
Marsh and Swamp Conservation
639
Marsh and Swamp Conservation Global evidence for the effects of interventions to conserve marsh and swamp vegetation Nigel G. Taylor, Patrick Grillas, Rebecca K. Smith & William J. Sutherland CONSERVATION EVIDENCE SERIES SYNOPSES
-
Upload
khangminh22 -
Category
Documents
-
view
0 -
download
0
Transcript of Marsh and Swamp Conservation

Marsh and Swamp Conservation
Global evidence for the effects of interventions to conserve marsh and swamp vegetation
Nigel G. Taylor, Patrick Grillas,
Rebecca K. Smith & William J. Sutherland
CONSERVATION EVIDENCE SERIES SYNOPSES

Marsh and Swamp Conservation
Global evidence for the effects of interventions to conserve marsh and swamp vegetation
Nigel G. Taylor, Patrick Grillas,
Rebecca K. Smith & William J. Sutherland
Conservation Evidence Series Synopses

© 2021 William J. Sutherland
This work is licensed under a Creative Commons Attribution 4.0 International license (CC BY 4.0), except where noted. This license allows you to share, copy, distribute and transmit the work; to adapt the work; and to make commercial use of the work providing attribution is made to the authors (but not in any way that suggests that they endorse you or your use of the work). Attribution should include the following information:
Taylor N.G., Grillas P., Smith R.K. & Sutherland W.J. (2021) Marsh and Swamp Conservation: Global Evidence for the Effects of Interventions to Conserve Marsh and Swamp Vegetation. Conservation Evidence Series Synopses. University of Cambridge, Cambridge, UK.
Further details about CC BY licenses are available at https://creativecommons.org/licenses/by/4.0/ Cover image: Mangrove trees ready to be planted in Vanga Bay, Kenya. Rob Barnes/GRID-Arendal Resources Library. Some rights reserved (CC BY-NC-SA 2.0). https://www.grida.no/resources/11053 Digital material and resources associated with this synopsis are available at https://www.conservationevidence.com/
iii
Contents
1. About this book....................................................................... 1
1.1 The Conservation Evidence project ............................................................................ 1
1.2 The purpose of Conservation Evidence synopses ...................................................... 1
1.3 Who is this synopsis for?............................................................................................ 1
1.4 Background to the Marsh and Swamp Conservation Synopsis ................................. 2
1.5 Scope of the Marsh and Swamp Conservation Synopsis ........................................... 3
1.6 Methods ..................................................................................................................... 8
1.7 How to use the information provided ...................................................................... 16
1.8 How you can help to change conservation practice ................................................ 17
1.9 References................................................................................................................ 18
2. Threat: Residential and commercial development ................. 19
2.1 Remove residential or commercial development ................................................... 19
2.2 Retain/create habitat linkages in developed areas ................................................. 20
2.3 Integrate marshes or swamps into developed areas .............................................. 20
3. Threat: Agriculture and aquaculture ...................................... 22
Multiple farming systems .................................................................................................... 23
3.1 Implement ‘mosaic management’ of farmland ....................................................... 23
3.2 Retain/create habitat linkages in farmed areas ...................................................... 23
3.3 Regulate farming to allow gradual regeneration of marshes or swamps ............... 24
Annual and perennial non-timber crops .............................................................................. 24
3.4 Abandon cropland: allow recovery without active intervention ............................ 24
3.5 Flood cropland when fallow .................................................................................... 28
Wood and pulp plantations ................................................................................................. 29
3.6 Abandon plantations: allow recovery without active intervention ........................ 29
3.7 Cut/remove/thin forest plantations ........................................................................ 29
Livestock farming and ranching .......................................................................................... 31
3.8 Use barriers to keep livestock off ungrazed marshes or swamps ........................... 31
3.9 Exclude or remove livestock from historically grazed marshes or swamps ............ 33
3.10 Reduce intensity of livestock grazing ...................................................................... 47
3.11 Change season/timing of livestock grazing ............................................................. 55
3.12 Change type of livestock grazing ............................................................................. 59
Aquaculture ......................................................................................................................... 62
3.13 Abandon aquaculture facilities: allow recovery without active intervention ......... 62
4. Threat: Energy production and mining ................................... 65
4.1 Abandon mined land: allow recovery without active intervention ........................ 65
4.2 Retain/create habitat linkages in areas of energy production or mining ............... 67

iv
5. Threat: Transportation and service corridors ......................... 68
5.1 Backfill canals or trenches ....................................................................................... 68
5.2 Plug/dam canals or trenches ................................................................................... 73
5.3 Design transportation or service corridors to maintain water flow ....................... 75
5.4 Retain/create habitat linkages across service corridors ......................................... 76
6. Threat: Biological resource use .............................................. 77
Harvesting or gathering wild plants .................................................................................... 77
6.1 Reduce frequency of vegetation harvest ................................................................ 77
6.2 Reduce intensity of vegetation harvest ................................................................... 80
6.3 Change season/timing of vegetation harvest ......................................................... 82
6.4 Use low-impact methods to harvest vegetation ..................................................... 84
6.5 Implement ‘mosaic management’ when harvesting wild vegetation ..................... 86
6.6 Provide new technologies to reduce harvesting pressure on vegetation .............. 87
Harvesting or gathering wild animals ................................................................................. 88
6.7 Reduce frequency of hunting/collecting animals .................................................... 88
6.8 Reduce intensity of hunting/collecting animals ...................................................... 88
6.9 Use low-impact methods to hunt/collect animals .................................................. 89
6.10 Reintroduce overharvested animals ....................................................................... 90
7. Threat: Human intrusions and disturbance ............................ 91
7.1 Restrict vehicle use .................................................................................................. 91
7.2 Physically exclude vehicles ...................................................................................... 92
7.3 Build barriers to protect littoral areas from boat wakes ........................................ 92
7.4 Restrict pedestrian access ....................................................................................... 93
7.5 Physically exclude pedestrians ................................................................................ 93
7.6 Install boardwalks/paths to prevent trampling ....................................................... 94
7.7 Adopt ecotourism principles/create an ecotourism site ........................................ 94
8. Threat: Natural system modifications .................................... 96
Modified water management ............................................................................................. 97
8.1 Raise water level to restore degraded marshes or swamps ................................... 97
8.2 Lower water level to restore degraded marshes or swamps ................................ 103
8.3 Facilitate tidal exchange to restore degraded marshes or swamps ..................... 105
8.4 Actively manage water level .................................................................................. 112
8.5 Divert/block/stop saltwater inputs ....................................................................... 125
8.6 Divert/block/stop freshwater inputs ..................................................................... 125
Modified disturbance regime: too little ............................................................................. 126
8.7 Cut/mow herbaceous plants to maintain or restore disturbance ........................ 126
8.8 Cut large trees/shrubs to maintain or restore disturbance .................................. 140
8.9 Use grazing to maintain or restore disturbance .................................................... 144
8.10 Use prescribed fire to maintain or restore disturbance ........................................ 151
8.11 Use herbicide to maintain or restore disturbance ................................................ 166
8.12 Remove plant litter ................................................................................................ 169

v
Modified disturbance regime: too much or wrong timing ................................................ 171
8.13 Reduce frequency of cutting/mowing ................................................................... 171
8.14 Reduce intensity of cutting/mowing ..................................................................... 174
8.15 Change season/timing of cutting/mowing ............................................................ 174
8.16 Reduce frequency of prescribed burning .............................................................. 177
8.17 Reduce intensity of prescribed burning ................................................................ 178
8.18 Change season/timing of prescribed burning ....................................................... 178
Modified wild fire regime .................................................................................................. 180
8.19 Thin vegetation to prevent wild fires .................................................................... 180
8.20 Raise water level to prevent wild fires .................................................................. 181
8.21 Build fire breaks ..................................................................................................... 182
8.22 Put up signs to discourage fires ............................................................................. 182
9. Threat: Invasive and other problematic species ................... 184
All problematic species ...................................................................................................... 185
9.1 Implement biosecurity measures to prevent introductions of problematic species ................................................................................................................... 185
Problematic plants ............................................................................................................. 185
9.2 Control problematic plants (specific intervention unclear) .................................. 185
9.3 Control problematic plants (multiple interventions) ............................................ 187
9.4 Physically remove problematic plants ................................................................... 189
9.5 Physically damage problematic plants .................................................................. 193
9.6 Manage water level to control problematic plants ............................................... 199
9.7 Add salt to control problematic plants .................................................................. 200
9.8 Use cutting/mowing to control problematic herbaceous plants .......................... 201
9.9 Use cutting to control problematic large trees/shrubs ......................................... 209
9.10 Use grazing to control problematic plants ............................................................ 212
9.11 Use prescribed fire to control problematic plants ................................................ 215
9.12 Use herbicide to control problematic plants ......................................................... 222
9.13 Use covers/barriers to control problematic plants ............................................... 238
9.14 Introduce organisms to control problematic plants ............................................. 240
Problematic animals .......................................................................................................... 242
9.15 Exclude wild vertebrates using physical barriers .................................................. 242
9.16 Control populations of wild vertebrates ............................................................... 252
9.17 Exclude wild invertebrates using physical barriers ............................................... 255
9.18 Control populations of wild invertebrates ............................................................ 256
10. Threat: Pollution ............................................................... 257
Multiple sources of pollution ............................................................................................. 257
10.1 Clean waste water before it enters the environment ........................................ 257
10.2 Divert/block/stop polluted water inputs ............................................................ 258
10.3 Slow down input water to allow more time for pollutants to be removed ....... 258
10.4 Retain/restore/create vegetation around marshes or swamps ......................... 259
10.5 Use artificial barriers to block pollution .............................................................. 263
10.6 Add clean water to reduce pollution .................................................................. 263
10.7 Introduce plants to marshes or swamps to control pollution ............................ 264

vi
10.8 Reduce fertilizer or herbicide use ....................................................................... 264
10.9 Manage fertilizer or herbicide application .......................................................... 267
10.10 Add lime or similar chemicals ............................................................................. 267
Garbage and solid waste ................................................................................................... 270
10.11 Remove debris ..................................................................................................... 270
10.12 Put up signs to discourage littering ..................................................................... 272
Agricultural and aquacultural effluents ............................................................................ 273
10.13 Modify crop farming practices in watershed to reduce pollution ...................... 273
10.14 Modify logging practices in watershed to reduce pollution ............................... 275
10.15 Modify livestock farming practices in watershed to reduce pollution ............... 276
10.16 Modify aquaculture practices in watershed to reduce pollution ....................... 277
Industrial and military effluents ........................................................................................ 278
10.17 Physically or chemically remove oil .................................................................... 278
10.18 Cut or burn oil-contaminated vegetation ........................................................... 279
10.19 Stimulate microbial breakdown of oil ................................................................. 281
Airborne pollutants ............................................................................................................ 282
10.20 Remove pollutants from waste gases before they enter the environment ....... 282
11. Threat: Climate change and severe weather ...................... 283
11.1 Add water to marshes or swamps to compensate for drought.......................... 284
11.2 Build barriers to protect littoral marshes or swamps from rising water levels and severe weather ............................................................................................. 284
11.3 Designate zones for migration of marshes or swamps as climate changes ....... 288
11.4 Restore/create marshes or swamps in areas that will be climatically suitable in the future ........................................................................................................ 289
12. Habitat restoration and creation ....................................... 291
General habitat restoration and creation ......................................................................... 292
12.1 Restore/create marshes or swamps (specific intervention unclear) .................. 292
12.2 Restore/create marshes or swamps (multiple interventions) ............................ 307
12.3 Deposit soil/sediment and introduce vegetation ............................................... 319
Modify physical habitat ..................................................................................................... 323
12.4 Raise water level to restore/create marshes or swamps from other land uses .. 323
12.5 Lower water level to restore/create marshes or swamps from other land uses.. 339
12.6 Facilitate tidal exchange to restore/create marshes or swamps from other land uses .............................................................................................................. 341
12.7 Fill/block ditches ................................................................................................. 350
12.8 Excavate pools ..................................................................................................... 350
12.9 Reprofile/relandscape ......................................................................................... 354
12.10 Create mounds or hollows .................................................................................. 369
12.11 Remove surface soil/sediment ............................................................................ 370
12.12 Bury surface soil/sediment ................................................................................. 376
12.13 Disturb soil/sediment surface ............................................................................. 376
12.14 Add sediment ...................................................................................................... 379
12.15 Add upland topsoil .............................................................................................. 383

vii
12.16 Deposit soil/sediment to form physical habitat structure .................................. 384
12.17 Add inorganic fertilizer ........................................................................................ 388
12.18 Add below-ground organic matter ..................................................................... 390
12.19 Add surface mulch ............................................................................................... 392
12.20 Add cover other than mulch ............................................................................... 394
12.21 Introduce nurse plants ........................................................................................ 395
Introduce emergent vegetation......................................................................................... 397
12.22 Directly plant whole plants ................................................................................. 397
12.23 Introduce vegetation fragments ......................................................................... 445
12.24 Introduce seeds or propagules ........................................................................... 451
12.25 Transplant or replace blocks of vegetation ......................................................... 471
12.26 Transplant or replace wetland soil ...................................................................... 474
13. Actions to complement planting ........................................ 481
Modify physical habitat ..................................................................................................... 481
13.1 Raise water level (before/after planting) ............................................................ 481
13.2 Lower water level (before/after planting) .......................................................... 482
13.3 Facilitate tidal exchange (before/after planting) ................................................ 482
13.4 Irrigate (before/after planting) ........................................................................... 485
13.5 Actively manage water level (after planting) ...................................................... 485
13.6 Reprofile/relandscape (before planting) ............................................................ 488
13.7 Create mounds or hollows (before planting) ...................................................... 488
13.8 Remove surface soil/sediment (before planting) ............................................... 494
13.9 Bury surface soil/sediment (before planting) ..................................................... 495
13.10 Disturb soil/sediment surface (before planting) ................................................. 495
13.11 Add upland topsoil (before/after planting) ........................................................ 498
13.12 Add lime or similar chemicals (before/after planting) ........................................ 501
13.13 Add inorganic fertilizer (before/after planting) .................................................. 503
13.14 Add below-ground organic matter (before/after planting) ................................ 511
13.15 Add surface mulch (before/after planting) ......................................................... 520
13.16 Add cover other than mulch (before/after planting).......................................... 523
13.17 Transplant wetland soil (before/after planting) ................................................. 526
13.18 Introduce nurse plants (before/after planting) .................................................. 529
13.19 Use fences or barriers to protect planted areas ................................................. 533
13.20 Remove vegetation that could compete with planted vegetation ..................... 538
Manipulate planted vegetation ......................................................................................... 545
13.21 Install physical supports for planted vegetation ................................................. 545
13.22 Use flotation devices to support planted vegetation ......................................... 546
13.23 Plant vegetation into moisture-retaining peat pots ........................................... 547
13.24 Plant vegetation into heavy containers .............................................................. 549
13.25 Allow plants to adjust to field conditions before planting ................................. 549
13.26 Add root-associated fungi to plants before planting .......................................... 549
13.27 Apply root dip to plants before planting ............................................................. 550
13.28 Prune roots before planting ................................................................................ 552
13.29 Soak vegetation before planting ......................................................................... 554
13.30 Soak seeds before sowing ................................................................................... 555
13.31 Chill seeds before sowing .................................................................................... 557

viii
13.32 Heat seeds before sowing ................................................................................... 561
13.33 Expose seeds to light before sowing ................................................................... 563
13.34 Physically damage seeds before sowing ............................................................. 563
13.35 Treat seeds with chemicals before sowing ......................................................... 566
14. Habitat protection ............................................................. 571
14.1 Designate protected area .................................................................................... 571
14.2 Provide general protection for marshes or swamps........................................... 574
14.3 Require mitigation of impacts to marshes or swamps ....................................... 576
14.4 Pay stakeholders to protect marshes or swamps ............................................... 580
14.5 Increase ‘on-the-ground’ protection (e.g. rangers) for marshes or swamps ..... 582
15. Education and awareness-raising ....................................... 584
15.1 Raise public awareness about marshes or swamps ............................................ 585
15.2 Engage local people in management/monitoring of marshes or swamps ......... 585
15.3 Provide education/training programmes about marshes or swamps ................ 587
15.4 Produce guidance for marsh or swamp conservation ........................................ 588
15.5 Use marketing strategies to increase the value of marshes or swamps ............ 589
15.6 Lobby/campaign/demonstrate to protect marshes or swamps ......................... 591
15.7 Classify conservation status of individual sites ................................................... 592
Appendix 1: Glossary .............................................................. 593
Appendix 2: Overview of reviewed literature .......................... 597
Appendix 3: List of searched literature .................................... 598
English-language journals ............................................................................................... 598
Non-English journals ....................................................................................................... 604
Additional literature sources ........................................................................................... 607
Appendix 4: Complete reference list ........................................ 608

ix
Advisory Board
We thank the following people for advising on the scope and content of this synopsis:
Damien Cook, Rakali Ecological Consulting, Australia
Nisha D’Souza, EcoNiche Consulting, Goa, India
Mori Diallo, Wetlands International, Mali
Dr Keith Edwards, University of South Bohemia, Czech Republic
Dr Chris Elphick, University of Connecticut, USA
Professor M. Siobhan Fennessy, Kenyon College, USA
Professor Susan Galatowitsch, University of Minnesota, USA
Dr Nancy Job, South African National Biodiversity Institute, South Africa
Dr Tatiana Lobato-de-Magalhães, Universidad Autónoma de Querétaro, Mexico
Rob McInnes, RM Wetlands and Environment, UK
Dr François Mesléard, Tour du Valat, France
Dr Kay Morris, Arthur Rylah Institute for Environmental Research, Australia
Mykhailo Nesterenko, Rewilding Ukraine, Ukraine
Yus Rusila Noor, Wetlands International, Indonesia
Professor Jos Verhoeven, University of Utrecht, The Netherlands
Dr Dominic Wodehouse, Bangor University, UK & Mangrove Action Project, USA
Professor Joy Zedler, University of Wisconsin-Madison, USA

x
About the authors
Nigel G. Taylor is a postdoctoral researcher at Tour du Valat, Research Institute for the Conservation of Mediterranean Wetlands, France. Patrick Grillas is a senior researcher and former scientific director at Tour du Valat, Research Institute for the Conservation of Mediterranean Wetlands, France. Rebecca K. Smith is a Senior Research Associate in the Department of Zoology, University of Cambridge, UK. William J. Sutherland is the Miriam Rothschild Professor of Conservation Biology at the University of Cambridge, UK.

xi
Acknowledgements
This synopsis was funded by the MAVA Foundation. We acknowledge the assistance and feedback of the Advisory Board and the Conservation Evidence team. We thank the countless staff and volunteers who have assisted with literature searches. Chapter header icons were sourced from www.thenounproject.com: (2) House is by Corpus Delicti; (3) Cow is by Jacopo Mencacci and Crops is by Hea Poh Lin; (4) Mining Cart is by James Fenton; (5) Highway is by 8ties; (6) Fruit Picking is by Luis Prado; (7) Man Traveller is by Andrew Doane; (8) Process is by Jonathan Collie; (9) Fish is by Arafat Uddin; (10) Pollution is by Hea Poh Lin and Water Pollution is by Jim Holt; (11) Climate Change is by Patrick Morrison; (12) History is by Alain W; (13) Plant is by Aleksandr Vector; (14) Shield is by Alena Artemova; (15) Thought is by Gregor Cresnar.

1
1. About this book
1.1 The Conservation Evidence project
The Conservation Evidence project has four main parts:
1) Synopses of evidence captured for the conservation of particular species groups or habitats. Synopses bring together the evidence for each possible intervention. They are freely available online and many are available to purchase in printed book form.
2) What Works in Conservation is an assessment of the effectiveness of interventions by expert panels, based on the collated evidence for each intervention for each species group or habitat covered by our synopses.
3) An ever-expanding database of summaries of previously published scientific papers, reports, reviews or systematic reviews that document the effects of interventions. This resource currently contains summaries based on over 7,600 publications, and is free to search on the website www.conservationevidence.com.
4) The online, open access Conservation Evidence Journal that publishes new pieces of research on the effects of conservation management interventions. All our papers are written by, or in conjunction with, those who carried out the conservation work and include some monitoring of its effects.
1.2 The purpose of Conservation Evidence synopses
Conservation Evidence synopses do Conservation Evidence synopses do not
Bring together scientific evidence captured by the Conservation Evidence project (summaries based on over 7,600 publications so far) on the effects of interventions to conserve biodiversity.
Include evidence on the basic ecology of species or habitats, or threats to them.
List all realistic interventions for the species group or habitat in question, regardless of how much evidence for their effects is available.
Make any attempt to weight or prioritize interventions according to their importance or the size of their effects.
Describe each piece of evidence, including methods, as clearly as possible, allowing readers to assess the quality of evidence.
Weight or numerically evaluate the evidence according to its quality.
Work in partnership with conservation practitioners, policymakers and scientists to develop the list of interventions and ensure we have covered the most important literature.
Provide recommendations for conservation problems, but instead provide scientific information to help with decision-making.
1.3 Who is this synopsis for?
If you are reading this, we hope you are someone who has to make decisions about how best to support or conserve biodiversity. You might be a land manager, a conservationist in the public or private sector, a farmer, a campaigner, an advisor or

1. About this book
2
consultant, a policymaker, a researcher or someone taking action to protect your own local wildlife. Our synopses summarize scientific evidence relevant to your conservation objectives and the actions you could take to achieve them.
We do not aim to make your decisions for you, but to support your decision-making by telling you what evidence there is (or isn’t) about the effects of possible interventions.
When decisions have to be made with particularly important consequences, we recommend carrying out a systematic review, as the latter is likely to be more comprehensive than the summary of evidence presented here. Organizations such as the Centre for Evidence-Based Conservation (www.cebc.bangor.ac.uk) and the Collaboration for Environmental Evidence (www.environmentalevidence.org) carry out detailed systematic reviews of evidence on the effectiveness of particular conservation interventions. The latter organization also provides guidance on how to conduct systematic reviews (www.environmentalevidence.org/information-for-authors).
1.4 Background to the Marsh and Swamp Conservation Synopsis
Wetlands are areas transitional between terrestrial and aquatic systems (Cowardin et al. 1979). They are characterized by a water table that is at, near or just above land surface, frequently enough and for long enough to influence the type of vegetation that could grow there. This definition of wetlands includes freshwater, brackish and saline marshes and swamps (see Section 1.5.1 for further definitions), plus habitats such as bogs and fens, shallow lakes, seagrass beds and intertidal mudflats. Wetlands cover around 4.4 million km2 of the Earth’s surface – roughly half the size of Brazil (Davidson & Finlayson 2018). Particularly large wetland areas include the Amazon Basin, the Pantanal, the Mississippi Basin, the Lake Chad Basin, the Nile Basin and the Prairie Pothole region of North America (Keddy et al. 2009).
Marshes, swamps and other wetlands are vital for both biodiversity and human wellbeing. For their area, wetlands support a disproportionate amount of global biodiversity (Balian et al. 2008). They also contribute disproportionately to the provision of ecosystem services, providing food (fish, shellfish, plants), building materials (timber, reeds, mud) and genetic resources (e.g. for crop breeding), storing carbon, purifying water, protecting human settlements against floods and storms, and offering opportunities for recreation and tourism (Mitsch & Gosselink 2015; Davidson et al. 2019). However, many wetlands are declining in area and/or quality due to threats such as climate change, overexploitation, pollution, invasive species, and conversion to other land uses. Natural wetlands and aquatic habitats were lost three times as fast as natural forests between 1990 and 2015, and their area is declining at an ever-increasing rate (Ramsar Convention on Wetlands 2018). Thus, there is growing recognition of the need to protect, restore, create and rehabilitate wetlands.
Using evidence to inform conservation planning could drastically improve the effectiveness and efficiency of conservation actions (Sutherland et al. 2004). Systematic reviews can be used to synthesise the effects of specific conservation interventions, but are usually labour-intensive, expensive and ill-suited for areas where the data are scarce and patchy. The Conservation Evidence project uses a subject-wide evidence synthesis approach (Sutherland & Wordley 2018; Sutherland et al. 2019) to review the evidence for all possible conservation interventions within a particular subject area, such as taxonomic

1. About this book
3
groups (amphibians, birds, bats) or ecosystem types (forests, shrublands, peatlands). This approach allows efficient and cost-effective synthesis of evidence across the subject area (Sutherland & Wordley 2018). However, there is an unavoidable trade-off with the comprehensiveness of the evidence base for each intervention.
To date, there has been limited synthesis of the effects of conservation interventions on marsh and swamp vegetation. This synopsis helps to fill this gap. The Marsh and Swamp Conservation synopsis complements the Peatland Conservation synopsis (Taylor et al. 2018), which examines the effects of interventions to conserve peatland vegetation. It is anticipated that both synopses will be regularly updated in the future.
1.5 Scope of the Marsh and Swamp Conservation Synopsis
1.5.1 Habitat types
Areas transitional between terrestrial and aquatic systems, where the water table is usually at or near the surface or where the land is covered by shallow water, are known as wetlands (Cowardin et al. 1979). Water levels in wetlands are high enough for long enough, during the growing season, to define the type of plants that can survive there.
Some wetlands support plants that are emergent through water or rooted in saturated soils. These emergent wetlands can be broadly divided into seven main classes, based on their salinity, dominant vegetation and soils: freshwater marshes, freshwater swamps, brackish/salt marshes, brackish/saline swamps, bogs, fens and peat swamps. The first four classes are the subject of this synopsis (Table 1).
Previous synopses address conservation of vegetation in peatland habitats (habitats defined by their wet peaty soils, i.e. bogs, fens and peat swamps; Taylor et al. 2018) and conservation of wet heath vegetation (dominated by dwarf shrubs; Martin et al. 2018). A future synopsis will address conservation of vegetation in aquatic habitats (habitats where most of the vegetation is submerged or floating, e.g. rivers, lakes, ponds and lagoons).
Table 1 Overview of marshes and swamps as considered in this synopsis. Salinity divisions based on Stewart & Kantrud (1972) and Cowardin et al. (1979).
Dominant Vegetation
Non-woody (herbs, bryophytes)
Woody (trees, shrubs)
Salin
ity
Freshwater (<0.5 ppt)
Freshwater marshes
e.g. wet meadows, wet prairies, wet grasslands, reedbeds, rice paddies, flushes and springs
Freshwater swamps
e.g. bottomland swamps, várzea, igapó
Brackish (0.5–15 ppt) or Saline (>15 ppt)
Brackish/saline marshes
e.g. coastal salt marshes, estuarine brackish marshes, brine springs
Brackish/saline swamps
e.g. mangrove forests, mangal, nipa swamps

1. About this book
4
The following points provide further clarifications relating to habitat types:
Scale: The scale of a study may determine whether the study site is within the scope of this synopsis. To be included in the synopsis, the study must involve a wetland that is at least 30% emergent vegetation in the target state (e.g. Fig. 1a,b). We consider these wetlands to be marshes or swamps. All site-level data from marshes or swamps are summarized in this synopsis, even if they include submerged or upland vegetation. However, separate studies or data on submerged vegetation, from aquatic habitats (<30% emergent vegetation) or from upland habitats (not wet) are generally not included in this synopsis (e.g. Fig 1c,d).
Floodplains: “Floodplains”, “riparian zones” and “bottomlands” are not necessarily wetlands. Some areas might only be flooded for a brief period each year, or only flooded in years with unusually high river levels. This synopsis only includes studies on floodplains where it is clear that the habitat being conserved is a marsh or swamp. This means the synopsis may include only selected results from publications about conservation across entire floodplains.
Wet meadows/prairies/grasslands: As for floodplains, this synopsis only includes studies of “wet grasslands” if it is clear that habitat being conserved is, or is intended to be, a wetland. Some authors may use the term “wet grassland” to describe grasslands that are wetter than those that they normally study, but are not technically wetlands.
(a) Richness across entire marsh: included in this synopsis
(b) Richness in area dominated by emergent vegetation: included in this synopsis
(c) Richness in aquatic habitat only: not included in this synopsis
(d) Richness reported separately for areas dominated by emergent vegetation (included
in this synopsis) and aquatic habitats (not included in this synopsis)
Figure 1 Scope of synopsis in relation to scale of monitoring in studies. Each panel relates to a different study. As an example, consider that plant species richness has been measured within the dotted boxes. Green dotted areas – stands of emergent wetland vegetation. Blue ellipses – areas of permanent standing water, of any area or depth but without emergent vegetation. The overall area of the site in these figures is arbitrary: it could be 1 m
2 or 100 km
2.

1. About this book
5
Peat soils: A separate synopsis (Taylor et al. 2018) addresses conservation of vegetation in peatlands and related habitats: bogs, fens, fen meadows and peat swamps. Vegetation types that may, but do not always, occur on peat soils are included in the current synopsis (e.g. salt marshes, mangroves, reedbeds).
Artificial environments: Generally, studies in laboratories, greenhouses, tanks and artificial mesocosms have been excluded from this synopsis. However, the synopsis does include studies in these settings if they test interventions to complement planting or to aid planted vegetation, in a form that would be used in the field (see Chapter 13). Studies in created/experimental marshes or swamps are included throughout.
Constructed wetlands: Generally, studies in marshes or swamps constructed primarily for functions such as water treatment or storage have been excluded from this synopsis. However, studies of constructed marshes or swamps are summarized if they aim to create systems somewhat like natural habitats, and have clear implications for vegetation conservation/management (e.g. De Martis 2016).
1.5.2 Geographical scope
This synopsis includes evidence from all around the world. Any geographical bias largely reflects biases in where research on marsh and swamp conservation has been carried out. We acknowledge that our literature search strategy, with its focus on English-language publications and peer-reviewed journals, may have contributed to bias towards English-speaking countries and the Global North. However, an explicit effort was made to search non-English literature (see Section 1.6.3 and Appendices) and include indivduals from all continents on the Advisory Board.
1.5.3 Interventions
This synopsis aims to summarize evidence for the effects of any intervention that might be done to conserve marsh or swamp vegetation. Conservation includes protection, restoration, creation, rehabilitation and other management intended to benefit vegetation – either directly, or by changing human behaviour to reduce threats. Interventions could be carried out by land managers, policymakers, advisors or consultants. Interventions could be commonly used at present, have been used in the past, or novel and so not yet widely used. Interventions could be applied within a focal marsh or swamp, or applied elsewhere in the watershed (e.g. applying lime to upland slopes).
Within studies, it is not necessary that interventions are done with a conservation intention, as long as the methods used are the same as would be used by conservationists. For example, studies examining the effect of erecting fences to exclude cattle from a heavily grazed marsh would be included whether the intention was to conserve that focal marsh or to maximize profits by concentrating livestock on better pasture elsewhere.
The synopsis is structured with interventions grouped into chapters, primarily according to the direct threat they address (Chapters 2–11). Interventions that can be used in response to many different threats are included in separate action-based chapters (12–15). See also Section 1.6.2.

1. About this book
6
1.5.4 Relevant comparators
To determine the effectiveness of interventions, studies should usually include an explicit comparison. This may be spatial (comparing sites where an intervention was carried out and sites where it was not, comparing sites treated with different interventions, or comparing sites treated with different implementation options such as grazing in different seasons) and/or temporal (monitoring change over time, typically before and after an intervention was implemented). For some interventions, the comparison might be a predefined target or expected state, such as mature natural sites or relatively undisturbed sites.
However, some studies or results that do not involve an explicit comparison might provide useful evidence and so have been summarized. This includes, for example, studies monitoring survival rates of planted vegetation, and studies quantifying any vegetation that colonizes after creating a wetland.
1.5.5 Relevant outcomes
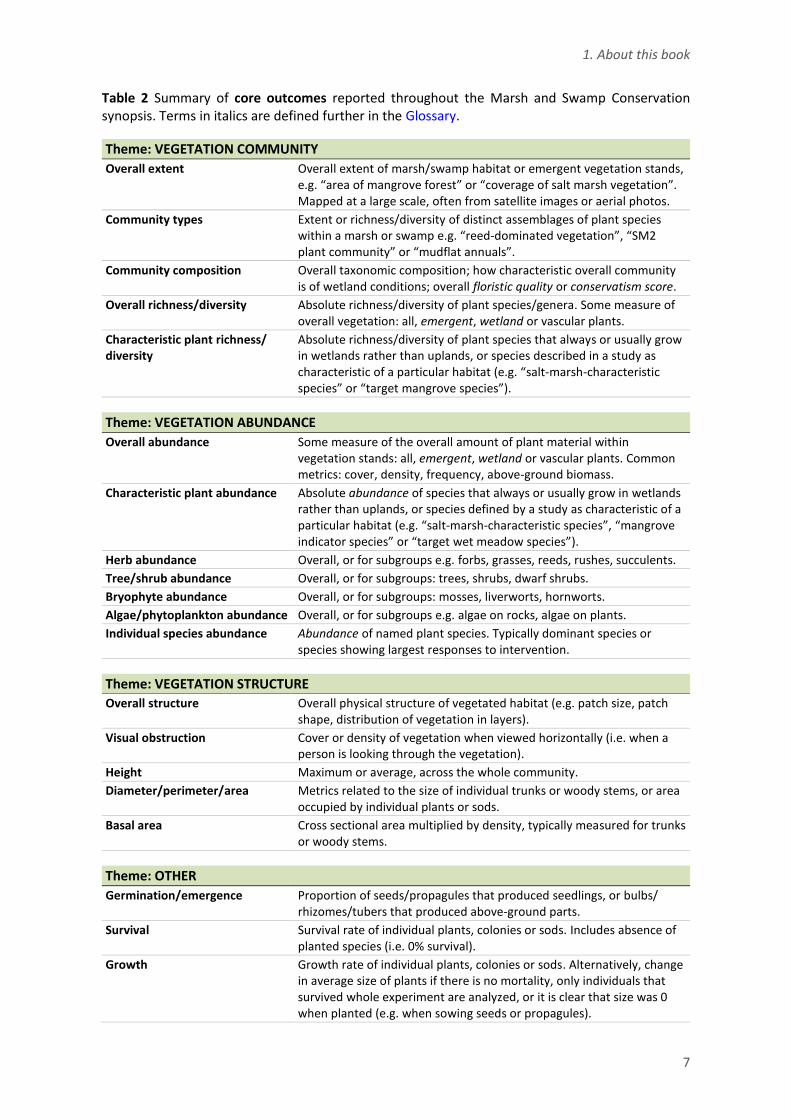
Nineteen core outcomes (Table 2) are consistently reported throughout the synopsis. They involve direct measures of the vegetation community, vegetation abundance, vegetation structure or plant performance. We aimed to summarize all results related to the key outcomes within summary paragraphs. The core outcomes are always included in the key messages for an intervention if we found any studies that quantified them.
Additional outcomes related to the vegetation community, abundance or structure are summarized when they are an important (or the only) result in a particular study, and/or the summary paragraph is not too long once core outcomes have been summarized. Additional outcomes may or may not be included in the key messages, depending on their importance in the evidence base for each intervention. If an additional outcome is included in the key messages for an intervention, results relating to it have been pulled out from all studies under that intervention. Additional vegetation outcomes included in a least one set of key messages are: relative abundance, native/non-target abundance, native/non-target richness/diversity, (tree) canopy cover, and measures of individual plant size not included in the core outcomes (e.g. biomass/plant or stems/plant).
Human behaviour is considered as an additional outcome for selected interventions. This is stated at the start of the key messages. For some interventions, precise monitoring of vegetation responses is difficult or impossible (Kapos et al. 2008). Human behavioural changes can be monitored instead to indicate proximate effects of an intervention, which may translate into effects on vegetation (although not always in an intuitive way). Relevant behavioural responses include changes in consumer purchasing patterns, creation of protected areas in response to lobbying, compliance with permit regulations, changes in incidence of unsustainable burning or harvesting.
Throughout the synopsis, terminology for has been harmonized so that all results relating to the same outcome (e.g. measures of tree trunk “diameter”, “width” and “thickness”) are grouped together. In particular, “growth” in this synopsis only includes results that clearly reflect growth of individual plants. Changes in average size have typically been summarized under “vegetation structure”, because they do not necessarily reflect growth: the average height of 100 seedlings might increase if the shortest 50 seedlings die, even if there is no change in height of the 50 surviving seedlings.
1. About this book
7
Table 2 Summary of core outcomes reported throughout the Marsh and Swamp Conservation synopsis. Terms in italics are defined further in the Glossary.
Theme: VEGETATION COMMUNITY
Overall extent Overall extent of marsh/swamp habitat or emergent vegetation stands, e.g. “area of mangrove forest” or “coverage of salt marsh vegetation”. Mapped at a large scale, often from satellite images or aerial photos.
Community types Extent or richness/diversity of distinct assemblages of plant species within a marsh or swamp e.g. “reed-dominated vegetation”, “SM2 plant community” or “mudflat annuals”.
Community composition Overall taxonomic composition; how characteristic overall community is of wetland conditions; overall floristic quality or conservatism score.
Overall richness/diversity Absolute richness/diversity of plant species/genera. Some measure of overall vegetation: all, emergent, wetland or vascular plants.
Characteristic plant richness/ diversity
Absolute richness/diversity of plant species that always or usually grow in wetlands rather than uplands, or species described in a study as characteristic of a particular habitat (e.g. “salt-marsh-characteristic species” or “target mangrove species”).
Theme: VEGETATION ABUNDANCE C Overall abundance Some measure of the overall amount of plant material within
vegetation stands: all, emergent, wetland or vascular plants. Common metrics: cover, density, frequency, above-ground biomass.
Characteristic plant abundance Absolute abundance of species that always or usually grow in wetlands rather than uplands, or species defined by a study as characteristic of a particular habitat (e.g. “salt-marsh-characteristic species”, “mangrove indicator species” or “target wet meadow species”).
Herb abundance Overall, or for subgroups e.g. forbs, grasses, reeds, rushes, succulents.
Tree/shrub abundance Overall, or for subgroups: trees, shrubs, dwarf shrubs.
Bryophyte abundance Overall, or for subgroups: mosses, liverworts, hornworts.
Algae/phytoplankton abundance Overall, or for subgroups e.g. algae on rocks, algae on plants.
Individual species abundance Abundance of named plant species. Typically dominant species or species showing largest responses to intervention.
Theme: VEGETATION STRUCTURE
Overall structure Overall physical structure of vegetated habitat (e.g. patch size, patch shape, distribution of vegetation in layers).
Visual obstruction Cover or density of vegetation when viewed horizontally (i.e. when a person is looking through the vegetation).
Height Maximum or average, across the whole community.
Diameter/perimeter/area Metrics related to the size of individual trunks or woody stems, or area occupied by individual plants or sods.
Basal area Cross sectional area multiplied by density, typically measured for trunks or woody stems.
Theme: OTHER
Germination/emergence Proportion of seeds/propagules that produced seedlings, or bulbs/ rhizomes/tubers that produced above-ground parts.
Survival Survival rate of individual plants, colonies or sods. Includes absence of planted species (i.e. 0% survival).
Growth Growth rate of individual plants, colonies or sods. Alternatively, change in average size of plants if there is no mortality, only individuals that survived whole experiment are analyzed, or it is clear that size was 0 when planted (e.g. when sowing seeds or propagules).

1. About this book
8
Outcomes explicitly not reported in this synopsis (unless they help interpretation of summarized results for a particular study) include:
Plant physiology (e.g. gas exchange, nutrient uptake, tissue chemistry), productivity (if not measured as standing biomass), seed/flower production (number or timing, unless used as an estimate of vegetation abundance), nutritional value, genetic richness/diversity.
Any outcomes related to seeds in the soil (e.g. abundance, richness, diversity).
Outcomes relating specifically to rare plant species (that exist in few locations, or that are not abundant/not major components of the target community).
Habitat suitability indices, e.g. overall indices of the quality of a habitat for birds.
Outcomes relating to organisms other than plants, such as birds or amphibians. These are covered in other Conservation Evidence synopses and on www.conservationevidence.com.
Ecosystem functions (e.g. peat formation) and services (e.g. carbon storage) – although note that these are often linked to the state of vegetation.
Outcomes relating to knowledge or awareness, rather than behaviour.
Vague outcomes such as “successfully restored” or “project objectives were met”, unless clear quantitative objectives were set (cf. Zedler 2007).
We have also excluded studies that aimed to control invasive or other problematic species but do not report effects on vegetation other than those species. Such studies are, or will be, summarized in other Conservation Evidence synopses (e.g. Aldridge et al. 2017). Thus, when outcomes related to invasive or problematic species have been reported, be aware that these may not give the full picture of effects on these species.
1.6 Methods
1.6.1 Advisory Board
We formed an Advisory Board made up of international conservationists and academics with expertise in marsh or swamp conservation. These experts contributed to the synopsis at two key stages: a) creating the comprehensive list of conservation interventions for review, and b) reviewing the draft evidence synthesis. Members of the Advisory Board are listed above.
1.6.2 Creating a list of interventions
We developed a list of 176 interventions that conservationists might do to conserve marsh or swamp vegetation, based on the experience of the synopsis authors, previous Conservation Evidence synopses, and input from the Advisory Board. The aim was to include all relevant interventions, whether or not there is evidence for their effects. We refined the number and wording of interventions throughout the process of compiling the synopsis. See also Section 1.5.3.

1. About this book
9
The conservation interventions are grouped into chapters, primarily according to the direct threat they address (Chapters 2–11). Threats are as defined in the IUCN Unified Classification of Direct Threats (www.iucnredlist.org/technical-documents/classification-schemes/threats-classification-scheme). Some IUCN threats, which do not affect marshes or swamps or cannot be addressed by any realistic interventions in these habitats, are not included in this synopsis. For interventions that can be used in response to many different threats, we created additional chapters (12–15) based on the IUCN Classification of Conservation Actions (www.iucnredlist.org/technical-documents/classification-schemes/ conservation-actions-classification-scheme-ver2).
Some interventions appear similar, but have been split because they address slightly different threats, e.g. mowing to maintain or restore a disturbance regime (Chapter 8) and mowing to control problematic plant species not linked to a change in a historical disturbance regime (Chapter 9). In these cases, there is clear cross-referencing between interventions.
We created combined interventions, rather than repeating evidence under all the separate interventions, if the following two conditions were met: a) there are five or more studies that use the same well-defined combination of interventions, with a very clear description of what they were and without separating the effects of each individual intervention, and b) the combined set of interventions is a commonly used conservation strategy.
Box 1: Some cautionary notes about interventions
Inclusion of an intervention is not an endorsement, or indication that it is effective.
Active intervention may not be the best option to conserve marshes and swamps. In relatively undisturbed sites the best action might be no action at all, or protection rather than active vegetation management (see Chapter 14).
Some interventions might only be effective if combined with another. For example, it will probably be necessary to raise the water table of drained marshes before planting wetland vegetation.
Most of the listed interventions are reactive. This means that they treat the effects of threats (e.g. by cutting down forestry plantations). This is not meant to discourage proactive conservation, addressing root causes of threats. Many proactive interventions, such as those to tackle climate change at a global scale, are simply beyond the scope of this synopsis.
Many of the interventions are suitable for specific habitat types or in specific contexts. To help account for this, we have typically split the interventions by salinity (fresh vs brackish/saline) and vegetation type (marshes vs swamps). However, there is still some variation within these groupings. The background sections, main text summarizing each study, and even the original publications may help you to fully understand the context of each study.
The listed interventions are often broader in scope than the summarized evidence. The summarized evidence reflects the evidence we captured, not the intended scope of the intervention.

1. About this book
10
1.6.3 Searching the literature
a) Inclusion criteria
To be included in the Marsh and Swamp Conservation Synopsis, studies had to meet the following inclusion criteria (based on Section 1.5 above):
Population: Marshes and swamps (wetlands with abundant emergent vegetation) anywhere in the world.
Intervention: Any intervention that a conservationist could or would do to conserve marsh or swamp vegetation. The intervention must have actually been implemented; this excludes predictive modelling studies, and correlative studies of relationships between vegetation and environmental characteristics without a clear link to an intervention.
Comparator: Usually a comparison to areas without intervention and/or before intervention. Otherwise, a comparison to an alternative intervention. Study designs without explicit comparisons are acceptable for some interventions (e.g. habitat creation, planting).
Outcomes: Quantitative data on the overall extent of marshes or swamps, vegetation within marshes or swamps, or planted emergent wetland vegetation (Chapter 13). For some interventions, human behaviour relevant to conservation of marsh or swamp vegetation.
b) Sources searched
We obtained literature for this synopsis from the following sources.
Systematic searches of 348 biology, ecology and conservation journals, including 94 primarily in a language other than English (see Appendix 3). Most of these have been searched as part of the Conservation Evidence project and relevant papers stored in a central database. We searched 14 specialist wetland and/or botanical journals specifically for the Marsh and Swamp Conservation synopsis. Journals were generally searched from their first issue to the end of 2017.
Systematic searches of grey literature on the websites of 13 organizations (see Appendix 3). Some of these have been searched as part of the Conservation Evidence project and relevant publications stored in a central database. We searched six sources of grey literature specifically for the Marsh and Swamp Conservation synopsis. Publications were generally searched from the first available document until the end of 2017.
Other publications on the Conservation Evidence website (www.conservation evidence.com) relevant to this synopsis. This includes, for example, publications recommended by advisory boards or identified through keyword searches for previous synopses.
Publications specifically recommended by the Advisory Board for this synopsis. The Advisory Board is made up of international conservationists and academics with expertise in marsh and/or swamp conservation. Members of the Advisory Board are listed at the start of this synopsis.

1. About this book
11
We acknowledge that the systematic search method used by Conservation Evidence results in gaps in the evidence. The process cannot cover all journals, and it is possible that we will have missed some relevant publications from sources that have been screened. However, alternative methods (e.g. using search terms) may also miss relevant publications (see Sutherland et al. 2019 for further discussion).
c) Screening
Publications were first screened at the level of title, abstract, summary or contents. Some of this screening was carried out by the authors of this synopsis, but most was carried out by other Conservation Evidence staff or volunteers. Publications that clearly or probably met the inclusion criteria were retained and added to a database.
Then, the authors of this synopsis screened all publications in this database at full text. Publications that met the inclusion criteria were summarized. A reason for exclusion was recorded for publications that did not meet the inclusion criteria.
We included evidence written in any language when it was identified, although most of the sources searched were in English.
We summarized original data reported within reviews or systematic reviews (e.g. novel case studies, novel comparisons based on combinations of published studies). We did not summarize data within reviews that originated from other sources (e.g. a case study from a previously published paper). Due to time constraints, we did not search reference lists of reviews and systematic reviews (and any other documents).
d) Study quality and critical appraisal
We carried out limited critical appraisal of each potentially relevant study. We did not quantitatively assess the evidence from each publication or weight it according to quality, and generally included all studies meeting the above criteria (Section 1.6.3a) regardless of quality. However, we did exclude studies that (a) have obvious and critical errors in their design or analysis, (b) report use of a specific intervention, but do not provide enough details about that intervention to be of use to conservationists (e.g. “planting vegetation” without details of which species were planted, or “lobbying” without details of what this actually involved), or (c) do not report enough information about the outcome to allow interpretation (e.g. reporting survival rate without a timescale).
Summary paragraphs in the synopsis include Information about the design and size of each study to help the reader critically appraise the evidence (see Section 1.6.4b).
1.6.4 Summarizing the evidence
a) Summary paragraphs
Altogether, we summarized 798 studies from 473 publications (see Appendix 2). A study is a conceptually distinct test of an intervention (e.g. performed in a different place, at a different time, with a different method, reporting different results and/or analyzed separately). One publication can contain multiple studies.

1. About this book
12
Each study is summarized in a single paragraph. This describes the study design, results and methods in around 200–250 words and using plain English as far as possible. Each summary paragraph uses the format in Box 2 below.
Generally, where there is evidence for an intervention, summary paragraphs are presented separately for freshwater marshes, brackish/salt marshes, freshwater swamps and brackish/saline swamps (see Table 1). Desirable outcomes might be very different in each habitat type, and this consistent formatting makes for simpler comparisons between interventions. The evidence is grouped more broadly for some interventions to reflect the spatial or temporal scale of studies. For example, studies of habitat protection (Chapter 14) often report combined results for multiple marsh/swamp types or wetlands overall.
Box 2: General format for Conservation Evidence summary paragraphs
A [TYPE OF STUDY1] in [YEARS X–Y] in [HOW MANY SITES] in/of [HABITAT] in
[REGION and COUNTRY] [REFERENCE] found that [INTERVENTION] [SUMMARY OF ALL
KEY RESULTS] for [SPECIES/HABITAT TYPE]. [DETAILS OF KEY RESULTS, INCLUDING
DATA2]. In addition, [EXTRA RESULTS, IMPLEMENTATION OPTIONS, CONFLICTING
RESULTS3]. Methods: The [DETAILS OF EXPERIMENTAL DESIGN, INTERVENTION
METHODS and KEY DETAILS OF SITE CONTEXT3]. Data was collected in [DETAILS OF
SAMPLING METHODS4].
1. Terminology chosen from Table 3. Refers to all design components included in study; all terms do not necessarily apply to all results.
2. Results always summarized for Key Outcomes in Table 2. Other results are summarized if they are important in a study and/or if space permits.
3. Not consistently reported. Included if critical to interpretation of a study and/or if space permits.
4. Reported in as much detail as possible, whilst keeping summary paragraph concise.
For example:
A site comparison study in 2007 of two salt marshes in the UK (1) reported that a restored salt marsh (where the sea wall was breached after depositing sediment) contained fewer plant species and less vegetation cover than a natural salt marsh. Statistical significance was not assessed. After 15 months, the restored marsh contained only one plant species: glasswort Salicornia europaea. Its cover was 11%. A nearby natural marsh contained eight plant species: mostly common saltmarsh grass Puccinellia maritima (50% cover), sea lavender Limonium vulgare (23% cover) and common cordgrass Spartina anglica (10% cover). Glasswort cover was 2%. The study also noted differences in sediment properties, including salinity and organic matter content, between the restored and natural marsh. Methods: In October 2007, plant species and their cover were recorded in ten 0.5-m2 quadrats, in each of two salt marshes. One marsh had been restored by depositing dredged sediment onto farmland, to raise the ground to an appropriate level for marsh vegetation (May 2005), then breaching the sea wall to restore tidal exchange (July 2006). The other, natural marsh had never been tidally restricted. Note that this study evaluates the combined effect of depositing sediment and restoring tidal exchange.
(1) Kadiri M., Spencer K.L., Heppell C.M. & Fletcher P. (2011) Sediment characteristics of a restored saltmarsh and mudflat in a managed realignment scheme in southeast England. Hydrobiologia, 672, 79–89.

1. About this book
13
For each intervention and habitat type, summary paragraphs are presented in chronological order: the most recently published evidence is presented at the end. Numbered references are provided. Paragraphs sharing the same reference number within an intervention (e.g. 1a, 1b, 1c) are all separate, conceptually distinct studies from the single publication with that number.
b) Terminology used to describe evidence
To help readers to interpret evidence, the size and design of each study is described in the summary paragraphs. Table 3 below defines the terms used to do this. The strongest evidence comes from replicated, randomized, paired, controlled trials with paired sites and before and after monitoring. In some studies, the study design differs between outcomes. The first sentence of summary paragraphs includes all applicable design descriptors for an entire study, whilst the key messages include only the design descriptors applicable to each outcome.
c) Dealing with multiple interventions within a publication
When a publication provides separate results for each intervention, separate summaries are included under each relevant intervention. When multiple interventions are compared within a publication (e.g. grazing vs mowing vs unmanaged), summary paragraphs and key messages focus on the comparison with no intervention (i.e. one paragraph for grazing vs unmanaged, and one paragraph for mowing vs unmanaged).
When outcomes are reported for three or fewer interventions carried out at the same time (e.g. mowing + burning vs unmanaged), a similar summary paragraph is usually included under all relevant interventions. The first sentence of the summary makes it clear that there was a combination of interventions carried out, e.g. “...found that mowing, along with burning, resulted in…”. The methods section of the summary includes a sentence such as “Note that this study does not distinguish between the effects of mowing and burning”. The combination of interventions is also flagged in the key messages.
Summary paragraphs involving combined interventions are not duplicated across interventions when one of the interventions would clearly not be appropriate for marsh or swamp conservation by itself. For example, a study of raising the water table and fertilizing to restore a marsh on drained farmland would only be summarized as a test of raising the water table: fertilizing alone would clearly not restore the marsh.
When more than three separate interventions have been carried out at the same time and the results cannot be separated, studies are summarized under a separate heading with “multiple interventions” in the title (i.e. Sections 9.3 and 12.2). In these studies, it is often particularly difficult to attribute effects to any single intervention.
d) Dealing with multiple habitat types within a publication
Similar rules apply when multiple habitat types are included within a publication. When it is possible to separate results for each habitat type, separate summaries are included for each habitat type. When results for multiple habitat types cannot be separated, a similar summary paragraph is included for each habitat type. Each summary explicitly highlights the fact that it includes multiple habitats.

1. About this book
14
Table 3 Terminology used to describe evidence in Conservation Evidence synopses
Term Meaning
Replicated The intervention was repeated on more than one site or individual.
Replicates should reflect the number of times an intervention has been independently carried out, from the perspective of the study subject. For example, 10 plots within a mown field might be independent replicates for plants with limited dispersal, but not for motile animals such as birds. We provide the number of replicates wherever possible. In conservation and ecology, the number of replicates is much smaller than it would be for medical trials. Generally in this synopsis, replicates are sites or plots, not individuals. This is true even for studies of planting or vegetation introduction. Pragmatism dictates that between five and ten sites/plots is a reasonable amount of replication, although more would be preferable.
Randomized The intervention was allocated randomly to sites or individuals. This means that the initial condition of those given the intervention is less likely to bias the outcome.
Paired Sites or plots are considered in pairs, when one was treated with the intervention and the other was not. Pairs or blocks of sites are selected with similar environmental conditions, such as soil type or surrounding landscape. This approach aims to reduce environmental variation and make it easier to detect a true effect of the intervention.
Controlled Sites or individuals treated with the intervention are compared with designated control sites or individuals not treated with the intervention. The treatment is usually allocated as part of the study, such that both the eventual treatment and control groups could have received the treatment.
Before-and-after Monitoring was carried out before and after the intervention was imposed. Alternatively, there is a clear description of the site before intervention, from which the state of an outcome measured after intervention can be inferred (e.g. “bare sediment” = 0% vegetation cover).
Site comparison A study that considers the effects of interventions by comparing sites that have historically received different interventions or levels of intervention (including intervention vs none). Unlike in controlled studies, it is not clear how treatments were allocated to sites.
Review A conventional review of literature. Generally, these have not used an agreed search protocol or quantitative assessments of the evidence.
Systematic review Follows structured, predefined methods to comprehensively collate and synthesise existing evidence. It must weight or evaluate studies, in some way, according to the strength of evidence they offer (e.g. based on sample size and rigour of design). Many environmental systematic reviews are available at www.environmentalevidence.org/index.htm.
Study If none of the above apply, for example a study that has measured outcomes in only one site and only after an intervention.

1. About this book
15
e) Dealing with multiple publications reporting the same results
If two publications describe exactly the same results from the same study (i.e. the same intervention implemented in the same space and at the same time), the synopsis includes only one summary paragraph for the study, with a citation to one of the publications: usually the one that has been most stringently peer-reviewed.
If one publication includes initial results from a study (e.g. after 1 year) and another reports results for identical outcomes over a longer time span (e.g. after 1–3 years), the synopsis includes only one summary paragraph for the study, with a citation to the latter publication. Publications that duplicate results from summarized studies are recorded in a separate database (available on request).
If two publications describe at least partially different results from the same study, the synopsis includes a summary paragraph for each publication. However, the link between the two summary paragraphs is indicated with a sentence such as “This study was based on the same experimental set-up as [REFERENCE]” or “This study used a subset of the marshes from [REFERENCE]”. The shared design is also flagged at the start of the key messages, with text such as “Two studies1,2 were based on the same experimental set-up”.
f) Taxonomy
We have not updated or standardized taxonomy: scientific names used in each original reference are reported. We have tried to use common names consistently for each species throughout the synopsis. However, be aware that common names in the synopsis might be used to describe different species in certain parts of the world (e.g. white mangrove refers to Laguncularia racemosa in parts of South America, but Avicennia marina in parts of Asia). Where possible, the common name and scientific name are both given the first time a species is mentioned in each paragraph or set of key messages.
g) Statistical significance
Scientists often carry out statistical tests to assess the statistical significance of a result. This tells us whether a result is more extreme than we would expect by chance alone. For example, is higher species richness in burned vs unburned plots likely to reflect a genuine effect of burning, or just random variation amongst the burned and unburned plots?
Results in this synopsis are generally based on assessments of statistical significance. In summary paragraphs, a sentence such as “Statistical significance was not assessed” highlights studies or results which are not based on assessments of statistical significance when they would have been possible. Throughout the synopsis, the word “found” is used to describe results that are (mostly) based on statistical inference, whilst “reported” is used to describe results that (mostly) are not.
Where possible, results in this synopsis are based on tests of statistical significance carried out in original publications. If these do not exist for a given result, or are clearly erroneous, statistical significance was estimated from standard errors or confidence intervals, following Cumming et al. (2007). If the study does not carry out statistical tests and errors are not presented or cannot be used, comparisons are based on raw values (with the aforementioned indication that statistical significance has not been assessed).

1. About this book
16
h) Key messages
For each habitat type (see Table 1) within each intervention, Key Messages give an overview of the evidence. These were written once all studies had been summarized. The first bullet point describes the total number of studies that tested the intervention, the locations of the studies, and any other important summary information. This is followed by bullet points that give a summary of the number, design, location and results of studies for each core outcome and any additional outcomes important for the intervention (see Section 1.5.5). The order of the core outcomes is the same as in Table 2.
If no evidence was found for an intervention, the key messages read as follows:
We found no studies that evaluated the effects of [INTERVENTION] on [OUTCOME AREA].
This means that we have not yet found any studies that have directly evaluated this intervention during our systematic journal and report searches. Therefore we have no evidence to indicate whether or not the intervention has any desirable or harmful effects.
Two simple rules may be helpful when reading key messages from this synopsis:
If any outcome appears as a bullet point in the key messages for an intervention, the bullet point indexes all the studies, returned by our literature searches, which quantified the effect of the intervention on that outcome.
If a core outcome (Table 2) does not appear as a bullet point in the key messages for an intervention, this means we found no studies that quantified the effect of the intervention on that outcome.
i) Background information
At the start of each intervention, a Background box describes the intervention and the logic behind it, to help you interpret the evidence. The background box may direct the reader to studies that have strong implications for the conservation of marsh and swamp vegetation, but do not directly test interventions. CAUTION highlights potential undesirable effects of the intervention on any aspect of the environment. Related interventions are cross-referenced. References are given for each background section.
1.6.5 Dissemination/communication of synopsis
The information in this synopsis is available (a) as a pdf, free to download from www.conservationevidence.com and (b) as text for individual interventions on the searchable database at www.conservationevidence.com. The key messages, along with an expert assessment of the effectiveness of each intervention, will also be included in the next edition of the book What Works in Conservation.
1.7 How to use the information provided
The primary aim of this synopsis is to inform conservation practice and management plans. However, it does not tell you what to do. To use this synopsis effectively, we recommend that you search for information relevant to your work, and then assess how applicable the information is to your situation. For example, ask yourself:

1. About this book
17
Which studies are the most relevant?
Do the studies deal with the same habitats and species as you?
Are the outcomes reported in each study relevant to your aims?
Over what time period were outcomes monitored? Is this long enough to observe meaningful change (or lack of change)?
How dependent are the results on local conditions?
How exactly was the intervention carried out in each study?
How reliable is the design of each study?
You should apply the information to your situation and decide on the course of action most likely to succeed. It may be helpful to refer to the original source to gain a full understanding of particular studies. You may use the synopsis to help you synthesise information across multiple studies, or use it to identify particularly relevant case studies.
Note that a lack of evidence for effects of an intervention does not mean that it is ineffective: it simply means we do not know whether the intervention is effective or not. Interventions without evidence should not necessarily be abandoned. Rather, a lack of evidence should encourage robust monitoring, and sharing of results, to ensure that future conservation efforts will be appropriate and effective.
In addition to evidence about the effects of interventions on vegetation, decisions about what action carry out (if any) should consider evidence about the effects on other groups of organisms and the wider ecosystem. Decisions will also incorporate practical factors such as available time and money, political and legal issues, and values of local people. Marshes and swamps provide diverse benefits to people and so can be highly valuable for a multitude of stakeholders: farmers, hunters, fishers, tourists, conservationists, nearby urban residents, governments, investors and so on. Incorporating these benefits into conservation strategies and allowing “wise use” of marshes and swamps by multiple stakeholders may be essential for successful long-term conservation (Ramsar Convention Secretariat 2010).
The information in this synopsis can also inform research into marsh and swamp conservation. In particular, it can help to identify gaps in knowledge: habitats, geographic locations or outcomes for which there is little or no published evidence. Bear in mind that this synopsis is not an exhaustive catalogue of the published literature, so you may wish to supplement it with your own literature searches.
1.8 How you can help to change conservation practice
If you know of evidence relating to the conservation of marsh or swamp vegetation that is not included in this synopsis, we invite you to contact us via our website www.conservationevidence.com. If you have new, unpublished evidence, you can submit a paper to Conservation Evidence Journal. We welcome all papers reporting the effects of conservation interventions, whether the intervention worked as planned or not. We particularly welcome papers submitted by conservation practitioners.

1. About this book
18
1.9 References
Balian E.V., Segers H., Lévèque C. & Martens K. (2008) The Freshwater Animal Diversity Assessment: an overview of the results. Hydrobiologia, 595, 627–637.
Cowardin L.M., Carter V., Golet F.C. & Laroe E.T. (1979) Classification of Wetlands and Deepwater Habitats of the United States. US Department of the Interior, Fish and Wildlife Service Report FWS/OBS-79/31.
Cumming G., Fidler F. & Vaux D.L. (2007) Error bars in experimental biology. The Journal of Cell Biology, 177, 7–11.
Davidson N. & Finlayson C.M. (2018) Extent, regional distribution and changes in area of different classes of wetlands. Marine and Freshwater Research, 69, 1525–1533.
Davidson N.C., van Dam A.A., Finlayson C.M. & McInnes R.J. (2019) Worth of wetlands: revised global monetary values of coastal and inland wetland ecosystem services. Marine and Freshwater Research, 70, 1189–1194.
Kapos V., Balmford A., Aveling R., Bubb P., Carey P., Entwistle A., Hopkins J., Mulliken T., Safford R., Stattersfield A., Walpole M. & Manica A. (2008) Calibrating conservation: new tools for measuring success. Conservation Letters, 1, 155–164.
Keddy P.A., Fraser L.H., Solomeshch A.I., Junk W.J., Campbell D.R., Arroyo M.T.K. & Alho C.J.R. (2009) Wet and wonderful: the world’s largest wetlands are conservation priorities. BioScience, 59, 39–51.
Martin P.A., Rocha R. & Smith R. (2017) Shrubland and Heathland Conservation: Global Evidence for the Effects of Interventions. Synopses of Conservation Evidence Series. University of Cambridge, Cambridge.
Mitsch W.J. & Gosselink J.G. (2015) Wetlands, Fifth Edition. Wiley, New Jersey.
Ramsar Convention Secretariat (2010) Wise Use of Wetlands: Concepts and Approaches for the Wise Use of Wetlands, Fourth Edition. Ramsar Convention Secretariat, Gland.
Ramsar Convention on Wetlands (2018) Global Wetland Outlook: State of the World’s Wetlands and their Services to People. Ramsar Convention Secretariat, Gland.
Sutherland W.J., Pullin A.S., Dolman P.M. & Knight T.M. (2004) The need for evidence-based conservation. Trends in Ecology & Evolution, 19, 305–308.
Sutherland W.J., Taylor N.G., MacFarlane D., Amano T., Christie A.P., Dicks L.V., Lemasson A.J., Littlewood N.A., Martin P.A., Ockendon N., Petrovan S.O., Robertson R.J., Rocha R., Shackelford G.E., Smith R.K., Tyler E.H.M. & Wordley C.F.R. (2019) Building a tool to overcome barriers in the research-implementation space: the Conservation Evidence database. Biological Conservation, 238, 108199.
Sutherland W.J. & Wordley C.F.R. (2018) A fresh approach to evidence synthesis. Nature, 558, 364–366.
Stewart R.E. & Kantrud H.A. (1972) Vegetation of prairie potholes, North Dakota, in relation to quality of water and other environmental factors. United States Geological Survey Professional Paper 585-D.
Taylor N.G., Grillas P. & Sutherland W.J. (2018) Peatland Conservation: Global Evidence for the Effects of Interventions to Conserve Peatland Vegetation. Synopses of Conservation Evidence Series. University of Cambridge, Cambridge.
Zedler J.B. (2007) Success: an unclear, subjective descriptor of restoration outcomes. Ecological Restoration, 25, 162–168.
19
2. Threat: Residential and commercial development
Background
This chapter considers interventions to counter damage to marshes and swamps from residential and commercial developments with a large footprint. This includes residential areas, factories, power plants, shopping malls, ports and airports. Large areas of London, Paris, Berlin, St. Petersburg, Chicago, New Orleans and Toronto were built on wetlands (Giblett 2016). Urban areas in Thailand, southern Malaysia and Vietnam have encroached onto mangrove habitats (Richards & Friess 2016).
Residential and commercial development can involve habitat destruction, changes in water levels, pollution, and impacts from transportation and service corridors. Interventions in response to these threats are described in other chapters.
Related chapters: Threat: Energy production and mining, including construction of infrastructure such as oil wells and solar farms (Chapter 4); Threat: Transportation and service corridors (Chapter 5); Threat: Human intrusions and disturbance (Chapter 7); Threat: Natural system modifications, including altered water levels (Chapter 8); Threat: Pollution (Chapter 10); Habitat restoration and creation (Chapter 12); Habitat protection, including protection against development (Chapter 14).
Giblett R. (2016) Cities and Wetlands: The Return of the Repressed in Nature and Culture. Bloomsbury, London, UK and New York, NY, USA.
Richards D.R. & Friess D.A. (2016) Rates and drivers of mangrove deforestation in Southeast Asia, 2000–2012. Proceedings of the National Academy of Sciences USA, 113, 344–349.
2.1 Remove residential or commercial development
We found no studies that evaluated the effects, on vegetation, of removing residential or commercial development to restore/create marshes or swamps.
This means that we have not yet found any studies that have directly evaluated this intervention during our systematic journal and report searches. Therefore we have no evidence to indicate whether or not the intervention has any desirable or harmful effects.
Background
Parking lots, shopping centres, housing, industrial facilities or tourist sites are sometimes built on marshes or swamps. Removing such developments could allow marsh or swamp vegetation to recover (e.g. at the Del Mar Fairgrounds in California, USA; Brennan 2017), or provide an opportunity to create new marshes or swamps.
Related interventions: Raise water level to restore degraded marshes or swamps (8.1); Raise water level to restore/create marshes or swamps from other land uses (12.4); habitat restoration and creation interventions (Chapter 12).
Brennan D.S. (2017) Parking lot becomes salt marsh in Del Mar wetland restoration. Available at https://www.sandiegouniontribune.com/communities/north-county/sd-no-delmar-wetlands-20170713-story.html. Accessed 24 June 2020.

2. Threat: Residential and commercial development
20
2.2 Retain/create habitat linkages in developed areas
We found no studies that evaluated the effects, on marsh/swamp vegetation, of retaining or creating habitat linkages in developed areas.
This means that we have not yet found any studies that have directly evaluated this intervention during our systematic journal and report searches. Therefore we have no evidence to indicate whether or not the intervention has any desirable or harmful effects.
Background
Isolated habitat patches can be linked with continuous habitat corridors, or with discrete habitat patches as stepping stones (Bennett 2003). Linkages could improve survival prospects and diversity of plant populations in habitat patches (Damschen et al. 2006), because seeds, pollen or vegetation fragments can be moved along them (e.g. by animals). CAUTION: Habitat linkages can also allow diseases, non-native species and fire to spread between patches (Resasco et al. 2014).
Studies of this intervention could involve linkages of any habitat type, as long as effects on marsh or swamp vegetation are evaluated.
Related interventions: Retain/create habitat linkages in farmed areas (3.2); Retain/ create habitat linkages in areas of energy production or mining (4.2); Retain/create habitat linkages across service corridors (5.4); habitat restoration and creation interventions, to restore/create linkages of marsh or swamp habitat (Chapter 12).
Bennett, A.F. (2003). Linkages in the Landscape: The Role of Corridors and Connectivity in Wildlife Conservation. IUCN, Gland, Switzerland and Cambridge, UK.
Damschen E.I., Haddad N.M., Orrock J.L., Tewksbury J.J. & Levey D.J. (2006) Corridors increase plant species richness at large scales. Science, 313, 1284–1286.
Resasco J., Haddad N.M., Orrock J.L., Shoemaker D., Brudvig L., Damschen E.I., Tewksbury J.J. & Levy D.J. (2014) Landscape corridors can increase invasion by an exotic species and reduce diversity of native species. Ecology, 95, 2033–2039.
2.3 Integrate marshes or swamps into developed areas
We found no studies that evaluated the effects, on vegetation, of incorporating marshes or swamps into developed areas.
This means that we have not yet found any studies that have directly evaluated this intervention during our systematic journal and report searches. Therefore we have no evidence to indicate whether or not the intervention has any desirable or harmful effects.
Background
Marsh or swamp habitats could be intentionally retained within developed areas (e.g. Densu Delta Ramsar Site in Accra, Ghana). Alternatively or additionally, they could be created or restored within existing developments – at a range of scales, from the 30-ha London Wetland Centre to green roofs on individual buildings (Song et al. 2013). Wetlands within developed areas can provide numerous benefits to people within developed areas, from water storage and purification to recreation and relaxation (Ramsar Convention Secretariat 2018). An assessment of the effects of conservation on such “ecosystem services” is beyond the scope of this synopsis.

2. Threat: Residential and commercial development
21
To be summarized as evidence for this intervention, studies should evaluate its overall effects, e.g. by comparing comparisons of plant diversity in marshes or swamps before and after development that deliberately retained these habitats. Assessments of vegetation within specific protected, restored or created sites are included in other chapters (12 and 14).
Related interventions: Retain/create habitat linkages in developed areas (2.2); habitat restoration and creation interventions (Chapter 12); Designate protected area (14.1) and Provide general protection for marshes or swamps (14.2), including policies and laws to protect these habitats in developed areas.
Ramsar Convention Secretariat (2018) Wetlands: Essential for a Sustainable Urban Future. Ramsar Factsheet 10. Available at https://www.ramsar.org/sites/default/files/urban_wetlands_en.pdf. Accessed 6 November 2020.
Song U., Kim E., Bang J.H., Son D.J., Waldman B. & Lee E.J. (2013) Wetlands are an effective green roof system. Building and Environment, 66, 141–147.

22
3. Threat: Agriculture and aquaculture
Background
This chapter considers interventions to counter the threat from agriculture and aquaculture within marshes or swamps. Threats that affect marshes and swamps near to agricultural land – such as water extraction, pollution and fire – are considered in other chapters.
Large areas of marsh and swamp have been – and continue to be – converted to farmland. For example, in the Mediterranean region, around 46% of wetlands were converted to cropland between 1975 and 2005 (MWO 2018). In China, about 60% of the loss of natural wetland area between 1990 and 2010 was due to conversion for grain production (Mao et al. 2018). Conversion to agriculture or aquaculture is a key driver of mangrove loss (Richards & Friess 2016; Thomas et al. 2017).
Marshes and swamps are often drained to allow cultivation, but crops can also be grown in areas that remain as wetlands – when they are wet (e.g. rice) or during the dry season (e.g. African dambos; Turner 1986). Similarly, marshes and swamps can be used by grazing livestock or for aquaculture, with potential negative impacts on biodiversity through direct consumption, trampling, reduced water clarity, and changes in nutrient levels following feeding or excretion (Bellingham & Davis 2008; Hoppe-Speer et al. 2015). Note that “livestock” is defined broadly in this synopsis and includes all domesticated animals reared for labour or produce.
Related chapters: Threat: Biological resource use, including harvesting of existing wild vegetation (Chapter 6); Threat: Natural system modifications, such as drainage and changes to disturbance regimes, to make sites suitable for agriculture (Chapter 8); Threat: Pollution, from agriculture/aquaculture within marshes or swamps or in their catchments (Chapter 10); Habitat restoration and creation (Chapter 12); Habitat protection, including voluntary codes and payment schemes to protect marshes or swamps (Chapter 14); Education and awareness-raising for landowners (Chapter 15).
Bellingham M. & Davis A. (2008) Livestock Grazing Impacts on Estuarine Vegetation in the Southern Kaipara Harbour. Contract Report for the Auckland Regional Council, Aristos Consultants Ltd., New Zealand.
Hoppe-Speer S.C.L., Adams J.B. & Bailey D. (2015) Present state of mangrove forests along the Eastern Cape coast, South Africa. Wetlands Ecology and Management, 23, 371–383.
Mao D., Luo L., Wang Z., Wilson M.C., Zeng Y., Wu B. & Wu J. (2018) Conversions between natural wetlands and farmland in China: a multiscale geospatial analysis. Science of the Total Environment, 634, 550–560.
MWO (2018) Mediterranean Wetlands Outlook 2: Solutions for Sustainable Mediterranean Wetlands. Tour du Valat, Arles, France.
Richards D.R. & Friess D.A. (2016) Rates and drivers of mangrove deforestation in Southeast Asia, 2000–2012. Proceedings of the National Academy of Sciences USA, 113, 344–349.
Thomas N., Lucas R., Bunting P., Hardy A., Rosenqvist A. & Simard M. (2017) Distribution and drivers of global mangrove forest change, 1996–2010. PloS ONE, 12, e0179302.
Turner, B. (1986) The importance of dambos in African agriculture. Land Use Policy, 3, 343–347.

3. Threat: Agriculture and aquaculture
23
Multiple farming systems
3.1 Implement ‘mosaic management’ of farmland
We found no studies that evaluated the effects, on marsh/swamp vegetation, of implementing mosaic management in agricultural systems.
This means that we have not yet found any studies that have directly evaluated this intervention during our systematic journal and report searches. Therefore we have no evidence to indicate whether or not the intervention has any desirable or harmful effects.
Background
Mosaic management involves managing neighbouring patches of land in different ways, across large scales. For example, patches of agricultural land or aquaculture pools could be interspersed with natural marsh vegetation that is never harvested or sustainably harvested. Alternatively, in a set of fields or farms, half could be cultivated at any one time whilst half are left undisturbed. Note that mosaic management involving marshes or swamps may only be possible if the farmed areas are kept wet: draining patches of land for agriculture can lower the entire local water table.
To be summarized as evidence for this intervention, studies must have considered the overall effectiveness of mosaic management, comparing marsh or swamp vegetation across the whole mosaic to an area not under mosaic management (e.g. traditional farmland or nature reserves; Oosterveld et al. 2010). Studies comparing vegetation between individual patches would be summarized elsewhere in the synopsis.
Related interventions: Implement ‘mosaic management’ when harvesting wild vegetation (6.5).
Oosterveld E.B., Nijland F., Musters C.J.M. & de Snoo G.R. (2010) Effectiveness of spatial mosaic management for grassland breeding shorebirds. Journal of Ornithology, 152, 161–170.
3.2 Retain/create habitat linkages in farmed areas
We found no studies that evaluated the effects, on marsh/swamp vegetation, of retaining or creating habitat linkages in farmed areas.
This means that we have not yet found any studies that have directly evaluated this intervention during our systematic journal and report searches. Therefore we have no evidence to indicate whether or not the intervention has any desirable or harmful effects.
Background
Isolated habitat patches can be linked with continuous habitat corridors, or with discrete habitat patches as stepping stones (Bennett 2003). Linkages could improve survival prospects and diversity of plant populations in habitat patches (Damschen et al. 2006), because seeds, pollen or vegetation fragments can be moved along them (e.g. by animals). CAUTION: Habitat linkages can also allow diseases, non-native species and fire to spread between patches (Resasco et al. 2014).
Studies of this intervention could involve linkages of any habitat type, as long as effects on marsh or swamp vegetation are evaluated.

3. Threat: Agriculture and aquaculture
24
Related interventions: Retain/create habitat linkages in developed areas (2.2); Retain/ create habitat linkages in areas of energy production or mining (4.2); Retain/create habitat linkages across service corridors (5.4); habitat restoration and creation interventions, to restore/create linkages of marsh or swamp habitat (Chapter 12).
Bennett, A.F. (2003). Linkages in the Landscape: The Role of Corridors and Connectivity in Wildlife Conservation. IUCN, Gland, Switzerland and Cambridge, UK.
Damschen E.I., Haddad N.M., Orrock J.L., Tewksbury J.J. & Levey D.J. (2006) Corridors increase plant species richness at large scales. Science, 313, 1284–1286.
Resasco J., Haddad N.M., Orrock J.L., Shoemaker D., Brudvig L., Damschen E.I., Tewksbury J.J. & Levy D.J. (2014) Landscape corridors can increase invasion by an exotic species and reduce diversity of native species. Ecology, 95, 2033–2039.
3.3 Regulate farming to allow gradual regeneration of marshes or
swamps
We found no studies that evaluated the effects, on marsh/swamp vegetation, of regulating farming to allow gradual habitat regeneration.
This means that we have not yet found any studies that have directly evaluated this intervention during our systematic journal and report searches. Therefore we have no evidence to indicate whether or not the intervention has any desirable or harmful effects.
Background
The Tanzanian Forest Service provides renewable, one-year licenses that allow rice farming to continue if the farmers allow mangrove trees to grow. The intention is that several years later, the farmland is abandoned because the trees cast too much shade for the rice, and full regeneration of the mangrove habitat can occur (Evans 2017). This principle could be applied to other habitats. However, such a scheme creates a perverse incentive for farmers to prevent recovery of the target vegetation to avoid being forced off their land (Evans 2017). Even if farmers do abandon their original plot following habitat regeneration, it is possible they will clear vegetation elsewhere to begin farming again.
Related interventions: Abandon cropland (3.4); Abandon plantations (3.6); Exclude or remove livestock from historically grazed marshes or swamps (3.9); Pay stakeholders to protect marshes or swamps (14.4).
Evans M. (2017) Protecting Tanzania’s Mangroves. Available at http://forestsnews.cifor.org/48023/ protecting-tanzanias-mangroves?fnl=en. Accessed 14 July 2019.
Annual and perennial non-timber crops
3.4 Abandon cropland: allow marshes or swamps to recover
without active intervention
Background
It may be possible that marshes or swamps will recover on their own, without any active intervention, if human activities are stopped. Such passive recovery can be

3. Threat: Agriculture and aquaculture
25
cheaper than active intervention and allow development of a community well adapted to local conditions. However, plant colonization may not occur at all or, if it does, occur slowly or be dominated by invasive species (Zahawi et al. 2014). Successful recovery may be hindered by physical degradation (e.g. a water table that is too low, restricted tidal exchange), chemical degradation (e.g. acidification of wetland soils when exposed to oxygen) or an insufficient supply of propagules.
To be summarized as evidence for this intervention, studies must have monitored cropland that has been abandoned (farming activities completely stopped, with no additional intervention) with the expectation that marshes or swamps could recover. Therefore, the summarized evidence is best considered as an indication of what kind of vegetation can develop in abandoned cropland, and how long it takes to develop, rather than a complete survey of all relevant evidence. The outcome of abandonment could be very different depending on whether it occurs after a final clearance of crops or not; both options are within the scope of this intervention.
Related interventions: Abandon plantations (3.6); Abandon aquaculture facilities (3.13); Exclude or remove livestock from historically grazed marshes or swamps (3.9); Raise water level to restore/create marshes or swamps from other land uses (12.4); Modify farming practices in watershed, including abandonment of cropland (10.13); habitat restoration and creation interventions, including any active intervention on former cropland (Chapter 12); habitat protection that may drive cropland abandonment (Chapter 14).
Zahawi R.A., Reid J.L. & Holl K.D. (2014) Hidden costs of passive restoration. Restoration Ecology, 22, 284–287.
3.4.1 Abandon cropland: allow freshwater marshes or swamps to
recover without active intervention
Four studies evaluated the effects, on vegetation, of abandoning cropland with the expectation that freshwater marshes or swamps would recover spontaneously. There was one study in each of Spain1, South Korea2, China3 and Japan4. The studies involved former rice fields1,2, soybean fields3 or pastures4.
VEGETATION COMMUNITY
Community composition (2 studies): Two site comparison studies in South Korea2 and Japan4 reported that the overall plant community composition in abandoned cropland became more like natural swamps2,4 and/or marshes4 over time.
Overall richness/diversity (2 studies): One site comparison study on a floodplain in Japan4 found that pastures abandoned for 5–25 years contained a higher richness of vascular, wetland plant species than pastures that remained in use. One study in South Korea2 simply reported that the number of plant species in abandoned rice paddies increased over time.
Characteristic plant richness/diversity (1 study): One site comparison study on a floodplain in Japan4 found that pastures abandoned for 5–25 years typically contained more marsh-indicator and swamp-indicator species than pastures that remained in use.
VEGETATION ABUNDANCE
Overall abundance (2 studies): One site comparison study in China3 found that vegetation biomass in abandoned soybean fields was lower than in natural wet meadows after three years, similar to natural wet meadows after six years, and higher than in natural wet meadows after 12 years. One

3. Threat: Agriculture and aquaculture
26
study in Spain1 simply quantified the peak biomass and density of vegetation in rice fields abandoned for up to six years. Biomass, but not density, increased with time since abandonment.
VEGETATION STRUCTURE
Height (1 study): One site comparison study in China3 found that soybean fields abandoned for 3–12 years contained vegetation of a similar height to natural wet meadows.
Diameter/perimeter/area (1 study): One site comparison study in South Korea2 reported that rice fields abandoned for 10 years contained thinner-stemmed Japanese alder Alnus japonica than mature alder forests.
A study in 1993–1995 of six former rice fields in a delta in north-east Spain (1) reported that after rice cultivation was stopped (but irrigation continued) the fields were colonized by rushes and reeds, and that older abandoned fields contained taller vegetation with greater biomass. A field surveyed one year after cultivation stopped was dominated by barnyardgrass Echinochloa spp. and sea club rush Scirpus maritimus. Older fields, surveyed 2–6 years after cultivation stopped, were dominated by sea club rush, broadleaf cattail Typha latifolia or common reed Phragmites australis. Cover was not quantified. In older fields, vegetation reached a significantly greater peak above-ground biomass (e.g. 1–2 years old: 520–817 g/m2; 4–6 years old: 1,195–1,391 g/m2), although there were no significant differences over time in vegetation density (157–246 stems/m2) or height (<50–124 cm). Methods: In 1993, 1994 or 1995, emergent vegetation was surveyed in each of six former rice fields: 1, 2, 3, 4, 5 or 6 years after rice cultivation had stopped (although controlled April–October fresh water flooding continued). Each month during the controlled flooding, above-ground biomass was cut from eight 40 x 40 cm quadrats/field then dried and weighed. The height of the dominant species was measured in three of the quadrats.
A site comparison study in 1993 involving five abandoned rice paddies in northern South Korea (2) reported that they were colonized by wetland plants, with increases over 10 years in woody plant dominance and plant species richness. Statistical significance was not assessed. The overall plant community composition differed between wetlands abandoned for different lengths of time (data reported as a graphical analysis and importance values). Paddies abandoned for ≤3 years were dominated by herbaceous wetland plant species. A paddy abandoned for seven years was co-dominated by common rush Juncus effusus and willow Salix coriyanagi. Paddies abandoned for 10 years were dominated by willow with some Japanese alder Alnus japonica. The Japanese alder had an average stem diameter of <1 cm, compared to 20–24 cm in nearby mature alder stands. Finally, total plant species richness increased with the length of time paddies had been abandoned (data reported as rank-abundance curves). Methods: In summer 1993, plant species and their cover were recorded in five rice paddies (23–26 quadrats/paddy, each 1–5 m2) abandoned for varying lengths of time (<1, 3, 7 or 10 years). The paddies had naturally wet soils and had been cultivated using traditional techniques. Japanese alder diameter was also surveyed in seven nearby, 40-year-old forests (one 400-m2 plot/forest).
A replicated, site comparison study in 2009 of three abandoned soybean fields in northeast China (3) found that they had developed wet meadow vegetation after 3–12 years – of similar height to a natural meadow in three of three comparisons, but with similar biomass in only one of three comparisons. All three abandoned fields and the natural meadow were dominated by the grass Calamagrostis angustifolia, sometimes along with other species (community composition not quantified). All three

3. Threat: Agriculture and aquaculture
27
abandoned fields had vegetation of a similar average height (79–94 cm) to the natural meadow (87 cm). However, only the field abandoned for six years had similar vegetation biomass (383 g/m2) to the natural meadow (420 g/m2). Biomass was lower the field abandoned for three years (353 g/m2) and higher in the field abandoned for 12 years (533 g/m2). Methods: In summer 2009, vegetation was surveyed in four wet meadows: three developing in abandoned soybean fields and one natural (never cultivated). Vegetation was cut from one 0.25-m2 quadrat/meadow, then dried and weighed. Details of plant height measurements were not reported.
A site comparison study in 2012 on a floodplain in Hokkaido, Japan (4) found that pastures abandoned for 5–25 years developed a plant community more like natural marshes or swamps than current pastures, typically with more wetland and habitat-characteristic species. The overall plant community composition in abandoned pastures was intermediate between that of natural wetlands and pastures still in use – but was more similar to marshes and swamps than to bogs (data reported as a graphical analysis). Pastures abandoned for the longest time had the most similar community to natural wetlands. Compared to current pastures, abandoned pastures contained more wetland plant species in four of four comparisons (abandoned: 1.2–2.0; current: 0.2 species/m2) and more species indicative of local marshes or swamps in seven of eight comparisons (abandoned: 0.4–0.7; current: <0.1 species/m2). Abandoned pastures retained a similar number of pasture species to current pastures in three of four comparisons (for which abandoned: 0.5–0.7; current: 0.8 species/m2). Methods: In July and September 2012, cover of vascular plant species was surveyed in 88 quadrats (each 4 m2) across a floodplain. There were 55 quadrats in abandoned pastures (drained, ploughed and sown for approximately 17 years, but abandoned for 5, 12, 14 or 25 years; water table 37–52 cm below surface, on average, in late summer–autumn), 14 quadrats in pastures still being cultivated (water table 96 cm below surface), and 19 quadrats in remnant patches of marsh, swamp or bog.
(1) Comín F.A., Romero J.A., Hernández O. & Menéndez M. (2001) Restoration of wetlands from abandoned rice fields for nutrient removal, and biological community and landscape diversity. Restoration Ecology, 9, 201–208.
(2) Lee C.-S., You Y.-H. & Robinson G.R. (2002) Secondary succession and natural habitat restoration in abandoned rice fields of central Korea. Restoration Ecology, 10, 306–314.
(3) Song Y., Song C., Yang G., Miao Y., Wang J. & Guo Y. (2012) Changes in labile organic carbon fractions and soil enzyme activities after marshland reclamation and restoration in the Sanjiang Plain in northeast China. Environmental Management, 50, 418–426.
(4) Morimoto J., Shibata M., Shida Y. & Nakamura F. (2017) Wetland restoration by natural succession in abandoned pastures with a degraded soil seed bank. Restoration Ecology, 25, 1005–1014.
3.4.2 Abandon cropland: allow brackish/saline marshes or swamps to
recover without active intervention
We found no studies that evaluated the effects, on vegetation, of abandoning cropland with the expectation that brackish/saline marshes or swamps would recover spontaneously.
This means that we have not yet found any studies that have directly evaluated this intervention during our systematic journal and report searches. Therefore we have no evidence to indicate whether or not the intervention has any desirable or harmful effects.

3. Threat: Agriculture and aquaculture
28
3.5 Flood cropland when fallow
Background
Flooding cropland during fallow seasons or years, when crops are not being grown, could allow wetland plant communities to develop temporarily. If this fallow period occurs within a yearly cycle, annual plant species will dominate. If the fallow period is long enough and at the right time of year, these species may be able to complete their life cycle within cropland. This intervention is particularly relevant to rice fields and other marshes.
Related interventions: Raise water level to restore degraded marshes or swamps (8.1); Raise water level to restore/create marshes or swamps from other land uses (12.4).
3.5.1 Flood cropland when fallow to conserve freshwater marshes
One study evaluated the effects, on freshwater marsh vegetation, of flooding cropland during fallow seasons or years. The study was in Brazil.
VEGETATION COMMUNITY
Community composition (1 study): One replicated, site comparison study in Brazil1 found that flooding rice fields during their fallow period affected the overall community composition of wetland plants, but that the nature of the effect depended on when fields were surveyed.
Overall richness/diversity (1 study): The same study1 found that flooding rice fields during their fallow period had no significant effect on wetland plant species richness per site and per survey, although fewer species were recorded in the flooded fields over the year of the study.
VEGETATION ABUNDANCE
VEGETATION STRUCTURE
A replicated, site comparison study in 2005–2006 of six rice fields in southern Brazil (1) found that rice fields that were flooded when fallow contained a different wetland plant community to rice fields that remained drained when fallow, but with similar species richness and biomass. The overall wetland plant community composition in the rice fields depended on the combination of flooding regime (whether fields were flooded or drained when uncultivated) and survey period (whether fields were cultivated or fallow when surveyed; data reported as a graphical analysis). Flooded and drained fields supported statistically similar species richness (flooded: 4–12 species/1.5 m2/survey; drained: 2–15 species/1.5 m2/survey) and biomass (flooded: 1–85 g/m2/survey; drained: 1–35 g/m2/survey) of wetland plants. However, only 22–31 different wetland plant species were recorded in flooded fields over the study year, compared to a total of 31–44 in drained fields. Methods: Between June 2005 and June 2006, wetland vegetation was surveyed in six rice fields (six 0.25-m2 quadrats/field/survey). Surveys covered all stages of the rice cultivation cycle, including cultivated (field preparation and rice growth) and uncultivated (post-harvest and fallow) periods. All fields were flooded when cultivated. During the uncultivated periods three of the fields were flooded and three were drained. Above-ground vegetation collected from each quadrat was dried before weighing.
(1) Rolon A.S. & Maltchik L. (2010) Does flooding of rice fields after cultivation contribute to wetland plant conservation in southern Brazil? Applied Vegetation Science, 13, 26–35.

3. Threat: Agriculture and aquaculture
29
3.5.2 Flood cropland when fallow to conserve brackish/salt marshes
We found no studies that evaluated the effects, on brackish/salt marsh vegetation, of flooding cropland during fallow seasons or years.
This means that we have not yet found any studies that have directly evaluated this intervention during our systematic journal and report searches. Therefore we have no evidence to indicate whether or not the intervention has any desirable or harmful effects.
Wood and pulp plantations
3.6 Abandon plantations: allow marshes or swamps to recover
without active intervention
We found no studies that evaluated the effects, on vegetation, of abandoning plantations with the expectation that marshes or swamps would recover spontaneously.
This means that we have not yet found any studies that have directly evaluated this intervention during our systematic journal and report searches. Therefore we have no evidence to indicate whether or not the intervention has any desirable or harmful effects.
Background
It may be possible that marshes or swamps will recover on their own, without any active intervention, if human activities are stopped. Such passive recovery can be cheaper than active intervention and allow development of a community well adapted to local conditions. However, plant colonization may not occur at all or, if it does, occur slowly or be dominated by invasive species (Zahawi et al. 2014). Successful recovery may be hindered by physical degradation (e.g. a water table that is too low, restricted tidal exchange), chemical degradation (e.g. acidification of wetland soils when exposed to oxygen) or an insufficient supply of propagules.
To be summarized as evidence for this intervention, studies must have monitored plantations that have been abandoned (plantation maintenance completely stopped, with no additional intervention) with the expectation that marshes or swamps could recover. Therefore, any summarized evidence is best considered as an indication of what kind of vegetation can develop in abandoned plantations, and how long it takes to develop, rather than a complete survey of all relevant evidence.
Related interventions: Abandon cropland (3.4); Cut/remove/thin forest plantations (3.7); Raise water level to restore degraded marshes or swamps (8.1); Raise water level to restore/create marshes or swamps from other land uses (12.4); Modify logging practices in watershed, including abandonment of plantations (10.14); habitat restoration and creation interventions, including any active intervention in former plantations (Chapter 12); habitat protection that may drive abandonment (Chapter 14).
Zahawi R.A., Reid J.L. & Holl K.D. (2014) Hidden costs of passive restoration. Restoration Ecology, 22, 284–287.
3.7 Cut/remove/thin forest plantations
Background

3. Threat: Agriculture and aquaculture
30
This intervention includes clear cutting (felling and removing all trees) and thinning (removal of only some trees) to address the threat from forest plantations (i.e. areas where trees have been deliberately planted, usually after drainage). Large wetland areas have been drained and afforested in the Paraná River Delta, South America (Ceballos et al. 2013) and the Sanjiang Plain, China (Zhang et al. 2014). Removing trees may increase light intensity at the ground surface allowing herbaceous plants to grow (Aschehoug et al. 2015), and may allow the water table to rise somewhat, since water is no longer intercepted or taken up by the trees).
Related interventions: Raise water level to restore degraded marshes or swamps (8.1); Raise water level to restore/create marshes or swamps from other land uses (12.4); Cut large trees/shrubs to maintain or restore disturbance (8.8); Use cutting to control problematic large trees/shrubs (9.9).
Aschehoug E.T., Sivakoff F.S., Cayton H.L., Morris W.F. & Haddad N.M. (2015) Habitat restoration affects immature stages of a wetland butterfly through indirect effects on predation. Ecology, 96, 1761–1767.
Ceballos D.S., Frangi J. & Jobbágy E.G. (2013) Soil volume and carbon storage shifts in drained and afforested wetlands of the Paraná River Delta. Biogeochemistry, 112, 359‒372.
Zhang B., Chang L., Ni Z., Callaham M.A., Sun X. & Wu D. (2014) Effects of land use changes on winter-active Collembola in Sanjiang Plain of China. Applied Soil Ecology, 83, 51‒58.
3.7.1 Cut/remove/thin forest plantations: freshwater marshes
One study evaluated the effects, on vegetation, of cutting/removing/thinning forest plantations to restore freshwater marshes. The study was in the USA.
VEGETATION COMMUNITY
Characteristic plant richness/diversity (1 study): One replicated, controlled study in the USA1 reported that the effect of thinning/clearing forest plantations on wetland-characteristic plant species richness depended on soil moisture. After three growing seasons, wetter thinned/cleared sites generally contained more wetland-characteristic plant species than drier thinned/cleared sites or sites that remained afforested.
VEGETATION ABUNDANCE
VEGETATION STRUCTURE
A replicated, controlled study in 2002–2005 involving 24 pine plantations on a gradient of moist to dry soils in Ohio, USA (1) reported that some sites where trees were thinned or cleared contained more wetland-characteristic plant species than sites that remained afforested. Statistical significance was not assessed. After three growing seasons, six thinned or cleared sites developed wetter soils than the others and contained 4–18 wetland-characteristic plant species/0.05 ha. Nine thinned and cleared sites that retained drier soils contained 0–9 such species/0.05 ha. Nine sites that remained fully afforested, and also had drier soils, contained 1–3 such species/0.05 ha. Methods: In early 2002, pine Pinus spp. plantations (47–63 years old; 900 trees/ha) were thinned or cleared from 15 sites (50–100% of trees removed, but many of the remaining trees died). Nine other sites were left fully afforested. Soil moisture varied between sites: the driest, upland sites were not expected to develop wetland vegetation even if trees were removed. Understory vegetation (a mix of herbs and shrubs) was surveyed in summer 2004 in one 20 x 25 m plot in the centre of each site.

3. Threat: Agriculture and aquaculture
31
(1) Abella S.R., Schetter T.A. & Walters T.L. (2017) Restoring and conserving rare native ecosystems: a 14-year plantation removal experiment. Biological Conservation, 212, 265–273.
3.7.2 Cut/remove/thin forest plantations: brackish/salt marshes
We found no studies that evaluated the effects, on vegetation, of cutting/removing/thinning forest plantations to restore brackish/salt marshes.
This means that we have not yet found any studies that have directly evaluated this intervention during our systematic journal and report searches. Therefore we have no evidence to indicate whether or not the intervention has any desirable or harmful effects.
3.7.3 Cut/remove/thin forest plantations: freshwater swamps
We found no studies that evaluated the effects, on vegetation, of cutting/removing/thinning forest plantations to restore freshwater swamps.
This means that we have not yet found any studies that have directly evaluated this intervention during our systematic journal and report searches. Therefore we have no evidence to indicate whether or not the intervention has any desirable or harmful effects.
3.7.4 Cut/remove/thin forest plantations: brackish/saline swamps
We found no studies that evaluated the effects, on vegetation, of cutting/removing/thinning forest plantations to restore brackish/saline swamps.
This means that we have not yet found any studies that have directly evaluated this intervention during our systematic journal and report searches. Therefore we have no evidence to indicate whether or not the intervention has any desirable or harmful effects.
Livestock farming and ranching
3.8 Use barriers to keep livestock off ungrazed marshes or
swamps
Background
This intervention involves excluding livestock – with physical barriers such as fences or hedgerows, or virtual barriers involving GPS trackers and negative sounds or electric shocks (SRUC 2015) – from an area of natural, ungrazed marsh or swamp. Here, “ungrazed” refers to the recent history of a site, so studies of sites that have not been recently grazed and so have regained their natural ecological character would also be included here.
Domestic livestock can directly consume vegetation, destroy vegetation by trampling, create bare patches of ground (e.g. repeatedly used tracks), affect water infiltration and flows by compacting soils, affect nutrient balance through excretion of waste products, and import seeds of undesirable plants (Morris & Reich 2013).
Related interventions: Exclude or remove livestock from historically grazed marshes or swamps (3.9); Use grazing to maintain or restore disturbance (8.9); Use grazing to control problematic plants (9.10); Exclude wild vertebrates (9.15); Use fences or barriers to protect planted areas (13.19).

3. Threat: Agriculture and aquaculture
32
Morris K. & Reich P. (2013) Understanding the Relationship Between Livestock Grazing and Wetland Condition. Arthur Rylah Institute for Environmental Research, Technical Report Series No. 252.
SRUC (2015) Virtual Fencing Systems for Livestock. Available at https://www.sruc.ac.uk/download /downloads/id/3128/virtual_fencing_systems_for_livestock.pdf. Accessed 7 January 2020.
3.8.1 Use barriers to keep livestock off ungrazed freshwater marshes
We found no studies that evaluated the effects, on vegetation, of using barriers to keep livestock off freshwater marshes that have never (or not recently) been grazed.
This means that we have not yet found any studies that have directly evaluated this intervention during our systematic journal and report searches. Therefore we have no evidence to indicate whether or not the intervention has any desirable or harmful effects.
3.8.2 Use barriers to keep livestock off ungrazed brackish/salt marshes
One study evaluated the effects, on vegetation, of using barriers to keep livestock off brackish/salt marshes that have never (or not recently) been grazed. The study was in the UK.
VEGETATION COMMUNITY
Overall richness/diversity (1 study): One replicated, controlled study in a salt marsh in the UK1 reported that plots fenced to exclude sheep contained more plant species, after four years, than plots that became grazed by sheep.
VEGETATION ABUNDANCE
Overall abundance (1 study): One replicated, controlled study in a salt marsh in the UK1 reported that plots fenced to exclude sheep contained more vegetation biomass, after two years, than plots that became grazed by sheep.
Individual species abundance (1 study): The same study1 also quantified the effect of this intervention on the abundance of individual plant species. For example, plots fenced to exclude sheep contained more cordgrass Spartina sp. and less saltbush Atriplex hastata, after four years, than plots that became grazed by sheep.
VEGETATION STRUCTURE
A replicated, controlled study in 1955–1959 in an estuarine salt marsh in England, UK (1) reported that plots from which livestock were excluded contained more overall vegetation biomass and more plant species than plots that became grazed, and that exclusion had mixed effects on the abundance of individual plant species. Statistical significance was not assessed. After two years, exclusion plots contained 7,293 g/m2 above-ground vegetation biomass (vs grazed: 5,325 g/m2; start of experiment: 7,720 g/m2). After four years, exclusion plots contained 9 plant species in total (vs grazed: 6; start of experiment: 5). Exclusion plots contained less cordgrass Spartina sp. and saltmarsh grass Puccinellia maritima than grazed plots, and more saltbush Atriplex hastata. For example, cover of mature cordgrass plants was only 5–59% in exclusion plots after four years (vs grazed: 64–89%) and cordgrass biomass declined more strongly over the first two years in exclusion plots (by 288 g/m2) than grazed plots (by 167 g/m2). See original paper for full data. Methods: In summer 1955, eight 9 x 13 m plots were established in a cordgrass-dominated salt marsh. Four plots were fenced to exclude sheep. Sheep were introduced to graze the other four plots (summer only; average 32 sheep days/plot/year). Vegetation was surveyed in

3. Threat: Agriculture and aquaculture
33
early June at the start of the experiment (1955) and over the four following years (1956–1959). Biomass was dried before weighing.
(1) Ranwell D.S. (1961) Spartina salt marshes in southern England: I. The effects of sheep grazing at the upper limits of Spartina marsh in Bridgwater Bay. Journal of Ecology, 49, 325–340.
3.8.3 Use barriers to keep livestock off ungrazed freshwater swamps
We found no studies that evaluated the effects, on vegetation, of using barriers to keep livestock off freshwater swamps that have never (or not recently) been grazed.
This means that we have not yet found any studies that have directly evaluated this intervention during our systematic journal and report searches. Therefore we have no evidence to indicate whether or not the intervention has any desirable or harmful effects.
3.8.4 Use barriers to keep livestock off ungrazed brackish/saline swamps
We found no studies that evaluated the effects, on vegetation, of using barriers to keep livestock off brackish/saline swamps that have never (or not recently) been grazed.
This means that we have not yet found any studies that have directly evaluated this intervention during our systematic journal and report searches. Therefore we have no evidence to indicate whether or not the intervention has any desirable or harmful effects.
3.9 Exclude or remove livestock from historically grazed marshes
or swamps
Background
This intervention involves completely excluding or completely removing livestock from marshes or swamps that have been negatively impacted by livestock grazing – whether deliberate or accidental. This may be implemented at a large scale (e.g. removing livestock from an entire farm) or at a small scale (e.g. tethering cattle to keep them off sensitive vegetation patches).
Domestic livestock can directly consume vegetation, destroy vegetation by trampling, create bare patches of ground (e.g. repeatedly used tracks), affect water infiltration and flows by compacting soils, affect nutrient balance through excretion of waste products, and import seeds of undesirable plants (Morris & Reich 2013). Removing livestock can allow grazing-sensitive species to recover. The effects might depend on site conditions such as productivity (determined by soil moisture and nutrient levels; Berney et al. 2014).
Related interventions: Use barriers to keep livestock off ungrazed marshes or swamps (3.8); Reduce intensity of livestock grazing, without completely removing livestock (3.10); Use grazing to maintain or restore disturbance (8.9); Use grazing to control problematic plants (9.10); Exclude wild vertebrates (9.15); Modify livestock farming practices in watershed (10.15); Use fences or barriers to protect planted areas (13.19).
Berney P.J., Wilson G.G., Ryder D.S., Whalley R.D.B., Duggin J. & McCosker R. (2014) Divergent responses to long-term grazing exclusion among three plant communities in a flood pulsing wetland in eastern Australia. Pacific Conservation Biology, 20, 237–251.
Morris K. & Reich P. (2013) Understanding the Relationship Between Livestock Grazing and Wetland Condition. Arthur Rylah Institute for Environmental Research, Technical Report Series No. 252.

3. Threat: Agriculture and aquaculture
34
3.9.1 Exclude or remove livestock from historically grazed freshwater
marshes
Ten studies evaluated the effects, on vegetation, of excluding or removing livestock from historically grazed freshwater marshes. Seven studies were in the USA1–4,7–9, two were in Morocco5a,5b and one was in Australia6. In all 10 studies the focal livestock included cattle (mixed with sheep in two studies5a,5b). Two studies in the USA2,8 were based on the same experimental set-up, and the two studies in Morocco5a,5b shared some study sites.
VEGETATION COMMUNITY
Community composition (4 studies): Two site comparison studies in Morocco5a and the USA7 reported that marshes/pools fenced to exclude livestock for 3–30 years contained a different overall plant community to grazed sites. In the USA7, the precise effect depended on the time since exclusion. Two replicated, randomized, paired, controlled studies in marshes in Australia6 and the USA9 found that fencing to exclude cattle typically had no significant effect on the overall plant community composition after 1–14 years. One of the studies9 also found that the plant community in fenced and grazed marshes was of similar quality, relative to pristine local marshes.
Relative abundance (3 studies): Of three replicated, randomized, paired, controlled studies that reported data on the relative abundance of plant groups, two studies (based on one experimental set-up) in the USA2,8 found that ephemeral pools fenced to exclude cattle for 1–10 years had similar or greater cover of grasses relative to forbs than pools that remained grazed. The other study, also in the USA9, found that the relative abundance of forbs, grass-like plants and shrubs was similar in marshes fenced to exclude cattle for 1–3 years and marshes that remained grazed.
Overall richness/diversity (6 studies): Four replicated studies (two also randomized, paired, controlled) in the USA4,9, Morocco5a and Australia6 found that marshes/pools fenced to exclude cattle, for 1–30 years, typically had similar overall plant species richness to sites that remained grazed. One of the studies9 found that the same was true for overall plant diversity. One replicated, site comparison study of ephemeral pools in Morocco5b found that pools fenced to exclude livestock for >30 years had similar (in a dry year) or greater (in a wet year) plant species richness compared to pools that remained grazed. One site comparison study in the USA7 found that marshes fenced to exclude cattle for 3–13 years contained fewer plant species than grazed marshes, and had similar or lower plant diversity.
Characteristic plant richness/diversity (1 study): One site comparison study of ephemeral pools in Morocco5a found that pools fenced to exclude livestock for >30 years contained a similar number of wetland-characteristic plant species to pools that remained grazed.
Native/non-target richness/diversity (3 studies): Of three replicated, randomized, paired, controlled studies that reported data on native plant species richness, two studies (based on one experimental set-up) in the USA2,8 found that fencing ephemeral pools to exclude cattle for 1–10 years typically reduced native plant species richness. The other study, also in the USA9, found that native plant species richness was similar in marshes fenced to exclude cattle for 1–3 years and marshes that remained grazed.
VEGETATION ABUNDANCE
Overall abundance (3 studies): Two replicated, site comparison studies in the USA4 and Morocco5b found that ponds/pools fenced to exclude cattle for >10 years contained more vegetation than sites that remained grazed. This was measured in terms of emergent cover around pond margins4 or peak above-ground biomass in ephemeral pools5b. One replicated, randomized, paired, controlled study in Australia6 found that marshes fenced to exclude cattle for ≤4 years contained similar above-ground vegetation biomass to marshes that remained grazed.

3. Threat: Agriculture and aquaculture
35
Characteristic plant abundance (1 study): One site comparison study of ephemeral pools in Morocco5a found that the overall abundance of wetland-characteristic plant species was greater in pools fenced to exclude livestock for >30 years than in pools that remained grazed.
Herb abundance (1 study): One replicated, randomized, paired, controlled, before-and-after study in the USA1 found that fencing pastures to exclude cattle typically increased herb cover in wetlands along creeks, but had no significant effect on herb cover within spring wetlands.
Individual species abundance (2 studies): Two replicated, randomized, paired, controlled studies in freshwater marshes in Australia6 and the USA9 quantified the effect of this intervention on the abundance of individual plant species (see original papers for data).
VEGETATION STRUCTURE
Visual obstruction (1 study): One replicated, site comparison study in the USA4 found that ponds fenced to exclude cattle for >10 years had greater horizontal vegetation cover, around their margins, than ponds that remained grazed.
Height (2 studies): Two replicated studies (one also randomized, paired, controlled, before-and-after) in the USA3,4 found that fencing ponds to exclude cattle, for 1–3 or >10 years, increased the height of vegetation around their margins.
A replicated, randomized, paired, controlled, before-and-after study in 1992–1997 of springs and creeks in California, USA (1) found that excluding cattle typically increased herbaceous vegetation cover in creek wetlands, but had no significant effect in spring wetlands. In three of five years, ungrazed creek wetlands had higher herb cover (84–87%) than creek wetlands that remained grazed (46–59%). In the other two years, there was no significant difference between treatments (ungrazed: 46–59%; grazed: 46–59%). Before cattle exclusion, plots destined for each treatment had statistically similar herb cover (ungrazed: 59%; grazed: 46–59%). In all five years, ungrazed spring wetlands had statistically similar herb cover to grazed spring wetlands (data not reported). Methods: Nine pastures (three sets of three) were selected for the study. All contained springs and had been moderately grazed by cattle since 1960 (800–1,000 kg/ha Residual Dry Matter: the amount of herbaceous material present left after grazing). From 1992/1993, cattle were excluded from three pastures (one random pasture/set). The other pastures remained moderately or lightly grazed (1,100–3,800 kg/ha RDM). Grazing occurred in November and February–May. Vegetation cover was monitored in late May 1992–1997, along four 5–10 m transects/pasture: two in wetlands near the spring source, and two in wetlands along the resulting creek.
A replicated, randomized, paired, controlled study in 2000–2003 of ephemeral pools within a grassland in California, USA (2) found that excluding cattle increased the dominance of grasses, but reduced the dominance and richness of native plants. In the final two of three years, pools fenced to exclude cattle had greater relative grass cover (83–104% of forb cover) than pools that remained grazed (34–48% of forb cover). In three of three years, exclusion pools had lower relative cover of native vs non-native plants than grazed pools (data not reported). Over the three years, native species richness was stable or declined in exclusion pools (1.3 fewer to 0.1 more species/0.25 m2) whilst it increased in grazed pools (0.7–1.8 more species/0.25 m2). Methods: In 2000, six pairs of plots were established on a ranch grazed for >100 years. In each pair, one plot was fenced to exclude cattle whilst the other remained grazed (October–June; 1 cow-calf pair/2.4 ha). Each spring between 2001 and 2003, vegetation was surveyed in three dried-up pools (and adjacent upland) in each plot.

3. Threat: Agriculture and aquaculture
36
Pools were 70–1,130 m2. Ungrazed pools were dry for longer than grazed pools. This study was based on the same experimental set-up as (8), but monitored it for less time.
A replicated, randomized, paired, controlled, before-and-after study in 2002–2006 at the edges of 12 ponds in Oregon, USA (3) found that excluding cattle increased vegetation height. Comparing data over three years before and after intervention, the average height of emergent vegetation increased more around ponds that had been fenced to exclude cattle (before: 5–13 cm; after: 28–31 cm) than around ponds that remained grazed (before: 6 cm; after: 9–10 cm). Methods: Four clusters of three historically grazed ponds (112–4,200 m2) were selected for study. Between 2003 and 2005, four ponds (one random pond/cluster) received each fencing treatment: fully fenced (wooden or barbed wire fences, 1.5 m tall, 1–5 m from pond edge), half fenced (including a fence running across the pond) or not fenced (open to grazing June–September, 25–32 ha/cow-calf pair). The height of emergent vegetation was surveyed in late summer 2002–2006, for up to three years before and after fencing. Eight 2 x 2 m plots were sampled around the shoreline of each pond.
A replicated, site comparison study in 2005–2006 at the edges of eight ponds in Tennessee, USA (4) found that ponds fenced to exclude cattle typically had taller vegetation with greater cover than ponds that remained grazed, but similar plant species richness. Exclusion ponds had significantly greater vegetation cover than grazed ponds in two of two years (exclusion: 42–45%; grazed: 25–30%), significantly taller vegetation, on average, in one of two years (for which exclusion: 73 cm; grazed: 42 cm), and significantly greater horizontal vegetation cover in one of two years (for which exclusion: 59%; grazed: 47%). In the other comparisons, there was no significant difference between exclusion and grazed ponds, but a strong trend towards greater cover. Total plant species richness never significantly differed between treatments (exclusion: 4.0–5.3 species/m2; grazed: 4.2–4.3 species/m2). Methods: In spring and summer 2005 and 2006, emergent vegetation was surveyed on the shoreline of eight small (<1.1 ha) farm ponds (one 1-m2 quadrat/pond/survey). Four ponds had been fenced to exclude cattle for >10 years. The other four ponds had been exposed to grazing (132 cattle/ha of wetland) continuously for >10 years.
A replicated, site comparison study in 2009 of 16 ephemeral pools in Morocco (5a) found that pools within areas fenced to exclude livestock for >30 years contained a different overall plant community to pools within grazed areas, with greater abundance of wetland-characteristic species – but that there was no significant difference in plant species richness. The overall plant community composition differed between exclusion and grazed pools (data reported as a graphical analysis; statistical significance of difference not assessed). Exclusion pools supported a higher total abundance of wetland-characteristic plant species than grazed pools (data not reported). However, exclusion and grazed pools contained a statistically similar number of wetland-characteristic plant species – and plant species overall (data not reported). Methods: In February and May 2009, vegetation was surveyed in 16 ephemeral pools (600–13,000 m2; water depth ≤85 cm) within a cork oak forest. Eight pools were in hunting reserves, from which livestock had been excluded since 1975. The other eight pools were open to cattle and sheep grazing. Cover/abundance of all plant species was recorded in two quadrats/pool/sample: one at the centre and one at the edge. Some of the pools from this study were also used in (5b).
A replicated, site comparison study in 2008–2009 of six ephemeral pools in Morocco (5b) found that pools within areas fenced to exclude livestock for >30 years

3. Threat: Agriculture and aquaculture
37
contained more vegetation biomass than pools within grazed areas, and more plant species in one of two years. Peak biomass was measured in 2008 only. Exclusion pools contained more above-ground biomass (123 g/m2) than grazed pools (42 g/m2). Plant species richness was measured in both 2008 and 2009. Exclusion pools contained a statistically similar number of plant species to ungrazed pools in 2008 (a dry year), but more plant species than ungrazed pools in 2009 (a wet year) (data not reported). Methods: Vegetation was surveyed in six ephemeral pools within a cork oak forest. Three pools were in hunting reserves, from which livestock had been excluded since 1975. The other three pools were open to cattle and sheep grazing. In February 2008, vegetation was cut from nine 1-m2 quadrats/pool, then dried and weighed. Between January and June 2008 and 2009, plant species were recorded in fifteen 900-cm2 quadrats/pool. All quadrats were evenly spread across different elevations. This study used a subset of the pools from (5a).
A replicated, randomized, paired, controlled study in 1994–2008 in three marshes on a floodplain in New South Wales, Australia (6) found that plots fenced to exclude cattle typically contained a similar plant community, with similar species richness and biomass, to plots that remained grazed by cattle. In the first four years after intervention, exclusion and grazed plots had a similar overall plant community composition (26 of 26 comparisons; data reported as graphical analyses), similar overall plant species richness (26 of 26 comparisons; 3–19 vs 3–17 species/m2) and similar plant biomass (3 of 3 comparisons; 630–1,300 vs 430–1,130 g/m2). After 13–14 years, exclusion and grazed plots had a similar plant community composition in seven of nine comparisons (data reported as a graphical analysis) and similar plant species richness in five of nine comparisons (exclusion: 5–19; grazed: 10–17 species/m2). Plant species richness was higher in exclusion than grazed plots in two comparisons (both in one marsh) and lower in exclusion than grazed plots in two comparisons (both in one marsh). The study also reported data on the cover of individual plant species (see original paper). Methods: In early 1994, twelve pairs of 25 x 25 m plots were established in three historically grazed marshes (four pairs/marsh). In each pair, one random plot was fenced to exclude domestic cattle (but not wild herbivores). The other plot was not fenced and was open to all herbivores, including 0.5–2.0 cows/ha. In 1994–1998 (a wetter period) and 2007–2008 (a drier period), plant species and their cover were recorded in ten 1-m2 quadrats/plot. In May 1998, live above-ground biomass was collected from two 0.25-m2 quadrats/plot, then dried and weighed.
A site comparison study in 2009 of three ephemeral freshwater marshes in Oregon, USA (7) reported that the effects of cattle exclusion on the plant community depended on the duration of exclusion. Both marshes from which cattle had been excluded had a significantly different plant community composition to a marsh that remained grazed (data reported as a graphical analysis). However, this involved lower relative cover of native species in the long-term exclosure (4% of total) than in the grazed marsh (23% of total), but greater relative cover of native species in the short-term exclosure (52% of total). Both exclosures had lower plant species richness (total: 6–12; native: 3–6; non-native: 3–5 species/transect) than the grazed marsh (total: 23; native: 10; non-native: 12 species/transect). The long-term exclosure had lower plant diversity (total, native and non-native) than the grazed marsh (data reported as a diversity index). In contrast, the short-term exclosure had higher native plant diversity than the grazed marsh, and similar total and non-native diversity. Methods: In late summer 2009, vegetation was surveyed in three marshes (each <10 ha) within

3. Threat: Agriculture and aquaculture
38
one river basin. Two marshes had been fenced to exclude cattle (one for three years, one for 13 years). The other marsh remained grazed (approximately 1.6 cattle/ha, April–September each year). Plant species and their cover were recorded along six 45–60 m transects/marsh.
A replicated, randomized, paired, controlled study in 2000–2010 of ephemeral pools within a grassland in California, USA (8) found that excluding cattle typically increased the dominance of grasses, but reduced the dominance and richness of native plants. In 5 of 10 years, pools fenced to exclude cattle had greater relative grass cover (1.2–4.8 times forb cover) than pools that remained grazed (0.2–1.7 times forb cover). In the other five years, there was no significant difference between exclusion and grazed pools. In 10 of 10 years, exclusion pools had lower relative cover of native plant species (0.3–0.6 times non-native cover) than grazed pools (0.5–0.7 times non-native cover). In 9 of 10 years, exclusion pools had lower native plant richness (5.8–6.8 species/0.25 m2) than grazed pools (8.0–9.0 species/0.25 m2). Methods: In 2000, six pairs of plots were established on a ranch grazed for >100 years. In each pair, one plot was fenced to exclude cattle whilst the other remained grazed (October–June; 1 cow-calf pair/2.4 ha). Each spring between 2001 and 2003, vegetation was surveyed in three dried-up pools (and adjacent upland) in each plot. Pools were 70–1,130 m2. Ungrazed pools were dry for longer than grazed pools. This study was based on the same experimental set-up as (2).
A replicated, paired, controlled study in 2006–2009 in 40 freshwater marshes within a ranch in Florida, USA (9) found that fencing to exclude cattle typically had no significant effect on the plant community composition, vegetation quality, species richness or diversity. Statistical significance was assessed for all results, but data were generally not reported. After 1–3 summers, the overall plant community composition was similar in marshes fenced to exclude cattle and marshes that remained grazed (data not reported). The same was true for the relative abundance of forbs, grass-like plants and shrubs. However, the relative abundance of dogfennel Eupatorium capillifolium was greater in exclusion marshes (2–5%) than in grazed marshes (0–1%). Exclusion and open marshes also had similar overall plant species diversity and richness, and similar native plant species richness. In two of three years, the extent to which species were characteristic of pristine Florida marshes was similar in exclusion and open marshes (data reported as a conservatism score). In the other year, the effect of cattle exclusion on this outcome was more complicated, differing between marshes and depending on whether they were burned or not. The study also reported data on the frequency of individual plant species (see original paper). Methods: The study used forty 0.5–1.5 ha marshes, grouped into five blocks of eight, within a 4,000-ha ranch. In February 2007, twenty marshes (four marshes/block) were fenced with barbed wire to exclude cattle (but not other mammals). The other 20 marshes (four marshes/block) were left open to cattle. In each block, two fenced and two grazed marshes were also burned in February 2008. Plant species presence/absence was recorded in October before (2006) and after (2007–2009) fencing, in fifteen 1-m2 quadrats/marsh.
(1) Allen-Diaz, B. & Jackson, R.D. (2000) Grazing effects on spring ecosystem vegetation of California's hardwood rangelands. Journal of Range Management, 53, 215–220.
(2) Marty J.T. (2005) Effects of cattle grazing on diversity in ephemeral wetlands. Conservation Biology, 19, 1626–1632.
(3) Adams M.J., Pearl C.A., McCreary B., Galvan S.K., Wessell S.J., Wente W.H., Anderson C.W. & Kuehl A.B. (2009) Short-term effect of cattle exclosures on Columbia spotted frog (Rana luteiventris) populations and habitat in northeastern Oregon. Journal of Herpetology, 43, 132–138.

3. Threat: Agriculture and aquaculture
39
(4) Burton E.C., Gray M.J., Schmutzer A.C. & Miller D.L. (2009) Differential responses of postmetamorphic amphibians to cattle grazing in wetlands. Journal of Wildlife Management, 73, 269–277.
(5) Bouahim S., Rhazi L., Amami B., Sahib N., Rhazi M., Waterkeyn A., Zouahri A., Mesleard F., Muller S.D. & Grillas P. (2010) Impact of grazing on the species richness of plant communities in Mediterranean temporary pools (western Morocco). Comptes Rendus Biologies, 333, 670–679.
(6) Berney P.J., Wilson G.G., Ryder D.S., Whalley R.D.B., Duggin J. & McCosker R. (2014) Divergent responses to long-term grazing exclusion among three plant communities in a flood pulsing wetland in eastern Australia. Pacific Conservation Biology, 20, 237–251.
(7) Kidd S.A. & Yeakley J.A. (2015) Riparian wetland plant response to livestock exclusion in the Lower Columbia River Basin. Natural Areas Journal, 35, 504–514.
(8) Marty J.T. (2015) Loss of biodiversity and hydrologic function in seasonal wetlands persists over 10 years of livestock grazing removal. Restoration Ecology, 23, 548–554.
(9) Boughton E.H., Quintana-Ascencio P.F., Bohlen P.J., Fauth J.E. & Jenkins D.G. (2016) Interactive effects of pasture management intensity, release from grazing and prescribed fire on forty subtropical wetland plant assemblages. Journal of Applied Ecology, 53, 159–170.
3.9.2 Exclude or remove livestock from historically grazed brackish/salt
marshes
Fifteen studies evaluated the effects, on vegetation, of excluding or removing livestock from historically grazed brackish/salt marshes. There were five studies in Germany5,6,10,11,13. There were two studies in the UK1,9, Denmark3a,3b and the Netherlands8,14. There was one study in each of the USA2, Sweden4, France7 and Argentina12. Livestock were sheep1,6,10,11,13, cattle4,8,9,12, sheep and cattle3a,3b,5, cattle and horses7,14 or unspecified2. There was overlap in the sites used in two studies10,11. Two other studies3a,3b took place in one marsh, but with different experimental set-ups.
VEGETATION COMMUNITY
Overall extent (1 study): One controlled study of a salt marsh in Germany5 reported that in a plot fenced to exclude cattle for eight years, the total vegetated area was greater than in a plot that remained grazed.
Community types (1 study): One site comparison study of brackish and salt marshes in Germany13 reported that reducing (or stopping) grazing affected the nature of transitions between vegetation types over time, but that the precise effect varied with environmental conditions.
Community composition (5 studies): Three paired studies (two also replicated and controlled) in brackish/salt marshes in France7, Argentina12 and the Netherlands14 reported that the effect of excluding livestock for 5–30 years on the overall plant community composition depended on plot elevation/flooding regime. In one of these studies12, the effect of livestock exclusion was not separated from the effect of general legal protection. Two studies in one salt marsh in Denmark3a,3b reported that excluding livestock had little effect on the identity of plant species in the community after six years.
Overall richness/diversity (6 studies): Two studies (one controlled, one before-and-after) in one salt marsh in Denmark3a,3b reported that excluding sheep and cattle for 6–7 years had no effect on overall plant species richness. One replicated, paired, controlled study in a salt marsh in the Netherlands8 reported that plots fenced to exclude cattle for seven years had lower plant species richness than areas that remained grazed. Two controlled studies (one also replicated and paired) in salt marshes in Germany10,11 found that the effect of removing sheep on overall plant species richness depended on the scale of measurement and the grazing intensity used for comparison – with inconsistent results across these studies even for similar scales and intensities. One paired, site comparison study of salt marshes in Argentina12 found that the effect of excluding cattle (along with legal protection) increased plant species richness at lower elevations, but did not significantly affect plant diversity at any elevation.

3. Threat: Agriculture and aquaculture
40
VEGETATION ABUNDANCE
Overall abundance (4 studies): Three studies (two controlled, one before-and-after) in salt marshes in the UK1 and Denmark3a,3b reported that excluding livestock for 2–6 years maintained or increased overall vegetation abundance (although in one study3b, only by a small amount). One controlled study in a salt marsh in Germany10 found that a paddock left ungrazed for 16–18 years had greater overall vegetation cover than lightly or heavily grazed paddocks, but lower cover than a moderately grazed paddock.
Individual species abundance (11 studies): Eleven studies1,2,3a,3b,4–8,10,11 quantified the effect of this intervention on the abundance of individual plant species. For example, five studies (four controlled, one before-and-after) on salt marshes in the UK1, Denmark3b, Germany5,6 and the Netherlands8 reported that excluding livestock for 2–8 years reduced (or prevented increases in) cover of saltmarsh grass Puccinellia maritima. However, two controlled studies (one also replicated and paired) on salt marshes in Denmark3a and Sweden4 reported greater saltmarsh grass cover in areas fenced to exclude livestock for 1–6 years than in areas that remained grazed. Four studies (three controlled, one before-and-after) on salt marshes in Denmark3a,3b and Germany6,10 reported that excluding or removing livestock for 4–16 years increased cover of sea purslane Halimione portulacoides.
VEGETATION STRUCTURE
Height (5 studies): Five controlled studies (two also replicated and paired) in salt marshes in Sweden4 and Germany5,10,11, and brackish wet grassland in the UK9, found that ungrazed plots (livestock excluded or removed) contained taller vegetation than plots that remained grazed. Vegetation was surveyed after one month9, 1–8 years4,5 or 16–22 years10,11.
A replicated, controlled study in 1955–1957 in an estuarine salt marsh in England, UK (1) reported that excluding livestock maintained greater overall vegetation biomass than continued grazing, but had mixed effects on the abundance of dominant plant species. Unless specified, statistical significance was not assessed. At the start of the experiment, total above-ground vegetation biomass was 8,061 g/m2. After two years, this had declined to 7,118 g/m2 in exclusion plots, vs 5,633 g/m2 in grazed plots. Over two years, saltbush Atriplex hastata biomass declined less in exclusion plots (by 70%) than in grazed plots (by 277%). In contrast, cordgrass Spartina sp. biomass declined more in exclusion plots (by 97%) than in grazed plots (by 67%) and saltmarsh grass Puccinellia maritima biomass increased less in exclusion plots (by 80%) than in grazed plots (by 99%). Changes in cover were typically similar in both exclusion and grazed plots. Exceptionally, saltmarsh grass cover did not significantly change in three of four exclusion plots but significantly increased in four of four grazed plots (data not reported). Methods: In summer 1955, eight 9 x 13 m plots were established in a historically grazed salt marsh. Four plots were fenced to exclude sheep. Four plots were grazed by sheep during summer (average 24 sheep days/plot/year). Vegetation was surveyed in early June at the start of the experiment (1955) and over the two following years (1956–1957). Biomass was dried before weighing.
A replicated, controlled, site comparison study in 1972–1974 in two brackish/salt marshes in Georgia, USA (2) reported that plots fenced to exclude livestock had similar patterns of species dominance to grazed areas, but typically contained more vegetation biomass. Statistical significance was not assessed. Over the two years following intervention, smooth cordgrass Spartina alterniflora was dominant in all ten sampled months in both exclosures (48–73% of biomass) and grazed areas (53–66% of biomass). Saltgrass Distichlis spicata and pickleweed

3. Threat: Agriculture and aquaculture
41
Salicornia virginica were subdominants. In 24 of 28 comparisons, the total above-ground biomass of these three species was greater in exclosures (28–362 g/m2) than grazed areas (15–277 g/m2). For the grasses, data were also reported for live and dead biomass separately, and showed similar patterns (see original paper). A nearby natural marsh was dominated by smooth cordgrass in 7 of 10 sampled months (51–69% of biomass) but pickleweed in the other three (54–65% of biomass). In every month with a fair comparison to the natural marsh, exclosures contained less biomass of both smooth cordgrass (exclosures: 82–345 g/m2; natural: 184–439 g/m2) and pickleweed (exclosures: 38–99 g/m2; natural: 194–490 g/m2). Methods: In May 1972, electric fences were installed to exclude livestock from five 200-m2 areas of a coastal brackish/salt marsh (salinity 5–35 ppt). The rest of this marsh remained “heavily” grazed. The study does not report details of the livestock or grazing intensity. Above-ground vegetation was sampled (cut, dried and weighed) approximately monthly over the following two years: from the exclosures, the grazed area and a nearby natural (never-grazed) marsh.
A controlled study in 1972–1978 in a salt marsh in Denmark (3a) reported that an area fenced to exclude livestock had identical plant species richness to an area that remained grazed, but greater vegetation cover. Statistical significance was not assessed. After approximately six years, the same seven plant species were present in the exclusion and grazed areas. However, six of these species consistently had greater cover in the exclusion area – including saltmarsh grass Puccinellia maritima (exclusion: 84–92%; grazed: 72–82%) and sea purslane Halimione portulacoides (exclusion: 8–17%; grazed: <1%). Accordingly, both sampling plots within the exclusion area had greater overall vegetation cover than both sampling plots within the grazed area. This was true for the sum of the cover of each species (exclusion: 130–145%; grazed: 81–89%) and for cover as the inverse of bare ground (exclusion: 95–98%; grazed: 73–83%). Methods: In spring 1972, an area of historically grazed coastal salt marsh was fenced to exclude livestock. The surrounding marsh remained grazed (by at least 0.5 sheep/ha and 0.5 cattle/ha, May–October). In August 1978, the cover of every plant species and bare ground were recorded in two plots in the fenced and grazed areas (50 point quadrats with 10 pins/plot). This study used the same marsh as (3b), but a different experimental set-up.
A before-and-after study in 1971–1978 in a salt marsh in Denmark (3b) reported that after installing fences to exclude livestock, plant species richness was stable but there were small changes in vegetation composition and cover. Statistical significance was not assessed. The study plot contained nine plant species both before and approximately six years after livestock exclusion. Eight of the species were the same (one species went extinct and one new species colonized). Overall vegetation cover increased slightly. This was true for the sum of the cover of each species (before exclusion: 176%; six years after: 180%) and for cover as the inverse of bare ground (before exclusion: 92%; six years after: 98%). Changes in cover of individual species included increases for red fescue Festuca rubra (before: 55%; after: 72%) and sea purslane Halimione portulacoides (before: 22%; after: 61%) and a decrease for saltmarsh grass Puccinellia maritima (before: 34%; after: 3%). Methods: In spring 1972, a 40 x 60 m area of coastal salt marsh was fenced to exclude livestock. Previously, the marsh had been grazed by 0.5 sheep and 0.5 cattle/ha, May–October. The cover of every plant species and bare ground were surveyed in a permanent plot, using point quadrats, before (August 1971) and after (August 1978) exclusion. This study used the same marsh as (3a), but a different experimental set-up.

3. Threat: Agriculture and aquaculture
42
A replicated, paired, controlled study in 1979–1983 on a coastal salt marsh in Sweden (4) found that plots from which cattle were excluded contained taller grasses than plots open to grazing. This was true in three of three years for creeping bentgrass Agrostis stolonifera (exclusion: 15–20 cm; grazed: 6–7 cm) and saltmarsh grass Puccinellia maritima (exclusion: 10–21 cm; grazed: 5–6 cm). The study also noted broadly similar changes in cover of these species under both treatments over four years, but that cover was more often higher in exclusion than grazed plots (statistical significance not assessed; data not clearly reported). Methods: In autumn 1979, five pairs of 25-m2 plots were established on a grazed salt marsh (0.1–0.9 cattle/ha). One plot in each pair was fenced to exclude cattle. Geese were also excluded from two of these plots from 1981. Vegetation was surveyed using point quadrats each autumn between 1979 and 1983 (including height measurements for 12–348 plants/species/ treatment/year, between 1980 and 1982).
A controlled study in 1980–1988 on a salt marsh in northern Germany (5) reported that a plot fenced to exclude livestock had greater overall vegetation coverage, different cover of some individual plant species, and taller vegetation than a plot that remained intensely grazed. Statistical significance was not assessed. After eight years, the total vegetated area was greater in the exclusion plot than the grazed plot, especially closer to the sea (data reported as maps). In the exclusion plot, vegetation stands further from the sea became dominated by couch grass Elymus pycnanthus at the expense of saltmarsh grass Puccinellia maritima, perennial ryegrass Lolium perenne and red fescue Festuca rubra (data reported as frequency classes). The exclusion plot also contained taller vegetation (understory grasses: 7–32 cm; canopy: 41–87 cm) than the grazed plot (understory grasses: 3–14 cm; canopy: 0–55 cm). Methods: In 1980, a 10-ha plot in a coastal salt marsh was fenced to exclude cattle. Another plot in the marsh remained heavily grazed (2 cattle/ha). Vegetation stands were mapped in 1988. Vegetation was surveyed in more detail along one 750-m transect/plot, at 50 m intervals. Cover was assessed using a point quadrat (50 points/interval).
A controlled study in 1988–1992 in a historically grazed salt marsh in northern Germany (6) reported that a plot where sheep grazing was stopped developed different cover of key plant species and taller vegetation than a plot that remained intensely grazed. Statistical significance was not assessed. After four years, the ungrazed plot had only 49% cover of the dominant saltmarsh grass Puccinellia maritima (vs grazed: 71%) and 0% cover of glasswort Salicornia europaea (vs grazed: 24%). Meanwhile, the ungrazed plot had 18% cover of red fescue Festuca rubra (vs grazed: 0%) and 18–21% cover of each of the perennial herbs sea aster Aster tripolium and sea purslane Halimione portulacoides (vs grazed: 0%). The perennial herbs also occurred in a greater proportion of quadrats across the ungrazed plot (see original paper for data). Finally, the ungrazed plots had taller vegetation on average (18 cm) than the grazed plot (8 cm). Methods: In 1988, sheep were excluded from one section of a coastal salt marsh. Another section of the marsh remained grazed by sheep (10 sheep/ha, April–October). The marsh was intertidal (flooded 80–200 times/year) but had a dense artificial drainage system. The cover of each plant species was surveyed annually between 1989 and 1992 in permanent quadrats. Perennial herb frequency and overall vegetation height were recorded in 1992, in quadrats or along transects respectively.
A replicated, paired, controlled, before-and-after study in 1989–1994 of eighteen historically grazed brackish marshes in southern France (7) reported that the effects

3. Threat: Agriculture and aquaculture
43
of excluding livestock on plant community composition, abundance and species richness depended on the flooding regime. Unless specified, statistical significance was not assessed. Under all three flooding regimes, the overall plant community composition in exclusion and grazed marshes diverged over five years. However, the speed and direction of the changes depended on the flooding regime (data reported as graphical analyses). For example, under two artificial flooding regimes, exclusion significantly increased the final cover of sea club rush Bolboschoenus maritimus (exclusion: 31–33%; grazed: 11–12%) and common reed Phragmites australis (exclusion: 12–16%; grazed: <1%). Under an unmanaged flooding regime, exclusion increased cover of the grass Aeluropus littoralis (exclusion: 16%; grazed: 0%). After five years, total plant species richness was higher in exclusion than grazed marshes under both artificial flooding regimes (exclusion: 4 species/0.25 m2; grazed: 5–6 species/0.25 m2) but lower in exclusion than grazed marshes under the unmanaged flooding regime (exclusion: 7 species/0.25 m2; grazed: 5 species/0.25 m2). Methods: The study used two sets of nine inland brackish marshes (former rice fields, but grazed since 1976 when cultivation stopped). In November 1989, one set was fenced to exclude livestock. The other set remained grazed (approximately 2 cattle and 1 horse/ha, April–November). Three of the nine 1-ha marshes within each set received each flooding regime: artificial winter flooding, artificial summer flooding, or year-round unmanaged flooding. Vegetation was surveyed every six months from early November 1989 to early November 1994 (nine 0.5 x 0.5 m quadrats/field/survey).
A replicated, paired, controlled study in 1991–1998 in a salt marsh in the Netherlands (8) reported that plots fenced to exclude cattle contained fewer plant species than grazed areas, and developed cover of different plant species. Statistical significance was not assessed. After seven years, plots from which cattle had been excluded had lower plant species richness (8–9 species/100 m2) than areas that remained grazed (13–14 species/100 m2). Exclusion plots were dominated or co-dominated by a mix of species, including couch grass Elymus repens (7–90% cover/plot), creeping bent Agrostis stolonifera (1–40% cover/plot) and saltmarsh grass Puccinellia maritima (0–50% cover/plot). In contrast, grazed plots were all dominated by saltmarsh grass (50–80% cover/plot). Couch grass and creeping bent showed particularly strong responses to the seven years of exclusion: cover of these species was 0–1% in the spring immediately following exclusion, and never more than 2% in grazed plots. Methods: In 1991, two 40 x 40 m plots within a grazed salt marsh were fenced and cattle were successfully excluded. One plot was closer to the sea and one closer to the land. Between 1991 and 1998, vegetation was surveyed in 10 x 10 m quadrats: two within each plot and three in the grazed marsh (38–81 animal days/ha/year) around each plot.
A replicated, controlled, before-and-after study in 1997 of eight areas of a brackish wet grassland on the coast of England, UK (9) found that plots left ungrazed contained taller vegetation than plots grazed by cattle. After approximately one month, the vegetation was taller in ungrazed plots (6.1–10.5 cm) than in grazed plots (4.2–5.0 cm). Before intervention, vegetation height did not significantly differ between plots destined for each treatment (ungrazed: 3.6 cm; grazed: 3.2 cm). Methods: The study used eight plots on a coastal, brackish, wet grassland that had been grazed by cattle in 1996. Four plots were left ungrazed in 1997, whilst four plots were lightly grazed by cattle (0.2–0.5 livestock units/ha) from mid-April. The overall height of the grassy vegetation was measured in 1997 before grazing began (early April) and approximately one month after (mid–late May). There were 20–40 survey points/plot.

3. Threat: Agriculture and aquaculture
44
A controlled study in 1991–2009 on a salt marsh in northern Germany (10) found that a paddock from which sheep had been removed contained taller vegetation than paddocks which remained grazed, and typically had higher vegetation cover and plant species richness. After 16–18 years, the vegetation canopy was taller in an ungrazed paddock (20 cm) than in all grazed paddocks (6–14 cm). In two of three comparisons, overall vegetation cover was greater in an ungrazed paddock (87%) than in grazed paddocks (lightly grazed: 86%; heavily grazed: 82%). In the other comparison, cover was lower in the ungrazed paddock (vs moderately grazed: 89%). In two of three comparisons, total plant species richness was greater in an ungrazed paddock (10.1 species/m2) than in grazed paddocks (moderately grazed: 9.9; heavily grazed: 6.7 species/m2). In the other comparison, richness was lower in the ungrazed paddock (vs lightly grazed: 12.2 species/m2). The study also reported cover of the dominant species in each paddock. For example, sea purslane Atriplex portulacoides was the most abundant species in the ungrazed paddock (27% cover) but not in grazed paddocks (<7–19% cover). Methods: The study used four paddocks on a coastal salt marsh (historically heavily grazed by sheep). From 1991, livestock were removed from one paddock. The other paddocks were grazed each summer: lightly (1–2 sheep/ha), moderately (3–4 sheep/ha), or heavily (10 sheep/ha). Vegetation was surveyed every three weeks in summer 2007–2009, in a total of thirty 1-m2 quadrats/paddock/year. All quadrats were at a similar elevation (±20 cm). The paddocks in this study were also used in (11).
A replicated, paired, controlled study in 1988–2010 on three salt marshes in northern Germany (11) found that paddocks from which sheep had been removed contained taller vegetation than paddocks which remained grazed, but a similar number of plant species. After 19–22 years, the vegetation canopy was taller in ungrazed paddocks (25 cm) than in all grazed paddocks (5–19 cm). At a large scale, plant species richness did not significantly differ between ungrazed paddocks (10.3 species/1.1 m2) and all grazed paddocks (13.3–14.0 species/1.1 m2). However, at a smaller scale, ungrazed paddocks contained fewer plant species (4.1 species/0.33 m2) than heavily grazed paddocks (7.3 species/0.33 m2) or short vegetation patches in moderately grazed paddocks (5.8 species/0.33 m2) – but a similar number of plant species to tall vegetation patches in moderately grazed paddocks (5.3 species/0.33 m2). The study also reported cover of the dominant species in each paddock (see original paper for data). Methods: The study used nine 11–15 ha paddocks: three on each of three coastal salt marshes (historically heavily grazed by sheep). From 1988 or 1991, sheep were removed from one paddock/set. The other paddocks were grazed each summer, either moderately (3–4 sheep/ha) or heavily (10 sheep/ha). Vegetation was surveyed in summer 2010, in sixteen 30-cm-diameter circular quadrats/paddock. All quadrats were at a similar elevation (±10 cm). This study included the paddocks used in (10).
A paired, site comparison study in 2010 in a salt marsh near Buenos Aires, Argentina (12) found that excluding livestock (along with legal protection) affected the plant community composition and species richness, with the effect depending on elevation, but did not significantly affect plant diversity. At high and medium (but not low) elevation, an exclusion area contained a significantly different plant community to a grazed area (data reported as a graphical analysis). This included greater relative cover of dominant denseflower cordgrass Spartina densiflora at the highest elevation (exclusion: 34%; grazed: 20%) and less relative cover of sea asparagus Sarcocornia perennis at the moderate elevation (exclusion: 9%; grazed: 29%). The exclusion area

3. Threat: Agriculture and aquaculture
45
contained more plant species at the low and medium elevations (exclusion: 5–12; grazed: 3–9 species/transect) but fewer plant species at high elevation (exclusion: 28; grazed: 16 species/transect). At all elevations, plant diversity was statistically similar in exclusion and grazed areas (data reported as a diversity index). Methods: In spring 2010, vegetation was surveyed at six sites: three in a protected area from which cattle had been excluded for 30 years, and three in an adjacent grazed area (0.6 cattle/ha). Historically, all sites had been grazed at “very low” intensity. Note that this study evaluates the combined effect of excluding livestock and general legal protection. The sites were at high, medium or low elevation (i.e. flooded by tides twice yearly, twice monthly or twice daily). At each site, plant species and their cover were recorded along three 10-m-long transects.
A site comparison study in 1988–2006 of coastal brackish and salt marshes in northern Germany (13) reported that reducing grazing intensity (or stopping grazing entirely) affected vegetation development, but that the effect depended on multiple other factors. Grazing intensity was included as an important predictor in six of six statistical models of observed vegetation development (i.e. transitions between vegetation types over defined time periods). However, the effect of grazing intensity depended on other environmental conditions such as initial vegetation type, elevation and latitude (proxy for salinity and flooding frequency). In two models, for example, grazing intensity affected vegetation development at low but not high elevations. It is not possible to separate out results for reducing grazing intensity vs stopping grazing entirely. For example, moderately grazed plots showed similar responses to intensely grazed plots in some cases, but similar responses to ungrazed plots in others. Methods: In 1988, 1996, 2001 and 2006, plant community types were mapped across approximately 7,000 ha of brackish and salt marsh. Over time, grazing intensity was reduced in some areas, from intense (>10 sheep/ha) to moderate (≤3 sheep/ha) or zero. Where grazing was stopped, drainage systems were also abandoned but this had little effect on water levels. Statistical analyses were used to determine the influence of different factors, including grazing intensity, on changes in plant community types between the survey years.
A replicated, paired, controlled study in 2002–2011 in a historically grazed brackish/salt marsh in the Netherlands (14) reported that the effects of excluding livestock on plant community composition, after nine years, depended on the elevation/wetness of plots. In higher, well-drained areas near to tidal creeks, exclusion plots developed a different plant community (dominated by sea couch grass Elytrigia atherica) to grazed plots (variable marsh communities). In lower, wetter areas further from creeks, a range of marsh plant communities developed in both exclusion and grazed plots with no clear distinction between the treatments. All data were reported as graphical analyses. The statistical significance of differences was not assessed. Methods: In spring 2002, twelve 10 x 25 m plots in a historically grazed coastal marsh were fenced to exclude livestock. The rest of the marsh remained grazed by cattle and horses during the summer. Regular tidal influx had been restored to the marsh over the previous five years. In summer 2011, cover of every plant species was estimated in seventy-two 4 x 4 m quadrats: three inside and three outside each exclosure.
(1) Ranwell D.S. (1961) Spartina salt marshes in southern England: I. The effects of sheep grazing at the upper limits of Spartina marsh in Bridgwater Bay. Journal of Ecology, 49, 325–340.
(2) Reimold R.J., Linthurst R.A. & Wolf P.A. (1975) Effects of grazing on a salt marsh. Biological Conservation, 8, 105–125.

3. Threat: Agriculture and aquaculture
46
(3) Jensen A. (1985) The effect of cattle and sheep grazing on salt-marsh vegetation at Skallingen, Denmark. Vegetatio, 60, 37–48.
(4) Pehrsson O. (1988) Effects of grazing and inundation on pasture quality and seed production in a salt marsh. Vegetatio, 74, 113–124.
(5) Andresen H., Bakker J.P., Brongers M., Heydemann B. & Irmler U. (1990) Long-term changes of salt marsh communities by cattle grazing. Vegetatio, 89, 137–148.
(6) Kiehl K., Eischeid I., Gettner S. & Walter J. (1996) Impact of different sheep grazing intensities on salt marsh vegetation in northern Germany. Journal of Vegetation Science, 7, 99–106.
(7) Mesléard F., Lepart J., Grillas P. & Mauchamp A. (1999) Effects of seasonal flooding and grazing on the vegetation of former ricefields in the Rhône delta (southern France). Plant Ecology, 145, 101–114.
(8) Esselink P., Frescok L.F.M. & Dijkema K.S. (2002) Vegetation change in a man-made salt marsh affected by a reduction in both grazing and drainage. Applied Vegetation Science, 5, 17–32.
(9) Hart J.D., Milsom T.P., Baxter A., Kelly P.F. & Parkin W.K. (2002) The impact of livestock on lapwing Vanellus vanellus breeding densities and performance on coastal grazing marsh. Bird Study, 49, 67–78.
(10) Rickert C., Fichtner A., van Klink R. & Bakker J.P. (2012) α- and β-diversity in moth communities in salt marshes is driven by grazing management. Biological Conservation, 146, 24–31.
(11) van Klink R., Rickert C., Vermeulen R., Vorst O., WallisDeVries M.F. & Bakker J.P. (2013) Grazed vegetation mosaics do not maximize arthropod diversity: evidence from salt marshes. Biological Conservation, 164, 150–157.
(12) Di Bella C.E., Jacobo E., Golluscio R.A. & Rodríguez A.M. (2014) Effect of cattle grazing on soil salinity and vegetation composition along an elevation gradient in a temperate coastal salt marsh of Samborombón Bay (Argentina). Wetlands Ecology and Management, 22, 1–13.
(13) Rupprecht F., Wanner A., Stock M. & Jensen K. (2015) Succession in salt marshes – large-scale and long-term patterns after abandonment of grazing and drainage. Applied Vegetation Science, 18, 86–98.
(14) Chang E.R., Veeneklaas R.M., Bakker J.P., Daniels P. & Esselink P. (2016) What factors determined restoration success of a salt marsh ten years after de-embankment? Applied Vegetation Science, 19, 66–77.
3.9.3 Exclude or remove livestock from historically grazed freshwater
swamps
We found no studies that evaluated the effects, on vegetation, of excluding or removing livestock from historically grazed freshwater swamps.
This means that we have not yet found any studies that have directly evaluated this intervention during our systematic journal and report searches. Therefore we have no evidence to indicate whether or not the intervention has any desirable or harmful effects.
3.9.4 Exclude or remove livestock from historically grazed brackish/
saline swamps
One study evaluated the effects, on vegetation, of excluding or removing livestock from historically grazed brackish/saline swamps. The study was in South Africa and the focal livestock were cattle.
VEGETATION COMMUNITY
VEGETATION ABUNDANCE
Individual species abundance (1 study): One replicated, paired, controlled study in South Africa1 reported that more grey mangrove Avicennia marina seedlings appeared in plots fenced to exclude cattle for two years, than in plots left open to cattle.
VEGETATION STRUCTURE
Height (1 study): One replicated, paired, controlled study in South Africa1 reported that mangrove trees fenced off from cattle were taller, after two years, than trees accessible to cattle.

3. Threat: Agriculture and aquaculture
47
OTHER
Growth (1 study): One replicated, paired, controlled study in South Africa1 found that mangrove trees fenced off from cattle grew more over two years – in height, diameter and crown volume –than trees accessible to cattle.
A replicated, paired, controlled study in 2010–2012 in an estuary in South Africa (1) reported that excluding cattle increased the height and growth rate of grey mangrove Avicennia marina. After two years, grey mangroves were 91 cm tall in plots that had been fenced to exclude cattle (vs 77 cm in plots left open to cattle; statistical significance not assessed). Over the two years, trees in exclusion plots grew more than trees in open plots in three of four metrics: plant height (exclusion: 5.4; open: −0.2 cm/year), plant diameter (exclusion: 7.1; open: 2.0 cm/year) and crown volume (exclusion: 0.5; open: 0.1 m3/year). Circumference growth did not significantly differ between treatments (exclusion: 26; open: 15 cm). In the second year, a total of 75 grey mangrove seedlings appeared in exclusion plots (vs 35 in open plots). Methods: In 2010, five pairs of 25-m2 plots were established within stunted, shrubby, estuarine mangroves. In each pair, one plot was fenced to exclude cattle whilst the other remained open to cattle (3–11 cows/ha). Grey mangrove trees were measured and seedlings were counted three times after setting up the experiment, in July 2010, 2011 and 2012.
(1) Hoppe-Speer S.C.L. & Adams J.B. (2015) Cattle browsing impacts on stunted Avicennia marina mangrove trees. Aquatic Botany, 121, 9–15.
3.10 Reduce intensity of livestock grazing
Background
Domestic livestock can directly consume vegetation, destroy vegetation by trampling, create bare patches of ground (e.g. repeatedly used tracks), affect water infiltration and flows by compacting soils, affect nutrient balance through excretion of waste products, and import seeds of undesirable plants (Morris & Reich 2013). Reducing grazing intensity might allow grazing-sensitive species to recover. However, maintaining some grazing may sustain a mosaic of short and tall vegetation patches, each favouring different plant species (Nolte et al. 2014). The effects of this intervention might depend on site conditions such as productivity (determined by soil moisture and nutrient levels; Berney et al. 2014).
To be summarized as evidence for this intervention, studies must have compared different grazing intensities, without completely removing livestock. Grazing intensity could be reduced by altering grazing duration (e.g. allowing livestock to graze for fewer days) or pressure (e.g. letting fewer animals graze, providing supplementary food as an alternative to living plants, encouraging grazing away from focal areas by feeding stations or shelter elsewhere). Comparisons must involve the same type of livestock and at least some overlap in the timing of grazing.
When interpreting the evidence, remember that the overall grazing intensity for a site does not necessarily reflect the local grazing intensity in wetland patches or in different vegetation types. Also note that “low”, “moderate” and “high” are relative terms within each study: they do not always refer to the same absolute intensity across studies.

3. Threat: Agriculture and aquaculture
48
Related interventions: Use barriers to keep livestock off ungrazed marshes or swamps (3.8); Exclude or remove livestock from historically grazed marshes or swamps (3.9); Use grazing to maintain or restore disturbance (8.9); Use grazing to control problematic plants (9.10); Modify livestock farming practices in watershed (10.15).
Berney P.J., Wilson G.G., Ryder D.S., Whalley R.D.B., Duggin J. & McCosker R. (2014) Divergent responses to long-term grazing exclusion among three plant communities in a flood pulsing wetland in eastern Australia. Pacific Conservation Biology, 20, 237–251.
Morris K. & Reich P. (2013) Understanding the Relationship Between Livestock Grazing and Wetland Condition. Arthur Rylah Institute for Environmental Research, Technical Report Series No. 252.
Nolte S., Esselink P., Smit C. & Bakker J.P. (2014) Herbivore species and density affect vegetation-structure patchiness in salt marshes. Agriculture, Ecosystems & Environment, 185, 41–47.
3.10.1 Reduce intensity of livestock grazing: freshwater marshes
Three studies evaluated the effects, on vegetation, of reducing livestock grazing intensity in freshwater marshes (without stopping grazing entirely). Two studies were in the USA1,2 and the other was in Ireland3. In all three studies, livestock were cattle.
VEGETATION COMMUNITY
Community composition (1 study): One site comparison study in Ireland3 found that lightly and heavily grazed wet meadows contained a similar overall mix of plant species.
Relative abundance (1 study): One replicated, randomized, paired, controlled study in the USA2 found that seasonally and continuously grazed ephemeral pools had similar cover of grasses relative to forbs.
Overall richness/diversity (1 study): One site comparison study in Ireland3 found that lightly and heavily grazed wet meadows had similar overall plant species richness.
Native plant richness/diversity (1 study): One replicated, randomized, paired, controlled study in the USA2 found that seasonally and continuously grazed ephemeral pools experienced similar changes in native plant species richness over three years.
VEGETATION ABUNDANCE
Overall abundance (1 study): One site comparison study in Ireland3 reported that lightly and heavily grazed wet meadows had similar overall vegetation cover.
Herb abundance (1 study): One replicated, randomized, paired, controlled, before-and-after study in the USA1 found that lightly and moderately grazed springs/creeks had similar herb cover.
Individual species abundance (1 study): One study3 quantified the effect of this intervention on the abundance of individual plant species. The site comparison study in Ireland3 reported, for example, that lightly grazed wet meadows had greater cover of black sedge Carex nigra, and lower cover of creeping bent Agrostis stolonifera, than more heavily grazed wet meadows.
VEGETATION STRUCTURE
Height (1 study): One site comparison study in Ireland3 found that lightly grazed wet meadows contained taller vegetation than heavily grazed wet meadows. Vegetation was measured in the summer, during the grazing season.
A replicated, randomized, paired, controlled, before-and-after study in 1992–1997 of springs and creeks in California, USA (1) found that lightly and moderately grazed areas had statistically similar herbaceous vegetation cover. This was true in five of five years, both in spring wetlands (data not reported) and in downstream wetlands alongside creeks (lightly grazed: 46–47%; heavily grazed: 35–80%). Before

3. Threat: Agriculture and aquaculture
49
intervention, the creek plots had 58–80% herb cover. Methods: Three pairs of pastures were selected for the study. All contained springs and had been moderately grazed by cattle since 1960 (800–1,000 kg/ha Residual Dry Matter: the amount of herbaceous material present left after grazing). From 1992/1993, one random pasture/pair remained moderately grazed (1,100–1,800 kg/ha RDM) and one was lightly grazed (1,200–3,800 kg/ha RDM). Grazing occurred in November and February–May. Vegetation cover was monitored in late May 1992–1997, along four 5–10 m transects/pasture: two in wetlands near the spring source, and two in wetlands along the resulting creek.
A replicated, randomized, paired, controlled study in 2000–2003 of ephemeral pools in a grassland in California, USA (2) found that seasonally grazed pools typically had similar relative cover of grasses and native plants to continuously grazed pools, and experienced similar changes in native plant richness. In six of six comparisons over three years, seasonally and continuously grazed pools had similar cover of grasses relative to forbs (seasonal: grass cover 46–55% of forb cover; continuous: 34–48%). In three of six comparisons, seasonally and continuously grazed pools had similar relative cover of native plants relative to non-natives. In the other three comparisons, seasonally grazed pools had lower relative cover of native plants than continuously grazed pools (data not reported). Finally, over the three years, seasonally and continuously grazed pools experienced statistically similar changes in native plant species richness (seasonal: 0.6 fewer to 1.2 more species/0.25 m2; continuous: 0.7–1.8 more species/0.25 m2). Methods: In 2000, eighteen plots were established (in six sets of three) on a ranch grazed for >100 years. In each set, one plot was grazed in the dry season, one was grazed in the wet season, and one was grazed throughout both seasons. Plots were grazed by 1 cow-calf pair/2.4 ha. Access to the seasonally grazed plots was controlled by electric fences. Each spring between 2001 and 2003, vegetation was surveyed in three pools/plot and in adjacent upland. Pools were 70–1,130 m2 and dry when surveyed.
A site comparison study in 2001 of three wet meadows around an ephemeral lake in Ireland (3) found that lightly and heavily grazed meadows had a similar plant community composition, species richness and overall cover, but that lightly grazed meadows contained taller vegetation. Both lightly and heavily grazed wet meadows had a statistically similar mix of plant species (data reported as a similarity index) and statistically similar plant species richness (lightly grazed: 18 species/150m2 and 15 species/m2; heavily grazed: 17–21 species/150m2 and 15–16 species/m2). Overall vegetation cover was 99% in both lightly grazed and heavily grazed meadows. However, the lightly grazed meadow had greater cover of black sedge Carex nigra cover and lower cover of creeping bent Agrostis stolonifera (data reported as abundance classes; see original paper for data on other species). Statistical significance of cover results was not assessed. The lightly grazed meadow had significantly taller vegetation on average (35 cm) than the heavily-grazed meadows (17 cm). Methods: In 2001, wet meadow vegetation was surveyed in three fields with different cattle grazing intensities. One field was lightly grazed (0.01 cows/ha/day, averaged across the summer) and two were heavily-grazed (0.67–0.76 cows/ha/day, averaged across the summer). In July, vegetation height was recorded at 72 points/field. In September, plant species and the area of bare ground/rock were recorded in six 1m2 quadrats/field.
(1) Allen-Diaz, B. & Jackson, R.D. (2000) Grazing effects on spring ecosystem vegetation of California's hardwood rangelands. Journal of Range Management, 53, 215–220.

3. Threat: Agriculture and aquaculture
50
(2) Marty J.T. (2005) Effects of cattle grazing on diversity in ephemeral wetlands. Conservation Biology, 19, 1626–1632.
(3) Ryder C., Moran J., Donnell R. & Gormally M. (2005) Conservation implications of grazing practices on the plant and dipteran communities of a turlough in Co. Mayo, Ireland. Biodiversity and Conservation, 14, 187–204
3.10.2 Reduce intensity of livestock grazing: brackish/salt marshes
Nine studies evaluated the effects, on vegetation, of reducing livestock grazing intensity in brackish/salt marshes (without stopping grazing entirely). Five studies were in Germany1,2,4,5,7. Four studies were in the Netherlands3,6,8,9. Livestock were cattle1,3,6,8,9, sheep2,7 or horses6,8,9. There was overlap in the sites used in two of the German studies4,5 and three of the Dutch studies6,8,9.
VEGETATION COMMUNITY
Overall extent (1 study): One controlled study of a salt marsh in Germany3 reported that the total vegetated area was slightly larger in plots grazed at a lower intensity, for eight years, than plots grazed at a higher intensity.
Community types (4 studies): Two controlled studies of salt marshes in Germany1 and the Netherlands8 reported similar coverage, or similar change in coverage, of plant community types under different grazing intensities. Two studies of brackish and salt marshes in the Netherlands3 and Germany7 reported that reducing grazing intensity (along with other interventions) affected coverage of plant community types. In one study7, the precise effect varied with environmental conditions.
Community composition (1 study): One replicated, randomized, paired, before-and-after study on a salt marsh in the Netherlands9 found that plots grazed under different grazing intensities experienced a similar turnover of plant species over six years, and had a similar overall plant community composition after six years.
Overall richness/diversity (5 studies): Three replicated, paired, controlled studies on salt marshes in Germany5 and the Netherlands8,9 found that plots grazed at lower intensities never had greater plant species richness, after 1–22 years, than plots grazed at higher intensities. One controlled study on a salt marsh in Germany4 found that paddocks grazed at low intensity had greater plant species richness, after 16–18 years, than paddocks grazed at higher intensities. Two studies of salt marshes in the Netherlands3,9 found that plant species richness increased over 6–14 years of reduced grazing intensity (sometimes3 along with other interventions).
VEGETATION ABUNDANCE
Overall abundance (1 study): One controlled study on a salt marsh in Germany4 reported that overall vegetation cover was greater in lightly and moderately grazed paddocks than in a heavily grazed paddock – with the highest cover of all in the moderately grazed paddock.
Individual species abundance (6 studies): Six studies1–5,9 quantified the effect of this intervention on the abundance of individual plant species. For example, three studies (including two controlled) on salt marshes in Germany1,2 and the Netherlands3 reported that plots under different grazing intensities supported a similar abundance (frequency1,3 or cover2) of saltmarsh grass Puccinellia maritima – but with a tendency for greater abundance under lower intensities.
VEGETATION STRUCTURE
Height (6 studies): Six controlled studies (three also replicated and paired) in salt marshes in Germany1,2,4,5 and the Netherlands6,8 reported that vegetation was taller on average (or contained taller vegetation patches) in areas that had been grazed at lower intensities. However, in one of the studies1, this was only true for canopy height: understory grasses were a similar height under

3. Threat: Agriculture and aquaculture
51
all grazing intensities. One of the replicated, paired, controlled studies6 found that, after two summers, variation in vegetation height between patches was similar under all grazing intensities.
A controlled study in 1980–1988 of a salt marsh in northern Germany (1) reported that less intensely grazed plots had a taller vegetation canopy than more intensely grazed plots, but that reducing grazing intensity had little effect on understory height or vegetation cover. Statistical significance was not assessed. After eight years, the vegetation canopy was 26–89 cm tall in plots grazed at low or medium intensity (vs 0–55 cm tall in a plot grazed at high intensity). In contrast, understory grasses reached a similar height under all grazing intensities (low: 6–22 cm; medium: 5–10 cm; high: 3–14 cm). The distribution of different vegetation types was broadly similar across all grazing intensities, with similar communities at similar elevations. However, the plots grazed at low/medium intensity supported a slightly larger total vegetated area than the plot grazed at high intensity (data reported as maps), and a slightly greater frequency of the dominant saltmarsh grass Puccinellia maritima (data reported as frequency classes). Methods: Three plots were established in a coastal salt marsh, historically grazed by 2.0 cattle/ha. From 1980, grazing intensity was reduced in two of the three plots: one to low intensity (0.5 cattle/ha) and one to medium intensity (1.0 cattle/ha). The third plot remained grazed by 2.0 cattle/ha. In 1988, vegetation was surveyed along one 750-m transect/plot, at 50 m intervals. Cover was assessed using a point quadrat (50 points/interval). Vegetation stands were mapped.
A controlled study in 1988–1992 in a salt marsh in northern Germany (2) reported that plots under lower grazing intensities developed different cover of some key plant species to a plot that remained heavily grazed, and had taller vegetation. Statistical significance was not assessed. After four years, moderately grazed plots had 19–27% cover of seablite Suaeda maritima (vs heavily grazed: 5%) but only 0–4% cover of glasswort Salicornia europaea (vs heavily grazed: 24%). Cover of the dominant saltmarsh grass Puccinellia maritima was similar under all grazing intensities (moderate: 70–74%; heavy: 71%). The perennial herbs sea aster Aster tripolium and sea purslane Halimione portulacoides had low cover under both moderate and heavy grazing (<2%), but occurred in a greater proportion of quadrats across moderately than heavily grazed plots, especially closer to the sea (see original paper). Finally, the moderately grazed plots had taller vegetation on average (10–20 cm) than the heavily grazed plot (8 cm), with the difference most pronounced closer to the sea. Methods: In 1988, sheep grazing intensity was reduced in two sections of a historically grazed coastal salt marsh (1.5–3.0 sheep/ha, April–October). A high grazing intensity was maintained in a third section (10 sheep/ha, April–October). The marsh was intertidal (flooded 80–200 times/year) but had a dense artificial drainage system. The cover of each plant species was surveyed annually between 1989 and 1992 in permanent quadrats. Perennial herb frequency and overall vegetation height were recorded in 1992, in quadrats or along transects respectively.
A study in 1981–1997 of a salt marsh in the Netherlands (3) reported that following a reduction in grazing intensity from 1981 (along with legal protection and abandonment of drainage systems), there were changes in the area of plant community types and the abundance of some dominant species, and an increase in plant species richness. Between 1981 and 1995, the area covered by pioneer succulents increased (from 0% to 19% of the marsh) and the area covered by short-grass communities decreased (from 76% to 56%). Statistical significance of these

3. Threat: Agriculture and aquaculture
52
cover results was not assessed. Between 1983 and 1997, the frequency of two of the most abundant plant species did not significantly change: saltmarsh grass Puccinellia maritima (1983: present in 81% of plots; 1997: present in 84% of plots) and sea aster Aster tripolium (1983: 80%; 1997: 97%). Species showing significant changes in frequency included saltbush Atriplex prostrata (increase from 86% to 98%), seablite Suaeda maritima (increase from 38% to 70%), creeping bentgrass Agrostis stolonifera (decrease from 78% to 69%) and common cordgrass Spartina anglica (decrease from 52% to 31%). Between 1983 and 1997, plant species richness significantly increased: from 8 species/100 m2 to 10 species/100 m2. Methods: A degraded coastal salt marsh became part of a nature reserve in 1981. Cattle grazing intensity was gradually reduced (reaching 40–80 animal days/ha/season by the 1990s), and the drainage system was abandoned by 1984 (making the soils wetter and less aerated). Note that this study evaluates the combined effect of these interventions. Coverage of vegetation types was calculated from maps of the marsh made in 1981 and 1995. Plant species presence and cover were surveyed in 64 permanent 100-m2 plots, spread across four parts of the marsh and at a range of elevations, in 1983, 1991 and 1997.
A controlled study in 1991–2009 on a salt marsh in northern Germany (4) found that less intensely grazed paddocks generally had higher plant species richness, greater vegetation cover and taller vegetation than more intensely grazed plots. After 16–18 years, lightly grazed paddocks had higher plant species richness (12.2 species/m2) than a moderately grazed paddock (9.9 species/m2), which had higher plant species richness than a heavily grazed paddock (6.7 species/m2). Total vegetation cover was greater in the lightly and moderately grazed paddocks (86–89%) than in the heavily grazed paddock (82%). Likewise, the vegetation canopy was taller in the lightly and moderately grazed paddocks (13.7–14.0 cm) than in the heavily grazed paddock (6.3 cm). Vegetation cover (but not canopy height) was also lower in the lightly grazed paddock than in the moderately grazed paddock. The study also reported cover of the dominant species in each paddock (see original paper for data). Methods: The study used three paddocks on a coastal salt marsh (historically heavily grazed by sheep). From 1991, the paddocks were grazed each summer at different intensities: one lightly (1–2 sheep/ha), one moderately (3–4 sheep/ha) and one heavily (10 sheep/ha). Vegetation was surveyed every three weeks in summer 2007–2009, in a total of thirty 1-m2 quadrats/paddock/year. All quadrats were at a similar elevation (±20 cm). The paddocks in this study were also used in (5).
A replicated, paired, controlled study in 1988–2010 on three salt marshes in northern Germany (5) found that moderately grazed plots contained a mosaic of short (species-rich) and tall (species-poor) vegetation patches, whilst heavily grazed plots contained only short vegetation. After 19–22 years, heavily grazed paddocks contained uniformly short and species-rich vegetation (5.0 cm canopy height; 7.3 plant species/0.33 m2; dominated by red fescue Festuca rubra: 35% cover). Moderately grazed paddocks contained some short, species-rich vegetation patches that were statistically similar to heavily grazed paddocks (5.8 cm canopy height; 5.8 plant species/0.33 m2; dominated by red fescue: 49% cover). They also contained taller vegetation patches with lower species richness than heavily grazed paddocks (19.4 cm canopy height; 5.3 plant species/0.33 m2; dominated by sea couch Elytrigia atherica: 46% cover). Paddock-scale species richness, which included both short and tall patches in the moderately grazed plots, did not significantly differ between treatments (moderate: 13.3; heavy: 14 plant species/1.1 m2). Methods: The study used six 11–15 ha paddocks: one pair on each of three coastal salt marshes

3. Threat: Agriculture and aquaculture
53
(historically heavily grazed by sheep). From 1988 or 1991, one paddock/pair remained heavily grazed (10 sheep/ha, May–October) and the other was moderately grazed (3–4 sheep/ha, May–October). Vegetation was surveyed in summer 2010, in sixteen 30-cm-diameter circular quadrats/paddock. In moderately grazed paddocks, quadrats were split evenly across short and tall patches. All quadrats were at a similar elevation (±10 cm). This study included the paddocks used in (4).
A replicated, paired, controlled study in 2010–2011 in a salt marsh in the Netherlands (6) found that a lower grazing intensity produced taller vegetation on average, but had no significant effect on patchiness or variation in vegetation height. After two summers of grazing, plots under low grazing intensity contained taller vegetation stands on average (16 cm) than plots with high grazing intensity (11 cm). However, both grazing intensities produced vegetation patches (i.e. areas of vegetation with uniform height) of similar size (low intensity: 118 cm; high intensity: 169 cm diameter). Under both grazing intensities, variation in height amongst patches was similar (data reported as statistical model results). Methods: In 2010, eight 11-ha plots were established (in two sets of four) on a coastal salt marsh. The marsh had been “intensively grazed” for the previous 20 years. In May–October 2010 and 2011, four plots (two plots/set) were grazed at each intensity: low (0.5 livestock units/ha) or high (1.0 livestock units/ha). Half of the plots were grazed by cattle and half by horses. In August 2011, vegetation height was measured along six 25-m transects/plot (100 points/transect). Some or all of the plots in this study were also used in (8) and (9).
A site comparison study in 1988–2006 of coastal brackish and salt marshes in northern Germany (7) reported that reducing grazing intensity (or stopping grazing entirely) affected vegetation development, but that the effect depended on multiple other factors. Grazing intensity was included as an important predictor in six of six statistical models of observed vegetation development (i.e. transitions between vegetation types over defined time periods). However, the effect of grazing intensity depended on other environmental conditions such as initial vegetation type, elevation and latitude (proxy for salinity and flooding frequency). In two models, for example, grazing intensity affected vegetation development at low but not high elevations. It is not possible to separate out results for reducing grazing intensity vs stopping grazing entirely. For example, moderately grazed plots showed similar responses to intensely grazed plots in some cases, but similar responses to ungrazed plots in others. Methods: In 1988, 1996, 2001 and 2006, plant community types were mapped across approximately 7,000 ha of brackish and salt marsh. Over time, grazing intensity was reduced in some areas, from intense (>10 sheep/ha) to moderate (≤3 sheep/ha) or zero. Where grazing was stopped, drainage systems were also abandoned but this had little effect on water levels. Statistical analyses were used to determine the influence of different factors, including grazing intensity, on changes in plant community types between the survey years.
A replicated, randomized, paired, controlled, before-and-after study in 2009–2013 on a salt marsh in the Netherlands (8) found that lower grazing intensities increased vegetation height in two of two comparisons but never increased plant species richness, and had no significant effect on the area of vegetation dominated by sea couch grass Elytrigia atheria. Both far from and near to the sea, vegetation was taller in plots grazed at low intensity (14–22 cm average height) than in plots grazed at high intensity (9–12 cm average height). Far from the sea, plant species richness was lower in plots grazed at low intensity (12–13 species/16 m2) than in plots grazed

3. Threat: Agriculture and aquaculture
54
at high intensity (14 species/16 m2). However, near to the sea, plant species richness did not significantly differ between grazing intensities (low: 8 species/16 m2; high: 9 species/16 m2). Finally, over four years of grazing and across the whole marsh, the area of couch-grass-dominated vegetation experienced a statistically similar change under both grazing intensities (although with a trend towards a greater reduction under a higher grazing intensity; data not reported). Methods: In 2009, twelve plots were established (in three sets of four) on a historically grazed coastal salt marsh. From 2010, six plots (two random plots/set) were grazed at each intensity: low (0.5 animals/ha) or high (1.0 animal/ha). Grazing occurred in summer (June–October) only. Half of the plots were grazed by cows and half by horses. Vegetation height and plant species were recorded in late August/early September 2010–2013, in eight 16-m2 quadrats/plot/year. The area of couch-grass-dominated vegetation was mapped using aerial photographs taken before (2009) and four years after (2013) grazing treatments were applied. Some of the plots in this study were also used in (6) and (9).
A replicated, randomized, paired, controlled, before-and-after study in 2009–2013 on a salt marsh in the Netherlands (9) found that low and high grazing intensities typically had statistically similar effects on plant community composition and cover of two focal herb species, but that lower grazing intensities inhibited species richness. After six years, plots grazed at low intensity contained fewer plant species (7.8–8.4 species/16 m2) and had experienced a smaller increase in plant species richness (gain of 0.5–3.4 species/16 m2) than plots grazed at high intensity (10.2 species/16 m2; gain of 1.2–5.9 species/16 m2). In contrast, plots under both grazing intensities contained a similar overall plant community composition after six years (data not reported), had experienced a similar turnover of plant species (data reported as a turnover index), and had experienced similar changes – in at least two of three comparisons – in cover of sea couch grass Elytrigia atheria and sea aster Aster tripolium (see original paper for data). Methods: In 2009, ten 11-ha plots were established (in two sets of five) on a coastal salt marsh. From 2010, six plots (three random plots/set) were grazed at low intensity (0.5 cattle/ha every summer, 0.5 horses/ha every summer, or 1 cattle/ha every other summer). The other four plots were grazed at higher intensity (1.0 cattle/ha every summer or 1.0 horses/ha every summer). Plant species and their cover were recorded in August/September 2009 (after a summer of intense grazing to standardize plots) and 2010–2015 (during grazing treatments). Surveys were carried out in eight 16-m2 quadrats/plot/year. Some or all of the plots in this study were also used in (6) and (8).
(1) Andresen H., Bakker J.P., Brongers M., Heydemann B. & Irmler U. (1990) Long-term changes of salt marsh communities by cattle grazing. Vegetatio, 89, 137–148.
(2) Kiehl K., Eischeid I., Gettner S. & Walter J. (1996) Impact of different sheep grazing intensities on salt marsh vegetation in northern Germany. Journal of Vegetation Science, 7, 99–106.
(3) Esselink P., Frescok L.F.M. & Dijkema K.S. (2002) Vegetation change in a man-made salt marsh affected by a reduction in both grazing and drainage. Applied Vegetation Science, 5, 17–32.
(4) Rickert C., Fichtner A., van Klink R. & Bakker J.P. (2012) α- and β-diversity in moth communities in salt marshes is driven by grazing management. Biological Conservation, 146, 24–31.
(5) van Klink R., Rickert C., Vermeulen R., Vorst O., WallisDeVries M.F. & Bakker J.P. (2013) Grazed vegetation mosaics do not maximize arthropod diversity: evidence from salt marshes. Biological Conservation, 164, 150–157.
(6) Nolte S., Esselink P., Smit C. & Bakker J.P. (2014) Herbivore species and density affect vegetation-structure patchiness in salt marshes. Agriculture, Ecosystems & Environment, 185, 41–47.
(7) Rupprecht F., Wanner A., Stock M. & Jensen K. (2015) Succession in salt marshes – large-scale and long-term patterns after abandonment of grazing and drainage. Applied Vegetation Science, 18, 86–98.

3. Threat: Agriculture and aquaculture
55
(8) van Klink R., Nolte S., Mandema F.S., Lagendijk D.D.G., Wallis De Vries M.F., Bakker J.P., Esselink P. & Smit C. (2016) Effects of grazing management on biodiversity across trophic levels – the importance of livestock species and stocking density in salt marshes. Agriculture, Ecosystems & Environment, 235, 329–339.
(9) Lagendijk D.D.G., Howison R.A., Esselink P., Ubels R. & Smit C. (2017) Rotation grazing as a conservation management tool: vegetation changes after six years of application in a salt marsh ecosystem. Agriculture, Ecosystems & Environment, 246, 361–366.
3.10.3 Reduce intensity of livestock grazing: freshwater swamps
We found no studies that evaluated the effects, on vegetation, of reducing livestock grazing intensity in freshwater swamps (without stopping grazing entirely).
This means that we have not yet found any studies that have directly evaluated this intervention during our systematic journal and report searches. Therefore we have no evidence to indicate whether or not the intervention has any desirable or harmful effects.
3.10.4 Reduce intensity of livestock grazing: brackish/saline swamps
We found no studies that evaluated the effects, on vegetation, of reducing livestock grazing intensity in brackish/saline swamps (without stopping grazing entirely).
This means that we have not yet found any studies that have directly evaluated this intervention during our systematic journal and report searches. Therefore we have no evidence to indicate whether or not the intervention has any desirable or harmful effects.
3.11 Change season/timing of livestock grazing
Background
Grazing could have different effects on wetland vegetation depending on the time of year at which it is done. For example, it might be beneficial to avoid grazing when certain plants are young/flowering so that they can grow/reproduce and contribute to the wetland vegetation. Additionally, the effects of trampling may vary by season, being lowest in summer when a seasonal wetland might be dry or winter when the soil may be frozen. Seasonal variation in the value of the wetland plants as food for livestock could also contribute to the decision of when to allow grazing.
To be summarized as evidence for this intervention, studies should have compared grazing in different seasons (e.g. summer vs winter) or in different temporal patterns (e.g. 0.5 cows/ha every summer vs 1 cow/ha every other summer). The overall grazing intensity and type of livestock must have been similar under each treatment.
Related interventions: Exclude or remove livestock from historically grazed marshes or swamps (3.9); Use grazing to maintain or restore disturbance (8.9); Use grazing to control problematic plants (9.10); Modify livestock farming practices in watershed (10.15).
3.11.1 Change season/timing of livestock grazing: freshwater marshes
Three studies evaluated the effects, on vegetation, of grazing freshwater marshes in different seasons or at different times. Two studies were in the USA1,2 and one was in Canada3. In all three studies, the livestock were cattle.

3. Threat: Agriculture and aquaculture
56
VEGETATION COMMUNITY
Community composition (1 study): One replicated, randomized, paired, controlled, before-and-after study of freshwater marshes and wet meadows in the USA2 reported that plots grazed in the summer and autumn experienced similar changes in overall plant community composition over a year.
Relative abundance (1 study): One replicated, randomized, paired, controlled study of ephemeral pools in the USA1 found that pools grazed in the dry or wet seasons had similar cover of grasses relative to forbs over three years.
Overall richness/diversity (1 study): One replicated, site comparison study of freshwater marshes in Canada3 found that in summer, marshes grazed in the summer/autumn contained more plant genera than marshes grazed in the spring/summer.
Native/non-target richness/diversity (1 study): One replicated, randomized, paired, controlled study of ephemeral pools in the USA1 found that pools grazed in the dry and wet seasons experienced similar changes in native plant richness over three years.
VEGETATION ABUNDANCE
Overall abundance (1 study): One replicated, randomized, paired, controlled, before-and-after study of freshwater marshes and wet meadows the USA2 found that, in three of four habitat types, summer- and autumn-grazed plots experienced similar changes in live vegetation biomass over one year.
VEGETATION STRUCTURE
Height (1 study): One replicated, site comparison study of freshwater marshes in Canada3 found that in summer, marshes grazed in the summer/autumn contained taller emergent vegetation than marshes grazed in the spring/summer.
A replicated, randomized, paired, controlled study in 2000–2003 of ephemeral pools in a grassland in California, USA (1) found that dry season and wet season grazing had similar effects on relative cover of grasses and native plants, and on native plant richness. In three of three years, pools had similar cover of grasses relative to forbs regardless of the grazing season (dry-season-grazed: grass cover 46–55% of forb cover; wet-season-grazed: grass cover 48–54% of forb cover) and had similar cover of native plants relative to non-natives (data not reported). Over three years, pools experienced statistically similar changes in native plant richness regardless of the grazing season (dry-season-grazed: 0.5–1.0 more species/0.25 m2; wet-season-grazed: 0.6 fewer to 1.2 more species/0.25 m2). Methods: In 2000, six pairs of plots were established on a ranch grazed October–June for >100 years. Between 2000 and 2003, one plot/pair was grazed in the dry season (October–November and April–June) and one plot/pair was grazed in the wet season (December–April). All plots were grazed by 1 cow-calf pair/2.4 ha. Cattle access was controlled by electric fences. Each spring between 2001 and 2003, vegetation was surveyed in three pools/plot and in adjacent upland. Pools were 70–1,130 m2 and dry when surveyed.
A replicated, randomized, paired, controlled, before-and-after study in 1998–1999 in six fields containing a range of freshwater marsh and wet meadow habitats in Idaho, USA (2) found that summer and autumn grazing typically had similar effects on plant communities and on vegetation biomass. Over one year including a period of grazing, summer- and autumn-grazed plots experienced similar changes plant community composition (if any) in all four freshwater habitat types (data presented as graphical analyses; statistical significance of differences not assessed). In three of

3. Threat: Agriculture and aquaculture
57
four freshwater habitat types, summer- and autumn-grazed plots experienced similar changes in live above-ground biomass (summer-grazed: decrease of 290 g/m2 to increase of 60 g/m2; autumn-grazed: decrease, but not always significant, of 5–140 g/m2). For the other vegetation type, plant biomass declined in summer-grazed plots (by 350 g/m2) but did not change in autumn-grazed plots (non-significant increase of 20 g/m2). Methods: The study used three pairs of fields around a lake. Each field contained a range of freshwater habitats, from permanently flooded marshes to ephemeral wet meadows. All fields had been historically grazed and cut, but were undisturbed from 1996. In each pair, one random field was grazed July–August 1998 and the other was grazed September–October 1998 (both by cattle, at 2.3–2.5 animal unit months/ha; one AUM is the amount of feed required to sustain a 1,000-lb cow and her calf for one month). Vegetation was surveyed in June–July before (1998) and after (1999) one season of grazing.
A replicated, site comparison study in 2008 of 13 ephemeral prairie pothole marshes in two pastures in Alberta, Canada (3) found that summer/autumn-grazed marshes contained more wetland plant genera, and taller vegetation, than spring/ summer-grazed marshes. The average number of wetland plant genera was significantly greater in the summer/autumn-grazed than the spring/summer-grazed marshes (data not reported). Three genera were only ever found in summer/autumn-grazed marshes: pondweeds Potamogeton spp., sedges Carex spp. and buttercups Caltha spp. Emergent vegetation was also significantly taller, on average, in summer/autumn-grazed (59 cm) than spring/summer-grazed marshes (32 cm). Methods: In July 2008, vegetation was surveyed in 13 ephemeral marshes: seven in one pasture grazed May–June and six in one adjacent pasture grazed August–October. Both pastures had been grazed by cattle (density not reported) under these regimes since 1994. All plant genera were identified in each marsh. For emergents, five random plants/genus/marsh were measured.
(1) Marty J.T. (2005) Effects of cattle grazing on diversity in ephemeral wetlands. Conservation Biology, 19, 1626–1632.
(2) Austin J.E., Keough J.R. & Pyle W.H. (2007) Effects of habitat management treatments on plant community composition and biomass in a montane wetland. Wetlands, 27, 570–587.
(3) Silver C.A. & Vamosi S.M. (2012) Macroinvertebrate community composition of temporary prairie wetlands: a preliminary test of the effect of rotational grazing. Wetlands, 32, 185–197.
3.11.2 Change season/timing of livestock grazing: brackish/salt marshes
Two studies evaluated the effects, on vegetation, of grazing brackish/salt marshes in different seasons or at different times. One study was in the USA1 and one was in the Netherlands2. In both studies, the focal livestock were cattle.
VEGETATION COMMUNITY
Community composition (1 study): One replicated, randomized, paired, controlled, before-and-after study on a salt marsh in the Netherlands2 found that plots grazed annually by 0.5 cattle/ha and plots grazed biennially by 1.0 cattle/ha experienced a similar turnover of plant species over six years, and had a similar overall plant community composition after six years.
Overall richness/diversity (1 study): The same study2 found that plots grazed annually by 0.5 cattle/ha and plots grazed biennially by 1.0 cattle/ha experienced similar increases in plant species richness over six years, and had similar species richness after six years.
VEGETATION ABUNDANCE

3. Threat: Agriculture and aquaculture
58
Overall abundance (1 study): One replicated, randomized, paired, controlled, before-and-after study in alkali marshes in the USA1 found that summer- and autumn-grazed plots experienced similar changes in live vegetation biomass, over one year.
Individual species abundance (1 study): One replicated, randomized, paired, controlled, before-and-after study on a salt marsh in the Netherlands2 found that grazing annually with 0.5 cattle/ha stimulated greater increases in cover of sea aster Aster tripolium than grazing biennially with 1.0 cattle/ha. There was no significant difference between the grazing regimes for cover of sea couch grass Elytrigia atheria. Vegetation was monitored over six years.
VEGETATION STRUCTURE
A replicated, randomized, paired, controlled, before-and-after study in 1998–1999 in six fields containing ephemeral alkali marshes in Idaho, USA (1) found that summer and autumn grazing had similar effects on vegetation biomass. Over one year including a period of grazing, changes in live above-ground plant biomass were statistically similar in summer-grazed alkali marshes (non-significant decrease of 30 g/m2) and autumn-grazed alkali marshes (non-significant increase of 30 g/m2). Methods: The study used three pairs of fields around a lake. Each field contained a range of wetland habitats, including alkali flats (seasonally flooded; developed salt crust in summer). All fields had been historically grazed and cut, but were undisturbed from 1996. In each pair, one random field was grazed July–August 1998 and the other was grazed September–October 1998 (both by cattle, at 2.3–2.5 animal unit months/ha; one AUM is the amount of feed required to sustain a 1,000-lb cow and her calf for one month). Vegetation was surveyed in June–July before (1998) and after (1999) one season of grazing.
A replicated, randomized, paired, controlled, before-and-after study in 2009–2013 on a salt marsh in the Netherlands (2) found that annual low-intensity and biennial high-intensity cattle grazing had statistically similar effects on plant community composition and plant species richness, but that annual low-intensity grazing increased cover of one of two focal herb species. After six years, plots grazed under each regime contained a similar overall plant community (data not reported) and plant species richness (annual: 8.4 species/16 m2; biennial: 7.8 species/16 m2). Over six years, plots grazed under each regime experienced a similar turnover of plant species (data reported as a turnover index), similar increases in plant species richness (annual: gain of 1.9–2.9 species/16 m2; biennial: gain of 0.5–2.3 species/16 m2) and a similar lack of change in sea couch grass Elytrigia atheria cover (annual: 2% change; biennial: 3% change). However, sea aster Aster tripolium cover increased by 27% in annual low-intensity plots, but only 8% in biennial high-intensity plots. Methods: In 2009, two pairs of 11-ha plots were established on a coastal salt marsh. From 2010, one random plot/pair was grazed by 0.5 cattle/ha every summer, whilst one random plot/pair was grazed by 1 cattle/ha every other summer. Plant species and their cover were recorded in August/September 2009 (after a summer of intense grazing to standardize plots) and 2010–2015 (during cattle grazing treatments). Surveys were carried out in eight 16-m2 quadrats/plot/year.
(1) Austin J.E., Keough J.R. & Pyle W.H. (2007) Effects of habitat management treatments on plant community composition and biomass in a montane wetland. Wetlands, 27, 570–587.
(2) Lagendijk D.D.G., Howison R.A., Esselink P., Ubels R. & Smit C. (2017) Rotation grazing as a conservation management tool: vegetation changes after six years of application in a salt marsh ecosystem. Agriculture, Ecosystems & Environment, 246, 361–366.

3. Threat: Agriculture and aquaculture
59
3.11.3 Change season/timing of livestock grazing: freshwater swamps
We found no studies that evaluated the effects, on vegetation, of grazing freshwater swamps in different seasons or at different times.
This means that we have not yet found any studies that have directly evaluated this intervention during our systematic journal and report searches. Therefore we have no evidence to indicate whether or not the intervention has any desirable or harmful effects.
3.11.4 Change season/timing of livestock grazing: brackish/saline
swamps
We found no studies that evaluated the effects, on vegetation, of grazing brackish/saline swamps in different seasons or at different times.
This means that we have not yet found any studies that have directly evaluated this intervention during our systematic journal and report searches. Therefore we have no evidence to indicate whether or not the intervention has any desirable or harmful effects.
3.12 Change type of livestock grazing
Background
Changing the species or breed of livestock grazing in marshes or swamps could reduce undesirable impacts. For example, trampling impacts could be reduced by replacing heavy cows with sheep, rabbits or ducks. Additionally, different species and breeds of livestock feed in different ways, leading to different impacts on vegetation (Adler et al. 2001; Loucougaray et al. 2004). Sheep maintain shorter, more uniform lawns of vegetation than cattle which leave tufts of longer vegetation, whilst horses can maintain patches of short vegetation. Traditional or heritage livestock breeds may consume different species of plants in different amounts to modern breeds (Tolhurst & Oates 2001). The temperament of livestock may also be an important consideration, with docile breeds being easier to manage around people.
To be summarized as evidence for this intervention, studies should ideally have compared grazing by different types of livestock at similar times and at a similar overall intensity. However, variation in timing and intensity might be inextricably linked to the change in livestock species (e.g. Nolte et al. 2014).
Related interventions: Exclude or remove livestock from historically grazed marshes or swamps (3.9); Use grazing to maintain or restore disturbance (8.9); Use grazing to control problematic plants (9.10); Modify livestock farming practices in watershed (10.15).
Adler P., Raff D. & Lauenroth W. (2001) The effect of grazing on the spatial heterogeneity of vegetation. Oecologia, 128, 465–479.
Loucougaray G., Bonis A. & Bouzillé J.-B. (2014) Effects of grazing by horses and/or cattle on the diversity of coastal grasslands in western France. Biological Conservation, 116, 59–71.
Nolte S., Esselink P., Smit C. & Bakker J.P. (2014) Herbivore species and density affect vegetation-structure patchiness in salt marshes. Agriculture, Ecosystems & Environment, 185, 41–47.
Tolhurst S. & Oates M. (2001) The Breed Profiles’ Handbook: A Guide to the Selection of Livestock Breeds for Grazing Wildlife Sites. English Nature, Peterborough.

3. Threat: Agriculture and aquaculture
60
3.12.1 Change type of livestock grazing: freshwater marshes
We found no studies that evaluated the effects, on vegetation, of allowing different types of livestock to graze freshwater marshes.
This means that we have not yet found any studies that have directly evaluated this intervention during our systematic journal and report searches. Therefore we have no evidence to indicate whether or not the intervention has any desirable or harmful effects.
3.12.2 Change type of livestock grazing: brackish/salt marshes
Three studies evaluated the effects, on vegetation, of allowing different types of livestock to graze brackish/salt marshes. There was overlap in the sites used in the studies, which all compared cattle and horse grazing on one salt marsh in the Netherlands.
VEGETATION COMMUNITY
Community types (1 study): One replicated, randomized, paired, controlled, before-and-after study on a salt marsh in the Netherlands2 found that plots experienced similar changes in the area of a couch-grass-dominated community, over four years, whether grazed by cattle or horses.
Community composition (1 study): One replicated, randomized, paired, controlled, before-and-after study on a salt marsh in the Netherlands3 found that plots grazed by cattle and plots grazed by horses experienced a similar turnover of plant species over six years, and had a similar overall plant community composition after six years.
Overall richness/diversity (2 studies): Two replicated, randomized, paired, controlled studies on one salt marsh in the Netherlands2,3 found that plots grazed by cattle and plots grazed by horses had similar plant species richness after 1–6 years. One of the studies3 also reported similar increases in species richness over six years, whether plots were grazed by cattle or horses.
VEGETATION ABUNDANCE
Individual species abundance (1 study): One replicated, randomized, paired, controlled, before-and-after study on a salt marsh in the Netherlands3 found that plots grazed by cattle and plots grazed by horses experienced similar changes in the cover of two salt marsh herb species, over six years.
VEGETATION STRUCTURE
Height (2 studies): Of two replicated, paired, controlled studies on one salt marsh in the Netherlands, one1 found that horses maintained shorter late-summer vegetation than cattle after two years of grazing. The other study2 found that horses and cattle maintained late-summer vegetation of a similar height, over four years. The first study1 also examined variation in height between vegetation patches, and found no significant difference between horse- and cattle-grazed plots.
A replicated, paired, controlled study in 2010–2011 on a salt marsh in the Netherlands (1) found that grazing by horses produced shorter vegetation on average, and larger uniform patches of vegetation, than grazing by cattle. After two summers of grazing, plots grazed by horses contained shorter vegetation stands (12 cm average height) than plots grazed by cattle (15 cm average height). Vegetation patches (i.e. areas of vegetation with uniform height) were larger in horse-grazed plots (190 cm diameter) than in cattle-grazed plots (98 cm diameter). Variation in height amongst patches was statistically similar in horse- and cattle-grazed plots (data reported as statistical model results). Methods: In 2010, eight 11-ha plots were established (in two sets of four) on a coastal salt marsh. The marsh had been “intensively grazed” for

3. Threat: Agriculture and aquaculture
61
the previous 20 years. In May–October 2010 and 2011, four plots (two plots/set) were grazed by horses and four were grazed by cattle. Half of the plots were grazed at high intensity (1.0 animal/ha) and half were grazed at low intensity (0.5 animals/ha). In August 2011, vegetation height was measured along six 25-m transects/plot (100 points/transect). Some or all of the plots in this study were also used in (2) and (3).
A replicated, randomized, paired, controlled, before-and-after study in 2009–2013 on a salt marsh in the Netherlands (2) found that grazing by cattle and horses had similar effects on plant species richness, vegetation height and the area of vegetation dominated by sea couch grass Elytrigia atheria. Over four years, plots grazed by cattle and horses did not significantly differ in plant species richness (both 8–14 species/16 m2) or average vegetation height (cattle: 9–22 cm; horses: 10–17 cm). This was true in both near to and far from the sea. Over four years, and across the whole marsh, plots grazed by cattle and horses experienced a statistically similar change in area of couch-grass-dominated vegetation (data not reported). Methods: In 2009, twelve 11-ha plots were established (in three sets of four) on a historically grazed coastal salt marsh. From 2010, six plots (two random plots/set) were grazed in summer by each livestock type: cows or horses. Half of the plots were grazed at high intensity (1.0 animal/ha) and half were grazed at low intensity (0.5 animals/ha). Vegetation height and plant species were recorded in late August/early September 2010–2013, in eight 16-m2 quadrats/plot/year. The area of couch-grass-dominated vegetation was mapped using aerial photographs taken before (2009) and four years after (2013) grazing treatments were applied. Some of the plots in this study were also used in (1) and (3).
A replicated, randomized, paired, controlled, before-and-after study in 2009–2013 on a salt marsh in the Netherlands (3) found that grazing by cattle and horses had statistically similar effects on plant community composition, plant species richness and two focal herb species. After six years, cattle-grazed and horse-grazed plots contained a similar overall plant community (data not reported) and plant species richness (cattle: 8.4–10.2 species/16 m2; horses: 8.3–10.2 species/16 m2). Over the six years, plots grazed by cattle and horses had experienced a similar turnover of plant species (data reported as a turnover index) and similar increases in plant species richness (cattle: gain of 1.7–5.9 species/16 m2; horses: gain of 1.1–5.2 species/16 m2). They had also experienced similar changes in cover of sea couch grass Elytrigia atheria (cattle: 2–11% change; horses: 0–9% change) and sea aster Aster tripolium (cattle: 1–27% change; horses: 13–15% change). Methods: In 2009, eight 11-ha plots were established (in two sets of four) on a coastal salt marsh. From 2010, four plots (two random plots/set) were grazed in summer by each livestock type: cows or horses. Half of the plots were grazed at high intensity (1.0 animal/ha) and half were grazed at low intensity (0.5 animals/ha). Plant species and their cover were recorded in August/September 2009 (after a summer of intense grazing to standardize plots) and 2010–2015 (during cattle/horse grazing treatments). Surveys were carried out in eight 16-m2 quadrats/plot/year. Some or all of the plots in this study were also used in (1) and (2).
(1) Nolte S., Esselink P., Smit C. & Bakker J.P. (2014) Herbivore species and density affect vegetation-structure patchiness in salt marshes. Agriculture, Ecosystems & Environment, 185, 41–47.
(2) van Klink R., Nolte S., Mandema F.S., Lagendijk D.D.G., Wallis De Vries M.F., Bakker J.P., Esselink P. & Smit C. (2016) Effects of grazing management on biodiversity across trophic levels – the importance of livestock species and stocking density in salt marshes. Agriculture, Ecosystems & Environment, 235, 329–339.

3. Threat: Agriculture and aquaculture
62
(3) Lagendijk D.D.G., Howison R.A., Esselink P., Ubels R. & Smit C. (2017) Rotation grazing as a conservation management tool: vegetation changes after six years of application in a salt marsh ecosystem. Agriculture, Ecosystems & Environment, 246, 361–366.
3.12.3 Change type of livestock grazing: freshwater swamps
We found no studies that evaluated the effects, on vegetation, of allowing different types of livestock to graze freshwater swamps.
This means that we have not yet found any studies that have directly evaluated this intervention during our systematic journal and report searches. Therefore we have no evidence to indicate whether or not the intervention has any desirable or harmful effects.
3.12.4 Change type of livestock grazing: brackish/saline swamps
We found no studies that evaluated the effects, on vegetation, of allowing different types of livestock to graze brackish/saline swamps.
This means that we have not yet found any studies that have directly evaluated this intervention during our systematic journal and report searches. Therefore we have no evidence to indicate whether or not the intervention has any desirable or harmful effects.
Aquaculture
3.13 Abandon aquaculture facilities: allow marshes or swamps to
recover without active intervention
Background
It may be possible that marshes or swamps will recover on their own, without any active intervention, if human activities are stopped. Such passive recovery can be cheaper than active intervention and allow development of a community well adapted to local conditions. However, plant colonization may not occur at all or, if it does, occur slowly or be dominated by invasive species (Zahawi et al. 2014). Successful recovery may be hindered by physical degradation (e.g. a water table that is too low, restricted tidal exchange), chemical degradation (e.g. acidification of wetland soils when exposed to oxygen) or an insufficient supply of propagules.
To be summarized as evidence for this intervention, studies must have monitored marshes or swamps after the abandonment of aquaculture facilities within them (stock removed and maintenance completely stopped, with no additional intervention). Therefore, the summarized evidence is best considered as an indication of what kind of vegetation can develop after abandonment of aquacultural facilities, and how long it takes to develop, rather than a complete survey of all relevant evidence.
Related interventions: Modify aquaculture practices in watershed, including abandonment of aquaculture facilities (10.16); habitat restoration/creation interventions, including active interventions in former aquacultural facilities (Chapter 12); habitat protection that may drive aquaculture abandonment (Chapter 14).
Zahawi R.A., Reid J.L. & Holl K.D. (2014) Hidden costs of passive restoration. Restoration Ecology, 22, 284–287.

3. Threat: Agriculture and aquaculture
63
3.13.1 Abandon aquaculture facilities: allow freshwater marshes or
swamps to recover without active intervention
We found no studies that evaluated the effects, on vegetation, of abandoning aquaculture facilities with the expectation that freshwater marshes or swamps would recover spontaneously.
This means that we have not yet found any studies that have directly evaluated this intervention during our systematic journal and report searches. Therefore we have no evidence to indicate whether or not the intervention has any desirable or harmful effects.
3.13.2 Abandon aquaculture facilities: allow brackish/saline marshes or
swamps to recover without active intervention
One study evaluated the effects, on vegetation, of abandoning aquaculture facilities with the expectation that brackish/saline marshes or swamps would recover spontaneously. The study was in Costa Rica.
VEGETATION COMMUNITY
Community composition (1 study): One site comparison study in Costa Rica1 reported that after 14 years, an abandoned shrimp pond contained the same four tree species as a nearby natural mangrove forest.
VEGETATION ABUNDANCE
Tree/shrub abundance (1 study): One site comparison study in Costa Rica1 reported that after 14 years, an abandoned shrimp pond contained a greater density of trees than a nearby natural mangrove forest.
VEGETATION STRUCTURE
Height (1 study): One site comparison study in Costa Rica1 reported that after 14 years, an abandoned shrimp pond had a shorter tree canopy than a nearby natural mangrove forest.
Basal area (1 study): The same study1 reported that the basal area of trees was smaller in an abandoned shrimp pond, after 14 years, than in a nearby natural mangrove forest.
A site comparison study in 1996 of an abandoned aquaculture pond in Costa Rica (1) reported that it had developed into mangrove forest within 14 years – containing the same four tree species as nearby natural mangroves, but a greater density of smaller trees. Statistical significance was not assessed. On average, the abandoned pond contained 15,200 trees/ha with a basal area of 18 m2/ha. The average canopy height was 4–10 m/species. In comparison, a nearby remnant of natural mangrove forest contained 7,000 trees/ha with a basal area of 29 m2/ha. The average canopy height was 8–13 m/species. Methods: In 1996, vegetation was surveyed in an abandoned shrimp pond and a nearby natural mangrove forest (two 5 x 5 m plots/site). The 4-ha pond had been used for aquaculture for 20 years, but abandoned since 1982. Its outer dike naturally breached in 1987. Only trees >2 m tall were surveyed. The study country was identified for this summary using Lewis et al. (2002).
(1) Stevenson N.J., Lewis R.R. & Burbridge P.R. (1999) Disused shrimp ponds and mangrove rehabilitation. Pages 277–297 in W. Streever (ed.) An International Perspective on Wetland Rehabilitation. Springer, Dordrecht.

3. Threat: Agriculture and aquaculture
64
Additional Reference
Lewis R.R. III, Erftemeijer P.L.A., Sayaka A. & Kethkaew P. (2002) Mangrove rehabilitation after shrimp aquaculture: a case study in progress at the Don Sak National Forest Reserves, Surat Thani, Southern Thailand. Pages 108–128 in D.J. Macintosh, M.J. Phillips, R.R. Lewis III & B. Clough (eds.) Annexes to the Thematic Review on Coastal Wetland Habitats and Shrimp Aquaculture: Case Studies. World Bank, NACA, WWF and FAO Consortium Program on Shrimp Farming and the Environment.

65
4. Threat: Energy production and mining
Background
This chapter addresses some direct threats to marshes and swamps from the production of energy or extraction of non-living resources (other than water). Marshes and swamps may be damaged by direct extraction of resources such as peat, salt (Liingilie et al. 2015), gravel (Litwin et al. 2013), or metals (Cabeza et al. 2019); resource exploration activities, such as drilling and explosions to identify oil and gas reserves (Adekola & Mitchell 2011; Howard et al. 2014); and construction of infrastructure such as oil wells (Day et al. 2020) and solar panels (Vaughan 2017). Indirect threats related to mining are considered in other chapters.
Related chapters: Threat: Residential and commercial development (Chapter 2); Threat: Transportation and service corridors (Chapter 5); Threat: Biological resource use, i.e. harvesting live biomass (Chapter 6); Threat: Human intrusions and disturbance, including from vehicles (Chapter 7); Threat: Natural system modifications, including changes to the water table that affect nearby marshes or swamps, and flooding from hydroelectric dams (Chapter 8); Threat: Pollution, including from mining activities, oil spills and acid rain (Chapter 10); Habitat restoration and creation (Chapter 12); Habitat protection against all forms of land use change, including energy production and mining (Chapter 14).
Adekola O. & Mitchell G. (2011) The Niger Delta wetlands: threats to ecosystem services, their importance to dependent communities and possible management measures. International Journal of Biodiversity Science, Ecosystem Services & Management, 7, 50–68.
Cabeza M., Terraube J., Burgas D., Temba E.M. & Rakoarijaoana M. (2019) Gold is not green: artisanal gold mining threatens Ranomafana National Park's biodiversity. Animal Conservation, 22, 417–419.
Day J.W., Clark H.C., Chang C., Hunter R. & Norman C.R. (2020) Life cycle of oil and gas fields in the Mississippi River Delta: a review. Water, 12, 1492.
Howard R.J., Wells C.J., Michot T.C. & Johnson D.J. (2014) Effects of disturbance associated with seismic exploration for oil and gas reserves in coastal marshes. Environmental Management, 54, 30–50.
Liingilie A.S., Kiiawe C., Kimaro A., Rubenza C. & Jonas E. (2015) Effects of salt making on growth and stocking of mangrove forests of south western Indian Ocean coast in Tanzania. Mediterranean Journal of Biosciences, 1, 27–31.
Litwin R.J., Smoot J.P., Pavich M.J., Oldberg E., Steury B., Helwig B., Markewich H.W., Santucci V.L. & Sanders G. (2013) Rates and probable causes of freshwater tidal marsh failure, Pototmac River Estuary, Northern Virginia, USA. Wetlands, 33, 1037–1061,
Vaughan A. (2017) UK’s biggest solar farm planned for Kent coast. Available at http://www.theguardian.com/environment/2017/nov/09/giant-solar-power-plant-uk-biggest-north-kent-coast-subsidy-free-power-station-faversham. Accessed 9 January 2020.
4.1 Abandon mined land: allow marshes or swamps to recover
without active intervention
Background
It may be possible that marshes or swamps will recover on their own, without any active intervention, if human activities are stopped. Such passive recovery can be cheaper than active intervention and allow development of a community well adapted

4. Threat: Energy production and mining
66
to local conditions. However, plant colonization may not occur at all or, if it does, occur slowly or be dominated by invasive species (Zahawi et al. 2014). Successful recovery may be hindered by physical degradation (e.g. a water table that is too low, restricted tidal exchange, compacted sediment), chemical degradation (e.g. acidified soils or presence of heavy metals) or an insufficient supply of propagules.
To be summarized as evidence for this intervention, studies must have monitored historically mined land that has been abandoned (mining activities completely stopped, with no additional intervention) with the expectation that marshes or swamps could recover (i.e. excluding studies of abandoned upland mines). Therefore, the summarized evidence is best considered as an indication of what kind of vegetation can develop in historically mined areas, and how long it takes to develop, rather than a complete survey of all relevant evidence.
Related interventions: Abandon cropland (3.4); Abandon plantations (3.7); habitat restoration and creation interventions, including any active intervention on formerly mined land (Chapter 12); habitat protection that may drive abandonment (Chapter 14).
Zahawi R.A., Reid J.L. & Holl K.D. (2014) Hidden costs of passive restoration. Restoration Ecology, 22, 284–287.
4.1.1 Abandon mined land: allow freshwater marshes or swamps to
recover without active intervention
We found no studies that evaluated the effects on vegetation, of abandoning formerly mined land with the expectation that freshwater marshes or swamps would recover spontaneously.
This means that we have not yet found any studies that have directly evaluated this intervention during our systematic journal and report searches. Therefore we have no evidence to indicate whether or not the intervention has any desirable or harmful effects.
4.1.2 Abandon mined land: allow brackish/saline marshes or swamps to
recover without active intervention
One study evaluated the effects, on vegetation, of abandoning formerly mined land with the expectation that brackish/saline marshes or swamps would recover spontaneously. The study was in France.
VEGETATION COMMUNITY
Community types (1 study): One replicated study in France1 simply classified the plant community types that developed on abandoned salt pans. Areas flooded for at least part of the year developed salt marsh plant communities, with the exact community composition depending on the duration of flooding and soil salinity.
VEGETATION ABUNDANCE
VEGETATION STRUCTURE
A replicated study in 1990 of 40 abandoned salt pans in northwest France (1) reported that they contained a range of plant community types, depending on the duration of flooding and soil salinity. In areas flooded for long periods (>277 days/year on average) and with low soil salinities (<2.5 mS/cm on average), common and/or abundant species included shoreline sedge Carex riparia, yellow flag Iris

4. Threat: Energy production and mining
67
pseudacorus, branched bur-reed Sparganium erectum and cuckoo flower Cardamine pratensis. In areas flooded for shorter periods (122–132 days/year on average) and with higher soil salinities (3.3–4.3 mS/cm on average), common and/or abundant species included saltmarsh rush Juncus gerardii and bulbous foxtail Alopecurus bulbosus. Some areas were never flooded and developed upland plant communities. Community data were reported as a graphical analysis, frequency classes and cover classes. Methods: In May 1990, plant species and their cover were recorded in three quadrats (one low elevation, one medium, one high) in each of 40 abandoned salt pans (no artificial inputs of salt water for 150 years). Some sites were still affected by adjacent drainage ditches. Some grazing and/or mowing had occurred on the sites since abandonment.
(1) Bouzillé J.-B., Kernéis E., Bonis A. & Touzard B. (2001) Vegetation and ecological gradients in abandoned salt pans in western France. Journal of Vegetation Science, 12, 269–278.
4.2 Retain/create habitat linkages in areas of energy production or
mining
We found no studies that evaluated the effects, on marsh/swamp vegetation, of retaining or creating habitat linkages in areas of energy production or mining.
This means that we have not yet found any studies that have directly evaluated this intervention during our systematic journal and report searches. Therefore we have no evidence to indicate whether or not the intervention has any desirable or harmful effects.
Background
Isolated habitat patches can be linked with continuous habitat corridors, or with discrete habitat patches as stepping stones (Bennett 2003). Linkages could improve survival prospects and diversity of plant populations in habitat patches (Damschen et al. 2006), because seeds, pollen or vegetation fragments can be moved along them (e.g. by animals). CAUTION: Habitat linkages can also allow diseases, non-native species and fire to spread between patches (Resasco et al. 2014).
Studies of this intervention could involve linkages of any habitat type, as long as effects on marsh or swamp vegetation are evaluated.
Related interventions: Retain/create habitat linkages in developed areas (2.2); Retain/ create habitat linkages in farmed areas (3.2); Retain/create habitat linkages across service corridors (5.4); habitat restoration and creation interventions, which could be used to restore/create linkages of marsh or swamp habitat (Chapter 12).
Bennett, A.F. (2003). Linkages in the Landscape: The Role of Corridors and Connectivity in Wildlife Conservation. IUCN, Gland, Switzerland and Cambridge, UK.
Damschen E.I., Haddad N.M., Orrock J.L., Tewksbury J.J. & Levey D.J. (2006) Corridors increase plant species richness at large scales. Science, 313, 1284–1286.
Resasco J., Haddad N.M., Orrock J.L., Shoemaker D., Brudvig L., Damschen E.I., Tewksbury J.J. & Levy D.J. (2014) Landscape corridors can increase invasion by an exotic species and reduce diversity of native species. Ecology, 95, 2033–2039.

68
5. Threat: Transportation and service corridors
Background
This chapter addresses threats from long, narrow transport routes (e.g. roads, railways and canals) or service corridors (e.g. pipelines). These can destroy the wetlands on which they are built, but also degrade adjacent wetlands (Coffin 2007; Ryder et al. 2004). For example, roads can modify flows of water into or out of wetlands. The railway line connecting New York to Boston in the USA has hydrologically separated many coastal wetlands from Long Island Sound (Squires 1990). Canals in coastal areas, such as the those dug for oil and gas exploration in Louisiana marshes (Baustian et al. 2009), can allow salt water to move further inland and contaminate freshwater wetlands (Wang 1988). Transportation corridors can also limit dispersal of native animals – and plant seeds or pollen they may carry.
Bear in mind that transportation corridors such as canals can also support important marsh or swamp habitats. For example, floating reedbeds have recently been installed in some canals in the United Kingdom (Butcher 2020).
Related chapters: Threat: Residential and commercial development with a larger footprint (Chapter 2); Threat: Human intrusions and disturbance, including damage from vehicles driving on marshes or swamps (Chapter 7); Threat: Natural system modifications, including effects of transport and service corridors on water flows (Chapter 8); Threat: Invasive and other problematic species, which may hitchhike along transport routes (Chapter 9); Threat: Pollution, including air pollution, road salt and oil spills associated with transport and service corridors (Chapter 10); Habitat restoration and creation (Chapter 12); Habitat protection (Chapter 14).
Baustian J.J., Turner R.E., Walters N.F. & Muth D.P. (2009) Restoration of dredged canals in wetlands: a comparison of methods. Wetlands Ecology and Management, 17, 445–453.
Butcher S. (2020) Floating reedbeds installed on Nottingham’s waterways to attract wildlife. Available at https://www.towpathtalk.co.uk/floating-reedbeds-installed-on-nottinghams-waterways-to-attract-wildlife. Accessed 14 November 2020.
Coffin A.W. (2007). From roadkill to road ecology: a review of the ecological effects of roads. Journal of Transport Geography, 15, 396–406.
Ryder A., Taylor D., Walters F. & Domeney R. (2004) Pipelines and peat: a review of peat formation, pipeline construction techniques and reinstatement options. Pages 582–601 in M. Sweeney (ed.) Terrain and Geohazard Challenges Facing Onshore Oil and Gas Pipelines. Conference Proceedings. London, UK.
Squires D.F. (1990) A historical review of changes in near-shore habitats in the sound-harbor-bight system. Pages 403–428 in K. Bricke & R.V. Thomann (eds.) Cleaning Up Our Coastal Waters: An Unfinished Agenda. Regional Conference Proceedings, Riverdale, NY, USA.
Wang F.C. (1988) Dynamics of saltwater intrusion in coastal channels. Journal of Geophysical Research: Oceans, 93, 6937–6946.
5.1 Backfill canals or trenches
Background
Backfilling involves returning dredged or excavated material to a canal (e.g. dug for boat traffic) or trench (e.g. dug for pipelines). Sometimes additional soil or sediment is

5. Threat: Transportation and service corridors
69
brought in if there is not enough excavated material left. In theory, backfilling restores more natural wetland conditions: the water depth in the canal and the height of adjacent spoil heaps are both reduced. The whole area then has more natural water levels and may support desirable marsh or swamp vegetation. Backfilling a canal will usually prevent boats from using it too. The success of this intervention may depend heavily on the skill of the operator, e.g. their ability to create the desired water/soil elevations and avoid overcompacting the fill material. Turner et al. (1994) estimated that backfilling canals in Louisiana cost US$1.20/m3 (US$1.98 corrected to 2017).
For this intervention, as throughout the synopsis, we have only summarized results that are solely or predominantly related to the specified habitat. For example, the results in Turner et al. (1994) combine data from approximately 80% brackish or salt marshes and 20% freshwater marshes – so they have not been summarized as evidence for freshwater marshes.
Evidence summarized for this intervention relates to effects on vegetation within or immediately adjacent to canals or trenches, dug as or associated with service corridors.
Related interventions: Plug/dam canals or trenches (5.2); Raise water level to restore degraded marshes or swamps (8.1); Raise water level to restore/create marshes or swamps from other land uses (12.4); Fill/block ditches not associated with service corridors (12.7); Remove surface soil/sediment (12.11).
Turner R.E., Lee J.M. & Neill C. (1994) Backfilling canals to restore wetlands: empirical results in coastal Louisiana. Wetlands Ecology and Management, 3, 63–78.
5.1.1 Backfill canals or trenches: freshwater marshes
Three studies evaluated the effects, on vegetation, of backfilling canals or trenches in freshwater marshes. All three studies were in the USA. There was overlap in the canals used in two of the studies1,2.
VEGETATION COMMUNITY
Overall extent (3 studies): Three replicated studies in freshwater marshes in the USA1–3 reported coverage of emergent marsh vegetation between 6 months and 25 years after backfilling. All three studies1–3 reported that coverage was greater on former spoil areas alongside canals than within the partly filled canal channels.
Relative abundance (1 study): One replicated, paired, site comparison study in a freshwater marsh in the USA3 reported that in levelled former spoil areas alongside backfilled canals, the relative abundance of some key plant species differed from natural marshland. Vegetation was surveyed three years after backfilling.
VEGETATION ABUNDANCE
VEGETATION STRUCTURE
A replicated study in 1983–1984 of five backfilled canals in freshwater marshes in Louisiana, USA (1) reported that they all developed some coverage of marsh vegetation, but mainly alongside rather than within the channels. After 6–60 months, emergent marsh vegetation coverage was 27% in former spoil areas alongside the channels, on average (range 20–62% for individual canals) but only 6% within the channels, on average (range <1–26% for individual canals). The study suggests that some of the variation between canals was related to the quality of the backfilling/skill

5. Threat: Transportation and service corridors
70
of the dredge operator. Methods: The area of marsh vegetation alongside and within five backfilled freshwater canals was estimated from aerial photographs taken in 1983 and 1984. The canals, originally dug by the oil and gas industry, had been backfilled with adjacent spoil between 1979 and 1984. This reduced their water depth to 0.4–1.4 m. Three of the canals had also been plugged at one end with earth or shell dams. Four canals in this study were also studied in (2).
A replicated study in 2000–2004 of five backfilled canals in freshwater marshes in Louisiana, USA (2) reported that they all developed some coverage of marsh vegetation, but mainly alongside rather than within the channels. Between 20 and 25 years after backfilling, emergent marsh vegetation coverage was 80% in former spoil areas alongside the channels, on average (range 5–95% for individual canals) but only 5% within the channels, on average (range 0–55% for individual canals). The study suggests that marsh vegetation coverage on spoil banks was related to how much of the spoil bank was actually levelled to marsh elevations. Methods: The area of marsh vegetation alongside and within five freshwater canals was estimated from aerial photographs and field surveys in 2000 and 2004. The canals, originally dug by the oil and gas industry, had been backfilled with adjacent spoil between 1979 and 1984. Between 5 and 100% of the spoil heaps alongside each canal were levelled, and the canals were made shallower (but not filled completely). Some canals were plugged at one end with earth or shell dams. Four canals in this study were also studied in (1).
A replicated, paired, site comparison study in 2005 of two backfilled canals in a freshwater marsh in Louisiana, USA (3) reported that they both developed some marsh vegetation within three years, but with a different relative abundance of key plant species to natural marshes. Statistical significance was not assessed. Three years after backfilling, marsh vegetation coverage was 65% on former spoil areas but only 20–25% within each canal. The relative abundance of plant species differed between former spoil areas and adjacent natural marshes. In particular, alligatorweed Alternanthera philoxeroides was more dominant on former spoil areas (23–37% of vegetation) than in natural marsh (6–9% of vegetation). The opposite was true for spikesedge Eleocharis sp. (former spoil areas: 0–30%; natural marsh: 23–73%). Methods: In early 2002, two shipping canals were dammed and adjacent spoil was returned to the channels. One canal received additional sediment from a nearby lake. The canals were not completely filled and adjacent spoil areas were not entirely levelled. In 2005, aerial photographs were taken to estimate vegetation coverage. Vegetation was also surveyed in ten 1-m2 quadrats/canal: five on former spoil areas (including marsh and non-marsh vegetation) and five in adjacent undisturbed marsh.
(1) Neill C. & Turner R.E. (1987) Backfilling canals to mitigate wetland dredging in Louisiana coastal marshes. Environmental Management, 11, 823–836.
(2) Baustian J.J. & Turner R.E. (2006) Restoration success of backfilling canals in coastal Louisiana marshes. Restoration Ecology, 14, 636–644.
(3) Baustian J.J., Turner R.E., Walters N.F. & Muth D.P. (2009) Restoration of dredged canals in wetlands: a comparison of methods. Wetlands Ecology and Management, 17, 445–453.
5.1.2 Backfill canals or trenches: brackish/salt marshes
Four studies evaluated the effects, on vegetation, of backfilling canals or trenches in brackish/salt marshes. All four studies were in the USA. There was overlap in the canals used in three of the studies1,3,4. All studies included some freshwater areas in some analyses, but all results are based predominantly on canals in brackish or saline marshes.

5. Threat: Transportation and service corridors
71
VEGETATION COMMUNITY
Overall extent (4 studies): One paired, site comparison study in marshes in the USA2 reported that emergent vegetation coverage was typically lower in backfilled canals, after four years, than in adjacent undisturbed marsh. Three other studies in marshes in the USA1,3,4 simply reported coverage of emergent marsh vegetation between 6 months and 25 years after backfilling canals. All four studies1–4 reported that coverage was greater on former spoil areas alongside canals than within the partly filled canal channels. Two of the studies1,2 also reported the frequency of submerged/ floating vegetation after 6–60 months, and one3 reported coverage of upland plant species on spoil banks that had not been completely levelled after 6–11 years.
Overall richness/diversity (2 studies): One replicated, site comparison study in marshes in the USA3 reported that former spoil areas alongside backfilled canals had greater plant species richness than nearby natural marsh, due to the presence of upland species on unlevelled areas. One other study of a backfilled canal in predominantly brackish and saline marshes in the USA2 simply quantified richness of submerged vegetation four years after backfilling.
VEGETATION ABUNDANCE
VEGETATION STRUCTURE
A replicated study in 1983–1984 of 31 backfilled canals of varying salinity in Louisiana, USA (1) reported that all but one developed some coverage of marsh vegetation within 6–60 months, and that aquatic vegetation was present in most. Considering only the 26 in brackish and saline canals, emergent marsh vegetation coverage was 53% in former spoil areas alongside the channels, on average (range 0–99% for individual canals) but <1% within the channels, on average (range 0–40% for individual canals). The study suggests that some of the variation between canals could be related to the quality of the backfilling/skill of the dredge operator. Of 27 canals of varying salinity (but mostly brackish or saline), submerged or floating aquatic vegetation was present in 18. Methods: The area of marsh vegetation alongside and within 31 backfilled canals in brackish and salt marshes was estimated from aerial photographs taken in 1983 and 1984. Submerged vegetation was identified in ground surveys. The canals, originally dug by the oil and gas industry, had been backfilled with adjacent spoil between 1979 and 1984. This reduced their water depth to 0.1–1.8 m. Eighteen of the canals had also been plugged at one end with earth or shell dams. This study selected canals from the same master set of 33 used in (3) and (4).
A paired, site comparison study in 1984 of a backfilled canal crossing predominantly brackish and saline marshes in Louisiana, USA (2) reported that it developed coverage of emergent vegetation over four years, but that this remained lower than in natural marshes. Statistical significance was not assessed. In 65 of 83 sampled sections, emergent vegetation coverage was lower within the backfilled canal than in adjacent undisturbed marsh (data not clearly reported). Vegetation coverage in the backfilled canal varied with canal width, excavation method, substrate and coverage in the adjacent marsh (factors which were themselves correlated). The backfilled canal contained 2–10 submerged plant species, depending on salinity, with submerged vegetation present at 10–59% of sampling points (data not reported for undisturbed marsh). Methods: In 1979–1980, a canal dug for an oil pipeline was immediately but incompletely backfilled with spoil. The canal predominantly crossed brackish and saline marshes (94% of study area); data for freshwater marshes were combined with weakly brackish marshes. In August 1984, vegetation was surveyed in 83 sections of the canal (each 0.62 km long) and natural marsh adjacent to each

5. Threat: Transportation and service corridors
72
section. Emergent vegetation coverage was estimated from aerial photographs. Submerged vegetation was sampled with a rake at 20 points/section.
A replicated study in 1983–1990 of 30 backfilled canals predominantly in brackish and saline marshes in Louisiana, USA (3) reported that they developed some coverage of marsh vegetation, but mainly alongside rather than within the channels. Between 6 and 60 months after backfilling, coverage of emergent marsh vegetation was 47% on former spoil areas alongside the channels, but only 5% within the channels. Upland vegetation occurred alongside the channels, with 28% coverage, in patches where spoil had not been completely levelled. Similar coverage was recorded 6–11 years after backfilling (marsh alongside canal: 51%; marsh within canal: 5%; upland vegetation alongside canal: 26%; statistical significance of changes not assessed). Methods: The area of marsh vegetation alongside and within 30 backfilled canals was estimated from aerial photographs taken in 1983, 1984 and 1990. This study selected canals from the same master set of 33 used in (1) and (4). The canals were originally dug by the oil and gas industry. They were backfilled with adjacent spoil between 1979 and 1984, reducing the water depth. Some canals were also plugged at one end with earth or shell dams. The study does not separate results for freshwater, brackish and saline marshes, but most canals (approximately 80%) were in brackish or saline marshes.
A replicated, site comparison study in 2000–2004 of 30 backfilled canals of varying salinity in Louisiana, USA (4) reported that they all developed some coverage of marsh vegetation after 20–25 years, but found that they had higher plant species richness than adjacent natural marsh. Considering only the 25 brackish and saline canals, emergent marsh vegetation coverage was 65% in former spoil areas alongside the channels, on average (range 5–95% for individual canals) but only 1% within the channels, on average (range 0–100% for individual canals). The study suggests that marsh vegetation coverage on spoil banks was related to how much of the spoil bank was actually levelled to marsh elevations. For 22 canals of varying salinity (but mostly brackish or saline), plant species richness was greater alongside backfilled canals (11 species/6 m2) than in nearby natural marsh (6 species/6 m2). Remnant spoil banks supported some upland species. Methods: The area of marsh vegetation alongside and within 30 canals was estimated from aerial photographs and field surveys in 2000 and 2004. Plant species were recorded alongside 22 canals (six 1-m2 quadrats/canal) and in nearby natural marsh (six 1-m2 quadrats/site). The canals, originally dug by the oil and gas industry, had been backfilled with adjacent spoil between 1979 and 1984. Between 5 and 100% of the spoil heaps alongside each canal were levelled, and the canals were made shallower (but not filled completely). Some canals were plugged at one end with earth or shell dams. This study selected canals from the same master set of 33 used in (1) and (3).
(1) Neill C. & Turner R.E. (1987) Backfilling canals to mitigate wetland dredging in Louisiana coastal marshes. Environmental Management, 11, 823–836.
(2) Abernethy R.K. & Gosselink J.G. (1988) Environmental conditions of a backfilled pipeline canal four years after construction. Wetlands, 8, 109–121.
(3) Turner R.E., Lee J.M. & Neill C. (1994) Backfilling canals to restore wetlands: empirical results in coastal Louisiana. Wetlands Ecology and Management, 3, 63–78.
(4) Baustian J.J. & Turner R.E. (2006) Restoration success of backfilling canals in coastal Louisiana marshes. Restoration Ecology, 14, 636–644.

5. Threat: Transportation and service corridors
73
5.1.3 Backfill canals or trenches: freshwater swamps
We found no studies that evaluated the effects, on vegetation, of backfilling canals or trenches in freshwater swamps.
This means that we have not yet found any studies that have directly evaluated this intervention during our systematic journal and report searches. Therefore we have no evidence to indicate whether or not the intervention has any desirable or harmful effects.
5.1.4 Backfill canals or trenches: brackish/saline swamps
We found no studies that evaluated the effects, on vegetation, of backfilling canals or trenches in brackish/saline swamps.
This means that we have not yet found any studies that have directly evaluated this intervention during our systematic journal and report searches. Therefore we have no evidence to indicate whether or not the intervention has any desirable or harmful effects.
5.2 Plug/dam canals or trenches
Background
Canals or trenches contribute to marsh and swamp degradation by allowing water of the ‘wrong’ salinity to enter (typically salty water entering freshwater or brackish sites, when canals or trenches are dug in coastal areas; LCWCRTF 2002), allowing increased water flow or tidal exchange (thus increasing rates of erosion), and/or by allowing water levels to fluctuate. Simply constructing a plug or dam at the mouth of a canal or trench, using materials such as wood or oyster shells, might reduce or solve these problems (NFWF 1995; LCWCRTF 2002).
For this intervention, as throughout the synopsis, we have only summarized results that are solely or predominantly related to the specified habitat. For example, the results in Turner et al. (1994) combine data from approximately 80% brackish or salt marshes and 20% freshwater marshes – so they have not been summarized as evidence for freshwater marshes.
Evidence summarized for this intervention relates to effects on vegetation within or immediately adjacent to canals or trenches, dug as or associated with service corridors.
Related interventions: Backfill canals or trenches (5.1); Fill/block ditches not associated with service corridors (12.7); other actions to Divert/block/stop saltwater inputs (8.5) or Divert/block/stop freshwater inputs (8.6).
LCWCRTF (2002) Point Au Fer Canal Plugs (TE-22). Louisiana Coastal Wetlands Conservation and Restoration Task Force. Available at https://www.lacoast.gov/reports/gpfs/TE-22.pdf. Accessed 15 January 2020.
NFWF (1995) FY1995 Fisheries and Wildlife Assessment. National Fisheries and Wildlife Foundation, USA.
Turner R.E., Lee J.M. & Neill C. (1994) Backfilling canals to restore wetlands: empirical results in coastal Louisiana. Wetlands Ecology and Management, 3, 63–78.
5.2.1 Plug/dam canals or trenches: freshwater marshes
One study evaluated the effects, on vegetation, of plugging/damming canals or trenches in freshwater marshes. The study was in the USA.

5. Threat: Transportation and service corridors
74
VEGETATION COMMUNITY
Overall extent (1 study): One replicated, site comparison study of backfilled canals in freshwater marshes in the USA1 reported that emergent marsh vegetation coverage was greater within the channels of plugged than unplugged canals, after 6–60 months. However, coverage on former spoil areas did not significantly differ between plugged and unplugged canals.
VEGETATION ABUNDANCE
VEGETATION STRUCTURE
A replicated, site comparison study in 1983–1984 of five backfilled canals in freshwater marshes in Louisiana, USA (1) reported that emergent marsh vegetation coverage was greater within plugged than open canals, but that coverage was similar on the adjacent former spoil areas. Statistical significance was not assessed. After 6–60 months, emergent vegetation coverage was 15% within plugged canals (vs <1% in open canals) and 35% on the former spoil areas alongside plugged canals (vs 35% alongside open canals). Methods: In 1983 and 1984, vegetation was surveyed in three freshwater canals that had been plugged with earth or seashell dams at one end, and two canals that had not been plugged. Coverage of emergent marsh vegetation was estimated from aerial photographs. All canals, originally dug by the oil and gas industry, had been backfilled with adjacent spoil between 1979 and 1984.
(1) Neill C. & Turner R.E. (1987) Backfilling canals to mitigate wetland dredging in Louisiana coastal marshes. Environmental Management, 11, 823–836.
5.2.2 Plug/dam canals or trenches: brackish/salt marshes
Two studies evaluated the effects, on vegetation, of plugging/damming canals or trenches in brackish/salt marshes. Both studies were in the USA. There was overlap in the canals used in the studies. Both studies included some freshwater areas in some analyses, but all results are based predominantly on canals in brackish or saline marshes.
VEGETATION COMMUNITY
VEGETATION ABUNDANCE
Overall abundance (2 studies): Two replicated, site comparison studies studied emergent vegetation of backfilled canals in the USA. One study1 reported that plugged canals had greater coverage of emergent marsh vegetation than unplugged canals after 6–60 months. One study2 found that emergent vegetation coverage on former spoil heaps did not significantly differ alongside plugged and unplugged canals after 6–11 years. The first study1 also reported that plugged canals were more likely to contain floating/submerged vegetation than unplugged canals.
VEGETATION STRUCTURE
A replicated, site comparison study in 1983–1984 of 27 backfilled canals of varying salinity in Louisiana, USA (1) reported that plugged canals had greater coverage of emergent marsh vegetation than open canals after 6–60 months, and were more likely to contain submerged vegetation. Statistical significance was not assessed. Considering 17 canals in brackish and saline marshes, emergent vegetation coverage was 7% within plugged canals (vs <1% in open canals) and 53% on the former spoil areas alongside plugged canals (vs 36% alongside open canals). Considering 27 canals

5. Threat: Transportation and service corridors
75
of varying salinity (but mostly brackish or saline), 92% of plugged canals contained floating or submerged aquatic vegetation (vs 43% of open canals). Methods: In 1983 and 1984, vegetation was surveyed in up to 13 canals plugged with earth or seashell dams at one end, and 7–14 canals that were not (or no longer) plugged. Coverage of emergent and floating vegetation was estimated from aerial photographs. Submerged vegetation was identified in ground surveys. All canals, originally dug by the oil and gas industry, had been backfilled with adjacent spoil between 1979 and 1984. This study selected canals from the same master set of 33 used in (2).
A replicated, site comparison study in 1990 of 23 backfilled canals predominantly in brackish and saline marshes in Louisiana, USA (2) found that plugging had no significant effect on marsh vegetation coverage alongside the canals. After 6–11 years, coverage of emergent marsh vegetation on former spoil areas alongside canals did not significantly differ between plugged canals and open canals. However, there was a trend towards lower coverage alongside plugged than open canals. Methods: In 1990, aerial photographs were taken of 23 canals. All canals had been backfilled with adjacent spoil between 1979 and 1984. The mouths of some canals (number not reported) had also been plugged with earth or seashell dams at one end, to maintain water levels and reduce saltwater inputs. The area of the former spoil heaps covered by marsh vegetation was determined from the photographs. This study selected canals from the same master set of 33 used in (1). The study does not separate results for freshwater, brackish and saline marshes, but most canals (approximately 80%) were in brackish or saline marshes.
(1) Neill C. & Turner R.E. (1987) Backfilling canals to mitigate wetland dredging in Louisiana coastal marshes. Environmental Management, 11, 823–836.
(2) Turner R.E., Lee J.M. & Neill C. (1994) Backfilling canals to restore wetlands: empirical results in coastal Louisiana. Wetlands Ecology and Management, 3, 63–78.
5.2.3 Plug/dam canals or trenches: freshwater swamps
We found no studies that evaluated the effects, on vegetation, of plugging/damming canals or trenches in freshwater swamps.
This means that we have not yet found any studies that have directly evaluated this intervention during our systematic journal and report searches. Therefore we have no evidence to indicate whether or not the intervention has any desirable or harmful effects.
5.2.4 Plug/dam canals or trenches: brackish/saline swamps
We found no studies that evaluated the effects, on vegetation, of plugging/damming canals or trenches in brackish/saline swamps.
This means that we have not yet found any studies that have directly evaluated this intervention during our systematic journal and report searches. Therefore we have no evidence to indicate whether or not the intervention has any desirable or harmful effects.
5.3 Design transportation or service corridors to maintain water
flow
We found no studies that evaluated the effects, on vegetation, of designing infrastructure to maintain water flow into/out of marshes or swamps.

5. Threat: Transportation and service corridors
76
This means that we have not yet found any studies that have directly evaluated this intervention during our systematic journal and report searches. Therefore we have no evidence to indicate whether or not the intervention has any desirable or harmful effects.
Background
Transportation or service corridors can block water flows into or out of wetlands (Shuldiner & Cope 1979). However, careful design and construction could minimize this effect, maintaining the amount, timing and quality of water flows. Specific features to facilitate water movement include permeable fill and logs under the infrastructure running parallel with the direction of flow (Partington et al. 2016).
Related interventions: interventions to restore water flows across transportation or service corridors, i.e. Raise water level to restore degraded marshes or swamps (8.1), Facilitate tidal exchange to restore degraded marshes or swamps (8.3), Raise water level to restore/create marshes or swamps from other land uses (12.4) and Facilitate tidal exchange to restore/create marshes or swamps from other land uses (12.6).
Partington M., Gillies C., Gingras B., Smith C. & Morissette J. (2016) Resource Roads and Wetlands: A Guide for Planning, Construction and Maintenance. FPInnovations Special Publication SP-530E.
Shuldiner P.W. & Cope D.F. (1979) Ecological effects of highway fills on wetlands: examples from the field. Transportation Research Record, 736, 29–37.
5.4 Retain/create habitat linkages across service corridors
We found no studies that evaluated the effects, on marsh/swamp vegetation, of retaining or creating habitat linkages across transportation or service corridors.
This means that we have not yet found any studies that have directly evaluated this intervention during our systematic journal and report searches. Therefore we have no evidence to indicate whether or not the intervention has any desirable or harmful effects.
Background
Isolated habitat patches can be linked with continuous habitat corridors, or with discrete habitat patches as stepping stones (Bennett 2003). Linkages could improve survival prospects and diversity of plant populations in habitat patches (Damschen et al. 2006), because seeds, pollen or vegetation fragments can be moved along them (e.g. by animals). CAUTION: Habitat linkages can also allow diseases, non-native species and fire to spread between patches (Resasco et al. 2014).
Studies of this intervention could involve linkages of any habitat type, as long as effects on marsh or swamp vegetation are evaluated.
Related interventions: Retain/create habitat linkages in developed areas (2.2); Retain/ create habitat linkages in farmed areas (3.2); Retain/create habitat linkages in areas of energy production or mining (4.2); habitat restoration and creation interventions, which could be used to restore/create linkages of marsh or swamp habitat (Chapter 12).
Bennett, A.F. (2003). Linkages in the Landscape: The Role of Corridors and Connectivity in Wildlife Conservation. IUCN, Gland, Switzerland and Cambridge, UK.
Damschen E.I., Haddad N.M., Orrock J.L., Tewksbury J.J. & Levey D.J. (2006) Corridors increase plant species richness at large scales. Science, 313, 1284–1286.
Resasco J., Haddad N.M., Orrock J.L., Shoemaker D., Brudvig L., Damschen E.I., Tewksbury J.J. & Levy D.J. (2014) Landscape corridors can increase invasion by an exotic species and reduce diversity of native species. Ecology, 95, 2033–2039.

77
6. Threat: Biological resource use
Background
This chapter addresses the threat from consumptive use (i.e. removing biomass or reducing the population size) of wild biological resources in marshes and swamps. This includes collecting or harvesting vegetation: reeds for construction; sedges for handicrafts; wood from swamps for fuel, fencing and construction; mangrove leaves to feed livestock etc. It also includes hunting, trapping or gathering animals that use marshes or swamps, such as fish, shellfish, shrimp, beavers and birds.
Biological resource use has caused severe damage to some marshes and swamps. For example, overharvesting of papyrus Cyperus papyrus has contributed to the degradation and loss of papyrus marshes around Lake Victoria (Owino & Ryan 2007). Overharvesting of predatory crabs, which allows the population of plant-grazing snails to increase, probably contributed to massive die-offs of salt marsh in the south-east USA (Silliman & Bertness 2002). Even limited resource use can affect vegetation structure and composition: in Timor-Leste, small-scale logging in mangrove forests reduced their density and above-ground biomass (Alongi & de Carvalho 2008).
Related chapters: Threat: Agriculture and aquaculture, i.e. harvesting resources in artificial environments (Chapter 3); Threat: Human intrusions and disturbance, including damage caused by vehicles or pedestrians during harvesting/hunting activities (Chapter 7); Threat: Invasive and other problematic species (Chapter 9); Threat: Pollution, which may arise from biological resource use around marshes or swamps (Chapter 10); Habitat protection, including laws and agreements to encourage sustainable harvesting (Chapter 14); Education and awareness-raising to increase the value of harvested/hunted goods (Chapter 15).
Alongi D.M. & de Carvalho N.A. (2008) The effect of small-scale logging on stand characteristics and soil biogeochemistry in mangrove forests of Timor Leste. Forest Ecology and Management, 255, 1359–1366.
Owino A.O. & Ryan P.G. (2007) Recent papyrus swamp habitat loss and conservation implications in western Kenya. Wetlands Ecology and Management, 15, 1–12.
Silliman B.R. & Bertness M.D. (2002) A trophic cascade regulates salt marsh primary production. Proceedings of the National Academy of Sciences USA, 99, 10500–10505.
Harvesting or gathering wild plants
6.1 Reduce frequency of vegetation harvest
Background
Harvesting vegetation less often (e.g. every two years instead of every year) will allow more time for it to recover from the disturbance, potentially growing taller and more densely. It might give plants long enough to mature and reproduce. CAUTION: In some habitats, regular disturbance such as harvesting may be necessary to maintain the composition and diversity of plant and animal communities (See Chapter 8).

6. Threat: Biological resource use
78
For this intervention, “reduction” includes stopping harvest altogether. Note that studies comparing areas that remain unharvested to areas that become harvested, at any frequency, are not summarized as evidence for this intervention.
Related interventions: Reduce intensity of vegetation harvest (6.2); Reduce frequency of cutting/mowing, including studies where cut vegetation is not removed (8.13).
6.1.1 Reduce frequency of vegetation harvest: freshwater marshes
Three studies evaluated the effects, on vegetation, of reducing the frequency of harvest in freshwater marshes (or harvesting at different frequencies). There was one study in each of the USA1, Belgium2 and Italy3.
VEGETATION COMMUNITY
Overall richness/diversity (1 study): One replicated, paired, controlled, before-and-after study in wet grasslands in Belgium2 reported that overall plant species richness was similar in plots harvested once or twice/year.
VEGETATION ABUNDANCE
Overall abundance (1 study): One replicated, paired, controlled, before-and-after study in wet grasslands in Belgium2 reported that the effect of harvesting twice/year (in July and October) on total above-ground biomass was intermediate between the effects of harvesting once/year in July or October.
Individual species abundance (3 studies): All three studies1–3 quantified the effect of this intervention on the abundance of individual plant species. For example, one replicated, paired, controlled study in freshwater marshes in the USA1 reported that cattail Typha spp. biomass was greater, nine months after the last harvest, in plots harvested every six weeks than in plots harvested every three weeks. One paired, controlled, before-and-after study in reedbeds in Italy3 found that the common reed Phragmites australis biomass was similar in plots harvested once or twice/year, when measured at least five months after the last harvest.
VEGETATION STRUCTURE
A replicated, paired, controlled study in 1980–1981 in two artificial water treatment marshes dominated by cattails Typha spp. in Michigan, USA (1) reported that harvesting cattail less frequently during one summer increased its biomass the following summer. Statistical significance was not assessed. Nine months after the last harvest, cattail biomass was 390 g/m2 in plots harvested every six weeks and 190 g/m2 in plots harvested every three weeks. There was a similar but less extreme pattern one year after the last harvest: cattail biomass was 760 g/m2 in plots harvested every six weeks and 600 g/m2 in plots harvested every three weeks. At both times, cattail biomass in unharvested plots was 620 g/m2. Methods: In June 1980, nine plots were established in each of two cattail-dominated marshes. Over 12 weeks, six plots (three plots/marsh) were cut every six weeks and six plots (three plots/marsh) were cut every three weeks. Cuttings were removed. The remaining six plots remained unharvested. In June and August 1981, above-ground cattail biomass was collected from each plot, then dried and weighed.
A replicated, paired, controlled, before-and-after study in 1986–1988 in five wet grasslands in Belgium (2) reported that harvesting plots once per year increased plant species richness and sometimes increased plant biomass, whilst harvesting twice per

6. Threat: Biological resource use
79
year increased plant species richness and reduced plant biomass. Statistical significance was not assessed. Over two years, plant species richness increased whether plots were harvested once per year (July: from 15 to 18 species/6 m2; October: from 19 to 20 species/6 m2) or twice per year (July and October: from 17 to 19 species/6 m2). Total above-ground biomass (including litter) increased in plots harvested in July (from 460 to 490 g/m2), but declined in plots harvested in October (from 730 to 480 g/m2) or July and October (from 660 to 630 g/m2). The study also included some data on the abundance of individual plant species under each harvesting regime (see original paper). Methods: In spring 1986, three 7 x 7 m plots were established in each of five adjacent wet grasslands (mown annually for the previous 10 years). From 1986, five plots (one plot/grassland) were mown in July, five were mown in October, and five were mown in July and October. Cuttings were removed. Plant species were recorded each summer between 1986 and 1988. Biomass was cut and collected from five 30 x 30 cm quadrats/plot/year, immediately before the first harvest (so not at the same time in all plots), then dried and weighed.
A paired, controlled, before-and-after study in 2000–2002 in two lakeshore reedbeds in northern Italy (3) found that plots harvested once or twice each year supported similar common reed Phragmites australis biomass after two years. In both reedbeds, above-ground reed biomass was statistically similar in plots harvested once each year (in winter; 625–1,751 g/m2) and plots harvested twice each year (in summer and winter; 370–1,153 g/m2). Before harvesting, reed biomass was statistically similar in plots destined for each treatment (477–668 g/m2). Methods: In July 2000, a pair of 10 x 10 m plots was established in each of two reedbeds on the shore of Lago di Aslerio. From summer 2000, one plot/reedbed was mown once each year (August 2000 and 2001), one plot/reedbed was mown twice each year (February 2001 and 2002, plus August mowing). Cuttings were removed. The reedbeds had been historically harvested in winter (and sometimes in summer), but not for >30 years. Above-ground biomass was calculated from counts and measurements of reed shoots from three 1-m2 quadrats/plot, before intervention (July 2000) and two years later (July 2002).
(1) Ulrich K.E. & Burton T.M. (1984) The establishment and management of emergent vegetation in sewage-fed artificial marshes and the effects of these marshes on water quality. Wetlands, 4, 205–220.
(2) Dumortier M., Verlinden A., Beeckman H. & van der Mijnsbrugger K. (1996) Effects of harvesting dates and frequencies on above and below-ground dynamics in Belgian wet grasslands. Écoscience, 3, 190–198.
(3) Fogli S., Brancaleoni L., Lambertini C. & Gerdol R. (2014) Mowing regime has different effects on reed stands in relation to habitat. Journal of Environmental Management, 134, 56–62.
6.1.2 Reduce frequency of vegetation harvest: brackish/salt marshes
We found no studies that evaluated the effects, on vegetation, of reducing the frequency of harvest in brackish/salt marshes (or harvesting at different frequencies).
This means that we have not yet found any studies that have directly evaluated this intervention during our systematic journal and report searches. Therefore we have no evidence to indicate whether or not the intervention has any desirable or harmful effects.
6.1.3 Reduce frequency of vegetation harvest: freshwater swamps
We found no studies that evaluated the effects, on vegetation, of reducing the frequency of harvest in freshwater swamps (or harvesting at different frequencies).

6. Threat: Biological resource use
80
This means that we have not yet found any studies that have directly evaluated this intervention during our systematic journal and report searches. Therefore we have no evidence to indicate whether or not the intervention has any desirable or harmful effects.
6.1.4 Reduce frequency of vegetation harvest: brackish/saline swamps
We found no studies that evaluated the effects, on vegetation, of reducing the frequency of harvest in brackish/saline swamps (or harvesting at different frequencies).
This means that we have not yet found any studies that have directly evaluated this intervention during our systematic journal and report searches. Therefore we have no evidence to indicate whether or not the intervention has any desirable or harmful effects.
6.2 Reduce intensity of vegetation harvest
Background
Harvesting vegetation less intensely may increase its capacity to recover. Harvesting a smaller area or removing fewer plants leaves a larger population of plants to grow or spread into harvested gaps. Removing less of each plant might avoid killing them and allow them to regrow. Techniques such as selective harvesting, thinning rather than clear-cutting, and patch retention harvesting are all included within this intervention. CAUTION: In some habitats, regular disturbance such as harvesting may be necessary to maintain the composition and diversity of plant and animal communities (See Chapter 8).
Note that studies comparing areas that remain unharvested to areas that become harvested, at any intensity, are not summarized as evidence for this intervention.
Related interventions: Reduce frequency of vegetation harvest (6.1); Reduce intensity of cutting/mowing, including studies where cut vegetation is not removed (8.14).
6.2.1 Reduce intensity of vegetation harvest: freshwater marshes
We found no studies that evaluated the effects, on vegetation, of reducing the intensity of harvest in freshwater marshes (or harvesting at different intensities).
This means that we have not yet found any studies that have directly evaluated this intervention during our systematic journal and report searches. Therefore we have no evidence to indicate whether or not the intervention has any desirable or harmful effects.
6.2.2 Reduce intensity of vegetation harvest: brackish/salt marshes
We found no studies that evaluated the effects, on vegetation, of reducing the intensity of harvest in brackish/salt marshes (or harvesting at different intensities).
This means that we have not yet found any studies that have directly evaluated this intervention during our systematic journal and report searches. Therefore we have no evidence to indicate whether or not the intervention has any desirable or harmful effects.
6.2.3 Reduce intensity of vegetation harvest: freshwater swamps
One study evaluated the effects, on vegetation, of reducing the intensity of harvest in freshwater swamps (or harvesting at different intensities). The study was in China.

6. Threat: Biological resource use
81
VEGETATION COMMUNITY
VEGETATION ABUNDANCE
Herb abundance (1 study): One replicated, controlled study in a freshwater swamp in China1 reported that overall herb biomass was statistically similar in plots logged at different intensities five years previously.
Tree/shrub abundance (1 study): The same study1 reported that overall tree biomass was greatest in plots logged at the lowest intensity five years previously. In contrast, overall shrub biomass was greatest in plots logged at medium intensity.
Individual species abundance (1 study): The same study1 reported that the density of the two most common tree species typically declined with increasing logging intensity.
VEGETATION STRUCTURE
Diameter/perimeter/area (1 study): One replicated, controlled study in a freshwater swamp in China1 reported that the diameter of the two most common tree species typically declined with increasing logging intensity.
Basal area (1 study): The same study1 reported that the basal area of the two most common tree species typically declined with increasing logging intensity.
A replicated, controlled study in 2006–2011 in a forested wetland in northeast China (1) found that plots harvested at lower intensities typically contained more trees, but that understory shrub biomass peaked at intermediate harvest intensities and herb biomass was not significantly related to harvest intensity. After five years, above-ground tree biomass was greatest in plots harvested at low intensity (low: 129; medium: 100; high: 88 t/ha; statistical significance not assessed). Accordingly, density, diameter and basal area of the two most common tree species typically declined with increasing harvest intensity, and otherwise did not clearly or significantly differ between intensities (see original paper for data). Shrub biomass was greatest in plots harvested at medium intensity (low: 0.6; medium: 4.8; high: 2.0 t/ha). Herb biomass did not significantly differ between harvest intensities (low: 2.2; medium: 3.5; high: 2.6 t/ha). Methods: Nine 20 x 30 m plots were established in a forested wetland. In autumn 2006, trees were mechanically cut and removed from all nine plots: three at low intensity (25% of tree volume removed), three at medium intensity (35% volume removed) and three at high intensity (50% volume removed). Trees were counted and measured in May and October 2011. Vegetation samples were cut in August 2011, then dried and weighed.
(1) Mu C., Lu H., Wang B., Bao X. & Cui W. (2013) Short-term effects of harvesting on carbon storage of boreal Larix gmelinii–Carex schmidtii forested wetlands in Daxing’anling, northeast China. Forest Ecology and Management, 293, 140–148.
6.2.4 Reduce intensity of vegetation harvest: brackish/saline swamps
We found no studies that evaluated the effects, on vegetation, of reducing the intensity of harvest in brackish/saline swamps (or harvesting at different intensities).
This means that we have not yet found any studies that have directly evaluated this intervention during our systematic journal and report searches. Therefore we have no evidence to indicate whether or not the intervention has any desirable or harmful effects.

6. Threat: Biological resource use
82
6.3 Change season/timing of vegetation harvest
Background
The effects of harvesting vegetation – especially on its physical structure at a given time of year – may vary depending on the time of year it is carried out. CAUTION: In some habitats, regular disturbance such as harvesting may be necessary to maintain the composition and diversity of plant and animal communities (See Chapter 8).
To be summarized as evidence for this intervention, studies should have compared a fixed harvest frequency and intensity, but in different seasons (e.g. summer vs winter) or in different temporal patterns (e.g. 50% of plants cut every summer vs 100% of plants cut every other summer).
Related interventions: Reduce frequency of vegetation harvest (6.1); Reduce intensity of vegetation harvest (6.2); Change season/timing of cutting/mowing, including studies where cut vegetation is not removed (8.15).
6.3.1 Change season/timing of vegetation harvest: freshwater marshes
Three studies evaluated the effects, on vegetation, of harvesting vegetation from freshwater marshes in different seasons or at different times. There was one study in Switzerland1, one in Belgium2 and one in Japan3.
VEGETATION COMMUNITY
Community composition (1 study): One replicated, randomized, paired, controlled study in wet meadows in Switzerland1 reported that summer-harvested and winter-harvested plots experienced similar changes in their overall plant community composition, over 3–4 years.
Overall richness/diversity (1 study): One replicated, paired, controlled study of wet grasslands in Belgium2 reported that the effect of a single harvest between June and November on overall plant species richness depended on the month of harvesting.
VEGETATION ABUNDANCE
Overall abundance (1 study): One replicated, paired, controlled study of wet grasslands in Belgium2 reported that the effect of a single harvest between June and November on overall vegetation abundance (including litter) depended on the month of harvesting.
Individual species abundance (3 studies): All three studies1–3 quantified the effect of this intervention on the abundance of individual plant species. The studies all reported that individual species’ abundances responded differently to harvesting in different seasons. For example, the controlled, before-and-after study in Japan3 reported that harvesting in June reduced the abundance of common reed Phragmites australis, in the following summer, more than harvesting in July.
VEGETATION STRUCTURE
Overall structure (1 study): One replicated, randomized, paired, controlled study in wet meadows in Switzerland1 reported that summer-harvested and winter-harvested plots both experienced a shift in vegetation cover towards lower vegetation layers, over 3–4 years.
Diameter/perimeter/area (1 study): The same study1 reported that summer harvesting and winter harvesting had opposite effects on the diameter of common reed Phragmites australis shoots: they became thinner over four years of summer harvests but thicker over three years of winter harvests.
A replicated, randomized, paired, controlled study in 1983–1986 in two wet meadows in Switzerland (1) reported that summer and winter harvesting had similar

6. Threat: Biological resource use
83
effects on overall plant community composition and structure, but different effects on some individual plant species. Statistical significance was not assessed. Over 3–4 years, plots harvested in summer and winter experienced similar changes in overall plant community composition (partial data reported as a graphical analysis). Both harvest regimes were associated with a significant increase in the proportion of vegetation in lower layers. This was true for vegetation overall, and the dominant species in each community (partial data reported, as number of times survey pins touched living vegetation). Some individual species responded differently to each harvest regime. For example, common reed Phragmites communis developed more, thinner shoots and lower above-ground biomass over four years of summer harvest, but developed fewer, thicker shoots and greater above-ground biomass over three years of winter harvest (see original paper for partial data). Methods: Two pairs of plots (each 121–169 m2) were established in two historically mown, but abandoned, lakeside wet meadows. In each pair, one random plot was mown in winter (from early 1983) and one random plot was mown in late summer (from 1983). Cuttings were removed. Vegetation was surveyed each summer 1983–1986 (before harvest, where applicable).
A replicated, paired, before-and-after study in 1986–1988 in five wet grasslands in Belgium (2) reported mixed effects of single annual harvests, between June and November, on plant species richness and biomass. Statistical significance was not assessed. Over two years, plant species richness increased in plots harvested between July and October (from 15–19 to 18–20 species/6 m2). It declined in plots harvested in November (from 19 to 18 species/6 m2) and was stable in plots harvested in June (17 species/6 m2). Total above-ground biomass (including litter) declined in plots harvested between August and October (from 550–730 g/m2 to 480–560 g/m2). It increased in plots harvested in June, July or November (from 310–660 g/m2 to 410–780 g/m2). The study also reported data on the cover of some example individual plant species (see original paper). Methods: In spring 1986, six 7 x 7 m plots were established in each of five adjacent wet grasslands (mown annually for the previous 10 years). From 1986, one plot/grassland was mown in each month between June and November. Cuttings were removed. Plant species were recorded each summer between 1986 and 1988. Biomass was cut and collected from five 30 x 30 cm quadrats/plot/year, immediately before mowing (so not at the same time in all plots), then dried and weighed.
A controlled, before-and-after study in 2000–2001 of a riparian reedbed near Tokyo, Japan (3) reported that harvesting in June suppressed common reed Phragmites australis biomass and density more, over the second growing season after cutting, than harvesting in July. Unless specified, statistical significance was not assessed. Before harvest, common reed abundance was statistically similar in both plots (density: 91–102 shoots/m2; above-ground biomass: 40–660 g/m2). In the first growing season after harvest, common reed abundance showed similar responses in both June-harvested and July-harvested plots: initial decline, then recovery to similar levels (see original paper for data). In the second growing season after cutting, June-cut plots contained fewer reed shoots than July-cut plots at four of six time points (for which June-harvested: 140–156 shoots/m2; July-harvested: 168–218 shoots/m2) and less reed biomass at three of seven time points (for which June-harvested: 370–800 g/m2; July-harvested: 710–1070 g/m2). At all other times, reed abundance was similar in June- and July-harvested plots. Methods: In April 2000, two 6 x 10 m plots were established in a mature riparian reedbed. Reeds were cut in early June 2000 in one

6. Threat: Biological resource use
84
plot and early July 2000 in the other (20–30 cm above ground level). Cuttings were removed. Reed shoots were cut, counted, dried and weighed every 1–2 months between April and December 2000 and 2001 (three 0.125-m2 quadrats/plot/survey).
(1) Buttler A. (1992) Permanent plot research in wet meadows and cutting experiment. Vegetatio, 103, 113–124.
(2) Dumortier M., Verlinden A., Beeckman H. & van der Mijnsbrugger K. (1996) Effects of harvesting dates and frequencies on above and below-ground dynamics in Belgian wet grasslands. Écoscience, 3, 190–198.
(3) Asaeda T., Rajapakse L., Manatunge J. & Sahara N. (2006) The effect of summer harvesting of Phragmites australis on growth characteristics and rhizome resource storage. Hydrobiologia, 553, 327–335.
6.3.2 Change season/timing of vegetation harvest: brackish/salt marshes
We found no studies that evaluated the effects, on vegetation, of harvesting brackish/salt marshes in different seasons or at different times.
This means that we have not yet found any studies that have directly evaluated this intervention during our systematic journal and report searches. Therefore we have no evidence to indicate whether or not the intervention has any desirable or harmful effects.
6.3.3 Change season/timing of vegetation harvest: freshwater swamps
We found no studies that evaluated the effects, on vegetation, of harvesting freshwater swamps in different seasons or at different times.
This means that we have not yet found any studies that have directly evaluated this intervention during our systematic journal and report searches. Therefore we have no evidence to indicate whether or not the intervention has any desirable or harmful effects.
6.3.4 Change season/timing of vegetation harvest: brackish/saline
swamps
We found no studies that evaluated the effects, on vegetation, of harvesting brackish/saline swamps in different seasons or at different times.
This means that we have not yet found any studies that have directly evaluated this intervention during our systematic journal and report searches. Therefore we have no evidence to indicate whether or not the intervention has any desirable or harmful effects.
6.4 Use low-impact methods to harvest vegetation
Background
The impact of harvesting vegetation could be reduced by switching to supposedly lower-impact methods or equipment. For example, vehicles used for harvesting can compress, sink into and create ruts in wet soils. Lower-impact alternatives include: using specialised tracked vehicles or hovercraft which exert less pressure on the ground (Dubowski et al. 2013); ensuring vehicles are not overloaded and heavy (Schröder et al. 2015); and extracting harvested vegetation by hand or helicopter. When logging in swamps, directional felling may reduce the amount of collateral damage when trees fall.

6. Threat: Biological resource use
85
To be included as evidence for this intervention, studies must have compared low- and high-impact harvesting methods, not just reported the effects of methods claimed to be low-impact.
Related interventions: Reduce frequency of vegetation harvest (6.1); Reduce intensity of vegetation harvest (6.2); Restrict vehicle use (7.1).
Dubowski A.P., Zembrowski K., Rakowicz A., Palowski T., Weymann S. & Wojnilowicz L. (2013) Developing new-generation machinery for vegetation management on protected wetlands in Poland. Mires and Peat, 13, Article 11.
Schröder C., Dahms T., Paulitz J., Wichtmann W. & Wichmann S. (2003) Towards large-scale paludiculture: addressing the challenges of biomass harvesting in wet and rewetted peatlands. Mires and Peat, 16, Article 13.
6.4.1 Use low-impact methods to harvest vegetation: freshwater
marshes
We found no studies that evaluated the effects, on vegetation, of using supposedly low-impact methods to harvest vegetation in freshwater marshes.
This means that we have not yet found any studies that have directly evaluated this intervention during our systematic journal and report searches. Therefore we have no evidence to indicate whether or not the intervention has any desirable or harmful effects.
6.4.2 Use low-impact methods to harvest vegetation: brackish/salt
marshes
We found no studies that evaluated the effects, on vegetation of using supposedly low-impact methods to harvest vegetation in brackish/salt marshes.
This means that we have not yet found any studies that have directly evaluated this intervention during our systematic journal and report searches. Therefore we have no evidence to indicate whether or not the intervention has any desirable or harmful effects.
6.4.3 Use low-impact methods to harvest vegetation: freshwater
swamps
One study evaluated the effects, on vegetation, of using supposedly low-impact methods to harvest vegetation in freshwater swamps. The study was in the USA.
VEGETATION COMMUNITY
Overall richness/diversity (1 study): One controlled study in a freshwater swamp in the USA1 reported that after seven years, a plot where logs had been extracted by helicopter only contained fewer plant species than a plot where logs had been extracted by helicopter and ground vehicles.
VEGETATION ABUNDANCE
Overall abundance (1 study): One controlled study in a freshwater swamp in the USA1 reported that after seven years, a plot where logs had been extracted by helicopter only contained less overall plant biomass than a plot where logs had been extracted by helicopter and ground vehicles. This was also true for the overstory and ground layers separately. However, overstory tree density did not significantly differ between helicopter-extracted and vehicle-extracted plots.
Individual species abundance (1 study): The same study1 found that the abundance of some individual plant species – particularly swamp ash Fraxinus caroliniana and water tupelo Nyssa aquatica – significantly differed between helicopter-extracted and vehicle-extracted plots.

6. Threat: Biological resource use
86
VEGETATION STRUCTURE
Height (1 study): One controlled study in a freshwater swamp in the USA1 found that after seven years, the average height of the overstory was similar in a plot where logs had been extracted by helicopter only and a plot where logs had been extracted by helicopter and ground vehicles.
Diameter, perimeter, area (1 study): The same study1 found that after seven years, the average stem diameter of overstory trees was similar in helicopter-extracted and vehicle-extracted plots.
A controlled study in 1986–1993 in a freshwater swamp in Alabama, USA (1) reported that a plot where logs were extracted by helicopter only contained fewer plant species and less plant biomass seven years later than a plot where logs were also extracted by ground vehicles, but that both treatments had a similar overstory tree density, diameter and height. Unless specified, results summarized for this study are not based on assessments of statistical significance. After seven years, helicopter-extracted plots contained 28 plant species, compared to 31 in vehicle-extracted plots. Helicopter-extracted plots contained only 46,748 kg/m2 dry above-ground plant biomass (overstory: 41,373; understory: 173; ground: 5,202 kg/m2), compared to 65,979 kg/m2 in vehicle-extracted plots (overstory: 60,222; understory: 108; ground: 5,649 kg/m2). For overstory trees, there were no significant differences between treatments in density (helicopter: 3,539; vehicle: 3,829 trees/ha), average diameter (helicopter: 6.2; vehicle: 6.9 cm) or average height (helicopter: 7.6; vehicle: 7.5 m). The study also compared all of these metrics for individual species. The main difference was that the overstory of helicopter-extracted plots contained significantly more swamp ash Fraxinus caroliniana and significantly less water tupelo Nyssa aquatica than vehicle-extracted plots (true for biomass and density; see original paper for data and full results). Methods: In summer 1993, vegetation was surveyed in two plots in a swamp. Both plots had been clear-cut (all trees felled) in autumn 1986. In one plot, some of the cut logs were removed by helicopter. In the other plot, after removing some cut logs by helicopter, other logs were dragged around the plot with a cable skidder to simulate extraction by vehicle.
(1) Aust W.M., Schoenholtz S.H., Zaebst T.W. & Szabo B.A. (1997) Recovery status of a tupelo-cypress wetland seven years after disturbance: silvicultural implications. Forest Ecology and Management, 90, 161–169.
6.4.4 Use low-impact methods to harvest vegetation: brackish/saline
swamps
We found no studies that evaluated the effects, on vegetation, of using supposedly low-impact methods to harvest vegetation in brackish/saline swamps.
This means that we have not yet found any studies that have directly evaluated this intervention during our systematic journal and report searches. Therefore we have no evidence to indicate whether or not the intervention has any desirable or harmful effects.
6.5 Implement ‘mosaic management’ when harvesting wild
vegetation
We found no studies that evaluated the effects, on vegetation, of implementing mosaic management when harvesting wild vegetation from marshes or swamps.

6. Threat: Biological resource use
87
This means that we have not yet found any studies that have directly evaluated this intervention during our systematic journal and report searches. Therefore we have no evidence to indicate whether or not the intervention has any desirable or harmful effects.
Background
Mosaic management involves managing neighbouring patches of land in different ways, across large scales. For example, while some areas of vegetation might be fully harvested in a given year, others might be left untouched. Alternatively, different areas of vegetation may be harvested at different times within a given year, or some areas might be grazed rather than harvested. In any case, different vegetation types in each patch might support different plant (and animal) species, boosting biodiversity across all patches.
To be summarized as evidence for this intervention, studies must have considered the overall effectiveness of mosaic management, comparing marsh or swamp vegetation across the whole mosaic to an area not under mosaic management (e.g. traditional farmland or nature reserves; Oosterveld et al. 2010). Studies comparing vegetation between individual patches would be summarized elsewhere in the synopsis.
Related interventions: Implement mosaic management of farmland (3.1).
Oosterveld E.B., Nijland F., Musters C.J.M. & de Snoo G.R. (2010) Effectiveness of spatial mosaic management for grassland breeding shorebirds. Journal of Ornithology, 152, 161–170.
6.6 Provide new technologies to reduce harvesting pressure on
vegetation
We found no studies that evaluated the effects, on vegetation or human behaviour, of providing new technologies to reduce harvesting pressure on vegetation in marshes or swamps.
This means that we have not yet found any studies that have directly evaluated this intervention during our systematic journal and report searches. Therefore we have no evidence to indicate whether or not the intervention has any desirable or harmful effects.
Background
Providing new, efficient technologies to people who live in or near marshes or swamps could reduce pressure on wild biological resources. More efficient equipment would use less of the natural resource, reducing the amount that needs to be harvested. For example, fuel-efficient fish-smoking systems installed in Cameroon could reduce the demand for wood, which is largely extracted from mangroves (Feka et al. 2010). New technologies might also have health benefits, such as the production of less, or less harmful, smoke.
To be included as evidence for this intervention, studies must have quantified the effects of new technologies on marsh or swamp vegetation or human behaviours that threaten it (e.g. the amount of wood harvested). Studies that simply monitor the technologies (e.g. the amount of wood consumed by stoves of different designs) are not included as evidence.
Related interventions: Designate protected area (14.1) and Provide general protection for marshes or swamps (14.2), including arrangements that allow sustainable use.
Feka N.Z., Chuyong G.B. & Ajonina G.N. (2010) Sustainable utilization of mangroves using improved fish-smoking systems: a management perspective from the Douala-Edea Wildlife Reserve, Cameroon. Tropical Conservation Science, 2, 450–468.

6. Threat: Biological resource use
88
Harvesting or gathering wild animals
6.7 Reduce frequency of hunting/collecting animals
We found no studies that evaluated the effects, on vegetation, of reducing the frequency of hunting/ collecting animals in marshes or swamps.
This means that we have not yet found any studies that have directly evaluated this intervention during our systematic journal and report searches. Therefore we have no evidence to indicate whether or not the intervention has any desirable or harmful effects.
Background
Hunting or collecting animals from marshes or swamps (or animals that use these habitats) can damage vegetation. The hunting/collecting activity can directly damage vegetation, e.g. trampling by foot traffic along shorelines used by anglers (USFWS 2006). Removing key animal species can have indirect effects on vegetation. For example, massive die-offs of salt marsh in the southeastern USA were probably related to overharvesting of predatory crabs – which used to eat and control the population of herbivorous snails (Silliman & Bertness 2002). Hunting or collecting animals less often (e.g. every two years instead of every year) may reduce these direct and indirect impacts, or at least give populations longer to recover.
For this intervention, “reduction” includes stopping harvest altogether. Note that studies comparing areas that remain unharvested to areas that become harvested, at any frequency, are not summarized as evidence for this intervention.
Related interventions: Reduce intensity of hunting/collecting animals (6.8); Control populations of wild vertebrates (9.16); Control populations of wild invertebrates (9.18).
Silliman B.R. & Bertness M.D. (2002) A trophic cascade regulates salt marsh primary production. Proceedings of the National Academy of Sciences USA, 99, 10500–10505.
USFWS (2006) Texas Chenier Plain Refuge Complex: Draft Environmental Impact Statement, Comprehensive Conservation Plan, and Land Protection Plan. United States Fish and Wildlife Service, Albuquerque, New Mexico, USA.
6.8 Reduce intensity of hunting/collecting animals
We found no studies that evaluated the effects, on vegetation, of reducing the intensity of hunting/ collecting animals in marshes or swamps.
This means that we have not yet found any studies that have directly evaluated this intervention during our systematic journal and report searches. Therefore we have no evidence to indicate whether or not the intervention has any desirable or harmful effects.
Background
Hunting or collecting animals from marshes or swamps (or animals that use these habitats) can damage vegetation. The hunting/collecting activity can directly damage vegetation, e.g. trampling by foot traffic along shorelines used by anglers (USFWS 2006). Removing key animal species can have indirect effects on vegetation. For example, massive die-offs of salt marsh in the southeastern USA were probably related to overharvesting of predatory crabs – which used to eat and control the population of herbivorous snails (Silliman & Bertness 2002). Reducing hunting/

6. Threat: Biological resource use
89
collecting intensity (e.g. removing fewer animals on each hunting trip, or removing only individuals of a certain sex or size) may reduce these direct and indirect impacts.
Note that studies comparing areas that remain unharvested to areas that become harvested, at any intensity, are not summarized as evidence for this intervention.
Related interventions: Reduce frequency of hunting/collecting animals (6.7); Control populations of wild vertebrates (9.16); Control populations of wild invertebrates (9.18).
Silliman B.R. & Bertness M.D. (2002) A trophic cascade regulates salt marsh primary production. Proceedings of the National Academy of Sciences USA, 99, 10500–10505.
USFWS (2006) Texas Chenier Plain Refuge Complex: Draft Environmental Impact Statement, Comprehensive Conservation Plan, and Land Protection Plan. United States Fish and Wildlife Service, Albuquerque, New Mexico, USA.
6.9 Use low-impact methods to hunt/collect animals
We found no studies that evaluated the effects, on vegetation, of using supposedly low-impact methods to hunt/collect animals in marshes or swamps.
This means that we have not yet found any studies that have directly evaluated this intervention during our systematic journal and report searches. Therefore we have no evidence to indicate whether or not the intervention has any desirable or harmful effects.
Background
The impact of hunting/collecting animals from marshes or swamps could be reduced by switching to lower-impact methods or equipment. Accessing marshes or swamps by foot may cause less damage to vegetation than using vehicles. Canoes or hovercraft may cause less damage to vegetation than motorboats. In Brazilian mangroves, reverting to the traditional, manual braceamento technique to collect crabs may be less damaging than the fashionable, more profitable redinha technique – which involves cutting mangrove trees in order to set crab traps (do Nascimento et al. 2011; Walsh 2017).
To be included as evidence for this intervention, studies must have compared low- and high-impact hunting methods, not just reported the effects of methods claimed to be low-impact.
Related interventions: Reduce frequency of hunting/collecting animals (6.7); Reduce intensity of hunting/collecting animals (6.8); Restrict vehicle use (7.1); Restrict pedestrian access (7.4).
do Nascimento D.M., da Silva Mourão J. & Alves R.R.N. (2011) A substituição das técnicas tradicionais de captura do caranguejo-uçá (Ucides cordatus) pela técnica “redinha” no estuário do rio Mamanguape, Paraíba. (The replacement of traditional capture techniques of caranguejo-uçá crabs (Ucides cordatus) by the redinha (little-net technique) in the Mamanguape River Estuary, Paraíba, Brazil). Sitientibus Série Ciências Biológicas, 11, 113–119.
Walsh K. (2017) Crabbing Gone Commercial: Brazilian Mangroves Threatened by Shift in Local Traditions. Available at https://news.mongabay.com/2017/05/crabbing-gone-commercial-brazilian-mangroves-threatened-by-shift-in-local-traditions/. Accessed 22 January 2020.

6. Threat: Biological resource use
90
6.10 Reintroduce overharvested animals
We found no studies that evaluated the effects, on marsh/swamp vegetation, of reintroducing overharvested animals.
This means that we have not yet found any studies that have directly evaluated this intervention during our systematic journal and report searches. Therefore we have no evidence to indicate whether or not the intervention has any desirable or harmful effects.
Background
Reintroducing overharvested animals – to marshes or swamps or the wider landscape – could help to conserve marshes and swamps. Animals such as beavers Castor spp. can directly benefit marshes and swamps: these wetland habitats can develop around beaver ponds, or develop on abandoned beaver ponds as they fill in (Willby et al. 2018). Other animals might benefit marshes and swamps more indirectly. For example, after the re-introduction of grey wolves Canis lupus to Yellowstone National Park, USA in the mid-1990s, elk Cervus elaphus numbers declined (elk are prey for wolves), willow Salix spp. growth and recruitment improved (willow is eaten by elk) and beaver numbers increased (beavers use willows as food and to build dams) – with potential consequences on the number and type of wetlands present across the landscape (Wolf et al. 2007; Ripple & Beschta 2015).
CAUTION: Introducing animal species where they are not native can have undesirable consequences, on native competitors and the wider environment.
Related interventions: Reduce frequency of hunting/collecting animals (6.7); Reduce intensity of hunting/collecting animals (6.8).
Ripple W.J. & Beschta R.L. (2015) Trophic cascades in Yellowstone: the first 15 years after wolf reintroduction. Biological Conservation, 145, 205–213.
Willby N.J., Law A., Levanoni O., Foster G. & Ecke F. (2018) Rewilding wetlands: beaver as agents of within-habitat heterogeneity and the responses of contrasting biota. Philosophical Transactions of the Royal Society B, 373, 20170444.
Wolf E.C., Cooper D.J. & Hobbs N.T. (2007) Hydrologic regime and herbivory stabilize and alternative state in Yellowstone National Park. Ecological Applications, 17, 1572–1587.

91
7. Threat: Human intrusions and disturbance
Background
The biodiversity, natural beauty, challenging physical conditions and isolation of wetlands make them attractive for a variety of non-consumptive activities (Ramsar Convention Secretariat 2011). This includes recreation, war, military exercises and scientific research. All of these activities can damage wetland habitats. For example, pedestrians can trample wetland vegetation, damage the soil structure and create ruts that affect water flow, especially along popular trails (Ross 2006). The same is true for vehicles (Kelleway 2005). During the Vietnam War, over 250,000 ha of Vietnamese mangroves – approximately the same size as Luxembourg – were destroyed by chemical spraying (Hong & San 1993).
Related chapters: Threat: Residential and commercial development (Chapter 2); Threat: Transportation and service corridors (Chapter 5); Threat: Invasive and other problematic species, which might be introduced by human visitors (Chapter 9); Habitat restoration and creation to fix damage caused by human intrusions or disturbance (Chapter 12).
Hong P.H. & San H.T. (1993) Mangroves of Vietnam. IUCN, Bangkok, Thailand.
Kelleway J. (2005) Ecological impacts of recreational vehicle use on saltmarshes of the Georges River, Sydney. Wetlands Australia, 22, 52–66.
Ramsar Convention Secretariat (2011) Recreation & Tourism. Wetland Ecosystem Services Factsheet 9. Available at http://www.ramsar.org/sites/default/files/documents/library/services_09_e.pdf. Accessed 22 January 2020.
Ross P.M. (2006) Macrofaunal loss and microhabitat destruction: the impact of trampling in a temperate mangrove forest, NSW Australia. Wetlands Ecology and Management, 14, 167–184.
7.1 Restrict vehicle use
We found no studies that evaluated the effects, on vegetation, of restricting vehicle use in or near marshes or swamps.
This means that we have not yet found any studies that have directly evaluated this intervention during our systematic journal and report searches. Therefore we have no evidence to indicate whether or not the intervention has any desirable or harmful effects.
Background
Vehicles such as cars, quad bikes, cycles and airboats can directly damage marsh and swamp vegetation (e.g. Hannaford & Resh 1999; Kelleway 2005). Vehicles can also compress and rut soft, wet soils, affecting storage and flow of water which in turn affects vegetation. Waves created by boats and jet skis can increase erosion of lake and sea shores (Bilkovic et al. 2017). To prevent this damage, or allow recovery from damage, vehicle use within or near to marshes/swamps could be restricted. This might apply to the total number of vehicles, their speed and/or the routes they can take. Specific means to achieve these restrictions include legislation, voluntary codes, signage and/or ensuring official routes are well maintained.

7. Threat: Human intrusions and disturbance
92
To be summarized as evidence for this intervention, studies must include a clear intervention to restrict vehicle use. Studies of different vehicle use intensities imposed by researchers are not included (e.g. Hannaford & Resh 1999).
Related interventions: Physically exclude vehicles (7.2); Designate protected area (14.1) and Provide general protection for marshes or swamps (14.2) against other or multiple threats.
Bilkovic D., Mitchell M., Davis J., Andrews E., King A., Mason P., Herman J., Tahvildari N. & Davis J. (2017) Review of Boat Wake Wave Impacts on Shoreline Erosion and Potential Solutions for the Chesapeake Bay. STAC Publication Number 17-002.
Hannaford M.J. & Resh V.H. (1999) Impact of all-terrain vehicles (ATVs) on pickleweed (Salicornia virginica L.) in a San Francisco Bay wetland. Wetlands Ecology and Management, 7, 225–233.
Kelleway J. (2005) Ecological impacts of recreational vehicle use on saltmarshes of the Georges River, Sydney. Wetlands Australia, 22, 52–66.
7.2 Physically exclude vehicles
We found no studies that evaluated the effects, on vegetation, of physically excluding vehicles from marshes or swamps.
This means that we have not yet found any studies that have directly evaluated this intervention during our systematic journal and report searches. Therefore we have no evidence to indicate whether or not the intervention has any desirable or harmful effects.
Background
Vehicles such as cars, quad bikes, cycles and airboats can directly damage marsh and swamp vegetation (e.g. Hannaford & Resh 1999; Kelleway 2005). They can also compress and rut soft, wet soils, affecting storage and flow of water which in turn affects vegetation. Waves created by boats and jet skis can increase erosion of lake and sea shores (Bilkovic et al. 2017). Vehicles could be physically excluded from pristine marshes and swamps to prevent damage, or from damaged areas to let them recover. Physical barriers could be fences, fallen trees or areas of water/wet ground.
Related interventions: Restrict vehicle use, using non-physical means such as signs or voluntary codes (7.1).
Bilkovic D., Mitchell M., Davis J., Andrews E., King A., Mason P., Herman J., Tahvildari N. & Davis J. (2017) Review of Boat Wake Wave Impacts on Shoreline Erosion and Potential Solutions for the Chesapeake Bay. STAC Publication Number 17-002.
Hannaford M.J. & Resh V.H. (1999) Impact of all-terrain vehicles (ATVs) on pickleweed (Salicornia virginica L.) in a San Francisco Bay wetland. Wetlands Ecology and Management, 7, 225–233.
Kelleway J. (2005) Ecological impacts of recreational vehicle use on saltmarshes of the Georges River, Sydney. Wetlands Australia, 22, 52–66.
7.3 Build barriers to protect littoral areas from boat wakes
We found no studies that evaluated the effects, on vegetation, of building barriers to protect littoral marshes or swamps from boat wakes.
This means that we have not yet found any studies that have directly evaluated this intervention during our systematic journal and report searches. Therefore we have no evidence to indicate whether or not the intervention has any desirable or harmful effects.

7. Threat: Human intrusions and disturbance
93
Background
Littoral marshes and swamps (i.e. on sea or lake shores) are vulnerable to erosion and physical damage from boat and jet ski wakes – especially when this activity is regular, concentrated and close to the shore (Bilkovic et al. 2017). Barriers between focal marshes or swamps and the main water body may help to diffuse energy. Barriers might be dykes, walls, breakwaters, reefs, or even created marshes or swamps!
Related interventions: Use artificial barriers to block pollution (10.5); Build barriers to protect littoral marshes or swamps from rising water levels and severe weather (11.2); Use fences or barriers to protect planted areas (13.19).
Bilkovic D., Mitchell M., Davis J., Andrews E., King A., Mason P., Herman J., Tahvildari N. & Davis J. (2017) Review of Boat Wake Wave Impacts on Shoreline Erosion and Potential Solutions for the Chesapeake Bay. STAC Publication Number 17-002.
7.4 Restrict pedestrian access
We found no studies that evaluated the effects, on vegetation, of restricting pedestrian access to marshes or swamps.
This means that we have not yet found any studies that have directly evaluated this intervention during our systematic journal and report searches. Therefore we have no evidence to indicate whether or not the intervention has any desirable or harmful effects.
Background
Walking on marshes or swamps can damage their vegetation, soils and hydrology (e.g. Ross 2006; Woolfolk 1999). Pedestrians are a particular problem when they repeatedly walk on the same area e.g. in popular tourist sites, or when scientists make repeat visits to sample plots. To prevent this damage, pedestrian access to marshes and swamps could be reduced by interventions such as legislation, limits on visitor numbers, voluntary codes, signage and/or ensuring official paths are well maintained.
Related interventions: Physically exclude pedestrians (7.5); Install boardwalks/paths to prevent trampling (7.6).
Ross P.M. (2006) Macrofaunal loss and microhabitat destruction: the impact of trampling in a temperate mangrove forest, NSW Australia. Wetlands Ecology and Management, 14, 167–184.
Woolfolk A.M. (1999) Effects of human trampling and cattle grazing on salt marsh assemblages in Elkhorn Slough, California. Masters Thesis, California State University, USA.
7.5 Physically exclude pedestrians
We found no studies that evaluated the effects, on vegetation, of physically excluding pedestrians from marshes or swamps.
This means that we have not yet found any studies that have directly evaluated this intervention during our systematic journal and report searches. Therefore we have no evidence to indicate whether or not the intervention has any desirable or harmful effects.
Background
Walking on marshes or swamps can damage their vegetation, soils and hydrology (e.g. Ross 2006; Woolfolk 1999). This is a particular problem when the same area is
7. Threat: Human intrusions and disturbance
94
repeatedly crossed e.g. in popular hiking areas, in tourist sites/nature reserves, or when scientists make repeat visits to sample plots. Pedestrians could be physically excluded from pristine areas to prevent damage, or from degraded areas to let them recover. Physical barriers could be fences, fallen trees or water/wet ground.
Related interventions: Restrict pedestrian access, using non-physical means such as signs or voluntary codes (7.4); Install boardwalks/paths to prevent trampling (7.6).
Ross P.M. (2006) Macrofaunal loss and microhabitat destruction: the impact of trampling in a temperate mangrove forest, NSW Australia. Wetlands Ecology and Management, 14, 167–184.
Woolfolk A.M. (1999) Effects of human trampling and cattle grazing on salt marsh assemblages in Elkhorn Slough, California. Masters Thesis, California State University, USA.
7.6 Install boardwalks/paths to prevent trampling
We found no studies that evaluated the effects, on vegetation, of installing boardwalks or paths to prevent trampling in marshes or swamps.
This means that we have not yet found any studies that have directly evaluated this intervention during our systematic journal and report searches. Therefore we have no evidence to indicate whether or not the intervention has any desirable or harmful effects.
Background
Walking on marshes or swamps can damage their vegetation, soils and hydrology (e.g. Ross 2006; Woolfolk 1999). Pedestrians are a particular problem when they repeatedly walk on the same area e.g. in popular hiking areas, in tourist sites/nature reserves, or when scientists repeatedly visit sample plots. Installing boardwalks or designated paths can prevent physical contact with the marsh or swamp (Vickery 1995) – assuming people stay on them.
CAUTION: Preservatives leaching from timber may harm vegetation and wildlife. Boardwalks will also shade and kill the vegetation beneath. Paths can compress sediments and alter water flow patterns, above and below the wetland surface.
Related interventions: Restrict pedestrian access (7.4); Physically exclude pedestrians (7.5).
Ross P.M. (2006) Macrofaunal loss and microhabitat destruction: the impact of trampling in a temperate mangrove forest, NSW Australia. Wetlands Ecology and Management, 14, 167–184.
Vickery J. (1995) Access. Pages 42–58 in: W.J. Sutherland & D.A. Hill (eds.) Managing Habitats for Conservation. Cambridge University Press, Cambridge.
Woolfolk A.M. (1999) Effects of human trampling and cattle grazing on salt marsh assemblages in Elkhorn Slough, California. Masters Thesis, California State University, USA.
7.7 Adopt ecotourism principles/create an ecotourism site
We found no studies that evaluated the effects, on marsh/swamp vegetation, of adopting ecotourism principles or creating an ecotourism site.
This means that we have not yet found any studies that have directly evaluated this intervention during our systematic journal and report searches. Therefore we have no evidence to indicate whether or not the intervention has any desirable or harmful effects.

7. Threat: Human intrusions and disturbance
95
Background
Tourists may visit marshes and swamps for many reasons, from hiking to biking, skiing, viewing wild animals, photography and relaxation. Tourist visits could be managed with conservation or natural and cultural resources in mind: minimizing damage from tourist activities, educating both staff and visitors, and providing financial resources to conserve natural areas (Ramsar 2012; The International Ecotourism Society 2017). “Voluntourists” – who help with research or conservation activities as part of their tourist experience – can help to collect scientific data and provide a source of income. Ecotourism principles could be adopted by existing tourist sites, or new ecotourism sites could be created.
Ecotourism activities should be carried out sustainably, for example minimizing impact by trampling (Section 7.4) and employing biosecurity measures to prevent the introduction of non-native species (Section 9.1). When developing a site aimed at foreign tourists, impacts on local communities should be considered.
To be summarized as evidence for this intervention, studies must have monitored vegetation within ecotourism sites, with a comparison to the situation before ecotourism principles were adopted or to sites not managed under ecotourism principles. This intervention does not include (a) studies that monitor plant populations or only within ecotourism sites, or (b) studies reporting visitor numbers, economic performance or perceived value of ecotourism sites.
Related interventions: specific interventions to limit damage from tourist activities (7.1–7.6); habitat protection interventions (Chapter 14); education and awareness-raising interventions, for tourists or local communities, which may form part of ecotourism programmes (Chapter 15).
Ramsar (2012) Ramsar (2012) Wetland Tourism: A Great Experience. Available at https://www.ramsar.org/sites/default/files/documents/library/ramsar-wwd2012-leaflet-en.pdf. Accessed 4 February 2020.
The International Ecotourism Society (2017) What is Ecotourism? Available at http://www.ecotourism.org/ what-is-ecotourism. Accessed 1 August 2017.

96
8. Threat: Natural system modifications
Background
This chapter considers interventions to counter the threat from human management of marshes and swamps that alters natural or semi-natural processes, and has led or may lead to degradation of vegetation. Marshes and swamps can suffer when there is too much or too little water, fire or other disturbance. They may also be sensitive to the timing of flooding, droughts, burning and other disturbances.
Marshes and swamps may be excessively flooded due to impoundment, dam construction, runoff from irrigation, or mismanagement (e.g. permanent flooding of ephemeral marshes). Marshes and swamps may be drained to grow crops, to build infrastructure such as roads, to control pests such as mosquitoes, to manage flood risks, or as part of political/military tactics (e.g. Mesopotamian Marshes, Iraq in the early 1990s; Human Rights Watch 2003). They might also become drier as a result of water extraction elsewhere in the catchment, which lowers the water table (e.g. Macquarie Marshes, Australia; Berney & Hosking 2016). Finally, water levels may be stabilized (e.g. construction of dams on rivers might remove or reduce flooding of riparian areas). If there is too much or too little water, or water is not present at the right time, emergent wetland vegetation will not survive. Water supply may also be closely linked to sediment supply: an important source of substrate and nutrients in marshes and swamps (Wang et al. 2011).
Disturbance is a key factor controlling wetland type and plant community composition (Keddy 2010). Disturbance can be natural (e.g. wildfire, floods, grazing by wild animals) or artificial (e.g. prescribed burning, mowing, grazing by livestock). Disturbance can clear dominant species, create space for other plants to grow and prevent a build-up of nutrients. Regular disturbance can maintain habitat structure and species richness/diversity (Middleton 2013). However, too much or too little disturbance can lead to undesirable changes. Management of wetlands may involve maintenance, restoration or reduction of disturbance to produce a desired plant community or physical structure.
Fire is an important disturbance in some marshes and swamps, whether it occurs naturally (Sutter & Kral 1994) or is prescribed by humans (Middleton 2013). Fire suppression could be compensated by any of the aforementioned interventions, including prescribed burning. However, excessive fire (too frequent, too intense) can also damage marshes or swamps. Fires within these habitats can directly damage the vegetation, soil structure and ecosystem functions such soil formation (Nyman & Chabreck 1995; Kotze 2013). Fires in the watershed can affect the water quality in focal marshes or swamps (Pinel-Alloul et al. 2002). This chapter also considers interventions to counter excess or unseasonal fire.
Some interventions in this chapter are similar to those in Chapter 9 (e.g. cutting/mowing, grazing, prescribed burning). Chapter 8 considers use of these interventions to maintain, restore, or compensate for the loss of a regular disturbance regime. Chapter 9 considers use of these interventions to tackle problematic vegetation whose success is not clearly or primarily linked to a change in disturbance regime.

8. Threat: Natural system modifications
97
Related chapters: Threat: Residential and commercial development (Chapter 2) and Threat: Agriculture and aquaculture (Chapter 3), which deal with conversion of marshes and swamps to other land use types, rather than changing management within them; Threat: Invasive and other problematic species, which have not clearly benefited from a change to a historical disturbance regime (Chapter 9); Habitat restoration and creation (Chapter 12); Education and awareness-raising, including to prevent wild fires (Chapter 15).
Berney P. & Hosking T. (2016) Opportunities and challenges for water-dependent protected area management arising from water management reform in the Murray-Darling Basin: a case study from the Macquarie Marshes in Australia. Aquatic Conservation: Marine and Freshwater Ecosystems, 26(S1), 12–28.
Human Rights Watch (2003) The Iraqi Government Assault on the Marsh Arabs. Available at https://www.hrw.org/legacy/backgrounder/mena/marsharabs1.pdf. Accessed 22 January 2020.
Keddy P.A. (2010) Wetland Ecology: Principles and Conservation, Second Edition. Cambridge University Press, Cambridge, UK.
Kotze D.C. (2013) The effects of fire on wetland structure and functioning. African Journal of Aquatic Science, 38, 237–247.
Middleton B.A. (2013) Rediscovering traditional vegetation management in preserves: trading experiences between cultures and continents. Biological Conservation, 158, 271–279.
Nyman J.A. & Chabreck R.H. (1995) Fire in coastal marshes: history and recent concerns. Pages 134–141 in: S.I. Cerulean & R.T. Engstrom (eds.) Fire in Wetlands: A Management Perspective. Proceedings of the Tall Timbers Fire Ecology Conference No 19. Tall Timbers Research Station, Tallahassee, USA.
Pinel-Alloul B., Prepas E., Planas D., Steedman R. & Charette T. (2002) Watershed impacts of logging and wildfire: case studies in Canada. Lake and Reservoir Management, 18, 307–318.
Sutter R.D. & Kral R. (1994) The ecology, status, and conservation of two non-alluvial wetland communities in the South Atlantic and Eastern Gulf coastal plain, USA. Biological Conservation, 235–243.
Wang J.-J., Lu X.X. & Kummu M. (2011) Sediment load estimates and variations in the Lower Mekong River. River Research and Applications, 27, 33–46.
Modified water management
8.1 Raise water level to restore degraded marshes or swamps
Background
This intervention involves one-off action to raise the water level/table in degraded marshes or swamps, to a depth that should support emergent vegetation. This means that intervention should (a) occur at one point in time, after which the water level is not actively managed, and (b) must affect a marsh or swamp that is drier than normal, but that is still recognizable as, or retains substantial characteristics of, the target habitat.
Specific techniques to raise water levels include: blocking drainage ditches (using sediment, rocks, plastic dams, wooden dams or vegetation); building raised embankments, berms or levees to retain water; switching off drainage pumps; ceasing groundwater extraction; installing or widening culverts (e.g. under roads and railways, to increase water flow into focal site); removing dams upstream of the focal site; and reprofiling or diverting river channels to raise the water level on floodplains. All of these techniques aim to make soils saturated or flooded, or make them saturated or flooded for longer, so they can support emergent wetland vegetation. The resulting water level may be stable or fluctuating, and may create permanently or seasonally flooded wetlands. Sediment inputs may also increase in line with water inputs.

8. Threat: Natural system modifications
98
CAUTION: This intervention may have negative effects on habitats elsewhere in the catchment. For example, removing dams upstream of a focal site could drain wetlands or aquatic habitats upstream of the dam. There may also be conflicts with water needs of human populations that need to be managed.
Related interventions: Raise water level to restore/create marshes or swamps from other land uses (12.4); Actively manage water level (8.4); Manage water level to control problematic plants (9.6); Reprofile/relandscape (12.9) or Remove surface soil/sediment (12.11), both of which can lower the ground surface towards the water table; Raise water level to complement planting (13.1); Restore/create marshes or swamps using multiple interventions, often including water level manipulations (12.2).
8.1.1 Raise water level to restore degraded freshwater marshes
Five studies evaluated the effects, on vegetation, of raising the water level to restore degraded freshwater marshes. There were three studies in the USA1,3,5 and one in each of the Netherlands2 and Japan4.
VEGETATION COMMUNITY
Overall extent (1 study): One before-and-after study of a floodplain in Japan4 reported that the area covered by marsh vegetation was higher five years after dechannelizing a river than 10 years before.
Community types (1 study): One before-and-after study of a floodplain in Japan4 reported changes in the area covered by different marsh plant communities over five years after dechannelizing a river compared to 10 years before.
Community composition (1 study): One replicated study of dune slacks in the Netherlands2 reported changes in the overall plant community composition after stopping groundwater extraction (along with other interventions).
Overall richness/diversity (2 studies): One replicated, site comparison study of dune slacks in the Netherlands2 reported that overall plant species richness was greater in restored slacks (groundwater extraction stopped five years previously, along with other interventions) than in mature unmanaged slacks. One replicated, before-and-after study of floodplain marshes in the USA3 reported that total plant species richness tended to be lower over nine years after raising the water table than before, but that there was no significant difference for diversity.
Characteristic plant richness/diversity (1 study): One replicated study of dune slacks in the Netherlands2 simply quantified the richness of characteristic plant species – typical of dune slacks or nutrient-rich marshes – over five years after stopping groundwater extraction (along with other interventions).
VEGETATION ABUNDANCE
Overall abundance (3 studies): One replicated, before-and-after study of floodplain marshes in the USA3 reported that total vegetation cover tended to be lower over nine years after raising the water table than before. One replicated, randomized, paired, controlled, before-and-after study of freshwater marshes in the USA5 found that damming to raise the water table prevented increases in understory vegetation cover over the following year. One replicated study of dune slacks in the Netherlands2 simply quantified total vegetation over five years after stopping groundwater extraction (along with other interventions). Cover never exceeded 50%.
Herb abundance (1 study): One replicated, randomized, paired, controlled, before-and-after study of freshwater marshes in the USA4 found that damming to raise the water table had no

8. Threat: Natural system modifications
99
significant effect on cover of sedges Carex spp. There were similar increases in dammed and undammed marshes over one year.
Characteristic plant abundance (1 study): One replicated, before-and-after study of floodplain marshes in the USA3 reported changes in the cover of wetland- and habitat-characteristic plant species over nine years after raising the water table.
Individual species abundance (3 studies): Three studies1–3 quantified the effect of this intervention on the abundance of individual plant species. For example, one replicated, before-and-after study in the USA3 reported that rewetted floodplain marshes became dominated by a non-native wetland shrub, approximately 4–9 years after raising the water table. One replicated study of a freshwater wetland in the USA1 reported that the effects of reflooding on the density of emergent plant species depended on the species and water level.
VEGETATION STRUCTURE
A replicated study in 1949–1957 in a freshwater wetland in Minnesota, USA (1) reported that the effects of reflooding on emergent plant abundance depended on the water level and species. Statistical significance was not assessed. In areas with deep water (>15 inches in summer, after reflooding), the density of all emergent plant species declined (e.g. softstem bulrush Scirpus validus: 7.1 stems/ft2 after 1 year of reflooding then 0 stems/ft2 after four years of reflooding; cattails Typha spp.: 0.8 stems/ft2 vs 0.4 stems/ft2). In areas with shallow water (0–10 inches in summer, after reflooding), the density of softstem bulrush and spikesedge Eleocharis palustris declined (9.6–10.3 stems/ft2 after one year vs 0.1–0.3 stems/ft2 after four years) whilst the density of cattails and sedges Carex spp. increased (1.0–1.5 stems/ft2 vs 2.2–2.5 stems/ft2). Methods: At some point between 1949 and 1957, water levels were raised in four separate wetland pools that had been drawn down for the previous 1–5 years. Vegetation was surveyed between one and four years after reflooding, in stands initially dominated by each plant species but with different post-reflooding water depths.
A replicated, site comparison study in 1993–1998 involving 12 dune slacks in the Netherlands (2) reported that after stopping groundwater extraction (along with removing topsoil and resuming grazing), the slacks developed plant communities with habitat-characteristic species, and more species than mature, unmanaged slacks. Statistical significance was not assessed. Restored slacks developed plant communities, the overall composition of which changed over time (data reported as a graphical analysis). After five years, restored slacks contained 76–108 plant species overall and 48–86 species/100 m2. This included species characteristic of dune slacks (5–11 species/100 m2) and nutrient-rich marshes (2–11 species/100 m2) alongside other wetland and upland species. In each slack, total vegetation cover was always <50% and only two individual species – creeping willow Salix repens and bushgrass Calamagrostis epigejos – ever had cover >1%. For comparison, during the second year of the study, mature slacks contained 12–39 plant species/m2 (data not reported for other outcomes). Methods: Dune slacks are low-lying areas amongst dunes. Eight degraded slacks (stabilized and covered with undesirable, mature vegetation) were restored. In 1993, groundwater extraction was stopped. Vegetation and topsoil were also stripped, completely or partially, from each slack. In 1995, grazers (a “small herd” of cattle and ponies) were reintroduced to seven slacks. The study does not distinguish between the effects of these interventions. Vegetation was surveyed in at least five of the restored slacks (spring or summer 1994–1998) and four mature slacks (spring 1994): species across the whole of each slack; species and cover in five comparable 100-m2 plots/slack.

8. Threat: Natural system modifications
100
A replicated, before-and-after study in 1998–2008 of two marshes on a floodplain in Florida, USA (3) reported that raising water levels by filling drainage/ flood control channels had mixed effects on cover of plant groups, but consistently reduced overall plant species richness and vegetation cover. Unless specified, results summarized for this study are not based on assessments of statistical significance. Before intervention, both marshes were dominated by wetland-characteristic grasses (24–52% cover) with some vegetation characteristic of broadleaf marshes (12–30% cover). Over the first 4–6 years after raising water levels, one marsh remained dominated by wetland-characteristic grasses (18–50% cover). The other became dominated by broadleaf marsh vegetation (11–68% cover). In subsequent years, both marshes were dominated by a mix of Peruvian water primrose Ludwigia peruviana (9–70%) and broadleaf marsh vegetation (4–34% cover). Total vegetation cover and species richness were variable over time, but often lower after intervention (49–97% cover; 7–20 species/100 m2) than before (77–93% cover; 16–26 species/100 m2). Plant diversity was statistically similar before and after intervention in both marshes (data not reported). Methods: Between 1999 and 2001, the water level was raised in two degraded marshes in Sections A and C of the Kissimmee River floodplain. This was achieved by “eliminating” a drainage ditch (one marsh) and dechannelizing the river (other marsh). Plant species and their cover were surveyed before intervention (from summer 1998) and for approximately seven years after (until summer 2008), in three 100-m2 plots/marsh.
A before-and-after study in 1999–2011 of a floodplain in Hokkaido, Japan (4) reported that following restoration of the natural meandering river course, the area of emergent herbaceous vegetation increased. Statistical significance was not assessed. Marshes covered approximately 50 ha of the floodplain around 10 years before restoration began, then 77 ha around five years after restoration began. More specifically, there were increases in the area of stands dominated by knotweed Polygonum thunbergii (before: 0 ha; after: 36 ha) and stands dominated by common rush Juncus effusus (before: 0 ha; after: 9 ha) – mostly in a recently (<9 months old) relandscaped area. In contrast, there were decreases the area of mixed common reed Phragmites australis and sedge Carex spp. stands (before: 27 ha; after: 19 ha) and wet meadows dominated by reed canarygrass Phalaris arundinacea (before: 22 ha; after: 13 ha). Methods: The Kushiro River was channelized and straightened in the 1970s. Between 2007 and 2011, its natural course was restored (2007–2010: former meandering channel excavated and reflooded; 2011: flood embankments removed and straightened section backfilled). Flooding frequency increased in the surrounding floodplain, and the water table rose to near the ground surface. Vegetation was mapped before (1999) and after (2011) restoration, from aerial photographs and with field surveys.
A replicated, randomized, paired, controlled, before-and-after study in 2011–2012 of marshes within a pine forest in North Carolina, USA (5) found that damming to raise the water table limited understory vegetation cover, but had no significant effect on sedge cover. In rewetted plots, there was no change in total understory vegetation cover (42% one month before thinning and 42% one year after). However, in plots that remained drained, understory vegetation cover increased (from 35 to 58%). Total sedge Carex spp. cover increased by statistically similar amounts in rewetted plots (from 11 to 17%) and drained plots (from 6 to 15%). Methods: In May 2011, sixteen 30 x 30 m plots were established (in four blocks of four) on tree-colonized marshes within a pine forest. Maintenance of open marsh had been

8. Threat: Natural system modifications
101
restricted by fire suppression and the extirpation of beavers Castor canadensis. Dams were installed on the downstream edge of eight plots (two/block), raising the water table. About a third of each plot was flooded. The other eight plots remained drained. Trees were also thinned in four rewetted and four drained plots. Vegetation cover was visually estimated one month before (April 2011) and one year after (April 2012) intervention.
(1) Harris S.W. & Marshall W.H. (1963) Ecology of water-level manipulations on a northern marsh. Ecology, 44, 331–343.
(2) Grootjans A.P., Everts H., Bruin K. & Fresco L. (2001) Restoration of wet dune slacks on the Dutch Wadden Sea islands: recolonization after large-scale sod cutting. Restoration Ecology, 9, 137–146.
(3) Toth L.A. (2010) Restoration response of relict broadleaf marshes to increased water depths. Wetlands, 30, 263–274.
(4) Nakamura F., Ishiyama N., Sueyoshi M., Negishi J. & Akasaka T. (2014) The significance of meander restoration for the hydrogeomorphology and recovery of wetland organisms in the Kushiro River, a lowland river in Japan. Restoration Ecology, 22, 544–554.
(5) Aschehoug E.T., Sivakoff F.S., Cayton H.L., Morris W.F. & Haddad N.M. (2015) Habitat restoration affects immature stages of a wetland butterfly through indirect effects on predation. Ecology, 96, 1761–1767.
8.1.2 Raise water level to restore degraded brackish/salt marshes
Two studies evaluated the effects, on vegetation, of raising the water level to restore degraded brackish/salt marshes. One study was in the Netherlands1 and one was in Tunisia2.
VEGETATION COMMUNITY
Community types (2 study): One before-and-after study of a lakeshore brackish/salt marsh in Tunisia2 reported an increase in coverage of bulrush-dominated vegetation relative to salt marsh vegetation over three years after modifying a canal to retain water in the marsh. One study of a salt marsh in the Netherlands1 reported increased coverage of pioneer succulent plant communities, and reduced coverage of short-grass communities, over approximately 10 years following abandonment of the drainage system (along with other interventions).
Overall richness/diversity (1 study): One study of a salt marsh in the Netherlands1 reported that overall plant species richness increased over 14 years after abandoning drainage systems (along with other interventions).
VEGETATION ABUNDANCE
Individual species abundance (1 study): One study of a salt marsh in the Netherlands1 reported that some individual plant species became more common over 14 years after abandoning drainage systems (along with other interventions). These included saltbush Atriplex prostrata and seablite Suaeda maritima. Some other species became less common, including creeping bentgrass Agrostis stolonifera and common cordgrass Spartina anglica.
VEGETATION STRUCTURE
A study in 1981–1997 of a salt marsh in the Netherlands (1) found that following abandonment of drainage systems from 1981 (along with legal protection and a reduction in grazing intensity), there were changes in the area of plant community types and the abundance of some dominant species, and an increase in plant species richness. Between 1981 and 1995, the area covered by pioneer succulents increased (from 0% to 19% of the marsh) and the area covered by short-grass communities decreased (from 76% to 56%). Statistical significance of these cover results was not

8. Threat: Natural system modifications
102
assessed. Between 1983 and 1997, the frequency of two of the most abundant plant species did not significantly change: saltmarsh grass Puccinellia maritima (1983: present in 81% of plots; 1997: present in 84% of plots) and sea aster Aster tripolium (1983: 80%; 1997: 97%). Species showing significant changes in frequency included saltbush Atriplex prostrata (increase from 86% to 98%), seablite Suaeda maritima (increase from 38% to 70%), creeping bentgrass Agrostis stolonifera (decrease from 78% to 69%) and common cordgrass Spartina anglica (decrease from 52% to 31%). Between 1983 and 1997, plant species richness significantly increased: from 8 species/100 m2 to 10 species/100 m2. Methods: A degraded coastal salt marsh became part of a nature reserve in 1981. The drainage system was abandoned by 1984 (making the soils wetter and less aerated), and cattle grazing intensity was gradually reduced (reaching 40–80 animal days/ha/season by the 1990s). Note that this study evaluates the combined effect of these interventions. Coverage of vegetation types was calculated from maps of the marsh made in 1981 and 1995. Plant species presence and cover were surveyed in 64 permanent 100-m2 plots, spread across four parts of the marsh and at a range of elevations, in 1983, 1991 and 1997.
A before-and-after study in 2005–2011 of a lakeshore brackish/saline marsh in Tunisia (2) reported that after building dams and embankments along a canal to raise the water level in the marsh, the ratio of bulrush-dominated vegetation to salt-marsh vegetation increased. In 2005, after three years of freshwater releases from upstream dams to restore winter flooding, the marsh contained 241 ha of vegetation dominated by bulrush Bolboschoenus glaucus, and 468 ha of salt marsh communities (dominated by glasswort Sarcocornia fruticosa and sea barley Hordeum marinum) – a ratio of 0.5:1. Between 2008 and 2011, after modifying a canal within the marsh to hold back water (dams inserted, and arrays of embankments built perpendicular to the canal) along with continued freshwater releases, the area of bulrush-dominated vegetation increased from 0.5:1 (193:399 ha) to 1:1 (298:296 ha). Methods: Between 2005 and 2011, vegetation in the lakeshore Joumine Marsh was mapped using field surveys and satellite images.
(1) Esselink P., Frescok L.F.M. & Dijkema K.S. (2002) Vegetation change in a man-made salt marsh affected by a reduction in both grazing and drainage. Applied Vegetation Science, 5, 17–32.
(2) Ouali M., Daoud-Bouattour A., Etteieb S., Gammar A.M., Ben Saad-Limam S. & Ghrabi-Gammar Z. (2014) Le marais de Joumine, Parc National de l’Ichkeul, Tunisie: diversité floristique, cartographie et dynamique de la végétation (1925–2011) [Joumine Marsh, National Park of Ichkeul, Tunisia: floristic diversity, vegetation mapping and dynamics (1925–2011)]. Revue d'Écologie (Terre et Vie), 69, 3–23.
8.1.3 Raise water level to restore degraded freshwater swamps
We found no studies that evaluated the effects, on vegetation, of raising the water level to restore degraded freshwater swamps.
This means that we have not yet found any studies that have directly evaluated this intervention during our systematic journal and report searches. Therefore we have no evidence to indicate whether or not the intervention has any desirable or harmful effects.
8.1.4 Raise water level to restore degraded brackish/saline swamps
We found no studies that evaluated the effects, on vegetation, of raising the water level to restore degraded brackish/saline swamps.
This means that we have not yet found any studies that have directly evaluated this intervention during our systematic journal and report searches. Therefore we have no evidence to indicate whether or not the intervention has any desirable or harmful effects.

8. Threat: Natural system modifications
103
8.2 Lower water level to restore degraded marshes or swamps
Background
This intervention involves one-off action to lower the water level in degraded marshes or swamps, to a depth that should support emergent vegetation. This means that intervention should (a) occur at one point in time, after which the water level is not actively managed, and (b) must affect a marsh or swamp that is wetter than normal, but is still recognizable as, or retains substantial characteristics of, the target habitat. Specific techniques to reduce water levels include removing dams downstream, switching off pumps that add water to a focal site, and improving drainage by digging shallow “runnels” or deeper creeks (Wigand et al. 2017).
CAUTION: This intervention may have negative effects on habitats elsewhere in the catchment. For example, removing dams could flood marshes, swamps or upland habitats downstream. There may also be conflicts with water needs of human populations that need to be managed.
Related interventions: Lower water level to restore/create marshes or swamps from other land uses (12.5); Backfill canals or trenches (5.1); Actively manage water level (8.4); Manage water level to control problematic plants (9.6); Reprofile/relandscape, may involve raising the ground surface towards or above the water table (12.9); Lower water level to complement planting (13.2).
Wigand C., Ardito T., Chaffee C., Ferguson W., Paton S., Raposa K., Vandemoer C. & Watson E. (2017) A climate change adaptation strategy for management of coastal marsh systems. Estuaries and Coasts, 40, 682–693.
8.2.1 Lower water level to restore degraded freshwater marshes
Two studies evaluated the effects, on vegetation, of lowering the water level to restore degraded freshwater marshes. One study was in the USA1 and one was in Canada2.
VEGETATION COMMUNITY
Overall extent (1 study): One before-and-after study of a lakeshore marsh in the USA1 reported that following a drawdown of water levels, emergent vegetation coverage increased in areas that were previously open water.
Community types (1 study): One replicated, controlled, before-and-after study of freshwater marshes in Canada2 reported changes in the area of some vegetation classes over three years of partial drawdown. There was a temporary increase in coverage of dead vegetation at the expense of some live vegetation classes. Two classes – horsetail-dominated and bur-reed-dominated – had greater coverage after three years of drawdown than before.
VEGETATION ABUNDANCE
VEGETATION STRUCTURE
A before-and-after study in 1993–1996 of a lakeshore marsh in Ohio, USA (1) reported that over a year of drawdown, the area of emergent vegetation increased. In 1993, two years before drawdown, the marsh was mostly open water with only 10% covered by emergent vegetation stands. In 1996, after approximately one year of drawdown but before any other interventions were carried out, 73% of the marsh was covered by emergent vegetation stands. Colonizing vegetation included several

8. Threat: Natural system modifications
104
herbaceous wetland species, wind-dispersed woody species, and some upland herbs (not quantified). Methods: In 1995, an embankment was constructed across the mouth of Metzger Marsh to replace a natural barrier beach that had disappeared in the 1970s. The embankment separated the marsh from Lake Erie and caused a decline (drawdown) of the water level in the marsh. Vegetation was surveyed before (1993) and after (1996) drawdown (further details not reported).
A replicated, controlled, before-and-after study in 2007–2010 of six freshwater marshes in Manitoba, Canada (2) found that a partial but long-term drawdown of the water level affected the area covered by some marsh vegetation classes. In marshes where the water level was drawn down, there was significant variation over time in the coverage of five vegetation classes. There was an initial decline followed by recovery in the area of vegetation dominated by sedges Carex spp. (before: 141 ha; after one year: 103 ha; after three years: 127 ha), cattails Typha spp. (111 ha; 69 ha; 98 ha) and horsetails Equisetum spp. (9 ha; 2 ha; 20 ha). Coverage of dead vegetation showed the opposite pattern (15 ha; 80 ha; 13 ha). Coverage of vegetation dominated by bur-reeds Sparganium spp. increased steadily over time (<1 ha; 2 ha; 7 ha). There was no significant change over time in the coverage of other vegetation classes, including trees (see original paper for data). In marshes that were not drawn down, the area of all vegetation classes was stable over time (see original paper for data). Methods: This study focused on six 84–207 ha marshes within one wetland complex. From August 2007, the water level was lowered in three marshes (average depth: 30 cm; maximum depth: 60 cm) using water control structures. This level was maintained over the entire study period. In the other three marshes, the water level remained unnaturally high (average: 67 cm; maximum: 100 cm). The coverage of vegetation types was measured from satellite images, taken in the summer before (2007) and for three years after (2008–2010) drawdown.
(1) Wilcox D.A. & Whillans T.H. (1999) Techniques for restoration of disturbed coastal wetlands of the Great Lakes. Wetlands, 19, 835–857.
(2) Baschuk M.S., Ervin M.D., Clark W.R., Armstrong L.M., Wrubelski D.A. & Goldsborough G.L. (2012) Using satellite imagery to assess macrophyte response to water-level manipulations in the Saskatchewan River Delta, Manitoba. Wetlands, 32, 1091–1102.
8.2.2 Lower water level to restore degraded brackish/salt marshes
We found no studies that evaluated the effects, on vegetation, of lowering the water level to restore degraded brackish/salt marshes.
This means that we have not yet found any studies that have directly evaluated this intervention during our systematic journal and report searches. Therefore we have no evidence to indicate whether or not the intervention has any desirable or harmful effects.
8.2.3 Lower water level to restore degraded freshwater swamps
We found no studies that evaluated the effects, on vegetation, of lowering the water level to restore degraded freshwater swamps.
This means that we have not yet found any studies that have directly evaluated this intervention during our systematic journal and report searches. Therefore we have no evidence to indicate whether or not the intervention has any desirable or harmful effects.
8.2.4 Lower water level to restore degraded brackish/saline swamps

8. Threat: Natural system modifications
105
We found no studies that evaluated the effects, on vegetation, of lowering the water level to restore degraded brackish/saline swamps.
This means that we have not yet found any studies that have directly evaluated this intervention during our systematic journal and report searches. Therefore we have no evidence to indicate whether or not the intervention has any desirable or harmful effects.
8.3 Facilitate tidal exchange to restore degraded marshes or
swamps
Background
This intervention involves action to facilitate tidal exchange to degraded marshes or swamps (i.e. still recognizable as, or retaining substantial characteristics of, the target habitat). The action could be a single permanent one (e.g. breaching sea walls or embankments, installing or widening culverts, excavating tidal creeks) or a reversible one (e.g. opening sluice gates once per day). Facilitating tidal exchange can affect multiple properties of a site: it can raise moisture levels, raise or reduce salinity, increase physical disturbance, and increase supplies of sediment and wetland plant propagules.
Tidal wetlands may be brackish/saline (e.g. mangroves, coastal marshes) or freshwater (e.g. at the upstream end of estuaries, as in the Mississippi, Yangtze, and Elbe rivers; Baldwin et al. 2009).
Studies of accidental restoration of tidal exchange, such as when coastal defences are breached by a storm, have not been summarized as evidence.
Related interventions: Facilitate tidal exchange to restore/create marshes or swamps from other land uses (12.6); Add salt to control problematic plants (9.7); Reprofile/ relandscape (12.9) or Remove surface soil/sediment (12.11), both of which can alter patterns of tidal exchange.
Baldwin A.H., Barendregt A. & Whigham D. (2009) Tidal Freshwater Wetlands. Backhuys Publishers, Leiden.
8.3.1 Facilitate tidal exchange to restore degraded freshwater marshes
We found no studies that evaluated the effects, on vegetation, of facilitating tidal exchange to restore degraded freshwater marshes.
This means that we have not yet found any studies that have directly evaluated this intervention during our systematic journal and report searches. Therefore we have no evidence to indicate whether or not the intervention has any desirable or harmful effects.
8.3.2 Facilitate tidal exchange to restore degraded brackish/salt marshes
Seven studies evaluated the effects, on vegetation, of facilitating tidal exchange to restore degraded brackish/salt marshes. Six studies1–4,6,7 were in the USA. One study5 included sites in both the USA and Canada.
VEGETATION COMMUNITY
Overall extent (1 study): One before-and-after study in the USA1 reported that over 10 years after improving tidal exchange in a degraded marsh, the area of salt marsh vegetation increased – but not quite to historical, pre-degradation levels.

8. Threat: Natural system modifications
106
Community types (1 study): One before-and-after study in the USA1 reported that 3–10 years after improving tidal exchange in a degraded marsh, the area of salt marsh community types differed from historical, pre-degradation levels.
Community composition (3 studies): Three before-and-after studies in the USA3,4,6 found that in the four years after improving tidal exchange in degraded brackish/salt marshes, the overall plant community composition significantly differed to that present before intervention. However, in one of the studies6 this was only true in one of two marshes (the most degraded before intervention). One of the studies3 also reported that the overall plant community composition became more similar to adjacent natural brackish/salt marshes over two growing seasons after intervention.
Overall richness/diversity (1 study): One replicated, before-and-after, site comparison study in the USA/Canada5 found that overall plant species richness was similar in ≥3-year-old tidally restored salt marshes and nearby natural salt marshes. However, there was also no significant difference between degraded marshes (before tidal restoration) and the natural marshes.
Characteristic plant richness/diversity (1 study): One study of a coastal marsh in the USA2 reported that over three years after restoring tidal exchange (along with a prescribed burn), the number of salt-tolerant plant species increased, whilst the number of freshwater plant species decreased.
VEGETATION ABUNDANCE
Overall abundance (1 study): One replicated, site comparison study of salt marshes in the USA7 found that tidally restored areas had a lower overall plant stem density, after 13–54 years, than natural salt marshes.
Characteristic plant abundance (2 studies): Two before-and-after studies of coastal marshes in North America2,5 reported that within three years of restoring tidal exchange (sometimes2 along with other interventions), total cover of fresh/brackish plant species decreased. In one study2 the total cover of salt-tolerant plant species increased, but in the other study5 it did not. One of the studies5 also found that tidally restored marshes had lower cover of salt-tolerant plants than nearby natural marshes.
Individual species abundance (5 studies): Five studies2–4,6,7 quantified the effect of this intervention on the abundance of individual plant species. All five studies were in brackish/salt marshes in the USA. Three before-and-after studies3,4,6 reported increases in cover or frequency of smooth cordgrass Spartina alterniflora in the four years after improving tidal exchange. One replicated, site comparison study7 found that smooth cordgrass cover was lower in tidally restored areas than in natural salt marshes, 13–54 years after tidal restoration. Two before-and-after studies4,6 reported no clear change in frequency or cover of saltmeadow cordgrass Spartina patens in the four years after improving tidal exchange, but one before-and-after study3 reported an increase in saltmeadow cordgrass cover over two growing seasons after improving tidal exchange. Four studies2–4,6 reported declines in cover or frequency of less salt-tolerant species such as common reed Phragmites australis3,4,6 and cattails Typha spp.2–4 in the four years after improving tidal exchange (sometimes2 along with other interventions). One replicated, site comparison study7 found that common reed cover was similarly low (<1%) in tidally restored areas and natural salt marshes, 13–54 years after tidal restoration.
VEGETATION STRUCTURE
Vegetation height (3 studies): Two before-and-after studies of brackish/salt marshes in the USA3,4 found that common reed was shorter 1–4 years after improving tidal exchange than before. One replicated, site comparison study in the USA7 found that the maximum vegetation height was similar in tidally restored salt marshes and natural salt marshes, 13–54 years after tidal restoration.

8. Threat: Natural system modifications
107
A before-and-after study in 1946–1988 of a coastal salt marsh in Connecticut, USA (1) reported that after installing culverts across a dyke to restore tidal exchange, coverage of salt marsh plant communities increased and coverage of fresh/brackish plant communities decreased. Statistical significance was not assessed. Salt marsh plant communities covered 88% of the site in 1946 (before tidal exchange was blocked), 4% of the site in 1976 (after 30 years without tidal exchange) and then 63% of the site in 1988 (after 10 years with restored tidal exchange). Twenty-eight percent of the site was covered by the same salt marsh community type in 1988 as it was in 1946. Vegetation dominated by smooth cordgrass Spartina alterniflora was more abundant in 1988 (51% coverage) than in 1946 (40% coverage). Mixed saltgrass Distichlis spicata and saltmeadow cordgrass Spartina patens was less abundant in 1988 (<1% coverage) than in 1946 (37% coverage). Stands dominated by narrowleaf cattail Typha angustifolia and common reed Phragmites australis (36% coverage in total) persisted in 1988 after restoration of tidal exchange (vs 80% coverage in 1976 and 0% coverage in 1946). Methods: The study compared three vegetation maps: before, during and after tidal restriction. A dyke built across the mouth of the marsh in 1946 stopped tidal exchange. Culverts built in 1978 and 1982 restored it.
A before-and-after study in 1993–1996 of a coastal marsh in Florida, USA (2) found that following restoration of tidal exchange and prescribed burning, species richness and cover of salt-tolerant vegetation increased, whilst species richness and cover of freshwater vegetation decreased. Within three years of tidal restoration, the number of salt-tolerant plant species in the marsh increased from seven to eight. Cover of salt-tolerant vegetation significantly increased (by 1,056%). The number of freshwater plant species decreased from thirteen to one. Cover of freshwater vegetation significantly decreased (by 74%). There was a non-significant 56% decline in southern cattail Typha domingensis cover. Methods: In 1993, thirteen culverts were built to restore tidal exchange to a degraded, impounded, cattail-invaded marsh. In February 1995, the marsh was burned. The study does not distinguish between the effects of these interventions. Vegetation was surveyed along fifteen 15-m transects in October 1993 (before culverts were built) and March 1996.
A before-and-after, site comparison study in 1996–2000 of two brackish/salt marshes in an estuary in Rhode Island, USA (3) found that after installing culverts to improve tidal exchange to a degraded marsh, its vegetation became more like a natural marsh. Over two growing seasons following intervention, the overall plant community composition in the tidally restored marsh became more like that in an adjacent natural marsh. Cover of salt marsh plant taxa such as cordgrasses Spartina spp. and glasswort Salicornia europaea increased, whilst cover of common reed Phragmites australis and narrowleaf cattail Typha angustifolia decreased (data reported as cover categories; statistical significance not assessed). After two growing seasons, the overall plant community in the tidally restored marsh remained significantly different from the natural marsh – but was also significantly different from the composition before intervention (data not reported). In the tidally restored marsh, common reed was significantly shorter over three growing seasons following intervention (84–107 cm) than it had been before intervention (136 cm). Methods: The study involved two brackish/salt marshes either side of a road causeway and narrow culvert. In March 1998, full tidal exchange was restored to the degraded, reed-dominated marsh above the road by installing two wider culverts. The marsh below the road remained relatively undisturbed, with full tidal exchange and dominated by salt marsh vegetation. Tidal creeks and pools were excavated in both marshes. Plant species and their cover were surveyed in late summer before (1996) and after (1998,

8. Threat: Natural system modifications
108
1999) intervention. Surveys involved 22–28 quadrats/marsh/year, each 1 m2, placed along transects. Common reed stems were also measured in the degraded/restored marsh until late summer 2000.
A before-and-after, site comparison study in 1997–2002 of three salt marshes in Massachusetts, USA (4) found that widening a culvert to improve tidal exchange altered the plant community composition and reduced the height of common reed Phragmites australis. In one marsh, the overall plant community composition was significantly different in the four years after tidal restoration than before (data not reported). Species experiencing large changes in frequency included common reed (present at only 24% of sampled points after restoration, vs 40% before), narrowleaf cattail Typha angustifolia (6% after vs 18% before) and Spartina alterniflora (28% after vs 17% before). The frequency of dominant saltmeadow cordgrass Spartina patens did not clearly change (50% after vs 46% before). These frequency results are not based on assessments of statistical significance. Common reed was significantly shorter after tidal restoration (60–85 cm) than before (140–155 cm). In two adjacent natural marshes, plant community composition, species frequencies and common reed height were stable over time (see original paper). Methods: In 1998, a small culvert was replaced with a bigger one to increase tidal exchange in a degraded, reed-invaded, coastal marsh. Plant species and reed height were recorded for two years before and four years after intervention, along 4–9 transects in the restored marsh and two natural marsh areas.
A replicated, before-and-after, site comparison study including up to 36 salt marsh restoration projects in the Gulf of Maine, North America (5) found that after improving tidal exchange, cover of salt-loving species did not increase, cover of fresh/brackish species decreased, and plant species richness remained stable. Before intervention, tidally restricted marshes had lower cover of salt-loving species than natural marshes (degraded: 48%; natural: 64%) and greater cover of fresh/brackish species (degraded: 10%; natural: 3%) but contained a statistically similar number of plant species (degraded: 6.9; natural: 6.6 species/marsh). After three or more years, tidally restored marshes still had lower cover of salt-loving species (47%) than natural marshes, but now had statistically similar cover of fresh/brackish species (6%) and retained statistically similar plant species richness (6.6 species/marsh). There was a temporary dip in cover of salt-loving species (33% after two years). The pattern of results was similar for each of three restoration methods considered (see original paper for data). Methods: The study collated data on vegetation cover and species richness from up to 36 coastal salt marsh restoration projects (7–25 marshes with data for each metric in a given year). The projects were completed, ongoing or pending between 1995 and 2003. They involved restoring tidal hydrology to tidally restricted marshes by (a) removing culverts or tide gates, (b) plugging drainage ditches, or (c) excavating tidal channels or raised areas. Data were averaged (a) for the last year before intervention, (b) for 1, 2 and ≥3 years after intervention, and (c) for natural reference marshes.
A replicated, before-and-after study in 2003–2008 of two brackish/salt marshes in an estuary in New York State, USA (6) found that after blocking drainage ditches and excavating tidal channels/pools to improve tidal exchange, one of two marshes experienced changes in plant community composition including a reduction in cover of common reed Phragmites australis. Before intervention, Marsh 1 was highly degraded. In all four years after intervention, the overall plant community composition along transects in this marsh was significantly different to the composition before (data reported as a graphical analysis). Species whose average

8. Threat: Natural system modifications
109
cover increased included saltmarsh bulrush Schoenoplectus robustus (before: 0.0%; after: 9.0%) and smooth cordgrass Spartina alterniflora (before: 0.2%; after: 2.0%). Cover of both live and dead common reed declined (live: from 25% to 8%; dead: from 21% to 5%). There was no clear change in cover of saltmeadow cordgrass Spartina patens (before: 80%; after: 82%). Statistical significance of these cover results was not assessed. Marsh 2 was less degraded before intervention. It experienced no significant change in overall plant community composition after intervention (data not reported). Methods: Between 2004 and 2006, tidal exchange was restored in two degraded (ditched, tidally restricted and reed-invaded) 16–19 ha brackish/salt marshes. Most existing drainage ditches were filled and new tidal channels/pools were excavated. Additionally, to reduce habitat for mosquito breeding, some depressions in the high marsh were filled in. Vegetation was surveyed each autumn for 2–3 years before and 3–4 years after intervention, along 4–5 transects spanning each marsh.
A replicated, site comparison study in 2007–2008 across 15 salt marshes in Connecticut, USA (7) found that plots in which tidal exchange had been restored had lower cover of saltmeadow cordgrass Spartina patens and a lower plant stem density than natural marshes, but had statistically similar cover of two reed/rush species and vegetation height. After 13–54 years, tidally restored plots had lower cordgrass cover than natural marshes (2 vs 20%) and a lower density of plant stems overall (3 vs 35 stems/100 cm2). However, there was no significant difference between tidally restored and natural areas in cover of common reed Phragmites australis (both <1% on average), saltmarsh rush Juncus gerardii (both <1% on average) or maximum vegetation height (restored: 45 cm; natural: 40 cm). Methods: Across summer 2007 and 2008, vegetation was surveyed in 33 plots (each 1 ha) spread across 15 salt marshes. Tidal exchange had been restored to 14 plots 13–54 years previously (no further details reported). The other 19 plots contained natural salt marsh vegetation. Vegetation cover was estimated in nine 1-m2 quadrats/plot, stem density in forty-five 100 cm quadrats/plot and vegetation height at 36 points/plot.
(1) Barrett N.E. & Niering W.A. (1993) Tidal marsh restoration: trends in vegetation change using a geographical information system (GIS). Restoration Ecology, 1, 18–28.
(2) Brockmeyer R.E. Jr., Rey J.R., Virnstein R.W., Gilmore R.G. & Earnest L. (1996) Rehabilitation of impounded estuarine wetlands by hydrological reconnection to the Indian River Lagoon, Florida (USA). Wetlands Ecology and Management, 4, 93–109.
(3) Roman C.T., Raposa K.B., Adamowicz S.C., James-Pirri M.-J. & Catena J.G. (2002) Quantifying vegetation and nekton response to tidal restoration of a New England salt marsh. Restoration Ecology, 10, 450–460.
(4) Buschbaum R.N., Catena J., Hutchins E. & James-Pirri M.-J. (2006) Changes in salt marsh vegetation, Phragmites australis, and nekton in response to increased tidal flushing in a New England salt marsh. Wetlands, 26, 544–557.
(5) Konisky R.A., Burdick D.M., Dionne M. & Neckles H.A. (2006) A regional assessment of salt marsh restoration and monitoring the Gulf of Maine. Restoration Ecology, 14, 516–525.
(6) Rochlin I., James-Pirri M.-J., Adamowicz S.C., Dempsey M.E., Iwanejko T. & Ninivaggi D.V. (2012) The effects of integrated marsh management (IMM) on salt marsh vegetation, nekton, and birds. Estuaries and Coasts, 35, 727–742.
(7) Elphick C.S., Meiman S. & Rubega M.A. (2015) Tidal-flow restoration provides little nesting habitat for a globally vulnerable saltmarsh bird. Restoration Ecology, 23, 439–446.
8.3.3 Facilitate tidal exchange to restore degraded freshwater swamps
We found no studies that evaluated the effects, on vegetation, of facilitating tidal exchange to restore degraded freshwater swamps.

8. Threat: Natural system modifications
110
This means that we have not yet found any studies that have directly evaluated this intervention during our systematic journal and report searches. Therefore we have no evidence to indicate whether or not the intervention has any desirable or harmful effects.
8.3.4 Facilitate tidal exchange to restore degraded brackish/saline
swamps
Four studies evaluated the effects, on vegetation, of facilitating tidal exchange to restore degraded brackish/saline swamps. Three studies were in Mexico2–4 and one was in India1.
VEGETATION COMMUNITY
Overall extent (2 studies): Two before-and-after studies on the coasts of India1 and Mexico3 reported that the area of mangrove forest in each site was greater 5–6 years after restoring tidal exchange (sometimes1 along with planting mangrove seedlings) than in the years before.
Community composition (1 study): One before-and-after study of a mangrove forest in Mexico3 reported that the tree community composition was identical before and five years after restoring tidal exchange: the same three tree species were present at both times.
Community types (1 study): One before-and-after study of a mangrove forest in Mexico3 reported that the relative coverage of stands dominated by each of three tree species was similar before and five years after restoring tidal exchange.
Tree/shrub richness/diversity (2 studies): One site comparison study in Mexico2 reported that a tidally restored mangrove forest contained a similar number of tree species to nearby natural mangroves, after 10–11 years. One before-and-after study in Mexico3 reported identical tree species richness in a mangrove forest before and five years after restoring tidal exchange.
VEGETATION ABUNDANCE
Tree/shrub abundance (2 studies): Two site comparison studies in Mexico2,4 reported that tidally restored mangrove forests contained a lower density of trees2 or seedlings4 than nearby natural mangroves.
Individual species abundance (1 study): One site comparison study in Mexico2 compared the abundance of three mangrove tree species in a tidally restored area and nearby natural forests (see original paper for data).
VEGETATION STRUCTURE
Height (2 studies): One site comparison study in Mexico2 reported that trees in a tidally restored mangrove forest were a similar height to trees in nearby natural mangroves, after 10–11 years. Another replicated, site comparison study in Mexico4 reported that seedlings in a tidally restored mangrove forest were taller than seedlings in a nearby natural mangrove.
Diameter (1 study): One site comparison study in Mexico2 reported that trees in a tidally restored mangrove forest had a similar diameter to trees in nearby natural mangroves, after 10–11 years.
Basal area (1 study): One site comparison study in Mexico2 reported that trees in a tidally restored mangrove forest had a smaller basal area than trees in natural mangroves, after 10–11 years.
A before-and-after study in 1986–2002 of a coastal wetland in southern India (1) reported that after excavating channels to restore tidal exchange and planting mangrove seedlings, the area of mangrove forest increased. Before intervention, the site contained only 325 ha of mangrove forest (all mature) and 375 ha of degraded mangrove. Approximately six years after intervention began, the site contained 618 ha of mangrove forest (411 ha mature; 297 ha developing) and only 65 ha of degraded

8. Threat: Natural system modifications
111
mangrove. Methods: Large scale restoration of a degraded mangrove forest began in 1996. Tidal exchange was restored to subsided, stagnant areas by excavating tidal channels. Then, mangrove seedlings were planted (details not reported). The study does not distinguish between the effects, on naturally colonizing vegetation, of planting and restoring tidal exchange. The local community was engaged in restoration and long-term management of the mangroves (e.g. de-silting tidal channels). The area covered by mangrove vegetation was measured from satellite images, and verified with field surveys, before intervention (1982) and approximately six years after it began (2002).
A site comparison study in 2006–2007 of mangrove forests in northwest Mexico (2) reported that a forest connected to a partially reopened tidal channel contained a different tree community and fewer trees than pristine natural forests, but that both forests contained similarly sized trees. Statistical significance was not assessed. After 10–11 years, the tidally restored area contained two tree species (mostly black mangrove Avicennia germinans with some red mangrove Rhizophora mangle). Pristine forests contained 2–3 species (always including white mangrove Laguncularia racemosa). The tidally restored area contained only 3.3 trees/m2 (vs pristine: 4.5–7.9 trees/m2) with a basal area of 34 cm2/m2 (vs pristine: 48–68 cm2/m2. For data on the abundance of individual species, see original paper. The average size of trees in the tidally restored area (height: 0.9–1.0 m; diameter: 3–5 cm) was within the range of trees in the pristine forest (height: 0.9–1.3 m; diameter: 2–9 cm). Methods: In 2006 or 2007, live trees were counted, identified and measured in 10 plots. Two 5-m2 plots were in a forest with partially restored tidal exchange. Its feeder channel had been blocked during road construction in 1995, then reopened one year later in 1996 (but only to 3.5 m diameter, not the pre-construction 5 m). Eight 1-m2 plots were in pristine mangrove patches in a nearby lagoon.
A before-and-after study in 2004–2009 of a mangrove forest in northwest Mexico (3) reported that after excavating a channel to restore tidal exchange, the area of live mangrove trees increased. Before excavation, the site contained only 2,890 m2 of live mangrove trees. Approximately five years after excavation, the site contained 11,830 m2 of live mangrove trees. Mangroves recolonized the site and expanded into surrounding sand dunes. The same three tree species were present before and after restoration, in similar proportions (% of total mangrove area): 49% red mangrove Rhizophora mangle, 23–24% black mangrove Avicennia germinans and 27–28% white mangrove Laguncularia racemosa. Methods: In April–June 2004, tidal exchange was restored to a degraded mangrove forest by excavating a stepped outlet channel through a sandbar (deposited by a hurricane three years previously). The channel had to be cleared of sediment twice after the initial excavation. The area covered by live mangrove trees was measured from satellite images, and verified with field surveys, before excavation (early 2004) and approximately five years after (2009).
A before-and-after, site comparison study in southeast Mexico (4) reported that following dredging of tidal channels to restore more natural tidal exchange to a degraded mangrove forest, mangrove seedlings colonized. Before dredging, there were no mangrove seedlings present in the study site. After dredging, there were 82 seedlings/100 m2. They were 56 cm tall on average. In a nearby undisturbed mangrove, there were 3,400 seedlings/100 m2. These were 40 cm tall on average. Methods: Around 2010, tidal channels were dredged in the 1,300-ha degraded mangrove forest on the edge of Términos Lagoon. This increased the flooding frequency and reduced flooding duration towards levels in undisturbed mangroves,

8. Threat: Natural system modifications
112
but reduced sediment salinity below levels in undisturbed mangroves. Local communities were also engaged in restoration activities and decision-making. The study does not report details of vegetation monitoring.
(1) Selvam V., Ravichandran K.K., Gnanappazham L. & Navamuniyammal M. (2003) Assessment of community-based restoration of Pichavaram mangrove wetland using remote sensing data. Current Science, 85, 794–798.
(2) Vovides A.G., Bashan Y., López-Portillo J.A. & Guevara R. (2011) Nitrogen fixation in preserved, reforested, naturally regenerated and impaired mangroves as an indicator of functional restoration in mangroves in an arid region of Mexico. Restoration Ecology, 19, 236–244.
(3) Bashan Y., Moreno M., Salazar B.G. & Alvarez L. (2013) Restoration and recovery of hurricane-damaged mangroves using the knickpoint retreat effect and tides as dredging tools. Journal of Environmental Management, 116, 196–203.
(4) Zaldívar-Jiménez A., Ladrón-de-Guevara-Porras P., Pérez-Ceballos R., Díaz-Mondragón S. & Rosado-Solórzano R. (2017) US-Mexico joint Gulf of Mexico large marine ecosystem based assessment and management: experience in community involvement and mangrove wetland restoration in Términos lagoon, Mexico. Environmental Development, 22, 206–213.
8.4 Actively manage water level
Background
This intervention involves active, repeated management of the amount of water in wetlands and when it is present, to mimic the natural hydrology of marshes or swamps. This may prevent excessively high or low water levels (e.g. during storm surges or droughts), or maintain wet/dry cycles that are a natural feature of many marshes and swamps (e.g. Conner & Buford 1998; Zacharias & Zamperas 2010).
This intervention will usually involve some kind of water control structure: a valve, gate, sluice or pump. Water level management might aim to: mirror historical water level fluctuations or stability; manage salinity levels; increase sediment inputs; stimulate growth of desirable plant species; and/or create new wetland plant communities. Studies of “moist soil management”, “structural marsh management” and “environmental flows” along river courses all fall within the scope of this intervention. CAUTION: When managing water levels in a focal site, the effect on water levels in neighbouring sites should be considered.
Although water levels may be managed to restore or enhance habitats for waterfowl, information on the value of vegetation for waterfowl (e.g. seed production; productivity measured as CO2 exchange rates) is not summarized in this synopsis. Also, this synopsis does not include information on riparian areas that are not clearly marshes or swamps (e.g. riparian forests that require only a brief flood pulse for germination; Taylor et al. 2006).
Related interventions: Raise water level to restore degraded marshes or swamps (8.1) or restore/create marshes or swamps from other land uses (12.4); Lower water level to restore degraded marshes or swamps (8.2) or restore/create marshes or swamps from other land uses (12.5); Facilitate tidal exchange to restore degraded marshes or swamps (8.3) or restore/create marshes or swamps from other land uses (12.5); Manage water level to control problematic plants (9.6); Actively manage water level to complement planting (13.5).

8. Threat: Natural system modifications
113
Conner W.H. & Buford M.A. (1998) Southern deepwater swamps. Pages 261–287 in: M.G. Messina & W.H. Conner (eds.) Southern Forested Wetlands: Ecology and Management. Lewis Publishers/CRC Press, Boca Raton.
Junk W.J., Piedade M.T.F., Schöngart J., Cohn-Haft M., Adeney J.M. Wittman F. (2011) A classification of major naturally-occurring Amazonian lowland wetlands. Wetlands, 31, 623–640.
Taylor J.P., Smith L.M. & Haukos D.A. (2006) Evaluation of woody plant restoration in the Middle Rio Grande: ten years after. Wetlands, 26, 1151–1160.
Zacharias I. & Zamparas M. (2010) Mediterranean temporary ponds. A disappearing ecosystem. Biodiversity and Conservation, 19, 3827–3834.
8.4.1 Actively manage water level: freshwater marshes
Ten studies evaluated the effects, on vegetation, of active water level management in freshwater marshes. Eight studies were in the USA1,2,5–10. One study was in Cameroon3 and one study was in the Netherlands4.
VEGETATION COMMUNITY
Community composition (1 study): One before-and-after study in the USA10 found that directly pumping water into drained marshes and wet meadows generated plant communities characteristic of wetter conditions. This change was reversed in some plots when the pump output was moved further away from the focal wetlands.
Relative abundance (2 studies): One replicated, randomized, controlled study of freshwater marshes in the USA2 reported that irrigated and non-irrigated marshes supported a similar relative abundance of the most common plant species. One before-and-after study on a floodplain in Cameroon3 found that the relative abundance of some key plant species changed over four years after restoring wet-season flooding. There was also an increase in the cover of perennial relative to annual herbs.
Overall richness/diversity (4 studies): One before-and-after study of a marsh/swamp in the USA6 found that overall plant diversity was higher in the autumn following a managed flood/drawdown than in the autumn before. Two before-and-after studies of marshes and wet meadows in the USA9,10 reported that plant species richness9,10 and/or diversity9 declined over 5–6 years of water level management (fluctuation9 or water addition10). One study in the USA7 simply reported the number of plant species that colonized a floodplain, over three weeks after lowering the river level.
VEGETATION ABUNDANCE
Overall abundance (3 studies): One study of riparian moist/wet meadows in the USA1 reported that vascular plant biomass increased in two of three meadow types, over the second year of artificially augmented streamflow. Meanwhile, vascular plant cover declined in two of three meadow types. Two studies in the Netherlands4 and the USA8 simply quantified overall vegetation abundance after 1–9 growing seasons of active water level management (sometimes8 along with other interventions).
Characteristic plant abundance (2 studies): Two before-and-after studies of marshes and wet meadows in the USA9,10 reported increases in abundance of some individual wetland- or habitat-characteristic species over 5–6 years of water level management (fluctuation9 or water addition10).
Moss abundance (1 study): One study of riparian moist/wet meadows in the USA1 reported that moss cover did not significantly change in two of three meadow types, over the second year of artificially augmented streamflow. It declined in the other meadow type.
Individual species abundance (7 studies): Seven studies1,5–10 quantified the effect of this intervention on the abundance of individual plant species. For example, one before-and-after study of a marsh/swamp in the USA6 reported mixed effects of a managed flood/drawdown on species

8. Threat: Natural system modifications
114
cover, including increased cover of Pacific willow Salix lucida and reduced cover of reed canarygrass Phalaris arundinacea. One controlled study of freshwater marshes in the USA5 found that irrigated marshes developed a greater biomass of pink smartweed Polygonum pensylvanicum, after one growing season, than marshes that were left dry.
VEGETATION STRUCTURE
Vegetation height (1 study): One replicated, randomized, controlled study of freshwater marshes in the USA1 reported that four common plant species were taller in irrigated than non-irrigated marshes.
A study in 1985–1987 of 18 riparian moist/wet meadows along one stream in Wyoming, USA (1) found that the effect of augmenting streamflow on vegetation abundance depended on meadow wetness, plant species and abundance metric. For example, over the second year of augmented streamflow, above-ground vascular plant biomass significantly increased at two of three moisture levels (from 412–433 g/m2 to 517–532 g/m2), whilst vascular plant cover significantly declined at two of three moisture levels (from 22–23% to 15%). The study also reported data on the abundance of individual plant species (see original paper). For example, biomass of the dominant sedges Carex spp. increased significantly in two of three comparisons (from 262–337 g/m2 to 386–456 g/m2) with a similar trend in the other (from 379 to 452 g/m2). Moss cover did not significantly change in two of three comparisons (from 3–27% to 8–24%) but declined in the other (from 29% to 4%). Methods: From August 1985, additional water was released into a previously ephemeral stream, increasing the flow and raising the water table in streamside meadows. Vegetation abundance was surveyed in 18 meadows (six moist, six moist-wet, six wet). Biomass was dried before weighing. Surveys took place in August–October 1985–1987, starting shortly after streamflow augmentation began. Large grazing mammals were excluded from some of the surveyed meadows.
A replicated, randomized, controlled study in 1990 in nine ephemeral freshwater marshes in California, USA (2) reported that irrigated marshes and non-irrigated marshes supported a similar relative abundance of common plant species, but that irrigation increased the height of four species and increased the biomass of two. Results summarized for this study are not based on assessments of statistical significance. All marshes were drained in spring. Four months later, the relative abundance of the most common plant species was broadly similar in irrigated and non-irrigated marshes: 49–62% of individual plants were pricklegrass Crypsis niliaca, 30–40% were sprangletop Leptochloa fasicularis, <5% were barnyardgrass Echinochloa crusgalli and <5% were swamp timothy Heleochloa schoenoides. However, all of these species were taller in irrigated marshes (3–29 cm) than in non-irrigated marshes (1–5 cm). Above-ground biomass of sprangletop and barnyardgrass was greater in irrigated marshes (0.1–0.7 g/plant) than non-irrigated marshes (<0.1–0.2 g/plant). Irrigation had little effect on the above-ground biomass of the other two species (irrigated: 0.1–0.2 g/plant; not irrigated: 0.1–0.2 g/plant). Methods: Nine adjacent experimental marshes were drained in April 1990 to simulate management for waterfowl. Six random marshes were irrigated by flooding (for <24 h): three in May only, and three in May and June. The other three marshes were not irrigated. In July–August, plants were counted and identified in five 0.25-m2 plots/marsh, and 40 plants/species/marsh were measured, cut, dried and weighed.
A before-and-after study in 1993–1997 on a floodplain in northern Cameroon (3) found that after releasing water from a dam to restore seasonal flooding, there

8. Threat: Natural system modifications
115
were changes in the relative abundance of some plant species and groups. Of eight monitored plant species, three were significantly less dominant in the year after reflooding than in the year before (antelope grass Echinochloa pyramidalis, turf grass Ischaemum afrum and vetiver grass Vetiveria nigritana; data not reported). Over the four years after reflooding, there were increases in the relative cover of antelope grass (from 9% to 19%) and wild rice Oryza longistaminata (from 29% to 38%), and a decrease in the relative cover of wild sorghum Sorghum arundinaceum (from 26% to 16%). Meanwhile, there was an increase in the relative cover of perennial herbs (from 41% to 62%), but a decrease in the relative cover of annual herbs (from 58% to 34%). Methods: This summary is based on data from 108 permanent 36-m2 plots, spaced 0.5–1.0 km apart on a floodplain. Wet-season flooding of these plots (approximately August to December) had been restricted after a dam was built upstream in 1979. Wet-season flooding was restored from 1994 by releasing water from the dam. Vegetation was surveyed, in the dry season, before reflooding (1993) and in four years after (1994–1997).
A study in 1995–1998 on the shore of a freshwater lake in the Netherlands (4) reported that following a managed sequence of drawdowns and floods, a band of emergent wetland vegetation developed. Initially, the study area was a sandy shoreline with little or no vegetation (not quantified). After three years, a 50-m-wide band of tall emergent vegetation had developed around and just below the drawdown water line. This included sea club rush Bolboschoenus maritimus, common reed Phragmites australis, cattails Typha spp. and bulrushes Schoenoplectus spp. Total above-ground biomass of these species reached 520–630 g/m2 in the most densely vegetated areas (data reported graphically). Brackish marsh vegetation developed at slightly higher elevations (not quantified). Methods: In 1995, a watertight exclosure was established around a 3-ha area on the shoreline of Lake Volkerak-Zoommeer. The lake was created from an estuary in 1987 and the water level had been held stable since. The water level was lowered throughout 1995 and 1996 (exposing a 60-m-wide band of shoreline), then raised each winter and lowered each summer (exposing a 20- to 30-m-wide band of shoreline). Parts of the study area were fenced to exclude waterbirds, but parts were left open. Each summer between 1995 and 1998, vegetation was surveyed along transects spanning the drawdown zone (i.e. perpendicular to shoreline).
A controlled study in 1993 of four depressional freshwater marshes in Texas, USA (5) found that marshes kept wetter over the growing season supported greater above-ground biomass of pink smartweed Polygonum pensylvanicum, at the end of the growing season, than drier marshes. This was true for marshes kept permanently flooded to 3–5 cm depth (12,497 kg/ha), marshes kept permanently wet but not flooded (9,010 kg/ha), and marshes that fluctuated between flooded, wet and dry (6,816 kg/ha). In permanently dry marshes, with plants wilting during day, above-ground biomass of pink smartweed was only 4,706 kg/ha. Methods: Four marshes (6.1 ha average size) were kept saturated in spring to promote germination of pink smartweed. Between June and August, three marshes were managed with increased water levels and one marsh was left dry. In September, smartweed was cut from twelve 0.25-m2 quadrats/marsh. Seeds were removed, then the vegetation was dried and weighed.
A before-and-after study in 2003–2004 of a freshwater wetland with marsh and swamp vegetation in Oregon, USA (6) found that following a managed flood/ drawdown, plant diversity increased and there were changes in cover of individual

8. Threat: Natural system modifications
116
plant taxa. Plant diversity was higher in the autumn after the flood/drawdown than in the autumn before (data reported as a diversity index). Of 21 plant taxa for which cover data were reported, 12 became more abundant, including knotweeds Polygonum spp. (before: 21%; after: 35%) and Pacific willow Salix lucida (before: 11%; after: 15%). The cover of seven taxa declined, including invasive reed canarygrass Phalaris arundinacea (before: 44%; after: 41%). The largest canarygrass declines occurred under regenerating tree canopies and in areas more deeply flooded during spring 2004 (see original paper for data). Methods: In 2004, a water control structure was used to restore a more natural water regime to a floodplain wetland: high winter and spring water levels (flooding some surveyed areas) followed by summer drawdown (exposure to natural tides). Over the previous 20 years, the water level had been artificially stabilized and reed canarygrass had invaded. Vegetation was surveyed around the edge of the wetland, in the autumn before (2003) and after (2004) the managed flood/drawdown. Plant species were recorded at 10 cm intervals along 27 transects (approximately 25,000 total points sampled), spanning areas with a tree canopy and areas of open marshland. The study does not generally separate results from the two habitat types.
A study in 1999–2001 of a section of the Mississippi River in Illinois/Missouri, USA (7) reported that when the water level was successfully lowered for 30 days, herbaceous plant species colonized exposed parts of the floodplain. In 1999 and 2001, fifteen to seventeen plant taxa were recorded on the exposed floodplain. The most common taxa were sedges Cyperus spp. (occurring in 69–77% of surveyed quadrats), barnyard grasses Echinochloa spp. (53–80%) and knotweeds Polygonum spp. (28–93%). In 2000, low water levels could not be maintained for a continuous 30 day period. Vegetation that had germinated on exposed soils was killed by the floodwaters. Methods: Each spring between 1994 and 2001, downstream dam gates were opened to lower the water level in the focal section of the Mississippi River. The aim was to expose floodplain soils and allow certain herb species to germinate. Each year between 1999 and 2001, plant species and their cover were surveyed in 55–65 quadrats on the floodplain, approximately three weeks after initial exposure.
A study in 1997–2006 of a levelled, irrigated and partially planted freshwater marsh in California, USA (8) reported that it developed vegetation dominated by emergent plants, including planted tule Schoenoplectus acutus – although vegetation cover and density depended on the water level. After 2–9 years, the shallower half of the site had 89–98% total vegetation cover. This included 77–81% cattail Typha spp., 11–19% tule and 0–5% submerged vegetation cover. Emergent vegetation density fluctuated between 49 and 76 stems/m2. The deeper half of the site had 77–100% total vegetation cover, including 38–58% cattail, 3–8% tule, and 10–46% submerged vegetation cover. Emergent vegetation density fluctuated between 44 and 59 stems/m2. Across the entire site, above-ground biomass of emergent vegetation was 1,630 g/m2 after 1–3 years (vs submerged, floating and algae combined: 389 g/m2) then fluctuated between 925 and 2,360 g/m2 for the following six years. Methods: In autumn 1997, a 0.6-ha area of farmland was levelled and lowered. Tule was planted into two 0.25-ha basins within the site. Shortly after planting, the fresh water was continuously piped into the site, flooding the basins with 25 cm and 55 cm of water respectively. The study does not distinguish between the effects of levelling, planting and irrigation on non-planted vegetation. All plants and algae were surveyed along transects, in summer/autumn, at least biennially between 1998 and 2006. Biomass was cut, dried and weighed (years 1–3) or estimated from plant height and diameter (years 4–9).

8. Threat: Natural system modifications
117
A before-and-after study in 1984–1990 of two marshes on a floodplain in Florida, USA (9) reported that following restoration of seasonal water level fluctuations, plant species richness and diversity decreased in both marshes, but the abundance of individual plant species responded differently in each marsh. Unless specified, statistical significance was not assessed. Plant species richness declined in both marshes, from 6.1–7.3 species/m2 in the year before intervention to 5.0–5.4 species/m2 after five years of fluctuating water levels – although this decline was only statistically significant in one marsh. Species diversity also declined in both marshes (data reported as a diversity index). The frequency of individual plant species, including those characteristic of broadleaf marshes, did not always respond consistently in both marshes. For example, pickerelweed Pontederia cordata frequency declined in one marsh (from 65% to 21% of quadrats) but was stable in the other (87% before and after). Methods: From September 1985, water level fluctuations were restored to two degraded marshes in Section B of the Kissimmee River floodplain, by actively managing the amount of water released into the river. Before intervention the marshes were nearly permanently flooded. After intervention, there were clear wet and dry seasons, with and without standing water. Plant species and their cover were surveyed before intervention (summer 1984–1985) and for five years after (until September 1990), in 1-m2 quadrats along two transects (37–48 quadrats/transect).
A before-and-after study in 1992–2010 in historically drained marshes and wet meadows in Florida, USA (10) found that pumping water more or less directly into these drained areas generally led to development of more wetland-characteristic plant communities. All data were reported as graphical analyses. In management Phase 1 (1993–1999), water was pumped from a canal into part of the marsh. In one transect sampled before and at the end of this phase, the overall plant community became characteristic of wetter conditions in 80% of plots. Cover of some individual, wetland-characteristic plant species also increased in these plots. However, overall plant species richness declined. In management Phase 2 (2000–2010), water was pumped into storage basins upstream from the focal marsh. The basins gradually released the water as surface flow. During this phase, the overall plant community did not significantly change in most plots (77%) but became characteristic of drier conditions in the rest (23%). Methods: Vegetation in Taylor Slough was surveyed one year before and at the end of each water management phase. One transect was surveyed for Phase 1 and three transects for Phase 2. Plant species and cover were recorded in twenty 5-m2 permanent plots/transect/survey.
(1) Henszey R.J., Skinner Q.D. & Wesche T.A. (1991) Response of montane meadow vegetation after two years of streamflow augmentation. Regulated Rivers: Research & Management, 6, 29–38.
(2) Mushet D.M., Euliss N.H. & Harris S.W. (1992) Effects of irrigation on seed production and vegetative characteristics of four moist-soil plants on impounded wetlands in California. Wetlands, 12, 204–207.
(3) Scholte P., Kirda P., Adam S. & Kadiri B. (2000) Floodplain rehabilitation in North Cameroon: impact on vegetation dynamics. Applied Vegetation Science, 3, 33–42.
(4) Coops H., Vulink J.T. & van Nes E.H. (2004) Managed water levels and the expansion of emergent vegetation along a lakeshore. Limnologica, 34, 57–64.
(5) Haukos D.A. & Smith L.M. (2006) Effects of soil water on seed production and photosynthesis of pink smartweed (Polygonum pensylvanicum L.) in playa wetlands. Wetlands, 26, 265–270.
(6) Jenkins N.J., Yeakley J.A. & Stewart E.M. (2008) First-year responses to managed flooding of lower Columbia River bottomland vegetation dominated by Phalaris arundinacea. Wetlands, 28, 1018–1027.
(7) Dugger B.D. & Feddersen J.C. (2009) Using river flow management to improve wetland habitat quality for waterfowl on the Mississippi River, USA. Wildfowl, 59, 62–74.

8. Threat: Natural system modifications
118
(8) Miller R.L. & Fujii R. (2010) Plant community, primary productivity, and environmental conditions following wetland re-establishment in the Sacramento-San Joaquin Delta, California. Wetlands Ecology and Management, 18, 1–16.
(9) Toth L.A. (2010) Restoration response of relict broadleaf marshes to increased water depths. Wetlands, 30, 263–274.
(10) Sah J.P., Ross M.S., Saha S., Minchin P. & Sadle J. (2014) Trajectories of vegetation response to water management in Taylor Slough, Everglades National Park, Florida. Wetlands, 34(S1), 65–79.
8.4.2 Actively manage water level: brackish/salt marshes
Ten studies evaluated the effects, on vegetation, of active water level management in brackish/ salt marshes. Six studies were in the USA3,4,6–9. There was overlap in the sites used in two of these studies4,6. Two studies were in Canada1,2 and based on the same experimental set-up. One study was in France5 and one was in Tunisia10.
VEGETATION COMMUNITY
Community types (1 study): One before-and-after study of a lakeshore brackish/salt marsh in Tunisia10 reported an increase in coverage of bulrush-dominated vegetation over nine years of freshwater releases into the lake (to increase its level and restore winter flooding of the marsh).
Community composition (3 studies): One replicated, paired, controlled, before-and-after study of brackish marshes in France5 reported that artificially flooded marshes developed different plant communities, over five years, to fields with unmanaged flooding. One before-and-after, site comparison study of brackish/salt marshes in the USA8 reported that the overall plant community composition changed more, over four years, in a marsh directly irrigated with treated wastewater than in downstream marshes. One replicated, paired, site comparison study of brackish/salt marshes in the USA9 reported that that marshes in which water levels were drawn down each spring/autumn (along with disking soils) shared only 24–34% of plant species with marshes that were not drawn down (or disked).
Overall richness/diversity (5 studies): Two replicated, site comparison studies of brackish/salt marshes in the USA6,9 found that marshes in which water levels were managed (sometimes9 along with other interventions) had similar plant species richness6,9 and/or diversity9 to marshes without water level management. One replicated, site comparison study of brackish and salt marshes in the USA4 reported that marshes in which water levels were managed had similar or higher plant species richness, in winter, than marshes without water level management. One before-and-after, site comparison study of brackish/salt marshes in the USA8 reported that plant species richness increased, over four years, in marshes directly irrigated with treated wastewater – but only to similar levels as in downstream marshes. One replicated, paired, controlled, before-and-after study of brackish marshes in France5 reported that the effects of artificial flooding on plant species richness depended on whether the marshes were grazed.
VEGETATION ABUNDANCE
Overall abundance (2 studies): Two replicated, site comparison studies of brackish and salt marshes in the USA4,6 reported that marshes in which water levels were managed typically had similar overall vegetation cover to marshes without water level management. One of the studies4 also reported that cover of standing dead vegetation was higher in the managed marshes than in the unmanaged marshes.
Individual species abundance (6 studies): Six studies3–8 quantified the effect of this intervention on the abundance of individual plant species. For example, four replicated, site comparison studies of brackish and salt marshes in the USA3,4,6,7 reported mixed effects of water level management on the abundance of saltmeadow cordgrass Spartina patens. One replicated, paired, controlled,

8. Threat: Natural system modifications
119
before-and-after study of brackish marshes in France5 reported that the effects of artificial flooding on the cover of individual plant species depended on the flooding (and grazing) regime.
VEGETATION STRUCTURE
OTHER
Germination/emergence (2 studies): Two replicated studies of brackish marshes in Canada1,2 reported that seedlings of wetland plants germinated in the spring/summer following drawdowns, after a period of deep flooding.
A replicated, before-and-after, site comparison study in 1981–1984 of 12 adjacent brackish marshes in Manitoba, Canada (1) reported that during the first 2–3 months of drawdown following prolonged deep flooding, seedlings of dominant plants germinated. For four of five species, most seedlings grew around the elevation where adult plants had been dominant before flooding (see original paper for data). The exception was common reed Phragmites australis. Adult plants persisted at the higher elevations where common reed dominated, and these adult plants likely inhibited seedling growth. Most (81%) quadrats in the 10 experimental marshes contained seedlings of >1 species, whereas most (64%) quadrats in two nearby mature marshes contained adult plants of only one species. Methods: The water level in 10 slightly brackish (2–3 ppt) diked marshes on the shores of Lake Manitoba was actively managed: deep flooding for two years (water level raised 1 m above normal, killing most emergent vegetation) followed by drawdown in spring 1983 or 1984 (water level dropped to 20 cm below normal). This mimicked historical water level fluctuations in Lake Manitoba. Over the first summer of drawdown, seedlings were counted monthly in twenty 1-m2 quadrats/marsh. Pre-intervention vegetation was mapped from aerial photographs taken in August 1980. Plant species were also recorded in two adjacent, unmanipulated marshes in August 1983 (thirty 1-m2 quadrats/marsh). This study was based on the same experimental set-up as (2).
A replicated study in 1981–1984 of 10 adjacent brackish marshes in Manitoba, Canada (2) reported that seedlings germinated during two summers of drawdown following prolonged deep flooding, with most seedlings of dominant perennials germinating in the first summer. The study reported seedling numbers for seven herbaceous emergent species. For four perennial, grass-like species that dominated the marshes before intervention, 120–49,000 seedlings/100 m2 germinated in the first summer of drawdown (vs 160–3,400 seedlings/100 m2 in the second). For three annual forbs, 2,300–31,000 seedlings/100 m2 germinated in the first summer of drawdown (vs 85,000–200,000 seedlings/100 m2 in the second). Methods: The water level in 10 slightly brackish (2–3 ppt) diked marshes on the shores of Lake Manitoba was actively managed: deep flooding for two years (water level raised 1 m above normal, killing most emergent vegetation) followed by drawdown in spring 1983 or 1984 (water level dropped to 20 cm below normal). This mimicked historical water level fluctuations in Lake Manitoba. Seedlings were counted monthly in summer 1983 and 1984 in up to twenty 1-m2 quadrats/marsh. Quadrats were placed in the zone around the historical shoreline where emergent vegetation had been killed during flooding. This study was based on the same experimental set-up as (1).
A replicated, paired, site comparison study in 1989 in two brackish marshes in Louisiana, USA (3) found that actively managing water levels within impoundments had mixed effects on the density and biomass of dominant saltmeadow cordgrass Spartina patens in each marsh. In Fina LaTerre marsh, saltmeadow cordgrass was

8. Threat: Natural system modifications
120
always significantly less abundant in an impounded area than an area open to natural tidal exchange. This was true for density (impounded: 81; open: 99 stems/m2) and above-ground biomass (impounded: 897; open: 1,357 g/m2). In Rockefeller marsh, saltmeadow cordgrass abundance increased over the growing season. From August to November, it had a similar density in impounded and open marshes (impounded: 94–136 stems/m2; open: 107–117 stems/m2) and greater biomass in impounded marshes (impounded: 1,960–2,750 g/m2; open: 420–1,200 g/m2). The study suggests that the different responses in each marsh could be related to the design of the tidal control structures, distance of each marsh from the coast and soil chemistry. Methods: In 1989, and in each of two brackish marshes, vegetation was surveyed in an impounded area where water levels were managed (drawn down in spring/summer every 1–4 years, then reflooded in autumn/winter) and a nearby unmanaged area open to tidal exchange. Some parts of one marsh were also burned. Throughout the year, vegetation was cut from 0.1-m2 plots (7–19 plots/area/sampling date). Then, live cordgrass plants were counted, dried and weighed.
A replicated, site comparison study in 1996–1998 of 14 coastal brackish and salt marshes in Louisiana, USA (4) reported that active management of water levels within impoundments had mixed effects on winter vegetation cover, structure and species richness, depending on the year and whether marshes had been recently burned. In two of two years, impounded marshes had statistically similar overall vegetation cover (62–72%) to open marshes (56–78%). In one of two years, vegetation in impounded marshes created less visual obstruction than vegetation in open marshes (data reported as an index combining height and horizontal cover; other year no significant difference). Compared to open marshes, impounded marshes had similar or lower saltgrass Distichlis spicata cover (impounded: 0–2%; open: <1–11%), similar or higher cover of standing dead vegetation (impounded: 5–76%; open: 3–75%), and similar or higher plant species richness (impounded: 6–8 species/marsh; open: 4–6 species/marsh). Impounded marshes typically had higher saltmeadow cordgrass Spartina patens cover (three of four comparisons, for which impounded: 1–23%; open: <1–19%). Statistical significance of these cover results was not assessed. Methods: In January–February 1996 and 1997, vegetation was surveyed at 80 points in each of 14 brackish or saline marshes. Eight marshes had been impounded since the late 1950s, meaning water levels could be controlled (e.g. maintained relatively high in winter). Water levels were not controlled in the other six marshes (i.e. open to natural tidal influence). In each marsh, 40 points had been burned earlier in winter 1995/1996 and 40 had not. This study included the marshes studied in (6).
A replicated, paired, controlled, before-and-after study in 1989–1994 of 18 brackish marshes in southern France (5) reported that artificially flooded fields developed different plant communities with different species richness to fields with unmanaged flooding, but that the precise effects of artificial flooding depended on the flooding and/or grazing regime. Unless specified, statistical significance was not assessed. Over five years, the overall plant community composition changed in artificially flooded fields, becoming less like that of fields with unmanaged flooding (data reported as graphical analyses). Responses of individual plant species, and therefore the precise community that developed, depended on when fields were flooded and whether they were grazed. For example, final cover of common reed Phragmites australis was significantly greater in ungrazed, artificially flooded fields (12–16%) than in grazed, artificially flooded fields (<1%) or fields with unmanaged flooding (0%). In ungrazed fields, plant species richness was similar after five years of

8. Threat: Natural system modifications
121
artificial flooding (5–6 species/0.25 m2) or unmanaged flooding (5 species/0.25 m2). In grazed fields, plant species richness was lower after five years of artificial flooding (4 species/0.25 m2) than unmanaged flooding (7 species/0.25 m2). Methods: The study used 18 adjacent former rice fields (1 ha; arranged in two sets of nine). From November 1989, six fields (three fields/set) received each flooding treatment: artificial winter flooding (10 cm depth November–April), artificial summer flooding (10 cm depth May–October) or year-round unmanaged flooding (inundated most of the winter most years). Half of the plots under each flooding treatment were also grazed. Vegetation was surveyed every six months from early November 1989 to early November 1994 (nine 0.5 x 0.5 m quadrats/field/survey).
A replicated, site comparison study in 1996–1998 of five coastal brackish marshes in Louisiana, USA (6) found that impounded marshes in which water levels were actively managed had similar summer plant species richness to open unmanaged marshes, and typically had similar cover of vegetation overall and dominant saltmeadow cordgrass Spartina patens. In three of three years, impounded marshes had statistically similar plant species richness (5.3–5.5 species/marsh) to open marshes (4.3–4.8 species/marsh). In two of three years, impounded marshes had statistically similar vegetation cover (total: 82–85%; cordgrass: 45–64%) to open marshes (total: 79–81%; cordgrass: 51–57%). The exception was in the first summer of the study, six months after prescribed burns, when impounded marshes had greater vegetation cover (total: 83%; cordgrass: 55%) than open marshes (total: 69%; cordgrass: 38%). Methods: In May–June 1996–1998, vegetation was surveyed at 80 points in each of five brackish marshes (salinity 5–10 ppt). Two marshes had been impounded since the late 1950s, meaning water levels could be controlled (e.g. maintained relatively high in winter). Water levels were not controlled in the other three marshes (i.e. open to natural tidal influence). In each marsh, 40 points had been burned earlier in winter 1995/1996 and 40 had not. This study used a subset of the marshes from (4).
A replicated, paired, before-and-after, site comparison study in 1991–1994 of four brackish marshes in Louisiana, USA (7) found that active water level management typically had no significant effect on the height of the two dominant plant species, but had mixed effects on density. Before intervention, height and density of both saltmeadow cordgrass Spartina patens and American bulrush Schoenoplectus americanus were similar in all marshes. Over the three following years, managed and unmanaged marshes contained cordgrass stems of a similar height in eight of eight comparisons, and bulrush stems of a similar height in five of eight comparisons (data reported as height categories). In the other three comparisons, bulrush stems were shorter in managed marshes. Managed and unmanaged marshes contained a similar density of cordgrass in eight of eight comparisons (managed: 280–1,420 stems/m2; unmanaged: 350–1,520 stems/m2) but a lower density of bulrush in four of eight comparisons (for which managed: 20–60 stems/m2; unmanaged: 80–210 stems/m2). In three of the other four comparisons, bulrush density was similar in managed and unmanaged marshes. Methods: From 1992, water levels were controlled (drained in spring, rewetted in summer and flooded in autumn and winter) within two impounded marshes. In two adjacent marshes, the water level was not managed (no drawdown). Plant stems were counted and measured in each marsh five times before water management began (1991–1992) and eight times after (1992–1994). Some monitoring plots, both managed and unmanaged, were also fenced to exclude herbivores.

8. Threat: Natural system modifications
122
A before-and-after, site comparison study in 1996–2006 of four brackish/salt marshes in a delta in Texas, USA (8) reported that adding treated wastewater to compensate for reduced natural freshwater inputs changed the overall plant community composition, and increased plant species richness. Unless specified, statistical significance was not assessed. Over the first four years after intervention, the overall plant community composition changed in the marsh directly affected by water additions, but was relatively stable in downstream marshes (data reported as a graphical analysis). In the marsh directly receiving water additions, sea marigold Borrichia frutescens cover significantly increased (before: <1–5%; after four years: 55%) whilst pickleweed Salicornia virginica cover significantly decreased (before: 83–88%; after: 34%). Meanwhile, in the downstream marshes, sea marigold cover did not significantly increase (before: 7–44%; after: 5–26%) whilst pickleweed cover did not significantly decrease (before: 28–54%; after: 28–56%). Plant species richness increased in the marsh directly receiving water additions (before: 1.6–2.1 species/1.25 m2; after four years: 3.4 species/1.25 m2) – but only to a similar level as the downstream marshes (before: 1.6–4.3; after four years: 3.1–4.4). Methods: Every day from October 1998, treated wastewater was discharged into one marsh in the Nueces Delta (via holding ponds), to compensate for reduced freshwater inputs and hypersalinity linked to upstream dams. Three downstream marshes, less affected by the wastewater inputs, provided comparisons. Plant species and their cover were surveyed before (June 1996–November 1997) and after (spring 1999–2002) water additions, along 11 transects/marsh/survey.
A replicated, paired, site comparison study in 2007–2009 of eight brackish/salt marshes in Texas, USA (9) found that managed marshes (impounded and drawn down each spring/autumn, along with annual disking) and unmanaged marshes (subjected to neither of these interventions) had few plant species in common, but had similar overall plant species richness and diversity. Only 24–34% of plant species were found in both managed and unmanaged marshes (reported as a similarity index). However, both marsh types had statistically similar plant species richness (six of six comparisons; managed: 12–21 species/marsh; unmanaged: 8–18 species/marsh) and plant diversity (six of six comparisons; data reported as a diversity index). Methods: In autumn, winter and spring 2007/2008 and 2008/2009, vegetation was surveyed in four pairs of managed and unmanaged marshes (fifty-six 1-m2 quadrats/marsh, placed along transects). The managed marshes had been impounded for 6–9 years to control water levels and salinity (drawdown each spring-autumn) and the soil surface was disked every spring. The study does not distinguish between the effects of these interventions. All marshes were grazed each summer and burned every three years. The marshes were brackish in 2007/2008 (managed: <2 ppt; unmanaged: <10 ppt) but saline in 2008/2009 following a hurricane and storm surge (e.g. average salinity in managed marshes: 20 ppt).
A before-and-after study in 1994–2011 of a lakeshore brackish/saline marsh in Tunisia (10) reported that after releasing water through upstream dams to restore winter flooding, the area of a bulrush-dominated community increased. In 1994–2002, the marsh was drier and more saline than normal. The main waterway feeding the marsh had been channelized to flow through the marsh (rather than into it) and dams had been built upstream. Vegetation dominated by bulrush Bolboschoenus glaucus covered 0–14 ha of the marsh, whilst salt marsh communities (dominated by glasswort Sarcocornia fruticosa and sea barley Hordeum marinum) covered 324–327 ha. In 2005, after three years of freshwater releases (along with heavy rains) that

8. Threat: Natural system modifications
123
raised the water level of the lake, restored winter flooding and reduced salinity, bulrush-dominated vegetation expanded to cover 241 ha. Salt marsh vegetation covered 468 ha. In 2008–2011, continued freshwater releases (along with construction of dams and perpendicular embankments along the canal within the marsh, to hold back water; see Section 8.1) maintained bulrush-dominated vegetation coverage at 192–298 ha. Salt-marsh vegetation covered 296–399 ha. Methods: Between 2005 and 2011, vegetation in Joumine Marsh was mapped using field surveys and satellite images. The study compared these maps to previously published maps. Large-scale release of freshwater into the lake began in autumn 2002.
(1) Welling C.H., Pederson R.L. & van der Valk A.G. (1988) Recruitment from the seed bank and the development of zonation of emergent vegetation during a drawdown in a prairie wetland. Journal of Ecology, 76, 483–496.
(2) Welling C.H., Pederson R.L. & van der Valk A.G. (1988) Temporal patterns in recruitment from the seed bank during drawdowns in a prairie wetland. Journal of Applied Ecology, 25, 999–1007.
(3) Flynn K.M., Mendelssohn I.A. & Wilsey B.J. (1999) The effect of water level management on the soils and vegetation of two coastal Louisiana marshes. Wetlands Ecology and Management, 7, 193–218.
(4) Gabrey S.W., Afton A.D. & Wilson B.C. (1999) Effects of winter burning and structural marsh management on vegetation and winter bird abundance in the Gulf Coast Chenier Plain, USA. Wetlands, 19, 594–603.
(5) Mesléard F., Lepart J., Grillas P. & Mauchamp A. (1999) Effects of seasonal flooding and grazing on the vegetation of former ricefields in the Rhône delta (southern France). Plant Ecology, 145, 101–114.
(6) Gabrey S.W., Afton A.D. & Wilson B.C. (2001) Effects of structural marsh management and winter burning on plant and bird communities during summer in the Gulf Coast Chenier Plain. Wildlife Society Bulletin, 29, 218–231.
(7) Johnson Randall L.A. & Foote A.L. (2005) Effects of managed impoundments and herbivory on wetland plant production and stand structure. Wetlands, 25, 38–50.
(8) Forbes M.G., Alexander H.D. & Dunton K.H. (2008) Effects of pulsed riverine versus non-pulsed wastewater inputs of freshwater on plant community structure in a semi-arid salt marsh. Wetlands, 28, 984–994.
(9) Fitzsimmons O.N., Ballard B.M., Merendino M.T., Baldassarre G.A. & Hartke K.M. (2012) Implications of coastal wetland management to nonbreeding waterbirds in Texas. Wetlands, 32, 1057–1066.
(10) Ouali M., Daoud-Bouattour A., Etteieb S., Gammar A.M., Ben Saad-Limam S. & Ghrabi-Gammar Z. (2014) Le marais de Joumine, Parc National de l’Ichkeul, Tunisie: diversité floristique, cartographie et dynamique de la végétation (1925–2011) [Joumine Marsh, National Park of Ichkeul, Tunisia: floristic diversity, vegetation mapping and dynamics (1925–2011)]. Revue d'Écologie (Terre et Vie), 69, 3–23.
8.4.3 Actively manage water level: freshwater swamps
Two studies evaluated the effects, on vegetation, of active water level management in freshwater swamps. Both studies were in the USA.
VEGETATION COMMUNITY
Overall richness/diversity (1 study): One before-and-after study of a swamp/marsh in the USA1 found that overall plant diversity was higher in the autumn following a managed flood/drawdown than in the autumn before.
VEGETATION ABUNDANCE
Tree/shrub abundance (1 study): One site comparison study of floodplain swamps in the USA2 found that an artificial flood had no significant effect on tree seedling density in a low and very wet swamp, but increased tree seedling density in a drier swamp higher on the floodplain.
Individual species abundance (1 study): One before-and-after study of a swamp/marsh in the USA1 reported mixed responses of individual plant species’ cover to active water level management.

8. Threat: Natural system modifications
124
However, the study found that cover of the dominant woody species, Pacific willow Salix lucida, was higher in the autumn following a managed flood/drawdown than in the autumn before.
VEGETATION STRUCTURE
A before-and-after study in 2003–2004 of a freshwater wetland with marsh and swamp vegetation in Oregon, USA (1) found that following a managed flood/ drawdown, plant diversity increased and there were changes in cover of individual plant taxa. Plant diversity was higher in the autumn after the flood/drawdown than in the autumn before (data reported as a diversity index). Of 21 plant taxa for which cover data were reported, 12 became more abundant, including knotweeds Polygonum spp. (before: 21%; after: 35%) and Pacific willow Salix lucida (before: 11%; after: 15%). The cover of seven taxa declined, including invasive reed canarygrass Phalaris arundinacea (before: 44%; after: 41%). The largest canarygrass declines occurred under regenerating tree canopies and in areas more deeply flooded during spring 2004 (see original paper for data). Methods: In 2004, a water control structure was used to restore a more natural water regime to a floodplain wetland: high winter and spring water levels (flooding some surveyed areas) followed by summer drawdown (exposure to natural tides). Over the previous 20 years, the water level had been artificially stabilized and reed canarygrass had invaded. Vegetation was surveyed around the edge of the wetland, in the autumn before (2003) and after (2004) the managed flood/drawdown. Plant species were recorded at 10 cm intervals along 27 transects (approximately 25,000 total points sampled), spanning marshy areas (open, herbaceous) and swampy areas (with a tree canopy). The study does not generally separate results from the two habitat types.
A site comparison study in 2006–2007 of two forested floodplains in South Carolina and Georgia, USA (2) found that an artificial flood pulse increased the number of tree seedlings in one of two forest types, but had no significant effect in the other. No data were reported for these results. The Savannah River floodplain was artificially flooded in spring 2006 by releasing water from an upstream reservoir, but was not flooded in spring 2007. In cypress-tupelo swamp forest, the number of tree seedlings/plot did not significantly differ between years. In bottomland hardwood forest (higher up on the floodplain), the number of tree seedlings/plot was greater in summer 2006 than summer 2007. The nearby Altamaha River floodplain experienced natural floods in spring 2006 and 2007. Here, the overall number of tree seedlings/plot did not significantly differ between years for both forest types. Methods: Tree seedlings were counted in July–September 2006 and 2007, in around 50 permanent 30-m2 plots/river/year.
(1) Jenkins N.J., Yeakley J.A. & Stewart E.M. (2008) First-year responses to managed flooding of lower Columbia River bottomland vegetation dominated by Phalaris arundinacea. Wetlands, 28, 1018–1027.
(2) Lee L.S., Garnett J.A., Bright E.G., Sharitz R.R. & Batzer D.P. (2016) Vegetation, invertebrate, and fish community response to past and current flow regulation in floodplains of the Savannah River, southeastern USA. Wetlands Ecology and Management, 24, 443–455.
8.4.4 Actively manage water level: brackish/saline swamps
We found no studies that evaluated the effects, on vegetation, of active water level management in brackish/saline swamps.
This means that we have not yet found any studies that have directly evaluated this intervention during our systematic journal and report searches. Therefore we have no evidence to indicate whether or not the intervention has any desirable or harmful effects.

8. Threat: Natural system modifications
125
8.5 Divert/block/stop saltwater inputs
We found no studies that evaluated the effects, on vegetation, of diverting/blocking/stopping saltwater inputs to marshes or swamps.
This means that we have not yet found any studies that have directly evaluated this intervention during our systematic journal and report searches. Therefore we have no evidence to indicate whether or not the intervention has any desirable or harmful effects.
Background
Marshes and swamps may be threatened by inputs of the wrong type of water. This intervention involves limiting inputs of salty water to marshes or swamps of lower salinity. Clearly, this includes keeping brackish, saline and hypersaline water out of freshwater sites. Less intuitively, it might also be desirable to keep hypersaline water out of brackish or saline sites. Both inland and coastal wetlands can suffer from excess saltwater inputs. Chronic inputs may be related to groundwater extraction (causing subsidence of coastal areas), construction of canals (which allow salt water to penetrate further inland), elongation of tidal creeks, and global sea level rise (Wang 1988; White & Kaplan 2017). Acute inputs can occur during storms and tsunamis.
Specific infrastructure to divert or block water includes pipes, channels, waterways, pumps, impoundments, plugs or dams. Intervention may be permanent (e.g. blocking input channels) or temporary (e.g. diverting saltwater inputs during storm surges).
CAUTION: Diversions could shift the problem to another habitat: a suitable recipient habitat, where impacts will be minimal, should be chosen. Consider potential negative impacts of reducing water and sediment inputs to the focal marsh or swamp.
Related interventions: Plug/dam canals or trenches (5.2); Actively manage water level, including by adding fresh water (8.4); Divert/block/stop freshwater inputs (8.6); modify farming practices, including irrigation, in catchment (10.13–10.15); Build barriers to protect littoral marshes or swamps from rising water levels and severe weather (11.2).
Wang F.C. (1988) Dynamics of saltwater intrusion in coastal channels. Journal of Geophysical Research: Oceans, 93, 6937–6946.
White E. Jr. & Kaplan D. (2017) Restore or retreat? Saltwater intrusion and water management in coastal wetlands. Ecosystem Health and Sustainability, 3, e01258.
8.6 Divert/block/stop freshwater inputs
We found no studies that evaluated the effects, on vegetation, of diverting/blocking/stopping excessive freshwater inputs to marshes or swamps.
This means that we have not yet found any studies that have directly evaluated this intervention during our systematic journal and report searches. Therefore we have no evidence to indicate whether or not the intervention has any desirable or harmful effects.
Background
Marshes and swamps may be threatened by inputs of the wrong type of water. This intervention involves limiting freshwater inputs to marshes or swamps, including (a) freshwater inputs to brackish or saline sites, (b) surface water inputs to sites normally fed by groundwater and (c) groundwater inputs to sites normally fed by surface

8. Threat: Natural system modifications
126
water. Construction of pipes, channels, waterways, pumps, impoundments or dams can help to achieve these goals. Intervention may be permanent (e.g. blocking input channels) or temporary (e.g. diverting freshwater inputs during storms).
Stormwater might be deliberately diverted into wetlands. Otherwise, paved and tarmac surfaces in urban areas can increase the amount of runoff into neighbouring wetlands. Excess fresh water in brackish/saline marshes or swamps can alter the vegetation, including replacement of salt-tolerant plant species with freshwater species (Zedler 1983). Further, differences in temperatures, chemical composition and oxygen content between surface water and ground water can affect the type of plant communities that grow in sites fed by one or the other (Winter et al. 1999).
CAUTION: Clearly, diversions could shift the problem to another habitat: a suitable recipient habitat, where impacts will be minimal, should be chosen. Diverting freshwater inputs may deprive coastal marshes and swamps of the sediment they need to keep up with sea level rise (Ibáñez et al. 2010).
Related interventions: Plug/dam canals or trenches (5.2); Facilitate tidal exchange to restore degraded marshes or swamps (8.3); Actively manage water level, including by adding salt water (8.4); Divert/block/stop saltwater inputs (8.5); modify farming practices, including irrigation, in catchment (10.13–10.15).
Ibáñez C., Sharpe P.J., Day J.W. & Prat N. (2010) Vertical accretion and relative sea level rise in the Ebro Delta Wetlands (Catalonia, Spain). Wetlands, 30, 979–988.
Winter T.C., Harvey J.W., Franke O.L. & Alley W.M. (1999) Ground Water and Surface Water: a Single Resource. US Geological Survey Circular 1139.
Zedler J.B. (1983) Freshwater inputs in normally hypersaline marshes. Estuaries, 6, 346–355.
Modified disturbance regime: too little
8.7 Cut/mow herbaceous plants to maintain or restore disturbance
Background
Disturbance can clear dominant plants, maintain light availability and control nutrient levels – and may maintain vegetation in a desirable and/or species-rich state (Hall et al. 2008; Middleton 2013). Therefore, conservationists sometimes want to actively restore disturbance where it has ceased, or maintain disturbance at a site where it would otherwise be lost. Mowing or cutting is one way to do this. This intervention includes machine mowing, hand clipping, strimming and scything of herbs or small shrubs, or swards of vegetation containing these types of plants.
Cutting itself may be the historic or traditional disturbance that maintains vegetation in a desirable state. For example, in Mexico’s Central Altiplano region, people have harvested marsh vegetation for millennia. Cattails and bulrushes are cut for crafts, construction, animal feed and fertilizer. This allows subordinate marsh plant species to persist (Hall et al. 2008). However, cutting activities may slow or cease as demand for the cut vegetation declines, skills are lost, or cheap imports reduce the economic viability of cutting (Clover 2002).
This intervention includes evidence for all forms of cutting/mowing in historically disturbed marshes, but bear in mind that the effects might be highly dependent on

8. Threat: Natural system modifications
127
how the cutting/mowing is carried out (e.g. extent, timing, frequency and duration) and site conditions (e.g. nutrient availability and water levels) (Rolletschek et al. 2000; Russell & Kraaij 2008; Fogli et al. 2014).
Related interventions: Use cutting/mowing to control problematic herbaceous plants, whose success is not linked to a change in disturbance regime (9.8); Cut large trees/shrubs to maintain or restore disturbance (8.8); Reduce frequency of cutting/ mowing (8.13); Reduce intensity of cutting/mowing (8.14); Change season/timing of cutting/mowing (8.15).
Clover C. (2002) Grim reaper hangs over reed-cutting industry. Available at http://www.telegraph.co.uk/news/uknews/1411568/Grim-reaper-hangs-over-reed-cutting-industry.html. Accessed 4 September 2019.
Fogli S., Brancaleoni L., Lambertini C. & Gerdol R. (2014) Mowing regime has different effects on reed stands in relation to habitat. Journal of Environmental Management, 134, 56–62.
Hall S.J., Lindig-Cisneros R. & Zedler J.B. (2008) Does harvesting sustain plant diversity in Central Mexican wetlands? Wetlands, 28, 776–792.
Middleton B.A. (2013) Rediscovering traditional vegetation management in preserves: trading experiences between cultures and continents. Biological Conservation, 158, 750–760.
Rolletschek H., Rolletschek A., Hartzendorf T. & Kohl J. (2000) Physiological consequences of mowing and burning of Phragmites australis stands for rhizome ventilation and amino acid metabolism. Wetlands Ecology and Management, 8, 425–433.
Russell I.A. & Kraaij T. (2008) Effects of cutting Phragmites australis along an inundation gradient, with implications for managing reed encroachment in a South African estuarine lake system. Wetlands Ecology and Management, 16, 383–393.
8.7.1 Cut/mow herbaceous plants to maintain or restore disturbance:
freshwater marshes
Twenty studies evaluated the effects, on vegetation, of cutting/mowing to maintain or restore disturbance in freshwater marshes. There were four studies in Belgium2–4,7, three of which2,3,7 took place in one wetland area so probably shared some experimental plots. There were two studies in each of the UK6a,6b, the USA10,19 and Estonia15,17. There was one study in each of seven other European countries1,5,8,9,11,14,18, Japan12, Mexico13 and Brazil16. In 15 of the studies1–5,6a,7–15 vegetation was measured at least six months after the last cut.
VEGETATION COMMUNITY
Community composition (6 studies): Four replicated, paired, controlled studies (two also randomized and before-and-after) of freshwater marshes and wet meadows in Belgium2, Switzerland5, Mexico13 and Estonia15 reported that the overall plant community composition differed between cut and uncut sites after 1–5 years, or typically diverged in cut and uncut areas over 3–10 years. One before-and-after study in a freshwater marsh in Belgium3 reported that the overall plant community composition changed over seven years after resuming annual mowing. One replicated, paired, controlled, before-and-after study in wet grasslands in Germany14 reported that over 20 years, mowing increased the average moisture preference of the vegetation.
Overall richness/diversity (11 studies): Seven studies (including two replicated, paired, controlled) in freshwater marshes in Belgium2–4,7, the UK6a, Mexico13 and Estonia17 reported that cut marshes had higher plant species richness than uncut marshes. Two of these studies6a,13 reported the same result for diversity. One before-and-after study in a freshwater marsh in Belgium3 reported that plant species richness increased over seven years after resuming annual mowing. Three replicated, paired, controlled studies in reedbeds in the UK6b and wet meadows in Germany14 and Estonia15 reported that cutting typically had no clear or significant effect on plant

8. Threat: Natural system modifications
128
species richness, after 3–5 months6b or over 5–20 years14,15. The two studies in the UK6b and Estonia15 found the same result for diversity.
Characteristic plant richness/diversity (1 study): One replicated, paired, controlled, before-and-after study in a temporary marsh in France11 reported that two years of annual autumn cutting increased the number of habitat-characteristic plant species present.
VEGETATION ABUNDANCE
Overall abundance (3 studies): Two replicated, controlled studies (one also randomized, paired, before-and-after) in freshwater marshes in the USA10,19 found that cutting had no significant effect on overall vegetation cover over 72 days19 or three years10. One replicated, paired, controlled study in wet grasslands in Belgium7 reported that plots mown annually for two years contained less above-ground biomass, just before mowing, than unmown plots.
Herb abundance (1 study): One replicated, paired, controlled, before-and-after study in wet grasslands in Germany14 reported that mowing increased sedge cover over 20 years, but had no clear effect on cover of rushes, forbs, ferns, grasses and legumes.
Tree/shrub abundance (1 study): One replicated, randomized, paired, controlled, before-and-after study in a wet prairie in the USA10 found that cutting had no significant effect on woody plant cover: there were similar increases, over three years, in cut and uncut plots.
Bryophyte abundance (1 study): One replicated study in a freshwater marsh in Belgium2 reported that total moss cover increased over five years after resuming annual mowing.
Individual species abundance (15 studies): Fifteen studies1–5,6a,6b,7–10,12,13,16,18 quantified the effect of this intervention on the abundance of individual plant species. For example, five studies (including one replicated, randomized, paired, controlled) in freshwater marshes in Belgium2,4, the UK6a,6b and the Czech Republic9 reported that common reed Phragmites australis was more abundant in cut than uncut areas. Two studies (one site comparison, one before-and-after) in fresh/brackish marshes in Belgium3 and Denmark8 reported that cutting reduced common reed cover3 or density8. The two studies in Belgium2,3 reported that cutting had no clear effect on common reed frequency. Four studies (including one replicated, randomized, paired, before-and-after) in freshwater marshes in the Netherlands1, Switzerland5, Japan12 and Italy18 found that the effect of cutting on common reed abundance depended on factors such as the year1, plant community type5,18, cutting season5, cutting intensity5,18 and time since mowing12.
VEGETATION STRUCTURE
Overall structure (1 study): One replicated, randomized, paired, controlled study in wet meadows in Switzerland5 reported that mown plots experienced a shift in vegetation cover towards lower vegetation layers, over 3–4 years, compared to a shift to upper layers in unmown plots.
Visual obstruction (1 study): One replicated, controlled study in a freshwater marsh in Belgium4 reported that summer-cut plots had lower horizontal vegetation cover than uncut plots (or winter-cut plots) over six years after resuming annual mowing.
Height (6 studies): Three replicated, controlled studies (one also randomized and paired) in freshwater marshes in Belgium4, the UK6b and the USA19 reported that cut marshes had shorter vegetation than uncut marshes. This was true for vegetation overall19, vegetation other than common reed Phragmites australis4, and for common reed cut in winter4 or spring6b (but not summer4). Two replicated, paired, controlled, before-and-after studies in a marsh in Mexico13 and wet grasslands in Germany14 reported that cutting/mowing had no significant or clear effect on vegetation height, after 12 months or over 20 years. One site comparison study in the Czech Republic9 found that common reed was taller, when measured in the summer, in a winter-mown reedbed than in an unmown reedbed.

8. Threat: Natural system modifications
129
Diameter/perimeter/area (5 studies): Two studies (one site comparison, one before-and-after) in fresh/brackish marshes in Belgium3 and Denmark8 reported that cutting, or time since last cutting, had no significant or clear effect on the stem diameter of common reed Phragmites australis. Two studies (including one replicated, randomized, paired, controlled) of reedbeds in the UK6b and the Czech Republic9 found that cut areas contained thicker reed stems than uncut areas, after one growing season. One replicated, randomized, paired, controlled, before-and-after study in wet meadows in Switzerland5 found that the effect of cutting on common reed shoot diameter depended on the plant community type and season of mowing.
Basal area (1 study): One site comparison study in a fresh/brackish marsh in Denmark8 found that the basal area of common reed Phragmites australis stems was smaller in a reedbed cut two years previously than in a reedbed cut seven years previously. Only “tall” stems were sampled.
OTHER
Survival (1 study): One replicated, randomized, paired, controlled study in a wet prairie in the USA10 found that mowing had no significant effect on woody plant survival over the following year.
A replicated, paired, controlled study in 1972–1975 in a created reedbed in the Netherlands (1) reported mixed effects of winter mowing on the subsequent density of common reed Phragmites australis. Statistical significance was not assessed. In two of three comparisons (both in 1972), the maximum annual reed density was lower in mown plots (340–450 stems/m2) than in unmown plots (520–730 stems/m2). In the other comparison (in 1974), the maximum annual reed density was higher in a mown plot (470 stems/m2) than in an unmown plot (250 stems/m2). Methods: In 1971, two pairs of plots were established in a young reedbed (sown in 1968). One pair was in a wetter area (flooded spring to autumn). One pair was in a drier area (water table 30–100 cm below surface). Between 1972 and 1975, one plot/pair was mown each winter. The other plots were not mown. All standing reed stems were counted between April and October each year (0.25–0.50 m2 quadrats; 4–6 quadrats/plot/ sampling date).
A replicated, paired, controlled study in 1977–1982 in a freshwater marsh in Belgium (2) reported that winter-mown plots developed a different plant community to unmown plots, typically with more plant species, higher cover of common reed Phragmites australis and lower cover of two weedy herb species. Statistical significance was not assessed. Over five years, mown and unmown plots contained distinct plant communities (data reported as a graphical analysis). More plant species were recorded in winter-mown plots than unmown plots in 25 of 25 comparisons (mown: 9–29 species/plot; unmown: 4–11 species/plot) – but a larger area was probably sampled in mown plots. The mown plots had higher common reed cover in 20 of 25 comparisons (for which mown: 55–90%; unmown: 25–86%), but lower cover of bindweed Calystegia sepium in 23 of 30 comparisons (for which mown: 5–67%; unmown: 27–84%) and lower cover of common nettle Urtica dioica in 25 of 25 comparisons (for which mown: 3–31%; unmown: 27–86%). Mowing had no clear effect on the frequency of each species (see original paper for data). Total moss cover increased in mown plots, from 0–9% after one annual mow to 18–58% after five annual mows (data for unmown plots not reported). Methods: Five pairs of plots (each 200–300 m2) were established in areas of degraded, weed-invaded marsh (where “traditional management” had ceased, and which had been partially drained). Each winter between 1977/1978 and 1981/1982, one plot in each pair was mown. The other plots were not mown. Each summer between 1978 and 1982, plant species and their cover were recorded in 3–12 permanent quadrats/plot (quadrat size not

8. Threat: Natural system modifications
130
reported). Some of the plots in this study may also have been used in (4), but this was not clearly reported.
A before-and-after study in 1978–1986 in a freshwater marsh in Belgium (3) reported that following the reinstatement of summer mowing, the plant community composition changed, species richness increased and cover of dominant herbs decreased. Statistical significance was not assessed. Over eight years, the overall plant community composition in the mown plot changed (data reported as a graphical analysis). The plot contained 15 plant species before mowing, compared to 25 species after seven years of mowing. Typical wet meadow species were only present after mowing (not quantified). Over the same time period, cover of the dominant herb species decreased: common reed Phragmites australis from 82% to 30%, bindweed Calystegia sepium from 66% to 7%, purple small-reed Calamagrostis canescens from 51% to 24%, and common nettle Urtica dioica from 24% to 1%. However, only common nettle occurred in fewer quadrats after eight years of mowing than before (decline from 75% to 18%). Common reed and bindweed maintained near 100% frequency, and the frequency of purple small-reed increased from 18% to 75%. Methods: Each summer between 1979 and 1985, one 225-m2 plot in a degraded, reed-dominated marsh (where “traditional management” had ceased, and which had been partially drained) was mown (once or twice per year). Cuttings were removed. In July 1978–1982 and 1986 (before mowing when applicable), plant species and their cover were recorded in 12 permanent quadrats in the plot (quadrat size not reported). The plot in this study may also have been used in (4), but this was not clearly reported.
A replicated, controlled study in 1978–1984 in a freshwater marsh in Belgium (4) reported that cut plots consistently contained more plant species, less of two weedy herb species and shorter vegetation than uncut plots, but reported that other effects on vegetation depended on the season/frequency of cutting. Statistical significance was not assessed. After six years, cut plots contained 17–23 plant species (compared to only 6–11 species in uncut plots). Bindweed Calystegia sepium and common nettle Urtica dioica were less abundant in cut than uncut plots, whereas common reed Phragmites australis was more abundant in cut plots (data reported as abundance classes). In cut plots, vegetation other than common reed was only 58–93 cm tall (vs uncut: 111–135 cm). In winter-cut plots, common reed was only 84 cm tall (vs summer-cut: 128–154 cm; uncut: 130–154 cm). Summer-cut plots had only 57–62% horizontal vegetation cover (vs winter-cut: 95%; uncut: 80–99%). Summer-cut plots had 5% cover of bare ground (i.e. not covered by vegetation or litter; vs 0% in winter-cut and uncut plots). Methods: Ten 300-m2 plots were established in areas of degraded, weed-invaded marsh. Vegetation in the marsh was historically cut, but had not been since the 1950s. The marsh was also partially drained. Three plots were cut by hand: two plots once each winter (November–March) from 1977/1978, and one plot twice each summer (July and September) from 1978. The other seven plots were left uncut. Vegetation was surveyed in summer (May–August) 1984. Horizontal cover was measured by viewing vegetation against a vertical board. This study may have used the same plots as (2) and (3), but this was not clearly reported.
A replicated, randomized, paired, controlled study in 1983–1986 in two wet meadows in Switzerland (5) reported that resuming annual mowing affected plant community composition and shifted the vegetation cover into lower layers. Statistical significance was not assessed. Within each of the two studied community types, the overall plant community composition became less similar in mown and unmown plots

8. Threat: Natural system modifications
131
over 3–4 years (partial data reported as a graphical analysis). Meanwhile, mown plots experienced a shift in vegetation cover towards lower layers, whilst vegetation cover in unmown plots shifted towards the upper layers. This was true for vegetation overall, and for the dominant species in each community (partial data reported, as number of times survey pins touched living vegetation). These community and structural responses were similar whether cutting was done in summer or winter. However, responses of other individual species (e.g. density, shoot diameter and biomass of common reed Phragmites australis) differed between community types and mowing seasons (see Section 8.15 and original paper). Methods: Three sets of three plots (each 121–169 m2) were established in two historically mown lakeside wet meadows, that had been abandoned for “many years”. One random plot/set received each treatment: winter mowing (from early 1983), late summer mowing (from 1983) or no mowing. Cuttings were removed. Vegetation was surveyed each summer 1983–1986 (before annual mowing, where applicable).
A replicated, paired, site comparison study in 1988 of reedbeds in 12 sites in England, UK (6a) found that cut reedbeds had a significantly higher density of reed stems than uncut reedbeds, but also had significantly greater plant species richness and diversity (data not reported). Of 42 common, non-reed plant species for which data were reported, 25 were significantly more frequent in cut reedbeds (present in 2–93% of samples) than in uncut reedbeds (in 0–44% of samples). Three species were significantly less frequent in cut reedbeds (in <1–10% of samples) than in uncut reedbeds (in 4–23% of samples). Methods: In July and August 1988, vegetation was surveyed in two adjacent reedbeds in each of 12 sites. One reedbed/site had been cut “regularly” for 20 years (cuttings were removed), with the other unmanaged (neither cut nor burned) for ≥3 years. Reed stems (both live and dead) were counted in twenty 0.25-m2 quadrats/reedbed. Plant species were recorded in each quarter of each quadrat.
A replicated, randomized, paired, controlled study in 1988 in a reedbed in England, UK (6b) found that cut plots contained more (but shorter and slightly thicker) reed stems than uncut plots after one growing season, but similar plant richness and diversity. After 3–5 months, cut plots contained a higher density of reed stems (720 stems/m2) than uncut plots (484 stems/m2). On average, reed stems were shorter but thicker in cut plots (148 cm tall; 3.7 mm diameter) than uncut plots (177 cm tall; 3.5 mm diameter). Cut and uncut plots had statistically similar plant species richness (data reported but units not clear) and diversity (data reported as a diversity index). Of 17 common, non-reed plant species for which data were reported, 12 were more frequent in cut plots than in uncut plots (statistical significance not assessed; see original paper for data). Methods: Five pair of 30 x 40 m plots were established in a reedbed that had not been managed for ≥10 years. In March 1988, one random plot/pair was cut. Cuttings were removed. The other plots were left unmanged. All plots were flooded from April 1988. Vegetation was surveyed in July and August 1988. Live and dead reed stems were counted, and plant species were recorded, in 0.25-m2 quadrats (number not clear). Forty live reed stems/plot were measured. This summary takes some contextual and methodological details from Ditlhogo et al. (1992).
A replicated, paired, controlled study in 1986–1988 in five wet grasslands in Belgium (7) reported that plots in which annual mowing continued contained less plant biomass than unmown plots after two years, and were more dominated by a single species but contained more plant species. Statistical significance was not

8. Threat: Natural system modifications
132
assessed. After two years, mown plots contained less above-ground plant biomass (550 g/m2 standing vegetation; 710 g/m2 including litter) than unmown plots (770 g/m2 standing vegetation; 1,120 g/m2 including litter). Acute sedge Carex acuta comprised 92% of the standing vegetation biomass in mown plots, compared to only 65% in unmown plots. However, mown plots contained more plant species (17–20 species/6 m2) than unmown plots (16 species/6 m2). The exact nature of changes in biomass and species richness over time depended on the month in which mowing was carried out (see Section 8.15). The study also reported data on the cover of some example individual plant species (see original paper). Methods: In spring 1986, seven 7 x 7 m plots were established in each of five adjacent wet grasslands (mown annually for the previous 10 years). From 1986, one plot/grassland was mown in each month between June and November. Cuttings were removed. In the other plot in each grassland, mowing was stopped. Vegetation was surveyed each summer between 1986 and 1988. Biomass was cut and collected from five 30 x 30 cm quadrats/plot/ year, before any mowing in that year, then dried and weighed.
A site comparison study in 1994 of two reedbeds in a fresh/brackish wetland in Denmark (8) found that a recently cut reedbed supported a lower density of tall common reed Phragmites australis with a smaller basal area than a more mature reedbed, although reed diameter was similar in both areas. In a reedbed cut two years before measurement, tall common reed stems were less dense (217 stems/m2) than in a more mature reedbed, cut seven years before measurement (422 stems/m2). However, the diameter of these reed stems did not significantly differ between the reedbeds (recently cut: 2.9; more mature: 3.1 mm). Combining these metrics, tall reed stems occupied a smaller proportion of the more recently cut reedbed (1,497 mm2/m2) than the more mature reedbed (3,014 mm2/m2). Methods: In 1994, vegetation was surveyed around 14 points in each of two reedbeds: one last cut in 1992 and one last cut in 1987. The reedbeds had been commercially harvested for “many years” previously. Most points were around (but approximately 2 m from) greylag goose Anser anser nests. At each point, all reed stems >75 cm tall were counted in four 0.25-m2 quadrats. Twenty stems/quadrat were measured.
A site comparison study in 1996 of two adjacent reedbeds in the Czech Republic (9) found that a mown reedbed contained more, taller and thicker common reed Phragmites australis shoots than an unmown reedbed. The mown reedbed contained 79 reed shoots/m2, compared to 49 shoots/m2 in the unmown reedbed (statistical significance not assessed). Reed shoots in the mown reedbed were significantly taller (mown: 256 cm; unmown: 171 cm) and thicker (mown: 7.1 mm; unmown: 6.0 mm). Methods: In August 1996, vegetation was surveyed in two reedbeds with comparable nutrient levels: one mown in the previous winter, and one that had not been mown. The reedbeds were flooded between mowing and measurement. Surveys involved measurements of 25 shoots/reedbed, and counts of shoots in five 1-m2 quadrats/ reedbed.
A replicated, randomized, paired, controlled, before-and-after study in 1994–1997 in an ephemeral wet prairie in Oregon, USA (10) found that mowing did not significantly affect the overall vegetation cover, forb cover, cover of the dominant herb species, and woody plant cover or survival. Over three years, mown and unmown plots experienced similar proportional changes in overall vegetation cover (increase; mown: 60%; unmown: 31%), native forb cover (decrease; mown: 14%; unmown: 77%), non-native forb cover (increase; mown: 43%; unmown: 28%), cover of the dominant herb species, tussock grass Deschampsia cespitosa (mown: 1% decrease;

8. Threat: Natural system modifications
133
unmown: 30% increase; see original paper for data on other individual plant species) and woody plant cover (increase; mown: 25%; unmown: 20%). Furthermore, woody plants had similar survival rates over one year in mown plots (88%) and unmown plots (83%). Methods: In 1994, five pairs of plots (each 56–140 m2) were established in a degraded, seasonally flooded prairie. Woody plants had grown over 200 years of fire suppression. One plot/pair was mown (herbs and woody vegetation; cuttings removed) in autumn 1994 and 1996. Vegetation was surveyed before (summer 1994) and after mowing. Survival of six tagged woody plants/plot was recorded in summer 1995. Cover of selected herb species was recorded in three 0.5-m2 quadrats/plot in summer 1997.
A replicated, paired, controlled, before-and-after study in 2001–2003 in an ephemeral freshwater wetland dominated by tall herbs in southern France (11) reported that cutting the vegetation increased the number of plant species characteristic of Mediterranean temporary marshes. Statistical significance was not assessed. The number of characteristic plant species increased in cut plots, from 2–3 in the year before intervention to 6–12 in the two years after (units not reported). The number of characteristic plant species was relatively stable in unmanaged plots (before: 2–4; after: 3–6). Methods: Six pairs of plots were established near a reservoir, in an ephemerally flooded wetland where historical grazing had ceased. The plots were dominated by compact rush Juncus conglomeratus or bulrush Scirpus holoschoenus. In autumn 2001 and 2002, the vegetation was cut in one plot/pair. Cuttings were removed. Plant species were recorded in the year before intervention (2001) and for two years after (2002 and 2003).
A replicated, controlled, before-and-after study in 2000–2001 of a riparian reedbed near Tokyo, Japan (12) found that one summer cut reduced common reed Phragmites australis abundance in the first growing season, and reduced biomass but increased density in the second growing season. Before cutting, common reed abundance was statistically similar in all plots (above-ground biomass: 40–690 g/m2; density: 91–102 shoots/m2). In the first 3–4 months after cutting, reed abundance was lower in cut plots (biomass: 0–230 g/m2; density: 0–73 g/m2) than uncut plots (biomass: 690–1,010 g/m2; density: 103–113 shoots/m2). In the second growing season after cutting, reed biomass was lower in cut plots in 6 of 14 comparisons (for which cut: 260–910 g/m2; uncut: 520–1,040 g/m2; other comparisons no significant difference). In contrast, reed density was higher in cut plots in 12 of 12 comparisons (cut: 140–218 shoots/m2; uncut: 86–134 shoots/m2; statistical significance not assessed). Methods: In April 2000, three 6 x 10 m plots were established in a riparian reedbed. The site had been undisturbed for at least 10 years. Reeds were cut, 20–30 cm above ground level, from two of the plots (one in June 2000, one in July 2000). Cuttings were removed. The other plot was left undisturbed. Reed shoots were cut, counted, dried and weighed every 1–2 months between April and December 2000 and 2001 (three 0.125-m2 quadrats/plot/survey).
A replicated, randomized, paired, controlled, before-and-after study in 2006–2007 in a freshwater marsh in central Mexico (13) found that resuming cutting altered the plant community composition and increased plant richness and diversity, but had no lasting effect on dominance, height or density of southern cattail Typha domingensis. After one year, the overall plant community composition significantly differed between cut and uncut plots (data not reported). Cut plots had higher plant species richness (12.4–14.8 species/4 m2) than uncut plots (11.0 species/4 m2) and had greater plant diversity (data reported as a diversity index). In contrast, cut and uncut plots contained a similar relative abundance of southern cattail (data not

8. Threat: Natural system modifications
134
reported) with similar height (harvested: 164–291; abandoned: 178–299 cm) and shoot density (harvested: 4–20; abandoned: 5–25 ramets/m2). Before intervention, community composition, richness, diversity, cattail height and cattail density were similar in all plots (richness: 8.8–9.9 species/4 m2; other data not reported). Methods: In May 2006, thirty-two 3 x 7 m plots were established in a degraded marsh (historically harvested and grazed, but both activities “minimal” since 2002). The plots were split across two areas with different water levels. In 24 random plots (12 plots/area), vegetation was cut to 20 cm above the soil surface. In 16 of these plots, cattail was cut for up to five months afterwards. All cuttings were removed. The final eight plots (4 plots/area) were not cut. Plant species, plant cover and cattail height were recorded before (May 2006) and one year after (May 2007) the initial cut, in four 1-m2 quadrats/plot.
A replicated, paired, controlled, before-and-after study in 1987–2007 in three wet grasslands in northwest Germany (14) reported that plots mown twice each year experienced similar vegetation changes to unmown plots, with the exception of sedge abundance, species richness and community moisture value. Statistical significance was not assessed. Over 20 years, mown plots experienced increases in sedge cover, plant species richness, and the average moisture preference of the vegetation. In contrast, these metrics decreased in unmown plots. Other changes over time were similar (in direction if not in magnitude) in both mown and unmown plots. There were increases in rush cover, tall forb cover, fern cover and vegetation height. There were decreases in cover of grasses, legumes and short forbs. All data were reported as graphical analyses. Methods: From 1987, one plot (200–250 m2) in each of three wet grassland sites was mown (in June/July and September each year). One additional plot in each site was not mown. These sites had non-peaty soils, and had been maintained as fertilized pasture (one also mown) prior to the study. Trees and shrubs were removed from all plots throughout the study. Vegetation was surveyed in mid-June, every one or two years, between 1987 and 2007.
A replicated, paired, controlled, before-and-after study in 2000–2010 of three wet meadows in Estonia (15) found that annual mowing typically affected the overall plant community composition, but had no significant effect on plant richness or diversity. In three of five cases, mown plots had a significantly different overall plant community composition to unmown plots after 5–10 years, despite having a similar community composition before mowing began (data reported as graphical analyses). In ≥5 of 7 comparisons, mown and unmown plots had statistically similar plant species richness (mown: 2.1-7.0; unmown: 2.0-6.0 species/m2) and diversity (data reported as a diversity index). Before intervention, plots destined for each treatment had statistically similar richness and diversity in seven of seven comparisons. Mowing also had no clear effect on the proportion of grass-like plants in five of seven comparisons (similar change or lack of change over time in mown and unmown plots; see original paper for data). Methods: The study used three floodplain wet meadows that had been abandoned since the mid-1980s. From 2000 (two meadows) or 2005 (one meadow), parts of each meadow were mown each summer. Cuttings were typically not removed. Other parts were left unmown. Vascular plants were surveyed in the summer before mowing (2000) and after 5–10 years of mowing (2010), in 1-m2 quadrats in 2–3 plant community types/meadow.
A replicated, controlled study in 2005 in a freshwater marsh in southern Brazil (16) reported that cutting southern cattail Typha domingensis reduced its density and biomass for <60 days. After 1–26 days, cut plots contained fewer mature cattail stems

8. Threat: Natural system modifications
135
than uncut plots (cut: 0–5; uncut: 19–44 stems/m2) and less above-ground cattail biomass (cut: 50–70; uncut: 350–470 g/m2). After 60–182 days, cut and uncut plots contained a statistically similar number of mature stems (cut: 16–23; uncut: 16–29 stems/m2) and above-ground biomass (cut: 230–420; uncut: 300–440 g/m2). The density of young stems and dead stems never significantly differed between cut and uncut plots (see original paper for data). Methods: In June 2005, eight 1-m2 plots were established in a dense stand of southern cattail. Four plots were cut. Cuttings were removed. Four plots were left uncut. All cattail stems (mature: >80 cm tall; young: <80 cm tall; dead) were counted and measured in each plot until December 2005. Dry, above-ground biomass was estimated from stem heights.
A replicated, site comparison study in 2009–2010 of a lakeshore marsh in Estonia (17) reported that mown areas had higher plant species richness than unmown areas. Statistical significance was not assessed. Vegetation was surveyed in July/August, in the band of intermittently flooded wetland vegetation around the lake. There were 12.3 plant species/0.25 m2 in areas mown earlier that summer vs 5.9 plant species/0.25 m2 in areas not yet mown that summer. Methods: In July/August 2009 and 2010, plant species were recorded in 0.25-m2 quadrats, along nine transects on the edge of Lake Peipsi. This summary focuses on quadrats (number not clear) in the intermittently flooded zone between open water and upland terraces. The lakeshore had been reprofiled and cleared of undesirable tall vegetation (mostly common reed Phragmites australis and willows Salix spp.) 1–17 years previously, and regularly mowed (in summer) since.
A paired, controlled, before-and-after study in 2000–2002 in two lakeshore reedbeds in northern Italy (18) found that plots where mowing had been resumed typically had similar common reed Phragmites australis biomass to plots that remained unmown. After two years of resumed mowing, above-ground reed biomass was statistically similar in mown and unmown plots in three of four comparisons (for which mown: 370–1,751 g/m2; unmown: 375–1844 g/m2). In the other comparison, reed biomass was lower in plots mown twice each year (1,153 g/m2) than in unmown plots (1,844 g/m2). Before mowing, reed biomass was statistically similar in plots destined for each treatment (477–982 g/m2). Methods: In July 2000, three 10 x 10 m plots were established in each of two reedbeds on the shore of Lago di Aslerio. The reedbeds had been historically mown in winter (and sometimes in summer), but not for >30 years. From summer 2000, one plot/reedbed was mown once each year (August 2000 and 2001), one plot/reedbed was mown twice each year (February 2001 and 2002, plus August mowing), and one plot/reedbed was left unmown. Above-ground biomass was calculated from counts and measurements of reed shoots from three 1-m2 quadrats/plot, before intervention (July 2000) and two years later (July 2002).
A replicated, controlled study in 2010 in a permanent freshwater marsh in Florida, USA (19) found that cut plots contained shorter vegetation than uncut plots, but had similar overall vegetation cover and contained a similar amount of surface-encrusting algae. Over 72 days following intervention, emergent vegetation was shorter in cut than uncut plots. This was true for both the average height (cut: 83 cm; uncut: 165 cm) and maximum height (cut: 101 cm; uncut: 200 cm). Plots under each treatment had statistically similar overall vegetation cover (cut: 28%; uncut: 41%), cover of surface-encrusting algae (cut: 14%; uncut: 21%) and biomass of surface-encrusting algae (cut: 13 g/m2; uncut: 42 g/m2). Methods: In early April 2010, eight 100-m2 plots were established in a marsh dominated by sawgrass Cladium mariscus

8. Threat: Natural system modifications
136
ssp. jamaicense. Historically, this type of marsh was frequently disturbed by lightning fires. Four plots were cut with hedge trimmers, approximately 48 cm above marsh surface (32 cm above water). Cuttings were removed. The other four plots were not cut. Plants and algae were surveyed every 10 days, between 2 and 72 days after cutting. Algae were dried before weighing.
(1) van der Toorn J. & Mook J.H. (1982) The influence of environmental factors and management on stands of Phragmites australis. I. Effects of burning, frost and insect damage on shoot density and shoot size. Journal of Applied Ecology, 19, 477–499.
(2) Gryseels M. (1989) Nature management experiments in a derelict reedmarsh. I: effects of winter cutting. Biological Conservation, 47, 171–193.
(3) Gryseels M. (1989) Nature management experiments in a derelict reedmarsh. II: effects of summer mowing. Biological Conservation, 48, 85–99.
(4) Decleer K. (1990) Experimental cutting of reedmarsh vegetation and its influence on the spider (Araneae) fauna in the Blankaart Nature Reserve, Belgium. Biological Conservation, 52, 161–185.
(5) Buttler A. (1992) Permanent plot research in wet meadows and cutting experiment. Vegetatio, 103, 113–124.
(6) Cowie N.R., Sutherland W.J., Ditlhogo M.K.M. & James R. (1992) The effects of conservation management of reed beds. II. The flora and litter disappearance. Journal of Applied Ecology, 29, 277–284.
(7) Dumortier M., Verlinden A., Beeckman H. & van der Mijnsbrugger K. (1996) Effects of harvesting dates and frequencies on above and below-ground dynamics in Belgian wet grasslands. Écoscience, 3, 190–198.
(8) Kristiansen J.N. (1998) Nest site preference by greylag geese Anser anser in reedbeds of different harvest age. Bird Study, 45, 337–343.
(9) Rolletscheck H., Rolletscheck A., Hartzendorf T. & Kohl J.-G. (2000) Physiological consequences of mowing and burning of Phragmites australis stands for rhizome ventilation and amino acid metabolism. Wetlands Ecology and Management, 8, 425–433.
(10) Clark D.L. & Wilson M.V. (2001) Fire, mowing, and hand-removal of woody species in restoring a native wetland prairie in the Willamette Valley of Oregon. Wetlands, 21, 135–144.
(11) Félisiak D., Duborper E. & Yavercovski N. (2004) An example of management by removal of vegetation: Lac des Aurèdes (Var, France). Page 84 in: P. Grillas, P. Gauthier, N. Yavercovski & C. Perennou (eds.) Mediterranean Temporary Pools Volume 1 – Issues Relating to Conservation, Functioning and Management. Station Biologique de la Tour du Valat, Arles.
(12) Asaeda T., Rajapakse L., Manatunge J. & Sahara N. (2006) The effect of summer harvesting of Phragmites australis on growth characteristics and rhizome resource storage. Hydrobiologia, 553, 327–335.
(13) Hall S.J., Lindig-Cisneros R. & Zedler J.B. (2008) Does harvesting sustain plant diversity in Central Mexican wetlands? Wetlands, 28, 776–792.
(14) Poptcheva K., Schwartze P., Vogel A., Kleinebecker T. & Hölzel N. (2009) Changes in wet meadow vegetation after 20 years of different management in a field experiment (north-west Germany). Agriculture, Ecosystems & Environment, 134, 108–114.
(15) Metsoja J.-A., Neuenkamp L., Pihu S., Vellak K., Kalwij J.M. & Zobel M. (2012) Restoration of flooded meadows in Estonia – vegetation changes and management indicators. Applied Vegetation Science, 15, 231–244.
(16) Silveira T.C.L., Rodrigues G.G., Coelho de Souza G.P. & Würdig N.L. (2012) Effect of Typha domingensis cutting: response of benthic macroinvertebrates and macrophyte regeneration. Biota Neotropica, 12, 124–132.
(17) Palmik K., Mäemets H., Haldna M. & Kangur K. (2013) A comparative study of macrophyte species richness in differently managed shore stretches of Lake Peipsi. Limnologica, 43, 245–253.
(18) Fogli S., Brancaleoni L., Lambertini C. & Gerdol R. (2014) Mowing regime has different effects on reed stands in relation to habitat. Journal of Environmental Management, 134, 56–62.
(19) Venne L.S., Trexler J.C. & Frederick P.C. (2016) Prescribed burn creates pulsed effects on a wetland aquatic community. Hydrobiologia, 771, 281–295.
Additional Reference
Ditlhogo M.K.M., James R., Laurence B.R. & Sutherland W.J. (1992) The effects of conservation management of reed beds. I. The invertebrates. Journal of Applied Ecology, 29, 265–276.

8. Threat: Natural system modifications
137
8.7.2 Cut/mow herbaceous plants to maintain or restore disturbance:
brackish/salt marshes
Six studies evaluated the effects, on vegetation, of cutting/mowing to maintain or restore disturbance in brackish/salt marshes. Two studies were in France3,4. There was one study in each of the USA1, Denmark2, South Africa5 and Estonia6.
VEGETATION COMMUNITY
Community composition (1 study): One replicated, randomized, controlled, before-and-after study in brackish wet grasslands in Estonia6 found that annual cutting affected overall plant community composition, with significant differences between cut and uncut plots after four years.
Overall richness/diversity (3 studies): Two replicated, site comparison studies in France3,4 found that cut and uncut reedbeds had similar overall plant species richness. One replicated, randomized, controlled, before-and-after study in brackish wet grasslands in Estonia6 found that cut and uncut plots typically had similar plant species richness and diversity over four years.
VEGETATION ABUNDANCE
Overall abundance (1 study): One replicated, site comparison study in France4 found that cut and uncut reedbeds had similar cover of plants other than common reed Phragmites australis.
Individual species abundance (5 studies): Five studies2–6 quantified the effect of this intervention on the abundance of individual plant species. For example, two replicated, randomized, controlled, before-and-after studies in brackish marshes or grasslands in South Africa5 and Estonia6 found that cutting had mixed effects on the abundance of common reed Phragmites australis after 1–4 years, depending on the water level of the plots. One site comparison study in Denmark2 found that a fresh/brackish reedbed cut two years previously contained fewer “tall” common reed stems than a reedbed cut seven years previously. Two replicated, site comparison studies in France3,4 found that cut reedbeds contained a similar number (and, in one study3, biomass) of live reed stems than uncut reedbeds, but far fewer dead stems.
VEGETATION STRUCTURE
Height (4 studies): Two controlled studies (one also replicated, randomized, before-and-after) in brackish marshes in the USA1 and South Africa5 reported that rushes or reeds were shorter in cut plots than in uncut plots, for up to one year after cutting. Two replicated, site comparison studies in France3,4 found that live reed stems were a similar height in cut and uncut reedbeds.
Diameter/perimeter/area (3 studies): Two site comparison studies (one replicated) in fresh/ brackish reedbeds in Denmark2 and France3 found that common reed Phragmites australis stems were a similar diameter in cut and uncut reedbeds. One replicated, randomized, controlled, before-and-after study in a brackish marsh in South Africa5 found that cutting reduced the diameter of common reed stems present one year later.
Basal area (1 study): One site comparison study in a fresh/brackish marsh in Denmark2 found that the basal area of common reed Phragmites australis stems was smaller in a reedbed cut two years previously than in a reedbed cut seven years previously. Only “tall” stems were sampled.
A controlled study in 1977–1979 in a brackish marsh in Mississippi, USA (1) reported that cutting reduced black rush Juncus roemerianus height and dominance, and reduced big cordgrass Spartina cynosuroides dominance. Statistical significance was not assessed. In an initially rush-dominated area, black rush reached a maximum height of 130–134 cm in cut plots, in the year following the final cut (vs 203 cm in uncut plots). Rushes comprised only 39–80% of all plant biomass in cut plots (vs 62–94% in uncut plots). In an initially cordgrass-dominated area, cordgrass comprised

8. Threat: Natural system modifications
138
only 33–97% of all plant biomass in cut plots (vs 61–99% in uncut plots). Methods: Plots in a tidal brackish marsh, dominated by black rush or big cordgrass, were cut once (1979), twice (1978 and 1979) or three times (1977, 1978 and 1979). Some additional plots were left uncut. Cutting was done in winter and cuttings were removed. The marsh was historically burned, but not since 1973. Vegetation was surveyed from April to November 1979. The study does not report further details of the methods.
A site comparison study in 1994 of two reedbeds in a fresh/brackish wetland in Denmark (2) found that a recently cut reedbed supported a lower density of tall common reed Phragmites australis with a smaller basal area than a more mature reedbed, although reed diameter was similar in both areas. In a reedbed cut two years before measurement, tall common reed stems were less dense (217 stems/m2) than in a more mature reedbed, cut seven years before measurement (422 stems/m2). However, the diameter of these reed stems did not significantly differ between the reedbeds (recently cut: 2.9; more mature: 3.1 mm). Combining these metrics, tall reed stems occupied a smaller proportion of the more recently cut reedbed (1,497 mm2/m2) than the more mature reedbed (3,014 mm2/m2). Methods: In 1994, vegetation was surveyed around 14 points in each of two reedbeds: one last cut in 1992 and one last cut in 1987. The reedbeds had been commercially harvested for “many years” previously. Most points were around (but approximately 2 m from) greylag goose Anser anser nests. At each point, all reed stems >75 cm tall were counted in four 0.25-m2 quadrats. Twenty stems/quadrat were measured.
A replicated, site comparison study in 1998–1999 of 13 brackish reedbeds in southern France (3) found that cut reedbeds contained a similar number of plant species and a similar live reed structure to uncut reedbeds, but a lower density of dead reeds. Plant species richness did not significantly differ between cut and uncut reedbeds. This was analyzed separately for emergent species (cut: 0.3; uncut: 0.6 species/quadrat) and terrestrial species (cut: 0.2; uncut: 0.5 species/quadrat). The structure of live (green) common reed Phragmites australis also did not significantly differ between cut and uncut reedbeds. This was true for density (cut: 203; uncut: 164 stems/m2), stem diameter (cut: 4.6; uncut: 4.1 mm), height (cut: 146; uncut: 137 cm) and above-ground biomass (cut: 1,853; uncut: 1,291 g/m2). However, cut reedbeds contained a lower density of dead reeds (11 stems/m2) than uncut reedbeds (311 stems/m2). Other structural metrics were not reported for dead reeds. Methods: In May–June 1998 or 1999, vegetation was surveyed in five cut reedbeds (commercially harvested each winter) and eight uncut reedbeds (never harvested, or not harvested for at least eight years). The average salinity was 2–3 ppt. In each reedbed, vegetation was surveyed in 25 quadrats (25 x 25 cm) along each of two transects (250 m long). All standing reed stems were counted. One random living reed stem was measured in each quadrat. Biomass was calculated from density, diameter and height measurements.
A replicated, site comparison study in 1999 of eight brackish reedbeds in southern France (4) found that cut reedbeds contained fewer dead reeds than uncut reedbeds, but that cutting had no significant effect on live reed density, live reed height, plant species richness and non-reed cover. Cut reedbeds contained a significantly lower density of dead common reed Phragmites australis (5 stems/m2) than uncut reedbeds (224 stems/m2). However, there was no significant difference between treatments for live reed density (cut: 198; uncut: 107 stems/m2), live reed height (cut: 129; uncut: 165 cm), total plant species richness (cut: 5.0; uncut: 5.0

8. Threat: Natural system modifications
139
species/reedbed) and cover of plants other than common reed (cut: 12%; uncut: 10%). Methods: In late July 1999, vegetation was surveyed in five cut reedbeds (harvested each winter for ≥5 years) and eight uncut reedbeds (not harvested for >5 years). The average salinity was 3 ppt. Vegetation was surveyed in 24 quadrats (50 x 50 cm) in each reedbed. This included counting all standing reed stems and measuring one random living reed stem/quadrat.
A replicated, randomized, controlled, before-and-after study in 2004–2006 in a brackish marsh in South Africa (5) found that cutting common reed Phragmites australis had mixed effects on vegetation structure after 1–2 years, depending on water levels. For example in the driest zone, cut plots always contained more reeds than uncut plots (cut: 67–68; uncut: 17–28 shoots/1.5 m2), but there was no difference in overall reed volume (cut: 5,150–5,620; uncut: 3,280–6,880 cm3/1.5 m2). In cut plots, reeds were always shorter (cut: 21–23; uncut: 30–35 m/1.5 m2) and thinner (cut: 6; uncut: 8–9 mm diameter). Meanwhile in the wettest zone, cut plots always contained fewer reeds than uncut plots (cut: 3–6; uncut: 68–104 shoots/1.5 m2) with a smaller volume (cut: 180; uncut: 1,190–1,870 cm3/1.5 m2). The low density of reeds in wetter cut plots negates meaningful interpretation of length and diameter. Before intervention, vegetation structure did not significantly differ between plots (averaged over moisture zones; data not reported). Methods: In 2004, eight plots (each 200–400 m2) were established in a reed-invaded marsh on the edge of a brackish lake (5–8 ppt). Stabilized water levels, reduced disturbance from large herbivores and reduced fire frequency likely contributed to reed encroachment. In three random plots, reeds were clipped to ground level in late summer 2004 and 2005. Cuttings were removed. The other five plots were left uncut. All plots were perpendicular to the lake edge so were divided into three moisture zones: dry (flooded for roughly 30% of the study), moist (50%) and wet (100%). Reed structure was surveyed before (late summer 2004) and after 1–2 cuts (late summer 2005 and 2006), in six 0.25-m2 quadrats/zone/ plot.
A replicated, randomized, controlled, before-and-after study in 2003–2007 in two brackish wet grasslands in Estonia (6) found that annual cutting altered the overall plant community composition, but typically had no significant effect on plant species richness or diversity. Over four years of cutting, the plant community composition in cut plots became less similar to that in uncut plots – especially in the wetter of the two grasslands (data reported as a graphical analysis). Cover of 5–6 individual plant species – including common reed Phragmites australis – significantly differed between cut and uncut plots in at least one grassland and at least some measured years (see original paper for data). In most comparisons, cut and uncut plots had statistically similar plant species richness (six of eight comparisons, for which cut: 9–19 species/4 m2; uncut: 8–17 species/4 m2; other two comparisons lower in cut than uncut plots) and diversity (16 of 16 comparisons; data reported as diversity indices). Before cutting and within each grassland, plots destined for each treatment had statistically similar plant communities, richness and diversity (see original paper for data). Methods: In August 2003, sixteen 2 x 2 m plots were established in two degraded wet grasslands. The vegetation was historically grazed, but had not been for the past 40 years. Each summer, eight random plots/grassland were cut (with shears, cuttings removed). The other plots were not cut. All plots were fenced to exclude wild boar. Plant species and their cover were recorded annually (before each cut), from 2003 to 2007.

8. Threat: Natural system modifications
140
(1) Hackney C.T. & de la Cruz A.A. (1981) Effects of fire on brackish marsh communities: management implications. Wetlands, 1, 75–86.
(2) Kristiansen J.N. (1998) Nest site preference by greylag geese Anser anser in reedbeds of different harvest age. Bird Study, 45, 337–343.
(3) Poulin B. & Lefebvre G. (2002) Effect of winter cutting on the passerine breeding assemblage in French Mediterranean reedbeds. Biodiversity and Conservation, 11, 1567–1581.
(4) Schmidt M.H., Lefebvre G., Poulin B. & Tscharntke T. (2005) Reed cutting affects arthropod communities, potentially reducing food for passerine birds. Biological Conservation, 121, 157–166.
(5) Russell I.A. & Kraaij T. (2008) Effects of cutting Phragmites australis along an inundation gradient, with implications for managing reed encroachment in a South African estuarine lake system. Wetlands Ecology and Management, 16, 383–393.
(6) Berg M., Joyce C. & Burnside N. (2012) Differential responses of abandoned wet grassland plant communities to reinstated cutting management. Hydrobiologia, 692, 83–97.
8.8 Cut large trees/shrubs to maintain or restore disturbance
Background
Disturbance can clear dominant plants (including trees and shrubs), maintain light availability and control nutrient levels – and may maintain vegetation in a desirable and/or species-rich state (Hall et al. 2008; Middleton 2013). Therefore, conservationists sometimes want to actively restore disturbance where it has ceased, or maintain disturbance at a site where it would otherwise be lost.
Large trees and shrubs may need to be managed by cutting individual plants, stems or branches with loppers, saws or chainsaws. These actions are the focus of this section. Afterwards, regrowth of trees and shrubs may be managed by grazing, mowing or herbicide (effects covered elsewhere in synopsis). CAUTION: Tree/shrub removal may be most desirable in open habitats like marshes and meadows. It is more typically a threat in swamps, although some thinning may be desirable here.
Related interventions: Use cutting to control problematic large trees/shrubs, whose success is not linked to a change in disturbance regime (9.9); Cut/remove/thin forest plantations (3.7); Cut/mow herbaceous plants (or small woody plants) to maintain or restore disturbance (8.7).
Hall S.J., Lindig-Cisneros R. & Zedler J.B. (2008) Does harvesting sustain plant diversity in Central Mexican wetlands? Wetlands, 28, 776–792.
Middleton B.A. (2013) Rediscovering traditional vegetation management in preserves: trading experiences between cultures and continents. Biological Conservation, 158, 750–760.
8.8.1 Cut large trees/shrubs to maintain or restore disturbance:
freshwater marshes
Four studies evaluated the effects, on vegetation, of cutting large trees/shrubs to maintain or restore disturbance in freshwater marshes. Three studies were in the USA1,3,4. One was in Germany2.
VEGETATION COMMUNITY
Community types (1 study): One study of a riparian wet meadow in Germany2 reported changes in the area of plant community types over four years after cutting trees/shrubs (along with grazing).
Community composition (1 study): One replicated, randomized, controlled, before-and-after study aiming to restore freshwater marshes in the USA3 found that cutting trees (along with other

8. Threat: Natural system modifications
141
interventions) significantly affected the overall plant community composition over the following five years.
Overall richness/diversity (1 study): One study of a riparian wet meadow in Germany2 reported that plant species richness increased over four years after cutting trees/shrubs (along with grazing).
VEGETATION ABUNDANCE
Overall abundance (2 studies): Of two replicated, randomized, paired, controlled, before-and-after studies in the USA, one1 found that cutting and removing woody plants from a degraded wet prairie had no significant effect on overall vegetation cover three years later. The other study4 was in wet patches of a pine forest and found that understory vegetation cover increased more, over one year, where trees were thinned than where they were not thinned.
Characteristic plant abundance (1 study): One replicated, randomized, controlled, before-and-after study of overgrown freshwater marshes in the USA3 reported that of 26 plant taxa that became more frequent after cutting trees (along with other interventions), 16 were obligate wetland taxa.
Herb abundance (1 study): One replicated, randomized, paired, controlled, before-and-after study in wet patches of a pine forest in the USA4 found that cover of sedges Carex spp. increased more, over one year, where trees were thinned than where they were not thinned.
Tree/shrub abundance (2 studies): One replicated, randomized, paired, controlled, before-and-after study of a wet prairie in the USA1 found that woody plant cover declined, over three years, in plots where trees/shrubs were cut – but increased in plots where trees/shrubs were not cut. One study of a riparian wet meadow in Germany2 simply reported that some trees/shrubs regrew over four years after cutting trees/shrubs (along with grazing).
Individual species abundance (1 study): One study1 quantified the effect of this intervention on the abundance of individual plant species. The replicated, randomized, paired, controlled, before-and-after study of a wet prairie in the USA1 found, for example, that cutting trees and shrubs had no significant effect on cover of the dominant herbaceous plant, tussock grass Deschampsia cespitosa, three years later.
VEGETATION STRUCTURE
Height (1 study): One site comparison study of a riparian wet meadow in Germany2 reported that an area in which trees/shrubs were cut back (along with reinstating cattle grazing) contained shorter vegetation than an adjacent unmanaged area.
OTHER
Survival (2 studies): One replicated, randomized, paired, controlled study in a wet prairie in the USA1 found that cutting woody plants did not significantly affect their survival in the following year. One study of a riparian wet meadow in Germany2 simply reported that 20% of black alder Alder glutinosa trees were still alive after being cut back and grazed for four years.
A replicated, randomized, paired, controlled, before-and-after study in 1994–1997 in an ephemeral wet prairie in Oregon, USA (1) found that cutting woody plants reduced their cover (but not their short-term survival) and affected cover of forbs – but not the dominant herb species or vegetation overall. Over three years, woody plant cover declined in plots where they were cut (by 79%), but increased in plots where they were not cut (by 20%). This is despite no significant effect on woody plant survival in the first year after cutting (cut: 60%; uncut: 83%). Changes in forb cover also significantly differed between cut and uncut plots, although the precise effect depended on whether forbs were native (cut: 167% increase; uncut: 77% decrease) or non-native (cut: 45% decrease; uncut: 28% increase). Plots under each treatment

8. Threat: Natural system modifications
142
experienced statistically similar increases in overall vegetation cover (cut: 42%; uncut: 31%) and cover of the dominant herb species, tussock grass Deschampsia cespitosa (cut: 8%; uncut: 31%; see original paper for data on other individual plant species). Methods: In 1994, five pairs of plots (each 56–140 m2) were established in a degraded, seasonally flooded prairie. Woody plants had grown over 200 years of fire suppression. In autumn 1994 and 1996, all woody vegetation was cut with pruners or loppers, then removed, from one plot/pair. Vegetation was surveyed before (summer 1994) and after cutting. Survival of six tagged woody plants/plot was recorded in summer 1995. Cover of selected herb species was recorded in three 0.5-m2 quadrats/ plot in summer 1997.
A site comparison study in 1996–2000 in a riparian wet meadow in southern Germany (2) reported that in plots where woody vegetation was cut (along with reinstating grazing), there were changes in the area of plant community types, an increase in plant species richness, a reduction in vegetation height and growth of some woody vegetation. Statistical significance was not assessed. Over four years after intervention, there were slight increases in the area of reedbed/marsh vegetation (from 10 to 14%) and herbs typical of disturbed areas (from 45 to 50%) and a slight decrease in the area of meadow and pasture vegetation (from 45 to 36%). Total plant species richness increased in seven of seven plots, from 5–45 species/plot to 11–57 species/plot (increase of 3–22 species/plot). After four years, the cut/grazed area contained shorter vegetation than adjacent unmanaged land, including patches <10 cm tall not present in unmanaged land (data reported graphically). Finally, woody vegetation grew back despite grazing: up to 15 bushes/100 m2, reaching a height of >1 m after four years. Around 80% of 400 black alder (Alder glutinosa) trees that had been cut back died over the four years. Methods: The focal wetland had been abandoned for 20 years, becoming overgrown with tall herbs and, in places, woody plants. In 1996, woody vegetation was cut back, near ground level, from a 6-ha study area (details not reported). Annual summer grazing was also reinstated. The study does not distinguish between the effects of these interventions. Vegetation was surveyed each summer 1996–2000, in seven grazed 100-m2 plots. In 2000, vegetation height was measured along a 34-m transect spanning the cut/grazed and unmanaged areas.
A replicated, randomized, controlled, before-and-after study in 2000–2005 aiming to restore ephemeral freshwater marshes within pine forest in Georgia, USA (3) found that cutting trees (along with applying herbicide and prescribed burning) altered the overall plant community composition, favouring herbaceous and wetland-characteristic species. Over five years, the community composition of managed wetlands diverged significantly from that of unmanaged wetlands (data reported as a graphical analysis). This effect was stronger in the core of the wetlands than on the wetland-upland boundary. Of 26 plant taxa whose frequency increased in managed wetlands (statistical significance not assessed), 25 were herbs and 15 were obligate wetland taxa. Methods: In summer 2000, mature stands of oak Quercus spp. trees (that had developed following fire suppression) were removed from five depressional wetlands by cutting and/or applying herbicide. Then, the wetlands were then burned three times (once every two years). The study does not distinguish between the effects of cutting, applying herbicide and prescribed burning. Five additional wetlands were not managed (trees not removed and no burning). Plant species presence/ absence was recorded before (2000) and after (2005) intervention, in three to seven 100-m2 plots/wetland.

8. Threat: Natural system modifications
143
A replicated, randomized, paired, controlled, before-and-after study in 2011–2012 aiming to restore marsh patches in a pine forest in North Carolina, USA (4) found that thinning trees increased understory vegetation cover, including sedges. In plots where trees were thinned, there were increases in total understory vegetation cover (from 34% one month before thinning to 57% one year after) and total cover of sedges Carex spp. (from 7% to 22%). These increases were significantly larger than in plots where trees were not thinned (total understory cover: increase from 44% to 48%; sedge cover: decrease from 10% to 8%). The effect of tree thinning was statistically similar in dammed and undammed plots (reported as a statistical model result). Methods: In May 2011, sixteen 30 x 30 m plots were established (in four blocks of four) in wet patches of a pine forest. Development of sedge marshes in wet patches of the forest had been restricted by fire suppression and the extirpation of beavers Castor canadensis. In eight plots (two/block), 90% of the trees were manually removed. Trees were not thinned in the other plots. Four thinned and four unthinned plots were also dammed. Vegetation cover was visually estimated one month before (April 2011) and one year after (April 2012) intervention.
(1) Clark D.L. & Wilson M.V. (2001) Fire, mowing, and hand-removal of woody species in restoring a native wetland prairie in the Willamette Valley of Oregon. Wetlands, 21, 135–144.
(2) Zahn V.A., Meinl M. & Niefermeier U. (2003) Auswirkungen extensiver rinderbeweidung auf die wegetation einer feuchtbrache (Effects of low maintenance grazing on the vegetation of a wetland fallow). Naturschutz und Landschaftsplanung, 35, 171–178.
(3) Martin K.L. & Kirkman L.K. (2009) Management of ecological thresholds to re-establish disturbance-maintained herbaceous wetlands of the south-eastern USA. Journal of Applied Ecology, 46, 906–914.
(4) Aschehoug E.T., Sivakoff F.S., Cayton H.L., Morris W.F. & Haddad N.M. (2015) Habitat restoration affects immature stages of a wetland butterfly through indirect effects on predation. Ecology, 96, 1761–1767.
8.8.2 Cut large trees/shrubs to maintain or restore disturbance: brackish/
salt marshes
We found no studies that evaluated the effects, on vegetation, of cutting large trees/shrubs to maintain or restore disturbance in brackish/salt marshes.
This means that we have not yet found any studies that have directly evaluated this intervention during our systematic journal and report searches. Therefore we have no evidence to indicate whether or not the intervention has any desirable or harmful effects.
8.8.3 Cut large trees/shrubs to maintain or restore disturbance:
freshwater swamps
One study evaluated the effects, on vegetation, of cutting large trees/shrubs to maintain or restore disturbance in freshwater swamps. The study was in the USA.
VEGETATION COMMUNITY
VEGETATION ABUNDANCE
Herb abundance (1 study): One replicated, randomized, controlled, before-and-after, site comparison study of freshwater swamps in the USA1 found that cutting woody vegetation (and applying herbicide) had no significant effect on herbaceous ground cover one year later: there were similar changes in treated and untreated swamps.

8. Threat: Natural system modifications
144
VEGETATION STRUCTURE
Basal area (1 study): One replicated, randomized, controlled, before-and-after, site comparison study of freshwater swamps in the USA1 found that cutting woody vegetation (and applying herbicide) had no significant effect on the basal area of woody vegetation one year later: there were similar changes in treated and untreated swamps.
Canopy cover (1 study): The same study1 found that cutting woody vegetation (and applying herbicide) reduced canopy cover – to similar levels as in high-quality swamps after one year.
A replicated, randomized, controlled, before-and-after, site comparison study in 2009–2011 of 19 ephemeral freshwater swamps in Florida, USA (1) found that cutting and applying herbicide to midstory vegetation reduced canopy cover one year later, but had no significant effect on ground cover or basal area. One year before intervention, treated swamps had higher canopy cover (55%) than untreated high-quality swamps (36%). One year after intervention, canopy cover in treated swamps had declined to 41%: not significantly different from the 37% cover in high-quality swamps. In untreated low-quality swamps, canopy cover was 49–54%. Other vegetation metrics showed statistically similar responses over time (one year before vs one year after intervention) in both treated and untreated swamps. This was true for herbaceous ground cover (treated: 23% vs 17%; high-quality: 48% vs 37%; low-quality: 22% vs 19%) and the basal area of woody vegetation (treated: 14% vs 12%; high-quality: 10% vs 9%; low-quality: 16% vs 15%). Methods: In August–September 2010, excessive woody vegetation – that had grown following suppression of dry season fires – was removed from eight swamps (<6 ha). Midstory vegetation (<12.7 cm trunk diameter) was cut and removed, then herbicide (triclopyr) was applied to stumps. Note that this study evaluates the combined effect of cutting and applying herbicide. Vegetation was not treated in seven additional overgrown swamps (“low-quality habitat” for wildlife) or in four additional swamps without a dense midstory (“high-quality habitat” for wildlife). Vegetation was surveyed in each swamp in autumn 2009 and 2011. Canopy cover included the midstory and overstory. Herb cover was estimated in one 0.1-m2 quadrat/swamp.
(1) Gorman T.A., Haas C.A. & Himes J.G. (2013) Evaluating methods to restore amphibian habitat in fire-suppressed pine flatwoods wetlands. Fire Ecology, 9, 96–109.
8.8.4 Cut large trees/shrubs to maintain or restore disturbance: brackish/
saline swamps
We found no studies that evaluated the effects, on vegetation, of cutting large trees/shrubs to maintain or restore disturbance in brackish/saline swamps.
This means that we have not yet found any studies that have directly evaluated this intervention during our systematic journal and report searches. Therefore we have no evidence to indicate whether or not the intervention has any desirable or harmful effects.
8.9 Use grazing to maintain or restore disturbance
Background
Disturbance can clear dominant plants, maintain light availability and control nutrient levels – and may maintain vegetation in a desirable and/or species-rich state (Hall et

8. Threat: Natural system modifications
145
al. 2008; Middleton 2013). Therefore, conservationists sometimes want to actively restore disturbance where it has ceased, or maintain disturbance at a site where it would otherwise be lost. Grazing with animals such as sheep, horses, cattle, goats or water buffalo (Gulickx et al. 2007) might be one way to do this. Grazing can also give some economic value to wetlands, strengthening arguments against conversion to other land uses. Grazing itself may be the disturbance that has been reduced. Some wetlands have been abandoned following historical low-intensity grazing (e.g. Plassman et al. 2010).
This section includes studies evaluating the effects of grazing implemented for conservation (e.g. with species and intensity aligned with vegetation conservation goals). Studies of the impact of intense commercial grazing, for example, are not included. Bear in mind that the effects of grazing might be highly dependent on how it is carried out (e.g. species, intensity, timing, frequency and duration) and site conditions (e.g. nutrient availability, water levels, presence/density of wild herbivores) (Rinella & Hileman 2009).
Related interventions: Use grazing to control problematic plants, whose success is not linked to a change in disturbance regime (9.10); Change season/timing of livestock grazing (3.11); Change type of livestock grazing (3.12).
Gulickx M.M.C., Beecroft R.C. & Green A.C. (2007) Introduction of water buffalo Bubalus bubalis to recently created wetlands at Kingfishers Bridge, Cambridgeshire, England. Conservation Evidence, 4, 43–44.
Hall S.J., Lindig-Cisneros R. & Zedler J.B. (2008) Does harvesting sustain plant diversity in Central Mexican wetlands? Wetlands, 28, 776–792.
Middleton B.A. (2013) Rediscovering traditional vegetation management in preserves: trading experiences between cultures and continents. Biological Conservation, 158, 750–760.
Plassmann K., Jones M.L.M. & Edwards-Jones G. (2010) Effects of long-term grazing management on sand dune vegetation of high conservation interest. Applied Vegetation Science, 13, 100–112.
Rinella M.J. & Hileman B.J. (2009) Efficacy of prescribed grazing depends on timing intensity and frequency. Journal of Applied Ecology, 46, 796–803.
8.9.1 Use grazing to maintain or restore disturbance: freshwater marshes
Five studies evaluated the effects, on vegetation, of using grazing to maintain or restore disturbance in freshwater marshes. Two studies were in the UK1,5. There was one study in each of the Netherlands2, Germany3 and the USA4.
VEGETATION COMMUNITY
Community types (2 studies): One study of a riparian wet meadow in Germany3 reported changes in the area of plant community types over four years of grazing (after cutting trees/shrubs). One replicated, before-and-after study of dune slacks in the UK5 reported that the plant community type within plots remained stable over 16 years of grazing.
Community composition (3 studies): Two replicated, randomized, paired, controlled, studies in freshwater marshes/wet meadows in the UK1 and the USA4 reported that the overall plant community composition was similar in grazed and ungrazed plots after 2–9 years. One replicated study of dune slacks in the Netherlands2 simply reported changes in the overall plant community composition after resuming grazing (along with other interventions).
Overall richness/diversity (4 studies): Two studies (one replicated, before-and-after) in wetlands in Germany3 and the UK5 reported that after resuming grazing (and cutting trees/shrubs in one study3), there were increases in total plant species richness3,5 and/or diversity5. One replicated, randomized, paired, controlled, before-and-after study in the UK1 reported that grazing had no

8. Threat: Natural system modifications
146
significant effect on overall plant species richness in wet grassland and flush vegetation: there were similar declines over nine years in grazed and ungrazed plots. One replicated study of dune slacks in the Netherlands2 simply quantified total plant species richness over three years after resuming grazing (along with other interventions).
Characteristic plant richness/diversity (2 studies): One replicated, before-and-after study in dune slacks in the UK5 reported that after resuming grazing, the number of dune-slack indicator species increased. One replicated study of dune slacks in the Netherlands2 simply quantified the richness of characteristic plant species – typical of dune slacks or nutrient-rich marshes – over three years after resuming grazing (along with other interventions).
VEGETATION ABUNDANCE
Overall abundance (2 studies): One replicated, randomized, paired, controlled, before-and-after study in freshwater marshes/wet meadows in the USA4 found that grazing typically had no significant effect on overall vegetation biomass after 1–2 years. One replicated study of dune slacks in the Netherlands2 simply quantified total vegetation cover over three years after resuming grazing (along with other interventions). Cover never exceeded 50%.
Herb abundance (1 study): One replicated, randomized, paired, controlled, before-and-after study in the UK1 reported that grazing had no significant effect on the cover of forbs or grass-like plants in wet grassland and flush vegetation: there were similar declines over nine years in grazed and ungrazed plots.
Tree/shrub abundance (1 study): One study of a riparian wet meadow in Germany3 reported that some trees/shrubs regrew over four years of grazing (after cutting trees/shrubs).
Bryophyte abundance (1 study): One replicated, randomized, paired, controlled, before-and-after study in the UK1 reported that grazing had no significant effect on bryophyte cover in wet grassland and flush vegetation: there were similar changes over nine years in grazed and ungrazed plots.
Individual species abundance (1 study): One replicated study of dune slacks in the Netherlands2 simply quantified the cover of individual species present over three years after resuming grazing (along with other interventions). Only two species had >1% cover in any slack.
VEGETATION STRUCTURE
Height (2 studies): One site comparison study of a riparian wet meadow in Germany3 reported that an area grazed by cattle (after cutting trees/shrubs) contained shorter vegetation than an adjacent unmanaged area. One replicated, randomized, paired, controlled study in wet grassland and flush vegetation in the UK1 found that the maximum vegetation height was typically similar, over four years, in plots grazed by cattle and plots from which cattle were excluded.
OTHER
Survival (1 study): One study of a riparian wet meadow in Germany3 reported that 20% of black alder Alder glutinosa trees were still alive after being cut back and grazed for four years.
A replicated, randomized, paired, controlled, before-and-after study in 1988–1997 in wet grassland and flush vegetation in Scotland, UK (1) found that restarting cattle grazing had no clear effect on plant community composition, and typically had no significant effect on plant species richness, cover or height. After nine years and within each vegetation type, the overall plant community composition was similar in grazed and exclusion plots (data reported as a graphical analysis; statistical significance of differences not assessed). Total plant species richness declined within each vegetation type, but by a statistically similar amount in grazed plots (1–5 fewer

8. Threat: Natural system modifications
147
species/2 m2 after nine years of grazing than before) and exclusion plots (6–8 fewer species/2 m2). Changes in cover of key plant groups were also statistically similar in grazed and exclusion plots (forbs: 6–21% decline; grass-like plants: 34–63% decline; bryophytes: 9% increase or 6–11% decline). Over the first four years of study, maximum vegetation height was statistically similar in grazed and exclusion plots in five of six comparisons (for which grazed: 24–90 cm; exclusion: 35–92 cm). Methods: Four pairs of 100-m2 plots were established in each of two vegetation types: a rush-dominated wet grassland and a seepage flush. Annual summer cattle grazing (2.2–2.4 cattle/ha in the wetlands and surrounding grassland) was restarted in August 1988, after a 10-year hiatus. However, one random plot/pair was fenced to exclude cattle. Wild roe deer Capreolus capreolus could access the whole site, including fenced plots. In summer 1988 (before cattle reintroduction), 1991 and 1997, plant species and vegetation cover were recorded in 1–4 permanent 2-m2 quadrats/plot. In autumn 1988, 1989 and 1991, the tallest plant shoot was measured in eighty 400-cm2 quadrats/plot.
A replicated study in 1993–1998 of four dune slacks in the Netherlands (2) reported that slacks where grazing was reintroduced (after stopping groundwater extraction and removing topsoil) developed plant communities with habitat-characteristic species. Restored slacks developed plant communities, the overall composition of which changed through time (data reported as a graphical analysis; statistical significance of changes not assessed). After three years of grazing, restored slacks contained 84–108 plant species overall and 48–86 species/100 m2. This included species characteristic of dune slacks (5–11 species/100 m2) and nutrient-rich marshes (2–11 species/100 m2) alongside other wetland and upland species. In each slack, total vegetation cover was always <50% and only two individual species – creeping willow Salix repens and bushgrass Calamagrostis epigejos – ever had cover >1%. Methods: In 1995, traditional grazing (by a “small herd” of cattle and ponies) was resumed in four degraded dune slacks (stabilized and covered with undesirable, mature vegetation). Dune slacks are wetter, low-lying areas between dune ridges. In 1993, groundwater extraction had been stopped. Vegetation and topsoil were also stripped, completely or partially, from each slack. The study does not distinguish between the effects of these interventions. Each spring or summer between 1994 and 1998, seed-plants were surveyed: species across the whole of each slack; species and cover in five comparable 100-m2 plots/slack.
A site comparison study in 1996–2000 in a riparian wet meadow in southern Germany (3) reported that in plots where summer grazing was reinstated (along with cutting woody vegetation), there were changes in the area of plant community types, an increase in plant species richness, a reduction in vegetation height and growth of some woody vegetation. Statistical significance was not assessed. Over the first four years of grazing, there were slight increases in the area of reedbed/marsh vegetation (from 10 to 14%) and herbs typical of disturbed areas (from 45 to 50%) and a slight decrease in the area of meadow and pasture vegetation (from 45 to 36%). Total plant species richness increased in seven of seven plots, from 5–45 species/plot to 11–57 species/plot (increase of 3–22 species/plot). After four years, the grazed/cut area contained shorter vegetation than adjacent unmanaged land, including patches <10 cm tall) not present in unmanaged land (data reported graphically). Finally, woody vegetation grew back despite grazing: up to 15 bushes/100 m2, reaching a height of >1 m after four years. Around 80% of 400 black alder (Alder glutinosa) trees that had been cut back died over the four years. Methods: The focal wetland had been

8. Threat: Natural system modifications
148
abandoned for 20 years, becoming overgrown with tall herbs and, in places, woody plants. From 1996, annual grazing was reinstated on 6 ha (6–9 cattle, April–November). Woody vegetation was also cut back, near ground level, in 1996. The study does not distinguish between the effects of these interventions. Vegetation was surveyed each summer 1996–2000, in seven grazed 100-m2 plots. In 2000, vegetation height was measured along a 34-m-long transect spanning the grazed/cut and unmanaged areas.
A replicated, randomized, paired, controlled, before-and-after study in 1998–2000 of a range of freshwater marsh and wet meadow habitats around one lake in Idaho, USA (4) found that grazing typically had no clear effect on plant community composition, but that summer grazing affected vegetation biomass in some vegetation types. Over two years, the overall plant community composition within freshwater habitats remained similar in autumn-grazed, summer-grazed and ungrazed plots (data presented as graphical analyses; statistical significance of differences not assessed). In 12 of 16 comparisons, changes in live, above-ground plant biomass (from before to after grazing) were not significantly different in grazed and ungrazed plots. This was true for all eight comparisons involving autumn grazing and four of eight comparisons involving summer grazing (see original paper for data). In the other four comparisons, all in the wettest habitats, vegetation biomass declined in summer-grazed plots (by 200–350 g/m2) but did not significantly change in ungrazed plots (non-significant increases of 20–230 g/m2). Methods: Three sets of three fields with similar neighbouring vegetation were studied. Each field contained a range of freshwater habitats, from permanently flooded marshes to ephemeral wet meadows. All fields had been historically grazed and cut, but were undisturbed from 1996. Three fields (one random field/set) received each treatment: annual autumn grazing (September–October 1998 and 1999), one-off summer grazing (July–August 1998) or no grazing. Grazing intensity was 2.3–2.5 animal unit months/ha (one AUM is the amount of feed required to sustain a 1,000-lb cow and her calf for one month). Vegetation was surveyed in June–July before intervention (1998) and for two years after (1999, 2000).
A replicated, before-and-after study in 1987–2003 of dune slacks within one sand dune system in Wales, UK (5) found that following the reintroduction of grazers, plots retained the same overall plant community type but developed greater plant species richness and diversity. The overall plant community type was the same in each plot before and after grazers were introduced. Each plot started with a community characteristic of wetter marshy or drier shrubby slacks, and retained that community over six months to 16 years of grazing (data not reported). However, averaged across both wetter and drier community types, there were increases in total plant species richness (before grazers introduced: 20; after grazers introduced: 27 species/4 m2) and diversity (data reported as a diversity index). More specifically, there were increases in richness of grass-like plants (before: 5; after: 8 species/4 m2) and indicator species for the dune slack communities (18% higher after grazers were introduced). Grazing had no significant effect on richness of bryophytes (2 species/4 m2 before and after) or lichens (<1 species/4 m2 before and after). Methods: At 1–7 year intervals between 1987 and 2003, vegetation was surveyed in 21 permanent 4-m2 plots. The plots were all within dune slacks (low-lying areas between dune ridges; some wetter, some drier) that had been grazed until the 1950s but had since become overgrown. Livestock (cattle, sheep and/or ponies at “low densities”) were introduced to the land containing each plot at various points between late 1987 and 2001. Rabbits were also present in the dune system.

8. Threat: Natural system modifications
149
(1) Humphrey J.W. & Patterson G.S. (2000) Effects of late summer cattle grazing on the diversity of riparian pasture vegetation in an upland conifer forest. Journal of Applied Ecology, 37, 986–996.
(2) Grootjans A.P., Everts H., Bruin K. & Fresco L. (2001) Restoration of wet dune slacks on the Dutch Wadden Sea islands: recolonization after large-scale sod cutting. Restoration Ecology, 9, 137–146.
(3) Zahn V.A., Meinl M. & Niefermeier U. (2003) Auswirkungen extensiver rinderbeweidung auf die wegetation einer feuchtbrache (Effects of low maintenance grazing on the vegetation of a wetland fallow). Naturschutz und Landschaftsplanung, 35, 171–178.
(4) Austin J.E., Keough J.R. & Pyle W.H. (2007) Effects of habitat management treatments on plant community composition and biomass in a montane wetland. Wetlands, 27, 570–587.
(5) Plassmann K., Jones M.L.M. & Edwards-Jones G. (2010) Effects of long-term grazing management on sand dune vegetation of high conservation interest. Applied Vegetation Science, 13, 100–112.
8.9.2 Use grazing to maintain or restore disturbance: brackish/salt
marshes
Four studies evaluated the effects, on vegetation, of using grazing to maintain or restore disturbance in brackish/salt marshes. The studies were in the UK1, Denmark2, France3 and the USA4.
VEGETATION COMMUNITY
Community composition (1 study): One replicated, paired, controlled, before-and-after study of brackish marshes in France3 reported that the overall plant community composition diverged, over five years, in plots where grazing was maintained and plots where grazing ceased. The precise effect depended on the flooding regime.
Overall richness/diversity (2 studies): One controlled study on a salt marsh in Denmark2 reported that an area where grazing was maintained had identical plant species richness, after six years, to an area where grazing had ceased. One replicated, paired, controlled, before-and-after study of brackish marshes in France3 reported that the effect of continued grazing on plant species richness depended on the flooding regime.
VEGETATION ABUNDANCE
Overall abundance (3 studies): Two controlled studies on salt marshes in the UK1 and Denmark2 reported that areas where grazing was maintained contained less vegetation overall, after 2–6 years, than areas where grazing ceased. This was measured in terms of biomass1 or cover2. One replicated, randomized, paired, controlled, before-and-after study in alkali marshes in the USA4 found that grazing had no significant effect on total vegetation biomass after 1–2 years.
Individual species abundance (3 studies): Three studies1–3 quantified the effect of this intervention on the abundance of individual plant species. For example, one replicated, paired, controlled, before-and-after study of brackish marshes in France3 reported that continued grazing strongly limited colonization by common reed Phragmites australis over five years.
VEGETATION STRUCTURE
A replicated, controlled study in 1955–1957 in an estuarine salt marsh in England, UK (1) reported that continued grazing reduced total vegetation biomass, but had mixed effects on the abundance of dominant plant species. Unless specified, statistical significance was not assessed. At the start of the experiment, total above-ground vegetation biomass was 8,061 g/m2. After two years, this was only 5,633 g/m2 in grazed plots, vs 7,118 g/m2 in ungrazed plots. Over two years, saltmarsh grass Puccinellia maritima biomass increased more in grazed plots (by 99%) than in ungrazed plots (by 80%). Saltmarsh grass cover significantly increased in four of four grazed plots, but did not significantly change in three of four ungrazed plots (data not

8. Threat: Natural system modifications
150
reported). Cordgrass Spartina sp. biomass declined less in grazed plots (by 67%) than in ungrazed plots (by 97%). Saltbush Atriplex hastata biomass declined more in grazed plots (by 277%) than in ungrazed plots (by 70%). Cover of these species typically declined significantly in both grazed and ungrazed plots. Methods: In summer 1955, eight 9 x 13 m plots were established in a historically grazed salt marsh. Four plots continued to be grazed by sheep during summer (average 24 sheep days/plot/year). Four plots were fenced to exclude sheep. Vegetation was surveyed in early June at the start of the experiment (1955) and over the two following years (1956–1957). Biomass was dried before weighing.
A controlled study in 1972–1978 in a salt marsh in Denmark (2) reported that an area in which grazing was maintained had identical plant species richness to an area from which livestock were excluded, but had lower vegetation cover. Statistical significance was not assessed. After approximately six years, the same seven plant species were present in the grazed and exclusion areas. However, six of these species had lower cover in both grazed plots – including saltmarsh grass Puccinellia maritima (grazed: 72–82%; exclusion: 84–92%) and sea purslane Halimione portulacoides (grazed: <1%; exclusion: 8–17%). Accordingly, both sampling plots within the grazed area had lower overall vegetation cover than both sampling plots within the exclusion area. This was true for cover including overlapping vegetation (grazed: 81–89%; exclusion: 130–145%) and for cover as the inverse of bare ground (grazed: 73–83%; exclusion: 95–98%). Methods: In spring 1972, an area of historically grazed coastal salt marsh was fenced to exclude livestock. Grazing was continued in the rest of the salt marsh (with at least 0.5 sheep/ha and 0.5 cattle/ha, May–October). In August 1978, the cover of every plant species and bare ground were recorded in two plots in the grazed and exclusion areas (50 point quadrats with 10 pins/plot).
A replicated, paired, controlled, before-and-after study in 1989–1994 of eighteen brackish marshes in southern France (3) reported that the effects of continued grazing on plant community composition, abundance and species richness depended on the flooding regime. Unless specified, statistical significance was not assessed. Under all three flooding regimes, the overall plant community composition in grazed and ungrazed plots diverged over five years. However, the speed and direction of the changes depended on the flooding regime (data reported as graphical analyses). For example, under two artificial flooding regimes, grazing significantly reduced the final cover of sea club rush Bolboschoenus maritimus (grazed: 11–12%; ungrazed: 31–33%) and common reed Phragmites australis (grazed: <1%; ungrazed: 12–16%). Other species showed mixed responses to grazing depending on the season of artificial flooding (see original paper). After five years, total plant species richness was lower in grazed fields under artificial flooding regimes (grazed: 4 species/0.25 m2; ungrazed: 5–6 species/0.25 m2) but higher in grazed fields under an unmanaged flooding regime (grazed: 7 species/0.25 m2; ungrazed: 5 species/0.25 m2). Methods: The study used two sets of nine inland brackish marshes (former rice fields, but grazed since 1976 when cultivation stopped). In November 1989, one set was fenced to exclude livestock. The other set remained grazed (approximately 2 cattle and 1 horse/ha, April–November). Three of the nine 1-ha marshes within each set received each flooding regime: artificial winter flooding, artificial summer flooding, or year-round unmanaged flooding. Vegetation was surveyed every six months from early November 1989 to early November 1994 (nine 0.5 x 0.5 m quadrats/field/survey).
A replicated, randomized, paired, controlled, before-and-after study in 1998–2000 in ephemeral alkali marshes around one lake in Idaho, USA (4) found that grazing had no significant effect on vegetation biomass. After both one and two years,

8. Threat: Natural system modifications
151
changes in live above-ground plant biomass were statistically similar in grazed plots (non-significant change of <40 g/m2 from before to after intervention) and ungrazed plots (non-significant change of <100 g/m2 from before to after intervention). Methods: Three sets of three fields with similar neighbouring vegetation were studied. Each field contained a range of wetland habitats, including alkali flats (seasonally flooded; developed salt crust in summer). All fields had been historically grazed and cut, but were undisturbed from 1996. Three fields (one random field/set) received each treatment: annual autumn grazing (September–October 1998 and 1999), one-off summer grazing (July–August 1998) or no grazing. Grazing intensity was 2.3–2.5 animal unit months/ha (one AUM is the amount of feed required to sustain a 1,000-lb cow and her calf for one month). Vegetation was surveyed in June–July before intervention (1998) and for two years after (1999, 2000).
(1) Ranwell D.S. (1961) Spartina salt marshes in southern England: I. The effects of sheep grazing at the upper limits of Spartina marsh in Bridgwater Bay. Journal of Ecology, 49, 325–340.
(2) Jensen A. (1985) The effect of cattle and sheep grazing on salt-marsh vegetation at Skallingen, Denmark. Vegetatio, 60, 37–48.
(3) Mesléard F., Lepart J., Grillas P. & Mauchamp A. (1999) Effects of seasonal flooding and grazing on the vegetation of former ricefields in the Rhône delta (southern France). Plant Ecology, 145, 101–114.
(4) Austin J.E., Keough J.R. & Pyle W.H. (2007) Effects of habitat management treatments on plant community composition and biomass in a montane wetland. Wetlands, 27, 570–587.
8.9.3 Use grazing to maintain/restore disturbance in freshwater swamps
We found no studies that evaluated the effects, on vegetation, of using grazing to maintain or restore disturbance in freshwater swamps.
This means that we have not yet found any studies that have directly evaluated this intervention during our systematic journal and report searches. Therefore we have no evidence to indicate whether or not the intervention has any desirable or harmful effects.
8.9.4 Use grazing to maintain/restore disturbance in brackish/saline
swamps
We found no studies that evaluated the effects, on vegetation, of using grazing to maintain or restore disturbance in brackish/saline swamps.
This means that we have not yet found any studies that have directly evaluated this intervention during our systematic journal and report searches. Therefore we have no evidence to indicate whether or not the intervention has any desirable or harmful effects.
8.10 Use prescribed fire to maintain or restore disturbance
Background
Disturbance can clear dominant plants, maintain light availability and control nutrient levels – and may maintain vegetation in a desirable and/or species-rich state (Hall et al. 2008; Middleton 2013). Therefore, conservationists sometimes want to actively restore disturbance where it has ceased, or maintain disturbance at a site where it would otherwise be lost. Prescribed burns are one way to do this.
Fire itself may be the historic or traditional disturbance that maintains wetlands in a desirable state. Some wetlands, especially ones that dry out in summer, burn naturally

8. Threat: Natural system modifications
152
every few years (Sutter & Kral 1994). In other wetlands, prescribed burns have been used by humans to manage vegetation (Middleton 2013). Reduced disturbance from fire in these systems – whether through abandonment or deliberate control of fire (e.g. via fire breaks or legislation) – can be detrimental to vegetation diversity, composition and structure (e.g. Clark & Wilson 2001).
CAUTION: Disturbance, and fire in particular, is not a natural feature of all wetlands. For example, even within the southeast USA, the natural fire frequency can vary from once per year to once per century (Sutter & Kral 1994). It can be difficult to control the intensity, duration and area of prescribed burns. Burns in winter or wet season, might be easier to control than burns in the summer or dry season. Smoke from prescribed burns could be detrimental to human health, especially near urban areas (Agee 1996). Also note potential impacts on animals within wetlands – but that some taxa might be unaffected or be able to avoid fire (e.g. Ditlhogo et al. 1992).
The timing and duration of monitoring might be particularly important when evaluating the effects of this intervention. Burning might produce apparently desirable changes in vegetation over the short term, followed by a rapid return to a degraded state.
Related interventions: Use prescribed fire to control problematic plants, whose success is not linked to a change in disturbance regime (9.11); Reduce frequency of prescribed burning (8.16); Reduce intensity of prescribed burning (8.17); Change season/timing of prescribed burning (8.18).
Agee J. (1996) Achieving conservation biology objectives with fire in the Pacific Northwest. Weed Technology, 10, 417–421.
Clark D.L. & Wilson M.V. (2001) Fire, mowing, and hand-removal of woody species in restoring a native wetland prairie in the Willamette Valley of Oregon. Wetlands, 21, 135–144.
Ditlhogo M.K.M., James R., Laurance B.R. & Sutherland W.J. (1992) The effects of conservation management of reed beds. I. The invertebrates." Journal of Applied Ecology, 29, 265–276.
Hall S.J., Lindig-Cisneros R. & Zedler J.B. (2008) Does harvesting sustain plant diversity in Central Mexican wetlands? Wetlands, 28, 776–792.
Middleton B.A. (2013) Rediscovering traditional vegetation management in preserves: trading experiences between cultures and continents. Biological Conservation, 158, 750–760.
Sutter R.D. & Kral R. (1994) The ecology, status, and conservation of two non-alluvial wetland communities in the South Atlantic and Eastern Gulf coastal plain, USA. Biological Conservation, 235–243.
8.10.1 Use prescribed fire to maintain or restore disturbance: freshwater
marshes
Fifteen studies evaluated the effects, on vegetation, of using prescribed fire to maintain or restore disturbance in freshwater marshes. Ten studies were in the USA3,5,6,8–12,14,15. Two studies, based on one experimental set-up, were in the Netherlands1,2. There was one study in each of the UK4, Romania7 and South Africa13.
VEGETATION COMMUNITY
Community composition (4 studies): Of four replicated, controlled studies (three also before-and-after) in freshwater wetlands in the USA, two11,12 found that burning (sometimes12 along with other interventions) significantly affected the overall plant community composition in the following 2–5 years. The other two studies10,14 found that burning had no clear or significant effect on the overall plant community composition over the following two years. One of these studies14 also
8. Threat: Natural system modifications
153
found that the plant community in burned marshes was less similar to pristine local marshes than the plant community in unburned marshes, after two years.
Overall richness/diversity (8 studies): Four replicated, paired, controlled studies in freshwater marshes/wet meadows in the UK4 and the USA5,11,14 found that burning had no significant effect on overall plant species richness5,11,14 and/or diversity4,14 over 1–2 growing seasons. However, three replicated, paired, controlled studies in the UK4 and the USA8,11 reported that burning increased plant species richness4,8 or diversity11 after 1–3 growing seasons. Two replicated studies (including one paired, site comparison) in the USA6 and South Africa13 reported that burning reduced plant species richness6 or diversity13 after 1–3 growing seasons. However, the study in the USA6 also reported that burning increased richness after 4–8 growing seasons.
VEGETATION ABUNDANCE
Overall abundance (5 studies): Four studies (including two randomized, paired, controlled, before-and-after) in freshwater marshes/wet meadows in the USA6,8,10,15 found that prescribed burning had no significant effect on overall vegetation abundance (biomass6,10 or cover8,15) after 1–3 growing seasons. One replicated, randomized, paired, controlled study in a freshwater marsh in the USA5 reported that burned plots contained less vegetation biomass, one year after the latest burn, than unburned plots.
Characteristic plant abundance (1 study): One replicated, randomized, controlled, before-and-after study of overgrown freshwater marshes in the USA12 reported that of 26 plant taxa that became more frequent after burning (along with other interventions), 16 were obligate wetland taxa.
Herb abundance (1 study): One replicated, paired, site comparison study of sedge meadows in the USA6 found that burned meadows typically contained similar cover of herbaceous plant groups (grasses, sedges/rushes and forbs) to unburned meadows, after 1–8 growing seasons.
Tree/shrub abundance (2 studies): One replicated, randomized, paired, controlled, before-and-after study in a degraded, shrubby wet prairie the USA8 found that over three years, burning reduced woody plant cover. One replicated, before-and-after study of freshwater marshes within a forest plantation in South Africa13 reported that burning never increased overall tree density five months later, although the precise effect apparently depended on site wetness.
Algae/phytoplankton abundance (1 study): One controlled study in a freshwater marsh in the USA15 found that burned plots contained a greater abundance (cover and biomass) of surface-encrusting algae, over the following 72 days, than unburned plots.
Individual species abundance (9 studies): Nine studies1,2,4–9,13 quantified the effect of this intervention on the abundance of individual plant species. The nine studies (including eight controlled or site comparison) in the Netherlands1,2, the UK4, the USA5,6,8,9, Romania7 and South Africa13 reported mixed effects of burning on dominant herbaceous species, depending on the species, metric, site conditions and/or time after burning.
VEGETATION STRUCTURE
Height (5 studies): Four studies (including one replicated, randomized, paired, controlled) – in reedbeds in the UK4 and Romania7, a marsh in the USA15 and freshwater marshes within a forest plantation in South Africa13 – found that burned plots contained shorter vegetation than unburned plots in the subsequent growing season. One study in a marsh in the USA3 reported that over the 50 days after prescribed burning, the average height of sawgrass Cladium jamaicense increased.
Diameter/perimeter/area (3 studies): Two replicated, paired, controlled studies in reedbeds in the Netherlands1 and the UK4 found that common reed Phragmites australis stems were typically thicker in spring-burned plots than unburned plots, in the subsequent growing season. However, one site comparison study of reedbeds in Romania7 found that common reed stems were thinner in winter-burned plots than unburned plots, in the following spring.

8. Threat: Natural system modifications
154
OTHER
Survival (1 study): One replicated, randomized, paired, controlled, before-and-after study in a degraded, shrubby wet prairie the USA8 found that woody plants had a lower survival rate, after one year, in burned plots than in unburned plots.
A replicated, paired, controlled, before-and-after study in 1972–1975 in a created reedbed in the Netherlands (1) found that spring-burned plots typically contained more common reed Phragmites australis biomass and thicker reed shoots than unburned plots. In late April/early May, burned plots contained thicker reed shoots than unburned plots in three of four comparisons (all burned mid-April; burned: 6.2–7.2 mm; unburned: 4.5–5.7 mm; other comparison no significant difference). In August/September, burned plots contained more above-ground reed biomass than unburned plots in seven of eight comparisons (for which burned: 1,200–1,760 g/m2; unburned: 530–1,270 g/m2; other comparison no significant difference). In the autumn before intervention, reed biomass was similar under both treatments (burned: 1,010–1,040 g/m2; unburned: 1,080–1,120 g/m2; statistical significance not assessed). Methods: In 1971, two pairs of plots were established in a young reedbed (sown in 1968). One pair was in a wetter area (flooded spring to autumn). One pair was in a drier area (water table 30–100 cm below surface). Between 1972 and 1975, one plot/pair was burned each spring (as early as possible). The other plots were not burned. Between April and October each year, all standing reed stems were cut from quadrats (0.25–0.50 m2; 2–6 quadrats/plot/sampling date), then measured, dried and weighed. This study used the same experimental set-up as (2).
A replicated, paired, controlled study in 1972–1975 in a created reedbed in the Netherlands (2) reported that the effect of spring burning on the subsequent density of common reed Phragmites australis depended on how wet the plots were. Statistical significance was not assessed. In a wetter area of the reedbed, the maximum annual reed density was typically lower in burned than unburned plots (three of four years, for which burned: 220–440 stems/m2; unburned: 310–920 stems/m2). In a drier area of the reedbed, the maximum annual reed density was typically higher in burned than unburned plots (three of four years, for which burned: 530–630 stems/m2; unburned: 230–270 stems/m2). Methods: In 1971, two pairs of plots were established in a young reedbed (sown in 1968). One pair was in a wetter area (flooded spring to autumn). One pair was in a drier area (water table 30–100 cm below surface). Between 1972 and 1975, one plot/pair was burned each spring (as early as possible). The other plots were not burned. All standing reed stems were counted between April and October each year (0.25–0.50 m2 quadrats; 4–6 quadrats/plot/sampling date). This study used the same experimental set-up as (1).
A study in 1985 in an ephemeral freshwater marsh in Florida, USA (3) reported that following prescribed burning, the height of the dominant plant species increased. Over 50 days following burning, the average height of sawgrass Cladium jamaicense increased by 36 cm (or 0.76 cm/day). Methods: In August 1985, an area of sawgrass-dominated marsh was deliberately burned. Lighting fires at the end of the dry season, when there is no standing water, are a common natural disturbance. Remnant shoots after the burn were 13 cm tall on average, and remained “well above water immediately post-fire”. Sawgrass was monitored for 50 days, by measuring the distance between the soil surface and the tip of the tallest leaf on each of 30 random plants (culms).
A replicated, randomized, paired, controlled study in 1988 in a reedbed in England, UK (4) reported that burned plots contained more, shorter and thicker reed

8. Threat: Natural system modifications
155
stems than unburned plots after one growing season, and had higher plant richness but not diversity. After 3–5 months, burned plots contained a higher density of reed stems (736 stems/m2) than unburned plots (484 stems/m2). On average, reed stems were shorter but thicker in burned plots (143 cm tall; 3.7 mm diameter) than unburned plots (177 cm tall; 3.5 mm diameter). Burned plots also had higher plant species richness than unburned plots (data reported but units not clear) but statistically similar diversity (data reported as a diversity index). Of 17 common plant species for which data were reported, 16 were more frequent in burned plots than in unburned plots (statistical significance not assessed; see original paper for data). Methods: Five pairs of 30 x 40 m plots were established in a reedbed that had not been managed for ≥10 years. In March 1988, one random plot/pair was burned. The other plots were left unmanaged. All plots were flooded from April 1988. Vegetation was surveyed in July and August 1988. Live and dead reed stems were counted, and plant species were recorded, in 0.25-m2 quadrats (number not clear). Forty live reed stems/plot were measured. This summary takes some contextual and methodological details from Ditlhogo et al. (1992).
A replicated, randomized, paired, controlled, before-and-after study in 1992–1994 in a freshwater marsh in Louisiana, USA (5) found that burning reduced overall vegetation biomass, but had mixed effects on cover of the dominant plant species and no significant effect on plant species richness. One year after the latest burn, above-ground vegetation biomass was lower in burned areas (780–960 g/m2) than in unburned areas (920–2,080 g/m2). Burned and unburned areas had statistically similar cover of the dominant plant species in three of four comparisons. In the other comparison, amongst subplots fenced to exclude wild mammals, burned areas had lower cover of saltmeadow cordgrass Spartina patens (31%) than unburned areas (78%). Although plant species richness significantly increased in burned areas over two years of burning (by 1.8–2.4 species/m2), this change was not significantly different from the change in unburned areas (where species richness increased by 0–1.8 species/m2). Methods: Five pairs of 100-m2 plots were established in a freshwater marsh (regularly burned for at least 100 years). One random plot in each pair was burned in autumn 1992 and 1993. Each plot contained two 4-m2 subplots, one of which was fenced. Plant species and their cover were recorded in each subplot in autumn 1992 (before intervention) and 1994. Vegetation was cut from one 0.25-m2 quadrat/subplot, then dried and weighed, in autumn 1994.
A replicated, paired, site comparison study in 1994 of eight sedge meadows in Wisconsin, USA (6) reported that burning reduced plant species richness in the short term and increased it in the long term, but found that burning typically had no significant effect on vegetation abundance after 1–8 growing seasons. Burned meadows had lower species richness than unburned meadows in three of five comparisons (burned ≤3 growing seasons previously: 27–30; unburned: 32–39 species/7.5 m2) but higher species richness in two of five comparisons (burned ≥4 growing seasons previously: 32–42; unburned: 26–39 species/7.5 m2). Statistical significance of richness results was not assessed. In two of five comparisons, burned meadows had higher cover of grasses (burned: 13–24%; unburned: 4%) and sedges/ rushes (burned: 100–110%; unburned: 75%). Otherwise, vegetation abundance (grass cover, sedge/rush cover, forb cover, total live above-ground biomass) did not significantly or consistently differ between burned and unburned meadows. For data on these outcomes and on the cover of individual plant species, see original paper. Methods: In summer 1994, vegetation was surveyed in eight sedge meadows: five last burned, in spring, 1–8 growing seasons previously; three not burned for >30 years.

8. Threat: Natural system modifications
156
Plant species and cover were recorded along three 100-m-long transects/meadow. Live vegetation was cut from five 0.1-m2 plots/meadow, then dried and weighed.
A site comparison study in 1996–1997 of two reedbeds in Romania (7) found that a burned reedbed contained fewer, shorter, thinner common reed common reed Phragmites australis shoots than an unburned reedbed, and a lower reed biomass. In the spring after intervention, the burned reedbed contained fewer reed shoots (40 shoots/m2) than the unburned reedbed (105 shoots/m2). Reed shoots in the burned reedbed were also shorter (burned: 150 cm; unburned: 194 cm) and thinner (burned: 9.9 mm; unburned: 12.9 mm). Accordingly, the peak above-ground biomass was lower in the burned reedbed (burned: 2,738 g/m2; unburned: 3,468 g/m2; statistical significance not assessed). Methods: In September 1996 (biomass) and May 1997 (all other metrics), vegetation was surveyed in two reedbeds with comparable nutrient levels: one burned in the previous winter, and one that had not been burned. The reedbeds were not flooded between burning and measurement. Surveys included measurements of 25 shoots/reedbed, and counts of shoots in five 1-m2 quadrats/reedbed.
A replicated, randomized, paired, controlled, before-and-after study in 1994–1997 in an ephemeral wet prairie in Oregon, USA (8) found that burning woody plants reduced their survival and cover and increased native forb abundance, but had no significant effect on overall vegetation or herb cover. After one year, the survival rate of woody plants was lower in burned (33%) than unburned plots (83%). Over three years, woody plant cover decreased in burned plots (by 63%) but increased in unburned plots (by 20%). Native forb cover increased in burned plots at the expense of non-native forbs (natives: 8% increase; non-natives: 77% decrease). The opposite was true in unburned plots (natives: 30% decrease; non-natives: 28% increase). However, burned and unburned plots experienced statistically similar changes in overall vegetation cover (increase; burned: 41%; unburned: 31%) and cover of the dominant herb species, tussock grass Deschampsia cespitosa (increase; burned: 31%; unburned: 31%; see original paper for data on other individual plant species). Methods: In 1994, five pairs of plots (each 64–160 m2) were established in a degraded, seasonally flooded prairie. Woody plants had grown over 200 years of fire suppression. In each pair, one random plot was burned in autumn 1994 and 1996. Vegetation was surveyed before (summer 1994) and after burning. Survival of six tagged woody plants/plot was recorded in summer 1995. Cover of selected herb species was recorded in three 0.5-m2 quadrats/plot in summer 1997.
A controlled, before-and-after study in 1994–1998 in a freshwater marsh in Florida, USA (9) reported that prescribed burning increased plant species richness and temporarily increased the density of one of two dominant species, but had no clear effect on the frequency of these two species. Unless specified, statistical significance was not assessed. Burned plots contained 6–9 plant species before burning, then 8–11 species over the four years after burning. Burning significantly but temporarily increased the density of southern cattail Typha domingensis (before: 2–3 stems/m2; after one to two years: 4–6 stems/m2; after three to four years: 2 stems/m2). Sawgrass Cladium jamaicense density was statistically similar before and after burning in seven of eight comparisons (for which before: 6–13 stems/m2; after: 6–15 stems/m2). Burning had no clear effect the frequency of southern cattail (before: in 93–100% of quadrats; after: 83–100%) or sawgrass (before: in 87–100% of quadrats; after: 80–100%). The frequency of eight other common plant species showed mixed responses to burning (see original paper). In unburned plots, metrics

8. Threat: Natural system modifications
157
were generally stable (before they were affected by wildfire): 9 species/plot, 1–2 cattail stems/m2, 10–13 sawgrass stems/m2, cattail in 73–80% quadrats and sawgrass in 97–100% of quadrats. Methods: In June 1994, a 265-ha area of marsh was deliberately burned. Lighting fires are a common natural disturbance in similar marshes, but the study marsh had not burned for ≥5 years. The marsh was flooded when burned and for most of the time after burning. Vegetation was surveyed before burning (1994) and for up to four years after (burned: 1995–1998; unburned: 1995–1996), in two plots within the burned area and one adjacent unburned plot (thirty 2-m2 quadrats/plot).
A replicated, randomized, paired, controlled, before-and-after study in 1998–2000 of a range of marsh and wet meadow habitats around one lake in Idaho, USA (10) found that prescribed burning typically had no clear or significant effect on plant community composition or biomass. Over two years, the overall plant community composition within freshwater habitats remained similar in burned and unburned plots (data presented as graphical analyses; statistical significance of differences not assessed). In six of eight comparisons, changes in live, above-ground plant biomass (from before to after grazing) were not significantly different in burned plots (decrease of 200 g/m2 to non-significant increase of 20 g/m2) and unburned plots (decrease of 170 g/m2 to non-significant increase of 130 g/m2). Methods: Three pairs of fields with similar neighbouring vegetation were studied. Each field contained a range of freshwater habitats, from permanently flooded marshes to ephemeral wet meadows. All fields had been historically grazed and cut, but were undisturbed from 1996. In October 1998 (when vegetation was dormant) one random field in each pair was burned. Vegetation was surveyed in June–July before intervention (1998) and for two years after (1999, 2000).
A replicated, paired, controlled, before-and-after study in 1989–1991 in a riparian wet meadow in California, USA (11) found that prescribed burning changed the overall plant community composition and increased plant diversity, but had no significant effect on plant species richness or the proportion of native species. Over two years, burning had a significant effect on the overall plant community composition (reported as statistical model results). The effect of burning on the relative abundance of individual species depended on the year and community type, but burning generally reduced the relative abundance of the most common species (see original paper for data). Accordingly, plant diversity increased more in burned than unburned plots (data reported as a diversity index). However, plant species richness increased by a similar amount in burned plots (from 5–6 species/plot to 5–11 species/plot) and unburned plots (from 5–7 species/plot to 5–11 species/plot). Burning has no significant effect on the proportion of native plant species (data not reported). Methods: Eight plots (approximately 50 x 460 m) were established in a seasonally flooded wet meadow. The meadow was grazed by livestock until 1988, then managed for waterfowl without grazing. Four plots were burned in November 1990 and December 1991. Vegetation was surveyed along two transects/plot before (August–September 1990) and approximately nine months after each burn (September 1991 and 1992). Data were split by plant community type for analysis.
A replicated, randomized, controlled, before-and-after study in 2000–2005 aiming to restore ephemeral freshwater marshes within pine forest in Georgia, USA (12) found that prescribed burning (along with killing trees by cutting and applying herbicide) altered the overall plant community composition, favouring herbaceous and wetland-characteristic species. Over five years, the community composition of

8. Threat: Natural system modifications
158
managed wetlands diverged significantly from that of unmanaged wetlands (data reported as a graphical analysis). This effect was stronger in the core of the wetlands than on the wetland-upland boundary. Of 26 plant taxa whose frequency increased in managed wetlands (statistical significance not assessed), 25 were herbs and 15 were obligate wetland taxa. Methods: Between 2000 and 2005, five depressional wetlands were burned three times (once every two years, matching the historical fire regime). In summer 2000, mature stands of fire-resistant trees (oak Quercus spp.) had been removed by cutting and/or applying herbicide. The study does not distinguish between the effects of burning and tree removal. Five additional wetlands were not managed (no burning and trees not removed). Plant species presence/absence was recorded before (2000) and after (2005) intervention, in three to seven 100-m2 plots/wetland.
A replicated, before-and-after study of two degraded freshwater marshes in South Africa (13) reported that prescribed burning reduced total plant diversity, but had mixed effects across sites on tree density and height. Unless specified, statistical significance was not assessed. In both sites, plant species diversity was lower five months after burning than just before (data reported as a diversity index). In the drier site (Z34), the overall tree density was significantly lower after burning than before. Density declined for 8 of 10 species (before: 1–23; after: 0–18 trees/species/0.25 ha). The average height of trees was statistically similar before (0–4 m) and after (0–5 m) burning. In the wetter site (Z49), burning had no significant effect on the overall tree density. Although density declined for 5 of 8 species (before: 2–8; after: 0–3 trees/species/0.25 ha), this was compensated for by increases in 2 of 8 species (before: 0–2; after: 1–12 trees/species/0.25 ha). The average height of trees was significantly lower after burning (0–1 m) than before (0–3 m). Mature trees (>2 m tall) were more likely to be killed in the wetter site, where ferns created taller flames. Methods: The two studied wetlands were within a forest plantation where natural fire was suppressed. As a result, woody vegetation was colonizing the wetlands. Vegetation was surveyed along four 50-m transects/wetland, before and five months after a prescribed burn (dates and methods not reported). Tree measurements included seedlings, saplings and mature trees.
A replicated, paired, controlled study in 2006–2009 in 40 freshwater marshes within a ranch in Florida, USA (14) found that prescribed burning typically had no significant effect on the overall plant community composition, richness and diversity, but had mixed effects on vegetation quality. Statistical significance was assessed for all results, but data were generally not reported. After one and two summers, burned and unburned marshes contained similar overall plant communities (based on the species present and their abundance; data not reported). In four of six cases, burned and unburned marshes supported a similar relative abundance of forbs, grass-like plants and shrubs (with mixed effects depending on the group, year and grazing in the other two cases). Burned and unburned marshes also had similar overall plant species diversity and richness, and similar native plant species richness. After two summers, species in burned marshes were less characteristic of pristine Florida marshes, on average, than were the species in unburned marshes (data reported as a conservatism score). The effect of burning on this outcome after one summer was more complicated, differing between marshes and depending on whether they were grazed or not. Methods: The study used forty 0.5–1.5 ha marshes, grouped into five blocks of eight, within a 4,000-ha ranch that was historically managed with sporadic prescribed burns. In February 2008, twenty marshes (four marshes/block) were deliberately

8. Threat: Natural system modifications
159
burned. The other 20 marshes (four marshes/block) were left unburned. In each block, two burned and two unburned marshes were also fenced to exclude cattle. Plant species presence/absence was recorded in October before (2006) and after (2008, 2009) burning, in fifteen 1-m2 quadrats/marsh.
A replicated, controlled study in 2010 in a permanent freshwater marsh in Florida, USA (15) found that burned plots had similar overall vegetation cover to unburned plots, but contained greater cover and biomass of surface-encrusting algae and contained shorter vegetation. Over 72 days following intervention, burned plots had statistically similar overall vegetation cover (25%) to unburned plots (41%). However, burned plots contained a greater abundance of surface-encrusting algae, both in terms of cover (burned: 27%; unburned: 21%) and biomass (burned: 51 g/m2; unburned: 42 g/m2). Finally, burned plots contained shorter vegetation, both in terms of average height (burned: 89 cm; unburned: 165 cm) and maximum height (burned: 104 cm; unburned: 200 cm). Methods: In early April 2010, a 690 ha area of marsh (dominated by sawgrass Cladium mariscus ssp. jamaicense) was burned. Standing water was present during the burn. Historically, this type of marsh was frequently disturbed by lightning fires. Vegetation and algae were surveyed every 10 days between 2 and 72 days after burning, in four 100-m2 plots in the burned area and four 100-m2 plots in a nearby unburned area. Algae were dried before weighing.
(1) Mook J.H. & van der Toorn J. (1982) The influence of environmental factors and management on stands of Phragmites australis. II. Effects on yield and its relationships with shoot density. Journal of Applied Ecology, 19, 501–517.
(2) van der Toorn J. & Mook J.H. (1982) The influence of environmental factors and management on stands of Phragmites australis. I. Effects of burning, frost and insect damage on shoot density and shoot size. Journal of Applied Ecology, 19, 477–499.
(3) Herndon A., Gunderson L. & Stenberg J. (1991) Sawgrass (Cladium jamaicense) survival in a regime of fire and flooding. Wetlands, 11, 17–27.
(4) Cowie N.R., Sutherland W.J., Ditlhogo M.K.M. & James R. (1992) The effects of conservation management of reed beds. II. The flora and litter disappearance. Journal of Applied Ecology, 29, 277–284.
(5) Ford M.A. & Grace J.B. (1998) The interactive effects of fire and herbivory on a coastal marsh in Louisiana. Wetlands, 18, 1–8.
(6) Kost M.A. & De Steven D. (2000) Plant community responses to prescribed burning in Wisconsin sedge meadows. Natural Areas Journal, 20, 36–45.
(7) Rolletscheck H., Rolletscheck A., Hartzendorf T. & Kohl J.-G. (2000) Physiological consequences of mowing and burning of Phragmites australis stands for rhizome ventilation and amino acid metabolism. Wetlands Ecology and Management, 8, 425–433.
(8) Clark D.L. & Wilson M.V. (2001) Fire, mowing, and hand-removal of woody species in restoring a native wetland prairie in the Willamette Valley of Oregon. Wetlands, 21, 135–144.
(9) Ponzio K.J., Miller S.J. & Lee M.A. (2004) Long-term effects of prescribed fire on Cladium jamaicense Cranz and Typha domingensis Pers. densities. Wetlands Ecology and Management, 12, 123–133.
(10) Austin J.E., Keough J.R. & Pyle W.H. (2007) Effects of habitat management treatments on plant community composition and biomass in a montane wetland. Wetlands, 27, 570–587.
(11) McWilliams S.R., Sloat T., Toft C.A. & Hatch D. (2007) Effects of prescribed fall burning on a wetland plant community, with implications for management of plants and herbivores. Western North American Naturalist, 67, 299–317.
(12) Martin K.L. & Kirkman L.K. (2009) Management of ecological thresholds to re-establish disturbance-maintained herbaceous wetlands of the south-eastern USA. Journal of Applied Ecology, 46, 906–914.
(13) Luvuno L. (2013) Burning wetlands: the influence of fire on wetland vegetation structure and composition. Masters Thesis. University of KwaZulu-Natal.
(14) Boughton E.H., Quintana-Ascencio P.F., Bohlen P.J., Fauth J.E. & Jenkins D.G. (2016) Interactive effects of pasture management intensity, release from grazing and prescribed fire on forty subtropical wetland plant assemblages. Journal of Applied Ecology, 53, 159–170.

8. Threat: Natural system modifications
160
(15) Venne L.S., Trexler J.C. & Frederick P.C. (2016) Prescribed burn creates pulsed effects on a wetland aquatic community. Hydrobiologia, 771, 281–295.
Additional Reference
Ditlhogo M.K.M., James R., Laurence B.R. & Sutherland W.J. (1992) The effects of conservation management of reed beds. I. The invertebrates. Journal of Applied Ecology, 29, 265–276.
8.10.2 Use prescribed fire to maintain or restore disturbance: brackish/
salt marshes
Ten studies evaluated the effects, on vegetation, of using prescribed fire to maintain or restore disturbance in brackish/salt marshes. Seven studies were in the USA1–6,9. Two studies were in Argentina7,10 but based on the same experimental set-up. One study was in Guadeloupe8.
VEGETATION COMMUNITY
Community composition (1 study): One replicated, paired, controlled study in a salt marsh in Argentina7 reported that burned plots had a different overall plant community composition to unburned plots, five months after burning. The same was true in one of two comparisons 17 months after burning.
Overall richness/diversity (5 studies): Three studies (including one replicated, paired, controlled) in brackish marshes in the USA2,3 and Guadeloupe8 reported that burning had no significant effect on overall plant species richness, measured approximately 10 weeks to 2 years after the latest burn. In one of the studies8, the effects of burning and legal protection were not separated. One replicated, randomized, paired, controlled, before-and-after study in brackish marshes in the USA5 reported that burning typically had no significant effect on changes in plant species richness over two years. One replicated, paired, controlled study in a salt marsh in Argentina7 reported that burned plots had greater overall plant species richness and diversity than unburned plots, 5–17 months after burning.
Characteristic plant richness/diversity (1 study): One study of a coastal marsh in the USA4
reported that over three years after restoration – involving a prescribed burn along with restoration of tidal exchange – the number of salt-tolerant plant species increased, whilst the number of freshwater plant species decreased.
VEGETATION ABUNDANCE
Overall abundance (5 studies): Three replicated studies (one also randomized, paired, controlled) in brackish marshes in the USA2,3,5 found that overall vegetation biomass was lower in burned than unburned plots, 10 weeks or 1 year after the latest burn. One replicated, randomized, paired, controlled, before-and-after study in alkali marshes in the USA9 found that a single prescribed burn had no significant effect on overall vegetation biomass: there was a similar change over two years in burned and unburned plots. One replicated, paired, controlled study in a salt marsh in Argentina7 found that the effect of a single prescribed burn on the frequency of seedlings depended on the time since burning, but that seedlings were more frequent in burned than unburned plots after 9–12 months.
Characteristic plant abundance (1 study): One study of a coastal marsh in the USA2 found that over three years after restoration – involving a prescribed burn along with restoration of tidal exchange – the cover of salt-tolerant plant species increased, whilst the cover of freshwater plant species decreased.
Individual species abundance (7 studies): Seven studies1–7 quantified the effect of this intervention on the abundance of individual plant species. For example, five studies quantified the effects of prescribed burning on the abundance of dominant cordgrasses Spartina sp. in brackish

8. Threat: Natural system modifications
161
and salt marshes in the USA2,3,5,6 and Argentina7. Two replicated, paired, controlled studies3,7 found that cordgrass abundance (biomass3 or cover7) was lower in burned than unburned plots, between 10 weeks and 17 months after the latest burn. However, one replicated, paired, site comparison study6 found that burning typically had no significant effect on cordgrass biomass or density after 2–8 months. One replicated, before-and-after study2 found that cordgrass biomass was lower, but cover greater, one year after burning than before. One study5 reported mixed effects on cordgrass cover across two marshes.
VEGETATION STRUCTURE
Height (2 studies): Two studies (one controlled, one site comparison) in brackish marshes in the USA1 and Guadeloupe8 reported that the height of dominant grass-like plants was lower in burned than unburned areas for up to 1–2 years after the latest burn. The study in the USA1 reported recovery, to a slightly greater height than in unburned areas, after three years. The study in Guadeloupe8 also reported that the tallest trees in burned marshes were shorter than the tallest trees in unburned marshes.
A controlled, before-and-after study in 1977–1979 in a brackish marsh in Mississippi, USA (1) reported that a prescribed burn temporarily reduced the biomass and height of black rush Juncus roemerianus, but persistently reduced dominance of black rush and big cordgrass Spartina cynosuroides. Statistical significance was not assessed. One study area was initially dominated by black rush. Before burning, above-ground rush biomass was 520 g/m2 (live) and 1,080 g/m2 (dead). In the first six months after burning, black rush biomass was depressed (live: 5–360; dead: 0–84 g/m2). Over the following 30 months, live black rush biomass recovered (290–820 g/m2) whilst dead biomass remained depressed (43–740 g/m2). The maximum height of black rush was 153, 182 and 214 cm respectively in plots one- two- and three- years after burning, compared to 203 cm in unburned plots. Across these plots, black rush comprised only 56–87% of the plant biomass in burned plots (vs 62–94% in unburned plots). Another study area was initially dominated by big cordgrass. It comprised only 1–97% of the plant biomass in burned plots (vs 62–99% in unburned plots). Methods: In early 1977, 1978 or 1979, some plots in rush- or cordgrass-dominated areas of a tidal brackish marsh were burned once. Some additional plots were left unburned. The marsh was historically burned, but not since 1973. Vegetation was surveyed until November 1979. The study does not report further methodological details.
A replicated, before-and-after study in 1988–1989 in two brackish marshes in Florida, USA (2) found that a prescribed burn reduced vegetation biomass, increased cover of tall vegetation and increased species richness of short vegetation. In both marshes, above-ground vegetation biomass was lower one year after burning (530 g/m2) than before (1,730–1,810 g/m2). The same was true for live and dead biomass separately, but the ratio of live to dead biomass increased after burning (see original paper for data). Cover of plants >50 cm tall was greater one year after burning than before (before: 107–108%; after: 120–131%). Richness of plants <50 cm tall increased in both marshes (before: 0.5–1 species/transect; after: 3–4 species/ transect). There were no significant changes in cover of shorter plants, richness of taller plants, or total richness (see original paper for data). Results for the dominant species in each marsh (black rush Juncus roemerianus and sand cordgrass Spartina bakeri) mirrored overall results: lower biomass after burning (rush: 465 g/m2; cordgrass: 400 g/m2) than before (rush: 1,576 g/m2; cordgrass: 1,312 g/m2), but greater cover after burning (rush: 99%; cordgrass: 92%) than before (rush: 92%;

8. Threat: Natural system modifications
162
cordgrass: 70%). Statistical significance of these dominant species results was not assessed. Methods: Two marshes, one rush-dominated and one cordgrass-dominated, were burned in November 1988. The marshes had “long been exposed to fire” but had last burned in 1985. Plant species and their cover were recorded immediately before and one year after the prescribed burn, along four or five 15-m-long transects/marsh. Vegetation was cut from twenty-five 0.25-m2 quadrats/marsh, then dried and weighed.
A replicated, paired, controlled study in 1991 in a brackish marsh in Louisiana, USA (3) found that burned plots contained less plant biomass than unburned plots, but had similar plant species richness. Ten weeks after a single burn, above-ground vegetation biomass was lower in burned plots (565 g/m2) than in unburned plots (947 g/m2). For five of six common plant species, biomass was statistically similar in burned and unburned plots. For the sixth species, saltmeadow cordgrass Spartina patens, burned plots contained significantly less biomass (311 g/m2) than unburned plots (645 g/m2). Burned and unburned plots contained a statistically similar number of plant species (data not reported). Methods: Twenty 1-m2 plots were established, in five sets of four, in a coastal brackish marsh. The marsh had probably been historically burned: burning is a traditional management technique in the area. Ten plots (two plots/set) were burned in June 1991. The other plots were not burned. Half of the plots in each treatment were also fenced to exclude herbivores. In September 1991, vegetation was cut from each plot then identified, dried and weighed.
A before-and-after study in 1993–1996 of a coastal marsh in Florida, USA (4) found that following a prescribed burn along with restoration of tidal exchange, species richness and cover of salt-tolerant vegetation increased, whilst species richness and cover of freshwater vegetation decreased. Within three years of tidal restoration, the number of salt-tolerant plant species in the marsh increased from seven to eight. Cover of salt-tolerant vegetation significantly increased (by 1,056%). The number of freshwater plant species decreased from thirteen to one. Cover of freshwater vegetation significantly decreased (by 74%). There was a non-significant 56% decline in southern cattail Typha domingensis cover. Methods: In 1993, thirteen culverts were built to restore tidal exchange to a degraded, impounded, cattail-invaded marsh. In February 1995, the marsh was burned. The study does not distinguish between the effects of these interventions. Vegetation was surveyed along fifteen 15-m transects in October 1993 (before culverts were built) and March 1996.
A replicated, randomized, paired, controlled, before-and-after study in 1992–1994 in two brackish marshes in Louisiana, USA (5) found that burning reduced vegetation biomass and affected the cover of dominant plant species, but had mixed effects on the cover of dominant plant species and plant species richness. One year after the latest burn, above-ground vegetation biomass was lower in burned areas (280–770 g/m2) than in unburned areas (450–1,200 g/m2). Burning significantly affected the cover of all three dominant plant species in one marsh (e.g. saltmeadow cordgrass Spartina patens cover was 27–35% in burned areas, vs 56–78% in unburned areas) but had no significant effect on cover of both dominant plant species in the other marsh (see original paper for data). Burning had no significant effect on plant species richness in three of four comparisons: there were statistically similar changes over two years in burned and unburned areas (see original paper for data). In the other comparison, involving subplots fenced to exclude wild mammals, plant species richness increased in burned areas (by 3.8 species/m2) but did not significantly change in unburned areas (non-significant decline of 0.4 species/m2).

8. Threat: Natural system modifications
163
Methods: Ten pairs of 100-m2 plots were established across two brackish marshes (regularly burned for at least 100 years). One random plot in each pair was burned in autumn 1992 and 1993. The other plots were not burned. Each plot contained two 4-m2 subplots, one of which was fenced. Plant species and their cover were recorded in autumn 1992 (before intervention) and 1994. Vegetation was cut from one 0.25-m2 quadrat/subplot, then dried and weighed, in autumn 1994.
A replicated, paired, site comparison study in 1989 in two brackish marshes in Louisiana, USA (6) found that a single prescribed burn typically had no significant effect on density or biomass of saltmeadow cordgrass Spartina patens. Between two and eight months after intervention, burned and unburned plots contained a statistically similar density of cordgrass stems (data not reported) and similar cordgrass biomass in five of six statistically tested comparisons (for which burned: 420–2,750 g/m2; unburned: 680–2,480 g/m2). In the other comparison, cordgrass biomass was lower in burned plots (1,970 g/m2) than in unburned plots (2,650 g/m2). Methods: Vegetation was sampled in May, August, October and November 1989, from 1–10 plots/marsh burned in March and 1–10 plots/marsh not burned that year. It is not clear whether the marshes had been burned before 1989, but burning is a traditional management technique in the area. Each sample involved cutting vegetation from one 0.1-m2 quadrat/plot then counting stems, and drying and weighing cordgrass plants.
A replicated, paired, controlled study in 1999–2000 in an ephemeral inland salt marsh in northeast Argentina (7) found that burned plots contained a different plant community to unburned plots for up to 17 months, with higher plant diversity and richness, and lower cover of the dominant grass species. Five months after a prescribed burn, the overall plant community composition differed between burned and unburned plots in two of two comparisons. After 17 months, clear differences persisted in only one of two comparisons (data reported as graphical analyses; statistical significance of differences not assessed). At both times, burned plots had significantly higher plant species richness than unburned plots (burned: 11–15 species/16 m2; unburned: 6–10 species/16 m2), significantly higher plant diversity (data not reported), and significantly lower cover of gulf cordgrass Spartina argentinensis (burned: 24–53%; unburned: 61–73%). Methods: Two pairs of 100 x 150 m plots were established in a cordgrass-dominated ephemeral marsh. The plots had not burned for ≥3 years, although fire is usually a common disturbance in these wetlands. In August 1999, one plot in each pair was deliberately burned. Plant species and their cover were recorded in December 1999 and 2000, in twelve 4 x 4 m quadrats/plot. This study was based on the same experimental set-up as (10).
A site comparison study in 2003 of three ephemeral brackish marshes in Guadeloupe (8) found that a marsh where traditional burning was maintained had similar plant species richness to marshes where burning had ceased, but supported a greater relative abundance of herbaceous vegetation. The burned marsh had statistically similar plant species richness (27 species/320 m2) to the unburned marshes (32 species/480 m2). However, the burned marsh was dominated more by short herbs (45% of all individual plants; unburned: 21%) and less by trees/woody lianas (14% of all individual plants; unburned: 27%). The dominant herb, sawgrass Cladium jamaicense, was significantly shorter in burned than unburned marshes (see original paper for data). The tallest tree stems in burned marshes were only 1–2 m, compared to 8 m in the unburned marsh. Methods: In March–April 2003, plant species, cover and height were recorded in three coastal brackish marshes. One marsh

8. Threat: Natural system modifications
164
was still burned under a traditional management regime (last burned in 2001). In the other two marshes, within a nature reserve, traditional burning had ceased around 1998. Vegetation was surveyed in 16–24 plots, each 20 m2, in each marsh.
A replicated, randomized, paired, controlled, before-and-after study in 1998–2000 in ephemeral alkali marshes around one lake in Idaho, USA (9) found that a single prescribed burn had no significant effect on vegetation biomass. After both one and two years, changes in live above-ground plant biomass were statistically similar in burned plots (non-significant change of <40 g/m2 from before to after intervention) and unburned plots (non-significant change of <100 g/m2 from before to after intervention). Methods: Three pairs of fields with similar neighbouring vegetation were studied. Each field contained a range of wetland habitats, including alkali flats (seasonally flooded; developed a salt crust each summer). All fields had been historically grazed and cut, but were undisturbed from 1996. In October 1998 (when vegetation was dormant) one random field per pair was burned. Vegetation was surveyed in June–July before intervention (1998) and for two years after (1999, 2000).
A replicated, paired, controlled study in 1999–2000 in an ephemeral inland salt marsh in northeast Argentina (10) found that the effect of a single prescribed burn on seedling frequency varied according to the time since burning. In two of two comparisons after one month, the frequency of plant seedlings was statistically similar in burned plots (2% of quadrats contained ≥1 seedling) and unburned plots (6% of quadrats contained ≥1 seedling). After six months, seedlings were less frequent in burned plots in two of two comparisons (burned: 0%; unburned: 16–17%). After 9–12 months, seedlings were more frequent in burned plots in six of six comparisons (burned: 9–81%; unburned: 0–31%). Methods: Two pairs of 100 x 150 m plots were established in a cordgrass-dominated ephemeral marsh. The plots had not burned for ≥3 years, although fire is usually a common disturbance in these wetlands. In August 1999, one plot in each pair was deliberately burned. Seedlings of all plant species were counted between September 1999 and August 2000, in one hundred 50 x 50 cm quadrats/plot. This study was based on the same experimental set-up as (7).
(1) Hackney C.T. & de la Cruz A.A. (1981) Effects of fire on brackish marsh communities: management implications. Wetlands, 1, 75–86.
(2) Schmalzer P.A., Hinkle C.R. & Mailander J.L. (1991) Changes in community composition and biomass in Juncus roemerianus Scheele and Spartina bakeri Merr. marshes one year after a fire. Wetlands, 11, 67–86.
(3) Taylor K.L., Grace J.B., Guntenspergen G.R. & Foote A.L. (1994) The interactive effects of herbivory and fire on an oligohaline marsh, Little Lake, Louisiana, USA. Wetlands, 14, 82–87.
(4) Brockmeyer R.E. Jr., Rey J.R., Virnstein R.W., Gilmore R.G. & Earnest L. (1996) Rehabilitation of impounded estuarine wetlands by hydrological reconnection to the Indian River Lagoon, Florida (USA). Wetlands Ecology and Management, 4, 93–109.
(5) Ford M.A. & Grace J.B. (1998) The interactive effects of fire and herbivory on a coastal marsh in Louisiana. Wetlands, 18, 1–8.
(6) Flynn K.M., Mendelssohn I.A. & Wilsey B.J. (1999) The effect of water level management on the soils and vegetation of two coastal Louisiana marshes. Wetlands Ecology and Management, 7, 193–218.
(7) Feldman S.R. & Lewis J.P. (2005) Effects of fire on the structure and diversity of a Spartina argentinensis tall grassland. Applied Vegetation Science, 8, 77–84.
(8) Imbert D. & Delbé L. (2006) Ecology of fire-influenced Cladium jamaicense marshes in Guadeloupe, Lesser Antilles. Wetlands, 26, 289–297.
(9) Austin J.E., Keough J.R. & Pyle W.H. (2007) Effects of habitat management treatments on plant community composition and biomass in a montane wetland. Wetlands, 27, 570–587.
(10) Feldman S.R. & Lewis J.P. (2007) Demographic responses to fire of Spartina argentinensis in temporary flooded grassland of Argentina. Wetlands, 27, 785–793.

8. Threat: Natural system modifications
165
8.10.3 Use prescribed fire to maintain or restore disturbance: freshwater
swamps
Two studies evaluated the effects, on vegetation, of using prescribed fire to maintain or restore disturbance in freshwater swamps. Both studies were in the USA.
VEGETATION COMMUNITY
Tree/shrub richness/diversity (1 study): One replicated, site comparison study in the USA2 found that shrub-dominated wetlands burned every three years contained fewer species of mature tree than unburned wetlands, but a similar number of shrub and sapling species.
VEGETATION ABUNDANCE
Overall abundance (1 study): One replicated, site comparison study of bottomland swamps in the USA1 found that swamps burned every 2–3 years had a similar overall density of midstory and understory vegetation to unburned swamps.
Herb abundance (2 studies): One replicated, site comparison study of shrub-dominated wetlands in the USA2 found that wetlands burned every three years had greater cover of grasses than unburned wetlands, but statistically similar cover of forbs and ferns. Another replicated, site comparison study of bottomland swamps in the USA1 found that swamps burned every 2–3 years had a similar density of understory grasses to unburned swamps.
Tree/shrub abundance (2 studies): One replicated, site comparison study of shrub-dominated wetlands in the USA2 found that wetlands burned every three years had greater cover of shrubs than unburned wetlands. Another replicated, site comparison study of bottomland swamps in the USA1 found that swamps burned every 2–3 years had a similar density of shrubs, vines and other woody plants to unburned swamps.
VEGETATION STRUCTURE
Height (2 studies): One replicated, site comparison study of bottomland swamps in the USA1 found that swamps burned every 2–3 years had a shorter tree canopy than unburned swamps – but a similar-height midstory and understory. Another replicated, site comparison study of shrub-dominated wetlands in the USA2 found that the tree canopy was a similar height in wetlands burned every three years and unburned wetlands.
Basal area (1 study): One replicated, site comparison study of bottomland swamps in the USA1 found that swamps burned every 2–3 years had a similar basal area of trees to unburned swamps.
Canopy cover (1 study): One replicated, site comparison study of shrub-dominated wetlands in the USA2 found that wetlands burned every three years had less canopy cover than unburned wetlands.
A replicated, site comparison study in 2001 of six bottomland swamp stands in Georgia, USA (1) found that burned stands had a shorter tree canopy than unburned stands, but there were no other significant differences in vegetation structure or abundance. Burned stands had a shorter canopy (21 m) than unburned stands (24 m), but a statistically similar midstory height (burned: 13 m; unburned: 12 m) and understory height (burned: 26 cm; unburned: 26 cm). The treatments also had a statistically similar basal area (burned: 31.6; unburned: 30.3 m2/ha), midstory density (burned: 1,342; unburned: 2,370 stems/ha), understory density (burned: 170; unburned: 98 stems/6 m2). The same was true separately for understory grasses (37 vs 1 stems/6 m2), vines (30 vs 38 stems/6 m2), shrubs (75 vs 26 stems/6 m2) and other woody plants (26 vs 32 stems/6 m2). Methods: In summer 2001, vegetation was surveyed in six stands of poorly drained, bottomland hardwood forest. Three

8. Threat: Natural system modifications
166
stands had been burned every 2–3 years for the past nine years (final burn January 2001). The other three stands had not been burned for at least nine years. Canopy and midstory vegetation were surveyed in two 0.04-ha plots/stand. Understory vegetation was surveyed in six 1-m2 quadrats/plot.
A replicated, site comparison study in 1996 of 48 pocosins (shrub-dominated, freshwater wetlands) within pine forest in North Carolina, USA (2) found that triennial prescribed burning increased shrub and grass cover, but reduced canopy cover and tree species richness, and had no significant effect on fern cover, forb cover, canopy height or shrub/sapling species richness. Compared to pocosins that had not burned during any growing season, pocosins burned every three growing seasons had greater shrub cover (burned: 50%; unburned: 40%) and greater grass cover (burned: 14%; unburned: 6%). However, burned pocosins had lower canopy cover (burned: 75%; unburned: 89%) and contained fewer mature tree species (burned: 6 species/site; unburned: 10 species/site). Burned and unburned pocosins had statistically similar fern cover (10% vs 6%), forb cover (3% vs 2%), tree canopy height (22 vs 19 m), shrub species richness (13 vs 12 species/site) and sapling species richness (12 species/site). Methods: In 2006, vegetation was surveyed at 19 sites within pocosins burned every three growing seasons since 1989, and at 29 sites within pocosins that had not burned during the growing season in this period. The pocosins were historically disturbed by fire, but this was suppressed after European settlement. Mature trees were surveyed in four 11-m-radius plots/site. Other vegetation was surveyed in four 5-m-radius plots/site.
(1) Moseley K.R., Castleberry S.B. & Schweitzer S.H. (2003) Effects of prescribed fire on herpetofauna in bottomland hardwood forests. Southeastern Naturalist, 2, 475–486.
(2) Allen J.C., Krieger S.M., Walters J.R. & Collazo J.A. (2006) Associations of breeding birds with fire-influenced and riparian-upland gradients in a longleaf pine ecosystem. The Auk, 123, 1110–1128.
8.10.4 Use prescribed fire to maintain or restore disturbance: brackish/
saline swamps
We found no studies that evaluated the effects, on vegetation, of using prescribed fire to maintain or restore disturbance in brackish/saline swamps.
This means that we have not yet found any studies that have directly evaluated this intervention during our systematic journal and report searches. Therefore we have no evidence to indicate whether or not the intervention has any desirable or harmful effects.
8.11 Use herbicide to maintain or restore disturbance
Background
Disturbance can clear dominant plants, maintain light availability and control nutrient levels – and may maintain vegetation in a desirable and/or species-rich state (Hall et al. 2008; Middleton 2013). Therefore, conservationists sometimes want to actively restore disturbance where it has ceased, or maintain disturbance at a site where it would otherwise be lost. Applying herbicide might be one way to do this.
Bear in mind that the effects of herbicide might be highly dependent on the chemical used, how it is applied and local site conditions (e.g. nutrient availability, water levels, presence/density of wild herbivores) (Tobias et al. 2016).

8. Threat: Natural system modifications
167
CAUTION: In many herbicides, the active chemicals are not specific to the problematic species so can cause collateral damage to desirable species. Relying on herbicides as the only tool to manage problematic plants can lead to the development of herbicide resistance in future generations (Powles et al. 1997). Herbicides can have severe negative side effects on biodiversity, the environment and human health (Pimentel et al. 1992). Accordingly, herbicide use – particularly in or near wetlands or water bodies – is limited in many countries.
Related interventions: Use herbicide to control problematic plants, whose success is not linked to a change in disturbance regime (9.12).
Hall S.J., Lindig-Cisneros R. & Zedler J.B. (2008) Does harvesting sustain plant diversity in Central Mexican wetlands? Wetlands, 28, 776–792.
Middleton B.A. (2013) Rediscovering traditional vegetation management in preserves: trading experiences between cultures and continents. Biological Conservation, 158, 750–760.
Pimentel D., Acquay H., Biltonen M., Rice P., Silva M., Nelson J., Lipner V., Giordano S., Horowitz A. & D’Amore M. (1992) Environmental and economic costs of pesticide use. BioScience, 42, 750–760.
Powles S.B., Preston C., Bryan I.B. & Jutsum A.R. (1997) Herbicide resistance: impact and management. Advances in Agronomy, 58, 57–93.
Tobias V.D., Block G. & Laca E.A. (2016) Controlling perennial pepperweed (Lepidium latifolium) in a brackish tidal marsh. Wetlands Ecology and Management, 24, 411–418.
8.11.1 Use herbicide to maintain or restore disturbance: freshwater
marshes
One study evaluated the effects, on vegetation, of using herbicide to maintain or restore disturbance in freshwater marshes. The study was in the USA.
VEGETATION COMMUNITY
Community composition (1 study): One replicated, randomized, controlled, before-and-after study aiming to restore freshwater marshes in the USA1 found that applying herbicide to trees (along with other interventions) significantly affected the overall plant community composition over the following five years.
VEGETATION ABUNDANCE
Characteristic plant abundance (1 study): One replicated, randomized, controlled, before-and-after study aiming to restore freshwater marshes in the USA1 reported that of the 26 plant taxa that became more frequent after applying herbicide to trees (along with other interventions), 16 were obligate wetland taxa.
VEGETATION STRUCTURE
A replicated, randomized, controlled, before-and-after study in 2000–2005 aiming to restore ephemeral freshwater marshes within pine forest in Georgia, USA (1) found that applying herbicide to trees (along with cutting and prescribed burning) altered the overall plant community composition, favouring herbaceous and wetland-characteristic species. Over five years, the community composition of managed wetlands diverged significantly from that of unmanaged wetlands (data reported as a graphical analysis). This effect was stronger in the core of the wetlands than on the wetland-upland boundary. Of 26 plant taxa whose frequency increased in managed wetlands (statistical significance not assessed), 25 were herbs and 15 were obligate wetland taxa. Methods: In summer 2000, mature stands of oak Quercus spp. trees –

8. Threat: Natural system modifications
168
that had developed following fire suppression – were removed from five depressional wetlands by cutting and/or applying herbicide (Pathway® and/or Imazapyr). Then, the wetlands were then burned three times (once every two years). The study does not distinguish between the effects of cutting, applying herbicide and prescribed burning. Five additional wetlands were not managed (trees not removed and no burning). Plant species presence/absence was recorded before (2000) and after (2005) intervention, in three to seven 100-m2 plots/wetland.
(1) Martin K.L. & Kirkman L.K. (2009) Management of ecological thresholds to re-establish disturbance-maintained herbaceous wetlands of the south-eastern USA. Journal of Applied Ecology, 46, 906–914.
8.11.2 Use herbicide to maintain or restore disturbance: brackish/salt
marshes
We found no studies that evaluated the effects, on vegetation, of using herbicide to maintain or restore disturbance in brackish/salt marshes.
This means that we have not yet found any studies that have directly evaluated this intervention during our systematic journal and report searches. Therefore we have no evidence to indicate whether or not the intervention has any desirable or harmful effects.
8.11.3 Use herbicide to maintain or restore disturbance: freshwater
swamps
One study evaluated the effects, on vegetation, of using herbicide to maintain or restore disturbance in freshwater swamps. The study was in the USA.
VEGETATION COMMUNITY
VEGETATION ABUNDANCE
Herb abundance (1 study): One replicated, randomized, controlled, before-and-after, site comparison study of freshwater swamps in the USA1 found that applying herbicide to woody vegetation (after cutting it) had no significant effect on herbaceous ground cover one year later: there were similar changes in treated and untreated swamps.
VEGETATION STRUCTURE
Basal area (1 study): One replicated, randomized, controlled, before-and-after, site comparison study of freshwater swamps in the USA1 found that applying herbicide to woody vegetation (after cutting it) had no significant effect on the basal area of woody vegetation one year later: there were similar changes in treated and untreated swamps.
Canopy cover (1 study): The same study1 found that applying herbicide to woody vegetation (after cutting it) reduced canopy cover – to similar levels as in high-quality swamps after one year.
A replicated, randomized, controlled, before-and-after, site comparison study in 2009–2011 of 19 ephemeral freshwater swamps in Florida, USA (1) found that cutting and applying herbicide to midstory vegetation reduced canopy cover one year later, but had no significant effect on ground cover or basal area. One year before intervention, treated swamps had higher canopy cover (55%) than untreated high-quality swamps (36%). One year after intervention, canopy cover in treated swamps had declined to 41%: not significantly different from the 37% cover in high-quality swamps. In untreated low-quality swamps, canopy cover was 49–54%. Other

8. Threat: Natural system modifications
169
vegetation metrics showed statistically similar responses over time (one year before vs one year after intervention) in both treated and untreated swamps. This was true for herbaceous ground cover (treated: 23% vs 17%; high-quality: 48% vs 37%; low-quality: 22% vs 19%) and the basal area of woody vegetation (treated: 14% vs 12%; high-quality: 10% vs 9%; low-quality: 16% vs 15%). Methods: In August–September 2010, excessive woody vegetation – that had grown following suppression of dry season fires – was removed from eight swamps (<6 ha). Midstory vegetation (<12.7 cm trunk diameter) was cut and removed, then herbicide (triclopyr) was applied to stumps. Note that this study evaluates the combined effect of cutting and applying herbicide. Vegetation was not treated in seven additional overgrown swamps (“low-quality habitat” for wildlife) or in four additional swamps without a dense midstory (“high-quality habitat” for wildlife). Vegetation was surveyed in each swamp in autumn 2009 and 2011. Canopy cover included the midstory and overstory. Herb cover was estimated in one 0.1-m2 quadrat/swamp.
(1) Gorman T.A., Haas C.A. & Himes J.G. (2013) Evaluating methods to restore amphibian habitat in fire-suppressed pine flatwoods wetlands. Fire Ecology, 9, 96–109.
8.11.4 Use herbicide to maintain or restore disturbance: brackish/saline
swamps
We found no studies that evaluated the effects, on vegetation, of using herbicide to maintain or restore disturbance in brackish/saline swamps.
This means that we have not yet found any studies that have directly evaluated this intervention during our systematic journal and report searches. Therefore we have no evidence to indicate whether or not the intervention has any desirable or harmful effects.
8.12 Remove plant litter
Background
Accumulation of dead plant matter, or litter, can cause undesirable changes to marsh and swamp plant communities. Litter can affect temperature, light and nutrient availability (Weltzin et al. 2005) and act as a barrier to seedlings from below and seeds from above (Facelli & Pickett 1991). Litter removal may be necessary after abandonment or suppression of disturbance. CAUTION: Litter accumulation is an important process in some wetlands, contributing organic matter to the soil. Where it is desirable to remove litter, removal by hand may cause less damage to soils and vegetation than using heavy machinery. Be aware that seeds of desirable plants may be removed along with the litter.
To be summarized as evidence for this intervention, studies must have examined the effect of litter removal alone (not, for example, the effect of removing litter from mown plots, or the combined effect of mowing and litter removal).
Related interventions: Cut/mow herbaceous plants to maintain or restore disturbance (8.7) and Use prescribed fire to maintain or restore disturbance (8.10), both of which could help to clear plant litter.
Facelli J.M. & Pickett S.T.A. (1991) Plant litter: its dynamics and effects on plant community structure. The Botanical Review, 57, 1–32.

8. Threat: Natural system modifications
170
Weltzin J.F., Keller J.K., Bridgham S.D., Pastor J., Allen P.B. & Chen J. (2005) Litter controls plant community composition in a northern fen. Oikos, 110, 537–546.
8.12.1 Remove plant litter: freshwater marshes
One study evaluated the effects, on vegetation, of removing plant litter from freshwater marshes. The study was in the USA.
VEGETATION COMMUNITY
Community composition (1 study): One replicated, paired, controlled study in rewetted marshes in the USA1 found that plots cleared of plant litter contained a plant community characteristic of wetter conditions than uncleared plots after one growing season – but not after two.
Overall richness/diversity (1 study): The same study1 found that plots cleared of plant litter contained a similar number of wetland plant species to uncleared plots, after 1–2 growing seasons.
VEGETATION ABUNDANCE
Overall abundance (1 study): One replicated, paired, controlled study in rewetted marshes in the USA1 found that plots cleared of plant litter had greater cover of wetland plants than uncleared plots after one growing season – but not after two.
VEGETATION STRUCTURE
A replicated, paired, controlled study in 1992–1993 in five freshwater marshes undergoing restoration in New York State, USA (1) found that plots cleared of plant litter contained a more wetland-characteristic plant community and greater cover of wetland plant species than uncleared plots after one growing season, but that these effects disappeared after two growing seasons. After one growing season, cleared plots contained a plant community more characteristic of wetland conditions than uncleared plots (data reported as a wetland indicator index). Cleared plots also had greater total cover of wetland plants (cleared: 24%; uncleared: 19%). The number of wetland plant species did not significantly differ between treatments (cleared: 2.4; uncleared: 2.0 species/plot). After two growing seasons, all metrics were statistically similar under both treatments: community composition, wetland plant cover (cleared: 67%; uncleared: 54%) and wetland plant richness (cleared: 3.7; uncleared: 2.8 species/plot). Methods: In May 1992, twenty 0.25-m2 plots were established across five recently rewetted sites (drained for ≥40 years previously). In five plots (one plot/site), all surface litter and plant stems were removed. Litter was left in the other 15 plots (three plots/site). Plant species and cover were recorded in autumn 1992 and 1993.
(1) Brown S.C. & Bedford B.L. (1997) Restoration of wetland vegetation with transplanted wetland soil: an experimental study. Wetlands, 17, 424–437.
8.12.2 Remove plant litter: brackish/salt marshes
We found no studies that evaluated the effects, on vegetation, of removing plant litter from brackish/salt marshes.
This means that we have not yet found any studies that have directly evaluated this intervention during our systematic journal and report searches. Therefore we have no evidence to indicate whether or not the intervention has any desirable or harmful effects.

8. Threat: Natural system modifications
171
8.12.3 Remove plant litter: freshwater swamps
We found no studies that evaluated the effects, on vegetation, of removing plant litter from freshwater swamps.
This means that we have not yet found any studies that have directly evaluated this intervention during our systematic journal and report searches. Therefore we have no evidence to indicate whether or not the intervention has any desirable or harmful effects.
8.12.4 Remove plant litter: brackish/saline swamps
We found no studies that evaluated the effects, on vegetation, of removing plant litter from brackish/saline swamps.
This means that we have not yet found any studies that have directly evaluated this intervention during our systematic journal and report searches. Therefore we have no evidence to indicate whether or not the intervention has any desirable or harmful effects.
Modified disturbance regime: too much or wrong timing
The effects of reducing grazing intensity or changing the season/timing of grazing are considered in Chapter 3.
8.13 Reduce frequency of cutting/mowing
Background
This section considers the effects of different cutting/mowing frequencies, when the lower intensity may be suitable to conserve the target vegetation. Different plant species have differing tolerance to disturbance, so the frequency and intensity of disturbance can affect the plant community composition (Connell 1978).
To be summarized as evidence in this section, studies must have compared cutting/mowing at different frequencies (e.g. 1 vs 2 cuts/year) but with the same intensity and with at least some overlap in the timing of disturbance (e.g. summer vs summer + winter). For this intervention, “reduction” includes stopping disturbance altogether. However, studies comparing areas that remain uncut to areas that become cut, at any frequency, are not summarized as evidence for this intervention.
Related interventions: Reduce frequency of vegetation harvest, including studies of cutting where vegetation is removed (6.1); Reduce intensity of cutting/mowing (8.14); Change season/timing of cutting/mowing (8.15); Cut/mow herbaceous plants to maintain or restore disturbance (8.7); Use cutting/mowing to control problematic herbaceous plants (9.8).
Connell, J.H. (1978) Diversity in tropical rain forests and coral reefs. Science, 199, 1302–1310.
8.13.1 Reduce frequency of cutting/mowing: freshwater marshes
Four studies evaluated the effects, on vegetation, of reducing the frequency of cutting/mowing in freshwater marshes (or cutting/mowing them at different frequencies). There was one study in each of USA1, the Netherlands2, Belgium3 and Italy4.

8. Threat: Natural system modifications
172
VEGETATION COMMUNITY
Community composition (1 study): One replicated, randomized, paired, controlled study of farmland ditches in the Netherlands2 found that marshy areas cut once, twice or three times/year had a similar overall plant community composition, when surveyed in July.
Overall richness/diversity (2 studies): Two replicated, paired, controlled studies in farmland ditches in the Netherlands2 and wet grasslands in Belgium3 reported that overall plant species richness was similar in plots cut once or twice/year (and three times/year in the Netherlands2).
VEGETATION ABUNDANCE
Overall abundance (1 study): One replicated, paired, controlled, before-and-after study in wet grasslands in Belgium3 reported that the effect of cutting twice/year (in July and October) on total above-ground biomass was intermediate between the effects of cutting once/year in July or October.
Individual species abundance (4 studies): All four studies1–4 quantified the effect of this intervention on the abundance of individual plant species. For example, one replicated, paired, controlled study in freshwater marshes in the USA1 reported that cattail Typha spp. biomass was greater, nine months after the last cut, in plots cut every six weeks than in plots cut every three weeks. One paired, controlled, before-and-after study in reedbeds in Italy4 found that common reed Phragmites australis biomass was similar in plots mown once or twice/year, when measured at least five months after the last cut.
VEGETATION STRUCTURE
A replicated, paired, controlled study in 1980–1981 in two artificial water treatment marshes dominated by cattails Typha spp. in Michigan, USA (1) reported that cutting cattail less frequently during one summer increased its biomass the following summer. Statistical significance was not assessed. Nine months after the last cut, cattail biomass was 390 g/m2 in plots cut every six weeks and 190 g/m2 in plots cut every three weeks. There was a similar but less extreme pattern one year after the last cut: cattail biomass was 760 g/m2 in plots cut every six weeks and 600 g/m2 in plots cut every three weeks. At both times, cattail biomass in uncut plots was 620 g/m2. Methods: In June 1980, nine plots were established in each of two cattail-dominated marshes. Over 12 weeks, six plots (three plots/marsh) were cut every six weeks and six plots (three plots/marsh) were cut every three weeks. Cuttings were removed. The remaining six plots remained undisturbed. In June and August 1981, above-ground cattail biomass was collected from each plot, then dried and weighed.
A replicated, randomized, paired, controlled study in 1989–1991 of four farmland ditches in the Netherlands (2) found that vegetation cutting had similar effects on the plant community in the emergent wetland zone, whether it was done once, twice or three times/year. The overall plant community composition was statistically similar under each cutting frequency in three of three years (data reported as statistical model results). Plant species richness was similar under each cutting frequency in 10 of 12 comparisons (for which one cut: 10–49; two cuts: 8–48; three cuts: 9–49 species/ditch). The study also identified 16 common emergent and terrestrial plant species whose cover was significantly affected by the frequency of cutting in at least one ditch (data not reported). Methods: Between 1989 and 1991, vegetation was cleared from three 20-m sections of each ditch: one section each May; one section each May and July; one section each May, July and September. Vegetation was cut within the ditch and on its margins, then dumped higher up on the ditch

8. Threat: Natural system modifications
173
banks. Each July, plant species and their cover (excluding mosses) were recorded in the emergent wetland zone (influenced by water, parts seasonally flooded) bordering each ditch.
A replicated, paired, controlled, before-and-after study in 1986–1988 in five wet grasslands in Belgium (3) reported that mowing plots once per year increased plant species richness and sometimes increased plant biomass, whilst mowing twice per year increased plant species richness and reduced plant biomass. Statistical significance was not assessed. Over two years, plant species richness increased whether plots were mown once per year (July: from 15 to 18 species/6 m2; October: from 19 to 20 species/6 m2) or twice per year (July and October: from 17 to 19 species/6 m2). Total above-ground biomass (including litter) increased in plots mown in July (from 460 to 490 g/m2), but declined in plots mown in October (from 730 to 480 g/m2) or July and October (from 660 to 630 g/m2). The study also included some data on the abundance of individual plant species under each mowing regime (see original paper). Methods: In spring 1986, three 7 x 7 m plots were established in each of five adjacent wet grasslands (mown annually for the previous 10 years). From 1986, five plots (one plot/grassland) were mown in July, five were mown in October, and five were mown in July and October. Cuttings were removed. Plant species were recorded each summer between 1986 and 1988. Biomass was cut and collected from five 30 x 30 cm quadrats/plot/year, immediately before the first mow (so not at the same time in all plots), then dried and weighed.
A paired, controlled, before-and-after study in 2000–2002 in two lakeshore reedbeds in northern Italy (4) found that plots mown once or twice each year supported similar common reed Phragmites australis biomass after two years. In both reedbeds, above-ground reed biomass was statistically similar in plots mown once each year (in winter; 625–1,751 g/m2) and plots mown twice each year (in summer and winter; 370–1,153 g/m2). Before mowing, reed biomass was statistically similar in plots destined for each treatment (477–668 g/m2). Methods: In July 2000, a pair of 10 x 10 m plots was established in each of two reedbeds on the shore of Lago di Aslerio. From summer 2000, one plot/reedbed was mown once each year (August 2000 and 2001), one plot/reedbed was mown twice each year (February 2001 and 2002, plus August mowing). Cuttings were removed. The reedbeds had been historically mown in winter (and sometimes in summer), but not for >30 years. Above-ground biomass was calculated from counts and measurements of reed shoots from three 1-m2 quadrats/plot, before intervention (July 2000) and two years later (July 2002).
(1) Ulrich K.E. & Burton T.M. (1984) The establishment and management of emergent vegetation in sewage-fed artificial marshes and the effects of these marshes on water quality. Wetlands, 4, 205–220.
(2) Best E.P.H. (1994) The impact of mechanical harvesting regimes on the aquatic and shore vegetation in water courses of agricultural areas of the Netherlands. Vegetatio, 112, 57–71.
(3) Dumortier M., Verlinden A., Beeckman H. & van der Mijnsbrugger K. (1996) Effects of harvesting dates and frequencies on above and below-ground dynamics in Belgian wet grasslands. Écoscience, 3, 190–198.
(4) Fogli S., Brancaleoni L., Lambertini C. & Gerdol R. (2014) Mowing regime has different effects on reed stands in relation to habitat. Journal of Environmental Management, 134, 56–62.
8.13.2 Reduce frequency of cutting/mowing: brackish/salt marshes
We found no studies that evaluated the effects, on vegetation, of reducing the frequency of cutting/ mowing in brackish/salt marshes (or cutting/mowing them at different frequencies).

8. Threat: Natural system modifications
174
This means that we have not yet found any studies that have directly evaluated this intervention during our systematic journal and report searches. Therefore we have no evidence to indicate whether or not the intervention has any desirable or harmful effects.
8.14 Reduce intensity of cutting/mowing
We found no studies that evaluated the effects, on vegetation, of reducing the intensity of cutting/ mowing in marshes or swamps (or cutting/mowing them at different intensities).
This means that we have not yet found any studies that have directly evaluated this intervention during our systematic journal and report searches. Therefore we have no evidence to indicate whether or not the intervention has any desirable or harmful effects.
Background
This section considers the effects of different disturbance intensities, when the lower intensity may be suitable to conserve the target vegetation. Different plant species have differing tolerance to disturbance, so the frequency and intensity of disturbance can affect the plant community composition (Connell 1978).
To be summarized as evidence in this section, studies must have compared cutting/mowing at different intensities (e.g. the proportion of the vegetation that is cut) but with the same frequency and with at least some overlap in the timing of disturbance (e.g. summer vs summer + winter). Note that studies comparing areas that remain uncut to areas that become cut, at any intensity, are not summarized as evidence for this intervention.
Related interventions: Reduce intensity of vegetation harvest, including studies of cutting where vegetation is removed (6.2); Reduce frequency of cutting/mowing (8.13); Change season/timing of cutting/mowing (8.15); Cut/mow herbaceous plants to maintain or restore disturbance (8.7); Use cutting/mowing to control problematic herbaceous plants (9.8).
Connell, J.H. (1978) Diversity in tropical rain forests and coral reefs. Science, 199, 1302–1310.
8.15 Change season/timing of cutting/mowing
Background
Cutting/mowing could have different effects on vegetation depending on the time of year at which it is done. For example, it might be beneficial to avoid disturbance when certain plants are young/flowering so that they can grow/reproduce and contribute to the community. The season of disturbance can also affect nutrient levels and impacts to soils by trampling or vehicles.
To be summarized as evidence in this section, studies should have compared a fixed frequency and intensity of cutting/mowing, but in different seasons (e.g. summer vs winter) or in different temporal patterns (e.g. 50% of plants cut every summer vs 100% of plants cut every other summer).
Related interventions: Change season/timing of vegetation harvest, including studies of cutting where vegetation is removed (6.3); Reduce frequency of cutting/mowing (8.13); Reduce intensity of cutting/mowing (8.14); Cut/mow herbaceous plants to

8. Threat: Natural system modifications
175
maintain or restore disturbance (8.7); Use cutting/mowing to control problematic herbaceous plants (9.8).
8.15.1 Change season/timing of cutting/mowing: freshwater marshes
Four studies evaluated the effects, on vegetation, of cutting/mowing freshwater marshes in different seasons or at different times. There was one study in each of Switzerland1, the Netherlands2, Belgium3 and Japan4.
VEGETATION COMMUNITY
Community composition (2 studies): Two replicated, randomized, paired, controlled studies in wet meadows in Switzerland1 and farmland ditches in the Netherlands2 reported that cutting vegetation in different seasons typically had similar effects on the overall plant community composition, over 1–4 years.
Overall richness/diversity (2 studies): One replicated, randomized, paired, controlled study in farmland ditches in the Netherlands2 found that marshy areas cut in May and areas cut in November typically contained a similar number of plant species, when surveyed in July. One replicated, paired, controlled study of wet grasslands in Belgium3 reported that the effect of a single mow between June and November on overall plant species richness depended on the month of mowing.
VEGETATION ABUNDANCE
Overall abundance (1 study): One replicated, paired, controlled study of wet grasslands in Belgium3 reported that the effect of a single mow between June and November on overall vegetation abundance (including litter) depended on the month of mowing.
Individual species abundance (4 studies): All four studies1–4 quantified the effect of this intervention on the abundance of individual plant species. The studies all reported that the abundance of some plant species responded differently to cutting in different seasons. The controlled, before-and-after study in Japan4, for example, reported that cutting in June reduced the abundance of common reed Phragmites australis in the following summer more than cutting in July.
VEGETATION STRUCTURE
Overall structure (1 study): One replicated, randomized, paired, controlled study in wet meadows in Switzerland1 reported that summer-mown and winter-mown plots both experienced a shift in vegetation cover towards lower vegetation layers, over 3–4 years.
Diameter/perimeter/area (1 study): The same study1 reported that summer-mowing and winter-mowing had opposite effects on the diameter of common reed Phragmites australis shoots: they became thinner over four years of summer mowing but thicker over three years of winter mowing.
A replicated, randomized, paired, controlled study in 1983–1986 in two wet meadows in Switzerland (1) reported that summer and winter mowing had similar effects on overall plant community composition and structure, but different effects on some individual plant species. Statistical significance was not assessed. Over 3–4 years, plots mown in summer and winter experienced similar changes in overall plant community composition (partial data reported as a graphical analysis). Both mowing regimes were associated with a significant increase in the proportion of vegetation in lower layers. This was true for vegetation overall, and the dominant species in each community (partial data reported, as number of times survey pins touched living vegetation). Some individual species responded differently to each mowing regime. For example, common reed Phragmites communis developed more, thinner shoots and lower above-ground biomass over four years of summer mowing, but developed

8. Threat: Natural system modifications
176
fewer, thicker shoots and greater above-ground biomass over three years of winter mowing (see original paper for partial data). Methods: Two pairs of plots (each 121–169 m2) were established in two historically mown, but abandoned, lakeside wet meadows. In each pair, one random plot was mown in winter (from early 1983) and one random plot was mown in late summer (from 1983). Cuttings were removed. Vegetation was surveyed each summer 1983–1986 (before mowing, where applicable).
A replicated, randomized, paired, controlled study in 1989–1991 of four farmland ditches in the Netherlands (2) found that vegetation cutting had similar effects on the plant community in the emergent wetland zone, whether it was done in May or November. The season of cutting had no significant effect on the overall plant community composition in two of three years, and had only a small effect in the other year (data reported as statistical model results). The season of cutting had no significant effect on plant species richness in 11 of 12 comparisons (for which May-cut: 10–49; November-cut: 8–47 species/ditch). The study also identified 18 common emergent and terrestrial plant species whose cover was significantly affected by the season of cutting in at least one of the four ditches (data not reported). Methods: Between 1989 and 1991, vegetation was cleared from two 20-m sections of each ditch: one section each May and one section each November. Vegetation was cut within the ditch and on its margins, then dumped higher up on the ditch banks. Each July, plant species and their cover (excluding mosses) were recorded in the emergent wetland zone (influenced by water, parts seasonally flooded) bordering each ditch.
A replicated, paired, controlled, before-and-after study in 1986–1988 in five wet grasslands in Belgium (3) reported mixed effects of single annual mows, between June and November, on plant species richness and biomass. Statistical significance was not assessed. Over two years, plant species richness increased in plots mown between July and October (from 15–19 to 18–20 species/6 m2). It declined in plots mown in November (from 19 to 18 species/6 m2) and was stable in plots mown in June (17 species/6 m2). Total above-ground biomass (including litter) declined in plots mown between August and October (from 550–730 g/m2 to 480–560 g/m2). It increased in plots mown in June, July or November (from 310–660 g/m2 to 410–780 g/m2). The study also reported data on the cover of some example individual plant species (see original paper). Methods: In spring 1986, six 7 x 7 m plots were established in each of five adjacent wet grasslands (mown annually for the previous 10 years). From 1986, one plot/grassland was mown in each month between June and November. Cuttings were removed. Plant species were recorded each summer between 1986 and 1988. Biomass was cut and collected from five 30 x 30 cm quadrats/plot/year, immediately before mowing (so not at the same time in all plots), then dried and weighed.
A controlled, before-and-after study in 2000–2001 of a riparian reedbed near Tokyo, Japan (4) reported that cutting in June suppressed common reed Phragmites australis biomass and density more, over the second growing season after cutting, than cutting in July. Unless specified, statistical significance was not assessed. Before cutting, common reed abundance was statistically similar in both plots (density: 91–102 shoots/m2; above-ground biomass: 40–660 g/m2). In the first growing season after cutting, common reed abundance showed similar responses in both June-cut and July-cut plots: initial decline, then recovery to similar levels (see original paper for data). In the second growing season after cutting, June-cut plots contained fewer reed shoots than July-cut plots at four of six time points (for which June-cut: 140–156 shoots/m2; July-cut: 168–218 shoots/m2) and less reed biomass at three of seven time points (for which June-cut: 370–800 g/m2; July-cut: 710–1070 g/m2). At all other

8. Threat: Natural system modifications
177
times, reed abundance was similar in June- and July-cut plots. Methods: In April 2000, two 6 x 10 m plots were established in a mature riparian reedbed. Reeds were cut in early June 2000 in one plot and early July 2000 in the other (20–30 cm above ground level; cuttings removed). Reed shoots were cut, counted, dried and weighed every 1–2 months between April and December 2000 and 2001 (three 0.125-m2 quadrats/plot/ survey).
(1) Buttler A. (1992) Permanent plot research in wet meadows and cutting experiment. Vegetatio, 103, 113–124.
(2) Best E.P.H. (1994) The impact of mechanical harvesting regimes on the aquatic and shore vegetation in water courses of agricultural areas of the Netherlands. Vegetatio, 112, 57–71.
(3) Dumortier M., Verlinden A., Beeckman H. & van der Mijnsbrugger K. (1996) Effects of harvesting dates and frequencies on above and below-ground dynamics in Belgian wet grasslands. Écoscience, 3, 190–198.
(4) Asaeda T., Rajapakse L., Manatunge J. & Sahara N. (2006) The effect of summer harvesting of Phragmites australis on growth characteristics and rhizome resource storage. Hydrobiologia, 553, 327–335.
8.15.2 Change season/timing of cutting/mowing: brackish/salt marshes
We found no studies that evaluated the effects, on vegetation, of cutting/mowing brackish/salt marshes in different seasons or at different times.
This means that we have not yet found any studies that have directly evaluated this intervention during our systematic journal and report searches. Therefore we have no evidence to indicate whether or not the intervention has any desirable or harmful effects.
8.16 Reduce frequency of prescribed burning
We found no studies that evaluated the effects, on vegetation, of reducing the frequency of prescribed burning in marshes or swamps (or burning them at different frequencies).
This means that we have not yet found any studies that have directly evaluated this intervention during our systematic journal and report searches. Therefore we have no evidence to indicate whether or not the intervention has any desirable or harmful effects.
Background
This section considers the effects of different prescribed burning frequencies, when the lower intensity may be suitable to conserve marsh or swamp vegetation. Different plant species have differing tolerance to disturbance, so the frequency and intensity of disturbance can affect the plant community composition (Connell 1978).
To be summarized as evidence in this section, studies must have compared burning at different frequencies (e.g. 1 vs 2 burns/year) but with the same intensity and with at least some overlap in the timing of disturbance (e.g. summer vs summer + winter). For this intervention, “reduction” includes stopping disturbance altogether. However, studies comparing areas that remain unburned to areas that become burned, at any frequency, are not summarized as evidence for this intervention.
Related interventions: Reduce intensity of prescribed burning (8.17); Change season/timing of prescribed burning (8.18); Use prescribed fire to maintain or restore disturbance (8.10); Use prescribed fire to control problematic plants (9.11).
Connell, J.H. (1978) Diversity in tropical rain forests and coral reefs. Science, 199, 1302–1310.

8. Threat: Natural system modifications
178
8.17 Reduce intensity of prescribed burning
We found no studies that evaluated the effects, on vegetation, of reducing the intensity of prescribed burning in marshes or swamps (or burning them at different intensities).
This means that we have not yet found any studies that have directly evaluated this intervention during our systematic journal and report searches. Therefore we have no evidence to indicate whether or not the intervention has any desirable or harmful effects.
Background
This section considers the effects of different intensities of prescribed burning, when the lower intensity may be suitable to conserve marsh or swamp vegetation. Different plant species have differing tolerance to disturbance, so the frequency and intensity of disturbance can affect the plant community composition (Connell 1978).
To be summarized as evidence in this section, studies must have compared prescribed burns at different intensities (e.g. by adjusting fuel load before burning) but with the same frequency and with at least some overlap in the timing of disturbance (e.g. summer vs summer + winter). Note that studies comparing areas that remain unburned to areas that become burned, at any intensity, are not summarized as evidence for this intervention.
Related interventions: Reduce frequency of prescribed burning (8.16); Change season/ timing of prescribed burning (8.18); Use prescribed fire to maintain or restore disturbance (8.10); Use prescribed fire to control problematic plants (9.11).
Connell, J.H. (1978) Diversity in tropical rain forests and coral reefs. Science, 199, 1302–1310.
8.18 Change season/timing of prescribed burning
Background
Prescribed burning could have different effects on vegetation depending on the time of year at which it is done. For example, it might be beneficial to avoid disturbance when certain plants are young/flowering so that they can grow/reproduce and contribute to the community. The season of disturbance can also affect nutrient levels and impacts to soils by trampling or vehicles.
To be summarized as evidence in this section, studies should have compared a fixed frequency and intensity of burning, but in different seasons (e.g. summer vs winter) or in different temporal patterns (e.g. 50% of marsh burned every summer vs 100% of marsh burned every other summer).
Related interventions: Reduce frequency of prescribed burning (8.16); Reduce intensity of prescribed burning (8.17); Use prescribed fire to maintain or restore disturbance (8.10); Use prescribed fire to control problematic plants (9.11).
8.18.1 Change season/timing of prescribed burning: freshwater marshes
One study evaluated the effects, on vegetation, of burning freshwater marshes in different seasons or at different times. The study was in the USA.
VEGETATION COMMUNITY

8. Threat: Natural system modifications
179
Overall richness/diversity (1 study): One replicated, randomized, controlled study in a marsh in the USA1 found that spring-burned plots had greater plant species richness than summer-burned plots, at the end of the growing season.
VEGETATION ABUNDANCE
Overall abundance (1 study): One replicated, randomized, controlled study in a marsh in the USA1 found that spring-burned plots had greater overall vegetation cover than summer-burned plots, at the end of the growing season.
Individual species abundance (1 study): The same study1 reported that the cover and frequency of some individual plant species responded differently to spring vs summer burning.
VEGETATION STRUCTURE
A replicated, randomized, controlled study in 1992 in an ephemeral freshwater marsh in Missouri, USA (1) found that spring-burned plots had greater plant species richness and overall vegetation cover than summer-burned plots at the end of the growing season, and supported a different abundance of individual plant species. At the end of September, spring-burned plots had greater plant species richness (5.5 species/m2) than summer-burned plots (2.6 species/m2). Spring-burned plots had greater overall vegetation cover (94%) than summer-burned plots (23%). The most abundant plant species in spring-burned plots included ricecut grass Leersia oryzoides (cover: 50%; frequency: 97%), beggarticks Bidens spp. (cover: 31%; frequency: 100%) and marsh elder Iva ciliata (cover: 17%; frequency: 90%). The most abundant species in summer-burned plots included ricecut grass (cover: 5%; frequency: 97%) and sesbania Sesbania exaltala (cover: 5%; frequency: 70%). Beggarticks and marsh elder each had <1% cover and occurred in only 3% of quadrats, on average. Methods: In 1992, six 0.1-ha plots were established in a freshwater marsh managed for waterfowl (i.e. winter flooding followed by spring or summer drawdown). Three random plots were burned in spring (early April) and three were burned in summer (late July). In the summer-burned plots, vegetation was mown three days before burning. Cover of every plant species, and bare ground, were recorded in late September 1992 in ten 1-m2 quadrats/plot.
(1) Laubhan M.K. (1995) Effects of prescribed fire on moist-soil vegetation and soil macronutrients. Wetlands, 15, 159–166.
8.18.2 Change season/timing of prescribed burning: brackish/salt marshes
We found no studies that evaluated the effects, on vegetation, of burning brackish/salt marshes in different seasons or at different times.
This means that we have not yet found any studies that have directly evaluated this intervention during our systematic journal and report searches. Therefore we have no evidence to indicate whether or not the intervention has any desirable or harmful effects.
8.18.3 Change season/timing of prescribed burning: freshwater swamps
We found no studies that evaluated the effects, on vegetation, of burning freshwater swamps in different seasons or at different times.
This means that we have not yet found any studies that have directly evaluated this intervention during our systematic journal and report searches. Therefore we have no evidence to indicate whether or not the intervention has any desirable or harmful effects.

8. Threat: Natural system modifications
180
8.18.4 Change season/timing of prescribed burning: brackish/saline
swamps
We found no studies that evaluated the effects, on vegetation, of burning brackish/saline swamps in different seasons or at different times.
This means that we have not yet found any studies that have directly evaluated this intervention during our systematic journal and report searches. Therefore we have no evidence to indicate whether or not the intervention has any desirable or harmful effects.
Modified wild fire regime
Interventions in the previous section could be used to compensate for loss of disturbance from fire. The following interventions therefore tackle the threat from excess wild fire.
8.19 Thin vegetation to prevent wild fires
We found no studies that evaluated the effects, on marsh/swamp vegetation, of thinning vegetation to prevent wild fires in or near these habitats.
This means that we have not yet found any studies that have directly evaluated this intervention during our systematic journal and report searches. Therefore we have no evidence to indicate whether or not the intervention has any desirable or harmful effects.
Background
Fire is an important disturbance in some marshes and swamps, whether it occurs naturally (Sutter & Kral 1994) or is prescribed by humans to manage the vegetation (Middleton 2013). However, if fire becomes too frequent or intense, or occurs at the “wrong” time of year, it can cause undesirable damage to these ecosystems. Fires within marshes or swamps can directly damage the vegetation and soils (Kotze 2013). Fires in the watershed can affect the water quality in focal marshes or swamps (Pinel-Alloul et al. 2002). It is possible to manage the frequency, intensity and timing of wild fires by removing/thinning the vegetation, thereby reducing the amount of fuel available (WRC 2000).
To be summarized in this intervention, studies could have compared areas or time periods in which vegetation has been thinned (using any method, including prescribed burning, within or adjacent to focal marshes or swamps) with areas or time periods in which vegetation was not thinned and experienced wild fire. The study must have monitored the vegetation, not just properties of the fire.
Related interventions: Raise water level to prevent wild fires (8.20); Build fire breaks (8.21); methods of controlling vegetation abundance: cutting, physical removal, prescribed burning and herbicide (Chapter 8/Chapter 9); Increase ‘on the ground’ protection for marshes or swamps, including fire fighting teams (14.5).
Kotze D.C. (2013) The effects of fire on wetland structure and functioning. African Journal of Aquatic Science, 38, 237–247.
Middleton B.A. (2013) Rediscovering traditional vegetation management in preserves: trading experiences between cultures and continents. Biological Conservation, 158, 750–760.
Pinel-Alloul B., Prepas E., Planas D., Steedman R. & Charette T. (2002) Watershed impacts of logging and wildfire: case studies in Canada. Lake and Reservoir Management, 18, 307–318.

8. Threat: Natural system modifications
181
Sutter R.D. & Kral R. (1994) The ecology, status, and conservation of two non-alluvial wetland communities in the South Atlantic and Eastern Gulf coastal plain, USA. Biological Conservation, 235–243.
WRC (2000) Water Notes 2: Wetlands and Fire. Water and Rivers Commission, Government of Western Australia, Perth. Available at https://water.wa.gov.au/__data/assets/pdf_file/0019/3349/11412.pdf. Accessed 20 September 2019.
8.20 Raise water level to prevent wild fires
We found no studies that evaluated the effects, on marsh/swamp vegetation, of raising the water level to prevent wild fires in or near these habitats.
This means that we have not yet found any studies that have directly evaluated this intervention during our systematic journal and report searches. Therefore we have no evidence to indicate whether or not the intervention has any desirable or harmful effects.
Background
Fire is an important disturbance in some marshes and swamps, whether it occurs naturally (Sutter & Kral 1994) or is prescribed by humans to manage the vegetation (Middleton 2013). However, if fire becomes too frequent or intense, or occurs at the “wrong” time of year, it can cause undesirable damage to these ecosystems. Fires within marshes or swamps can directly damage the vegetation and soils (Kotze 2013). Fires in the watershed can affect the water quality in focal marshes or swamps (Pinel-Alloul et al. 2002).
It may be possible to manage the frequency, intensity and timing of wild fires by raising the water level/table in focal marshes/swamps or surrounding areas. Wet soils or areas of open water can suppress fire. CAUTION: Restoring limited flooding to a site could actually increase fire risk by encouraging plant growth and thereby increasing fuel load during dry periods (Heinl et al. 2006).
To be summarized in this intervention, studies could have compared areas (or time periods) with high water tables and areas (or time periods) with low water tables and where wild fire occurred. Studies must have monitored the vegetation within marshes or swamps, not just properties of the fire.
Related interventions: Raise water level to restore degraded marshes or swamps (8.1); Raise water level to restore/create marshes or swamps from other land uses (12.4); Thin vegetation to prevent wild fires (8.19); Build fire breaks (8.21); Increase ‘on the ground’ protection for marshes or swamps, including fire fighting teams (14.5).
Heinl M., Neuenschwander A., Sliva J. & Vanderpost C. (2006) Interactions between fire and flooding in a southern African floodplain system (Okavango Delta, Botswana). Landscape Ecology, 21, 699–709.
Kotze D.C. (2013) The effects of fire on wetland structure and functioning. African Journal of Aquatic Science, 38, 237–247.
Middleton B.A. (2013) Rediscovering traditional vegetation management in preserves: trading experiences between cultures and continents. Biological Conservation, 158, 271–279.
Pinel-Alloul B., Prepas E., Planas D., Steedman R. & Charette T. (2002) Watershed impacts of logging and wildfire: case studies in Canada. Lake and Reservoir Management, 18, 307–318.
Sutter R.D. & Kral R. (1994) The ecology, status, and conservation of two non-alluvial wetland communities in the South Atlantic and Eastern Gulf coastal plain, USA. Biological Conservation, 235–243.

8. Threat: Natural system modifications
182
8.21 Build fire breaks
We found no studies that evaluated the effects, on marsh/swamp vegetation, of building fire breaks to protect these habitats.
This means that we have not yet found any studies that have directly evaluated this intervention during our systematic journal and report searches. Therefore we have no evidence to indicate whether or not the intervention has any desirable or harmful effects.
Background
Fire is an important disturbance in some marshes and swamps, whether it occurs naturally (Sutter & Kral 1994) or is prescribed by humans to manage the vegetation (Middleton 2013). However, if fire becomes too frequent or intense, or occurs at the “wrong” time of year, it can cause undesirable damage to these ecosystems. Fires within marshes or swamps can directly damage the vegetation and soils (Kotze 2013). Fires in the watershed can affect the water quality in focal marshes or swamps (Pinel-Alloul et al. 2002).
Fire breaks could be constructed to completely exclude fires from marshes/swamps or nearby habitats, or restrict fires to certain areas. Fire breaks could be strips cleared of vegetation, strips of fire-resistant vegetation, embankments, empty ditches or water-filled ditches (Adinugroho et al. 2011). CAUTION: If left in place over the long term, fire breaks may pose a threat to marshes and swamps (e.g. ditches could act as drains). So, it may be desirable to dismantle them once the fire risk has passed.
To be summarized in this intervention, studies could have compared areas (or time periods) in which marshes or swamps were protected with fire breaks with areas (or time periods) in which they were not protected and experienced wild fire. Studies must have monitored the vegetation, not just properties of the fire.
Related interventions: Thin vegetation to prevent wild fires (8.19); Raise water level to prevent wild fires (8.20); Increase ‘on the ground’ protection for marshes or swamps, including fire fighting teams (14.5).
Adinugroho W.C., Suryadiputra I.N.N., Saharjo B.H. & Siboro L. (2011) Manual for the Control of Fire in Peatlands and Peatland Forest. Wetlands International Indonesia & Wildlife Habitat Canada, Bogor.
Kotze D.C. (2013) The effects of fire on wetland structure and functioning. African Journal of Aquatic Science, 38, 237–247.
Middleton B.A. (2013) Rediscovering traditional vegetation management in preserves: trading experiences between cultures and continents. Biological Conservation, 158, 750–760.
Pinel-Alloul B., Prepas E., Planas D., Steedman R. & Charette T. (2002) Watershed impacts of logging and wildfire: case studies in Canada. Lake and Reservoir Management, 18, 307–318.
Sutter R.D. & Kral R. (1994) The ecology, status, and conservation of two non-alluvial wetland communities in the South Atlantic and Eastern Gulf coastal plain, USA. Biological Conservation, 235–243.
8.22 Put up signs to discourage fires
We found no studies that evaluated the effects, on marsh/swamp vegetation or human behaviour, of putting up signs to discourage fires in or near these habitats.
This means that we have not yet found any studies that have directly evaluated this intervention during our systematic journal and report searches. Therefore we have no evidence to indicate whether or not the intervention has any desirable or harmful effects.

8. Threat: Natural system modifications
183
Background
Signs may be erected in/around marshes or swamps to discourage fires, including campfires and barbeques. These signs may or may not have a legal basis. They may be temporary, being erected or applying only during hot/dry seasons fire risk is greatest. They may be included as part of more general information boards.
Related interventions: Put up signs to discourage littering (10.12); Raise public awareness about marshes or swamps, including through erecting information boards (15.1).

184
9. Threat: Invasive and other problematic species
Background
This chapter considers targeted management of plants and animals that have harmful effects on biodiversity following their introduction, spread or increase in abundance. Controlling dominant plant species can create space for other species to grow, potentially increasing plant diversity (Jensen & Meyer 2001). Controlling animal species can prevent them from causing damage, directly or indirectly, to vegetation. We use the verb “control” to include all management of wild problematic species, whatever the aim: eradication (complete removal), suppression (reducing distribution or abundance) or containment (stopping or slowing spread to new areas).
Following the International Union for the Conservation of Nature, we use the term “invasive species” to refer to organisms that are non-native and problematic in their new range. Non-native species tend to have more severe negative impacts than native species (Hassan & Ricciardi 2014). However, native species (which naturally occur in a region) can also be problematic, especially if they become overabundant.
Wetlands, such as marshes and swamps, are especially susceptible to invasions (Zedler & Kercher 2004). They often occur in low parts of the landscape so are natural sinks for plant propagules, nutrients and sediments that can enhance invasion success. They may receive propagules through their close links with human activities such as recreation and transport. Regular disturbances, such as seasonal floods or drought, can also favour invasions.
Some interventions in this chapter are similar to those in Chapter 8 (e.g. cutting/ mowing, grazing, prescribed burning). Chapter 8 considers use of these interventions to maintain, restore, or compensate for the loss of a regular disturbance regime. Chapter 9 considers use of these interventions to tackle problematic vegetation whose success is not clearly or primarily linked to a change in disturbance regime.
Studies in this chapter must quantify the effect of interventions on non-target vegetation. This synopsis does not include studies (a) that only report the effect of an intervention on the target problematic species, or (b) that aim to control problematic species to restore/create non-vegetated habitats (e.g. open water or mudflats). These studies are, or will be, summarized in other synopses (e.g. Aldridge et al. 2017).
Related chapters: Threat: Agriculture and aquaculture, including problematic domesticated plant and animal species (Chapter 3); Threat: Transportation and service corridors (Chapter 5), Threat: Biological resource use (Chapter 6), Threat: Human intrusions and disturbance (Chapter 7) and Threat: Pollution (Chapter 10), which can all contribute to species becoming invasive or problematic; Habitat restoration and creation, including modifications to the environment to make it less suitable for problematic species (Chapter 12).
Aldridge D.C., Aldridge S.L., Mead A., Ockendon N., Rocha R., Scales H., Smith R.K., Zieritz A. & Sutherland W.J. (2017) Control of Freshwater Invasive Species: Global Evidence for the Effects of Selected Interventions. Synopses of Conservation Evidence Series. University of Cambridge, Cambridge, UK.
Hassan A. & Ricciardi A. (2014) Are non-native species more likely to become pests? Influence of biogeographic origin on the impacts of freshwater organisms. Frontiers in Ecology and the Environment, 12, 218–223.

9. Threat: Invasive and other problematic species
185
Jensen K. & Meyer C. (2001) Effects of light competition and litter on performance of Viola palustris and on species composition and diversity of an abandoned fen meadow. Plant Ecology, 155, 169–181.
Zedler J. & Kercher S. (2004) Causes and consequences of invasive plants in wetlands: opportunities, opportunists, and outcomes. Critical Reviews in Plant Sciences, 23, 431–452.
All problematic species
9.1 Implement biosecurity measures to prevent introductions of
problematic species
We found no studies that evaluated the effects, on vegetation, of implementing biosecurity measures to prevent introductions of problematic species to marshes or swamps.
This means that we have not yet found any studies that have directly evaluated this intervention during our systematic journal and report searches. Therefore we have no evidence to indicate whether or not the intervention has any desirable or harmful effects.
Background
It is often cheaper and easier to prevent problematic species from being introduced to a site than trying to control them afterwards (Leung et al. 2002). This section includes all interventions aiming to directly prevent introductions of problematic species to marshes or swamps: from physical biosecurity measures like cleaning and drying equipment between sites, to legislative measures like banning the sale or ownership of problematic species. CAUTION: Bans on sale or ownership of problematic species may encourage mass releases into the wild (Hulme 2015).
To be included in this section, studies would have to evaluate the effect of biosecurity measures on wild marsh or swamp vegetation. This section does not include (a) studies only reporting the effects of biosecurity interventions on the problematic organism (e.g. mortality in laboratory tests), or (b) studies reporting changes in human behaviour after the introduction of biosecurity measures (e.g. uptake of biosecurity measures, or whether problematic species are still on sale).
Related interventions: Raise public awareness about marshes or swamps, including about problematic species and biosecurity (15.1).
Hulme P. (2015) European Union: new law risks release of invasive species. Nature, 517, 21.
Leung B., Lodge D.M., Finnoff D., Shogren J.F., Lewis M.A. & Lamberti G. (2002) An ounce of prevention or a pound of cure: bioeconomic risk analysis of invasive species. Proceedings of the Royal Society B, 269, 2407–2413.
Problematic plants
9.2 Control problematic plants (specific intervention unclear)
Background
This section considers studies that have controlled problematic plants, but which do not clearly report the specific intervention(s) used for control so the study cannot be summarized elsewhere in this chapter.

9. Threat: Invasive and other problematic species
186
For this section, “vegetation” refers to overall or non-target vegetation. Studies that only report responses of target problematic plants have not been summarized.
9.2.1 Control problematic plants (specific intervention unclear):
freshwater marshes or swamps
One study evaluated the effects, on vegetation, of controlling problematic plants in freshwater marshes or swamps using unspecified or unclear methods. The study was in the USA.
VEGETATION COMMUNITY
Overall richness/diversity (1 study): One replicated, site comparison study in the USA1 found that marshes in which non-native plants were actively controlled had higher overall plant richness and diversity, after three years, than marshes in which non-native plants were not controlled.
VEGETATION ABUNDANCE
Overall abundance (1 study): One replicated, site comparison study in the USA1 found that marshes in which non-native plants were actively controlled had similar overall vegetation cover, after three years, to marshes in which non-native plants were not controlled.
Individual species abundance (1 study): One study1 quantified the effect of this intervention on the abundance of individual plant species other than those being controlled. The replicated, site comparison study in the USA1 found, for example, that spikerush Eleocharis sp. cover was greater in marshes where non-native plants were actively controlled than where they were not controlled.
VEGETATION STRUCTURE
A replicated, site comparison study in 2011 of 26 freshwater marshes in Oregon, USA (1) found that marshes in which non-native plants were actively controlled had higher overall plant richness and diversity than marshes where non-native plants were not controlled, but similar overall vegetation cover. Controlled marshes contained more plant taxa (13 taxa/30 m2; 87 taxa across 18 marshes) than uncontrolled marshes (9 taxa/30 m2; 42 taxa across eight marshes). The same was true for plant diversity (data reported as a diversity index). Controlled marshes had statistically similar overall vegetation cover to uncontrolled marshes but lower cover of plants not native to Oregon (reported as statistical model results). The study also reported data on cover of individual plant species. For example, native spikerush Eleocharis sp. had greater cover in controlled marshes (13%, vs uncontrolled: 7%), whereas invasive reed canarygrass Phalaris arundinacea had lower cover in controlled marshes (8%, vs uncontrolled: 33%). Methods: In summer 2011, emergent vegetation was surveyed in 26 permanent and ephemeral marshes (0.08–14.7 ha). In each marsh, plant species and cover were recorded in thirty 1-m2 quadrats along transects from the shore to shallow water. Non-native plants had been actively controlled in 18 marshes (“intensive management” applied to >50% of the marsh at least twice in the past three years; no further details reported) but not in the other eight marshes (where the only management, if any, involved “minimal” control of the water level).
(1) Rowe J.C. & Garcia T.S. (2014) Impacts of wetland restoration efforts on an amphibian assemblage in a multi-invader community. Wetlands, 34, 141–153.

9. Threat: Invasive and other problematic species
187
9.2.2 Control problematic plants (specific intervention unclear):
brackish/saline marshes or swamps
One study evaluated the effects, on vegetation, of controlling problematic plants in brackish/saline marshes or swamps using unspecified or unclear methods. The study was in the USA.
VEGETATION COMMUNITY
VEGETATION ABUNDANCE
Overall abundance (1 study): One replicated, site comparison study in salt marshes in the USA1 found that plots in which common reed Phragmites australis had been controlled 4–10 years previously contained a similar density of plant stems to nearby natural marshes
Individual species abundance (1 study): One study1 quantified the effect of this intervention on the abundance of individual plant species other than those being controlled. The replicated, site comparison study in salt marshes in the USA1 found that plots in which common reed Phragmites australis had been controlled 4–10 years previously had similar cover of saltmarsh cordgrass Spartina patens to nearby natural marshes.
VEGETATION STRUCTURE
Height (1 study): One replicated, site comparison study in salt marshes in the USA1 found that plots in which common reed Phragmites australis had been controlled 4–10 years previously contained vegetation of similar height to nearby natural marshes.
A replicated, site comparison study in 2007–2008 across 16 salt marshes in Connecticut, USA (1) found that plots where common reed Phragmites australis had been controlled had a similar vegetation density, cover of saltmarsh cordgrass Spartina patens and vegetation height to natural marshes. After 4–10 years, plots where common reed had been controlled had 10% common reed cover – greater than the 1% cover in natural marshes. However, other measured variables did not significantly differ between reed-control and natural marshes. This included overall vegetation density (28 vs 35 stems/100 cm2), cover of saltmarsh cordgrass (18 vs 20%), and maximum vegetation height (55 vs 40 cm). Methods: In summer 2007 and 2008, vegetation was surveyed in 26 plots (each 1 ha) spread across 16 salt marshes. In seven plots, interventions to control common reed had been implemented 4–10 years ago. The interventions included cutting and applying herbicide (further details not reported). The other 19 plots contained natural salt marsh vegetation. Vegetation cover was estimated in nine 1-m2 quadrats/plot, stem density in forty-five 100 cm quadrats/plot and vegetation height at 36 points/plot.
(1) Elphick C.S., Meiman S. & Rubega M.A. (2015) Tidal-flow restoration provides little nesting habitat for a globally vulnerable saltmarsh bird. Restoration Ecology, 23, 439–446.
9.3 Control problematic plants (multiple interventions)
Background
This section considers control of problematic plants using >3 separate interventions at once, such that it is difficult to attribute outcomes to any single specific intervention. Where three or fewer interventions have been used together in a study, it is included as evidence for each intervention elsewhere in the synopsis (whilst explicitly noting the use of multiple interventions in each summary paragraph).

9. Threat: Invasive and other problematic species
188
For this section, “vegetation” refers to overall or non-target vegetation. Studies that only report responses of target problematic plants have not been summarized.
9.3.1 Control problematic plants (multiple interventions): freshwater
marshes or swamps
One study evaluated the effects, on vegetation, of controlling problematic plants in freshwater marshes or swamps using >3 combined interventions. The study was in Costa Rica.
VEGETATION COMMUNITY
Overall extent (1 study): One controlled study in a freshwater marsh in Costa Rica1 reported that coverage of live vegetation stands was lower in a plot where southern cattail Typha domingensis had been controlled for >15 years than in a plot where cattail had not been controlled.
Overall richness/diversity (1 study): The same study1 reported that a plot in which southern cattail Typha domingensis had been controlled for >15 years had greater plant species richness than a plot where cattail had not been controlled.
VEGETATION ABUNDANCE
Overall abundance (1 study): One controlled study in a freshwater marsh in Costa Rica1 reported that a plot in which southern cattail Typha domingensis had been controlled for >15 years had less live vegetation cover than a plot where cattail had not been controlled.
VEGETATION STRUCTURE
A controlled study in 1987–2004 in an ephemeral freshwater marsh in Costa Rica (1) reported that controlling invasive southern cattail Typha domingensis with multiple interventions reduced the total vegetated area and vegetation cover, but increased plant species richness. Unless specified, statistical significance was not assessed. After approximately 15–17 years, a managed plot (where cattail had been controlled) contained less live vegetation overall than an unmanaged plot. This was true for the total area of live vegetation (managed: 28–85%; unmanaged: 98–100%) and cover of live vegetation along transects (managed: 35–91%; unmanaged: 88–100%). Abundance varied across seasons. The managed plot also contained less cattail – both in terms of the total area (managed: 9–24% of plot; unmanaged: 63–66% of plot) and cover along transects (managed: 5–10%; unmanaged: 75–100%). Finally, the managed plot contained more plant species in total (managed: 59; unmanaged: 20) and had significantly greater plant species richness (managed: 13; unmanaged: 4 species/300 m2 transect). Methods: Two 80-ha plots were established in a cattail-dominated marsh. Cattail stands were managed in one of the plots: with multiple experimental interventions from 1987 (including cutting by hand, mowing, physical damage, grazing and burning, alone and in combination) then by physical damage alone from September 2002 (driving over it in a tractor with large paddle wheels). Water supply was also restored to both plots in July 2002. Vegetation stands were mapped from aerial photographs or satellite images taken in November 2002 (wet season) and March 2003 (dry season). Detailed vegetation surveys, along six 25 x 2 m transects/plot, were carried out between August 2003 and July 2004.
(1) Trama F.A., Rizo-Patrón F.L., Kumar A., Gonzalez E., Somma D. & McCoy M.B. (2009) Wetland cover types and plant community changes in response to cattail-control activities in the Palo Verde Marsh, Costa Rica. Ecological Restoration, 27, 278–289.

9. Threat: Invasive and other problematic species
189
9.3.2 Control problematic plants (multiple interventions): brackish/saline
marshes or swamps
We found no studies that evaluated the effects, on vegetation, of controlling problematic plants in brackish/saline marshes or swamps using >3 combined interventions.
This means that we have not yet found any studies that have directly evaluated this intervention during our systematic journal and report searches. Therefore we have no evidence to indicate whether or not the intervention has any desirable or harmful effects.
9.4 Physically remove problematic plants
Background
This intervention considers complete physical removal of problematic plants, i.e. pulling up or digging up entire plants, or scraping living vegetation from the marsh or swamp surface. Removal may be targeted to individual organisms, or applied to the whole plant community. The most appropriate removal method will depend on the species to be removed, and the site conditions (e.g. Tobias et al. 2016).
If plants are completely removed, including roots where applicable, immediate regrowth will be prevented (although long-term recolonization from the seed bank or from neighbouring sites is possible). For some species, disposing of the problem plants off-site may help to prevent regrowth, but disposal should be done carefully to avoid causing an invasion elsewhere (Stevens et al. 1997).
For this intervention, “vegetation” refers to overall or non-target vegetation. Studies that only report responses of target problematic plants have not been summarized.
Related interventions: Remove surface soil/sediment, including any plants on it (12.11).
Stevens K.J., Peterson R.L. & Stephenson G.R. (1997) Vegetative propagation and the tissues involved in lateral spread of Lythrum salicaria. Aquatic Botany, 56, 11–24.
Tobias V.D., Block G. & Laca E.A. (2016) Controlling perennial pepperweed (Lepidium latifolium) in a brackish tidal marsh. Wetlands Ecology and Management, 24, 411–418.
9.4.1 Physically remove problematic plants: freshwater marshes
Five studies evaluated the effects, on vegetation, of physically removing problematic plants from freshwater marshes. Three studies were in the USA2a,2b,4, one was in India1 and one was in France3. Two of the studies in the USA2a,2b were in the same site and shared some plots.
VEGETATION COMMUNITY
Community composition (1 study): One replicated, randomized, paired, controlled, before-and-after study in the USA4 found that physically removing all vegetation from a cattail-invaded marsh altered the overall plant community composition, over the following two years.
Overall richness/diversity (3 studies): One replicated, randomized, paired, controlled, before-and-after study in the USA4 found that removing all vegetation from a cattail-invaded marsh increased overall plant species richness 1–2 years later. Two replicated, randomized, paired, controlled, before-and-after studies in wet meadows in the USA2a,2b found that physically removing vegetation had no significant effect on overall plant species richness or diversity three years later. One of the studies2a removed all vegetation, whilst the other2b controlled regrowth of the invasive species (by physical removal along with herbicide application).

9. Threat: Invasive and other problematic species
190
Characteristic plant richness/diversity (1 study): One controlled, before-and-after study in a temporary marsh in France3 reported that stripping all vegetation increased the number of habitat-characteristic plant species present in the following two years.
VEGETATION ABUNDANCE
Overall abundance (3 studies): Three before-and-after studies (two also replicated, randomized, paired, controlled) in freshwater marshes/wet meadows in India1 and the USA2a,2b found that physically removing vegetation had no clear or significant effect on overall vegetation cover, nine months or three years later. Two of the studies1,2a removed all vegetation, whilst one2b controlled regrowth of the invasive species (by physical removal along with herbicide application).
Herb abundance (2 studies): Of two replicated, randomized, paired, controlled, before-and-after studies in loosestrife-invaded wet meadows in the USA, one2a reported that removing all vegetation increased the cover of grass-like plants, and reduced the cover of forbs, three years later. The other study2b found that controlling regrowth of the invasive species – by physical removal and applying herbicide – had no significant effect on cover of grass-like plants or forbs after three years.
Algae/phytoplankton abundance (1 study): One before-and-after, site comparison study in India1 reported that removing all vegetation from a knotgrass-invaded marsh increased the cover of algae nine months later.
Individual species abundance (3 studies): Three studies1,2a,2b quantified the effect of this intervention on the abundance of individual plant species other than the target problematic species. For example, one before-and-after, site comparison study in India1 reported that removing all vegetation from a knotgrass-invaded marsh increased the cover of some other common herb species nine months later.
VEGETATION STRUCTURE
A before-and-after, site comparison study in 1984–1986 in an ephemeral freshwater marsh invaded by knotgrass Paspalum distichum in northwest India (1) reported that an area cleared of vegetation developed similar vegetation cover to uncleared areas within nine months, but with different dominant species. Statistical significance was not assessed. Before intervention, the marsh had 69–70% total vegetation cover, 49–51% cover of knotgrass, <1% cover of water snowflake Nymphoides indicum and 2–4% cover of algae. After nine months, and at the same time of year, cleared areas had developed 68% total vegetation cover. This included <1% knotgrass cover, 29% water snowflake cover and 24% algal cover. Meanwhile, uncleared areas had 64% total vegetation cover, 49% knotgrass cover, 1% water snowflake cover and 6% algae cover. Methods: In June 1985, knotgrass-invaded vegetation was cleared, using bulldozers, from a marshy area in Keoladeo National Park. Comparable estimates of vegetation cover were made before clearance (March 1984 and 1985; ≥638 quadrats across whole marsh in each survey) and after clearance (March 1986; 55 quadrats in cleared area and ≥638 quadrats across rest of marsh). All quadrats were 1 m2.
A replicated, randomized, paired, controlled, before-and-after study in 1988–1991 in two wet meadows invaded by purple loosestrife Lythrum salicaria in New York State, USA (2a) found that physically removing all vegetation had no significant effect on vegetation richness, diversity or overall cover three years later, but increased cover of grass-like plants and reduced cover of forbs. After three years and in both meadows, cleared and uncleared plots had statistically similar plant species

9. Threat: Invasive and other problematic species
191
richness (cleared: 8; uncleared: 7–8 species/m2), plant diversity (data reported as a diversity index) and overall vegetation cover (cleared: 79%; uncleared: 78–117%). However, cleared plots were dominated by grass-like plants (73–74% cover) and had little cover of forbs (overall: 6–9%; purple loosestrife: 2%), whereas uncleared plots had little cover of grass-like plants (26–39%) and had high cover of forbs (overall: 41–92%; purple loosestrife: 31–78%). Note that these differences were only statistically significant in one of the two meadows. For data on the cover of other individual plant species, see original paper. Before intervention and within each meadow, plots destined for each treatment had statistically similar total vegetation cover (99–153%), plant species richness (8–10 species/m2). plant diversity, grass-like plant cover (11–67%) and loosestrife cover (18–82%). In one meadow, overall forb cover was lower in plots destined for clearance (25%) than plots not destined for clearance (121%). Methods: In 1988, six pairs of 1-m2 plots were established across two loosestrife-invaded wet meadows. In September, all vegetation was dug up and removed from one random plot in each pair. These plots were also used in (2b). Vegetation was not removed from the other plots. Plant species and their cover were surveyed before removal (August 1988) and three years after (September 1991).
A replicated, randomized, paired, controlled, before-and-after study in 1988–1991 in two wet meadows that had been cleared of vegetation in New York State, USA (2b) found that controlling regrowth of invasive purple loosestrife Lythrum salicaria (by pulling up seedlings and applying herbicide to large shoots) had no significant effect on plant species richness, diversity or vegetation cover. After three years, plots with and without control of loosestrife regrowth had statistically similar plant species richness (control: 7; no control: 8 species/m2), plant diversity (data reported as a diversity index), total vegetation cover (control: 67–82%; no control: 79%), grass-like plant cover (control: 60–75%; no control: 70–73%) and forb cover (control: 5–20%; no control: 8–10%). Purple loosestrife cover was 0% in plots where regrowth had been controlled, but still only 2% in plots where regrowth had not been controlled. For data on the cover of other individual plant species, see original paper. Before intervention and within each meadow, plots destined for each treatment had statistically similar plant species richness (8–9 species/m2), plant diversity, total vegetation cover (103–143%), grass-like plant cover (16–58%), forb cover (25–56%) and purple loosestrife cover (23–63%). Methods: In 1988, six pairs of 1-m2 plots were established across two loosestrife-invaded wet meadows. In September, all vegetation was dug up and removed from the plots. In six of the plots (one random plot/pair), loosestrife regrowth was controlled twice/year thereafter (pulling up seedlings and painting large shoots with glyphosate; the study does not distinguish between the effects of these interventions). In the other plots loosestrife regrowth was not controlled. These plots were also used in (2a). Plant species and their cover were surveyed before initial removal (August 1988) and three years after (September 1991).
A controlled, before-and-after study in 2001–2003 in an ephemeral freshwater wetland dominated by compact rush Juncus conglomeratus in southern France (3) reported that removing the vegetation increased the number of plant species characteristic of Mediterranean temporary marshes over the following two years. Statistical significance was not assessed. The number of characteristic plant species increased in stripped plots, from zero in the year before intervention to 3–4 in the two years after (units not reported). The number of characteristic plant species was relatively stable in unmanaged plots (before: 2–4; after: 3–6). Methods: Four plots

9. Threat: Invasive and other problematic species
192
were established in rush-dominated vegetation near a reservoir. In autumn 2001, one plot was stripped of vegetation (including the root mat), exposing bare soil. The other three plots were left undisturbed. Plant species were recorded in the year before intervention (2001) and for two years after (2002 and 2003).
A replicated, randomized, paired, controlled, before-and-after study in 2011–2013 in a freshwater marsh invaded by hybrid cattail Typha x glauca in Michigan, USA (4) found that physically removing the cattail-dominated vegetation changed the plant community composition and increased plant species richness and diversity. In the two years following vegetation removal, the overall plant community composition significantly differed between cleared and uncleared plots (data reported as a graphical analysis). Cleared plots had lower relative cover of hybrid cattail (cleared: 21–26%; uncleared: 87% of total cover). They also contained less hybrid cattail biomass (cleared: 29–51; uncleared: 500–700 g/m2). In both years, cleared plots contained more plant species (cleared: 13–14; uncleared: 8 species/16 m2) and had greater plant diversity (reported as a diversity index). Before intervention, plots destined for each treatment contained statistically similar plant communities with similar relative cover of cattail (84–87%), cattail biomass (data not reported), species richness (5–7 species/16 m2) and diversity. Methods: Sixteen 4-m2 plots were established in two areas of a freshwater marsh that had been invaded by hybrid cattail (one for >30 years, one for <20 years). In August 2011, vegetation was removed from eight plots (four random plots/area): vegetation was cut and removed, then rhizomes (underground horizontal stems) were dug up and removed. No vegetation was removed from the other eight plots. Roots and rhizomes were cut around the edge of each plot. Vegetation was surveyed in July before (2011) and for two years after (2012–2013) intervention. Dry above-ground biomass was estimated, after intervention only, from the height of cattail stems.
(1) Middleton B.A., van der Valk A.G., Mason D.H., Williams R.L. & Davis C.B. (1991) Vegetation dynamics and seed banks of a monsoonal wetland overgrown with Paspalum distichum L. in northern India. Aquatic Botany, 40, 239–259.
(2) Morrison J.A. (2002) Wetland vegetation before and after experimental purple loosestrife removal. Wetlands, 22, 159–169.
(3) Félisiak D., Duborper E. & Yavercovski N. (2004) An example of management by removal of vegetation: Lac des Aurèdes (Var, France). Page 84 in: P. Grillas, P. Gauthier, N. Yavercovski & C. Perennou (eds.) Mediterranean Temporary Pools Volume 1 – Issues Relating to Conservation, Functioning and Management. Station Biologique de la Tour du Valat, Arles.
(4) Lishawa S.C., Lawrence B.A., Albert D.A. & Tuchman N.C. (2015) Biomass harvest of invasive Typha promotes plant diversity in a Great Lakes coastal wetland. Restoration Ecology, 23, 228–237.
9.4.2 Physically remove problematic plants: brackish/salt marshes
One study evaluated the effects, on vegetation, of physically removing problematic plants from brackish/salt marshes. The study was in the USA.
VEGETATION COMMUNITY
VEGETATION ABUNDANCE
Native/non-target abundance (1 study): One replicated, randomized, paired, controlled, before-and-after study in pepperweed invaded marshes in the USA1 found that physically removing pepperweed from plots sprayed with herbicide increased cover of native plants, over the following two years, compared to spraying with herbicide only.

9. Threat: Invasive and other problematic species
193
Individual species abundance (1 study): The same study1 quantified the effect of this intervention on the cover of individual plant species other than the target of control (see original paper for data).
VEGETATION STRUCTURE
A replicated, randomized, paired, controlled, before-and-after study in 2005–2007 in three brackish and salt marshes invaded by pepperweed Lepidium latifolium in California, USA (1) found that physically removing pepperweed before spraying herbicide increased native plant cover more than spraying alone. Averaged over the two years following intervention, cleared/sprayed plots had greater cover of native plants (year one: 26–124%; year two: 33–195%) than plots that were only sprayed (year one: 10–67%; year two: 19–113%). In contrast, cleared/sprayed plots had lower pepperweed cover (year one: 0–14%; year two: 5–44%) than plots that were only sprayed (year one: 2–60%; year two: 25–88%). Before intervention, plots destined for each treatment had statistically similar cover of native plants (10–33%) and pepperweed (90–100%). For data on the cover of other individual plant species, see original paper. Methods: In April 2005, five sets of 2 x 2 m plots were established each of three pepperweed-invaded marshes. In each set, there was one replicate where pepperweed was removed (including roots to 20 cm depth) before spraying regrowth with herbicide (1.25% glyphosate), and one replicate that was only sprayed with herbicide. Treatments were randomly allocated to plots. Vegetation cover was measured before (April 2005) and quarterly for two years after (April 2007) intervention, in 1-m2 quadrats.
(1) Boyer K.E. & Burdick A.P. (2010) Control of Lepidium latifolium (perennial pepperweed) and recovery of native plants in tidal marshes of the San Francisco Estuary. Wetlands Ecology and Management, 18, 731–743.
9.4.3 Physically remove problematic plants: freshwater swamps
We found no studies that evaluated the effects, on vegetation, of physically removing problematic plants from freshwater swamps.
This means that we have not yet found any studies that have directly evaluated this intervention during our systematic journal and report searches. Therefore we have no evidence to indicate whether or not the intervention has any desirable or harmful effects.
9.4.4 Physically remove problematic plants: brackish/saline swamps
We found no studies that evaluated the effects, on vegetation, of physically removing problematic plants from brackish/saline swamps.
This means that we have not yet found any studies that have directly evaluated this intervention during our systematic journal and report searches. Therefore we have no evidence to indicate whether or not the intervention has any desirable or harmful effects.
9.5 Physically damage problematic plants
Background
Physical damage to plants may kill them directly, increase their susceptibility to disease, slow their growth and/or prevent reproduction. This section considers

9. Threat: Invasive and other problematic species
194
actions, other than cutting and mowing, that physically damage problematic plants. This includes crushing stems, removing seed heads and girdling trees (removing a strip of bark from the entire circumference of a trunk, stem or branch), as well as soil disturbance that damages the underground parts of problematic plants. Removing fragments of the damaged plants might be desirable to prevent regrowth.
For this intervention, “vegetation” refers to overall or non-target vegetation. Studies that only report responses of target problematic plants have not been summarized.
Related interventions: Use cutting/mowing to control problematic herbaceous plants (9.8); Use cutting to control problematic large trees/shrubs (9.9); Remove surface soil/sediment (12.11); Bury surface soil/sediment (12.12) or Disturb soil/sediment surface (12.13) other than to control problematic plants.
9.5.1 Physically damage problematic plants: freshwater marshes
Five studies evaluated the effects, on vegetation, of physically damaging problematic plants in freshwater marshes. There were two studies in Australia1,2 and two in Costa Rica4,5. In each country, the two studies were based in one study area but used different experimental set-ups. The final study was in Mexico3.
VEGETATION COMMUNITY
Overall extent (1 study): One controlled, before-and-after study in a freshwater marsh in Costa Rica4 reported that crushing (and burning) cattail stands reduced the area of live vegetation present 5–22 months later.
Community composition (1 study): One replicated, randomized, paired, controlled study in a marsh in Costa Rica5 found that plots in which cattail-dominated vegetation was crushed had a different overall plant community composition, over the following 15 months, to plots in which vegetation was not crushed.
Overall richness/diversity (3 studies): Two controlled studies (one also replicated, randomized, paired) in one freshwater marsh in Costa Rica4,5 reported that in plots where cattail-dominated vegetation was crushed (sometimes4 along with burning), plant species richness4,5 and diversity5 were not lower than in plots where vegetation was not crushed (or burned). Vegetation was surveyed 2–22 months after intervention. One replicated, randomized, paired, controlled study in a freshwater marsh in Mexico3 found that disking after cutting grass-invaded vegetation increased overall plant diversity, after 4–8 months, compared to cutting alone. However, disking had no significant effect on plant richness.
VEGETATION ABUNDANCE
Overall abundance (2 studies): One controlled, before-and-after study in a freshwater marsh in Costa Rica4 reported that crushing (and burning) cattail stands reduced live vegetation cover 5–22 months later. One replicated, randomized, paired, controlled study in a freshwater marsh in Mexico3 found that disking after cutting grass-invaded vegetation typically had no significant effect on overall plant density, after 4–8 months, compared to cutting alone.
Herb abundance (1 study): One study of a floodplain marsh in Australia1 simply reported grass/ sedge cover for up to four years after crushing mimosa-invaded vegetation (along with other interventions).
Native/non-target abundance (2 studies): One replicated, randomized, paired, controlled, before-and-after study in a mimosa-invaded wetland in Australia2 reported that crushing mimosa stands did not reduce – and often increased – cover of non-mimosa vegetation one year later. One

9. Threat: Invasive and other problematic species
195
study of a floodplain marsh in Australia1 simply reported non-target vegetation cover for up to four years after crushing mimosa-invaded vegetation (along with other interventions).
Individual species abundance (2 studies): Two studies3,5 quantified the effect of this intervention on the abundance of individual plant species other than the species being controlled. One replicated, randomized, paired, controlled study in a freshwater marsh in Costa Rica5 found that plots in which cattail-dominated vegetation was crushed supported a greater abundance of individual plant species other than cattail, over the following 15 months, than plots in which vegetation was not crushed. One replicated, randomized, paired, controlled study in a freshwater marsh in Mexico3 found that disking after cutting grass-invaded vegetation increased the cover of two of five common native plant species, after 4–8 months, compared to cutting alone.
VEGETATION STRUCTURE
A study in 1998–2003 in a degraded floodplain marsh in the Northern Territory, Australia (1) reported that following herbicide application, physical damage and prescribed burning to control invasive mimosa Mimosa pigra, some herbaceous plants recolonized the site along with mimosa. After one year, cover of all vegetation other than mimosa was approximately 31–80%. This included 12–45% total cover of grasses/sedges. Mimosa cover was approximately 0–17%, depending on the area within the marsh. The number of new mimosa seedlings each year declined over time, from 1 seedling/m2 in the first year after intervention was complete, to <0.5 seedlings/m2 in the second and third years, then 0 seedlings/m2 in the fourth year. Methods: Three interventions were applied to a 100-ha patch of mimosa-dominated floodplain. In April 1998, the site was sprayed with herbicide (metsulfuron methyl). In October 1999, the dead vegetation was crushed using a chain tied between two bulldozers, then the site was burned (fire lasting several days). The study does not distinguish between the effects of these interventions. Vegetation was surveyed in the dry season (July–October), in up to three areas of the marsh (where no vegetation had been introduced) and for up to four years after intervention was complete. This study was in the same area as (2), but used a different experimental set-up.
A replicated, randomized, paired, controlled, before-and-after study in 1997–1999 in a floodplain wetland invaded by mimosa Mimosa pigra in the Northern Territory, Australia (2) reported that crushing the vegetation with a bulldozer did not reduce cover of non-mimosa vegetation one year later. In one of two comparisons, amongst plots previously sprayed with herbicide, crushed plots had greater cover of non-mimosa vegetation (55%) than uncrushed plots (33%). In the other comparison, amongst plots not sprayed with herbicide, non-mimosa vegetation cover did not significantly differ between treatments (crushed: 38%; uncrushed: 15%). Meanwhile, mimosa was never more abundant in crushed than uncrushed plots, and often significantly less abundant. This was true for mimosa coverage, density and above-ground biomass (see original paper for data). Before intervention, the abundance of both mimosa and other vegetation were statistically similar in plots destined for each treatment (data not reported). Methods: Eight pairs of 100 x 200 m plots were established on a mimosa-invaded floodplain. In late 1998, the vegetation was crushed in eight plots (one random plot/pair) by driving over it with bulldozers. Four crushed and four uncrushed plots had been sprayed with herbicide earlier in April 1998. Vegetation was surveyed before crushing (late 1997/early 1998) and one year after (late 1999), in four 1–5 m2 quadrats/plot and by aerial photography (mimosa coverage). This study was in the same area as (1), but used a different experimental set-up.

9. Threat: Invasive and other problematic species
196
A replicated, randomized, paired, controlled study in a freshwater marsh in eastern Mexico (3) found that disking after cutting grass-invaded vegetation increased plant diversity (but not richness), typically had no significant effect on overall plant density, and increased the absolute and relative abundance of two common native plant species. After 4–8 months, cut/disked plots had higher plant diversity than plots that had only been cut (data reported as a diversity index). However, there was no significant difference between treatments in plant species richness (cut/disked: 7–10; cut only: 4–7 species/0.49 m2). Cut/disked plots supported a similar overall plant density to cut plots in two of three comparisons (for which cut/disked: 66–89; cut only: 67–120 individuals/0.49 m2). Two of five monitored native plant species had greater cover in cut/disked plots (Canada spikesedge Eleocharis geniculata: 26%; umbrella sedge Fuirena simplex: 10%) than cut plots (spikesedge: 0%; umbrella sedge: 1%). The same was true for relative abundance (above-ground biomass, measured after eight months only; see original paper for data). Invasive antelope grass Echinochloa pyramidalis had statistically similar cover under each treatment in two of three comparisons (for which cut/disked: 26–42%; cut only: 38–47%). Methods: In January (year not reported), seven pairs of 0.49-m2 plots were established in a degraded marsh, invaded by antelope grass. In all 14 plots, vegetation was cut to ground level. In one random plot/pair, the soil was then disked by hand (to 37 cm depth, until a “muddy, uniform consistency” was reached). This damaged rhizomes (underground horizontal stems). All of these plots were enclosed, underground, by a plastic barrier. Vegetation was surveyed between May and September later that year (biomass in September only).
A controlled, before-and-after study in 1998–2004 in an ephemeral freshwater marsh in Costa Rica (4) reported that crushing and burning stands of invasive southern cattail Typha domingensis reduced the total vegetated area and vegetation cover, but increased plant species richness. Unless specified, statistical significance was not assessed. In the wet season before intervention, live vegetation stands covered 98–99% of the study plots. In a managed plot, this dropped to 68% after five months (wet season) then 23% after eight months (dry season). Over the same period, the coverage of southern cattail stands dropped from 61–62% to 52%, then to 7%. In an unmanaged plot, coverage remained ≥98% for live vegetation and 63–66% for cattail. After 11–22 months, the managed plot had lower cover of live vegetation, along transects, than the unmanaged plot (managed: 17–90%; unmanaged: 88–100%). The same was true for cattail cover (managed: 5–38%; unmanaged: 75–100%). Meanwhile, the managed plot contained more plant species, both overall (managed: 61; unmanaged: 20 species/plot) and within transects (managed: 12; unmanaged: 4 species/300 m2). Methods: Two 80-ha plots were established in a cattail-dominated marsh. From September 2002, cattail stands in one of the plots were damaged when wet (by driving over them in a tractor with large paddle wheels) and/or burned when dry. The study does not distinguish between the effects of these interventions. Both plots had been rewetted in July. Vegetation stands were mapped from aerial photographs or satellite images taken before (December 1998) and after (November 2002, March 2003) intervention. Detailed vegetation surveys, along six 25 x 2 m transects/plot, were carried out between August 2003 and July 2004. This study used the same marsh as (5), but a different experimental set-up.
A replicated, randomized, paired, controlled study in 2007–2008 in an ephemeral freshwater marsh invaded by southern cattail Typha domingensis in Costa Rica (5) found that damaging cattail stands with paddled tractor wheels changed the

9. Threat: Invasive and other problematic species
197
overall plant community composition, and increased overall plant diversity but typically not richness. Over 15 months after intervention, damaged and undamaged plots consistently differed in overall plant community composition (six of six comparisons; data reported as a graphical analysis). Damaged plots had higher plant diversity than undamaged plots (six of six comparisons; data reported as a diversity index), with a greater abundance of individual plant species other than cattail (see original paper for data). Plant species richness did not significantly differ between treatments in four of six comparisons (damaged: 4–10; not damaged: 3–8 species/3 m2) but was higher in disturbed plots in the other two (damaged: 5–6; not damaged: 3–4 species/3 m2). At both three and 15 months after intervention, there was less cattail in damaged than undamaged plots. This was true in terms of height (damaged: 7–74; not damaged: 248–262 cm), density (damaged: 1–4; not damaged: 10–13 shoots/m2) and dry above-ground biomass (damaged: 0–135; not damaged: 557–662 g/m2). Methods: Fifteen pairs of 20-m2 plots were established in a degraded, cattail-invaded marsh. In February 2007, cattail-dominated vegetation was damaged (crushed and partly pulled up) in one plot/pair by driving over it in a tractor with large paddle wheels (locally called fangueo). The other plots were left undisturbed. Between March 2007 and April 2008, vegetation was surveyed in three permanent 1-m2 quadrats/plot. This study used the same marsh as (4), but a different experimental set-up.
(1) Paynter Q. (2004) Revegetation of a wetland following control of the invasive woody weed, Mimosa pigra, in the Northern Territory, Australia. Environmental Management and Restoration, 5, 191–198.
(2) Paynter Q. & Flanagan G.J. (2004) Integrating herbicide and mechanical control treatments with fire and biological control to manage an invasive wetland shrub, Mimosa pigra. Journal of Applied Ecology, 41, 615–629.
(3) López Rosas H., Moreno-Casasola P. & Mendelssohn I.A. (2006) Effects of experimental disturbances on a tropical freshwater marsh invaded by the African grass Echinochloa pyramidalis. Wetlands, 26, 593–604.
(4) Trama F.A., Rizo-Patrón F.L., Kumar A., Gonzalez E., Somma D. & McCoy M.B. (2009) Wetland cover types and plant community changes in response to cattail-control activities in the Palo Verde Marsh, Costa Rica. Ecological Restoration, 27, 278–289.
(5) Osland M.J., González E. & Richardson C.J. (2011) Restoring diversity after cattail expansion: disturbance, resilience, and seasonality in a tropical dry wetland. Ecological Applications, 21, 715–728.
9.5.2 Physically damage problematic plants: brackish/salt marshes
We found no studies that evaluated the effects, on vegetation, of physically damaging problematic plants in brackish/salt marshes.
This means that we have not yet found any studies that have directly evaluated this intervention during our systematic journal and report searches. Therefore we have no evidence to indicate whether or not the intervention has any desirable or harmful effects.
9.5.3 Physically damage problematic plants: freshwater swamps
Two studies evaluated the effects, on vegetation, of physically damaging problematic plants in freshwater swamps. Both studies were in the USA.
VEGETATION COMMUNITY
Overall richness/diversity (1 study): One controlled study aiming to restore a swamp in the USA1 found that ploughing a canarygrass-invaded plot after spraying it with herbicide increased overall plant richness and diversity, two growing seasons later, compared to spraying alone.

9. Threat: Invasive and other problematic species
198
Native/non-target richness/diversity (1 study): The same study1 found that ploughing a canarygrass-invaded plot after spraying it with herbicide had no significant effect on native plant species richness, two growing seasons later, compared to spraying alone.
VEGETATION ABUNDANCE
Tree/shrub abundance (2 studies): Two controlled studies in the USA1,2 evaluated the effects, on tree/shrub abundance, of physically damaging canarygrass-invaded vegetation. One study1 found that ploughing a canarygrass-invaded plot after spraying it with herbicide had no significant effect on the density of non-planted tree seedlings, two growing seasons later, compared to spraying alone. The other study2 found that managed plots (cut, disked and sprayed with herbicide) contained more non-planted tree seedlings than unmanaged plots, after 1–3 years.
Native/non-target abundance (1 study): One replicated, controlled study aiming to restore a swamp in the USA2 found that plots in which canarygrass-invaded vegetation was managed (by disking, along with cutting and applying herbicide) contained at least as much non-canarygrass herb cover, after 1–3 years, to plots in which vegetation was not managed.
Individual species abundance (1 study): One controlled study aiming to restore a swamp in the USA1 reported that ploughing a canarygrass-invaded plot after spraying it with herbicide affected the abundance of some individual plant species – other than the target problematic species – two growing seasons later.
VEGETATION STRUCTURE
A controlled study in 2002–2004 aiming to restore a swamp in a reed canarygrass Phalaris arundinacea stand in Wisconsin, USA (1) found that ploughing after spraying herbicide increased plant diversity and richness more than spraying alone, but that ploughing had no additional effect on the number of tree seedlings. After two growing seasons, the vegetation was more diverse in a ploughed/sprayed plot than in plots that had only been sprayed (data reported as a diversity index). The same was true for overall plant richness (ploughed/sprayed: 11.3; sprayed: 6.6 species/m2). However, the treatments did not significantly differ in native plant richness (ploughed/sprayed: 5.5; sprayed: 4.0 species/m2), or in the density of non-planted tree seedlings (ploughed/sprayed: 56; sprayed: 25 seedlings/m2). The study also reported differences between treatments in the abundance of individual plant species (statistical significance not assessed). For example, common vervain Verbena hastata was more abundant in the ploughed/sprayed plot (100% of quadrats; 20% cover) than sprayed plots (40% of quadrats; 3% cover). Reed canarygrass was less abundant in the ploughed/sprayed plot (40% of quadrats; 18% cover) than sprayed plots (100% of quadrats; 73% cover). Methods: Nine plots were established in a canarygrass-invaded wetland. All nine plots were sprayed with herbicide (Roundup®) in November 2002, and planted with tree/shrub seedlings (roughly 1 seedling/m2) in spring 2003. One plot was also ploughed, before planting, in spring 2003. This plot was slightly higher and drier than the unploughed plots. In August 2004, plant species and their cover were surveyed in ten 1-m2 quadrats/treatment, ignoring planted trees/shrubs.
A replicated, controlled study in 2006–2009 in a floodplain swamp clearing invaded by reed canarygrass Phalaris arundinacea in Wisconsin, USA (2) found that cutting, disking and applying herbicide to invaded plots increased tree seedling abundance after 1–3 years, and increased cover of herbs other than canarygrass after three years. In three of three years following intervention, treated plots contained more tree seedlings (4–44 seedlings/m2) than untreated plots (0–5 seedlings/m2). At

9. Threat: Invasive and other problematic species
199
the same time, treated plots had lower reed canarygrass cover (7–31%) than untreated plots (83–92%). Cover of herbs other than reed canarygrass did not significantly differ between treated and untreated plots in the first two years after intervention (treated: 15–47%; untreated: 16–22%), but was higher in treated than untreated plots in the third year (treated: 35–58%; untreated: 12%). Methods: In November 2006, twenty plots (roughly 810 m2) were established in a storm-created clearing within a floodplain swamp. Sixteen canarygrass-dominated plots were treated by cutting the vegetation (with a mechanical mulcher), disking the soil, and applying herbicide (four combinations of herbicide type and dose; repeated applications in summer and autumn until November 2008). The other four plots received none of these interventions. The study does not distinguish between the effects of cutting, disking and applying herbicide. Some tree species were planted and/or sown across the whole clearing. Vegetation (excluding planted trees) was surveyed in August 2007–2009, in four 2.25-m2 quadrats/plot.
(1) Hovick S.M. & Reinartz J.A. (2007) Restoring forest in wetlands dominated by reed canarygrass: the effects of pre-planting treatments on early survival of planted stock. Wetlands, 27, 24–39.
(2) Thomsen M., Brownell K., Groshek M. & Kirsch E. (2012) Control of reed canarygrass promotes wetland herb and tree seedling establishment in an Upper Mississippi River floodplain forest. Wetlands, 32, 543–555.
9.5.4 Physically damage problematic plants: brackish/saline swamps
We found no studies that evaluated the effects, on vegetation, of physically damaging problematic plants in brackish/saline swamps.
This means that we have not yet found any studies that have directly evaluated this intervention during our systematic journal and report searches. Therefore we have no evidence to indicate whether or not the intervention has any desirable or harmful effects.
9.6 Manage water level to control problematic plants
We found no studies that evaluated the effects, on vegetation, of managing water levels to control problematic plants in marshes or swamps.
This means that we have not yet found any studies that have directly evaluated this intervention during our systematic journal and report searches. Therefore we have no evidence to indicate whether or not the intervention has any desirable or harmful effects.
Background
Temporarily increasing or decreasing water levels could help to control problematic plants in marshes or swamps. An elevated water table may kill upland plants that cannot tolerate long periods in saturated soils, or kill submerged plants by reducing the amount of light reaching them. Prolonged flooding, especially after another treatment like cutting or burning, may kill emergent vegetation (Hellings & Gallagher 1992). Lowering water levels may create exposed or dry soils, killing aquatic plants.
For this intervention, “vegetation” refers to overall or non-target vegetation. Studies that only report responses of target problematic plants have not been summarized.
Related interventions: Raise water level to restore degraded marshes or swamps (8.1); Lower water level to restore degraded marshes or swamps (8.2); Actively manage water level (8.4).

9. Threat: Invasive and other problematic species
200
Hellings S.E. & Gallagher J.L. (1992) The effects of salinity and flooding on Phragmites australis. Journal of Applied Ecology, 29, 41–49.
9.7 Add salt to control problematic plants
Background
Direct and temporary application of salt or salty water to marshes or swamps, for example by spreading or spraying, may kill or reduce the growth of problematic plants that cannot tolerate high salinities. Salt may also be more cost effective than other control methods, such as hand removal or herbicide application (Kuhn & Zedler 1997). CAUTION: This intervention may have long-term and widespread impacts on native plants and other organisms, both in the focal site and nearby ecosystems (Alluvium 2013). So, it may be best to use short-term and targeted applications (Kuhn & Zedler 1997).
For this intervention, “vegetation” refers to overall or non-target vegetation. Studies that only report responses of target problematic plants have not been summarized.
Related interventions: Facilitate tidal exchange to restore degraded marshes or swamps (8.3).
Alluvium (2013) Investigation of Alternative Options to Control Phragmites at Reedy Lake. Report P112088_R01_V03 for the Corangamite Catchment Management Authority.
Kuhn N.L. & Zedler J.B. (1997) Differential effects of salinity and soil saturation on native and exotic plants of a coastal salt marsh. Estuaries, 20, 391–403.
9.7.1 Add salt to control problematic plants: freshwater marshes
We found no studies that evaluated the effects, on vegetation, of directly adding salt to control problematic plants in freshwater marshes.
This means that we have not yet found any studies that have directly evaluated this intervention during our systematic journal and report searches. Therefore we have no evidence to indicate whether or not the intervention has any desirable or harmful effects.
9.7.2 Add salt to control problematic plants: brackish/salt marshes
One study evaluated the effects, on vegetation, of directly adding salt to control problematic plants in brackish/salt marshes. The study was in the USA.
VEGETATION COMMUNITY
VEGETATION ABUNDANCE
VEGETATION STRUCTURE
Height (1 study): One replicated, randomized, paired, controlled, before-and-after study in a salt marsh in the USA1 found that adding salt to control invasive beardgrass Polypogon monspeliensis had no significant effect on the height the dominant native glasswort Salicornia subterminalis.
A replicated, randomized, paired, controlled, before-and-after study in 1994–1995 in an estuarine salt marsh in California, USA (1) found that adding salt to control invasive annual beardgrass Polypogon monspeliensis had no significant effect on the

9. Threat: Invasive and other problematic species
201
height of the native dominant glasswort Salicornia subterminalis. Over three months, glasswort plants were a similar height in plots with or without added salt (salt: 31–34 cm; no salt: 32–34 cm). The same was true before intervention (salt: 31–34 cm; no salt: 33 cm). After three months, there were fewer beardgrass shoots in plots with added salt than plots without (data reported as density classes). Methods: In December 1994, thirty-two 1-m2 plots were established (in eight sets of four) on a beardgrass-invaded, intertidal salt marsh. Between December and February, sea salt was sprinkled onto the surface of 24 plots. One random plot/set received each monthly dose: 850 g, 1,700 g or 3,400 g. No salt was added to the final eight plots. Vegetation was surveyed before salt additions began (December 1994) and for three months after (January-March 1995). Three individual glasswort plants/plot were measured throughout the study.
(1) Kuhn N.L. & Zedler J.B. (1997) Differential effects of salinity and soil saturation on native and exotic plants of a coastal salt marsh. Estuaries, 20, 391–403.
9.7.3 Add salt to control problematic plants: freshwater swamps
We found no studies that evaluated the effects, on vegetation, of directly adding salt to control problematic plants in freshwater swamps.
This means that we have not yet found any studies that have directly evaluated this intervention during our systematic journal and report searches. Therefore we have no evidence to indicate whether or not the intervention has any desirable or harmful effects.
9.7.4 Add salt to control problematic plants: brackish/saline swamps
We found no studies that evaluated the effects, on vegetation, of directly adding salt to control problematic plants in brackish/saline swamps.
This means that we have not yet found any studies that have directly evaluated this intervention during our systematic journal and report searches. Therefore we have no evidence to indicate whether or not the intervention has any desirable or harmful effects.
9.8 Use cutting/mowing to control problematic herbaceous plants
Background
Cutting or mowing refers to the removal of above-ground parts of herbaceous plants or young trees/shrubs. Roots are left in place. Mowing and cutting can be broad tools affecting all plants in a community, or targeted at specific problematic plants. Whilst cutting may not kill the targeted plants, it may weaken them and may provide desirable plants with an opportunity to grow and outcompete problematic plants. The cut plant material could be left on site or removed and used for construction or energy production, for example (Lishawa et al. 2015). CAUTION: Mowing with heavy machinery could damage wetland soil and vegetation. Cutting by hand or with specialized vehicles might cause less damage.
This intervention includes evidence for all forms of cutting/mowing to control problematic plants, but bear in mind that the effects might be highly dependent on how the cutting/mowing is carried out (e.g. extent, timing, frequency, duration, and whether cuttings are left in place or removed) and site conditions (e.g. nutrient

9. Threat: Invasive and other problematic species
202
availability and water levels) (Rolletschek et al. 2000; Weltzin et al. 2005; Russell & Kraaij 2008; Fogli et al. 2014).
For this intervention, “vegetation” refers to overall or non-target vegetation. Studies that only report responses of target problematic plants have not been summarized.
Related interventions: Cut/mow herbaceous plants to maintain or restore disturbance (8.7); Reduce frequency of cutting/mowing (8.13); Reduce intensity of cutting/mowing (8.14); Change season/timing of cutting/mowing (8.15).
Fogli S., Brancaleoni L., Lambertini C. & Gerdol R. (2014) Mowing regime has different effects on reed stands in relation to habitat. Journal of Environmental Management, 134, 56–62.
Lishawa S.C., Lawrence B.A., Albert D.A. & Tuchman N.C. (2015) Biomass harvest of invasive Typha promotes plant diversity in a Great Lakes coastal wetland. Restoration Ecology, 23, 228–237.
Rolletschek H., Rolletschek A., Hartzendorf T. & Kohl J. (2000) Physiological consequences of mowing and burning of Phragmites australis stands for rhizome ventilation and amino acid metabolism. Wetlands Ecology and Management, 8, 425–433.
Russell I.A. & Kraaij T. (2008) Effects of cutting Phragmites australis along an inundation gradient, with implications for managing reed encroachment in a South African estuarine lake system. Wetlands Ecology and Management, 16, 383–393.
Weltzin J.F., Keller J.K., Bridgham S.D., Pastor J., Allen P.B. & Chen J. (2005) Litter controls plant community composition in a northern fen. Oikos, 110, 537–546.
9.8.1 Use cutting/mowing to control problematic herbaceous plants:
freshwater marshes
Eight studies evaluated the effects, on vegetation, of cutting/mowing problematic herbaceous plants or small shrubs in freshwater marshes. Six studies were in the USA1,2,4–7, one was in Mexico3 and one was in Canada8.
VEGETATION COMMUNITY
Community composition (1 study): One replicated, randomized, paired, controlled, before-and-after study in a cattail-dominated marsh in the USA6 found that cutting altered the overall plant community composition over the following two years.
Relative abundance (1 study): One replicated, randomized, paired, controlled study in a grass-invaded marsh in Mexico3 found that cut and uncut plots supported a similar relative abundance of six common plant species after 4–8 months.
Overall richness/diversity (4 studies): Two replicated, randomized, paired, controlled studies in invaded marshes/wet meadows in the USA5,6 found that cut plots typically had greater overall plant species richness5,6 and/or diversity6 than uncut plots, after 1–3 growing seasons. One of the studies4 carried out other interventions along with cutting. Two replicated, controlled studies in freshwater marshes in the USA1 and Mexico3 found that cut and uncut plots had similar overall plant richness1,3 and/or diversity3, after 1–2 growing seasons.
Native/non-target richness/diversity (2 studies): One controlled, before-and-after study in a reed-dominated freshwater marsh in the USA2 found that cutting/mowing (along with applying herbicide) increased non-reed species richness three years later. One replicated, controlled, before-and-after study in cattail-invaded marshes in the USA7 found that mown and unmown marshes had similar native plant species richness after 1–12 months
VEGETATION ABUNDANCE
Overall abundance (3 studies): Two replicated, controlled studies in freshwater marshes in the USA1 and Mexico3 found that cut and uncut plots contained a similar amount of vegetation after 1–

9. Threat: Invasive and other problematic species
203
2 growing seasons. This was true for cover of wetland plants1 and density of all plants3. One replicated, randomized, paired, controlled, before-and-after study in iris-invaded lakeshore marshes in Canada7 reported that cutting reduced overall vegetation cover, one year later, in a permanently flooded marsh but had no clear effect on cover in an intermittently flooded marsh.
Herb abundance (1 study): One replicated, randomized, paired, controlled study in a cattail-invaded wet meadow in the USA4 found that plots in which cattail was cut four times over two growing seasons developed greater cover of sedges Carex spp. than uncut plots, but that cutting cattail only twice had no significant effect on sedge cover.
Native/non-target abundance (3 studies): Two controlled studies (one also replicated, randomized, paired; one also before-and-after) in reed- or canarygrass-dominated wetlands in the USA2,5 found that cut plots typically contained more native5 or non-target2 vegetation than uncut plots, after 1–3 growing seasons. Both studies carried out other interventions along with cutting. One replicated, controlled, before-and-after study in cattail-invaded marshes in the USA7 found that mown and unmown marshes supported a similar native vegetation density after 1–12 months, and similar native vegetation biomass after 12 months.
Individual species abundance (2 studies): Three studies1–3 quantified the effect of this intervention on the abundance of individual plant species other than the species being controlled. For example, one replicated, randomized, paired, controlled study in a grass-invaded marsh in Mexico3 found that five of five monitored native species had similar cover in cut and uncut plots after 4–8 months.
VEGETATION STRUCTURE
A replicated, controlled study in 1993–1995 in five freshwater marshes undergoing restoration in New York State, USA (1) found that mowing typically had no significant effect on richness or total cover of wetland plants, and cover of cattails Typha spp. Over two years after intervention, mown and unmown plots contained a statistically similar number of wetland plant species in six of six comparisons (mown: 1.9–4.5; unmown: 1.4–4.7 species/plot). Mown and unmown plots had statistically similar cover of wetland plants in five of six comparisons (for which mown: 10–107%; unmown: 5–96%; other comparison higher in mown plots). After two years, mown and unmown plots had statistically similar cattail cover in three of three comparisons (mown: 2%; unmown: 0–7%). Methods: The study used five degraded wetland sites, drained for ≥40 years. In summer 1993, areas within three sites were mown. Cuttings were not removed. In autumn 1993, all five sites were rewetted. Plant species and cover were recorded in 1994 and 1995 (precise date not reported), in 30 quadrats in the mown areas and 39 quadrats in nearby unmown areas. Quadrats spanned a range of elevations.
A controlled, before-and-after study in 1995–1998 in a freshwater marsh dominated by common reed Phragmites australis in Connecticut, USA (2) found that cutting/mowing the vegetation (along with applying herbicide) increased the evenness of the plant community and the abundance and richness of non-reed species. After three years, treated plots contained a more even plant community, less dominated by one or two species, than an untreated plot (data reported as a coefficient of variation; see original paper for data on individual species abundance). Treated plots also had greater plant species richness (cut/herbicide: 5; mow/herbicide: 7; untreated: 3 species/m2, excluding common reed) and contained a greater density of non-reed stems (cut/herbicide: 78; mow/herbicide: 97; untreated: 15 stems/m2). Common reed was less abundant in treated plots, in terms of stem density (cut/herbicide: 19; mow/herbicide: 6; untreated: 36 stems/m2) and frequency

9. Threat: Invasive and other problematic species
204
(cut/herbicide: 64%; mow/herbicide: 45%; untreated: 98% of surveyed quadrats contained common reed). Before intervention, all plots had relatively similar plant species richness (2–3 species/m2, excluding common reed), non-reed density (7–23 stems/m2) and reed density (33–40 stems/m2). Methods: In 1995, two 0.4-ha plots were treated in a reed-dominated, tidal, freshwater marsh. In August, each plot was sprayed with herbicide (Rodeo® 1%). In autumn, one plot was cut by hand and one was mown mechanically; cuttings were left in place. A third adjacent plot was neither sprayed with herbicide nor cut/mown. The study does not distinguish between the effects of cutting/mowing and applying herbicide. In late summer before (1995) and after (1996–1998) intervention, plant stems were identified and counted in fifty 1-m2 quadrats/plot.
A replicated, randomized, paired, controlled study in a freshwater marsh invaded by antelope grass Echinochloa pyramidalis in eastern Mexico (3) found that cutting the vegetation had no significant effect on overall plant density, richness or diversity, the relative abundance of common plant species, or the absolute abundance of common native plant species. After 4–8 months, cut and uncut plots contained a statistically similar overall plant density (six of six comparisons; cut: 56–126; uncut: 54–93 plants/0.49 m2), species richness (six of six comparisons; cut: 4–8; uncut: 3–5 species/0.49 m2) and diversity (two of two comparisons; data reported as a diversity index). Accordingly, all six monitored plant species had a similar relative abundance in cut and uncut plots (five native species, plus antelope grass; see original paper for data). The five native plant species had statistically similar cover in cut and uncut plots in 14 of 14 comparisons (both treatments: 0–19% cover/species). In contrast, antelope grass had lower cover in cut plots in five of six comparisons (for which cut: 38–92%; uncut: 94–100%). Methods: In January (year not reported), twenty-one 0.49-m2 plots were established (in seven sets of three) in a degraded marsh, invaded by antelope grass. In 14 plots (two random plots/set), vegetation was clipped to ground level. In seven of these, the most abundant native plant species was deliberately not clipped. In the final seven plots (one random plot/set), no vegetation was clipped. All 21 plots were enclosed, underground, by a plastic barrier. Vegetation was surveyed between May and September later that year (relative biomass in September only).
A replicated, randomized, paired, controlled study in 2006–2008 in a wet meadow being invaded by hybrid cattail Typha x glauca in Wisconsin, USA (4) found that cutting cattail four times over two growing seasons increased cover of sedges Carex spp., but that cutting twice had no significant effect. After two growing seasons, sedge cover was higher in plots where cattails had been cut four times (33–66%) than in uncut plots (11–38%). However, plots where cattails had only been cut twice had statistically similar sedge cover (20–59%) to the uncut plots. Additional plots where all vegetation had been cut one month before sampling had 4–9% sedge cover. No sedge seedlings were found in any plot. Methods: Thirty-two 4 x 8 m plots were established (in two sets of 16) on the boundary between native wet meadow vegetation and a patch of hybrid cattail. In May 2006, all cattail stems were cut and removed from 24 plots (12 random plots/set). Eight of these plots (4 random plots/set) received each follow-up treatment over the next two growing seasons: cutting cattail four times upon regrowth to 1 m, cutting cattail twice upon regrowth to 1 m, or cutting all vegetation once in September 2007. The final eight plots (4 random plots/set) were never cut. Sedge cover was surveyed in October 2007, in four 1-m2 quadrats/plot.

9. Threat: Invasive and other problematic species
205
A replicated, randomized, paired, controlled, before-and-after study in 2005–2008 in five wet meadows in South Dakota, USA (5) found that controlling problematic plants by mowing, applying herbicide and planting native upland plants increased plant species richness and cover of unplanted native species. All plots were initially dominated by reed canarygrass Phalaris arundinacea (>80% cover). After 1–3 growing seasons, overall plant species richness was higher in treated than untreated plots in 19 of 21 comparisons (for which treated: 2–5 species/0.25 m2; untreated: 2 species/0.25 m2). Treated plots also had greater cover of unplanted native species in 17 of 21 comparisons (for which treated: 8–57%; untreated: 3–21%) and lower cover of reed canarygrass in 21 of 21 comparisons (treated: 1–66%; untreated: 91–93%). Methods: Forty 3 x 40 m plots were established across five canarygrass-invaded wet meadows (eight plots/meadow). Between autumn 2005 and spring 2006, thirty-five plots (seven random plots/set) were mown (15–25 cm height; cuttings removed), sprayed with herbicide and planted with 14 native upland species. Subsequent targeted mowing of “noxious weeds” was also carried out. The study does not distinguish between the effects of these interventions. Vegetation was surveyed at the end of each growing season 2006–2008, in nine 0.25-m2 quadrats/plot.
A replicated, randomized, paired, controlled, before-and-after study in 2011–2013 in a freshwater marsh dominated by hybrid cattail Typha x glauca in Michigan, USA (6) found that cutting the cattail-dominated vegetation changed the plant community composition and increased plant species richness and diversity. In the two years following cutting, the overall plant community composition significantly differed between cut and uncut plots (data reported as a graphical analysis). After two years (but not one), cut plots contained more plant species than uncut plots (14 vs 8 species/16 m2) and had greater plant diversity (reported as a diversity index). At this time, hybrid cattail was also less dominant in cut than uncut plots (63 vs 87% of total cover). After one year (but not two), cut plots contained less above-ground cattail biomass than uncut plots (280 vs 700 g/m2). Before intervention, plots destined for each treatment contained statistically similar plant communities with similar species richness (5–7 species/16 m2), diversity, cattail relative cover (85–87%), and cattail biomass (data not reported). Methods: Sixteen 4-m2 plots were established in two areas of a freshwater marsh that had been invaded by hybrid cattail (one for >30 years, one for <20 years). In August 2011, all vegetation was cut at ground level in eight plots (four random plots/area). Cuttings were removed. No vegetation was cut in the other eight plots. Roots and rhizomes (underground horizontal stems) were cut around the edge of each plot. Vegetation was surveyed in July before (2011) and for two years after (2012–2013) intervention. Above-ground dry biomass was estimated, after intervention only, from the height of cattail stems.
A replicated, controlled, before-and-after study in 2013–2014 in twelve artificial marshes invaded by hybrid cattail Typha x glauca in Michigan, USA (7) found that a single mow had no significant effect on native plant richness, density or biomass one year later. After one year, mown and unmown marshes had statistically similar native plant richness (mown: 1.8–4.5; not mown: 4–4.5 species/2 m2), density (mown: 190–560; not mown: 300 stems/m2) and above-ground biomass (mown: 160–180; not mown: 440 g/m2). The same was true for cattail density (mown: 17; not mown: 44 stems/m2) although above-ground cattail biomass was lower in mown plots (mown: 90; not mown: 750 g/m2). Most outcomes also did not significantly differ between treatments after one month, the exceptions being native plant biomass (mown: <10; not mown: 260 g/m2) and cattail density (mown: 5–6; not mown: 55 stems/m2). Before mowing, vegetation was statistically similar in marshes destined for each

9. Threat: Invasive and other problematic species
206
treatment (native richness: 2.7–4.3 species/2 m2; native density: 150–230 stems/m2; native biomass: 320–380 g/m2; cattail density: 63–69 stems/m2; cattail biomass: 1,080–1,130 g/m2). Methods: In July 2013, all vegetation was mown in eight experimental marshes (1 x 2 m area, 1 m soil depth). The marshes had been created in 2002 and planted (i.e. deliberately invaded) with hybrid cattail in 2004. Cuttings were left in four marshes but removed from the other four. Four additional marshes were not mown. Plant species, density and height were recorded in all marshes immediately before, one month after and one year after mowing. Above-ground dry biomass was calculated from height measurements.
A replicated, randomized, paired, controlled, before-and-after study in 2014–2015 in two lakeshore marshes invaded by yellow flag iris Iris pseudacorus in British Columbia, Canada (8) reported that the effect of cutting yellow flag iris on recolonizing vegetation depended on the water level. Statistical significance was not assessed. Before cutting, all study plots were completely covered by yellow flag iris. One year later, in the permanently flooded marsh, cut plots had only 5% vegetation cover (mixture of yellow flag iris seedlings and broadleaf cattail Typha latifolia; species cover not quantified) whilst uncut plots had 100% vegetation cover (yellow flag iris only). In the intermittently flooded marsh, both cut and uncut plots were completely covered by yellow flag iris. Methods: Nine pairs of plots (approximately 1 m2) were established in iris-dominated marshes on the shores of two lakes. In one random plot/pair, yellow flag iris was cut to 0–4 cm above the sediment. Cuttings were removed. The other plots were left uncut. Vegetation cover was surveyed in July 2015.
(1) Brown S.C. & Bedford B.L. (1997) Restoration of wetland vegetation with transplanted wetland soil: an experimental study. Wetlands, 17, 424–437.
(2) Farnsworth E.J. & Meyerson L.A. (1999) Species composition and inter-annual dynamics of a freshwater tidal plant community following removal of the invasive grass, Phragmites australis. Biological Invasions, 1, 115–127.
(3) López Rosas H., Moreno-Casasola P. & Mendelssohn I.A. (2006) Effects of experimental disturbances on a tropical freshwater marsh invaded by the African grass Echinochloa pyramidalis. Wetlands, 26, 593–604.
(4) Hall S.J. & Zedler J.B. (2010) Constraints on sedge meadow self-restoration in urban wetlands. Restoration Ecology, 18, 671–680.
(5) Bahm M.A., Barnes T.G. & Jensen K.C. (2014) Evaluation of herbicides for control of reed canarygrass (Phalaris arundinacea). Natural Areas Journal, 34, 459–464.
(6) Lishawa S.C., Lawrence B.A., Albert D.A. & Tuchman N.C. (2015) Biomass harvest of invasive Typha promotes plant diversity in a Great Lakes coastal wetland. Restoration Ecology, 23, 228–237.
(7) Lawrence B.A., Lishawa S.C., Rodriguez Y. & Tuchman N.C. (2016) Herbicide management of invasive cattail (Typha x glauca) increases porewater nutrient concentrations. Wetlands Ecology and Management, 24, 457–467.
(8) Tarasoff C.S., Streichert K., Gardner W., Heiser B., Church J. & Pypker T.G. (2016) Assessing benthic barriers vs. aggressive cutting as effective yellow flag iris (Iris pseudacorus) control mechanisms. Invasive Plant Science and Management, 9, 229–234.
9.8.2 Use cutting/mowing to control problematic herbaceous plants:
brackish/salt marshes
One study evaluated the effects, on vegetation, of cutting/mowing problematic herbaceous plants or small shrubs in brackish/salt marshes. The study was in the USA.
VEGETATION COMMUNITY
Overall richness/diversity (1 study): One replicated, randomized, paired, controlled study in a saltgrass-dominated marsh in the USA1 found that mown and unmown plots had similar overall plant species richness after one year.

9. Threat: Invasive and other problematic species
207
VEGETATION ABUNDANCE
Overall abundance (1 study): One replicated, randomized, paired, controlled study in a saltgrass-dominated marsh in the USA1 found that mown and unmown plots had similar overall vegetation cover after one year.
Individual species abundance (1 study): The same study1 found that six dominant herb species, other than the species being controlled, had similar cover in mown and unmown plots after one year.
VEGETATION STRUCTURE
A replicated, randomized, paired, controlled study in 1992–1993 in an ephemeral brackish marsh dominated by saltgrass Distichlis spicata in California, USA (1) found that mown and unmown plots had similar plant species richness, similar overall vegetation cover, and similar cover of dominant plant species. After one year, overall plant species richness did not significantly differ between mown plots (3.2 species/m2) and unmown plots (3.1 species/m2). The same was true for cover of vegetation overall (mown: 98%; unmown: >99%), saltgrass (mown: 93%; unmown: 99%) and each of six other dominant herb species (mown: 0–7%; unmown: 0–5%). However, mown plots did contain a greater density of saltgrass (4,070 stems/m2) than unmown plots (1,770 stems/m2). Density was not reported for the other six dominant herb species. Methods: Ten pairs of 100-m2 plots were established in an impounded brackish marsh, managed for waterfowl (autumn/winter flooding with spring/ summer drawdown) but dominated by saltgrass. In August–September 1992, ten plots were hand-mown (one plot/pair; 50 m2/plot). Cuttings were not removed. The other plots were not mown. In August 1993, vegetation was surveyed in two 1-m2 quadrats/plot. Cover estimates included live and dead standing plants.
(1) De Szalay F.A. & Resh V.H. (1997) Responses of wetland invertebrates and plants important in waterfowl diets to burning and mowing of emergent vegetation. Wetlands, 17, 149–156.
9.8.3 Use cutting/mowing to control problematic herbaceous plants:
freshwater swamps
Two studies evaluated the effects, on vegetation, of cutting/mowing problematic herbaceous plants or small shrubs in freshwater swamps. Both studies were in the USA.
VEGETATION COMMUNITY
Overall richness/diversity (1 study): One replicated, controlled study aiming to restore a swamp in the USA1 found that mowing canarygrass-invaded vegetation before spraying it with herbicide had no significant effect on overall plant richness or diversity, two growing seasons later, compared to spraying alone.
Native/non-target richness/diversity (1 study): The same study1 found that mowing canarygrass-invaded vegetation before spraying it with herbicide had no significant effect on native plant species richness, two growing seasons later, compared to spraying alone.
VEGETATION ABUNDANCE
Tree/shrub abundance (2 studies): Two replicated, controlled studies in the USA1,2 evaluated the effects, on tree/shrub abundance, of managing canarygrass-invaded vegetation by cutting. One study1 found that mowing canarygrass-invaded vegetation before spraying it with herbicide had no significant effect on the density of non-planted tree seedlings, two growing seasons later,

9. Threat: Invasive and other problematic species
208
compared to spraying alone. The other study2 found that managed plots (cut, disked and sprayed with herbicide) contained more non-planted tree seedlings than unmanaged plots, after 1–3 years.
Native/non-target abundance (1 study): One replicated, controlled study aiming to restore a swamp in the USA2 found that plots in which canarygrass-invaded vegetation was managed (by cutting, along with disking and applying herbicide) contained at least as much non-canarygrass herb cover, after 1–3 years, to plots in which vegetation was not managed.
Individual species abundance (1 study): One replicated, controlled study aiming to restore a swamp in the USA1 reported that mowing canarygrass-invaded vegetation before spraying it with herbicide affected the abundance of some individual plant species – other than the target problematic species – two growing seasons later.
VEGETATION STRUCTURE
A replicated, controlled study in 2002–2004 aiming to restore a swamp in a reed canarygrass Phalaris arundinacea stand in Wisconsin, USA (1) reported that mowing before spraying herbicide affected the abundance of some individual plant species compared to spraying alone, but found no additional effect on plant diversity, plant richness, or the number of tree seedlings. After two growing seasons, overall plant diversity did not significantly differ between mown/sprayed plots and plots that had only been sprayed (data reported as a diversity index). The same was true for overall plant richness (mown/sprayed: 8.4; sprayed: 6.6 species/m2), native plant richness (mown/sprayed: 5.7; sprayed: 4.0 species/m2) or density of non-planted tree seedlings (mown/sprayed: 46; sprayed: 25 seedlings/m2). However, the study did report differences between treatments in the abundance of some individual plant species (statistical significance not assessed). For example, eastern common ragweed Ambrosia artemisiifolia was more abundant in mown/sprayed plots (20% of quadrats; 33% cover) than sprayed plots (0% of quadrats). Reed canarygrass was less abundant in mown/sprayed plots (80% of quadrats; 31% cover) than sprayed plots (100% of quadrats; 73% cover). Methods: Twenty plots were established in a canarygrass-invaded wetland. Twelve plots were mown in August 2002. All 20 plots were then sprayed with herbicide (Roundup®) in November 2002, and planted with tree/shrub seedlings (roughly 1 seedling/m2) in spring 2003. In August 2004, plant species and their cover were surveyed in ten 1-m2 quadrats/treatment, ignoring planted trees/shrubs.
A replicated, controlled study in 2006–2009 in a floodplain swamp clearing invaded by reed canarygrass Phalaris arundinacea in Wisconsin, USA (2) found that cutting, disking and applying herbicide to invaded plots increased tree seedling abundance after 1–3 years, and increased cover of herbs other than canarygrass after three years. In three of three years following intervention, treated plots contained more tree seedlings (4–44 seedlings/m2) than untreated plots (0–5 seedlings/m2). At the same time, treated plots had lower reed canarygrass cover (7–31%) than untreated plots (83–92%). Cover of herbs other than reed canarygrass did not significantly differ between treated and untreated plots in the first two years after intervention (treated: 15–47%; untreated: 16–22%), but was higher in treated than untreated plots in the third year (treated: 35–58%; untreated: 12%). Methods: In November 2006, twenty plots (roughly 810 m2) were established in a storm-created clearing within a floodplain swamp. Sixteen canarygrass-dominated plots were treated by cutting the vegetation (with a mechanical mulcher), disking the soil, and applying herbicide (four combinations of herbicide type and dose; repeated applications in summer and autumn until November 2008). The other four plots

9. Threat: Invasive and other problematic species
209
received none of these interventions. The study does not distinguish between the effects of cutting, disking and applying herbicide. Some tree species were planted and/or sown across the whole clearing. Vegetation (excluding planted trees) was surveyed in August 2007–2009, in four 2.25-m2 quadrats/plot.
(1) Hovick S.M. & Reinartz J.A. (2007) Restoring forest in wetlands dominated by reed canarygrass: the effects of pre-planting treatments on early survival of planted stock. Wetlands, 27, 24–39.
(2) Thomsen M., Brownell K., Groshek M. & Kirsch E. (2012) Control of reed canarygrass promotes wetland herb and tree seedling establishment in an Upper Mississippi River floodplain forest. Wetlands, 32, 543–555.
9.8.4 Use cutting/mowing to control problematic herbaceous plants:
brackish/saline swamps
We found no studies that evaluated the effects, on vegetation, of cutting/mowing problematic herbaceous plants or small shrubs in brackish/saline swamps.
This means that we have not yet found any studies that have directly evaluated this intervention during our systematic journal and report searches. Therefore we have no evidence to indicate whether or not the intervention has any desirable or harmful effects.
9.9 Use cutting to control problematic large trees/shrubs
Background
This intervention involves cutting off above-ground parts of mature shrubs and trees: plants that are too large to mow. Note that vegetation may resprout from roots or stumps that are left in place. Cutting may be done manually or with machinery, depending on the species to be cut and the site conditions. Cuttings may be removed from the site, or left in place to rot down.
Locally, it may be desirable to remove all large trees/shrubs from open marshes to prevent them from developing into swamps. However, note that encroachment of woody vegetation into marshes may be necessary for habitat migration and conservation of swamps at a regional or global scale (Saintilan et al. 2014). Within swamps, it may be desirable to remove individual trees/shrubs to maintain the vegetation structure or composition.
For this intervention, “vegetation” refers to overall or non-target vegetation. Studies that only report responses of target problematic plants have not been summarized.
Related interventions: Cut/remove/thin forest plantations (3.7); Cut large trees/shrubs to maintain or restore disturbance (8.8); Physically remove problematic plants (9.4); Physically damage problematic plants, including by girdling large trees/shrubs (9.5).
Saintilan N., Wilson N.C., Rogers K., Rajkaran A., & Krauss K.W. (2014) Mangrove expansion and salt marsh decline at mangrove poleward limits. Global Change Biology, 20, 147–157.
9.9.1 Use cutting to control problematic large trees/shrubs: freshwater
marshes
Two studies evaluated the effects, on vegetation, of cutting down problematic large trees/shrubs in freshwater marshes. One study was in the UK1 and one was in the USA2.

9. Threat: Invasive and other problematic species
210
VEGETATION COMMUNITY
Overall extent (1 study): One study of a dune slack in the UK1 reported an increase in total vegetation coverage between one and two years after clearing scrub (by cutting and applying herbicide).
Overall richness/diversity (1 study): The same study1 reported a small increase in total plant richness between one and two years after clearing scrub (by cutting and applying herbicide).
Characteristic plant richness/diversity (1 study): The same study1 reported an increase in the number of slack-characteristic plant species present between one and two years after clearing scrub (by cutting and applying herbicide).
Native/non-target richness/diversity (1 study): The same study1 reported an increase in native plant richness between one and two years after clearing scrub (by cutting and applying herbicide).
VEGETATION ABUNDANCE
Individual species abundance (1 study): One study2 quantified the effect of this intervention on the abundance of individual plant species other than the species being controlled. The site comparison study in the USA2 found that tussock sedge Carex stricta was less dense in a wet meadow restored by removing trees (along with other interventions, including planting sedges) than in nearby natural meadows, after 11–14 years.
VEGETATION STRUCTURE
Height (1 study): One site comparison study in the USA2 reported that sedge tussocks were shorter in a wet meadow restored by removing trees (along with other interventions, including planting sedges) than in nearby natural meadows, after 11–14 years.
Diameter/perimeter/area (1 study): The same study2 reported that sedge tussocks had a smaller perimeter in a wet meadow restored by removing trees (along with other interventions, including planting sedges) than in nearby natural meadows, after 11–14 years.
Basal area (1 study): The same study2 reported that the basal area of sedge tussocks was smaller in a wet meadow restored by removing trees (along with other interventions, including planting sedges) than in nearby natural meadows, after 11–14 years.
A study in 2005–2007 of a dune slack in England, UK (1) reported that after cutting grey willow Salix cinerea scrub (along with applying herbicide), ground vegetation recolonized. In 2006, approximately one year after removing willows, 80% of the site was covered with vegetation (mostly herbaceous). There were 108 vascular plant taxa, including 98 natives. Approximately 54 taxa were characteristic of dune slacks. In 2007, approximately two years after removing willows, 95% of the site was covered with vegetation (still mostly herbaceous). There were 111 vascular plant taxa, including 107 natives. Approximately 65 taxa were characteristic of dune slacks. Twenty-eight taxa recorded in 2006 were not present in 2007, but 31 new taxa had colonized the site. Methods: In November/December 2005, dense grey willow scrub in a dune slack (low-lying area amongst dunes) was controlled. Grey willows were cut at ground level, then herbicide (Roundup® Biactive Plus) was applied to the largest stumps. The study does not distinguish between the effects of these interventions. Cut material was burned on site. Vascular plant taxa and their overall coverage were surveyed in August/September 2006 and 2007.
A site comparison study in 2008 of five sedge meadows in Illinois and Wisconsin, USA (2) found that a meadow restored by removing trees (and excess sediment, then planting tussock sedge Carex stricta) – contained more but smaller sedge tussocks than nearby natural meadows after 11–14 years. In four of four comparisons, the

9. Threat: Invasive and other problematic species
211
restored meadow contained a greater density of sedge tussocks (8.4 tussocks/m2) than natural meadows (4.5–5.6 tussocks/m2). Sedge tussocks were also smaller in the restored meadow than in the natural meadows. This was true in four of four comparisons for height (restored: 5 cm; natural: 11–18 cm), perimeter (restored: 39 cm; natural: 51–82 cm) and volume (restored: 560 cm3; natural: 2,342–6,604 cm3). The basal area of tussocks in the restored meadow was only 0.07 m2/m2, compared to 0.12–0.23 m2/m2 in the natural meadows (statistical significance not assessed). Methods: In 2008, sedge tussocks were surveyed in one restored and four natural sedge meadows (15–30 quadrats/meadow, each 1 m2). The restored meadow was formerly a wooded floodplain. Trees and accumulated sediment were removed, then plugs of tussock sedge planted 30 cm apart, between 1994 and 1997. The study does not distinguish between the effects of these interventions on any non-planted sedges.
(1) Smith P.H. & Kimpton A. (2008) Effects of grey willow Salix cinerea removal on the floristic diversity of a wet dune-slack at Cabin Hill National Nature Reserve on the Sefton Coast, Merseyside, England. Conservation Evidence, 5, 6–11.
(2) Lawrence B.A. & Zedler J.B. (2013) Carbon storage by Carex stricta tussocks: a restorable ecosystem service? Wetlands, 33, 483–493.
9.9.2 Use cutting to control problematic large trees/shrubs: brackish/salt
marshes
One study evaluated the effects, on vegetation, of cutting down problematic large trees/shrubs in brackish/salt marshes. The study was in the USA.
VEGETATION COMMUNITY
Community composition (1 study): One controlled, before-and-after study in a salt marsh in the USA1 reported that in seven of nine cases, the overall plant community composition varied more across plots from which mangrove trees had been removed than a plot from which mangrove trees had not been removed. Vegetation was surveyed after two years of continual tree removal.
VEGETATION ABUNDANCE
Overall abundance (1 study): One controlled, before-and-after study in a salt marsh in the USA1
reported that removing >50% of invading mangrove trees increased total cover of salt marsh vegetation two years later, but that removing <50% of invading mangrove trees had no clear effect.
VEGETATION STRUCTURE
A controlled, before-and-after study in 2012–2014 in a salt marsh colonized by mangrove trees in Texas, USA (1) reported that clearing patches of mangrove vegetation increased cover of salt marsh vegetation (when >50% was cleared) and increased variation in plant community composition (when any amount was cleared). Statistical significance was not assessed. Before intervention, all plots were dominated by black mangrove Avicennia germinans, with <1–19% total cover of salt marsh plant species. After two years, plots where more than half of the mangrove vegetation had been cleared developed greater total cover of salt marsh plant species (28–80%) than an uncleared plot (16%). Plots where less than half of the mangrove vegetation had been cleared retained similar total cover of salt marsh plant species (3–21%) to the uncleared plot. In seven of nine cleared plots, the variation in plant community composition between quadrats was greater than in the uncleared plot – with particularly high variation when 80–90% of the mangrove vegetation was cleared

9. Threat: Invasive and other problematic species
212
(data reported as a similarity index). Methods: Ten 1,008-m2 plots were established in a degraded coastal salt marsh. In summer 2012, mangrove trees were cut and removed from a variable number of 9-m2 cells within each plot, leaving 0–100% of the mangrove vegetation remaining. The cells were re-cut every 3–4 months. Cover of every plant species was visually estimated along a transect (1 m wide) spanning the length of each plot, before mangrove cutting began (June 2012) and approximately two years after (August 2014).
(1) Guo H., Weaver C., Charles S.P., Whitt A., Dastidar S., D'Odorico P., Fuentes J.D., Kominoski J.S., Armitage A.R. & Pennings S.C. (2017) Coastal regime shifts: rapid responses of coastal wetlands to changes in mangrove cover. Ecology, 98, 762–772.
9.9.3 Use cutting to control problematic large trees/shrubs: freshwater
swamps
We found no studies that evaluated the effects, on vegetation, of cutting down problematic large trees/shrubs in freshwater swamps.
This means that we have not yet found any studies that have directly evaluated this intervention during our systematic journal and report searches. Therefore we have no evidence to indicate whether or not the intervention has any desirable or harmful effects.
9.9.4 Use cutting to control problematic large trees/shrubs: brackish/
saline swamps
We found no studies that evaluated the effects, on vegetation, of cutting down problematic large trees/shrubs in brackish/saline swamps.
This means that we have not yet found any studies that have directly evaluated this intervention during our systematic journal and report searches. Therefore we have no evidence to indicate whether or not the intervention has any desirable or harmful effects.
9.10 Use grazing to control problematic plants
Background
This intervention involves using herbivores such as sheep, cows, horses or fish to control problematic plants. Herbivores remove shoots or flowers, limiting plant growth and/or reproduction. They might selectively graze certain plant groups or species (Grant et al. 1987), creating space for other species to grow.
Grazing may be a useful option for control of problematic plants over large areas, or areas that are not easily accessible to equipment. To ensure grazing actually occurs in wetlands within the larger landscape, the breed or population of herbivores should be carefully chosen. Herbivores adapted to upland areas may avoid wetland habitats altogether. CAUTION: Trampling, erosion and nutrient enrichment from herbivores can have negative impacts on vegetation, especially if the density of herbivores is high.
Bear in mind that the effects of grazing might be highly dependent on how it is carried out (e.g. species, intensity, timing, frequency and duration) and site conditions (e.g. nutrient availability, water levels, presence/density of wild herbivores) (Rinella & Hileman 2009).

9. Threat: Invasive and other problematic species
213
For this intervention, “vegetation” refers to overall or non-target vegetation. Studies that only report responses of target problematic plants have not been summarized.
Related interventions: interventions to address domestic livestock as a threat, e.g. Exclude livestock from historically ungrazed sites (3.8–3.12); Use grazing to maintain or restore disturbance (8.9).
Grant S.A., Suckling S.A., Smith H.K., Torvell L., Forbes T.D.A. & Hodgson J. (1987). Comparative studies of diet selection by sheep and cattle: blanket bog and heather moor. Journal of Ecology, 75, 947–960.
Rinella M.J. & Hileman B.J. (2009) Efficacy of prescribed grazing depends on timing intensity and frequency. Journal of Applied Ecology, 46, 796–803.
9.10.1 Use grazing to control problematic plants: freshwater marshes
Three studies evaluated the effects, on vegetation, of using grazing to control problematic plants in freshwater marshes. Two studies were in the USA1,2. One study was in Costa Rica3.
VEGETATION COMMUNITY
Community composition (1 study): One replicated, randomized, paired, controlled study in Costa Rica3 found that amongst plots where cattail-dominated vegetation had been crushed, grazing had no significant effect on the overall plant community composition over 15 months.
Relative abundance (1 study): One replicated, paired, controlled, before-and-after study in a canarygrass-invaded marsh in the USA1 found that grazing had no significant effect on the relative abundance of the invader: over two years, it declined similarly in grazed and ungrazed plots.
Overall richness/diversity (3 studies): Of three replicated, paired, controlled studies in invaded marshes/wet meadows in the USA1,2 and Costa Rica3, two1,3 found that grazing typically had no significant effect on plant species richness1,3 and/or diversity3 over approximately two years. The other study2 found that grazed areas had higher plant species richness than ungrazed areas after two months.
VEGETATION ABUNDANCE
Overall abundance (1 study): One replicated, paired, controlled, before-and-after study in a canarygrass-invaded marsh in the USA1 found that grazing had no significant effect on total vegetation cover at the ground surface, over two years.
Native/non-target abundance (1 study): One replicated, paired, controlled, before-and-after study in an invaded wet meadow in the USA2 found that two months of grazing increased cover of non-invasive grass-like plants.
VEGETATION STRUCTURE
A replicated, paired, controlled, before-and-after study in 2005–2007 in four freshwater marshes invaded by reed canarygrass Phalaris arundinacea in Nebraska, USA (1) found that grazing had no significant effect on plant species richness, overall vegetation cover, or the abundance of reed canarygrass (both absolute and relative). Over two years, grazed and ungrazed plots experienced statistically similar changes in plant species richness (data not reported) and overall vegetation cover (grazed: decline from 8% to 3%; ungrazed: decline from 8% to <1%). The same was true for reed canarygrass absolute cover (grazed: decline from 8% to 2%; ungrazed: decline from 8% to <1%) and relative abundance (grazed: decline from 93% to 68% of recorded plants; ungrazed: decline from 96% to 68% of recorded plants). The study also reported increases in bare ground cover and decreases in litter cover in grazed

9. Threat: Invasive and other problematic species
214
plots – whereas the opposite was true in ungrazed plots (see original paper for data). Methods: Three 3–8 ha plots were established in each of four depressional marshes, in dense stands of reed canarygrass. Eight plots (two plots/marsh) were grazed in both 2006 and 2007 (at some point between April and August; 20–40 animal units for 10–49 days/year). The other four plots (one plot/marsh) were left ungrazed. Plant species and vegetation cover were recorded at points along transects (number of points not clearly reported) before grazing (2005) and after 1–2 years of grazing (July–August 2006 and 2007).
A replicated, paired, controlled, before-and-after study in 2008 in a wet meadow invaded by purple loosestrife Lythrum salicaria and reed canarygrass Phalaris arundinacea in New York State, USA (2) found that grazed paddocks had higher plant species richness and greater cover of non-invasive plants than ungrazed paddocks. After two months, grazed paddocks contained more plant species in total (grazed: 25; ungrazed: 20 species/20 m2) and per quadrat (grazed: 4.0; ungrazed: 2.6 species/0.25 m2). Grazed paddocks had lower cover than ungrazed paddocks of the key invasive species: purple loosestrife (grazed: 20%; ungrazed: 65%) and reed canarygrass (grazed: 20%; ungrazed: 50%). Accordingly, grazed paddocks had higher cover of other grass-like plants (40%) than ungrazed paddocks (20%). Before intervention, cover of these plant groups was statistically similar in paddocks destined for each treatment (loosestrife: 50%; canarygrass: 43–45%; other grass-like plants: 20–30%). Methods: Four pairs of 200-m2 paddocks were established in an invaded wet meadow. Between 16 June and 3 August 2008, one plot/pair was rotationally grazed by sheep (two ewes/paddock for 2–3 days every two weeks). Detailed vegetation surveys were carried out after intervention (mid-August 2008; 20 quadrats/paddock). Cover was also surveyed before intervention (early June 2008).
A replicated, randomized, paired, controlled study in 2007–2008 in an ephemeral freshwater marsh in Costa Rica (3) found that amongst plots in which invasive southern cattail Typha domingensis was damaged, cattle grazing typically had no significant effect on the overall plant community composition, diversity or richness. Over 15 months, grazed and ungrazed plots had a statistically similar overall plant community composition (five of five comparisons; data not reported) and plant diversity (five of five comparisons; data reported as a diversity index). Plant species richness did not significantly differ between treatments in three of five comparisons (grazed: 5–10; ungrazed: 6–11 species/3 m2) but was lower in grazed plots in the other two (grazed: 4–7; ungrazed: 6–8 species/3 m2). After both three and 15 months, cattail properties did not significantly differ between grazed and ungrazed plots. This was true in terms of height (grazed: 7–74; ungrazed: 21–73 cm), density (grazed: 1–4; ungrazed: 1–4 shoots/m2) and dry above-ground biomass (grazed: 0–135; ungrazed: 5–95 g/m2). Methods: In February 2007, cattail-dominated vegetation was damaged (by driving over it in a tractor with large paddle wheels) in 15 pairs of 20-m2 plots. Cattle were then allowed to graze one plot in each pair. The other plots were fenced to exclude cattle. After 2–16 months, vegetation was surveyed in three 1-m2 quadrats/ plot.
(1) Hillhouse H.L., Tunnell S.J. & Stubbendieck J. (2010) Spring grazing impacts on the vegetation of reed canarygrass-invaded wetlands. Rangeland Ecology & Management, 63, 581–587.
(2) Kleppel G.S. & LaBarge E. (2011) Using sheep to control purple loosestrife (Lythrum salicaria). Invasive Plant Science and Management, 4, 50–57.
(3) Osland M.J., González E. & Richardson C.J. (2011) Restoring diversity after cattail expansion: disturbance, resilience, and seasonality in a tropical dry wetland. Ecological Applications, 21, 715–728.

9. Threat: Invasive and other problematic species
215
9.10.2 Use grazing to control problematic plants: brackish/salt marshes
We found no studies that evaluated the effects, on vegetation, of using grazing to control problematic plants in brackish/salt marshes.
This means that we have not yet found any studies that have directly evaluated this intervention during our systematic journal and report searches. Therefore we have no evidence to indicate whether or not the intervention has any desirable or harmful effects.
9.10.3 Use grazing to control problematic plants: freshwater swamps
We found no studies that evaluated the effects, on vegetation, of using grazing to control problematic plants in freshwater swamps.
This means that we have not yet found any studies that have directly evaluated this intervention during our systematic journal and report searches. Therefore we have no evidence to indicate whether or not the intervention has any desirable or harmful effects.
9.10.4 Use grazing to control problematic plants: brackish/saline swamps
We found no studies that evaluated the effects, on vegetation, of using grazing to control problematic plants in brackish/saline swamps.
This means that we have not yet found any studies that have directly evaluated this intervention during our systematic journal and report searches. Therefore we have no evidence to indicate whether or not the intervention has any desirable or harmful effects.
9.11 Use prescribed fire to control problematic plants
Background
Prescribed burns can be used to manage problematic plants that may overgrow and outcompete desirable vegetation. By removing above-ground vegetation, fire can also be used to manage the physical vegetation structure (Flores et al. 2011). Prescribed burns may have only temporary effects: many plants can regrow from remaining stumps, roots or rhizomes (underground horizontal stems).
Potential benefits of management by prescribed burning should be weighed up against potential risks. For example, it can be difficult to control the intensity, duration and area of a prescribed burn: burning when the ground is wet and/or cold might be safer (Hackney & de la Cruz 1981). Burning can damage seed banks, and might produce apparently desirable changes in vegetation over the short term followed by a rapid return to a degraded state. Burning can also damage the physical habitat (e.g. by exposing sediments, increasing erosion and reducing accumulation of organic matter; McKee & Grace 2012) and may be harmful to animals like amphibians (Smith & Sutherland 2014) and birds (Flores et al. 2011).
The timing and duration of monitoring might be particularly important when evaluating the effects of this intervention. Burning might produce apparently desirable changes in vegetation over the short term, followed by a rapid return to a degraded state.
For this intervention, “vegetation” refers to overall or non-target vegetation. Studies that only report responses of target problematic plants have not been summarized.

9. Threat: Invasive and other problematic species
216
Related interventions: Use prescribed fire to maintain or restore disturbance (8.10); Reduce frequency of prescribed burning (8.16); Reduce intensity of prescribed burning (8.17); Change season/timing of prescribed burning (8.18); interventions to address the threat from excess wild fire (8.19–8.22).
Flores C., Bounds D.L. & Ruby D.E. (2011) Does prescribed fire benefit wetland vegetation? Wetlands, 31, 35–44.
Hackney C.T. & de la Cruz A.A. (1981) Effects of fire on brackish marsh communities: management implications. Wetlands, 1, 75–86.
McKee K.L. & Grace J.B. (2012) Effects of Prescribed Burning on Marsh Elevation Change and the Risk of Wetland Loss. U.S. Geological Survey Open-File Report 2012-1031.
Smith R.K. & Sutherland W.J. (2014) Amphibian Conservation: Global Evidence for the Effects of Interventions. Pelagic Publishing, Exeter, UK.
9.11.1 Use prescribed fire to control problematic plants: freshwater
marshes
Four studies evaluated the effects, on vegetation, of using prescribed fire to control problematic plants in freshwater marshes. Two studies were in the USA1,3. There was one study in each of Australia2 and Costa Rica4.
VEGETATION COMMUNITY
Overall extent (1 study): One controlled, before-and-after study in a freshwater marsh in Costa Rica4 reported that burning (and physically damaging) cattail stands reduced the area of live vegetation present 5–22 months later.
Overall richness/diversity (2 studies): One controlled study in a freshwater marsh in Costa Rica4 found that plots in which cattail stands were managed (burned and physically damaged) had greater overall plant species richness than unmanaged plots, 11–22 months after intervention. One replicated, randomized, controlled study in a marsh in the USA1 found that the effect of prescribed burning on plant species richness in the following autumn depended on the season of burning.
VEGETATION ABUNDANCE
Overall abundance (2 studies): One controlled, before-and-after study in a freshwater marsh in Costa Rica4 reported that burning (and physically damaging) cattail stands reduced live vegetation cover 5–22 months later. One replicated, randomized, controlled study in a marsh in the USA1 found that the effect of prescribed burning on overall vegetation cover in the following autumn depended on the season of burning.
Herb abundance (1 study): One study of a floodplain marsh in Australia2 simply reported grass/ sedge cover for up to four years after burning mimosa-invaded vegetation (along with other interventions).
Native/non-target abundance (2 studies): One replicated, randomized, paired, controlled study in canarygrass-invaded wet meadows in the USA3 found that prescribed burning had no significant effect on the biomass of plants other than the invasive species, 2–3 growing seasons later. One study of a floodplain marsh in Australia2 simply reported non-target vegetation cover for up to four years after burning mimosa-invaded vegetation (along with other interventions).
Individual species abundance (1 study): One study1 quantified the effect of this intervention on the abundance of individual plant species other than the species being controlled. The replicated, randomized, controlled study in a marsh in the USA1 found that the effect of prescribed burning on the cover of dominant species in the following autumn depended on the season of burning.
VEGETATION STRUCTURE

9. Threat: Invasive and other problematic species
217
A replicated, randomized, controlled study in 1992 in an ephemeral freshwater marsh in Missouri, USA (1) found that summer-burned plots (but not spring-burned plots) contained fewer plant species and had lower vegetation cover than unburned plots. Vegetation was surveyed at the end of September. Unburned plots contained 4.6 plant species/m2 and had 92% total vegetation cover. The most abundant plant species included fox sedge Carex vulpinoidea (cover: 28%; frequency: 60%), marsh elder Iva ciliata (cover: 25%; frequency: 100%), ricecut grass Leersia oryzoides (cover: 17%; frequency: 50%) and beggarticks Bidens spp. (cover: 12%; frequency: 100%). Spring-burned plots had statistically similar plant species richness (5.5 species/m2) and total vegetation cover (94%) to the unburned plots, but were dominated by ricecut grass (cover: 50; frequency: 97%) and beggarticks (cover: 31%; frequency: 100%). Summer-burned plots had significantly lower plant species richness (2.8 species/m2) and lower total vegetation cover (23%) than the unburned plots. The most abundant plant species in summer-burned plots were ricecut grass (cover: 5%; frequency: 97%) and sesbania Sesbania exaltala (cover: 5%; frequency: 70%). Methods: Nine 0.1-ha plots were established in a freshwater marsh managed for waterfowl (i.e. winter flooding followed by spring or summer drawdown). Three random plots received each treatment: spring burning (April 1992), summer burning (July 1992) or no burning. In the summer-burned plots, vegetation was mown three days before burning. Cover of every plant species, and bare ground, were recorded in September 1992 in ten 1-m2 quadrats/plot.
A study in 1998–2003 in a degraded floodplain marsh in the Northern Territory, Australia (2) reported that following herbicide application, physical damage and prescribed burning to control invasive mimosa Mimosa pigra, some herbaceous plants recolonized the site along with mimosa. After one year, cover of all vegetation other than mimosa was approximately 31–80%. This included 12–45% total cover of grasses/sedges. Mimosa cover was approximately 0–17%, depending on the area within the marsh. The number of new mimosa seedlings each year declined over time, from 1 seedling/m2 in the first year after intervention was complete, to <0.5 seedlings/m2 in the second and third years, then 0 seedlings/m2 in the fourth year. Methods: Three interventions were applied to a 100-ha patch of mimosa-dominated floodplain. In April 1998, the site was sprayed with herbicide (metsulfuron methyl). In October 1999, the dead vegetation was crushed using a chain tied between two bulldozers, then the site was burned (fire lasting several days). The study does not distinguish between the effects of these interventions. Vegetation was surveyed in the dry season (July–October), in up to three areas of the marsh (where no vegetation had been introduced) and for up to four years after intervention was complete.
A replicated, randomized, paired, controlled study in 2000–2004 in two wet meadows invaded by reed canarygrass Phalaris arundinacea in Minnesota, USA (3) found that prescribed burning had no significant effect on vegetation biomass, 2–3 growing seasons after the last burn. Vegetation biomass was statistically similar in burned and unburned plots. This was true for total biomass of non-canarygrass species (both sown and non-sown) and for canarygrass itself (data not reported). Burning did, however, have a short-term effect on canarygrass density. After four weeks, burned plots contained more canarygrass shoots (1,180 shoots/m2) than unburned plots (520 shoots/m2). Methods: In the early 2000s, one hundred and sixty 25-m2 plots were established, in 40 sets of four, across two canarygrass-invaded wet meadows. Eighty plots (20 random sets) were burned in mid-May, for either one or two years. The remaining 80 plots were not burned. Three-quarters of the plots under

9. Threat: Invasive and other problematic species
218
each burning treatment were also sprayed with herbicide later in the year. All plots were sown with a mixture of grass and forb seeds in the year after the final burn. Dry above-ground biomass samples were taken in August in the two years after burning.
A controlled, before-and-after study in 1998–2004 in an ephemeral freshwater marsh in Costa Rica (4) reported that burning and crushing stands of invasive southern cattail Typha domingensis reduced the total vegetated area and vegetation cover, but increased plant species richness. Unless specified, statistical significance was not assessed. In the wet season before intervention, live vegetation stands covered 98–99% of the study plots. In a managed plot, this dropped to 68% after five months (wet season) then 23% after eight months (dry season). Over the same period, the coverage of southern cattail stands dropped from 61–62% to 52%, then to 7%. In an unmanaged plot, coverage remained ≥98% for live vegetation and 63–66% for cattail. After 11–22 months, the managed plot had lower cover of live vegetation, along transects, than the unmanaged plot (managed: 17–90%; unmanaged: 88–100%). The same was true for cattail cover (managed: 5–38%; unmanaged: 75–100%). Finally, the managed plot contained more plant species, both overall (managed: 61; unmanaged: 20 species/plot) and within transects (managed: 12; unmanaged: 4 species/300 m2). Methods: Two 80-ha plots were established in a cattail-dominated marsh. From September 2002, cattail stands in one of the plots were burned when dry and/or crushed when wet (by driving over them in a tractor with large paddle wheels). The study does not distinguish between the effects of these interventions. Both plots had been rewetted in July. Vegetation stands were mapped from aerial photographs or satellite images taken before (December 1998) and after (November 2002, March 2003) intervention. Detailed vegetation surveys, along six 25 x 2 m transects/plot, were carried out between August 2003 and July 2004.
(1) Laubhan M.K. (1995) Effects of prescribed fire on moist-soil vegetation and soil macronutrients. Wetlands, 15, 159–166.
(2) Paynter Q. (2004) Revegetation of a wetland following control of the invasive woody weed, Mimosa pigra, in the Northern Territory, Australia. Environmental Management and Restoration, 5, 191–198.
(3) Reinhardt Adams C. & Galatowitsch S.M. (2006) Increasing the effectiveness of reed canary grass (Phalaris arundinacea L.) control in wet meadow restorations. Restoration Ecology, 14, 441–451.
(4) Trama F.A., Rizo-Patrón F.L., Kumar A., Gonzalez E., Somma D. & McCoy M.B. (2009) Wetland cover types and plant community changes in response to cattail-control activities in the Palo Verde Marsh, Costa Rica. Ecological Restoration, 27, 278–289.
9.11.2 Use prescribed fire to control problematic plants: brackish/salt
marshes
Four studies evaluated the effects, on vegetation, of using prescribed fire to control problematic plants in brackish/salt marshes. All four studies were in the USA. Two studies2,3 were based on the same experimental set-up.
VEGETATION COMMUNITY
Overall richness/diversity (4 studies): Two replicated, randomized, paired, controlled studies in brackish and salt marshes in the USA2,3 reported that burned and unburned plots had similar plant species richness over the following 1–3 years. Two studies in saltgrass- or reed-dominated marshes in the USA1,4 reported that burned areas had greater plant species richness than unburned areas, after approximately 1–3 years. In one of the studies4, burned areas had also been sprayed with herbicide for nine years – and contained more plant species than a nearby natural marsh.

9. Threat: Invasive and other problematic species
219
VEGETATION ABUNDANCE
Overall abundance (3 studies): Three replicated, randomized, paired, controlled studies in brackish and salt marshes in the USA1–3 evaluated the effect of prescribed burning on vegetation cover. One study1 found that autumn-burned plots had lower overall vegetation cover than unburned plots after 11 months, but one2 found that winter-burned plots had similar overall vegetation cover to unburned plots after one year. Two of the studies2,3 reported that winter-burned plots had less standing dead vegetation cover than unburned plots in the following summer3 or winter2.
Individual species abundance (4 studies): All four studies1–4 quantified the effect of this intervention on the abundance of individual plant species other than a species being controlled. For example, three replicated, randomized, paired, controlled studies in brackish and salt marshes in the USA1–3 reported mixed effects of burning on cover of saltgrass Distichlis spicata: higher in burned than unburned plots in the following summer1, lower in burned than unburned plots in the following winter2, or mixed effects amongst marsh types3. Two replicated, randomized, paired, controlled studies in brackish and salt marshes in the USA2,3 reported that burning did not reduce cover of saltmeadow cordgrass Spartina patens, compared to cover in unburned plots, over the following 1–3 years. One site comparison study of brackish marshes in the USA4 reported that a marsh that had been burned for three years (and sprayed with herbicide for nine) contained more smooth cordgrass Spartina alterniflora than an unburned and unsprayed marsh, and a similar amount of smooth cordgrass to a nearby natural marsh.
VEGETATION STRUCTURE
Visual obstruction (1 study): One replicated, randomized, paired, controlled study in brackish and salt marshes in the USA2 found that the visual obstruction caused by vegetation (combination of height and horizontal cover) was similar in burned and unburned plots, after 11 months.
Height (1 study): One site comparison study of brackish marshes in the USA4 found that in a marsh burned for two years (and sprayed with herbicide for nine), the dominant plant species (smooth cordgrass Spartina alterniflora) grew to a similar height as in a nearby natural marsh.
A replicated, randomized, paired, controlled study in 1992–1993 in an ephemeral brackish marsh dominated by saltgrass Distichlis spicata in California, USA (1) found that burned plots had greater plant species richness than unburned plots, and lower overall vegetation cover, but similar or greater cover of dominant species other than saltgrass. After 11 months, burned plots had greater overall plant species richness than unburned plots (burned: 6.3 species/m2; unburned: 3.1 species/m2) but lower overall vegetation cover (burned: 88%; unburned: >99%). Burned plots had lower saltgrass cover (burned: 65%; unburned: 99%) despite a statistically similar saltgrass density under both treatments (burned: 2,000; unburned: 1,770 stems/m2). Of six other dominant herb species, two had greater cover in burned plots (burned: 9–11%; unburned: 0%) whilst four had statistically similar cover under each treatment (burned 2–17%; unburned: <1–5%). Density of these species was not reported. Methods: Ten pairs of 100-m2 plots were established in an impounded brackish marsh, managed for waterfowl (autumn/winter flooding with spring/summer drawdown) but dominated by saltgrass. In September 1992, ten plots were burned (one plot/pair; 50 m2/plot). The other plots were not burned. In August 1993, vegetation was surveyed in two 1-m2 quadrats/plot. Cover estimates included live and dead standing plants.
A replicated, randomized, paired, controlled study in 1995–1997 in 14 brackish and salt marshes in Louisiana, USA (2) reported that prescribed winter burning had no significant effect on plant species richness, vegetation structure and overall vegetation cover in the following winter, but increased cover of the two dominant

9. Threat: Invasive and other problematic species
220
plant species and reduced cover of dead vegetation. Unless specified, statistical significance was not assessed. After one year, a total of 5–8 plant species were recorded across burned plots (vs 6–7 species across unburned plots). Burned and unburned plots created statistically similar visual obstruction (data reported as an index combining plant height and horizontal cover) and had statistically similar overall vegetation cover (burned: 72%; unburned: 76%). However, burned plots had greater live cover of the two dominant plant species (saltmeadow cordgrass Spartina patens: 28–59%; saltgrass Distichlis spicata: 2–11%) and less cover of standing dead vegetation (35–61%) than unburned plots (saltmeadow cordgrass: 19–23%; saltgrass: 1–5%; dead: 75–76%). Vegetation was also surveyed 1–2 months after burning. At this point, all metrics apart from species richness were lower in burned than unburned plots (see original paper for data). Methods: The experiment was carried out in 14 coastal marshes of varying salinity and tidal influence. In winter 1995/1996, when 5 cm of water covered the marshes, one random half of each marsh was burned. In January–February 1996 and 1997, vegetation was surveyed at 40 points in each half of each marsh. This study was based on the same experimental set-up as (3).
A replicated, randomized, paired, controlled study in 1995–1998 in 11 brackish and salt marshes in Louisiana, USA (3) found that prescribed winter burning typically had no significant effect on summer plant species richness but had mixed effects on the cover of two dominant plant species and caused only a temporary reduction in cover of dead vegetation. Averaged over the three summers following intervention, burned and unburned plots had statistically similar plant species richness in three of four marsh types (for which burned: 4.2–5.7 species/plot; unburned: 5.0–5.5 species/plot; other marsh type higher richness in burned plots). Cover of saltmeadow cordgrass Spartina patens was similar in burned and unburned plots in three of four marsh types, but greater in burned plots in the other marsh type. Cover of saltgrass Distichlis spicata was greater in burned plots in two of four marsh types, lower in burned plots in one marsh type and similar in burned and unburned plots in the other marsh type (see original paper for data). Averaged over all marsh types, cover of standing dead vegetation was lower in burned plots in the first summer (burned: 45%; unburned: 69%) but did not significantly differ between treatments in the following two summers (burned: 64–78%; unburned: 71–72%). Methods: The experiment was carried out in 11 coastal marshes (of four types based on salinity and tidal influence). In winter 1995/1996, one random half of each marsh was burned. The “unburned” half of one marsh experienced a lightning fire in summer 1997. In May–June 1996–1998, vegetation was surveyed at 40 points in each half of each marsh. This study was based on the same experimental set-up as (2).
A site comparison study in 2004 of three brackish marshes in an estuary in New Jersey, USA (4) found that prescribed burning (along with applying herbicide) converted a marsh dominated by common reed Phragmites australis to one dominated by smooth cordgrass Spartina alterniflora, with similar cordgrass abundance and height to a natural marsh, but more plant species. After three years of burning and nine years of herbicide application, the treated marsh was statistically similar to a nearby natural marsh in terms of cordgrass dominance (treated: 78%; natural: 83% of stems were smooth cordgrass), density (treated: 286; natural: 360 stems/m2), above-ground biomass (treated: 457; natural: 802 g/m2) and height (treated: 78; natural: 94 cm). However, the treated marsh contained six plant species, including common reed, whilst the natural marsh contained only three. A third, untreated marsh was still dominated by common reed (100% of stems; density: 80 stems/m2; biomass: 2,124

9. Threat: Invasive and other problematic species
221
g/m2; height: 317 cm; no other plant species). Methods: In August 2004, vegetation was surveyed in three tidal brackish marshes. One marsh was formerly dominated by common reed, but had been burned in 1996–1998 and sprayed with herbicide in 1996–2004. The study does not distinguish between the effects of these interventions. The second, natural marsh was dominated by smooth cordgrass. The third marsh was dominated by common reed and had not been treated. In each marsh, vegetation was clipped from six 0.25 x 0.25 m quadrats then identified, measured, dried and weighed.
(1) De Szalay F.A. & Resh V.H. (1997) Responses of wetland invertebrates and plants important in waterfowl diets to burning and mowing of emergent vegetation. Wetlands, 17, 149–156.
(2) Gabrey S.W., Afton A.D. & Wilson B.C. (1999) Effects of winter burning and structural marsh management on vegetation and winter bird abundance in the Gulf Coast Chenier Plain, USA. Wetlands, 19, 594–603.
(3) Gabrey S.W., Afton A.D. & Wilson B.C. (2001) Effects of structural marsh management and winter burning on plant and bird communities during summer in the Gulf Coast Chenier Plain. Wildlife Society Bulletin, 29, 218–231.
(4) Hagan S.M., Brown S.A. & Able K.W. (2007) Production of mummichog (Fundulus hereroclitus): response in marshes treated for common reed (Phragmites australis) removal. Wetlands, 27, 54–67.
9.11.3 Use prescribed fire to control problematic plants: freshwater
swamps
One study evaluated the effects, on vegetation, of using prescribed fire to control problematic plants in freshwater swamps. The study was in the USA.
VEGETATION COMMUNITY
Overall richness/diversity (1 study): One replicated, randomized, controlled study aiming to restore a swamp in the USA1 found that burning canarygrass-invaded vegetation after spraying it with herbicide increased overall plant diversity, two growing seasons later, compared to spraying alone. However, burning had no significant effect on plant species richness.
Native/non-target richness/diversity (1 study): The same study1 found that burning canarygrass-invaded vegetation after spraying it with herbicide had no significant effect on native plant species richness, two growing seasons later, compared to spraying alone.
VEGETATION ABUNDANCE
Tree/shrub abundance (1 study): One replicated, randomized, controlled study aiming to restore a swamp in the USA1 found that burning canarygrass-invaded vegetation after spraying it with herbicide had no significant effect on the density of non-planted tree seedlings, two growing seasons later, compared to spraying alone.
Individual species abundance (1 study): The same study1 reported that burning canarygrass-invaded vegetation after spraying it with herbicide affected the abundance of some individual plant species two growing seasons later.
VEGETATION STRUCTURE
A replicated, randomized, controlled study in 2002–2004 aiming to restore a swamp in a reed canarygrass Phalaris arundinacea stand in Wisconsin, USA (1) found that burning after spraying herbicide increased plant diversity more than spraying alone, but that burning had no additional effect on plant richness or the number of tree seedlings. After two growing seasons, the vegetation was more diverse in burned/sprayed plots than in plots that had only been sprayed (data reported as a diversity index). The treatments did not significantly differ in overall plant richness

9. Threat: Invasive and other problematic species
222
(burned/sprayed: 9.3; sprayed: 6.6 species/m2), native plant richness (burned/ sprayed: 6.3; sprayed: 4.0 species/m2) or density of non-planted tree seedlings (burned/sprayed: 21; sprayed: 25 seedlings/m2). The study also reported differences between treatments in the abundance of individual plant species (statistical significance not assessed). For example, eastern willow herb Epilobium coloratum was more abundant in burned/sprayed plots (70% of quadrats; 10% cover) than sprayed plots (40% of quadrats; 6% cover). Reed canarygrass was less abundant in burned/sprayed plots (80% of quadrats; 34% cover) than sprayed plots (100% of quadrats; 73% cover). Methods: Twelve plots were established in a canarygrass-invaded wetland. All 12 plots were sprayed with herbicide (Roundup®) in November 2002, and planted with tree/shrub seedlings (roughly 1 seedling/m2) in spring 2003. Four random plots were also burned, before planting, in spring 2003. In August 2004, plant species and their cover were surveyed in ten 1-m2 quadrats/treatment, ignoring planted trees/shrubs.
(1) Hovick S.M. & Reinartz J.A. (2007) Restoring forest in wetlands dominated by reed canarygrass: the effects of pre-planting treatments on early survival of planted stock. Wetlands, 27, 24–39.
9.11.4 Use prescribed fire to control problematic plants: brackish/saline
swamps
We found no studies that evaluated the effects, on vegetation, of using prescribed fire to control problematic plants in brackish/saline swamps.
This means that we have not yet found any studies that have directly evaluated this intervention during our systematic journal and report searches. Therefore we have no evidence to indicate whether or not the intervention has any desirable or harmful effects.
9.12 Use herbicide to control problematic plants
Background
Herbicides can be applied to an entire area of vegetation, or targeted at individual problematic species (e.g. by painting onto individual plants, or shielding non-target vegetation). Herbicides could be applied once, or repeatedly to kill established vegetation or recurrent growth from the seed bank. To maximize contact with target species and minimize non-target effects, herbicides might be applied during/at the start of the dry season, as the tide is going out, or on calm rather than windy days (e.g. Tobias et al. 2016). Often, herbicide application will follow or be followed by other interventions, such as mowing, burning or physical removal of problematic plants.
CAUTION: In many herbicides, the active chemicals are not specific to the problematic species so can cause collateral damage to desirable species. Relying on herbicides as the only tool to manage problematic plants can lead to the development of herbicide resistance in future generations (Powles et al. 1997). Herbicides can have severe negative side effects on biodiversity, the environment and human health (Pimentel et al. 1992). Accordingly, herbicide use – particularly in or near wetlands or water bodies – is limited in many countries.
Bear in mind that the effects of herbicide might be highly dependent on the chemical used, how it is applied (e.g. season and number of applications), and local site

9. Threat: Invasive and other problematic species
223
conditions (e.g. nutrient availability, water levels, proximity of untreated invaded vegetation) (Tobias et al. 2016). Also, similarity between treated and untreated, degraded areas might not be an undesirable outcome for this intervention: similarity in vegetation cover after months or years could suggest, for example, that native vegetation abundance has recovered after being initially depressed by herbicide.
For this intervention, “vegetation” refers to overall or non-target vegetation. Studies that only report responses of target problematic plants have not been summarized.
Related interventions: Use herbicide to maintain or restore disturbance (8.11); Introduce organisms to control problematic plants, including introduction of microorganisms as “bioherbicides” (9.14).
Pimentel D., Acquay H., Biltonen M., Rice P., Silva M., Nelson J., Lipner V., Giordano S., Horowitz A. & D’Amore M. (1992) Environmental and economic costs of pesticide use. BioScience, 42, 750–760.
Powles S.B., Preston C., Bryan I.B. & Jutsum A.R. (1997) Herbicide resistance: impact and management. Advances in Agronomy, 58, 57–93.
Tobias V.D., Block G. & Laca E.A. (2016) Controlling perennial pepperweed (Lepidium latifolium) in a brackish tidal marsh. Wetlands Ecology and Management, 24, 411–418.
9.12.1 Use herbicide to control problematic plants: freshwater marshes
Seventeen studies evaluated the effects, on vegetation, of using herbicide to control problematic plants in freshwater marshes. Twelve studies were in the USA2–5,9,10,12–15,16a,16b. Two studies were in Australia6,7. There was one study in each of Canada1, Mexico8 and the UK11. There was overlap in the sites used in two studies2,3. Two pairs of studies in Australia6,7 and the USA16a,16b used the same general study area, but different plots or experimental set-ups.
VEGETATION COMMUNITY
Overall extent (3 studies): Two replicated, randomized, controlled, before-and-after studies in the USA2,3 found that marshes sprayed with herbicide had lower live vegetation coverage but greater dead vegetation coverage than unsprayed marshes, after 1–2 years. Overall vegetation coverage was lower in sprayed than unsprayed marshes in one study2, but similar in sprayed and unsprayed marshes in the other3. One study of a dune slack in the UK1 simply reported an increase in overall vegetation coverage between one and two years after clearing scrub (by cutting and applying herbicide).
Overall richness/diversity (6 studies): Three studies (including one replicated, randomized, paired, controlled) in ephemeral marshes/wet meadows in the USA14,16a,16b reported that spraying invaded vegetation with herbicide (sometimes13 along with other interventions) typically increased total plant species richness 1–5 growing seasons later. Two replicated, randomized, paired, controlled studies (one also before-and-after) in freshwater marshes/wet meadows in the USA5 and Mexico8 found that plots treated with herbicide (sometimes5 along with other interventions) had similar overall plant species richness and diversity to untreated plots, after 4–8 months8 or three years5. One study of a dune slack in the UK11 simply reported a small increase in total plant richness between one and two years after clearing scrub (by cutting and applying herbicide).
Characteristic plant richness/diversity (3 studies): Two before-and-after studies of floodplain marshes in the USA16a,16b reported that cover of wet-prairie indicator species was higher 1–4 years after applying herbicide than before. However, one of these studies16b reported that the total cover of non-invasive, wetland-characteristic herbs was similar or lower 2–3 years after applying herbicide than before. One study of a dune slack in the UK11 simply reported an increase the number of slack-characteristic plant species present between one and two years after clearing scrub (by cutting and applying herbicide).

9. Threat: Invasive and other problematic species
224
Native/non-target richness/diversity (3 studies): One controlled, before-and-after study in a reed-dominated freshwater marsh in the USA1 found that applying herbicide (along with cutting/ mowing) increased non-reed species richness three years later. One replicated, controlled, before-and-after study in cattail-invaded marshes in the USA14 reported that marshes sprayed with herbicide contained no living native plants one year later: fewer than were present before spraying and in unsprayed marshes. One study of a dune slack in the UK11 simply reported an increase in native plant richness between one and two years after clearing scrub (by cutting and applying herbicide).
VEGETATION ABUNDANCE
Overall abundance (4 studies): Three replicated studies (two also randomized, paired, controlled) in freshwater marshes/wet meadows in the USA5,16b and Mexico8 found that applying herbicide (sometimes5 along with other interventions) had no clear or significant effect on overall vegetation abundance four months to three years later. Cover5,16b and density8 were similar to untreated plots and/or pre-treatment levels. One replicated, randomized, paired, controlled study in the USA9 found that wet meadows sprayed with herbicide contained less total vegetation biomass than unsprayed marshes, 2–3 growing seasons later.
Native/non-target abundance (7 studies): Four studies (including one replicated, randomized, paired, controlled, before-and-after) in marshes/wet meadows in the USA4,9,14 and Australia7 found that spraying invaded plots with herbicide (sometimes4,14 along with other interventions) did not reduce – and often increased – the abundance of native14 or non-target4,7,9 vegetation 1–3 growing seasons later. One replicated, controlled, before-and-after study in cattail-invaded marshes in the USA15 reported that marshes sprayed with herbicide contained no living native plants one year later: density and biomass were lower than before spraying and in unsprayed marshes. One replicated, randomized, paired, controlled study in an alligatorweed-invaded marsh in the USA10 found that spraying vegetation with herbicide had no significant effect on native plant biomass after 1–2 growing seasons. One study of a floodplain marsh in Australia6 simply reported non-target vegetation cover for up to four years after treating mimosa-invaded vegetation with herbicide (along with other interventions).
Herb abundance (4 studies): Two replicated, randomized, paired, controlled studies in wet meadows in the USA5,12 found that treating a problematic plant species with herbicide (sometimes5 along with physical removal) had no significant effect on cover of forbs5, grass-like plants5 or sedges12 after 2–3 growing seasons. One replicated, randomized, paired, controlled study in a loosestrife-invaded marsh in Canada1 found that the density of sedges and grasses was not lower in herbicide-sprayed plots, than in unsprayed plots, after 2–3 years. The precise effect depended on dose of herbicide used. One study of a floodplain marsh in Australia6 simply reported grass/sedge cover for up to four years after treating mimosa-invaded vegetation with herbicide (along with other interventions).
Algae/phytoplankton abundance (1 study): One replicated, randomized, controlled study in a reed-invaded marsh in the USA13 reported that free-growing filamentous algae were more common in plots sprayed with herbicide than unsprayed plots, approximately one year later. However, spraying with herbicide had no significant effect on the density or biomass of biofilm algae.
Individual species abundance (3 studies): Three studies4,5,8 quantified the effect of this intervention on the abundance of individual plant species other than the species being controlled. For example, one replicated, randomized, paired, controlled study in a grass-invaded marsh in Mexico8 found that five of five monitored native species had similar cover in herbicide-sprayed and unsprayed plots after 4–8 months. Two of the studies4,5 do not distinguish between the effects of applying herbicide and other interventions.
VEGETATION STRUCTURE

9. Threat: Invasive and other problematic species
225
A replicated, randomized, paired, controlled study in 1991–1994 in a floating freshwater marsh invaded by purple loosestrife Lythrum salicaria in Ontario, Canada (1) found that the effect of spraying herbicide on the density of sedges, grasses and purple loosestrife depended on the dose. After 2–3 years, the density of sedges Carex spp. did not significantly differ between sprayed plots (68–322 stems/m2) and unsprayed plots (150–199 stems/m2). Grass density did not significantly differ between plots sprayed with low-medium herbicide doses (sprayed: 80–177 stems/m2)
and unsprayed plots (47–65 stems/m2). However, it was significantly greater (vs no spraying) in plots sprayed with high herbicide doses (124–161 stems/m2). Purple loosestrife density did not significantly differ between plots sprayed with low herbicide doses (27–41 stems/m2) and unsprayed plots (36–56 stems/m2). However, it was significantly lower (vs no spraying) in plots sprayed with medium-high herbicide doses (1–15 stems/m2). Methods: In summer 1991, twelve 30-m2 plots were established, in three blocks of four, in a loosestrife-invaded marsh. Three plots (one random plot/block) were sprayed with each dose of triclopyr amine: low (4 kg/m2), medium (8 kg/m2) or high (12 kg/m2). The other three plots were not sprayed. In July and August 1993 and 1994, plant stems were counted in three 1-m2 quadrats/plot.
A replicated, randomized, controlled, before-and-after study in 1990–1993 of 17 freshwater marshes dominated by cattails Typha spp. in North Dakota, USA (2) found that marshes sprayed with herbicide had lower overall and live vegetation coverage than unsprayed marshes, but greater coverage of dead vegetation. After 1–2 years, coverage of emergent vegetation was significantly lower in sprayed marshes (70% of marsh area) than in unsprayed marshes (88% of marsh area). Sprayed marshes also had lower coverage of live vegetation (sprayed: 29%; unsprayed: 70%) but greater coverage of dead vegetation (sprayed: 40%; unsprayed: 17%). Before intervention, marshes destined for each treatment had statistically similar coverage of emergent vegetation (sprayed: 84–90%; unsprayed: 89%; live and dead not separated). Methods: In July 1990 and 1991, glyphosate herbicide (Rodeo®) was sprayed on to a total of 12 cattail-dominated marshes (5.8 L/ha across 50–90% of each marsh). Five similar marshes were left unsprayed. Emergent vegetation coverage was estimated from aerial photographs of each marsh, taken before (June 1990) and 1–2 years after (August 1991–1993) intervention. This study used a subset of the marshes in (3).
A replicated, randomized, controlled, before-and-after study in 1990–1993 of 23 freshwater marshes dominated by cattails Typha spp. in North Dakota, USA (3) found that marshes sprayed with herbicide had similar overall vegetation coverage to unsprayed marshes, but less live vegetation and more dead vegetation. After 1–2 years, coverage of emergent vegetation did not significantly differ between sprayed marshes (61–81% of marsh area) and unsprayed marshes (76–85% of marsh area). However, sprayed marshes had lower coverage of live vegetation (sprayed: 14–39%; unsprayed: 61–69%) including cattails (sprayed: 31%; unsprayed: 65%), and greater coverage of dead vegetation (sprayed: 25–58%; unsprayed: 15–16%). Before intervention, marshes destined for each treatment had statistically similar coverage of emergent vegetation (sprayed: 70–91%; unsprayed: 87%; data not reported for live, dead and cattail coverage). Methods: In July 1990 and 1991, glyphosate herbicide (Rodeo®) was sprayed on to a total of 16 cattail-dominated marshes (5.8 L/ha across 50–90% of each marsh). Seven similar marshes were left unsprayed. Emergent vegetation coverage was estimated from aerial photographs of each marsh, taken before (June 1990) and 1–2 years after (August 1991–1993) intervention. Some of the marshes in this study were also used in (2).

9. Threat: Invasive and other problematic species
226
A controlled, before-and-after study in 1995–1998 in a freshwater marsh dominated by common reed Phragmites australis in Connecticut, USA (4) found that applying herbicide to the vegetation (along with cutting/mowing) increased the evenness of the plant community and the abundance and richness of non-reed species. After three years, treated plots contained a more even plant community, less dominated by one or two species, than an untreated plot (data reported as a coefficient of variation; see original paper for data on individual species abundance). Treated plots also had greater plant species richness (excluding common reed; treated: 5–7 species/m2; untreated: 3 species/m2) and contained a greater density of non-reed stems (treated: 78–97 stems/m2; untreated: 15 stems/m2). Common reed was less abundant in treated plots, in terms of stem density (treated: 6–19 stems/m2; untreated: 36 stems/m2) and frequency (treated: 45–64%; untreated: 98% of surveyed quadrats contained common reed). Before intervention, all plots had relatively similar plant species richness (excluding common reed; 2–3 species/m2), non-reed density (7–23 stems/m2) and reed density (33–40 stems/m2). Methods: In 1995, two 0.4-ha plots were treated in a reed-dominated, tidal, freshwater marsh. In August, each plot was sprayed with herbicide (Rodeo® 1%). In autumn, one plot was cut by hand and one was mown mechanically; cuttings were left in place. A third adjacent plot was neither sprayed with herbicide nor cut/mown. The study does not distinguish between the effects of applying herbicide and cutting/mowing. In late summer before (1995) and after (1996–1998) intervention, plant stems were identified and counted in fifty 1-m2 quadrats/plot.
A replicated, randomized, paired, controlled, before-and-after study in 1988–1991 in two wet meadows that had been cleared of vegetation in New York State, USA (5) found that controlling regrowth of invasive purple loosestrife Lythrum salicaria (by applying herbicide to large shoots and pulling up seedlings) had no significant effect on plant species richness, diversity or vegetation cover. After three years, plots with and without control of loosestrife regrowth had statistically similar plant species richness (control: 7; no control: 8 species/m2), plant diversity (data reported as a diversity index), total vegetation cover (control: 67–82%; no control: 79%), grass-like plant cover (control: 60–75%; no control: 70–73%) and forb cover (control: 5–20%; no control: 8–10%). Purple loosestrife cover was 0% in plots where regrowth had been controlled, but still only 2% in plots where regrowth had not been controlled. For data on the cover of other individual plant species, see original paper. Before intervention and within each meadow, plots destined for each treatment had statistically similar plant species richness (8–9 species/m2), plant diversity, total vegetation cover (103–143%), grass-like plant cover (16–58%), forb cover (25–56%) and purple loosestrife cover (23–63%). Methods: In 1988, six pairs of 1-m2 plots were established across two loosestrife-invaded wet meadows. In September, all vegetation was dug up and removed from the plots (see Section 9.4). In six of the plots (one random plot/pair), loosestrife regrowth was controlled twice/year thereafter (painting large shoots with glyphosate and pulling up seedlings; the study does not distinguish between the effects of these interventions). In the other plots, loosestrife regrowth was not controlled. Plant species and their cover were surveyed before initial removal (August 1988) and three years after (September 1991).
A study in 1998–2003 in a degraded floodplain marsh in the Northern Territory, Australia (6) reported that following herbicide application, physical damage and prescribed burning to control invasive mimosa Mimosa pigra, some herbaceous plants recolonized the site along with mimosa. After one year, cover of all vegetation other

9. Threat: Invasive and other problematic species
227
than mimosa was approximately 31–80%. This included 12–45% total cover of grasses/sedges. Mimosa cover was approximately 0–17%, depending on the area within the marsh. The number of new mimosa seedlings each year declined over time, from 1 seedling/m2 in the first year after intervention was complete, to <0.5 seedlings/m2 in the second and third years, then 0 seedlings/m2 in the fourth year. Methods: Three interventions were applied to a 100-ha patch of mimosa-dominated floodplain. In April 1998, the site was sprayed with herbicide (metsulfuron methyl). In October 1999, the dead vegetation was crushed using a chain tied between two bulldozers, then the site was burned (fire lasting several days). The study does not distinguish between the effects of these interventions. Vegetation was surveyed in the dry season (July–October), in up to three areas of the marsh (where no vegetation had been introduced) and for up to four years after intervention was complete. This study was in the same area as (7), but used a different experimental set-up.
A replicated, randomized, paired, controlled, before-and-after study in 1997–1999 in a floodplain wetland invaded by mimosa Mimosa pigra in the Northern Territory, Australia (7) found that spraying the vegetation with herbicide did not reduce the cover of non-mimosa vegetation 1–2 years later. In three of six comparisons, non-mimosa cover was higher in sprayed plots (55–74%) than unsprayed plots (15–38%). In the other three comparisons, there was no significant difference between treatments (sprayed: 32–47%; unsprayed: 15–38%). Sprayed plots consistently had lower mimosa coverage (six of six comparisons) and density (six of six comparisons). Results for mimosa biomass were mixed, but never significantly higher in sprayed than unsprayed plots (see original paper for data). Before intervention, the abundance of both mimosa and other vegetation were statistically similar in plots destined for each treatment (data not reported). Methods: In April 1998, thirty-two 100 x 200 m plots were established, in four sets of eight, on a mimosa-invaded floodplain. Twenty-four plots (six random plots/set) were sprayed with herbicide in April 1998 and/or January 1999. In half of the plots, vegetation was also crushed with bulldozers in late 1998. Vegetation was surveyed one year before spraying (late 1997/early 1998) and approximately 1–2 years after the latest spray (late 1999), in four 1–5 m2 quadrats/plot and by aerial photography (mimosa coverage). This study was in the same area as (6), but used a different experimental set-up.
A replicated, randomized, paired, controlled study in a freshwater marsh invaded by antelope grass Echinochloa pyramidalis in eastern Mexico (8) found that spraying the vegetation with herbicide had no significant effect on overall plant density, richness or diversity, the relative abundance of common plant species, or the absolute abundance of common native plant species. After 4–8 months, sprayed and unsprayed plots contained a statistically similar overall plant density (six of six comparisons; sprayed: 57–81; unsprayed: 54–93 plants/0.49 m2), species richness (six of six comparisons; sprayed: 5–7; unsprayed: 3–5 species/0.49 m2) and diversity (two of two comparisons; data reported as a diversity index). Accordingly, all six monitored plant species had a similar relative abundance in sprayed and unsprayed plots (five native species, plus antelope grass; see original paper for data). The five native plant species had statistically similar cover in sprayed and unsprayed plots in 13 of 14 comparisons (both treatments: 0–19% cover/species). In contrast, antelope grass had lower cover in sprayed plots in four of six comparisons (for which sprayed: 22–78%; unsprayed: 99–100%). Methods: In January (year not reported), twenty-one 0.49-m2 plots were established (in seven sets of three) in a degraded marsh, invaded

9. Threat: Invasive and other problematic species
228
by antelope grass. Fourteen plots (two random plots/set) were sprayed with glyphosate herbicide (Roundup®). In seven of these, the most abundant native plant species was shielded with plastic tubes. The final seven plots (one random plot/set) were not sprayed. All 21 plots were enclosed, underground, by a plastic barrier. Vegetation was surveyed between May and September later that year (relative biomass in September only).
A replicated, randomized, paired, controlled study in 2000–2004 in two wet meadows invaded by reed canarygrass Phalaris arundinacea in Minnesota, USA (9) found that plots sprayed with herbicide contained less overall plant biomass than unsprayed plots after 2–3 growing seasons, but more non-canarygrass plant biomass. Two to three growing seasons after the last herbicide application, sprayed plots contained less total above-ground plant biomass (320–720 g/m2) than unsprayed plots (520–900 g/m2). Sprayed plots contained less reed canarygrass biomass (10–480 g/m2) than unsprayed plots (420–880 g/m2). However, they contained more biomass of other plants. This was true for total biomass of sown species (sprayed: 0–70 g/m2; unsprayed: 0 g/m2) and species that had not been sown (sprayed: 170–550 g/m2; unsprayed: 30–100 g/m2). Methods: In the early 2000s, one hundred and sixty 25-m2 plots were established, in 40 sets of four, across two canarygrass-invaded wet meadows. One hundred and twenty plots (three random plots/set) were sprayed with herbicide (Roundup® Ultra): in late May, August or September and in one or two years. The remaining 40 plots were not sprayed. Half of the plots under each herbicide treatment were also burned in mid-May. All plots were sown with a mixture of grass and forb seeds in the spring after the final herbicide application. Dry biomass samples were taken in August in the two years after herbicide application.
A replicated, randomized, paired, controlled, before-and-after study in 2004–2005 in two freshwater marshes invaded by alligatorweed Alternanthera philoxeroides in Alabama and Georgia, USA (10) found that spraying the vegetation with herbicide had no significant effect on native plant biomass after 1–2 growing seasons. Native plant biomass varied a lot depending on herbicide type, dose and application date, but was statistically similar in sprayed and unsprayed plots in 24 of 24 paired comparisons (sprayed: <1–210 g/0.25 m2; unsprayed: 76–129 g/0.25 m2). Alligatorweed biomass did not significantly differ between treatments in 14 of 24 comparisons (for which sprayed: 18–92 g/0.25 m2; unsprayed: 54–78 g/0.25 m2) but was lower in sprayed plots in the other 10 comparisons (for which sprayed: <1–22 g/0.25 m2; unsprayed: 54–78 g/0.25 m2). The study also provided short-term data on alligatorweed cover. This was depressed after 2–4 weeks for all herbicide types, doses and application dates (sprayed: 0–32%; unsprayed: 25–69%; before spraying: 17–62%). Methods: Sixty-four 5 x 5 m plots (in four sets of 16) were established across two alligatorweed-invaded freshwater marshes, managed for waterfowl. Herbicide was applied to 48 of the plots (12 random plots/set), in all possible combinations of herbicide type (triclopyr amine or imazapyr), dose (low, medium or high) and application date (April or July 2004). Alligatorweed cover was surveyed one week before spraying and for 12 weeks after. Vegetation was cut from plots, then dried and weighed, in October 2004 and 2005.
A study in 2005–2007 of a dune slack in England, UK (11) reported that after cutting and applying herbicide to grey willow Salix cinerea scrub, ground vegetation recolonized. In 2006, approximately one year after removing willows, 80% of the site was covered with vegetation (mostly herbaceous). There were 108 vascular plant taxa, including 98 natives. Approximately 54 taxa were characteristic of dune slacks.

9. Threat: Invasive and other problematic species
229
In 2007, approximately two years after removing willows, 95% of the site was covered with vegetation (still mostly herbaceous). There were 111 vascular plant taxa, including 107 natives. Approximately 65 taxa were characteristic of dune slacks. Twenty-eight taxa recorded in 2006 were not present in 2007, but 31 new taxa had colonized the site. Methods: In November/December 2005, dense grey willow scrub in a dune slack (low-lying area amongst dunes) was controlled. Grey willows were cut at ground level, then herbicide (Roundup® Biactive Plus) was applied to the largest stumps. The study does not distinguish between the effects of these interventions. Cut material was burned on site. Vascular plant taxa and their overall coverage were surveyed in August/September 2006 and 2007.
A replicated, randomized, paired, controlled study in 2006–2008 in a wet meadow being invaded by hybrid cattail Typha x glauca in Wisconsin, USA (12) found that spraying cattail with herbicide had no significant effect on cover of sedges Carex spp. after two growing seasons. Plots where cattails had been sprayed with herbicide had statistically similar sedge cover (14–29%) to unsprayed plots (11–38%). No sedge seedlings were found in any plot. Methods: Sixteen 4 x 8 m plots were established (in two sets of eight) on the boundary between native wet meadow vegetation and a patch of hybrid cattail. In May 2006, cattail plants in eight plots (four random plots/set) were sprayed with herbicide (Rodeo® 0.75%). The other eight plots were not sprayed. Sedge cover was surveyed in October 2007, in four 1-m2 quadrats/plot.
A replicated, randomized, controlled study in 2007–2008 in a freshwater marsh invaded by common reed Phragmites australis in Ohio, USA (13) reported that plots sprayed with herbicide were more likely to contain free-growing filamentous algae than unsprayed plots, but found that all plots contained a similar abundance, diversity and community of biofilm algae. After approximately one year, free-growing algae occurred in 13 of 30 samples in sprayed plots (vs 1 of 15 samples in unsprayed plots; statistical significance not assessed). Meanwhile, biofilm algae reached a statistically similar abundance in sprayed and unsprayed plots. This was true for both density (sprayed: 1,700–2,800 cells/cm2; unsprayed: 1,100–1,700 cells/100 cm2) and biomass (sprayed: 5–41 μg chlorophyll/cm2; unsprayed: 5–41 μg chlorophyll/cm2). Sprayed and unsprayed plots also supported a similar diversity of biofilm algae (data reported as a diversity index) and a similar community composition of the most abundant group: diatoms (data reported as a graphical analysis; statistical significance of difference not assessed). Common reed was less abundant in sprayed than unsprayed plots, in terms of both density (sprayed: 2–3 live stems/m2; unsprayed: 36 live stems/m2) and cover (sprayed: 1–3%; unsprayed: 49%). Methods: In June 2007, fifteen contiguous 20 x 20 m plots were established in a reed-invaded, lakeshore marsh. Ten random plots were sprayed once with herbicide (five with glyphosate-based AquaNeat®; five with imazapyr-based Habitat®). The other five plots were not sprayed. Vegetation was surveyed in June–August 2008. Free-growing algae were surveyed in 10 x 10 cm quadrats. Biofilms were surveyed on fallen, submerged reed stems. Reeds were surveyed, in 0.5-m2 quadrats, along a central transect in each plot.
A replicated, randomized, paired, controlled, before-and-after study in 2005–2008 in five wet meadows in South Dakota, USA (14) found that controlling problematic plants by mowing, applying herbicide and planting native upland plants increased plant species richness and cover of unplanted native species. All plots were initially dominated by reed canarygrass Phalaris arundinacea (>80% cover). After 1–3 growing seasons, plant species richness was higher in treated than untreated plots in

9. Threat: Invasive and other problematic species
230
19 of 21 comparisons (for which treated: 2–5 species/0.25 m2; untreated: 2 species/0.25 m2). Treated plots also had greater cover of unplanted native species in 17 of 21 comparisons (for which treated: 8–57%; untreated: 3–21%) and lower cover of reed canarygrass in 21 of 21 comparisons (treated: 1–66%; untreated: 91–93%). After 2–3 growing seasons, no treatment outperformed those involving imazapyr. Plots treated with imazapyr never had lower plant species richness and unplanted native cover than plots treated with other herbicides, and never had higher cover of reed canarygrass (see original paper for data). Methods: Forty 3 x 40 m plots were established across five canarygrass-invaded wet meadows (eight plots/meadow). Between autumn 2005 and spring 2006, thirty-five plots (seven random plots/set) were mown, sprayed with herbicide (seven chemical x timing combinations), and planted with 14 native upland species. Subsequent targeted mowing of “noxious weeds” was also carried out. The study does not distinguish between the effects of these interventions. Vegetation was surveyed at the end of each growing season 2006–2008, in nine 0.25-m2 quadrats/plot.
A replicated, controlled, before-and-after study in 2013–2014 in eight artificial marshes invaded by hybrid cattail Typha x glauca in Michigan, USA (15) found that applying herbicide to the vegetation reduced native plant richness, density and biomass. After one year, there were no living plants in marshes treated with herbicide: richness, density and biomass, of both native plants and hybrid cattail, were zero. All metrics were significantly lower than in untreated marshes (where native richness: 4.5 species/2 m2; native density: 300 stems/m2; native biomass: 440 g/m2; cattail density: 44 stems/m2; cattail biomass: 745 g/m2). Results were generally similar after one month, although native plant richness had not yet declined in treated marshes (see original paper). Before treatment, vegetation was statistically similar in all marshes (native plant richness: 3.5–4.3 species/2 m2; native plant density: 190–230 stems/m2; native plant biomass: 350–430 g/m2; cattail density: 66–69 stems/m2; cattail biomass: 1,080–1,130 g/m2). Methods: In July 2013, glyphosate-based herbicide was spread onto all plant stems in four experimental marshes (1 x 2 m area, 1 m soil depth). The marshes had been created in 2002 and planted with cattail (i.e. deliberately invaded) in 2004. Four additional marshes were left untreated. Plant species, density and height were recorded in all marshes immediately before, one month after and one year after treatment. Dry above-ground biomass was calculated from height measurements.
A before-and-after study in 2006–2010 of a floodplain wetland invaded by limpo grass Hemarthria altissima in Florida, USA (16a) reported that over the four years after applying herbicide, cover of wet-prairie indicator species and total plant species richness were typically higher than before intervention. Statistical significance was not assessed. In the spring before applying herbicide, the wetland had 96% limpo grass cover and <1% cover of native wet-prairie indicator species. There were 3 plant species/100 m2. Between one and four years after applying herbicide, limpo grass cover ranged from 2% to 22%. Indicator species cover ranged from 1% to 13%. There were between 13 and 30 plant species/100 m2. Methods: In May 2006, glyphosate herbicide was applied to 6 ha of a recently rewetted, limpo-grass-invaded floodplain. Plant species and their cover were surveyed in twelve 100-m2 plots, before intervention (spring 2006) and for approximately four years after (spring 2007–summer 2010). This study was in the same area as (16b), but used a different plot.
A replicated, before-and-after, site comparison study in 2007–2010 of floodplain wet prairies invaded by limpo grass Hemarthria altissima in Florida, USA (16b)

9. Threat: Invasive and other problematic species
231
reported that applying herbicide reduced limpo grass cover and maintained cover of other wetland-characteristic herbs in some plots 2–3 years later, but failed to do so in others. Statistical significance was not assessed. In three of seven treated plots, applying herbicide reduced limpo grass cover (before: 47%; 2–3 years after: 4%). Cover of other wetland-characteristic herbs was similar before (21%) and after (18%) applying herbicide. In the other four of seven treated plots, applying herbicide failed to prevent an increase in limpo grass cover 2–3 years later (before: 47%; 2–3 years after: 59%). Meanwhile, cover of other wetland-characteristic herbs declined (before: 21%; after: 10%). Nearby untreated plots were always dominated by wetland-characteristic herbs (before: 54%; after: 43%) with little limpo grass cover (before: 5%; after: 1%). Across all seven treated plots, three key metrics increased over time after herbicide application, reaching similar or higher levels three years after intervention than before: cover of native wet-prairie indicator species (before: 2–5%; after: 9%), total vegetation cover (before: >80%; after: >80%), and total plant species richness (before: 13–17; after: 23 species/100 m2). Methods: Eighteen 100-m2 plots were established in wet prairies on a recently rewetted floodplain, with varying limpo grass cover. In autumn 2007, glyphosate herbicide was applied to seven plots with the greatest limpo grass cover. Plant species and their cover were surveyed in all 18 plots, before intervention (spring 2006–summer 2007) and for approximately three years after (spring 2008–summer 2010). This study was in the same area as (16a), but used different plots.
(1) Gabor T.S., Haagsma T. & Murkin H.R. (1996) Wetland plant responses to varying degrees of purple loosestrife removal in southeastern Ontario, Canada. Wetlands, 16, 95–98.
(2) Linz G.M., Blixt D.C., Bergman D.L. & Bleier W.J. (1996) Response of ducks to glyphosate-induced habitat alterations in wetlands. Wetlands, 16, 38–44.
(3) Linz G.M., Blixt D.C., Bergman D.L. & Bleier W.J. (1996) Response of red-winged blackbirds, yellow-headed blackbirds and marsh wrens to glyphosate-induced habitat alterations in wetlands. Journal of Field Ornithology, 67, 167–176.
(4) Farnsworth E.J. & Meyerson L.A. (1999) Species composition and inter-annual dynamics of a freshwater tidal plant community following removal of the invasive grass, Phragmites australis. Biological Invasions, 1, 115–127.
(5) Morrison J.A. (2002) Wetland vegetation before and after experimental purple loosestrife removal. Wetlands, 22, 159–169.
(6) Paynter Q. (2004) Revegetation of a wetland following control of the invasive woody weed, Mimosa pigra, in the Northern Territory, Australia. Environmental Management and Restoration, 5, 191–198.
(7) Paynter Q. & Flanagan G.J. (2004) Integrating herbicide and mechanical control treatments with fire and biological control to manage an invasive wetland shrub, Mimosa pigra. Journal of Applied Ecology, 41, 615–629.
(8) López Rosas H., Moreno-Casasola P. & Mendelssohn I.A. (2006) Effects of experimental disturbances on a tropical freshwater marsh invaded by the African grass Echinochloa pyramidalis. Wetlands, 26, 593–604.
(9) Reinhardt Adams C. & Galatowitsch S.M. (2006) Increasing the effectiveness of reed canary grass (Phalaris arundinacea L.) control in wet meadow restorations. Restoration Ecology, 14, 441–451.
(10) Allen S.L., Hepp G.R. & Miller J.H. (2007) Use of herbicides to control alligatorweed and restore native plants in managed marshes. Wetlands, 27, 739–748.
(11) Smith P.H. & Kimpton A. (2008) Effects of grey willow Salix cinerea removal on the floristic diversity of a wet dune-slack at Cabin Hill National Nature Reserve on the Sefton Coast, Merseyside, England. Conservation Evidence, 5, 6–11.
(12) Hall S.J. & Zedler J.B. (2010) Constraints on sedge meadow self-restoration in urban wetlands. Restoration Ecology, 18, 671–680.
(13) Back C.L., Holomuzki J.R., Klarer D.M. & Whyte R.S. (2012) Herbiciding invasive reed: indirect effects on habitat conditions and snail-algal assemblages one year post-application. Wetlands Ecology and Management, 20, 419–431.
(14) Bahm M.A., Barnes T.G. & Jensen K.C. (2014) Evaluation of herbicides for control of reed canarygrass (Phalaris arundinacea). Natural Areas Journal, 34, 459–464.

9. Threat: Invasive and other problematic species
232
(15) Lawrence B.A., Lishawa S.C., Rodriguez Y. & Tuchman N.C. (2016) Herbicide management of invasive cattail (Typha x glauca) increases porewater nutrient concentrations. Wetlands Ecology and Management, 24, 457–467.
(16) Toth L.A. (2016) Cover thresholds for impacts of an exotic grass on the structure and assembly of a wet prairie community. Wetlands Ecology and Management, 24, 61–72.
9.12.2 Use herbicide to control problematic plants: brackish/salt
marshes
Seven studies evaluated the effects, on vegetation, of using herbicide to control problematic plants in brackish/salt marshes. Six studies were in the USA1,2a,2b,3,5,6. One study was in South Africa4. Two studies2a,2b shared part of the same experimental set-up.
VEGETATION COMMUNITY
Relative abundance (1 study): One site comparison study of brackish marshes in the USA1 found that a marsh sprayed with herbicide for nine years (and burned for three) and a nearby natural marsh supported a similar relative abundance of the dominant plant species, smooth cordgrass Spartina alterniflora.
Overall richness/diversity (1 study): One site comparison study of brackish marshes in the USA1 reported that a marsh sprayed with herbicide for nine years (and burned for three) contained more plant species than an unburned and unsprayed marsh – but also more plant species than a nearby natural marsh.
Native/non-target richness/diversity (2 studies): One replicated, randomized, paired, controlled, before-and-after study in a pepperweed-invaded marsh in the USA3 found that applying herbicide did not increase the richness of non-pepperweed species over two years after intervention. The precise effect depended on the herbicide used. One study of an intertidal area in the USA6 simply counted the number of native salt marsh plant species that colonized after treating smooth cordgrass Spartina alterniflora stands with herbicide.
VEGETATION ABUNDANCE
Native/non-target abundance (5 studies): Three replicated, randomized, paired, controlled, before-and-after studies in pepperweed-invaded marshes in the USA2a,2b,3 found that applying herbicide typically did not increase cover of non-pepperweed vegetation, in the two years following intervention. The precise effect depended on the herbicide used. Two studies on the coasts of South Africa4 and the USA6 simply quantified the abundance of native salt marsh vegetation that colonized after treating smooth cordgrass Spartina alterniflora stands with herbicide.
Individual species abundance (4 studies): Four studies1,2a,5,6 quantified the effect of this intervention on the abundance of individual plant species other than the species being controlled. For example, one site comparison study of brackish marshes in the USA1 reported that a marsh sprayed with herbicide for nine years (and burned for three) contained more smooth cordgrass Spartina alterniflora than an unburned and unsprayed marsh, and a similar amount of smooth cordgrass to a nearby natural marsh. One replicated, paired, controlled, before-and-after study in a pepperweed-invaded marsh in the USA5 reported that applying herbicide typically reduced cover of dominant native species over two years. The precise effect depended on the herbicide used.
VEGETATION STRUCTURE
Height (1 study): One site comparison study of brackish marshes in the USA1 found that in a marsh sprayed with herbicide for nine years (and burned for three), the dominant plant species (smooth cordgrass Spartina alterniflora) grew to a similar height as in a nearby natural marsh.

9. Threat: Invasive and other problematic species
233
A site comparison study in 2004 of three brackish marshes in an estuary in New Jersey, USA (1) found that spraying herbicide (along with prescribed burning) converted a marsh dominated by common reed Phragmites australis to one dominated by smooth cordgrass Spartina alterniflora, with similar cordgrass abundance and height to a natural marsh, but more plant species. After nine years of herbicide application and three years of burning, the treated marsh was statistically similar to a nearby natural marsh in terms of cordgrass dominance (treated: 78%; natural: 83% of stems were smooth cordgrass), cordgrass density (treated: 286; natural: 360 stems/m2), above-ground cordgrass biomass (treated: 457; natural: 802 g/m2) and cordgrass height (treated: 78; natural: 94 cm). However, the treated marsh contained six plant species, including common reed, whilst the natural marsh contained only three. A third, untreated marsh was still dominated by common reed (100% of stems; density: 80 stems/m2; biomass: 2,124 g/m2; height: 317 cm; no other plant species). Methods: In August 2004, vegetation was surveyed in three tidal brackish marshes. One marsh was formerly dominated by common reed, but had been sprayed with herbicide (Rodeo®) since 1996 and burned in 1996–1998. The study does not distinguish between the effects of these interventions. The second, natural marsh was dominated by smooth cordgrass. The third marsh was dominated by common reed and had not been treated. In each marsh, vegetation was clipped from six 0.25 x 0.25 m quadrats then identified, measured, dried and weighed.
A replicated, randomized, paired, controlled, before-and-after study in 2005–2007 in three brackish and salt marshes invaded by pepperweed Lepidium latifolium in California, USA (2a) found that plots sprayed with glyphosate herbicide typically had similar cover of native plants to unsprayed plots, over the two years following spraying. In most comparisons, total native plant cover was statistically similar in sprayed and unsprayed plots: eight of nine comparisons in year one (for which sprayed: 10–50%; unsprayed: 16–45%) and six of nine comparisons in year two (for which sprayed: 19–113%; unsprayed: 23–49%). Pepperweed cover was typically lower in sprayed than unsprayed plots: in nine of nine comparisons in year one (sprayed: 2–60%; unsprayed: 89–99%) and six of nine comparisons in year two (for which sprayed: 25–78%; unsprayed: 85–100%). Before intervention, plots destined for each treatment had statistically similar cover of native plants (10–33%) and pepperweed (90–100%). For data on the cover of other individual plant species, see original paper. Methods: In April 2005, five sets of 2 x 2 m plots were established in each of three pepperweed-invaded marshes. In each set, there was one sprayed replicate (1.25% glyphosate) and one unsprayed replicate. Treatments were randomly allocated to plots. Vegetation cover was measured before (April 2005) and quarterly for two years after (April 2007) spraying, in 1-m2 quadrats. This study shared part of the experimental set-up used in (2b).
A replicated, randomized, paired, controlled, before-and-after study in 2006–2007 in two brackish and salt marshes invaded by pepperweed Lepidium latifolium in California, USA (2b) reported that spraying plots with imazapyr herbicide had no clear effect on native plant cover. Results summarized for this study are not based on assessments of statistical significance. Total native plant cover was not clearly different in the year following intervention compared to the year before intervention (data reported, but not possible to extract precise values). Pepperweed cover was only 0–10% in the year following intervention, compared to 89–100% in the year before and 85–94% in unsprayed plots. Methods: Five pairs of 2 x 2 m plots were established in each of two pepperweed-invaded marshes. In April 2006, one random

9. Threat: Invasive and other problematic species
234
plot/pair was sprayed with herbicide (0.64% imazapyr with surfactant). The other plots were not sprayed. Vegetation cover was measured quarterly for one year before and one year after spraying, in one 1-m2 quadrat/plot. This study shared part of the experimental set-up used in (2a).
A replicated, randomized, paired, controlled, before-and-after study in 2007–2009 in a brackish marsh invaded by perennial pepperweed Lepidium latifolium in California, USA (3) found that spraying the vegetation with imazapyr herbicide reduced the richness and cover of non-target vegetation over two years, but that spraying the vegetation with 2,4D had no significant effect on these metrics. After two years, imazapyr-treated plots contained only 0.5 non-pepperweed plant species/0.25 m2 (vs 2,4D: 2.0 species/0.25 m2; untreated: 2.1 species/0.25 m2) and only 7% cover of plants other than pepperweed (vs 2,4D: 70%; untreated: 66%). Imazapyr-treated plots had only 1% cover of pepperweed (vs 2,4D: 26%; untreated: 31%), and above-ground pepperweed biomass was only 7 g/m2 (vs 2,4D: 29 g/m2; untreated: 40 g/m2). The pattern of results was similar after one year, although not the values of some metrics (e.g. only 3–34% cover of plants other than pepperweed). Before intervention, plots destined for each treatment had similar non-pepperweed richness (2.0–2.6 species/plot), non-pepperweed cover (30–35%), pepperweed cover (27–39%) and pepperweed biomass (87–110 g/m2). Methods: Thirty-six plots were established (in six blocks of six) in a degraded, historically tidal, brackish marsh. In 2007 and 2008, twelve plots (two plots/block) received each of three treatments: spraying with dyed imazapyr (Habitat®), spraying with dyed 2,4D (Weedar®) or no herbicide (spraying with dyed water only). Vegetation was surveyed in April before (2007) and after (2008, 2009) intervention. Plant species and cover were recorded in three 0.25-m2 quadrats/plot. Pepperweed was cut from three 0.125-m2 quadrats/plot then dried and weighed.
A before-and-after study in 2009–2015 in an estuary in South Africa (4) reported that within three years of spraying invasive smooth cordgrass Spartina alterniflora with herbicide, native salt marsh plants had colonized. Herbicide application began in 2011. In October 2014, the first seedlings of native salt marsh plants appeared. In November 2015, 49 of 60 former cordgrass patches contained native salt marsh plants with up to 95% total cover. The total area of smooth cordgrass in the estuary was 10,221 m2 in 2011, then only 10 m2 in 2015. The above-ground biomass of smooth cordgrass within patches was 933 g/m2 in 2009, then only 240 g/m2 in 2015. Methods: From 2011, smooth cordgrass in the Great Brak Estuary was sprayed with herbicide. Intense treatments began in January 2013, with 2–3 applications each summer of glyphosate (10 kg/ha) and 0.5% imazapyr (100 g/L). Before 2014, herbicide was broadcast over cordgrass patches. From 2014, herbicide was applied to individual cordgrass plants. Between 2009 and 2015, cordgrass patches were mapped. Vegetation was also surveyed in living (pre-treatment) or dead (post-treatment) cordgrass patches (details not clearly reported for all surveys). Biomass was dried before weighing.
A replicated, paired, controlled, before-and-after study in 2007–2009 in a brackish marsh invaded by perennial pepperweed Lepidium latifolium in California, USA (5) reported that spraying the vegetation with herbicide typically reduced native plant cover. Results summarized for this study are not based on assessments of statistical significance. Over two years, cover of the two dominant native species (Pacific pickleweed Sarcocornia pacifica and alkali heath Frankenia salinia) declined in sprayed plots in 8 of 12 cases (from 5–85% before intervention to 0–45% after two

9. Threat: Invasive and other problematic species
235
years) but was stable or increased in unsprayed plots in six of six cases (before: 12–67%; after: 24–70%). Cover increased in only one of the remaining cases in sprayed plots (from 17% to 45%). The size and direction of the effect of on native cover depended on the species, herbicide composition and location within the marsh (see original paper). The number of pepperweed stems decreased in plots treated with herbicide (from 21–36 stems/m2 before intervention to <1 stem/m2 after two years) compared to an increase in untreated plots (from 27 stems/m2 to 32 stems/m2). Methods: Thirty-six 16-m2 plots were established in a pepperweed-invaded brackish marsh. In May 2007 and 2008, twenty-one plots were sprayed with herbicide: 10 with imazapyr (Habitat®) and 11 with mixed imazapyr and glyphosate (Rodeo®). Fifteen plots were not sprayed, but pepperweed flowerheads were removed. In May 2007–2009, vegetation was surveyed in the central 1 m2 of each plot.
One study in 2003–2015 of an intertidal area invaded by smooth cordgrass Spartina alterniflora in Washington, USA (6) reported that after treating smooth cordgrass with herbicide, native salt marsh vegetation developed. One year after herbicide treatment began, three salt marsh plant species were present: glasswort Salicornia pacifica, Canadian sandspurry Spergularia canadensis and arrowgrass Triglochin maritimum (see original paper for frequency and cover data). After 12 years, three additional species were present. Saltgrass Distichlis spicata was the most abundant species (both frequency and cover) at high elevations, next to an existing salt marsh. Total native species cover reached 100% at these high elevations. Methods: Smooth cordgrass was controlled in a 300-ha cordgrass meadow that had developed on intertidal mudflats. Between 2003 and 2005, the meadow was sprayed with herbicide (1.7 kg/ha imazapyr). In subsequent years, remaining cordgrass plants were spot-treated (2% glyphosate, 0.75% imazapyr). Vegetation was surveyed between 2004 and 2015: approximately 300 quadrats/year, along sixteen 600-m transects extending seawards from the edge of an existing salt marsh.
(1) Hagan S.M., Brown S.A. & Able K.W. (2007) Production of mummichog (Fundulus hereroclitus): response in marshes treated for common reed (Phragmites australis) removal. Wetlands, 27, 54–67.
(2) Boyer K.E. & Burdick A.P. (2010) Control of Lepidium latifolium (perennial pepperweed) and recovery of native plants in tidal marshes of the San Francisco Estuary. Wetlands Ecology and Management, 18, 731–743.
(3) Whitcraft C.R. & Grewell B.J. (2012) Evaluation of perennial pepperweed (Lepidium latifolium) management in a seasonal wetland in San Francisco Estuary prior to restoration of tidal hydrology. Wetlands Ecology and Management, 20, 35–45.
(4) Riddin T., van Wyk E. & Adams J. (2016) The rise and fall of an invasive estuarine grass. South African Journal of Botany, 107, 74-79.
(5) Tobias V.D., Block G. & Laca E.A. (2016) Controlling perennial pepperweed (Lepidium latifolium) in a brackish tidal marsh. Wetlands Ecology and Management, 24, 411–418.
(6) Patten K., O'Casey C. & Metzger C. (2017) Large-scale chemical control of smooth cordgrass (Spartina alterniflora) in Willapa Bay, WA: towards eradication and ecological restoration. Invasive Plant Science and Management, 10, 284–292.
9.12.3 Use herbicide to control problematic plants: freshwater swamps
Four studies evaluated the effects, on vegetation, of using herbicide to control problematic plants in freshwater swamps. All four studies were in the USA.
VEGETATION COMMUNITY
Overall richness/diversity (2 studies): One replicated, randomized, paired, controlled study aiming to restore canarygrass-invaded swamps in the USA1 found that plots sprayed with herbicide

9. Threat: Invasive and other problematic species
236
typically had greater plant species richness and diversity than unsprayed plots, after 1–2 growing seasons. One replicated, randomized, controlled study in a petunia-invaded floodplain swamp in the USA4 found that plots sprayed with herbicide had similar overall plant species richness to unsprayed plots, over 15 months after spraying.
Native/non-target richness/diversity (3 studies): Three replicated, controlled studies (also paired and/or randomized) in invaded freshwater swamps in the USA1,3,4 found that applying herbicide typically had no significant effect on native plant species richness, over 3–24 months after spraying.
VEGETATION ABUNDANCE
Tree/shrub abundance (2 studies): Two replicated, controlled studies in the USA1,2 evaluated the effects, on tree/shrub abundance, of managing canarygrass-invaded vegetation by applying herbicide. One study1 found that plots sprayed with herbicide contained more non-planted tree seedlings than unsprayed plots, after 1–2 growing seasons. The other study2 found that managed plots (cut, disked and sprayed with herbicide) contained more non-planted tree seedlings than unmanaged plots, after 1–3 years.
Native/non-target abundance (2 studies): Two replicated, controlled studies in swamps in the USA2,3 reported that spraying invaded vegetation with herbicide (sometimes2 along with other interventions) typically had no clear or significant effect on native/non-target vegetation cover 1–3 years later. Cover was typically similar to unmanaged plots2 or before intervention3.
Individual species abundance (1 study): One replicated, randomized, paired, controlled study aiming to restore a canarygrass-invaded swamp in the USA1 reported that spraying the vegetation with herbicide affected the abundance of some individual plant species – other than the target problematic species – two growing seasons later.
VEGETATION STRUCTURE
A replicated, randomized, paired, controlled study in 2002–2005 aiming to restore swamps in three reed canarygrass Phalaris arundinacea stands in Wisconsin, USA (1) found that spraying the vegetation with herbicide typically increased plant species richness and diversity, and increased tree seedling density. After 1–2 growing seasons, overall plant richness was greater in sprayed than unsprayed plots in two of three comparisons (for which sprayed: 3.2–6.6; unsprayed; 1.9–2.3 species/m2; other comparison no significant difference). The same was true for overall plant diversity (data reported as a diversity index). However, native plant richness did not significantly differ between treatments in two of three comparisons (for which sprayed: 1.7–2.6; unsprayed; 1.3–2.2 species/m2; other comparison higher in sprayed plots). The density of non-planted tree seedlings was greater in sprayed plots in three of three comparisons (sprayed: 3–25; unsprayed: <1–4 seedlings/m2). For one of the three swamps, the study also reported data on the abundance of individual plant species (see original paper). Methods: Sixteen plots of varying size were established across three canarygrass-invaded wetlands. Ten plots (1–8 random plots/site) were sprayed with herbicide (Roundup®) in autumn 2002 or 2003. Six plots (1–4 random plots/site) were left unsprayed. All plots were planted with tree/shrub seedlings (roughly 1 seedling/m2) in spring 2003 or 2004. In August 2004, plant species and their cover were surveyed in ten 1-m2 quadrats/treatment/swamp, ignoring planted trees/shrubs.
A replicated, controlled study in 2006–2009 in a floodplain swamp clearing invaded by reed canarygrass Phalaris arundinacea in Wisconsin, USA (2) found that cutting, disking and applying herbicide to invaded plots increased tree seedling abundance after 1–3 years, and increased cover of herbs other than canarygrass after

9. Threat: Invasive and other problematic species
237
three years. In three of three years following intervention, treated plots contained more tree seedlings (4–44 seedlings/m2) than untreated plots (0–5 seedlings/m2). At the same time, treated plots had lower reed canarygrass cover (7–31%) than untreated plots (83–92%). Cover of herbs other than reed canarygrass did not significantly differ between treated and untreated plots in the first two years after intervention (treated: 15–47%; untreated: 16–22%), but was higher in treated than untreated plots in the third year (treated: 35–58%; untreated: 12%). Methods: In November 2006, twenty plots (roughly 810 m2) were established in a storm-created clearing within a floodplain swamp. Sixteen canarygrass-dominated plots were treated by cutting the vegetation (with a mechanical mulcher), disking the soil, and applying herbicide (four combinations of herbicide type and dose; repeated applications in summer and autumn until November 2008). The other four plots received none of these interventions. The study does not distinguish between the effects of cutting, disking and applying herbicide. Some tree species were planted and/or sown across the whole clearing. Vegetation (excluding planted trees) was surveyed in August 2007–2009, in four 2.25-m2 quadrats/plot.
A replicated, paired, controlled, before-and-after study in 2006–2008 in six freshwater swamps invaded by Old World climbing fern Lygodium microphyllum in Florida, USA (3) reported that spraying the fern with herbicide had no clear effect on native plant richness or ground cover after two years. Unless specified, statistical significance was not assessed. Before intervention, plots destined to be sprayed contained 7–10 native plant species and had 46–72% native vegetation cover (mostly ferns). After two years, they contained 8–11 native plant species and had 33–67% native vegetation cover (mostly weedy species). Meanwhile, unsprayed plots contained 9 native plant species (sprayed plots statistically similar in ≥10 of 12 comparisons both before and after) and had 93–107% native vegetation cover (sprayed plots significantly lower in ≥11 of 12 comparisons both before and after). Herbicide treatments did reduce cover of the climbing fern (e.g. sprayed plots before: 59–72%; two years after: <1–4%). Methods: In September/October 2006, thirteen 20-m2 plots were established in each of six fern-invaded swamps. Seventy-two plots were sprayed with herbicide (1 plot/swamp for each of 12 different herbicides). Initial treatment was followed up with spot-treatments every 6 months. The final six plots (1 plot/swamp) were left unsprayed. Ground-level vegetation was surveyed on a 10-m-long transect in each plot, immediately before initial spraying (September/ October 2006) and every 6 months after (until September/October 2008).
A replicated, randomized, controlled study in 2013–2014 in a floodplain swamp invaded by Mexican petunia Ruellia simplex in Florida, USA (4) found that spraying the vegetation with herbicide had no significant effect on overall plant species richness. Averaged over 3–15 months after intervention, overall plant species richness was statistically similar in sprayed plots (2.8 species/2.25 m2) and unsprayed plots (1.8 species/2.25 m2). Sprayed plots also had statistically similar Mexican petunia cover to unsprayed plots (sprayed: 55%; unsprayed: 71%), but contained fewer Mexican petunia stems (sprayed: 5–35 stems/0.56 m2; unsprayed: 23–76 stems/0.56 m2) and, after 15 months, contained less Mexican petunia above-ground biomass (sprayed: 8 g/m2; unsprayed: 15 g/m2). Methods: Fourteen 1.5 x 1.5 m plots were established in a petunia-invaded floodplain swamp. In August 2013, seven random plots were sprayed with glyphosate herbicide (AquaPro®). The other seven plots were not sprayed. Vegetation was surveyed between November 2013 and November 2014: plant species and their cover every three months (whole plot), petunia stem density every month

9. Threat: Invasive and other problematic species
238
(two 75 x 75 cm quadrats/plot), and petunia biomass in November 2014 only (vegetation cut from one 15 x 15 cm quadrat/plot, then dried and weighed).
(1) Hovick S.M. & Reinartz J.A. (2007) Restoring forest in wetlands dominated by reed canarygrass: the effects of pre-planting treatments on early survival of planted stock. Wetlands, 27, 24–39.
(2) Thomsen M., Brownell K., Groshek M. & Kirsch E. (2012) Control of reed canarygrass promotes wetland herb and tree seedling establishment in an Upper Mississippi River floodplain forest. Wetlands, 32, 543–555.
(3) Hutchinson J.T. & Langeland K.A. (2015) Response of Old World climbing fern and native vegetation to repeated ground herbicide treatments. Journal of Aquatic Plant Management, 53, 14–21.
(4) Smith A.M., Reinhardt Adams C., Wiese C. & Wilson S.B. (2016) Re-vegetation with native species does not control the invasive Ruellia simplex in a floodplain forest in Florida, USA. Applied Vegetation Science, 19, 20–30.
9.12.4 Use herbicide to control problematic plants: brackish/saline
swamps
We found no studies that evaluated the effects, on vegetation, of using herbicide to control problematic plants in brackish/saline swamps.
This means that we have not yet found any studies that have directly evaluated this intervention during our systematic journal and report searches. Therefore we have no evidence to indicate whether or not the intervention has any desirable or harmful effects.
9.13 Use covers/barriers to control problematic plants
Background
Covers such as plastic sheeting, fabric sheeting, wood chips or straw mulch could be used to control problematic plants. These may act as direct physical barriers, temporarily covering the ground or water surface to prevent seeds from settling and establishing. Barriers could also be used to modify environmental conditions to the detriment of problematic species. Shading or opaque screens can limit photosynthesis. In areas where the sun is strong, black plastic placed on the soil/sediment surface can increase temperatures to kill problematic plants and their seeds (a technique known as solarization; Katan & DeVay 1991). Covers can be anchored underwater, if necessary.
CAUTION: Covers will also affect, and may kill, desirable plant species. Temporary application, when a site is most vulnerable to invasion by problematic plants, could solve this problem. Covers may need to be punctured to allow gas to escape.
For this intervention, “vegetation” refers to overall or non-target vegetation. Studies that only report responses of target problematic plants have not been summarized.
Related interventions: Add surface mulch (12.19) or Add cover other than mulch (12.20), primarily to benefit desirable plants rather than harm problematic plants; Add surface mulch to complement planting (13.15); Add cover other than mulch to complement planting (13.16).
Katan J. & DeVay J.E. (1991) Soil solarization: historical perspectives, principles, and uses. Pages 23–37 in: J. Katan and J.E. DeVay (eds.) Soil Solarization. Boca Raton, Florida.

9. Threat: Invasive and other problematic species
239
9.13.1 Use covers/barriers to control problematic plants: freshwater
marshes
One study evaluated the effects, on vegetation, of using covers or barriers to control problematic plants in freshwater marshes. The study was in Canada.
VEGETATION COMMUNITY
VEGETATION ABUNDANCE
Overall abundance (1 study): One replicated, randomized, paired, controlled, before-and-after study in iris-invaded lakeshore marshes in Canada1 reported that covering plots with rubber sheeting after cutting back yellow iris Iris pseudacorus prevented most vegetation regrowth in an intermittently flooded marsh, but had no clear effect in a permanently flooded marsh.
VEGETATION STRUCTURE
A replicated, randomized, paired, controlled, before-and-after study in 2014–2015 in two lakeshore marshes cleared of yellow flag iris Iris pseudacorus in British Columbia, Canada (1) reported that the effect of covering plots on recolonizing vegetation depended on the water level. Statistical significance was not assessed. Initially, all study plots were completely covered by invasive yellow flag iris. This was clipped to ground level. One year later, in the intermittently flooded marsh, covered plots had approximately 7% vegetation cover (yellow flag iris seedlings and broadleaf cattail Typha latifolia; species cover not quantified). In contrast, open plots had 100% cover of yellow flag iris. Meanwhile, in the permanently flooded marsh, both covered and open plots had approximately 5% vegetation cover (yellow flag iris seedlings and broadleaf cattail; species cover not quantified). Methods: Nine pairs of plots (approximately 1 m2) were established in iris-dominated marshes on the shores of two lakes. In June 2014, yellow flag iris was cut to 0–4 cm above the sediment in all plots. Cuttings were removed. Then, one random plot/pair was covered with an impermeable rubber sheet for 150 days. Vegetation cover was surveyed in July 2015.
(1) Tarasoff C.S., Streichert K., Gardner W., Heiser B., Church J. & Pypker T.G. (2016) Assessing benthic barriers vs. aggressive cutting as effective yellow flag iris (Iris pseudacorus) control mechanisms. Invasive Plant Science and Management, 9, 229–234.
9.13.2 Use covers/barriers to control problematic plants: brackish/salt
marshes
We found no studies that evaluated the effects, on vegetation, of using covers or barriers to control problematic plants in brackish/salt marshes.
This means that we have not yet found any studies that have directly evaluated this intervention during our systematic journal and report searches. Therefore we have no evidence to indicate whether or not the intervention has any desirable or harmful effects.
9.13.3 Use covers/barriers to control problematic plants: freshwater
swamps
We found no studies that evaluated the effects, on vegetation, of using covers or barriers to control problematic plants in freshwater swamps.
This means that we have not yet found any studies that have directly evaluated this intervention during our systematic journal and report searches. Therefore we have no evidence to indicate whether or not the intervention has any desirable or harmful effects.

9. Threat: Invasive and other problematic species
240
9.13.4 Use covers/barriers to control problematic plants: brackish/saline
swamps
We found no studies that evaluated the effects, on vegetation, of using covers or barriers to control problematic plants in brackish/saline swamps.
This means that we have not yet found any studies that have directly evaluated this intervention during our systematic journal and report searches. Therefore we have no evidence to indicate whether or not the intervention has any desirable or harmful effects.
9.14 Introduce organisms to control problematic plants
Background
This intervention involves biological control: managing the abundance or distribution of problematic organisms via their enemies. Enemies of problematic plants could be disease-causing microorganisms (e.g. a virus or a fungus), insects, fish or even other plants (to compete with or parasitize problematic plants). Biological control could be particularly effective for non-native problematic plants: their success in their new range may be due to escape from natural enemies in their native range (Keane & Crawley 2002). CAUTION: Organisms introduced for biological control can themselves become problematic pests (e.g. the harlequin ladybird; Roy et al. 2016), and could damage non-target plants or restrict their establishment (Iannone & Galatowitsch 2008). Introductions should not be carried out without thorough assessment of likely negative impacts, non-target effects and effectiveness of control.
To be summarized as evidence for this intervention, studies must have successfully introduced a biocontrol agent that persisted in the environment. The agent must have been introduced with a clear aim to control problematic plants.
For this intervention, “vegetation” refers to overall or non-target vegetation. Studies that only report responses of target problematic plants have not been summarized.
Related interventions: Use grazing to control problematic plants (9.10); introduce marsh or swamp vegetation, where its primary function is not to control or compete with problematic plants (12.22–12.26).
Iannone B.V. III & Galatowitsch S.M. (2008) Altering light and soil N to limit Phalaris arundinacea reinvasion in sedge meadow restorations. Restoration Ecology, 16, 689–701.
Keane R.M. & Crawley M.J. (2002) Exotic plant invasions and the enemy release hypothesis. Trends in Ecology and Evolution, 17, 164–170.
Roy H.E., Brown P.M.J., Adriaens T. et al. (2016) The harlequin ladybird, Harmonia axyridis: global perspectives on invasion history and ecology. Biological Invasions, 18, 997–1044.
9.14.1 Introduce organisms to control problematic plants: freshwater
marshes
One study evaluated the effects, on vegetation, of introducing organisms (other than large vertebrate grazers) to control problematic plants in freshwater marshes. The study was in the USA. It involved introducing plants to compete with problematic plants.
VEGETATION COMMUNITY
Overall richness/diversity (1 study): One replicated, randomized, paired, controlled study in canarygrass-invaded wet meadows in the USA1 found that plots planted with upland vegetation

9. Threat: Invasive and other problematic species
241
(after mowing and applying herbicide) had greater overall plant species richness than untreated plots, after 1–3 growing seasons.
VEGETATION ABUNDANCE
Native/non-target abundance (1 study): One replicated, randomized, paired, controlled study in canarygrass-invaded wet meadows in the USA1 found that plots planted with upland vegetation (after mowing and applying herbicide) typically had greater cover of unplanted native vegetation than untreated plots, after 1–3 growing seasons.
VEGETATION STRUCTURE
A replicated, randomized, paired, controlled, before-and-after study in 2005–2008 in five wet meadows in South Dakota, USA (1) found that controlling problematic plants by mowing, applying herbicide and planting native upland plants increased plant species richness and cover of unplanted native species. All plots were initially dominated by reed canarygrass Phalaris arundinacea (>80% cover). After 1–3 growing seasons, plant species richness was higher in treated than untreated plots in 19 of 21 comparisons (for which treated: 2–5 species/0.25 m2; untreated: 2 species/0.25 m2). Treated plots also had greater cover of unplanted native species in 17 of 21 comparisons (for which treated: 8–57%; untreated: 3–21%) and lower cover of reed canarygrass in 21 of 21 comparisons (treated: 1–66%; untreated: 91–93%). Methods: Forty 3 x 40 m plots were established across five canarygrass-invaded wet meadows (eight plots/meadow). Between autumn 2005 and spring 2006, thirty-five plots (seven random plots/meadow) were mown, sprayed with herbicide and planted with 14 native upland grasses and forbs (2–23% cover after 1–3 growing seasons). Subsequent targeted mowing of “noxious weeds” was also carried out. The study does not distinguish between the effects of these interventions. Vegetation was surveyed at the end of each growing season 2006–2008, in nine 0.25-m2 quadrats/plot.
(1) Bahm M.A., Barnes T.G. & Jensen K.C. (2014) Evaluation of herbicides for control of reed canarygrass (Phalaris arundinacea). Natural Areas Journal, 34, 459–464.
9.14.2 Introduce organisms to control problematic plants: brackish/salt
marshes
We found no studies that evaluated the effects, on vegetation, of introducing organisms (other than large vertebrate grazers) to control problematic plants in brackish/salt marshes.
This means that we have not yet found any studies that have directly evaluated this intervention during our systematic journal and report searches. Therefore we have no evidence to indicate whether or not the intervention has any desirable or harmful effects.
9.14.3 Introduce organisms to control problematic plants: freshwater
swamps
One study evaluated the effects, on vegetation, of introducing organisms (other than large vertebrate grazers) to control problematic plants in freshwater swamps. The study was in the USA. It involved introducing plants to compete with problematic plants.
VEGETATION COMMUNITY
Overall richness/diversity (1 study): One replicated, randomized, controlled study in a petunia-invaded floodplain swamp in the USA1 found that plots planted with wetland herbs had greater overall plant species richness than unplanted plots, over the year after planting.

9. Threat: Invasive and other problematic species
242
Native/non-target richness/diversity (1 study): The same study1 found that planted plots had greater native plant species richness than unplanted plots, over the year after planting.
VEGETATION ABUNDANCE
VEGETATION STRUCTURE
A replicated, randomized, controlled study in 2013–2014 in a floodplain swamp invaded by Mexican petunia Ruellia simplex in Florida, USA (1) found that amongst plots sprayed with herbicide, planting native wetland herb species increased plant species richness. Four herb species were planted, with survival rates of 2–57% after one year. Over this year, planted plots had higher plant species richness (total: 5.2; native: 3.8 species/2.25 m2) than unplanted plots (total: 1.8; native: 0.6 species/2.25 m2). However, planted and unplanted plots contained a statistically similar amount of Mexican petunia. This was true for density (planted: 8–31 stems/0.56 m2; unplanted: 5–35 stems/0.56 m2), cover (planted: 39%; unplanted: 55%) and, after 12 months, biomass (planted: 4 g/m2; unplanted: 8 g/m2). Methods: Fourteen 1.5 x 1.5 m plots were established in a floodplain swamp, where invasive Mexican petunia had been controlled (but not eradicated) with herbicide. In November 2013, seven random plots were planted with greenhouse-reared herbs (four species; four plants/species/ plot; individual plants 30 cm apart). The other seven plots were not planted. Vegetation was surveyed for one year after planting.
(1) Smith A.M., Reinhardt Adams C., Wiese C. & Wilson S.B. (2016) Re-vegetation with native species does not control the invasive Ruellia simplex in a floodplain forest in Florida, USA. Applied Vegetation Science, 19, 20–30.
9.14.4 Introduce organisms to control problematic plants: brackish/
saline swamps
We found no studies that evaluated the effects, on vegetation, of introducing organisms (other than large vertebrate grazers) to control problematic plants in brackish/saline swamps.
This means that we have not yet found any studies that have directly evaluated this intervention during our systematic journal and report searches. Therefore we have no evidence to indicate whether or not the intervention has any desirable or harmful effects.
Problematic animals
9.15 Exclude wild vertebrates using physical barriers
Background
Important wild vertebrates in marshes and swamps include mammals (e.g. deer, rabbits, hares, kangaroos, feral horses, feral pigs), birds (e.g. ducks, geese, swans), reptiles (e.g. turtles) and fish (e.g. carp). These animals can damage vegetation directly by eating it. They can also affect vegetation indirectly, for example by trampling, creating trails, digging, burrowing or defecation (Fuller 1985). Wild vertebrates could be physically excluded from pristine sites to prevent damage, or from degraded sites to let them recover.

9. Threat: Invasive and other problematic species
243
CAUTION: Disturbance from animals may be desirable in some habitats. It can help to control undesirable vegetation and maintain species richness or open water patches (e.g. Smith et al. 2012). Fences or cages can be expensive and require ongoing maintenance.
Although studies often intend to exclude a particular problematic species, other animals of a similar size will incidentally be excluded. Smaller animals such as insects can usually still access vertebrate exclusion plots. The benefits of this intervention may be highly dependent on the type/size of fencing used, and the abundance of problematic animals in the study site.
Related interventions: Use barriers to keep livestock off ungrazed marshes or swamps (3.8); Exclude or remove livestock from historically grazed marshes or swamps (3.9); Exclude wild invertebrates using physical barriers (9.17); Use fences or barriers to protect planted areas (13.19).
Fuller D.A., Sasser C.E., Johnson W.B. & Gosselink J.G. (1985) The effects of herbivory on vegetation on islands in Atchafalaya Bay, Louisiana. Wetlands, 4, 105–114.
Smith A.N., Vernes K.A. & Ford H.A. (2012) Grazing effects of black swans Cygnus atratus (Latham) on a seasonally flooded coastal wetland of eastern Australia. Hydrobiologia, 697, 45–57.
9.15.1 Exclude wild vertebrates: freshwater marshes
Twelve studies evaluated the effects, on vegetation, of physically excluding wild vertebrates from freshwater marshes. Six studies were in the USA1,2,4,5,8,11. Three studies were in the Netherlands3,6,12, two were in Australia9,10 and one was in Canada7. The problematic vertebrates were birds in five studies3,5,6,9,11, mammals in four studies1,2,4,10, fish in one study7, and mixed taxa in two studies8,12. Two studies2,4 were conducted in the same area, but with different experimental set-ups.
VEGETATION COMMUNITY
Overall extent (1 study): One before-and-after study in a freshwater marsh in Canada7 found that after two years of excluding common carp Cyprinus carpio, the area of emergent vegetation was similar to the area expected based on the water level and historical data (when carp were present).
Community composition (1 study): One replicated, randomized, paired, controlled study in freshwater marshes in Australia10 found that areas fenced to exclude wild mammals typically had a similar overall plant community composition to open areas, over 14 years.
Overall richness/diversity (4 studies): Three replicated, randomized, paired, controlled studies in freshwater marshes in the USA2,4 and Australia10 reported that fencing to exclude wild mammals had no clear or significant effect on total plant species richness. One replicated, paired, controlled study in freshwater marshes in the Netherlands12 found that fenced plots had higher emergent plant species richness than open plots, but similar diversity.
VEGETATION ABUNDANCE
Overall abundance (7 studies): Seven replicated, controlled studies (three also randomized and paired) involving freshwater marshes in the USA1,2,4,5, the Netherlands6,12 and Australia10 found that areas fenced to exclude wild vertebrates contained at least as much vegetation as open areas – and typically more. This was true for biomass (fenced > open in six1,2,4,6,10,12 of six studies), cover (fenced > open in two5,12 of two studies) and stem density (fenced similar to open in one1 of one studies). Vegetation was monitored over the winter immediately after fencing5, or after 1–4 growing seasons1,2,4,6,10,12.

9. Threat: Invasive and other problematic species
244
Individual species abundance (8 studies): Eight studies1–4,8–11 quantified the effect of this intervention on the abundance of individual plant species. For example, seven replicated, controlled studies (four also paired, two also randomized) in freshwater marshes in the USA1,2,4,8,11, the Netherlands3 and Australia9 found that dominant plant species had similar or greater abundance in areas fenced to exclude wild vertebrates, after 1–3 growing seasons, than in areas open to wild vertebrates. The dominant species included switchgrass Panicum virgatum2,4, cordgrasses Spartina spp.2,4 and wild rice Zizania aquatica8,11.
VEGETATION STRUCTURE
Height (1 study): One replicated, paired, controlled study in freshwater marshes in the USA11 found that plots fenced to exclude Canada geese Branta canadensis contained taller wild rice Zizania aquatica than open plots in two of three comparisons. In the other comparison, after two years of goose control, fenced and open plots contained wild rice of a similar height.
A replicated, controlled study in 1980–1981 in a freshwater marsh in Louisiana, USA (1) found that plots fenced to exclude wild rodents contained more vegetation biomass than plots that remained open to grazing, but had a similar vegetation density. After both one and two growing seasons, fenced plots contained more live, above-ground vegetation biomass (242–312 g/ m2) than open plots (117–187 g/m2). The same was true for live biomass of the two most common species in the marsh: broadleaf arrowhead Sagittaria latifolia (fenced: 172; open: 106 g/m2) and valley redstem Ammania coccinea (fenced: 43; open: 10 g/m2) and for dead biomass (fenced: 281–348; open: 145–204 g/m2). However, the density of live plant stems did not significantly differ between fenced (291–396 stems/m2) and open plots (265–481 stems/m2). Methods: In March 1980, ten 1-m2 plots in a freshwater marsh were fenced (2 x 4 cm wire mesh) to exclude nutria Myocastor coypus and muskrat Ondatra zibethicus. Waterbirds could access all plots. In October 1980 and 1981, vegetation was sampled (cut, counted, dried and weighed) in each plot and 10 adjacent plots that were left open to herbivores.
A replicated, randomized, paired, controlled study in 1991 in a freshwater marsh in Louisiana, USA (2) reported that plots fenced to exclude nutria Myocastor coypus contained more overall vegetation biomass than plots that remained open to grazing, but had similar plant species richness. Statistical significance was not assessed. After two growing seasons, above-ground vegetation biomass was 1,600 g/m2 in fenced plots, compared to 1,270 g/m2 in open plots. However, fenced and open plots contained a statistically similar biomass of the dominant plant species: switchgrass Panicum virgatum (fenced: 771; open: 517 g/m2) and big cordgrass Spartina cynosuroides (fenced: 381; open: 355 g/m2). Fenced plots contained 12.3 plant species/m2, compared to 12.7 plant species/m2 in open plots. Methods: In March 1990, twelve 4-m2 plots were established (in three sets of four) in a freshwater marsh. Six of the plots (two random plots/set) were fenced (2.5 cm plastic-coated mesh) to exclude nutria (and other large mammals). The other six plots were left open. In September 1991, all vegetation was cut from one 1-m2 quadrat/plot. Plant species were identified, then the vegetation was dried and weighed. This study was in the same area as (4), but used a different experimental set-up.
A replicated, controlled study in 1990–1991 in a freshwater marsh in the Netherlands (3) reported that fencing to exclude waterfowl maintained the density and biomass of lakeshore bulrush Scirpus lacustris ssp. lacustris over one growing season, but did not affect vegetation recovery over a second growing season. Statistical significance was not assessed. Over the first growing season, fenced plots

9. Threat: Invasive and other problematic species
245
contained more bulrush (density: 165–360 shoots/m2; above-ground biomass: 800–1,150 g/m2) than plots open to summer grazing (density: 70–225 shoots/m2; above-ground biomass: 200–510 g/m2). Over the second growing season, all plots were fenced and recovered to have similar bulrush density (315–450 g/m2) and above-ground biomass (1,210–1,480 g/m2) by late summer. Methods: The study used twelve 6-m2, tidal, lakeshore plots with 3-year-old bulrush stands. Four plots were fenced (12 cm wire mesh) in spring 1990 to protect them from further waterfowl grazing. The other eight plots were left open to one or two grazing events in summer 1990. All plots were fenced from autumn 1990. Bulrush shoots were counted and measured throughout the 1990 and 1991 growing seasons. Above-ground dry biomass was estimated from length-mass relationships.
A replicated, randomized, paired, controlled, before-and-after study in 1992–1994 in a freshwater marsh in Louisiana, USA (4) found that fencing to exclude wild mammals increased overall vegetation biomass, but had mixed effects on the cover of dominant plant species and no significant effect on plant species richness. After two years, above-ground vegetation biomass was higher in fenced plots (960–2,080 g/m2) than in plots that remained open to grazing (780–920 g/m2). Fenced plots also had greater cover of switchgrass Panicum virgatum than open plots (fenced: 54–68%; open: 30–51%), but statistically similar cover of saltmeadow cordgrass Spartina patens (fenced: 31–78%; open: 56–71%). Fencing had no significant effect on plant species richness, with statistically similar changes in fenced plots (increase of 0–2.4 species/m2 over two years) and open plots (increase of 1.8 species/m2 over two years). Methods: In autumn 1992, ten pairs of 4-m2 plots were established in a freshwater marsh. Ten plots (one random plot/pair) were fenced (5 cm wire mesh with hooks to prevent burrowing) to exclude nutria Myocastor coypus and wild boar Sus scrofa (and other large mammals). The other 10 plots were not fenced. Half of the plots under each treatment were also burned in autumn 1992 and 1993. Plant species and cover were recorded in autumn 1992 (before intervention) and 1994. Vegetation was cut from one 0.25-m2 quadrat/plot, then dried and weighed, in autumn 1994. This study was in the same area as (2), but used a different experimental set-up.
A replicated, paired, controlled study in 1996–1997 in four freshwater and brackish marshes in Delaware, USA (5) reported that plots fenced to exclude snow geese Chen caerulescens had greater vegetation cover (15–57%) than plots grazed by geese (<1–11%). Statistical significance was not assessed. Methods: In September–October 1996, sixteen goose exclosures were established across four impounded marshes with fresh or “slightly” brackish water. The study does not separate results for each marsh type. There were four exclosures/marsh. Exclosures were 1.2 x 1.2 m, fenced with 1.5 x 1.5 cm plastic mesh and topped with bright plastic strips to prevent snow geese from landing. Over winter 1996/1997, total vegetation cover was estimated in the 16 exclosures and 16 adjacent plots open to, and grazed by, snow geese.
A replicated, controlled study in 1995–1998 on the shore of a freshwater lake in the Netherlands (6) reported that areas fenced to exclude waterbirds contained more emergent vegetation biomass, over three years, than plots left open to grazing. In three of three years, the total above-ground biomass of tall emergent vegetation was greater in fenced than open areas (data reported graphically). This was driven by herbivory in shallow water: the maximum biomass in deeper water was actually slightly lower in fenced plots than open plots (e.g. after three years, fenced: 520 g/m2; open: 630 g/m2). Methods: The study used a 3-ha area of the shoreline of Lake

9. Threat: Invasive and other problematic species
246
Volkerak-Zoommeer, where tall emergent vegetation was developing following experimental drawdowns and floods (beginning in spring 1995). Parts of the study area were fenced to exclude waterbirds (2-m-high fence with ropes above) and parts were left open. Each summer between 1995 and 1998, above-ground biomass was sampled in transects in the fenced and open areas. The study does not report further details of the experimental set-up or sampling methods.
A before-and-after study in 1934–1999 of a freshwater marsh in Ontario, Canada (7) found that excluding common carp Cyprinus carpio had no significant effect on the area covered by emergent vegetation. Two years after carp exclusion, the area covered by emergent vegetation (19% of the marsh) did not significantly differ from expected coverage given the water level at the time (23–28%). Methods: From spring 1997, a barrier system was used to prevent large carp (>40 cm long) from migrating into the marsh from the adjacent lake. The area of emergent vegetation across the marsh before (1934–1990) and after (1999) carp exclusion was obtained from previously published data (based on aerial photographs or field surveys). Carp had been introduced in 1908. The relationship between emergent vegetation coverage and water level before exclusion was used to determine the expected coverage based on the water level after exclusion. Note that other restoration interventions had been carried out since 1992 (sewage management, watershed land management, planting vegetation; see Smith et al. 2001).
A replicated, paired, controlled study in 1999 in a tidal freshwater marsh in Maryland, USA (8) found that plots from which large vertebrates were excluded developed a greater density of wild rice Zizania aquatica than exposed plots. After one growing season, exclusion plots contained more wild rice plants on average (97 plants/m2; 105 flowering stalks/m2) than adjacent open plots (3 plants/m2; 0 flowering stalks/m2). The mesh size of exclosures had no significant effect on the density of wild rice plants or flowering stalks, plots enclosed by a smaller mesh supported taller and thicker wild rice shoots (see original paper for data; height and stem diameter only reported for exclosures). Methods: In April 1999, twenty-four 1-m2 plots were established (in six sets of four) in a marsh with naturally germinating wild rice. Eighteen of the plots (three plots/set) were fenced with 1.5-m-tall wire mesh to exclude vertebrates (birds, mammals, large turtles and fish). Six fences (one plot/set) had each of three mesh sizes: small (1.3 x 1.3 cm), medium (2.5 x 2.5 cm) or large (5.1 x 10.2 cm). The other six plots (one plot/set) were left open to all animals. The study reported intense grazing by Canada geese Branta canadensis in these open plots, and that sediment was trapped by the fences (especially those with small mesh). After one growing season, all rice plants were counted in each plot and 10 rice plants/plot were measured.
A replicated, controlled study in 2007 in a freshwater marsh in New South Wales, Australia (9) found that plots fenced to exclude black swans Cygnus atratus contained a greater biomass and density of dominant spikesedge Eleocharis equisetina, than plots left open to swans. After 20 weeks, fenced plots contained more spikesedge biomass (above-water: 540 g/m2; above-sediment: 1,200 g/m2) than open plots (above-water: 3 g/m2; above-sediment: 580 g/m2). Fenced plots contained 64–130 spikesedge stems/m2 compared to 1–15 spikesedge stems/m2 in open plots (statistical significance not assessed). Methods: In February 2007, ten 4-m2 plots in a freshwater marsh (occasionally brackish) were fenced (5 cm wire mesh) to exclude black swans. The whole study area was also fenced to exclude cattle. Vegetation was sampled in the 10 swan exclosures, and five nearby plots grazed by swans, until July

9. Threat: Invasive and other problematic species
247
2007. Emergent spikesedge stems were counted. All spikesedge material above the sediment was cut, dried and weighed. This summary does not include data (a) for five open plots that were not grazed by swans in 2007, and (b) for exclosures after July, because some exclosures were corroded and grazed by swans.
A replicated, randomized, paired, controlled study in 1994–2008 in three floodplain marshes in New South Wales, Australia (10) found that plots fenced to exclude wild mammals typically contained more plant biomass than plots that remained open to mammals, but typically had a similar plant community composition and species richness. After four years, fenced plots contained more live, above-ground plant biomass than open plots in two of three marshes (for which fenced: 1,640–2,420 g/m2; open: 930–1,300 g/m2). There was no significant difference in the other marsh (for which fenced: 850 g/m2; open: 630 g/m2). The overall plant community composition was statistically similar in fenced and open plots in at least 33 of 35 comparisons over 14 years (data reported as graphical analyses). In all 35 comparisons, fenced plots had similar plant species richness to open plots (fenced: 2–20 species/m2; open: 3–19 species/m2). The study also reported data on the cover of individual plant species (see original paper). Methods: In early 1994, twelve pairs of 25 x 25 m plots were established across three historically grazed floodplain marshes (four pairs/marsh). In each pair, one random plot was fenced to exclude wild mammals (native marsupials and feral pigs/rabbits). The other plots were left open. Domestic cattle were excluded from all 24 experimental plots. In 1994–1998 (a wetter period) and 2007–2008 (a drier period), plant species and cover were recorded in ten 1-m2 quadrats/plot. In May 1998, live above-ground vegetation was collected from two 0.25-m2 quadrats/plot, then dried and weighed.
A replicated, paired, controlled study in 2000–2002 in tidal, freshwater marshes along a river in New Jersey, USA (11) reported that plots fenced to exclude Canada geese Branta canadensis contained more, taller wild rice Zizania aquatica plants than plots exposed to intense goose grazing, although these effects typically disappeared after geese were controlled. In the first year of the study, with a large and uncontrolled goose population, wild rice plants were more abundant and taller in goose exclosures (70 plants/m2, 241 cm tall) than in plots open to geese (15 plants/m2, 200 cm tall). In the following two years, when the goose population was controlled, differences between exclosure and open plots were typically eliminated (and if not, reduced in magnitude). Exclosure and open plots contained a statistically similar density of wild rice in two of two years with goose control (fenced: 60–68 plants/m2; open: 55–58 plants/m2), and contained wild rice of a statistically similar height in one of two years with goose control (for which fenced: 208 cm; open: 212 cm). Methods: Each April between 2000 and 2002, 17–22 pairs of 1-m2 plots were established on tidal freshwater marshes along the lower Maurice River. In each pair, one plot was fenced to exclude geese (5–10 cm wire mesh, 1.5 m high) whilst the other was left open. In 2001 and 2002, the local goose population was reduced by killing and scaring. Wild rice was counted (all plants in each plot) and measured (10 plants in centre of each plot) in autumn each year.
A replicated, paired, controlled study in ten freshwater wetlands in the Netherlands (12) found that plots fenced to exclude wild waterbirds and rodents contained more, and richer but not more diverse, emergent vegetation than plots that remained open to grazing. In both the first and second growing season after intervention, fenced plots had higher emergent vegetation cover (47–62%) than open plots (34–36%). Cover also increased significantly more over time in the fenced plots.

9. Threat: Invasive and other problematic species
248
In both growing seasons, fenced plots had higher emergent plant species richness than open plots, but statistically similar emergent plant diversity (data not reported). In the first growing season, fenced plots contained more above-ground vegetation biomass, in both permanently flooded areas (fenced: 1,220; open: 790 g/m2) and saturated areas (fenced: 320; open: 180 g/m2). In the second growing season, emergent vegetation extended further into the water in fenced plots (fenced: 490 cm; open: 360 cm). Methods: In March 2011, fifty pairs of 3 x 6 m plots were established at the margins of 10 wetlands. Each plot contained emergent vegetation and open water. One plot in each pair was fenced (chicken wire sides, additional wire on top) to exclude large animals (waterbirds and muskrats Ondatra zibethicus). Plant species and their cover were recorded in a 6-m-long transect crossing each plot in July 2011 and 2012. All vegetation was cut, dried and weighed from two 0.2-m2 quadrats/plot in August 2011.
(1) Fuller D.A., Sasser C.E., Johnson W.B. & Gosselink J.G. (1985) The effects of herbivory on vegetation on islands in Atchafalaya Bay, Louisiana. Wetlands, 4, 105–114.
(2) Taylor K.L. & Grace J.B. (1995) The effects of vertebrate herbivory on plant community structure in the coastal marshes of the Pearl River, Louisiana, USA. Wetlands, 15, 68–73.
(3) Clevering O.A. & van Gulik W.M.G. (1997) Restoration of Scirpus lacustris and Scirpus maritimus stands in a former tidal area. Aquatic Botany, 55, 229–246.
(4) Ford M.A. & Grace J.B. (1998) The interactive effects of fire and herbivory on a coastal marsh in Louisiana. Wetlands, 18, 1–8.
(5) Sherfy M.H. & Kirkpatrick R.L. (2003) Invertebrate response to snow goose herbivory on moist-soil vegetation. Wetlands, 23, 236–249.
(6) Coops H., Vulink J.T. & van Nes E.H. (2004) Managed water levels and the expansion of emergent vegetation along a lakeshore. Limnologica, 34, 57–64.
(7) Chow-Fraser P. (2005) Ecosystem response to changes in water level of Lake Ontario marshes: lessons from the restoration of Cootes Paradise Marsh. Hydrobiologia, 539, 189–204.
(8) Haramis G.M. & Kearns G.D. (2007) Herbivory by resident geese: the loss and recovery of wild rice along the tidal Patuxent River. Journal of Wildlife Management, 71, 788–794.
(9) Smith A.N., Vernes K.A. & Ford H.A. (2012) Grazing effects of black swans Cygnus atratus (Latham) on a seasonally flooded coastal wetland of eastern Australia. Hydrobiologia, 697, 45–57.
(10) Berney P.J., Wilson G.G., Ryder D.S., Whalley R.D.B., Duggin J. & McCosker R. (2014) Divergent responses to long-term grazing exclusion among three plant communities in a flood pulsing wetland in eastern Australia. Pacific Conservation Biology, 20, 237–251.
(11) Nichols T.C. (2014) Integrated damage management reduces grazing of wild rice by resident Canada geese in New Jersey. Wildlife Society Bulletin, 38, 229–236.
(12) Sarneel J.M., Huig N., Veen G.F., Rip W. & Bakker E.S. (2014) Herbivores enforce sharp boundaries between terrestrial and aquatic ecosystems. Ecosystems, 17, 1426–1438.
Additional reference:
Smith T., Lundholm J. & Simser L. (2001) Wetland vegetation monitoring in Cootes Paradise: measuring the response to a fishway/carp barrier. Ecological Restoration, 19, 145–154.
9.15.2 Exclude wild vertebrates: brackish/salt marshes
Seven studies evaluated the effects, on vegetation, of physically excluding wild vertebrates from brackish/salt marshes. Five studies were in the USA3–7. The other studies were in France1 and Sweden2. In five studies, the problematic vertebrates were mammals1,3–5,7. In the other two studies, they were birds2,6. Two of the studies4,5 were conducted in the same area, but with different experimental set-ups.
VEGETATION COMMUNITY

9. Threat: Invasive and other problematic species
249
Overall richness/diversity (3 studies): Two replicated, paired, controlled studies in brackish marshes in the USA3,4 found that fencing to exclude nutria Myocastor coypus had no significant effect on total plant species richness: fenced and open plots contained a similar number of plant species after 1–2 growing seasons. One replicated, randomized, paired, controlled, before-and-after study in brackish marshes in the USA5 reported that excluding mammals typically had no significant effect on changes in plant species richness over two years.
VEGETATION ABUNDANCE
Overall abundance (5 studies): Five replicated, paired, controlled studies involving brackish marshes in France1 and the USA3–6 found that fencing to exclude medium-large vertebrates maintained1 or increased3–6 overall vegetation abundance. Vegetation cover1,6 or biomass3–5 were compared between fenced and open plots, after 1–2 growing seasons1,3–5 or over the winter after fencing6.
Individual species abundance (6 studies): Six studies1–5,7 quantified the effect of this intervention on the abundance of individual plant species. The six replicated, controlled studies in brackish and salt marshes in France1, Sweden2 and the USA3–5,7 reported that fencing to exclude medium-large mammals typically maintained or increased the abundance of the dominant herb species over 1–4 growing seasons. Four of the studies3–5,7 found that fenced and open plots contained a similar abundance (biomass3,4, cover5 or density7) of cordgrasses Spartina spp. Three of the studies3,5,7 found that bulrushes Schoenoplectus spp./Scirpus spp. were more abundant in fenced than open plots. However, one study2 reported no clear difference in bulrush abundance between treatments and one study1 reported mixed effects depending on moisture levels and which mammals were excluded.
VEGETATION STRUCTURE
Height (3 studies): One replicated, paired, controlled study in a brackish marsh in France1 found that overall vegetation height increased over two years in plots fenced to exclude medium-large mammals, compared to a decline in plots left open. Two replicated, controlled studies in brackish and salt marshes in Sweden2 and the USA7 found that vertebrate exclusion did not reduce (i.e. maintained or increased) the height of dominant herb species over 2–4 growing seasons.
A replicated, paired, controlled study in 1975–1978 in an ephemeral brackish marsh in southern France (1) reported that the effects of excluding large mammalian herbivores on the dominant vegetation depended on the marsh type and which animals were excluded (horses Equus caballus and nutria Myocastor coypus, or horses only). The drier part of the marsh initially had 96–98% total vegetation cover, dominated by the grass Aeluropus littoralis (in 100% of quadrats) and alkali bulrush Scirpus maritimus (in 48–59% of quadrats). Two years later, total vegetation cover remained high in exclusion plots (full: 100%; horses: 100%) but had declined in grazed plots (83%). A. littoralis frequency had not changed in exclusion plots (full: 100%; horses: 100%) but had declined in grazed plots (79%). Alkali bulrush frequency had increased in all plots (full exclusion: 97%; horse exclusion: 88%; grazed: 96%). The wetter part of the marsh was initially dominated by alkali bulrush (in 85–93% of quadrats) and common reed Phragmites communis (in 11–27% of quadrats). Vegetation was 40–69 cm tall. After two more years, common reed frequency had increased in exclusion plots (full: 38%; horses: 64%) but decreased in grazed plots (2%). The same was true for vegetation height (full exclusion: 169 cm; horse exclusion: 116 cm; grazed: 18 cm). Alkali bulrush frequency had increased in full exclusion plots (100%), but decreased in horse exclusion plots (49%) and grazed plots (76%). Methods: In winter 1975/1976, eighteen 7 x 7 m plots were established

9. Threat: Invasive and other problematic species
250
in a brackish marsh (nine in the drier margins and nine in the wetter centre). In each part of the marsh, three plots received each treatment: full exclusion (of horses and nutria; wire fence with 3 cm mesh), partial exclusion (of horses only; fence with two barbed wire strands) and no fence (continued grazing, including <0.15 horses/ha). Vegetation was surveyed in summer 1976–1978 (frequency of each species and height of the tallest plant in fifty 15 x 15 cm quadrats/plot/year; bare ground at 100 points/plot/year).
A replicated, controlled, before-and-after study in 1980–1983 on a coastal salt marsh in Sweden (2) found that excluding geese increased the height of saltmarsh grass Puccinellia maritima. In 1981 and 1982, saltmarsh grass was taller in plots from which geese had been excluded (16–24 cm) than plots left open to geese (13–16 cm). In 1980, before intervention, the opposite was true: saltmarsh grass was shorter in plots destined for goose exclusion (10 cm) than plots destined to remain open to geese (11 cm). The study also noted broadly similar changes in vegetation cover under both treatments, between 1980 and 1983. Cover of saltmarsh grass consistently declined, whilst cover of creeping bentgrass Agrostis stolonifera and saltmarsh bulrush Scirpus maritimus consistently increased (statistical significance not assessed; data not clearly reported). Methods: In late 1979, four 25-m2 plots were established in grassy areas of a salt marsh and fenced to exclude cattle. In 1981, geese were also excluded from two of the plots using circular chicken nets. Vegetation was surveyed using point quadrats each autumn before goose exclusion (1980) and after goose exclusion (1981–1983). Height was measured for 3–186 plants/species/treatment/ year.
A replicated, paired, controlled study in 1991 in a brackish marsh in Louisiana, USA (3) found that plots fenced to exclude nutria Myocastor coypus contained more vegetation biomass than plots that remained open to grazing, but had similar plant species richness. After six months, fenced plots contained more above-ground vegetation biomass (974 g/m2) than open plots (538 g/m2). Individual species showed mixed responses. For example, fenced plots contained more biomass of chairmaker’s bulrush Scirpus olneyi (fenced: 244 g/m2; open: 27 g/m2), but statistically similar biomass of the other dominant species, saltmeadow cordgrass Spartina patens (fenced: 557 g/m2; open: 381 g/m2) and less biomass of Cyperus sedges (fenced: 1–2 g/m2; open: 11–46 g/m2). Fenced and open plots contained a statistically similar number of plant species (data not reported). Methods: In March 1991, twenty 1-m2 plots were established (in five sets of four) in a coastal brackish marsh. Ten plots (two plots/set) were fenced (2.5 x 5.0 cm plastic-coated mesh) to exclude nutria (and other large mammals). The other plots were not fenced. Half of the plots under each treatment were burned, in June. In September 1991, all vegetation was cut from each plot then identified, dried and weighed.
A replicated, randomized, paired, controlled study in 1991 in two brackish marshes in Louisiana, USA (4) reported that plots fenced to exclude nutria Myocastor coypus contained more overall vegetation biomass than plots that remained open to grazing, but had similar plant species richness. Statistical significance was not assessed. After two growing seasons, above-ground vegetation biomass was 990–1,150 g/m2 in fenced plots, compared to 720–910 g/m2 in open plots. However, fenced and open plots contained a statistically similar biomass of the dominant plant species: saltmeadow cordgrass Spartina patens (fenced: 501; open: 290 g/m2) and smooth cordgrass Spartina alterniflora (fenced: 993; open: 713 g/m2). Fenced and open plots had similar plant species richness: 10.3–10.4 species/m2 in one marsh and

9. Threat: Invasive and other problematic species
251
1.5–2.0 species/m2 in the other. Methods: In March 1990, twenty-four 4-m2 plots were established (in six sets of four) across two brackish marshes. Twelve of the plots (two random plots/set) were fenced (2.5 cm plastic-coated mesh) to exclude nutria (and other large mammals). The other 12 plots were left open. In September 1991, all vegetation was cut from one 1-m2 quadrat/plot. Plant species were identified, then the vegetation was dried and weighed. This study was in the same area as (5), but used a different experimental set-up.
A replicated, randomized, paired, controlled, before-and-after study in 1992–1994 in two brackish marshes in Louisiana, USA (5) found that fencing to exclude wild mammals increased overall vegetation biomass, but had mixed effects on the cover of dominant plant species and plant species richness. After two years, above-ground vegetation biomass was higher in fenced plots (600–1,200 g/m2) than in plots that remained open to grazing (280–450 g/m2). Fenced and open plots had similar cover of the dominant plant species in 7 of 10 comparisons. In two of the other comparisons, fenced plots had greater cover of American bulrush Scirpus americanus (54–57%) than open plots (18–19%). Fencing had no significant effect on plant species richness in three of four comparisons: there were statistically similar changes over two years in fenced and open plots (see original paper for data). In the other comparison, in burned areas, plant species richness increased in fenced plots (by 3.8 species/m2) but did not significantly change in open plots (non-significant increase of 0.2 species/m2). Methods: In autumn 1992, twenty pairs of 4-m2 plots were established across two brackish marshes. Twenty plots (one random plot/pair) were fenced (5 cm wire mesh with hooks to prevent burrowing) to exclude nutria Myocastor coypus and wild boar Sus scrofa (and other large mammals). The other 20 plots were not fenced. Half of the plots under each treatment were also burned in autumn 1992 and 1993. Plant species and cover were recorded in autumn 1992 (before intervention) and 1994. Vegetation was cut from one 0.25-m2 quadrat/plot, then dried and weighed, in autumn 1994. This study was in the same area as (4), but used a different experimental set-up.
A replicated, paired, controlled study in 1996–1997 in four brackish and freshwater marshes in Delaware, USA (6) reported that plots fenced to exclude snow geese Chen caerulescens had greater vegetation cover (15–57%) than plots grazed by geese (<1–11%). Statistical significance was not assessed. Methods: In September–October 1996, sixteen goose exclosures were established across four impounded marshes with “slightly” brackish or fresh water. The study does not separate results for each marsh type. There were four exclosures/marsh. Exclosures were 1.2 x 1.2 m, fenced with 1.5 x 1.5 cm plastic mesh and topped with bright plastic strips to prevent snow geese from landing. Over winter 1996/1997, total vegetation cover was estimated in the 16 exclosures and 16 adjacent plots open to, and grazed by, snow geese.
A replicated, paired, controlled study in 1991–1994 in four brackish marshes in Louisiana, USA (7) found that fencing to exclude nutria Myocastor coypus increased the height and density of American bulrush Schoenoplectus americanus but not saltmeadow cordgrass Spartina patens. Bulrush was taller in fenced plots than open plots in 14 of 14 comparisons over 42 months (data reported as height categories). There were more bulrush stems in fenced plots in 12 of 14 comparisons (for which fenced: 70–240 stems/m2; open: 10–60 stems/m2). Cordgrass was taller in fenced than open plots in only 4 of 14 comparisons, with no significant difference in the others (data reported as height categories). There were more cordgrass stems in fenced plots in only 1 of 14 comparisons, with no significant difference in the others

9. Threat: Invasive and other problematic species
252
(for which fenced: 360–1,350 stems/m2; open: 270–1,750 stems/m2). Methods: In April 1991, forty 9-m2 plots were established across four brackish marshes (10 plots/marsh). Twenty of the plots (five plots/marsh) were fenced (4 x 6 cm plastic-coated mesh) to exclude nutria (and other large mammals). The other 20 plots were left open. Every 3–6 months for three and a half years, stems of the dominant plant species were counted and measured in two 25 x 25 cm quadrats/plot.
(1) Bassett P.A. (1980) Some effects of grazing on vegetation dynamics in the Camargue, France. Vegetatio, 43, 173–184.
(2) Pehrsson O. (1988) Effects of grazing and inundation on pasture quality and seed production in a salt marsh. Vegetatio, 74, 113–124.
(3) Taylor K.L., Grace J.B., Guntenspergen G.R. & Foote A.L. (1994) The interactive effects of herbivory and fire on an oligohaline marsh, Little Lake, Louisiana, USA. Wetlands, 14, 82–87.
(4) Taylor K.L. & Grace J.B. (1995) The effects of vertebrate herbivory on plant community structure in the coastal marshes of the Pearl River, Louisiana, USA. Wetlands, 15, 68–73.
(5) Ford M.A. & Grace J.B. (1998) The interactive effects of fire and herbivory on a coastal marsh in Louisiana. Wetlands, 18, 1–8.
(6) Sherfy M.H. & Kirkpatrick R.L. (2003) Invertebrate response to snow goose herbivory on moist-soil vegetation. Wetlands, 23, 236–249.
(7) Johnson Randall L.A. & Foote A.L. (2005) Effects of managed impoundments and herbivory on wetland plant production and stand structure. Wetlands, 25, 38–50.
9.15.3 Exclude wild vertebrates: freshwater swamps
We found no studies that evaluated the effects, on vegetation, of physically excluding wild vertebrates from freshwater swamps.
This means that we have not yet found any studies that have directly evaluated this intervention during our systematic journal and report searches. Therefore we have no evidence to indicate whether or not the intervention has any desirable or harmful effects.
9.15.4 Exclude wild vertebrates: brackish/saline swamps
We found no studies that evaluated the effects, on vegetation, of physically excluding wild vertebrates from brackish/saline swamps.
This means that we have not yet found any studies that have directly evaluated this intervention during our systematic journal and report searches. Therefore we have no evidence to indicate whether or not the intervention has any desirable or harmful effects.
9.16 Control populations of wild vertebrates
Background
Important wild vertebrates in marshes and swamps include mammals (e.g. deer, rabbits, hares, kangaroos, feral horses, feral pigs), birds (e.g. ducks, geese, swans), reptiles (e.g. turtles) and fish (e.g. carp). These animals can damage vegetation directly by eating it. They can also affect vegetation indirectly, for example by trampling, creating trails, digging, burrowing or defecation (Fuller 1985). Reducing the local population of wild vertebrates (e.g. by scaring them away and/or killing them) could reduce their impacts and allow degraded sites to recover. It may be very difficult to completely eradicate animals that have refuges in nearby habitats.

9. Threat: Invasive and other problematic species
253
To be summarized as evidence for this intervention, studies must have successfully reduced the local population density of problematic vertebrates. This could be done, for example, by killing them or by scaring them away.
CAUTION: These actions could directly affect non-target animals (e.g. if they consume poison by mistake) or might have knock-on effects for the rest of the food chain (e.g. less food for predators of the controlled animals; accumulation of poisons in predators; increased population of one problematic species after another, competing species is controlled; Corbett 1995). Herbivorous vertebrates, in particular, can be important in maintaining wetland vegetation, by controlling dominant species (e.g. black swans Cygnus atratus controlling sedges and maintaining open water; Smith et al. 2012) or by creating habitats on a large scale (e.g. marshes that develop on abandoned beaver Castor canadensis ponds; Wright et al. 2002). You should consider whether killing vertebrates is ethically acceptable. Scaring vertebrates away from a focal site could shift the problem to adjacent sites.
Related interventions: interventions to address the threat from domestic livestock, e.g. Use barriers to keep livestock off ungrazed marshes or swamps (3.8–3.12); Exclude wild vertebrates using physical barriers (9.15); Control populations of wild invertebrates (9.18).
Corbett L. (1995) Does dingo predation or buffalo competition regulate feral pig populations in the Australian wet-dry tropics? An experimental study. Wildlife Research, 22, 65–74.
Fuller D.A., Sasser C.E., Johnson W.B. & Gosselink J.G. (1985) The effects of herbivory on vegetation on islands in Atchafalaya Bay, Louisiana. Wetlands, 4, 105–114.
Smith A.N., Vernes K.A. & Ford H.A. (2012) Grazing effects of black swans Cygnus atratus (Latham) on a seasonally flooded coastal wetland of eastern Australia. Hydrobiologia, 697, 45–57.
Wright J.P., Jones C.G. & Flecker A.S. (2002) An ecosystem engineer, the beaver, increases species richness at the landscape scale. Oecologia, 132, 96–101.
9.16.1 Control populations of wild vertebrates: freshwater marshes
Two studies evaluated the effects, on vegetation, of controlling populations of wild vertebrates in freshwater marshes. Both studies were in the USA. In one study, the problematic animals were mammals1 and in the other study they were birds2.
VEGETATION COMMUNITY
VEGETATION ABUNDANCE
Overall abundance (1 study): One before-and-after study of marshy vegetation in the USA1 reported that over two years of trapping and shooting feral swine Sus scrofa, overall vegetation cover increased.
Characteristic plant abundance (1 study): One before-and-after study in the USA1 reported that over two years of trapping and shooting feral swine Sus scrofa, cover of two plant species characteristic of target seepage slope vegetation increased.
Herb abundance (1 study): One before-and-after study of marshy vegetation in the USA1 reported that over two years of trapping and shooting feral swine Sus scrofa, total forb cover increased.
Individual species abundance (2 studies): One paired, controlled, before-and-after study in freshwater marshes in the USA2 reported that killing and scaring Canada geese Branta canadensis reduced their impacts on the density of wild rice Zizania aquatica: its density became similar in plots open to geese and plots fenced to exclude geese. One before-and-after study of marshy

9. Threat: Invasive and other problematic species
254
vegetation in the USA1 reported mixed responses of individual plant species to two years of trapping and shooting feral swine Sus scrofa.
VEGETATION STRUCTURE
Height (1 study): One paired, controlled, before-and-after study in freshwater marshes in the USA2 reported that killing and scaring Canada geese Branta canadensis reduced their impacts on the height of wild rice Zizania aquatica: its height became similar in plots open to geese and plots fenced to exclude geese.
A before-and-after study in 2003–2005 of 28 marshy seepage slopes on an air base in Florida, USA (1) found that following control of feral swine Sus scrofa, cover of swine-damaged vegetation decreased whilst cover of herbs, forbs and seepage-characteristic species increased. Cover of swine-damaged (broken) vegetation within seepage slopes decreased from 11–25% before swine control to 4–6% after approximately two years of control. Based on correlations between swine damage and other vegetation metrics, this means that cover of saw palmetto Serenoa repens also declined over two years of swine control. Meanwhile, there were increases in overall vegetation cover, forb cover, and cover of two indicator species for healthy seepage slopes (toothache grass Ctenium aromaticum and wiregrass Aristida beyrichiana). Methods: Between autumn 2003 and 2005, feral swine on Elgin Air Force Base were removed for conservation purposes (by trapping or shooting). Together with continued sport hunting, this lead to a 92% decline in the swine population. Although conservation trapping/shooting and sport hunting occurred in separate areas within the air base, swine could easily move between the areas. Vegetation was surveyed on 28 seepage slopes before conservation trapping/shooting began (2003) and for two years after (2004, 2005). Each May–June, twenty 1-m2 quadrats were surveyed on each slope.
A paired, controlled, before-and-after study in 2000–2002 in tidal freshwater marshes along a river in New Jersey, USA (2) reported that killing and scaring Canada geese Branta canadensis reduced their impacts on wild rice Zizania aquatica density and height. In the autumn before intervention, plots exposed to goose herbivory contained only 15 wild rice plants/m2, with an average height of 200 cm. Additional plots from which geese were excluded contained 70 plants/m2, with an average height of 241 cm. In two of two autumns following goose control, the density of rice plants was statistically similar in open and exclusion plots (open: 55–58 plants/m2; exclusion: 60–68 plants/m2). Rice plants were still shorter in open than exclusion plots after one year of goose control (open: 281 cm; exclusion: 298 cm) but this difference was no longer significant after the second year of goose control (open: 212 cm; exclusion: 208 cm). Methods: In April–June 2001 and 2002, geese were controlled along the lower Maurice River by killing adults (shooting and capturing then euthanizing with carbon dioxide), scaring adults (with pyrotechnics) and puncturing eggs. The study marshes supported 0–17 goslings and 37–83 moulting geese in control years (vs 43 goslings and 250 moulting geese in pre-control years). Wild rice was surveyed each autumn 2000–2002, in 17–22 pairs of 1-m2 plots. In each pair, one plot was open to geese whilst the other had been fenced (to exclude geese) since April. In each plot, all rice plants were counted and 10 rice plants were measured.
(1) Engeman R.M., Stevens A., Allen J., Dunlap J., Daniel M., Teague D. & Constantin B. (2007) Feral swine management for conservation of an imperiled wetland habitat: Florida's vanishing seepage slopes. Biological Conservation, 134, 440–446.

9. Threat: Invasive and other problematic species
255
(2) Nichols T.C. (2014) Integrated damage management reduces grazing of wild rice by resident Canada geese in New Jersey. Wildlife Society Bulletin, 38, 229–236.
9.16.2 Control populations of wild vertebrates: brackish/salt marshes
We found no studies that evaluated the effects, on vegetation, of controlling populations of wild vertebrates in brackish/salt marshes.
This means that we have not yet found any studies that have directly evaluated this intervention during our systematic journal and report searches. Therefore we have no evidence to indicate whether or not the intervention has any desirable or harmful effects.
9.16.3 Control populations of wild vertebrates: freshwater swamps
We found no studies that evaluated the effects, on vegetation, of controlling populations of wild vertebrates in freshwater swamps.
This means that we have not yet found any studies that have directly evaluated this intervention during our systematic journal and report searches. Therefore we have no evidence to indicate whether or not the intervention has any desirable or harmful effects.
9.16.4 Control populations of wild vertebrates: brackish/saline swamps
We found no studies that evaluated the effects, on vegetation, of controlling populations of wild vertebrates in brackish/saline swamps.
This means that we have not yet found any studies that have directly evaluated this intervention during our systematic journal and report searches. Therefore we have no evidence to indicate whether or not the intervention has any desirable or harmful effects.
9.17 Exclude wild invertebrates using physical barriers
We found no studies that evaluated the effects, on vegetation, of physically excluding wild invertebrates from marshes or swamps.
This means that we have not yet found any studies that have directly evaluated this intervention during our systematic journal and report searches. Therefore we have no evidence to indicate whether or not the intervention has any desirable or harmful effects.
Background
Although invertebrates such as insects, spiders, crabs and molluscs are an important part of marsh and swamp ecosystems, they can become problematic where they are introduced and/or become abundant. Invertebrates could be excluded from vegetation patches using mesh cages, or from individual plants using sticky materials painted on to stems.
We have not summarized the numerous fundamental studies testing the effects of invertebrate exclusion or removal on existing marsh or swamp vegetation: it is not clear that such small-scale manipulations are realistic practical conservation interventions. Many of these studies have demonstrated substantial effects, both direct and indirect, of invertebrates on vegetation (e.g. Tyrell et al. 2008; Bertness et al. 2014).
Related interventions: Exclude wild vertebrates using physical barriers (9.15); Use fences or barriers to protect planted areas (13.19).

9. Threat: Invasive and other problematic species
256
Bertness M.D., Brisson C.P., Coverdale T.C., Bevil M.C., Crotty S.M. & Suglia E.R. (2014) Experimental predator removal causes rapid salt marsh die-off. Ecology Letters, 17, 830–835.
Tyrell M.C., Dionne M. & Edgerly J.A. (2008) Physical factors mediate effects of grazing by a non-indigenous snail species on saltmarsh cordgrass (Spartina alterniflora) in New England marshes. ICES Journal of Marine Science, 65, 746–752.
9.18 Control populations of wild invertebrates
We found no studies that evaluated the effects, on vegetation, of controlling populations of wild invertebrates in marshes or swamps.
This means that we have not yet found any studies that have directly evaluated this intervention during our systematic journal and report searches. Therefore we have no evidence to indicate whether or not the intervention has any desirable or harmful effects.
Background
Although invertebrates such as insects, gastropods and crustaceans are an important part of marsh and swamp ecosystems, they can become problematic where they are introduced and/or become overabundant. For example, invasive scale insects Nipponaclerda biwakoensis are causing die-back of natural reed stands in the Mississippi River Delta (Knight et al. 2018). The golden apple snail Pomacea canaliculata can greatly reduce vegetation abundance (Carlsson et al. 2004).
Reducing the local population of wild invertebrates could reduce their impacts and allow degraded marshes or swamps to recover. Specific techniques might be spraying with pesticides, setting traps, introducing reproductively sterile individuals, introducing a natural enemy of the problem species, or increased harvesting. It may be very difficult to completely eradicate animals that have refuges in nearby habitats.
CAUTION: Actions to control invertebrates could have negative side effects. Pesticides will kill many non-target invertebrates. Organisms introduced to control problematic invertebrates could themselves become problematic. Reducing invertebrate populations could have knock-on effects for the wider community: invertebrates can be an important food source for predators, pollinators for plants, and competitors that prevent other species from becoming overabundant and problematic.
Related interventions: Control populations of wild vertebrates (9.16); Exclude wild invertebrates using physical barriers (9.17).
Carlsson N.O.L., Brönmark C. & Hansson L.-A. (2004) Invading herbivory: the golden apple snail alters ecosystem functioning in Asian wetlands. Ecology, 85, 1575–1580.
Knight I.A., Wilson B.E., Gill M., Aviles L., Cronin J.T., Nyman J.A., Schneider S.A. & Diaz R. (2018) Invasion of Nipponaclerda biwakoensis (Hemiptera: Aclerdidae) and Phragmites australis die-back in southern Louisiana, USA. Biological Invasions, 20, 2739–2744.

257
10. Threat: Pollution
Background
Although wetlands may sometimes be constructed to help clean up and break down pollutants (Scholz 2016), damage can occur when large amounts of pollutants occur in natural marshes or swamps. These ecosystems are vulnerable to a wide variety of pollutants from agriculture, residential areas, tourist developments, industry, vehicles, roads, mining, fossil fuel extraction and fossil fuel transport. Key pollutants affecting marsh and swamp vegetation include sediment, herbicides, fertilizers, road salt, heavy metals, oil and large solid waste.
More specifically, an estimated 5.5 million tonnes of oil has been released into mangrove-lined coastal waters around the world since 1958, killing at least 126,000 ha of mangrove vegetation (an area approximately half the size of Luxembourg; Duke 2016). Polluted roadside snowmelt can inhibit germination of some wetland plant species, ultimately affecting plant community composition (Isabelle et al. 1987). Even if plants themselves are not affected by pollution, the accumulation of pollutants in vegetation can harm animals that eat it (Bromberg Gedan et al. 2009).
Some interventions involve removing the pollution after it has occurred. Other interventions involve preventing the pollution from reaching a focal site in the first place: by diverting it, blocking it or minimizing its generation. This synopsis includes studies that report responses of marsh or swamp vegetation to pollution control. It does not include studies that only report physical or chemical effects of interventions.
Related chapters: Threat: Natural system modifications, including drainage and flooding that can affect salinity, nutrient availability and acidity, and changes to the disturbance regime that can affect nutrient levels (Chapter 8); Threat: Invasive and other problematic species, which may grow in polluted marshes or swamps (Chapter 9); Habitat restoration and creation, including several interventions that could also be used to counter pollution (Chapter 12).
Bromberg Gedan K., Silliman B.R. & Bertness M.D. (2009) Centuries of human-driven change in salt marsh ecosystems. Annual Review of Marine Science, 1, 117–141.
Duke N. (2016) Oil spill impacts on mangroves: recommendations for operational planning and action based on a global review. Marine Pollution Bulletin, 109, 700–715.
Isabelle P.S., Fooks L.J., Keddy P.A. & Wilson S.D. (1987) Effects of roadside snowmelt on wetland vegetation: an experimental study. Journal of Environmental Management, 25, 57–60.
Scholz M. (2016) Wetlands for Water Pollution Control, Second Edition. Elsevier, Amsterdam.
Multiple sources of pollution
10.1 Clean waste water before it enters the environment
We found no studies that evaluated the effects, on marsh or swamp vegetation, of cleaning waste water before releasing it into the environment.
This means that we have not yet found any studies that have directly evaluated this intervention during our systematic journal and report searches. Therefore we have no evidence to indicate whether or not the intervention has any desirable or harmful effects.

10. Threat: Pollution
258
Background
Waste water could be cleaned before it is released into the environment, or directly into marshes or swamps. Excess nutrients, salts, heavy metals, radioactive materials, organic compounds and solid waste should be removed. Acidity (pH) should be adjusted. Hot water should be cooled. Waste water can be treated through processes such as sedimentation or mechanical filtration, with bacteria or chemicals, or in ‘constructed wetlands’ that contain plants and microorganisms to absorb or break down pollutants (Kadlec et al. 2000; Siddiqui 2003).
Related interventions: Remove pollutants from waste gases before they enter the environment (10.20).
Kadlec R.H., Knight R.L., Vymazal J., Brix H., Cooper P. & Haberl R. (2000) Constructed Wetlands for Pollution Control: Processes, Performance, Design and Operation. IWA Publishing, London.
Siddiqui S.A. (2003) Wastewater treatment technology in aquaculture. World Aquaculture, 34, 49–52.
10.2 Divert/block/stop polluted water inputs
We found no studies that evaluated the effects, on marsh or swamp vegetation, of diverting/ blocking/stopping polluted water inputs.
This means that we have not yet found any studies that have directly evaluated this intervention during our systematic journal and report searches. Therefore we have no evidence to indicate whether or not the intervention has any desirable or harmful effects.
Background
This intervention involves actions that divert or block polluted water (e.g. heated, or contaminated with excess nutrients or heavy metals) to prevent it from entering marshes or swamps, for example by constructing new pipes, channels, waterways, pumps or dams. Alternatively, pollutants could be collected at source: in India and the Philippines, specially designed toilets collect urine, which is then used as a fertilizer for crops instead of being released into natural systems (DWA 2015).
Care must be taken not to cause problems in another habitat by diverting polluted water there. Also, if water inputs are stopped, they may need to be replaced with a more suitable source to prevent the focal marsh or swamp from drying out.
Related interventions: Divert/block/stop saltwater inputs (8.5); Divert/block/stop freshwater inputs (8.6); Designate protected area (14.1) and Provide general protection for marshes or swamps (14.2), including policies and laws to prevent pollution.
DWA (2015) Dutch Wash Alliance Factsheet: Environmental Sustainability in Purifying Water and Keeping It Clean. Available at https://www.wetlands.org/download/5065/. Accessed 9 February 2020.
10.3 Slow down input water to allow more time for pollutants to
be removed
We found no studies that evaluated the effects, on marsh or swamp vegetation, of slowing down input water to allow more time for pollutants to be removed.
This means that we have not yet found any studies that have directly evaluated this intervention during our systematic journal and report searches. Therefore we have no evidence to indicate whether or not the intervention has any desirable or harmful effects.

10. Threat: Pollution
259
Background
Polluted water entering a marsh or swamp could be slowed down, allowing more time for natural breakdown or removal of pollutants. This intervention includes various ways of slowing down input water by altering the structure of input channels, such as making them longer or damming them.
Related interventions: Clean waste water before it enters the environment (10.1); Divert/block/stop polluted water inputs (10.2); Retain/restore/create vegetation around marshes or swamps, including in waterways that feed a focal site (10.4).
10.4 Retain/restore/create vegetation around marshes or swamps
Background
Management of the watershed or catchment (the area of land which drains into a wetland) can be a critical part of wetland conservation.
Maintaining, restoring or creating vegetation in the watershed could reduce the amount of pollution reaching focal marshes or swamps (amongst other benefits; Ma 2016). Vegetated slopes or buffer zones may retain sediment and nutrients better than bare soil (Skagen et al. 2008; Smith et al. 2016). Perennial, deep-rooted plants in catchments can also soak up water and prevent salinization (due to rising water tables) in areas with salty soils (NSW Government 2019). Artificial wetlands may be built in the catchment of a focal marsh or swamp, and planted with vegetation that can remove or break down pollutants (Brix 2003). Vegetation could be retained around development, or could be introduced to degraded land around focal sites. Vegetation in watersheds could be carefully harvested, providing income to support conservation (Wantzen et al. 2006).
To be summarized as evidence for this intervention, studies must have reported the effect of vegetation near/around a focal marsh or swamp on the vegetation within the marsh or swamp. The surrounding vegetation may be permanent (e.g. planting forests) or temporary (e.g. planting cover crops in farmland). The scope of this intervention does not include (a) studies of water quality only, or (b) studies of the surrounding habitat, even if it is also a marsh or a swamp, since this habitat is sacrificed to protect the focal site.
Related interventions: Slow down polluted input water, other than with vegetation (10.3); Use artificial barriers to block pollution (10.5).
Brix, H. (2003) Plants used in constructed wetlands and their functions. Proceedings of the 1st International Seminar on the Use of Aquatic Macrophytes for Wastewater Treatment in Constructed Wetlands, 8–10 May 2003, Lisbon, Portugal, 81–109.
Ma M. (2016) Riparian buffer zone for wetlands. In: C.M. Finlayson, M. Everard, K. Irvine, R.J. McInnes, B.A. Middleton, A.A. van Dam, N.C. Davidson (eds.) The Wetland Book I: Structure and Function, Management, and Methods. Springer, Dordrecht. Accessed 28 October 2019.
NSW Government (2019) Type of Salinity and their Prevention. Available at https://www.environment.nsw.gov.au/topics/land-and-soil/soil-degradation/salinity/type-of-salinity-and-their-prevention. Accessed 30 December 2020.
Skagen S.K., Melcher C.P. & Haukos D.A. (2008) Reducing sedimentation of depressional wetlands in agricultural landscapes. Wetlands, 28, 594–604.
Smith C., DeKeyser E.S., Dixon C., Kobiela B. & Little A. (2016) Effects of sediment removal on prairie pothole wetland plant communities in North Dakota. Natural Areas Journal, 36, 48–58.

10. Threat: Pollution
260
Wantzen K.M., Siqueira A., da Cunha C.N. & de Sá M.d.F.P. (2006) Stream-valley systems of the Brazilian Cerrado: impact assessment and conservation scheme. Aquatic Conservation: Marine and Freshwater Ecosystems, 16, 713–732.
10.4.1 Retain/restore/create vegetation around freshwater marshes
Four studies evaluated the effects, on vegetation in freshwater marshes, of retaining/restoring/ creating vegetation around them. Three studies were in the USA1,2,4 and one was in China3. Two studies1,2 were largely based on the same sites.
VEGETATION COMMUNITY
Community composition (2 studies): Two replicated, site comparison studies in the USA2,4 reported that freshwater marshes surrounded by restored upland vegetation contained a different overall plant community, after 1–20 years, to nearby marshes surrounded by natural vegetation. One of the studies2 also reported differences between marshes in restored vs degraded catchments.
Overall richness/diversity (3 studies): One replicated, paired, site comparison study in the USA1 found that marshes surrounded by restored upland vegetation had greater overall plant species richness than marshes within cropland, and similar richness to marshes within natural grassland. One replicated, site comparison study in the USA2 reported that freshwater marshes surrounded by restored upland vegetation contained fewer wetland plant species, after 1–20 years, than nearby marshes surrounded by natural vegetation. One before-and-after study of a lakeshore marsh in China3 reported that after revegetating a polluted input river (along with planting directly into the marsh), overall plant species richness increased.
VEGETATION ABUNDANCE
Overall abundance (1 study): One replicated, paired, site comparison study in the USA1 found that marshes surrounded by restored upland vegetation contained more plant biomass than marshes within cropland, but also more plant biomass than marshes within natural grassland.
Characteristic plant abundance (1 study): One replicated, paired, site comparison study in the USA1 found that marshes surrounded by restored upland vegetation typically had greater cover of wetland-characteristic plants than marshes within cropland, and similar cover of these species to marshes within natural grassland.
Individual species abundance (1 study): One replicated, site comparison study of pothole wetlands the USA4 found that wetlands surrounded by restored upland vegetation had greater cover of hybrid cattail Typha x glauca, after 2–7 years, than nearby natural wetlands.
VEGETATION STRUCTURE
Visual obstruction (1 study): One replicated, site comparison study of pothole wetlands in the USA4 found that parts of wetlands surrounded by restored upland vegetation created more visual obstruction, after 2–7 years, than the corresponding zone of nearby natural wetlands.
A replicated, paired, site comparison study of 261 ephemeral freshwater marshes (playas) in the Great Plains of the USA (1) found that marshes within revegetated cropland had greater plant species richness, plant biomass and cover of wetland-characteristic plants than marshes within current cropland, and similar richness and cover of wetland-characteristic plants to marshes within natural grassland. Compared to marshes within current cropland, restored-catchment marshes had greater plant species richness (reported as statistical model results), greater above-ground plant biomass (restored: 420; cropland: 200 g/m2) and typically greater cover of wetland-characteristic plant species (two of three

10. Threat: Pollution
261
comparisons, for which restored: 22–27%; cropland: 11–15%). Compared to marshes within natural (never ploughed) grassland, restored-catchment marshes had similar plant species richness (reported as statistical model results) and typically similar cover of wetland-characteristic plant species (two of three comparisons, for which restored: 22–27%; natural: 22–26%). However, restored-catchment marshes had greater above-ground plant biomass (420 g/m2) than marshes within natural grassland (240 g/m2). The study also reported that restored-catchment marshes were dominated by Great-Plains-native perennial plants, like natural marshes, but had greater cover of non-native plants than both natural and cropland marshes (see original paper for data). Methods: In summer (year not reported), vegetation was surveyed within 261 playa wetlands. These were arranged in 87 sets of three. In each set, one wetland was within former cropland now planted with a perennial cover crop, one was within extant cropland, and one was within natural grassland. Surveys included crop plants within wetlands. Biomass was dried before weighing. Most of the sites in this study were also studied in (2).
A replicated, site comparison study of 258 ephemeral freshwater marshes in central USA (2) reported that marshes within revegetated cropland contained a different plant community to natural marshes (surrounded by permanent grassland) and degraded marshes (surrounded by cropland), with lower cover of perennial wetland plants and fewer perennial wetland species than the natural marshes. Results summarized for this study are not based on assessments of statistical significance. After 1–20 years, the overall plant community composition differed between restored-catchment, natural and degraded marshes (data reported as a graphical analysis). Perennial wetland species were underrepresented in restored-catchment marshes (30% cover; 3.5 species/marsh) compared to natural marshes (47% cover; 5.0 species/marsh). However, restored-catchment marshes had greater cover of these species than degraded marshes (7% cover; species richness not reported). Annual wetland species were overrepresented in restored-catchment marshes compared to natural marshes in terms of abundance (data reported as a graphical analysis only). However, there was a similar number of these species in restored-catchment marshes (5.2 species/marsh) and natural marshes (5.4 species/marsh). Methods: Around 2010, vegetation was surveyed in 258 ephemeral playa marshes (along two transects crossing each marsh, in both the cool and warm seasons). Of these marshes, 86 were undergoing restoration under the Conservation Reserve Program (former cropland in catchment replanted to grassland 1–20 years previously; no intervention within the marshes), 86 were in natural catchments, and 86 were in degraded, farmed catchments. This study used a subset of the sites from (1).
A before-and-after study in 2008–2014 of a lakeshore freshwater marsh in southern China (3) found that after planting herbs into a polluted river feeding it (and planting directly into the marsh), plant species richness increased. Statistical significance was not assessed. The marsh contained 14 plant species before planting but 26 plant species five years after. Methods: In May 2009, the river feeding a lake was planted with pollution-reducing vegetation: bur-reed Sparganium simplex, mare’s tail Hippuris vulgaris and yellow floating heart Nymphoides peltatum. The river water quality had recently declined, due to inputs of nutrients and domestic sewage. Some herbs were also planted directly into the lakeshore marsh (number of species not reported). The study does not distinguish between the effects of these interventions on any non-planted vegetation. Lakeshore vegetation (emergent, floating and submerged) was surveyed before (July 2008) and for approximately five years after (July 2009–2014) planting (details not fully reported).

10. Threat: Pollution
262
A replicated, site comparison study in 2010 of 20 prairie pothole wetlands in North Dakota, USA (4) found that potholes amongst restored perennial vegetation contained a different marsh and wet meadow plant community to nearby natural marshes, with greater cattail cover and sometimes greater horizontal vegetation cover. The overall plant community composition in both the marsh and wet meadow zones significantly differed between potholes surrounded by restored perennial upland vegetation and nearby natural potholes (data reported as a graphical analysis). Across both zones, the potholes in restored areas had greater cover of hybrid cattail Typha x glauca (19%) than natural potholes (5%). In the marsh zone – but not the wet meadow zone – visual obstruction was greater in potholes in restored areas than in natural potholes (data reported as a visual obstruction index). Methods: In summer 2010, vegetation was surveyed in the marsh (seasonally flooded) and wet meadow (occasionally flooded) zones of 20 prairie potholes (10 quadrats/zone/pothole). Eleven potholes used to be surrounded by cropland, but this had been restored to perennial vegetation cover (details and dates not reported, but probably around 2–7 years previously). However, these potholes likely contained excess sediment that had washed off the cropland. The other nine potholes were surrounded by land that was not, and had never been, cultivated.
(1) O'Connell J.L., Johnson L.A., Smith L.M., McMurry S.T. & Haukos D.A. (2012) Influence of land-use and conservation programs on wetland plant communities of the semiarid United States Great Plains. Biological Conservation, 146, 108–115.
(2) O'Connell J.L., Johnson L.A., Beas B.J., Smith L.M., McMurry S.T. & Haukos D.A. (2013) Predicting dispersal-limitation in plants: optimizing planting decisions for isolated wetland restoration in agricultural landscapes. Biological Conservation, 159, 343–354.
(3) Liu G., Tian K., Sun J., Xiao D. & Yuan X. (2016) Evaluating the effects of wetland restoration at the watershed scale in northwest Yunnan Plateau, China. Wetlands, 36, 169–183.
(4) Smith C., DeKeyser E.S., Dixon C., Kobiela B. & Little A. (2016) Effects of sediment removal on prairie pothole wetland plant communities in North Dakota. Natural Areas Journal, 36, 48–58.
10.4.2 Retain/restore/create vegetation around brackish/salt marshes
We found no studies that evaluated the effects, on vegetation in brackish/salt marshes, of retaining/ restoring/creating vegetation around them.
This means that we have not yet found any studies that have directly evaluated this intervention during our systematic journal and report searches. Therefore we have no evidence to indicate whether or not the intervention has any desirable or harmful effects.
10.4.3 Retain/restore/create vegetation around freshwater swamps
We found no studies that evaluated the effects, on vegetation in freshwater swamps, of retaining/ restoring/creating vegetation around them.
This means that we have not yet found any studies that have directly evaluated this intervention during our systematic journal and report searches. Therefore we have no evidence to indicate whether or not the intervention has any desirable or harmful effects.
10.4.4 Retain/restore/create vegetation around brackish/saline swamps
We found no studies that evaluated the effects, on vegetation in brackish/saline swamps, of retaining/restoring/creating vegetation around them.
This means that we have not yet found any studies that have directly evaluated this intervention during our systematic journal and report searches. Therefore we have no evidence to indicate whether or not the intervention has any desirable or harmful effects.

10. Threat: Pollution
263
10.5 Use artificial barriers to block pollution
We found no studies that evaluated the effects, on marsh or swamp vegetation, of using artificial barriers to block out pollution.
This means that we have not yet found any studies that have directly evaluated this intervention during our systematic journal and report searches. Therefore we have no evidence to indicate whether or not the intervention has any desirable or harmful effects.
Background
Artificial barriers such as sand bags, rocks, temporary berms, bundles of sticks, plastic curtains, booms, absorbent matting or ditches could be used to block out pollution from a focal marsh or swamp. Barriers can isolate pollution and prevent it reaching the site at all, or slow it down so it has time to break down before reaching the focal site. Barriers are likely to be most effective as a short-term intervention to extreme pollution events e.g. oil or chemical spills (Hoff & Michel 2014). In 2010, over 20 km of sand berms were built to protect coastal marshes in Louisiana from the Deepwater Horizon oil spill (Martínez et al. 2012). In Australia, temporary banks or flow regulators are used to contain the acid water and toxic metals released when acid sulfate soils are rewetted (Baldwin 2011).
To be summarized as evidence for this intervention, studies must have evaluated the effect of barriers on marsh or swamp vegetation – not just the effectiveness of barriers for isolating pollutants.
Related interventions: Retain/restore/create vegetation around marshes or swamps (10.4); Add clean water to reduce pollution (10.6).
Baldwin D. (2011) National Guidance for the Management of Acid Sulfate Soils in Inland Aquatic Ecosystems, Environment Protection and Heritage Council and the Natural Resource Management Ministerial Council, Australia.
Hoff R, & Michel J. (2014) Oil Spills in Mangroves: Planning & Response Considerations. US Department of Commerce.
Martínez M.L., Feagin R.A., Yeager K.M., Day J., Costanza R., Harris J.A., Hobbs R.J., López-Portillo J., Walker I.J., Higgs E., Moreno-Casasola P., Sheinbaum J. & Yáñez-Arancibia A. (2012) Artificial modifications of the coast in response to the Deepwater Horizon oil spill: quick solutions or long-term liabilities? Frontiers in Ecology and the Environment, 10, 44–49.
10.6 Add clean water to reduce pollution
We found no studies that evaluated the effects, on vegetation in marshes or swamps, of diverting clean water into them to reduce pollution.
This means that we have not yet found any studies that have directly evaluated this intervention during our systematic journal and report searches. Therefore we have no evidence to indicate whether or not the intervention has any desirable or harmful effects.
Background
Diverting non-polluted water into marshes or swamps when they are risk of pollution events may help to prevent pollutants from entering at all. For example, in April 2010, floodgates into the Barataria Bay and Breton Sound basins were opened to increase freshwater flows in an attempt to prevent oil from the Deepwater Horizon spill from entering coastal marshes in Louisiana (Martínez et al. 2012). Clean water could also

10. Threat: Pollution
264
be used to dilute or flush out pollutants that have already entered marshes or swamps. CAUTION: Increasing freshwater inputs will reduce the salinity, which may affect vegetation and other organisms. High flow rates may cause erosion. Diluting pollutants with clean water may reduce concentrations without affecting the total amount entering a focal site.
To be summarized as evidence for this intervention, studies must have evaluated the effect of water diversions on marsh or swamp vegetation – not just their effectiveness at reducing pollution.
Related interventions: Use artificial barriers to block pollution (10.5).
Martínez M.L., Feagin R.A., Yeager K.M., Day J., Costanza R., Harris J.A., Hobbs R.J., López-Portillo J., Walker I.J., Higgs E., Moreno-Casasola P., Sheinbaum J. & Yáñez-Arancibia A. (2012) Artificial modifications of the coast in response to the Deepwater Horizon oil spill: quick solutions or long-term liabilities? Frontiers in Ecology and the Environment, 10, 44–49.
10.7 Introduce plants to marshes or swamps to control pollution
We found no studies that evaluated the effects, on other vegetation, of introducing plants to marshes or swamps with the primary aim of controlling pollution.
This means that we have not yet found any studies that have directly evaluated this intervention during our systematic journal and report searches. Therefore we have no evidence to indicate whether or not the intervention has any desirable or harmful effects.
Background
This intervention involves introducing vegetation into polluted marshes or swamps, with the intention that the introduced plants help to control pollution (Bert et al. 2009). Plants can help to clean up existing pollutants, or manage chronic inputs of pollutants. Plants may directly absorb or break down pollutants, or facilitate break down by microbes through providing oxygen and a large surface area (Brix 2003). To be summarized as evidence for this intervention, studies must report effects on desirable marsh or swamp vegetation other than that planted to control pollution.
Related interventions: Retain/restore/create vegetation around marshes or swamps, including in waterways that feed a focal site (10.4); introduce marsh or swamp vegetation, where its primary purpose is not pollution control (12.22–12.26); Stimulate microbial breakdown of oil (10.19).
Bert V., Seuntjens P., Dejonghe W., Lacherez S., Thuy H.T.T. & Vandecasteele B. (2009) Phytoremediation as a management option for contaminated sediments in tidal marshes, flood control areas and dredged sediment landfill sites. Environmental Science and Pollution Research, 16, 745–764.
Brix, H. (2003) Plants used in constructed wetlands and their functions. Proceedings of the 1st International Seminar on the Use of Aquatic Macrophytes for Wastewater Treatment in Constructed Wetlands, 8–10 May 2003, Lisbon, Portugal, 81–109.
10.8 Reduce fertilizer or herbicide use
Background
An excess of fertilizers and herbicides can have negative effects on vegetation. Herbicides can kill plants directly. An excess of nutrients, such as nitrogen and

10. Threat: Pollution
265
phosphorous, can alter the competitive balance leading to domination by single species (Tilman et al. 1999) or algal blooms (Smith et al. 2006). For many marshes and swamps, problems are related to chronic spillover of chemicals from agricultural or domestic land. Nutrient pollution is especially severe where a large proportion of the land is cultivated, e.g. in Europe, eastern North America and southeast China (Verhoeven et al. 2006). In some cases, e.g. rice paddies, excess chemical application could affect vegetation during the growing season and/or fallow periods.
Simply applying less fertilizer or herbicide to land/water near focal sites, or to agricultural wetlands, could reduce these problems. Ultimately, reduced application could be driven by legislation, financial incentives and/or education. Studies of organic farming – an agricultural system that minimizes the use of synthetic fertilizers and pesticides and relies on techniques such as crop rotation, compost and biological pest control (European Commission 2019) – are included within this intervention.
For this intervention, “reduction” includes stopping fertilizer or herbicide treatments altogether. Note that studies comparing areas that remain untreated to areas that become treated are not summarized as evidence for this intervention.
Related interventions: Manage fertilizer or herbicide application, without reducing the total amount applied (10.9). In practice, interventions 10.8 and 10.9 will often be used simultaneously.
European Commission (2019) What is Organic Farming? Available at http://ec.europa.eu/agriculture/ organic/organic-farming/what-is-organic-farming. Accessed 29 October 2019.
Smith V.H., Joye S.B. & Howarth R.W. (2006) Eutrophication of freshwater and marine ecosystems. Limnology and Oceanography, 51, 351–355.
Tilman E.A., Tilman D., Crawley M.J. & Johnston A.E. (1999) Biological weed control via nutrient competition: potassium limitation of dandelions. Ecological Applications, 9, 103–111.
Verhoeven J.T.A., Arheimer B., Yin C. & Hefting M.M. (2006) Regional and global concerns over wetlands and water quality. Trends in Ecology and Evolution, 21, 96–103.
10.8.1 Reduce fertilizer or herbicide use: freshwater marshes
One study evaluated the effects, on vegetation in freshwater marshes, of reducing the amount of fertilizer or herbicide used in the marshes or adjacent areas. The study was in Brazil.
VEGETATION COMMUNITY
Community composition (1 study): One replicated, site comparison study of rice fields in Brazil1 found that the overall plant community composition (excluding rice) was similar in organically farmed fields and conventionally farmed fields, but different from the community in nearby natural marshes.
Overall richness/diversity (1 study): The same study1 found that organically farmed rice fields contained a similar average richness and diversity of wetland plants (at any single point in time) to conventionally farmed rice fields, although more species were recorded in the organic fields over the year of the study. Organically farmed rice fields had lower wetland plant richness and diversity than nearby natural marshes.
VEGETATION ABUNDANCE
Overall abundance (1 study): One replicated, site comparison study of rice fields in Brazil1 found that organically farmed fields contained more wetland plant biomass than conventionally farmed fields over the year of the study, but less wetland plant biomass than nearby natural marshes.

10. Threat: Pollution
266
VEGETATION STRUCTURE
A replicated, site comparison study in 2010–2011 involving eight rice fields in southern Brazil (1) found that organically farmed fields were similar to conventionally farmed fields in terms of wetland plant community composition, richness and diversity (but not biomass), but different from natural marshes. Across one year of cultivation, the overall plant community composition in organic fields was statistically similar to conventional fields (data reported as a graphical analysis). Fields under each farming treatment had statistically similar wetland plant species richness (organic: 3–6 species/0.9 m2/survey; conventional: 1–7 species/0.9 m2/survey) and diversity (data reported as a diversity index). However, a total of 27 wetland plant species were recorded in the organic fields, compared to 23 in conventional fields. The average biomass of wetland plants was higher in organic fields (1–18 g/m2) than conventional fields (<1–11 g/m2). Compared to nearby natural marshes, the organic rice fields supported a different plant community with fewer total species (natural: 55), lower species richness (natural: 7–11 species/0.9 m2), lower diversity, and less biomass (natural: 36–228 g/m2). Methods: Between August 2010 and August 2011, at six stages in the rice-growing calendar, vegetation was surveyed in four organically farmed rice fields (no artificial fertilizers or herbicides; weeds controlled by changing water level and tilling), four conventionally farmed rice fields, and four nearby natural ephemeral marshes. Wild wetland plant species (i.e. excluding rice and terrestrial species) were recorded in ten 30 x 30 cm quadrats/site/survey. Their above-ground parts were collected, then dried and weighed.
(1) Linke M.G., Godoy R.S., Rolon A.S. & Maltchik L. (2014) Can organic rice crops help conserve aquatic plants in southern Brazil wetlands? Applied Vegetation Science, 17, 346–355.
10.8.2 Reduce fertilizer or herbicide use: brackish/salt marshes
We found no studies that evaluated the effects, on vegetation in brackish/salt marshes, of reducing the amount of fertilizer or herbicide used in the marshes or adjacent areas.
This means that we have not yet found any studies that have directly evaluated this intervention during our systematic journal and report searches. Therefore we have no evidence to indicate whether or not the intervention has any desirable or harmful effects.
10.8.3 Reduce fertilizer or herbicide use: freshwater swamps
We found no studies that evaluated the effects, on vegetation in freshwater swamps, of reducing the amount of fertilizer or herbicide used in the swamps or adjacent areas.
This means that we have not yet found any studies that have directly evaluated this intervention during our systematic journal and report searches. Therefore we have no evidence to indicate whether or not the intervention has any desirable or harmful effects.
10.8.4 Reduce fertilizer or herbicide use: brackish/saline swamps
We found no studies that evaluated the effects, on vegetation in brackish/saline swamps, of reducing the amount of fertilizer or herbicide used in the swamps or adjacent areas.
This means that we have not yet found any studies that have directly evaluated this intervention during our systematic journal and report searches. Therefore we have no evidence to indicate whether or not the intervention has any desirable or harmful effects.

10. Threat: Pollution
267
10.9 Manage fertilizer or herbicide application
We found no studies that evaluated the effects, on vegetation in marshes or swamps, of managing fertilizer or herbicide use in these habitats or adjacent areas.
This means that we have not yet found any studies that have directly evaluated this intervention during our systematic journal and report searches. Therefore we have no evidence to indicate whether or not the intervention has any desirable or harmful effects.
Background
An excess of fertilizers and herbicides can have negative effects on vegetation. Herbicides can kill plants directly. An excess of nutrients, such as nitrogen and phosphorous, can alter the competitive balance in marshes and swamps leading to domination by single species (Tilman et al. 1999) or algal blooms (Smith et al. 2006). For many marshes and swamps, problems are related to chronic spillover of chemicals from agricultural or domestic land. Nutrient pollution is especially severe where a large proportion of the land is cultivated, e.g. in Europe, eastern North America and southeast China (Verhoeven et al. 2006). In some cases, e.g. rice paddies, excess chemical application could affect vegetation during the growing season and/or fallow periods.
Various techniques could be used to reduce these problems, without reducing the overall amount applied (although this could also be beneficial; Section 10.6). Applying fertilizers when plants are actively growing means a greater proportion of the nutrients are taken up by the plants. Within watersheds, avoiding application before heavy rain reduces the amount that is immediately washed away. Ultimately, better chemical management could be driven by legislation, financial incentives and/or education.
Related interventions: Reduce fertilizer or herbicide use, without other management of its application (10.8). In practice, interventions 10.8 and 10.9 will often be used simultaneously.
Smith V.H., Joye S.B. & Howarth R.W. (2006) Eutrophication of freshwater and marine ecosystems. Limnology and Oceanography, 51, 351–355.
Tilman E.A., Tilman D., Crawley M.J. & Johnston A.E. (1999) Biological weed control via nutrient competition: potassium limitation of dandelions. Ecological Applications, 9, 103–111.
Verhoeven J.T.A., Arheimer B., Yin C. & Hefting M.M. (2006) Regional and global concerns over wetlands and water quality. Trends in Ecology and Evolution, 21, 96–103.
10.10 Add lime or similar chemicals
Background
Marshes and swamps can become acidified through processes such as:
deposition of sulfur dioxide and nitrogen oxides from the air. These originate from a range of man-made sources, e.g. transport exhausts and gas flaring on oil wells (Uyigue & Agho 2007).
exposure of acid sulfate soils to oxygen, for example through drought, drainage or dredging. These soils are present in coastal wetlands such as mangroves (Dent 1986) and salinized inland areas (Baldwin 2011).

10. Threat: Pollution
268
inflows of acidic waste water from mining operations, for example in the Odiel Marshes, southwest Spain (Davila et al. 2019). This is formed when metal sulfide minerals, exposed during mining, react with oxygen.
Acidity can be reduced with calcium and/or magnesium-rich substances, such as lime CaO or Ca(OH)2, limestone CaCO3, magnesium oxide MgO, fly ash (residue from burning coal) or biochar (a type of charcoal). Adding these chemicals can also affect nutrient availability, because nutrients such as phosphorous become locked away in acidic soils or sediments (Weil & Brady 2016).
Neutralizing chemicals might be added directly to a focal site, added to an adjacent water body, or applied elsewhere in the watershed (which may reduce negative impacts on water quality associated with direct addition; Dorland et al. 2005).
Related interventions: Clean waste water before it enters the environment, including diversion of acidified water into designated treatment wetlands (10.1); Add lime or similar chemicals to complement planting (13.12).
Baldwin D. (2011) National Guidance for the Management of Acid Sulfate Soils in Inland Aquatic Ecosystems, Environment Protection and Heritage Council and the Natural Resource Management Ministerial Council, Australia.
Davila J.M., Sarmiento A.M., Santisteban M., Luís A.T., Fortes J.C., Diaz-Curiel J., Valbuena C. & Grande J.A. (2019) The UNESCO national biosphere reserve (Marismas del Odiel, SW Spain): an area of 18,875 ha affected by mining waste. Environmental Science and Pollution Research, 26, 33594–33606.
Dent D.L. (1986) Acid Sulphate Soils: A Baseline for Research and Development. ILRI Publication 39.
Dorland E., van den Berg L.J.L., Brouwer E., Roelofs J.G.M. & Bobbink R. (2005) Catchment liming to restore degraded, acidified heathlands and moorland pools. Restoration Ecology, 13, 302–311.
Uyigue E. & Agho M. (2007) Coping with Climate Change and Environmental Degradation in the Niger Delta of Southern Nigeria. Community Research and Development Centre Nigeria (CREDC).
Weil R.R. & Brady N.C. (2016) The Nature and Properties of Soils, Fifteenth Edition. Pearson, USA.
10.10.1 Add lime or similar chemicals: freshwater marshes
One study evaluated the effects, on vegetation, of adding neutralizing chemicals to freshwater marshes or their catchments. The study was in the USA.
VEGETATION COMMUNITY
Relative abundance (1 study): One replicated, controlled, before-and-after study of marsh vegetation in the USA1 found that liming had little effect on the relative abundance of plant taxa. For 48 of 49 taxa, differences or similarities in relative abundance between limed and unlimed areas before intervention persisted over two years after intervention.
VEGETATION ABUNDANCE
Individual species abundance (1 study): One replicated, controlled, before-and-after study of marsh vegetation in the USA1 found that for most plant taxa, differences or similarities in abundance between limed and unlimed areas before intervention persisted over two years following intervention. This was true for 33 of 38 herbaceous plant taxa, eight of eight woody plant taxa, and two of three moss taxa.
VEGETATION STRUCTURE
A replicated, controlled, before-and-after study in 1989–1991 of marsh vegetation around a lake in New York State, USA (1) found that catchment liming had

10. Threat: Pollution
269
no significant effect on the absolute and relative abundance of most plant taxa. This was true for cover of 45 of 49 plant taxa, frequency of 48 of 49 taxa, and relative abundance of 48 of 49 taxa. Liming increased cover of one taxon, sawtooth sedge Cladium mariscus (before intervention: 1–2% cover; limed areas after two years: 6% cover; unlimed areas after two years: 1% cover). Liming reduced, or prevented increases in, cover of two taxa (sundew Drosera intermedia, bog muhly Muhlenbergia uniflora) and frequency of one (lesser St. John’s wort Hypericum canadense; see original paper for data). Cover of one taxon – inland sedge Carex interior – was low and stable in limed areas (before: 0.3%; two years after: 0.2%) but declined, albeit from much greater values, in unlimed areas (before: 1.4%; two years later: 0.3%). Methods: In October 1989, pelleted limestone was added by helicopter to two of five subcatchments around Woods Lake (1,100 Mg of limestone across 100 ha). The other three subcatchments were not limed. Plant taxa and their cover were surveyed in marshes around the lake, in summer before liming (1989) and for two years after (1990, 1991). “No significant effect” in this study means that differences or similarities between limed and unlimed subcatchments before intervention persisted after intervention. Surveys were completed in 50 permanent 1-m2 quadrats (21 in limed marshes; 29 in unlimed marshes). Substrate pH was 4.5 before liming, then 6.6 in limed areas and 5.0 in unlimed areas.
(1) Mackun I.R., Leopold D.J. & Raynal D.J. (1994) Short-term responses of wetland vegetation after liming of an Adirondack watershed. Ecological Applications, 4, 535–543.
10.10.2 Add lime or similar chemicals: brackish/salt marshes
We found no studies that evaluated the effects, on vegetation, of adding neutralizing chemicals to brackish/salt marshes or their catchments.
This means that we have not yet found any studies that have directly evaluated this intervention during our systematic journal and report searches. Therefore we have no evidence to indicate whether or not the intervention has any desirable or harmful effects.
10.10.3 Add lime or similar chemicals: freshwater swamps
One study evaluated the effects, on vegetation, of adding neutralizing chemicals to freshwater swamps or their catchments. The study was in the USA.
VEGETATION COMMUNITY
Relative abundance (1 study): One replicated, controlled, before-and-after study of shrubby wetland vegetation in the USA1 found that liming had no significant effect on the relative abundance of plant taxa. For 49 of 49 taxa, differences or similarities in relative abundance between limed and unlimed areas before intervention persisted over two years after intervention.
VEGETATION ABUNDANCE
Individual species abundance (1 study): One replicated, controlled, before-and-after study of shrubby wetland vegetation in the USA1 found that for most plant taxa, differences or similarities in abundance between limed and unlimed areas before intervention persisted over two years following intervention. This was true for 31 of 31 herbaceous plant taxa, 16 of 16 woody plant taxa, and one of two moss taxa.
VEGETATION STRUCTURE

10. Threat: Pollution
270
A replicated, controlled, before-and-after study in 1989–1991 of shrubby wetland vegetation around a lake in New York State, USA (1) found that catchment liming had no significant effect on the absolute and relative abundance of most plant taxa. This was true for cover of 48 of 49 plant taxa, frequency of all 49 taxa, and relative abundance of all 49 taxa. Exceptionally, cover of Sphagnum spp. mosses was low and stable in limed areas (before: 1.0%; two years after: 0.9%) compared to a decline, albeit from a much greater value, in unlimed areas (before: 4%; two years later: 2.6%). Methods: In October 1989, pelleted limestone was added by helicopter to two of five subcatchments around Woods Lake (1100 Mg of limestone across 100 ha). The other three subcatchments were not limed. Plant taxa and their cover were surveyed in shrubby wetland vegetation around the lake, in summer before liming (1989) and for two years after (1990, 1991). “No significant effect” in this study means that differences or similarities between limed and unlimed subcatchments before intervention persisted after intervention. Surveys were completed in 52 permanent 1-m2 quadrats (18 in limed marshes; 34 in unlimed marshes). Substrate pH was 4.0–4.2 before liming, then 5.0–6.5 in limed areas and still 4.0–4.2 in unlimed areas.
(1) Mackun I.R., Leopold D.J. & Raynal D.J. (1994) Short-term responses of wetland vegetation after liming of an Adirondack watershed. Ecological Applications, 4, 535–543.
10.10.4 Add lime or similar chemicals: brackish/saline swamps
We found no studies that evaluated the effects, on vegetation, of adding neutralizing chemicals to brackish/saline swamps or their catchments.
This means that we have not yet found any studies that have directly evaluated this intervention during our systematic journal and report searches. Therefore we have no evidence to indicate whether or not the intervention has any desirable or harmful effects.
Garbage and solid waste
10.11 Remove debris
Background
Large debris (e.g. building materials, tyres) and accumulations of small debris (e.g. plant litter, wrack, plastics) can damage marsh and swamp vegetation. Debris can shade and crush vegetation. Movement of debris with water flows or tides can increase the area impacted beyond the footprint of the debris itself. Debris could also provide a refuge for animals that might damage vegetation, or release toxic chemicals (Uhrin & Schellinger 2011). Debris might be deposited directly onto marshes or swamps by humans, or carried there by wind and water (e.g. storms and tsunamis; Valiela et al. 1998).
Related interventions: Put up signs to discourage littering (10.12).
Uhrin A.V. & Schellinger J. (2011) Marine debris impacts to a tidal fringing-marsh in North Carolina. Marine Pollution Bulletin, 62, 2605–2610.
Valiela I., Peckol P., D’Avanzo C., Kremer J., Hersh D., Foreman K., Lajtha L., Seely B., Geyer W.R., Isaji R. & Crawford R. (1998) Ecological effects of major storms on coastal watersheds and coastal waters: Hurricane Bob on Cape Cod. Journal of Coastal Research, 14, 218–238.

10. Threat: Pollution
271
10.11.1 Remove debris from freshwater marshes
We found no studies that evaluated the effects, on vegetation, of removing debris from freshwater marshes.
This means that we have not yet found any studies that have directly evaluated this intervention during our systematic journal and report searches. Therefore we have no evidence to indicate whether or not the intervention has any desirable or harmful effects.
10.11.2 Remove debris from brackish/salt marshes
Two studies evaluated the effects, on vegetation, of removing debris from brackish/salt marshes. Both studies were in the USA.
VEGETATION COMMUNITY
VEGETATION ABUNDANCE
Overall abundance (1 study): One replicated, paired, site comparison study in a salt marsh in the USA2 found that overall vegetation cover in patches where debris had been removed remained lower than in undisturbed marsh for one growing season, but had recovered to match undisturbed marsh after two growing seasons.
Individual species abundance (2 studies): Two studies1,2 quantified the effect of this intervention on the abundance of individual plant species. For example, the two replicated, site comparison studies in salt marshes in the USA1,2 found that the abundance of dominant herb species in impacted vegetation patches was typically lower than in undisturbed marsh one growing season after removing debris, but was sometimes similar to undisturbed marsh. The results depended on the species, metric and type of debris removed. One of the studies2 also monitored until the second growing season after removing debris; at this point, the cover of both dominant herb species had recovered to match undisturbed marsh.
VEGETATION STRUCTURE
Height (1 study): One replicated, before-and-after, site comparison study in a salt marsh in the USA1 found that the maximum height of smooth cordgrass recovered, to match undisturbed marsh, within 45 weeks of removing debris.
A replicated, before-and-after, site comparison study in 2008–2009 in a coastal salt marsh in North Carolina, USA (1) found that following removal of crab pots and tyres from the marsh, smooth cordgrass Spartina alterniflora height and density typically recovered to undisturbed levels within a year. Immediately before intervention, impacted patches contained fewer cordgrass stems (120–133 stems/m2) than undisturbed marsh (300–370 stems/m2). There was a similar trend (not statistically significant) for the maximum height of cordgrass (impacted: 34–62 cm; undisturbed: 72–80 cm). Patches cleared of crab pots consistently had similar cordgrass height to undisturbed marsh from 22 weeks after clearance (cleared: 25–81 cm; undisturbed: 30–87 cm) and statistically similar cordgrass density to undisturbed marsh from 42 weeks (cleared: 167–229 stems/m2; undisturbed: 302–414 stems/m2). Patches cleared of tyres consistently had similar cordgrass height to undisturbed marsh from 45 weeks (cleared: 50–85 cm; undisturbed: 53–87 cm). However, cordgrass densities remained significantly lower in cleared than undisturbed marsh over the whole study year (33 of 35 comparisons; cleared: 84–273 stems/m2; undisturbed: 287–538 stems/m2). Methods: In August or September 2008, seven wire crab pots and seven vehicle tyres were removed from a salt marsh. Vegetation was surveyed under the debris before removal, then regularly after removal until

10. Threat: Pollution
272
September 2009. In each survey, live cordgrass stems were counted and measured in 1–2 quadrats covering the footprint of each pot or tyre (including stems growing through the centre of tyres) and seven quadrats in undisturbed patches of the marsh.
A replicated, paired, site comparison study in 2013–2015 in a coastal salt marsh in New York State, USA (2) found that patches cleared of stranded wooden debris developed similar vegetation cover to undisturbed marsh within two growing seasons. Immediately after removing debris, the cleared patches contained less vegetation (density: <5 shoots/m2; cover: 1–2%) than adjacent undisturbed marsh (density: 290 shoots/m2; cover: 96%). After one growing season, overall vegetation abundance had increased in the cleared patches (density: 98–114 shoots/m2; cover: 28–33%) but was still lower than in undisturbed marsh (density: 292 shoots/m2; cover: 96%). The same was generally true for the abundance of the two dominant species, smooth cordgrass Spartina alterniflora and saltgrass Distichlis spicata, although saltgrass cover was statistically similar in cleared patches and undisturbed marsh (see original paper for data). After two growing seasons, vegetation cover was statistically similar in the cleared patches and undisturbed marsh (density not recorded). This was true for overall cover (cleared: 69–74%; undisturbed: 79%), smooth cordgrass (cleared: 42–45%; undisturbed: 51%) and saltgrass (cleared: 23–25%; undisturbed: 21%). Methods: Five chunks of wooden storm debris (1–4 m2) were cleared from a salt marsh. Initial clearance took place in October 2013, although part of each patch was re-covered over winter then permanently cleared in March 2014. Between October 2013 (after initial clearance) and August 2015, vegetation was surveyed within each cleared patch and its adjacent undisturbed marsh.
(1) Uhrin A.V. & Schellinger J. (2011) Marine debris impacts to a tidal fringing-marsh in North Carolina. Marine Pollution Bulletin, 62, 2605–2610.
(2) Ehl K.M., Raciti S.M. & Williams J.D. (2017) Recovery of salt marsh vegetation after removal of storm-deposited anthropogenic debris: lessons from volunteer clean-up efforts in Long Beach, NY. Marine Pollution Bulletin, 117, 436–447.
10.11.3 Remove debris from freshwater swamps
We found no studies that evaluated the effects, on vegetation, of removing debris from freshwater swamps.
This means that we have not yet found any studies that have directly evaluated this intervention during our systematic journal and report searches. Therefore we have no evidence to indicate whether or not the intervention has any desirable or harmful effects.
10.11.4 Remove debris from brackish/saline swamps
We found no studies that evaluated the effects, on vegetation, of removing debris from brackish/ saline swamps.
This means that we have not yet found any studies that have directly evaluated this intervention during our systematic journal and report searches. Therefore we have no evidence to indicate whether or not the intervention has any desirable or harmful effects.
10.12 Put up signs to discourage littering
We found no studies that evaluated the effects, on vegetation or human behaviour, of putting up signs to discourage littering in/near marshes or swamps.

10. Threat: Pollution
273
This means that we have not yet found any studies that have directly evaluated this intervention during our systematic journal and report searches. Therefore we have no evidence to indicate whether or not the intervention has any desirable or harmful effects.
Background
Signs may be erected in/around marshes or swamps to discourage casual littering or large-scale waste dumping (Korb 2018). Solid waste can smother or physically damage vegetation, especially herbs and young plants. Anti-littering notices may or may not have a legal basis (i.e. littering/dumping may or may not be illegal). They may be included as part of general information boards.
Although we found no studies evaluating the effects of this intervention in marshes or swamps, more general psychological studies suggest a combination of anti-littering signs but the presence of litter – suggesting other people have ignored the sign – can actually make people more likely to litter (Keizer et al. 2011).
Related interventions: Restrict vehicle use (7.1) and Restrict pedestrian access (7.4), including through erecting signs; Put up signs to discourage fires (8.22); Raise public awareness about marshes or swamps, including through erecting information boards (15.1).
Keizer K., Lindenberg S. & Steg L. (2011) The reversal effect of prohibition signs. Group Processes & Intergroup Relations, 14, 681-688.
Korb P. (2018) Protected Wetlands Marked with Anti-Litter Sign. Available at https://patch.com/new-york/islip/protected-wetlands-marked-anti-litter-sign. Accessed 10 February 2020.
Agricultural and aquacultural effluents
10.13 Modify crop farming practices in watershed to reduce
pollution
Background
Crop farming in watersheds can lead to pollution of focal marshes or swamps. Soil and nutrients can run off arable land and accumulate in wetlands, affecting the plant community composition, plant diversity and distribution of plant species (Verhoeven et al. 2006; Bromberg Gedan et al. 2009). Extreme excesses can cause algal blooms or even fill in wetlands (Gleason & Euliss Jr. 1998). Crop farming can also contribute to salinization and acidification, by raising the local water table and bringing salts to the surface. This can occur through (a) excess irrigation or (b) replacing native, perennial deep-rooted vegetation with shallow-rooted, temporary crops that don’t take up as much water (NSW Government 2019). Alternatively, runoff of excess fresh irrigation water can pollute brackish/saline sites (Zedler 1983).
This intervention includes a range of specific actions, other than changes in fertilizer or herbicide use that are considered above (Sections 10.8 and 10.9), that might reduce pollution from arable farming in wetland catchments. For example, ploughing or harrowing parallel to slopes avoids creating channels that carry soil and nutrients. Terraces may help to retain soil and nutrients. Minimizing the number/duration of fallow periods, and planting cover crops during them, could minimize sediment/ chemical runoff and infiltration of water. Water table rise could also be reduced by

10. Threat: Pollution
274
tailoring irrigation to the needs of crops, increasing irrigation efficiency (e.g. replacing leaking pipes) and installing systems to retain excess irrigation water on site (NSW Government 2019).
Related interventions: Divert/block/stop freshwater inputs (8.6); Reduce fertilizer or herbicide use (10.8); Manage fertilizer or herbicide application (10.9).
Bromberg Gedan K., Silliman B.R. & Bertness M.D. (2009) Centuries of human-driven change in salt marsh ecosystems. Annual Review of Marine Science, 1, 117–141.
Gleason R.A. & Euliss N.H. Jr. (1998) Sedimentation of prairie wetlands. Great Plains Research, 8, 97–112.
NSW Government (2019) Type of Salinity and their Prevention. Available at https://www.environment.nsw.gov.au/topics/land-and-soil/soil-degradation/salinity/type-of-salinity-and-their-prevention. Accessed 30 December 2020.
Verhoeven J.T.A., Arheimer B., Yin C. & Hefting M.M. (2006) Regional and global concerns over wetlands and water quality. Trends in Ecology and Evolution, 21, 96–103.
Zedler J.B. (1983) Freshwater inputs in normally hypersaline marshes. Estuaries, 6, 346–355.
10.13.1 Modify crop farming practices in watershed to reduce pollution:
freshwater marshes
One study evaluated the effects, on vegetation in freshwater marshes, of modifying crop farming practices in the watershed to reduce pollution. The study was in the USA.
VEGETATION COMMUNITY
Community composition (1 study): One replicated, site comparison study in the USA1 reported that freshwater marshes being restored by abandoning cropland in the watershed (along with removing topsoil from the marshes) contained a different overall plant community, after 1–12 years, to both natural and degraded marshes nearby.
Overall richness/diversity (1 study): The same study1 reported that freshwater marshes being restored by abandoning cropland in the watershed (along with removing topsoil from the marshes) contained fewer wetland plant species, after 1–12 years, than nearby natural marshes.
VEGETATION ABUNDANCE
VEGETATION STRUCTURE
A replicated, site comparison study around 2010 of 48 ephemeral freshwater marshes in Nebraska, USA (1) reported that marshes undergoing restoration (surrounding cropland abandoned and agricultural topsoil removed) contained a different plant community to natural marshes (surrounded by permanent grassland) and degraded marshes (surrounded by cropland), with lower cover of wetland perennial plants and fewer wetland perennial species than the natural marshes. Results summarized for this study are not based on assessments of statistical significance. After 1–12 years, the overall plant community composition differed between restored, natural and degraded marshes (data reported as a graphical analysis). Perennial wetland species were underrepresented in restored marshes (43% cover; 10.1 species/marsh) compared to natural marshes (56% cover; 13.0 species/marsh). However, restored marshes had greater cover of these species than degraded marshes (35% cover; species richness not reported). Annual wetland species were “slightly” overrepresented in restored marshes compared to natural marshes in terms of abundance (data reported as a graphical analysis only). However, there was a similar number of these species in restored marshes (8.2 species/marsh) and natural

10. Threat: Pollution
275
marshes (8.0 species/marsh). Methods: Around 2010, vegetation was surveyed in 48 ephemeral playa marshes (along two transects crossing each marsh, in both the cool and warm seasons). Sixteen of the marshes were undergoing restoration under the Wetland Reserve Program. This involved abandoning the surrounding cropland and removing eroded agricultural topsoil from the marshes. The study does not distinguish between the effects of these interventions. Of the remaining marshes, 16 were in natural catchments and 16 were in degraded, farmed catchments.
(1) O'Connell J.L., Johnson L.A., Beas B.J., Smith L.M., McMurry S.T. & Haukos D.A. (2013) Predicting dispersal-limitation in plants: optimizing planting decisions for isolated wetland restoration in agricultural landscapes. Biological Conservation, 159, 343–354.
10.13.2 Modify crop farming practices in watershed to reduce pollution:
brackish/salt marshes
We found no studies that evaluated the effects, on vegetation in brackish/salt marshes, of modifying crop farming practices in the watershed to reduce pollution.
This means that we have not yet found any studies that have directly evaluated this intervention during our systematic journal and report searches. Therefore we have no evidence to indicate whether or not the intervention has any desirable or harmful effects.
10.13.3 Modify crop farming practices in watershed to reduce pollution:
freshwater swamps
We found no studies that evaluated the effects, on vegetation in freshwater swamps, of modifying crop farming practices in the watershed to reduce pollution.
This means that we have not yet found any studies that have directly evaluated this intervention during our systematic journal and report searches. Therefore we have no evidence to indicate whether or not the intervention has any desirable or harmful effects.
10.13.4 Modify crop farming practices in watershed to reduce pollution:
brackish/saline swamps
We found no studies that evaluated the effects, vegetation in brackish/saline swamps, of modifying crop farming practices in the watershed to reduce pollution.
This means that we have not yet found any studies that have directly evaluated this intervention during our systematic journal and report searches. Therefore we have no evidence to indicate whether or not the intervention has any desirable or harmful effects.
10.14 Modify logging practices in watershed to reduce pollution
We found no studies that evaluated the effects, on vegetation in marshes or swamps, of modifying logging practices in the watershed to reduce pollution.
This means that we have not yet found any studies that have directly evaluated this intervention during our systematic journal and report searches. Therefore we have no evidence to indicate whether or not the intervention has any desirable or harmful effects.
Background
High intensity logging within watersheds – when a large proportion of the trees are removed, or trees are removed frequently – can cause pollution problems in marshes

10. Threat: Pollution
276
or swamps below. Erosion and landslides following logging activity can increase sediment loads, reducing water clarity or even filling wetlands completely (Lele 2009; Adamus 2014).
This intervention includes a range of specific actions, other than changes in fertilizer or herbicide use that are considered above (Sections 10.8 and 10.9), that might reduce pollution from logging in wetland catchments. Logging less frequently or less intensely would leave more trees to intercept rainfall and hold together the soil, reducing sediment run-off. Additionally, any logging that is carried out could follow low-impact principles such as planning vehicle extraction routes, extraction of timber by helicopter, and directional felling.
Related interventions: Reduce frequency of vegetation harvest within wetlands (6.1); Reduce intensity of vegetation harvest within wetlands (6.2); Change season/timing of vegetation harvest within wetlands (6.3); Use low-impact methods to harvest vegetation within wetlands (6.4); Reduce fertilizer or herbicide use (10.8); Manage fertilizer or herbicide application (10.9).
Adamus P. (2014) Effects of forest roads and tree removal in or near wetlands of the Pacific Northwest: a literature synthesis. Washington State Department of Natural Resources.
Lele S. (2009) Watershed services of tropical forests: from hydrology to economic valuation to integrated analysis. Current Opinion in Environmental Sustainability, 1, 148–155.
10.15 Modify livestock farming practices in watershed to reduce
pollution
We found no studies that evaluated the effects, on vegetation in marshes or swamps, of modifying livestock farming practices in the watershed to reduce pollution.
This means that we have not yet found any studies that have directly evaluated this intervention during our systematic journal and report searches. Therefore we have no evidence to indicate whether or not the intervention has any desirable or harmful effects.
Background
Livestock farming in watersheds can lead to pollution of focal marshes or swamps. Soil and nutrients can run off arable land and accumulate in wetlands, affecting the plant community composition, plant diversity and distribution of plant species (Meehan & Platts 1978; Verhoeven et al. 2006; Bromberg Gedan et al. 2009). Extreme excesses can cause algal blooms. Runoff is a particular problem on farmland that has been compacted due to trampling. Conversion of catchments to pastures also contributes to salinization and acidification, by raising the local water table and bringing salts to the surface. The main cause of this is the replacement of native deep-rooted vegetation with shallow-rooted pasture crops that don’t take up as much water – made worse if overgrazing stunts plant growth or creates bare patches (NSW Government 2019).
This intervention includes a range of specific actions, other than changes in fertilizer or herbicide use that are considered above (Sections 10.8 and 10.9), that might reduce pollution from livestock farming in wetland catchments. These interventions include: completely excluding or removing livestock, reducing grazing intensity (by reducing duration and/or pressure of grazing), changing timing of grazing (e.g. avoiding grazing just before heavy rains) and changing the type of livestock (e.g. using sheep or goats

10. Threat: Pollution
277
rather than cattle if trampling is a problem). Studies in which livestock have access to marshes or swamps, and can graze directly within them, are considered in Chapter 3.
Related interventions: interventions to address the threat from livestock within wetlands, e.g. Use barriers to keep livestock off ungrazed marshes or swamps (3.8–3.12); Reduce fertilizer or herbicide use (10.8); Manage fertilizer or herbicide application (10.9).
Bromberg Gedan K., Silliman B.R. & Bertness M.D. (2009) Centuries of human-driven change in salt marsh ecosystems. Annual Review of Marine Science, 1, 117–141.
Meehan W.R. & Platts, W.S. (1978) Livestock grazing and the aquatic environment. Journal of Soil and Water Conservation, 33, 274–278.
NSW Government (2019) Type of Salinity and their Prevention. Available at https://www.environment.nsw.gov.au/topics/land-and-soil/soil-degradation/salinity/type-of-salinity-and-their-prevention. Accessed 30 December 2020.
Verhoeven J.T.A., Arheimer B., Yin C. & Hefting M.M. (2006) Regional and global concerns over wetlands and water quality. Trends in Ecology and Evolution, 21, 96–103.
10.16 Modify aquaculture practices in watershed to reduce
pollution
We found no studies that evaluated the effects, on vegetation in marshes or swamps, of modifying aquacultural practices in the watershed to reduce pollution.
This means that we have not yet found any studies that have directly evaluated this intervention during our systematic journal and report searches. Therefore we have no evidence to indicate whether or not the intervention has any desirable or harmful effects.
Background
Nutrients from aquaculture stock can spill over into focal marshes or swamps, causing pollution problems. This includes nutrients in excretory products from the animals themselves, as well as in excess food (Dauda et al. 2019). An excess of nutrients in marshes and swamps can affect the plant community composition, plant diversity and distribution of plant species (Verhoeven et al. 2006; Bromberg Gedan et al. 2009). Extreme excesses can cause algal blooms.
This intervention includes a range of specific actions, other than changes in fertilizer or herbicide use that are considered above (Sections 10.8 and 10.9), that might reduce pollution in focal marshes or swamps from aquacultural facilities elsewhere in the catchments. These interventions include: completely excluding or removing stock, reducing aquacultural intensity (by reducing frequency and/or degree of stocking), or better management of feed (altering the amount and/or timing).
Related interventions: Abandon aquaculture facilities within focal wetlands (3.13).
Bromberg Gedan K., Silliman B.R. & Bertness M.D. (2009) Centuries of human-driven change in salt marsh ecosystems. Annual Review of Marine Science, 1, 117–141.
Dauda A., Ajadi A., Tola-Fabunmi A.S. & Akinwole A.O. (2019) Waste production in aquaculture: sources, components and managements in different culture systems. Aquaculture and Fisheries, 4, 81–88.
Verhoeven J.T.A., Arheimer B., Yin C. & Hefting M.M. (2006) Regional and global concerns over wetlands and water quality. Trends in Ecology and Evolution, 21, 96–103.

10. Threat: Pollution
278
Industrial and military effluents
10.17 Physically or chemically remove oil
We found no studies that evaluated the effects, on vegetation, of physically or chemically removing oil (but not vegetation) from contaminated marshes or swamps.
This means that we have not yet found any studies that have directly evaluated this intervention during our systematic journal and report searches. Therefore we have no evidence to indicate whether or not the intervention has any desirable or harmful effects.
Background
Oil spills can damage vegetation in marshes and swamps. Lighter oils can kill plants through their toxic effects, whilst heavier oils coat and smother vegetation (Michel & Rutherford 2013). Coastal salt marshes and mangroves are vulnerable to offshore tanker spillages. An estimated 5.5 million tonnes of oil has been released into mangrove-lined coastal waters around the world since 1958, killing at least 126,000 ha of mangrove vegetation (Duke 2016). Oil pipelines crossing inland marshes or swamps (e.g. the Russia-China Oil Pipeline; Yu et al. 2010) pose a threat from leaks and malfunctions. Loss of vegetation can increase the risk of erosion and permanent habitat loss (Beland et al. 2017; https://youtu.be/UkATPicHIo4).
This intervention includes a range of specific actions that directly remove or break down oil, such as picking up lumps of oil, removing oil-contaminated litter/ wrack/sediment, vacuuming, washing, sand-blasting, using chemical cleaners, and adding chemical dispersants. For more information about implementing these techniques, see ExxonMobil (2008), Michel & Rutherford (2013) and Hoff & Michel (2014). The effectiveness of these actions may depend on the type of oil, exposure to waves and currents, climate, time of year that the spill occurred, and the species involved (Michel & Rutherford 2014). CAUTION: Interventions to remove oil could kill any surviving vegetation and churn oil into the sediment, potentially hindering long-term recovery.
Related interventions: Use artificial barriers to block pollution (10.5); Cut or burn oil-contaminated vegetation (10.18); Stimulate microbial breakdown of oil (10.19); interventions to address the threat from infrastructure associated with oil exploitation (Chapter 5); habitat restoration and creation interventions, which may be useful after removing oil (Chapter 12).
Beland M., Biggs T.W., Roberts D.A., Peterson S.H., Kokaly R.F. & Piazza S. (2017) Oiling accelerates loss of salt marshes, southeastern Louisiana. PLoS ONE, 12, e0181197.
ExxonMobil (2008) Oil Spill Response Field Manual. ExxonMobil, USA.
Hoff R, & Michel J. (2014) Oil Spills in Mangroves: Planning & Response Considerations. US Department of Commerce.
Michel J. & Rutherford N. (2013) Oil Spills in Marshes: Planning & Response Considerations. US Department of Commerce.
Michel J. & Rutherford N. (2014) Impacts, recovery rates and treatment options for spilled oil in marshes. Marine Pollution Bulletin, 82, 19–25.
Yu X., Wang G., Zou Y., Wang Q., Zhao H. & Lu X. (2010) Effects of pipeline construction on wetland ecosystems: Russia-China Oil Pipeline Project (Mohe-Daqing Section). Ambio, 39, 447–450.

10. Threat: Pollution
279
10.18 Cut or burn oil-contaminated vegetation
Background
Oil spills can damage vegetation in marshes and swamps. Lighter oils can kill plants through their toxic effects, whilst heavier oils coat and smother vegetation (Michel & Rutherford 2013). Coastal sites are vulnerable to offshore tanker spillages. For example, an estimated 5.5 million tonnes of oil has been released into mangrove-lined coastal waters around the world since 1958, killing at least 126,000 ha of mangrove vegetation (Duke 2016). Oil pipelines crossing inland wetlands (e.g. the Russia-China Oil Pipeline; Yu et al. 2010) pose a threat from leaks and malfunctions. Loss of vegetation can increase the risk of erosion and permanent habitat loss (Beland et al. 2017; https://youtu.be/UkATPicHIo4).
This intervention involves cutting or burning above-ground plant parts from oil-contaminated marshes and swamps. This may increase oxygen supply to the root zone (oil smothering leaves may interfere with oxygen diffusion) and prevent complete death of the oiled plants (Zengel & Michel 1996).
CAUTION: Activity on the wetland surface (e.g. foot traffic) could churn oil further into the sediment. Removing above-ground vegetation could increase rates of erosion. Hoff & Michel (2014) suggest that live mangrove vegetation should never be cut or burned, as the forest structure would take a long time to recover.
Related interventions: Use artificial barriers to block pollution (10.5); Physically or chemically remove oil (10.17); Stimulate microbial breakdown of oil (10.19); interventions to address the threat from infrastructure associated with oil exploitation (Chapter 5); habitat restoration and creation interventions, which may be useful after cleaning up oil (Chapter 12).
Beland M., Biggs T.W., Roberts D.A., Peterson S.H., Kokaly R.F. & Piazza S. (2017) Oiling accelerates loss of salt marshes, southeastern Louisiana. PLoS ONE, 12, e0181197.
Hoff R, & Michel J. (2014) Oil Spills in Mangroves: Planning & Response Considerations. US Department of Commerce.
Michel J. & Rutherford N. (2013) Oil Spills in Marshes: Planning & Response Considerations. US Department of Commerce.
Michel J. & Rutherford N. (2014) Impacts, recovery rates and treatment options for spilled oil in marshes. Marine Pollution Bulletin, 82, 19–25.
Yu X., Wang G., Zou Y., Wang Q., Zhao H. & Lu X. (2010) Effects of pipeline construction on wetland ecosystems: Russia-China Oil Pipeline Project (Mohe-Daqing Section). Ambio, 39, 447–450.
Zengel S.A. & Michel J. (1996) Vegetation cutting as a clean-up method for salt and brackish marshes impacted by oil spills: a review and case history of the effects on plant recovery. Marine Pollution Bulletin, 32, 876–885.
10.18.1 Cut or burn oil-contaminated vegetation: freshwater marshes
We found no studies that evaluated the effects, on vegetation, of cutting or burning oil-contaminated vegetation in freshwater marshes.
This means that we have not yet found any studies that have directly evaluated this intervention during our systematic journal and report searches. Therefore we have no evidence to indicate whether or not the intervention has any desirable or harmful effects.

10. Threat: Pollution
280
10.18.2 Cut or burn oil-contaminated vegetation: brackish/salt marshes
Two studies evaluated the effects, on vegetation, of cutting or burning oil-contaminated vegetation in brackish/salt marshes. One study reviewed multiple cases from the UK and the USA1. The other study was in Brazil2.
VEGETATION COMMUNITY
VEGETATION ABUNDANCE
Overall abundance (1 study): One review of studies in oil-contaminated salt marshes in the UK and the USA1 reported that in eight of eight cases with quantitative comparisons between cut and uncut areas, cutting had no clear benefit for vegetation abundance (density, biomass or cover) over 8–29 months of recovery.
Individual species abundance (1 study): One replicated, paired, controlled, site comparison study in oil-contaminated brackish/salt marshes in Brazil2 found that smooth cordgrass Spartina alterniflora density and biomass were never greater in cut than uncut plots (and typically similar under each treatment), over nine months after cutting.
VEGETATION STRUCTURE
Height (1 study): One replicated, paired, controlled, site comparison study in oil-contaminated brackish/saline marshes in Brazil2 found that smooth cordgrass Spartina alterniflora was never taller in cut than uncut plots (typically similar height under each treatment) over nine months after cutting.
A 1996 review of studies in brackish/salt marshes in the UK and the USA (1) reported mixed effects of cutting oil-contaminated vegetation on its recovery. Statistical significance was not assessed. Considering the eight cases that quantitatively compared cut and uncut areas in the field, the review suggests that cutting had no clear effect on vegetation abundance (density, biomass or cover) in four cases (50%) and a negative effect on vegetation abundance (biomass or cover) in four cases (50%). Across all 21 cases, the review suggests that “vegetation recovery” was positively affected by cutting in seven cases (33%), negatively affected by cutting in nine cases (43%), and not clearly affected by cutting in five cases (24%). These results should be interpreted carefully: the review does not report effect sizes, which may be more important than the number of studies reporting effects in a particular direction. Methods: The review included 21 cases, from 14 publications and at least 13 different marshes, in which oil-damaged vegetation in brackish/salt marshes was cut. Vegetation abundance, height or “recovery” (not clearly defined) were monitored between 14 weeks and 29 months after cutting (8–29 months after cutting for the eight quantitative studies).
A replicated, paired, controlled, site comparison study in 2007–2008 in two brackish/salt marshes in southern Brazil (2) found that cutting and removing smooth cordgrass Spartina alterniflora from oiled plots did not increase cordgrass biomass, density or height. Over the nine months following intervention, cut and uncut plots contained a similar above-ground cordgrass biomass in 5 of 8 comparisons (for which cut: 32–127; uncut: 61–159 g/m2), similar cordgrass densities in 7 of 9 comparisons (for which cut: 32–382; uncut: 35–372 plants/m2), and cordgrass of similar maximum height in 11 of 18 comparisons (for which cut: 43–102; uncut: 39–102 cm). In the other comparisons, cut plots contained less cordgrass biomass and fewer, shorter cordgrass plants. In all comparisons at least six months after intervention, all metrics (biomass, density and height) were statistically similar in cut plots, uncut plots and

10. Threat: Pollution
281
natural (undisturbed) plots (see original paper for data). Methods: Eighteen 2.5 x 2.5 m plots were established (in six sets of three) across two estuarine marshes (salinity: 12–34 ppt) dominated by smooth cordgrass. In December 2007, twelve plots (two plots/set) were sprayed with oil (ship fuel; 6 L/11 m2). One week later, vegetation was cut and removed from six of the oiled plots (one plot/set). The final six plots (one plot/set) were neither oiled nor cut. Smooth cordgrass within the plots was surveyed monthly until September 2008. To sample biomass, live cordgrass was cut, dried and weighed.
(1) Zengel S.A. & Michel J. (1996) Vegetation cutting as a clean-up method for salt and brackish marshes impacted by oil spills: a review and case history of the effects on plant recovery. Marine Pollution Bulletin, 32, 876–885.
(2) Wolinski A.L.T.O., Lana P.C. & Sandrini-Neto L. (2011) Is the cutting of oil contaminated marshes an efficient clean-up technique in a subtropical estuary? Marine Pollution Bulletin, 62, 1227–1232.
10.18.3 Cut or burn oil-contaminated vegetation: freshwater swamps
We found no studies that evaluated the effects, on vegetation, of cutting or burning oil-contaminated vegetation in freshwater swamps.
This means that we have not yet found any studies that have directly evaluated this intervention during our systematic journal and report searches. Therefore we have no evidence to indicate whether or not the intervention has any desirable or harmful effects.
10.18.4 Cut or burn oil-contaminated vegetation: brackish/saline swamps
We found no studies that evaluated the effects, on vegetation, of cutting or burning oil-contaminated vegetation in brackish/saline swamps.
This means that we have not yet found any studies that have directly evaluated this intervention during our systematic journal and report searches. Therefore we have no evidence to indicate whether or not the intervention has any desirable or harmful effects.
10.19 Stimulate microbial breakdown of oil
We found no studies that evaluated the effects, on vegetation, of stimulating microbial breakdown of oil in contaminated marshes or swamps.
This means that we have not yet found any studies that have directly evaluated this intervention during our systematic journal and report searches. Therefore we have no evidence to indicate whether or not the intervention has any desirable or harmful effects.
Background
Oil spills can damage vegetation in marshes and swamps. Lighter oils can kill plants through their toxic effects, whilst heavier oils coat and smother vegetation (Michel & Rutherford 2013). Coastal salt marshes and mangroves are vulnerable to offshore tanker spillages. An estimated 5.5 million tonnes of oil has been released into mangrove-lined coastal waters around the world since 1958, killing at least 126,000 ha of mangrove vegetation (Duke 2016). Oil pipelines crossing inland marshes or swamps (e.g. the Russia-China Oil Pipeline; Yu et al. 2010) pose a threat from leaks and malfunctions. Loss of vegetation can increase the risk of erosion and permanent habitat loss (Beland et al. 2017; https://youtu.be/UkATPicHIo4).

10. Threat: Pollution
282
This intervention includes various specific actions for bioremediation, such as introducing oil-degrading microbes, tillage or aeration to increase the amount of oxygen available to microbes in sediments, and/or fertilization to provide nutrients for microbes. For more information about implementing these techniques, see practical manuals such as ExxonMobil (2008), Michel & Rutherford (2013) and Hoff & Michel (2014). The effectiveness of interventions may depend on the type of oil, exposure to waves and currents, climate, time of year that the spill occurred, and the species involved (Michel & Rutherford 2014). CAUTION: Interventions such as tillage or aeration can cause damage to wetland soils (Michel & Rutherford 2013).
Related interventions: Use artificial barriers to block pollution (10.5); Introduce plants to marshes or swamps to control pollution (10.7); Physically or chemically remove oil (10.17); Cut or burn oil-contaminated vegetation (10.18); interventions to address the threat from infrastructure associated with oil exploitation (Chapter 5); habitat restoration and creation interventions, which may be useful after cleaning up oil (Chapter 12).
Beland M., Biggs T.W., Roberts D.A., Peterson S.H., Kokaly R.F. & Piazza S. (2017) Oiling accelerates loss of salt marshes, southeastern Louisiana. PLoS ONE, 12, e0181197.
ExxonMobil (2008) Oil Spill Response Field Manual. ExxonMobil, USA.
Hoff R, & Michel J. (2014) Oil Spills in Mangroves: Planning & Response Considerations. US Department of Commerce.
Michel J. & Rutherford N. (2013) Oil Spills in Marshes: Planning & Response Considerations. US Department of Commerce.
Michel J. & Rutherford N. (2014) Impacts, recovery rates and treatment options for spilled oil in marshes. Marine Pollution Bulletin, 82, 19–25.
Yu X., Wang G., Zou Y., Wang Q., Zhao H. & Lu X. (2010) Effects of pipeline construction on wetland ecosystems: Russia-China Oil Pipeline Project (Mohe-Daqing Section). Ambio, 39, 447–450.
Airborne pollutants
10.20 Remove pollutants from waste gases before they enter the
environment
We found no studies that evaluated the effects, on vegetation in marshes or swamps, of removing pollutants from waste gases before releasing them into the environment.
This means that we have not yet found any studies that have directly evaluated this intervention during our systematic journal and report searches. Therefore we have no evidence to indicate whether or not the intervention has any desirable or harmful effects.
Background
Atmospheric pollutants can be removed from waste gases (e.g. from industry or transport) before they enter the environment. Physical or electrostatic filters can trap dust and ash particles. Sulfur dioxide can be removed by spraying alkaline substances, such as seawater, into waste gases. Reducing emissions of atmospheric pollutants may prevent damage to marsh or swamp vegetation, or allow it to recover. Ultimately, efforts to clean up waste gases may be driven by legislation or financial incentives.
Related interventions: Clean waste water before it enters the environment (10.1).

283
11. Threat: Climate change and severe weather
Background
This chapter includes interventions that might be used to tackle threats from long-term climatic change and extreme weather events. Marshes and swamps are extremely vulnerable to climate change. Changes in precipitation and temperature can directly affect water availability and salinity. Sea level rise will flood large coastal areas, and development of new marshes or swamps inland might be limited by human development (Schuerch et al. 2018). Climatic-driven changes in phenology (the timing of events such as spring leaf emergence) could affect the functioning of marsh and swamp ecosystems and the composition of plant communities, through direct effects on organisms and feedbacks to the physical environment (Piao et al. 2019). Climate change might also affect marshes and swamps less directly. For example, if farmers receive less water from precipitation, they may extract more water from the environment, leaving less available for marshes and swamps.
Marshes and swamps are also vulnerable to severe weather such as strong winds (Long et al. 2016), storm surges (Herbert et al. 2015), heavy rainfall (Zedler 1983) and drought (Ibáñez & Caiola 2013). Severe weather events are expected to become more common and more intense in the future (IPCC 2014).
Note that conserving wetlands such as marshes and swamps could, in itself, reduce the severity of climate change. Wetlands are a key store of carbon, containing at least 44% of all carbon stored in terrestrial ecosystems (Mitra et al. 2005). Wetlands might also be employed to mitigate impacts of climate change, for example by slowing the flow of floodwaters. Evidence on these topics is beyond the scope of this synopsis.
Related chapters: Threat: Natural system modifications, including wild fire (Chapter 8); Threat: Invasive and other problematic species, which may benefit from climate change (Chapter 9); Threat: Pollution, including debris deposited by storms (Chapter 10); Habitat restoration and creation interventions, which may be used to prevent or mitigate impacts of climate change on marshes and swamps (Chapter 12).
Herbert E.R., Boon P., Burgin A.J., Neubauer S.C., Franklin R.B., Ardón M., Hopfensperger K.N., Lamers L.P.M. & Gell P. (2015) A global perspective on wetland salinization: ecological consequences of a growing threat to freshwater wetlands. Ecosphere, 6, Article 206.
Ibáñez C. & Caiola N. (2013) Impacts of water scarcity and drought on Iberian aquatic ecosystems. Pages 169–184 in: K. Schwabe, J. Albiac, J. Connor, R. Hassan & L. Meza González (eds.) Drought in Arid and Semi-Arid Regions. Springer, Dordrecht.
IPCC (2014) Climate Change 2014: Synthesis Report. Contribution of Working Groups I, II and III to the Fifth Assessment Report of the Intergovernmental Panel on Climate Change. IPCC, Geneva, Switzerland.
Long J., Giri C., Primavera J. & Trivedi M. (2016) Damage and recovery assessment of the Philippines’ mangroves following Super Typhoon Haiyan. Marine Pollution Bulletin, 109, 734–743.
Mitra S., Wassman R. & Velk P.L.G. (2005) An appraisal of global wetland area and its organic carbon stock. Current Science, 88, 25–35.
Piao S., Liu Q., Chen A., Janssens I.A., Fu Y., Dai J., Liu L., Lian X., Shen M. & Zhu X. (2019) Plant phenology and global climate change: current progresses and challenges. Global Change Biology, 25, 1922–1940.
Schuerch M., Spencer T., Temmerman S., Kirwan M.L., Wolff C., Lincke D., McOwen C.J., Pickering M.D., Reef R., Vafeidis A.T., Hinkel J., Nicholls R.J. & Brown S. (2018) Future response of global coastal wetlands to sea level rise. Nature, 561, 231–234.
Zedler J.B. (1983) Freshwater inputs in normally hypersaline marshes. Estuaries, 6, 346–355.

11. Climate change and severe weather
284
11.1 Add water to marshes or swamps to compensate for drought
We found no studies that evaluated the effects, on vegetation, of adding water to marshes or swamps to compensate for drought.
This means that we have not yet found any studies that have directly evaluated this intervention during our systematic journal and report searches. Therefore we have no evidence to indicate whether or not the intervention has any desirable or harmful effects.
Background
Water may be added to marshes or swamps to compensate for meteorological drought: periods of water shortage linked to below-average precipitation. Long periods with dry soils, which may be accompanied by increases in salinity, can kill or change the composition of vegetation (e.g. Visser et al. 2002). Water may be added to a site for weeks, months or years, depending on the duration of the drought. Longer periods of water additions are less likely to be sustainable, both financially and in terms of damage to other ecosystems which may be deprived of water. CAUTION: The added water must be of a suitable chemical composition for the target habitat (e.g. correct pH and salinity and not excessively polluted). Consider that adding water to a focal site could deprive habitats elsewhere.
Related interventions: Raise water level to restore degraded marshes or swamps (8.1); Raise water level to restore/create marshes or swamps from other land uses (12.4); Actively manage water level (8.4); interventions to tackle wild fires, which could be associated with droughts (8.19–8.22).
Visser J.M., Sasser C.E., Chabreck R.H. & Linscombe R.G. (2002) The impact of a severe drought on the vegetation of a subtropical estuary. Estuaries, 25, 1184–1195.
11.2 Build barriers to protect littoral marshes or swamps from
rising water levels and severe weather
Background
Littoral wetlands (on sea or lake shores) are vulnerable to physical damage from strong waves, and from excessive flooding linked to storm surges and rising water levels. These threats may be reduced by building barriers such as dykes, walls, breakwaters, reefs, groynes, coconut-fibre rolls or even additional marshes or swamps. Barriers can provide some immediate shelter from wave energy. They can also encourage sediment deposition, potentially helping existing marshes or swamps to keep up with sea level rise or building a surface at suitable elevation for emergent vegetation (Wetlands International 2016). Barriers could be installed temporarily to protect colonizing vegetation, or could be used as permanent protection.
CAUTION: Littoral areas are naturally exposed to wind, waves and flooding. Some disturbance from these elements may be necessary to maintain a diversity of coastal habitats and normal wetland functions. For example, restricting tidal influx to coastal marshes may limit their natural tendency to accumulate sediment and organic matter to keep up with sea level rise (Redfield & Rubin 1962; Nyman et al. 2006). If barriers are left in place for many years, it may not be possible to ever remove them without flooding the marshes or swamps they were intended to protect.

11. Climate change and severe weather
285
Related interventions: Build barriers to protect littoral areas from boat wakes (7.3); Divert/replace/block saltwater inputs (8.5); Use artificial barriers to block pollution (10.5); Use fences or barriers to protect planted areas (13.19).
Nyman J.A., Walters R.J., Delaune R.D. & Patrick W.H. Jr. (2006) Marsh vertical accretion via vegetative growth. Estuarine, Coastal and Shelf Science, 69, 370–380.
Redfield A.C. & Rubin M. (1962) The age of salt marsh peat and its relation to recent changes in sea level at Barnstable, Massachusetts. Proceedings of the National Academy of Sciences USA, 48, 1728–1735.
Wetlands International (2016) Mangrove restoration: To Plant or Not To Plant? Available at https://www.wetlands.org/publications/mangrove-restoration-to-plant-or-not-to-plant/. Accessed 1 February 2020.
11.2.1 Build barriers to protect littoral freshwater marshes from rising
water levels and severe weather
We found no studies that evaluated the effects, on vegetation, of building barriers to protect littoral freshwater marshes from rising water levels and severe weather.
This means that we have not yet found any studies that have directly evaluated this intervention during our systematic journal and report searches. Therefore we have no evidence to indicate whether or not the intervention has any desirable or harmful effects.
11.2.2 Build barriers to protect littoral brackish/salt marshes from rising
water levels and severe weather
Five studies evaluated the effects, on vegetation, of building barriers to protect littoral brackish/ salt marshes from rising water levels and severe weather. Three studies were in the USA2–4, one was in Italy1 and one was in the Netherlands5.
VEGETATION COMMUNITY
Overall extent (3 studies): Two controlled studies (one also replicated, randomized, paired) in Italy1 and the USA4 found that protecting salt marshes with offshore structures had no significant effect on the seaward limit of emergent vegetation, after 17–27 months. It was similar1, or retreated at a similar rate4, in protected and unprotected marshes. One replicated, randomized, paired, controlled study in the USA2 found that brackish marshes protected with oyster shell reefs receded less, over one year, than unprotected marshes.
Community composition (1 study): One replicated, site comparison study in the Netherlands5 reported that marshes protected with low sea walls had a similar overall plant community composition to nearby natural salt marshes, 15–22 years after the walls were built.
Overall richness/diversity (2 studies): One controlled study in Italy1 reported that a salt marsh protected with an offshore fence contained more plant species, after 17 months, than an unfenced marsh. One replicated, site comparison study in the Netherlands5 recorded 85 plant and algal species across two salt marshes that had developed behind low sea walls, over 15–22 years, compared to 155 species recorded across multiple natural marshes in the region.
VEGETATION ABUNDANCE
Overall abundance (2 studies): Two controlled studies (one also replicated, randomized, paired) in Italy1 and the USA2 found that brackish/salt marshes protected with offshore structures contained a similar total amount of vegetation to unprotected marshes. This was true for cover1,2 and biomass2.
Individual species abundance (2 studies): One replicated, paired, site comparison study in the USA3 found that salt marshes protected with offshore breakwaters (and planted with cordgrasses Spartina spp.) typically contained less smooth cordgrass S. alterniflora, after 2–3 growing seasons,

11. Climate change and severe weather
286
than nearby natural marshes. One replicated, site comparison study in the Netherlands5 reported that in marshes protected with low sea walls for 15–22 years and nearby natural salt marshes, the same plant species were the most frequent.
VEGETATION STRUCTURE
Height (1 study): One replicated, paired, site comparison study in the USA3 found that salt marshes protected with offshore breakwaters (and planted with cordgrasses Spartina spp.) contained shorter smooth cordgrass S. alterniflora plants, after 2–3 growing seasons, than nearby natural marshes.
A controlled study in 1994–1995 of two salt marshes in northern Italy (1) reported that a salt marsh behind a sediment fence contained more plant species than an exposed salt marsh, but found that there was no significant difference in vegetation cover or distribution. After 17 months, three plant species were recorded in the fenced marsh, compared to only one species in the exposed marsh. The marshes did not significantly differ in terms of vegetation cover (fenced: 29%; exposed: 19%) or distance between the physical edge of the marsh sediment and the vegetation (fenced: 7.5 m; exposed: 9.1 m). Methods: The study involved two intertidal salt marshes behind embayments. In May 1994, a fence (vegetation bundles behind wooden posts) was built across the mouth of one embayment to trap sediment and protect the marsh behind from waves. The other embayment was left open. In October 1995, vegetation was surveyed along the edge of each marsh (14–16 points/marsh; species and cover within a 1 m radius around each point).
A replicated, randomized, paired, controlled study in 2002–2003 of brackish marsh around a lake in Louisiana, USA (2) found that installing offshore oyster shell reefs reduced the rate of shoreline retreat, but had no significant effect on vegetation cover or biomass within the marshes. Over one year, the rate at which the vegetated shoreline receded was lower for marshes behind oyster shell reefs (8 cm/month) than for unprotected marshes (12 cm/month). Over the year, vegetation cover and above-ground vegetation biomass were statistically similar in marshes behind oyster shell reefs and in unprotected marshes (data not reported). Methods: The study used twelve sections of shoreline (six in a high-energy area, six in a low-energy area) around one coastal lake. All had brackish marsh landward. Oyster shell reefs (25 m long and exposed at low tide) were deposited <5 m offshore of six random sections (three high-energy, three low-energy). The other six sections were left unprotected. Vegetation was surveyed for one year after reefs were installed: three measurements/ section/month for shoreline position (i.e. edge of marsh vegetation); nine 1-m2 quadrats/section/month for cover of each plant species; three 0.25-m2 quadrats/section/quarter for biomass (vegetation cut, dried and weighed).
A replicated, paired, site comparison study in 2001–2004 of six salt marshes in North Carolina, USA (3) found that restored marshes – protected with breakwaters and planted with cordgrasses Spartina spp. – typically contained less, and shorter, smooth cordgrass than natural marshes. Averaged over the 22 or 31 months after intervention, smooth cordgrass cover was lower in restored than natural marshes in three of three comparisons (restored: 10–26%; natural: 33–46%). Smooth cordgrass density was lower in restored than natural marshes in two of three comparisons (for which restored: 70–162 stems/m2; natural: 150–222 stems/m2; other comparison no significant difference). Smooth cordgrass plants were shorter in restored than natural marshes in three of three comparisons (restored: 50–62 cm; natural: 64–82 cm). Methods: Between autumn 2001 and summer 2002, three degraded salt marshes were restored. Rocky breakwaters were built offshore, then cordgrasses Spartina spp.

11. Climate change and severe weather
287
(mainly smooth cordgrass Spartina alterniflora) were planted. The study does not distinguish between the effects of the breakwaters and planting on non-planted vegetation. For each protected/planted marsh an adjacent, physically similar, natural marsh was selected for comparison. Smooth cordgrass was monitored along transects each spring and autumn for up to 31 months after intervention. Cover was estimated in 1-m2 plots, stems were counted in 0.25-m2 subplots, and the three tallest stems/plot were measured.
A replicated, randomized, paired, controlled study in 2007–2009 of two salt marshes in Alabama, USA (4) found that installing offshore oyster shell reefs had no significant effect on the rate of shoreline retreat. Over approximately two years, the vegetated shoreline receded by a statistically similar amount whether it was behind an oyster shell reef (3.1–5.1 m retreat) or left unprotected (4.5–5.5 m retreat). Methods: The study used eight sites across two rapidly eroding shorelines. At four sites (two random sites/shoreline), oyster shell was deposited just offshore to form a breakwater (three 5 x 25 m sections; top exposed during low tides). The shell was placed on geotextile fabric and anchored in place with plastic mesh. It was colonized by oysters Crassostrea virginica. The other four sites were left unprotected. Stakes were inserted at the seaward limit of emergent vegetation when the reefs were constructed. Retreat relative to these stakes was measured over 24–27 months.
A replicated, site comparison study in 2011–2013 of salt marshes in the Netherlands (5) reported that degraded marshes behind low sea walls developed similar plant/algal communities to natural salt marshes within 15–22 years, but contained fewer plant/algal species. The overall plant/algal community composition in protected salt marshes fell within the range of the community composition of natural marshes (data reported as graphical analyses; statistical significance of similarity not assessed). In both protected and natural marshes, the most common species were glasswort Salicornia europaea (present in 59–66% of quadrats), saltmarsh grass Puccinellia maritima (59–63%) and seablite Suaeda maritima (58–62%). However, only 85 species of plants and algae were recorded in the protected salt marshes, compared to 155 species recorded in natural salt marshes in the region. Protected marshes were missing some of the rarer species present in natural marshes. Methods: In 2011 and 2013, cover of every plant and algal species was recorded (in 148 circular 4-m2 quadrats) across two coastal salt marshes in the Dutch Wadden Sea. The marshes had developed behind low sea walls (10–60 m from the salt marsh edge, extending 1 m above mean sea level) built in 1991 and 1998 to protect remnant, eroding marsh vegetation. Previously published data, from 6,198 quadrats in natural marshes across the Dutch Wadden Sea, were used for comparison.
(1) Scarton F., Day J.W. Jr., Rismondo A., Cecconi G. & Are D. (2000) Effects of an intertidal sediment fence on sediment elevation and vegetation distribution in a Venice (Italy) lagoon salt marsh. Ecological Engineering, 16, 223–233.
(2) Piazza B.P., Banks P.D. & La Peyre M.K. (2005) The potential for created oyster shell reefs as a sustainable shoreline protection strategy in Louisiana. Restoration Ecology, 13, 499–506.
(3) Currin C.A., Delano P.C. & Valdes-Weaver L.M. (2008) Utilization of a citizen monitoring protocol to assess the structure and function of natural and stabilized fringing salt marshes in North Carolina. Wetlands Ecology and Management, 16, 97–118.
(4) Scyphers S.B., Powers S.P., Heck K.L. Jr. & Byron D. (2011) Oyster reefs as natural breakwaters mitigate shoreline loss and facilitate fisheries. PLoS ONE, 6, e22396.
(5) van Loon-Steensma J.M., van Dobben H.F., Slim P.A., Huiskes H.P.J. & Dirkse G.M. (2015) Does vegetation in restored salt marshes equal naturally developed vegetation? Applied Vegetation Science, 18, 674–682.

11. Climate change and severe weather
288
11.2.3 Build barriers to protect littoral freshwater swamps from rising
water levels and severe weather
We found no studies that evaluated the effects, on vegetation, of building barriers to protect littoral freshwater swamps from rising water levels and severe weather.
This means that we have not yet found any studies that have directly evaluated this intervention during our systematic journal and report searches. Therefore we have no evidence to indicate whether or not the intervention has any desirable or harmful effects.
11.2.4 Build barriers to protect littoral brackish/saline swamps from
rising water levels and severe weather
We found no studies that evaluated the effects, on vegetation, of building barriers to protect littoral brackish/saline swamps from rising water levels and severe weather.
This means that we have not yet found any studies that have directly evaluated this intervention during our systematic journal and report searches. Therefore we have no evidence to indicate whether or not the intervention has any desirable or harmful effects.
11.3 Designate zones for migration of marshes or swamps as
climate changes
We found no studies that evaluated the effects, on vegetation, of designating zones for migration of marshes or swamps under climate change.
This means that we have not yet found any studies that have directly evaluated this intervention during our systematic journal and report searches. Therefore we have no evidence to indicate whether or not the intervention has any desirable or harmful effects.
Background
Areas could be left undeveloped as spaces for migration of marshes and swamps as climate changes and sea levels rise. This philosophy should be integrated into urban planning, especially along coastlines (Green et al. 2009). For example, in Yankeetown on the coast of Florida, USA, development is prohibited within 50 feet of a wetland to allow space for migration with sea level rise (Anon 2016). Areas for migration should be of reasonable size and ideally connected to existing marshes or swamps. Barriers to habitat migration, such as roads and embankments, may need to be actively removed. Long-term land ownership issues should be considered; it may be necessary to purchase areas designated for habitat migration (DELWP 2016).
We realize that providing evidence for the effects of this intervention will be difficult, but include the intervention for completeness: it is something that could be done to conserve marsh or swamp vegetation.
Anon (2016) Yankeetown Comprehensive Plan Vol. II (adopted 23 March 2009/updated with amendments 25 April 2016). Available at https://yankeetownfl.govoffice2.com/?SEC=3509A776-0A50-4489-9E09-CA04B996CE3A. Accessed 17 November 2020.
DELWP (2016) Climate Change Vulnerability and Adaptive Capacity of Coastal Wetlands. Decision Support Framework, Vol. 1. Department of Environment, Land, Water and Planning, Victoria, Australia.
Green J., Reichelt-Brushett A. & Jacobs S.W.L. (2009) Re-establishing a saltmarsh vegetation structure in a changing climate. Ecological Management & Restoration, 10, 20–30.

11. Climate change and severe weather
289
11.4 Restore/create marshes or swamps in areas that will be
climatically suitable in the future
Background
It may be wise to prioritize restoration or creation of marshes or swamps in areas that will remain – or become more – climatically suitable in the future, rather than areas that are destined to become unsuitable. These areas will provide space for existing vegetation to move into as their current sites become to dry, wet, warm or cold (Oliver et al. 2012).
Related interventions: interventions to restore or manage water levels (Chapter 8); specific habitat restoration and creation interventions (Chapter 12).
Oliver T.H., Smithers R.J., Bailey S., Walmsley C.A. & Watts K. (2012) A decision framework for considering climate change adaptation in biodiversity conservation planning. Journal of Applied Ecology, 49, 1247–1255.
11.4.1 Restore/create freshwater marshes in areas that will be
climatically suitable in the future
We found no studies that evaluated the effects, on vegetation, of restoring or creating freshwater marshes in areas expected to be climatically suitable in the future.
This means that we have not yet found any studies that have directly evaluated this intervention during our systematic journal and report searches. Therefore we have no evidence to indicate whether or not the intervention has any desirable or harmful effects.
11.4.2 Restore/create brackish/salt marshes in areas that will be
climatically suitable in the future
We found no studies that evaluated the effects, on vegetation, of restoring or creating brackish/salt marshes in areas expected to be climatically suitable in the future.
This means that we have not yet found any studies that have directly evaluated this intervention during our systematic journal and report searches. Therefore we have no evidence to indicate whether or not the intervention has any desirable or harmful effects.
11.4.3 Restore/create freshwater swamps in areas that will be
climatically suitable in the future
We found no studies that evaluated the effects, on vegetation, of restoring or creating freshwater swamps in areas expected to be climatically suitable in the future.
This means that we have not yet found any studies that have directly evaluated this intervention during our systematic journal and report searches. Therefore we have no evidence to indicate whether or not the intervention has any desirable or harmful effects.
11.4.4 Restore/create brackish/saline swamps in areas that will be
climatically suitable in the future
One study evaluated the effects, on vegetation, of restoring or creating brackish/saline swamps in areas expected to be climatically suitable in the future. The study was in South Africa.
VEGETATION COMMUNITY

11. Climate change and severe weather
290
Overall extent (1 study): One before-and-after study in an estuary in South Africa1 reported that over 42 years after planting mangrove trees just beyond their current range, the area of mangrove forests increased.
VEGETATION ABUNDANCE
VEGETATION STRUCTURE
A before-and-after study in 1969–2011 in an estuary in South Africa (1) reported that over 42 years after planting mangrove trees just outside their current range, the area of mangrove vegetation increased. Before planting, there were no mangroves present in the estuary. In the year after planting (1970), mangrove forests could not be identified on aerial photographs. Forty-two years after planting (2011), mangrove forests had established and covered 1.6 ha. Although mangroves encroached into and replaced existing salt marshes, the area of salt marsh in the estuary actually increased slightly over time (1970: 2.9 ha; 2011: 3.1 ha). Salt marshes developed on newly deposited sediment. Methods: In 1969, twenty-five grey mangrove Avicennia marina trees (age unclear) were planted into salt marsh in the Nahoon Estuary. This site is 60 km south of naturally occurring mangrove forests in South Africa. “A few” mangrove trees of other species were planted “a few” years later. The area of mangrove forest and salt marsh in the estuary was determined from aerial photographs (taken 1970–2004), satellite images (taken 2004–2010) and field surveys (2011).
(1) Hoppe-Speer S.C.L., Adams J.B. & Rajkaran A. (2015) Mangrove expansion and population structure at a planted site, East London, South Africa. Southern Forests, 77, 131–139.

291
12. Habitat restoration and creation
Background
This chapter addresses general restoration and creation of marshes and swamps. Interventions here could be used to address multiple threats from previous chapters.
Following Mitsch & Gosselink (2015), we define creation as the conversion of a non-wetland area (i.e. persistent upland or aquatic habitat) into a marsh or swamp, or conversion of one persistent wetland type into another (e.g. converting a mudflat into a marsh. We define restoration as returning a marsh or swamp from a disturbed or altered condition towards a previously existing condition. In this sense restoration may, but almost always does not, return the habitat exactly to that previous condition. This may be impossible due to physical environmental changes. Further, because ecosystems naturally change in character through time, the previous condition may not reflect how the site would be now had it not been disturbed (Hughes et al. 2012). This chapter also includes some studies aiming to enhance or rehabilitate marshes and swamps, since they often involve the same interventions as creation or restoration.
Within this chapter, there are separate sections for studies testing:
(a) Unclear interventions, and combinations of multiple interventions where it is difficult to separate out the effects of any single intervention.
(b) Interventions that modify the physical habitat, to create more favourable conditions for desirable/focal/target plants. If studies test the combined effect of physical habitat modifications and planting, they are included in this section if they report outcomes related to or including non-planted vegetation.
(c) Interventions that introduce desirable marsh or swamp vegetation. There is often some modification of the physical environment beforehand or afterwards to create suitable conditions. This section deviates slightly from the general structure of the synopsis: interventions are split based on the type of vegetation introduced (non-woody plants vs trees/shrubs) rather than the target habitat.
Deciding whether to use interventions from part (b) and/or (c) is not always straightforward. Modifying the physical habitat without introducing vegetation is often a cheaper approach and may allow assembly of a community better suited to local conditions. However, this assembly might take a long time, if it occurs at all. Introducing vegetation might be particularly important when creating marshes or swamps from scratch (where there is no seed bank of target species), if the focal site is isolated from natural marshes or swamps (so there are limited inputs of seeds and other propagules) and/or if invasive species are a concern (quickly establishing native vegetation could limit invasions). When planning to create a marsh or swamp, it is also important to consider the effects of loss of the existing habitat.
Related chapters: chapters focused on specific threats and interventions to tackle them (Chapters 2–11); Actions to complement planting (Chapter 13); Habitat protection, including laws and agreements to encourage restoration or creation (Chapter 14).
Hughes F.M.R., Adams W.M. & Stroh P.A. (2012) When is open-endedness desirable in restoration projects? Restoration Ecology, 20, 291–295.
Mitsch W.J. & Gosselink J.G. (2015) Wetlands, Fifth Edition. Wiley, New Jersey.

12. Habitat restoration and creation
292
General habitat restoration and creation
12.1 Restore/create marshes or swamps (specific intervention
unclear)
Background
This section includes studies that aimed to “restore” or “create” marshes or swamps, but did not clearly describe the specific intervention(s) that were done. Commonly, this occurs when the primary focus of a study is an animal taxon, so details of vegetation restoration were not deemed relevant by the authors. Alternatively, if the study involves interventions carried out historically, details of the intervention may be unavailable.
Several studies in this section refer to conservatism scores and a floristic quality index. Conservatism scores reflect the fidelity of individual plant species to undegraded natural habitats in the study region. The floristic quality index is the product of the average conservatism score for all plant species in a community and the square root of the number of species.
This section does not include studies that simply report the area or number of sites “restored” or “created”, without quantifying the vegetation in those sites.
12.1.1 Restore/create freshwater marshes or swamps (specific
intervention unclear)
Twenty-five studies evaluated the effects, on vegetation, of restoring/creating freshwater marshes or swamps using unclear or incompletely described interventions. Twenty-three studies were in the USA1–19,21,22,24,25. Two were in Canada20,23. Two of the studies7,8 used the same set of wetlands.
VEGETATION COMMUNITY
Community types (1 study): One replicated, site comparison study in the USA7 reported that created wetlands had greater coverage of herbaceous vegetation after 7–8 years than natural wetlands, but lower coverage of forest and shrubby vegetation.
Community composition (17 studies): Four replicated, site comparison studies in the USA3,4,8,21 found that the overall plant community composition in created freshwater wetlands differed from the community in natural wetlands, after 1–21 years. Two replicated, site comparison studies in the USA10 and Canada23 reported mixed effects of freshwater marsh restoration/creation on overall algal10 or plant23 community composition, depending on the habitat10,23 and use of mining waste during creation23. Of four replicated, site comparison studies in the USA and Canada, three6,20,24
reported lower quality vegetation in restored/created wetlands than in natural wetlands, but one11 reported similar vegetation quality in created and natural wetlands. Two replicated, site comparison studies in the USA5,8 found that created marshes developed a plant community characteristic of similar wetness to natural marshes within 4–21 years – but in one study5, this was only true for created marshes >10 years old. Seven replicated studies in the USA4,9,12,15,16,18,22 simply quantified the composition, quality or wetness of the plant community up to 22 years after wetland restoration/ creation.
Overall richness/diversity (17 studies): Eleven replicated studies, in the USA1,3–6,8,11,13,19,21 and Canada23, compared overall plant richness/diversity in created/restored and natural/unmanaged

12. Habitat restoration and creation
293
freshwater wetlands. Five of the studies6,11,13,19,21 found that created/restored wetlands typically had similar plant taxonomic richness to natural/unmanaged wetlands. Three of the studies1,4,5 reported lower species richness in created than natural wetlands after 1–18 years. Two of the studies3,8 reported higher species richness in created than natural wetlands after 1–21 years. The final study23 reported mixed effects of marsh creation on plant species richness, depending on the vegetation zone and use of mining waste during creation. Two of the studies8,11 reported identical results for plant diversity as for richness (similar11 or greater8 in created vs natural wetlands) but one study19 found that the effect of management on plant diversity depended on the timing of drawdown. Six replicated studies in the USA2,9,12,15,17,18 simply quantified overall plant species richness2,9,12,15,17,18 and/or diversity12 over 1–16 years after wetland restoration/creation.
Native richness/diversity (3 studies): Of two replicated, site comparison studies of freshwater wetlands in the USA, one3 found that restored/created wetlands contained more native plant species than natural wetlands after 1–11 years. The other6 found that restored wetlands contained fewer native plant species than natural wetlands after 2–8 years. One replicated study of swamp restoration sites in the USA25 simply quantified native plant richness over 1–8 years after intervention.
VEGETATION ABUNDANCE
Overall abundance (7 studies): Six replicated studies, all in the USA1,4,5,10,13,14, compared overall vegetation abundance in created/restored and natural wetlands. Four of the studies4,5,10,13 found that created/restored freshwater wetlands contained less vegetation (cover4,5,10 or biomass13) than natural wetlands after 1–18 years. Two of the studies1,14 found that created and natural fresh/ brackish/saline wetlands contained a similar amount of vegetation (overall cover1,14 and density1; wetland plant cover14) after >1 year. One of these studies14 reported that restored wetlands had lower vegetation cover than natural marshes – but this reflected management goals. One replicated study in the USA18 simply quantified total vegetation cover and biomass 3–10 years after marsh creation.
Herb abundance (2 studies): One replicated, site comparison study in the USA8 reported that created wetlands had greater overall cover of herb species, after 7–8 years, than natural wetlands. One replicated study in the USA22 simply quantified herb biomass in wetland restoration sites after 7–22 years.
Tree/shrub abundance (1 study): One replicated study in the USA22 simply quantified the density of woody vegetation in wetland restoration sites after 7–22 years.
Algae/phytoplankton abundance (1 study): One replicated, site comparison study in the USA10 found that ≤15-year-old restored freshwater marshes contained a similar phytoplankton biomass to natural marshes.
Individual species abundance (9 studies): Nine studies1–3,6–9,12,21 quantified the effect of this intervention on the abundance of individual plant species. For example, one replicated, site comparison study in the USA1 found that created and natural freshwater marshes supported a similar abundance of pickerelweed Pontederia cordata after 1–11 years.
VEGETATION STRUCTURE
A replicated, site comparison study in 1993 of 20 freshwater marshes in Florida, USA (1) found that stands dominated by pickerelweed Pontederia cordata had similar vegetation cover and density in created and natural marshes. After 1–11 years, pickerelweed-dominated stands contained a statistically similar abundance of vegetation in created marshes and natural marshes. This was true for pickerelweed cover (created: 54%; natural: 55%) and density (created: 157 stems/m2; natural: 164 stems/m2). Ignoring one unusual natural site, the same was also true for non-pickerelweed cover (created: 20%; natural: 39%) and density (created: 31 stems/m2;

12. Habitat restoration and creation
294
natural: 35 stems/m2). Twelve plant species were recorded in pickerelweed stands across all the created marshes (vs 15 species in natural marshes). Methods: In summer 1993, vegetation was surveyed in pickerelweed-dominated stands within ten marshes created after mining, and ten natural marshes (fifteen 0.5-m2 quadrats/ marsh). All marshes were 1–80 ha in area. Created marshes had been excavated between 1982 and 1992. Some were probably amended with wetland soil and/or planted with wetland plants, although details of wetland creation are not clear. The study did not attempt to measure the overall vegetation composition of the marshes, only that of pickerelweed stands.
A replicated study in 1994 of five freshwater wetland restoration/creation sites in Ohio, USA (2) reported that four of the sites contained the desired emergent vegetation within four years, and that wetland-characteristic species made up at least 45% of the vegetation cover in each site. Restoration/creation was intended to replace areas of emergent wetland vegetation. After approximately 1–4 years, four of five sites did contain emergent wetland vegetation (other site: submerged vegetation surrounded by upland). Across all sites, wetland areas contained 4–52 plant species (excluding “unidentified grasses”). Wetland species made up 65–100% of vegetation cover. Wetland-characteristic species made up 45–100% of vegetation cover. For data on the absolute cover of individual plant species, see original paper. Methods: In 1994, vegetation was surveyed in 0.25-m2 quadrats (number not clear) in five wetland restoration/creation sites. The sites were approximately 1–4 years old. Interventions were not clearly reported by included excavation, rewetting or other management of water inputs and outputs, planting herbs, planting trees/shrubs, and invasive species removal. Surveys included emergent, floating and submerged vegetation in wetland habitats only, and where water was <1 m deep.
A replicated, site comparison study in 1993 of 96 freshwater wetlands in Oregon, USA (3) found that restored/created wetlands contained a different overall plant community to natural wetlands, with more plant species, after 1–11 years. The overall plant community composition differed significantly between restored/created and natural wetlands (data reported as graphical analyses). Although 220 of 365 recorded plant taxa occurred in both restored/created and natural wetlands, 86 occurred only in the former and 59 only in the latter. Amongst restored/created wetlands, the overall plant community composition changed over time: wetlands >3 years old contained a significantly different community to wetlands ≤3 years old. Finally, restored/created wetlands contained more plant species (overall: 41; native: 19; non-native: 19 species/wetland) than natural wetlands (overall: 30; native: 13; non-native: 15 species/wetland). For data on the frequency of some individual plant species, see original paper. Methods: In summer 1993, plant species were recorded in 96 wetlands (approximately fifty-seven 1-m2 quadrats/wetland). Fifty-one wetlands had been restored or created 1–11 years previously. The study does not report details of restoration/creation methods. Forty-five wetlands were naturally occurring. All wetlands were ≤2 ha in size and were dominated by wet meadows, emergent marshes, floating vegetation and/or open water. Restored/created wetlands were wetter than natural wetlands, with 52% of their area flooded during the growing season (vs 21% in natural wetlands).
A replicated, paired, site comparison study in 1997 of 69 restored/created wetlands in Massachusetts, USA (4) found that they contained different plant communities to remnant natural wetlands, with fewer plant species and lower cover. After 3–12 years, restored/created sites contained a plant community characteristic of

12. Habitat restoration and creation
295
wetland conditions (data reported as a wetland indicator index). However, the overall plant community composition typically differed between restored/created wetlands and remnant natural wetlands (similarity <38% in 66 of 69 cases; statistical significance not assessed). The restored/created wetlands also had fewer plant species (restored/created: 9; natural: 11), fewer wetland plant species (restored/ created: 8; natural: 10), and lower vegetation cover (all plants and wetland plants; data not reported). Methods: In summer 1997, vegetation was surveyed in 69 pairs of wetlands. Each pair included one wetland restoration/creation project and one remnant natural wetland. One representative 15 x 30 m plot was surveyed in each wetland. The restoration/creation projects were intended to compensate for damage to wetlands from development projects. The study included both marshes and swamps (number of each not clearly reported).
A replicated, site comparison study in 1995 of 26 freshwater marshes in Pennsylvania, USA (5) found that created marshes developed a wetland-characteristic plant community after 10 years, but had lower plant species richness and vegetation cover than reference (disturbed and pristine) marshes for up to 18 years. The overall plant community in >10-year-old created sites was characteristic of true wetlands, just like the community in reference wetlands. However, the overall plant community in <10-year-old created sites was characteristic of significantly drier conditions (data reported as a wetland indicator index). Regardless of age, created wetlands had a lower average plant species richness (3–6 species/79 m2) and vegetation cover (65–75%) than reference wetlands (10 species/79 m2; 95% cover). Methods: In June–August 1995, vegetation was surveyed across 26 freshwater marshes. Twelve marshes (0.2–5.3 ha) had been created in uplands approximately 2–18 years previously. The study does not report details of wetland creation methods. Fourteen reference marshes (0.1–2.1 ha), ranging from “disturbed” to “pristine”, were used for comparison. Plant species were recorded in 5-m radius circular plots, spaced 20 m apart across the whole of each wetland. Vegetation cover was recorded in a 0.25-m2 quadrat within each plot.
A replicated, site comparison study in 1995 of 53 prairie pothole wetlands across four complexes in North Dakota, USA (6) found that restored wetlands contained lower quality vegetation and fewer native plant species than natural wetlands after 2–8 years, but a similar total number of plant species to natural wetlands after 5–8 years. In all three restored complexes, the native wetland vegetation was of lower quality (i.e. less characteristic of undisturbed local habitats) than in a natural complex (data reported as conservatism scores and a floristic quality index). However, vegetation quality increased with time since restoration. In all three restored complexes, wetlands contained fewer regional native plant species (27–34 species/wetland) than wetlands in the natural complex (44 species/wetland). However, in the two oldest restored complexes, wetlands contained a similar number of plant species in total (50–51 species/wetland) to wetlands in the natural complex (56 species/wetland). For data on the frequency of individual plant species, see original paper. Methods: In summer 1995, plant species were recorded in 53 depressional wetlands. There were 11–14 wetlands in each of three complexes restored two, five and eight years previously. Restoration methods were not clearly reported, but involved reseeding grasslands around the wetlands. No native wetland species were planted. Sixteen wetlands were within a natural, relatively undisturbed wetland complex. Restored wetlands spanned a similar range of sizes and flooding regimes to the natural wetlands.

12. Habitat restoration and creation
296
A replicated, site comparison study in 2001–2002 of 15 freshwater wetlands in West Virginia, USA (7) reported differences in the area and cover of vegetation between created and natural marshes after 4–21 years. Results summarized for this study are not based on assessments of statistical significance. Created wetlands were 0% forest by area (vs natural wetlands: 5%), only 5% shrubs (vs natural: 41%), 54% herbaceous (vs natural: 44%) and 41% open water (vs natural: only 9%). Plant species with different cover in created and natural wetlands included reed canary grass Phalaris arundinacea (created: 7%; natural: 0%), common rush Juncus effusus var. effusus (created: 5%; natural: <1%), tussock sedge Carex stricta (created: <1%; natural: 4%) and broadleaf cattail Typha latifolia (created: 1%; natural: 7%). Methods: In summer 2001 and 2002, vegetation was surveyed in fifteen wetlands: eleven created/restored 4–21 years previously (details not reported) and four natural (undisturbed). Coverage of vegetation types was estimated across each wetland, and cover of individual species was estimated in at least five 1-m2 quadrats/vegetation type/wetland. This study used the same sites as (8).
A replicated, site comparison study in 2001–2002 of 15 freshwater wetlands in West Virginia, USA (8) found that created wetlands contained different, richer and more diverse vegetation to natural wetlands, but with a similar proportion of wetland species and total herb cover. After 4–21 years, both created and natural sites contained wetland-characteristic plant communities (data reported as a wetland indicator index). However, the plant species composition significantly differed between created and natural wetlands (data reported as a graphical analysis). Created wetlands supported a greater abundance of non-native and early-colonizing species (e.g. reed canary grass Phalaris arundinacea; see Study 7 and original paper for cover data). Created wetlands had greater plant species richness on average (13 species/500 m2) than natural wetlands (8 species/500 m2). The same was true for diversity (data reported as a diversity index). In contrast, created and natural wetlands contained a statistically similar percentage of wetland-characteristic species (created: 79%; natural: 90% of all plant species) and total cover of herb species (created: 39%; natural: 54%). Methods: In summer 2001 and 2002, vegetation was surveyed in fifteen wetlands: eleven created/restored 4–21 years previously (details not reported) and four natural (undisturbed). Plant species were recorded in at least one 500-m2 plot/vegetation type/wetland. Cover of these species was estimated in five 1-m2 quadrats/plot. This study used the same sites as (7).
A replicated study in the early 2000s of 45 created, restored and enhanced freshwater wetlands in the USA (9) reported that they typically contained wetland vegetation after 1–7 years. In 43 of the 45 studied wetlands, the overall plant community was more characteristic of wetlands than uplands. The other two wetlands contained vegetation that was marginally more characteristic of uplands than wetlands (data reported as a wetland indicator index). On average, the wetlands contained 11 plant species/10 m2 (range: 0.2–56 species/10 m2), of which 16% were not native (range: 0–53%). The study also reported effects of intervention type (creation, restoration or enhancement), wetland setting (depressional, riverine or lakeshore) and wetland age on these metrics, and reported data on the frequency of some individual plant species (see original paper). Methods: Data on vascular plant species and cover were collected from monitoring reports for 45 wetlands (within 36 project areas across 21 states). The wetlands were 1–562 ha in area and 1–7 years old. Of the 45 wetlands, 17 had been created (from scratch), 19 restored (from degraded wetlands) and nine enhanced (increasing value of existing wetlands) as part of

12. Habitat restoration and creation
297
mitigation projects. Thirty-two wetlands contained areas of marsh and 19 contained areas of shrubby/forested swamp. The study does not consistently separate results for marsh and swamp vegetation.
A replicated, site comparison study in 2000 of 45 freshwater marshes in Michigan, USA (10) found that restored marshes had lower cover of emergent vegetation and duckweed than natural marshes, a different community of algae growing on plants, and greater algal richness and diversity. The restored marshes were ≤15 years old. On average, restored marshes had lower vegetation cover than natural marshes. This was true for emergent canopy cover (restored: approx. 20%; natural: approx. 40%) and duckweed cover (restored: 36%; natural: 59%). The overall community composition of algae growing on plants differed significantly between restored and natural marshes, but the plankton and sediment algal communities did not (data reported as graphical analyses). Species richness of all three algal groups was statistically similar in restored marshes (9–30 taxa/marsh) and natural marshes (8–26 taxa/marsh). Phytoplankton biomass was also statistically similar in restored and natural marshes (data not reported). Methods: In July 2000, vegetation was surveyed in 25 restored marshes of varying age (restored ≤15 years ago) and 20 naturally occurring marshes. The study does not report details of restoration methods. All marshes were permanent or semi-permanent, surrounded by farmland, <2 ha in area and <2 m deep. Surveys included emergent vegetation, floating vegetation, phytoplankton (two samples/marsh from 10 cm below water surface), algae growing on plant stems (4–5 stems/marsh) and algae growing in the sediment (8 samples/marsh from the top 1 cm).
A replicated, site comparison study in 2004–2005 of 18 freshwater marshes in Oklahoma, USA (11) found that created marshes contained a greater proportion of perennial plant species than natural marshes, but that other vegetation metrics were similar in created and natural marshes. After >20 years, 94% of the plant species in created marshes were perennial – significantly greater than the 78% of perennial species in natural marshes. All other vegetation metrics were statistically similar in each type of marsh. These included taxonomic richness (created: 6.9; natural: 6.9 taxa/marsh), taxonomic diversity (data reported as a diversity index), proportion of wetland-characteristic species (created: 77%; natural: 67%), vegetation quality (data reported as an index based on how characteristic each plant species is of undisturbed local habitats) and percent cover of the dominant species (created: 55%; natural: 49%). Methods: In summer 2004 and 2005, herbaceous plant species and their cover were recorded in six created wetlands (>20 years old; identified based on the presence of a dam or levee, and soil characteristics) and 12 natural wetlands. All wetlands were <1.1 ha. The study does not report further details of wetland creation methods. The created wetlands had deeper, less turbid water than the natural wetlands and were typically flooded for longer. Vegetation was surveyed in four 0.5-m2 quadrats/broad vegetation type/wetland/year.
A replicated study in 1992–2004 of 11 wetland restoration sites in Wisconsin, USA (12) reported that they developed wetland-characteristic herbaceous vegetation, which increased in quality over time. Each site was surveyed 1–4 years and 13–16 years after restoration. Nine sites contained mostly emergent vegetation, but two contained mostly submerged vegetation. Between the two surveys, the proportion of wetland-characteristic plant species increased, from 54% to 81% of all species present. The plant species also became more characteristic of undisturbed local habitats, on average (data reported as a conservatism score and floristic quality index;

12. Habitat restoration and creation
298
both increased but only the former significantly). However, there were declines in total plant species richness (from 108 to 84 species across all wetlands, and from 29 to 20 species/15 m2) and plant diversity (reported as a diversity index). For data on the presence/absence of individual plant species, see original paper. Methods: In August 1992 and 2004, plant species and their cover were recorded in 1-m2 quadrats in each of 11 wetland restoration sites (each <1 ha; 15–30 quadrats/site/survey). A complete plant species list was also made for each wetland. Restoration interventions had been carried out between 1988 and 1991 (details not reported). The analysis was based on change within each wetland over time.
A replicated, site comparison study in 2001 of 19 freshwater marshes in Ohio, USA (13) found that created marshes contained less vegetation biomass than natural marshes. After 1–9 years, created marshes contained less above-ground vegetation biomass on average (209 g/m2) than nearby natural marshes (347 g/m2). Methods: In July and August 2001, live above-ground vegetation was collected 19 depressional marshes (eight 0.1-m2 quadrats/marsh), then dried and weighed. Ten marshes had been created 1–9 years previously. The other nine marshes were natural. The study does not report the specific interventions used for marsh creation, but does note that excavation was involved in all created sites.
A replicated, site comparison study in 2007 of 35 freshwater, brackish and saline marshes in Hawaii, USA (14) found that restored/created marshes had statistically similar overall plant species richness, cover of wetland plant species and cover of exotic plant species to natural marshes, but that restored marshes had lower overall vegetation cover. Data were not reported for most outcomes. Overall vegetation cover was only 59% in restored marshes: significantly lower than the 74% cover in created wetlands and 76% cover in natural wetlands. The study suggests this may reflect management of restored wetlands for waterbirds, which require open water and mudflats. Methods: In March/April 2007, plant species and their cover were recorded in 35 coastal lowland marshes: 11 restored, 7 created and 17 natural. Six 1-m2 quadrats were surveyed in each marsh, across flooded, saturated and upland areas. Eight marshes were freshwater, whilst the other 27 were influenced by salt (brackish–hypersaline). The study does not report details of restoration/creation methods (including dates), or separate the effects of restoration/creation in marshes of different salinity.
A replicated study in 1991–2006 of 15 restored marshes and nine restored swamps in Illinois, USA (15) found that the overall plant community composition changed over the four years following restoration, and reported that the wetlands overall experienced a net gain in plant species richness. The plant community in younger restored marshes was characterized by annual herbs like Pennsylvania smartweed Persicaria pensylvanica and barnyard grasses Echinocloa spp., whereas older restored marshes were characterized by clonal perennial herbs like broadleaf cattail Typha latifolia, reed canarygrass Phalaris arundinacea and rice cutgrass Leersia oryzoides (data reported as a graphical analysis). Across all 24 restored marshes and swamps, plant species richness increased over time. On average, each wetland lost 20% of the plant species present at the start of each year but gained 27%. Methods: Between 1991 and 2002, twenty-four degraded wetlands were restored by (a) removing drainage structures, building berms and/or excavating, then (b) planting herbs, trees, shrubs, or nothing. The study does not describe which intervention(s) were carried out in each wetland. Vascular plant species (and, in marshes, their cover) were recorded in the first four summers following restoration.

12. Habitat restoration and creation
299
A replicated study in 2010 of 53 wetland restoration/creation sites in the southeast USA (16) reported that they developed stands of native wetland vegetation after 2–11 years. The sites had developed into herbaceous, shrubby or forested habitats (or a mixture of these). The overall plant community in restored/created sites was characteristic of undisturbed local wetlands (data reported as a wetland indicator index and conservatism score). Of the 21–31 dominant plant species in each site, at least 86–91% were wetland species (capable of growing in wetlands) whilst 59–69% were wetland-characteristic species (that always or usually grow in wetlands rather than uplands). Between 93 and 96% of species were native. These averages mask the fact that in 6–8 of the 53 sites, the overall plant community was characteristic of drier conditions (based on the wetland indicator index) and/or <40% of plant species were wetland-characteristic. Methods: Dominant plant species (>20% cover in any layer of vegetation) were surveyed in 53 wetland restoration/creation sites in July–August 2010. Most or all sites were probably fresh rather than saline (not explicitly reported). Restoration or creation was completed 2–11 years previously using interventions such as ditch blocking, excavation, relandscaping and tree planting. The study does not report details of restoration/creation methods, or separate results for marsh and swamp vegetation.
A replicated study in 1989–2005 of 15 created wetlands in Virginia, USA (17) reported that they had developed vegetation cover within 1–15 years of creation. On average, there were 29 plant species/site in the herbaceous layer and 6 plant species/site in the shrub/sapling layer. The herbaceous layer was dominated by perennial species (71% of species; 69% importance). The shrub/sapling layer was predominantly volunteer species (52% of species; 67% importance). None of these metrics significantly differed between sites of different ages. The same was true for plant diversity. Although there was typically no significant difference in overall plant community composition between sites of different ages, there was a general pattern of older communities (11–15 years old) returning to a composition more like younger communities (1–5 years old) after an intermediate (3–10 years old) shift in composition (data reported as graphical analyses and similarity indices). The dominant species also varied between sites of different ages (see original paper for data). Methods: In late summer 2004 or 2005, vegetation was surveyed in fifteen 1–17 ha depressional floodplain wetlands. All wetlands had been created 1–15 years previously with the intention that they would develop into swamps (precise details not reported or not available, but involving planting trees/shrubs and sowing grass to stabilize the soil). The herbaceous layer (herbs and trees/shrubs <1 m tall) was surveyed in fifteen 1-m2 quadrats/wetland. The shrub/sapling layer (plants >1 m tall) was surveyed in one 5-m-radius plot/wetland.
A replicated study in 2009 of four created freshwater marshes in Virginia, USA (18) reported that they contained wetland vegetation after 3–10 years. In all four marshes, the overall plant community was characteristic of wetland conditions (data reported as a wetland indicator index). There were 4–5 plant species/m2 and 19–27 plant species/marsh. Of these, 70–84% were wetland-characteristic and 20–26% had been sown. Overall vegetation cover was 99–106%, including 24–65% sown species and 1–26% non-native. Above-ground vegetation biomass was 770–1,830 g/m2. Most tested metrics did not significantly differ between wetlands of different ages: overall cover, sown cover, species richness and diversity, and vegetation quality. However, older wetlands did have a plant community characteristic of slightly drier conditions, and the oldest wetland supported the lowest vegetation biomass (see original paper

12. Habitat restoration and creation
300
for data). Methods: The four wetlands were created between 1999 and 2006 (details not reported, except that some herb seeds were sown). Vegetation was surveyed in August or September 2009 (16–32 quadrats/marsh). Plant species and their cover were recorded across the whole of each 1-m2 quadrat. All standing vegetation was cut from 0.25 m2 subquadrats, then dried and weighed.
A replicated, site comparison study in 2008–2009 of 54 ephemeral freshwater marshes in Mississippi, USA (19) found that intervention to create waterfowl habitat had no significant effect on plant species richness or the relative abundance of woody plants, and only affected plant diversity and the relative abundance of grasses if it involved early drawdown. At the end of the growing season, managed and unmanaged marshes contained a similar number of plant taxa (managed: 17; unmanaged: 16 taxa/marsh) and a similar proportion of woody plants (3% of all plants). Managed marshes with an early drawdown of the water table had greater diversity of plant species than unmanaged marshes (data reported as a diversity index), a greater variety of plant growth forms (1.8 different forms/sample point; vs unmanaged: 1.4) and a greater proportion of grasses (47% of all plants; vs unmanaged: 26%). These metrics did not significantly differ between managed marshes with a later drawdown of the water table and unmanaged marshes (see original paper for data). Methods: In October 2008 and 2009, vegetation was surveyed at 50–64 points in each of 54 marshes across 18 private lands. The vegetation of 39–42 marshes had been actively managed for waterfowl, with interventions such as annual soil disturbance, herbicide or mechanical control of undesirable (low forage value) plants and summer drawdown. Drawdown was early (before 15 June) in approximately half of the managed marshes, and late (≥3 weeks later) in the other managed marshes. The final 12–15 marshes received almost no intervention (e.g. “limited or no control of undesirable plants”).
A replicated, paired, site comparison study in 2007–2011 of 133 fresh and brackish wetlands in Alberta, Canada (20) found that restored/created wetlands typically contained lower quality wet meadow vegetation than natural wetlands. All data were reported as a floristic quality index, with higher quality vegetation containing species more characteristic of undisturbed wet meadows in the study area, and a greater proportion of native species. In six of eight comparisons, vegetation in restored/created wetlands was of lower quality than in natural wetlands. This was true for wetlands restored on historically mined land (including some still affected by pollution) and for “improved” stormwater ponds (with attempts to make them more like natural wetlands using interventions such as reprofiling, adding wetland soil and planting). In the final two comparisons, vegetation in wetlands restored on farmland contained was of similar quality to vegetation in natural wetlands. Methods: Between 2007 and 2011, plant species were recorded in the wet meadow zone of 133 wetlands (six 1-m2 quadrats/wetland). There were 47 restored or created wetlands (≥ 3 years old) and 86 naturally occurring wetlands (some surrounded mostly by forest, some mostly by agriculture) across two distinct regions. The study does not report full details of restoration/creation methods, or separate results for fresh and brackish wetlands.
A replicated, site comparison study in 2008–2009 of four floodplain wetlands in Texas, USA (21) found that created wetlands contained a different plant community to a natural wetland, with fewer wetland plant species. After 7–8 years, the plant community composition in the created wetlands was only 14–35% similar to the natural wetland. In three of four created wetlands, the proportion of wetland species

12. Habitat restoration and creation
301
was significantly lower (20–87%) than in the natural wetland (96%). Wetland plant species richness was lower in created than natural wetlands in seven of eight comparisons (for which created: 0.3–0.5 species/m2; natural: 2.0–3.3 species/m2; other comparison no difference). Total plant species showed mixed results depending on the wetland and year: similar in created and natural wetlands in four of eight comparisons (created: 2.0–4.5 species/m2; natural: 2.0–4.3 species/m2) lower in created wetlands in three comparisons (created: 0.5–2.8 species/m2; natural: 2.5–4.2 species/m2) and higher in created wetlands in one comparison (created: 3.8 species/m2; natural: 2.5 species/m2). For data on the presence/absence of individual plant species, see original paper. Methods: In summer/autumn 2008 and 2009, plant species were recorded in four created wetlands and one nearby natural wetland (sixty 1-m2 quadrats across all sites). The study does not clearly report the interventions used for wetland creation, but does note that culverts were installed in 2001 to allow water flow between the wetlands, and that no vegetation was introduced. However, the created wetlands were ephemerally flooded whilst the natural wetland was permanently flooded.
A replicated study in 2012 of thirty wetland restoration sites in Illinois, USA (22) reported that they developed vegetation within 7–22 years, but this was characteristic of disturbed habitats. The wetland restoration sites contained 13–755 g/m2 dry above-ground herb biomass (average: 265) and 0–1 woody stems at least 1 m tall/m2 (average: 0.3). They had 0–95% cover of non-native plants (average: 36%) and a conservatism score of 2.1–3.3 out of 10 (average: 2.7), indicating that the plant species were characteristic of fairly disturbed habitats in the study region. Methods: In summer 2012, vegetation was surveyed in 30 wetland sites, restored 7–22 years previously. Restoration involved excavating, removing drainage structures, building embankments to retain water and, in some sites, planting and/or sowing wetland plants. The precise interventions carried out in each site are not clearly reported. Of the 30 sites, 13 were marshes, 10 were swamps and seven included both marshy and swampy areas. The study does not separate results for marsh and swamp vegetation.
A replicated, site comparison study in 2008–2012 of marsh vegetation in 51 freshwater wetlands in Alberta, Canada (23) reported mixed effectiveness of wetland creation on the overall plant community composition and species richness, depending on whether mining waste was incorporated into the wetlands and on the vegetation zone. For wetlands created without incorporating mining waste, the emergent zone supported a statistically similar plant community to natural wetlands (80% similarity), but had lower species richness (created: 5.9; natural: 8.6 species/6 m2). In contrast, the wet meadow zone supported a significantly different plant community to natural wetlands (70% similarity), but had statistically similar species richness (created: 9.7; natural: 9.9 species/6 m2). For wetlands where mining waste was used during creation, the plant community composition in both zones was significantly different from natural wetlands (50% similarity). Species richness in the emergent zone (3.9 species/6 m2) was lower than in the natural wetlands. Species richness in the wet meadow zone (9.7 species/6 m2) was statistically similar to the natural wetlands. The study identified physical environmental differences between wetlands that may have influenced the vegetation. Methods: In August 2008–2012, vegetation was surveyed in 51 wetlands near Fort McMurray: 19 created on natural sediment and with fresh surface water; 16 created with mining waste (built on waste sediments, or filled with waste water); 16 natural. All created wetlands were ≥7 years old (18 were >15 years old). The study does not report details of wetland creation methods.

12. Habitat restoration and creation
302
Vegetation (emergent, floating and submerged) was surveyed in six 1-m2 quadrats/ vegetation zone/wetland.
A replicated, paired, site comparison study in 1996–2012 involving 15 wetland restoration sites in Illinois, USA (24) found that they had higher or lower quality vegetation than nearby natural wetlands, depending on the metric. The 15 restoration sites had lower quality vegetation than 15 nearby natural wetlands when measured as a conservatism score (how characteristic the plant species are of undisturbed local habitats), but higher quality vegetation when measured a floristic quality index (combining conservatism score with species richness). The proportion of native, non-weedy, perennial species was statistically similar in the restoration sites (49–55% of species) and the natural wetlands (60% of species). Methods: The study involved 15 sites restored between 1992 and 2004 (methods not reported) and a natural wetland site near each restored site. The study included both marshes and swamps (number of each not clearly reported). Vegetation was surveyed twice in restoration sites (once in 1996–2009, once in 2012) and once in natural wetlands (2012).
A replicated study in 2009 of 13 swamp restoration sites in the USA (25) reported that they had developed vegetation cover, including native species, after 1–8 years. The restoration sites contained 8–36 native plant species, which comprised 28–100% of the overall vegetation cover. The number and abundance of woody plant species was not reported. Additional analyses did not separate results for wetland and upland sites. Methods: In summer 2009, plant species and foliage cover were surveyed in 13 sites being restored as freshwater forested wetlands (one 405-m2
plot/site). Restoration began 1–8 years previously. The study does not report the restoration methods in detail, but they included controlling invasive plants that were initially dominant and covering the ground surface (with cardboard, wood chippings or landscape fabric), then regular management by watering, introducing native plants and protecting them from herbivores.
(1) Streever W.J., Portier K.M. & Crisman T.L. (1996) A comparison of dipterans from ten created and ten natural wetlands. Wetlands, 16, 416–428.
(2) Wilson R.F. & Mitsch W.J. (1996) Functional assessment of five wetlands constructed to mitigate wetland loss in Ohio, USA. Wetlands, 16, 436–451.
(3) Magee T.K., Ernst T.L., Kentula M.E. & Dwire K.A. (1999) Floristic comparison of freshwater wetlands in an urbanizing environment. Wetlands, 19, 517–534.
(4) Brown S.C. & Veneman P.L.M. (2001) Effectiveness of compensatory wetland mitigation in Massachusetts, USA. Wetlands, 21, 508–518.
(5) Campbell D.A., Cole C.A. & Brooks R.P. (2002) A comparison of created and natural wetlands in Pennsylvania, USA. Wetlands Ecology and Management, 10, 41–49.
(6) Mushet D.M., Euliss N.H. Jr. & Shaffer T.L. (2002) Floristic quality assessment of one natural and three restored wetland complexes in North Dakota, USA. Wetlands, 22, 126–138.
(7) Balcombe C.K., Anderson J.T., Fortney R.H. & Kordek W.S. (2005) Wildlife use of mitigation and reference wetlands in West Virginia. Ecological Engineering, 25, 85–99.
(8) Balcombe C.K., Anderson J.T., Fortney R.H., Rentch J.S., Grafton W.N. & Kordek W.S. (2005) A comparison of plant communities in mitigation and reference wetlands in the mid-Appalachians. Wetlands, 25, 130–142.
(9) Spieles D.J. (2005) Vegetation development in created, restored, and enhanced mitigation wetland banks of the United States. Wetlands, 25, 51–63.
(10) Zheng L. & Stevenson R.J. (2006) Algal assemblages in multiple habitats of restored and extant wetlands. Hydrobiologia, 561, 221–238.
(11) Hartzell D., Bidwell J.R. & Davis C.A. (2007) A comparison of natural and created depressional wetlands in central Oklahoma using metrics from indices of biological integrity. Wetlands, 27, 794–805.
(12) Nedland T.S., Wolf A. & Reed T. (2007) A re-examination of restored wetlands in Manitowoc County, Wisconsin. Wetlands, 27, 999–1015.
12. Habitat restoration and creation
303
(13) Fennessy M.S., Rokosch A. & Mack J.J. (2008) Patterns of plant decomposition and nutrient cycling in natural and created wetlands. Wetlands, 28, 300–310.
(14) Bantilan-Smith M., Bruland G.L., MacKenzie R.A., Henry A.R. & Ryder C.R. (2009) A comparison of the vegetation and soils of natural, restored and created coastal lowland wetlands in Hawai’i. Wetlands, 29, 1023–1035.
(15) Matthews J.W. & Endress A.G. (2010) Rate of succession in restored wetlands and the role of site context. Applied Vegetation Science, 13, 346–355.
(16) De Steven D. & Gramling J.M. (2012) Diverse characteristics of wetlands restored under the Wetlands Reserve Program in the southeastern United States. Wetlands, 32, 593–604.
(17) DeBerry D.A. & Perry J.E. (2012) Vegetation dynamics across a chronosequence of created wetland sites in Virginia, USA. Wetlands Ecology and Management, 20, 521–537.
(18) Dee S.M. & Ahn C. (2012) Soil properties predict plant community development of mitigation wetlands created in the Virginia Piedmont, USA. Environmental Management, 49, 1022–1036.
(19) Fleming K.S., Kaminski R.M., Tietjen T.E., Schummer M.L., Ervin G.N. & Nelms K.D. (2012) Vegetative forage quality and moist-soil management on Wetlands Reserve Program lands in Mississippi. Wetlands, 32, 919–929.
(20) Wilson M.J., Forrest A.S. & Bayley S.E. (2013) Floristic quality assessment for marshes in Alberta's northern prairie and boreal regions. Aquatic Ecosystem Health & Management, 16, 288–299.
(21) Wall C.B. & Stevens K.J. (2014) Assessing wetland mitigation efforts using standing vegetation and seed bank community structure in neighbouring natural and compensatory wetlands in north-central Texas. Wetlands Ecology and Management, 23, 149–166.
(22) Jessop J., Spyreas G., Pociask G.E., Benson T.J., Ward M.P., Kent A.D. & Matthews J.W. (2015) Tradeoffs among ecosystem services in restored wetlands. Biological Conservation, 191, 341–348.
(23) Roy M.-C., Foote L. & Ciborowski J.J.H. (2016) Vegetation community composition in wetlands created following oil sand mining in Alberta, Canada. Journal of Environmental Management, 172, 18–28.
(24) van den Bosch K. & Matthews J.W. (2017) An assessment of long-term compliance with performance standards in compensatory mitigation wetlands. Environmental Management, 59, 546–556.
(25) Wood J.K., Gold W.G., Fridley J.L., Ewing K. & Niyogi D.K. (2017) An analysis of factors driving success in ecological restoration projects by a university-community partnership. Ecological Restoration, 35, 60–69.
12.1.2 Restore/create brackish/saline marshes or swamps (specific
intervention unclear)
Seven studies evaluated the effects, on vegetation, of restoring/creating brackish/saline marshes or swamps using unclear or incompletely described interventions. Four studies were in the USA1–
3,5. There was one study in each of Australia4, Canada6 and Indonesia7.
VEGETATION COMMUNITY
Community composition (4 studies): Three replicated, site comparison studies in the USA1,2 and Australia4 reported that the overall plant or algal community composition in restored/created marshes typically became more like natural reference marshes over time. One replicated, site comparison study of fresh/brackish wetlands in Canada6 reported that the overall plant community was lower quality in restored/created sites than natural sites, after ≥3 years.
Overall richness/diversity (1 study): One replicated, site comparison study of salt marshes in the USA1 found that created marshes had similar overall plant diversity, after 1–14 years, to natural marshes. Created marshes had lower plant species richness than natural marshes on average, but richness became more similar to natural marshes with time since creation.
Algae/phytoplankton richness/diversity (1 study): One replicated, paired, site comparison study of brackish/saline marshes in the USA2 reported that restored and natural marshes contained a similar number of algal species, and found that they had similar algal diversity, after 1–28 years.
VEGETATION ABUNDANCE

12. Habitat restoration and creation
304
Overall abundance (2 studies): One replicated, site comparison study of salt marshes in the USA1 found that created marshes contained less overall plant biomass, after 1–14 years, than natural marshes – but that biomass increased with time since creation. One replicated, site comparison study of fresh/brackish/saline marshes in the USA3 found that created (but not restored) marshes had similar overall vegetation cover to natural marshes. Both created and restored marshes had similar cover of wetland vegetation to natural marshes.
Herb abundance (2 studies): One replicated, paired, site comparison study of brackish/saline marshes in the USA2 reported that restored marshes contained a greater density of cordgrasses Spartina spp. than natural marshes in six of eight comparisons. Vegetation was surveyed 1–28 years after restoration, which involved planting cordgrasses. One replicated, paired site comparison study in the USA5 reported that created intertidal wetlands contained more smooth cordgrass Spartina alterniflora than nearby natural mangrove forests for around 13 years.
Tree/shrub abundance (2 studies): One replicated, paired site comparison study in the USA5 reported that created intertidal wetlands contained fewer adult mangrove trees than nearby natural mangrove forests for up to 20 years – but predicted equivalence within 55 years. One replicated study in Indonesia7 simply quantified the density of tree seedlings three years after restoration of former mangrove ponds.
Algae/phytoplankton abundance (1 study): One paired, site comparison study of brackish/saline marshes in the USA2 reported that older restored marshes (≥26 years old) contained a similar or greater abundance of algae to natural marshes, whereas younger restored marshes (<13 years old) contained less algae than natural marshes.
VEGETATION STRUCTURE
Diameter/perimeter/area (1 study): One replicated, paired site comparison study in the USA5 reported that created intertidal wetlands contained thinner adult mangrove trees than nearby natural mangrove forests for up to 20 years – but predicted equivalence within 25 years.
A replicated, site comparison study of 17 estuarine salt marshes in the northeast USA (1) found that created marshes contained a different plant community, fewer plant species and less plant biomass than nearby natural marshes, on average – but reported that the oldest created marsh was similar to the natural marshes. The created marshes were 1–14 years old. They typically had a different overall plant community composition to natural marshes (data reported as a graphical analysis; statistical significance not assessed) with less overall cover of high marsh species (created: 0–37%; natural: 1–84%). On average, the created marshes contained less above-ground plant biomass (160 g/m2; vs natural: 350) and fewer plant species (4.4 species/marsh; vs natural: 8.4), although average plant diversity did not significantly differ between created and natural marshes (data reported as a diversity index). However, the oldest created marsh was similar to the natural marshes. This was true for overall community composition, cover of high marsh species (37%), biomass (310 g/m2) and richness (9.1 species/marsh). Methods: In an unspecified year, vegetation was surveyed in six created salt marshes and 11 nearby natural marshes in similar physical environments. Creation involved planting, but the study does not report details of this or prior earthworks. Plant species and their cover were surveyed in 1-m2 quadrats. Live vegetation was cut from 0.5-m2 quadrats, then dried and weighed.
A replicated, paired, site comparison study in 1998 of 16 brackish/saline marshes in North Carolina, USA (2) reported that restored marshes had similar algal richness and diversity to natural marshes, and that older restored marshes contained a similar amount of algae to natural marshes. Unless specified, statistical significance

12. Habitat restoration and creation
305
was not assessed. Both restored and natural marshes contained algal communities dominated by diatoms, filamentous algae and blue-green algae. The similarity in community composition between restored and natural marshes varied between 12 and 96%, depending on the habitat, season and time since restoration. Restored and natural marshes supported a similar number of algal species (restored: 131–204; natural: 118–218 species/habitat/season) and statistically similar algal diversity (data reported as a diversity index). Algal abundance generally increased with time since restoration, such that older restored marshes (≥26 years old) contained a similar or greater amount of algae to natural marshes whereas younger restored marshes (<13 years old) contained less (see original paper for data and statistical models). Finally, restored marshes contained more cordgrass Spartina spp. than natural marshes in six of eight comparisons (for which restored: 297–498 stems/m2; natural: 201–316 stems/m2). Methods: In spring and summer 1998, algae were surveyed in eight pairs of coastal brackish/saline marshes. In each pair, one marsh had been restored 1–28 years previously (restoration methods not reported, but included cordgrass planting) and the other, nearby marsh was natural. Algae were collected from cordgrass stems and the top 1 cm of sediment. Abundance was measured as biovolume or estimated from chlorophyll concentrations. Cordgrass stems were counted in each marsh in October.
A replicated, site comparison study in 2007 in 35 freshwater, brackish and saline marshes in Hawaii, USA (3) found that restored/created marshes had statistically similar overall plant species richness, cover of wetland plant species and cover of exotic plant species to natural marshes, but that restored marshes had lower overall vegetation cover. Data were not reported for most outcomes. Overall vegetation cover was only 59% in restored marshes: significantly lower than the 74% cover in created wetlands and 76% cover in natural wetlands. The study suggests this may have been driven by management of restored wetlands for waterbirds, which require open water and mudflats. The study also reported differences in soil properties between restored/created and natural marshes. Methods: In March/April 2007, plant species and their cover were recorded in 35 coastal lowland marshes: 11 restored, 7 created and 17 natural. Six 1-m2 quadrats were surveyed in each marsh, across flooded, saturated and upland areas. Twenty-seven marshes brackish, saline or hypersaline. The other eight marshes were freshwater. The study does not report details of restoration/creation methods (including dates), or separate the effects of restoration/creation in marshes of different salinity.
A replicated, controlled, site comparison study in 2003–2007 in an estuarine salt marsh in New South Wales, Australia (4) reported that restored areas developed a plant community more like natural reference areas over 3–4 years. All four restored areas were colonized by saltwater couch Sporobolus virginicus: the dominant plant species in the reference areas. The overall plant community composition in all four restored areas became more similar to the reference areas (data reported as a graphical analysis). However, it remained distinct from the reference marshes (similarity <50%) in three of four cases. Two additional degraded areas that received no or less intervention (details not clear) also developed a plant community more like reference marshes over time. These results are not based on assessments of statistical significance. Methods: Between July 2004 and April 2007, plant species and cover were surveyed in eight areas of tidal salt marsh around a lagoon (fifty 1-m2 quadrats/area/survey). Two areas contained natural, undisturbed salt marsh. The other six areas had been degraded by vehicle use, mining, rubbish dumping and weed

12. Habitat restoration and creation
306
encroachment. Four of these areas were restored between 2003 and mid-2004, with interventions including fencing to exclude vehicles, filling eroded patches with sediment, restoring the surrounding forest and transplanting sods of saltwater couch. The study does not clearly report what interventions, if any, were done in the other two degraded areas.
A replicated, paired, site comparison study in 2010 of 18 intertidal wetlands on the coast of Florida, USA (5) reported that created wetlands were initially dominated by salt marsh vegetation but began to develop mangrove forest vegetation within 20 years. All data in this summary have been taken from statistical models. Young created wetlands (2–5 years old) were dominated by salt marsh vegetation, most of which was smooth cordgrass Spartina alterniflora (above-ground biomass: >270 g/m2; density: >200 stems/m2). The oldest studied created wetlands (19.5 years old) contained a mixture of juvenile (2 trees/m2; 85 cm tall) and adult (98 trees/m2; 4.2 cm diameter) mangrove trees, and no smooth cordgrass. Statistical models predicted that the abundance of smooth cordgrass became equivalent to nearby natural mangrove forests within 13 years. The diameter and density of adult mangrove trees would become equivalent to nearby natural mangrove forests after 25 and 55 years, respectively. Methods: In summer 2010, vegetation was surveyed in nine pairs of intertidal wetlands in Tampa Bay. In each pair, one wetland had been created from upland 2–20 years previously (precise creation methods not reported, but likely involved reprofiling to intertidal elevations and planting with salt marsh herbs) and one wetland was a natural, mature mangrove forest. Surveys were carried out in three 100-m2 plots/site (and subplots of various size within).
A replicated, paired, site comparison study in 2007–2011 of 133 fresh and brackish wetlands in Alberta, Canada (6) found that restored/created wetlands typically contained higher quality wet meadow vegetation than natural wetlands. All data were reported as a floristic quality index, with higher quality vegetation containing species more characteristic of undisturbed wet meadows in the study area, and a greater proportion of native to non-native species. In six of eight comparisons, the quality of wet meadow vegetation was lower in restored/created wetlands than natural wetlands. This was true for wetlands restored on historically mined land (whether still affected by pollution or not) and for “improved” stormwater ponds (with attempts to make them more like natural wetlands using interventions such as reprofiling, adding wetland soil and planting). In the final two comparisons, the quality of wet meadow vegetation was similar in wetlands restored on farmland and in natural wetlands. Methods: Between 2007 and 2011, plant species were recorded in the wet meadow zone of 133 wetlands (six 1-m2 quadrats/wetland). There were 47 restored or created wetlands (≥ 3 years old) and 86 naturally occurring wetlands (some surrounded mostly by forest, some mostly by agriculture) across two distinct regions. The study does not report full details of restoration/creation methods, or separate results for brackish and fresh wetlands.
A replicated study in 2010–2016 of former aquaculture ponds undergoing restoration in South Sulawesi, Indonesia (7) reported that natural recruitment of mangrove seedlings occurred within one year, creating densities of over 2,500 seedlings/ha after three years. Methods: Between 2010 and 2015, aquaculture ponds in seven villages on Tanakeke Island were subjected to “Ecological Mangrove Rehabilitation”. The study does not completely describe this process, but notes that it involves breaching dikes, re-creating tidal creeks, periodic addition of mangrove propagules, and a “minimal amount” of planting.

12. Habitat restoration and creation
307
(1) Morgan P.A. & Short F.T. (2002) Using functional trajectories to track constructed salt marsh development in the Great Bay Estuary, Maine/New Hampshire, U.S.A. Restoration Ecology, 10, 461–473.
(2) Zheng L., Stevenson R.J. & Craft C. (2004) Changes in benthic algal attributes during salt marsh restoration. Wetlands, 24, 309–323.
(3) Bantilan-Smith M., Bruland G.L., MacKenzie R.A., Henry A.R. & Ryder C.R. (2009) A comparison of the vegetation and soils of natural, restored and created coastal lowland wetlands in Hawai’i. Wetlands, 29, 1023–1035.
(4) Green J., Reichelt-Brushett A. & Jacobs S.W.L. (2009) Re-establishing a saltmarsh vegetation structure in a changing climate. Ecological Management & Restoration, 10, 20–30.
(5) Osland M.J., Spivak A.C., Nestlerode J.A., Lessmann J.M., Almario A.E., Heitmuller P.T., Russell M.J., Krauss K.W., Alvarez F., Dantin D.D., Harvey J.E., From A.S., Cormier N. & Stagg C.L. (2012) Ecosystem development after mangrove wetland creation: plant–soil change across a 20-year chronosequence. Ecosystems, 15, 848–866.
(6) Wilson M.J., Forrest A.S. & Bayley S.E. (2013) Floristic quality assessment for marshes in Alberta's northern prairie and boreal regions. Aquatic Ecosystem Health & Management, 16, 288–299.
(7) Wetlands International (2016) Mangrove restoration: to plant or not to plant? Available at http://www.wetlands.org/publications/mangrove-restoration-to-plant-or-not-to-plant/. Accessed 20 February 2020.
12.2 Restore/create marshes or swamps (multiple interventions)
Background
This section includes studies of marsh or swamp restoration/creation that test more than three separate interventions at once, such that it is difficult to attribute outcomes to any single specific intervention. Where three or fewer interventions have been used together in a study, results are reported elsewhere in the synopsis: under each intervention (but noting the influence of the others, where appropriate) or sometimes as a combined intervention (e.g. Deposit soil/sediment and introduce vegetation). When multiple interventions have been used but not clearly described, studies are summarized in the previous section: Restore/create marshes or swamps (specific intervention unclear).
This section does not include studies that simply report the area or number of sites “restored” or “created”, without quantifying the vegetation in those sites.
12.2.1 Restore/create freshwater marshes or swamps (multiple
interventions)
Seventeen studies evaluated the effects, on vegetation, of using >3 combined interventions to restore/create freshwater marshes or swamps. Fourteen studies were in the USA1–4,6–8,10–13,15–17.
There was one study in each of Canada5, the UK9 and East Africa14. There was overlap in the sites used in three studies10–12.
VEGETATION COMMUNITY
Overall extent (1 study): One before-and-after study in Canada5 reported that the area of emergent vegetation in a marsh was greater after 5–6 years of intervention than in the year before.
Community composition (5 studies): Two replicated, site comparison studies in the USA4,15 found that restored/created freshwater wetlands contained different overall plant communities to natural or reference wetlands, after 1–8 years. Two site comparison studies in the USA2,12 reported similarity in species composition between restored/created and natural wetlands. Similarity ranged

12. Habitat restoration and creation
308
from 35% to 79% after 1–5 years. One study in the USA16 simply quantified the plant community composition of different pools within a marsh, two years after its creation.
Overall richness/diversity (16 studies): Three studies (including one replicated, before-and-after, site comparison) of freshwater wetlands in the USA4,12 and Canada5 reported that multiple restoration interventions increased overall4,12 or emergent5 plant species richness over 1–6 years. Another replicated, before-and-after, site comparison study in the USA10 – which used a subset of the sites in Study 12 – reported that the effect of restoration on plant species richness varied between years. Two replicated, site comparison studies in the USA2,15 found that restored/created wetlands had similar plant species richness to natural or reference wetlands, after 1–8 years. One site comparison study in the USA1 reported that a created wetland contained fewer plant species than nearby natural marshes, after two years. Nine studies (four replicated, one before-and-after) in the USA3,6–8,11,13,16,17 and the UK9 simply quantified overall plant species richness3,6–9,11,13,16,17 and/or diversity16 approximately 1–10 years after intervention.
Characteristic plant richness/diversity (6 studies): One replicated, before-and-after, site comparison study of freshwater wetlands in the USA10 reported that multiple restoration interventions increased the richness of wetland-characteristic plant species over three subsequent years. Five studies (two replicated) in the USA3,6,8,11,17 simply quantified wetland-characteristic plant richness up to 10 years after intervention.
VEGETATION ABUNDANCE
Overall abundance (4 studies): Two replicated, before-and-after studies (one also a site comparison) of freshwater wetlands in the USA10,12 reported that multiple restoration interventions reduced overall vegetation cover over the five subsequent years. Two replicated studies in the USA11,13 simply quantified overall vegetation cover for up to six years after intervention.
Characteristic plant abundance (3 studies): Two replicated, before-and-after studies (one also a site comparison) of freshwater wetlands in the USA10,12 reported that multiple restoration interventions did not increase the cover of wetland-characteristic vegetation over three subsequent years. One of the studies12 also monitored in the fifth (wetter) year after restoration, and reported greater cover of wetland-characteristic vegetation than before restoration. One replicated study on the same set of wetlands in the USA11 simply quantified wetland-characteristic vegetation cover for up to three years after intervention.
Herb abundance (3 studies): One replicated, site comparison study in the USA15 found that restored wet prairies had similar grass and forb cover to remnant prairies after 3–8 years. Another replicated, site comparison study in the USA4 reported that created dune slacks had greater cover of annual herbs after three years than mature natural slacks, but similar cover of perennial herbs and floating aquatic herbs. One replicated, before-and-after study in the USA12 reported greater herb cover 1–5 years after restoration of freshwater wetlands than before.
Tree/shrub abundance (3 studies): One replicated, site comparison study in the USA4 reported that created dune slacks had similar cover of trees and shrubs, after three years, to mature natural slacks. One replicated, before-and-after study in the USA12 reported lower cover of woody vegetation 1–5 years after restoration of freshwater wetlands than before. One replicated study in the USA11 simply quantified woody plant cover 1–2 years after intervention.
Individual species abundance (10 studies): Ten studies2–4,6,7,9,10,12,14,15 quantified the effect of this intervention on the abundance of individual plant species. For example, the replicated, site comparison study in East Africa14 reported that the biomass of papyrus Cyperus papyrus in created marshes was within the range of natural marshes in the region after 18 months.
VEGETATION STRUCTURE

12. Habitat restoration and creation
309
A site comparison study in 1978–1980 of three freshwater marshes in Florida, USA (1) reported that a created marsh contained fewer plant species than natural marshes. After two years, the created marsh contained 70 vascular plant species (vs 76–88 in natural marshes; statistical significance not assessed). Vegetation cover in the created marsh was dominated by broadleaf cattail Typha latifolia, but this was not quantified. Methods: In summer 1978, one 0.16-ha depression was excavated in rangeland. Initially, 1.8 m of topsoil was removed but 0.6 m was backfilled to reach the final depth. The depression and surrounding site were also seeded with two pioneer herb species (to prevent erosion), limed (2,245 kg/ha dolomite) and fertilized (450 kg/ha). In summer 1980, plant species were recorded in the created marsh and two natural marshes (along a transect extending from the centre to the edge of each).
A replicated, paired, site comparison study in 1988–1990 involving six created freshwater wetlands in eastern Massachusetts, USA (2) reported that they all developed vegetation cover within 1–2 years, with a similar plant species richness to adjacent natural wetlands but a distinct species composition. Statistical significance was not assessed. Created wetlands contained 9–20 plant species (vs natural: 13–23). The created and natural wetlands had 35–79% of plant species in common (average: 52%). All six created wetlands had >75% cover of native wetland vegetation. Woody plant cover was only 5–30%, suggesting herbaceous species were dominant (data not reported). Most adjacent natural wetlands, representing the target state, had a tree canopy with shrub and herb understory layers (not quantified). Red maple Acer rubrum seedlings were found in three of six created wetlands, at a density of 3–18/m2. Methods: In late 1990, vegetation was surveyed in six created wetlands (88–800 m2) and an unspecified number of adjacent natural wetlands. Surveys covered all woody vegetation and herbaceous vegetation in five 1-m2 quadrats/wetland. Wetland creation, in summer 1988 or 1989, involved excavating, creating “hydrological connections” to adjacent wetlands, adding wetland soil, planting wetland shrubs (six sites), herbs (five sites) or sods of vegetation (three sites), and sowing seeds of wetland herbs (one site).
A study in 1992–1993 on a former sand mine in New Jersey, USA (3) reported that following multiple restoration interventions the site developed vegetation cover, including some wetland-characteristic species. After 10 months, 82 plant species were recorded in quadrats across the site (area surveyed: 26.75 m2) with 6.3 species/0.25-m2 quadrat. There were at least 20 wetland-characteristic species across the site. The most abundant taxa were panicgrasses Panicum spp. (33 plants/m2), tapertip rush Juncus acuminatus (15 plants/m2) and toad rush Juncus bufonius (8 plants/m2). The only common woody taxa were willows Salix spp. (two species; 0.3–0.4 plants/m2). Methods: In October–November 1992, a former sand mine (last mined in the early 1990s) was subjected to multiple interventions: reprofiling, adding soil from another wetland (5–10 cm layer over the site), planting herbs and woody plants (species not reported), sowing a grass cover crop (including a panicgrass species), mulching with straw and adding lime. The aim was to restore a shrubby freshwater wetland. Vegetation was surveyed in August 1993, in 107 quadrats (each 0.25 m2) spread across the site.
A replicated, site comparison study in 1990–1993 of eight dune slacks in California, USA (4) reported that created slacks contained different plant communities to mature slacks, with more plant species and greater cover of annual herbs (but similar cover of other plant groups). Results summarized for this study are not based on assessments of statistical significance. Over their first three years, created slacks

12. Habitat restoration and creation
310
contained plant communities distinct from those in mature slacks – although this distinctiveness declined over time (data reported as a graphical analysis). Created slacks contained 69–86 plant species/year (vs mature: 28–59 species/year). After three years, created slacks had 70–95% cover of annual herbs (vs mature: <1–37%). For all other plant groups, cover did not clearly differ between created and mature slacks: perennial herbs (created: 69–135%; mature: 82–127%), shrubs (created: 27%; mature: 13–86%), trees (created: 7–11%; mature: 0–43%) and floating aquatic plants (created: 3–5%; mature: 0–8%). For data on the abundance of individual plant species, see original paper. Methods: In winter 1990/1991, multiple interventions were used to create wetlands within dune slacks (low-lying areas amongst dunes): removing existing vegetation and topsoil, relandscaping, adding wetland soil and sowing seeds. Afterwards, non-native plants were controlled by cutting, physical removal or herbicide application. Between 1991 and 1993, vegetation was surveyed in the two created slacks (twenty 5-m2 plots/site) and six nearby mature slacks (six to nine 30-m2 plots/site). Surveys included wetlands and immediately adjacent uplands.
A before-and-after study in 1993–1999 of a freshwater marsh in Ontario, Canada (5) reported that following multiple restoration interventions, there were increases in emergent vegetation coverage and species richness. Statistical significance was not assessed. In the year before intervention began, the marsh contained 33 ha of emergent vegetation and 17 emergent plant species. After 5–6 years of intervention, there were 51 ha of emergent vegetation and 23 emergent plant species. Four species present in historical records (1950) were not found in the more recent surveys, either before or after intervention. Methods: Multiple interventions were carried out from 1993: planting emergent vegetation, containing sewage overflow, encouraging sustainable land management practices in the watershed and, in 1997, installing a barrier to keep large carp Cyprinus carpio out of the marsh. Emergent vegetation surveys and mapping were carried out before intervention (1993) and after 5–6 years (1998–1999). The study notes likely differences in survey effort and emergent plant definitions between surveys, and that low water levels in 1998–1999 could have contributed to expansion of emergent vegetation.
A study in 1993–1998 of a created, tidal, freshwater marsh in New Jersey, USA (6) reported that vegetation was present on the site, but that species richness and cover were highly variable across space and time. Over all samples taken 2–5 years after wetland creation began, 92 plant species were recorded in the marsh. This included 59 wetland-characteristic species, and 14 of 14 planted species. The number of species per sampling quadrat (5–30 species/0.25 m2) and cover of individual plant species (see original paper for full data) were highly variable: depending on the area of the marsh, water level, and year. For example, two years after wetland creation began, jewelweed Impatiens capensis cover was 0–4% in all areas and water levels. After five years, jewelweed cover was 23–58% at the driest points but 0–2% at the wettest points. Methods: In 1993, an area of deposited dredge spoil was cleared of vegetation, excavated to form islands and channels, and graded. Throughout 1994, dams were removed to open the channels. In 1994 and 1995, fourteen herb species were planted across the site. Each August between 1995 and 1998, plant species and their cover were surveyed in 108 quadrats in wetland areas (water depth at high tide approximately 5–50 cm).
A study in 1995–2000 of an ephemeral wetland restoration site on farmland in Minnesota, USA (7) reported that following multiple interventions, the site developed vegetation cover, including some naturally colonizing species and some wetland

12. Habitat restoration and creation
311
species. Approximately five years after restoration began, 256 plant species were recorded in the site. Of these, 112 had been introduced as plants or seeds whilst 144 had colonized completely on their own. There were 147 wetland species. Amongst the planted/sown species, establishment success and abundance varied between wetland zones. The most abundant species in each zone were broadleaf arrowhead Sagittaria latifolia (wettest, emergent marsh zone; 25–49% average cover), bluejoint Calamagrostis canadensis and two forbs (sedge meadow zone; each 5–24% average cover) and black-eyed Susan Rudbeckia hirta (wet grassland zone; 25–49% average cover). Methods: From August 1995, multiple interventions were carried out to restore a zoned wetland on former agricultural land: applying herbicide, prescribed burning and physical removal to control invasive plants, cutting and applying herbicide to woody plants, breaking drainage systems to rewet the site, and sowing (autumn 1996) and planting (summer 1997) >100 plant species found in local wetlands. In summer 2000, vegetation was surveyed across the wetland in 28 monitoring units.
A study in 2000–2003 of a freshwater swamp restoration site on former cropland in North Carolina, USA (8) reported that following multiple interventions, nineteen plant species colonized the created hummocks, hollows and flats within two years. Of these, 15 were wetland species and six were wetland-characteristic species. Eighteen species occurred on only one landform: either on raised hummocks, low hollows or the flats in-between. Flats had a higher plant species richness (5.0 species/m2) than hollows (3.5 species/m2) or hummocks (1.9 species/m2). Hollows supported a higher plant biomass (1,390 g/m2) than flats (900 g/m2) or hummocks (290 g/m2). Methods: In winter 2000/2001, a 37-ha agricultural field was subjected to multiple restoration interventions: stripping the topsoil; reprofiling the surface into hummocks (1 m tall; 1.5 m diameter), hollows (30 cm deep; 20–40 m2) and flats; blocking ditches to raise the water table; replacing the topsoil; and planting tree seedlings in the hollows and flats (1,680 seedlings/ha). In October 2003, herbaceous vegetation was surveyed in eighteen 5-m2 plots (six plots/landform). Above-ground biomass was cut from one 50-cm diameter subplot/plot, then dried and weighed.
A replicated, before-and-after study in 1953–2002 of two freshwater wetland restoration sites in England, UK (9) reported that following multiple interventions, nine plant species (re)appeared. Five years after restoration, seven wetland plant species had recolonized the sites (i.e. present before degradation in 1953, absent after degradation in 1983, then present after restoration in 2002). Two new plant species colonized the wetlands (i.e. not present in 1953 or 1983). Eight locally rare plant species that were present in 1983 were absent in 2002. The study also reported reduced cover of Cladonia lichens following intervention (but this was not quantified). Methods: In 1997, multiple interventions were applied in two degraded wetland depressions (overgrown by willow Salix spp. after grazing stopped in the 1950s and water levels dropped in the 1970s). Willow trees and common reed Phragmites australis were cut and removed, willow stumps were treated with herbicide, and late-summer grazing by sheep and goats was reintroduced (further details not reported). Vegetation surveyed in 2002 was compared to previously published records from 1953 and 1983.
A replicated, before-and-after, site comparison study in 2000–2003 involving 15 ephemeral freshwater wetland restoration sites in South Carolina, USA (10) reported that multiple interventions changed the vegetation type, cover and species richness. Before intervention, the sites were dominated by facultative wetland trees (see

12. Habitat restoration and creation
312
original paper for data on individual species abundance). They contained 22 plant species on average (including 5 wetland-characteristic) and had 143% vegetation cover (herbaceous: 6%; wetland-characteristic: 29%). One and two years after intervention, during a dry spell, restored wetlands were dominated by facultative and wetland-characteristic herbs. They contained 36–44 plant species (including 14–20 wetland-characteristic) and had 65–78% vegetation cover (herbaceous: 40–60%; wetland-characteristic: 24–37%). In the third, wetter year, the vegetation in restored wetlands was dominated by facultative trees (as saplings or resprouts) with some submerged, floating and emergent herbs. There were now only 17 plant species/wetland (including 8 wetland-characteristic) and vegetation cover was only 23% (herbaceous: 13%; wetland-characteristic: 13%). Three unrestored wetlands retained similar vegetation to pre-restoration conditions throughout the study (e.g. dominated by woody vegetation; 18–27 plant species). Methods: In 2000–2001, fifteen degraded wetlands (≤2 ha; drained and overgrown but with actively flowing remnant ditches) were subjected to multiple restoration interventions: plugging drainage ditches, cutting and removing existing trees, and applying herbicide to resprouting stumps. Eight of the wetlands were also sparsely planted with seedlings of wetland-characteristic trees; see Barton et al. (2004) and (12). Vegetation was sampled in August before intervention (2000) and for three years after (2001–2003). Three unrestored wetlands were also monitored for comparison. Some of the restored wetlands in this study were used in (11), and all were used in (12).
A replicated study in 2000–2004 of 12 ephemeral freshwater wetland restoration sites in South Carolina, USA (11) reported that following multiple interventions, the sites developed vegetation cover including wetland-characteristic species. Approximately one year after intervention, overall vegetation cover was 48% (wetland-characteristic species: 23%) and there were 11.4 plant species/4 m2 (wetland-characteristic: 4.9). Approximately three years after intervention, overall vegetation cover was 90% (wetland-characteristic: 54%) and there were 8.7 plant species/4 m2 (wetland-characteristic: 4.7 species/4 m2). Methods: In 2000–2001, twelve degraded wetlands (≤2 ha; drained and overgrown by facultative wetland trees) were restored by plugging drainage ditches, cutting and removing existing trees, and applying herbicide to resprouting stumps. Some of the wetlands were also sparsely planted with seedlings of wetland-characteristic trees; see Barton et al. (2004) and (12). In August 2002 and 2004, plant species and cover (excluding resprouting trees) were recorded in one 4-m2 quadrat/wetland. The first survey was during a drought, but the second after normal rainfall. The wetlands in this study were also used in (10) and (12).
A replicated, before-and-after, site comparison study in 2000–2005 of 16 ephemeral freshwater wetland restoration sites in South Carolina, USA (12) reported that multiple interventions changed the vegetation type, cover and species richness. Results summarized for this study are not based on assessments of statistical significance. Before intervention, the sites were dominated by facultative wetland trees (data not reported). They contained 23 plant species on average (including 8 wetland-characteristic) and had 141% overall vegetation cover (woody: 130%; herbaceous: 10%; wetland-characteristic: 48%). Reference wetlands contained 10–33 species. After one year, restored wetlands were dominated by facultative and wetland-characteristic herbs. They contained 43 plant species (including 22 wetland-characteristic) and had 77% vegetation cover (woody: 18%; herbaceous: 59%; wetland-characteristic: 39%). After five years, restored wetlands contained a mixture

12. Habitat restoration and creation
313
of herbs and young woody plants. They contained 35 plant species (including 21 wetland-characteristic) and had 102% vegetation cover (woody: 40%; herbaceous: 64%; wetland-characteristic: 63%). At this point, the overall plant community in restored wetlands was 37–41% similar to 29 reference local marsh and swamp communities (vs 36–41% similarity between natural marsh or swamp communities from different sites). For data on the abundance of individual plant species, see original paper. Methods: In 2000–2002, sixteen degraded wetlands (≤2 ha; drained and overgrown) were subjected to multiple restoration interventions: plugging drainage ditches, cutting and removing existing trees, and applying herbicide to resprouting stumps. Eight of the wetlands were also sparsely planted with seedlings of wetland-characteristic trees. Vegetation was sampled in August before restoration (2000) and for five years after (2001–2005). Some of the restored wetlands in this study were also used in (10) and (11).
A replicated study in 2004–2010 of four ephemeral marsh restoration sites within farmland in Oregon, USA (13) reported that following multiple interventions, vegetation cover developed. Approximately three and a half years after intervention began, there were 55–99 plant species/marsh (native: 42–67; non-native: 13–33) and total vegetation cover was 128–177% (native: 91–174%; non-native: 4–37%). Two marshes were also monitored after five and a half years. There were now 86–112 plant species/marsh (native: 58–74; non-native: 28–38). Total vegetation cover had increased in one of two marshes (to 242%). Native cover increased in both (to 103–240%) and exotic cover had decreased in both (to 2–12%). These results are not based on assessments of statistical significance. Methods: Four areas (3–16 ha) of agricultural land were managed to restore ephemeral marshland. Interventions included mowing, burning, applying herbicide (general or grass-specific), rewetting by removing drainage ditches, removing weeds by hand, seeding herbs and directly planting herbs. In the second and fifth summer after intervention began, vegetation was surveyed at ≥400 points/marsh (≥200 points in each of 2–4 plots/marsh).
A replicated, site comparison study of six papyrus marshes in East Africa (14) reported that created marshes developed similar biomass of papyrus Cyperus papyrus to natural marshes, within 18 months. Statistical significance was not assessed. In two created marshes in Tanzania, above-ground papyrus biomass was 3,900 g/m2. This was within the range reported for other natural East African papyrus marshes: 883–8,456 g/m2 (data from the four studies that clearly measured above-ground, rather than total, biomass). Methods: Marsh creation involved multiple interventions: physically removing problematic plants (water hyacinth Eichhornia crassipes and crops), digging the compacted soil, planting papyrus and other wetland reeds/grasses/shrubs, digging channels to rewet the marsh, and fencing to exclude humans and animals. After 18 months, papyrus was cut from the created marshes, then dried and weighed. Previously published biomass data from natural marshes were reported for comparison. The study does not report dates of intervention or monitoring.
A replicated, site comparison study in 2009–2010 of six wet prairies in Oregon and Washington, USA (15) found that restored prairies contained a different plant community to remnant semi-natural prairies, but had similar richness and cover. Approximately 3–8 years after restoration began, the overall plant community composition significantly differed between restored and remnant prairies (data reported as a graphical analysis). Other vegetation metrics did not significantly differ between restored and remnant prairies. This was true for overall richness (restored:

12. Habitat restoration and creation
314
18–40; remnant: 13–48 taxa/100 m2), native richness (restored: 11–28; remnant: 9–26 taxa/100 m2), native diversity (data reported as a diversity index), overall vegetation cover (restored: 114–164%; remnant: 95–115%), grass cover (restored: 44–108%; remnant: 72–93%) and forb cover (restored: 20–120%; remnant: 2–43%). For data on the abundance of individual plant species, see original paper. Methods: In summer 2009, plant taxa and their cover were recorded in three restored and three remnant seasonally flooded wet prairies (three 100-m2 plots/site, in areas dominated by tufted hairgrass Deschampsia cespitosa). Taxa were also recorded in spring 2010. Restoration of previously drained and “altered” sites involved prescribed burning, annual herbicide application, annual mowing, sowing cover crops and sowing native species (four of these five interventions/site, over 3–8 years). Remnant sites were the best remaining, but not completely undisturbed, wetland prairies in the area. They were also managed with some of the interventions, plus hand weeding.
A study in 2011–2013 of a created freshwater marsh in New York, USA (16) reported that it contained 44–46 plant species after approximately two years. There were 17 plant species present in the summer one year after creation began (and before deliberately planting vegetation) and 44–46 species present in the summer two years after creation began (one year after planting). Plant species diversity was also higher in the second summer (data reported as a diversity index; statistical significance not assessed). Note that sampling effort was not the same in both years. In the second summer, the plant communities somewhat differed between pools within the marsh, with an average 59% similarity in composition. Methods: A stormwater treatment marsh was created by (a) demolishing buildings and excavating eight pools in June 2011, (b) clearing established vegetation, reprofiling the pools and planting 85 species of trees, shrubs, emergent herbs and submerged herbs, in September 2012, and (c) mowing in July 2013. Plant species and their cover were surveyed along three 20-m transects in June 2012, then nine 20-m transects (1–2 transects/pool) in June and August 2013. Transects included terrestrial, emergent wetland and aquatic vegetation.
A replicated study in 2013 of eight 10-year-old restored/created freshwater wetlands in Maryland, USA (17) reported that they contained a total of 134 plant species, including 65 wetland-characteristic species. There were 45–78 species/ wetland in the ground layer (<1 m tall) and 4–10 species/wetland in the tree layer (woody species >1 m tall). The study also noted that several environmental characteristics were related to plant diversity and/or community composition (e.g. wetland size, slope, water regime, soil fertility; see original paper for details). Methods: In June–August 2013, vegetation was surveyed along transects in eight restored/created depressional wetlands (4–6 transects/wetland, extending from the centre to the surrounding upland). The wetlands had been restored (one) or created (seven) on farmland in 2003–2004, by: removing drainage tiles/plugging ditches; adding coarse woody debris; adding wheat/barley straw; and planting trees/shrubs around the margins of the flooded centre and in the surrounding uplands.
(1) Swanson L.J. Jr. & Shuey A.G. (1980) Freshwater marsh reclamation in west central Florida. Proceedings of the Annual Conference on Restoration and Creation of Wetlands 7, Tampa, Florida, 51–61.
(2) Jarman N.M., Dobberteen R.A., Windmiller B. & Lelito P.R. (1991) Evaluation of created freshwater wetlands in Massachusetts. Restoration & Management Notes, 9, 26–29.
(3) Vivian-Smith G. & Handel S.N. (1996) Freshwater wetland restoration of an abandoned sand mine: seed bank recruitment dynamics and plant colonization. Wetlands, 16, 185–196.
(4) Parikh A. & Gale N. (1998) Vegetation monitoring of created dune swale wetlands, Vanderberg Air Force Base, California. Restoration Ecology, 6, 83–93.

12. Habitat restoration and creation
315
(5) Smith T., Lundholm J. & Simser L. (2001) Wetland vegetation monitoring in Cootes Paradise: measuring the response to a fishway/carp barrier. Ecological Restoration, 19, 145–154.
(6) Leck M.A. (2003) Seed-bank and vegetation development in a created tidal freshwater wetland on the Delaware River, Trenton, New Jersey, USA. Wetlands, 23, 310–343.
(7) Bohnen J.L. & Galatowitsch S.M. (2005) Spring Peeper Meadow: revegetation practices in a seasonal wetland restoration in Minnesota. Ecological Restoration, 23, 172–181.
(8) Bruland G.L. & Richardson C.J. (2005) Hydrologic, edaphic, and vegetative responses to microtopographic reestablishment in a restored wetland. Restoration Ecology, 13, 515–523.
(9) Akers P. & Alcorn R.I. (2006) Re-colonization of wetland plants following scrub removal at the Open Pits, Dungeness RSPB reserve, Kent, England. Conservation Evidence, 3, 92–93.
(10) De Steven D., Sharitz R.R., Singer J.H. & Barton C.D (2006) Testing a passive revegetation approach for restoring coastal plain depression wetlands. Restoration Ecology, 14, 452–460.
(11) De Steven D. & Sharitz R.R. (2007) Transplanting native dominant plants to facilitate community development in restored coastal plain wetlands. Wetlands, 27, 972–978.
(12) De Steven D., Sharitz R.R. & Barton C.D. (2010) Ecological outcomes and evaluation of success in passively restored Southeastern depressional wetlands. Wetlands, 30, 1129–1140.
(13) Wold E.N., Jancaitis J.E., Taylor T.H. & Steeck D.M. (2011) Restoration of agricultural fields to diverse wet prairie plant communities in the Willamette Valley, Oregon. Northwest Science, 85, 269–287.
(14) Kiwango Y., Moshi G., Kibasa W. & Mnaya B. (2013) Papyrus wetlands creation, a solution to
improve food security and save Lake Victoria. Wetlands Ecology and Management, 21, 147–154. (15) Taylor S.M. & Santelmann M.V. (2014) Comparing vegetation and soils of remnant and restored
wetland prairies in the Northern Willamette Valley. Northwest Science, 88, 329–343. (16) Pier B.M., Dresser B.R., Lee J.J., Boylen C.W. & Nierzwicki-Bauer S.A. (2015) Ecological analysis
before and after planting in a constructed wetland in the Adirondacks. Wetlands, 35, 611–624. (17) Russell K.N. & Beauchamp V.B. (2017) Plant species diversity in restored and created Delmarva
Bay wetlands. Wetlands, 37, 1119–1133. Additional Reference
Barton C.D., De Steven D. & Kilgo J.C. (2004) Mitigation bank promotes research on restoring coastal plain depression wetlands. Ecological Restoration, 22, 291–292.
12.2.2 Restore/create brackish/saline marshes or swamps (multiple
interventions)
Eight studies evaluated the effects, on vegetation, of using >3 combined interventions to restore/ create brackish/saline marshes or swamps. Six studies were in the USA1–6. One was in Singapore7. One was in Indonesia8. Three studies2,3,6 were based on the same experimental set-up.
VEGETATION COMMUNITY
Overall extent (1 study): One study of a coastal site in the USA4 reported that the coverage of mangrove vegetation increased, and the coverage of herbaceous vegetation declined, over five years after intervention (intended to restore mangrove forest).
Overall richness/diversity (3 studies): Three studies of one salt marsh restoration site in the USA2,3,6 simply quantified plant species richness for up to 13 growing seasons after intervention.
Tree/shrub richness/diversity (1 study): One site comparison study in Indonesia8 reported that a restored aquaculture pond contained a similar number of mangrove species to nearby reference forests, just 6–7 months after intervention. Some trees may have been present before intervention.
VEGETATION ABUNDANCE
Overall abundance (4 studies): One replicated, paired, site comparison study of salt marshes in the USA5 found that restored marshes had similar overall vegetation cover to natural marshes after 9–20 years. Three studies of one salt marsh restoration site in the USA2,3,6 simply quantified overall vegetation abundance for up to 13 growing seasons after intervention.

12. Habitat restoration and creation
316
Tree/shrub abundance (3 studies): One replicated, paired, site comparison study of salt marshes in the USA5 found that restored marshes had similar, limited shrub cover to natural marshes after 9–20 years. One site comparison study of mangrove forests in Singapore7 reported that a created mangrove forest supported lower above-ground biomass than mature natural forests after ≥15 years. One study in Indonesia8 simply counted the number of mangrove trees present 6–7 months after intervention.
Individual species abundance (4 studies): Four studies in estuaries in the USA1–3,6 simply quantified the abundance of individual plant species for up to 13 growing seasons after intervention.
VEGETATION STRUCTURE
Overall structure (1 study): One replicated, paired, site comparison study of salt marshes in the USA5 found that restored marshes had less cover of short vegetation and greater cover of medium-height vegetation than natural marshes after 9–20 years. Restored and natural marshes had similar cover of tall vegetation.
Height (2 studies): One study of a created mangrove forest in Singapore7 reported that the average height of surviving mangrove saplings increased over five years. One study of a salt marsh restoration site in the USA6 reported that maximum vegetation height did not clearly increase between the third and twelfth/thirteenth growing seasons after intervention.
A study in 1981–1982 in an estuary in Maryland, USA (1) reported that 53% of a site prepared with multiple interventions contained smooth cordgrass Spartina alterniflora. After approximately one year, smooth cordgrass stands covered 4.5 ha of an 8.5 ha prepared area. Methods: In November 1981, fine-grained dredge sediment was deposited in Tar Bay. In April–May 1982, an 8.5-ha area 20–50 cm above mean low water was sown with a mix of smooth cordgrass seeds and cat litter (as a drying agent; approximately 96 seeds/m2) and harrowed with spikes or chains. In June and August, the area was fertilized (NPK fertilizer; 110 kg/ha). The area covered by smooth cordgrass stands, both “dense” and “sparse”, was recorded in December 1982.
A study in 1996–2000 of a salt marsh restoration site in California, USA (2) reported that over four growing seasons after multiple interventions, unplanted seedlings colonized and vegetation cover developed. Over the first growing season after intervention 35,507 unplanted seedlings of eight species were recorded across eighty-five 4-m2 plots. At least 98% of unplanted seedlings were pickleweed Salicornia virginica, dwarf saltwort Salicornia bigelovii or estuary seablite Suaeda esteroa. For these species, the number of unplanted seedlings/plot typically depended on elevation and the identity and number of planted species (see original paper). After four growing seasons, plots contained 3.2–5.3 plant species on average. There was 94% total vegetation cover, dominated by pickleweed and dwarf saltwort. Methods: In 1996/1997, an upland area was lowered to intertidal elevations and graded into a slope. In this area, eighty-five 4-m2 study plots were amended with fine sediment, tilled and levelled. Seventy plots were then planted with salt marsh herbs/succulents (90 seedlings/plot; 1–6 species/plot; eight species total). Non-planted seedlings were counted (and removed) throughout the growing season in 1998, and at the end of the growing season in 1999. Plant species and their cover were surveyed, along two transects/plot, until autumn 2000. This study was based on the same experimental set-up as (3) and (6).
A study in 1996–2000 of a salt marsh restoration site in California, USA (3) reported that three growing seasons after multiple interventions, the site contained both planted and unplanted vegetation. On average, plots contained 94 g/m2 standing

12. Habitat restoration and creation
317
above-ground biomass if not planted, and 372–431 g/m2 standing above-ground biomass if planted (see Section 12.22). Unplanted species colonized all plots, but only five species were found across 15 unplanted plots. Three species comprised 97% of the above-ground biomass in unplanted plots: dwarf saltwort Salicornia bigelovii (59 g/m2), pickleweed Salicornia virginica (29 g/m2) and estuary seablite Suaeda esteroa (5 g/m2). Methods: In 1996/1997, an upland area was lowered to intertidal elevations and graded into a slope. In this area, eighty-five 4-m2 study plots were amended with fine sediment, tilled and levelled. Seventy plots were then planted with salt marsh herbs/succulents (90 seedlings/plot; 1–6 species/plot; eight species total). Non-planted vegetation was cleared from all plots in 1997 and 1998, but was left to grow from 1999. In January 2000, standing vegetation was cut from a 20 x 120 cm quadrat in each plot, then dried and weighed. This study was based on the same experimental set-up as (2) and (6).
A study in 1999–2004 of a coastal site in Florida, USA (4) reported that following multiple interventions, mangrove trees spontaneously colonized. Mangrove vegetation covered 4% of the site immediately after intervention, then 95% after five years. Mangrove seedlings were observed growing three months after intervention (174 seedlings/m2) and five years after intervention (40 seedlings/m2). After five years, white mangroves Laguncularia racemosa were 1.6 m tall on average and black mangroves Avicennia germinans were 0.9 m tall on average. Herbaceous vegetation coverage declined from 32% of one year after intervention to 5% after five years. Methods: In spring/summer 1999, a degraded coastal site was subjected to multiple interventions intended to expand mangrove forest habitat: clearing invasive shrubs/trees with chainsaws and herbicide, reprofiling to intertidal elevations (similar to nearby mangroves), excavating tidal creeks, and planting smooth cordgrass Spartina alterniflora on bare ground (to trap mangrove propagules). Vegetation was surveyed immediately after intervention was complete (September 1999) and five years later (September 2004). This summary takes some methodological details from Mauseth et al. (2001).
A replicated, paired, site comparison study in 2001–2002 of 22 coastal salt marshes in Virginia, USA (5) found that marshes created using multiple interventions had similar plant species richness, overall vegetation cover and shrub cover to natural marshes, but that the created marshes had lower cover of short vegetation than the natural marshes. After 9–20 years, there was no significant difference between created and natural marshes in plant species richness (created: 4.1; natural: 5.7 species/marsh), overall vegetation cover (created: 83%; natural: 80%) and shrub cover (created: 2%; natural: 3%). Both marsh types had statistically similar cover of tall vegetation (created: 9%; natural: 13%). However, created marshes had lower cover of short vegetation (created: 9%; natural: 27%) and greater cover of medium-height vegetation (created: 63%; natural: 35%). Seven plant species found in the natural marshes were absent from the created marshes. Methods: In May–July 2001 and 2002, vegetation was surveyed in 11 pairs of marshes (matched by size, shape and surrounding land use). In each pair, one marsh had been created 9–20 years previously and one was natural. Marsh creation involved removing upland soil, reprofiling to a suitable slope, creating a connection to a tidal creek, and planting (mostly grasses/rushes, sometimes shrubs; 6 of 11 marshes planted with only one species). In each of six surveys, the cover of every plant species and bare mud were recorded along 2–6 transects/marsh (transects 100 m long).
A study in 1996–2009 of a salt marsh restoration site in California, USA (6) reported that 12–13 growing seasons after multiple interventions, the site contained

12. Habitat restoration and creation
318
salt marsh vegetation dominated by pickleweed Salicornia virginica and salt marsh daisy Jaumea carnosa. Pickleweed was present in 100% of plots, with 110 g/0.25 m2 above-ground biomass. Salt marsh daisy was present in 87% of plots, with 75 g/0.25 m2 above-ground biomass. Total above-ground biomass was 210 g/0.25 m2 (vs 79 after 1–3 growing seasons). There were 4.0 plant species/plot (vs 3.0–4.5), 3.5 canopy layers (vs 1.9–2.7) and a maximum vegetation height of 33–37 cm (vs 20–38). Relationships between these outcomes and the number of species planted in restoration plots that were significant after 1–3 growing seasons were no longer significant after 11–12 years (see original paper). Methods: In 1996/1997, an upland area was lowered to intertidal elevations and graded into a slope. In this area, eighty-five 4-m2 plots were amended with fine sediment, tilled and levelled. Most were then planted with salt marsh herbs/succulents (90 seedlings/plot; 1–6 species/plot; eight species total). Non-planted vegetation was cleared from all plots in 1997 and 1998, but was left to grow from 1999. Vegetation was surveyed in 45 planted plots in 1997–2000 and 2008–2009. Biomass included standing vegetation only and was dried before weighing. This study used a subset of the plots from (2) and (3).
A site comparison study involving one mangrove creation site in Singapore (7) reported that the average height of surviving trees increased over five years, but that above-ground biomass remained lower than in nearby natural mangrove forests after ≥15 years. Statistical significance was not assessed. After five years, surviving trees were 1.5–2.0 m tall (vs <0.45 m tall when sown or planted). After ≥15 years, the above-ground biomass in the created mangrove (36 t C/ha) was lower than in mature natural mangroves in the rest of Singapore (105–227 t C/ha). Methods: In 1996, a mangrove creation project was established on Pulau Semakau Island. Creation involved depositing ash and other waste materials between granite bunds, adding a 0.5–1.0 m thick layer of mangrove mud, planting propagules, planting nursery-reared seedlings, exposing acid soil to seawater to raise its pH, and removing barnacles and seaweed growing on seedlings. Both loop-root mangrove Rhizophora mucronata and tall-stilt mangrove Rhizophora apiculata were planted, at the elevations they occupied in nearby natural forests. This summary takes some methodological details from Tanaka et al. (2003). The date of biomass monitoring is not clear, but was likely in 2011 or later.
A site comparison study in 2013–2014 in disused aquaculture ponds in South Sulawesi, Indonesia (8) reported that 6–7 months after carrying out restoration interventions, the ponds contained 651 mangrove plants and more mangrove species than nearby reference forests. The restored ponds contained 471 mangrove seedlings/saplings and 180 mangrove trees. Of these, only 137 (21%) were found on reprofiled areas (so definitely colonized after intervention). In total, the restored ponds contained 13 mangrove species (vs 11 in nearby reference forests). The most common genera in both restored and reference forests were Rhizophora spp. (54–65% of seedlings/saplings; 29% of trees) and Avicennia spp. (21–23% of seedlings/saplings; 31–42% of trees). Methods: In November/December 2013, twenty-nine disused aquaculture ponds (21.5 ha) were subjected to multiple restoration interventions: breaching pond walls to improve tidal exchange, reprofiling some walls to more suitable elevations for mangroves (details not reported), adding a pile of broken branches to trap propagules, and releasing >218,000 propagules (>7 species) at high tide. In June 2014, vegetation was surveyed in the restored ponds and two nearby reference mangrove forests (the least disturbed local forests; area surveyed not clearly reported).

12. Habitat restoration and creation
319
(1) Earhart H.G. & Garbisch E.W. Jr. (1983) Habitat development utilizing dredged material at Barren Island Dorchester County, Maryland. Wetlands, 3, 108–119.
(2) Lindig-Cisneros R. & Zedler J. (2002) Halophyte recruitment in a salt marsh restoration site. Estuaries, 25, 259–273.
(3) Callaway J.C., Sullivan G. & Zedler J.B. (2003) Species-rich plantings increase biomass and nitrogen accumulation in a wetland restoration experiment. Ecological Applications, 13, 1626–1639.
(4) Lewis R.R. III (2005) Project facilitates the natural reseeding of mangrove forests (Florida). Ecological Restoration, 23, 276–277.
(5) Desrochers D.W., Keagy J.C. & Cristol D.A. (2008) Created versus natural wetlands: avian communities in Virginia salt marshes. Écoscience, 15, 36–43.
(6) Doherty J.M., Callaway J.C. & Zedler J.B. (2011) Diversity-function relationships changed in a long- term restoration experiment. Ecological Applications, 21, 2143–2155.
(7) Friess D.A. (2017) Mangrove rehabilitation along urban coastlines: a Singapore case study. Regional Studies in Marine Science, 16, 279–289.
(8) Oh R.R.Y., Friess D.A. & Brown B.M. (2017) The role of surface elevation in the rehabilitation of abandoned aquaculture ponds to mangrove forests, Sulawesi, Indonesia. Ecological Engineering, 100, 325–334.
Additional References
Mauseth G.S., Urquhart-Donnelly J.S. & Lewis R.R. (2001) Compensatory restoration of mangrove habitat following the Tampa Bay oil spill. International Oil Spill Conference Proceedings 2001, 761–767.
Tanaka Y, Arita K, Yauchi E. 2003. A mangrove mitigation project in Singapore. Asia and Pacific Coasts 2003: Proceedings of the 2nd International Conference, Makuhari, Japan, 256–257.
12.3 Deposit soil/sediment and introduce vegetation
Background
This section considers studies that examine the combined effects of (a) large-scale deposition of soil or sediment (e.g. waste material from dredging) to form the physical structure of a marsh or swamp and (b) introducing marsh or swamp vegetation in any form, such as planting individual plants or sowing seeds. Introducing vegetation may help to stabilize the deposited sediment whilst natural colonization occurs.
Related interventions: Deposit soil/sediment to form physical habitat structure, without introducing vegetation (12.16); introduce marsh or swamp vegetation (12.22–12.26).
12.3.1 Deposit soil/sediment and introduce vegetation: freshwater
marshes
We found no studies that evaluated the combined effects, on vegetation, of depositing soil/sediment to form the physical structure of freshwater marshes and introducing vegetation.
This means that we have not yet found any studies that have directly evaluated this intervention during our systematic journal and report searches. Therefore we have no evidence to indicate whether or not the intervention has any desirable or harmful effects.
12.3.2 Deposit soil/sediment and introduce vegetation: brackish/salt
marshes
Six studies evaluated the combined effects, on vegetation, of depositing soil/sediment to form the physical structure of brackish/salt marshes and introducing vegetation. All six studies were in the USA. Several sites, and even the same data from some sites, were used in multiple studies1,3–5.

12. Habitat restoration and creation
320
VEGETATION COMMUNITY
Overall extent (2 studies): Two replicated, site comparison studies of salt marshes in the USA4,6 compared the overall area of emergent vegetation in marshes created by depositing sediment and planting vs natural marshes. One study4 found that created and natural marshes had similar vegetation coverage after 2–23 years. The other study6 reported that created marshes had slightly lower vegetation coverage than nearby natural marshes after 2–4 years.
Community types (1 study): One replicated, site comparison study in the USA3 found that four of four plant community types had similar coverage in created and natural salt marshes after 3–15 years. For most marshes, creation involved depositing sediment and planting herbs.
Community composition (1 study): One replicated, before-and-after, site comparison study in the USA6 reported that the overall plant community in salt marshes created by depositing sediment and planting herbs/shrubs was <36% similar to nearby natural salt marshes, after 2–4 years.
VEGETATION ABUNDANCE
Overall abundance (1 study): One paired, site comparison study in the USA1 found that salt marshes created by depositing sediment and planting/sowing herbs typically contained at least as much vegetation (biomass and density) as natural marshes, after 1–4 years.
Individual species abundance (4 studies): Three studies1,2,5,6 quantified the effect of this intervention on the abundance of individual plant species. For example, two studies (one review, one site comparison) in the USA2,5 found that salt marshes created by depositing sediment and introducing vegetation typically contained a similar amount (density2,5 and/or biomass5) of cordgrasses Spartina spp. to nearby natural marshes, after 1–9 years. Meanwhile, one paired, site comparison study in the USA1 reported that whether created marshes contained a higher, lower or similar cordgrass density to natural marshes depended on plot elevation.
VEGETATION STRUCTURE
Overall structure (2 studies): One replicated, site comparison study in the USA3 found that salt marshes created (mostly) by depositing sediment and planting herbs contained larger patches of vegetation with straighter edges than natural marshes, after 3–15 years. One replicated, paired, site comparison study in the USA4 reported that created salt marshes contained a similar proportion of edge habitat to nearby natural salt marshes, after 2–23 years.
Height (2 studies): Two site comparison studies in the USA1,2 compared the height of cordgrasses Spartina sp. in created and nearby natural marshes. One study1 (also paired) found that created marshes typically contained cordgrass of similar height to natural marshes, after 1–4 growing seasons. The other study2 reported that cordgrass was shorter in created than natural marshes, after 7–9 years.
A paired, site comparison study in 1978–1979 of four intertidal salt marshes in Texas, USA (1) found that a created marsh – where cordgrasses Spartina spp. were planted and sown after depositing sediment – typically developed similar vegetation biomass and cordgrass of similar height to natural marshes, with mixed results for cordgrass density. Within four years, total above-ground vegetation biomass was statistically similar in created and natural marshes in 19 of 24 comparisons (for which created: 278–982 g/m2; natural: 132–1,102 g/m2). The average height of smooth cordgrass Spartina alterniflora was statistically similar in created and natural marshes in 15 of 21 comparisons (for which created: 34–124 cm; natural: 13–114 cm). In the other eight comparisons, all below mean high tide, cordgrass was taller in created marshes. The density of smooth cordgrass was similar in created and natural marshes in only 10 of 24 comparisons (for which created: 27–489; natural: 12–635 stems/m2).

12. Habitat restoration and creation
321
Its density was higher in created marshes in seven comparisons (all above mean high tide; created: 27–156; natural: 0–63 stems/m2) but lower in created marshes in seven comparisons (all below mean high tide; created: 192–489; natural: 396–814 stems/m2). Methods: Between August and November 1978 and 1979, vegetation was surveyed in one created and three natural salt marshes (six 0.5-m2 quadrats at each of 3–5 tide levels/marsh). Marsh creation involved depositing sediment in 1975 then, in some areas, planting cordgrass sprigs in summer 1976 and sowing cordgrass seeds in spring 1977. All quadrats were in or near to planted/sown areas (not clearly reported). Biomass was dried before weighing. One site from this study was also included in (3). Some data from this study were included in (5).
A site comparison study in 1989 of four estuarine salt marshes in California, USA (2) found that parts of a marsh created by depositing sediment and planting California cordgrass Spartina foliosa supported a similar cordgrass density to adjacent natural marshes, but with shorter plants. Statistical significance was not assessed. After 7–9 years, four of six transects in the created marsh supported a cordgrass density (100–193 stems/m2) within the range of nearby natural marshes (73–193 stems/m2). The other two transects supported a lower cordgrass density (40–60 stems/m2). However, a greater proportion of stems were in shorter height classes in the created marshes than in the natural marshes (data reported graphically). Methods: In September 1989, California cordgrass was surveyed in 0.1-m2 quadrats. Thirty-six quadrats (six transects) were surveyed in a marsh created by depositing dredge spoil (in 1980) then planting California cordgrass (in 1984–1986). Fifty-four quadrats (seven transects) were surveyed in three nearby natural marshes.
A replicated, site comparison study in 1990 of 15 coastal salt marshes in Texas, USA (3) found that marshes created by depositing sediment and/or introducing vegetation had similar coverage of emergent plant community types to natural marshes, but contained larger, smoother patches of the most abundant community type. Created and natural marshes had statistically similar coverage of four of four plant communities: three types of emergent herbaceous vegetation (created: 2–47%; natural: 1–45% coverage/type) and one type of shrubby vegetation (created: 6%; natural: 2%). The most abundant community type was dense, regularly flooded smooth cordgrass Spartina alterniflora. In created marshes, this occurred in larger blocks with straighter edges (vs smaller patches with undulating edges in natural marshes; data reported as landscape metrics). Methods: Ten created marshes, and representative sections of five nearby natural marshes, were mapped from aerial photographs taken in October 1990. All marshes were landward of barrier islands. The created marshes were 3–15 years old. Marsh creation involved: planting smooth cordgrass onto deposited sediment (five marshes) or excavated upland (one marsh); planting only (two marshes); or depositing sediment only (two marshes). The study does not report further details of creation methods, or separate results for different means of creation. Some sites from this study were also included in (4).
A replicated, paired, site comparison study in 1995–1998 of 20 coastal salt marshes in Texas, USA (4) found that marshes created by depositing sediment and planting smooth cordgrass Spartina alterniflora had similar vegetation coverage to natural marshes after 2–23 years, and also had similar amounts of edge habitat. Created and natural marshes had statistically similar coverage of marsh vegetation (measured as the ratio of open water to vegetation; created: 0–0.7 for 9 of 10 marshes, 3.5 in the other; natural: 0–0.3). Created and natural marshes also had a statistically similar proportion of edge habitat (i.e. where marsh vegetation meets open water,

12. Habitat restoration and creation
322
measured as an edge-to-area ratio; created: 123–1,805 m/ha; natural: 239–1,134 m/ha). Methods: Vegetation patches were mapped on 10 pairs of salt marshes, using aerial photographs taken in 1995 or 1998. Each pair contained a created marsh (formed by depositing dredged sediment then planting smooth cordgrass) and a nearby natural marsh (with vegetation composition and exposure as similar as possible to the created marsh). Created marshes were 2–23 years old when photographed. Some sites from this study were also included in (3) and (5).
A 2000 review analyzing coastal salt marshes in nine sites in the southeast USA (5) found that marshes created by depositing sediment and planting marsh vegetation contained a similar amount of smooth cordgrass Spartina alterniflora to natural marshes, after 1–9 years. Averaged across all years, smooth cordgrass abundance was statistically similar in created and natural marshes (no significant difference from a 1:1 ratio). This was true for both above-ground biomass and stem density. Biomass in created marshes ranged from 0.5 times to 3.3 times the biomass in natural marshes. Stem density in created marshes ranged from 0.5 times to 1.9 times the density in natural marshes (but was never lower in created than natural marshes >3 years after creation). Methods: The review used published data from Florida, Georgia, North Carolina and Texas. It included data from (1) and several sites from (3) and (4). For each metric, year and site (above-ground biomass in seven sites, density in eight sites), a ratio was calculated to compare smooth cordgrass abundance in created and natural marshes. In all sites, marsh creation involved depositing dredged sediment in coastal waters until the surface was intertidal, then planting smooth cordgrass. Other marsh plant species were planted in some sites.
A replicated, before-and-after, site comparison study in 1991–1995 of seven salt marshes in Texas, USA (6) reported that areas of deposited sediment planted with marsh plants developed marsh vegetation, but that that the plant community composition differed from natural marshes after 2–4 years. Statistical significance was not assessed. After 2–4 years, 34–63% of each created marsh was covered by salt marsh vegetation; 1–35% was unvegetated salt pans and 16–30% was subtidal open water. The most abundant species was smooth cordgrass Spartina alterniflora (18–45% cover). For comparison, nearby natural marshes were composed entirely of salt marsh vegetation (52–71% of area) and unvegetated salt pans (29–48% of area). The most abundant species were saltwort Batis maritima (31–41% cover) and shoregrass Monanthochloe littoralis (5–47% cover). Smooth cordgrass was absent. Similarity in the overall plant community composition between created and natural marshes ranged from <1 to 36%. Methods: Four marshes were created on the Texas coast between 1991 and 1993. Dredged sediment was pumped into 2–7 ha cells, enclosed by levees. Once the sediment had settled, marsh vegetation was planted into the intertidal parts of each site (three sites: 12 herb and shrub species; one site smooth cordgrass only). The created marshes were designed to contain diverse habitats rather than to replicate the natural marshes exactly; they had a steeper gradient and were flooded more often than the natural marshes. The four created marshes, and three nearby natural marshes, were surveyed in 1995. Habitat coverage was mapped from aerial photographs. Plant species were recorded along transects at 200–303 points/site.
(1) Webb J.W. & Newling C.J. (1984) Comparison of natural and man-made salt marshes in Galveston Bay Complex, Texas. Wetlands, 4, 75–86.
(2) Zedler J.B. (1993) Canopy architecture of natural and planted cordgrass marshes: selecting habitat evaluation criteria. Ecological Applications, 3, 123–138.

12. Habitat restoration and creation
323
(3) Delaney T.P., Webb J.W. & Minello T.J. (2000) Comparison of physical characteristics between created and natural estuarine marshes in Galveston Bay, Texas. Wetlands Ecology and Management, 8, 343–352.
(4) Shafer D.J. & Streever W.J. (2000) A comparison of 28 natural and dredged material salt marshes in Texas with an emphasis on geomorphological variables. Wetlands Ecology and Management, 8, 353–366.
(5) Streever W.J. (2000) Spartina alterniflora marshes on dredged material: a critical review of the ongoing debate over success. Wetlands Ecology and Management, 8, 295–316.
(6) Darnell T.M. & Smith E.H. (2001) Recommended design for more accurate duplication of natural conditions in salt marsh creation. Environmental Management, 29, 813–823.
12.3.3 Deposit soil/sediment and introduce vegetation: freshwater
swamps
We found no studies that evaluated the combined effects, on vegetation, of depositing soil/sediment to form the physical structure of freshwater swamps and introducing vegetation.
This means that we have not yet found any studies that have directly evaluated this intervention during our systematic journal and report searches. Therefore we have no evidence to indicate whether or not the intervention has any desirable or harmful effects.
12.3.4 Deposit soil/sediment and introduce vegetation: brackish/saline
swamps
We found no studies that evaluated the combined effects, on vegetation, of depositing soil/sediment to form the physical structure of brackish/saline swamps and introducing vegetation.
This means that we have not yet found any studies that have directly evaluated this intervention during our systematic journal and report searches. Therefore we have no evidence to indicate whether or not the intervention has any desirable or harmful effects.
Modify physical habitat
12.4 Raise water level to restore/create marshes or swamps from
other land uses
Background
This intervention involves one-off action to raise the water level/table to restore/ create marshes or swamps from other land uses. This means that intervention should (a) occur at one point in time, after which the water table is not actively managed, and (b) must affect an area that does not retain substantial characteristics of the target habitat. This could be an upland area (e.g. grassland), an unvegetated wetland (e.g. mudflats), or a wetland other than the target type (e.g. swamp, where the habitat used to be a marsh).
Specific techniques to raise water levels include: blocking drainage ditches (using sediment, rocks, plastic dams, wooden dams or vegetation); building raised embankments, berms or levees to retain water; switching off drainage pumps; ceasing groundwater extraction; installing or widening culverts (e.g. under roads and railways, to increase water flow into focal marsh/swamp); removing dams upstream of the focal marsh/swamp; and reprofiling or diverting river channels to raise the

12. Habitat restoration and creation
324
water level on floodplains. All of these techniques aim to make soils saturated or flooded, or make them saturated or flooded for longer, so they can support emergent wetland vegetation. The resulting water level may be stable or fluctuating, and may create permanently or seasonally flooded wetlands. Sediment inputs may also increase in line with water inputs.
CAUTION: This intervention may have negative effects on habitats elsewhere in the catchment. For example, removing dams upstream of a focal site could drain wetlands or aquatic habitats upstream of the dam. There may also be conflicts with water needs of human populations that need to be managed. Rewetting drained acid sulfate soils – common in coastal areas and salinized inland areas – can lead to acidification, deoxygenation and release of toxic metals (Baldwin 2011).
Related interventions: Raise water level to restore degraded marshes or swamps (8.1); Flood cropland when fallow (3.5); Actively manage water level (8.4); Reprofile/ relandscape (12.9) or Remove surface soil/sediment (12.11), both of which can lower the ground surface towards the water table; Raise water level to complement planting (13.1); Restore/create marshes or swamps using multiple interventions, often including water level manipulations (12.2).
Baldwin D. (2011) National Guidance for the Management of Acid Sulfate Soils in Inland Aquatic Ecosystems, Environment Protection and Heritage Council and the Natural Resource Management Ministerial Council, Australia.
12.4.1 Raise water level to restore/create freshwater marshes from other
land uses
Twenty-six studies evaluated the effects, on vegetation, of raising the water level to restore/ create freshwater marshes from other land uses or habitat types. Twenty-one studies were in the USA1–3,4a,4b,5–8,10,11,14,15,17–21,23–25. There was one study in each of Israel9, the UK12, China13, Luxembourg16 and Canada22. Eight studies4a,4b,5,6,7,10,11,14 used sites from a common set of 62 restored prairie potholes in the Midwest USA. Five studies19–21,23,25 monitored the effects of one river dechannelization project in Florida.
VEGETATION COMMUNITY
Overall extent (5 studies): One replicated, paired, before-and-after, site comparison study in the USA2 reported that damming a stream reduced the area of emergent vegetation on the floodplain. Two before-and-after studies of a floodplain in the USA20,24 reported that after dechannelizing a river to raise the water level, the area of emergent herbaceous vegetation increased. Two studies in the USA8 and Luxembourg16 simply quantified coverage of wetland vegetation 1–6 years after raising the water table (sometimes16 along with other interventions).
Community types (9 studies): Nine studies2,4a,4b,5,15,16,20,22,24 quantified the effect of this intervention on specific types of marsh vegetation. For example, one before-and-after study of a floodplain in the USA20 reported greatly increased coverage of wet prairie plant communities after dechannelizing a river to raise the water table, but only slightly increased coverage of mixed herbaceous/shrubby wetland communities. Five studies in the USA4a,4b,5,15 and Luxembourg16 simply quantified the number15, abundance4a,4b,5 or extent16 of wetland plant communities present 1–6 years after raising the water table (typically4a,4b,5,16 along with other interventions).
Community composition (8 studies): Three replicated, site comparison studies (two also paired) in the USA6,11,17 evaluated the effects of rewetting farmed depressions (along with planting cover crops in/around them). One of these studies11 reported that restored wetlands contained a different overall plant community to natural wetlands after 5–7 years. One study6 reported that the plant

12. Habitat restoration and creation
325
community composition differed more between restored and natural wetlands than amongst restored or natural wetlands. The final study17 found that restoration increased vegetation quality after ≥10 years, but not to the level of natural wetlands. Two site comparison studies in China13 and the USA19 reported that the plant community became more similar to natural wetlands over 6–15 years after raising the water level – in terms of species composition13 or overall wetness19. Three replicated studies in the USA3,10,14 simply quantified the plant community composition for up to three years after rewetting farmland (sometimes10,14 along with other interventions).
Overall richness/diversity (12 studies): Four replicated, site comparison studies (two also paired) of one set of historically farmed depressions in the USA4b,6,7,11 reported that restored wetlands (rewetted, along with planting cover crops in/around the sites) had lower overall plant species richness than nearby natural wetlands, after 1–7 years. Two before-and-after, site comparison studies of historical wetlands on a floodplain in the USA19,21 reported that raising the water level reduced overall plant species richness in the following six years. One site comparison study of lakeshore marshes in China13 reported that the total plant species richness in former paddy fields with breached weirs was similar to a nearby natural marsh, after 2–15 years. Five studies (two replicated) in the USA1,3,14,15 and Israel9 simply quantified overall plant species richness1,3,9,14,15 and/or diversity3 between three months and 19 years after raising the water table (sometimes1,14 along with other interventions).
Characteristic plant richness/diversity (1 study): One before-and-after, site-comparison study of a floodplain in the USA19 reported that dechannelizing a river to raise the water level had no clear effect on the richness of wetland-characteristic plant species in the following six years.
VEGETATION ABUNDANCE
Overall abundance (9 studies): Three before-and-after, site-comparison studies of historical wetlands on a floodplain in the USA19,21,25 reported that dechannelizing a river to raise the water level reduced overall vegetation cover in the following 6–9 years. One site comparison study in China13 reported that vegetation biomass in former paddy fields with breached weirs was similar to a nearby natural marsh, after 2–15 years. In contrast, one replicated, site comparison study in the USA11 found that vegetation cover in rewetted, formerly farmed depressions (also planted with cover crops) was lower than in nearby natural wetlands, after 5–7 years. Four studies (two replicated) in the USA1,3,15 and the UK12 simply quantified vegetation abundance between three months and six years after raising the water table (sometimes1,12 along with other interventions).
Characteristic plant abundance (4 studies): Three before-and-after studies (two also site comparisons) of historical wetlands on a floodplain in the USA19,23,25 reported that dechannelizing a river to raise the water level increased the abundance of habitat- and/or wetland-characteristic plant species in the following 6–9 years. One study in the UK12 simply quantified the abundance of wet meadow plant species present 3–5 years after rewetting farmland (and introducing grazing).
Bryophyte abundance (1 study): One replicated, site comparison study in the USA18 found that the frequency of bryophytes in (the wettest parts of) marshes rewetted 34 years previously was not significantly different from their frequency in (the wettest parts of) nearby natural marshes.
Individual species abundance (11 studies): Eleven studies1–3,4a,6,7,10,12,14,18,23 quantified the effect of this intervention on the abundance of individual plant species. For example, one replicated, site comparison study of freshwater marshes in the USA18 reported that Kneiff’s feathermoss Leptodictyum riparium was the most abundant plant species in marshes rewetted 34 years previously and nearby natural marshes. One before-and-after study of historical wetlands on a floodplain in the USA23 reported that after dechannelizing a river to raise the water level, some plots became dominated by a non-native grass species.
VEGETATION STRUCTURE

12. Habitat restoration and creation
326
A study in 1982–1984 aiming to create a freshwater marsh on formerly mined land in Florida, USA (1) reported that building a levee to raise the water table (along with reprofiling) allowed marsh vegetation to develop within three months. Three months after intervention, 16 plant species were present with 33% total vegetation cover. After two years, 26 plant species were present with 75% total vegetation cover. During the second year after creation, the most abundant plant species were broadleaf cattail Typha latifolia (17–60% cover) and water pennywort Hydrocotyle sp. (17–35% cover). Methods: The study aimed to create a marsh on surface-mined land (historically a mix of forest and rangeland). In the early 1980s, the water table was raised by building a levee downslope. The area was also landscaped to a gentle slope with shallow depressions. The study does not distinguish between the effects of these interventions. Some ponds were also dug, but no wetland soil was added to this area. The interventions were completed by May 1982. Between autumn 1982 and summer 1984, the cover of every plant species was recorded along three randomly placed permanent transects (crossing zones of emergent and floating/submerged vegetation).
A replicated, paired, before-and-after, site comparison study in 1958–1989 aiming to create marshes along a stream in Iowa, USA (2) reported that damming the stream increased the area of open water at the expense of emergent riparian vegetation. Statistical significance was not assessed. Before damming, the 445-ha study area contained 188 ha of emergent herbaceous vegetation, plus 21 ha of open water and 239 ha of upland/forest. Approximately 5–19 years after damming, there was only 78 ha of emergent herbaceous vegetation, plus 157 ha of open water and 213 ha of upland/forest. Over 14–28 years, three riparian transects immediately upstream of dams experienced an increase in open water coverage (before: 1–10%; after: 58–72%) and a decline in coverage of tall wetland grasses (before: 7–14%; after: 0–7%). In contrast, two riparian transects away from dams had stable open water coverage (before: 2%; after: 1–3%) but experienced an increase in coverage of tall wetland grasses (before: 4–5%; after: 18–41%). Other major changes in vegetation cover were mirrored across both types of transect (e.g. decreased cover of tussock sedge Carex stricta; see original paper for data). Methods: Between 1961 and 1975, three impoundments were created by damming Elk Creek, with the aim of creating marshland for waterbirds. Maps of the riparian zone before (1958) and after (1980) damming were drawn from aerial imagery. Vegetation cover was surveyed along five transects crossing the riparian zone, before (early 1960s) and after (1989) damming.
A replicated study in 1990–1992 of 11 wetlands created or restored on farmland in Wisconsin, USA (3) reported that they had developed vegetation cover, mostly of wetland plants. On average, 3-year-old created wetlands contained 44 plant species with 85% total vegetation cover, and 23 native wetland plant species with 60% cover. The most abundant plant species were cattails Typha spp. (33% cover). Woody plants were present around the wetland margins. The overall plant community composition changed with wetland age (data reported as a graphical analysis; statistical significance of differences not assessed). Similarly, vegetation cover was generally higher in older wetlands, with 3-year-old wetlands having significantly greater vegetation cover than 1-year-old wetlands (total: 28%; native wetland: 6%). However, plant species richness and diversity did not significantly change with wetland age (see original paper for data). Methods: In autumn 1988 or 1989, eleven areas of agricultural land (<2.2 ha) were flooded by blocking or removing drainage channels. Vegetation was surveyed one year after flooding (1990, five wetlands), two years after (1991, eleven wetlands) or three years after (1992, six wetlands). Plant species and

12. Habitat restoration and creation
327
cover were recorded in twenty-five 1-m2 quadrats/wetland, and a complete species list was made for each wetland.
A replicated study in 1989–1991 of 62 prairie potholes in the Midwest USA (4a) reported that restored potholes (rewetted and planted with cover crops) developed cover of wetland plant communities within three years of first flooding. This included zones of wet meadow vegetation, emergent wetland vegetation, and aquatic (floating and submerged) vegetation. However, the abundance of each community type depended on how often the potholes were flooded, how they had been drained and for how long they had been drained. For example, potholes flooded in only one of three years were dominated by emergent wetland plants or mudflat annuals. Potholes flooded in three of three years contained these plant communities along with zones of aquatic vegetation. The study also reported data on the abundance of individual plant species (see original chapter). Methods: In 1989, 1990 and 1991, vegetation was surveyed in 62 potholes whose drainage structures had been blocked or removed in 1988, to raise the water table. All potholes had been cultivated for ≥25 years. Some had been planted with upland cover crops before rewetting; the study evaluates the combined effect of these interventions in these potholes. Some of the restored potholes were used in (4b), (5), (6) and (7) and were studied at later dates in (10), (11) and (14).
A replicated, site comparison study in 1989–1991 in the Midwest USA (4b) reported that restored prairie potholes (rewetted and planted with cover crops) developed some zones of wetland vegetation within three years, but contained fewer plant species than naturally occurring potholes. Of the 22 rewetted potholes, 16 contained an emergent vegetation zone and 13 contained a submerged vegetation zone, but only two contained a sedge meadow or wet prairie zone. After three years, 10 restored potholes contained fewer plant species (17–38 species/pothole; average: 27) than 10 contemporary natural potholes (32–56 species/pothole; average: 46) or historical reports for pristine potholes (57–126 species/pothole). More specifically, the restored potholes contained fewer shallow-emergent, sedge-meadow, wet-prairie and floating aquatic species on average (1–5 species/group/pothole) than contemporary natural potholes (4–17 species/group/pothole), but more submerged aquatic species (6 vs 1 species/pothole). Methods: In 1989, 1990 and 1991, vegetation was surveyed in 22 potholes whose drainage structures had been blocked or removed in 1988, to raise the water table. All of these potholes had been cultivated for ≥25 years, but were flooded every summer since rewetting. Some had been planted with upland cover crops before rewetting: the study evaluates the combined effect of these interventions in these potholes. Vegetation was also surveyed in 10 adjacent natural potholes (never drained, but surrounded by farmland). Species richness of seven pristine potholes (unaffected by surrounding agriculture) was obtained from published records from the 1890s–1980s. This study used a subset of the restored potholes from (4a) – but not clearly the same 22 potholes as (5).
A replicated study in 1989–1991 of 22 prairie pothole marshes in the Midwest USA (5) reported that most restored potholes (rewetted and planted with cover crops) developed some characteristic wetland plant zones within three years. Natural prairie potholes have zones of plant communities, characteristic of different water levels. Of 22 potholes studied three years after restoration, 18 had developed at least one characteristic pothole vegetation zone. Sixteen had a deep water zone with submerged vegetation. Thirteen had an emergent vegetation zone. Two had a sedge meadow zone. None had a wet prairie zone. Methods: In 1989–1991, cover of every

12. Habitat restoration and creation
328
plant species was estimated in 22 potholes and used to identify vegetation zones. All potholes had been historically drained and cultivated, but restored in 1987–1989 by rewetting (blocking/removing drainage structures and building water-retaining dikes where necessary) and sometimes planting cover crops. Note that the study evaluates the combined effect of these interventions in some potholes. All potholes had flooded in three consecutive years when surveyed. This study used a subset of the restored potholes from (4a) – but not clearly the same 22 potholes as (4b).
A replicated, paired, site comparison study in 1991 of 20 prairie potholes in Iowa, USA (6) found that restored potholes (rewetted and planted with cover crops) contained a distinct plant community to natural wetlands after three years, with fewer plant species. The plant community composition differed more between restored and natural wetlands (12–44% similarity) than it did amongst restored or natural wetlands (31–63% similarity). The study reported lower richness in restored than natural wetlands of plant species overall, floating, shallow emergent, wet prairie and sedge meadow species, but higher richness of submerged species (data reported in 4b). The study also reported data on the cover of common individual plant species (see original paper). Methods: In April–October 1991, plant species and cover were recorded in 10 pairs of similarly sized pothole marshes (twenty 1-m2 quadrats/ pothole). In each pair, one marsh had been restored three years previously (by blocking/breaking drainage structures to raise the water level and, in some sites, planting cover crops; note that the study evaluates the combined effect of these interventions in some potholes). Restored potholes had previously been drained and farmed for ≥25 years. The other marshes were natural (never drained or farmed, but surrounded by farmland). This study used a subset of the restored potholes from (4a) and exactly the same potholes as (7). Some of the potholes were also studied in (11).
A replicated, paired, site comparison study in 1991 of 20 prairie potholes in Iowa, USA (7) found that restored potholes (rewetted and planted with cover crops) contained fewer plant species than natural wetlands after three years, and that their plant community was composed of different types of species. Statistical significance was not assessed. Fifty-eight different plant species were recorded across 10 restored potholes (vs 96 species across 10 natural potholes). Fewer floating, emergent, wet prairie and sedge meadow species were recorded in restored potholes (total: 4, 13, 4 and 13 species respectively) than natural potholes (total: 5, 20, 19 and 34 species respectively). More submerged species were recorded in restored than natural potholes (total: 9 vs 4 species). The study also reported data on the cover of individual plant species (see original paper). Methods: This study used exactly the same potholes and methods as (6).
A replicated study in 1991–1992 of rewetted prairie pothole marshes in Iowa, USA (8) reported that they developed 63% coverage of emergent vegetation within four years. For twelve 1-year-old marshes, the average area covered by emergent vegetation stands was only 20%. Emergent vegetation was clustered around the pothole margin in 10 of the marshes. Coverage of emergent vegetation increased with wetland age, to an average of 63% across six 4-year-old marshes. Emergent vegetation was distributed across the whole pothole in three of six cases, clustered around the margin in two cases and clustered in the centre in one case. Methods: In July 1991 and 1992, emergent vegetation stands were mapped in 24 rewetted prairie pothole marshes (<6 ha; drained and farmed for >20 years before rewetting; details of rewetting not reported). The potholes were surveyed one, two, three or four years after rewetting. Sixteen potholes were surveyed in both years. Eight potholes were

12. Habitat restoration and creation
329
surveyed in 1992 only. This summary takes some methodological details from VanRees-Siewert (1993).
A study in 1994–1996 of rewetted cropland in Israel (9) reported that it was colonized by emergent (and aquatic) vegetation within two years. After two years, a total of 74 species had colonized the rewetted area. This included emergent and wet-meadow plants such as papyrus Cyperus papyrus, toad rush Juncus bufonius, purple loosestrife Lythrum salicaria, lakeshore bulrush Scirpus litoralis, southern cattail Typha domingensis and water speedwell Veronica anagallis-aquatica. The total species count also included aquatic and upland species. Methods: In 1994, part of the Hula Valley was rewetted to create Lake Agmon. The valley had been drained in the 1950s to create cropland. Each month for two years after rewetting, plant species were recorded in twenty-two 5 x 5 m quadrats, placed along transects perpendicular to the lake shoreline. The water depth in quadrats was 0–300 cm.
A replicated study in 1989–2000 of 41 restored prairie potholes (rewetted and planted with cover crops) in the Midwest USA (10) reported that they were colonized by plants, including wetland species, with increasing species richness and changes in plant community composition over time. Statistical significance was not assessed. After 1–3 years, all restored potholes contained ≤50 plant species and some contained <11. After 12 years, all potholes contained ≥11 plant species and the richest four potholes contained >90. Considering just wetland plants, the overall community composition became more similar amongst the 41 potholes over time (data reported as a similarity index). After 12 years, the most common emergent/wet meadow species included reed canarygrass Phalaris arundinacea (present in all 41 potholes), asters Aster spp. (36 potholes), water knotweed Polygonum amphibium (35 potholes) and pale spikesedge Eleocharis macrostachya (34 potholes). Methods: This study analyzed data from 41 prairie potholes that had been restored from farmland in 1988 and sampled through to 2000. Restoration involved rewetting by breaking/blocking drainage systems (resulting water levels varied from annual flooding to seasonal saturation), and planting cover crops in adjacent uplands. Note that the study evaluates the combined effect of rewetting and planting cover crops in some potholes. In summer 1989, 1991 and 2000, plant species and cover were recorded across the whole of each pothole (including upland buffer zone). This study used a subset of potholes from (4a). Most of the potholes were also studied in (14).
A replicated, site comparison study in 1993–1994 of 27 prairie pothole marshes in Iowa, USA (11) found that restored potholes (rewetted and planted with cover crops) had lower vegetation cover and species richness than natural potholes, and were characterized by a different set of species. After 5–7 years, restored potholes had lower overall vegetation cover than natural potholes (see original paper for data and statistical model). Restored potholes also contained fewer plant species: overall (restored: 19; natural: 29 species/pothole) and per quadrat (restored: 3.2; natural: 4.8 species/m2). Finally, restored potholes contained a different plant community to natural potholes (statistical significance not assessed). Of 47 analyzed species, 23 were significantly more common in natural potholes whilst only eight were significantly more common in restored potholes (data reported as statistical model results). Methods: In 1993 or 1994, vegetation was surveyed in 27 prairie potholes. Seventeen potholes had been restored from farmland 5–7 years previously, by breaking/blocking drainage systems, and planting cover crops “along the margins of several sites”. Ten potholes were natural (never drained). Plant species and cover were recorded in 11–42 quadrats, each 1 m2, across each pothole. Note that the study

12. Habitat restoration and creation
330
evaluates the combined effect of rewetting and planting cover crops in some potholes. This study used a subset of the restored potholes from (4a), and used some of the potholes from (6) and (7).
A study in 1998–2003 aiming to restore a wet meadow on farmland in England, UK (12) reported that following rewetting and the introduction of grazing, the site was colonized by vegetation – including wet meadow species. After three years, overall vegetation cover was 71%, including 23% cover of wet meadow plant species (“typical of lowland pasture regularly flooded with fresh water”) and 42% cover of grassland species. The most abundant plant species was rough meadow grass Poa trivialis (37% cover). After five years, overall vegetation cover had increased to 94% and wet meadow plant cover had increased to 65%, whilst grassland plant cover had decreased to 13%. The most abundant plant species was now creeping bent Agrostis stolonifera (29% cover). Methods: In 1998, eighty-four hectares of arable farmland, next to a wetland nature reserve, were rewetted: by damming existing drainage, installing a wind-driven water pump and digging new water-control ditches to bring the water table to the soil surface. Grazing livestock (sheep and cattle) were also introduced. Note that the study evaluates the combined effect of rewetting and grazing. In August 2001 and 2003, plant species and cover were recorded in twenty-eight 1-m2 quadrats.
A site comparison study in 2003–2004 of six lakeshore marshes in eastern China (13) reported that restored marshes (developing in abandoned rice paddies with breached weirs) developed a similar plant community to a nearby reference marsh, with similar species richness and biomass. Unless specified, statistical significance was not assessed. The overall plant community composition in restored marshes became more similar to a reference marsh over time. A 2-year-old restored marsh was 64% similar to the reference marsh. A 15-year-old restored marsh was 97% similar to the reference marsh, dominated by common reed Phragmites communis, Amur silvergrass Miscanthus sacchariflorus and Manchurian wild rice Zizania latifolia. The restored marshes contained 10–13 plant species (vs reference: 9) and 1,270–2,100 g/m2 plant biomass (vs reference: 1,590 g/m2). Methods: In March–October 2003 and 2004, vegetation was surveyed in 1-m2 quadrats (number not clearly reported) in six lakeshore marshes. Biomass was dried before weighing. Five marshes had been restored from rice paddies: the weirs around the paddies had been damaged 2, 5, 10 or 15 years previously to allow lake water to flow in and out naturally. The other, reference marsh was “less disturbed” and had not been cultivated for >30 years.
A replicated study in 1991–2007 of 37 restored prairie potholes (rewetted and planted with cover crops) in the Midwest USA (14) reported that they were colonized by wetland plants, but not all the species found in nearby natural potholes. Restored potholes contained 138 wetland plant species (22 species/pothole) after three years, 268 wetland plant species (60 species/pothole) after 12 years, and 279 wetland plant species (57 species/pothole) after 19 years. However, some species found in nearby natural potholes never colonized the restored potholes: 22% of common species, 70% of uncommon species and 93% of rare species. Overall, plant community composition across the 37 restored potholes became more similar over time (data reported as a similarity index). After 19 years, vegetation in the wet meadow zone was dominated by reed canary grass Phalaris arundinacea (66% cover), the emergent zone by cattails Typha spp. (56% cover) and the aquatic zone by pondweed Potamogeton spp. (77% cover). Methods: This study analyzed data from 37 prairie potholes that had been restored from farmland in 1988 and sampled through to 2007. Restoration involved

12. Habitat restoration and creation
331
rewetting by breaking/blocking drainage systems (resulting water levels varied from annual flooding to seasonal saturation), and planting cover crops in/around some sites. Note that the study evaluates the combined effect of rewetting and planting cover crops in some potholes. In summer 1991, 2000 and 2007, plant species and cover were recorded across the whole of each pothole. including upland buffer zone). This study used a subset of potholes from (4a) and (10).
A study in 2005 of meadows next to an ephemeral stream in California, USA (15) reported that after diverting the incised stream into a new shallower channel, some wetland plant communities developed. Six years after intervention, three communities dominated by wetland-characteristic plant species had developed close to the stream where the water table was highest (flooded for >24 days in the growing season, on average). The most abundant species in each community were Nebraska sedge Carex nebracensis (16% cover), Bach’s calicoflower Downingia bacigalupii (16% cover) and pale spikerush Eleocharis macrostachya (39% cover). The communities contained 8–18 plant species/4 m2 and had 56–83% vegetation cover. Areas with a lower water table (flooded for <10 days in the growing season, on average) retained plant communities dominated by the non-native common meadowgrass Poa pratensis and Japanese brome Bromus japonica – which were also abundant before intervention (not quantified). Methods: In summer 2005, vascular plant species and their cover were recorded in 128 plots, each 4 m2, across a floodplain. In 1999, the floodplain water table had been raised by plugging the old channelized and incised stream (creating a series of ponds) and diverting the stream along a new, shallower course.
A study in 2003–2006 aiming to restore wetland plant communities on a floodplain in Luxembourg (16) reported that following rewetting by redirecting the river, wetland plant communities developed. Before rewetting, the floodplain was dominated by dry grassland (not quantified). After 1–3 years of rewetting, wetland plant communities comprised 53–65% of the vegetated area on the floodplain. These communities included wet grasslands (29–30%), sedge meadows (12–24%) and reedbeds (11%). Methods: In winter 2003, a historically drained valley was rewetted by redirecting the river from a deep, artificial channel at the valley edge to a shallower channel in the valley bottom. At the same time, biannual mowing ceased (H. Schaich pers. comm.) and in August 2004, year-round rotational cattle grazing began. Note that this study evaluates the combined effect of rewetting, cessation of mowing, and grazing. Plant community types were mapped, in the field, in summer 2004–2006.
A replicated, paired, site comparison study in 2006 of 36 depressions in the Midwest USA (17) found that rewetting historically farmed depressions (and re-seeding their catchments to grassland) increased vegetation quality, but not to the same level as in natural depressions. On average, the plant species in restored depressions were more characteristic of undisturbed habitats in the study region (Conservatism Score: 3.3 out of 10) than the plant species in depressions that remained drained and farmed (Conservatism Score: 1.2 out of 10). However, the species in restored depressions remained less characteristic of undisturbed habitats in the study region than the species in contemporary natural wetlands (Conservatism Score: 4.0 out of 10). Methods: In 2006, plant species were recorded within, and in a 10 m buffer around, 36 depressions. Twelve depressions (four at each of three sites) were under each land use: (a) restored wetlands: historically drained and farmed; restored ≥10 years ago by breaking/blocking drainage structures and reseeding surrounding land to grassland; (b) degraded depressions: still drained and farmed; (c) natural wetlands: never drained or farmed. Note that this study evaluates the combined effect of rewetting and revegetating catchments.

12. Habitat restoration and creation
332
A replicated, site comparison study in 2011 of 15 freshwater marshes in Minnesota, USA (18) found that rewetted marshes had lower bryophyte species richness than natural marshes after 34 years, but contained a similar frequency of bryophytes. Rewetted marshes contained only 3–6 bryophyte species in total (vs natural marshes: 8–12). Rewetted marshes also contained significantly fewer bryophyte species per quadrat: across the whole marsh (rewetted 1.7; natural: 3.3 species/0.36 m2) and in the wettest areas (rewetted: 0.6; natural: 0.8 species/0.36 m2). However, rewetted marshes supported a statistically similar frequency of bryophytes (occurrence in 44% of subquadrats in the wettest areas) to natural marshes (55%). Kneiff’s feathermoss Leptodictyum riparium was the most abundant bryophyte species in both rewetted and natural marshes (see original paper for full data). Methods: In summer 2011, aquatic and semi-aquatic bryophytes were surveyed in 15 marshes. Six marshes were historically drained and farmed, but had been rewetted 34 years previously by blocking drainage ditches. The other nine marshes were natural (never drained or farmed). Five of the natural marshes burned in April 2011. Bryophyte species were recorded across the whole of each marsh and in twenty-four 0.36-m2 quadrats/marsh (split into 100-cm2 subquadrats, and placed along four transects from wetter to drier areas).
A before-and-after, site comparison study in 1998–2007 in Florida, USA (19) reported that dechannelizing the river to rewet the floodplain reduced overall vegetation cover, forage grass cover and plant species richness in the wet prairie zone, but made the overall plant community more characteristic of wetland conditions. Statistical significance was not assessed. In the year before rewetting, restoration plots had 93–99% overall vegetation cover (forage grasses: 58–71%; typical wet-prairie species: 1–6%). There were 16–18 plant species/100 m2 (7–9 wetland-characteristic). Over six years after rewetting, overall vegetation cover fluctuated between 13% and 84% (forage grasses: 1–42%; typical wet-prairie species: 2–32%). There were 5–26 plant species/100 m2 (3–19 wetland-characteristic). The overall plant community became more characteristic of wetland conditions over time, reaching a similar level to nearby reference wet prairies around three years after rewetting, and becoming significantly more wetland-characteristic than plots that remained drained (data reported as a wetland indicator index). In the drained plots, vegetation cover and richness were relatively stable over time (see original paper for data). Methods: Between October 1999 and February 2001, Section C of the Kissimmee River floodplain was rewetted by dechannelizing the river. Twenty-one 100-m2 plots were established in the historical wet prairie zone of the floodplain: 15 in the dechannelized section and six in an upstream section that remained channelized. Plant species and their cover were surveyed in spring and summer before intervention (1998–1999) and for roughly six years after (until 2007). Vegetation was also surveyed in two nearby, near-natural wet prairies (date not reported). This study used the same floodplain section(s) as (20) and (25), and used a subset of the plots in (21) and (23).
A before-and-after study in 1954–2008 in Florida, USA (20) reported that after dechannelizing a river to rewet the floodplain, the area of wet prairie and mixed marsh/shrubby wetland vegetation increased. After roughly 3–8 years of rewetting, wet prairie vegetation covered 33–39% of the floodplain (vs 13–15% in a degraded state before rewetting, and 29% in the natural state before degradation). Mixed herbaceous/shrubby wetlands covered 7–18% the floodplain (vs 3–15% before rewetting and 52% before degradation). In total, wetland vegetation (herbaceous, shrubby, forested and submerged) covered 65–83% of the floodplain after rewetting

12. Habitat restoration and creation
333
(vs 22–37% before rewetting and 84% before degradation). Methods: Between 1999 and 2001, Section C of the Kissimmee River was dechannelized. This restored its natural meandering course, raised the water table on the adjacent floodplain and allowed for seasonal floods. Floodplain vegetation was mapped from aerial photographs taken before degradation (1954), during degradation (1974, 1996) and after restoration (2003, 2008). This study used the same rewetted floodplain section as (19), (21), (23) and (25).
A before-and-after, site comparison study in 1998–2007 in Florida, USA (21) reported that dechannelizing a river to rewet the floodplain increased variation in plant community composition between plots in the wet prairie zone, but reduced forage grass cover, overall vegetation cover and plant species richness. Results summarized for this study are not based on assessments of statistical significance. Variation in plant community composition amongst restoration plots (i.e. large-scale diversity) was relatively low before rewetting began (59–65% similarity). It was higher in the six years after rewetting was complete (17–49% similarity). This was linked to reduced dominance (cover) of forage grasses (before: 61–72%; after: 0–39%). There were also declines in total vegetation cover (before: 94–99%; after: 14–83%) and richness (before: 17–19; after: 5–26 species/100 m2). Note the increased variability after rewetting, reflecting differences between seasons and years. Meanwhile, the vegetation was relatively stable over time in another part of the floodplain that remained drained: 41–71% community similarity, 42–77% forage grass cover, 82–99% total vegetation cover, 18–25 species/100 m2. Methods: Between October 1999 and February 2001, Section C of the Kissimmee River floodplain was rewetted by dechannelizing the river. Twenty-four 100-m2 plots were established in the historical wet prairie zone (more recently used as upland pasture): 18 in the dechannelized section and six in an upstream section that remained channelized. Plant species and their cover were surveyed in spring and summer before intervention (1998–1999) and for roughly six years after (until 2007). This study used the same floodplain section(s) as (20) and (25), and shared wet prairie plots with (19) and (23).
A before-and-after study in 2000–2010 along a river in Alberta, Canada (22) found that artificially increasing flow by diverting water from another river had no significant effect on the coverage of broadleaf cattail Typha latifolia beds, but reduced the coverage of grass-like plants and increased coverage of shrubs across the whole riparian zone. For all data and statistical models, see original paper. After six years of increased flows, the proportion of the riparian zone covered by cattail beds was not significantly different to the proportion four years before flows were increased – although there was a trend towards higher cattail coverage. Across the entire riparian zone (i.e. including wetland and upland areas), coverage of other grass-like plants (grasses, sedges and rushes) was significantly lower after flows were increased than before. Coverage of woody plants (true willows Salix spp. and wolf willow Eleagnus commutata) was significantly higher after flows were increased than before. Methods: In 2004, a canal linking the Highwood River to the Little Bow River was upgraded to increase its flow capacity. This increased summer discharge in the Little Bow River. Broad riparian vegetation types were mapped using aerial photographs taken in 2000 and 2010. Cattle grazing was locally intensive.
A before-and-after study in 1998–2007 in Florida, USA (23) reported that after dechannelizing the river to rewet the floodplain, both non-native limpo grass Hemarthria altissima and native wetland-characteristic vegetation increased in

12. Habitat restoration and creation
334
abundance in historic wetland zones, although individual plots became dominated by one or the other. Statistical significance was not assessed. Before rewetting began, limpo grass was present in only 3 of 27 marsh and wet prairie plots with only 0–4% cover. Roughly six years after rewetting was complete, limpo grass was present in 15–17 of 27 plots, with an average cover of 22–26%. Further data were presented for the 18 wet prairie plots. Here, there were 14–17 plant species/100 m2 before rewetting, then 17–19 plant species/100 m2 six years after. Cover of three wet-prairie indicator species was <1–3% before rewetting, then 16–25% six years after. However, these averages mask a dichotomy. After rewetting, nine wet prairie plots were dominated by the indicator species (38% cover; limpo grass cover: <12%) whilst nine were dominated by limpo grass (43% cover; indicator species cover: 3%). Methods: Between October 1999 and February 2001, Section C of the Kissimmee River floodplain was rewetted by dechannelizing the river. Plant species and their cover were surveyed in spring and summer before intervention (1998–1999) and for roughly six years after (until 2007), in twenty-seven 100-m2 plots (18 in historic wet prairies and nine in historic marshes). This study used the same rewetted floodplain section as (20) and shared plots with (19), (21) and (25).
A before-and-after, site comparison study in 1938–2013 on a floodplain in Illinois, USA (24) reported that after raising the water table by turning off drainage pumps, the total wetland area and coverage of emergent wetland vegetation increased. Statistical significance was not assessed. In the autumn after rewetting, the total wetland area was 252 ha. Emergent vegetation covered only 114 ha of the site (63 ha permanent marsh and 51 ha temporary mudflat colonizers). Six years later, the total wetland area was 1,944 ha. Emergent vegetation covered 558 ha (450 ha permanent and 108 ha temporary). Over the six years, the average proportion of the rewetted site covered by emergent vegetation (29%) was similar to historical (25%) and contemporary (36%) values for similar wetland sites. However, the proportion covered by permanent vegetation was higher (rewetted: 21%; historical: 12%; contemporary: 4%) and the proportion covered by temporary vegetation was lower (rewetted: 9%; historical: 12%; contemporary: 33%). Methods: In 2007 (precise date not reported), drainage systems were switched off to raise the water table in a historically farmed floodplain area. This created a range of wetland and deepwater habitats. Each autumn between 2007 and 2013, vegetation types were mapped using field surveys and aerial photographs. Vegetation coverage was compared to published records for natural wetland sites in the same river valley, from 1938–1942 and 2005–2006.
A before-and-after, site comparison study in 1998–2010 in Florida, USA (25) reported that dechannelizing the river to rewet the floodplain reduced overall vegetation cover and cover of pasture/upland grasses in the historical marsh zone, but increased the abundance of wetland- and habitat-characteristic herbs. Statistical significance was not assessed. In restoration plots, overall vegetation cover was 96–98% in the year before rewetting began, then 10–90% roughly 1–9 years after rewetting was complete (highly variable between seasons and years). Cover of pasture/upland grasses was 75–79% before rewetting vs 0–1% after. Cover of wetland-characteristic herbs was 10–11% before rewetting vs 15–61% in all but one sample after. Broadleaf-marsh-characteristic species were absent before rewetting but colonized after (present in ≥67% of restoration plots after nine years, with 5% average cover). Over the entire study period (ignoring a year of extreme flooding), vegetation cover was relatively stable in another part of the floodplain that remained

12. Habitat restoration and creation
335
drained: 66–98% overall vegetation cover, 34–78% cover of pasture/upland grasses, 12–43% cover of wetland-characteristic herbs, and no broadleaf-marsh-characteristic species. Methods: Between October 1999 and February 2001, Section C of the Kissimmee River floodplain was rewetted by dechannelizing the river. Fifteen 100-m2 plots were established in parts of the floodplain that were historically marshes (more recently used as cattle pasture). There were nine plots in the dechannelized section and six in an upstream section that remained channelized. Plant species and their cover were surveyed in spring and summer before intervention (1998–1999) and for roughly nine years after (until 2010). This study used the same floodplain section(s) as (19), (20) and (21), and shared plots with (23).
(1) Erwin K.L. & Best G.R. (1985) Marsh community development in a Central Florida phosphate surface-mined reclaimed wetland. Wetlands, 5, 155–166.
(2) Weller M.W., Kaufman G.W. & Vohs P.A. Jr. (1991) Evaluation of wetland development and waterbird response at Elk Creek Wildlife Management Area, Lake Mills, Iowa, 1961–1990. Wetlands, 11, 245–262.
(3) Reinartz J.A. & Warne E.L. (1993) Development of vegetation in small created wetlands in southeastern Wisconsin. Wetlands, 13, 153–164.
(4) Galatowitsch S.M. & van der Valk A.G. (1995) Natural revegetation during restoration of wetlands in the southern prairie pothole region of North America. Pages 129–142 in B.D. Wheeler, S.C. Shaw, W.J. Fojt & R.A. Robertson (eds.) Restoration of Temperate Wetlands. John Wiley and Sons Ltd., Chichester.
(5) Galatowitsch S.M. & van der Valk A.G. (1996) Characteristics of recently restored wetlands in the prairie pothole region. Wetlands, 16, 75–83.
(6) Galatowitsch S.M. & van der Valk A.G. (1996) The vegetation of restored and natural prairie wetlands. Ecological Applications, 6, 102–112.
(7) Galatowitsch S.M. & van der Valk A.G. (1996) Vegetation and environmental conditions in recently restored wetlands in the prairie pothole region of the USA. Vegetatio, 126, 89–99.
(8) VanRees-Siewert K.L. & Dinsmore J.J. (1996) Influence of wetland age on bird use of restored wetlands in Iowa. Wetlands, 16, 577–582.
(9) Kaplan D., Oron T. & Gutman, M. (1998) Development of macrophytic vegetation in the Agmon Wetland of Israel by spontaneous colonization and reintroduction. Wetlands Ecology and Management, 6, 143–150.
(10) Mulhouse J.M. & Galatowitsch S.M. (2003) Revegetation of prairie pothole wetlands in the mid-continental US: twelve years post-reflooding. Plant Ecology, 169, 143–159.
(11) Seabloom E.W. & van der Valk A.G. (2003) Plant diversity, composition, and invasion of restored and natural prairie pothole wetlands: implications for restoration. Wetlands, 23, 1–12.
(12) Lyons G. & Ausden M. (2005) Raising water levels to revert arable land to grazing marsh at Berney Marshes RSPB Reserve, Norfolk, England. Conservation Evidence, 2, 47–49.
(13) Lu J., Wang H., Wang W. & Yin C. (2007) Vegetation and soil properties in restored wetlands near Lake Taihu, China. Hydrobiologia, 581, 151–159.
(14) Aronson M.F.J. & Galatowitsch S. (2008) Long-term vegetation development of restored prairie pothole wetlands. Wetlands, 28, 883–895.
(15) Hammersmark C.T., Rains M.C., Wickland A.C. & Mount J.F. (2009) Vegetation and water-table relationships in a hydrologically restored riparian meadow. Wetlands, 29, 785–797.
(16) Schaich H., Szabó I. & Kaphegyi T.A.M. (2010) Grazing with Galloway cattle for floodplain restoration in the Syr Valley, Luxembourg. Journal for Nature Conservation, 18, 268–277.
(17) Balas C.J., Euliss N.H. Jr. & Mushet D.M. (2012) Influence of conservation programs on amphibians using seasonal wetlands in the prairie pothole region. Wetlands, 2012, 333–345.
(18) Fuselier L.C., Donarski D., Novacek J., Rastedt D. & Peyton C. (2012) Composition and biomass productivity of bryophyte assemblages in natural and restored marshes in the prairie pothole region of Northern Minnesota. Wetlands, 32, 1067–1078.
(19) Toth L.A. & van der Valk A. (2012) Predictability of flood pulse driven assembly rules for restoration of a floodplain plant community. Wetlands Ecology and Management, 20, 59–75.
(20) Spencer L.J. & Bousquin S.G. (2014) Interim responses of floodplain wetland vegetation to Phase I of the Kissimmee River Restoration Project: comparisons of vegetation maps from five periods in the river's history. Restoration Ecology, 22, 397–408.
(21) Toth L.A. (2015) Invasibility drives restoration of a floodplain plant community. River Research and Applications, 31, 1319–1327.

12. Habitat restoration and creation
336
(22) Hillman E.J., Bigelow S.G., Samuelson G.M., Herzog P.W., Hurly T.A. & Rood S.B. (2016) Increasing river flow expands riparian habitat: influences of flow augmentation on channel form, riparian vegetation and birds along the Little Bow River, Alberta. River Research and Applications, 32, 1687–1697.
(23) Toth L.A. (2016) Cover thresholds for impacts of an exotic grass on the structure and assembly of a wet prairie community. Wetlands Ecology and Management, 24, 61–72.
(24) Hine C.S., Hagy H.M., Horath M.M., Yetter A.P., Smith R.V. & Stafford J.D. (2017) Response of aquatic vegetation communities and other wetland cover types to floodplain restoration at Emiquon Preserve. Hydrobiologia, 804, 59–71.
(25) Toth L.A. (2017) Variant restoration trajectories for wetland plant communities on a channelized floodplain. Restoration Ecology, 25, 342–353.
Additional Reference
VanRees-Siewert K.L. (1993) The influence of wetland age on bird and aquatic macroinvertebrate use of restored Iowa wetlands. M.S. Thesis, Iowa State University, Ames, IA, USA.
12.4.2 Raise water level to restore/create brackish/salt marshes from
other land uses
Two studies evaluated the effects, on vegetation, of raising the water level to restore/create brackish/salt marshes from other land uses or habitat types. Both studies were in the same area of Iraq, but used different study sites.
VEGETATION COMMUNITY
Community types (1 study): One before-and-after study of a slightly brackish marsh in Iraq2 reported that fewer plant community types were present three years after reflooding than before drainage.
Overall richness/diversity (2 studies): Two before-and-after studies of brackish marshes in Iraq1,2 reported that fewer plant species were present three years after reflooding than before drainage. One of these studies2 also reported that individual plant communities typically had lower diversity after reflooding than before drainage.
VEGETATION ABUNDANCE
Overall abundance (1 study): One before-and-after study of a slightly brackish marsh in Iraq2 reported that six of seven studied plant communities had lower spring and/or summer biomass three years after reflooding than before drainage.
VEGETATION STRUCTURE
A replicated, before-and-after study in the early 1990s and 2006 of two brackish marshes in southern Iraq (1) reported that after reflooding, the marshes contained fewer plant species than they contained before drainage. Approximately three years after reflooding, 24–27 plant species were recorded in each marsh (10–12 emergent, 12 submerged, 2–3 floating). Before drainage, 38–44 plant species were recorded in each marsh (18–19 emergent, 12–16 submerged, 8–9 floating). Methods: Monthly surveys were carried out between January 2006 and December 2007 to record plant species in Central Marsh (two sites) and East Hammar Marsh (two sites). These brackish marshes were drained in the 1990s – becoming “almost totally desiccated” by 2000, but retaining small pockets of remnant marsh vegetation. The marshes were reflooded from 2003 (details not reported). Previously published data from the same marshes, collected in the early 1990s before drainage, were used for comparison.
A before-and-after study in 1973–2006 of a brackish marsh in southern Iraq (2) reported that after reflooding, the marsh contained fewer plant species and

12. Habitat restoration and creation
337
communities than before it was drained, and that those communities typically had lower diversity and biomass. Statistical significance was not assessed. Within three years of reflooding, 38 plant species were recorded in the marsh (vs 48 before drainage). Twenty-six species were present both before and after reflooding. Three years after reflooding, 10 distinct plant communities were recorded in the marsh (vs 14 before drainage). For six of seven communities with comparable data, plant diversity was lower after reflooding than before drainage (data reported as a diversity index). Results for above-ground vegetation biomass were more mixed and depended on the season of comparison, but for six communities biomass was lower after reflooding than before drainage in at least one season (for which after: 50–3,247 g/m2; before: 60–4,923 g/m2). Methods: In 2003, local residents released water from canals and reservoirs to reflood marshes on the Mesopotamian Plain that had been almost completely drained in the 1990s. In spring and summer 2006, vegetation was surveyed in three sites within the slightly brackish (salinity 1–2 ppt) reflooded Central Marsh. Species, cover and biomass were recorded/collected in seven hundred 1-m2
quadrats. Biomass was later dried and weighed. Previously published data from the 1970s (from different sites within the marsh) were used for comparison.
(1) Al-Abbawy D.A.H. & Al-Mayah (2010) Ecological survey of aquatic macrophytes in restored marshes of southern Iraq during 2006 and 2007. Marsh Bulletin, 5, 177–196.
(2) Hamdan M.A., Asada T., Hassan F.M., Warner B.G., Douabdul A., Al-Hilli M.R.A. & Alwan A.A. (2010) Vegetation response to re-flooding in the Mesopotamian Wetlands, southern Iraq. Wetlands, 30, 177–188.
12.4.3 Raise water level to restore/create freshwater swamps from other
land uses
Two studies evaluated the effects, on vegetation, of raising the water level to restore/create freshwater swamps from other land uses or habitat types. Both studies monitored the effects of one river dechannelization project in the USA.
VEGETATION COMMUNITY
Overall extent (1 study): One before-and-after study of a floodplain in the USA1 reported that after dechannelizing a river to raise the water level, the area of shrubby and forested wetlands increased – reaching greater coverage than before intervention, but also than before degradation.
Community types (1 study): The same study1 broke down overall swamp coverage into specific community types. For example, most of the shrubby wetlands that developed after raising the water level were dominated by a non-native species – which was not present historically.
VEGETATION ABUNDANCE
Overall abundance (1 study): One before-and-after, site comparison study of historical shrubby wetlands on a floodplain in the USA2 reported that dechannelizing a river to raise the water level reduced overall vegetation cover in the following nine years.
Characteristic plant abundance (1 study): The same study2 reported that after dechannelizing a river to raise the water level, only one of two sites became dominated by wetland-characteristic shrubs. The other site remained dominated by wetland-characteristic herb species.
Individual species abundance (1 study): The same study2 reported that dechannelizing a river to raise the water level slightly increased cover of buttonbush Cephalanthus occidentalis in one of two sites (no data for other site).
VEGETATION STRUCTURE

12. Habitat restoration and creation
338
A before-and-after study in 1954–2008 in Florida, USA (1) reported that after dechannelizing a river to rewet the floodplain, the area of shrubby and forested wetlands increased. After roughly 3–8 years of rewetting, shrub-dominated wetlands covered 17–18% of the floodplain (vs 3–4% in a degraded state before rewetting, and 1% in the natural state before degradation). Most of the shrubby wetland area after rewetting was dominated by invasive Peruvian water primrose Ludwigia peruviana, which was not present before degradation. Mixed shrubby/herbaceous wetlands covered 7–18% of the floodplain after rewetting (vs 3–15% before rewetting and 52% before degradation). Coverage of forested wetlands was also greater after rewetting than before rewetting or degradation (data reported as maps). In total, wetland vegetation (shrubby, forested, herbaceous and submerged) covered 65–83% of the floodplain after rewetting (vs 22–37% before rewetting and 84% before degradation). Methods: Between 1999 and 2001, Section C of the Kissimmee River was dechannelized. This restored its natural meandering course, raised the water table on the adjacent floodplain and allowed for seasonal floods. Floodplain vegetation was mapped from aerial photographs taken before degradation (1954), during degradation (1974, 1996) and after restoration (2003, 2008). This study used the same rewetted floodplain section as (2).
A before-and-after, site comparison study in 1998–2010 in Florida, USA (2) reported that dechannelizing the river to rewet the floodplain had mixed effects on vegetation across two sites that were historically swamps. Statistical significance was not assessed. In the year before rewetting began, one restoration site (higher elevation) was dominated by shrubs: mostly upland (46–49% cover) but some wetland-characteristic (9% cover). The other restoration site (lower elevation) was dominated by wetland-characteristic herbs (71% cover). Total cover was 68–93%. Over roughly nine years after rewetting was complete, only the higher site had substantial cover of wetland-characteristic shrubs (3–29%). Canopy cover of habitat-characteristic buttonbush Cephalanthus occidentalis was <1–6% (vs before: 1%). The other site was dominated by wetland-characteristic herbs and floating/submerged plants. In both sites, vegetation cover after rewetting was highly variable across seasons and years (e.g. wetland-characteristic herbs: 1–82%; floating/submerged plants: 0–54%; overall: 1–92%). Over the entire study period, vegetation cover was relatively stable in another part of the floodplain that remained drained: a mixture of wetland and upland herbs (32–62% cover) and shrubs (8–34% cover). Methods: Between October 1999 and February 2001, Section C of the Kissimmee River floodplain was rewetted by dechannelizing the river. Eighteen 100-m2 plots were established in parts of the floodplain that were historically buttonbush swamps (more recently drained and grazed/overgrown). There were 12 plots in the dechannelized section and six in an upstream section that remained channelized. Plant species and their cover were surveyed in spring and summer before intervention (1998–1999) and for roughly nine years after (until 2010). This study used the same rewetted floodplain section as (1).
(1) Spencer L.J. & Bousquin S.G. (2014) Interim responses of floodplain wetland vegetation to Phase I of the Kissimmee River Restoration Project: comparisons of vegetation maps from five periods in the river's history. Restoration Ecology, 22, 397–408.
(2) Toth L.A. (2017) Variant restoration trajectories for wetland plant communities on a channelized floodplain. Restoration Ecology, 25, 342–353.

12. Habitat restoration and creation
339
12.4.4 Raise water level to restore/create brackish/saline swamps from
other land uses
We found no studies that evaluated the effects, on vegetation, of raising the water level to restore/ create brackish/saline swamps from other land uses or habitat types.
This means that we have not yet found any studies that have directly evaluated this intervention during our systematic journal and report searches. Therefore we have no evidence to indicate whether or not the intervention has any desirable or harmful effects.
12.5 Lower water level to restore/create marshes or swamps from
other land uses
Background
This intervention involves one-off action to lower the water level and restore or create marshes or swamps from other land uses, i.e. in areas that do not retain substantial characteristics of the target habitat. By definition, these other land uses will always be aquatic habitats such as reservoirs or lakes. The lowered water level should not depend on continued intervention (e.g. pumping). Specific techniques to reduce water levels include removing dams downstream, or switching off pumps that add water to a focal site. This intervention includes water level reductions to any depth that could, in theory, support emergent wetland vegetation.
CAUTION: This intervention may have negative effects on habitats elsewhere in the catchment. For example, removing dams could flood marshes, swamps or upland habitats downstream. There may also be conflicts with water needs of human populations that need to be managed.
Related interventions: Lower water level to restore degraded marshes or swamps (8.2); Backfill canals or trenches (5.1); Actively manage water level (8.4); Reprofile/ relandscape, which may involve raising the ground surface towards or above the water table (12.9); Lower water level to complement planting (13.2).
12.5.1 Lower water level to restore/create freshwater marshes from
other land uses
Two studies evaluated the effects, on vegetation, of lowering the water level to restore/ create freshwater marshes from other land uses or habitat types. One study was in the USA1 and one was in the Netherlands2.
VEGETATION COMMUNITY
Overall extent (1 study): One replicated, before-and-after study of a freshwater wetland in the USA1 reported that following a drawdown of water levels, emergent vegetation coverage increased in areas that were previously open water.
VEGETATION ABUNDANCE
Overall abundance (1 study): One before-and-after study at the edge of a freshwater lake in the Netherlands2 reported that following a drawdown of the lake water level, vegetation cover developed in areas that were previously open water. Cover varied between years and elevations.
VEGETATION STRUCTURE

12. Habitat restoration and creation
340
A replicated, before-and-after study in 1949–1957 in a freshwater wetland in Minnesota, USA (1) reported that following drawdown of water levels, emergent wetland vegetation colonized the site. Over five years of drawdown, stands of tall emergent plants like softstem bulrush Scirpus validus, cattails Typha spp. and sedges Carex spp. developed on approximately 5,000 acres of 12,000 acres that were previously open water. Elsewhere, exposed mudflats were colonized by species such as marsh fleabane Senecio congestus and red goosefoot Chenopodium rubrum (area not quantified). The study suggested several related factors that affected the type of vegetation that developed, e.g. month of drawdown, soil type (mineral or peat), speed of drying, seed availability, and presence of algal mats. Herbaceous wetland communities present in the first year of drawdown were largely replaced by upland weeds, then woody species, over the following four years. Methods: At some point between 1949 and 1957, water levels were lowered in seven separate wetland pools to stimulate growth of emergent and moist-soil wetland vegetation. Two pools supported islands of emergent vegetation before drawdown. Observations were made after 1–5 years of drawdown in each pool (further details not reported).
A before-and-after study in 1987–1992 of a freshwater lake in the Netherlands (2) reported that following drawdown of the water level, emergent wetland vegetation colonized. Cover of vegetation overall and of individual plant species depended on elevation and length of drawdown. For example, the highest, driest zone (exposed from March/April 1987) developed 63% total vegetation cover after one growing season. It was dominated by broadleaf cattail Typha latifolia (53% of total). After four years, total cover was 103% and the dominant species was great willowherb Epilobium hirsutum (63% of total). The lowest, wettest zone (exposed from April/July 1988) developed 16% total cover after one growing season. It was dominated by swamp ragwort Senecio congestus (87% of total). After four years, total cover was 36% and the dominant species was toad rush Juncus bufonius (28% of total). Zones at intermediate elevation developed 87–109% total cover after four years, dominated by common reed Phragmites australis (51–94% of total). Methods: The water level of Groteplas Lake was lowered from 1987, gradually exposing formerly flooded areas. The highest shoreline zones (with some islands of emergent vegetation before drawdown) were exposed in 1987. The lowest zones (no emergent vegetation before drawdown) were exposed in 1988. Cover of each plant species and vegetation overall were recorded along transects in exposed areas after 1–4 growing seasons (September/October 1987–1992).
(1) Harris S.W. & Marshall W.H. (1963) Ecology of water-level manipulations on a northern marsh. Ecology, 44, 331–343.
(2) ter Heerdt G.N.J. & Drost H.J. (1994) Potential for the development of marsh vegetation from the seed bank after a drawdown. Biological Conservation, 67, 1–11.
12.5.2 Lower water level to restore/create brackish/salt marshes from
other land uses
We found no studies that evaluated the effects, on vegetation, of lowering the water level to restore/create brackish/salt marshes from other land uses or habitat types.
This means that we have not yet found any studies that have directly evaluated this intervention during our systematic journal and report searches. Therefore we have no evidence to indicate whether or not the intervention has any desirable or harmful effects.

12. Habitat restoration and creation
341
12.5.3 Lower water level to restore/create freshwater swamps from
other land uses
We found no studies that evaluated the effects, on vegetation, of lowering the water level to restore/create freshwater swamps from other land uses or habitat types.
This means that we have not yet found any studies that have directly evaluated this intervention during our systematic journal and report searches. Therefore we have no evidence to indicate whether or not the intervention has any desirable or harmful effects.
12.5.4 Lower water level to restore/create brackish/saline swamps from
other land uses
We found no studies that evaluated the effects, on vegetation, of lowering the water level to restore/create brackish/saline swamps from other land uses or habitat types.
This means that we have not yet found any studies that have directly evaluated this intervention during our systematic journal and report searches. Therefore we have no evidence to indicate whether or not the intervention has any desirable or harmful effects.
12.6 Facilitate tidal exchange to restore/create marshes or
swamps from other land uses
Background
This intervention includes actions that facilitate tidal exchange, in order to restore or create marshes or swamps from other land uses. The action may be a single permanent one (e.g. breaching sea walls or embankments, installing or widening culverts, excavating tidal creeks) or a reversible one (e.g. opening sluice gates once per day). However, the intervention must affect an area that does not retain substantial characteristics of the target habitat. This could be an upland area (e.g. the thousands of square kilometres of farmland that has been reclaimed from salt marsh in the Netherlands since the Middle Ages; Wolff 1992), an unvegetated wetland (e.g. mudflats), or a wetland other than the target type (e.g. swamp, where the habitat used to be a marsh). “Planned retreat” and “managed realignment” fall within the scope of this intervention.
Tidal wetlands may be brackish/saline (e.g. mangroves, coastal marshes) or freshwater (e.g. at the upstream end of estuaries, as in the Mississippi, Yangtze, and Elbe rivers; Baldwin et al. 2009). Studies of accidental realignment, such as when coastal defences are breached by a storm, have not been summarized as evidence (e.g. Onaindia et al. 2001; some sites in Williams & Orr 2002).
Related interventions: Facilitate tidal exchange to restore degraded marshes or swamps (8.3); Reprofile/relandscape (12.9) or Remove surface soil/sediment (12.11), both of which can alter patterns of tidal exchange; Facilitate tidal exchange to complement planting (13.3).
Baldwin A.H., Barendregt A. & Whigham D. (2009) Tidal Freshwater Wetlands. Backhuys Publishers, Lieden.
Onaindia M., Albizu I. & Amezaga I. (2001) Effect of time on the natural regeneration of salt marsh. Applied Vegetation Science, 4, 247–256.
Williams P.B. & Orr M.K. (2002) Physical evolution of restored breached levee salt marshes in the San Francisco Bay estuary. Restoration Ecology, 10, 527–542.

12. Habitat restoration and creation
342
Wolff W.J. (1992) The end of a tradition: 1000 years of embankment and reclamation of wetlands in the Netherlands. Ambio, 21, 287–291.
12.6.1 Facilitate tidal exchange to restore/create freshwater marshes
from other land uses
We found no studies that evaluated the effects, on vegetation, of facilitating tidal exchange to restore/create freshwater marshes from other land uses or habitat types.
This means that we have not yet found any studies that have directly evaluated this intervention during our systematic journal and report searches. Therefore we have no evidence to indicate whether or not the intervention has any desirable or harmful effects.
12.6.2 Facilitate tidal exchange to restore/create brackish/salt marshes
from other land uses
Fourteen studies evaluated the effects, on vegetation, of facilitating tidal exchange to restore/ create brackish/salt marshes from other land uses or habitat types. Seven studies were in the UK1,5–7,9–11. Five studies were in the USA2,3,4a,4b,13. There was one study in each of Australia8 and the Netherlands12. There was overlap in the sites used in four of the studies1,6,7,10.
VEGETATION COMMUNITY
Overall extent (3 studies): Three before-and-after studies in Australia8, the UK11 and the Netherlands12 reported increases in the overall extent of salt marsh vegetation over 3–10 years after restoring tidal exchange.
Community types (3 studies): One replicated, paired, site comparison study in the UK6 reported that restored marshes, developing after 2–13 years of tidal exchange, contained a different type of salt marsh plant community to natural marshes in four of four cases. Two before-and-after studies in the UK11 and the Netherlands12 reported increases in the frequency or coverage of salt marsh plant communities after restoring tidal exchange, reaching 93–100% after 9–10 years.
Community composition (4 studies): Four site comparison studies (two replicated, one paired) in the UK6,10 and the USA3,13 reported that after facilitating tidal exchange on freshwater wetlands or farmland, the overall plant community composition remained somewhat different from natural brackish/salt marshes for up to 30 years. Three of the studies3,6,13 reported increasing community similarity to natural marshes over 11–30 years of tidal exchange.
Overall richness/diversity (6 studies): Two site comparison studies of brackish/salt marshes in the USA3 and the UK7 reported that overall plant species richness was similar in marshes developing after 4–11 years of tidal exchange, and in nearby natural marshes. Two site comparison studies (one replicated) of salt marshes in the UK9,10 reported that marshes developing after 1–14 years of tidal exchange (sometimes9 along with other interventions) had lower plant species richness9 or diversity10 than nearby natural marshes. Two before-and-after studies in the UK1,11 compared the number of plant/algae species present in salt marshes that developed over 1–9 years after restoring tidal exchange to the number of plant species present before intervention. In one study1 there were more species after intervention, but in the other study11 there were fewer.
Characteristic plant richness/diversity (2 studies): One replicated, site comparison study of salt marshes in the UK10 reported that marshes developing after 1–14 years of tidal exchange contained a similar number of salt-tolerant plant species to natural marshes. One before-and-after study in the Netherlands12 reported that all 23 target brackish/salt marsh species were present in the study site 10 years after restoring regular tidal exchange: more than were present before restoration.

12. Habitat restoration and creation
343
VEGETATION ABUNDANCE
Overall abundance (6 studies): Two site comparison studies (one replicated) of salt marshes in the UK9,10 reported that marshes developing after 1–14 years of tidal exchange (sometimes9 along with other interventions) had lower overall vegetation cover than nearby natural marshes. One before-and-after study in the UK11 reported that 99% of salt marsh quadrats were vegetated nine years after restoring tidal exchange, compared to 100% in the freshwater wetland that previously occupied the site and 43% one summer after restoration. Three studies in the USA4a,4b and the UK5 simply quantified the overall cover of vegetation present in sites for up to 15 years after facilitating tidal exchange (sometimes4b,5 along with other interventions).
Characteristic plant abundance (1 study): One site comparison study in the USA13 reported that some plant species diagnostic of natural brackish marshes were absent from a marsh that had developed over >30 years of restored tidal exchange.
Individual species abundance (6 studies): Six studies1,6,7,9,10,13 quantified the effect of this intervention on the abundance of individual plant species. For example, three site comparison studies of salt marshes in the UK6,9,10 reported that cover of saltmarsh grass Puccinellia maritima was similar or lower in marshes developing after 1–14 years of tidal exchange (sometimes9 along with other interventions) than in nearby natural marshes. In contrast, in these studies, cover of glassworts Salicornia spp. was higher in restored than natural marshes.
VEGETATION STRUCTURE
A before-and-after study in 1991–1994 of a coastal site where tidal exchange was restored in England, UK (1) reported that salt marsh vegetation colonized the site within one year, and that salt marsh plant communities developed within three years. Before intervention, the site was a coastal grassland containing 14 plant species. One year after intervention, the site contained 17 plant and algae species (1.6 species/m2) – mostly the alga Enteromorpha sp. (present in 88% of quadrats). After 2–3 years, the site contained 22–25 plant and algae species (3.0–3.5 species/m2). It had developed a recognizable salt marsh vegetation community. The most common species were glassworts Salicornia spp. (in 88–94% of quadrats) and seablite Suaeda maritima (in 64–74% of quadrats), along with Enteromorpha sp. (in 88–96% of quadrats). Methods: In July 1991, a sea wall was lowered to allow tidal exchange on 2 acres of Northey Island. The studied area was inundated by 100 tides/year. Vegetation was surveyed (50 randomly placed quadrats/year; ≤1 m2) before intervention (June 1991) and for three years after (summer 1992–1994). The restoration site was included in studies (6) and (10).
A before-and-after, site comparison study in 1993–1995 in an estuarine marsh in New Hampshire, USA (2) reported that an area in which tidal exchange was improved (by modifying culverts under a road) developed cover of salt marsh vegetation within two years, although total vegetation cover declined. Statistical significance was not assessed. Before intervention, the tidally restricted area was a freshwater wet meadow dominated by grasses (39% cover) and asters Aster spp. (32% cover). Total vegetation cover was 94%. Two years after restoring tidal exchange, the area was dominated by the alga Vaucheria spp. (21% cover) and saltmeadow cordgrass Spartina patens (21% cover), with other salt-tolerant species present at lower abundance (e.g. smooth cordgrass Spartina alterniflora: <1% cover; see original paper for full data). Total vegetation cover was 63%. For comparison, a reference area of marsh downstream contained communities dominated by saltmeadow cordgrass (56% cover) or smooth cordgrass Spartina alterniflora (60% cover) with no algae, and 71–86% total vegetation cover. Methods: A road built

12. Habitat restoration and creation
344
across Mill Brook Marsh, in 1970, restricted tidal exchange to part of the marsh through a narrow gated culvert. In 1993, the gate on the old culvert was removed and a new, wider culvert was installed. This restored regular tidal exchange, raised the water table and increased soil salinity in the degraded area. Summer vegetation surveys were carried out, using 1-m2 quadrats, before (1993) and after (1995) intervention in the degraded/restored area. The undisturbed marsh below the road was also surveyed.
A site comparison study in 1987–1998 of two estuarine marshes in Washington, USA (3) reported that after breaching a dyke to restore tidal influx to one marsh, its plant community became more similar to an adjacent natural marsh. Statistical significance was not assessed. The restored marsh progressed through four key phases. Before breaching, it was dominated by freshwater wetland plant species (not quantified). In the first two years after breaching, the most abundant plant species was reed canary grass Phalaris arundinacea (in 43–57% of quadrats). After 4–5 years, the dominant species was pickleweed Salicornia virginica (52–53% cover). After 8–11 years, the dominant species were saltgrass Distichlis spicata (36–48% cover), arrowgrass Triglochin maritima (12–23% cover) and pickleweed (7–16% cover). Meanwhile, an adjacent natural marsh was dominated by saltgrass (24–47% cover), tufted hairgrass Dechampsia cespitosa (18–42% cover) and pickleweed (6–14% cover). Overall, the plant community composition in the restored marsh became more similar to the natural marsh over time (32–42% similarity after 4 years; 58–68% after 8 years; 48–80% after 11 years). After 4–11 years, total plant species richness was similar in both marshes (restored: 8–12 species/36 m2; natural: 9–14 species/30 m2; 14 species recorded in each marsh over all surveys). Methods: In early 1987, tidal exchange was restored to 23 ha of coastal land by breaching a dyke that had been built in the early 1900s. This area had subsided whilst dyked, and had a higher salinity than adjacent estuarine water after restoration. Vegetation was surveyed most summers in 1987–1998: initially species presence in seven 1-m2 quadrats in the restored marsh, but from 1991 presence and cover in 30–37 quadrats in the restored marsh and an adjacent natural marsh.
A replicated study in 1979–2000 of six coastal sites where tidal exchange was restored in California, USA (4a) reported that three of the sites developed ≥50% vegetation coverage within 15 years. These sites were 0.3–0.9 m above mean sea level when tidal exchange was restored. The other three sites had <50% vegetation coverage after 6–20 years (their maximum age during the study). These sites were 0.5–4.6 m below mean sea level when tidal exchange was restored. Methods: Between 1979 and 1995, levees were deliberately breached to restore tidal exchange in six coastal sites (farmland, mudflats, salt ponds or borrow pits). The area of each site covered by vegetation stands was estimated from historical aerial photographs and field surveys.
A replicated study in 1972–2000 of four filled and tidally restored coastal sites in California, USA (4b) reported that they developed 50% vegetation coverage within approximately 5–14 years. Any coverage beyond 50% was not quantified. Methods: Between 1972 and 1976, four coastal sites (historical land use not clear) were filled with dredged materials to restore suitable elevations for salt marsh plants (0.5–1.5 m above mean sea level). Then, tidal influx was restored by breaching levees. Note that this study evaluates the combined effect of these interventions. The area of each site covered by vegetation stands was estimated from historical aerial photographs.
A before-and-after study in 2002–2005 aiming to restore a salt marsh on farmland in England, UK (5) reported that approximately three years after clearing

12. Habitat restoration and creation
345
existing vegetation and restoring tidal exchange, 70% of the site was covered by salt marsh vegetation. The first colonizers included glasswort Salicornia sp. and seablite Suaeda maritima, but sea purslane Halimione portulacoides and sea aster Aster tripolium were present after 2–3 years (data not reported). The study reported that plant species diversity in the managed site was similar to adjacent natural salt marsh (but this was neither quantified nor statistically tested). Methods: The study used 66 ha of cropland that had been claimed from the sea in 1983. In August 2002, tidal exchange was restored to the site by blocking some drainage ditches, excavating tidal channels and breaching the seawall. Existing vegetation was cleared before hydrological restoration, so note that this study evaluates the combined effect of these interventions. Details of vegetation monitoring were not reported.
A replicated, paired, site comparison study in 2004 of eight salt marshes in England, UK (6) reported that restored marshes (deliberately exposed to tidal influx) contained different vegetation communities to natural marshes, typically with lower species richness and taller vegetation. Although all restored sites contained salt marsh vegetation after 2–13 years, the specific community type differed from natural marshes in four of four comparisons. Further, vegetation communities in restored marshes were ≤44% similar to those in natural marshes (8% for a 2-year-old marsh; 35–44% for 9–13-year-old marshes). Four of 17 recorded species had significantly different cover in restored and natural marshes, including sea purslane Atriplex portulacoides (restored: 2%; natural: 30%) and common cordgrass Spartina anglica (restored: 21%; natural: 3%). Species with statistically similar cover in restored and natural marshes included saltmarsh grass Puccinellia (restored 47%; natural: 33%) and glasswort Salicornia europaea (restored: 13%; natural: 5%). In two of four comparisons, restored marshes had significantly lower species richness than restored marshes (restored: 2–3 species/2 m2; natural: 8–10 species/2 m2; other comparisons no significant difference) and significantly taller vegetation than natural marshes (restored: 20–44 cm; natural: 9–22 cm; other comparisons mixed results). Methods: In July 2004, vegetation was surveyed in four pairs of adjacent restored and natural salt marshes. The restored marshes were former farmland, where embankments had been breached 2–13 years previously to restore tidal exchange. Plant/algal species and cover were recorded at a fixed elevation in five 2-m2 quadrats/marsh. This study included the restoration sites studied in (1) and (7). All sites in this study were included in (10).
A before-and-after, site comparison study in 1995–2003 of three salt marshes in England, UK (7) found that a marsh restored by breaching an embankment around farmland was colonized by salt marsh vegetation, and developed a similar species richness to nearby natural marshes within five years. Plant species colonized gradually: glassworts Salicornia spp. were the first species to establish (within two years), then seablite Suaeda maritima, then long-lived salt marsh species (see original paper for frequency data). From five years after breaching, plant species richness on the restored marsh was within the range of two nearby natural marshes (data reported as a saturation index). After eight years, 11 salt marsh plant species had established. The plant communities on the restored marsh matched recognized salt marsh community types, characterized on higher ground by saltmarsh grass Puccinellia (found in 100% of quadrats) and on lower ground by glassworts (in 55–100% of quadrats, depending on elevation). Methods: In August 1995, a 50-m-wide opening was made in an embankment around agricultural land, allowing the tide to enter twice a day. Plants were allowed to colonize naturally. Annually from 1997–2003, vegetation cover was recorded in 7,500 quadrats (each 1 m2). Quadrats were

12. Habitat restoration and creation
346
arranged in three 20 x 125 m transects, perpendicular to the shoreline. Long-term data on plant species in two nearby natural marshes were used for comparison. The restoration site was included in studies (6) and (10).
A before-and-after study in 1993–2004 in an estuary in New South Wales, Australia (8) reported that after removing culverts to improve tidal exchange to an island, the area of salt marsh vegetation increased. Salt marsh vegetation covered 44 ha of the study area two years before culvert removal, 52 ha three years after culvert removal, and 53 ha nine years after culvert removal. Other habitats present in the study site included mangrove forests (before: 1 ha; after nine years: 12 ha), tidal pools/mudflats (before: 33 ha; after nine years: 32 ha) and upland pasture (before: 42 ha; after nine years: 22 ha). Methods: The study focused on an island in the Hunter River Estuary, which had been partially drained for agriculture. In 1995, two 0.5-m diameter culverts in a tidal inlet were removed, restoring full tidal exchange to approximately one fifth of the island. Tidal exchange was slightly improved across the rest of the marsh, where culverts remained in place. Habitats were mapped from aerial photographs taken in 1993, 1998 and 2004.
A site comparison study in 2007 of two salt marshes in the UK (9) reported that a restored salt marsh (where the sea wall was breached after depositing sediment) contained fewer plant species and less vegetation cover than a natural salt marsh. Statistical significance was not assessed. After 15 months, the restored marsh contained only one plant species: glasswort Salicornia europaea. Its cover was 11%. A nearby natural marsh contained eight plant species: mostly common saltmarsh grass Puccinellia maritima (50% cover), sea lavender Limonium vulgare (23% cover) and common cordgrass Spartina anglica (10% cover). Glasswort cover was 2%. The study also noted differences in sediment properties, including salinity and organic matter content, between the restored and natural marsh. Methods: In October 2007, plant species and their cover were recorded in ten 0.5-m2 quadrats, in each of two salt marshes. One marsh had been restored by depositing dredged sediment onto farmland, to raise the ground to an appropriate level for marsh vegetation (May 2005), then breaching the sea wall to restore tidal exchange (July 2006). The other, natural marsh had never been tidally restricted. Note that this study evaluates the combined effect of depositing sediment and restoring tidal exchange.
A replicated, site comparison study in 2004–2010 of 52 salt marshes in England, UK (10) reported that restored marshes (deliberately exposed to tidal influx) were colonized by salt-tolerant plants within one year, but found that they had a different plant community with lower diversity and cover than natural salt marshes. After 1–14 years, restored marshes contained 21–80% of all salt-tolerant plant species recorded in the study (vs 27–77% in natural marshes; statistical significance not assessed). However, the overall composition of the plant community significantly differed between restored and natural marshes (data reported as a graphical analysis). Plant diversity was also lower in quadrats from restored marshes (data reported as a diversity index). In three of three comparisons, restored marshes had lower overall vegetation cover (53–83%) than natural marshes (84–98%). Restored marshes had significantly lower cover of Atriplex portulacoides in three of three comparisons (restored: 7–9%; natural: 17–21%) and significantly greater cover of glasswort Salicornia europaea in two of three comparisons (for which restored: 12–21%; natural: 5–12%), but similar cover of saltmarsh grass Puccinellia maritima in two of three comparisons (for which restored: 23–32%; natural: 29–31%; see original paper for full cover data). Methods: In summer–autumn 2004–2010, vegetation was surveyed in 52 salt marshes: 18 marshes restored from agricultural land 1–14 years

12. Habitat restoration and creation
347
previously by deliberately breaching sea walls, and 34 nearby natural marshes. Cover of all vascular plant species, and bare ground, were estimated in at least fifty 0.25-m2 quadrats/marsh (along transects perpendicular to shoreline). Species within 20 m of transects were also noted. This study included the sites studied in (1), (6) and (7).
A before-and-after study in 2001–2012 aiming to restore a salt marsh on pasture land in Scotland, UK (11) reported that salt marsh vegetation colonized the site within one year of breaching the sea wall, and dominated the site within three years. Before breaching, all sixty surveyed quadrats contained wet grassland/rush pasture plant communities. After one summer, 18% of quadrats contained salt marsh plant communities, with 57% of quadrats bare mud. Within three years, 65% of quadrats contained salt marsh plant communities, with only 2% bare mud. Wet grassland/rush pasture persisted in 21% of quadrats, at higher elevations. After nine years, 93% of quadrats contained salt marsh plant communities, 6% wet grassland and 1% bare mud. After breaching, there were only 25–32 plant species on the marsh each year, compared to 37 before. Methods: In February 2003, two 20-m-long breaches were dug in a sea wall. This restored tidal exchange to a 25-ha pasture created in the 1950s. Plant species and community types were recorded in sixty permanent quadrats across the site, before breaching (August 2001) and for up to nine years after (summer 2003–2011).
A before-and-after study in 1987–2011 aiming to restore a brackish/salt marsh on grassland in the Netherlands (12) reported that within ten years of restoring regular tidal exchange, marsh plant communities had developed. Before intervention, the site was a grassland containing 35–70% (depending on the elevation) of the target marsh species (typical of brackish or saline marshes in the region). After 10 years, the site was completely covered by a range of brackish and saline marsh plant communities, each containing 78–96% of the target marsh species. Of the 23 target species, only common reed Phragmites australis was not found along any surveyed transects – but it was noted elsewhere in the site. Methods: Between 1997 and 2001, regular tidal exchange (i.e. more than just high spring tides and storm surges) was restored to grassland behind an embankment: first (1997) by opening two culverts, then (2000) by excavating creeks and filling drainage ditches, and finally (2001) by creating three breaches, each 20–40 m wide, in the embankment. Plant communities were assessed from maps made 14 years before and up to 10 years after breaching. Plant species were recorded in three permanent transects (each containing 250–310 contiguous 10 x 10 m cells) one year before and up to 10 years after breaching.
A site comparison study of four brackish marshes in an estuary in Oregon, USA (13) reported that after removing levees to restore tidal exchange, the plant community became more similar to that of a nearby natural marsh – but remained significantly different after >30 years. In all three restored marshes, freshwater pasture grasses were gradually replaced by native salt-tolerant species such as pickleweed Salicornia virginica and saltgrass Distichlis spicata (data not reported). However, in a marsh where tidal exchange had been restored for the longest time (>30 years), the overall plant community composition remained significantly different from the natural marsh (data not reported). This restored marsh lacked some “diagnostic” brackish marsh species, such as Baltic rush Juncus balticus and black bent Agrostis alba. Methods: Vegetation was surveyed in four brackish marshes within the Salmon River estuary (years and survey methods not reported; salinity obtained from Gray et al. 2002). In three marshes, tidal influx had been restored. Levees that kept these sites as freshwater pasture were removed in 1978, 1987 or 1996. The other site was a natural marsh, where tidal influx had never been modified.

12. Habitat restoration and creation
348
(1) Dagley J.R. (1995) Northey Island: Managed Retreat Scheme; Results of Botanical Monitoring 1991–1994. English Nature Research Report 128.
(2) Burdick D.M., Dionne M., Boumans R.M. & Short F.T. (1996) Ecological responses to tidal restorations of two northern New England salt marshes. Wetlands Ecology and Management, 4, 129–144.
(3) Thom R.M., Zeigler R. & Borde A.B. (2002) Floristic development patterns in a restored Elk River estuarine marsh, Grays Harbor, Washington. Restoration Ecology, 10, 487–496.
(4) Williams P.B. & Orr M.K. (2002) Physical evolution of restored breached levee salt marshes in the San Francisco Bay estuary. Restoration Ecology, 10, 527–542.
(5) Badley J. & Allcorn R.I. (2006) Changes in bird use following the managed realignment at Freiston Shore RSPB Reserve, Lincolnshire, England. Conservation Evidence, 3, 102–105.
(6) Garbutt A. & Wolters M. (2008) The natural regeneration of salt marsh on formerly reclaimed land. Applied Vegetation Science, 11, 335–344.
(7) Wolters M., Garbutt A., Bekker R.M., Bakker J.P. & Carey P.D. (2008) Restoration of salt-marsh vegetation in relation to site suitability, species pool and dispersal traits. Journal of Applied Ecology, 45, 904–912.
(8) Howe A.J., Rodríguez J.F., Spencer J., MacFarlane G.R. & Saintilan N. (2010) Response of estuarine wetlands to reinstatement of tidal flows. Marine and Freshwater Research, 61, 702–713.
(9) Kadiri M., Spencer K.L., Heppell C.M. & Fletcher P. (2011) Sediment characteristics of a restored saltmarsh and mudflat in a managed realignment scheme in southeast England. Hydrobiologia, 672, 79–89.
(10) Mossman H.L., Davy A.J. & Grant A. (2012) Does managed coastal realignment create saltmarshes with 'equivalent biological characteristics' to natural reference sites? Journal of Applied Ecology, 49, 1446–1456.
(11) Elliott S. (2015) Coastal realignment at RSPB Nigg Bay Nature Reserve. RSPB Research Report. (12) Chang E.R., Veeneklaas R.M., Bakker J.P., Daniels P. & Esselink P. (2016) What factors determined
restoration success of a salt marsh ten years after de-embankment? Applied Vegetation Science, 19, 66–77.
(13) Flitcroft R.L., Bottom D.L., Haberman K.L., Bierly K.F., Jones K.K., Simenstad C.A., Gray A., Ellingson K., Baumgartner E., Cornwell T.J. & Campbell L.A. (2016) Expect the unexpected: place-based protections can lead to unforeseen benefits. Aquatic Conservation: Marine and Freshwater Ecosystems, 26(S1), 39–59.
Additional Reference
Gray A., Simenstad C.A., Bottom D.L & Cornwell T.J. (2002) Contrasting functional performance of juvenile salmon in recovering wetlands of the Salmon River estuary, Oregon USA. Restoration Ecology, 10, 514–526.
12.6.3 Facilitate tidal exchange to restore/create freshwater swamps
from other land uses
We found no studies that evaluated the effects, on vegetation, of facilitating tidal exchange to restore/create freshwater swamps from other land uses or habitat types.
This means that we have not yet found any studies that have directly evaluated this intervention during our systematic journal and report searches. Therefore we have no evidence to indicate whether or not the intervention has any desirable or harmful effects.
12.6.4 Facilitate tidal exchange to restore/create brackish/saline swamps
from other land uses
Two studies evaluated the effects, on vegetation, of facilitating tidal exchange to restore/create brackish/saline swamps from other land uses or habitat types. One study was in Australia1 and one was in Thailand2.
VEGETATION COMMUNITY

12. Habitat restoration and creation
349
Overall extent (1 study): One before-and-after study in an estuary in Australia1 reported that the area of mangrove forest on an island was greater 3–9 years after restoring full tidal exchange than in the years before.
Tree/shrub richness/diversity (1 study): One study in a former shrimp pond in Thailand2 reported the number of mangrove tree species that spontaneously colonized in the six years after restoring full tidal exchange (along with other interventions).
VEGETATION ABUNDANCE
Individual species abundance (1 study): One study in a former shrimp pond in Thailand2 reported the number of mangrove trees, by species, that spontaneously colonized in the six years after restoring full tidal exchange (along with other interventions).
VEGETATION STRUCTURE
A before-and-after study in 1993–2004 in an estuary in New South Wales, Australia (1) reported that after removing culverts to improve tidal exchange to an island, the area of mangrove vegetation increased. Mangrove forests covered 1 ha of the study area two years before culvert removal, 5 ha three years after culvert removal, and 12 ha nine years after culvert removal. Mangroves benefitted from the expansion of intertidal habitat, which provided a suitable physical environment. Other habitats present in the study site included salt marsh vegetation (before: 44 ha; after nine years: 53 ha), tidal pools/mudflats (before: 33 ha; after nine years: 32 ha) and upland pasture (before: 42 ha; after nine years: 22 ha). Methods: The study focused on an island in the Hunter River Estuary, which had been partially drained for agriculture. In 1995, two 0.5-m-diameter culverts in a tidal inlet were removed, restoring full tidal exchange to approximately one fifth of the island. Tidal exchange was slightly improved across the rest of the marsh, where culverts remained in place. Habitats were mapped from aerial photographs taken in 1993, 1998 and 2004.
A study in 1999–2005 in a former shrimp pond in Thailand (2) reported that six years after restoring tidal exchange (along with reprofiling and planting mangrove seedlings), 1,797 unplanted trees of 15 different species were present. The most abundant species were grey mangrove Avicennia marina (842 trees), Bruguiera cylindrica (486 trees) and Ceriops decandra (267 trees). Four species were represented by a single tree. Methods: In June 1999, full tidal exchange was restored to an abandoned 6,525-m2 shrimp pond by levelling the banks surrounding the pond. Previously, water could only flow in and out through a 10-m-wide channel. The pond was also filled in. In September 1999, seedlings of four mangrove species were planted in the pond (500–800 seedlings/species, 1.5 m apart). The study does not distinguish between the effects of these interventions on naturally colonizing vegetation, of restoring tidal exchange, reprofiling and planting. In October 2005, mangrove trees that had spontaneously colonized were recorded in a 300-m2 section of the site.
(1) Howe A.J., Rodríguez J.F., Spencer J., MacFarlane G.R. & Saintilan N. (2010) Response of estuarine wetlands to reinstatement of tidal flows. Marine and Freshwater Research, 61, 702–713.
(2) Matsui N., Suekuni J., Nogami M., Havanond S. & Salikul P. (2010) Mangrove rehabilitation dynamics and soil organic carbon changes as a result of full hydraulic restoration and re-grading of a previously intensively managed shrimp pond. Wetlands Ecology and Management, 18, 233–242.

12. Habitat restoration and creation
350
12.7 Fill/block ditches
We found no studies that evaluated the effects of filling/blocking ditches in marshes or swamps on vegetation within the ditches.
This means that we have not yet found any studies that have directly evaluated this intervention during our systematic journal and report searches. Therefore we have no evidence to indicate whether or not the intervention has any desirable or harmful effects.
Background
Ditches could form as a result of erosion (e.g. heavy rainfall, repeated livestock use of set trails) or be deliberately dug to drain wetlands for agriculture, forestry or mining. It may be desirable to fill or block a ditch to allow vegetation characteristic of shallow still water to grow – as opposed to vegetation characteristic of deeper and perhaps moving water in extant ditches. Evidence summarized for this intervention relates to effects on vegetation within filled/blocked ditches.
Related interventions: Backfill canals or trenches dug as transport or service corridors (5.1); Raise water level to restore degraded marshes or swamps (8.1); Raise water level to restore/create marshes or swamps from other land uses (12.4).
12.8 Excavate pools
Background
Pools are small, discrete water bodies: <8 ha in area or <280 m in diameter (Ramsar Convention Secretariat 2016). They may be permanently or seasonally flooded. Pools may be lost through drainage or filling, or become degraded through pollution, invasion or lack of management. In this synopsis, we consider “pools” and “ponds” as synonymous.
To be summarized as evidence for this intervention, studies must evaluate the effects of excavating pools on emergent vegetation (e.g. coverage of emergent vegetation within permanent pools, or characteristics of vegetation in marshes or swamps around pools). Studies of pools, or zones within pools, that contain little emergent vegetation will be summarized in a future synopsis.
Related interventions: Reprofile/relandscape areas larger than pools (12.9).
Ramsar Convention Secretariat (2016) An Introduction to the Convention on Wetlands: Ramsar Handbooks 5th Edition. Ramsar Convention Secretariat, Gland.
12.8.1 Excavate freshwater pools
Seven studies evaluated the effects, on vegetation within pools or surrounding marshes/swamps, of excavating freshwater pools. Five studies were in the USA2–5,7, one was in Guam1 and one was in Canada6. Two of the studies in the USA4,5 were based on the same set of pools.
VEGETATION COMMUNITY
Relative abundance (2 studies): One replicated, paired, site comparison study in a freshwater marsh in Canada6 reported that a smaller proportion of individual plants around excavated pools were wetland-characteristic species, compared to the proportion around natural pools. The

12. Habitat restoration and creation
351
excavated pools were 1–3 years old. One replicated study in the USA5 reported that excavated pools became dominated by non-native plant species over eight years.
Overall richness/diversity (3 studies): One replicated, paired, site comparison study in a freshwater marsh in Canada6 found that overall plant species richness and diversity were similar around excavated pools and natural pools, 1–3 years after excavation. Two studies involving freshwater marshes in Guam1 and the USA2 simply quantified plant species richness 12–18 months after excavation (along with other interventions).
VEGETATION ABUNDANCE
Overall abundance (1 study): One replicated, site comparison study in the USA7 found that excavated and natural pools had similar cover of emergent vegetation, seven years after excavation. The same was true for submerged vegetation.
Characteristic plant abundance (2 studies): Two replicated studies in the USA4,5 reported the abundance of native pool-characteristic species over 3–8 years after excavating pools. One of the studies4 was also a site comparison and reported that these species were less abundant in the excavated pools than nearby natural pools.
Shrub abundance (2 studies): One replicated, site comparison study in the USA7 found that excavated and natural pools had similar cover of shrubby vegetation after seven years. One replicated study in the USA3 simply quantified shrub abundance over five years after excavating pools/potholes (along with other interventions).
Algae/phytoplankton abundance (1 study): One replicated, site comparison study in the USA7 found that excavated and natural pools contained a similar biomass of surface-coating algae and phytoplankton, after seven years. The same was true for phytoplankton after eight years.
Individual species abundance (5 studies): Five studies1,3,4,6,7 quantified the effect of this intervention on the abundance of individual plant species. For example, one replicated, site comparison study in the USA7 found that excavated and natural pools had similar cover of loosestrife Lythrum sp. seven years after excavation, but that excavated pools had greater cover of duckweed Lemna sp., cattails Typha spp. and common reed Phragmites australis.
VEGETATION STRUCTURE
A before-and-after study in 1992–1993 on a tourist resort in Guam (1) reported that a freshwater pool created by excavation, lining with wetland soil and planting herb species contained two of the four planted species after one year, and four additional species. The two planted species present after one year were spikerush Eleocharis dulcis (60% cover) and rusty flatsedge Cyperus oderatus (<1% cover). Four additional species were present after one year: two rushes, one grass and one forb (<1–10% cover). Methods: In January 1992, a 600-m2 wetland was excavated on a natural valley slope, lined with wetland soil (30 cm deep) and planted with four herbaceous species (120 spikerush, an unclear number of rusty flatsedge, 20 taro, 5% cover of water lettuce). The study does not distinguish between the effects of these interventions on non-planted vegetation. The wetland was fed by ground and surface water, and had a stable 20–60 cm water depth. Final vegetation cover was estimated in January 1993.
A study in 1991–1993 of an excavated and planted freshwater wetland in Ohio, USA (2) reported that it developed vegetation cover, including 13 of 17 planted herb species, after 18 months. Eighteen months after planting, 50 herbaceous plant species were recorded in the marsh and wet meadow zones (vs 35 after six months and 44 after 15 months). Of these, 13 were planted species (12 emergent marsh and wet

12. Habitat restoration and creation
352
meadow species, plus one cover crop). The other 37 species had colonized spontaneously. No submerged vegetation was recorded within pools in the wetland. Methods: In autumn 1991, two connected wetland basins (6.1 ha total area) were excavated from former farmland. In spring 1992, seventeen wetland herb species (including three intended as cover crops) were planted into flooded and saturated areas of the basins. In autumn 1992, summer 1993 and autumn 1993, herbaceous plant species were recorded along six transects spanning the wetland. The study does not distinguish between the effects of excavation and planting on non-planted vegetation.
A replicated study in 1997–2002 of excavated ephemeral pools/potholes (within replanted uplands) in Maine, USA (3) reported that they were colonized by vegetation – mostly common cattail Typha latifolia – within five years. These results were not tested for statistical significance. After five years, cattail dominated three of three pools (60–84% of their vegetation cover) and 21 of 50 surveyed potholes (percent cover not reported). Shrubs were present in 30 of 50 surveyed potholes and were the dominant vegetation in seven (percent cover not reported). The study also reported that vegetation cover and species richness increased between three and five years after excavation (data not reported and not statistically tested). Methods: In autumn 1997, three seasonal freshwater pools (350–900 m2) and 200 seasonal freshwater potholes (0.3–110 m2) were excavated in an abandoned commercial development. Fill material was removed to expose soil from the forested wetland that historically occupied the site. Upland grasses, shrubs and trees were planted around the pools/potholes to stabilize the soil. Emergent vegetation cover, up to the high water mark, was estimated in each pool and 50 potholes in May–September 1999–2002.
A replicated, site comparison study in 1998–2008 of 64 ephemeral pools on an air force base in California, USA (4) reported that excavated pools were colonized by five native, pool-characteristic plant species, but that these were less abundant than in nearby natural pools. Abundance of the five species peaked eight years after excavation, with a total frequency (summed across all species) of 5%. Over the eight years, individual species had a frequency of 0–21% in excavated pools, compared to 5–48% in nearby natural pools. Methods: In December 1999, sixty-four ephemeral pools were excavated in recently farmed grassland. The pools were 25–100 m2 and <150 m from natural pools. These pools were not sown with any seeds, but the surface was lightly raked. The frequency of five focal species (native species characteristic of Californian ephemeral pools) was recorded using grids of one hundred 2.5-cm2 cells. One grid was surveyed in some (number not specified) natural pools on the base in 1998 and 1999, and in each excavated pool in spring 2002–2008. This study was based on the same pools as (5).
A replicated study in 1999–2008 of 64 excavated ephemeral pools on an air force base in California, USA (5) reported that they were colonized by vegetation, but became dominated by non-native species after eight years. After 3–6 years, the excavated pools contained a mixture of native Californian pool-characteristic plants, and non-native plants. The abundance of each group was similar (native pool-characteristic abundance 1.1–1.5 times greater than non-natives). However after 8–9 years, and following a period of flooding then drought, the pools were dominated by non-native plants (non-native abundance 5–10 times greater than native pool-characteristic plants). Absolute abundance was reported as the sum of frequencies of species in each group (see original paper for data). Methods: In December 1999, sixty-four ephemeral pools were excavated in recently farmed grassland. The pools

12. Habitat restoration and creation
353
were 25–100 m2 and <150 m from natural pools. These pools were not sown with any seeds, but the surface was lightly raked. Each spring between 2002 and 2008, the frequency of every plant species was recorded in each pool, using a grid of one hundred 2.5-cm2 cells. Frequencies were added together to give the overall abundance for native, pool-characteristic plants and non-native plants (data for native, generalist plants were not reported). This study was based on the same pools as (4).
A replicated, paired, site comparison study in 2011 in a freshwater marsh in Ontario, Canada (6) found that the margins of excavated pools had a richer and more diverse plant community, but were less dominated by wetland-characteristic plants, than the margins of natural pools and reed/cattail stands. After 1–3 years, plant species richness was significantly higher on the shores of excavated pools (11 species/60 sampling points) than on the shores of natural pools (7 species/60 points) or in areas of the marsh dominated by common reed Phragmites australis or cattails Typha spp. (7 species/60 points). The same was true for plant diversity (data reported as a diversity index). Only 93% of individual plants recorded on the shores of excavated pools were wetland-characteristic species, compared to 99% on natural shorelines and 98% in reed/cattail stands (statistical significance not assessed). The study also reported data on the abundance of individual plant species (see appendix to original paper). Methods: In summer 2011, vegetation was surveyed in 11 areas of a freshwater marsh on the shores of Lake Erie. Each area contained three sites: one excavated pool (≤4 ha; ≤1.5 m deep; dug in reed/cattail stands 1–3 years previously, with dredge spoil deposited around pool margins), one “natural” pool (substrate not disturbed for >10 years) and one site still containing reed/cattail stands. Plant species were recorded at 60 points/site. At pool sites, points were in the surrounding marsh but ≤3 m from the open water.
A replicated, site comparison study in 2013–2014 of 13 pools within forests in the northeast USA (7) found that excavated pools and natural pools had similar abundance of some – but not all – vegetation types and taxa. Seven-year-old excavated pools and natural pools supported statistically similar cover of submerged vegetation, overall emergent vegetation, shrubs and loosestrife Lythrum sp. (all vegetation cover data reported as categories). Excavated and natural pools also contained a statistically similar biomass of surface-coating algae and phytoplankton after seven years (also true for phytoplankton after eight years; data not reported). However, 7-year-old excavated pools had greater cover than natural pools of duckweed Lemna sp., cattail Typha spp. and common reed Phragmites australis. The study also reported differences in some physical characteristics of the pools. For example, excavated pools were smaller, warmer, less acidic and received more light than natural pools (see original paper). Methods: In 2013–2014, plants, algae and phytoplankton were surveyed in seven excavated pools (326 m2 on average; created in 2006) and six natural pools (588 m2 on average). Most of the pools were seasonally flooded, but two excavated pools were permanently flooded. The excavated pools were in New York and the natural pools in Connecticut, but all were within similar mature forests. Algal and phytoplankton biomass were estimated from chlorophyll on glass slides or in the water column, respectively.
(1) Ritter M.W. & Sweet T.M. (1993) Rapid colonization of a human-made wetland by Mariana common moorhen on Guam. Wilson Bulletin, 105, 685–687.
(2) Niswander S.F. & Mitsch W.J. (1995) Functional analysis of a two-year-old created in-stream wetland: hydrology, phosphorus retention, and vegetation survival and growth. Wetlands, 15, 212–225.
(3) Vasconcelos D. & Calhoun A.J.K. (2006) Monitoring created seasonal pools for functional success: a six-year case study of amphibian responses, Sears Island, Maine, USA. Wetlands, 26, 992–1003.

12. Habitat restoration and creation
354
(4) Collinge S.K. & Ray C. (2009) Transient patterns in the assembly of vernal pool plant communities. Ecology, 90, 3313–3323.
(5) Collinge S.K., Ray C. & Gerhardt F. (2011) Long-term dynamics of biotic and abiotic resistance to exotic species invasion in restored vernal pool plant communities. Ecological Applications, 21, 2105–2118.
(6) Schummer M.L., Palframan J., McNaughton E., Barney T. & Petrie S.A. (2012) Comparisons of bird, aquatic macroinvertebrate, and plant communities among dredged ponds and natural wetland habitats at Long Point, Lake Erie, Ontario. Wetlands, 32, 945–953.
(7) Kolozsvary M.B. & Holgerson M.A. (2016) Creating temporary pools as wetland mitigation: how well do they function? Wetlands, 36, 335–345.
12.8.2 Excavate brackish/saline pools
We found no studies that evaluated the effects, on vegetation within pools or surrounding marshes/swamps, of excavating brackish/saline pools.
This means that we have not yet found any studies that have directly evaluated this intervention during our systematic journal and report searches. Therefore we have no evidence to indicate whether or not the intervention has any desirable or harmful effects.
12.9 Reprofile/relandscape
Background
This intervention involves large-scale reprofiling or landscaping, aiming to restore or create marshes or swamps. This includes excavating large basins (>8 ha or >280 m diameter), moving soil/sediment from the site into levees/berms/impoundments, removing unnatural hills or levees, filling in deep depressions and altering the elevation/slope of coastal areas. In other words, this intervention aims to restore wetland hydrology (how wet the soil is and when it is wet/flooded) by adjusting the ground surface relative to the water table or sea. Soil from existing marshes or swamps might be imported as part of relandscaping efforts, but we consider this as a separate intervention (Section 12.26).
CAUTION: Heavy machinery is usually needed for this intervention. Heavy vehicles can churn and compress wetland soils (Campbell et al. 2002; see also Chapter 7).
Related interventions: Raise water level to restore degraded marshes or swamps (8.1); Raise water level to restore/create marshes or swamps from other land uses (12.4); Facilitate tidal exchange to restore degraded marshes or swamps (8.3); Facilitate tidal exchange to restore/create marshes or swamps from other land uses (12.6); Excavate pools (12.8); Create mounds or hollows (12.10); Remove surface soil/sediment (12.11); Deposit soil/sediment to form physical habitat structure (12.16); Reprofile/relandscape before planting (13.6).
Campbell D.A., Cole C.A. & Brooks R.P. (2002) A comparison of created and natural wetlands in Pennsylvania, USA. Wetlands Ecology and Management, 10, 41–49.
12.9.1 Reprofile/relandscape: freshwater marshes
Thirteen studies evaluated the effects, on vegetation, of reprofiling/relandscaping to restore or create freshwater marshes. Ten studies were in the USA1–4,6,8–12. There was one study in each of France5, the UK7 and Italy13. Two pairs of studies used the same or similar sites in Connecticut2,4 and Nebraska11,12.

12. Habitat restoration and creation
355
VEGETATION COMMUNITY
Overall extent (1 study): One replicated, site comparison study in the USA2 reported that emergent vegetation stands covered a smaller area within excavated than natural marshes, 4–5 years after intervention.
Community composition (3 studies): Two site comparison studies (one before-and-after, one replicated) in France5 and the USA11 reported that reprofiling affected the overall plant community composition. In the USA11, the community differed from, but was not intermediate between, natural marshes and degraded marshes. One study in the USA3 simply quantified the wetness of the overall plant community in an excavated wetland, 1–2 growing seasons after intervention.
Overall richness/diversity (9 studies): Three replicated, site comparison studies in the USA2,4,11 found that plant species richness (overall11 or wetland species2,4) was similar in reprofiled and natural marshes, 1–13 years after intervention. One before-and-after, site comparison study in the UK7 reported that overall plant species richness was not higher in excavated (and planted) reedbeds, than in a nearby natural reedbed, after seven years. One before-and-after study in France5 reported that there were more plant species present in a marsh in the two summers after reprofiling than in the summer before. Four studies in the USA1,3,9 and Italy13 simply reported the number of plant species on wetlands that had been reprofiled or excavated (sometimes1,13 along with other interventions), after three months to 23 years.
Characteristic plant richness/diversity (1 study): One study in the USA9 simply reported the number of wetland-characteristic plant species in excavated wetlands, for up to 18 years after intervention.
VEGETATION ABUNDANCE
Overall abundance (8 studies): Two replicated, site comparison studies in the USA4,12 reported that overall vegetation cover was similar in reprofiled and natural marshes, 2–13 years after intervention. One of the studies12 also found that vegetation cover was similar in reprofiled and degraded marshes. Another replicated, site comparison study in the USA2 reported that vegetation cover within emergent vegetation stands was lower in excavated than natural marshes, 4–5 years after intervention. Five studies in the USA1,3,6,8,9 simply quantified overall vegetation abundance on wetlands that had been reprofiled or excavated (sometimes1,8 along with other interventions), after three months to 18 years. One of these studies6 reported an absence of vegetation after two years.
Characteristic plant abundance (1 study): One study in the USA3 simply quantified the abundance of wetland-characteristic plants in an excavated wetland, after 1–2 growing seasons.
Bryophyte abundance (1 study): One replicated, site comparison study in the USA10 reported that excavated marshes contained a lower abundance (frequency and biomass) of bryophytes than natural marshes, 2–15 years after intervention.
Trees/shrub abundance (1 study): One replicated, site comparison study in the USA4 reported that excavated marshes had lower woody plant cover than natural marshes, after 12–13 years.
Individual species abundance (10 studies): Ten studies1–10 quantified the effect of this intervention on the abundance of individual plant species. Two of these studies were replicated site comparisons in the USA2,4, and reported mixed responses. For example, broadleaf cattail Typha latifolia typically had lower cover in excavated than natural marshes in one study2, but greater cover in excavated than natural marshes in the other study4.
VEGETATION STRUCTURE
A study in 1982–1984 aiming to create a freshwater marsh on formerly mined land in Florida, USA (1) reported that reprofiling (along with raising the water table) allowed marsh vegetation to develop within three months. Three months after

12. Habitat restoration and creation
356
intervention, 16 plant species were present with 33% total vegetation cover. After two years, 26 plant species were present with 75% total vegetation cover. During the second year after creation, the most abundant plant species were broadleaf cattail Typha latifolia (17–60% cover) and water pennywort Hydrocotyle sp. (17–35% cover). Methods: The study aimed to create a marsh on surface-mined land (historically a mix of forest and rangeland). In the early 1980s, a surface-mined area was landscaped to a gentle slope with shallow depressions. The water table was also raised by building a levee downslope. The study does not distinguish between the effects of these interventions. Some ponds were dug, but no wetland soil was added to this area. Interventions were completed in May 1982. Between autumn 1982 and summer 1984, the cover of every plant species was recorded along three randomly placed permanent transects (crossing zones of emergent and floating/submerged vegetation).
A replicated, site comparison study in 1988 of ten freshwater marshes in Connecticut, USA (2) found that excavated marshes contained more open water and less vegetation cover than natural marshes, but similar richness of wetland plant species. After 4–5 years, the area of open water was greater in excavated marshes (5–90%) than in natural marshes (0–40%). Within vegetated areas, excavated marshes had only 71% vegetation cover on average (vs natural: 97%). Cover and frequency of individual species showed mixed results (see original paper for data; statistical significance not assessed). For example, broadleaf cattail Typha latifolia cover was lower in excavated than natural marshes in three of five comparisons, but higher in excavated than natural marshes in the other two comparisons. In contrast, tussock sedge Carex stricta always had similar or lower cover in excavated marshes compared to natural marshes. Finally, there was a statistically similar number of wetland plant species, on average, in excavated marshes (33 species/marsh) and natural marshes (30 species/marsh). Methods: In summer 1988, vegetation was surveyed in five created marshes (excavated in 1983–1984) and five nearby natural marshes. All marshes were <1 ha. Although paired geographically, created and natural marshes contained different soils and water levels. The total open water area was visually estimated. Plant species and their cover were recorded in at least forty 1-m2 quadrats/marsh, placed in vegetated areas. Some of the marshes in this study were also studied in (4).
A study in 1991–1992 of an excavated freshwater wetland in Pennsylvania, USA (3) reported that it developed vegetation cover, but mostly of upland plant species. After two growing seasons, there were 7 plant species/3 m2 in the excavated wetland. Vegetation cover was 45% and there were 86 plant stems/0.25 m2 (both higher, but not significantly, than after the first growing season). There was only 5% cover of wetland-characteristic plant species (vs 28% cover of species that usually grow in uplands). The overall plant community was more characteristic of upland than wetland conditions (data reported as a wetland indicator index). For data on the frequency of individual species, see original paper. Methods: In January 1991, a 1-m-deep basin was excavated in a formerly cropped floodplain. In the excavated wetland, the water table was 0.4–0.6 cm below the ground surface on average during the growing season. Vegetation was surveyed in August 1991 and 1992, in twelve 0.25-m2 quadrats in each of six 36-m2 plots.
A replicated, site comparison study in 1996 of seven freshwater marshes in Connecticut, USA (4) reported that created marshes had similar wetland plant richness, overall vegetation cover and woody plant cover to natural marshes, but greater cover of common reed Phragmites australis and cattails Typha spp. Statistical
12. Habitat restoration and creation
357
significance was not assessed. After 12–13 years, excavated marshes contained 25–53 wetland plant species (vs natural: 38–46 species) and had 80–123% total vegetation cover (natural: 90–130%). Key species with greater cover in created marshes included common reed (three of three comparisons; created: 2–29%; natural: <1%), narrowleaf cattail Typha angustifolia (three of three comparisons; <1–19%; natural: 0–11%) and broadleaf cattail Typha latifolia (two of three comparisons, for which created: 5–8%; natural: <1%). Woody plants had grown in both created marshes (10% cover) and natural marshes (16% cover). The study also reported data from 4–5 years after excavation (see original paper). Methods: In summer 1988 and 1996, vegetation was surveyed in four created marshes (excavated in 1983–1984) and three nearby natural marshes. All marshes were <1 ha, and the summer water table was 30 cm below to 22 cm above ground surface on average. Plant species and their cover were recorded in at least forty 1-m2 quadrats within vegetated areas of each marsh. This study used a subset of the marshes in (2).
A before-and-after, site comparison study in 1983–1999 of two marshes within a cut-off meander in France (5) reported that after one marsh was reprofiled and isolated from the river channel, its plant community composition changed and species richness increased. Statistical significance was not assessed. Community data were reported as graphical analyses, species abundance scores and statistical model results. Over the 12 years before intervention, both marshes were developing cover of few, dominant plant species. The plant community composition was becoming less variable across each marsh and the number of plant species was declining (e.g. to 17 species in one marsh in 1997). In the year after intervention, plant community variation had increased across the reprofiled marsh, but remained relatively stable in the unmanaged marsh. Excavated areas of the reprofiled marsh developed a different plant community (dominated by invasive Nuttall’s pondweed Elodea nutallii) to areas of the marsh where sediment had been added (dominated by emergent species). In the two summers after intervention, the reprofiled marsh contained 20 and 21 plant species. Methods: The study used a meander that was cut off from its river at one end. In June 1998, one section still joined the river (and thus drained when the river level dropped in the summer) was reprofiled to maintain water levels. Excess silt was removed, and one end was plugged to isolate the section from the river channel. Another section of the meander (naturally isolated from the river) was not reprofiled and was used as a reference. Plant species and their abundance (combination of cover and patchiness) were recorded in summer before (1983, 1992, 1997) and after (1998, 1999) reprofiling, along 5–7 transects/marsh.
A replicated study in 1999–2001 of six excavated wetlands in Wyoming, USA (6) reported that no plants grew in the wetlands within two years of excavation. Methods: In late 1999, six wetlands were excavated (area: 0.25–1 ha; depth: <3 m) in bentonite clay soils. None of these marshes were amended with wetland soils (cf. Section 12.26). In September 2000 and 2001, forty 0.25-m2 quadrats/wetland were surveyed for vegetation. Quadrats were placed along transects perpendicular to the shoreline, so had variable water depths.
A before-and-after, site comparison study in 1996–2008 aiming to restore a reedbed on farmland in England, UK (7) found that excavated wet basins (also planted with common reed Phragmites australis) contained a greater density of reeds but fewer plant species than a nearby natural reedbed. The restored area was initially drained farmland. Seven years after excavations finished, the restored area contained a greater density of live reeds (96 stems/m2) than the natural reedbed (63 stems/m2).

12. Habitat restoration and creation
358
There was no significant difference in the density of dead reeds (restored: 52; natural: 48 stems/m2). Although the restored area contained fewer plant species than the natural reedbed at a large scale (restored: 5; natural: 9 species/30 m2), both sites had the same species richness at a small scale (3 species/2 m2). Statistical significance of these richness results was not assessed. Methods: Between 1996 and 2001, three hundred hectares of wet basins were excavated in farmland. Over 250,000 common reed stems were planted into the basins by 2003. The study does not distinguish between the effects of excavation and planting on non-planted vegetation. In August 2008, reed stems and plant species and were recorded in thirty 2-m2 quadrats: 15 in the restoration area and 15 in a natural (never-farmed) reedbed.
A study in 1997–2006 of a levelled, irrigated and partially planted freshwater marsh in California, USA (8) reported that it developed vegetation dominated by emergent plants, including planted tule Schoenoplectus acutus – although vegetation cover and density depended on the water level. After 2–9 years, the shallower half of the site had 89–98% total vegetation cover. This included 77–81% cattail Typha spp., 11–19% tule and 0–5% submerged vegetation cover. Emergent vegetation density fluctuated between 49 and 76 stems/m2. The deeper half of the site had 77–100% total vegetation cover, including 38–58% cattail, 3–8% tule, and 10–46% submerged vegetation cover. Emergent vegetation density fluctuated between 44 and 59 stems/m2. Across the entire site, above-ground biomass of emergent vegetation was 1,630 g/m2 after 1–3 years (vs submerged, floating and algae combined: 389 g/m2) then fluctuated between 925 and 2,360 g/m2 for the following six years. Methods: In autumn 1997, a 0.6-ha area of farmland was levelled and lowered. Tule was planted into two 0.25-ha basins within the site. Shortly after planting, the fresh water was continuously piped into the site, flooding the basins with 25 cm and 55 cm of water respectively. The study does not distinguish between the effects of levelling, planting and irrigation on non-planted vegetation. All plants and algae were surveyed along transects, in summer/autumn, at least biennially between 1998 and 2006. Biomass was cut, dried and weighed (years 1–3) or estimated from plant height and diameter (years 4–9).
A replicated study in 2005–2006 of nine excavated depressions in formerly mined land in Texas, USA (9) reported that they developed greater vegetation cover, species richness and biomass over time. Unless specified, statistical significance was not assessed. Vegetation was present in 35% of quadrats in the youngest marshes (0–2 years old), 60% of quadrats in intermediate marshes (7–8 years old) and 55% of quadrats sampled in the oldest marshes (17–18 years old). The oldest marshes contained 8–11 plant species, all of which were wetland-characteristic species. The intermediate marshes contained 7–9 species (5–9 wetland-characteristic) and the youngest marshes contained 3–8 species (2–8 wetland-characteristic). For data on the frequency of individual species, see original paper. Averaged over a year, above-ground vegetation biomass was significantly greater in the oldest marshes than the intermediate or youngest marshes (data not reported). Methods: In 2005–2006, vegetation was surveyed in nine marshes (1–23 ha; three young, three intermediate and three old) excavated in a historically mined area. The oldest marshes were excavated in 1987. Some upland species had been planted around the youngest marshes. Emergent and submerged plants were identified and counted in nine 0.25-m2 quadrats/marsh/season, then live vegetation was cut, dried and weighed.
A replicated, site comparison study in 2011 of 27 freshwater marshes in Minnesota, USA (10) reported that excavated marshes typically had lower bryophyte

12. Habitat restoration and creation
359
species richness, frequency and biomass than natural marshes. Unless specified, statistical significance was not assessed. Excavated marshes were 2–15 years old. They contained 1–9 bryophyte species in total (vs natural marshes: 8–12), 1.6–3.2 bryophyte species/0.36 m2 (vs natural: 3.3; significantly lower in one of two comparisons) and 0.3–0.6 bryophyte species/0.36 m2 in the wettest areas (vs natural: 0.8). In excavated marshes, bryophytes occurred in 7–41% of sampled 100-cm2
quadrats (vs natural: 20–55%) and bryophyte biomass was <1–4 g/100 cm2 (vs natural: 2–5%). For data on the frequency of individual species, see original paper. Methods: In summer 2011, aquatic and semi-aquatic bryophytes were surveyed in 27 marshes: 18 excavated and nine natural. The natural marshes had burned in spring 2009 or 2011. Bryophyte species were recorded across the whole of each marsh and in twenty-four 0.36-m2 quadrats/marsh (placed along four transects from wetland to upland areas). All bryophytes were collected from twenty 100-cm2 quadrats in three excavated marshes and one natural, then dried and weighed.
A replicated, site comparison study in 2008–2009 involving 12 reprofiled ephemeral freshwater marshes (playas) in Nebraska, USA (11) found that reprofiled marshes typically had similar plant species richness to natural marshes after 1–11 years and greater species richness than degraded marshes, but reported different plant communities under each treatment. In two of two years, reprofiled marshes contained a similar number of plant species (overall: 43–49; native: 36–38 species/marsh) to natural marshes (overall: 38–40; native: 31 species/marsh). Reprofiled marshes contained significantly more plant species than degraded marshes (overall: 24–26; native: 18–19 species/marsh). However, reprofiled marshes were developing a plant community distinct from, rather than intermediate between, natural and degraded marshes (data reported as graphical analyses; statistical significance of differences not assessed). For example, reprofiled marshes contained mostly mudflat annual plants, rather than the wet prairie and perennial species present in natural marshes. Methods: In summer 2008 and 2009, vegetation was surveyed in 34 playa wetlands: 11–12 reprofiled (by removing excess upland sediment to create a graded basin; surrounded by crops or grassland), 11–12 degraded (with excess upland sediment; surrounded by and/or planted with crops) and 11–12 natural (unaffected by sediment; surrounded by grassland). Each June, July and August, plant species and their cover were recorded at 400 points across two transects/marsh. This study largely used the same marshes as (12).
A replicated, site comparison study in 2008–2009 involving 11 reprofiled ephemeral freshwater marshes (playas) in Nebraska, USA (12) found that reprofiled marshes had similar emergent vegetation cover, after 2–11 years, to both degraded and natural playas. In two of two years, emergent vegetation cover did not significantly differ between reprofiled marshes (74–95%), degraded marshes (81–91%) and natural marshes (85–96%). Methods: In June 2008, vegetation cover was recorded in 34 playa marshes (two transects/marsh). Of the marshes, 11 were reprofiled (by removing excess upland sediment to create a graded basin; surrounded by crops or grassland), 11 were degraded (with excess upland sediment; surrounded by and/or planted with crops) and 12 were natural (unaffected by sediment; surrounded by grassland). Surveys were repeated in 32 of the playas in June 2009. This study largely used the same marshes as (11).
A study in 2005–2013 of an excavated, planted and harvested water treatment marsh in Sardinia, Italy (13) reported that it supported 275 plant taxa. This included 201 plant species in 161 genera. Approximately 63% of the taxa were Mediterranean

12. Habitat restoration and creation
360
(found predominantly or solely in this region) and approximately 16% were known non-natives in Italy. As expected in the study area, 56% of the taxa were annual plants that complete their life cycle rapidly in favourable conditions (“thereophytes”). Only 2% of taxa had underwater resting buds (“hydrophytes”). Methods: Between 2005 and 2013, plant taxa were recorded in the 37-ha EcoSistema Filtro marsh, which had been constructed with the dual aims of habitat creation and water treatment. There were monthly surveys (a) across the whole site, including banks and upland areas, and (b) in three 16-m2 plots, each April–July and September–December. The wetland had been constructed by excavating basins of varying salinity and levees (including removal of all existing vegetation; beginning 1990) and planting bundles of 2-m-tall common reed Phragmites australis (2004). Some “plant biomass” was mechanically removed between 2005 and 2007. Note that this study evaluates the combined effect of these interventions, and does not separate results from fresh, brackish and saline areas.
(1) Erwin K.L. & Best G.R. (1985) Marsh community development in a Central Florida phosphate surface-mined reclaimed wetland. Wetlands, 5, 155–166.
(2) Confer S.R. & Niering W.A. (1992) Comparison of created and natural freshwater emergent wetlands in Connecticut (USA). Wetlands Ecology and Management, 2, 143–156.
(3) Stauffer A.L. & Brooks R.P. (1997) Plant and soil responses to salvaged marsh surface and organic matter amendments at a created wetland in central Pennsylvania. Wetlands, 17, 90–105.
(4) Moore H.H., Niering W.A., Marsicano L.J. & Dowdell M. (1999) Vegetation change in created emergent wetlands (1988–1996) in Connecticut (USA). Wetlands Ecology and Management, 7, 177–191.
(5) Combroux I.C.S., Bornette G. & Amoros C. (2002) Plant regenerative strategies after a major disturbance: the case of a riverine wetland restoration. Wetlands, 22, 234–246.
(6) McKinstry M.C. & Anderson S.H. (2005) Salvaged-wetland soil as a technique to improve aquatic vegetation at created wetlands in Wyoming, USA. Wetlands Ecology and Management, 13, 499–508.
(7) Booth V. & Ausden M. (2009) The invertebrate population of a created reedbed after seven years: Lakenheath Fen RSPB reserve, Suffolk, England. Conservation Evidence, 6, 105–110.
(8) Miller R.L. & Fujii R. (2010) Plant community, primary productivity, and environmental conditions following wetland re-establishment in the Sacramento-San Joaquin Delta, California. Wetlands Ecology and Management, 18, 1–16.
(9) Hart T.M. & Davis S.E. III (2011) Wetland development in a previously mined landscape of East Texas, USA. Wetlands Ecology and Management, 19, 317–329.
(10) Fuselier L.C., Donarski D., Novacek J., Rastedt D. & Peyton C. (2012) Composition and biomass productivity of bryophyte assemblages in natural and restored marshes in the prairie pothole region of Northern Minnesota. Wetlands, 32, 1067–1078
(11) Beas B.J., Smith L.M., LaGrange T.G. & Stutheit R. (2013) Effects of sediment removal on vegetation communities in Rainwater Basin playa wetlands. Journal of Environmental Management, 128, 371–379.
(12) Beas B.J. & Smith L.M. (2014) Amphibian community responses to playa restoration in the Rainwater Basin. Wetlands, 34, 1247–1253.
(13) De Martis G., Mulas B., Malavasi V. & Marignani M. (2016) Can artificial ecosystems enhance local biodiversity? The case of a constructed wetland in a Mediterranean urban context. Environmental Management, 57, 1088–1097.
12.9.2 Reprofile/relandscape: brackish/salt marshes
Nine studies evaluated the effects, on vegetation, of reprofiling/relandscaping to restore or create brackish/salt marshes. Seven studies were in the USA1–6,8. One was in Belgium7. One was in Italy9. Two of the studies2,3 were based on the same marsh.
VEGETATION COMMUNITY
Overall extent (2 studies): One paired, site comparison study in an estuary in the USA1 reported that vegetation coverage on reprofiled sediment, after 2–3 years, did not clearly differ from natural

12. Habitat restoration and creation
361
marsh areas in two of three comparisons. One replicated, paired, site comparison study in the USA6 reported that reprofiled coastal areas, where submerged sediment had been pushed into ridges, contained a smaller proportion of salt marsh habitat than nearby natural areas.
Overall richness/diversity (2 studies): Two studies in Belgium7 and Italy9 simply quantified plant species richness in marshy areas that had been reprofiled or excavated (sometimes9 along with other interventions), for up to 23 years after intervention began.
Characteristic plant richness/diversity (1 study): One study in an estuary in the USA8 simply reported the number of salt marsh plant species that colonized an area of reprofiled sediment over seven years.
VEGETATION ABUNDANCE
Overall abundance (2 studies): One site comparison study of salt marshes in the USA5 reported that a marsh created by reprofiling sediment (along with other interventions, including planting) had lower overall vegetation cover than a nearby natural marsh, after three growing seasons. One study in an estuary in Belgium7 simply quantified the cover of vegetation that colonized an area of reprofiled sediment over five years.
Individual species abundance (6 studies): Six studies1–5,7 quantified the effect of this intervention on the abundance of individual plant species. Of four site comparison studies in the USA, three1,2,5 reported that the dominant herb species was typically less abundant – in terms of cover1,5 or biomass2 – in marshes that had been reprofiled (sometimes2,5 along with other interventions) than in natural areas, after 2–5 years. The other study3 reported that density of the dominant herb species in a reprofiled (and planted) marsh was within the range of nearby natural marshes, after five years. Two studies in the USA4 and Belgium7 simply quantified cover of individual plant species over five years after reprofiling (sometimes4 along with other interventions).
VEGETATION STRUCTURE
Overall structure (1 study): One replicated, paired, site comparison study in the USA6 found that the layout of salt marsh habitat (e.g. patch size and complexity) differed between reprofiled coastal areas, where submerged sediment had been pushed into ridges, and nearby natural areas.
Height (1 study): One site comparison study in the USA3 reported that California cordgrass Spartina foliosa was shorter in a 5-year-old reprofiled marsh (also planted with cordgrass) than in nearby natural marshes.
A paired, site comparison study in 1981 in four brackish and salt marshes in Texas, USA (1) reported mixed recovery of vegetation cover in reprofiled areas, relative to natural areas, after 2–3 years. Unless specified, statistical significance was not assessed. The density and cover of 1–2 dominant grass/succulent species was reported for each marsh (see original paper for data). The density of these species was statistically similar in reprofiled and natural areas in four of seven comparisons, lower in the reprofiled area in two comparisons and higher in the reprofiled area in the other comparison. Their cover was lower in reprofiled areas in four of seven comparisons, higher in two comparisons and similar in reprofiled and natural areas in the other comparison. Overall vegetation coverage was reported for three of the four marshes. There was no clear difference between reprofiled and natural areas in two of three comparisons (reprofiled: 50–85%; natural: 50–85%) but lower coverage in the reprofiled area in the other comparison (reprofiled: 75%; natural: 95%). Methods: In spring 1981, vegetation was surveyed in 25 x 25 cm plots (number not reported), randomly placed in reprofiled and natural (undisturbed) areas of four marshes. Excess sediment had been deposited on parts of each marsh during construction

12. Habitat restoration and creation
362
activities. Two to three years before surveying, this sediment was removed (and any depressions filled) to return these areas to their natural elevation.
A site comparison study in 1989 of two estuarine salt marshes in California, USA (2) found that a marsh created by reprofiling, planting California cordgrass Spartina foliosa and fertilizing contained less cordgrass biomass, after 4–5 years, than an adjacent natural marsh. The created marsh contained 192 g/m2 above-ground California cordgrass biomass: significantly lower than the 454 g/m2 in the natural marsh. Methods: In July 1989, California cordgrass was cut from 9–12 quadrats at a similar elevation in the two marshes, then dried and weighed. One marsh (same marsh as in Study 3) had been created by reprofiling into islands and creeks (autumn 1984), planting California cordgrass along creek banks (March 1985) and fertilizing with urea (25 g/m2; four times 1985–1986). This study evaluates the combined effect of these interventions on any non-planted cordgrass. A nearby natural marsh, exposed to similar tides, was chosen for comparison.
A site comparison study in 1989 of four estuarine salt marshes in California, USA (3) found that a marsh created by reprofiling, planting California cordgrass Spartina foliosa and fertilizing supported a similar cordgrass density to adjacent natural marshes, but with shorter plants. Statistical significance was not assessed. Five years after reprofiling, four of four transects in the created marsh supported a cordgrass density (133–173 stems/m2) within the range of nearby natural marshes (73–193 stems/m2). However, cordgrass was shorter in the created than natural marshes, with a greater proportion of stems in shorter height classes (see original paper for data). Methods: In September 1989, California cordgrass was surveyed in 0.1-m2 quadrats. Twelve quadrats (four transects) were surveyed in a created marsh (reprofiled into islands and creeks in 1984, planted with California cordgrass in 1985, fertilized with urea in 1985–1986; same marsh as in Study 2). This study evaluates the combined effect of these interventions on any non-planted cordgrass. Fifty-four quadrats (seven transects) were surveyed in three nearby natural marshes.
A replicated study in 1989–1991 in an estuary in California, USA (4) reported that after excavating a salt marsh and planting California cordgrass Spartina foliosa, there were increases in California cordgrass density and biomass. Statistical significance was not assessed. After one growing season, there were 25 cordgrass stems/m2 and 60 g/m2 dry above-ground biomass. After two growing seasons, there were 50 cordgrass stems/m2 and 220 g/m2 dry above-ground biomass. Methods: Between 1989 and March 1990, dredge spoil that had been deposited in San Diego Bay was excavated to elevations suitable for California cordgrass. In March 1990, California cordgrass was planted into four 5-m2 plots in the marsh (ten 4-L pots of cordgrass/plot). None of these four plots received any additional treatment. California cordgrass stems were counted and measured until October 1991. Note that this study does not distinguish between the effects of excavation and planting on any non-planted cordgrass.
A site comparison study in 1998–2002 of two salt marshes in California, USA (5) reported that a reprofiled, planted and fenced marsh had lower vegetation cover than a nearby natural marsh after three growing seasons, but that both marshes were dominated by pickleweed Salicornia virginica. Statistical significance was not assessed. After three growing seasons, the created marsh had 62% total vegetation cover (compared to 87% in a nearby natural marsh). The most abundant species in both marshes was pickleweed (created: 39%; natural: 62% cover). Four plant species colonized plots where they had not been planted. In these plots, pickleweed cover was

12. Habitat restoration and creation
363
23–27%. Where they colonized, the other species had <1% cover. Methods: In autumn 1997, an upland area was reprofiled to form an intertidal mudflat. In March 1998, rooted cuttings of four salt marsh herb/succulent species were planted into fifty-five 4-m2 plots around the edge of the mudflat (25–81 plants/plot; combinations of 1 or 2 species/plot). After one growing season, the plots were protected with rabbit-proof fencing. Debris and colonizing vegetation were regularly removed during the first two growing seasons, but left in place thereafter. The study does not distinguish between the effects of reprofiling, planting and fencing on the non-planted vegetation. Total vegetation cover was measured in 0.25-m2 quadrats: in the created marsh (1 quadrat/plot/year until October 2000) and a nearby natural marsh of similar elevation (10 quadrats in July 1999).
A replicated, paired, site comparison study in 2004 in two salt marshes in Texas, USA (6) found that relandscaped plots, where sediment had been pushed into ridges, contained less and more patchy marsh habitat than natural reference plots. Relandscaped plots contained less marsh habitat (low marsh: 6–7%; high marsh: <1–3%) than natural areas (low marsh: 27–37%; high marsh: <1–10%). Accordingly, relandscaped plots contained more open water (76–91%) than natural areas (20–53%). Five of seven landscape structural metrics also significantly differed between relandscaped and natural plots. Relandscaped plots were dominated by multiple small patches of low marsh with relatively complex outlines, whereas natural plots contained fewer, larger, clumped patches of low marsh with relatively simple outlines (see original paper for data). Methods: Vegetation was mapped from aerial photographs taken in 2004 (ground-truthed in May 2005). Vegetation was compared in three pairs of 4-ha plots/marsh. In each pair, one plot contained reprofiled marsh (submerged sediment pushed into ridges, in a grid pattern or arcs; date of intervention not clearly reported). The other contained natural, undisturbed marsh.
A study in 1999–2007 aiming to create a salt marsh in an estuary in Belgium (7) reported that an area cleared and reprofiled to allow tidal inundation was colonized by vegetation, including salt marsh species, within one year. Immediately after reprofiling the area was bare sediment. After one year, the site had 16% total vegetation cover and 5 plant species/4 m2. After five years, the site had 75% total vegetation cover, with 10 plant species/4 m2 and a total of 119 plant species across the site. The most abundant species were annual seablite Suaeda maritima (20% cover) and glasswort Salicornia europaea (8% cover). Between one and five years after reprofiling, the plant community composition changed significantly, especially in higher areas flooded less often (data reported as a turnover index). Methods: Between 1999 and 2002, a site on the edge of an estuary was reprofiled to facilitate tidal inundation. Buildings and fill material were removed to create a slope with varying flooding frequencies. Plant species and their cover were recorded in 2003, 2005 and 2007 in 119 permanent 4-m2 quadrats, placed along transects perpendicular to the shoreline.
A study in 2003–2010 aiming to restore a salt marsh in an estuary in Florida, USA (8) reported than an area where excess fill material was removed to restore tidal influx was colonized by salt marsh plants within one year. After one year, 18 plant species “appropriate for salt marsh habitats” had colonized the reprofiled sediment. These included smooth cordgrass Spartina alterniflora, annual seablite Suaeda linearis and three species of mangrove tree. After seven years, 27 salt marsh plant species were present. A “few” upland species were also recorded, but not Brazilian pepper Schinus terebinthifolius that dominated the site prior to relandscaping. Methods: In

12. Habitat restoration and creation
364
2003, excess material (sand/shell mix from a historic dredging operation) was removed from the surface of a former salt marsh. The elevation was restored to within the range of adjacent healthy marshes. Plant species present were recorded one and seven years after relandscaping.
A study in 2005–2013 of an excavated, planted and harvested water treatment marsh in Sardinia, Italy (9) reported that it supported 275 plant taxa. This included 201 plant species in 161 genera. Approximately 63% of the taxa were Mediterranean (found predominantly or solely in this region) and approximately 16% were known non-natives in Italy. As expected in the study area, 56% of the taxa were annual plants that complete their life cycle rapidly in favourable conditions (“thereophytes”). Only 2% of taxa had underwater resting buds (“hydrophytes”). Methods: Between 2005 and 2013, plant taxa were recorded in the 37-ha EcoSistema Filtro marsh, which had been constructed with the dual aims of habitat creation and water treatment. There were monthly surveys (a) across the whole site, including banks and upland areas, and (b) in three 16-m2 plots, each April–July and September–December. The wetland had been constructed by excavating basins of varying salinity and levees (including removal of all existing vegetation; beginning 1990) and planting bundles of 2-m-tall common reed Phragmites australis (2004). Some “plant biomass” was mechanically removed between 2005 and 2007. Note that this study evaluates the combined effect of these interventions, and does not separate results from fresh, brackish and saline areas.
(1) Pitre R.L. & Anthamatten F. (1981) Successful restoration of filled wetlands at four locations along the Texas Gulf Coast. Wetlands, 1, 171–177.
(2) Langis R., Zalejko M. & Zedler J.B. (1991) Nitrogen assessments in a constructed and natural salt marsh of San Diego Bay. Ecological Applications, 1, 40–51.
(3) Zedler J.B. (1993) Canopy architecture of natural and planted cordgrass marshes: selecting habitat evaluation criteria. Ecological Applications, 3, 123–138.
(4) Gibson K.D., Zedler J.B. & Langis R. (1994) Limited response of cordgrass (Spartina foliosa) to soil amendments in a constructed marsh. Ecological Applications, 4, 757–767.
(5) Armitage A.R., Boyer K.E., Vance R.R. & Ambrose R.F. (2006) Restoring assemblages of salt marsh halophytes in the presence of a rapidly colonizing dominant species. Wetlands, 26, 667–676.
(6) Feagin R.A. & Wu X.B. (2006) Spatial pattern and edge characteristics in restored terrace versus reference salt marshes in Galveston Bay. Wetlands, 26, 1004–1011.
(7) Pétillon J., Erfanzadeh R., Garbutt A., Maelfait J.-P. & Hoffmann M. (2010) Inundation frequency determines the post-pioneer successional pathway in a newly created salt marsh. Wetlands, 30, 1097–1105.
(8) Taylor D.S. (2012) Removing the sands (sins?) of our past: dredge spoil removal and saltmarsh restoration along the Indian River Lagoon, Florida (USA). Wetlands Ecology and Management, 20, 213–218.
(9) De Martis G., Mulas B., Malavasi V. & Marignani M. (2016) Can artificial ecosystems enhance local biodiversity? The case of a constructed wetland in a Mediterranean urban context. Environmental Management, 57, 1088–1097.
12.9.3 Reprofile/relandscape: freshwater swamps
Two studies evaluated the effects, on vegetation, of reprofiling or relandscaping to restore or create freshwater swamps. Both studies were in the USA.
VEGETATION COMMUNITY
Community composition (1 study): One replicated, site comparison study in the USA2 found that swamps created by reprofiling uplands (along with planting trees/shrubs) contained a similar proportion of tree species in different plant groups, after 7–11 years, to nearby swamps recovering naturally from logging.

12. Habitat restoration and creation
365
VEGETATION ABUNDANCE
Overall abundance (1 study): One replicated, site comparison study in the USA2 found that swamps created by reprofiling uplands (along with planting trees/shrubs) had similar ground and canopy cover, after 7–11 years, to nearby swamps recovering naturally from logging.
Herb abundance (1 study): One study in a former firing range in the USA1 simply quantified herb cover approximately 1–2 years after reprofiling the site (and planting trees/shrubs).
Tree/shrub abundance (1 study): One study in a former firing range in the USA1 simply quantified woody plant cover approximately 1–2 years after reprofiling the site (and planting trees/shrubs).
VEGETATION STRUCTURE
Visual obstruction (1 study): One replicated, site comparison study in the USA2 found that swamps created by reprofiling uplands (along with planting trees/shrubs) had less horizontal vegetation cover, after 7–11 years, than nearby swamps recovering naturally from logging.
Height (1 study): The same study2 found that swamps created by reprofiling uplands (along with planting trees/shrubs) contained shorter woody vegetation, after 7–11 years, than nearby swamps recovering naturally from logging. Herbaceous vegetation, however, was of similar height in both created and naturally recovering swamps.
Basal area (1 study): The same study2 found that swamps created by reprofiling uplands (along with planting trees/shrubs) had a lower vegetation basal area, after 7–11 years, than nearby swamps recovering naturally from logging.
A study in 1994–1995 aiming to create a freshwater swamp in Maryland, USA (1) reported that approximately 1–2 years after reprofiling and planting trees/shrubs, the site contained mostly herbaceous vegetation. The created wetland had 67–69% grass cover, 17–19% cover of other herbs, and 1% cover of woody plants. Methods: In winter 1993/1994, around 5.5 ha of a former firing range was reprofiled to wetland elevations. In spring/summer 1994, a mixture of tree and shrub species (6,327 individuals) were planted into the reprofiled site. Vegetation was surveyed in August 1994 and 1995. Cover of all plant species was recorded in 120 quadrats, each 1 m2. The study does not distinguish between the effect of reprofiling and planting on non-planted vegetation.
A replicated, site comparison study in 2000 of 11 freshwater swamps in Virginia, USA (2) found that created swamps – reprofiled then planted with trees/shrubs – had a similar proportion of habitat-characteristic vegetation and similar horizontal vegetation cover to similar-aged swamps recovering naturally from logging, but contained shorter woody vegetation with a lower basal area and density. After 7–11 years, created and naturally recovering swamps contained statistically similar proportions of tree species characteristic of four soil moisture classes (from “highly saturated” to “partially saturated”), had statistically similar vegetation cover (both ground and canopy) and contained herbs of statistically similar height (data not reported). However, woody vegetation in created swamps was shorter (created: 2.0 m; natural: 4.4 m) and had a lower basal area (created: 59 cm2/100 m2; natural: 519 cm2/100 m2). Finally, created swamps had lower horizontal vegetation cover, both 1 m and 2 m above the ground (created: 26–45%; natural: 83–92%). Methods: In summer 2000, vegetation was surveyed in 11 swamps of similar age, water level and surrounding land use. Six swamps had been created by reprofiling upland sites to increase soil moisture, then planting a mix of wetland trees/shrubs (and in one case, adding wetland soil). The study does not distinguish between the effects of these interventions on non-planted vegetation. Five swamps were recovering naturally after clearcut logging.

12. Habitat restoration and creation
366
(1) Perry M.C., Sibrel C.B. & Gough G.A. (1996) Wetlands mitigation: partnership between an electric power company and a federal wildlife refuge. Environmental Management, 20, 933–939.
(2) Snell-Rood E.C. & Cristol D.A. (2003) Avian communities of created and natural wetlands: bottomland forests in Virginia. The Condor, 105, 303–315.
12.9.4 Reprofile/relandscape: brackish/saline swamps
Five studies evaluated the effects, on vegetation, of reprofiling/relandscaping to restore or create brackish/saline swamps. Three studies were in the USA1,3,4. Two of these1,3 shared a study site. There was one study in Singapore2 and one in Thailand5.
VEGETATION COMMUNITY
Overall extent (1 study): One study of a coastal site in the USA3 reported that the area of mangrove vegetation increased between 6 and 14 years after reprofiling (and planting propagules).
Relative abundance (2 studies): Two site comparison studies in the USA1 and Singapore2 reported that areas of reprofiled coastal land (sometimes1 also planted with propagules) supported a different relative abundance of tree species to natural forests, after roughly 3–15 years.
Overall richness/diversity (1 study): One site comparison study in Singapore2 reported that an area of reprofiled coastal land colonized by mangrove vegetation had higher plant species richness, after three and a half years, than an adjacent mature mangrove patch.
Tree/shrub richness/diversity (3 studies): Two replicated, site comparison studies in the USA1,4, reported that where mangrove forests developed on reprofiled (and planted) sites, they contained a similar number of tree species to nearby mature forests after 7–30 years. One study in a former shrimp pond in Thailand5 simply reported the number of mangrove tree species that spontaneously colonized in the six years after reprofiling (along with other interventions).
VEGETATION ABUNDANCE
Overall abundance (1 study): One site comparison study in Singapore2 reported that an area of reprofiled coastal land colonized by mangrove vegetation had a higher density of individual plants, after three and a half years, than an adjacent mature mangrove patch.
Tree/shrub abundance (3 studies): Two replicated, site comparison studies in the USA1,4, reported that where mangrove forests developed on reprofiled (and planted) sites, they contained a greater density of trees than nearby mature forests after 17–30 years. One study in a former shrimp pond in Thailand5 simply reported the number of mangrove trees that spontaneously colonized in the six years after reprofiling (along with other interventions).
Individual species abundance (1 study): One study in a former shrimp pond in Thailand5 reported the number of mangrove trees, by species, that spontaneously colonized in the six years after reprofiling (along with other interventions).
VEGETATION STRUCTURE
Overall structure (1 study): One replicated, site comparison study in the USA4 reported that where mangrove forests developed on reprofiled (and planted) sites, they had a different overall structure to nearby mature forests after 17–30 years.
Height (2 studies): One replicated, site comparison study in the USA4, reported that where mangrove forests developed on reprofiled (and planted) sites, they had a shorter canopy than nearby mature forests after 17–30 years. One site comparison study in Singapore2 reported that in an area of reprofiled coastal land colonized by mangrove vegetation, most plants were in a similar height category to those in an adjacent mature mangrove patch, but that the maximum plant height was lower. Vegetation was surveyed three and a half years after reprofiling.

12. Habitat restoration and creation
367
Diameter/perimeter/area (2 studies): Two site comparison studies in the USA1,3 reported that mangrove forests that developed on reprofiled (and planted) coastal areas contained thinner trees, on average, than mature natural forests, after 7–18 years.
Basal area (3 studies): Three site comparison studies in the USA1,3,4 compared mangrove forests that developed on reprofiled (and planted) coastal areas to mature natural forests. Two of the studies1,3 reported that restored forests had a smaller basal area than mature natural forests, after 7–18 years. The other study4 reported that restored forests had a similar basal area to mature natural forests, after 17–30 years.
A replicated, paired, site comparison study in 1996–1997 involving two reprofiled sites (also planted with mangrove propagules) in Florida, USA (1) reported that they supported a different tree density, structure and community to mature natural mangrove forests after 7–15 years. Statistical significance was not assessed. Restored sites contained 6,830–27,700 trees/ha (vs natural: only 1,840–2,131 trees/ha) but had a basal area of only 3–18 m2/ha (vs natural: 26–28 m2/ha). Accordingly, trees in restored sites were all <10 cm in diameter (average: 2.1–2.7 cm) whereas natural sites contained trees both <10 cm and ≥10 cm in diameter. Restored sites contained two or three tree species (vs natural: three), but in different proportions (e.g. 48–75% of trees in restored sites were white mangrove Laguncularia racemosa, vs natural: 17–26%; similar pattern for relative density, dominance and importance). Methods: Between November 1996 and December 1997, trees were surveyed in two pairs of restored and natural mangrove forests. Restoration, completed in 1982 or 1990, involved removing previously dumped sediment and excavating tidal channels, then planting red mangrove propagules. The study does not distinguish between the effects, on non-planted trees, of reprofiling and planting. Trees ≥2 m tall and ≥2 cm in diameter were recorded at 21 points/site. One pair of sites in this study was also used in (3).
A site comparison study in the early 1990s on the coast of Singapore (2) reported that an area reprofiled to the same elevation as a neighbouring remnant mangrove forest was colonized by mangrove vegetation within 42 months, but with greater plant species richness and fewer, shorter plants than the remnant mangrove. Statistical significance was not assessed. After 42 months, the reprofiled area contained 9 plant species and 241 individual plants along an 80-m2 transect (vs natural: 7 species and 487 individuals). Most plants in the reprofiled area were ≤2 m tall (75%) and the tallest were ≤6 m. In the remnant mangrove, most plants were also <2 m tall (77%) but some were >8 m. The reprofiled area was dominated numerically by smallflower bruguiera Bruguiera parviflora (50% of individuals, but mostly saplings) whereas the remnant mangrove was dominated numerically by Avicennia alba (67% of individuals, but mostly saplings). Methods: In 1988, a 1-ha plot between a remnant patch of mangrove forest and a tidal river was reprofiled to allow tidal inundation around 40–50 times/month (as in the remnant mangrove). Forty-two months later, vegetation was surveyed along a 2 x 40 m transect in the reprofiled plot and the remnant mangrove. All individual plants were identified and measured.
A site comparison study in 1989–2000 in Florida, USA (3) reported that after reprofiling a coastal site (and planting mangrove propagules) mangrove forest stands developed, but that these contained more trees with a greater basal area than natural forest after 18 years. Tall mangrove stands occupied 74% of the restored area after six years, then 95% after 14 years. Two of three mangrove species present in nearby natural forest had colonized the restored site: black mangrove Avicennia germinans

12. Habitat restoration and creation
368
and white mangrove Laguncularia racemosa. Overall, trees in the restored site were thinner (restored: 3 cm; natural: 13 cm diameter) but had a greater basal area (restored: 43 m2/ha; natural: 16–19 m2/ha). Statistical significance was not assessed. Methods: Between 1989 and 2000, vegetation was surveyed in a restored area and adjacent natural mangrove. Restoration, in the early 1980s, involved removing previously dumped sediment and excavating a tidal channel, then planting red mangrove propagules. The study does not distinguish between the effects, on non-planted trees, of reprofiling and planting. Surveys involved taking aerial photographs to estimate overall mangrove area, and counting/measuring trees within 25-m2 plots or 1-m2 quadrats (see original paper for details). This study monitored one of the sites from (1).
A replicated, site comparison study in 2005 in Florida, USA (4) reported that 12 of 17 mangrove creation/restoration sites (all reprofiled, along with other interventions) contained mangrove forests after 17–30 years – but that these differed from mature natural forests in overall complexity, tree density and canopy height. Statistical significance was not assessed. After 17–30 years, mangrove forests had developed in 12 of the 17 sites. Mangrove forests had not persisted in four sites and been deliberately removed from one. Nine of the sites that developed forests were surveyed in detail. The created/restored forests had a different overall structure to natural forests (data reported as a complexity index and graphical analysis). Created/restored forests contained 16,370 trees/ha on average (vs natural: only 6,594 trees/ha) and had a canopy height of only 3.7 m (vs natural: 6.4 m). Both created/restored and natural forests had a similar average basal area (28–31 m2/ha, and contained 1–3 tree species. Methods: In 2005, vegetation was surveyed in 17 sites (three 2 x 2 m plots/site). Between 1975 and 1987, all of these sites had been reprofiled to appropriate elevations for mangroves. All but one had also been planted with red mangrove Rhizophora mangle seedlings or propagules, and some (precise number not reported) had been planted with smooth cordgrass Spartina alterniflora. The study does not distinguish between the effects, on unplanted trees, of reprofiling, planting mangroves and planting cordgrass. Comparisons were made with previously published data from seven nearby natural forests.
A study in 1999–2005 in a former shrimp pond in Thailand (5) reported that six years after reprofiling (along with restoring tidal exchange and planting mangrove seedlings), 1,797 unplanted trees of 15 different species were present. The most abundant species were grey mangrove Avicennia marina (842 trees), Bruguiera cylindrica (486 trees) and Ceriops decandra (267 trees). Four species were represented by a single tree. Methods: In June 1999, an abandoned 6,525-m2 shrimp pond was filled in, and tidal exchange was restored by levelling the banks. In September 1999, seedlings of four mangrove species were planted in the pond (500–800 seedlings/species, 1.5 m apart). The study does not distinguish between the effects, on naturally colonizing vegetation, of reprofiling, restoring tidal exchange and planting. In October 2005, mangrove trees that had spontaneously colonized were recorded in a 300-m2 section of the site.
(1) McKee K.L. & Faulkner P.L. (2000) Restoration of biogeochemical function in mangrove forests. Restoration Ecology, 8, 247–259.
(2) Lee S.K., Tan W.H. & Havanond S. (1996) Regeneration and colonisation of mangrove on clay-filled reclaimed land in Singapore. Hydrobiologia, 319, 23–35.
(3) Proffitt C.E. & Devlin D.J. (2005) Long-term growth and succession in restored and natural mangrove forests in southwestern Florida. Wetlands Ecology and Management, 13, 531–551.
(4) Shafer D.J. & Roberts T.H. (2008) Long-term development of tidal mitigation wetlands in Florida. Wetlands Ecology and Management, 16, 23–31.

12. Habitat restoration and creation
369
(5) Matsui N., Suekuni J., Nogami M., Havanond S. & Salikul P. (2010) Mangrove rehabilitation dynamics and soil organic carbon changes as a result of full hydraulic restoration and re-grading of a previously intensively managed shrimp pond. Wetlands Ecology and Management, 18, 233–242.
12.10 Create mounds or hollows
Background
This intervention involves creating discrete mounds (e.g. by adding blocks of soil, bundles of sticks, other coarse woody debris) or hollows (e.g. by excavation) to provide suitable conditions for emergent wetland vegetation. The scale of this intervention falls somewhere between reprofiling/relandscaping (large-scale landscape features, tens of metres wide; Section 12.9) and disturbing the soil/ sediment surface (which may create small scale mounds or hollows, millimetres or a few centimetres wide/deep; Section 12.13).
Often, this intervention aims to mimic the natural microtopography of marshes or swamps, which can be created by sediment accumulation, erosion, tree fall, root growth or animal activity (Vivian-Smith 1997, Bruland & Richardson 2005). Microtopography can increase plant diversity, because the different microclimates or microelevations may support different species (Vivian-Smith 1997). Depressions might provide sheltered and moist microclimates, in which the first colonizing plants can become established. Large woody debris will also release nutrients as it decomposes.
Studies that simply compare vegetation on mounds vs hollows (e.g. Bruland & Richardson 2005) have not been summarized as evidence here, even if those mounds and hollows were deliberately created.
Related interventions: Reprofile/relandscape larger areas (12.9); Disturb soil/sediment surface without creating discrete mounds and/or hollows (12.13); Create mounds or hollows before planting (13.7).
Bruland G.L. & Richardson C.J. (2005) Hydrologic, edaphic, and vegetative responses to microtopographic reestablishment in a restored wetland. Restoration Ecology, 13, 515–523.
Vivian-Smith G. (1997) Microtopographic heterogeneity and floristic diversity in experimental wetland communities. Journal of Ecology, 85, 71–82.
12.10.1 Create mounds or hollows: freshwater marshes
We found no studies that evaluated the effects, on vegetation, of creating mounds or hollows in freshwater marshes.
This means that we have not yet found any studies that have directly evaluated this intervention during our systematic journal and report searches. Therefore we have no evidence to indicate whether or not the intervention has any desirable or harmful effects.
12.10.2 Create mounds or hollows: brackish/salt marshes
We found no studies that evaluated the effects, on vegetation, of creating mounds or hollows in brackish/salt marshes.
This means that we have not yet found any studies that have directly evaluated this intervention during our systematic journal and report searches. Therefore we have no evidence to indicate whether or not the intervention has any desirable or harmful effects.

12. Habitat restoration and creation
370
12.10.3 Create mounds or hollows: freshwater swamps
We found no studies that evaluated the effects, on vegetation, of creating mounds or hollows in freshwater swamps.
This means that we have not yet found any studies that have directly evaluated this intervention during our systematic journal and report searches. Therefore we have no evidence to indicate whether or not the intervention has any desirable or harmful effects.
12.10.4 Create mounds or hollows: brackish/saline swamps
One study evaluated the effects, on vegetation, of creating mounds or hollows in brackish/saline swamps. The study was in Indonesia.
VEGETATION COMMUNITY
VEGETATION ABUNDANCE
Tree/shrub abundance (1 study): One study in Indonesia1 simply reported the number of mangrove tree seedlings that had colonized a pile of branches placed in a disused aquaculture pond, around seven months after depositing the branches (and releasing mangrove propagules).
VEGETATION STRUCTURE
A study in 2013–2014 in a disused aquaculture pond in South Sulawesi, Indonesia (1) reported that approximately seven months after depositing a mound of branches (and releasing mangrove propagules), the mound had been colonized by 29 mangrove tree seedlings. Methods: In November 2013, a 770-m2 pile of branches was added to a disused aquaculture pond to create a raised mound (extending above the range of elevations colonized by mangroves in other ponds). Walls within the wider pond system were breached to improve tidal exchange. In December 2013, >218,000 propagules (of >7 species) were added to the ponds at high tide. Seedlings growing in the pile of branches were counted in June 2014.
(1) Oh R.R.Y., Friess D.A. & Brown B.M. (2017) The role of surface elevation in the rehabilitation of abandoned aquaculture ponds to mangrove forests, Sulawesi, Indonesia. Ecological Engineering, 100, 325–334.
12.11 Remove surface soil/sediment
Background
Surface soil/sediment – and any vegetation on it – could be removed to create a new bare surface for plants to colonize. This new surface may have fewer nutrients and pollutants, have no undesirable seed bank, and have a looser surface. Soil/sediment removal can also make a site wetter, by bringing the surface closer to the water table, increasing the frequency/duration of tidal flooding, or increasing the water depth in an already flooded site. This intervention may be particularly useful in naturally dynamic habitats that have been artificially stabilized, mimicking disturbances that would create bare soil/sediment.
CAUTION: Heavy machinery is usually needed for this intervention. Heavy vehicles can churn and compress wetland soils (Campbell et al. 2002; see also Chapter 7). Stripping topsoil can have counter-intuitive effects, such as increasing ammonium concentrations

12. Habitat restoration and creation
371
because nitrifying bacteria, which break down ammonia, are removed with the soil (Dorland 2004). It may remove seeds of desirable species, and can be expensive.
Related interventions: Raise water level to restore degraded marshes or swamps (8.1); Raise water level to restore/create marshes or swamps from other land uses (12.4); Reprofile/relandscape (12.9); Bury surface soil/sediment (12.12); Disturb soil/sediment surface without removing material (12.13); Transplant or replace wetland soil (12.26); Remove surface soil/sediment before planting (13.8); interventions to control vegetation without removing soil/sediment (Chapter 9).
Campbell D.A., Cole C.A. & Brooks R.P. (2002) A comparison of created and natural wetlands in Pennsylvania, USA. Wetlands Ecology and Management, 10, 41–49.
Dorland E. (2004) Ecological restoration of wet heaths and matgrass swards: bottlenecks and solutions . PhD Thesis, Utrecht University, The Netherlands.
12.11.1 Remove surface soil/sediment: freshwater marshes
Six studies evaluated the effects, on vegetation, of removing surface soil/sediment to restore or create freshwater marshes. Four studies were in the USA2,4–6. One study was in the Netherlands1. One study was in Japan3.
VEGETATION COMMUNITY
Community composition (3 studies): Two replicated, site comparison studies in the USA5,6 reported that freshwater marshes being restored by removing excess soil/sediment (along with other interventions) typically contained a different overall plant community, after 1–12 years, to both degraded and natural marshes nearby. One replicated study of dune slacks in the Netherlands1 simply reported changes in the overall plant community composition over four years after stripping topsoil (along with other interventions).
Overall richness/diversity (4 studies): One replicated, site comparison study of dune slacks in the Netherlands1 reported that overall plant species richness was greater in restored slacks (topsoil stripped five years previously, along with other interventions) than in mature unmanaged slacks. One replicated, site comparison study in the USA5 reported that freshwater marshes being restored by removing topsoil (along with other interventions) contained fewer wetland plant species, after 1–12 years, than nearby natural marshes. Two studies (including one site comparison) in freshwater marshes in the USA2 and Japan3 reported that the effect of removing topsoil on overall plant species richness depended on the amount removed.
Characteristic plant richness/diversity (2 studies): One replicated, site comparison study of a floodplain marsh in Japan3 found that where stripped plots were colonized by plants within two growing seasons, they contained more wetland-characteristic species than an adjacent unstripped area. One replicated study of dune slacks in the Netherlands1 simply reported the number of characteristic plant species present over five years after stripping topsoil (along with other interventions).
VEGETATION ABUNDANCE
Overall abundance (3 studies): Three studies (two replicated) in the Netherlands1, the USA2 and Japan3 simply quantified the overall abundance of vegetation that colonized – within five years – freshwater wetlands stripped of topsoil (sometimes1 along with other interventions).
Characteristic plant abundance (2 studies): Two studies (one replicated) in freshwater marshes in the USA2 and Japan3 simply quantified the abundance of wetland-characteristic plant species that colonized – within five years – areas stripped of topsoil.
Individual species abundance (5 studies): Five studies1–4,6 quantified the effect of this intervention on the abundance of individual plant species. For example, one replicated, site comparison study

12. Habitat restoration and creation
372
in the USA6 found that pothole wetlands restored by removing excess sediment (sometimes along with planting herbs) had lower hybrid cattail Typha x glauca cover than unrestored wetlands after 2–7 years, and similar hybrid cattail cover to nearby natural wetlands. One replicated study of dune slacks in the Netherlands1 simply quantified the cover of individual species present over five years after stripping topsoil (along with other interventions). Only two species had >1% cover in any slack.
VEGETATION STRUCTURE
Overall structure (1 study): One study in a freshwater marsh in the USA2 reported that the effect of removing topsoil on the abundance of tall vegetation depended on the amount removed.
Visual obstruction (1 study): One replicated, site comparison study of pothole wetlands in the USA6 found that the effect of removing excess sediment (sometimes along with planting herbs) on horizontal vegetation cover, 2–7 years later, depended on the elevation/vegetation zone.
Height (1 study): One site comparison study in the USA4 reported that sedge tussocks were shorter in a wet meadow restored by removing excess sediment (along with other interventions, including planting sedges) than in nearby natural meadows, after 11–14 years.
Diameter/perimeter/area (1 study): One site comparison study in the USA4 reported that sedge tussocks had a smaller perimeter in a wet meadow restored by removing excess sediment (along with other interventions, including planting sedges) than in natural meadows, after 11–14 years.
Basal area (1 study): One site comparison study in the USA4 reported that the basal area of sedge tussocks was smaller in a wet meadow restored by removing excess sediment (along with other interventions, including planting sedges) than in nearby natural meadows, after 11–14 years.
A replicated, site comparison study in 1993–1998 involving 12 dune slacks in the Netherlands (1) reported that slacks where topsoil was removed (along with stopping groundwater extraction and reintroducing grazers) developed plant communities with characteristic wetland species and more plant species than mature, unmanaged slacks. Statistical significance was not assessed. Restored slacks developed plant communities, the overall composition of which changed over time (data reported as a graphical analysis). After five years, restored slacks contained 76–108 plant species overall and 48–86 species/100 m2. This included species characteristic of dune slacks (5–11 species/100 m2) and nutrient-rich marshes (2–11 species/100 m2) alongside other wetland and upland species. In each slack, total vegetation cover was always <50% and only two individual species – creeping willow Salix repens and bushgrass Calamagrostis epigejos – ever had cover >1%. For comparison, during the second year of the study, mature slacks contained 12–39 plant species/m2 (data not reported for other outcomes). Methods: Dune slacks are low-lying areas amongst dunes. Eight degraded slacks (stabilized and covered with undesirable, mature vegetation) were restored. In summer 1993, vegetation and topsoil were removed (10–40 cm depth, across all or part of each slack). Earlier that year, groundwater extraction had been stopped. In 1995, grazers (a “small herd” of cattle and ponies) were reintroduced to seven slacks. The study does not distinguish between the effects of these interventions. Vegetation was surveyed in at least five of the restored slacks (spring or summer 1994–1998) and four mature slacks (spring 1994): species across the whole of each slack; species and cover in five comparable 100-m2 plots/slack.
A study in 1989–1994 in a freshwater marsh in Florida, USA (2) reported that areas where topsoil was removed were colonized by vegetation, with species richness and the amount of tall/shrubby vegetation depending on the amount of topsoil removed. After approximately 54 months, an area where topsoil had been completely removed contained 32 plant species/100 m2, 243% total vegetation cover and 79%

12. Habitat restoration and creation
373
cover of wetland-characteristic plants. The formerly-dominant shrub Brazilian pepper Schinus terebinthifolius occurred in only 4% of survey plots. Less than 1% of total cover was plants >2 m tall. An area where topsoil had been partially removed contained 20 plant species/100 m2, 245% total vegetation cover and 81% cover of wetland-characteristic plants. Brazilian pepper occurred in 86% of survey plots. Approximately 10% of total cover was plants >2 m tall. Results were similar 30–42 months after soil removal, although there was some variation in the first 6–18 months (see original paper). Methods: In early 1989, topsoil and vegetation were removed from a marsh that had been farmed and then became overgrown with Brazilian pepper. Topsoil was completely removed (down to bedrock) from 18 ha and partially removed (“thin layer” remaining) from an adjacent 6 ha. Plant species and cover were recorded each August between 1989 and 1994, in fourteen or forty-nine 100-m2 plots/area/year.
A replicated, site comparison study in 2007–2008 in an overgrown floodplain wetland in central Japan (3) found that some plots stripped of topsoil and vegetation were colonized by new marsh vegetation, and that these plots contained more plant species over two growing seasons than adjacent unstripped land. Unless specified, results summarized for this study are not based on assessments of statistical significance. Vegetation colonized shallow-stripped plots (flooded 22–57 days/year) but not deeper stripped plots (flooded 215 days/year). Over the first two growing seasons, the stripped plots contained more plant species (102) than adjacent unstripped land (66). Sixty-five species only occurred in the stripped plots. The stripped plots also contained more plant species characteristic of wetlands/wet disturbed floodplains (stripped: 37; unstripped: 8), but a statistically similar number of alien plant species (stripped: 9; unstripped: 3). After two growing seasons, the shallow-stripped plots contained 0.7–11.1 plant species/m2 (including 0.3–2.2 wetland-characteristic), 7–167 plants/m2 (including 0.8–11.3 wetland-characteristic) and <5–33% vegetation cover. Invasive goldenrod Solidago altissima was absent from all stripped plots. Methods: In spring 2007, topsoil and vegetation were removed from ten 70-m2 plots on a goldenrod-invaded floodplain (two plots for each of five stripping depths; 1.5–2.7 m of topsoil removed). Vascular plants were surveyed between spring and autumn 2007 and 2008. All species were recorded in the stripped plots, plus cover and density in nine 1-m2 quadrats/plot/survey. Species were also recorded along transects in unstripped land within 50 m of stripped plots.
A site comparison study in 2008 of five sedge meadows in Illinois and Wisconsin, USA (4) found that a meadow restored by removing excess sediment (and trees, then planting tussock sedge Carex stricta) – contained more but smaller sedge tussocks than nearby natural meadows after 11–14 years. In four of four comparisons, the restored meadow contained a greater density of sedge tussocks (8.4 tussocks/m2) than natural meadows (4.5–5.6 tussocks/m2). Sedge tussocks were also smaller in the restored meadow than in the natural meadows. This was true in four of four comparisons for height (restored: 5 cm; natural: 11–18 cm), perimeter (restored: 39 cm; natural: 51–82 cm) and volume (restored: 560 cm3; natural: 2,342–6,604 cm3). The basal area of tussocks in the restored meadow was only 0.07 m2/m2, compared to 0.12–0.23 m2/m2 in the natural meadows (statistical significance not assessed). Methods: In 2008, sedge tussocks were surveyed in one restored and four natural sedge meadows (15–30 quadrats/meadow, each 1 m2). The restored meadow was formerly a wooded floodplain. Trees and accumulated sediment were removed, then plugs of tussock sedge planted 30 cm apart, between 1994 and 1997. The study does not distinguish between the effects of these interventions on any non-planted sedges.

12. Habitat restoration and creation
374
A replicated, site comparison study around 2010 of 48 ephemeral freshwater marshes in Nebraska, USA (5) reported that marshes undergoing restoration (agricultural topsoil removed and surrounding cropland abandoned) contained a different plant community to natural marshes (surrounded by permanent grassland) and degraded marshes (surrounded by cropland), with lower cover of wetland perennial plants and fewer wetland perennial species than the natural marshes. Results summarized for this study are not based on assessments of statistical significance. After 1–12 years, the overall plant community composition differed between restored, natural and degraded marshes (data reported as a graphical analysis). Perennial wetland species were underrepresented in restored marshes (43% cover; 10.1 species/marsh) compared to natural marshes (56% cover/group; 13.0 species/marsh). However, restored marshes had greater cover of these species than degraded marshes (35% cover; richness not reported). Annual wetland species were “slightly” overrepresented in restored marshes compared to natural marshes in terms of abundance (data reported as a graphical analysis). However, there was a similar number of these species in restored and natural marshes (8.2 vs 8.0 species/marsh). Methods: Around 2010, vegetation was surveyed in 48 ephemeral playa marshes (along two transects crossing each marsh, in both the cool and warm seasons). Sixteen of the marshes were undergoing restoration under the Wetland Reserve Program. This involved removing eroded agricultural topsoil from the marshes and abandoning the surrounding cropland. The study does not distinguish between the effects of these interventions. Of the remaining marshes, 16 were in natural catchments and 16 were in degraded, farmed catchments.
A replicated, site comparison study in 2010 of 39 prairie pothole wetlands in North Dakota, USA (6) found that restoration by excavating excess sediment (and sometimes planting wetland herbs) reduced cover of hybrid cattail Typha x glauca, but that other effects on vegetation depended on the vegetation zone. Across both the marsh and wet meadow zones, restored potholes had lower hybrid cattail cover (6%) unrestored potholes (19%). In the marsh zone, the overall plant community composition significantly differed between restored and unrestored potholes (data reported as a graphical analysis). Restored potholes also had less horizontal vegetation cover (data not reported). In the wet meadow zone, neither the plant community composition nor horizontal vegetation cover significantly differed between restored and unrestored potholes. Compared to natural potholes, the restored potholes had a significantly different plant community in both zones and lower horizontal cover in the marsh zone, but similar horizontal cover in the wet meadow zone and similar hybrid cattail cover (natural: 5%). Methods: In summer 2010, vegetation was surveyed in the marsh (seasonally flooded) and wet meadow (occasionally flooded) zones of 39 prairie potholes (10 quadrats/zone/pothole). Thirty potholes were surrounded by former cropland, converted to perennial vegetation cover. Excess cropland sediment had been removed from 19 of these potholes, 2–7 years previously. Prairie cordgrass Spartina pectinata had also been planted in the wet meadow zone of some excavated potholes (number not reported). The study does not distinguish between the effects of sediment removal and planting on any non-planted vegetation in these potholes. The remaining nine potholes were “natural”, i.e. surrounded by land that had never been cultivated.
(1) Grootjans A.P., Everts H., Bruin K. & Fresco L. (2001) Restoration of wet dune slacks on the Dutch Wadden Sea islands: recolonization after large-scale sod cutting. Restoration Ecology, 9, 137–146.
(2) Dalrymple G.H., Doren R.F., O'Hare N.K., Norland M.R. & Armentano T.V. (2003) Plant colonization after complete and partial removal of disturbed soils for wetland restoration of former agricultural fields in Everglades National Park. Wetlands, 23, 1015–1029.

12. Habitat restoration and creation
375
(3) Ishii J., Hashimoto L. & Washitani I. (2011) 渡良瀬遊水地の湿地再生試験地における初期の植生発
達 (Early vegetation growth in an experimental restoration site in the Watarase wetland). Japanese Journal of Conservation Ecology, 16, 69–84.
(4) Lawrence B.A. & Zedler J.B. (2013) Carbon storage by Carex stricta tussocks: a restorable ecosystem service? Wetlands, 33, 483–493
(5) O'Connell J.L., Johnson L.A., Beas B.J., Smith L.M., McMurry S.T. & Haukos D.A. (2013) Predicting dispersal-limitation in plants: optimizing planting decisions for isolated wetland restoration in agricultural landscapes. Biological Conservation, 159, 343–354.
(6) Smith C., DeKeyser E.S., Dixon C., Kobiela B. & Little A. (2016) Effects of sediment removal on prairie pothole wetland plant communities in North Dakota. Natural Areas Journal, 36, 48–58.
12.11.2 Remove surface soil/sediment: brackish/salt marshes
One study evaluated the effects, on vegetation, of removing surface soil/sediment to restore or create brackish/salt marshes. The study was in the Netherlands.
VEGETATION COMMUNITY
Overall richness/diversity (1 study): One study in the Netherlands1 reported that 23 plant species colonized over two years after stripping topsoil from coastal farmland.
VEGETATION ABUNDANCE
Individual species abundance (1 study): One study in the Netherlands1 reported the frequency of plant species that colonized over two years after stripping topsoil from coastal farmland.
VEGETATION STRUCTURE
A study in 1997–1999 aiming to create a brackish marsh on coastal farmland in the Netherlands (1) reported that an area from which topsoil was removed was colonized by farmland weeds and some plant species characteristic of brackish marshes. Two years after topsoil removal, 23 plant species were recorded in the study area. The most abundant taxa were mostly farmland weeds/generalists, such as chamomile Matricaria recutita (in 97% of quadrats), sow thistle Sonchus oleraceus (76%) and meadow grass Poa annua (61%). Taxa characteristic of brackish marshes included rushes Juncus spp. (in 97% of quadrats), sea aster Aster tripolium (7%) and alkali bulrush Scirpus maritimus (5%). The study does not define a full list of characteristic species. Methods: In 1997, a 30 cm layer of topsoil was stripped from an area of coastal farmland (Emmapolder). Not all topsoil was completely removed from the site: some was stored in rows on site, and so provided a source of farmland weed seeds. Brackish groundwater naturally seeped towards the ground surface. In 1999, vegetation was surveyed in an unplanted area of the site, next to a pool (100 quadrats, each 0.4 m2).
(1) Bakker J.P., Esselink P., Dijkema K.S., van Duin W.E. & de Jong D.J. (2002) Restoration of salt marshes in the Netherlands. Hydrobiologia, 478, 29–51.
12.11.3 Remove surface soil/sediment: freshwater swamps
We found no studies that evaluated the effects, on vegetation, of removing surface soil/sediment to restore or create freshwater swamps.
This means that we have not yet found any studies that have directly evaluated this intervention during our systematic journal and report searches. Therefore we have no evidence to indicate whether or not the intervention has any desirable or harmful effects.

12. Habitat restoration and creation
376
12.11.4 Remove surface soil/sediment: brackish/saline swamps
We found no studies that evaluated the effects, on vegetation, of removing surface soil/sediment to restore or create brackish/saline swamps.
This means that we have not yet found any studies that have directly evaluated this intervention during our systematic journal and report searches. Therefore we have no evidence to indicate whether or not the intervention has any desirable or harmful effects.
12.12 Bury surface soil/sediment
We found no studies that evaluated the effects, on vegetation, of burying surface soil/sediment to restore/create marshes or swamps.
This means that we have not yet found any studies that have directly evaluated this intervention during our systematic journal and report searches. Therefore we have no evidence to indicate whether or not the intervention has any desirable or harmful effects.
Background
In degraded marshes or swamps, the surface soil/sediment – and any vegetation on it – could be buried under deeper layers, for instance by deep ploughing. Burial can create bare soil/sediment with spaces for vegetation to grow, prevent undesirable plants from growing from seeds already in the soil, remove excess nutrients that favour growth of undesirable weedy plants, and remove any contaminants or pollutants (Glen et al. 2017). Inverting, rather than removing, the upper soil layer maintains the ground level.
CAUTION: Heavy machinery is usually needed for this intervention. Heavy vehicles can churn and compress wetland soils (Campbell et al. 2002; see also Chapter 7).
Related interventions: Remove surface soil/sediment without replacement (12.11); Disturb soil/sediment surface (12.13); Bury surface soil/sediment before planting (13.9).
Campbell D.A., Cole C.A. & Brooks R.P. (2002) A comparison of created and natural wetlands in Pennsylvania, USA. Wetlands Ecology and Management, 10, 41–49.
Glen E., Price E.A.C., Caporn S.J.M., Carroll J.A., Jones L.M. & Scott R. (2017) Evaluation of topsoil inversion in UK habitat creation and restoration schemes. Restoration Ecology, 25, 72–81.
12.13 Disturb soil/sediment surface
Background
This intervention involves shallow disturbance of the top few centimetres of soil/sediment in degraded marshes or swamps (e.g. by tilling, ploughing, disking or scarifying) without permanently removing any material. Such disturbance may encourage the growth of desirable plants. It can break up any hard soil crust, or create bare patches clear of competing vegetation or litter in which new plants can grow. Marsh or swamp plants may colonize from nearby habitat patches, or germinate from propagules (e.g. seeds, spores or root/rhizome fragments) already in the soil. The first colonizing plants will typically be fast-growing, weedy species – but these may also be desirable members of target plant communities, or act as nurse plants for later desirable communities.

12. Habitat restoration and creation
377
Related interventions: Physically damage problematic plants, including by disturbing the soil/sediment (9.5); Remove surface soil/sediment (12.11); Bury surface soil/ sediment, including by deep ploughing (12.12).
12.13.1 Disturb soil/sediment surface: freshwater marshes
Two studies evaluated the effects, on vegetation, of disturbing the surface of freshwater marshes. Both studies were in the USA – in the same region but different sites.
VEGETATION COMMUNITY
Community composition (1 study): One replicated, paired, controlled study in rewetted marshes in the USA1a found that ploughed plots contained a plant community characteristic of wetter conditions than unploughed plots after one growing season – but not after two.
Overall richness/diversity (2 studies): Two replicated, controlled studies in rewetted marshes in the USA1a,1b found that ploughed plots typically contained more wetland plant species than unploughed plots after one growing season – but not after two.
VEGETATION ABUNDANCE
Overall abundance (2 studies): Two replicated, controlled studies in rewetted marshes in the USA1a,1b found that ploughed plots had greater cover of wetland plants than unploughed plots after one growing season – but not after two.
Individual species abundance (1 study): One replicated, controlled study in rewetted marshes in the USA1b found that ploughed plots had much greater cover of cattails Typha spp. than unploughed plots after two growing seasons.
VEGETATION STRUCTURE
A replicated, paired, controlled study in 1992–1993 in five freshwater marshes undergoing restoration in New York State, USA (1a) found that plots with disturbed soil contained a more wetland-characteristic plant community, with more and greater cover of wetland species, after one growing season – but that these effects disappeared after two growing seasons. After one growing season, disturbed plots contained a plant community more characteristic of wetland conditions than undisturbed plots (data reported as a wetland indicator index). Disturbed plots also contained more and greater total cover of wetland plant species (3.2 species/plot; 28% cover) than undisturbed plots (2.0 species/plot; 19% cover). After two growing seasons, all metrics were statistically similar under both treatments: community composition, wetland plant cover (disturbed: 72%; undisturbed: 54%) and wetland plant richness (disturbed: 3.6; undisturbed: 2.8 species/plot). Methods: In May 1992, twenty 0.25-m2 plots were established across five recently rewetted sites (drained for ≥40 years previously). In five plots (one plot/site), the top 15 cm of soil was removed then put back in place. The other 15 plots (three plots/site) were left undisturbed. Plant species and cover were recorded in autumn 1992 and 1993.
A replicated, controlled study in 1993–1995 in five freshwater marshes undergoing restoration in New York State, USA (1b) found that plots disturbed by ploughing typically contained more and greater cover of wetland plant species than unploughed plots after one year, and higher cover of cattails Typha spp. after two years. After one year, ploughed plots had greater total cover of wetland plants than unploughed plots in three of three comparisons (ploughed: 33–74%; unploughed: 5–15%). Ploughed plots contained more wetland plant species in two of three

12. Habitat restoration and creation
378
comparisons (for which ploughed: 5.7–6.4; unploughed: 3.0 species/plot; other comparison no significant difference). After two years, treatments did not significantly differ in either total wetland plant cover (ploughed: 114–138%; unploughed: 71–96%) or richness (ploughed: 2.4–4.9; unploughed: 3.7–4.7 species/plot). However, ploughed plots had far greater cover of cattails in three of three comparisons (ploughed: 72–148%; unploughed: 0–7%). Methods: The study used five degraded wetland sites, drained for ≥40 years. In summer 1993, areas within two sites were ploughed. In autumn 1993, all five sites were rewetted. Plant species and cover were recorded in 1994 and 1995 (precise date not reported), in 18 quadrats in the ploughed areas and 39 quadrats in nearby unploughed areas. Quadrats spanned a range of elevations.
(1) Brown S.C. & Bedford B.L. (1997) Restoration of wetland vegetation with transplanted wetland soil: an experimental study. Wetlands, 17, 424–437.
12.13.2 Disturb soil/sediment surface: brackish/salt marshes
One study evaluated the effects, on vegetation, of disturbing the surface of brackish/salt marshes. The study was in the USA.
VEGETATION COMMUNITY
Community composition (1 study): One replicated, paired, site comparison study of brackish/ salt marshes in the USA1 reported that marshes disked every spring for at least six years (and drawn down during spring/autumn) shared only 24–34% of plant species with marshes that were not disked (or drawn down).
Overall richness/diversity (1 study): The same study1 found that overall plant species richness and diversity were similar in managed marshes (disked every spring and drawn down during spring/autumn, for at least six years) and unmanaged marshes (neither disked nor drawn down).
VEGETATION ABUNDANCE
VEGETATION STRUCTURE
A replicated, paired, site comparison study in 2007–2009 of eight brackish/salt marshes in Texas, USA (1) found that managed marshes (disked every spring, along with a spring/autumn drawdown) and unmanaged marshes (subjected to neither of these interventions) had few plant species in common, but had similar overall plant species richness and diversity. Only 24–34% of plant species were found in both managed and unmanaged marshes (reported as a similarity index). However, both marsh types had statistically similar plant species richness (six of six comparisons; managed: 12–21 species/marsh; unmanaged: 8–18 species/marsh) and plant diversity (six of six comparisons; data reported as a diversity index). Methods: In autumn, winter and spring 2007/2008 and 2008/2009, vegetation was surveyed in four pairs of managed and unmanaged marshes (fifty-six 1-m2 quadrats/marsh, placed along transects). In the managed marshes, the soil surface was disked every spring for 6–9 years. The managed marshes had also been impounded to control water levels and salinity (drawdown each spring-autumn). The study does not distinguish between the effects of three interventions. All marshes were grazed each summer and burned every three years. The marshes were brackish in 2007/2008 (managed: <2 ppt; unmanaged: <10 ppt) but saline in 2008/2009 following a hurricane and storm surge (e.g. average salinity in managed marshes: 20 ppt).

12. Habitat restoration and creation
379
(1) Fitzsimmons O.N., Ballard B.M., Merendino M.T., Baldassarre G.A. & Hartke K.M. (2012) Implications of coastal wetland management to nonbreeding waterbirds in Texas. Wetlands, 32, 1057–1066.
12.13.3 Disturb soil/sediment surface: freshwater swamps
We found no studies that evaluated the effects, on vegetation, of disturbing the surface of freshwater swamps.
This means that we have not yet found any studies that have directly evaluated this intervention during our systematic journal and report searches. Therefore we have no evidence to indicate whether or not the intervention has any desirable or harmful effects.
12.13.4 Disturb soil/sediment surface: brackish/saline swamps
We found no studies that evaluated the effects, on vegetation, of disturbing the surface of brackish/ saline swamps.
This means that we have not yet found any studies that have directly evaluated this intervention during our systematic journal and report searches. Therefore we have no evidence to indicate whether or not the intervention has any desirable or harmful effects.
12.14 Add sediment
Background
Adding small amounts of sediment to marshes or swamps is a possible intervention to counter multiple threats. These include: sea level rise; subsidence (e.g. following oil and gas extraction); reduced sediment inputs following the construction of levees, flood control structures or jetties; and erosion from storms or boat traffic or following excessive grazing (Reed & Wilson 2004). Adding sediment can physically raise the ground surface and provide nutrients to vegetation. In turn, vegetation can physically protect and stabilize wetlands, and encourage further sediment deposition. Sediment or sediment slurry could be added directly to a focal site, or placed nearby then transported to the focal site by natural process (Foster 2013).
Factors that might influence the effects of this intervention include the amount of sediment added, and whether any vegetation is present before sediment addition.
Related interventions: Deposit soil/sediment to form physical habitat structure (12.16); Transplant or replace wetland soil in order to introduce marsh or swamp vegetation (12.26).
Foster N.M., Hudson M.D., Bray S. & Nicholls R.J. (2013) Intertidal mudflat and saltmarsh conservation and sustainable use in the UK: a review. Journal of Environmental Management, 126, 96–104.
Reed D.J. & Wilson L. (2004) Coast 2050: a new approach to restoration of Louisiana coastal wetlands. Physical Geography, 25, 4–21.
12.14.1 Add sediment: freshwater marshes
One study evaluated the effects, on vegetation, of adding sediment to existing freshwater marshes. The study was in the USA.
VEGETATION COMMUNITY

12. Habitat restoration and creation
380
Overall richness/diversity (1 study): One replicated, randomized, paired, controlled study in the USA1 reported that adding sediment to freshwater marshes typically reduced plant species richness after one growing season.
VEGETATION ABUNDANCE
Overall abundance (1 study): One replicated, randomized, paired, controlled study in the USA1 found that adding sediment to freshwater marshes had no significant effect on total live vegetation biomass after one growing season.
Individual species abundance (1 study): The same study1 found that adding sediment to freshwater marshes had no significant effect on the biomass of most of the dominant herbaceous species after one growing season.
VEGETATION STRUCTURE
A replicated, randomized, paired, controlled study in 2004 in two floating freshwater marshes in Louisiana, USA (1) found that adding sediment reduced plant species richness, but had no significant effect on vegetation biomass. After one growing season, plots amended with sediment had lower plant species richness than unamended plots in five of six cases (for which amended: 8–12 species/0.4 m2; unamended: 12–13 species/0.4 m2; statistical significance not assessed). Sediment addition had no significant effect on total, live, above-ground vegetation biomass (amended: 270–660 g/m2; unamended: 320–530 g/m2). Sediment addition typically had no significant effect on the overall biomass of dominant plant species, such as slender spikerush Eleocharis baldwinii and dotted smartweed Polygonum punctatum (see original paper for data). However, in one of two marshes, biomass of frogfruit Phyla lanceolata was greater in amended plots (4–12 g/m2) than unamended plots (<0.1 g/m2). Methods: In spring 2004, thirty-two 1-m2 plots were established across two floating marshes. Sediment inputs to the marshes had been reduced by an upstream dam. In each marsh, twelve random plots were amended with sediment collected from a nearby river channel (2 kg/m2, 7 kg/m2 or 17 kg/m2). The remaining plots received no sediment. All plots were also fenced to exclude nutria Myocastor coypus. In autumn 2004, vegetation was cut from 0.1 m2 of each plot then separated by species, dried and weighed.
(1) Carpenter K., Sasser C.E., Visser J.M. & DeLaune R.D. (2007) Sediment input into a floating freshwater marsh: effects on soil properties, buoyancy and plant biomass. Wetlands, 27, 1016–1024.
12.14.2 Add sediment: brackish/salt marshes
Five studies evaluated the effects, on vegetation, of adding sediment to existing brackish/salt marshes. All five studies were in the USA. Two studies1,2 were based on one experimental set-up and two studies4,5 were based on another.
VEGETATION COMMUNITY
Relative abundance (1 study): One replicated, site comparison study in the USA4 found that salt marshes amended with sediment typically supported a greater relative abundance of smooth cordgrass Spartina alterniflora than degraded marshes after two years, but that this typically remained lower than in natural marshes.
Overall richness/diversity (1 study): The same study4 found that salt marshes amended with sediment typically had greater plant species richness than degraded marshes, and statistically similar richness to natural marshes, after two years.

12. Habitat restoration and creation
381
VEGETATION ABUNDANCE
Overall abundance (1 study): One replicated, site comparison study of in the USA4 found that salt marshes amended with sediment typically had greater total vegetation cover than degraded marshes, and statistically similar cover to natural marshes, after two years.
Individual species abundance (4 studies): Four studies1–3,5 quantified the effect of this intervention on the abundance of individual plant species. For example, all four studies (including two replicated, randomized, paired, controlled) of salt marshes in the USA1–3,5 found that adding sediment typically increased the abundance of smooth cordgrass Spartina alterniflora, over approximately 1–5 years. This is based on total biomass1,2, density1,2 and/or cover3,5. One of the studies3 reported that adding sediment increased the cover of three other species after one year.
VEGETATION STRUCTURE
Height (1 study): One replicated, randomized, paired, controlled study in a salt marsh in the USA1 found that the height of the dominant plant species, smooth cordgrass Spartina alterniflora, did not significantly differ between plots amended with sediment and unamended plots. Height was measured 16 months after sediment amendment began.
A replicated, randomized, paired, controlled study in 1986–1987 in a subsiding tidal salt marsh in Louisiana, USA (1) found that adding sediment increased smooth cordgrass Spartina alterniflora density and biomass, but not its height. Sixteen months after the first amendment, plots amended with sediment contained more smooth cordgrass stems (high dose: 75 stems/0.25 m2; low dose: 65 stems/0.25 m2) than unamended plots (47 stems/0.25 m2). Above-ground biomass of smooth cordgrass was greater in amended than unamended plots, although only significantly so for the high sediment dose. This was true for both overall biomass (high dose: 527; low dose: 406; unamended; 288 g/0.25 m2) and for live biomass only (high dose: 368; low dose: 268; unamended; 184 g/0.25 m2). Smooth cordgrass height did not significantly differ between treatments (high dose: 41; low dose: 41; unamended: 43 cm). Methods: In July 1986, twelve 1.44-m2 plots were established (in four sets of three) on a degraded, cordgrass-dominated salt marsh. Eight plots (two random plots/set) were amended with dredged river alluvium: either high dose (94 kg/m2) or low dose (47 kg/m2). Half of the sediment was added in July 1986 and half in June 1987. The other four plots received no sediment. In November 1987, vegetation was cut from one 0.25-m2 quadrat/plot. Five random stems were measured, then all sampled vegetation was dried and weighed. This study was based on the same experimental set-up as (2).
A replicated, randomized, paired, controlled study in 1986–1988 in a subsiding tidal salt marsh in Louisiana, USA (2) found that adding sediment increased smooth cordgrass Spartina alterniflora density and biomass. Twenty-two months after the first amendment, plots amended with sediment contained more cordgrass stems (high dose: 50 stems/m2; low dose: 42 stems/m2) than unamended plots (19 stems/m2). The above-ground biomass of smooth cordgrass was also greater in amended plots (high dose: 381 g/m2; low dose: 321 g/m2) than unamended plots (160 g/m2). Methods: In July 1986, twelve 1.44-m2 plots were established (in four sets of three) on a degraded, cordgrass-dominated salt marsh. Four plots received each sediment dose: high (94 kg/m2), low (47 kg/m2) or none. Sediment was dredged river alluvium. Half was added to each amended plot in July 1986 and half in June 1987. In April 1988, vegetation was cut from two 0.25-m2 quadrats/plot, then dried and weighed. This study was based on the same experimental set-up as (1).
A before-and-after, site comparison study in 1996–1997 of two coastal marshes in Louisiana, USA (3) reported that one year after spraying dredged sediment onto a

12. Habitat restoration and creation
382
marsh, cover of three of four plant species was greater than before spraying. Statistical significance was not assessed. One year after spraying, the marsh had 66% cover of smooth cordgrass Spartina alterniflora (before: 19%), 35% cover of hairy cowpea Vigna luteloa (before: 1%), 16% cover of three-square bulrush Scirpus americanus (before: 7%) and 0% cover of saltmeadow cordgrass Spartina patens (before: 11%). Meanwhile, cover of the first three species was stable over time in a nearby unsprayed marsh (smooth cordgrass: 54–55%; cowpea: 8–12%; bulrush: 7–9%) whilst cover of saltmeadow cordgrass declined (from 6% to 0%). Methods: In July 1996, dredged canal sediment was sprayed in a high-pressure jet onto an area of subsided marsh in the Mississippi Delta. This increased the marsh surface elevation by approximately 2 cm. Cover of each plant species was surveyed in the sprayed marsh and a nearby reference marsh (not subsided, not sprayed), five weeks before spraying (June 1996) and for up to one year after (July 1997).
A replicated, site comparison study in 2007 of eight tidal salt marshes in Louisiana, USA (4) found that marshes amended with sediment to counteract subsidence typically had greater vegetation cover and species richness than degraded marshes, and similar cover and richness to natural marshes, after two years. Vegetation cover in amended marshes was greater than in degraded marshes and similar to natural marshes in three of five cases (for which amended: 85–100%; degraded: 8%; natural: 93%). Similarly, total plant species richness was greater than in degraded marshes and similar to natural marshes in three of five cases (for which amended: 1.3–2.4; degraded: 0.1; natural: 1.4 species/unit; units not clearly reported). Additionally, the relative abundance of smooth cordgrass Spartina alterniflora in amended marshes was greater than in degraded marshes in four of five cases, but similar to natural marshes in only two cases (data reported as importance values). In the other cases, cover (12–30%), richness (0.4–0.8 species/unit) and cordgrass relative abundance in amended marshes remained similar to degraded marshes and typically lower than in natural marshes. These comparisons generally involved amendments with large amounts of sediment on initially bare areas. Methods: In 2002, sediment slurry was pumped onto four degraded salt marshes (subsided after most plants were killed by drought in 2000). The marsh surface was raised 13–36 cm above natural marshes. Between autumn 2003 and 2004, vegetation was surveyed along transects in the four restored marshes, two adjacent degraded (subsided) marshes and two adjacent natural marshes. This study was based on the same experimental set-up as (5).
A replicated, site comparison study in 2007 in eight tidal salt marshes in Louisiana, USA (5) found that marshes amended with sediment to counteract subsidence typically had greater smooth cordgrass Spartina alterniflora cover than degraded marshes, and sometimes had similar cover to natural marshes. After five years, total smooth cordgrass cover was greater in amended than degraded marshes in three of four comparisons (for which amended: 16–42%; degraded: 2%). Natural marshes had 49% smooth cordgrass cover. This was not significantly different from amended marshes in two of four comparisons (where small amounts of sediment had been added or cordgrass rhizomes persisted before amendment; cover: 29–42%) but was lower in amended marshes in the other two comparisons (where higher amounts of sediment had been added to bare marsh; cover: 16–19%). Live cordgrass cover was 8–12% in amended marshes (24–59% of total), 2% in degraded marshes (100% of total), and 15% in natural marshes (30% of total; statistical significance of differences not assessed). Methods: In 2002, sediment slurry was pumped onto four degraded

12. Habitat restoration and creation
383
salt marshes. These had subsided after plants were killed by drought in 2000, but retained some patches of cordgrass rhizomes (underground horizontal stems). The marshes were raised to 3–15 cm above mean sea level. In summer 2007, vegetation was surveyed in 0.25-m2 quadrats in the four restored marshes, two adjacent degraded (subsided) marshes and two adjacent natural marshes. This study was based on the same experimental set-up as (4).
(1) DeLaune R.D., Pezeshki S.R., Pardue J.H., Whitcomb J.H. & Patrick W.H. Jr. (1990) Some influences of sediment addition to a deteriorating salt marsh in the Mississippi River deltaic plain: a pilot study. Journal of Coastal Research, 6, 181–188.
(2) Pezeshki S.R., DeLaune R.D. & Pardue J.H. (1992) Sediment addition enhances transpiration and growth of Spartina alterniflora in deteriorating Louisiana Gulf Coast salt marshes. Wetlands Ecology and Management, 1, 185–189.
(3) Ford M.A., Cahoon D.R. & Lynch J.C. (1999) Restoring marsh elevation in a rapidly subsiding salt marsh by thin-layer deposition of dredged material. Ecological Engineering, 12, 189–205.
(4) Schrift A.M., Mendelssohn I.A. & Materne M.D. (2008) Salt marsh restoration with sediment-slurry amendments following a drought-induced large-scale disturbance. Wetlands, 28, 1071–1085.
(5) Stagg C.L. & Mendelssohn I.A. (2012) Littoraria irrorata growth and survival in a sediment-restored salt marsh. Wetlands, 32, 643–652.
12.14.3 Add sediment: freshwater swamps
We found no studies that evaluated the effects, on vegetation, of adding sediment to existing freshwater swamps. This means that we have not yet found any studies that have directly evaluated this intervention during our systematic journal and report searches. Therefore we have no evidence to indicate whether or not the intervention has any desirable or harmful effects.
12.14.4 Add sediment: brackish/saline swamps
We found no studies that evaluated the effects, on vegetation, of adding sediment to existing brackish/saline swamps. This means that we have not yet found any studies that have directly evaluated this intervention during our systematic journal and report searches. Therefore we have no evidence to indicate whether or not the intervention has any desirable or harmful effects.
12.15 Add upland topsoil
We found no studies that evaluated the effects, on vegetation, of adding upland topsoil to restore/create marshes or swamps.
This means that we have not yet found any studies that have directly evaluated this intervention during our systematic journal and report searches. Therefore we have no evidence to indicate whether or not the intervention has any desirable or harmful effects.
Background
Topsoil can be a source of soil organic matter and help to improve water retention (Bruland & Richardson 2004). This might benefit wetland vegetation, particularly when creating new marshes and swamps. However, given that upland soil will probably not contain seeds or fragments or marsh/swamp plants, it may be necessary to introduce these in some way (see Sections 12.22–12.26). CAUTION: Topsoil may contain seeds or fragments of undesirable vegetation.

12. Habitat restoration and creation
384
Related interventions: Transplant or replace wetland soil (12.26); Add upland topsoil to complement planting (13.11).
Bruland G.L. & Richardson C.J. (2004) Hydrologic gradients and topsoil additions affect soil properties of Virginia created wetlands. Soil Science Society of America Journal, 68, 2069–2077.
12.16 Deposit soil/sediment to form physical habitat structure
Background
This intervention involves large-scale deposition of soil or sediment to form the physical structure of a marsh or swamp, e.g. the creation of new salt marshes by depositing dredge material. This can be a cost-effective alternative to depositing sediment in upland areas or in the ocean (LaSalle et al. 1991). Soil or sediment could be placed directly where a marsh or swamp is desired, or placed nearby then carried to the desired site by water flows (Foster et al. 2013). Summarized studies could vary in the degree of landscaping of the newly deposited sediment.
Related interventions: Deposit soil/sediment and introduce vegetation (12.3); Add sediment in relatively small amounts (12.14); Add upland topsoil (12.15); Transplant or replace wetland soil in order to introduce marsh or swamp vegetation (12.26).
Foster N.M., Hudson M.D., Bray S. & Nicholls R.J. (2013) Intertidal mudflat and saltmarsh conservation and sustainable use in the UK: a review. Journal of Environmental Management, 126, 96–104.
LaSalle M.W., Landin M.C. & Sims J.G. (1991) Evaluation of the flora and fauna of a Spartina alterniflora marsh established on dredged material in Winyah Bay, South Carolina. Wetlands, 11, 191–208.
12.16.1 Deposit soil/sediment to form physical structure of freshwater
marshes
Two studies evaluated the effects, on vegetation, of depositing soil/sediment to form the physical structure of freshwater marshes (without introducing vegetation). One study was in the USA1 and one was in the Netherlands2.
VEGETATION COMMUNITY
Community types (1 study): One replicated, paired, site comparison study in the Netherlands2 reported that marshes created by depositing sand at lake margins contained fewer plant community types, after 8–16 years, than mature natural marshes.
VEGETATION ABUNDANCE
Overall abundance (2 studies): One site comparison study in the USA1 reported that plant stem density was similar, after 4–10 years, in marshes created by depositing sediment and in natural marshes, but that vegetation cover was lower in the created marshes. One replicated, paired, site comparison study in the Netherlands2 reported that marshes created by depositing sand at lake margins contained similar vegetation biomass to nearby natural marshes after 8–16 years.
VEGETATION STRUCTURE
Height (1 study): One site comparison study in the USA1 reported that a freshwater marsh created by depositing sediment contained vegetation of a similar height to nearby natural marshes after 4–10 years.

12. Habitat restoration and creation
385
A site comparison study in 1979–1985 alongside a river in Virginia, USA (1) reported that a freshwater marsh created by depositing dredged sediment developed vegetation of similar height and density to three natural marshes within four years, but that vegetation cover remained lower than natural marshes for 10 years. Statistical significance was not assessed. Four years after wetland creation, vegetation was 112 cm tall (vs natural wetlands: 99–112 cm) and there were 212 plant stems/m2 (vs natural: 183–380 stems/m2). However, in the created marsh, vegetation cover was only 47% (vs natural: 65–91%). Data were also reported 10 years after marsh creation. Height and density were still within the range of natural marshes, and cover was still lower in the created marsh than natural marshes (see original paper for data). Methods: In 1975, dredged sediment was deposited behind a sand embankment in the James River channel. The dike was breached after depositing the sediment to allow tidal influx. Vegetation was surveyed along permanent transects in the created marsh and three adjacent natural marshes in 1979, 1982 and 1985.
A replicated, paired, site comparison study in 2003 around three freshwater lakes in the Netherlands (2) reported that marshes created by depositing sand contained fewer plant community types than natural marshes, but found that they had similar vegetation biomass. After 8–16 years, the created marshes contained three distinct plant community types, compared to four in natural marshes. Unlike natural marshes, created marshes did not contain pure stands of cattails Typha spp. or common reed Phragmites australis. However, the above-ground vegetation biomass in sampled plots did not significantly differ between created marshes (1.5 kg/m2) and natural marshes (1.6 kg/m2). Methods: In August 2003, vegetation was surveyed around the margins of three connected freshwater lakes. One created marsh and one natural (mature) marsh were surveyed in each lake. Created marshes had been formed by depositing sand to a suitable elevation for plants to colonize. Vegetation was cut from three or four 400-cm2 plots/marsh, distributed across the plant community types present, then dried and weighed.
(1) Landin M.C., Clairain E.J. Jr. & Newling C.J. (1989) Wetland habitat development and long-term monitoring at Windmill Point, Virginia. Wetlands, 9, 13–25.
(2) Sollie S., Coops H. & Verhoeven J.T.A. (2008) Natural and constructed littoral zones as nutrient traps in eutrophicated shallow lakes. Hydrobiologia, 605, 219–233.
12.16.2 Deposit soil/sediment to form physical structure of brackish/salt
marshes
Four studies evaluated the effects, on vegetation, of depositing soil/sediment to form the physical structure of brackish/salt marshes (without introducing vegetation). Three studies were in the USA1–3
and one study was in Italy4. Two studies1,2 took place in the same marsh, but in different areas.
VEGETATION COMMUNITY
Overall extent (1 study): One replicated study in a lagoon in Italy4 quantified the area of vegetation on sediment deposited up to 19 years previously (average six years four months, with 61% vegetation coverage).
Community types (2 studies): Two replicated studies in coastal wetlands in the USA2 and Italy4 quantified the coverage of brackish or salt marsh plant communities on sediment deposited up to 19 years previously.
Community composition (1 study): One replicated, site comparison study on the coast of the USA3 reported that the composition of the plant community that developed on deposited sediment

12. Habitat restoration and creation
386
depended on the time since deposition and the elevation of the sediment. Areas of sediment that were of a similar elevation to natural marshes (or slightly lower) developed (or were developing) a similar overall plant community composition to the natural marshes.
Overall richness/diversity (1 study): One replicated study in an estuary in the USA1 reported that 1–2 plant species had colonized areas of deposited sediment after 4–8 years.
VEGETATION ABUNDANCE
VEGETATION STRUCTURE
A replicated, site comparison study in 1988 in an estuary in South Carolina, USA (1) reported that two areas of deposited sediment had been colonized by brackish marsh vegetation, developing biomass within the range of natural marshes within four years. A 4-year-old patch of sediment had been colonized by smooth cordgrass Spartina alterniflora only. Vegetation cover was 52%. Vegetation was 66 cm tall, there were 199 stems/m2 and above-ground biomass was 856 g/m2. In nearby, natural, smooth cordgrass-dominated marshes, above-ground biomass was 573–969 g/m2. An 8-year-old patch of sediment had been colonized by sturdy bulrush Scirpus robustus in addition to smooth cordgrass. Vegetation cover was similar to the younger marsh (48%) but vegetation was shorter (40 cm tall), more dense (257 stems/m2) and had lower biomass (631 g/m2). Methods: In September 1988, vegetation was surveyed in ten 0.25-m2 quadrats in two areas of sediment, deposited and levelled four or eight years previously. Previously published biomass data from marshes in Georgia and North Carolina were used for comparison. This study was in the same marsh as (2), but used different patches of sediment.
A replicated study in 1994–1999 in an estuary in South Carolina, USA (2) reported that three patches of deposited sediment had developed brackish marsh plant communities when 6–17 years old, with replacement of single species by mixed communities in patches >13 years old. The youngest patch was dominated almost exclusively by smooth cordgrass Spartina alterniflora during both surveys (when the patch was 6–11 years old). In two older patches, single-species communities initially dominated, occurring at 87–96% of surveyed points when the patches were 13–17 years old. This dominance decreased over time, with single-species communities occurring at only 50–63% of surveyed points when the patches were 18–22 years old. However, individual species remained dominant or co-dominant at a similar number of sampled points. For example, in one marsh, smooth cordgrass occurred at 45% of points after 13 years then 57% after 18 years, and sturdy bulrush Schoenoplectus robustus occurred at 50% of points after 13 years then 65% after 18 years. Methods: In 1994 and 1999, dominant plant communities were surveyed in three patches of a created marsh (in three 100-m2 quadrats/marsh/year; 36 survey points/quadrat). Dredged sediment had been deposited in an estuary in stages between 1977 and 1988, creating patches of intertidal brackish marsh (salinity 1–10 ppt) of varying age. This study was in the same marsh as (1), but used different patches of sediment.
A replicated, site comparison study in 1997–2002 on the coastal plain of Louisiana, USA (3) found that four areas of deposited sediment had developed salt marsh plant communities, although the precise community – and its similarity to natural marshes – depended on elevation. Statistical significance was not assessed. Two areas of deposited sediment had developed similar plant communities to nearby natural salt marshes, dominated by smooth cordgrass Spartina alterniflora, within 4–17 years. In a third area, the community was developing in a similar direction by the

12. Habitat restoration and creation
387
third year after creation. A fourth area had developed a different plant community to the other created and natural marshes after eight years. This wetland was dominated by herbs characteristic of its higher elevation. All data were reported as graphical analyses. Methods: Between 1983 and 1999, dredged sediment was pumped into open water areas to create four bare islands (40–200 ha). In 1997, 2000 and 2002, vegetation was surveyed on the sediment deposits and in three nearby natural wetlands. Plant species and cover were recorded along 3–7 transects/site/year.
A replicated study in 2005–2007 in Venice Lagoon, Italy (4) reported that 75 artificial islands had developed up to 70% vegetation coverage, mostly of salt marsh plant communities. On average, the islands were six years four months old when surveyed and 61% of their area was vegetated. Two salt marsh plant communities made up most of the vegetated area: a community dominated by samphire Salicornia spp. (55% of vegetated area) and a community dominated by shrubby swampfire Sarcocornia fruticosa (20% of vegetated area). Islands 5–15 years old had higher overall vegetation coverage (70%) than islands 0–2 years old (27%) or islands 16–19 years old (37%). Statistical significance of this cover result was not assessed. Methods: Between 2005 and 2007, vegetation communities on 75 artificial islands were mapped using aerial photographs and field surveys. The islands had been created between 1988 and 2007 by depositing dredged sediment into geotextile-lined pens (with some gaps in the walls to encourage tidal creek formation). The island surfaces settled to 50–100 cm above sea level: an elevation intended to allow salt marsh vegetation to develop. The average area of the islands was 11.3 ha (range 0.1–51.4 ha).
(1) LaSalle M.W., Landin M.C. & Sims J.G. (1991) Evaluation of the flora and fauna of a Spartina alterniflora marsh established on dredged material in Winyah Bay, South Carolina. Wetlands, 11, 191–208.
(2) Alphin T.D. & Posey M.H. (2000) Long-term trends in vegetation dominance and infaunal community composition in created marshes. Wetlands Ecology and Management, 8, 317–325.
(3) Edwards K.R. & Proffitt C.E. (2003) Comparison of wetland structural characteristics between created and natural salt marshes in southwest Louisiana, USA. Wetlands, 23, 344–356.
(4) Scarton F., Cecconi G. & Valle R. (2013) Use of dredge islands by a declining European shorebird, the Kentish plover Charadrius alexandrinus. Wetlands Ecology and Management, 21, 15–27.
12.16.3 Deposit soil/sediment to form physical structure of freshwater
swamps
We found no studies that evaluated the effects on vegetation, of depositing soil/sediment to form the physical structure of freshwater swamps (without introducing vegetation).
This means that we have not yet found any studies that have directly evaluated this intervention during our systematic journal and report searches. Therefore we have no evidence to indicate whether or not the intervention has any desirable or harmful effects.
12.16.4 Deposit soil/sediment to form physical structure of brackish/
saline swamps
We found no studies that evaluated the effects on vegetation, of depositing soil/sediment to form the physical structure of brackish/saline swamps (without introducing vegetation).
This means that we have not yet found any studies that have directly evaluated this intervention during our systematic journal and report searches. Therefore we have no evidence to indicate whether or not the intervention has any desirable or harmful effects.

12. Habitat restoration and creation
388
12.17 Add inorganic fertilizer
Background
Fertilizers can be used to manage nutrient availability and may speed up revegetation. Plant growth might be limited by a lack of nutrients overall, or of a specific nutrient, after drainage, mining, vegetation harvest or pollution. When one or two nutrients are overabundant, invasive plant species may benefit more than native species. Adding the less abundant nutrients may shift the competitive balance back towards native species (Tilman et al. 1999; Perry et al. 2004). Commonly added nutrients include nitrogen (N), phosphorous (P) and/or potassium (K). It may be sensible to add fertilizer when the focal site is not flooded, to reduce the risk of it dissolving or being washed away.
The effects of this intervention will be heavily dependent on the study context, especially initial site nutrient levels and the amount of fertilizer added. Adding fertilizer when nutrients are already abundant could cause more harm than good, encouraging the growth of undesirable plants or algae and even inhibiting plant growth (Weinbaum et al. 1992). Accordingly, studies testing the effects of nutrient enrichment as a threat (i.e. enrichment above normal or desirable levels) are not summarized as evidence.
Related interventions: Add inorganic fertilizer to complement planting (13.13); Stimulate microbial breakdown of oil, including through fertilization (10.19).
Perry L.G., Galatowitsch S.M. & Rosen C.J. (2004) Competitive control of invasive vegetation: a native wetland sedge suppresses Phalaris arundinacea in carbon-enriched soil. Journal of Applied Ecology, 41, 151–162.
Tilman E.A., Tilman D., Crawley M.J. & Johnston A.E. (1999) Biological weed control via nutrient competition: potassium limitation of dandelions. Ecological Applications, 9, 103–111.
Weinbaum S.A., Johnson R.S. & DeJong T.M. (1992) Causes and consequences of overfertilization in orchards. HortTechnology, 2, 112–121.
12.17.1 Add inorganic fertilizer: freshwater marshes
One study evaluated the effects, on vegetation, of adding inorganic fertilizer to restore or create freshwater marshes. The study was in Germany.
VEGETATION COMMUNITY
Community composition (1 study): One replicated, paired, controlled, before-and-after study in wet grasslands in Germany1 reported that the effect of annual fertilization (for 20 years) on the average moisture preference of the vegetation varied between sites.
Overall richness/diversity (1 study): The same study1 reported that the effect of annual fertilization (for 20 years) on total plant species richness varied between sites.
VEGETATION ABUNDANCE
Overall abundance (1 study): One replicated, paired, controlled study in wet grasslands in Germany1 reported that plots fertilized every spring contained more vegetation biomass, after 4–18 years, than unfertilized plots.
Herb abundance (1 study): The same study1 reported that the effect of annual fertilization (for 20 years) on cover of herb groups (sedges, rushes, forbs, ferns, grasses, legumes) varied between sites.
VEGETATION STRUCTURE

12. Habitat restoration and creation
389
Height (1 study): One replicated, paired, controlled, before-and-after study in wet grasslands in Germany1 reported that the effect of annual fertilization (for 20 years) on vegetation height varied between sites.
A replicated, paired, controlled, before-and-after study in 1987–2007 in two wet grasslands in northwest Germany (1) reported that fertilized plots contained more plant biomass than unfertilized plots after 4–18 years, but that fertilizer had no consistent effect on vegetation cover, height or species richness. In the first year of the study, above-ground vegetation biomass was statistically similar in fertilized plots (540–590 g/m2) and unfertilized plots (480–510 g/m2). However, after 4–18 years of intervention, above-ground vegetation biomass was significantly greater in fertilized plots (520–820 g/m2) than unfertilized plots (240–390 g/m2). Over 20 years, other vegetation metrics did not respond clearly or consistently to fertilization across the two wet grasslands (data reported as graphical analyses; statistical significance of differences not assessed). These metrics included cover of plant groups (e.g. sedges, rushes, forbs), vegetation height, species richness and community moisture preference. Methods: In 1987, two plots (each 200–250 m2) were established in each of two wet grassland sites (with non-peaty soils, and maintained as fertilized pasture prior to the study). From 1987, all four plots were mown twice each year (June/July and September). From 1989, one plot in each meadow was also fertilized each year in early spring (60 kg/ha P2O5 and 120 kg/ha K2O). Vegetation was surveyed in mid-June. Cover/abundance of all plant species was recorded in four 4-m2 quadrats/plot, every one or two years between 1987 and 2007. Vegetation was cut from eight 0.25-m2 quadrats/plot in 1989, 1993, 1998 and 2007, then dried and weighed.
(1) Poptcheva K., Schwartze P., Vogel A., Kleinebecker T. & Hölzel N. (2009) Changes in wet meadow vegetation after 20 years of different management in a field experiment (north-west Germany). Agriculture, Ecosystems & Environment, 134, 108–114.
12.17.2 Add inorganic fertilizer: brackish/salt marshes
One study evaluated the effects, on vegetation, of adding inorganic fertilizer to restore or create brackish/salt marshes. The study was in Canada.
VEGETATION COMMUNITY
VEGETATION ABUNDANCE
Characteristic plant abundance (1 study): One replicated, paired, controlled, before-and-after study in salt-contaminated bogs in Canada1 found that adding fertilizer had no significant effect on cover of salt marsh vegetation, in unplanted plots, after one year.
VEGETATION STRUCTURE
A replicated, paired, controlled, before-and-after study in 2011–2012 in two salt-contaminated bogs in New Brunswick, Canada (1) found that fertilizing without introducing salt marsh vegetation had no significant effect on cover of salt marsh plants. After one year, cover of salt marsh plant species was very low in both fertilized bog plots (0% cover) and unfertilized bog plots (<0.1% cover). Methods: In summer 2011, sixteen 9-m2 plots were established (in four sets of four) on bare, salt-contaminated peat. Eight plots (two plots/block) were fertilized with rock phosphate, spread across the plot surface (50 g/m2) or placed in 49 holes/plot (9 g/hole). The

12. Habitat restoration and creation
390
other eight plots were not fertilized. Half of the fertilized and unfertilized plots were also limed, but no vegetation was introduced to any of the plots. In July 2012, cover of salt marsh plants (i.e. species present in a nearby salt marsh) was recorded in one 4-m2 quadrat/plot.
(1) Emond C., Lapointe L., Hugron S. & Rochefort L. (2016) Reintroduction of salt marsh vegetation and phosphorus fertilisation improve plant colonisation on seawater-contaminated cutover bogs. Mires and Peat, 18, Article 17.
12.17.3 Add inorganic fertilizer: freshwater swamps
We found no studies that evaluated the effects, on vegetation, of adding inorganic fertilizer to restore or create freshwater swamps.
This means that we have not yet found any studies that have directly evaluated this intervention during our systematic journal and report searches. Therefore we have no evidence to indicate whether or not the intervention has any desirable or harmful effects.
12.17.4 Add inorganic fertilizer: brackish/saline swamps
We found no studies that evaluated the effects, on vegetation, of adding inorganic fertilizer to restore or create brackish/saline swamps.
This means that we have not yet found any studies that have directly evaluated this intervention during our systematic journal and report searches. Therefore we have no evidence to indicate whether or not the intervention has any desirable or harmful effects.
12.18 Add below-ground organic matter
Background
This intervention involves adding organic matter (i.e. remains or waste products of living organisms) below the ground surface, for example by mixing it into the sediment or placing it into holes. Specific substances than can be used include compost, sewage sludge, wood chips and seaweed extract.
The soil organic matter content of wetland soils may be reduced by disturbance. For example, drainage allows oxygen into the soil, whilst reprofiling removes surface layers rich in organic matter (Bruland et al. 2006). Organic matter can be an important component of wetland soils. It directly supplies nutrients to growing plants, supplies carbon and energy to soil organisms, helps bind the soil together, retains water during dry periods, and mediates soil temperature (Donahue et al. 1983; Weil & Brady 2016). Adding carbon-rich organic materials can indirectly modify nutrient availability by stimulating microbial activity, and so could help to manage invasive species where they benefit from an excess of certain nutrients (Reever Morghan & Seastedt 1999; Tilman et al. 1999; Perry et al. 2004).
To be summarized as evidence for this intervention, studies must evaluate the effects of adding organic matter without adding living vegetation. The organic matter should be used to help or manage existing vegetation, such as remnant patches of vegetation, or seedlings that germinate from seeds already present.
Related interventions: Add surface mulch (12.19); Add below-ground organic matter to complement planting (13.14).

12. Habitat restoration and creation
391
Bruland G.L., Richardson C.J. & Whalen S.C. (2006) Spatial variability of denitrification potential and related soil properties in created, restored, and paired natural wetlands. Wetlands, 26, 1042–1056.
Donahue R.L., Shickluna J.C. & Robertson L.S. (1983) Soils: An Introduction to Soils and Plant Growth, Fifth Edition. Prentice-Hall, Englewood Cliffs, NJ, USA.
Perry L.G., Galatowitsch S.M. & Rosen C.J. (2004) Competitive control of invasive vegetation: a native wetland sedge suppresses Phalaris arundinacea in carbon-enriched soil. Journal of Applied Ecology, 41, 151–162.
Reever Morghan K.J. & Seastedt T.R. (1999) Effects of soil nitrogen reduction on nonnative plants in restored grasslands. Restoration Ecology, 7, 51–55.
Tilman E.A., Tilman D., Crawley M.J. & Johnston A.E. (1999) Biological weed control via nutrient competition: potassium limitation of dandelions. Ecological Applications, 9, 103–111.
Weil R.R. & Brady N.C. (2016) The Nature and Properties of Soils, Fifteenth Edition. Pearson, USA.
12.18.1 Add below-ground organic matter: freshwater marshes
We found no studies that evaluated the effects, on vegetation, of adding below-ground organic matter to restore or create freshwater marshes.
This means that we have not yet found any studies that have directly evaluated this intervention during our systematic journal and report searches. Therefore we have no evidence to indicate whether or not the intervention has any desirable or harmful effects.
12.18.2 Add below-ground organic matter: brackish/salt marshes
One study evaluated the effects, on vegetation, of adding below-ground organic matter to restore or create brackish/salt marshes. The study was in the USA.
VEGETATION COMMUNITY
VEGETATION ABUNDANCE
Individual species abundance (1 study): One replicated, randomized, controlled, before-and-after study in a salt marsh in the USA1 found that plots amended with alginate contained a greater density of smooth cordgrass Spartina alterniflora than unamended plots after 6–52 weeks. However, amended and unamended plots contained similar smooth cordgrass biomass when it was sampled after 52 weeks.
VEGETATION STRUCTURE
Height (1 study): One replicated, randomized, controlled, before-and-after study in a salt marsh in the USA1 found that amending plots with alginate had no significant effect on smooth cordgrass height in the first 16 weeks after intervention, but that amended plots contained taller smooth cordgrass than unamended plots after 28–52 weeks.
A replicated, randomized, controlled, before-and-after study in 2007–2008 in a salt marsh in Georgia, USA (1) found that adding alginate generally increased the density and height, but not biomass, of smooth cordgrass Spartina alterniflora. Before intervention, plots contained 285–334 smooth cordgrass stems/0.5 m2 and plants were 53–59 cm tall. After 6–16 weeks, smooth cordgrass density was greater in plots amended with alginate (282–367 stems/0.5 m2) than in unamended plots (224–313 stems/0.5 m2). However, smooth cordgrass height did not significantly differ between treatments (amended: 65–68 cm; unamended: 60–63 cm). After 28–52 weeks, smooth cordgrass density remained greater in amended plots (135–213 stems/0.5 m2) than in unamended plots (121–164 stems/0.5 m2). Cordgrass was also significantly taller in amended plots (23–49 cm) than in unamended plots (15–35 cm). Finally, after 52

12. Habitat restoration and creation
392
weeks, above-ground cordgrass biomass did not significantly differ between treatments (amended: 3.4 g/0.25 m2; unamended: 6.3 g/0.25 m2). Methods: In July 2007, ten 0.5-m2 plots were established in a cordgrass-dominated salt marsh. Alginate (a carbon-rich seaweed extract) was added to five plots (80 g/plot, across ten 2-cm diameter x 10-cm deep holes). In the other five plots, holes were dug but alginate was not added. Live stem density and the height of the five tallest plants were recorded immediately before intervention and biweekly afterwards. Smooth cordgrass was cut from plots after one year, then dried and weighed.
(1) Cohen R.A. & Kern H. (2012) Alginate addition influences smooth cordgrass (Spartina alterniflora) growth and macroinvertebrate densities. Wetlands, 32, 51–58.
12.18.3 Add below-ground organic matter: freshwater swamps
We found no studies that evaluated the effects, on vegetation, of adding below-ground organic matter to restore or create freshwater swamps.
This means that we have not yet found any studies that have directly evaluated this intervention during our systematic journal and report searches. Therefore we have no evidence to indicate whether or not the intervention has any desirable or harmful effects.
12.18.4 Add below-ground organic matter: brackish/saline swamps
We found no studies that evaluated the effects, on vegetation, of adding below-ground organic matter to restore or create brackish/saline swamps.
This means that we have not yet found any studies that have directly evaluated this intervention during our systematic journal and report searches. Therefore we have no evidence to indicate whether or not the intervention has any desirable or harmful effects.
12.19 Add surface mulch
Background
Organic mulches (i.e. remains or waste products of living organisms) can be placed on the surface of wetlands to stabilize temperatures and humidity, and provide shade to germinating plants. This may create a more hospitable environment for vegetation establishment and growth. Mulches can also help to manage acidification by excluding oxygen from sediments and stimulating microbial processes that neutralize the acidity (Baldwin 2011). Carbon-rich organic matter may also help to shift the competitive balance away from invasive species in polluted environments, enriched in certain nutrients (Reever Morghan & Seastedt 1999; Tilman et al. 1999; Perry et al. 2004). Examples of substances than can be used as mulches include compost, straw, seagrass leaves and seaweed (macroalgae).
CAUTION: It may be necessary to sterilize mulch before applying it, with heat or radiation, to kill propagules of undesirable plants. Adding organic matter as a mulch may be less labour intensive than mixing it into the soil or sediment, but increases the risk of the material being washed away.
To be summarized as evidence for this intervention, studies must have added mulch that is largely free from plant propagules. The mulch should be used to help or manage existing vegetation, such as remnant patches of vegetation, or seedlings that germinate from seeds already present.

12. Habitat restoration and creation
393
Related interventions: Use covers/barriers to control problematic plants (9.13); Add cover other than mulch during marsh or swamp restoration/creation (12.20); Add surface mulch to complement planting (13.15).
Baldwin D. (2011) National Guidance for the Management of Acid Sulfate Soils in Inland Aquatic Ecosystems, Environment Protection and Heritage Council and the Natural Resource Management Ministerial Council, Australia.
Perry L.G., Galatowitsch S.M. & Rosen C.J. (2004) Competitive control of invasive vegetation: a native wetland sedge suppresses Phalaris arundinacea in carbon-enriched soil. Journal of Applied Ecology, 41, 151–162.
Reever Morghan K.J. & Seastedt T.R. (1999) Effects of soil nitrogen reduction on nonnative plants in restored grasslands. Restoration Ecology, 7, 51–55.
Tilman E.A., Tilman D., Crawley M.J. & Johnston A.E. (1999) Biological weed control via nutrient competition: potassium limitation of dandelions. Ecological Applications, 9, 103–111.
12.19.1 Add surface mulch: freshwater marshes
We found no studies that evaluated the effects, on vegetation, of using organic mulch to restore or create freshwater marshes.
This means that we have not yet found any studies that have directly evaluated this intervention during our systematic journal and report searches. Therefore we have no evidence to indicate whether or not the intervention has any desirable or harmful effects.
12.19.2 Add surface mulch: brackish/salt marshes
One study evaluated the effects, on vegetation, of using organic mulch to restore or create brackish/salt marshes. The study was in Australia.
VEGETATION COMMUNITY
Overall richness/diversity (1 study): One replicated, paired, controlled study on a sandflat in Australia1 found that mulched and unmulched plots had similar plant species richness over two years.
VEGETATION ABUNDANCE
Herb abundance (1 study): One replicated, paired, controlled study on a sandflat in Australia1 found that mulched plots were more likely to contain glasswort Sarcocornia quinqueflora than unmulched plots, after 20 months. However, mulching had no significant effect on glasswort biomass after 20 months, and typically had no significant effect on glasswort cover over two years.
VEGETATION STRUCTURE
A replicated, paired, controlled study in 1999–2001, aiming to create a saltmarsh on a lagoon sandflat in New South Wales, Australia (1) found that mulched plots were more likely to contain glasswort Sarcocornia quinqueflora than unmulched plots, but that mulching typically had no significant effect on glasswort biomass, glasswort cover or plant species richness (because of high variability between plots). After 20 months, glasswort was present in a significantly greater proportion of mulched plots (89%) than unmulched plots (56%). However, above-ground glasswort biomass was statistically similar in mulched (9–19 g/units not clear) and unmulched plots (8–11 g/units not clear). Over the two years following intervention, glasswort cover was statistically similar under each treatment in 6 of 10 comparisons (for which mulched: 4–43%; unmulched: 4–19%). In the other comparisons, mulching either increased

12. Habitat restoration and creation
394
glasswort cover or had variable effects across the site (see original paper). Meanwhile, plant species richness was similar under each treatment in 11 of 11 comparisons (mulched: 1–4 species/4 m2; unmulched: 1–3 species/4 m2). Methods: In October 1999, forty 4-m2 plots were established (in two sets of 20) on almost-bare sediment next to a patchy salt marsh. Twenty plots (10 plots/set) were mulched with seagrass and seaweed (5–10 cm layer). Mulch was reapplied when it thinned or was blown away. Plant species and cover were surveyed 10–11 times over two years after mulching. In June 2001, glasswort shoots were cut from 12 plots, then air-dried and weighed. Roughly half way through the study, some plots were damaged by motorbike riders (further details not reported).
(1) Chapman M.G. & Roberts D.E. (2004) Use of seagrass wrack in restoring disturbed Australian saltmarshes. Ecological Management & Restoration, 5, 183–190.
12.19.3 Add surface mulch: freshwater swamps
We found no studies that evaluated the effects, on vegetation, of using organic mulch to restore or create freshwater swamps.
This means that we have not yet found any studies that have directly evaluated this intervention during our systematic journal and report searches. Therefore we have no evidence to indicate whether or not the intervention has any desirable or harmful effects.
12.19.4 Add surface mulch: brackish/saline swamps
We found no studies that evaluated the effects, on vegetation, of using organic mulch to restore or create brackish/saline swamps.
This means that we have not yet found any studies that have directly evaluated this intervention during our systematic journal and report searches. Therefore we have no evidence to indicate whether or not the intervention has any desirable or harmful effects.
12.20 Add cover other than mulch
We found no studies that evaluated the effects, on vegetation, of using cover other than mulch to restore/create marshes or swamps.
This means that we have not yet found any studies that have directly evaluated this intervention during our systematic journal and report searches. Therefore we have no evidence to indicate whether or not the intervention has any desirable or harmful effects.
Background
Covers (such as plastic sheets, fleece or fibre mats) can be placed on a wetland surface to stabilize temperatures and humidity, and provide shade to germinating plants. This may create a more hospitable environment for establishment and growth of wetland vegetation. The precise effect of a cover may depend on the material and its height above the wetland.
To be summarized as evidence for this intervention, studies must have added covers without adding vegetation. The cover should be used to help or manage existing vegetation, such as remnant patches of vegetation, or seedlings that germinate from seeds already present.

12. Habitat restoration and creation
395
Related interventions: Use covers/barriers to control problematic plants (9.13); Add surface mulch (12.19); Add cover other than mulch to complement planting (13.16).
12.21 Introduce nurse plants
Background
Nurse plants (also known as companion plants or pioneer plants) can be planted to help naturally recolonizing vegetation (Padilla & Pugnaire 2006). Nurse plants may trap and stabilize sediments, trap propagules, reduce harsh environmental conditions (e.g. temperature fluctuations and strong sunlight), attract pollinators, deflect herbivory away from focal species, and/or limit weed establishment. CAUTION: Nurse plant species must be chosen carefully. Species that spread easily or are very strong competitors can cause more harm than good. For example, the non-native mangrove apple Sonneratia apetala has been used to restore Chinese mangroves, but has spread into neighbouring forests (Ren et al. 2009).
To be summarized as evidence for this intervention, studies must have reported the effects of the nurse plants on other vegetation, not just the survival or growth of the nurse plants. Studies must have explicitly planted vegetation for its nursing effect. Studies are summarized in Sections 12.22–12.26 if (a) the nurse plant is itself a desirable part of the final plant community, (b) if vegetation other than nurse plants is introduced, or (c) desirable vegetation is planted into existing nurse vegetation. Studies of the nursing effect of existing vegetation (e.g. Lewis & Dunstan 1975; McKee et al. 2007) are outside the scope of this synopsis.
Related interventions: introduce target marsh or swamp vegetation (12.22–12.26); Introduce nurse plants to complement planting of marsh/swamp vegetation (13.18).
Lewis R.R. & Dunstan F.M. (1975) The possible role of Spartina alterniflora Loisel in establishment of mangroves in Florida. Proceedings of the 2nd Annual Conference on Restoration of Coastal Vegetation in Florida, Tampa, Florida, 81–100.
McKee K.L., Rooth J.E. & Feller I.C. (2007) Mangrove recruitment after forest disturbance is facilitated by herbaceous species in the Caribbean. Ecological Applications, 17, 1678–1693.
Padilla F.M. & Pugnaire F.I. (2006) The role of nurse plants in the restoration of degraded environments. Frontiers in Ecology and the Environment, 4, 196–202.
Ren H., Lu H., Shen W., Huang C., Guo Q., Li Z. & Jian S. (2009) Sonneratia apetala Buch.Ham in the mangrove ecosystems of China: an invasive species or restoration species? Ecological Engineering, 35, 1243–1248.
12.21.1 Introduce nurse plants: freshwater marshes
We found no studies that evaluated the effects, on naturally colonizing vegetation, of introducing nurse plants to restore or create freshwater marshes.
This means that we have not yet found any studies that have directly evaluated this intervention during our systematic journal and report searches. Therefore we have no evidence to indicate whether or not the intervention has any desirable or harmful effects.
12.21.2 Introduce nurse plants: brackish/salt marshes
We found no studies that evaluated the effects, on naturally colonizing vegetation, of introducing nurse plants to restore or create brackish/salt marshes.

12. Habitat restoration and creation
396
This means that we have not yet found any studies that have directly evaluated this intervention during our systematic journal and report searches. Therefore we have no evidence to indicate whether or not the intervention has any desirable or harmful effects.
12.21.3 Introduce nurse plants: freshwater swamps
We found no studies that evaluated the effects, on naturally colonizing vegetation, of introducing nurse plants to restore or create freshwater swamps.
This means that we have not yet found any studies that have directly evaluated this intervention during our systematic journal and report searches. Therefore we have no evidence to indicate whether or not the intervention has any desirable or harmful effects.
12.21.4 Introduce nurse plants: brackish/saline swamps
One study evaluated the effects, on naturally colonizing vegetation, of introducing nurse plants to restore or create brackish/saline swamps. The study was in India.
VEGETATION COMMUNITY
VEGETATION ABUNDANCE
VEGETATION STRUCTURE
Height (1 study): One study on an estuarine mudflat in India1 reported that the average height of mangrove propagules trapped by nurse grasses increased by 21–90% (depending on the species) over the first month after establishment.
OTHER
Germination/emergence (1 study): One study on an estuarine mudflat in India1 reported that 60–80% (depending on the species) of mangrove propagules trapped by nurse grasses developed into seedlings. Saltmarsh grasses trapped 1,200–1,372 mangrove propagules/m2/week, approximately 1–2 years after they were planted.
A study in 2013–2016 on an estuarine mudflat in northeast India (1) reported that an area planted with saltmarsh grasses trapped mangrove propagules, that the majority of these propagules established, and the average height of established propagules increased. In the two monsoon seasons approximately 18–30 months after planting, grassy vegetation patches trapped an average of 1,200–1,372 mangrove propagules/m2/week. Between 60 and 80 per cent of trapped propagules developed into seedlings (depending on species). The average height of established seedlings increased by 21–90% taller over the first month after establishment (depending on species). Methods: In 2013, four grass species were transplanted from nearby marshes to an estuarine mudflat (lower and middle intertidal zones; water salinity 19–34 ppt). There were mangrove forests elsewhere in the estuary as a source of propagules. The resulting grassy vegetation patches were surveyed weekly in the 2014–2015 and 2015–2016 monsoon seasons. Mangrove propagules were counted along 10 x 100 m transects. Seedlings were counted and measured in 100-m2 subplots as soon as they had established, then measured again one month later.
(1) Begam M.M, Sutradhar T., Chowdhury R., Mukherjee C., Basak S.K. & Ray K. (2017) Native salt-tolerant grass species for habitat restoration, their acclimation and contribution to improving edaphic conditions: a study from a degraded mangrove in the Indian Sundarbans. Hydrobiologia, 803, 373–387.

12. Habitat restoration and creation
397
Introduce emergent vegetation
12.22 Directly plant whole plants
Background
This intervention involves planting whole emergent plants, directly into soil or sediment, to restore/create marshes or swamps. These plants might be individual seedlings, rooted cuttings or mature plants. Plants may be raised in greenhouses/ laboratories, or collected from natural sites (with potential damage to donor site; Laegdsgaard 2002).
Introduction of target vegetation might be useful in severely degraded or bare sites – which may lack remnant plants or seed banks to kick start revegetation with desirable species, and may be at risk of being taken over by undesirable species (Brown & Bedford 1997). It might also be useful in isolated wetlands, far from sources of marsh or swamp plant propagules. However, note that up-front costs can be high.
The effects of planting may be highly dependent on the environmental conditions in each study. Questions you might ask when interpreting the evidence include: Is the study site degraded? Where and when was vegetation planted? Was there any intervention to improve conditions before planting? What were the environmental conditions over the duration of the study?
The scope of this intervention does not include planting nurse plants; planting submerged or floating plants; planting to restore bogs, fens, fen meadows or peat swamp forests (see Taylor et al. 2018); planting facultative wetland plants in upland sites; or planting for commercial purposes (e.g. mangrove plantations; Kaly & Jones 1998). In contrast, the scope does include planting non-native species to conserve marshes or swamps – whilst acknowledging that this is often considered ethically unacceptable due to the risk of invasion (e.g. Ren et al. 2009).
Related interventions: Introduce vegetation fragments (12.23); Introduce seeds or propagules (12.24); Transplant or replace blocks of vegetation (12.25); Transplant or replace wetland soil (12.26); Introduce organisms to control problematic plants (9.14); Introduce nurse plants (12.21); Restore/create marshes or swamps using multiple interventions, often including planting (12.2); interventions to complement planting (Chapter 13).
Brown S.C. & Bedford B.L. (1997) Restoration of wetland vegetation with transplanted wetland soil: an experimental study. Wetlands, 17, 424–437.
Kaly U.L. & Jones G.P. (1998) Mangrove restoration: a potential tool for coastal management in tropical developing countries. Ambio, 27, 656–661.
Laegdsgaard P. (2002) Recovery of small denuded patches of the dominant NSW coastal saltmarsh species (Sporobolus virginicus and Sarcocornia quinqueflora) and implications for restoration using donor sites. Ecological Management & Restoration, 3, 202–206.
Ren H., Lu H., Shen W., Huang C., Guo Q., Li Z. & Jian S. (2009) Sonneratia apetala Buch.Ham in the mangrove ecosystems of China: an invasive species or restoration species? Ecological Engineering, 35, 1243–1248.
Taylor N.G., Grillas P. & Sutherland W.J. (2018) Peatland Conservation: Global Evidence for the Effects of Interventions to Conserve Peatland Vegetation. Synopses of Conservation Evidence Series. University of Cambridge, Cambridge.
12.22.1 Directly plant non-woody plants: freshwater wetlands

12. Habitat restoration and creation
398
Twenty-four studies evaluated the effects, on vegetation, of directly planting emergent, non-woody plants in freshwater wetlands. Sixteen studies were in the USA1,3,4,7,8,10,11,13–16,17a,17b,18,19,23. There was one study in each of Guam2, the Netherlands5, Israel6, Ireland9, the UK12, Italy20, Australia21 and China22. Two pairs of studies in Minnesota8,10 and South Dakota17a,17b took place in the same area but used different experimental set-ups.
VEGETATION COMMUNITY
Community composition (1 study): One replicated, site comparison study around fresh/brackish lakes in Australia21 reported that as planted rush stands aged, their near-shore plant community became more similar to that behind mature natural rush stands.
Overall richness/diversity (9 studies): Two studies (including one replicated, randomized, controlled) in freshwater marshes in China22 and the USA23 reported that planting herbs increased plant species richness22,23 and/or diversity22 for up to five years. Two controlled studies in freshwater marshes in the USA1,11 reported that planted and unplanted sites had similar plant species richness after 2–3 years. Three studies in the USA1, the UK12 and Australia21 compared plant species richness in marshes that had been planted with herbs (sometimes1,12 along with other interventions) and natural marshes, and reported that it was never higher in planted marshes. Three studies involving freshwater marshes in Guam2, the USA4 and Italy20 simply quantified plant species richness for up to 13 years after planting herbs (along with other interventions).
Characteristic plant richness/diversity (1 study): One replicated, paired, controlled study in freshwater wetlands in the USA11 found that plots planted with wetland-characteristic herbs had a similar richness of wetland-characteristic plant species, after three years, to unplanted plots.
VEGETATION ABUNDANCE
Overall abundance (4 studies): One before-and-after study of a freshwater marsh and wet meadow in China22 found that vegetation cover was greater five years after planting herbs than in the year before planting. One replicated, paired, controlled study in freshwater wetlands in the USA11 found that plots planted with herbs had similar overall vegetation cover, after three years, to unplanted plots. One replicated, site comparison study around fresh/brackish lakes in Australia21 found that as planted rush stands aged, the density of plants in adjacent near-shore vegetation became more similar to mature natural stands. One study in a freshwater marsh in the USA13 simply quantified vegetation cover and density over 1–9 years after planting herbs (along with other interventions).
Characteristic plant abundance (1 study): One replicated, paired, controlled study in freshwater wetlands in the USA11 found that plots planted with wetland-characteristic herbs had greater cover of wetland-characteristic plants, after three years, than unplanted plots.
Individual species abundance (13 studies): Thirteen studies2,5,6,8,11–13,16,17a,17b,18,19,21 quantified the effect of this intervention on the abundance of individual plant species. For example, one replicated, paired, controlled study in freshwater wetlands in the USA11 found that both planted herb species had greater cover in planted than unplanted plots, after three years. Three studies in the UK12, the USA16 and Australia21 compared the abundance of herb species where they had been planted to their abundance in natural marshes: two12,16 found that the planted species was more dense in planted than natural areas after 5–14 years, and one21 found that planted rush stands became more dense (i.e. more like natural stands) as they aged.
VEGETATION STRUCTURE
Overall structure (1 study): One replicated, site comparison study around fresh/brackish lakes in Australia21 reported that as planted rush stands aged, their width increased – becoming more like mature natural stands.

12. Habitat restoration and creation
399
Height (4 studies): One replicated, site comparison study around fresh/brackish lakes in Australia21 reported that as planted rush stands aged, their maximum height increased – becoming more like mature natural stands. One before-and-after study of a freshwater marsh and wet meadow in China22 found that vegetation was taller five years after planting herbs than in the year before planting. One site comparison study of wet meadows in the USA16 reported that sedge tussocks in a restored meadow were shorter than sedge tussocks in natural meadows, 11–14 years after planting (along with other interventions). One replicated study in wet basins in the USA8 simply reported an increase in the average height of a herb species over three growing seasons after it was planted.
Diameter/perimeter/area (1 study): One site comparison study of wet meadows in the USA16 reported that sedge tussocks in a restored meadow had a smaller perimeter than sedge tussocks in natural meadows, 11–14 years after planting (along with other interventions).
Basal area (1 study): One site comparison study of wet meadows in the USA16 reported that the basal area of sedge tussocks was lower in a restored meadow than in natural meadows, 11–14 years after planting (along with other interventions).
Individual plant size (2 studies): Two replicated studies in wet meadow restoration sites in the USA7,10 reported that the size of Carex stricta seedlings increased over two months or three growing seasons after planting. This was true for the average number of shoots/plant7,10 and biomass/plant10.
OTHER
Survival (14 studies): Nine studies (eight replicated) in the USA3,8,10,15,17b,18,19,23 and Israel6 quantified survival rates of individual herbs planted in freshwater wetlands. Survival rates ranged from 0% to 100% after 1–3 growing seasons. Eight studies (including five replicated and two before-and-after) in Guam2, the USA3,4,14,17a,19, the Netherlands5 and Israel6 reported 0% survival or absence of planted (or sown14) herb species, in at least some cases, after three months to seven years. Proposed factors affecting survival included elevation/water levels2,6,8,10,17a,18, herbivory3,5,6, time of planting15
and plug type15.
Growth (2 studies): Two studies monitored true growth of individual herbs (rather than changes in average height of survivors). The two studies (one replicated) in Ireland9 and the USA18 reported that herbs grew over 1–2 growing seasons after planting.
A controlled, site comparison study in 1978–1980 of four freshwater marshes in Florida, USA (1) reported that an excavated marsh planted with wetland herbs contained a similar number of plant species to both unplanted and natural marshes. Statistical significance was not assessed. After two years, the planted marsh contained 76 vascular plant species (vs 70 in the unplanted marsh and 76–88 in natural marshes). The planted marsh was dominated by the three planted species whereas the unplanted marsh was dominated by broadleaf cattail Typha latifolia (cover was not quantified). Methods: In summer 1978, two 0.16-ha depressions were excavated in rangeland. One was then planted with three herb species collected from nearby marshes: maidencane Panicum hemitomon, pickerelweed Pontederia lanceolata and common rush Juncus effusus. The other depression was left unplanted. The whole site was seeded with pioneer herbs before planting (to prevent erosion) and limed and fertilized after. In summer 1980, plant species were recorded in each excavated marsh and two natural marshes, along a transect extending from the centre to the edge of each.
A before-and-after study in 1992–1993 on a tourist resort in Guam (2) reported that a freshwater pool created by excavation, lining with wetland soil and planting

12. Habitat restoration and creation
400
herb species contained two of the four planted species after one year, and four additional species. The two planted species present after one year were spikerush Eleocharis dulcis (60% cover) and rusty flatsedge Cyperus oderatus (<1% cover). All planted taro Colocasioa esculenta died; the study suggests it was “excessively flooded”. Planted water lettuce Pistia stratioides was deliberately removed after five months, when it had reached 20% cover. Four additional species were present after one year: two rushes, one grass and one forb (<1–10% cover). Methods: In January 1992, a 600-m2 wetland was excavated on a natural valley slope, lined with wetland soil (30 cm deep) and planted with four herbaceous species (120 spikerush, an unclear number of rusty flatsedge, 20 taro, 5% cover of water lettuce). The study does not distinguish between the effects of these interventions on non-planted vegetation. The wetland was fed by ground and surface water, and had a stable 20–60 cm water depth. Final vegetation cover was estimated in January 1993.
A replicated study in 1993–1994 in a freshwater marsh in Ontario, Canada (3) reported 0–100% survival of planted emergent herbs, depending on water depth and use of silt screens. Vegetation was surveyed approximately one year after planting. Across three plots in shallow water (15–20 cm at planting), approximately 24% of arrowheads Sagittaria latifolia and 10% of broadleaf cattails Typha latifolia survived. Cattail survival was also reported, but not quantified, in two other shallow-water plots. In seven of eight plots in deep water (≥30 cm at planting), no arrowheads survived. In the other plot, surrounded by a fine-mesh silt screen, all planted arrowheads had survived and spread. Methods: In August 1993, volunteers planted 90 plants into each of thirteen 6-m2 plots in Cootes Paradise Marsh: 30 arrowhead, 30 cattails and 30 submerged plants. All plots were fenced in an attempt to exclude muskrats Ondatra zibethicus, but they entered at least eight plots and ate the above-ground vegetation. Vegetation was surveyed in July and August 1994.
A study in 1991–1993 of an excavated and planted freshwater wetland in Ohio, USA (4) reported that it developed vegetation cover, including 13 of 17 planted herb species, after 18 months. Eighteen months after planting, 50 herbaceous plant species were recorded in the marsh and wet meadow zones (vs 35 after six months and 44 after 15 months). Of these, 13 were planted species (12 emergent marsh and wet meadow species, plus one cover crop). The other 37 species had colonized spontaneously. No submerged vegetation was recorded within pools in the wetland. Methods: In spring 1992, seventeen wetland herb species (including three intended as cover crops) were planted into flooded and saturated areas of an excavated wetland (two connected basins; 6.1 ha total area; excavated from former farmland in autumn 1991). In autumn 1992, summer 1993 and autumn 1993, herbaceous plant species were recorded along six transects spanning the wetland. The study does not distinguish between the effects of planting and excavation on non-planted vegetation.
A replicated study in 1987–1989 of lakeshores planted with bulrushes Scirpus spp. in the Netherlands (5) reported that where bulrushes persisted over three growing seasons, their density, biomass and extent increased. Statistical significance was not assessed. After three growing seasons, lakeshore bulrush Scirpus lacustris ssp. lacustris was present in all three sites where it was planted. There were 370–390 shoots/m2 with 1,730–2,360 g/m2 biomass (vs only 70–130 shoots/m2 and 90–430 g/m2 biomass after one growing season). Saltmarsh bulrush Scirpus maritimus was present in two of three sites where it was planted. There were 70–220 shoots/m2 with 310–1,070 g/m2 biomass (vs only 20–40 shoots/m2 and 30–60 g/m2 biomass after one growing season). In the other site, plants were uprooted by muskrats Ondatra

12. Habitat restoration and creation
401
zibeticus. Finally, in four of four cases with data, bulrush had spread outside planted plots (by 27–372 cm, on average). Methods: In spring 1987, each bulrush species was transplanted (12 plants/m2) into 24 plots (6–25 m2) across three sites. All sites were at the margins of freshwater lakes and two were tidal. Half of the plots were fertilized at planting and all were fenced to exclude waterfowl. Bulrush shoots were counted, and above-ground dry biomass estimated from length-mass relationships, in spring and summer until August 1989. Lateral spread was recorded in July 1989.
A study in the mid-1990s in a reflooded freshwater wetland in Israel (6) reported variable survival of five planted emergent species. Three species were planted in saturated soils, without protection from herbivores. Survival rates were low for dwarf waterclover Marsilea minuta (0 of 12 alive eight months after planting) and flowering rush Butomus umbellatus (1 of 19 alive four months after planting). Cover of water purslane Ludwigia palustris increased from 0.2 m2 when planted to 1.8 m2 after 26 months. For the other two species survival rates depended on soil type, water depth and/or herbivore protection. For example, the highest survival of yellow flag iris Iris pseudacorus occurred in peat soils, in 30 cm of water and with herbivore protection (75% of 16 plants alive after 18 months). The highest survival of papyrus Cyperus papyrus occurred in peat soils, without standing water and without herbivore protection (86–89% of 36 plants alive after 12 months). Methods: Plants native to the study area were planted into recently rewetted cropland. The plants were sourced from nearby natural wetlands, botanical gardens or private collections. Some plants were protected from herbivores with wire mesh (5 x 5 cm holes) and plastic netting. The study does not report precise planting and survey dates.
A replicated, paired, controlled study in 1992 in a wet meadow restoration site in Iowa, USA (7) reported that the number of shoots on tussock sedge Carex stricta seedlings increased over two months after planting. Statistical significance was not assessed. Two weeks after planting, there were 4.7–5.8 shoots/plant. Two months after planting, there were 11.5–15.5 shoots/plant. Adding compost or fertilizer sometimes increased the number of shoots/plant, but adding topsoil never had a clear effect (see Sections 13.11, 13.13 and 13.14). Methods: In June 1992, tussock sedge seedlings were planted into twelve sets of eight 1-m2 plots of mineral soil (topsoil had been removed). The number of seedlings/plot was not clearly reported. Seven plots/set were amended with topsoil, Scott’s® Starter Fertilizer and/or composted garden waste.
A replicated, before-and-after study in 1995–1997 in three recently excavated wet basins in Minnesota, USA (8) reported >37% survival of lake sedge Carex lacustris in each of the three years after planting, and increases in sedge biomass, density and height over time. In the first growing season after planting, the sedge survival rate ranged from 37% in the wettest plots to 95% in the driest. In the next two growing seasons, the average survival rate across all plots was ≥95%. Amongst variation related to planting density, water regime, elevation and weeding treatments (see Sections 13.5 and 13.20), there were significant increases over time in sedge biomass (from 12–81 g/m2 after one growing season to 272–1,160 g/m2 after three growing seasons), density (from <20 stems/m2 when planted to 143–219 stems/m2 after three growing seasons) and average height (from <35 cm when planted to 88–102 cm after three growing seasons). Maximum height also increased, but this was not statistically tested (<80 cm when planted; 139–158 cm after three growing seasons). Methods: In May 1995, nursery-reared lake sedge was planted into 48 bare, 5-m2 plots (10 or 45 plants/plot) across three wet basins (same as in Study 10). Each basin was managed

12. Habitat restoration and creation
402
with a different water regime: falling, stable or rising throughout the growing season. The plots were situated at four different elevations, and half were weeded (colonizing plants removed) throughout the study. Vegetation was surveyed through the 1995, 1996 and 1997 growing seasons.
A study in 1996–1997 in a mine tailing pool in Ireland (9) reported that planted floating sweetgrass Glyceria fluitans grew. Over 6–14 months after planting, the sweetgrass plants grew 0.5–2.9 shoots/month. Live above-ground biomass increased by 0.1–0.6 g/month. A batch of sweetgrass planted in deeper water in spring grew faster than a batch planted in shallower water the previous autumn (see original paper). Methods: A total of 21 wild-collected sweetgrass plants (runners with two shoots; 5.5–7.0 g fresh mass) were planted into a pool of mining waste. Fourteen plants were planted in July 1996 (in 20–30 cm deep water, but water table dropped below surface in summer). Seven plants were planted in March 1997 (in 30–50 cm deep water, with sediment always waterlogged). In September 1997, all sweetgrass shoots were counted then harvested, dried and weighed.
A replicated study in 1995–1997 in three recently excavated wet basins in Minnesota, USA (10) reported >48% survival of planted tussock sedge Carex stricta in each of the three years after planting, and increases in sedge biomass and stem number over time. In the first growing season after planting, the sedge survival rate ranged from 48% in the wettest plots to 99% in the driest. In the next two growing seasons, the survival rates in all plots were ≥90%. Amongst variation related to water regime, elevation and weeding treatments (see original paper), there were significant increases over time in sedge biomass (from 2–16 g/plant after one growing season to 49–234 g/plant after three growing seasons) and stem number (from <5 stems/plant when planted to 50–310 stems/plant after three growing seasons). Methods: In May 1995, nursery-reared tussock sedge was planted into 48 bare, 5-m2 plots (10 or 45 plants/plot) across three wet basins (same as in Study 8). Each basin was managed with a different water regime: falling, stable or rising throughout the growing season. The plots were situated at four different elevations, and half were weeded (colonizing plants removed) throughout the study. Vegetation was surveyed through the 1995, 1996 and 1997 growing seasons.
A replicated, paired, controlled study in 2001–2004 in 12 ephemeral freshwater wetlands undergoing restoration in South Carolina, USA (11) found that plots planted with southern cutgrass Leersia hexandra and maidencane Panicum hemitomon had greater cover of wetland-characteristic vegetation than unplanted plots, but similar overall vegetation cover and species richness. After approximately three years, planted plots had greater cover of wetland-characteristic vegetation (overall: 65–79%; cutgrass and maidencane: 41–66%) than unplanted plots (overall: 54%; cutgrass and maidencane: 0%). However, total vegetation cover did not significantly differ between treatments (planted: 87–100%; unplanted: 90%). The same was true for plant species richness: both for wetland-characteristic species, including cutgrass and maidencane (planted: 3.8–4.1 species/4 m2; unplanted: 4.7 species/4 m2) and all species (planted: 6.8–7.4 species/4 m2; unplanted: 8.7 species/4 m2). The study also reported data from one year after intervention, during a drought (see original paper). Methods: Twenty-four plots (each 80–150 m2) were established across 12 wetlands undergoing restoration (drainage ditches plugged and trees cleared in 2000–2001). In April–May 2001, southern cutgrass and maidencane were each transplanted into 12 plots (1 plot/wetland; 2–3 plants/m2, giving 1–4% cover). In August 2002 and 2004, plant species and cover (excluding resprouting trees) were recorded in three 4-m2 quadrats/wetland: one quadrat/plot and one in the adjacent, unplanted area.

12. Habitat restoration and creation
403
A before-and-after, site comparison study in 1996–2008 aiming to restore a reedbed on farmland in England, UK (12) found that an area planted with common reed Phragmites australis (after excavating wet basins) contained a greater density of reeds but fewer plant species than a nearby natural reedbed. The restored area was initially drained farmland. Five years after planting finished, the restored area contained a greater density of live reeds (96 stems/m2) than the natural reedbed (63 stems/m2). There was no significant difference in the density of dead reeds (restored: 52; natural: 48 stems/m2). Although the restored area contained fewer plant species than the natural reedbed at a large scale (restored: 5; natural: 9 species/30 m2), both sites had the same species richness at a small scale (3 species/2 m2). Statistical significance of these richness results was not assessed. Methods: Between 1996 and 2003, a quarter of a million common reed stems were planted into 300 ha of excavated wet basins. The study does not distinguish between the effects of reed planting and excavation on non-planted vegetation. In August 2008, reed stems and plant species and were recorded in thirty 2-m2 quadrats: 15 in the restoration area and 15 in a natural (never-farmed) reedbed.
A study in 1997–2006 of a levelled, irrigated and partially planted freshwater marsh in California, USA (13) reported that it developed vegetation dominated by emergent plants, including planted tule Schoenoplectus acutus – although vegetation cover and density depended on the water level. After 2–9 years, the shallower half of the site had 89–98% total vegetation cover. This included 77–81% cattail Typha spp., 11–19% tule and 0–5% submerged vegetation cover. Emergent vegetation density fluctuated between 49 and 76 stems/m2. The deeper half of the site had 77–100% total vegetation cover, including 38–58% cattail, 3–8% tule, and 10–46% submerged vegetation cover. Emergent vegetation density fluctuated between 44 and 59 stems/m2. Across the entire site, above-ground biomass of emergent vegetation was 1,630 g/m2 after 1–3 years (vs submerged, floating and algae combined: 389 g/m2) then fluctuated between 925 and 2,360 g/m2 for the following six years. Methods: In autumn 1997, tule was planted into 0.5 ha of a 6-ha site: 0.25 ha in the shallower half (25 cm water depth) and 0.25 ha in the deeper half (55 cm water depth). The site used to be farmland, but had been levelled before planting and was continuously irrigated after. The study does not distinguish between the effects of planting, levelling and irrigation on non-planted vegetation. All plants and algae were surveyed along transects, in summer/autumn, at least biennially between 1998 and 2006. Biomass was cut, dried and weighed (years 1–3) or estimated from plant height and diameter (years 4–9).
A replicated study in 2005–2006 of 22 lakeshore restoration sites in Minnesota, USA (14) reported that 17–40% of planted/sown species reliably established across multiple sites, and that no planted/sown species established in some individual sites. In the seasonally flooded zone, only 22 of 128 planted/sown species reliably established (survived in >75% of sites where planted, or ≥25% cover in ≥1 site). Fifty-six species failed to establish at any site. However, some planted/sown species established at 100% of sites. In the permanently flooded zone, 10 of 25 planted/sown species reliably established. Six species failed to establish at any site. Planted/sown species completely failed to establish at 27% of sites. Methods: In summer 2005 and spring 2006, plant species and their cover were surveyed in 22 urban lakeshore restoration projects. Native plants had been introduced between 1999 and 2004. Species lists were obtained from project reports or interviews with staff. Almost all introduced plants were emergent herbs, and most (but not all) were wetland species. Some plants were directly planted (as plugs or on pre-vegetated coconut-fibre mats)

12. Habitat restoration and creation
404
and some were sown. The study does not distinguish between the effects of planting and sowing. Most sites were protected with fences and/or wave breaks, at least for the first growing season after planting/sowing.
A replicated study in 2006–2007 along the shores of five freshwater lakes in Minnesota, USA (15) reported 15% overall survival of planted softstem bulrush Schoenoplectus tabernaemontani plugs after approximately one year. The survival rate per lake ranged from 4% to 31%. It was significantly affected by month of planting and plug type, but not water depth. For example, plugs grown in pots and planted in June had the highest survival rate (39%) whilst plugs grown in pots and planted in August or grown in mats and planted in September had the lowest survival rate (3%). Methods: Between May and September 2006, a total of 3,750 bulrush plugs were planted along degraded shorelines within five urban lakes (150 plugs/month/lake, spaced 45 cm apart). Each greenhouse-reared plug contained 3–5 individual plants. Biomass at planting varied between months. Half of the plugs had been grown in pots and half on coconut fibre mats. Half were planted in shallow water (maximum depth 0–30 cm) and half in deep water (maximum depth 31–60 cm). All planted areas were fenced to exclude muskrats Ondatra zibethicus. Plugs containing ≥1 live plant were recorded until May–June 2007.
A site comparison study in 2008 of five sedge meadows in Illinois and Wisconsin, USA (16) found that a restored meadow – planted with plugs of tussock sedge Carex stricta, after removing trees and excess sediment – contained more but smaller sedge tussocks than nearby natural meadows after 11–14 years. In four of four comparisons, the restored meadow contained a greater density of sedge tussocks (8.4 tussocks/m2) than natural meadows (4.5–5.6 tussocks/m2). Sedge tussocks were also smaller in the restored meadow than in the natural meadows. This was true in four of four comparisons for height (restored: 5 cm; natural: 11–18 cm), perimeter (restored: 39 cm; natural: 51–82 cm) and volume (restored: 560 cm3; natural: 2,342–6,604 cm3). The basal area of tussocks in the restored meadow was only 0.07 m2/m2, compared to 0.12–0.23 m2/m2 in the natural meadows (statistical significance not assessed). Methods: In 2008, sedge tussocks were surveyed in one restored and four natural sedge meadows (15–30 quadrats/meadow, each 1 m2). The restored meadow was formerly a wooded floodplain. Trees and accumulated sediment were removed, then plugs of tussock sedge planted 30 cm apart, between 1994 and 1997. The study does not distinguish between the effects of these interventions on any non-planted sedges.
A replicated, before-and-after study in 2010–2013 in a seasonally flooded depression on farmland in South Dakota, USA (17a) reported that planted prairie cordgrass Spartina pectinata occurred in 65–86% of sampled quadrats after two growing seasons and 90–100% of quadrats after four, depending on elevation. Two growing seasons after planting, 65% of quadrats at low elevations (≤10 cm from wetland bottom) and 86% of quadrats at higher elevations (>10 cm from wetland bottom) contained at least one cordgrass stem. Four growing seasons after planting, cordgrass plants had spread and there was at least one stem in 100% of quadrats at low elevations and 90% of quadrats at higher elevations. Methods: Four plots were established in a historically cultivated ephemeral wetland. Each plot ran perpendicular to the slope of the wetland, so included a range of elevations. Spring floodwaters were typically 50 cm deep. In spring 2010, each plot was planted with >760 greenhouse-reared cordgrass plugs (90 cm apart). All plots were mown once in 2011 to control weeds. Each autumn from 2011 to 2013, cordgrass presence was surveyed in 1-m2 quadrats along the length of each plot. This study used the same farm as (17b), but used a different experimental set-up.

12. Habitat restoration and creation
405
A replicated study in 2008–2013 in two seasonally flooded depressions on farmland in South Dakota, USA (17b) reported 91% survival of transplanted prairie cordgrass Spartina pectinata after one growing season. The study also measured wet, above-ground vegetation biomass. After two growing seasons, cordgrass biomass was greater in plots with closely spaced transplants (0.9 m apart: 4 Mg/ha) than loosely spaced transplants (1.5 m apart: 2 Mg/ha). After 3–6 growing seasons, total above-ground biomass (including plants other than cordgrass) did not significantly differ between transplant density treatments (closely spaced: 10–16 Mg/ha; loosely spaced: 8–14 Mg/ha). Methods: In May–July 2008, greenhouse-reared cordgrass plugs were transplanted into two historically cultivated, ephemeral wetlands (corn and soybean fields in the years before planting). Half of each wetland was planted at each transplant spacing. The wetlands were sprayed with herbicide before planting, and individual invasive plants were sprayed or pulled up after planting. Cordgrass survival was monitored in October 2008. Between 2009 and 2013, vegetation was cut from an average of twenty-four 1-m2 quadrats/wetland/year, then weighed in the field. This study used the same farm as (17a), but used a different experimental set-up.
A replicated study in 2012–2013 in a freshwater wetland in Wisconsin, USA (18) reported 27–100% survival of planted tussock sedge Carex stricta over 1–2 growing seasons, and that survivors grew. Survival rates depended on how wet plots were, and how sedges were planted. Survival was lowest for sedges planted into 16-cm-tall soil mounds in a drier area (27% after two growing seasons) and highest into 8-cm-tall mounds, peat pots or flat ground in a wetter area (100% after two growing seasons). Surviving plants grew, on average – although not in all cases during the first growing season (2012), when there was a drought (see original paper for data). After 1–2 growing seasons, planted plots contained 3–70% tussock sedge cover. As for survival, variation was related to plot wetness and planting method. Methods: Across spring 2012 and 2013, a total of 300 nursery-reared tussock sedges were planted into 60 plots in a wetland undergoing restoration (five sedges/plot). An invasive shrub that had colonized the site was cut down in January each year. Half of the plots were in a wetter area and half in a drier area. The sedges were planted into mounds, hollows or peat pots in 48 of the plots, and into flat ground in the other 12 plots. Sedges planted in 2012 were regularly watered and weeded. Survival and cover were surveyed in June–August 2013. Growth rates were calculated from leaf lengths measured in 2012 and 2013.
A replicated study in 2010–2012 in a tidal freshwater marsh in California, USA (19) reported that planted sedges and reeds survived for three months in 10 of 12 cases, but were present after two years in only 2 of 12 cases. Three species were planted in each of four areas. After three months, all four areas contained planted California bulrush Schoenoplectus californicus (44–94% of individual plants alive) and hardstem bulrush Schoenoplectus acutus (25–75% of individual plants alive). However, only two of four areas contained planted broadleaf cattail Typha latifolia (where 25–56% of individual plants were alive). After 24 months, the bulrush species were each present in only one of four areas (area covered: 0.1–2.4 m2) and broadleaf cattail was not present in any area. For all species, initial survival was statistically similar in open water areas (0–94%) and on the marsh fringe (0–75%). Methods: In June 2010, one hundred and ninety two nursery-grown plants were planted into four areas within the marsh (16 plants/species/area). Survival was quantified in September 2010. Cover was measured until June 2012. The study areas were flooded for 82–99% of each summer.

12. Habitat restoration and creation
406
A study in 2005–2013 of an excavated, planted and harvested water treatment marsh in Sardinia, Italy (20) reported that it supported 275 plant taxa. This included 201 plant species in 161 genera. Approximately 63% of the taxa were Mediterranean (found predominantly or solely in this region) and approximately 16% were known non-natives in Italy. As expected in the study area, 56% of the taxa were annual plants that complete their life cycle rapidly in favourable conditions (“thereophytes”). Only 2% of taxa had underwater resting buds (“hydrophytes”). Methods: Between 2005 and 2013, plant taxa were recorded in the 37-ha EcoSistema Filtro marsh, which had been constructed with the dual aims of habitat creation and water treatment. There were monthly surveys (a) across the whole site, including banks and upland areas, and (b) in three 16-m2 plots, each April–July and September–December. The wetland had been constructed by excavating basins of varying salinity and levees (including removal of all existing vegetation; beginning 1990) and planting bundles of 2-m-tall common reed Phragmites australis (2004). Some “plant biomass” was mechanically removed between 2005 and 2007. Note that this study evaluates the combined effect of these interventions, and does not separate results from fresh, brackish and saline areas.
A replicated, site comparison study in 2013–2015 around two fresh/brackish lakes in South Australia (21) found that planted stands of river club-rush Schoenoplectus tabernaemontani became more similar to mature natural stands over time – in terms of structure and rush abundance – and supported similar near-shore vegetation to the natural stands within 8 years. Older planted rush stands were more similar to mature natural stands in terms of stand width (young planted: 1–3 cm; old planted: 5–12 cm; natural: 35 cm), maximum height (young: 60–142 cm; old: 131–152 cm; natural: 155 cm) and stem density (data not reported). All stands were a similar average height (data not reported). Near-shore vegetation (i.e. between the rush stands and the shoreline) behind older planted rush stands was similar to that behind mature natural stands, whereas young planted stands supported similar near-shore vegetation to areas without rush stands. This was true for overall community composition (data reported as graphical analyses; statistical significance of differences not assessed), plant species richness (no rushes: 30; young: 45; old: 150; natural: 330 species/site) and abundance (no rushes: 940; young: 1,370; old: 14,000; natural: 31,300 plants/site). Methods: In autumn 2013–2015, vegetation was surveyed at 21 sites on the margins of two connected fresh/brackish lakes. Ten sites had been planted with nursery-reared rushes (1 m apart): six sites ≤3 years ago (young plantings) and four sites 8–11 years ago (old plantings). Three sites had mature natural rush stands (≥20 years old) and eight had no rushes. All sites were fenced to exclude livestock. Rush stands were surveyed in five 1-m2 quadrats/site/ year. Other near-shore vegetation was surveyed in approximately thirty-six 3-m2 quadrats/site/year.
A before-and-after study in 2008–2014 in two sites containing freshwater marshes and wet meadows in southern China (22) reported that after planting herbs into the wetlands (and a polluted river feeding them), plant species richness, diversity, cover, biomass and height all increased. Statistical significance was not assessed. The sites contained 13–14 plant species before planting but 26–42 plant species five years after. In the one site for which data were reported, marsh and wet meadow habitats experienced increases in plant diversity (data reported as diversity indices), total vegetation cover (from 22–64% to 64–93%), total vegetation biomass (from 520–638 g/m2 to 768–919 g/m2) and vegetation height (from 43–86 cm to 86–161 cm). Methods: In May 2009, two degraded wetland sites were planted with herbaceous

12. Habitat restoration and creation
407
plants (number of species not reported). In one site, a lakeshore marsh was planted with emergent and floating herbs. In the other site, slightly uphill from the lake, marshes and meadows were planted with forbs and grasses. The river feeding the lake was also planted with pollution-reducing vegetation. The study does not distinguish between the effects, on any non-planted vegetation, of planting directly in the lakeshore marsh and planting in the river. Vegetation (emergent, floating and submerged) was surveyed before (July 2008) and for approximately five years after (July 2009–2014) planting (details not fully reported).
A replicated, randomized, controlled study in 2013–2014 in a degraded floodplain swamp in Florida, USA (23) reported 2–57% survival of planted wetland herbs after one year, and found that planted plots had higher plant species richness than unplanted plots. Four herb species were planted. After one year, survival rates were 2% for purple bluestem Andropogon glomeratus and pine barren goldenrod Solidago fistulosa, 46% for common rush Juncus effusus, and 57% for red-top panic grass Panicum longifolium. The study reported that cattle damaged or completely removed some plants, especially purple bluestem and pine barren goldenrod. Over the year following planting, plant species richness was higher in planted plots (total: 5.2; native: 3.8 species/0.56 m2) than in unplanted plots (total: 1.8; native: 0.6 species/0.56 m2). Planting had no significant effect on Mexican petunia Ruellia simplex density, cover or biomass (see Section 9.14). Methods: Fourteen 1.5 x 1.5 m plots were established in a floodplain swamp where invasive Mexican petunia had been controlled (but not eradicated) with herbicide. In November 2013, seven random plots were planted with greenhouse-reared herbs (four species; four plants/species/ plot; individual plants 30 cm apart). The other seven plots were not planted. Vegetation was surveyed for one year after planting. During this period, surface water was present in 6 of 12 months and was up to 21 cm deep.
(1) Swanson L.J. Jr. & Shuey A.G. (1980) Freshwater marsh reclamation in west central Florida. Proceedings of the Annual Conference on Restoration and Creation of Wetlands 7, Tampa, Florida, 51–61.
(2) Ritter M.W. & Sweet T.M. (1993) Rapid colonization of a human-made wetland by Mariana common moorhen on Guam. Wilson Bulletin, 105, 685–687.
(3) Chow-Fraser P. & Lukasik L. (1995) Cootes Paradise Marsh: community participation in the restoration of a Great Lakes coastal wetland. Restoration & Management Notes, 13, 183–189.
(4) Niswander S.F. & Mitsch W.J. (1995) Functional analysis of a two-year-old created in-stream wetland: hydrology, phosphorus retention, and vegetation survival and growth. Wetlands, 15, 212–225.
(5) Clevering O.A. & van Gulik W.M.G. (1997) Restoration of Scirpus lacustris and Scirpus maritimus stands in a former tidal area. Aquatic Botany, 55, 229–246.
(6) Kaplan D., Oron T. & Gutman, M. (1998) Development of macrophytic vegetation in the Agmon Wetland of Israel by spontaneous colonization and reintroduction. Wetlands Ecology and Management, 6, 143–150.
(7) van der Valk A.G., Bremholm T.L. & Gordon E. (1999) The restoration of sedge meadows: seed viability, seed germination requirements, and seedling growth of Carex species. Wetlands, 19, 756–764.
(8) Budelsky R.A. & Galatowitsch S.M. (2000) Effects of water regime and competition on the establishment of a native sedge in restored wetlands. Journal of Applied Ecology, 37, 971–985.
(9) McCabe O.M. & Otte M.L. (2000) The wetland grass Glyceria fluitans for revegetation of metal mine tailings. Wetlands, 20, 548–559.
(10) Budelsky R.A. & Galatowitsch S.M. (2004) Establishment of Carex stricta Lam. seedlings in experimental wetlands with implications for restoration. Plant Ecology, 175, 91–105.
(11) De Steven D. & Sharitz R.R. (2007) Transplanting native dominant plants to facilitate community development in restored coastal plain wetlands. Wetlands, 27, 972–978.
(12) Booth V. & Ausden M. (2009) The invertebrate population of a created reedbed after seven years: Lakenheath Fen RSPB reserve, Suffolk, England. Conservation Evidence, 6, 105–110.
(13) Miller R.L. & Fujii R. (2010) Plant community, primary productivity, and environmental conditions following wetland re-establishment in the Sacramento-San Joaquin Delta, California. Wetlands Ecology and Management, 18, 1–16.

12. Habitat restoration and creation
408
(14) Vanderbosch D.A. & Galatowitsch S.M. (2010) An assessment of urban lakeshore restorations in Minnesota. Ecological Restoration, 28, 71–80.
(15) Vanderbosch D.A. & Galatowitsch S.M. (2011) Factors affecting the establishment of Schoenoplectus tabernaemontani (C.C. Gmel.) Palla in urban lakeshore restorations. Wetlands Ecology and Management, 19, 35–45.
(16) Lawrence B.A. & Zedler J.B. (2013) Carbon storage by Carex stricta tussocks: a restorable ecosystem service? Wetlands, 33, 483–493.
(17) Zilverberg C.J., Johnson W.C., Boe A., Owens V., Archer D.W., Novotny C., Volke M. & Werner B. (2014) Growing Spartina pectinata in previously farmed prairie wetlands for economic and ecological benefits. Wetlands, 34, 853–864.
(18) Doherty J.M. & Zedler J.B. (2015) Increasing substrate heterogeneity as a bet-hedging strategy for restoring wetland vegetation. Restoration Ecology, 23, 15–25.
(19) Sloey T.M., Willis J.M. & Hester M.W. (2015) Hydrologic and edaphic constraints on Schoenoplectus acutus, Schoenoplectus californicus, and Typha latifolia in tidal marsh restoration. Restoration Ecology, 23, 430–438.
(20) De Martis G., Mulas B., Malavasi V. & Marignani M. (2016) Can artificial ecosystems enhance local biodiversity? The case of a constructed wetland in a Mediterranean urban context. Environmental Management, 57, 1088–1097.
(21) Jellinek S., Te T., Gehrig S.L., Steward H. & Nicol J.M. (2016) Facilitating the restoration of aquatic plant communities in a Ramsar wetland. Restoration Ecology, 24, 528–537.
(22) Liu G., Tian K., Sun J., Xiao D. & Yuan X. (2016) Evaluating the effects of wetland restoration at the watershed scale in northwest Yunnan Plateau, China. Wetlands, 36, 169–183.
(23) Smith A.M., Reinhardt Adams C., Wiese C. & Wilson S.B. (2016) Re-vegetation with native species does not control the invasive Ruellia simplex in a floodplain forest in Florida, USA. Applied Vegetation Science, 19, 20–30.
12.22.2 Directly plant non-woody plants: brackish/saline wetlands
Thirty studies evaluated the effects, on vegetation, of directly planting emergent, non-woody plants in brackish/saline wetlands. Twenty-four studies were in the USA1–10,12–15,16a,16b,18–23,25,29. There was one study in each of Canada11, New Zealand17, Spain24, Italy27 and Australia28. One study26 was a global systematic review. Four of the studies12,13,15,16a monitored different outcomes of one planting experiment in California. Two other studies7,8 used the same marsh as each other. Two studies16b,19 shared some plots with each other.
VEGETATION COMMUNITY
Community composition (1 study): One replicated, site comparison study around fresh/brackish lakes in Australia28 reported that as planted rush stands aged, their near-shore plant community became more similar to that behind mature natural rush stands.
Overall richness/diversity (3 studies): One controlled study on a brackish sandflat in the USA1 reported that an area planted with wetland herbs contained more plant species, after eight years, than an adjacent unplanted area. One replicated, site comparison study around fresh/brackish lakes in Australia28 found that the near-shore vegetation behind >8-year-old planted rush stands and mature natural stands contained a similar number of plant species. One study of a fresh/ brackish/saline marsh in Italy27 simply quantified plant species richness for up to 13 years after planting herbs (along with other interventions).
VEGETATION ABUNDANCE
Overall abundance (4 studies): Two site comparison studies (one replicated) of brackish/ saline marshes in the USA2,18 reported that areas planted with herbs (sometimes18 along with other interventions) contained less vegetation, after 2–3 growing seasons, than nearby natural marshes. This was true for biomass2 and cover18. One replicated, site comparison study around fresh/ brackish lakes in Australia28 found that the density of near-shore vegetation behind older planted rush stands was similar to that behind mature natural stands. One replicated, randomized, paired,

12. Habitat restoration and creation
409
controlled study in an estuary in the USA15 reported that plots planted with salt marsh vegetation contained more vegetation biomass than unplanted plots, after three growing seasons.
Individual species abundance (18 studies): Eighteen studies2,4–13,18,20–22,25,28,29 quantified the effect of this intervention on the abundance of individual plant species. Four studies in the USA10,13,20,25 compared the abundance of plant species in planted and unplanted areas. Two replicated studies10,25 found that planted herb species were typically more abundant in planted than unplanted plots, after 2–4 growing seasons. One replicated, paired, controlled study20 reported that there were fewer common reed Phragmites australis stems in plots planted with other wetland herbs (and shrubs) than in unplanted plots, after 1–3 years. One replicated, randomized, controlled study13 reported species-specific effects of planted individuals on recruitment of conspecific seedlings. Nine studies in the USA2,5,7,8,12,18,22,25 and Australia28 compared the abundance of herb species where they had been planted to their abundance in natural brackish/saline marshes. Results varied between studies, species, metrics and time since planting. One before-and-after study of an intertidal site in the USA29 reported greater abundance of smooth cordgrass Spartina alterniflora over five years after planting (along with other interventions) than before. Seven studies (six replicated) in brackish/saline marshes in the USA4,6,9,12,15,21 and Canada11 simply quantified the abundance of individual species over 1–3 growing seasons after they were planted (sometimes6,9,15,21 along with other interventions).
VEGETATION STRUCTURE
Overall structure (2 studies): One replicated, randomized, paired, controlled, site comparison study in a salt marsh in the USA12 found that plots planted with herbs contained more canopy layers than unplanted plots after 2–4 growing seasons. One replicated, site comparison study around fresh/brackish lakes in Australia28 reported that as planted rush stands aged, their width increased – becoming more similar to mature natural stands.
Height (11 studies): Three replicated studies in salt marshes in the USA10,12,25 found that vegetation in areas planted with herbs was at least as tall as vegetation in unplanted areas, 2–4 growing seasons after planting. Of six site comparison studies that compared vegetation height in planted and natural marshes (sometimes8,22 along with other interventions), three studies in the USA2,8,22 reported that vegetation was shorter in planted marshes after 2–5 growing seasons. Two studies in the USA10 and Australia28 found that vegetation was typically a similar height in planted and natural marshes after 2–11 years. One study in the USA25 found that vegetation was taller in planted marshes after three growing seasons. Four replicated studies in brackish/saline marshes in the USA4–6,29 simply quantified the height of herbs over 1–5 growing seasons after they were planted; in three of these studies4,6,29, the average height increased over time.
OTHER
Survival (17 studies): Seventeen studies (including 13 replicated and one systematic review) in the USA2–4,6,10,14,16a,16b,18–20,23,29, Canada11, New Zealand17, Spain24 and multiple countries26 quantified survival rates of individual herbs planted (or sown26) in brackish/saline wetlands. Survival rates ranged from 0% to 100% after 20 days to 2 years. Four studies in the USA1,21, New Zealand17 and multiple countries26 reported 0% survival or absence of planted herb species, in at least some cases, after nine months to eight years. Proposed factors affecting survival included elevation/ water levels9,16b,23,24, age of planted individuals4, treatment with root dip4, planting date6, soil pH14, damage by waterbirds16a, salinity16b and sediment organic matter content19.
Growth (2 studies): Two studies monitored true growth of individual herbs (rather than changes in average height of survivors). One replicated study in a brackish marsh in the USA20 reported that in 8 of 10 cases, rushes/bulrushes grew in both height and circumference over the second year after planting. One replicated study in an estuary in Spain24 reported growth of planted small cordgrass Spartina maritima and glasswort Sarcocornia perennis over the year after planting.

12. Habitat restoration and creation
410
A controlled study in 1973–1981 on a brackish, tidal sandflat in North Carolina, USA (1) reported that an area planted with wetland herbs contained 24 plant species after eight years, including four of nine planted species, whilst an adjacent unplanted area remained “unvegetated”. The four persisting planted species were black rush Juncus roemerianus, common reed Phragmites australis, broadleaf cattail Typha latifolia and smooth cordgrass Spartina alterniflora. Twenty other herb and shrub species colonized the planted area naturally. Methods: In spring and summer 1973, nine herbaceous species were transplanted from existing marshes to a 30 m stretch of brackish, tidal, sandy sediment. Plants were 60–90 cm apart. An adjacent area of sediment was not planted. Plant species were recorded in 1981.
A site comparison study in 1980–1981 involving reprofiled borrow pits in North Carolina, USA (2) reported 37–98% survival of four planted herb species after one growing season and that the biomass of survivors increased, but that vegetation in planted and natural marshes differed after two growing seasons. Statistical significance was not assessed. After one growing season, survival rates were 37–55% for smooth cordgrass Spartina alterniflora, 66–97% for big cordgrass Spartina cynosuroides, and 82–98% for saltmeadow cordgrass Spartina patens (data not clearly reported for black rush Juncus roemerianus). The above-ground biomass of surviving plants increased from 8–562 g/m2/species after one growing season to 297–3,105 g/m2/species after two growing seasons. Finally, planted and natural stands of big cordgrass and black rush were compared. After two growing seasons, planted stands contained only 297–1,525 g/m2 above-ground biomass (vs natural: 997–1,891 g/m2) and vegetation only 91–161 cm tall (vs natural: 155–293 cm). Planted stands contained more big cordgrass stems than natural marshes (planted: 223; natural: 44 stems/m2), but fewer black rush stems (planted: 509; natural: 884 stems/m2). Methods: In spring/early summer 1979–1980, four herb species were planted (60–90 cm apart) into reprofiled coastal land (dry during planting but rewetted after; salinity <20 ppt). Experimental design, including number of plants and plots, was not clearly reported. In October 1979–1981, planted vegetation and vegetation in a nearby natural marsh were surveyed. This included cutting, drying and weighing live vegetation from 0.25-m2 quadrats.
A study in 1982 in an estuary in Maryland, USA (3) reported approximately 70% survival of saltmeadow cordgrass Spartina patens planted into deposited dredge sediment. Survival was measured after 5–6 months. Methods: In June–July 1982, nursery-reared saltmeadow cordgrass was planted on an area of fine-grained dredge sediment deposited in Tar Bay. Approximately 65,520 plants were planted, 60 cm apart, 40–70 cm above mean low water. Each plant was fertilized with 30 g of slow-release Osmocote® fertilizer. Survival was recorded in December 1982.
A replicated study in 1976–1977 on two intertidal mudflats in Texas, USA (4) reported 3–89% survival of planted smooth cordgrass Spartina alterniflora after one growing season, and increases in stem height, density and biomass over two growing seasons. Unless specified, statistical significance was not assessed. After two growing seasons, cordgrass stems were 84–140 cm tall (vs 20–100 cm when planted). There were 18–252 cordgrass stems/m2 (vs <1–35 stems/m2 after one growing season and 4 stems/m2 when planted). Above-ground cordgrass biomass was 466–1,840 g/m2 (vs 20–104 g/m2 after one growing season). Amongst planted plots, results depended on the mudflat and the age/form of the cordgrass (see original paper) and whether plants were treated with root dip before planting (see Section 13.27). Fertilizer typically had no significant effect on the results (see Section 13.13). Methods: In July 1976, smooth

12. Habitat restoration and creation
411
cordgrass was transplanted into seventy-two 12.5-m2 plots (50 plants/plot, 50 cm apart) across two intertidal mudflats. Transplants were dug from existing salt marshes (young, mature short-form or mature tall-form). Some plants were treated with root dip before planting, and some plots were fertilized after planting. Cordgrass was monitored over the growing season in 1976 and 1977. Monitoring included counting stems, measuring representative flowering stems, and cutting, drying and weighing three cordgrass plants/plot.
A replicated, site comparison study of salt marshes in North Carolina, USA (5) reported that transplanted smooth cordgrass Spartina alterniflora did not clearly change in height over three growing seasons, but increased in density and biomass (with biomass reaching similar levels to natural marshes). Statistical significance was not assessed. After three growing seasons, cordgrass shoots were 125–158 cm tall on average (vs 109–173 cm after one growing season). Plots contained 203–275 cordgrass stems/m2 (vs 52–96 stems/m2 after one growing season) and 676–1,241 g/m2 above-ground cordgrass biomass (vs 121–272 g/m2 after one growing season). After three growing seasons, plots planted with tall-form cordgrass supported an above-ground cordgrass biomass of 1,068 g/m2, compared to an average of 1,168 g/m2 in five nearby natural, tall-form marshes. Methods: In April, smooth cordgrass was planted (90 cm apart) into fifteen plots on an area of recently deposited and graded intertidal sediment (year and number of plants not reported). Cordgrass plants were dug from four natural marshes and had different initial growth forms (short, intermediate or tall). In September after 1–3 growing seasons, transplanted cordgrass growing 50–60 cm above sea level was monitored: height of five shoots/plot; density and dry above-ground biomass in one 0.25–1 m2 quadrat/plot.
A replicated study in 1977 on intertidal sediment in Texas, USA (6) reported that 20–91% of planted smooth cordgrass Spartina alterniflora survived for two months, with increases in cordgrass density and height over one growing season. Statistical significance was not assessed. After one growing season, planted plots contained 21–230 cordgrass stems/m2 (vs 4 stems/m2 when planted). Cordgrass plants were 54–157 cm tall (vs 48–59 cm when planted). Cordgrass cover was <10–50% (initial cover not reported). Amongst the plots, results depended on planting date, elevation and the combination of the two (see original paper for full details). For example, after one growing season, plots planted in February supported higher cordgrass densities than plots planted in May at the lowest elevation (February: 153; May: 2 stems/m2), but the opposite was true at highest elevation (February: 21; May: 56 stems/m2). Fertilizer typically had no significant effect on the results (see Section 13.13). Methods: In 1977, four hundred and fifty 15-m2 plots were established, in three sets of 150, at varying elevations on created intertidal land (sediment deposited and graded, protected by a breakwater and fenced). All plots were planted with field-collected cordgrass (60 plants/plot): half in February and half in May. Most plots were also fertilized. After two months (April or July) and one growing season (November), the central 30 cordgrass plants in each plot were surveyed.
A site comparison study in 1989 of two estuarine salt marshes in California, USA (7) found that a marsh created by reprofiling, planting California cordgrass Spartina foliosa and fertilizing contained less cordgrass biomass, after 4–5 years, than an adjacent natural marsh. The created marsh contained 192 g/m2 above-ground California cordgrass biomass: significantly lower than the 454 g/m2 in the natural marsh. Methods: In July 1989, California cordgrass was cut from 9–12 quadrats at a similar elevation in the two marshes, then dried and weighed. One marsh (same

12. Habitat restoration and creation
412
marsh as in Study 8) had been created by reprofiling into islands and creeks (autumn 1984), planting California cordgrass along creek banks (March 1985) and fertilizing with urea (25 g/m2; four times 1985–1986). This study evaluates the combined effect of these interventions on any non-planted cordgrass. A nearby natural marsh, exposed to similar tides, was chosen for comparison.
A site comparison study in 1989 of four estuarine salt marshes in California, USA (8) found that a marsh created by reprofiling, planting California cordgrass Spartina foliosa and fertilizing supported a similar cordgrass density to adjacent natural marshes, but with shorter plants. Statistical significance was not assessed. Four years after planting, four of four transects in the created marsh supported a cordgrass density (133–173 stems/m2) within the range of nearby natural marshes (73–193 stems/m2). However, cordgrass was shorter in the created than natural marshes, with a greater proportion of stems in shorter height classes (see original paper for data). Methods: In September 1989, California cordgrass was surveyed in 0.1-m2 quadrats. Twelve quadrats (four transects) were surveyed in a created marsh (reprofiled into islands and creeks in 1984, planted with California cordgrass in 1985, fertilized with urea in 1985–1986; same marsh as in Study 7). This study evaluates the combined effect of these interventions on any non-planted cordgrass. Fifty-four quadrats (seven transects) were surveyed in three nearby natural marshes.
A replicated study in 1989–1991 in an estuary in California, USA (9) reported that in an excavated salt marsh planted with California cordgrass Spartina foliosa, there were increases in California cordgrass density and biomass. Statistical significance was not assessed. After one growing season, there were 25 cordgrass stems/m2 and 60 g/m2 dry above-ground biomass. After two growing seasons, there were 50 cordgrass stems/m2 and 220 g/m2 dry above-ground biomass. Methods: In March 1990, California cordgrass plants were planted into four 5-m2 plots in a salt marsh that had been excavated in 1989 (ten 4-L pots of cordgrass/plot). None of these four plots received any additional treatment. California cordgrass stems were counted and measured until October 1991. Note that this study does not distinguish between the effects of planting and excavation on any non-planted cordgrass.
A replicated, paired, before-and-after, site comparison study in 1993–1997 of four salt marshes in New York, USA (10) reported that most planted smooth cordgrass Spartina alterniflora survived the first month, and that the average height and biomass of cordgrass in planted areas typically became similar to natural cordgrass stands within 2–4 growing seasons. After one month, cordgrass survival was 50%, 60% and 99% in the three planted marshes. Cordgrass stems were 56–136 cm tall after one growing season, then 114–182 cm tall after 2–4 growing seasons. At the same time, the planted marshes had developed 15–80% cordgrass cover, 68–236 cordgrass stems/m2 and 641–2,144 g/m2 cordgrass biomass (dry, above-ground). In the majority of pairwise comparisons (see original paper), these metrics were statistically similar to existing mature cordgrass stands (where height: 137–158 cm; cover: 66–80%; density: 136–196 stems/m2; biomass: 1,477–2,138 g/m2) and greater than in degraded areas that had not been planted (where height: 34–46 cm; cover: 2–4%; density: 6–9 stems/m2; biomass: not reported). Methods: Between 1993 and 1995, smooth cordgrass was planted into bare intertidal sediment in three salt marshes (denuded by an oil spill in 1990). Plants were mostly nursery-reared seedlings (planted 30 cm apart), but some mature individuals were also planted (1–10 m apart). All seedlings were fertilized, and the sites were fenced to exclude geese. Vegetation was surveyed in September, for up to four growing seasons after planting: in planted

12. Habitat restoration and creation
413
areas (three marshes), unplanted degraded areas (four marshes) and natural cordgrass stands (four marshes).
A replicated study in 1996–1997 in two degraded, coastal, brackish marshes in Manitoba, Canada (11) reported 24–100% survival of two transplanted herb species after two growing seasons, and that their cover had increased. Statistical significance was not assessed. Two growing seasons after planting, creeping alkaligrass Puccinellia phryganodes had a survival rate of 47–100% and black estuary sedge Carex subspathacea had a survival rate of 24–50%. Cover of surviving alkaligrass was 1,600–5,400 mm2/m2 (vs 200 mm2/m2 when planted). Cover of surviving estuary sedge was 700–2,800 mm2/m2 (vs 200 mm2/m2 when planted). Adding mulch or fertilizer significantly increased the cover of alkaligrass but not estuary sedge, and did not significantly affect survival rates (see Sections 13.13 and 13.15). Methods: In June 1996, plugs of alkaligrass and estuary sedge were transplanted from natural stands to 1-m2 plots within brackish marsh vegetation damaged by geese (one species/marsh; 12 plots/species; 42 plugs/plot). All plots were fenced to exclude geese. Mulch (5 mm peat layer) and/or fertilizer (N and P) were added to three quarters of each planted plot. Survival and cover (basal area) of planted vegetation in the centre of each plot were monitored until mid-August 1997.
A replicated, randomized, paired, controlled study in 1997–2000 in an estuary in California, USA (12) found that plots planted with salt marsh vegetation typically contained more canopy layers and taller vegetation than unplanted plots, after four growing seasons. In three of three comparisons, planted plots had more canopy layers (2.1–2.8) than unplanted plots (1.7). Plots planted with three or six species had a greater maximum vegetation height (53–56 cm) than unplanted plots (41 cm). Plots planted with only one species had a similar vegetation height (46 cm) to the unplanted plots. The study also reported data from planted plots after two growing seasons. Plots planted with multiple species had greater overall vegetation cover, more canopy layers and a greater maximum vegetation height than plots planted with single species – but a similar average vegetation height (see original paper for data). Methods: In spring 1997, eight salt marsh herbs/succulents were planted into recently reprofiled intertidal sediment. In each of five areas, 14 random 4-m2 plots were planted with 90 greenhouse-reared seedlings (eight single-species plots, three three-species plots, three six-species plots) and three random plots were left unplanted. The planting areas had recently been excavated, amended with fine sediment, tilled and levelled. Non-planted vegetation was cleared from all plots during the first two growing seasons (1997–1998), but was left to grow from the third (1999–1998). Vegetation was surveyed using transects and point quadrats, in autumn 1997–2000. This study was based on the same experimental set-up as (13), (15) and (16a).
A replicated, randomized, controlled study in 1997–1998 in an estuary in California, USA (13) found that planting salt marsh succulents reduced seedling recruitment for one species, but increased recruitment for two others. Over the second growing season after planting, there were fewer unplanted pickleweed Salicornia virginica seedlings in plots where pickleweed had been planted (71–99 seedlings/4 m2) than where it had not been planted (167–380 seedlings/4 m2). In contrast, there were more unplanted seedlings of dwarf saltwort Salicornia bigelovii and estuary seablite Suaeda esteroa in plots where each species had been planted (saltwort: 395–920; seablite: 21–137 seedlings/4 m2) than where they had not been planted (saltwort: 14–102; seablite: 3–10 seedlings/4 m2). Methods: In April 1997,

12. Habitat restoration and creation
414
eighty-five 4-m2 plots were established (in five sets of 17) on an area of recently reprofiled intertidal sediment. All plots were amended with fine sediment, tilled and levelled. Seventy plots were then planted with 90 greenhouse-reared seedlings (random mix of one, three or six plant species: sometimes including the focal species and sometimes not). The other 15 plots were left unplanted. Seedlings were counted in all plots throughout the 1998 growing season. This study was based on the same experimental set-up as (12), (15) and (16a).
A replicated study in 1998–1999 in cleared and reprofiled former farmland in Florida, USA (14) reported that 60–100% of planted saltmeadow cordgrass Spartina patens plants survived for 20 days. Survival rates varied with soil pH (acidic: 74–86%; weakly acidic: 100%; alkaline: 60–69%) but not elevation (low: 63–100%; moderate: 60–100%; high: 69–100%). Statistical significance was not assessed. Methods: In October 1998, saltmeadow cordgrass plants (nursery-reared from locally-collected seed) were planted into three 4 x 9 m plots (100 plants/plot). The plots were in an area farmed for approximately 100 years, then cleared of invasive plants and lowered to the elevation of surrounding wetlands. All plots had brackish soils (2–7 ppt). Soil pH varied between plots (acidic: 5.2; weakly acidic: 6.4; alkaline: 8.5). Elevation varied within plots (low: <30 cm; moderate: 30–60 cm; high: >60 cm above mean tide level; approximate values). Cordgrass plants that were “severely stressed” (<25% green stems, no new growth, wilted) 20 days after planting, and that did not recover over the following 300 days, were considered dead.
A replicated, randomized, paired, controlled study in 1997–2000 in an estuary in California, USA (15) found that plots planted with salt marsh vegetation contained more above-ground plant biomass, after three growing seasons, than unplanted plots. Results summarized for this study exclude litter and are not based on assessments of statistical significance. On average, plots planted with 3–6 species contained 372–431 g/m2 biomass whilst plots planted with a single species contained 277 g/m2 biomass. Unplanted plots contained only 94 g/m2 biomass. In single-species plots, the biomass of the planted species ranged from <1 g/m2 (arrowgrass Triglochin concinna) to 490 g/m2 (pickleweed Salicornia virginica). The biomass of unplanted species in these plots was 1–102 g/m2. Methods: In spring 1997, eight salt marsh herbs/succulents were planted into recently reprofiled intertidal sediment. In each of five areas, 14 random 4-m2 plots were planted with 90 greenhouse-reared seedlings (eight single-species plots, three three-species plots, three six-species plots) and three random plots were left unplanted. The planting areas had recently been excavated, amended with fine sediment, tilled and levelled. Non-planted vegetation was cleared from all plots during the first two growing seasons (1997–1998), but was left to grow in the third (1999). In January 2000, standing vegetation was cut from a 20 x 120 cm quadrat in each plot, then dried and weighed. This study was based on the same experimental set-up as (12), (13) and (16a).
A replicated study in 1997–1998 in an estuary in California, USA (16a) reported ≥81% survival of eight planted salt marsh species through their first growing season, and ≥58% survival through their first winter. Over the first growing season, the survival rate ranged from 81% for saltwort Batis maritima to 99% for alkali heath Frankenia salina (overall: 93%). Over the first winter, the survival rate ranged from 58% for arrowgrass Triglochin concinna to >99% for pickleweed Salicornia virginica (overall: 82%). The study suggests that winter mortality was related to smothering by algae and sediment, and feeding/trampling by waterbirds. Colonization by non-planted seedlings was also reported (see Study 13). Methods: In April 1997,

12. Habitat restoration and creation
415
greenhouse-reared herbs/succulents were planted into seventy-two 4-m2 plots, on an area of recently reprofiled intertidal sediment (90 seedlings/plot; 1–6 species/plot; eight species total). Plots were amended with fine sediment, tilled and levelled before planting. Seedlings were watered regularly after planting. Dead planted seedlings were replaced. Non-planted seedlings were removed. Survival was assessed in July 1997 and March 1998. This study was based on the same experimental set-up as (12), (13) and (15).
A replicated study in 2000–2002 in an estuary in California, USA (16b) reported <1–80% survival of six planted salt marsh species. Of 1,332 seedlings planted in April 2000, only 9% survived their first growing season (from <1% of salt marsh daisy Jaumea carnosa to 16% of alkali heath Frankenia salina). For 180 seedlings planted in December 2000, the survival rate over one year was 48% (from 30% for estuary seablite Suaeda esteroa to 80% for saltwort Batis maritima). For 504 seedlings planted in March 2001, the survival rate was 70% over the first growing season (68–90% per species) then 62% over the first winter (45–82% per species). The study identified high salinities, waterlogging, limited tidal flushing and sediment deposition as possible causes of mortality. Methods: Between April 2000 and March 2001, greenhouse-reared herbs/succulents were planted into an area of recently reprofiled intertidal sediment (36–48 plots/trial; 1–6 species/plot; 1–42 seedlings/plot, ≥5 cm apart). In two of three trials, dead planted seedlings were replaced. Survival was assessed in July 2000, December 2001, July 2001 and January 2002. One trial in this study used a subset of the plots in (19).
A replicated, site comparison study in 1998 of a salt marsh near Christchurch, New Zealand (17) reported 0–100% survival of planted herbs after nine months, and that surviving plants had a similar biomass to those in a nearby natural marsh. Statistical significance was not assessed. Three-square bulrush Schoenoplectus pungens did not recover following the expected winter die-back, two months after planting. In contrast, 100% of planted wire rush Leptocarpus similis and 73% of planted sea rush Juncus maritimus were alive, but appeared stressed, after nine months. Surviving wire rush and sea rush had a dry above-ground biomass of 0.08–0.19 g/plant, compared to 0.12–0.22 g/plant in a nearby natural marsh. Methods: In March 1998, the three herb species were planted into thirty-six 0.25-m2 plots (12 plots/species; four plants/plot) within an estuarine salt marsh. The plots started as bare sediment: half were re-filled with marsh mud and half were re-filled with treated sewage/industrial waste. Within each plot, two plants were sourced from a nearby marsh and two were nursery-reared. All plants were clipped to 20 cm height. Plots were regularly cleared of debris. Planted vegetation was monitored for up to nine months. Biomass was estimated from height measurements.
A replicated, site comparison study in 1998–2002 involving a reprofiled, planted and fenced salt marsh in California, USA (18) reported 88–98% survival of planted salt marsh species after one growing season, but lower cover of vegetation overall and the dominant plant species compared to a natural marsh after three growing seasons. Statistical significance was not assessed. After one growing season, survival rates ranged from 88% for saltgrass Distichlis spicata to 98% for salt marsh daisy Jaumea carnosa. After three growing seasons, total vegetation cover in the created marsh was 62% (mostly pickleweed Salicornia virginica: 39% cover). In a nearby natural marsh total vegetation cover was 87% (mostly pickleweed: 62% cover). Each species had greater cover in plots where it was planted (pickleweed: 38–72%; other species: 10–57%) than where it colonized by itself (pickleweed: 23–27%; other species: <0.5%).

12. Habitat restoration and creation
416
For some species, the final cover and canopy height depended on planting density (see original paper). Methods: In autumn 1997, an upland area was reprofiled to form an intertidal mudflat. In March 1998, rooted cuttings of four salt marsh herb/succulent species were planted into fifty-five 4-m2 plots around the edge of the mudflat (25–81 plants/plot; combinations of 1 or 2 species/plot). After one growing season, the plots were protected with rabbit-proof fencing. Debris and colonizing vegetation were regularly removed during the first two growing seasons, but left in place thereafter. The study does not distinguish between the effects of reprofiling, planting and fencing on the non-planted vegetation. Survival of planted individuals was monitored after one growing season. Total vegetation cover was measured in 0.25-m2 quadrats: in the created marsh (1 quadrat/plot/year until October 2000) and a nearby natural marsh of similar elevation (10 quadrats in July 1999).
A replicated study in 2000–2002 in an estuary in California, USA (19) reported 31–83% survival of five planted salt marsh species over the second year after planting began, and that the average size of survivors increased. In December 2001, the study site contained 108 plants of each of five species (one plant/species in 108 plots). In August 2002, 33–90 plants/species were still alive, with an average of 2.7–3.5 surviving plants/plot. Initial planting occurred in December 2000, but dead plants were replaced until December 2001 to maintain the total of 108 plants/species (129–290 replacements/species). Between October 2001 and August 2002, the average size of surviving plants increased in 15 of 15 comparisons (statistical significant not assessed; data reported as an index combining height and lateral extent). Survival rates and plant size were typically increased by adding kelp compost to plots (see Section 13.14) but not significantly affected by the spacing of planting or excavation of tidal creeks (see original paper and Section 13.3). Methods: In December 2000, one-year-old, greenhouse-reared herbs/succulents were planted into intertidal sediment excavated the previous winter. The species were saltwort Batis maritima, alkali heath Frankenia salina, salt marsh daisy Jaumea carnosa, California sea lavender Limonium californicum and estuary seablite Suaeda esteroa. Half of the plots were in the catchment of excavated tidal creeks. Kelp compost was tilled into some plots, some plots were tilled, and some were left undisturbed. Colonizing vegetation was removed until October 2001. This study included some of the plots used in (16b).
A replicated, paired, controlled study in 2000–2004 in a degraded brackish marsh in New Jersey, USA (20) reported 67–100% survival of five planted herb species over two years, and that survivors grew in 8 of 10 cases. Statistical significance was not assessed. Survival rates were lowest for saltmarsh rush Juncus gerardii and saltmarsh bulrush Scirpus robustus (67% or 100% across two cases) and highest for black rush Juncus roemerianus (100% in two of two cases). In 8 of 10 cases, surviving plants grew in height (4–241% increase) and circumference (21–251% increase) over the second year after planting. In the other two cases, plant circumference decreased by 16–78% and height changed by ≤15%. The study also reported that areas planted with the herbs (and some shrubs) contained fewer common reed stems (7–25 stems/m2) than adjacent unplanted areas (66–149 stems/m2). Methods: In summer–autumn 2000–2002, five herb and three shrub species were planted in three areas on the edge of a marsh (4–7 species/area; 4–48 plants/species/area; individual plants 60–100 cm apart). Plants were collected from the wild or grown from tissue in a laboratory. Invasive common reed Phragmites australis had been cleared <1 year before planting, by applying herbicide and cutting. Plant survival and size were recorded 1–2 years after planting. Common reed stems

12. Habitat restoration and creation
417
were counted in the planted areas and three adjacent unplanted areas, 2–4 years after reed clearance.
A study in 1995–2003 of brackish wetland patches within a park in New York, USA (21) reported that 11 of 20 wetland herbs planted in 1995 were still present two years later, and that eight of these increased in area over the second year after planting. Statistical significance was not assessed. Between one and two years after planting, ovate spikerush Eleocharis ovata was the species that increased most in area (from 10 m2 to 112 m2). Lizard’s tail Saururus cernuus was the species that declined most in area (from 102 m2 to 0 m2). The study also reported that most wetland patches, especially the smallest ones, were invaded by common reed Phragmites australis and purple loosestrife Lythrum salicaria 7–8 years after restoration (not quantified). Methods: In late spring 1995, twenty wetland herb species were planted in nine wetland patches next to a brackish lake. Approximately 10,000 nursery-reared plants were planted at appropriate elevations. The site had been disturbed by pipeline maintenance, but then graded to create nine wetland patches (125–536 m2) and cleared of common reed using herbicide and plastic sheeting. The study does not distinguish between the effects of these interventions and planting on any non-planted individuals. The area covered by each planted species was mapped in early summer 1996 and 1997. Vegetation was surveyed qualitatively in 2002 and 2003.
A replicated, paired, site comparison study in 2001–2004 of six salt marshes in North Carolina, USA (22) found that restored marshes – planted with cordgrasses Spartina spp. and protected with breakwaters – typically contained less, and shorter, smooth cordgrass than natural marshes. Averaged over the 22 or 31 months after planting, smooth cordgrass cover was lower in restored than natural marshes in three of three comparisons (restored: 10–26%; natural: 33–46%). Smooth cordgrass density was lower in restored than natural marshes in two of three comparisons (for which restored: 70–162 stems/m2; natural: 150–222 stems/m2; other comparison no significant difference). Smooth cordgrass plants were shorter in restored than natural marshes in three of three comparisons (restored: 50–62 cm; natural: 64–82 cm). Methods: Between autumn 2001 and summer 2002, three degraded salt marshes were restored. Rocky breakwaters were built offshore, then cordgrasses Spartina spp. (mainly smooth cordgrass Spartina alterniflora) were planted. The study does not distinguish between the effects of planting and the breakwaters on non-planted vegetation. For each planted marsh an adjacent, physically similar, natural marsh was selected for comparison. Smooth cordgrass was monitored along transects each spring and autumn for up to 31 months after intervention. Cover was estimated in 1-m2 plots, stems were counted in 0.25-m2 subplots, and the three tallest stems/plot were measured.
A replicated study in 2006 in an estuarine salt marsh in California, USA (23) reported that survival of transplanted dwarf saltwort Salicornia bigelovii seedlings depended on plot elevation and thinning of the dominant competitor. After one growing season, <40% of seedlings transplanted into 10-cm depressions were still alive. In contrast, 70% of seedlings transplanted into 5-cm depressions or level plots were still alive. The survival rate of transplants was 2.4 times greater in plots where dominant pickleweed Salicornia virginica had been thinned (to 50% cover) than where it had not been thinned (>75% cover). Methods: In March 2006, four dwarf saltwort seedlings were planted in each of seventy-two 0.25-m2 plots on a pickleweed-dominated salt marsh. Dwarf saltwort was also sown onto each plot (1.25 ml seed/plot). In some of the plots, the surface was lowered by 5–10 cm and/or

12. Habitat restoration and creation
418
pickleweed stems were cut and removed before planting. Survival was monitored in September 2006. This study was in the same area as (16b) and (19), but used different plots.
A replicated, before-and-after study in 2006–2008 on estuarine mudflats in southern Spain (24) reported that planted clumps of herbaceous vegetation survived and expanded, but that an invasive grass colonized some sites. After one year, 75–99% of planted small cordgrass Spartina maritima clumps had survived. Survival varied with location (flat plain < sloping banks). Surviving clumps had expanded horizontally by 1.1 cm/month, on average. Clumps of glasswort Sarcocornia perennis, introduced as fragments within the cordgrass clumps, had also expanded horizontally by 1.8 cm/month. Seedlings of invasive denseflower cordgrass Spartina densiflora appeared in three sites (abundance not quantified). Methods: Between November 2006 and January 2007, salt marsh vegetation was planted into polluted, unvegetated, tidal mudflats in the Odiel Estuary (number of sites not reported). All sites were planted with cordgrass-dominated clumps, collected from natural marshes (1 clump/m2; approximately 20 cordgrass shoots/clump). Sea purslane Atriplex portulacoides, was also planted around the edge of some sites. Expansion was monitored for 21–76 clumps/herb species (further details not reported).
A replicated, controlled, site comparison study in 2010–2012 in a salt marsh in Georgia, USA (25) found that the density and height of smooth cordgrass Spartina alterniflora increased in plots planted with cordgrass plants, and that after three growing seasons cordgrass density was similar in planted plots and natural marshes. The total number of live stems in plots planted with cordgrass increased from 30–35 stems/m2 at planting to 345–369 stems/m2 after three growing seasons. Maximum cordgrass height increased from 45–48 cm to 56–58 cm. Adding alginate did not significantly affect cordgrass density or height (see Section 13.14). After three growing seasons, planted plots contained taller cordgrass than mature natural marshes, but at a similar density (natural marshes: 29 cm tall; 427 stems/m2). Planted plots contained a greater density of cordgrass than unplanted plots, but of a similar height (unplanted plots: 89 stems/m2; 40 cm tall). Methods: In May 2010, thirty 1-m2 plots were established in an estuarine salt marsh. Twenty bare mud plots were planted with swards of cordgrass from nearby natural marsh, in nine holes 45 cm apart. Alginate (a carbon-rich seaweed extract) was added to half of these plots. Five bare mud plots were not planted. The final five plots were situated in patches of natural marsh. Cordgrass stems were counted, and the five tallest stems/plot measured, in each plot over three growing seasons.
A 2016 systematic review of salt marsh restoration studies around the world (26) reported a 65% average survival rate of planted and sown vegetation. Survival ranged from 0% (2 of 64 cases) to ≥95% (7 of 64 cases). Methods: These results are based on 64 cases (e.g. different species, environments or intervention methods) from 16 publications and five countries, 63 of which involved planting or sowing salt marsh vegetation (mostly herbs and succulents, sometimes shrubs; see Appendix to original paper). Literature searches were carried out in 2014. Planting and sowing were sometimes into environments thought to be suitable (but sometimes into hostile environments) and sometimes preceded by site preparation (but sometimes not). Study duration ranged from 20 days to 13 years. Survival was sometimes estimated from other metrics, such as cover. The review does not separate results for planting vs sowing. The review includes studies (10), (14), (16a), (16b), (18), (19) and (24) summarized above.

12. Habitat restoration and creation
419
A study in 2005–2013 of an excavated, planted and harvested water treatment marsh in Sardinia, Italy (27) reported that it supported 275 plant taxa. This included 201 plant species in 161 genera. Approximately 63% of the taxa were Mediterranean (found predominantly or solely in this region) and approximately 16% were known non-natives in Italy. As expected in the study area, 56% of the taxa were annual plants that complete their life cycle rapidly in favourable conditions (“thereophytes”). Only 2% of taxa had underwater resting buds (“hydrophytes”). Methods: Between 2005 and 2013, plant taxa were recorded in the 37-ha EcoSistema Filtro marsh, which had been constructed with the dual aims of habitat creation and water treatment. There were monthly surveys (a) across the whole site, including banks and upland areas, and (b) in three 16-m2 plots, each April–July and September–December. The wetland had been constructed by excavating basins of varying salinity and levees (including removal of all existing vegetation; beginning 1990) and planting bundles of 2-m-tall common reed Phragmites australis (2004). Some “plant biomass” was mechanically removed between 2005 and 2007. Note that this study evaluates the combined effect of these interventions, and does not separate results from fresh, brackish and saline areas.
A replicated, site comparison study in 2013–2015 around two fresh/brackish lakes in South Australia (28) found that planted stands of river club-rush Schoenoplectus tabernaemontani became more similar to mature natural stands over time – in terms of structure and rush abundance – and supported similar near-shore vegetation to the natural stands within 8 years. Older planted rush stands were more similar to mature natural stands in terms of stand width (young planted: 1–3 cm; old planted: 5–12 cm; natural: 35 cm), maximum height (young: 60–142 cm; old: 131–152 cm; natural: 155 cm) and stem density (data not reported). All stands were a similar average height (data not reported). Near-shore vegetation (i.e. between the rush stands and the shoreline) behind older planted rush stands was similar to that behind mature natural stands, whereas young planted stands supported similar near-shore vegetation to areas without rush stands. This was true for overall community composition (data reported as graphical analyses; statistical significance of differences not assessed), plant species richness (no rushes: 30; young: 45; old: 150; natural: 330 species/site) and abundance (no rushes: 940; young: 1,370; old: 14,000; natural: 31,300 plants/site). Methods: In autumn 2013–2015, vegetation was surveyed at 21 sites on the margins of two connected fresh/brackish lakes. Ten sites had been planted with nursery-reared rushes (1 m apart): six sites ≤3 years ago (young plantings) and four sites 8–11 years ago (old plantings). Three sites had mature natural rush stands (≥20 years old) and eight had no rushes. All sites were fenced to exclude livestock. Rush stands were surveyed in five 1-m2 quadrats/site/ year. Other near-shore vegetation was surveyed in approximately thirty-six 3-m2 quadrats/site/year.
A before-and-after study in 2011–2016 of an intertidal site in Florida, USA (29) reported 53% survival of transplanted smooth cordgrass Spartina alterniflora after two years, and increases in cordgrass abundance and height over five years. Before planting, the mid-intertidal zone was sparsely vegetated (<1 cordgrass shoots/m2; 2% cover). Five years after planting smooth cordgrass into this zone, its density had increased to 56 shoots/m2 and its cover had increased to 52%. The average height of planted cordgrass had increased, from 37 cm when planted to 67 cm after five years (statistical significance not assessed). No natural recruitment was observed within the first three years after planting (data not reported after this). Methods: The study took place along a 200 m stretch of shoreline, on the edge of an ancient shell waste dump.

12. Habitat restoration and creation
420
In April/May 2011, smooth cordgrass Spartina alterniflora was planted in the mid-intertidal zone (620 nursery-reared plants; 3 plants/m). Mangrove seedlings were planted in the upper intertidal zone and oyster-shell mats were placed in the lower intertidal zone. The study does not distinguish between the effects of these interventions on natural recruitment. Cordgrass in the mid-intertidal zone was surveyed before planting (presumably April 2011) and for five years after (2011–2016).
(1) Benner C.S., Knutson P.L., Brochu R.A. & Hurme A.K. (1982) Vegetative erosion control in an oligohaline environment Currituck Sound, North Carolina. Wetlands, 2, 105–117.
(2) Broome S.W., Seneca E.D. & Woodhouse W.W. Jr. (1982) Establishing brackish marshes on graded upland sites in North Carolina. Wetlands, 2, 152–178.
(3) Earhart H.G. & Garbisch E.W. Jr. (1983) Habitat development utilizing dredged material at Barren Island Dorchester County, Maryland. Wetlands, 3, 108–119.
(4) Tanner G.W. & Dodd J.D. (1985) Effects of phenological stage of Spartina alterniflora transplant culms on stand development. Wetlands, 4, 57–74.
(5) Seneca E.D., Broome S.W. & Woodhouse W.W. Jr. (1985) Comparison of Spartina alterniflora Loisel. transplants from different locations in a man-initiated marsh in North Carolina. Wetlands, 5, 181–190.
(6) Webb J.W. & Dodd J.D. (1989) Spartina alterniflora response to fertilizer, planting dates, and elevation in Galveston Bay, Texas. Wetlands, 9, 61–72.
(7) Langis R., Zalejko M. & Zedler J.B. (1991) Nitrogen assessments in a constructed and natural salt marsh of San Diego Bay. Ecological Applications, 1, 40–51.
(8) Zedler J.B. (1993) Canopy architecture of natural and planted cordgrass marshes: selecting habitat evaluation criteria. Ecological Applications, 3, 123–138.
(9) Gibson K.D., Zedler J.B. & Langis R. (1994) Limited response of cordgrass (Spartina foliosa) to soil amendments in a constructed marsh. Ecological Applications, 4, 757–767.
(10) Bergen A., Alderson C., Bergfors R., Aquila C. & Matsil M.A. (2000) Restoration of a Spartina alterniflora salt marsh following a fuel oil spill, New York City, NY. Wetlands Ecology and Management, 8, 185–195.
(11) Handa I.T. & Jeffries R.L. (2000) Assisted revegetation trials in degraded salt-marshes. Journal of Applied Ecology, 37, 944–958.
(12) Keer G.H. & Zedler J.B. (2002) Salt marsh canopy architecture differs with the number and composition of species. Ecological Applications, 12, 456–473.
(13) Lindig-Cisneros R. & Zedler J. (2002) Halophyte recruitment in a salt marsh restoration site. Estuaries, 25, 259–273.
(14) Anastasiou C.J. & Brooks J.R. (2003) Effects of soil pH, redox potential, and elevation on survival of Spartina patens planted at a West Central Florida salt marsh restoration site. Wetlands, 23, 845–859.
(15) Callaway J.C., Sullivan G. & Zedler J.B. (2003) Species-rich plantings increase biomass and nitrogen accumulation in a wetland restoration experiment. Ecological Applications, 13, 1626–1639.
(16) Zedler J.B., Morzaria-Luna H. & Ward K. (2003) The challenge of restoring vegetation on tidal, hypersaline substrates. Plant and Soil, 253, 259–273.
(17) Thomsen D., Marsden I.D. & Sparrow A.D. (2005) A field experiment to assess the transplant success of salt marsh plants into tidal wetlands. Wetlands Ecology and Management, 13, 489–497.
(18) Armitage A.R., Boyer K.E., Vance R.R. & Ambrose R.F. (2006) Restoring assemblages of salt marsh halophytes in the presence of a rapidly colonizing dominant species. Wetlands, 26, 667–676.
(19) O’Brien E.L. & Zedler J.B. (2006) Accelerating the restoration of vegetation in a southern California salt marsh. Wetlands Ecology and Management, 14, 269–286.
(20) Wang J., Seliskar D.M., Gallagher J.L. & League M.T. (2006) Blocking Phragmites australis reinvasion of restored marshes using plants selected from wild populations and tissue culture. Wetlands Ecology and Management, 14, 539–547.
(21) Galbraith-Kent S.L. & Handel S.N. (2007) Lessons from an urban lakeshore restoration project in New York City. Ecological Restoration, 25, 123–128.
(22) Currin C.A., Delano P.C. & Valdes-Weaver L.M. (2008) Utilization of a citizen monitoring protocol to assess the structure and function of natural and stabilized fringing salt marshes in North Carolina. Wetlands Ecology and Management, 16, 97–118.
(23) Varty A.K. & Zedler J.B. (2008) How waterlogged microsites help an annual plant persist among salt marsh perennials. Estuaries and Coasts, 31, 300–312.

12. Habitat restoration and creation
421
(24) Castillo J.M. & Figueroa E. (2009) Restoring salt marshes using small cordgrass, Spartina maritima. Restoration Ecology, 17, 324–326.
(25) Cain J.L. & Cohen R.A. (2014) Using sediment alginate amendment as a tool in the restoration of Spartina alterniflora marsh. Wetlands Ecology and Management, 22, 439–449.
(26) Bayraktarov E., Saunders M.I., Abdullah S., Mills M., Beher J., Possingham H.P., Mumby P.J. & Lovelock C.E. (2016) The cost and feasibility of marine coastal restoration. Ecological Applications, 26, 1055–1074.
(27) De Martis G., Mulas B., Malavasi V. & Marignani M. (2016) Can artificial ecosystems enhance local biodiversity? The case of a constructed wetland in a Mediterranean urban context. Environmental Management, 57, 1088–1097.
(28) Jellinek S., Te T., Gehrig S.L., Steward H. & Nicol J.M. (2016) Facilitating the restoration of aquatic plant communities in a Ramsar wetland. Restoration Ecology, 24, 528–537.
(29) Donnelly M., Shaffer M., Connor S., Sacks P. & Walters L. (2017) Using mangroves to stabilize coastal historic sites: deployment success versus natural recruitment. Hydrobiologia, 803, 389–401.
12.22.3 Directly plant trees/shrubs: freshwater wetlands
Seventeen studies evaluated the effects, on vegetation, of directly planting trees/shrubs in freshwater wetlands. Fifteen studies were in the USA1–7,9–13,15–17. Two were in Australia8,14. Two of the studies9,10 took place in the same site, but used different experimental set-ups.
VEGETATION COMMUNITY
Community composition (2 studies): Two replicated studies of freshwater wetlands in the USA11,13 found that planting trees/shrubs (sometimes11 along with other interventions) had no significant effect on aspects of plant community composition, after 1–11 years. Specifically, planted and unplanted wetlands had a similar proportion of species in different plant groups11,13 and relative abundance of different plant groups13.
Overall richness/diversity (1 study): One replicated, randomized, controlled, before-and-after study in depressional wetlands in the USA13 found that wetlands sparsely planted with tree seedlings contained a similar number of plant species, after 1–4 years, to unplanted wetlands.
VEGETATION ABUNDANCE
Overall abundance (2 studies): Two replicated studies (one site comparison; one randomized, controlled, before-and-after) of freshwater wetlands in the USA11,13 found that planting trees/shrubs (sometimes11 along with other interventions) had no significant effect on overall vegetation cover (both ground and canopy, separately11 or combined13) after 1–11 years.
Herb abundance (1 study): One study in a former firing range in the USA7 simply quantified herb cover approximately 1–2 years after reprofiling the site and planting trees/shrubs.
Tree/shrub abundance (1 study): One study in a former firing range in the USA7 simply quantified woody plant cover approximately 1–2 years after reprofiling the site and planting trees/shrubs.
VEGETATION STRUCTURE
Visual obstruction (1 study): One replicated, site comparison study in the USA11 found that swamps created by planting trees/shrubs (after reprofiling) had less horizontal vegetation cover, after 7–11 years, than nearby swamps recovering naturally from logging.
Height (6 studies): One replicated, site comparison study in the USA11 found that swamps created by planting trees/shrubs (after reprofiling) contained shorter woody vegetation, after 7–11 years, than nearby swamps recovering naturally from logging. Herbaceous vegetation, however, was of similar height. Five studies (four replicated) in freshwater wetlands in the USA3,7,9,10,15 simply quantified the height of trees and shrubs over 1–6 growing seasons after they were planted; in four of these studies3,9,10,15, the average height typically increased over time.

12. Habitat restoration and creation
422
Diameter (1 study): One study in a freshwater wetland in the USA7 reported an increase in the diameter of surviving trees over the year after they were planted.
Basal area (1 study): One replicated, site comparison study in the USA11 found that swamps created by planting trees/shrubs (after reprofiling) had a lower vegetation basal area, after 7–11 years, than nearby swamps recovering naturally from logging.
OTHER
Survival (15 studies): Fifteen studies (including eight replicated) in the USA1–7,9,10,12,15–17 and Australia8,14 quantified survival of individual trees/shrubs planted in freshwater wetlands. Survival rates ranged from 0% to 100% after 4–66 months. Seven of the studies (including six replicated) in the USA3,4,10,12,15 and Australia8,14 reported 0% survival of planted vegetation in at least some cases, after 1–6 growing seasons. Proposed factors affecting survival included elevation/water levels1,3,9,10,12,15, the season of planting3, protection from herbivores3,14,15, root pruning4, extreme weather8, and if/how invasive vegetation was removed before planting12.
Growth (2 studies): Two studies monitored true growth of individual trees/shrubs (rather than changes in average height of survivors). The two studies, in freshwater wetlands in the USA5,17, reported that planted trees grew in diameter5,17 and/or height17 over their first 1–2 growing seasons.
A study in 1979 of a swamp restoration project in Florida, USA (1) reported that 7–85% of planted tree seedlings survived over 4–5 months. Of the 16 planted species, survival was lowest for longleaf pine Pinus palustris (7%) and highest for green ash Fraxinus pennsylvanica and baldcypress Taxodium distichum (both 85%). For all species, the survival rate varied between plots at different elevations. Statistical significance was not assessed. Methods: In January and February 1979, seedlings of native Florida tree species were planted into a wetland undergoing restoration. The site was historically a swamp, then mined for phosphate. It was modified before planting by levelling spoil piles, creating wet basins and installing inflow/outfall pipes. Most of the 10,400 seedlings were planted in 26 multispecies plots (4–5 species/plot; seedlings 1.5 metres apart) but some were planted randomly throughout the site. Survival of planted seedlings was recorded in June 1979.
A study in 1980–1981 of a swamp restoration project in Florida, USA (2) reported that 46–91% of planted tree seedlings survived over one year. Eight species were planted, but the study only reports results for three. The survival rate was 46% for slash pine Pinus elliotti, 85% for red maple Acer rubrum and 91% for sweetgum Liquidamar styraciflua. Methods: In early 1980, five 0.19-ha plots were planted with approximately 3,000 tree seedlings (600 seedlings/plot; mixed species). The site was historically a swamp, then mined for phosphate. Existing grass-like plants were burned before planting trees. Survival of planted seedlings was recorded in early 1981.
A replicated study in 1985–1987 in a floodplain swamp in Louisiana, USA (3) reported variable survival and changes in average height of planted baldcypress Taxodium distichum seedlings, depending on protection from herbivores, water levels and season of planting. Statistical significance was not assessed. Overall, 0–88% of seedlings survived over 2–3 growing seasons. In five of seven cases with data, the average height of surviving seedlings was greater after 2–3 growing seasons (76–130 cm) than it had been after one growing season (60–102 cm). Seedlings protected from herbivores had higher survival than unprotected seedlings when planted in the spring, but not when planted in autumn (see Section 13.19). Amongst protected seedlings, survival was higher in drier plots after a wet year (1986; driest plot: 84–88%; wettest

12. Habitat restoration and creation
423
plot: 52–70%) but higher in wetter plots after a dry year (1987; driest plot: 20–40%; wettest plot: 52–70%). Methods: In 1985, three plots (flooded at different depths and for different durations) were each planted with 250 baldcypress seedlings: 200 in February/March and 50 in September. Chickenwire fences protected 75 seedlings/ plot from herbivores (especially nutria Myocastor coypus). Seedlings were root-pruned and stored cold (4°C) before planting. Plots contained other trees (330–590 stems/ha) and saplings/shrubs (1,000–3,500 stems/ha). Baldcypress seedling survival and height were recorded in October 1985, 1986 and 1987.
A replicated study in 1988–1990 in up to five created freshwater wetlands in eastern Massachusetts, USA (4) reported that survival of planted red maple Acer rubrum saplings depended on whether their roots were pruned. Statistical significance was not assessed. After approximately 1–2 years, the survival rate was >75% for saplings whose roots had been pruned “several months” before planting, but <25% for saplings whose roots had not been pruned. Methods: In the late 1980s, red maple saplings saved from destroyed wetlands were planted in up to five newly created wetlands (excavated from uplands, connected to natural wetlands, planted with herbs and shrubs as well as red maple). The roots of some saplings were pruned before planting. The study does not report the number of saplings planted, the precise number of wetlands planted with red maple, or precise dates of planting and monitoring.
A study in 1992–1994 in a freshwater marsh in Louisiana, USA (5) reported that planted baldcypress Taxodium distichum seedlings grew, but that seedlings exposed to herbivores all died within two years. Statistical significance was not assessed. Over one growing season, seedlings protected from herbivores grew thicker by 0.32–0.85 cm. Unprotected seedlings grew thicker by 0.28 cm. Half of the unprotected seedlings survived the first growing season, but none survived the winter following the second growing season. The study does not report survival rates for the protected seedlings. Methods: In January 1992, four hundred baldcypress seedlings were planted into a marsh (historically a swamp, but logged around 80 years previously). Of these, 320 were protected from herbivores (240 with plastic sleeves, 80 with sticky insect-trapping oil) and 80 were left unprotected. Some protected and unprotected seedlings received additional treatments: fertilization and/or removal of competing vines. Nutria Myocastor coypus were “intensively trapped” in the month before planting. Seedling diameter was measured at planting (January 1992) and after one growing season (October 1992). Survival was monitored until after the second growing season (early 1994).
A study in 1992–1993 around the margins of an excavated freshwater wetland in Ohio, USA (6) reported that 96% of planted trees survived for 16 months. In contrast, almost all planted shrubby cinquefoil Potentilla fruticosa had died or was “very unhealthy”. Methods: In spring 1992, approximately 757 trees/shrubs were planted (4.6 m apart) into intermittently flooded land around two connected basins (6.1 ha total area) which had been excavated in autumn 1991. Ten different species were planted: two maples Acer spp., river birch Betula nigra, green hawthorn Crateagus viridis, green ash Fraxinus pennsylvanica, sweetgum Liquidambar styraciflua, black gum Nyssa sylvatica, pin oak Quercus palustris, arrowwood Viburnum recognitum and shrubby cinquefoil.
A study in 1994–1995 in a reprofiled and planted freshwater wetland in Maryland, USA (7) reported that the majority of planted trees/shrubs survived for one year, but there was little other change in vegetation cover and structure. Statistical

12. Habitat restoration and creation
424
significance was not assessed. After approximately one year, 83% of planted shrubs and 91% of planted trees were still alive. Survival varied between species, but was never lower than 69% (for highbush blueberry Vaccinium corymbosum). Over the year after planting, the average diameter of surviving trees increased from 11 to 15 mm. There was little other change in vegetation cover (grasses: 67–69%; other herbs: 17–19%; woody plants: 1%) or structure (tree height: 147–149 cm; tree canopy diameter: 29–33 cm; shrub height: 101 cm; shrub canopy diameter: 31–36 cm). Methods: In spring/summer 1994, a mixture of tree and shrub species (6,327 individuals) were planted into 5.5 ha of a former firing range, which had been reprofiled to manage water levels. Vegetation was surveyed in August 1994 and 1995. Tree/shrub survival, and diameter of surviving trees/shrubs, were monitored in twelve 25 x 25 m plots. Cover of all plant species was recorded in 120 quadrats, each 1 m2. The study does not distinguish between the effect of planting trees/shrubs and reprofiling on non-planted vegetation.
A replicated study in 1994–1995 in a wet meadow in New South Wales, Australia (8) reported 95–100% survival of planted tree/shrub seedlings after nine months, but 0–90% survival after 50 months. After nine months, >95% of planted seedlings were still alive: for all five sown species, in both drier and wetter plots, and whether or not vegetation was cleared before planting. After 50 months, and following extremes of both flooding and drought, survival was more variable. Some seedlings survived in 9 of 10 cases, with a survival rate of 10–90%. In the other case, the survival rate was 0% for prickly tea tree Leptospermum juniperinum seedlings in lower (wetter) plots. Methods: In October–December 1994, five tree/shrub species present in local wetlands were planted into a wet meadow, with the aim of restoring a swamp. Three hundred nursery-reared seedlings of each species were planted, at least 1 m apart. Of the 300 seedlings/species, 150 were planted in a drier area (vs 150 in a wetter area) and 200 were planted in plots cleared of vegetation (vs 100 in intact vegetation). Survival was monitored after nine months (all seedlings) and 50 months (10 seedlings/species/water level).
A replicated study in 1993–1996 in a degraded freshwater swamp in South Carolina, USA (9) reported that 14–87% of planted tree seedlings survived over four growing seasons, and that the average height of seedlings increased. Statistical significance was not assessed. Six tree species were planted. After four growing seasons, survival rates were 14% for cherrybark oak Quercus falcata var. pagodaefolia, 54% for willow oak Quercus phellos, 62% for water tupelo Nyssa aquatica and Nuttall oak Quercus nuttallii, 83% for overcup oak Quercus lyrata and 87% for baldcypress Taxodium distichum. When planted, seedlings were 42–89 cm tall on average. After four growing seasons, survivors were 153–285 cm tall on average. The study also reported that survival and height change varied with elevation/wetness for some species, but found that clearing competing vegetation typically had no significant effect on survival or growth (see Section 13.20 and original paper). Methods: In April 1993, tree seedlings were planted (25 plots; 6 seedlings/species/plot; seedlings 2 m apart) into a degraded swamp. Heated effluent had killed existing trees between 1955 and 1985. All seedlings were protected with tree guards. In 20 plots, competing vegetation was cleared in summer 1993 and 1994, by mowing or applying herbicide. Seedling survival and height were recorded at planting, then each autumn until 1996. This study used the same swamp as (10), but a different experimental set-up.
A replicated study in 1994–1996 in a degraded freshwater swamp in South Carolina, USA (10) reported that 0–95% of planted tree seedlings survived over three

12. Habitat restoration and creation
425
growing seasons, but that the average height of seedlings increased. Statistical significance was not assessed. Four tree species were planted. After three growing seasons, survival rates were 0% for laurel oak Quercus laurifolia, 73–90% for water hickory Carya aquatica, 78–90% for overcup oak Quercus lyrata and 70–95% for baldcypress Taxodium distichum. When planted, seedlings of the last three species were 47–85 cm tall on average. After three growing seasons, survivors were 104–192 cm tall on average. The study also reported that survival and height change varied with elevation/wetness for all species, and with site conditions (presence of tree canopy or grasses) for baldcypress (see Section 13.20 and original paper). Methods: Fifteen 180-m2 plots were established in a degraded swamp (where heated effluent had existing trees between 1955 and 1985). Five plots contained black willow Salix nigra, five were cleared of willow and five were dominated by grasses. In February 1994, four hundred and eighty seedlings (120 seedlings/species) were planted, 2 m apart, into the 15 plots (8 seedlings/species/plot). All seedlings were protected with tree guards. Seedling survival and height were recorded at planting, then each autumn until 1996. This study used the same swamp as (9), but a different experimental set-up.
A replicated, site comparison study in 2000 of 11 freshwater swamps in Virginia, USA (11) found that created swamps – planted with trees/shrubs after reprofiling – had a similar proportion of habitat-characteristic vegetation and similar horizontal vegetation cover to similar-aged swamps recovering naturally from logging, but contained shorter woody vegetation with a lower basal area and density. After 7–11 years, created and naturally recovering swamps contained statistically similar proportions of tree species characteristic of four soil moisture classes (from “highly saturated” to “partially saturated”), had statistically similar vegetation cover (both ground and canopy) and contained herbs of statistically similar height (data not reported). However, woody vegetation in created swamps was shorter (created: 2.0 m; natural: 4.4 m) and had a lower basal area (created: 59 cm2/100 m2; natural: 519 cm2/100 m2). Finally, created swamps had lower horizontal vegetation cover, both 1 m and 2 m above the ground (created: 26–45%; natural: 83–92%). Methods: In summer 2000, vegetation was surveyed in 11 swamps of similar age, water level and surrounding land use. Six swamps had been created by planting a mix of wetland trees/shrubs after reprofiling upland sites to increase soil moisture (and in one case, adding wetland soil). The study does not distinguish between the effects of these interventions on non-planted vegetation. Five swamps were recovering naturally after clearcut logging.
A replicated study in 2002–2004 in three freshwater wetlands in Wisconsin, USA (12) reported variable survival of 23 planted tree/shrub species after 1–2 growing seasons, depending on numerous factors. Overall, survival rates ranged from 0% after one growing season to 100% after two growing seasons. Survival rates depended on the combination of species, site, time after planting, plot elevation/wetness, and whether/how invasive reed canarygrass Phalaris arundinacea was removed before planting. After two growing seasons, three species had 100% survival under one treatment: blackcurrant Ribes americanum, elderberry Sambucus canadensis and highbush cranberry Viburnum opulus var. americanum, planted where canarygrass had been sprayed with herbicide and the soil had been ploughed. Twelve species failed to survive under at least one treatment. Yellow birch Betula alleganiensis failed to survive under any treatment. Methods: In spring 2003 or 2004, seedlings of 11 tree and 12 shrub species were planted into three degraded wetlands (roughly 1 seedling/m2). Reed canarygrass had been removed from some planted areas, but left

12. Habitat restoration and creation
426
in others (distribution of seedlings amongst treatments not clear). Removal treatments involved spraying with herbicide, herbicide then ploughing, herbicide then burning, or mowing then herbicide. Survival of all seedlings was monitored in September 2003 and 2004.
A replicated, randomized, controlled, before-and-after study in 2000–2005 in 16 ephemeral freshwater wetlands undergoing restoration in South Carolina, USA (13) found that sparsely planting wetland tree seedlings had no significant effect on plant species richness or cover. Over four years after planting, there was no significant difference in any measured vegetation metric between planted and unplanted wetlands. Metrics included: total plant species richness; total vegetation cover; proportion of wetland-characteristic, herbaceous and woody plant species; and relative cover of wetland-characteristic, herbaceous and woody plants. The study does not report data for planted and unplanted wetlands separately (see Section 12.2 for combined data). Methods: In 2001, baldcypress Taxodium distichum and swamp tupelo Nyssa biflora seedlings were planted (≥5 m apart) into eight depressional wetlands. Eight nearby wetlands were not planted. Earlier that year, all 16 wetlands received the following interventions: plugging drainage ditches, cutting and removing non-wetland trees, and treating tree regrowth with herbicide. Vegetation was surveyed before (2000) and for four years after (2001–2005) planting, in 0.1-ha plots (3–5/wetland) and 4-m2 quadrats (8–12/wetland).
A replicated study in 2014–2015 in two degraded floodplain swamps in Victoria, Australia (14) reported 0–100% survival of planted swamp gum Eucalyptus camphora seedlings over one year, largely depending on whether herbivores were excluded or not. In plots fenced to exclude browsing and grazing mammals, 98–100% of seedlings survived. In unfenced plots, only 0–4% of seedlings survived. Methods: In March 2014, swamp gum seedlings were planted into eighteen 100-m2 plots across two floodplain wetlands (50 seedlings/plot). In each wetland, eight plots had been fenced and one was left open. All plots had been recently cut and sprayed with herbicide (to control reed canarygrass Phalaris arundinacea or common reed Phragmites australis), and planted with native shrubs and herbs along with swamp gum. Some fenced plots were also covered with matting or woodchips. Seedling survival was monitored in March 2015.
A replicated study in 2008–2013 in two created freshwater swamps in Michigan, USA (15) reported 0–94% survival of planted white cedar Thuja occidentalis seedlings after five years, and a change in average height of −2 cm/year to +39 cm/year between two and five years after planting. These results depended on seedling elevation, site and whether plots were fenced to exclude white-tailed deer Odocoileus virginianus. For example, the highest survival rate (94%) was for seedlings planted on mounds in the drier site, and within deer-exclusion fencing. In the wetter site, ≤1% of seedlings survived when planted in lower flats, whether or not they were protected from deer browsing. For full details, see Sections 13.7 and 13.19. Methods: In spring 2008, one-year-old white cedar seedlings were planted into 37 plots (of varying size) on two recently excavated wetlands. Each plot was planted with 5–106 seedlings, approximately 2.8 m apart. There were 2–6 plots/site for each of two elevation treatments (mounded/never flooded or flat/sometimes flooded) and two fencing treatments (fenced or open). Surviving trees were monitored in April 2010 and October 2013.
A study in 2002–2005 aiming to restore a forested wetland in Arkansas, USA (16) reported 50% survival of planted tree seedlings after three years. An average of

12. Habitat restoration and creation
427
377 trees/ha were still alive in 2005, compared to the 748 trees/ha planted in 2002. Methods: In 2002, bare-root tree seedlings were planted into flats (seasonally wet areas, intermediate in elevation between created mounds and hollows) on a floodplain wetland. The site been used for agriculture since the 1960s. Wetland restoration activities (details not reported) began in 2001. The species planted were baldcypress Taxodium distichum, water oak Quercus nigra, overcup oak Quercus lyrata, Nuttall’s oak Quercus texana, and green ash Fraxinus pennsylvanica (data reported for all species combined).
A study in 2013–2015 in an ephemeral freshwater marsh in Florida, USA (17) reported that 89–100% of planted tree saplings survived over two years, and that survivors typically grew. Statistical significance was not assessed. Two years after planting in floating peat bags, survival rates were 89% for strangler fig Ficus aurea saplings, 97% for red maple Acer rubrum saplings and 100% for pond apple Annona glabra saplings. Average growth rates were positive in 27 of 28 reported cases (height: 0.2–1.4 mm/day; diameter: 0.01–0.06 mm/day; variation depending on species and planting method). In the other case, the average growth rate of red maple planted in unfertilized, upright peat bags was −0.01 mm/day. Methods: In October 2013, thirty-five nursery-reared saplings/species were planted into peat bags (punctured with multiple holes; 1–2 saplings/bag). Fertilizer or additional floatation aids were added to some bags. The planted bags were then floated on the marsh, flat or upright. All saplings were measured at planting. Survivors were recorded and measured for up to two years.
(1) Gilbert T., King T., Hord L. & Allen J.N. Jr. (1980) An assessment of wetlands establishment techniques at a Florida phosphate mine site. Proceedings of the Annual Conference on Restoration and Creation of Wetlands 7, Tampa, Florida, 245–263.
(2) Clewell A.F. (1981) Vegetational restoration techniques on reclaimed phosphate strip mines in Florida. Wetlands, 1, 158–170.
(3) Conner W.H. & Flynn K. (1989) Growth and survival of baldcypress (Taxodium distichum [L.] Rich.) planted across a flooding gradient in a Louisiana bottomland forest. Wetlands, 9, 207–217.
(4) Jarman N.M., Dobberteen R.A., Windmiller B. & Lelito P.R. (1991) Evaluation of created freshwater wetlands in Massachusetts. Restoration & Management Notes, 9, 26–29.
(5) Myers R.S., Shaffer G.P. & Llewellyn D.W. (1995) Baldcypress (Taxodium distichum (L.) Rich.) restoration in southeast Louisiana: the relative effects of herbivory, flooding, competition and macronutrients. Wetlands, 15, 141–148.
(6) Niswander S.F. & Mitsch W.J. (1995) Functional analysis of a two-year-old created in-stream wetland: hydrology, phosphorus retention, and vegetation survival and growth. Wetlands, 15, 212–225.
(7) Perry M.C., Sibrel C.B. & Gough G.A. (1996) Wetlands mitigation: partnership between an electric power company and a federal wildlife refuge. Environmental Management, 20, 933–939.
(8) de Jong N.H. (2000) Woody plant restoration and natural regeneration in wet meadow at Coomonderry Swamp on the south coast of New South Wales. Marine and Freshwater Research, 51, 81–89.
(9) McLeod K.W., Reed M.R. & Wike L.D. (2000) Elevation, competition control, and species affect bottomland forest restoration. Wetlands, 20, 162–168.
(10) McLeod K.W., Reed M.R. & Nelson E.A. (2001) Influence of a willow canopy on tree seedling establishment for wetland restoration. Wetlands, 21, 395–402.
(11) Snell-Rood E.C. & Cristol D.A. (2003) Avian communities of created and natural wetlands: bottomland forests in Virginia. The Condor, 105, 303–315.
(12) Hovick S.M. & Reinartz J.A. (2007) Restoring forest in wetlands dominated by reed canarygrass: the effects of pre-planting treatments on early survival of planted stock. Wetlands, 27, 24–39.
(13) De Steven D., Sharitz R.R. & Barton C.D. (2010) Ecological outcomes and evaluation of success in passively restored Southeastern depressional wetlands. Wetlands, 30, 1129–1140.
(14) Greet J., King E. & Stewart-Howie M. (2016) Plastic weed matting is better than jute or woodchips for controlling the invasive wetland grass species Phalaris arundinacea, but not Phragmites australis. Plant Protection Quarterly, 31, 19–22.

12. Habitat restoration and creation
428
(15) Kangas L.C., Schwartz R., Pennington M.R., Webster C.R. & Chimner R.A. (2016) Artificial microtopography and herbivory protection facilitates wetland tree (Thuja occidentalis L.) survival and growth in created wetlands. New Forests, 47, 73–86.
(16) Sleeper B.E. & Ficklin R.L. (2016) Edaphic and vegetative responses to forested wetland restoration with created microtopography in Arkansas. Ecological Restoration, 34, 117–123.
(17) Dreschel T.W., Cline E.A. & Hill S.D. (2017) Everglades tree island restoration: testing a simple tree planting technique patterned after a natural process. Restoration Ecology, 25, 696–704.
12.22.4 Directly plant trees/shrubs: brackish/saline wetlands
Forty-seven studies evaluated the effects, on vegetation, of directly planting trees/shrubs in brackish/saline wetlands. Forty-four studies involved planting mangroves or other coastal swamp trees: 20 in Asia3,5,10–12,19a,19b,20a,20b,22,25–28,32,34,39–41,44, seven in Central America6,7,17,24,30,33,35, six in Africa8,13,18,36,42a,42b, four in North America1,14,21,43, four in South America2,4,29,31, two in Oceania16,37 and one globally38. Three studies involved planting shrubs in the USA9,15 or Spain23. There was overlap in the sites used in two studies6,30. One systematic review38 included several of the other summarized studies.
VEGETATION COMMUNITY
Overall extent (3 studies): Two before-and-after studies in India10 and South Africa36 reported that the area of mangrove forest was greater 6–42 years after planting mangrove trees (sometimes10 along with other interventions) than in the years before. One study in Sri Lanka44 simply quantified the area of mangrove vegetation present 8–10 years after planting seedlings (and propagules).
Tree/shrub richness/diversity (6 studies): Three site comparison studies in the USA21, Mexico30 and Brazil31 reported that where mangrove forests developed after planting trees (sometimes21 along with other interventions), they contained a similar number of tree species to mature21,30,31 and/or naturally regenerating31 forests after 10–30 years. One site comparison study in Vietnam40 reported that after 14–34 years, a planted mangrove forest contained more tree species than a (slightly older) naturally regenerated forest. One replicated, paired, before-and-after, site comparison study in Kenya8 reported that planted mangrove forest contained fewer adult tree species than mature natural forest after five years, but more species of seedling. One study in a former shrimp pond in Thailand28 simply reported the number of unplanted tree species that had colonized six years after planting (along with other interventions).
VEGETATION ABUNDANCE
Tree/shrub abundance (9 studies): Three replicated, site comparison studies of coastal sites in the Philippines20b, the USA21 and Brazil31 reported that where mangrove forests developed after planting trees (sometimes20b,21 along with other interventions), woody vegetation was typically more dense than in mature natural forests20b,21,31 and/or naturally regenerating forests31. Two site comparison studies in Kenya8 and Vietnam40 found that tree abundance (density8,40 and biomass40) was similar in planted and natural mangroves after 5–34 years. One site comparison study in Mexico30 reported that a planted mangrove forest contained fewer trees than pristine natural forests after 12 years. Two site comparison studies in the Philippines32,39 reported mixed results according to time since planting32 and site39. One study in Thailand28 simply quantified the abundance of mangrove trees six years after planting (along with other interventions).
Algae/phytoplankton abundance (1 study): One site comparison study in Kenya13 found that mangrove forests restored by planting contained a similar algal biomass, after eight years, to mature natural forests. However, mangrove forests created by planting into bare sediment contained less algal biomass than mature natural forests.
Individual species abundance (7 studies): Seven studies8,13,15,28,30,31,43 quantified the effect of this intervention on the abundance of individual plant species. Four of the studies compared the

12. Habitat restoration and creation
429
abundance of woody vegetation8,30,31 or algae13 in planted mangrove forests and mature natural forests – and sometimes31 naturally regenerating forests (see original papers for data). One replicated, paired, controlled study in a brackish wetland in the USA15 reported that there were fewer common reed Phragmites australis stems in plots planted with wetland shrubs (and herbs) than in unplanted plots, after 1–3 years. One before-and-after study of an intertidal site in the USA43 reported greater abundance of red mangrove Rhizophora mangle over five years after planting (along with other interventions) than before.
VEGETATION STRUCTURE
Overall structure (3 studies): Three replicated, site comparison studies of coastal sites in the Kenya8, the USA21 and the Philippines32 reported that where mangrove forests developed after planting trees (sometimes21 along with other interventions), their overall structure differed from mature natural forests for up to 50 years.
Height (18 studies): Four site comparison studies (three replicated, three paired) of coastal sites in Kenya8, the USA21, Brazil31 and the Philippines39 reported that where mangrove forests developed after planting trees (sometimes21 along with other interventions), the vegetation was shorter than in mature8,21,31,39 and naturally regenerating31 forests after 5–30 years. One site comparison study in Mexico30 reported that planted mangrove forests contained taller trees than pristine natural forests after 12 years. Fourteen studies (four replicated) in Asia3,5,11,12,27,28, Central/South America6,7,17,24,35, Africa42a,42b and North America43 simply quantified the height of mangrove trees for up to six years after they were planted; in 13 of these studies3,5–7,12,17,24,27,28,35,42a,42b,43, the average height increased over time.
Diameter (7 studies): Two site comparison studies in Mexio30 and Vietnam40 reported that tree diameters were similar in planted and natural mangroves after 12–34 years. In contrast, two site comparison studies in Brazil31 and the Philippines39 reported that planted mangroves contained thinner tree stems than mature natural mangroves after 7–12 years. The study in Brazil31 also reported that stem diameters were thinner than in naturally regenerating areas. Three studies in India3 and Nigeria42a,42b simply quantified the diameter of mangrove trees for up to three years after they were planted; in all three studies, the average stem diameter increased over time.
Basal area (3 studies): Two site comparison studies (one also replicated, paired, before-and-after) in Kenya8 and Mexico30 reported that planted mangrove forests had a smaller basal area than mature natural forests after 5–12 years. One replicated, site comparison study in the USA21 reported that where mangrove forests developed after planting trees (along with other interventions), their basal area was similar to mature natural forests after 17–30 years.
OTHER
Survival (37 studies): Thirty-six studies (including one review1 and one systematic review38) quantified survival rates of individual trees/shrubs planted in brackish/saline wetlands. Survival rates ranged from 0% to 100% after 15 days to 21 years. The studies were of mangroves in North America1,13,43, Central/South America2,4,6,7,17,24,29,33,35, Asia3,5,11,12,19a,19b,20a,22,25–28,34,41,44, Africa18,42a,42b, Oceania16,37 or globally38, and of shrubs in the USA9,15 or Spain23. Six studies1,4,15,17,26,37 reported 100% survival in some cases. Eleven studies1,4,5,16,21,22,29,37,38,41,44 reported 0% survival or absence of planted species in some cases. In six studies20a,21,22,37,38,44, survival of planted seedlings was not distinguished from survival of seeds or propagules. Proposed factors affecting survival included elevation/water levels2,5,11,16,18,19a,19b,22,29,33–35, exposure to wind/waves2,4,12,20a,34, soil properties4,11,29,33, sediment deposition19b,22,25,27, oyster/barnacle colonization19b,20a,27, salinity11,18, use of guidance44 and post-planting care44.
Growth (9 studies): Nine studies monitored true growth of individual trees/shrubs (rather than changes in average height of survivors). The nine studies, in Colombia2,4, the USA9,14,15, the
Philippines20a,32, Brazil29 and China41, reported that planted trees/shrubs typically grew, over periods

12. Habitat restoration and creation
430
from 40 days to 50 years. One replicated study in the USA14 reported that planted seedlings grew less quickly than naturally colonizing seedlings. One replicated, site comparison study in the Philippines32 found that growth rates of trees in planted mangroves became more similar to those in mature natural mangroves over time.
A 1977 review of mangrove plantings in Florida, USA (1) reported 0–100% survival of planted seedlings or trees over six months to 32 years. Experiments yielding high survival rates included: planting seedlings in sheltered coastal sites (85–90% survival after 1–4 years); planting >4-year-old trees, with roots wrapped in burlap, at or above mid-tide level (80–100% survival after 13 months); and planting trees, each 0.3–3.6 m tall, alongside sheltered canals (100% survival after six months). Experiments yielding low survival rates included: planting seedlings in exposed east-coast sites (0–2% survival after 7–10 months); planting >4-year-old trees below mid-tide level (0% survival after 13 months; insect damage noted); transplanting fourteen trees, each 4.6–6.1 m tall (0% survival after six months); and planting young seedlings in the Dry Tortugas Islands (80% survival after one year but 0% survival after 32 years). Methods: The review reported results from several experiments planting mangrove seedlings or trees under a range of conditions. Most experiments involved planting red mangrove Rhizophora mangle; some also included black mangrove Avicennia germinans and white mangrove Laguncularia racemosa. Between 14 and 60,000 plants were planted in each experiment. Some were nursery-reared and some were transplanted from wild populations.
A replicated study in 1984–1985 on chalky coastal sediments around three islands in Colombia (2) reported that only 20% of transplanted red mangrove Rhizophora mangle seedlings survived over 247 days, but that survivors grew. Statistical significance was not assessed. Overall, 26 of 130 planted seedlings were still in place and alive after 247 days. Seedling survival was 0% and 5% on the two most exposed islands, but 35% on the least exposed island. Seedling survival was 0% at the highest elevations, 60% in moderate elevations and 100% at the lowest elevations. On average, surviving seedlings grew 6 cm taller and four new leaves at moderate elevations, but grew 32 cm taller and six new leaves at the lowest elevations. Methods: In November 1984, a total of 130 red mangrove seedlings (<70 cm tall) were transplanted to three islands, at three different elevations (“high beach”, “intertidal” and “low beach”). The study does not report the number of seedlings on each island or at each elevation, and does not quantify elevation. Seedlings were spaced at 9/m2, watered every two weeks with fresh water, and cleaned of dust and debris. Seedlings in “poor condition” were removed. Seedling survival, height and leaf number were monitored until July 1985.
A study in a marshy, estuarine site in northeast India (3) reported 25–83% survival of planted mangrove saplings after one year, and that the average size of saplings typically increased over two years. Statistical significance was not assessed. Ten species were planted. One year after planting, mangrove apple Sonneratia apetala had the highest survival rate (76–83%) and Ceriopsis decandra the lowest (25–33%). Between one and two years after planting, the average size of surviving trees typically increased: height in 20 of 20 cases, trunk diameter in 16 of 20 cases, number of branches in 15 of 20 cases and canopy diameter in 14 of 20 cases (see original paper for data). Nine of 10 species had higher survival in mixed plantations than monocultures, but size metrics were more likely to increase over time in monocultures (40 of 40 cases) than in mixed plantations (25 of 40 cases). Methods: At an unspecified time, 1-year-old mangrove saplings (reared in a nursery from

12. Habitat restoration and creation
431
cuttings) were planted 2 m apart over 10-ha degraded salt marsh within the Mahanadi Delta. Ten species were planted in single-species or mixed-species stands (further details of layout not reported). Survival was monitored after one year. Surviving saplings were measured after one and two years.
A replicated study in 1995–1997 in two degraded mangroves in Colombia (4) reported that 0–100% of planted trees survived over 15 months – depending on species, age and environmental conditions – but that survivors grew. For example, white mangrove Laguncularia racemosa seedlings had significantly higher survival rates (0–90%) than black mangrove Avicennia germinans seedlings (0–11%). For these species, seedlings had lower survival rates (0–90%) than saplings (20–100%; statistical significance not assessed). Surviving plants grew over 13 months (see original paper). The study suggests that variation in survival and growth was related to dust, winds, soil moisture, soil firmness and/or caterpillar damage. Methods: In 1995 (start of the dry season), seedlings and/or saplings of three mangrove species were planted into two degraded mangrove sites. In both sites, channels had been unblocked (in 1989 or earlier in 1995) to restore freshwater inputs and reduce the salinity that killed the existing mangrove trees (around 1965 or 1975). Sets of 10–30 trees were planted in a range of soil conditions (1–2 sets/species/site; see original paper for full details). Survival and plant height were monitored at planting and for up to 15 months.
A replicated study in 1992–1997 of two mangrove plantations in Kuwait (5) reported that most grey mangrove Avicennia marina seedlings established when planted below average high tide level, and that their average height and stem number increased over time. Statistical significance was not assessed. No seedlings survived when planted above the average high tide level. Of the seedlings planted at or below average high tide level, 85–92% survived for at least one year. When planted, seedlings had 1 main stem and were 33–63 cm tall on average. After five years, surviving seedlings had 3–8 main stems and were 128–288 cm tall on average. Flowering, fruiting and seeding were also observed. Methods: In June 1992 or 1994, mangrove seedlings (number not reported) were planted into two mudflats. At each site, five rows were planted at varying tidal heights. The seedlings were grown in a greenhouse from wild seeds collected the previous year (from two separate mangroves). Measurements were taken at planting and for at least five years afterwards.
A study in 1994–1998 on a mudflat in northwest Mexico (6) reported that 74% of planted black mangrove Avicennia germinans seedlings survived for two years, and that the average height of seedlings increased over time. After six months, surviving seedlings were 13 cm tall on average. After two years, surviving seedlings were 62 cm tall on average. Statistical significance was not assessed. Methods: In December 1994, nursery-grown black mangrove seedlings were planted into an intertidal mudflat (where the previous mangrove forest had been cut down three years earlier). A total of 555 seedlings were planted, in 111 clusters of five. Clusters were 1 m apart and at least 60 cm from naturally colonizing trees. The plastic bag containing each cluster was slit to allow the roots to grow. Seedling survival and height were monitored for two years. This site was also studied in (30).
A study in 2000–2001 in a lagoon in southern Mexico (7) reported 95% survival of planted red mangrove Rhizophora mangle seedlings after seven months, and that the average height of surviving seedlings increased. Statistical significance was not assessed. When planted, seedlings were 32 cm tall on average. Seven months later,

12. Habitat restoration and creation
432
surviving seedlings were 72 cm tall on average. Methods: In late 2000, a total of 550 nursery-reared red mangrove seedlings (90 days old) were planted at the edge of Pozuelos lagoon (elevation not reported). This site was flooded by two tides/day throughout the year. Surviving seedlings were surveyed for up to seven months after planting.
A replicated, paired, before-and-after, site comparison study in 1994–1999 involving three areas of planted mangroves in southeast Kenya (8) reported that the planted areas had a similar density of trees to mature natural forests after five years, but contained fewer adult tree species and differed in other structural metrics. Unless specified, statistical significance was not assessed. The three planted areas were initially bare sediment. After five years, they contained 3,330–7,640 trees/ha (vs natural: 3,770–4,300 trees/ha; see original paper for on individual species density). Each planted area contained only one species of adult tree (i.e. the planted species), whereas natural areas contained 1–4 species of adult tree (but were always dominated by a single species, comprising 69–100% of individuals). Planted areas contained 4–5 species of seedling (vs natural: only 3 species). Vegetation in planted areas was less structurally complex than in natural areas (reported as a complexity index), was only 3–5 m tall on average (vs natural: 6–8 m) and had a basal area of only 3–12 m2/ha (vs natural: 27–42 m2/ha). In two of three comparisons, planted areas contained significantly fewer seedlings than natural areas (but more in the other comparison). After five years, denuded areas that were not planted remained unvegetated. Methods: In 1994, mangrove saplings were planted into three areas (0.3–6.7 ha) of bare, tidal sediment (historically logged mangrove forest). Each area was planted with one species: grey mangrove Avicennia marina, mangrove apple Sonneratia alba or loop-root mangrove Rhizophora mucronata. In 1999, vegetation was surveyed in the planted areas (three 100-m2 plots/area). For each planted area, an area of natural forest and denuded but unplanted sediment were also surveyed.
A replicated study in 2000 in a salt marsh in Louisiana, USA (9) reported 11–45% survival of planted groundsel Baccharis halimifolia seedlings after four months, but found that surviving seedlings grew. Four months after planting, 11% of groundsel seedlings planted into bare sediment were still alive. These seedlings were 49 cm tall on average, and had grown 4.4 cm taller since planting. For groundsel seedlings planted within patches of smooth cordgrass Spartina alterniflora, the survival rate was 45%. These seedlings were 68 cm tall on average, and had grown 7.2 cm taller since planting. Survival, final height and growth rate were all significantly greater for seedlings planted within cordgrass patches than bare sediment. Methods: In May–June 2000, a total of 160 groundsel seedlings were planted into 20 plots in the high intertidal zone of a salt marsh (constructed four years previously). The groundsel seedlings were 15–55 cm tall, transplanted from another area in the marsh, and planted approximately 25 cm apart within each plot. Ten plots were in the centre of smooth cordgrass patches (where most cordgrass stems were dead). Ten plots were on adjacent bare or sparsely vegetated sediment. Groundsel survival and height were monitored for up to four months after planting.
A before-and-after study in 1986–2002 of a coastal wetland in southern India (10) reported that after excavating channels to restore tidal exchange and planting mangrove seedlings, the area of mangrove forest increased. Before intervention, the site contained only 325 ha of mangrove forest (all mature) and 375 ha of degraded mangrove. Approximately six years after intervention began, the site contained 618 ha of mangrove forest (411 ha mature; 297 ha developing) and only 65 ha of degraded

12. Habitat restoration and creation
433
mangrove. Methods: Large scale restoration of a degraded mangrove forest began in 1996. Tidal exchange was restored to subsided, stagnant areas by excavating tidal channels. Then, mangrove seedlings were planted (details not reported). The study does not distinguish between the effects, on naturally colonizing vegetation, of planting and restoring tidal exchange. The local community was engaged in restoration and long-term management of the mangroves (e.g. de-silting tidal channels). The area covered by mangrove vegetation was measured from satellite images, and verified with field surveys, before intervention (1982) and approximately six years after it began (2002).
A replicated study in the early 2000s on five coastal mudflats in Kuwait (11) reported 16–81% survival of planted grey mangrove Avicennia marina seedlings after nine months, and that the number of branches/seedling typically increased over time but their height typically did not. Statistical significance was not assessed. On average, surviving seedlings had 1–2 branches three months after planting, then 3–7 branches nine months after planting. When planted, the average height of seedlings was 20–25 cm. After nine months, the average height of surviving seedlings was 19–27 cm in four of five sites (46–47 cm in the other site). The study suggests that survival and growth were affected by physical factors such as soil texture, salinity, elevation and the presence of algae. Methods: Grey mangrove seedlings were planted in five tidal, coastal mudflats (1,500–2,000 seedlings/site, 1 m apart). The seedlings had been reared in a nursery from propagules collected in the United Arab Emirates and acclimatized to local high salinities before planting. Surviving seedlings were recorded and measured for up to nine months after planting.
A study in 1998–2003 in the United Arab Emirates (12) reported that 57% of planted grey mangrove Avicennia marina seedlings survived for five years, and that the average size of seedlings increased over time. Seedling mortality occurred in patches. The study suggests the following causes: erosion at the water’s edge, burial with sand from a collapsed road, sandstorms, insect herbivory, and weak root systems unable to support the seedlings. After five years, surviving seedlings were 48 cm tall and had a stem diameter of 82 mm. When planted, seedlings were 27 cm tall and had a stem diameter of 48 mm. Statistical significance was not assessed. Methods: In March–May 1998, grey mangrove seedlings were planted (2 seedlings/m2, 40–50 cm above low tide level) around the edge of an excavated, oval, tidal canal. The 79,580 planted seedlings had been reared in a nearby nursery for six months. Survival (all seedlings) and size (100 seedlings) were monitored in April 2003.
A site comparison study in 2002 of three mangrove forests in southeast Kenya (13) reported that planting non-native mangrove apple Sonneratia alba into degraded forest generally restored habitat structure, algal richness and algal biomass to near natural levels, but replanting clear-cut forest did not. Unless specified, statistical significance was not assessed. After eight years, sites where mangrove apple had been planted into degraded forest did not clearly differ from natural forests in terms of canopy cover (planted: 50–75%; natural: 50–75%), the basal area of aerial roots (planted: 0.4–0.6 m2 roots/m2 forest; natural: 0.3–0.6 m2 roots/m2 forest) and algal richness (planted: 23 taxa/5 m2; natural: 18 taxa/5 m2), and did not significantly differ in terms of algal biomass (planted; 962–4,519 g/m2; natural: 681–2,963 g/m2). In contrast, sites where mangrove apple had been planted after clear-cutting had 100% canopy cover, only 0.2 m2 of aerial roots/m2 forest, only 10 algal species and only 5–167 g/m2 of algal biomass. Both types of planted mangroves contained more aerial roots (degraded: 322–424/m2; clear-cut: 380–400/m2) than natural mangroves

12. Habitat restoration and creation
434
(174–280/m2). For data on the biomass of individual algal species, see original paper. Methods: In early 2002, three mangrove forests were surveyed: two planted with mangrove apple trees in 1994 (amongst remnant forest, or in a site clear-cut in the 1970s) and one natural (mature). Twenty 0.25-m2 quadrats were surveyed in each mangrove. Aerial roots were counted and measured. Algae were identified, collected, dried and weighed.
A replicated study in 2005 on a mudflat in Florida, USA (14) reported that only 6–34% of planted black mangrove Avicennia germinans seedlings survived over seven weeks, and that planted seedlings grew less quickly than naturally colonizing seedlings. Statistical significance was not assessed. Survival was 34% for seedlings planted into established stands of saltwort Batis maritima, 11% for seedlings planted into bare mudflat and 6% for seedlings planted into freshly created saltwort stands. In established saltwort stands, planted seedlings grew 20 mm/week, compared to 50 mm/week for naturally colonizing seedlings. Methods: In June 2005, fifty-four nursery-reared black mangrove seedlings (43 cm tall) were planted into a mudflat where mangrove forest had died off. This area was lower than an adjacent area with healthy forest. Eighteen seedlings were planted in each habitat type: established saltwort stands, saltwort stands planted <5 days earlier, and bare mudflat. Survival and height were measured after seven weeks. The initial and final heights of 36 naturally colonizing seedlings were also recorded.
A replicated, paired, controlled study in 2000–2004 in a degraded brackish marsh in New Jersey, USA (15) reported 38–100% survival of three planted shrub species over two years, and that survivors grew in six of seven cases. Statistical significance was not assessed. Survival rates were 38–73% for southern wax myrtle Myrica cerifera, 92–100% for sea myrtle Baccharis halimifolia and 100% for Jesuit’s bark Iva frutescens. In six of seven cases, surviving plants grew in height (8–252% increase) and circumference (9–233% increase). In the other case, southern wax myrtle grew in height by <1% and shrunk in circumference by 3%. The study also reported that areas planted with the herbs (and some shrubs) contained fewer common reed stems (7–25 stems/m2) than adjacent unplanted areas (66–149 stems/m2). Methods: In summer–autumn 2000–2002, three shrub and five herb species were planted in three areas on the edge of a marsh (4–7 species/area; 4–48 plants/species/area; individual plants 60–100 cm apart). All planted shrubs had been collected from local marshes. Invasive common reed Phragmites australis had been cleared <1 year before planting, by applying herbicide and cutting. Plant survival and size were recorded 1–2 years after planting. Common reed stems were counted in the planted areas and three adjacent unplanted areas, 2–4 years after reed clearance.
A replicated study in 2004–2005 in a coastal brackish/saline marsh in Victoria, Australia (16) reported that 0–93% of planted swamp paperbark Melaleuca ericifolia seedlings survived over 5–8 months. When planted into mounds, 93% of seedlings survived over five months. When not planted into mounds, 0–12% of seedlings survived over 5–8 months. Amongst these, the survival rate was higher for older seedlings and seedlings planted in drier areas, but was not affected by planting method (dug or cored planting holes; see original paper for data). Seedling height was also reported, but is difficult to interpret owing to the high mortality. Methods: In March and November 2004, a total of 890 swamp paperbark seedlings were planted into 35 plots in a brackish/saline marsh. Seedlings had been grown in a nursery for 4–6 months. Plots varied in elevation: they were at different heights relative to the shoreline, or were pairs of mounds and hollows. However, all plots experienced

12. Habitat restoration and creation
435
extreme water levels during the study (some seedlings submerged, some with no standing water). Survival and seedling height were monitored for 5–8 months from planting.
A study in 2007–2008 in a degraded mangrove forest in Cuba (17) reported 100% survival of planted black mangrove Avicennia germinans seedlings after 15 days, and that the average size of surviving seedlings increased over two months. All 125 surveyed seedlings were alive 15 days after planting. Seedlings planted amongst saltwort Batis maritima were 5 cm tall 15 days after planting, 10 cm tall after one month, and 21 cm tall after two months (with 3 branches and 6 leaves/plant). Seedlings planted into bare sediment were only 18 cm tall after two months (with <1 branch and 3 leaves/plant). Methods: In November 2007, five thousand nursery-reared black mangrove seedlings were planted in a degraded mangrove forest (damaged by storms and sediment deposition in 2002–2004). Seedlings were planted 1.5–2.0 m apart and 15–20 cm deep. Some seedlings were planted within patches of saltwort, and some into bare sediment. Seedlings were monitored until January 2008, but survival rates beyond 15 days were not clearly reported.
A replicated study in 2003–2005 in two historically logged mangrove areas in southeast Kenya (18) reported that 29–87% of planted mangrove saplings survived over 13–25 months. Four species were planted. In one area, 35–55% of planted mangrove apple Sonneratia alba saplings survived for 25 months. In another area, the survival rate after 13 months was 29% for large-leafed mangrove Bruguiera gymnorhiza, 71% for spurred mangrove Ceriops tagal and 87% for grey mangrove Avicennia marina. For these species, survival was negatively related to salinity and positively related to height above the shoreline, but was not significantly affected by the number of species planted within plots or whether saplings were at the edge or middle of plots. Methods: Two historically clear-felled areas within Gazi Bay were planted with nursery-raised saplings. In July 2003, mangrove apple was planted in one area flooded by tides every day (697 saplings, mostly 4–5 months old, 0.5–1m apart). In August 2004, the other three species were planted in another area flooded only during spring high tides (3,390 saplings, 6 months old, 0.6 m apart, in 32 single or mixed-species plots). Saplings that died within one month were replaced. Survival was then recorded after 25 months (mangrove apple) or 13 months (other species).
A study in 2006–2008 in the Philippines (19a) reported approximately 50% survival of planted grey mangrove Avicennia marina seedlings after six months, but <10% survival after 18 months. The study suggests mortality was mainly due to frequent tidal flooding, with most surviving plants located at the highest elevations. Other contributing factors were garbage, trampling by fishers, and people digging in the sediment. Methods: In 2006, >400 nursery-reared grey mangrove seedlings were planted at various elevations along the banks of the Iloilo River (further details not reported). Survival was monitored over 18 months.
A study in 2006 in the Philippines (19b) reported that all planted mangrove seedlings died within three months. The study suggests mortality was mainly due to prolonged flooding, evidenced by rotting stems. Seedlings were also damaged by barnacles, algae and sediment deposition. Methods: Approximately 20,000 mangrove seedlings were planted in the lower intertidal to subtidal zone of a coastal site at Dumangas. The seedlings were mostly (90%) nursery-reared grey mangrove Avicennia marina. The other 10% included mangrove apple Sonneratia alba and Rhizophora spp. Survival was monitored over three months.

12. Habitat restoration and creation
436
A study of mangrove planting projects in the Philippines (20a) reported <5% survival of planted mangrove seedlings/propagules, but growth of surviving seedlings. Plantings almost exclusively involved Rhizophora spp. In two sites where survival was quantified, <5% of planted individuals survived (over nine months in one site; timescale not reported for other site). The study suggests that seedlings were killed by mechanical stress, substrate erosion, and oysters growing on their stems. Growth of surviving seedlings was quantified in eight sites. “Young individuals” grew by 3–13 cm over approximately 40 days (equivalent to 30–75 cm/year). Growth rates significantly differed between elevations: lowest in the low intertidal zone, and highest in the upper intertidal zone. Methods: The study reported results from various mangrove planting projects initiated since the 1980s: both afforestation (planting in mudflats, sandflats or seagrass beds) and reforestation (re-planting cleared mangroves, mostly fishponds). Seedlings and/or propagules were generally planted 1 m apart, following national guidelines, but often with 2–5 individuals at each planting spot.
A replicated, paired, site comparison study of six coastal sites in the Philippines (20b) reported that planted mangrove forests typically contained a higher density of trees and greater canopy cover than natural mangrove forests. Statistical significance was not assessed. After “several years”, planted forests contained a greater density of trees than natural forests in 9 of 10 comparisons (for which planted: 27–93 trees/100 m2; natural: 22–42 trees/100 m2). Planted forests had greater canopy cover than natural forests in 5 of 9 comparisons (data reported as a canopy index; other comparisons lower in planted forests). Methods: The study surveyed planted and natural mangrove forests at six sites (1–22 plots/forest type/site; dates not reported). Plantings had taken place since the 1980s (precise dates not reported) and almost exclusively involved Rhizophora spp. seedlings and/or propagules. These were generally planted 1 m apart, following national guidelines, but often with 2–5 individuals at each planting spot. Some plantings involved afforestation (planting in mudflats, sandflats or seagrass beds) and some involved reforestation (re-planting cleared mangroves, mostly fishponds).
A replicated, site comparison study in 2005 in Florida, USA (21) reported that 12 of 17 sites planted with mangroves (along with other interventions) contained mangrove forests after 17–30 years – but that these differed from mature natural forests in overall complexity, tree density and canopy height. Statistical significance was not assessed. After 17–30 years, mangrove forests had developed in 12 of the 17 sites. Mangrove forests had not persisted in four sites and been deliberately removed from one. Nine of the sites that developed forests were surveyed in detail. The created/restored forests had a different overall structure to natural forests (data reported as a complexity index and graphical analysis). Created/restored forests contained 16,925 trees/ha (vs natural: only 6,594 trees/ha) and had a canopy height of only 4.0 m (vs natural: 6.4 m). Both created/restored and natural forests had an average basal area of 31 m2/ha, and contained 1–3 tree species. Methods: In 2005, vegetation was surveyed in 17 sites (three 2 x 2 m plots/site). All of these sites had been planted with red mangrove Rhizophora mangle between 1975 and 1987 (either seedlings or propagules; precise numbers not reported). Some sites had also been planted with smooth cordgrass Spartina alterniflora. All but one site was planted after levelling upland areas. The study does not distinguish between the effects, on unplanted trees, of planting mangroves, planting cordgrass and reprofiling. Comparisons were made with previously published data from seven nearby natural forests.

12. Habitat restoration and creation
437
A replicated study in 2006–2009 of 47 mangrove restoration projects in Sumatra, Indonesia (22) reported 0–99% survival of planted seedlings/propagules after <15 months. Some planted individuals survived in 45 of the 47 projects. Survival rates ranged from 17% to 99% per project. The study suggests that survival was influenced by factors such as elevation, sediment deposition, flash floods, grazing by crabs, smothering by algae, soaking propagules before planting, and prior planting experience of communities (effects not quantified). Methods: Between February 2006 and September 2008, approximately 1.6 million mangrove seedlings and/or propagules were planted across 47 projects (mostly in separate sites). The study does not distinguish between the effects of planting seedlings and propagules. Eight species were planted (mostly Rhizophora spp.) on mudflats, in degraded mangroves, in former aquaculture ponds, and along water channels. Individuals were generally planted 0.3–1.0 m apart, but sometimes with double plantings at a single point. At some time within 15 months of planting (not clearly reported), survival rates were checked for 20% of the planted individuals in each project.
A replicated, before-and-after study in 2006–2008 on estuarine mudflats in southern Spain (23) reported 90% survival of sea purslane Atriplex portulacoides, one year after planting. Methods: Between November 2006 and January 2007, nursery-reared sea purslane was planted around the edge of some polluted, unvegetated, tidal mudflats in the Odiel Estuary (number of plants and sites not reported). The main area of each site was planted with clumps of herbaceous plants. Survival was monitored one year after planting.
A replicated study in 2008 in two coastal sites in the Cayman Islands (24) reported 48–84% survival of planted red mangrove Rhizophora mangle saplings after 10 months, and that the average height of surviving trees increased. After five months, 94% of the planted saplings were still alive in both sites. After 10 months (including hurricane season), survival rates had dropped to 84% in the sheltered site and 48% in the exposed site. The average height of surviving seedlings was similar in both sites: 39 cm when planted, 42 cm after five months, and 51–52 cm after 10 months (statistical significance not assessed). Methods: In early 2008, approximately 400 containers of 2–3 red mangrove saplings were transplanted into shallow water across two coastal sites. The containers were specially designed concrete pots: 25 cm tall, 40–45 cm diameter, 16 kg when empty, holes in the sides to allow water exchange and the bottom to allow root growth. Saplings had been grown in the containers in a nursery for 15 months. Sapling survival and height (tallest sapling in each container) were monitored in January, June and December 2008.
A site comparison study in 2009 on the coast of Peninsular Malaysia (25) reported that only 7% of planted Avicennia alba seedlings survived for four months, but that survivors had grown in height by 2.5 mm/cm. For comparison, seedlings growing naturally in a nearby established mangrove had 92% survival over four months, and survivors had grown in height by 1.5 mm/cm. Methods: In April 2009, Avicennia alba seedlings were planted on a bare intertidal area with clay/loam soils. The 314 seedlings had been grown in coconut-fibre logs in a nursery for six months (5 seedlings/3 m log). Then, the coir logs were placed directly onto the intertidal area. A breakwater had been built to shelter the seedlings from waves, but it had the unintended effect of encouraging sediment deposition around the seedlings. Seedling survival and growth (relative to initial height) were monitored for four months: for the planted seedlings and 80 seedlings growing spontaneously in a nearby mangrove forest.

12. Habitat restoration and creation
438
A study in 2006–2009 in an aquaculture pond undergoing restoration in southern India (26) reported 100% survival of planted mangrove saplings after 45 months. Methods: A total of 2,050 mangrove saplings were planted along embankments in an abandoned fishpond: 1,723 Rhizophora spp. saplings in one lower row, and 327 grey mangrove Avicennia marina saplings in one upper row (precise water levels not clear). Within each row, saplings were 5 m apart. Survival was recorded in November 2009. The mangroves were part of a system to allow sustainable farming of fish and salt marsh vegetation.
A study in 2008–2009 on a mudflat in Peninsular Malaysia (27) reported that only 30% of planted grey mangrove Avicennia marina seedlings survived for seven months, but that the average height of seedlings increased over time. When planted, the seedlings were 41 cm tall on average. After seven months, surviving seedlings were 54 cm tall on average. Statistical significance was not assessed. The study suggests that seedlings were killed by barnacle growth, sediment deposition and disturbance from fishermen. Methods: In July 2008, coconut-fibre “logs” containing a total of 5,780 grey mangrove seedlings were transferred to an intertidal mudflat. The planting site was on an exposed shore, but situated behind a breakwater and next to an existing mangrove forest. Seedling survival and height were monitored until February 2009.
A study in 1999–2005 in a reprofiled shrimp pond in Thailand (28) reported 44–83% survival of planted mangrove seedlings over one year, that the average height of planted seedlings increased, and that additional seedlings colonized naturally. Over one year, survival rates were: 44% for spurred mangrove Ceriops tagal; 70% for loop-root mangrove Rhizophora mucronata; 72% for tall-stilt mangrove Rhizophora apiculata; and 83% for Bruguiera cylindrica. After six years, surviving trees were 190–430 cm tall on average (vs 23–75 cm three months after planting). Also after six years, a 300-m2 section of the pond contained 1,797 unplanted trees of 15 different species (see original paper for data on individual species abundance). Methods: In September 1999, seedlings of four mangrove species were planted in a 6,525-m2 former shrimp pond (500–800 seedlings/species, 1.5 m apart, at elevations matching their natural habitat). Three months previously, the pond had been reprofiled and tidal exchange restored by levelling the banks. The study does not distinguish between the effects, on naturally colonizing vegetation, of planting, reprofiling and restoring tidal exchange. Survival and height of 50–80 seedlings/species were recorded between three months and six years after planting.
A study in 2002–2005 in a degraded coastal swamp in southeast Brazil (29) reported that 0–93% of planted tree/shrub seedlings survived over three years, and found that survivors typically grew. Nine species were planted. For five species, most planted individuals survived over three years. Survival rates ranged from 57% for Myrcia multiflora to 93% for Tabaebuia cassinoides. For the other four species, survival rates were 2% (two species) or 0% (two species). Seedlings grew significantly larger in 54 of 69 comparisons (involving stem diameter, height or canopy cover of the first five species). Seedlings shrunk in seven of the other comparisons. The study found that survival and growth varied according to species, growth metric, initial seedling height (see original paper), addition of organic matter (see Section 13.14) and whether seedlings were planted into mounds or at ground level (see Section 13.7). Methods: In May 2002, a total of 1,230 nursery-grown tree and shrub seedlings were planted into a degraded coastal swamp. There were 90–150 seedlings/species. Seedlings were planted 1.5 m apart, in mounds or at ground level,

12. Habitat restoration and creation
439
and with or without added manure. Invasive trees and grasses were removed from the swamp before planting. Seedling survival was monitored until May 2005. Seedling diameter, height and canopy area were measured in August 2002 and August 2005.
A site comparison study in 2006–2007 of mangrove forests in northwest Mexico (30) reported that a planted forest contained a similar tree community to pristine natural forests after 12 years, but contained fewer and taller trees. Unless specified, statistical significance was not assessed. The planted forest contained three tree species (planted black mangrove Avicennia germinans and two others). Pristine forests contained 2–3 species (black mangrove and 1–2 others). The overall tree density was significantly lower in the planted forest (1.4 trees/m2) than pristine forests (4.5–7.9 trees/m2). For data on the abundance of individual species, see original paper. In the planted forest, trees were 1.3–1.8 m tall on average (vs pristine: only 0.9–1.3 m), had stems 3–7 cm thick on average (vs pristine: 2–9 cm), and had an average basal area of 27 cm2/m2 (vs pristine: 48–68 cm2/m2). Methods: In 2006 or 2007, trees were counted, identified and measured in 10 plots. Two 5-m2 plots were in a replanted forest, where 111 clusters of nursery-reared black mangrove seedlings had been planted, 1 m apart, in December 1994. Eight 1-m2 plots were in pristine mangrove patches in the same lagoon. This study included the area restored in (6).
A replicated, paired, site comparison study in 2011 in three mangrove forests in southern Brazil (31) reported that planted areas typically contained more, thinner, shorter woody stems than natural forests (both mature and regenerating) – but a similar number of tree species. Statistical significance was not assessed. Planted areas contained 4,500–22,037 woody stems/ha, with a basal area of 4–10 m2/ha, an average diameter of 3 cm, and average height of 2–3 m. Stem density and basal area were greater than in mature forests in at least two of three sites (mature density: 512–861 stems/m2; basal area: 4–7 m2/ha). Diameter and height were less than in mature forests in three of three sites (mature diameter: 9–15 cm; height: 6–9 m). The pattern of results was similar for comparisons with naturally regenerating forests. Planted and natural forests all contained 2–3 tree species. However, in two of three sites, planted areas were dominated by white mangrove Laguncularia racemosa (90–99% of stems) whereas natural areas were co-dominated by white mangrove (36–45% of stems) and siriúba Avicennia schaueriana (54–63% of stems). For data on abundance and structure of individual species, see original paper. Methods: In 2011, trees were counted, identified and measured in three areas in each of three sites: one area planted 10–12 years previously (details not reported), one area naturally regenerating for 10 years, and one mature stand. The planted and regenerating areas had, historically, been damaged by sediment excavation or pollution from a landfill site.
A replicated, site comparison study in 2008–2010 in 11 mangrove forests in the Philippines (32) found that overall vegetation structure, tree density, biomass, leaf cover and growth rates in planted forests became more similar to mature natural forests over time. For example, a 6-year-old planted mangrove contained 7,780 trees/ha (vs 18-year-old: 1,358 trees/ha; natural: 1,442–1,499 trees/ha). Above-ground tree biomass was only 116 T/ha in the 18-year-old planted mangrove (vs 50-year-old: 132 T/ha; natural: 148–151 T/ha). Mangrove seedlings were only observed in the 50-year-old planted mangrove (20 seedlings/100 m2) and the natural mangrove (12 seedlings/100 m2). The overall vegetation structure in all ages of planted mangrove remained significantly different from natural mangroves (data reported as a graphical analysis). Methods: Between 2008 and 2010, vegetation was surveyed in

12. Habitat restoration and creation
440
(a) eight monospecific mangrove forests planted with loop-root mangrove Rhizophora mucronata 6–50 years ago, and (b) three natural, mature mangrove forests. All trees were counted and measured in three 3–5 m radius plots/mangrove. Above-ground biomass was estimated from diameter-mass relationships. Leaf cover was estimated from photographs.
A replicated study in 2006–2007 on the coast of southeast Mexico (33) reported 10–60% survival of planted black mangrove Avicennia germinans seedlings over 5–11 months. In one planted area on a sandy ridge and with restored tidal flushing, survival was 60% after 11 months. In the other planted area, survival was 10–30% after five months. The conditions in this area were not clearly reported, but the sediment was probably more clayey and tidal flushing less frequent. Methods: Nursery-reared mangrove seedlings (number not reported) were planted in two coastal areas in March or September/October 2006. Survival was monitored in February 2006.
A study in 2009–2010 on the coast of Peninsular Malaysia (34) reported that no more than 5% of planted mangrove seedlings survived for one year. The study suggests that seedlings were toppled by waves and tidal flows, and were probably planted in water that was too deep. Methods: In early 2009, a mixture of grey mangrove Avicennia marina and tall-stilt mangrove Rhizophora apiculata seedlings (number not reported) were planted behind a constructed breakwater, at the edge of an existing mangrove forest. The seedlings had been raised in a nursery (some in coconut-fibre logs, which were transferred to the field site) and were 20 cm tall when planted. Survival was recorded “within one year” after planting.
A replicated study on a saltflat in western Mexico (35) reported that only 3–50% of planted black mangrove Avicennia germinans seedlings survived over six months, but reported that the average height of seedlings increased over this period. Seedlings were planted alongside excavated tidal channels. After six months, only 3–5% of seedlings survived when planted 1 m away from the channels. However, 40–50% of seedlings survived when planted ≤50 cm from the channels. Surviving seedlings were 7.8–11.0 cm tall on average, compared to 6.5–7.2 cm for all planted seedlings. Methods: In August–September (year not reported), 600 nursery-reared black mangrove seedlings were planted alongside four excavated channels on a bare saltflat. The channels were designed to increase tidal flushing and mitigate hypersaline conditions. Fifty seedlings were planted along the edge of each channel, 50 seedlings were planted 50 cm away and 30 seedlings were planted 100 cm away. Within rows, seedlings were 50–100 cm apart. Seedlings along one channel were shaded with black mesh (see Section 13.16). Seedling survival and height were recorded for approximately six months.
A before-and-after study in 1969–2011 in an estuary in South Africa (36) reported that over 42 years after planting mangrove trees, the area of mangrove vegetation increased. Before planting, there were no mangroves present in the estuary. In the year after planting (1970), mangrove forests could not be identified on aerial photographs. Forty-two years after planting (2011), mangrove forests had established and covered 1.6 ha. Although mangroves encroached into and replaced existing salt marshes, the area of salt marsh in the estuary actually increased slightly over time (1970: 2.9 ha; 2011: 3.1 ha). Salt marshes developed on newly deposited sediment. Methods: In 1969, twenty-five grey mangrove Avicennia marina trees (age unclear) were planted into salt marsh in the Nahoon Estuary. This site is 60 km south of naturally occurring mangrove forests in South Africa. “A few” mangrove trees of other species were planted “a few” years later. The area of mangrove forest and salt

12. Habitat restoration and creation
441
marsh in the estuary was determined from aerial photographs (taken 1970–2004), satellite images (taken 2004–2010) and field surveys (2011).
A replicated study in 2012–2014 on the coast of Manus Island, Papua New Guinea (37) reported that planted mangrove trees survived in 19 of 33 cases (species x site combinations). In these cases, the number of trees present was 4–102% of the number known to be planted (additional undocumented planting by local communities explains values >100%). Some planted propagules or saplings survived in seven of nine sites. All five planted species survived in at least one site. Methods: Between June 2012 and April 2014, more than 8,300 seedlings and propagules of five mangrove species were planted in nine sites around Manus Island (1–9 sites/species). The study does not distinguish between the effects of planting seedlings and propagules. The number of seedlings or propagules introduced was recorded for about half of the area planted (where local communities were guided by NGO staff) but not for the other half (where local communities planted independently). Six of the nine sites had recently contained mangrove forests, but the other three had never been forested. Seedlings originating from planting efforts were counted in April 2014.
A 2016 systematic review of mangrove restoration studies around the world (38) reported a 51% average survival rate of planted mangrove trees and sown mangrove propagules. Survival ranged from 0% (17 of 106 cases) to ≥95% (15 of 106 cases). The average survival rate was 56% in developed countries and 45% in developing countries. Methods: The review was based on 106 cases (e.g. different species, environments or intervention methods) from 28 publications and at least 17 countries, 104 of which involved planting or sowing mangroves (see Appendix to original paper). Literature searches were carried out in 2014. Planting and sowing were sometimes into environments thought to be suitable (but sometimes into hostile environments) and were sometimes preceded by site preparation (but sometimes not). Study duration ranged from one month to 21 years. Survival was sometimes estimated from other metrics, such as cover. The review does not separate results for survival of planted seedlings vs sown propagules. The review includes studies (1), (6), (27), (28) and (34) summarized above.
A paired, site comparison study in 2014–2015 of mangrove forests in the Philippines (39) reported that replanted mangroves had a smaller basal area with shorter, thinner trees than mature natural mangroves, but had a similar or greater stem density and similar canopy closure. Statistical significance was not assessed. After 7–9 years, planted mangroves had a basal area of 28–33 m2/ha (vs natural: 11–17 m2/ha). On average, trees in planted mangroves were only 3.8–4.6 m tall (vs natural: 6.2–6.7 m) and had a stem diameter of only 2.7–6.9 cm (vs natural: 5.8–18.0 cm). In one site, stem density was similar in planted and natural mangroves (planted: 1,916; natural: 2,152 stems/ha), but in the other site, stem density was greater in the planted mangrove (planted: 11,839; natural: 6,496 stems/ha). Canopy closure was 84–87% in planted mangroves (vs natural: 85–88%). Methods: In 2014–2015, vegetation was surveyed in a replanted and natural mangrove forest at each of two sites on Panay Island (eight 7-m radius plots/forest). One replanted forest (Bakhawan) had been planted with tall-stilt mangrove Rhizophora apiculata in 2006, then colonized by other species. The other replanted forest (Ermita) had been planted with mixed mangrove species in 2007, although only white mangrove Sonneratia alba survived.
A site comparison study in 2012 of two mangrove forests in southern Vietnam (40) reported that a planted forest contained more tree species than a naturally

12. Habitat restoration and creation
442
recolonized forest, but found that both forests had similar tree density, diameter, basal area and biomass. After 14–34 years, 15 true mangrove tree species were recorded in the planted forest (vs 12 in the recolonized forest; statistical significance of difference not assessed). The most common species in both forests was tall-stilt mangrove Rhizophora apiculata (planted: 80%; recolonized: 73% of all trees). There was no significant difference between the forests in tree density (planted: 1,963; recolonized: 2,548 trees/ha), diameter (planted: 11; recolonized: 10 cm), basal area (planted: 22; recolonized: 23 m2/ha) or above-ground biomass (planted: 131; recolonized: 147 Mg/ha). Methods: In June 2012, forest structure was surveyed along 15 transects in recovering mangroves (degraded in the 1960s–1970s by wartime herbicide spraying and deforestation). Six transects were in a forest replanted in 1978–1998 (35 tree species, mostly tall-stilt mangrove) then thinned at five year intervals. Nine transects were in a forest where trees had grown without any human intervention. Each transect contained six 150-m2 plots and ran perpendicular to creeks/coastlines. Above-ground biomass was estimated using diameter data. Both live and dead trees were surveyed.
A replicated, before-and-after study in 2012–2013 in a brackish/saline estuarine site with mudflats and existing mangroves in southeast China (41) reported 0–80% survival of planted seedlings over 12 months, and that surviving seedlings grew. The lowest survival rate (0%) was exhibited by three of four species, including non-native mangrove apple Sonneratia apetala, in a strongly shaded, 8-year-old mangrove plantation. The highest survival rate (74%) was for river mangrove Aegiceras corniculatum in a lightly shaded, 2-year-old mangrove plantation. The study reported increases in the biomass, height and basal area of surviving seedlings (statistical significance not assessed). Growth rates depended on the combination of species and the habitat in which it was planted (see original paper). Methods: In June 2012, seedlings of four mangrove tree species were planted into four habitats: a tidal mudflat, and 2-, 4- and 8-year-old mangrove plantations. Twelve sets of 50 seedlings were sown for each species (3 sets/habitat). Seedlings were monitored every three months for a year.
A study in 2005–2008 on a mudflat alongside a brackish creek in southern Nigeria (42a) reported that 72% of planted red mangrove Rhizophora racemosa seedlings survived for three years, and that the average size of survivors increased over time. After three years, surviving individuals were 3.1 m tall and had a stem diameter of 2.8 cm (compared to 0.6 m tall and 1.4 cm diameter one month after planting). These results are not based on assessments of statistical significance. Methods: In November 2005, four hundred red mangrove seedlings were planted alongside Bodo Creek, in a former mangrove swamp that had been killed by an oil spill in 2003. The nursery-reared seedlings were planted 1 m apart. “Some” wilting seedlings were replaced one month after initial planting, and were not included in the analysis. Before planting, dead stumps were removed from the study site (but left at the margins to prevent erosion) and the sediment was tilled. For a year from July 2005, the site was also fertilized (weekly or bi-weekly; 1.2 kg NPK fertilizer/0.17 ha/application). Surviving seedlings were monitored one month and approximately three years after planting.
A study in 2010–2013 alongside a brackish creek in southern Nigeria (42b) reported that only 12% of planted red mangrove Rhizophora racemosa seedlings survived for three years, but that the average size of survivors increased over time. After three years, surviving individuals were 1.3 m tall and had a stem diameter of 2.1

12. Habitat restoration and creation
443
cm (compared to 0.5 m tall and 1.3 cm diameter immediately after planting). These results are not based on assessments of statistical significance. Methods: In April 2010, four hundred red mangrove seedlings were planted alongside Kono Creek, in an area cleared of invasive nipa palm Nypa fruticans (clear cut, and rhizomes removed). The site was weakly brackish (<4 ppt). The nursery-reared seedlings were planted early in the morning, 1 m apart. Seedlings were measured immediately after planting and three years later.
A before-and-after study in 2011–2016 of an intertidal site in Florida, USA (43) reported 62% survival of planted red mangrove Rhizophora mangle seedlings after two years, and increases in red mangrove abundance and height over five years. Before planting, the upper intertidal zone was sparsely vegetated (<1 mangrove stem/m2; 3% cover). Five years after planting red mangroves into this zone, their density had increased to 3.5 stems/m2 and their cover had increased to 81%. Most of this vegetation had been planted: limited natural recruitment (0.2 seedlings/m2) was only observed from the fourth year of the study. The average height of surviving seedlings increased, from 36 cm when planted to 92 cm after five years (statistical significance not assessed). Methods: The study aimed to stabilize a 200 m stretch of shoreline, on the edge of an ancient shell waste dump. In April/May 2011, nursery-reared red mangrove seedlings were planted in the high intertidal zone (450 seedlings; 2 seedlings/m). Smooth cordgrass Spartina alterniflora was planted in the mid-intertidal zone and oyster-shell mats were placed in the lower intertidal zone. The study does not distinguish between the effects of these interventions on non-planted mangroves. Mangrove vegetation in the upper intertidal zone was surveyed before intervention (presumably April 2011) and for five years after (2011–2016).
A replicated study in 2012–2014 of 23 coastal sites in Sri Lanka (44) reported 0–78% survival of planted mangrove seedlings and propagules after ≥5 years, and that only 18–20% the area planted with mangroves was forested after 8–10 years. In 9 of the 23 sites, no mangrove trees were alive five or more years after planting. In 7 of the 14 sites with some surviving trees, survival rates were <10%. Only three sites supported >50% survival. Average survival rates were higher in sites where technical guidance was used (46%) than where it was not used (0%), and in sites with post-planting care of seedlings (13%) than without (0%). The study suggests that mangroves were planted into unsuitable environments in many sites. Finally, the study reports that of 1,000–1,200 ha of mangrove forest planted in these sites since 2004, only 200–220 ha was present 8–10 years later. Methods: Between 2012 and 2014, the number of surviving, healthy mangrove trees was counted or estimated in 23 coastal sites around Sri Lanka. In eight sites, the tidal influence was “negligible”. Mangrove propagules and seedlings (97% of which were Rhizophora spp.) were planted between 1996 and 2009, with multiple planting attempts in all sites. In 10 sites, mangroves were cared for after planting. The study does not distinguish between the effects of planting seedlings and propagules.
(1) Teas H.J. (1977) Ecology and restoration of mangrove shorelines in Florida. Environmental Conservation, 4, 51–58.
(2) Bóhorquez C.A. & Prada M.C. (1988) Transplante de plántulas de Rhizophora mangle (Rhizophoraceae) en el Parque Nacional Corales del Rosario, Colombia (Transplantation of Rhizophora mangle (Rhizophoraceae) seedlings in the Corales del Rosario National Park, Colombia). Revista de Biología Tropical, 36, 555–557.
(3) Das P., Basak U.C. & Das A.B. (1997) Restoration of the mangrove vegetation in the Mahanadi Delta, Orissa, India. Mangroves and Salt Marshes, 1, 155–161.
(4) Elster C. (2000) Reasons for reforestation success and failure with three mangrove species in Colombia. Forest Ecology and Management, 131, 201–214.

12. Habitat restoration and creation
444
(5) Abo El-Nil M.M. (2001) Growth and establishment of mangrove (Avicennia marina) on the coastlines of Kuwait. Wetlands Ecology and Management, 9, 421–428.
(6) Toledo G., Rojas A. & Bashan Y. (2001) Monitoring of black mangrove restoration with nursery-reared seedlings on an arid coastal lagoon. Hydrobiologia, 444, 101–109.
(7) Reyes Chargoy M.A. & Tovilla Hernández C. (2002) Restauración de áreas alteradas de manglar con Rhizophora mangle en la Costa de Chiapas (Restoration of altered mangrove areas with Rhizophora mangle on the Chiapas coast). Madera y Bosques, 8, 103–114.
(8) Bosire J.O., Dahdouh-Guebas F., Kairo J.G. & Koedam N. (2003) Colonization of non-planted mangrove species into restored mangrove stands in Gazi Bay, Kenya. Aquatic Botany, 76, 267–279.
(9) Egerova J., Proffitt C.E. & Travis S.E. (2003) Facilitation of survival and growth of Baccharis halimifolia L. by Spartina alterniflora Loisel. in a created Louisiana salt marsh. Wetlands, 23, 250–256.
(10) Selvam V., Ravichandran K.K., Gnanappazham L. & Navamuniyammal M. (2003) Assessment of community-based restoration of Pichavaram mangrove wetland using remote sensing data. Current Science, 85, 794–798.
(11) Bhat N.R., Suleiman M.K. & Shahid S.A. (2004) Mangrove, Avicennia marina, establishment and growth under the arid climate of Kuwait. Arid Land Research and Management, 18, 127–139.
(12) Tamaei S. (2005) ヒルギダマシ植林による砂漠沿岸緑化に関する研究: サブカに人工水路を掘
り込むことによるヒルギダマシ植林とそこに形成された生物群集 (Study of gray mangrove (Avicennia marina) afforestation for greening of desert coasts: gray mangrove afforestation on banks of artificial channel across a sabkha and the established biotic community). Japanese Journal of Ecology, 55, 1–9.
(13) Crona B.I., Holmgren S. & Rönnbäck P. (2006) Re-establishment of epibiotic communities in reforested mangroves of Gazi Bay, Kenya. Wetlands Ecology and Management, 14, 527–538.
(14) Milbrandt E.C. & Tinsley M.N. (2006) The role of saltwort (Batis maritima L.) in regeneration of degraded mangrove forests. Hydrobiologia, 568, 369–377.
(15) Wang J., Seliskar D.M., Gallagher J.L. & League M.T. (2006) Blocking Phragmites australis reinvasion of restored marshes using plants selected from wild populations and tissue culture. Wetlands Ecology and Management, 14, 539–547.
(16) Raulings E.J., Boon P.I., Bailey P.C., Roache M.C., Morris K. & Robinson R. (2007) Rehabilitation of swamp paperbark (Melaleuca ericifolia) wetlands in south-eastern Australia: effects of hydrology, microtopography, plant age and planting technique on the success of community-based revegetation trials. Wetlands Ecology and Management, 15, 175–188.
(17) Baigorría Montero D., Rodríguez Crespo G., Domínguez Junco D. & Milián Cabrera I. (2008) Nueva experiencia en la restauración de manglares, Playa las Canas, La Coloma (New experience in mangrove restoration, Playa las Canas, La Coloma). Revista Forestal Baracoa, 27, 3–12.
(18) Kirui B.Y.K., Huxham M., Kairo J. & Skov M. (2008) Influence of species richness and environmental context on early survival of replanted mangroves at Gazi Bay, Kenya. Hydrobiologia, 603, 171–181.
(19) Primavera J.H. & Esteban J.M.A. (2008) A review of mangrove rehabilitation in the Philippines: successes, failures and future prospects. Wetlands Ecology and Management, 16, 345–358.
(20) Samson M.S. & Rollon R.N. (2008) Growth performance of planted mangroves in the Philippines: revisiting forest management strategies. Ambio, 37, 234–240.
(21) Shafer D.J. & Roberts T.H. (2008) Long-term development of tidal mitigation wetlands in Florida. Wetlands Ecology and Management, 16, 23–31.
(22) Wibisono I.T.C. & Sualia I. (2008) An assessment of lessons learnt from the “Green Coast Project” in Nanggroe Aceh Darussalam (NAD) Province and Nias Island, Indonesia (Period 2005–2008). Wetlands International, Bogor.
(23) Castillo J.M. & Figueroa E. (2009) Restoring salt marshes using small cordgrass, Spartina maritima. Restoration Ecology, 17, 324–326.
(24) Krumholz J. & Jadot C. (2009) Demonstration of a new technology for restoration of red mangrove (Rhizophora mangle) in high-energy environments. Marine Technology Society Journal, 43, 64–72.
(25) Affandi N.A.M., Kamali B., Rozianah M.Z., Mohd Tamin N. & Hashim R. (2010) Early growth and survival of Avicennia alba seedlings under excessive sedimentation. Scientific Research and Essays, 5, 2801–2805.
(26) Anon (2010) Sustainable Coastal Livelihood: Integrated Mangrove Fishery Farming System (IMFFS). Final Report (October 2008 to December 2009).
(27) Hashim R., Kamali B., Tamin N.M. & Zakaria R. (2010) An integrated approach to coastal rehabilitation: mangrove restoration in Sungai Haji Dorani, Malaysia. Estuarine, Coastal and Shelf Science, 86, 118–124.

12. Habitat restoration and creation
445
(28) Matsui N., Suekuni J., Nogami M., Havanond S. & Salikul P. (2010) Mangrove rehabilitation dynamics and soil organic carbon changes as a result of full hydraulic restoration and re-grading of a previously intensively managed shrimp pond. Wetlands Ecology and Management, 18, 233–242.
(29) Zamith L.R. & Scarano F.R. (2010) Restoration of a coastal swamp forest in southeastern Brazil. Wetlands Ecology and Management, 18, 435–448.
(30) Vovides A.G., Bashan Y., López-Portillo J.A. & Guevara R. (2011) Nitrogen fixation in preserved, reforested, naturally regenerated and impaired mangroves as an indicator of functional restoration in mangroves in an arid region of Mexico. Restoration Ecology, 19, 236–244.
(31) Rovai A.S., Soriano-Sierra E.J., Pagliosa P.R., Cintrón G., Schaeffer-Novelli Y., Menghini R.P. Coelho-Jr C., Horta P.A., Lewis R.R. III, Simonassi J.C., Alves J.A.A., Boscatto F. & Dutra S.J. (2012) Secondary succession impairment in restored mangroves. Wetlands Ecology and Management, 20, 447–459.
(32) Salmo S.G. III, Lovelock C. & Duke N.C. (2013) Vegetation and soil characteristics as indicators of restoration trajectories in restored mangroves. Hydrobiologia, 720, 1–18.
(33) Tsuruda K. (2013) Silviculture manual for mangrove restoration in the Yucatan Peninsula, Mexico. Pages 23–34 in: H.T. Chan, M. Cohen & S. Baba (eds.) Mangrove Ecosystems Occasional Papers No. 4. International Society for Mangrove Ecosystems.
(34) Motamedi S., Hashim R., Zakaria R., Song K.-I. & Sofawi B. (2014) Long-term assessment of an innovative mangrove rehabilitation project: case study on Carey Island, Malaysia. The Scientific World Journal, 2014, 953830.
(35) Flores-Verdugo F., Zebadua-Penagos F. & Flores-de-Santiago F. (2015) Assessing the influence of artificially constructed channels in the growth of afforested black mangrove (Avicennia germinans) within an arid coastal region. Journal of Environmental Management, 160, 113–120.
(36) Hoppe-Speer S.C.L., Adams J.B. & Rajkaran A. (2015) Mangrove expansion and population structure at a planted site, East London, South Africa. Southern Forests, 77, 131–139.
(37) Arihafa A. (2016) Factors influencing community mangrove planting success on Manus Island, Papua New Guinea. Conservation Evidence, 13, 42–46.
(38) Bayraktarov E., Saunders M.I., Abdullah S., Mills M., Beher J., Possingham H.P., Mumby P.J. & Lovelock C.E. (2016) The cost and feasibility of marine coastal restoration. Ecological Applications, 26, 1055–1074.
(39) Duncan C., Primavera J.H., Pettorelli N., Thompson J.R., Loma R.J.A. & Koldewey H.J. (2016) Rehabilitating mangrove ecosystem services: a case study on the relative benefits of abandoned pond reversion from Panay Island, Philippines. Marine Pollution Bulletin, 109, 772–782.
(40) Nam V.N., Sasmito S.D., Murdiyarso D., Purbopuspito J. & MacKenzie R.A. (2016) Carbon stocks in artificially and naturally regenerated mangrove ecosystems in the Mekong Delta. Wetlands Ecology and Management, 24, 231–244.
(41) Peng Y., Diao J., Zheng M., Guan D., Zhang R., Chen G. & Lee S.Y. (2016) Early growth adaptability of four mangrove species under the canopy of an introduced mangrove plantation: implications for restoration. Forest Ecology and Management, 373, 179–188.
(42) Zabbey N. & Tanee F.B.G. (2016) Assessment of asymmetric mangrove restoration trials in Ogoniland, Niger Delta, Nigeria: lessons for future intervention. Ecological Restoration, 34, 245–257.
(43) Donnelly M., Shaffer M., Connor S., Sacks P. & Walters L. (2017) Using mangroves to stabilize coastal historic sites: deployment success versus natural recruitment. Hydrobiologia, 803, 389–401.
(44) Kodikara K.A.S., Mukherjee N., Jayatissa L.P., Dahdouh-Guebas F. & Koedam N. (2017) Have mangrove restoration projects worked? An in-depth study in Sri Lanka. Restoration Ecology, 25, 705–716.
12.23 Introduce vegetation fragments
Background
This intervention involves introducing fragments of emergent plants to restore/create marshes or swamps. This includes unrooted cuttings, roots, tubers/bulbs/corms (underground storage organs), rhizomes (underground horizontal stems) or stolons/ runners (above-ground horizontal stems). Vegetation fragments may be planted directly into the soil, or spread on the soil surface. Fragments may be obtained from plants raised in greenhouses/laboratories, or collected from natural sites (with potential damage to donor site; Laegdsgaard 2002).

12. Habitat restoration and creation
446
Introduction of target vegetation might be useful in severely degraded or bare sites – which may lack remnant plants or seed banks to kick start revegetation with desirable species, and may be at risk of being taken over by undesirable species (Brown & Bedford 1997). It might also be useful in isolated wetlands, far from sources of marsh or swamp plant propagules. However, note that up-front costs can be high.
The effects of planting may be highly dependent on the environmental conditions in each study. Questions you might ask when interpreting the evidence include: Is the study site degraded? Where and when were fragments introduced? Was there any intervention to improve conditions before planting? What were the environmental conditions over the duration of the study?
The scope of this intervention does not include planting nurse plants; planting submerged or floating plants; planting to restore bogs, fens, fen meadows or peat swamp forests (see Taylor et al. 2018); or planting facultative wetland plants in upland sites. In contrast, the scope does include planting non-native species to conserve marshes or swamps – whilst acknowledging that this is often considered ethically unacceptable due to the risk of invasion (e.g. Ren et al. 2009).
Related interventions: Directly plant whole plants (12.22); Introduce seeds or propagules (12.24); Transplant or replace blocks of vegetation (12.25); Transplant or replace wetland soil (12.26); Restore/create marshes or swamps using multiple interventions, often including planting (12.2); interventions to complement planting (Chapter 13).
Brown S.C. & Bedford B.L. (1997) Restoration of wetland vegetation with transplanted wetland soil: an experimental study. Wetlands, 17, 424–437.
Laegdsgaard P. (2002) Recovery of small denuded patches of the dominant NSW coastal saltmarsh species (Sporobolus virginicus and Sarcocornia quinqueflora) and implications for restoration using donor sites. Ecological Management & Restoration, 3, 202–206.
Ren H., Lu H., Shen W., Huang C., Guo Q., Li Z. & Jian S. (2009) Sonneratia apetala Buch.Ham in the mangrove ecosystems of China: an invasive species or restoration species? Ecological Engineering, 35, 1243–1248.
Taylor N.G., Grillas P. & Sutherland W.J. (2018) Peatland Conservation: Global Evidence for the Effects of Interventions to Conserve Peatland Vegetation. Synopses of Conservation Evidence Series. University of Cambridge, Cambridge.
12.23.1 Introduce fragments of non-woody plants: freshwater wetlands
Five studies evaluated the effects, on vegetation, of introducing fragments of emergent, non-woody plants to freshwater wetlands. Three studies were in the USA1,2,4. Two studies were in one marsh in Australia3a,3b, but used different experimental set-ups.
VEGETATION COMMUNITY
VEGETATION ABUNDANCE
Overall abundance (2 studies): Two replicated, randomized, paired, controlled, before-and-after studies in a floodplain marsh in Australia3a,3b found that plots planted with wick grass Hymenachne acutigluma had similar overall vegetation cover to unplanted plots after one year. One of the studies3b continued for longer, and found that planted plots had greater overall vegetation cover than unplanted plots after three years.
Herb abundance (1 study): One replicated, randomized, paired, controlled, before-and-after study in a floodplain marsh in Australia3a found that plots planted with wick grass Hymenachne acutigluma had similar overall sedge/grass cover to unplanted plots after one year.

12. Habitat restoration and creation
447
Individual species abundance (4 studies): Four studies2,3a,3b,4 quantified the effect of this intervention on the abundance of individual plant species. For example, of two replicated, randomized, paired, controlled, before-and-after studies in a floodplain marsh in Australia, one3b found that wick grass Hymenachne acutigluma was more frequent and had greater cover, after 1–3 years, in plots where its runners had been planted than where they had not been planted. The other study3a reported that wick grass cover was present, with approximately 1% cover, in 5 of 10 plots where its runners had been planted. This study monitored vegetation one year after planting.
VEGETATION STRUCTURE
OTHER
Germination/emergence (1 study): One replicated, randomized, paired, controlled study in a floodplain marsh in Australia3b found that planting wick grass Hymenachne acutigluma had no significant effect on the germination rate of invasive mimosa Mimosa pigra over three years.
Survival (5 studies): Two replicated studies planted sedge Carex spp. fragments into freshwater wetlands in the USA. One study1 reported 38–79% survival of planted tubers over one growing season, whilst the other study2 reported 0–73% survival of planted rhizomes after 1–9 months. One replicated study in a tidal freshwater marsh in the USA4 reported that 6–31% of planted California bulrush Schoenoplectus californicus rhizomes had produced shoots after three months. For two other species, all planted rhizomes died within three months. Two replicated, randomized, paired, controlled, before-and-after studies in a floodplain marsh in Australia3a,3b reported absence of planted wick grass Hymenachne acutigluma from 17–50% of plots after one year.
A replicated study in 1991–1992 in an excavated freshwater wetland in Pennsylvania, USA (1) reported that 38–79% of planted lurid sedge Carex lurida tubers survived over one growing season. Survival was 79% in plots with added leaf litter, but only 38% in plots without added leaf litter (see Section 13.14). Methods: In October 1991, lurid sedge tubers (number not reported) were transplanted from one wetland into a nearby recently excavated wetland (formerly cropland). The tubers were planted 10 cm deep into eight 6 x 6 m plots, then watered. Leaf litter was mixed into the surface of four plots before planting. Survival was last recorded in August 1992.
A replicated study in 1994–1996 in three experimental freshwater wetlands in Minnesota, USA (2) reported 0–73% survival of planted sedge Carex spp. rhizomes over 1–9 months, and that the abundance of one species increased over two growing seasons. Statistical significance was not assessed. Overall survival rates were 27% for lake sedge Carex lacustris and 4% for tussock sedge Carex stricta. However, for each species, survival varied with planting season, water regime and elevation. For example, 73% of lake sedge rhizomes were alive in June after planting in spring under a rising water regime. This dropped to 38% for spring-planted rhizomes under a falling water regime, and <2% for autumn-planted rhizomes under any water regime. The study also monitored the abundance of lake sedge in plots planted with that species. After one growing season, there were 14 shoots/m2 and 80 g/m2 above-ground biomass. After two growing seasons, there were 36–39 shoots/m2 and 236–497 g/m2 above-ground biomass (averaged across implementation options). Methods: Field-collected sedge rhizomes were trimmed (to 10 cm length; roots removed) and planted (2–4 cm deep) into three adjacent wetlands. There were 56 rhizomes for each combination of species, season (autumn 1994 or spring 1995), water regime (stable, low over winter/rising through growing season, high over winter/falling through growing season) and elevation (six levels). Survival (presence

12. Habitat restoration and creation
448
of living shoots) was monitored in June 1995. Shoots were counted in October 1995 and 1996. Biomass was cut, dried and weighed in August 1995 and 1996.
A replicated, randomized, paired, controlled, before-and-after study in 1999–2000 in a floodplain marsh in the Northern Territory, Australia (3a) reported that 50% of plots planted with wick grass Hymenachne acutigluma runners contained wick grass after one year, but found that planting had no significant effect on vegetation cover. After one year, wick grass was present in 5 of 10 planted plots (at approximately 1% cover). Presence in unplanted plots was not clearly reported. Planted and unplanted plots had statistically similar cover of vegetation overall (approximately 90%), sedges and grasses overall (approximately 12%) and invasive mimosa Mimosa pigra (approximately 10%). Before planting, plots destined for each treatment had statistically similar cover of vegetation (<1%), dead mimosa stumps (15%) and bare mud (85%). Methods: In November 1999 (at the end of the dry season), fifteen 5 x 5 m plots were established (in five sets of three) on a degraded floodplain marsh. Mimosa had recently been cleared from the marsh using herbicide, crushing and burning. Then, 10 plots (two random plots/set) were planted with locally-collected wick grass runners (36 or 121 runners/plot). The other five plots (one random plot/set) were not planted. Vegetation was surveyed immediately before planting and approximately one year after (October 2000). This study used the same marsh as (3b), but a different experimental set-up.
A replicated, randomized, paired, controlled, before-and-after study in 2000–2003 in a floodplain marsh in the Northern Territory, Australia (3b) found that plots planted with wick grass Hymenachne acutigluma runners contained more wick grass than unplanted plots over three years and had greater vegetation cover after three years, but supported similar mimosa germination rates. Immediately before planting, these plots had no vegetation cover. After one year, wick grass was more frequent and had greater cover in planted plots (present in 10 of 12 plots at 6% cover) than unplanted plots (present in 2 of 12 plots at <1% cover). Overall vegetation cover was statistically similar in planted plots (60%) and unplanted plots (66%). After three years, planted plots still had greater wick grass cover (24%) than unplanted plots (<2%) and now had greater overall vegetation cover (68%) than unplanted plots (50%). Finally, germination rates of invasive mimosa Mimosa pigra did not significantly differ between planted and unplanted plots in any year (see original paper). Methods: In July–September 2000 (at the end of the wet season), twelve pairs of 7.5 x 7.5 m plots were established on a degraded floodplain marsh. Mimosa had recently been cleared from the marsh using herbicide, crushing and burning. Then, one plot in each pair was planted with 16 locally-collected wick grass runners. The other plots were not planted. Vegetation was surveyed immediately before planting and in the following three dry seasons (July–October 2001–2003). This study used the same marsh as (3a), but a different experimental set-up.
A replicated study in 2010–2012 in a tidal freshwater marsh in California, USA (4) reported that all planted sedge and reed rhizomes died for two of three species, but that they survived and spread for the other species. Three months after planting, all rhizomes of hardstem bulrush Schoenoplectus acutus and broadleaf cattail Typha latifolia had died (i.e. none had produced shoots). In contrast, California bulrush Schoenoplectus californicus rhizomes were alive in all four areas where they were planted, with 6–31% of individual rhizomes having produced shoots. After 24 months, California bulrush was still present in all four areas and had spread to cover 4–23 m2/site. Methods: In June 2010, one hundred and ninety two rhizomes were planted

12. Habitat restoration and creation
449
into four areas within the marsh (16 rhizomes/species/area). Survival was quantified in September 2010. Cover was measured until June 2012. The study areas were flooded for 82–99% of each summer.
(1) Stauffer A.L. & Brooks R.P. (1997) Plant and soil responses to salvaged marsh surface and organic matter amendments at a created wetland in central Pennsylvania. Wetlands, 17, 90–105.
(2) Yetka L.A. & Galatowitsch S.M. (1999) Factors affecting revegetation of Carex lacustris and Carex stricta from rhizomes. Restoration Ecology, 7, 162–171.
(3) Paynter Q. (2004) Revegetation of a wetland following control of the invasive woody weed, Mimosa pigra, in the Northern Territory, Australia. Environmental Management and Restoration, 5, 191–198.
(4) Sloey T.M., Willis J.M. & Hester M.W. (2015) Hydrologic and edaphic constraints on Schoenoplectus acutus, Schoenoplectus californicus, and Typha latifolia in tidal marsh restoration. Restoration Ecology, 23, 430–438.
12.23.2 Introduce fragments of non-woody plants: brackish/saline
wetlands
Three studies evaluated the effects, on vegetation, of introducing fragments of emergent, non-woody plants to brackish/saline wetlands. Two studies were in one bog in Canada1a,1b. One study was in China2.
VEGETATION COMMUNITY
VEGETATION ABUNDANCE
Overall abundance (2 studies): Two replicated, paired, controlled, before-and-after studies in salt-contaminated bogs in Canada1a,1b found that plots planted with rhizomes1a or sown with fragments1b of salt marsh herbs had similar overall vegetation biomass, after one year, to plots that had not been planted or sown.
Herb abundance (1 study): One replicated, paired, controlled, before-and-after studies in salt-contaminated bogs in Canada1b found that plots sown with fragments of salt marsh herbs had greater overall cover of the introduced species, after one year, to unsown plots. However, biomass of the introduced species did not significantly differ between sown and unsown plots.
Individual species abundance (2 studies): Two replicated studies (one also before-and-after) in brackish/saline wetlands in Canada1a and China2 simply quantified the abundance of herb species, over one year or growing season after planting herb fragments.
VEGETATION STRUCTURE
OTHER
Germination/emergence (1 study): One replicated study on a tidal flat in China2 reported that at least 25% of bulrush Scirpus mariqueter corms (bulb-like organs) produced shoots within the first growing season after planting.
A replicated, paired, controlled, before-and-after study in 2011–2012 in two salt-contaminated bogs in New Brunswick, Canada (1a) found that plots planted with rhizomes of salt marsh herbs contained a similar overall vegetation biomass to unplanted plots. Plots were initially bare peat. After one year, total above-ground vegetation biomass did not significantly differ between plots planted with chaffy sedge Carex paleacea (150 g/m2), plots planted with prairie cordgrass Spartina pectinata (66 g/m2) and unplanted plots (122 g/m2). In the plots where it was planted, chaffy sedge biomass was 120 g/m2 and it had 9–17% cover. In the plots where it was planted, prairie cordgrass biomass was 24 g/m2, and it had 2–3% cover.

12. Habitat restoration and creation
450
Methods: In June 2011, forty-eight 9-m2 plots were established across the two bogs, in four blocks of twelve. Plugs of rhizomes and soil (5 cm diameter) from an adjacent salt marsh were added to 32 of the plots (eight plots/block; four with sedge rhizomes and four with cordgrass rhizomes). Phosphorous fertilizer and lime were each applied to one plot per treatment. In July 2012, vegetation cover was recorded in the central 4 m2 of each plot. Vegetation was cut from one 250-cm2 quadrat/plot, then dried and weighed. This study shared part of the experimental set-up used in (1b).
A replicated, paired, controlled, before-and-after study in 2011–2012 in two salt-contaminated bogs in New Brunswick, Canada (1b) found that plots sown with salt marsh vegetation fragments developed greater cover of introduced herb species than unsown plots, but similar biomass of these species and vegetation overall. Before sowing, plots were bare peat. After one year, sown plots had greater cover of introduced herb species (i.e. the 15 species present at the donor site; 1–4%) than unsown plots (<1%). However, there was no significant difference between treatments in biomass of introduced species (sown: 12–14 g/m2; not sown: 0 g/m2) or vegetation overall (sown: 126–155 g/m2; not sown: 122 g/m2). Methods: In June 2011, forty-eight 9-m2 plots were established across the two bogs, in four blocks of twelve. Vegetation fragments from an adjacent salt marsh were added to 32 of the plots (eight plots/block; four in July, four in August). Phosphorous fertilizer and lime were each applied to half of the plots. In July 2012, vegetation cover was recorded in the central 4 m2 of each plot. Vegetation was cut from one 250-cm2 quadrat/plot, then dried and weighed. This study shared part of the experimental set-up used in (1a).
A replicated study in 2014 on a recently deposited tidal flat in eastern China (2) reported that planted bulrush Scirpus mariqueter corms (swollen underground stems, similar to bulbs) successfully emerged to produce above-ground parts. Over the first growing season after planting, the emergence rate of planted corms was at least 25–42% (depending on planting density, and based on the maximum number of seedlings observed at any one time). At the end of the growing season, planted areas contained 73–216 bulrush shoots/m2. The final shoot density was significantly greater where more corms had been planted. Methods: In March–April 2014, field-collected bulrush corms were planted into a recent accumulation of intertidal sediment in the Yangtze estuary. Three 400-m2 plots were each planted with a different density of corms: 15, 30 or 60 corms/m2. Corms were planted 5 cm deep. Bulrush seedlings and shoots were counted twice each month until October, in ten 4-m2 quadrats/plot.
(1) Emond C., Lapointe L., Hugron S. & Rochefort L. (2016) Reintroduction of salt marsh vegetation and phosphorus fertilisation improve plant colonisation on seawater-contaminated cutover bogs. Mires and Peat, 18, Article 17.
(2) Hu Z., Ma Q., Cao H., Zhang Z., Tang C., Zhang L. & Ge Z. (2016) 长江口滨海湿地原生海三棱藨草种
群恢复的实验研究 (A trial study on revegetation of the native Scirpus mariqueter population in the
coastal wetland of the Yangtze Estuary). Ecological Science, 35, 1–7.
12.23.3 Introduce fragments of trees/shrubs: freshwater wetlands
One study evaluated the effects, on vegetation, of introducing tree/shrub fragments to freshwater wetlands. The study was in the USA.
VEGETATION COMMUNITY
VEGETATION ABUNDANCE

12. Habitat restoration and creation
451
VEGETATION STRUCTURE
OTHER
Survival (1 study): One study in a floodplain swamp clearing in the USA1 reported 12% overall survival of planted unrooted tree cuttings over two years. For two of four species, no monitored seedlings survived.
A study in 2007–2009 in a floodplain swamp restoration site in Wisconsin, USA (1) reported 12% survival of planted tree cuttings over two years. All surviving individuals were willows Salix spp. No cottonwood Populus deltoides or red osier dogwood Cornus stolonifera cuttings survived at monitored points – although some surviving cottonwood cuttings were noted elsewhere in the site (not quantified). Methods: Fresh (<2-week-old), unrooted tree cuttings were planted into 16 plots in a floodplain swamp restoration site (a clearing created by a storm). Cottonwood cuttings were planted in May 2007. Black willow Salix nigra, sandbar willow Salix exigua and dogwood cuttings were planted in April 2008. All plots had been cleared of invasive reed canarygrass Phalaris arundinacea and disked in November 2006. Herbicide was then applied regularly through to November 2008). Survival was monitored for 28 cuttings situated at survey points.
(1) Thomsen M., Brownell K., Groshek M. & Kirsch E. (2012) Control of reed canarygrass promotes wetland herb and tree seedling establishment in an Upper Mississippi River floodplain forest. Wetlands, 32, 543–555.
12.23.4 Introduce fragments of trees/shrubs: brackish/saline wetlands
We found no studies that evaluated the effects, on vegetation, of introducing tree/shrub fragments to brackish/saline wetlands.
This means that we have not yet found any studies that have directly evaluated this intervention during our systematic journal and report searches. Therefore we have no evidence to indicate whether or not the intervention has any desirable or harmful effects.
12.24 Introduce seeds or propagules
Background
This intervention involves introducing seeds or propagules of emergent plants to restore/create marshes or swamps. “Propagules” is the term used to describe the seed-like, usually leafless structures produced by mangrove trees to allow them to reproduce and disperse. Seeds or propagules may be collected from plants in greenhouses/laboratories, or from natural sites. They may be sown directly into the soil, scattered over the surface, or carried to suitable sites by water (e.g. after dropping them into the sea during an incoming tide).
Introduction of target vegetation might be useful in severely degraded or bare sites – which may lack remnant plants or seed banks to kick start revegetation with desirable species, and may be at risk of being taken over by undesirable species (Brown & Bedford 1997). It might also be useful in isolated wetlands, far from sources of marsh or swamp plant propagules. Seeds and propagules are easier to handle than plants, and can be a cost-effective way to introduce vegetation to large areas – but they can be more susceptible to herbivory or being washed away (e.g. Schoenholz et al. 2001).

12. Habitat restoration and creation
452
The effects of sowing may be highly dependent on the environmental conditions in each study. Questions you might ask when interpreting the evidence include: Is the study site degraded? Where and when were seeds/propagules introduced? Was there any intervention to improve conditions before planting? What were the conditions over the duration of the study?
The scope of this intervention does not include sowing nurse plants; sowing submerged or floating plants; sowing to restore bogs, fens, fen meadows or peat swamp forests (see Taylor et al. 2018); or sowing facultative wetland plants in upland sites. In contrast, the scope does include sowing non-native species to conserve marshes or swamps – whilst acknowledging that this is often considered ethically unacceptable due to the risk of invasion (e.g. Ren et al. 2009).
Related interventions: Directly plant whole plants (12.22); Introduce vegetation fragments (12.23); Transplant or replace blocks of vegetation (12.25); Transplant or replace wetland soil (12.26); Restore/create marshes or swamps using multiple interventions, often including planting (12.2); interventions to complement planting (Chapter 13).
Brown S.C. & Bedford B.L. (1997) Restoration of wetland vegetation with transplanted wetland soil: an experimental study. Wetlands, 17, 424–437.
Ren H., Lu H., Shen W., Huang C., Guo Q., Li Z. & Jian S. (2009) Sonneratia apetala Buch.Ham in the mangrove ecosystems of China: an invasive species or restoration species? Ecological Engineering, 35, 1243–1248.
Schoenholz S.H., James J.P., Kaminski R.M., Leopold B.D. & Ezell A.W. (2001) Afforestation of bottomland hardwoods in the Lower Mississippi Alluvial Valley: status and trends. Wetlands, 21, 602–613.
Taylor N.G., Grillas P. & Sutherland W.J. (2018) Peatland Conservation: Global Evidence for the Effects of Interventions to Conserve Peatland Vegetation. Synopses of Conservation Evidence Series. University of Cambridge, Cambridge.
12.24.1 Introduce seeds of non-woody plants: freshwater wetlands
Thirteen studies evaluated the effects, on vegetation, of introducing seeds of emergent, non-woody plants to freshwater wetlands. Eleven studies were in the USA1–3,5–12. Two studies were in Australia4a,4b. Two of the studies7,9 were based on exactly the same set of pools. Two sets of studies in the USA2,3,6 and Australia4a,4b used the same general sites, but different experimental set-ups.
VEGETATION COMMUNITY
Community composition (1 study): One replicated, site comparison study of created wetlands in the USA1 reported that wetlands sown with herb (and some shrub) seeds contained a different overall plant community to unsown wetlands, after 1–2 years.
Overall richness/diversity (1 study): The same study1 reported that wetlands sown with herb (and some shrub) seeds had higher plant diversity than unsown wetlands, after 1–2 years.
VEGETATION ABUNDANCE
Overall abundance (4 studies): Three replicated studies (two also randomized, paired, controlled, before-and-after) in wetlands in the USA1 and Australia4a,4b found that plots sown with herb seeds (and in one study1, some shrub seeds) had similar overall vegetation cover to unsown plots, after 1–3 years. One replicated, before-and-after study in the USA2 reported that vegetation biomass developed over 15 months after sowing mixed herb seeds. Biomass included all the sown species.
Characteristic plant abundance (3 studies): Two replicated, controlled studies of recently excavated ephemeral pools in the USA7,9 found that native, pool-characteristic species were more

12. Habitat restoration and creation
453
common, over seven years, in pools where they were sown than where they were not sown. One of the studies9 found that this was true when a mixture of characteristic species were densely sown, but not when a single species was sparsely sown. One replicated, before-and-after study in experimental wet basins in the USA6 quantified the overall density of target sedge meadow species, in the vegetation that developed over 16 weeks after sowing.
Herb abundance (2 studies): Two replicated, randomized, paired, controlled, before-and-after studies in a floodplain marsh in Australia4a,4b found that plots sown with herb seeds had similar overall sedge/grass cover to unsown plots, after 1–3 years.
Individual species abundance (8 studies): Eight studies1–3,4a,4b,6,7,11 quantified the effect of this intervention on the abundance of individual plant species. For example, four replicated, before-and-after studies in Australia4a,4b and the USA3,11 reported that sown herb species were absent from plots in some cases, after 1–3 years. The two studies in Australia4a,4b reported low abundance (<20% frequency and <2% cover) of wick grass Hymenachne acutigluma 1–3 years after sowing its seeds – although in one of the studies4a this was greater than in unsown plots.
VEGETATION STRUCTURE
Height (1 study): One replicated study in the USA11 reported data on cordgrass height, for up to three growing seasons after sowing.
OTHER
Germination/emergence (4 studies): Two replicated studies in the USA6,10 reported ≤1–61% germination of grass-like plants and forbs, after their seeds were sown onto wetlands. Another replicated study in the USA12 reported that seeds of six wetland herb species did not germinate when sown into a floodplain where an invasive plant was present (but being controlled). One replicated, randomized, paired, controlled study in a floodplain marsh in Australia4b found that sowing herb seeds had no significant effect on the number of invasive mimosa Mimosa pigra seedlings germinating, for up to three years.
Survival (6 studies): Six studies in freshwater wetlands in Australia4a,4b and the USA5,8,11,12 reported absence of sown (or planted8) herb species, in at least some cases, after one month to seven years. It is not always clear whether this reflects death of seedlings or failure of seeds to germinate.
A replicated, site comparison study in 1989–1992 of 10 created wetlands in Wisconsin, USA (1) reported that wetlands sown with herb (and some shrub) seeds contained a different plant community to unsown wetlands, with greater richness and diversity but similar vegetation cover. Unless specified, statistical significance was not assessed. After 1–2 years, the overall plant community composition differed between sown and unsown wetlands (data reported as a graphical analysis). Sown wetlands contained more plant species than unsown wetlands (sown: 46–56; unsown: 40–42 species/wetland), contained more native wetland plant species (sown: 25–42; unsown: 18–20 species/wetland) and had higher plant diversity (total and native wetland plants; data reported as a diversity index). However, vegetation cover did not significantly differ between sown and unsown wetlands. This was true for cover of all vegetation (sown: 40–73%; unsown: 29–67%) and cover of native wetland species only (sown: 21–59%; unsown: 6–41%). After two years, 17 of the 21 sown herb species were found in at least two of five sown wetlands. Meanwhile, the most abundant species in both types of wetland was cattail Typha spp. (sown: 13% cover; unsown: 17% cover; see original paper for data on abundance of other species). Methods: In autumn 1989 or 1990, ten areas of agricultural land (<2.2 ha) were flooded by blocking or removing drainage channels. Five were also sown with a mix of

12. Habitat restoration and creation
454
22 wetland plant species (21 herbs, 1 shrub). When each wetland was one or two years old, all plant species were recorded and vegetation cover was estimated in twenty-five 1-m2 quadrats.
A replicated, before-and-after study in 1998–1999 in two experimental wet basins in Minnesota, USA (2) reported that 11 of 11 sown wetland herb species established. After 15 months, all 11 sown species were present as plants. The most abundant species was mannagrass Glyceria grandis (above-ground biomass: 248–681 g/m2). Total above-ground biomass was 1,915–3,079 g/m2 (including native grass-like plants: 366–1,252 g/m2; native forbs: 386–1,932 g/m2). Methods: In May 1998, seeds of 11 native sedge meadow grass-like plants and forbs were sown into sixty 1.13-m2 plots across two saturated wet basins (equal mix of all 11 species in each plot; total 1,500 viable seeds/m2). Seeds were dipped in bleach, then stored cold (4°C) and wet for 46 days before sowing. In October 1997, the plots had been levelled, enclosed in a plastic barrier, and treated with a chemical to kill all seeds in the soil. For experimental reasons, 30 plots also received seeds of invasive reed canarygrass Phalaris arundinacea (136 viable seeds/m2) and 40 plots were fertilized to simulate pollution. Vegetation was cut from one 0.5-m2 quadrat/plot in August 1999, then dried and weighed. This study used the same site as (3) and (6), but a different experimental set-up.
A replicated, before-and-after study in 1998–1999 in an experimental wet basin in Minnesota, USA (3) reported that plots sown with porcupine sedge Carex hystericina seeds supported porcupine sedge populations after 1–2 growing seasons. In plots only sown with porcupine sedge, above-ground biomass was <1–16 g/m2 after one growing season, then 0–1,790 g/m2 after two. In plots sown with other species alongside porcupine sedge (potential nurse plants and/or an invasive grass), sedge biomass was 0–3 g/m2 after one growing season, then 0–1,130 g/m2 after two. Variation was related to elevation (less biomass in higher, drier plots) and which companion species were planted. Methods: In June 1997 and April 1998, porcupine sedge seeds were sown onto four hundred and eighty 0.25-m2 plots in an experimental wet basin (500–5,000 seeds/m2). Plots were 2–37 cm above the water level. Sedge seeds were dipped in bleach, then stored cold (4°C) and wet for eight weeks before sowing. For experimental reasons, 432 plots were also sown with also one or two other plant species. Biomass was sampled from the centre of the plots – half after one growing season, half after two – then dried and weighed. This study used the same site as (2) and (6), but a different experimental set-up.
A replicated, randomized, paired, controlled, before-and-after study in 1999–2000 in a floodplain marsh in the Northern Territory, Australia (4a) reported that only two of five sown herb species were present after one year, and found that sowing had no significant effect on vegetation cover. After one year, the only two sown species present in any sown plots were wick grass Hymenachne acutigluma (in 1 of 35 sown plots; approximately 1% cover) and water chestnut Eleocharis dulcis (in 5 of 20 sown plots; cover not reported). Wick grass was present in 0 of 15 unsown plots. Water chestnut was present in 1 of 10 unsown plots. Sown and unsown plots had statistically similar cover of vegetation overall (approximately 76–90%), sedges and grasses (approximately 12–27%) and invasive mimosa Mimosa pigra (approximately 10–17%). Before sowing, plots destined for each treatment had similar cover of vegetation (<1%), dead mimosa stumps (5–15%) and bare mud (85–95%). Methods: In November 1999 (end of the dry season), herb seeds (collected from local wetlands) were sown into 5 x 5 m plots in a degraded floodplain marsh. Mimosa had recently

12. Habitat restoration and creation
455
been cleared from the marsh using herbicide, crushing and burning. In one area, ten sets of three plots were established. Twenty plots (two random plots/set) were sown with seeds of five mixed species, including wick grass and water chestnut (1 g/species). In the other area, five sets of four plots were established. Fifteen plots (three random plots/set) were sown with wick grass seeds (1.25 g, 5 g or 12.5 g). All other plots were not sown. Vegetation was surveyed immediately before sowing and approximately one year after (October 2000). This study used the same marsh as (4b), but different experimental set-ups.
A replicated, randomized, paired, controlled, before-and-after study in 2000–2003 in a floodplain marsh in the Northern Territory, Australia (4b) found that sowing seeds of three wetland herb species had no significant effect on their abundance or overall vegetation cover, or on germination rates of invasive mimosa Mimosa pigra. Immediately before sowing, plots had no vegetation cover. After one year, only one of three sown species (wick grass Hymenachne acutigluma) was present in sown plots. However, wick grass was present in the same proportion (17%) of sown and unsown plots. In three of three years after planting, sown and unsown plots had statistically similar cover of wick grass (sown: <2%; unsown: <2%), grasses/sedges overall (sown: 34–52%; unsown: 41–45%) and vegetation overall (sown: 40–76%; unsown: 50–76%). Finally, mimosa germination rates did not significantly differ between sown and unsown plots in any of the three years after sowing (see original paper for data). Methods: In July–September 2000 (at the end of the wet season), twelve pairs of 7.5 x 7.5 m plots were established on a degraded floodplain marsh. Mimosa had recently been cleared from the marsh using herbicide, crushing and burning. Then, one plot in each pair was sown with an equal mix of three herb species (2,667 g/ha of seeds collected from local wetlands). The other plots were not sown. Vegetation was surveyed immediately before sowing and in the following three dry seasons (July–October 2001–2003). This study used the same marsh as (4a), but a different experimental set-up.
A replicated study in 2000–2004 in two wet meadows in Minnesota, USA (5) reported that 15 of 26 sown herb species established. For these 15 species, some biomass was found in at least one sown plot after one and/or two growing seasons. In every plot, the total biomass of sown species was <10% of the biomass of species that had not been sown (excluding invasive reed canarygrass Phalaris arundinacea). Sown species only established in plots where reed canarygrass had been controlled with herbicide before sowing. Methods: One hundred and sixty 25-m2 plots were established across two canarygrass-invaded wet meadows. All plots were sown with a mix of grass and forb seeds in May 2001, 2002 or 2003 (further details not reported). Most (140) plots had been burned and/or sprayed with herbicide in the year(s) before sowing to control reed canarygrass. Vegetation was surveyed in August, one and two growing seasons after sowing.
A replicated, before-and-after study in 2004–2005 in two experimental wet basins in Minnesota, USA (6) reported that 33–61% of sown sedge meadow plant seeds germinated depending on the presence/diversity of a nurse crop, and that vegetation abundance after one growing season depended on the presence/diversity of a nurse crop, presence of an invasive plant species, sawdust addition and the outcome metric. For example, the total density of target (sown) sedge meadow species was lowest (370 shoots/m2) in plots with a high-diversity nurse crop and reed canarygrass Phararis arundinacea, but without added sawdust, and highest (1,300 shoots/m2) in plots without a nurse crop, but with reed canarygrass and added

12. Habitat restoration and creation
456
sawdust. The density of individual sown species ranged from 0 shoots/m2 (e.g. great blue lobelia Lobelia siphilitica under all conditions) to 490 shoots/m2 (prairie ironweed Vernonia fasciculata under one set of conditions). Methods: In May 2005, seeds of ten target sedge meadow species were sown onto seventy-two 1-m2 plots (total 2,250 seeds/m2) across two experimental, vegetation-free wet basins. The seeds were stored cold (4°C) and wet for four months before sowing. All plots were weeded for 10 weeks after sowing. For experimental reasons, 48 plots were also sown with a potential nurse crop (one or five species), 36 plots were sown with reed canarygrass, and 36 plots were amended with sawdust before sowing. Target vegetation was surveyed for 16 weeks after sowing. Seedlings were counted in five 100-cm2 subplots/plot. Shoot density and cover were monitored across the whole of each plot. This study used the same site as (2) and (3), but a different experimental set-up.
A replicated, controlled, site comparison study in 1999–2008 in 256 excavated ephemeral pools on one air force base in California, USA (7) found that plots sown with seeds of five native, pool-characteristic herb species contained a greater abundance of these species than unsown plots. In seven of seven years, the combined frequency of the five pool-characteristic plants was greater in sown plots (3–19%) than unsown plots (<1–5%). The same was true in 30 of 35 comparisons for the individual species (sown: <1–44%; unsown: <0–21%). For comparison, the frequency of each species in nearby natural pools was 5–48%. Three of four analyzed species also strongly benefitted from “priority effects”: they were more frequent in pools where they were sown in the first year of the study than in pools where they were sown in the second year, after other species (see original paper for data). Methods: Between 1999 and 2001, seeds of five focal herb species (native species characteristic of Californian ephemeral pools) were sown onto 192 plots (each 0.25 m2 and in a separate excavated pool). Of these, 128 were sown with a mix of five species (600 seeds/plot, over 1–2 years) and 64 were sown with a single species (100–300 seeds/plot, over 1–3 years). The mixed-species plots received one of two planting orders (species A+B+C then species A+D+E, or species A+D+E then species A+B+C). Sixty-four additional plots (pools) were not sown. Each spring between 2002 and 2008, the frequency of the five focal species was recorded in each plot, using a grid of one hundred 2.5-cm2 cells. Some natural pools (number not specified) on the base were also surveyed in 1998 and 1999. This study was based on the same pools as (9).
A replicated study in 2005–2006 of 22 lakeshore restoration sites in Minnesota, USA (8) reported that 17–40% of sown/planted species reliably established across multiple sites, and that no planted/sown species established in some individual sites. In the seasonally flooded zone, only 22 of 128 sown/planted species reliably established (survived in >75% of sites where planted, or ≥25% cover in ≥1 site). Fifty-six species failed to establish at any site. However, some sown/planted species established at 100% of sites. In the permanently flooded zone, 10 of 25 sown/planted species reliably established. Six species failed to establish at any site. Sown/planted species completely failed to establish at 27% of sites. Methods: In summer 2005 and spring 2006, plant species and their cover were surveyed in 22 urban lakeshore restoration projects. Native plants had been introduced between 1999 and 2004. Species lists were obtained from project reports or interviews with staff. Almost all introduced plants were emergent herbs, and most (but not all) were wetland species. Some plants were sown and some were directly planted (as plugs or on pre-vegetated coconut-fibre mats). The study does not distinguish between the effects of sowing and planting. Most sites were protected with fences and/or wave breaks, at least for the first growing season after sowing/planting.

12. Habitat restoration and creation
457
A replicated, controlled study in 1999–2008 in 256 excavated ephemeral pools on one air force base in California, USA (9) found that plots sown with seeds of pool-characteristic herbs typically contained a greater abundance of native pool-characteristic plants than unsown plots (if a dense seed mix was used), but that sowing did not significantly affect the abundance of non-native plants. All data were reported as frequencies, added together for all species in each group. Over seven years of monitoring, plots densely sown with a mix of herb species typically supported a greater abundance of native, pool-characteristic plants than unsown plots (9 of 14 comparisons; other comparisons no significant difference). However, densely sown plots typically supported a similar abundance of non-native plants to unsown plots (9 of 14 comparisons; other comparisons lower abundance in sown plots). The study does not report data for native, generalist plants. In contrast, plots sparsely sown with single species typically supported a similar abundance – to unsown plots – of both native pool-characteristic plants (13 of 14 comparisons) and non-native plants (14 of 14 comparisons). Methods: Between 1999 and 2001, seeds of native, pool-characteristic herbs were sown onto 192 plots (each 0.25 m2 and in a separate excavated pool). Of these, 128 were densely sown (600 seeds/plot; mix of five species) and 64 were sparsely sown (100–300 seeds/plot; one species). Sixty-four additional plots (pools) were not sown. Each spring between 2002 and 2008, the frequency of every plant species was recorded in each plot, using a grid of one hundred 2.5-cm2 cells. This study was based on the same pools as (7).
A replicated study in 2003–2004 in six wet meadows in Iowa, USA (10) reported that <1–21% of sown sedge Carex spp. seeds germinated within two growing seasons. A higher proportion of seeds germinated in recently rewetted meadows (7–21%) than natural meadows (<1–4%). For seeds sown in natural meadows in the spring, a higher proportion germinated when chilled over the previous winter than when kept at room temperature (see Section 13.31). Within each wetland type and seed treatment, germination rate did not significantly differ between species (see original paper). Methods: In autumn 2002 and spring 2003, seeds of 4–5 sedge species were sown into the wet meadow zone of six prairie pothole wetlands (900–8,100 wild-collected seeds/species/pothole, split across 9–27 plots/species). Three meadows were natural and three had been rewetted one year previously (so were still developing vegetation, and had drier soil with no sedge seeds). Autumn-sown seeds were held in place with plastic mesh and barriers. Amongst spring-sown seeds, half had been chilled (1–5°C) over the previous winter whilst half had been kept at room temperature. Seedlings that emerged from the soil were counted for two growing seasons.
A replicated, before-and-after study in 2010–2013 aiming to restore an ephemeral freshwater marsh on cropland in South Dakota, USA (11) reported that sown prairie cordgrass Spartina pectinata occurred in 0–67% of sampled quadrats after two growing seasons and 31–78% of sampled quadrats after four, depending on elevation. After two growing seasons, 0–10% of quadrats at low elevations (≤10 cm from wetland bottom) and 57–67% of quadrats at higher elevations (>10 cm from wetland bottom) contained at least one cordgrass stem. After four growing seasons, cordgrass plants had spread (possibly from adjacent plots with transplanted cordgrass). There was at least one stem in 15–31% of quadrats at low elevations and 66–78% of quadrats at higher elevations. The height and above-ground biomass of cordgrass were greatest at mid-low elevations (see original paper). Methods: Four plots were established in a historically cultivated ephemeral wetland. Each plot ran perpendicular to the slope of the wetland, so included a range of elevations. Spring floodwaters were typically 50 cm deep. In spring 2010, each plot was sown with

12. Habitat restoration and creation
458
cordgrass seed (10 kg/ha). All plots were mown once in 2011 to control weeds. Each autumn from 2011 to 2013, cordgrass presence and height were surveyed in 1-m2 quadrats along the length of each plot. Biomass was sampled in 2013 only.
A replicated study in 2013–2014 in a degraded floodplain swamp in Florida, USA (12) reported that seeds of six wetland herb species did not germinate within a year of sowing, when sown into a clearing. Methods: In November 2013, herb seeds were sown (600 viable seeds/m2) into fourteen 1.5 x 1.5 m plots, in a clearing in a floodplain swamp. Seven plots received a mix of four native species (common rush Juncus effusus, pine barren goldenrod Solidago fistulosa, purple bluestem Andropogon glomeratus, and red-top panic grass Panicum longifolium). Seven plots received a mix of two native species (common rush and goldenrod). Three months before sowing, all plots were sprayed with herbicide to control, but not eradicate, invasive Mexican petunia Ruellia simplex. Plots were monitored monthly for one year after sowing. Surface water was present in 6 of 12 months and was up to 21 cm deep.
(1) Reinartz J.A. & Warne E.L. (1993) Development of vegetation in small created wetlands in southeastern Wisconsin. Wetlands, 13, 153–164.
(2) Green E.K. & Galatowitsch S.M. (2002) Effects of Phalaris arundinacea and nitrate-N addition on wetland plant community establishment. Journal of Applied Ecology, 39, 134–144.
(3) Perry L.G. & Galatowitsch S.M. (2003) A test of two annual cover crops for controlling Phalaris arundinacea invasion in restored sedge meadow wetlands. Restoration Ecology, 11, 297–307.
(4) Paynter Q. (2004) Revegetation of a wetland following control of the invasive woody weed, Mimosa pigra, in the Northern Territory, Australia. Environmental Management and Restoration, 5, 191–198.
(5) Reinhardt Adams C. & Galatowitsch S.M. (2006) Increasing the effectiveness of reed canary grass (Phalaris arundinacea L.) control in wet meadow restorations. Restoration Ecology, 14, 441–451.
(6) Iannone B.V. III & Galatowitsch S.M. (2008) Altering light and soil N to limit Phalaris arundinacea reinvasion in sedge meadow restorations. Restoration Ecology, 16, 689–701.
(7) Collinge S.K. & Ray C. (2009) Transient patterns in the assembly of vernal pool plant communities. Ecology, 90, 3313–3323.
(8) Vanderbosch D.A. & Galatowitsch S.M. (2010) An assessment of urban lakeshore restorations in Minnesota. Ecological Restoration, 28, 71–80.
(9) Collinge S.K., Ray C. & Gerhardt F. (2011) Long-term dynamics of biotic and abiotic resistance to exotic species invasion in restored vernal pool plant communities. Ecological Applications, 21, 2105–2118.
(10) Kettenring K. & Galatowitsch S.M. (2011) Carex seedling emergence in restored and natural prairie wetlands. Wetlands, 31, 273–281.
(11) Zilverberg C.J., Johnson W.C., Boe A., Owens V., Archer D.W., Novotny C., Volke M. & Werner B. (2014) Growing Spartina pectinata in previously farmed prairie wetlands for economic and ecological benefits. Wetlands, 34, 853–864.
(12) Smith A.M., Reinhardt Adams C., Wiese C. & Wilson S.B. (2016) Re-vegetation with native species does not control the invasive Ruellia simplex in a floodplain forest in Florida, USA. Applied Vegetation Science, 19, 20–30.
12.24.2 Introduce seeds of non-woody plants: brackish/saline wetlands
Eight studies evaluated the effects, on vegetation, of introducing seeds of emergent, non-woody plants to brackish/saline wetlands. There were three studies in the USA1,4,5, two in the Netherlands2,3 and two in China6,8. The other study was a global systematic review7.
VEGETATION COMMUNITY
VEGETATION ABUNDANCE
Individual species abundance (4 studies): Four replicated studies1,2,6,8 quantified the effect of this intervention on the abundance of individual plant species. One study in an estuary in China6

12. Habitat restoration and creation
459
also gave a before-and-after comparison, and reported higher density and biomass of seablite Suaeda salsa five months after sowing its seeds than on the bare sediment present before sowing.
VEGETATION STRUCTURE
Height (1 study): One replicated study on a mudflat in the Netherlands2 reported that the average height of surviving common cordgrass Spartina anglica plants increased, between one and six months after sowing cordgrass seeds.
OTHER
Germination/emergence (5 studies): Five replicated studies in the Netherlands2,3, the USA4,5 and China8 quantified germination rates of seeds sown into intertidal areas. Some seeds germinated in all five studies, at a rate of <1% to 25%. Two studies3,4 reported that no seeds germinated for some species and/or in some environments.
Survival (3 studies): One replicated study in a salt marsh in the Netherlands3 quantified survival rates of individual germinated seedlings: 0–83% over their first growing season, depending on species and site conditions. Another replicated study in a salt marsh in the Netherlands2 reported that after two growing seasons, common cordgrass Spartina anglica was absent from 90% of plots in which had been sown. One global systematic review7 reported variable survival of herbs sown (or planted) in salt marshes: 0% to ≥95% after 20 days to 13 years, depending on the study.
A replicated study in 1979–1981 on reprofiled borrow pits in North Carolina, USA (1) reported that smooth cordgrass Spartina alterniflora biomass developed in plots where sown cordgrass seeds germinated. Cordgrass seeds only germinated in some plots, which the authors suggested were those with suitable moisture levels (data not reported). In these plots, there was 304–1,163 g/m2 above-ground biomass of smooth cordgrass after one growing season. Methods: In spring 1979 and 1981, smooth cordgrass seeds were mixed into the surface of “several” plots on reprofiled coastal land (30 cm below to 60 cm above mean sea level; salinity <20 ppt). The seeds had been stored at 2–4°C, first dry, then in artificial sea water. The plots were dry during sowing but rewetted after. All plots were fertilized before or after sowing. In October 1979 and 1981, live vegetation was cut from the plots, then dried and weighed.
A replicated study in 1981–1982 on a mudflat in the Netherlands (2) reported that 1–23% of sown common cordgrass Spartina anglica seeds germinated within one month, and that the average height of surviving plants increased over one growing season. Initial germination rates were highest in plots at higher elevations (97–110 cm above mean sea level) and for seeds sown at intermediate depths (1.5 cm; statistical significance not assessed). The average height of surviving cordgrass plants was 1–2 cm one month after planting, then 8–15 cm six months after planting (with taller plants at the higher elevations). After two growing seasons, sown cordgrass only persisted at the highest elevation, and here in only 50% of plots. These plots had also been colonized by new cordgrasses and saltworts Salicornia spp. (not quantified). Methods: In April 1981, field-collected common cordgrass seeds were sown into one hundred and eighty 0.25-m2 plots (20 seeds/plot). The plots were on a mudflat, below a cordgrass-dominated salt marsh. They were arranged in five groups of 36 plots, with each group at a different elevation (42–110 cm above mean sea level). One third of the seeds (12 plots/group) were sown at each of three depths (0.5, 1.5 or 3.0 cm). The presence and height of cordgrass plants were monitored between May and November 1981. Plot-level survival was monitored in July 1982.

12. Habitat restoration and creation
460
A replicated study in 1989 in a salt marsh in the Netherlands (3) reported that 0–19% of salt marsh plant species’ seeds germinated after sowing, and that 0–83% of seedlings survived their first growing season. Germination and survival rates varied between sown species, the plant community in which they were sown, and whether vegetation was grazed or mown (see original paper for details). The species with the highest overall germination rate was sea aster Aster tripolium: 98 seedlings found during the first growing season (vs 750 seeds sown). The species with the highest overall survival rate was spear-leaved orache Atriplex prostrata: 35 seedlings alive at the end of August (vs 80 seedlings germinated). Only one Danish scurvygrass Cochlearia danica seedling survived until the end of August (vs 63 germinated). Methods: In March 1989, at total of 9,000 seeds were sown into a coastal salt marsh. Five batches of 50 seeds were sown for each of six species, in three recipient plant communities, and for each of two disturbance regimes (summer grazing or annual mowing; date not reported). Germination and survival were monitored until the end of August.
A replicated study in 2001 in an estuary in California, USA (4) reported that after sowing 21,600 seeds of two salt marsh species, only 17 seedlings grew. These 17 seedlings were all dwarf saltwort Salicornia bigelovii. No seedlings of arrowgrass Triglochin concinna were found. Methods: In March 2001, a total of 10,800 seeds/species were sown onto an area of recently reprofiled intertidal sediment. Sets of 50 seeds (25 seeds/species) were sown under single adult herbs/succulents (144 sets), under clusters of adult herbs/succulents (144 sets) or onto bare sediment (144 sets). All seed sets were covered with burlap fabric after sowing. Seedlings were counted over the 2001 growing season.
A replicated study in 2006 in an estuarine salt marsh in California, USA (5) reported that plots sown with dwarf saltwort Salicornia bigelovii seeds contained dwarf saltwort seedlings two months later. A total of 650 seedlings were counted across seventy-two 0.25-m2 plots. There were 3–14 seedlings/0.25 m2 depending on plot elevation and location in the marsh (see Section 13.7). Thinning the dominant pickleweed Salicornia virginica had no significant effect on seedling density. The study notes that there were probably lots of dwarf saltwort seeds already in the soil, and many of the seedlings probably germinated from these seeds. Methods: In March 2006, dwarf saltwort seeds were sown onto seventy-two 0.25-m2 plots in a pickleweed-dominated salt marsh (approximately 68 seeds/plot). Four dwarf saltwort seedlings were also planted in each plot. In some of the plots, the surface was lowered by 5–10 cm and/or pickleweed stems were cut and removed before planting. Seedlings were counted in May 2006.
A replicated, before-and-after study in an alkaline, estuarine wetland in eastern China (6) reported that five months after sowing seeds of seablite Suaeda salsa onto bare prepared plots, seablite was present. Seeds were sown May. In October, sown plots contained 292–532 seablite plants/m2, with an above-ground biomass of 396–771 g/m2. Seablite plants were 59–63 cm tall, on average. Variation in density and biomass were related to the method used to prepare plots for sowing (see Sections 13.13 and 13.14). Methods: In May 2009, three pairs of 6-m2 plots were established in a degraded, unvegetated, hypersaline/alkaline wetland in the Yellow River estuary. Approximately 5,000 seablite seeds were sown onto each plot, then watered. Three plots had been prepared by ploughing (to 20 cm depth), three by ploughing and mixing in urea (130 kg N/ha), and three by ploughing and mixing in reed debris (2 kg/m2). Vegetation was sampled in five 1-m2 quadrats/plot until October 2009.

12. Habitat restoration and creation
461
Biomass measurements involved samples of approximately 100 plants/plot. Details of height measurements were not reported.
A 2016 systematic review of salt marsh restoration studies around the world (7) reported a 65% average survival rate of sown and planted vegetation. Survival ranged from 0% (2 of 64 cases) to ≥95% (7 of 64 cases). Methods: These results are based on 64 cases (e.g. different species, environments or intervention methods) from 16 publications and five countries, 63 of which involved sowing or planting salt marsh vegetation (mostly herbs and succulents, sometimes shrubs; see Appendix to original paper). Literature searches were carried out in 2014. Sowing and planting were sometimes into environments thought to be suitable (but sometimes into hostile environments) and sometimes preceded by site preparation (but sometimes not). Study duration ranged from 20 days to 13 years. Survival was sometimes estimated from other metrics, such as cover. The review does not separate results for sowing vs planting. The review does not include any of the other studies summarized for this intervention.
A replicated study in 2014 on a recently deposited tidal flat in eastern China (8) reported that sown bulrush Scirpus mariqueter seeds successfully germinated. After one growing season, 0.6–1.1% of sown bulrush seeds had germinated and emerged as seedlings. There were 0.06–0.50 bulrush shoots/m2. Neither the germination rate nor shoot density significantly differed between different sowing densities. Methods: In March–April 2015, field-collected bulrush seeds were sown into a recent accumulation of intertidal sediment in the Yangtze estuary. Three 200-m2 plots were each sown with a different density of seeds: 1,000, 2,000 or 4,000 seeds/m2. Seeds were sown 5 cm deep, but the study noted that substantial sediment deposition over the rest of the growing season (>15 cm depth). Bulrush seedlings and shoots were counted twice each month until October, in ten 4-m2 quadrats/plot.
(1) Broome S.W., Seneca E.D. & Woodhouse W.W. Jr. (1982) Establishing brackish marshes on graded upland sites in North Carolina. Wetlands, 2, 152–178.
(2) Groenendijk A.M. (1986) Establishment of a Spartina anglica population on a tidal mudflat: a field experiment. Journal of Environmental Management, 22, 1–12.
(3) Bakker J.P. & de Vries Y. (1992) Germination and early establishment of lower salt-marsh species in grazed and mown salt marsh. Journal of Vegetation Science, 3, 247–252.
(4) Zedler J.B., Morzaria-Luna H. & Ward K. (2003) The challenge of restoring vegetation on tidal, hypersaline substrates. Plant and Soil, 253, 259–273.
(5) Varty A.K. & Zedler J.B. (2008) How waterlogged microsites help an annual plant persist among salt marsh perennials. Estuaries and Coasts, 31, 300–312.
(6) Guan, B., Yu J., Lu Z., Xie W., Chen X. & Wang X. (2011) 黄河三角洲重度退化滨海湿地盐地碱蓬的生态修复效果
(The ecological effects of Suaeda salsa on repairing heavily degraded coastal saline-alkaline wetlands in the Yellow River Delta). Acta Ecologica Sinica, 31, 4835–4840.
(7) Bayraktarov E., Saunders M.I., Abdullah S., Mills M., Beher J., Possingham H.P., Mumby P.J. & Lovelock C.E. (2016) The cost and feasibility of marine coastal restoration. Ecological Applications, 26, 1055–1074.
(8) Hu Z., Ma Q., Cao H., Zhang Z., Tang C., Zhang L. & Ge Z. (2016) 长江口滨海湿地原生海三棱藨草种
群恢复的实验研究 (A trial study on revegetation of the native Scirpus mariqueter population in the
coastal wetland of the Yangtze Estuary). Ecological Science, 35, 1–7.
12.24.3 Introduce tree/shrub seeds or propagules: freshwater wetlands
Two studies evaluated the effects, on vegetation, of introducing seeds or propagules of trees/ shrubs to freshwater wetlands. One study was in Australia1 and one study was in the USA2.

12. Habitat restoration and creation
462
VEGETATION COMMUNITY
VEGETATION ABUNDANCE
Tree/shrub abundance (1 study): One study in a floodplain swamp clearing in the USA2 simply reported the number of tree seedlings present within three years of sowing tree seeds. There were no seedlings of two of the five sown species.
VEGETATION STRUCTURE
OTHER
Germination/emergence (1 study): One replicated study in Australia1 reported 0–18% germination of tree/shrub seeds sown into a wet meadow, depending on the species and whether vegetation was cleared before sowing.
Survival (1 study): The same study1 reported 0% survival, after 8 months, of seedlings that had germinated from sown tree/shrub seeds.
A replicated study in 1995 in a wet meadow in New South Wales, Australia (1) reported 0–18% germination of sown tree/shrub seeds after two months, depending on the species and whether vegetation was cleared before sowing, but 0% survival after eight months. In plots that had been cleared of vegetation before sowing, all five sown species germinated. The number of seedlings present after two months was 1–18% of the number of seeds sown. In plots that had not been cleared of vegetation, only two of five species germinated. For these species, the number of seedlings present after two months was ≤1% of the number of seeds sown. After eight months, after prolonged saturation or flooding, no seedlings were present in any plot. Methods: In January–February 1995, seeds of five tree/shrub species present in local wetlands were sown on to a wet meadow, with the aim of restoring a swamp. For each species, three hundred 25 x 25 cm plots were sown with approximately 50 seeds. Of the 300 plots, 200 were cleared of vegetation before sowing. Half of the plots/species were higher (and drier) than the others. Seedlings of the planted species were counted in every plot after two and eight months.
A study in 2006–2009 in a floodplain swamp restoration site in Wisconsin, USA (2) reported that seedlings of only three of five sown tree species were present. Neither black ash Fraxinus nigra nor river birch Betula nigra seedlings were present in the site within three years of sowing seeds. Seedlings of the other three sown species were present (green ash Fraxinus pennsylvanica, American elm Ulmus americana and silver maple Acer saccharinum; abundance data reported graphically) but the study does not distinguish seedlings originating from sown vs naturally arriving seeds. Methods: Between November 2006 and May 2009, seeds of five tree species (numbers not clearly reported) were broadcast across 16 plots in a floodplain swamp restoration site (a clearing created by a storm). All plots had been cleared of invasive reed canarygrass Phalaris arundinacea and disked in November 2006 (before first sowing). Herbicide was then applied regularly through to November 2008). Tree seedlings were counted in August 2007–2009.
(1) de Jong N.H. (2000) Woody plant restoration and natural regeneration in wet meadow at Coomonderry Swamp on the south coast of New South Wales. Marine and Freshwater Research, 51, 81–89.
(2) Thomsen M., Brownell K., Groshek M. & Kirsch E. (2012) Control of reed canarygrass promotes wetland herb and tree seedling establishment in an Upper Mississippi River floodplain forest. Wetlands, 32, 543–555.

12. Habitat restoration and creation
463
12.24.4 Introduce tree/shrub seeds or propagules: brackish/saline
wetlands
Nineteen studies evaluated the effects, on vegetation, of introducing seeds or propagules of trees/shrubs to brackish/saline wetlands. All 19 studies involved planting mangrove propagules: seven in Asia2,9,12a,12b,14,17,18, five in North America3,5,7,10,13, three in Central America1,8,11, two in Oceania4,15, one in South America6 and one globally16. Three studies in the USA7,10,13 shared some study sites.
VEGETATION COMMUNITY
Overall extent (2 studies): Two studies in the USA10 and Sri Lanka18 simply quantified the area of mangrove vegetation present 6–14 years after planting propagules (along with other interventions).
Relative abundance (1 study): One replicated, paired, site comparison study in the USA7 reported that mangrove forests created by planting propagules (after reprofiling) supported a different relative abundance of tree species to natural forests, after 7–15 years.
Tree/shrub richness/diversity (2 studies): Two replicated, site comparison studies in the USA7,13 reported that mangrove forests created by planting propagules (along with other interventions) contained a similar number of tree species to mature natural forests, after 7–30 years.
VEGETATION ABUNDANCE
Tree/shrub abundance (3 studies): Three replicated, site comparison studies of coastal sites in the USA7,13 and the Philippines12b reported that where mangrove forests developed after planting propagules (along with other interventions), trees were typically more dense than in mature natural forests.
VEGETATION STRUCTURE
Overall structure (1 study): One replicated, site comparison study in the USA13 reported that mangrove forests created by planting propagules (along with other interventions) had a different overall physical structure to mature natural forests, after 17–30 years.
Height (4 studies): Four studies (three replicated) in Thailand2, the USA3, Mexico8 and the United Arab Emirates9 simply quantified the height of surviving mangrove trees for up to 16 years after sowing seeds or planting propagules; in all of these studies, the average height increased over time.
Diameter/perimeter/area (3 studies): Two site comparison studies (one also replicated and paired) in the USA7,10 reported that mangrove forests created by planting propagules (after reprofiling) contained thinner trees, on average, than mature natural forests, after 7–18 years. One study in a coastal area planted with mangrove propagules in Thailand2 reported that the average diameter of surviving seedlings increased over time.
Basal area (3 studies): Three site comparison studies (two also replicated, one also paired) in the USA7,10,13 compared mangrove forests created by planting propagules (along with other interventions) and mature natural forests. Two of the studies7,10 reported that planted forests had a smaller basal area than mature natural forests, after 7–18 years. The other study13 reported that planted forests had similar basal area to mature natural forests, after 17–30 years.
OTHER
Germination/emergence (2 studies): One replicated study in the United Arab Emirates9 reported 65–92% germination of sown grey mangrove Avicennia marina seeds, across five coastal sites. One replicated study in a brackish/saline estuary in China17 reported 38–100% germination of planted mangrove propagules, depending on the species and habitat.
Survival (16 studies): Fifteen studies1–6,8–11,12a,14–16,18 quantified survival of individual tree/shrub propagules planted in brackish/saline wetlands (or plants originating from them). All 15 studies were

12. Habitat restoration and creation
464
of mangroves: in Central/South America1,6,8,11, Asia2,9,12a,14,18, North America3,5,10, Oceania4,15 or gloablly16. All reported survival in at least some cases, from 20 days to 30 years after planting. Five studies5,6,8,11,15 reported 100% survival in some cases. However, nine studies4,5,6,13–18 reported 0% survival or absence of planted species in some cases. In five studies12a,14–16,18, survival of seeds or propagules was not distinguished from survival of planted seedlings. Proposed factors affecting survival rates included elevation/water levels2,6,8,14,18, substrate2,4, invertebrate herbivory6,14, use of tree shelters5, mechanical stress12a, oyster colonization12a, use of guidance18, post-planting care18 and repeated planting18.
Growth (5 studies): Five studies monitored true growth of individual trees/shrubs (rather than changes in average height of survivors). All five studies (three replicated) in Australia4, the USA5,10, Colombia6 and the Philippines12a reported that mangrove seedlings, originating from planted seeds or propagules, grew over time.
A replicated study in 1986–1987 in an experimentally degraded mangrove forest in Guadeloupe (1) reported >70% survival of planted red mangrove Rhizophora mangle propagules after approximately one year, and that the average height of saplings increased. Statistical significance was not assessed. Mangrove propagules were planted in oiled and non-oiled plots in March and July. After one year, the survival rate of propagules planted in oiled plots in July was 72–81% (data not reported for non-oiled plots). Across all treatments, healthy surviving saplings were 150–200 cm tall (vs 0 cm when planted as propagules). Saplings were 200–220 cm tall in non-oiled plots and 200–210 cm in plots sprayed with pure oil, compared to 150–180 cm in plots sprayed with oil and additives. Methods: In March and July 1986, mature, field-collected, red mangrove propagules were planted in four 2-m2 plots (72 propagules/plot) in a tidal mangrove forest that had been cleared for the study. Six plots (three plots/month) had been sprayed with 5L/m2 crude oil in early March. In four plots (two plots/month), the oil contained an additive (chemical dispersant, or a bioactivator to stimulate microbial activity). The height of healthy saplings (i.e. alive and not damaged by insects, crabs or falling branches) was measured every 50 days for approximately one year after planting.
A study in 1989–1993 in a historically mined mangrove in Thailand (2) reported that 53% of planted tall-stilt mangrove Rhizophora apiculata seedlings survived for four years, and that the average height of surviving seedlings increased over time. Statistical significance was not assessed. Seedling survival rates were 70% after one year, 55% after three years and 53% after four years. The most common seedling height was 50–75 cm after one year, then 100–125 cm after four years. The most common seedling diameter was 0.5–1.0 cm after one year, then 2.0–2.5 cm after four years. The study also suggested that survival and changes in height were affected by elevation and firmness of sediment (see original paper for data). Methods: In August 1989, tall-stilt mangrove propagules were planted into 1,000 m2 of tidal coastal land (3,950 wild-collected propagules, 50 cm apart). The area had been mined for tin in the previous decade. Data were collected immediately before planting (August 1989) and for up to four years after (November 1990, August 1992 and August 1993).
A replicated study in 1988–1990 on the coast of Louisiana, USA (3) reported 40–55% survival of planted black mangrove Avicennia germinans propagules after 15 months, and that the average height of surviving seedlings increased. After four months, 89–92% of propagules were still alive (31–33% of which were rooted and upright). After 15 months, 44–55% of propagules were still alive (all of these were rooted and upright). Surviving seedlings were 25–28 cm tall on average. The survival rate was statistically similar for propagules introduced to mangroves or salt marshes,

12. Habitat restoration and creation
465
but seedlings grew significantly more within salt marshes. Methods: In November 1998, twenty field-collected black mangrove propagules were placed loose within each of 32 cages (0.1 m2, 6 mm mesh, 0.6 m tall). Half of the cages were within existing black mangrove vegetation and half were in salt marsh vegetation (dominated by smooth cordgrass Spartina alterniflora) further inland. Propagules/seedlings were monitored in March 1989 and February 1990.
A replicated study in 1995–1997 on a tidal mudflat in New South Wales, Australia (4) reported 0–53% survival of planted grey mangrove Avicennia marina propagules after two growing seasons, but that survivors grew. In one of three planted areas, there were no mangrove seedlings present after two weeks. In the other two areas, there were 3.5–8.4 mangrove seedlings/plot present after two growing seasons (vs 16 planted propagules/plot). Seedlings were 30–49 cm tall, on average. There were more surviving seedlings in sand or natural substrate (6.7–8.4 seedlings/plot) than in slag (3.5 seedlings/plot), but the average height of seedlings was lower in sand (30 cm) than in all other substrates (45–49 cm). Methods: In December 1995, sixty 1-m2 plots were established (in three sets of 20) on a tidal mudflat in the Hunter River estuary. The plots were excavated to 20 cm depth and refilled with sand, the local natural substrate (sand/silt/clay; ploughed or unploughed) or slag (a waste product from iron production). Sixteen locally collected grey mangrove propagules were planted into each plot. Seedlings were counted in each set after approximately two weeks, then counted and measured in two of the sets after 15 months.
A replicated study in 1997–1998 in four sandy coastal sites in Florida, USA (5) reported 0–100% survival of planted red mangrove Rhizophora mangle propagules after 4–8 months, but that surviving propagules developed stems and leaves in most cases. Statistical significance was not assessed. Survival rates were highest (76–100%) for propagules sheltered within translucent plastic pipes that extended above and below ground. Survival rates were lower (0–6%) for propagules sheltered by bamboo pipes, sheltered by plastic pipes below ground only, or not sheltered. Some propagules developed stems in 9 of 12 cases and leaves in 10 of 12 cases (location x shelter combinations). The rate of stem and leaf development depended on shelter treatment, site, and when seedlings were collected and planted (see original paper). Methods: In August and November 1997, a total of 796 red mangrove propagules were planted in four areas of coastal, sandy sediment (13–35 propagules/site/season for each of the four shelter treatments; see above). The sites experienced “moderate to high” wave energy. Propagules were collected locally then rooted in a nursery. Healthy propagules were planted near the high tide level. Propagules (or the seedlings they became) were monitored twice a month for up to eight months after planting.
A replicated study in 1995–1997 in a degraded mangrove forest in Colombia (6) reported that 0–100% of planted propagules survived over 15 months, depending on species and environmental conditions, but that survivors grew. When planted and secured in flooded soils, survival rates were 71% for red mangrove Rhizophora mangle, 28% for white mangrove Laguncularia racemosa and 10% for black mangrove Avicennia germinans. Caterpillars ate most of the black mangroves. When planted into saturated soils, only red mangroves survived (100%). When planted into dry soils, no species survived for longer than 10 months. Surviving plants grew by 20–110 cm over 13 months. Methods: In November–December 1995 (start of the dry season), field-collected propagules were planted into a former mangrove site. The site had been reconnected to the main lagoon system (in 1989) to reduce the salinity that killed the former mangroves (around 1965). Sets of 15–100 propagules were planted (1–3 sets/species) in a range of soil conditions: flooded (5–10 cm deep), saturated (water

12. Habitat restoration and creation
466
table at soil surface) or dry (water table 2 cm below surface). After planting, water depths varied seasonally. Shade was provided for some propagules. Survival and plant height were monitored for up to 15 months.
A replicated, paired, site comparison study in 1996–1997 involving two sites planted with red mangrove Rhizophora mangle propagules (after reprofiling) in Florida, USA (7) reported that they supported a different tree density, structure and community to mature natural mangrove forests after 7–15 years. Statistical significance was not assessed. Restored sites contained 6,830–27,700 trees/ha (vs natural: only 1,840–2,131 trees/ha) but had a basal area of only 3–18 m2/ha (vs natural: 26–28 m2/ha). Accordingly, trees in restored sites were all <10 cm in diameter (average: 2.1–2.7 cm) whereas natural sites contained trees both <10 cm and ≥10 cm in diameter. Restored sites contained two or three tree species (vs natural: three), but in different proportions (e.g. 48–75% of trees in restored sites were white mangrove Laguncularia racemosa, vs natural: 17–26%; similar pattern for relative density, dominance and importance). Methods: Between November 1996 and December 1997, trees were surveyed in two pairs of restored and natural mangrove forests. Restoration, completed in 1982 or 1990, involved removing previously dumped sediment and excavating tidal channels, then planting red mangrove propagules. The study does not distinguish between the effects, on unplanted trees, of planting and reprofiling. Trees ≥2 m tall and ≥2 cm in diameter were recorded at 21 points/site. One pair of sites in this study was also used in (10).
A replicated study in 2000–2001 in two lagoons in southern Mexico (8) reported 39–100% survival of planted red mangrove Rhizophora mangle propagules after 8–11 months, but that the average height of surviving seedlings increased. Statistical significance was not assessed. Pozuelos Lagoon was flooded by two tides/day throughout the year. Here, all 3,019 planted propagules apparently produced surviving seedlings eight months later. These were 65 cm tall on average (vs 11 cm one month after planting). However, the study also reported extensive natural colonization by mangrove seedlings (> the number of propagules planted), and it is unclear if/how planted and unplanted seedlings were distinguished. In Cabildo Lagoon, only 39% of 19,345 planted propagules produced surviving seedlings after 8–11 months. These were 60–75 cm tall on average (vs 12–18 cm one month after planting). The study suggests that seedlings in this site were killed by low water levels and trampling by people and animals. Methods: Between June and September 2000, field-collected red mangrove propagules were planted in the intertidal zone of two lagoons (from 20-cm-deep water to the “limit of the wet zone”). Surviving seedlings were surveyed for up to eleven months after planting.
A replicated study in 1985–2001 in five coastal sites in the United Arab Emirates (9) reported that most sown grey mangrove Avicennia marina seeds germinated, and that the average height of the few surviving trees increased over time. Statistical significance was not assessed. Across the five sites, the germination rate ranged from 65% to 92%. Survival rates of germinated seedlings ranged from <1% to 27% after 5–8 years. The study suggests grazing by gazelles Gazella sp. and vandalism as causes of mortality. Surviving trees reached a height of 98–287 cm after 5–8 years, and 5.7–5.8 m after 13–16 years (one site only). Methods: Between 1985 and 1996, grey mangrove seeds were sown into five coastal sites (including one in the wastewater channel of a research centre). The seeds were collected from local mangrove trees, then buried 3 cm deep and 25–150 cm apart in the middle of the intertidal zone. Salinity was 40–45 ppt. At least 1,420 seeds were sown in each site. Germination rates

12. Habitat restoration and creation
467
were recorded 35–40 days after sowing. Surviving plants were counted, and height of 20 healthy seedlings measured, for up to 16 years.
A site comparison study in 1989–2000 in Florida, USA (10) reported that an area planted with red mangrove Rhizophora mangle propagules (after reprofiling) developed mangrove forest stands, but that these contained more trees with a greater basal area than natural forest after 18 years. Unless specified, statistical significance was not assessed. Tall mangrove stands occupied 74% of the restored area after six years, then 95% after 14 years. After 18 years, 60–87% of planted red mangrove trees were still alive. Survivors had grown, from 0.5–3 m tall six years after planting to 2–5 m tall 18 years after planting. Two of three mangrove species present in nearby natural forest had colonized the restored site: black mangrove Avicennia germinans and white mangrove Laguncularia racemosa. Overall, trees in the restored site were thinner (restored: 3 cm; natural: 13 cm diameter) but had a greater basal area (restored: 43 m2/ha; natural: 16–19 m2/ha). Methods: Between 1989 and 2000, vegetation was surveyed in a restored area and adjacent natural mangrove. Restoration, in the early 1980s, involved removing previously dumped sediment and excavating a tidal channel, then planting red mangrove propagules (in pairs 1 m apart). The study does not distinguish between the effects of these interventions on non-planted trees. Surveys involved monitoring individual marked trees over time, counting/measuring trees within 25-m2 plots or 1-m2 quadrats, and taking aerial photographs to estimate overall mangrove area (see original paper for details). This study monitored one of the sites from (7).
A replicated study in 2001–2003 on coastal salt marsh and sediment in Belize (11) reported 80–100% survival of planted red mangrove Rhizophora mangle propagules over two years, and that the average number of leaves per seedling increased over time. Statistical significance was not assessed. After two years, 80–100% of propagules planted amongst existing vegetation and 92% of propagules planted into bare sediment survived as seedlings. Surviving seedlings had 29–43 leaves on average (35–43 leaves/seedling developing amongst existing vegetation; 29 leaves/seedling developing on bare sediment). In comparison, seedlings had only four leaves on average after six months. Methods: In August 2001, nine plots were established in an intertidal area that used to be mangrove forest (clear-cut in 1991). Three plots were dominated by sea purslane Sesuvium portulacastrum, three were dominated by saltgrass Distichlis spicata, and three were bare sediment. Ten red mangrove propagules (collected from the surrounding forest) were planted into each plot. Between 6 and 24 months after planting the propagules, surviving seedlings were recorded and their leaves were counted.
A study of mangrove planting projects in the Philippines (12a) reported <5% survival of planted mangrove propagules/seedlings, but growth of surviving seedlings. Plantings almost exclusively involved Rhizophora spp. In two sites where survival was quantified, <5% of planted individuals survived (over nine months in one site; timescale not reported for other site). The study suggests that seedlings were killed by mechanical stress, substrate erosion, and oysters growing on their stems. Growth of surviving seedlings was quantified in eight sites. “Young individuals” grew by 3–13 cm over approximately 40 days (equivalent to 30–75 cm/year). Growth rates significantly differed between elevations: lowest in the low intertidal zone, and highest in the upper intertidal zone. Methods: The study reported results from various mangrove planting projects initiated since the 1980s: both afforestation (planting in mudflats, sandflats or seagrass beds) and reforestation (re-planting

12. Habitat restoration and creation
468
cleared mangroves, mostly fishponds). Propagules and/or seedlings were generally planted 1 m apart, following national guidelines, but often with 2–5 individuals at each planting spot.
A replicated, paired, site comparison study of six coastal sites in the Philippines (12b) reported that planted mangrove forests typically contained a higher density of trees and greater canopy cover than natural mangrove forests. Statistical significance was not assessed. After “several years”, planted forests contained a greater density of trees than natural forests in 9 of 10 comparisons (for which planted: 27–93 trees/100 m2; natural: 22–42 trees/100 m2). Planted forests had greater canopy cover than natural forests in 5 of 9 comparisons (data reported as a canopy index; other comparisons lower in planted forests). Methods: The study surveyed planted and natural mangrove forests at six sites (1–22 plots/forest type/site; dates not reported). Plantings had taken place since the 1980s (precise dates not reported) and almost exclusively involved Rhizophora spp. propagules and/or seedlings. These were generally planted 1 m apart, following national guidelines, but often with 2–5 individuals at each planting spot. Some plantings involved afforestation (planting in mudflats, sandflats or seagrass beds) and some involved reforestation (re-planting cleared mangroves, mostly fishponds).
A replicated, site comparison study in 2005 in Florida, USA (13) reported that 12 of 17 sites planted with mangroves (along with other interventions) contained mangrove forests after 17–30 years – but that these differed from mature natural forests in overall complexity, tree density and canopy height. Statistical significance was not assessed. After 17–30 years, mangrove forests had developed in 12 of the 17 sites. Mangrove forests had not persisted in four sites and been deliberately removed from one. Nine of the sites that developed forests were surveyed in detail. The created/restored forests had a different overall structure to natural forests (data reported as a complexity index and graphical analysis). Created/restored forests contained 16,925 trees/ha (vs natural: only 6,594 trees/ha) and had a canopy height of only 4.0 m (vs natural: 6.4 m). Both created/restored and natural forests had an average basal area of 31 m2/ha, and contained 1–3 tree species. Methods: In 2005, vegetation was surveyed in 17 sites (three 2 x 2 m plots/site). All of these sites had been planted with red mangrove Rhizophora mangle between 1975 and 1987 (either propagules or seedlings; precise numbers not reported). Some sites had also been planted with smooth cordgrass Spartina alterniflora. All but one site was planted after levelling upland areas. The study does not distinguish between the effects, on unplanted trees, of planting mangroves, planting cordgrass and reprofiling. Comparisons were made with previously published data from seven nearby natural forests. This study included the sites in (7) and (10).
A replicated study in 2006–2009 of 47 mangrove restoration projects in Sumatra, Indonesia (14) reported 0–99% survival of planted propagules/seedlings after <15 months. Some planted individuals survived in 45 of the 47 projects. Survival rates ranged from 17% to 99% per project. The study suggests that survival was influenced by factors such as elevation, sediment deposition, flash floods, grazing by crabs, smothering by algae, soaking propagules before planting, and prior planting experience of communities (effects not quantified). Methods: Between February 2006 and September 2008, approximately 1.6 million mangrove seedlings and/or propagules were planted across 47 projects (mostly in separate sites). The study does not distinguish between the effects of planting propagules and seedlings. Eight species were planted (mostly Rhizophora spp.) on mudflats, in degraded mangroves, in former

12. Habitat restoration and creation
469
aquaculture ponds, and along water channels. Individuals were generally planted 0.3–1.0 m apart, but sometimes with double plantings at a single point. At some time within 15 months of planting (not clearly reported), survival rates were checked for 20% of the planted individuals in each project.
A replicated study in 2012–2014 on the coast of Manus Island, Papua New Guinea (15) reported that planted mangrove trees survived in 19 of 33 cases (species x site combinations). In these cases, the number of trees present was 4–102% of the number known to be planted; additional undocumented planting by local communities explains values >100%. Some planted propagules or saplings survived in seven of nine sites. All five planted species survived in at least one site. Methods: Between June 2012 and April 2014, more than 8,300 seedlings and ungerminated propagules of five mangrove species were planted in nine sites around Manus Island (1–9 sites/species). The study does not distinguish between the effects of planting propagules and seedlings. The number of propagules or seedlings introduced was recorded for about half of the area planted (where local communities were guided by NGO staff) but not for the other half (where local communities planted independently). Six of the nine sites had recently contained mangrove forests, but the other three had never been forested. Seedlings originating from planting efforts were counted in April 2014.
A 2016 systematic review of mangrove restoration studies around the world (16) reported a 51% average survival rate of sown mangrove propagules and planted mangrove trees. Survival ranged from 0% (17 of 106 cases) to ≥95% (15 of 106 cases). The average survival rate was 56% in developed countries and 45% in developing countries. Methods: The review was based on 106 cases (e.g. different species, environments or intervention methods) from 28 publications and at least 17 countries, 104 of which involved sowing or planting mangroves (see Appendix to original paper). Literature searches were carried out in 2014. Sowing and planting were sometimes into environments thought to be suitable (but sometimes into hostile environments) and were sometimes preceded by site preparation (but sometimes not). Study duration ranged from one month to 21 years. Survival was sometimes estimated from other metrics, such as cover. The review does not separate results for survival of sown propagules vs planted seedlings. The review includes studies (4) and (10) summarized above.
A replicated, before-and-after study in 2012–2013 in a brackish/saline estuarine site with mudflats and existing mangroves in southeast China (17) reported 38–100% germination of planted mangrove propagules. Germination rates depended on the combination of species and the habitat in which it was planted. For example, the germination rate of non-native mangrove apple Sonneratia alba ranged from 67% amongst the oldest, darkest forest to 100% on bare mudflats. Three native mangrove species had germination rates of 38–90%, but only one (river mangrove Aegiceras corniculatum) was clearly affected by the habitat. Methods: In June 2012, propagules of four mangrove tree species were planted into four habitats: a tidal mudflat, a 2-year-old mangrove apple plantation, a 4-year-old mangrove apple plantation, and an 8-year-old mangrove apple plantation. Twelve sets of 30 propagules were sown for each species (3 sets/species/habitat). Germination was monitored daily for 20 days.
A replicated study in 2012–2014 of 23 coastal sites in Sri Lanka (18) reported 0–78% survival of planted mangrove propagules and seedlings after ≥5 years, and that only 17–20% of the area planted with mangroves was forested after 8–10 years. In 9 of the 23 sites, no mangrove trees were alive five or more years after planting. In 7 of

12. Habitat restoration and creation
470
the 14 sites with some surviving trees, survival rates were <10%. Only three sites supported >50% survival. Average survival rates were higher in sites where technical guidance was used (46%) than where it was not used (0%), and in sites with post-planting care of seedlings (13%) than without (0%). The study suggests that mangroves were planted into unsuitable environments in many sites. Finally, the study reports that of 1,000–1,200 ha of mangrove forest planted in these sites since 2004, only 200–220 ha was present 8–10 years later. Methods: Between 2012 and 2014, the number of surviving, healthy mangrove trees was counted or estimated in 23 coastal sites around Sri Lanka. In eight sites, the tidal influence was “negligible”. Mangrove propagules and seedlings (97% of which were Rhizophora spp.) were planted between 1996 and 2009, with multiple planting attempts in all sites. In 10 sites, mangroves were cared for after planting. The study does not distinguish between the effects of planting propagules and seedlings.
(1) Scherrer P., Blasco F. & Imbert D. (1989) Etude experimentale in situ de la toxicite du petrole brut et de 2 additifs envers les plantules de Rhizophora mangle (In situ experimental study of the toxicity of crude oil and 2 additives to Rhizophora mangle seedlings). Environmental Technology Letters, 10, 323–332.
(2) Komiyama A., Santiean T., Higo M., Patanaponpaiboon P., Kongsangchai J. & Ogino K. (1996) Microtopography, soil hardness and survival of mangrove (Rhizophora apiculata BL.) seedlings planted in an abandoned tin-mining area. Forest Ecology and Management, 81, 243–248.
(3) Patterson S., McKee K. & Mendelssohn I.A. (1997) Effects of tidal inundation and predation on Avicennia germinans seedling establishment and survival in a sub-tropical mangal/salt marsh community. Mangroves and Salt Marshes, 1, 103–111.
(4) Day S., Streever W.J. & Watts J.J. (1999) An experimental assessment of slag as a substrate for mangrove rehabilitation. Restoration Ecology, 7, 139–144.
(5) Salgado Kent C.P. & Lin J. (1999) A comparison of Riley encased methodology and traditional techniques for planting red mangroves (Rhizophora mangle). Mangroves and Salt Marshes, 3, 215–225.
(6) Elster C. (2000) Reasons for reforestation success and failure with three mangrove species in Colombia. Forest Ecology and Management, 131, 201–214.
(7) McKee K.L. & Faulkner P.L. (2000) Restoration of biogeochemical function in mangrove forests. Restoration Ecology, 8, 247–259.
(8) Reyes Chargoy M.A. & Tovilla Hernández C. (2002) Restauración de áreas alteradas de manglar con Rhizophora mangle en la Costa de Chiapas (Restoration of altered mangrove areas with Rhizophora mangle on the Chiapas coast). Madera y Bosques, 8, 103–114.
(9) Tamaei S. (2004) ヒルギダマシ植林による砂漠沿岸緑化に関する研究: 養殖廃水を利用したヒ
ルギダマシ植林と形成された生態系 (Study of gray mangrove (Avicennia marina) afforestation for greening of desert coasts: afforestation with gray mangroves combined with aquaculture waste water for ecosystem establishment). Japanese Journal of Ecology, 54, 35–46.
(10) Proffitt C.E. & Devlin D.J. (2005) Long-term growth and succession in restored and natural mangrove forests in southwestern Florida. Wetlands Ecology and Management, 13, 531–551.
(11) McKee K.L., Rooth J.E. & Feller I.C. (2007) Mangrove recruitment after forest disturbance is facilitated by herbaceous species in the Caribbean. Ecological Applications, 17, 1678–1693.
(12) Samson M.S. & Rollon R.N. (2008) Growth performance of planted mangroves in the Philippines: revisiting forest management strategies. Ambio, 37, 234–240.
(13) Shafer D.J. & Roberts T.H. (2008) Long-term development of tidal mitigation wetlands in Florida. Wetlands Ecology and Management, 16, 23–31.
(14) Wibisono I.T.C. & Sualia I. (2008) An assessment of lessons learnt from the “Green Coast Project” in Nanggroe Aceh Darussalam (NAD) Province and Nias Island, Indonesia (Period 2005–2008). Wetlands International, Bogor.
(15) Arihafa A. (2016) Factors influencing community mangrove planting success on Manus Island, Papua New Guinea. Conservation Evidence, 13, 42–46.
(16) Bayraktarov E., Saunders M.I., Abdullah S., Mills M., Beher J., Possingham H.P., Mumby P.J. & Lovelock C.E. (2016) The cost and feasibility of marine coastal restoration. Ecological Applications, 26, 1055–1074.
(17) Peng Y., Diao J., Zheng M., Guan D., Zhang R., Chen G. & Lee S.Y. (2016) Early growth adaptability of four mangrove species under the canopy of an introduced mangrove plantation: implications for restoration. Forest Ecology and Management, 373, 179–188.

12. Habitat restoration and creation
471
(18) Kodikara K.A.S., Mukherjee N., Jayatissa L.P., Dahdouh-Guebas F. & Koedam N. (2017) Have mangrove restoration projects worked? An in-depth study in Sri Lanka. Restoration Ecology, 25, 705–716.
12.25 Transplant or replace blocks of vegetation
Background
This intervention involves the introduction of vegetation as blocks or large sods, containing multiple individual plants. This technique might be used to introduce particular species to an already vegetated site, or to speed up the revegetation of a currently bare site. Blocks may be cut from a focal site, kept to one side during a disturbance, then replaced. Alternatively, blocks may be sourced from a separate donor site. When moving blocks from a donor site, it may be necessary to excavate the recipient site to avoid raising the soil surface.
CAUTION: This intervention inevitably causes damage to any donor site. Also, transplanted blocks could contain invasive plants, animals or microorganisms. A possible solution to these problems is to use soil from healthy marshes or swamps that are earmarked for destruction. Using local donor sites could minimize the spread of invasive species, and make use of communities adapted to local conditions.
Effects of this intervention could be measured for the sods or vegetation overall (e.g. overall community composition of sods, or survival of sods) or for individual species or plants within the sods (e.g. height of the dominant grass species).
Related interventions: Directly plant whole plants (12.22); Transplant or replace wetland soil (12.26); interventions to complement planting (Chapter 13).
12.25.1 Transplant or replace blocks of vegetation: freshwater marshes
Four studies evaluated the effects, on vegetation, of transplanting or replacing blocks of freshwater marsh vegetation. Three studies were in the USA2–4. One study was in the UK1.
VEGETATION COMMUNITY
Community composition (1 study): One replicated, paired, controlled study in rewetted marshes in the USA2 found that plots of transplanted marsh vegetation contained a plant community characteristic of wetter conditions than plots without transplants after one growing season – but not after two.
Overall richness/diversity (2 studies): One replicated, before-and-after study in the UK1 reported that plant species richness within transplanted freshwater marsh vegetation was similar before transplanting and six years later. There was a temporary increase in richness after one year. One replicated, paired, controlled study in rewetted freshwater marshes in the USA2 found that plots of transplanted marsh vegetation contained more wetland plant species than plots without transplants after one growing season – but that there was no significant difference after two.
VEGETATION ABUNDANCE
Overall abundance (1 study): One replicated, paired, controlled study in rewetted freshwater marshes in the USA2 found that plots of transplanted marsh vegetation had greater cover of wetland plants than plots without transplants, after 1–2 growing seasons.
Individual species abundance (2 studies): One replicated, site comparison study in a wet prairie in the USA4 found that after three growing seasons, the density of prairie cordgrass Spartina

12. Habitat restoration and creation
472
pectinata stems was lower in transplanted sods than in pristine or source prairies. One before-and-after study of transplanted freshwater marsh vegetation in the UK1 reported changes in the frequency of individual plant species from before to six years after transplanting.
VEGETATION STRUCTURE
Height (1 study): One replicated, site comparison study in a wet prairie in the USA4 found that after three growing seasons, prairie cordgrass Spartina pectinata was shorter in transplanted sods than in pristine or source prairies.
Diameter/perimeter/area (2 studies): Two studies (one replicated) in wet prairies in the USA3,4 found that the average area of small transplanted sods (≤0.28 m2 initial size) increased over 3–4 growing seasons. One of the studies4 transplanted larger sods (0.65 m2 initial size) and reported that their average area decreased over 3–4 growing seasons.
OTHER
Survival (2 studies): Two studies (one replicated) in wet prairies in the USA3,4 reported ≥90% survival of transplanted sods of wet prairie vegetation after 3–4 growing seasons.
A before-and-after study in 1980–1986 of a patch of freshwater marsh vegetation in England, UK (1) reported that transplanting vegetation from one site to another (then grazing, cutting and pulling up weeds) had little long-term effect on plant species richness. Unless specified, statistical significance was not assessed. The vegetation contained 54 species before transplanting and 49 species six years after. Thirty-six species were present both before and after transplanting. Small-scale richness was significantly higher one year after transplanting (16 species/m2) than before (11 species/m2), but returned to approximately 11 species/m2 after six years. The most frequently recorded species before intervention were clustered dock Rumex conglomeratus (in 100% of quadrats), creeping buttercup Ranunculus repens (92%) and yellow iris Iris pseudacorus (75%). The most frequently recorded species after intervention were tufted grass Holcus lanatus (92%) and yellow iris (83%). Methods: In late 1980, around 1.5 ha of marsh vegetation (along with 2.8 ha of other vegetation) was transplanted from one site earmarked for gravel mining. The new site, 400 m away, was excavated to suitable elevations, then 6-m2 blocks of vegetation and soil were transplanted. Post-transplant management involved annual grazing, pulling up docks Rumex spp. and intermittent cutting. Pumps maintained a high water table. The marsh vegetation was surveyed in twelve 1-m2 quadrats before (October 1980) and after (October 1981 and 1986) intervention.
A replicated, paired, controlled study in 1992–1993 in five freshwater marshes undergoing restoration in New York State, USA (2) found that plots of transplanted marsh vegetation contained a more wetland-characteristic plant community, with more and greater cover of wetland species, than plots without transplants for up to two growing seasons. After one growing season, transplanted plots contained a plant community more characteristic of wetland conditions than plots without transplants (data reported as a wetland indicator index). The transplanted plots also contained more and greater cover of wetland plant species (3.7 species/plot; 50% cover) than plots without transplants (2.0 species/plot; 19% cover). After two growing seasons, the transplanted plots still had greater cover of wetland plants (99%) than plots without transplants (54%), but the other metrics did not significantly differ between treatments (e.g. 5.1 vs 2.8 wetland plant species/plot). Methods: In May 1992, thirty 0.25-m2 plots were established across five recently rewetted sites (drained for ≥40 years previously). In 15 plots (three plots/site), 15 cm of topsoil was removed and

12. Habitat restoration and creation
473
replaced with sods of soil and vegetation from nearby remnant marshes. The other 15 plots (three plots/site) were left undisturbed. Plant species and cover were recorded in autumn 1992 and 1993.
A study in 1994–1997 in a floodplain wet prairie in Kansas, USA (3) reported >90% survival of transplanted wetland vegetation sods after four growing seasons, and found that the area of surviving sods increased. After four growing seasons, 97 of 107 transplanted sods were still alive. Two sods were confirmed as dead. The other eight sods were not relocated. Surviving sods dominated by prairie cordgrass Spartina pectinata covered 1.6 m2 on average and surviving sods dominated by spikerush Eleocharis macrostachya covered 26 m2 on average. All sods were 0.28 m2 when transplanted. For both species, the final area of sods was affected by elevation/ moisture levels (see original paper). Methods: In spring 1994, sods of perennial wet prairie vegetation were cut from a wet prairie using a mechanical tree spade. The sods were placed in a newly created wet prairie site, with similar soils to the donor site, within one hour. Survival of all sods, and the area of 27 cordgrass-dominated and 18 spikerush-dominated sods, were monitored each October between 1994 and 1997.
A replicated, site comparison study in 1999–2001 in a floodplain wet prairie in Kansas, USA (4) reported 90% survival of transplanted prairie cordgrass Spartina pectinata sods over three growing seasons, found that smaller sods increased in size and area, and found that transplanted cordgrass was shorter and less dense than in reference prairies. Sixty plots were planted with 1–20 cordgrass sods, with a total area of about 0.65 m2/plot. After three growing seasons, 90% of all transplanted cordgrass sods contained at least one living stem (range 73–100% for different initial sod sizes and planting elevations). The total area of prairie cordgrass had increased in plots planted with small sods (to 3.6 m2/plot) or medium sods (to 1.0 m2/plot) but had decreased in plots planted with one large sod (to 0.4 m2/plot). This reflected changes in the average size of individual sods (see original paper for data). After three growing seasons, prairie cordgrass was shorter and less dense in planted sods (127 cm tall; 91 stems/m2) than in pristine or source prairies (184–192 cm tall; 257–303 stems/m2). Methods: In June 1999, five-hundred cordgrass sods were transplanted from roadside areas to a recently restored wet prairie (historically farmed, sown with mixed prairie seeds in April 1999). Twenty 400-m2 plots were planted with each sod number/size combination (twenty 0.03-m2 sods; four 0.17-m2 sods; or one 0.65-m2 sod). Plots had varying elevations (moisture levels). Sods were monitored in September 1999, 2000 and 2001. Cordgrass height and density were also surveyed in nearby pristine wet prairies and source roadside prairies.
(1) Worthington D.R. & Helliwell T.R. (1987) Transference of semi-natural grassland and marshland onto newly created landfill. Biological Conservation, 41, 301–311.
(2) Brown S.C. & Bedford B.L. (1997) Restoration of wetland vegetation with transplanted wetland soil: an experimental study. Wetlands, 17, 424–437.
(3) Fraser A. & Kindscher K. (2001) Tree spade transplanting of Spartina pectinata (Link) and Eleocharis macrostachya (Britt.) in a prairie wetland restoration site. Aquatic Botany, 71, 297–304.
(4) Fraser A. & Kindscher K. (2005) Spatial distribution of Spartina pectinata transplants to restore wet prairie. Restoration Ecology, 13, 144–151.
12.25.2 Transplant or replace blocks of vegetation: brackish/salt marshes
One study evaluated the effects, on vegetation, of transplanting or replacing blocks of brackish/ salt marsh vegetation. The study was in Australia.

12. Habitat restoration and creation
474
VEGETATION COMMUNITY
Community composition (1 study): One replicated, controlled, site comparison study in an estuarine salt marsh in Australia1 found that areas where sods of saltwater couch Sporobolus virginicus were transplanted had a similar overall plant community composition to areas without transplants, after 3–4 years. The plant community in the transplanted areas was >70% similar to natural areas in only 4 of 12 comparisons.
VEGETATION ABUNDANCE
VEGETATION STRUCTURE
A replicated, controlled, site comparison study in 2004–2007 of four areas of an estuarine salt marsh in New South Wales, Australia (1) found that transplanting sods of the dominant marsh plant saltwater couch Sporobolus virginicus had no significant effect on plant community composition. After 3–4 years, the overall plant community composition was statistically similar in degraded areas planted with saltwater couch sods and degraded areas that had not been planted (data reported as a graphical analysis). Where saltwater couch was not transplanted, it spread from remnant patches in and around the study area. In 4 of 12 comparisons over three years, planted areas contained a plant community that was >70% similar to natural reference areas (vs 2 of 12 comparisons for unplanted areas). Methods: Between 2003 and mid-2004, four degraded areas of tidal salt marsh around a lagoon were restored using multiple interventions, including fencing to exclude vehicles and filling eroded patches with sediment. Two of these degraded areas were also planted with sods of saltwater couch (100 cm2; 1 m apart) cut from nearby natural marshes. Two additional areas of natural, undisturbed salt marsh were used for comparison. Plant species and cover were surveyed six times between July 2004 (after intervention) and April 2007. Each survey used fifty 1-m2 quadrats/area.
(1) Green J., Reichelt-Brushett A. & Jacobs S.W.L. (2009) Re-establishing a saltmarsh vegetation structure in a changing climate. Ecological Management & Restoration, 10, 20–30.
12.26 Transplant or replace wetland soil
Background
Loose soil can be transplanted from a healthy marsh or swamp to one that is being created or restored. Soil could simply be added to a recipient site, or be used to replace material in the recipient site.
Soil transplants can be useful to introduce three key features of a healthy marsh or swamp (Anderson & Cowell 2004): (1) a chemically and physically suitable substrate for growth of wetland plants, (2) a mixture of soil organisms such as bacteria, fungi and invertebrates, and (3) a mixture of wetland vegetation (e.g. as seeds, roots, tubers or rhizomes). The vegetation within soil transplants may be more taxonomically and genetically diverse than that which could be introduced, given a fixed budget, by manual planting. However, note that excavating, moving and spreading soil can be expensive (Clewell 1981; Brown & Bedford 1997).
CAUTION: This intervention inevitably causes damage to any donor site. Also, transplanted soil could contain invasive plants, animals or microorganisms. A possible

12. Habitat restoration and creation
475
solution to these problems is to use soil from healthy marshes or swamps that are earmarked for destruction. Using local donor sites could minimize the spread of invasive species, and make use of communities adapted to local conditions.
Other published names for this intervention include “salvaged marsh surface replacement”, transplanting “seed banks” and “mulching”. We restrict the latter term to the addition of organic matter, such as domestic compost or seaweed, to the ground surface (see Section 12.19).
Related interventions: Backfill canals or trenches (5.1); Introduce vegetation fragments without adding soil (12.23); Introduce seeds or propagules without adding soil (12.24); Transplant or replace blocks of vegetation (12.25); interventions to complement planting (Chapter 13).
Anderson C.J. & Cowell B.C. (2004) Mulching effects on the seasonally flooded zone of west-central Florida, USA wetlands. Wetlands, 24, 811–819.
Brown S.C. & Bedford B.L. (1997) Restoration of wetland vegetation with transplanted wetland soil: an experimental study. Wetlands, 17, 424–437.
Clewell A.F. (1981) Vegetational restoration techniques on reclaimed phosphate strip mines in Florida. Wetlands, 1, 158–170.
12.26.1 Transplant or replace wetland soil: freshwater marshes
Ten studies evaluated the effects, on vegetation, of transplanting wetland soil to restore or create freshwater marshes. Nine studies were in the USA1–4,6,7a,7b,8,9. One study was in Guam5. Two studies7a,7b were in the same region but used different sites.
VEGETATION COMMUNITY
Community composition (3 studies): Two replicated, controlled studies in rewetted marshes in the USA7a,7b found that areas amended with wetland soil contained a plant community characteristic of wetter conditions than unamended plots after one growing season – but not after two. One replicated, randomized, controlled study in a recently excavated marsh in the USA8 found that amended and unamended plots contained a plant community of similar overall wetness after both one and two growing seasons.
Overall richness/diversity (10 studies): Eight studies (including four at least replicated and controlled) in freshwater marshes in the USA1–4,6,7b,8,9 reported that areas amended with wetland soil had greater plant richness1–4,7b,8,9 and/or diversity6,8 than unamended areas1–4,7b,8,9 and/or nearby natural marshes1,6. One replicated, paired, controlled study in rewetted freshwater marshes in the USA7a found that plots amended with sieved marsh soil contained a similar number of wetland plant species to unamended plots, after 1–2 growing seasons. One before-and-after study of freshwater pool in Guam5 simply quantified plant species richness one year after adding wetland soil (along with other interventions).
Characteristic plant richness/diversity (1 study): One replicated, randomized, paired, controlled study in a freshwater marsh in the USA4 reported that plots amended with wetland soil developed a greater richness of wetland-characteristic plant species than unamended plots, at the end of the growing season.
VEGETATION ABUNDANCE
Overall abundance (6 studies): Six controlled studies in freshwater marshes in the USA3,4,7a,7b,8,9 reported that plots amended with wetland soil typically contained more vegetation overall than unamended plots, after 1–2 growing seasons. This was true for cover3,7a,7b,8 and biomass4,9, but not stem density8.

12. Habitat restoration and creation
476
Individual species abundance (7 studies): Seven studies (including one replicated, randomized, paired, controlled, site comparison) in freshwater marshes, meadows and pools in the USA3,4,6,7b,8,9 and Guam5 quantified the effect of this intervention (sometimes5 along with others) on the abundance of individual plant species. Results were mixed and likely depended on the composition of the donor wetland.
VEGETATION STRUCTURE
A controlled, site comparison study in 1978–1980 of four freshwater marshes in Florida, USA (1) reported that an excavated marsh amended with wetland soil contained more plant species than unamended and natural marshes, and more marsh-characteristic plant species than the unamended marsh. Statistical significance was not assessed. After two years, the amended marsh contained 95 vascular plant species (vs 70 in the unamended marsh and 76–88 in natural marshes). The amended marsh also contained 17 marsh plant species (i.e. present in at least one natural marsh) that were not present in the unamended marsh. Methods: In summer 1978, two 0.16-ha depressions were excavated in rangeland. Topsoil and vegetation from a nearby natural marsh was added to one depression (30 cm depth) but not the other. The whole site was seeded with pioneer herbs before topsoil addition (to prevent erosion) and limed and fertilized after. In summer 1980, plant species were recorded in each excavated marsh and two natural marshes, along a transect extending from the centre to the edge of each.
A before-and-after study in the 1980s in a marsh developing on reclaimed mining land in Florida, USA (2) reported that following the addition of soil from a natural marsh, the number of plant species increased. Before soil was added, the marsh contained 45 plant species. One year after soil was added, the marsh contained 88 plant species, “many” of which occurred in the donor sites. Methods: In the early 1980s, a 5-cm-thick layer of topsoil from natural marshes was added to a developing marsh. The site had been planted with dry pasture grasses four years earlier, but had since developed marsh vegetation because it was kept wet by seepage from a settling pond. The study does not report precise dates and details of monitoring.
A controlled study in 1982–1984 in a marsh undergoing restoration in Florida, USA (3) reported that an area amended with wetland soil typically had higher plant species richness and total vegetation cover than an unamended area, and that the areas were dominated by different plant species. Statistical significance was not assessed. Over two years, more plant species were recorded in the amended area than the unamended area in six of six comparisons (amended: 34–48 species/392 m; unamended: 14–30 species/276 m; note different transect lengths). Total vegetation cover was higher in the amended area in four of six comparisons (for which amended: 84–105%; unamended: 33–62%; other comparisons lower in amended area). From the second year after intervention, pickerelweed Pontederia cordata dominated the amended marsh (32–64% cover) but broadleaf cattail Typha latifolia was typically the most abundant species in the unamended marsh (17–60% cover). Methods: The study site was a surface-mined marsh undergoing restoration through rewetting, reprofiling and pool excavation. Part of the site was topped with a 2–10 cm layer of soil from a nearby wetland. Restoration was completed in May 1982. Between autumn 1982 and summer 1984, plant species and their cover were recorded along transects (crossing zones of emergent and floating/submerged vegetation, but otherwise randomly placed). There were three transects (total length 392 m) in the amended part of the site and three (total length 276 m) in the unamended part.

12. Habitat restoration and creation
477
A replicated, randomized, paired, controlled, site comparison study in 1989–1990 in a created freshwater marsh in Texas, USA (4) reported that plots amended with soil from a donor marsh contained more plant species, more wetland-characteristic plant species and typically more plant biomass than unamended plots. Unless specified, statistical significance was not assessed. Mature vegetation in amended plots contained 17–28 plant species/0.25 m2 (vs unamended: 6–14) and 8–13 plant species/0.25 m2 that “prefer wet or semi-wet soils” (vs unamended: 1–3). In three of four comparisons, amended plots contained significantly more above-ground vegetation biomass (for which amended: 99–769 g/m2; unamended: 5–83 g/m2; other comparison no significant difference). Only 12 of the 20 plant taxa present in the donor site were present in amended plots, but they comprised 96% of the biomass in amended plots (see original paper for data on biomass of individual plant species). Methods: In February 1990, one hundred and twenty 0.25-m2 plots were established in a created marsh (formerly grassland), in four blocks of 30 according to moisture level. In eighty plots (20 plots/block), the top 6–7 cm of soil were removed and replaced with soil from the top 10–15 cm of a nearby donor marsh. The donor soil had been stockpiled over winter. The other 40 plots (10 plots/block) were left undisturbed. Later in 1990, when emergent vegetation was “mature”, it was cut from each plot then identified, dried and weighed. Vegetation in the donor marsh was surveyed along transects perpendicular to the shoreline in October 1989.
A before-and-after study in 1992–1993 on a tourist resort in Guam (5) reported that a freshwater pool created by excavation, lining with wetland soil and planting herb species contained two of the four planted species after one year, and four additional species. The two planted species present after one year were spikerush Eleocharis dulcis (60% cover) and rusty flatsedge Cyperus oderatus (<1% cover). All planted taro Colocasioa esculenta died; the study suggests it was “excessively flooded”. Planted water lettuce Pistia stratioides was deliberately removed after five months, when it had reached 20% cover. Four additional species were present after one year: two rushes, one grass and one forb (<1–10% cover). Methods: In January 1992, a 600-m2 wetland was excavated on a natural valley slope, lined with wetland soil (30 cm deep) and planted with four herbaceous species (120 spikerush, an unclear number of rusty flatsedge, 20 taro, 5% cover of water lettuce). The study does not distinguish between the effects of these interventions on non-planted vegetation. The wetland was fed by ground and surface water, and had a stable 20–60 cm water depth. Final vegetation cover was estimated in January 1993.
A replicated, site comparison study in 1991 of three mixed sedge meadows/freshwater marshes in Wisconsin, USA (6) found that wetlands amended with peat from a donor meadow/marsh had higher plant diversity than a natural wetland, and different cover of some key plant species. Statistical significance was not assessed. After five years, both amended wetlands had higher plant diversity than a nearby natural wetland (data reported as a diversity index). Taxa with different cover in amended and natural wetlands included Canadian reedgrass Calamagrostis canadensis (amended: 5–13%; natural: 34%), sedges Carex spp. (amended: 2–12%; natural: 25%) and cattails Typha spp. (amended: 5–13%; natural: 2%). The study reported differences between the amended and natural wetlands in peat depth and water levels, which may have been related to differences in vegetation. Methods: In 1986, sand was removed from two former wetlands and replaced with peat from the surface of a nearby meadow/marsh. The deposited peat formed a layer 5–180 cm thick. In 1991, plant species and their cover were estimated in 1-m2 quadrats along

12. Habitat restoration and creation
478
transects: approximately 50 quadrats in each of the two amended wetlands (0.2 ha), and 19 quadrats in an adjacent, undisturbed wetland (<0.01 ha).
A replicated, controlled study in 1992–1993 in five freshwater marshes undergoing restoration in New York State, USA (7a) found that plots amended with sieved marsh soil had greater cover of wetland plant species over two growing seasons than unamended plots, and a more wetland-characteristic plant community in the first growing season. Over two growing seasons after intervention, amended plots had greater total cover of wetland plant species (28–96%) than unamended plots (19–54%). However, the number of wetland plant species never significantly differed between amended plots (3.0–3.9 species/plot) and unamended plots (2.0–2.8 species/plot). The overall plant community was more characteristic of wetland conditions in amended plots than unamended plots after one growing season, but there was no significant difference between treatments after two (data reported as a wetland indicator index). Methods: In May 1992, twenty-one 0.25-m2 plots were established across five recently rewetted sites (drained for ≥40 years previously). In six plots (three plots in each of two sites), 15 cm of topsoil was removed and replaced with sieved soil (1 cm mesh) from nearby remnant marshes. The other 15 plots (three plots/site) were left undisturbed. Plant species and cover were recorded in autumn 1992 and 1993.
A replicated, paired, controlled study in 1993–1995 in five freshwater marshes undergoing restoration in New York State, USA (7b) found that plots amended with wetland soil typically contained more and greater cover of wetland plant species than unamended plots over two years – and contained a more wetland-characteristic plant community after one. Over two years after intervention, amended plots contained more wetland plant species than unamended plots in six of six comparisons (amended: 6.7–9.1; unamended: 1.4–4.7 species/plot). Amended plots had greater total cover of wetland plants in five of six comparisons (for which amended: 80–193%; unamended: 5–96%; other comparison no significant difference). The overall plant community was more characteristic of wetland conditions in amended plots than unamended plots after one year, but there was no significant difference between treatments after two (data reported as a wetland indicator index). After two years, cover of cattails Typha spp. was low, and statistically similar, in amended plots (1–10%) and unamended plots (0–2%). Methods: In summer 1993, soil from remnant marshes in drainage ditches was spread onto five degraded wetlands (drained for ≥40 years). In autumn 1993, all five sites were rewetted. Plant species and cover were recorded in 1994 and 1995 (precise date not reported), in 54 quadrats in areas amended with wetland soil and 39 quadrats in nearby unamended areas. Quadrats spanned a range of elevations.
A replicated, randomized, controlled study in 1991–1992 in an excavated freshwater wetland in Pennsylvania, USA (8) found that plots amended with wetland soil contained a different plant community to unamended plots with more wetland-characteristic plants, greater overall vegetation cover and higher plant richness and diversity. After both one and two growing seasons, amended and unamended plots shared <14% of plant species. The plant community was more characteristic of wetland conditions in amended plots, although not significantly so (data reported as a wetland indicator index). Cover of wetland-characteristic plants was higher in amended plots (40–45%) than unamended plots (3–5%). Amended plots also had greater overall vegetation cover (amended: 83–96%; unamended: 27–45%), contained more plant species (amended: 15–19; unamended: 7 species/3 m2) and had

12. Habitat restoration and creation
479
higher plant diversity (data reported as a diversity index). Total stem density did not significantly differ between treatments (amended: 97–133; unamended: 78–86 stems/0.25 m2). For data on the frequency of individual species, see original paper. Methods: In May 1991, soil from the top 15 cm of a mature marsh was mixed into the surface of four 6 x 6 m plots in a recently excavated wetland. Four additional plots were not amended with wetland soil. Vegetation was surveyed in August 1991 and 1992, in twelve 0.25-m2 quadrats/plot.
A replicated, controlled study in 1999–2001 of 12 excavated wetlands in Wyoming, USA (9) found that wetlands amended with marsh soil developed vegetation cover, whilst unamended wetlands did not. Amended wetlands contained three plant species after one year and eight plant species after two years. Of 40 quadrats surveyed in each amended wetland, 3–6 contained vegetation after one year and 1–22 contained vegetation after two years. At this point, plant biomass was mostly alkali bulrush Scirpus maritimus (142g; 51% of total) or cattails Typha spp. (96g; 34% of total). No plants were recorded in unamended wetlands. Methods: In late 1999, twelve wetlands (<1 ha each) were excavated in clay soils. A 10–15 cm thick layer of soil from a nearby marsh was spread around the edge of six wetlands (water depth: 0–100 cm). The other six wetlands did not receive soil. In September 2000 and 2001, all vegetation was collected from forty 0.25-m2 quadrats/wetland then identified, dried and weighed. Quadrats were placed along transects perpendicular to the shoreline.
(1) Swanson L.J. Jr. & Shuey A.G. (1980) Freshwater marsh reclamation in west central Florida. Proceedings of the Annual Conference on Restoration and Creation of Wetlands 7, Tampa, Florida, 51–61.
(2) Clewell A.F. (1981) Vegetational restoration techniques on reclaimed phosphate strip mines in Florida. Wetlands, 1, 158–170.
(3) Erwin K.L. & Best G.R. (1985) Marsh community development in a Central Florida phosphate surface-mined reclaimed wetland. Wetlands, 5, 155–166.
(4) McKnight S.K. (1992) Transplanted seed bank response to drawdown time in a created wetland in East Texas. Wetlands, 12, 79–90.
(5) Ritter M.W. & Sweet T.M. (1993) Rapid colonization of a human-made wetland by Mariana common moorhen on Guam. Wilson Bulletin, 105, 685–687.
(6) Ashworth S.M. (1997) Comparison between restored and reference sedge meadow wetlands in south-central Wisconsin. Wetlands, 17, 518–527.
(7) Brown S.C. & Bedford B.L. (1997) Restoration of wetland vegetation with transplanted wetland soil: an experimental study. Wetlands, 17, 424–437.
(8) Stauffer A.L. & Brooks R.P. (1997) Plant and soil responses to salvaged marsh surface and organic matter amendments at a created wetland in central Pennsylvania. Wetlands, 17, 90–105.
(9) McKinstry M.C. & Anderson S.H. (2005) Salvaged-wetland soil as a technique to improve aquatic vegetation at created wetlands in Wyoming, USA. Wetlands Ecology and Management, 13, 499–508.
12.26.2 Transplant or replace wetland soil: brackish/salt marshes
We found no studies that evaluated the effects on vegetation, of transplanting wetland soil to restore or create brackish/salt marshes.
This means that we have not yet found any studies that have directly evaluated this intervention during our systematic journal and report searches. Therefore we have no evidence to indicate whether or not the intervention has any desirable or harmful effects.
12.26.3 Transplant or replace wetland soil: freshwater swamps
We found no studies that evaluated the effects on vegetation, of transplanting wetland soil to restore or create freshwater swamps.

12. Habitat restoration and creation
480
This means that we have not yet found any studies that have directly evaluated this intervention during our systematic journal and report searches. Therefore we have no evidence to indicate whether or not the intervention has any desirable or harmful effects.
12.26.4 Transplant or replace wetland soil: brackish/saline swamps
We found no studies that evaluated the effects on vegetation, of transplanting wetland soil to restore or create brackish/saline swamps.
This means that we have not yet found any studies that have directly evaluated this intervention during our systematic journal and report searches. Therefore we have no evidence to indicate whether or not the intervention has any desirable or harmful effects.

481
13. Actions to complement planting
Background
This chapter highlights interventions that can be used to complement deliberate introduction of desirable, emergent, wetland vegetation. Studies in this chapter must test the effects of these interventions, so typically compare plots or areas where vegetation has been introduced with and without an intervention intended to aid its performance (e.g. germination, survival or growth). The helping intervention could be applied before planting (e.g. adding fertilizer to a hole immediately before planting; preparing a site by clearing competing vegetation) and/or after planting (e.g. adding a herbivore guard around the plant; adding lime each spring for five years after planting).
Studies in this chapter typically measure the response of the planted vegetation to the helping intervention. In some cases, the intervention might affect non-planted vegetation as well or instead (e.g. fertilization might stimulate growth of seeds already in the soil, not just planted seeds).
Generally, this chapter includes studies performed in greenhouses, laboratories or nurseries if they test an intervention as it would be used in the field (e.g. adding fertilizer). Studies that change environmental conditions in other ways (e.g. altering water level by placing plant pots at different depths) are not summarized as evidence.
Related chapters: other chapters throughout the synopsis consider interventions in this chapter used without introducing vegetation (mainly Chapter 12). Summaries in other chapters may mention the effects of interventions from Chapter 13 as implementation options within the overall effect of planting, but the effects are described in more detail in this chapter.
Modify physical habitat
13.1 Raise water level (before/after planting)
We found no studies that evaluated the effects, on vegetation, of raising the water level in areas planted with emergent marsh/swamp plants.
This means that we have not yet found any studies that have directly evaluated this intervention during our systematic journal and report searches. Therefore we have no evidence to indicate whether or not the intervention has any desirable or harmful effects.
Background
Drainage or water extraction, within or near to a focal wetland, can create conditions that are too dry to support healthy emergent vegetation. To complement planting efforts, the water level/table could be raised using techniques such as techniques such as: blocking drainage ditches; building raised embankments, berms or levees to retain water; switching off drainage pumps; installing or widening culverts under roads;

13. Actions to complement planting
482
ceasing groundwater extraction; removing dams upstream of the focal site; and reprofiling or diverting river channels.
The summarized evidence does not include general guidance about plant species’ moisture preferences, or laboratory studies of performance under different levels of soil moisture. To be summarized as evidence for this intervention, studies must have experimentally tested the effect of raising the water level to complement planting in the field.
Related interventions: Raise water level to restore degraded marshes or swamps (8.1); Raise water level to restore/create marshes or swamps from other land uses (12.4); Irrigate before/after planting (13.4); Actively manage water level after planting (13.5); Reprofile/relandscape before planting (13.6); Remove surface soil/sediment before planting (13.8).
13.2 Lower water level (before/after planting)
We found no studies that evaluated the effects, on vegetation, of lowering the water level in areas planted with emergent marsh/swamp plants.
This means that we have not yet found any studies that have directly evaluated this intervention during our systematic journal and report searches. Therefore we have no evidence to indicate whether or not the intervention has any desirable or harmful effects.
Background
If wetlands are flooded too deeply, or soils are waterlogged for too long, desirable marsh or swamp vegetation may not be able to survive. To complement planting efforts, the water level/table could be lowered by actions such as removing dams downstream, switching off water input pumps, and improving drainage by digging shallow “runnels” or deeper creeks (Wigand et al. 2017).
The summarized evidence does not include general guidance about plant species’ moisture preferences, or laboratory studies of performance under different levels of soil moisture. To be summarized as evidence for this intervention, studies must have experimentally tested the effect of raising the water level to complement planting in the field.
Related interventions: Lower water level to restore degraded marshes or swamps (8.2); Lower water level to restore/create marshes or swamps from other land uses (12.5); Actively manage water level after planting (13.5); Reprofile/relandscape before planting (13.6).
Wigand C., Ardito T., Chaffee C., Ferguson W., Paton S., Raposa K., Vandemoer C. & Watson E. (2017) A climate change adaptation strategy for management of coastal marsh systems. Estuaries and Coasts, 40, 682–693.
13.3 Facilitate tidal exchange (before/after planting)
Background
This intervention involves increasing the frequency or duration of flooding by tides in areas planted with marsh or swamp vegetation. Tidal exchange could be facilitated by

13. Actions to complement planting
483
breaching sea walls or embankments, installing or widening culverts, excavating tidal creeks, or opening/closing sluice gates. Tidal wetlands may be brackish/saline (e.g. mangroves, coastal marshes) or freshwater (e.g. at the upstream end of estuaries, as in the Mississippi, Yangtze, and Elbe rivers; Baldwin et al. 2009).
Related interventions: Facilitate tidal exchange to restore degraded marshes or swamps (8.3); Facilitate tidal exchange to restore/create marshes or swamps from other land uses (12.6); Reprofile/relandscape before planting (13.6); Remove surface soil/sediment before planting (13.8).
Baldwin A.H., Barendregt A. & Whigham D. (2009) Tidal Freshwater Wetlands. Backhuys Publishers, Lieden.
13.3.1 Facilitate tidal exchange before/after planting non-woody plants:
freshwater wetlands
We found no studies that evaluated the effects, on vegetation, of facilitating tidal exchange in freshwater wetlands planted with emergent, non-woody plants.
This means that we have not yet found any studies that have directly evaluated this intervention during our systematic journal and report searches. Therefore we have no evidence to indicate whether or not the intervention has any desirable or harmful effects.
13.3.2 Facilitate tidal exchange before/after planting non-woody plants:
brackish/saline wetlands
Two studies evaluated the effects, on vegetation, of facilitating tidal exchange in brackish/saline wetlands planted with emergent, non-woody plants. Both studies were in the same estuarine site in the USA.
VEGETATION COMMUNITY
VEGETATION ABUNDANCE
VEGETATION STRUCTURE
Height (1 study): One replicated, controlled study in a salt marsh in the USA1b found that planted California cordgrass Spartina foliosa reached a similar height, after three growing seasons, in areas with an excavated tidal creek and areas without a tidal creek.
Individual plant size (1 study): One replicated, controlled study in a salt marsh in the USA1a
found that planted salt marsh herbs reached a similar overall size, after 1–2 growing seasons, in areas with an excavated tidal creek and areas without a tidal creek.
OTHER
Survival (2 studies): Two replicated, controlled studies in a salt marsh in the USA1a,1b found that planted salt marsh herbs typically had similar survival rates, after 1–2 growing seasons, in areas with an excavated tidal creek and areas without a tidal creek.
A replicated, controlled study in 1999–2002 in an estuary in California, USA (1a) found that excavating tidal creeks before planting salt marsh plants typically had no significant effect on their survival or size. Over the first year after initial planting, dead plants were replaced by new plants of a similar age. The number of replacements needed per plot, and for four of five species, was statistically similar in catchments with or without a tidal creek (data not reported). Over the second year of the study, plot-level survival was statistically similar under both treatments (creek: 3.3; no

13. Actions to complement planting
484
creek: 2.9 survivors/plot). The survival rate was similar under each treatment for three of five planted species (creek: 24–80%; no creek: 37–70%) but higher in catchments with a creek for the other two species (creek: 63–93%; no creek: 48–74%). Across both years, surviving plants were a similar size (combination of height and lateral extent) in catchments with and without tidal creeks. This was true for both plot- and species-level comparisons (data not reported). Methods: In winter 1999/2000, an area of estuarine sediment was reprofiled to intertidal elevations. A tidal creek was dug in three of six catchments within the site. In December 2000, 90 greenhouse-reared salt marsh plants were planted in each catchment (five plants, each a different species, in each of eighteen 2.24-m2 plots/catchment). Some plots had also been tilled and/or amended with kelp compost. Colonizing vegetation was removed until October 2001. Until December 2001, dead planted vegetation was replaced. Replacements were counted. In August 2002, final survival, height and lateral spread of planted vegetation were recorded.
A replicated, controlled study in 1999–2002 in an estuary in California, USA (1b) found that excavating tidal creeks before planting California cordgrass Spartina foliosa did not significantly affect cordgrass density or height. After three growing seasons, the density of California cordgrass stems was statistically similar in catchments with or without a tidal creek. The same was true for the average height of those stems. No data were reported. Methods: In winter 1999/2000, twelve 15 x 30 m plots were established during the excavation of a salt marsh. Six plots were within the catchments of three excavated tidal creeks. The other six plots were in three catchments without tidal creeks. Kelp compost was also added to half of the plots. In February 2000, plugs of California cordgrass (range 50–100 cm tall) were dug from a nearby marsh and planted (2 m apart) in the plots. In August 2002, cordgrass stems were counted and measured in four 0.25-m2 quadrats/plot (each with ≥15 stems).
(1) O'Brien E.L. & Zedler J.B. (2006) Accelerating the restoration of vegetation in a southern California salt marsh. Wetlands Ecology and Management, 14, 269–286.
13.3.3 Facilitate tidal exchange before/after planting trees/shrubs:
freshwater wetlands
We found no studies that evaluated the effects, on vegetation, of facilitating tidal exchange in freshwater wetlands planted with trees/shrubs.
This means that we have not yet found any studies that have directly evaluated this intervention during our systematic journal and report searches. Therefore we have no evidence to indicate whether or not the intervention has any desirable or harmful effects.
13.3.4 Facilitate tidal exchange before/after planting trees/shrubs:
brackish/saline wetlands
We found no studies that evaluated the effects, on vegetation, of facilitating tidal exchange in brackish/saline wetlands planted with trees/shrubs.
This means that we have not yet found any studies that have directly evaluated this intervention during our systematic journal and report searches. Therefore we have no evidence to indicate whether or not the intervention has any desirable or harmful effects.

13. Actions to complement planting
485
13.4 Irrigate (before/after planting)
We found no studies that evaluated the effects, on vegetation, of irrigating areas planted with emergent marsh/swamp plants.
This means that we have not yet found any studies that have directly evaluated this intervention during our systematic journal and report searches. Therefore we have no evidence to indicate whether or not the intervention has any desirable or harmful effects.
Background
This intervention involves active, direct, continuous or repeated application of water to areas planted with marsh or swamp vegetation. Irrigation could be done with systems such as sprinklers, channels or pipes. It can be used to manage moisture and salinity levels, creating suitable conditions for planted vegetation. Irrigation can be expensive so may be best used as a short-term intervention to kick-start restoration. It might also divert water resources away from marshes, swamps or other wetlands elsewhere.
Related interventions: Actively manage water level, other than to complement planting (8.4); one-off interventions to Raise water level before/after planting (13.1); Actively manage water level after planting (13.5).
13.5 Actively manage water level (after planting)
Background
This intervention involves active management of water levels in areas planted with emergent marsh or swamp vegetation. It involves repeated management of the amount of water present and/or when it is present. This intervention will usually involve some kind of water control structure: a valve, gate, sluice or pump.
Related interventions: Actively manage water level, other than to complement planting (8.4); one-off interventions to Raise water level before/after planting (13.1); Facilitate tidal exchange before/after planting (13.3); Irrigate before/after planting (13.4).
13.5.1 Actively manage water level before/after planting non-woody
plants: freshwater wetlands
Three studies evaluated the effects, on vegetation, of actively managing water levels in freshwater wetlands planted with emergent, non-woody plants. All three studies were in the USA. Two studies2,3 used the same experimental wet basins but planted different species.
VEGETATION COMMUNITY
Overall richness/diversity (1 study): One study in a freshwater marsh in the USA1 found that amongst plots amended with wetland soil, those flooded for longer contained fewer emergent plant species over the rest of the growing season following drawdown.
Characteristic plant richness/diversity (1 study): The same study1 found that amongst plots amended with wetland soil, those flooded for longer contained fewer wetland-characteristic plant species over the rest of the growing season following drawdown.
VEGETATION ABUNDANCE

13. Actions to complement planting
486
Overall abundance (1 study): One study in a freshwater marsh in the USA1 found that amongst plots amended with wetland soil, those flooded for longer developed more submerged vegetation biomass before drawdown, but developed less emergent vegetation (biomass and stem density) over the rest of the growing season after drawdown.
Individual species abundance (2 studies): Two studies1,2 quantified the effect of this intervention on the abundance of individual plant species. For example, one controlled, before-and-after study in wet basins in the USA2 found that the effect of mimicking a natural (falling) water regime on lake sedge Carex lacustris biomass and density, in the three years after planting, depended on the year and various environmental factors (e.g. planting density, elevation and weeding of competitors).
VEGETATION STRUCTURE
Height (2 studies): Two controlled studies in wet basins in the USA2,3 examined the effect of mimicking a natural (falling) water regime, compared to a stable or rising regime, on the height of sedges over three years after planting. One of the studies3 found no significant effect on the height of tussock sedge Carex stricta in three of three years. The other study2 found that the effect on the height of lake sedge Carex lacustris varied within and between years.
OTHER
Survival (2 studies): Two controlled studies in wet basins in the USA2,3 examined the effect of mimicking a natural (falling) water regime, compared to a stable or rising regime, on the survival of sedges Carex spp. over three years after planting. The precise effect depended on the year2,3 and/or plot elevation3. In the first year, sedge survival was typically lower under the falling regime.
A study in 1990 in a created freshwater marsh in Texas, USA (1) found that the length of flooding and drawdown on shelves amended with wetland soil affected the abundance, richness and composition of submerged and emergent vegetation. The longer plots were flooded, the more submerged vegetation biomass they contained (five months flooding: 191; three months: 46; one month: 0 g/m2). In contrast, for emergent vegetation that matured after drawdown, plots flooded for longer contained less above-ground biomass (five months: 99; three months: 134; one month: 769 g/m2), fewer stems (five months: 1,126; three months: 340; one month: 1,851 stems/m2), fewer species (five months: 17; three months: 17; one month: 29 species/0.25 m2) and fewer species that “prefer wet or semi-wet soils” (five months: 10; three months: 8; one month: 13 species/0.25 m2). The duration of flooding also affected the biomass of individual plant species (see original paper for data). Methods: The study used a created marsh containing three shelves of differing height. In late February 1990, wetland soil was added to all shelves and then they were flooded. The water level was then drawn down in stages, exposing one shelf after one month, one after three months and one after five months. Vegetation was surveyed from 11–20 plots/shelf (each 0.25 m2). Submerged vegetation was collected immediately before drawdown. Emergent vegetation was collected once “mature”. Vegetation was dried before weighing.
A controlled, before-and-after study in 1995–1997 in three recently excavated wet basins in Minnesota, USA (2) found that the effect of simulating a naturally falling water level on survival, abundance and height of planted lake sedge Carex lacustris varied across time and/or environmental conditions. For example, in the first year after planting, sedge survival was lower under a falling water regime (82%) than under a rising water regime (97%). Water regime did not significantly affect survival rates in the second and third year after planting. In contrast, sedge biomass and stem density were not significantly increased by a falling water regime in the first year after

13. Actions to complement planting
487
planting (e.g. falling: 20; stable: 29; rising: 57 g/m2 biomass) but were higher under a falling water regime by the third year (e.g. biomass falling: 953; stable: 536; rising: 573 g/m2 biomass). In the third year, sedges in plots under a falling regime were at least as tall (average: 55–100 cm; maximum: 88–158 cm) as sedges under a stable or rising regime (average: 27–102 cm; maximum: 54–147 cm). Methods: The study used three wet basins (same as in Study 3), each of which was managed with a different water regime: falling, stable or rising throughout the growing season. The falling regime was most similar to natural conditions in local depressional wetlands (deepest flooding at start of growing season). In May 1995, nursery-reared lake sedge was planted into 48 bare, 5-m2 plots (16 plots/basin; 10 or 45 plants/plot). The plots were situated at four different elevations, and half of the plots in each basin were weeded (colonizing plants removed) throughout the study. Vegetation was surveyed through the 1995, 1996 and 1997 growing seasons.
A controlled, before-and-after study in 1995–1997 in three recently excavated wet basins in Minnesota, USA (3) found that simulating a naturally falling water level had no significant effect on the height of planted tussock sedge Carex stricta, and that effect on sedge survival depended on other factors. In each of three years, the height of planted sedges was statistically similar under a falling, rising or stable water regime (data not reported). Sedge survival was significantly affected by water regime in the first and second years after planting (but not the third), but the effect depended on plot elevation. For example, first-year survival was >98% under all water regimes in higher/drier plots, but ranged from 47% (falling regime) to 96% (rising regime) in lower/wetter plots. The study also reported data on biomass/plant and shoot number/plant. The effect of water regime on these metrics depended on time since planting, elevation and/or weeding (see original paper). Methods: The study used three wet basins (same as in Study 2), each of which was managed with a different water regime: falling, stable or rising throughout the growing season. The falling regime was most similar to natural conditions in local depressional wetlands (deepest flooding at start of growing season). In May 1995, nursery-reared tussock sedge was planted into 48 bare, 5-m2 plots (16 plots/basin; 10 or 45 plants/plot). The plots were situated at four different elevations, and half of the plots in each basin were weeded (colonizing plants removed) throughout the study. Vegetation was surveyed through the 1995, 1996 and 1997 growing seasons.
(1) McKnight S.K. (1992) Transplanted seed bank response to drawdown time in a created wetland in East Texas. Wetlands, 12, 79–90.
(2) Budelsky R.A. & Galatowitsch S.M. (2000) Effects of water regime and competition on the establishment of a native sedge in restored wetlands. Journal of Applied Ecology, 37, 971–985.
(3) Budelsky R.A. & Galatowitsch S.M. (2004) Establishment of Carex stricta Lam. seedlings in experimental wetlands with implications for restoration. Plant Ecology, 175, 91–105.
13.5.2 Actively manage water level before/after planting non-woody
plants: brackish/saline wetlands
We found no studies that evaluated the effects, on vegetation, of actively managing water levels in brackish/saline wetlands planted with emergent, non-woody plants.
This means that we have not yet found any studies that have directly evaluated this intervention during our systematic journal and report searches. Therefore we have no evidence to indicate whether or not the intervention has any desirable or harmful effects.

13. Actions to complement planting
488
13.5.3 Actively manage water level before/after planting trees/shrubs:
freshwater wetlands
We found no studies that evaluated the effects, on vegetation, of actively managing water levels in freshwater wetlands planted with trees/shrubs.
This means that we have not yet found any studies that have directly evaluated this intervention during our systematic journal and report searches. Therefore we have no evidence to indicate whether or not the intervention has any desirable or harmful effects.
13.5.4 Actively manage water level before/after planting trees/shrubs:
brackish/saline wetlands
We found no studies that evaluated the effects, on vegetation, of actively managing water levels in brackish/saline wetlands planted with trees/shrubs.
This means that we have not yet found any studies that have directly evaluated this intervention during our systematic journal and report searches. Therefore we have no evidence to indicate whether or not the intervention has any desirable or harmful effects.
13.6 Reprofile/relandscape (before planting)
We found no studies that evaluated the effects, on vegetation, of reprofiling/relandscaping before planting emergent marsh/swamp plants.
This means that we have not yet found any studies that have directly evaluated this intervention during our systematic journal and report searches. Therefore we have no evidence to indicate whether or not the intervention has any desirable or harmful effects.
Background
This intervention involves large-scale reprofiling or landscaping of sites that are later planted with marsh or swamp vegetation. This includes excavating large basins (>8 ha or 300 m diameter), moving soil/sediment from the site into levees/berms/ impoundments, removing unnatural hills or levees, filling in deep depressions, and altering the elevation/slope of coastal areas. Generally, these interventions aim to restore wetland hydrology (how wet the soil is and when it is wet/flooded) by adjusting the ground surface relative to the water table or sea.
CAUTION: Landscaping often relies on heavy machinery, which can damage any existing vegetation, and churn or compress wetland soils (Campbell et al. 2002).
Related interventions: Reprofile/relandscape, other than to complement planting (12.9); Raise water level before/after planting (13.1); Facilitate tidal exchange before/after planting (13.3); Create mounds or hollows before planting (13.7); Remove surface soil/sediment before planting (13.8).
Campbell D.A., Cole C.A. & Brooks R.P. (2002) A comparison of created and natural wetlands in Pennsylvania, USA. Wetlands Ecology and Management, 10, 41–49.
13.7 Create mounds or hollows (before planting)
Background

13. Actions to complement planting
489
This intervention involves creating discrete mounds (e.g. by adding blocks of soil, bundles of sticks, other coarse woody debris) or hollows (e.g. by excavation) before planting marsh or swamp vegetation. The scale of this intervention falls somewhere between reprofiling/relandscaping (large-scale landscape features, tens of metres wide; Section 13.6) and disturbing the ground surface (which may create small scale mounds or hollows, millimetres or a few centimetres wide/deep; Section 13.10).
Often, this intervention aims to mimic the natural microtopography of marshes or swamps, which can be created by sediment accumulation, erosion, tree fall, root growth or animal activity (Vivian-Smith 1997, Bruland & Richardson 2005). Microtopography can increase plant diversity, because the different microclimates or microelevations may support different species (Vivian-Smith 1997). Planting into mounds can be useful if seedlings would otherwise be flooded too deeply or for too long (Zamith & Scarano 2010). Large woody debris will also add nutrients and organic matter to a site as it decomposes.
Studies that examine the effects of planting into existing microtopographic features (e.g. mounds), even if they compare effects between different kinds of features, are not summarized as evidence here (e.g. Raulings et al. 2007; Sleeper & Ficklin 2016).
Related interventions: Create mounds or hollows, other than to complement planting (12.10); Reprofile/relandscape before planting (13.6); Disturb soil/sediment surface before planting without creating discrete mounds and/or hollows (13.10).
Bruland G.L. & Richardson C.J. (2005) Hydrologic, edaphic, and vegetative responses to microtopographic reestablishment in a restored wetland. Restoration Ecology, 13, 515–523.
Raulings E.J., Boon P.I., Bailey P.C., Roache M.C., Morris K. & Robinson R. (2007) Rehabilitation of swamp paperbark (Melaleuca ericifolia) wetlands in south-eastern Australia: effects of hydrology, microtopography, plant age and planting technique on the success of community-based revegetation trials. Wetlands Ecology and Management, 15, 175–188.
Sleeper B.E. & Ficklin R.L. (2016) Edaphic and vegetative responses to forested wetland restoration with created microtopography in Arkansas. Ecological Restoration, 34, 117–123.
Vivian-Smith G. (1997) Microtopographic heterogeneity and floristic diversity in experimental wetland communities. Journal of Ecology, 85, 71–82.
Zamith L.R. & Scarano F.R. (2010) Restoration of a coastal swamp forest in southeastern Brazil. Wetlands Ecology and Management, 18, 435–448.
13.7.1 Create mounds or hollows before planting non-woody plants:
freshwater wetlands
Two studies evaluated the effects, on vegetation, of creating mounds or hollows in freshwater wetlands before planting emergent, non-woody plants. Both studies were in the same wetland in the USA, but used different experimental set-ups.
VEGETATION COMMUNITY
VEGETATION ABUNDANCE
Individual species abundance (2 studies): Two replicated, randomized, paired, controlled studies in a wetland in the USA1a,1b found that tussock sedge Carex stricta cover was typically similar across plots, after two growing seasons, whether sedges were planted into created mounds1a,1b or hollows1b, or planted into flat ground.
VEGETATION STRUCTURE

13. Actions to complement planting
490
Individual plant size (2 studies): Two replicated, randomized, paired, controlled studies in a wetland in the USA1a,1b found that planting tussock sedges Carex stricta into created mounds1a,1b or hollows1b had no significant effect on their individual biomass, after 1–2 growing seasons, when compared to planting into flat ground.
OTHER
Survival (2 studies): Two replicated, randomized, paired, controlled studies in a wetland in the USA1a,1b found that planting tussock sedge Carex stricta into created mounds1a or hollows1b did not improve, and typically reduced, its survival rate compared to planting into flat ground. Survival was monitored after 1–2 growing seasons.
Growth (2 studies): The same studies1a,1b found that planting tussock sedge Carex stricta into created mounds1a,1b or hollows1b typically had no significant effect on its growth rate, over 1–2 growing seasons, compared to planting into flat ground.
A replicated, randomized, paired, controlled study in 2012–2013 in a freshwater wetland in Wisconsin, USA (1a) found that creating mounds before planting tussock sedge Carex stricta did not improve survival rates, and typically had no significant effect on sedge growth, biomass or cover. After two growing seasons, survival rates were lower for sedges planted in mounds than on flat ground in seven of eight comparisons (for which mounds: 27–93%; flat: 100%). There was typically no significant difference between treatments in sedge growth rate (11 of 16 comparisons; see original paper for data). In three of the other five growth rate comparisons, all in the second growing season after planting, sedges grew faster in mounds (0.021–0.028 mm/mm/day) than on flat ground (0.013 mm/mm/day). In most cases, there was also no significant difference between treatments for final above-ground sedge biomass (four of four comparisons, for which mounds: 5–34 g/plant; flat: 7–39 g/plant) and final sedge cover (three of four comparisons, for which mounds: 11–46%; flat: 38–62%). Methods: In spring 2012, thirty 1-m2 plots were established, in six sets of five, in a wetland undergoing restoration. Soil mounds were built in 24 of the plots (five random plots/set). Mounds were either 8 cm tall, 16 cm tall, 16 cm tall with 50% woodchip, or 32 cm tall. The other six plots were left as flat ground. Five nursery-reared tussock sedges were planted into each plot (one plant/mound in plots with mounds) then regularly watered and weeded. Survival and above-ground biomass of planted sedges, and total tussock sedge cover, were surveyed in June–August 2013. Biomass was dried before weighing. Growth rates were calculated from leaf lengths measured in 2012 and 2013. This study used the same site as (1b), but a different experimental set-up.
A replicated, randomized, paired, controlled study in 2013 in a freshwater wetland in Wisconsin, USA (1b) found that creating mounds or hollows before planting tussock sedge Carex stricta typically had no significant effect on sedge growth, biomass or cover, and reported that creating hollows reduced survival rates. After one growing season, sedges planted in hollows had a lower survival rate (63%) than sedges planted on flat ground (≥90%; data for mounds not reported; statistical significance not assessed). The treatments had no significant effect, compared to planting in flat ground, on sedge growth rate (mounds: 0.026–0.028 mm/mm/day; hollows: 0.032–0.035 mm/mm/day; flat: 0.027–0.035 mm/mm/day), final above-ground sedge biomass (g/plant; data not reported), or final sedge cover (six of six comparisons, for which mounds: 11–38%; hollows: 3–11%; flat: 15%). Methods: In spring 2013, twenty-four 1-m2 plots were established, in six sets of four, in a wetland undergoing restoration. Soil mounds (8 cm tall or 16 cm tall) were built in 12 of the

13. Actions to complement planting
491
plots (two random plots/set). Square hollows (10 cm deep; 15 cm across) were dug in six of the plots (one random plot/set). The final six plots were left as flat ground. Five nursery-reared tussock sedges were planted into each plot (one plant/mound or hollow where relevant). Survival and above-ground biomass of planted sedges, and total tussock sedge cover, were surveyed in June–August 2013. Biomass was dried before weighing. Growth rates were calculated from leaf lengths measured in 2013. This study used the same site as (1a), but a different experimental set-up.
(1) Doherty J.M. & Zedler J.B. (2015) Increasing substrate heterogeneity as a bet-hedging strategy for restoring wetland vegetation. Restoration Ecology, 23, 15–25.
13.7.2 Create mounds or hollows before planting non-woody plants:
brackish/saline wetlands
One study evaluated the effects, on vegetation, of creating mounds or hollows in brackish/saline wetlands before planting emergent, non-woody plants. The study was in the USA.
VEGETATION COMMUNITY
VEGETATION ABUNDANCE
Individual species abundance (1 study): One replicated, randomized, paired, controlled study in an estuarine salt marsh in the USA1 found that amongst plots sown/planted with dwarf saltwort Salicornia bigelovii, those that had been excavated into depressions had lower cover of dominant pickleweed Salicornia virginica – over the first growing season – than plots left at ground level.
VEGETATION STRUCTURE
OTHER
Germination/emergence (1 study): One replicated, randomized, paired, controlled study in an estuarine salt marsh in the USA1 found that there were no more (sometimes fewer) dwarf saltwort Salicornia bigelovii seedlings in excavated depressions than in level plots, two months after sowing saltwort seeds.
Survival (1 study): The same study1 found that the survival rate of dwarf saltwort Salicornia bigelovii transplants was not greater (sometimes lower) in excavated depressions than in level plots.
A replicated, randomized, paired, controlled study in 2006 in an estuarine salt marsh in California, USA (1) found that excavating depressions before sowing/ planting dwarf saltwort Salicornia bigelovii did not increase saltwort seedling density or transplant survival, but did reduce density of the initially dominant succulent. Two months after sowing/planting, there were fewer dwarf saltwort seedlings in 10-cm depressions (3 seedlings/0.25 m2) than on level plots (10–14 seedlings/0.25 m2), with no significant difference between 5-cm depressions (9 seedlings/0.25 m2) and level plots. The same was true for survival of dwarf saltwort transplants after six months (10-cm depressions: <40%; 5-cm depressions: 70%; level plots: 70%). However, depressions had lower cover of pickleweed Salicornia virginica in 12 of 12 comparisons over the whole growing season (10-cm depressions: 41–59%; 5-cm depressions: 49–65%; level plots: 58–78%). Methods: In March 2006, dwarf saltwort was planted and sown into seventy-two 0.25-m2 plots (three sets of 24) on a pickleweed-dominated salt marsh. Four seedlings and 1.25 ml of seed were added to each plot. Thirty-six plots (12 random plots/set) had been lowered by 5 cm or 10 cm before planting, by removing subsurface sediment. The other plots remained at

13. Actions to complement planting
492
ground level. Some pickleweed was cut and removed from half of the plots. Vegetation was surveyed between May and September 2006.
(1) Varty A.K. & Zedler J.B. (2008) How waterlogged microsites help an annual plant persist among salt marsh perennials. Estuaries and Coasts, 31, 300–312.
13.7.3 Create mounds or hollows before planting trees/shrubs: freshwater
wetlands
Three studies evaluated the effects, on vegetation, of creating mounds or hollows in freshwater wetlands before planting trees/shrubs. All three studies were in the USA.
VEGETATION COMMUNITY
Community composition (1 study): One replicated, site comparison study of 10-year-old restored/created freshwater wetlands in the USA3 reported that adding coarse woody debris to wetlands before planting trees/shrubs affected the composition of the ground vegetation layer, but not the tree layer.
Overall richness/diversity (2 studies): Two studies in freshwater wetlands in the USA1,3 reported that creating mounds or hollows before planting trees/shrubs had no clear or significant effect on plant species richness and diversity 10–12 years later. In one of the studies1, the same was true for bryophyte, herb and woody plants richness separately.
VEGETATION ABUNDANCE
VEGETATION STRUCTURE
Height (1 study): One replicated, paired, controlled study in created freshwater wetlands in the USA2 found that the average height of white cedar Thuja occidentalis saplings typically increased more, between two and five years after planting, in created mounds than on lower (occasionally flooded) ground.
OTHER
Survival (1 study): One replicated, paired, controlled study in created freshwater wetlands in the USA2 found that white cedar Thuja occidentalis seedlings had higher survival rates when planted into created mounds than on lower (occasionally flooded) ground.
A controlled study in 1988–2000 in a freshwater swamp in Michigan, USA (1) reported that creating ridges and ditches before re-planting harvested trees had no clear effect on plant species richness, and no significant effect on overall plant diversity, after 11–12 years. Amongst plots that were harvested then re-planted, those with created ridges and ditches had similar plant species richness (36–44 species/2 m2) to those with natural, unmodified ridges and ditches (39 species/2 m2; statistical significance not assessed). The same was true separately for richness of bryophytes (created: 18–20; natural: 18 species/2 m2), Sphagnum mosses (created: 6–7; natural: 7 species/2 m2), herbs (created: 11–12; natural: 10 species/2 m2) and woody plants (created: 7–12; natural: 11 species/2 m2). For comparison, unharvested plots – where trees were planted amongst natural ridges and ditches – contained 47 plant species/2 m2 (including 25 bryophytes, 12 Sphagnum mosses, 8 herbs and 14 woody species). Overall plant diversity was statistically similar in harvested/re-planted plots with created ridges, harvested/re-planted plots with natural ridges, and unharvested/ planted plots (data reported as a diversity index). Methods: In 1988, all trees were cut and removed from three plots in a forested swamp. In two plots, microtopography

13. Actions to complement planting
493
(trenches and adjacent mounds) was created after harvesting, using a disc trencher or a plough. In the third plot, natural pits and mounds remaining after harvesting were not altered. An additional plot was not harvested and the natural microtopography was not altered. All plots were subsequently planted with tree seedlings. In 1999 and 2000, understory vegetation (<1 m tall) was surveyed in twenty 1,000-cm2 quadrats/area. Each quadrat contained a pit or trench, a mound and the slope between them.
A replicated, paired, controlled study in 2008–2013 in two created freshwater swamps in Michigan, USA (2) reported that white cedar Thuja occidentalis seedlings had higher survival rates when planted into created mounds than on flat ground, and that the average height of survivors increased more on mounds than on flats. After five years and in four of four comparisons, cedar seedlings planted on elevated mounds had a higher survival rate (54–94%) than seedlings planted on lower flats (0–41%). Between two and five years after planting, the average height of surviving trees increased more on mounds than on flats in three of four comparisons (mounds: 11–39 cm/year; flats : 0–23 cm/year). In the other comparison, there was no significant difference between treatments (mounds: 1 cm/year increase; flats: 2 cm/year decrease). Methods: In spring 2008, one-year-old white cedar seedlings were planted into 37 plots on two recently excavated wetlands (5–106 seedlings/plot, approximately 2.8 m apart). The seedlings were planted on created mounds in 20 plots (1.0–1.5 m diameter; 13–25 cm tall) and on a flat surface in the other 17 plots. Mound tops were never flooded. Flats were sometimes flooded. Some mounded and flat plots were also fenced to exclude deer. Surviving trees were monitored in April 2010 and October 2013.
A replicated, site comparison study in 2013 of eight 10-year-old restored/created freshwater wetlands in Maryland, USA (3) found that adding coarse woody debris to wetlands before planting trees/shrubs generally had no significant effect on plant community composition, richness or diversity – but did affect the ground layer community composition. The amount of coarse woody debris added to wetlands (none, low density, high density) was not significantly related to plant community composition, richness or diversity. This was true for both the ground vegetation layer (<1 m tall) and the tree layer (>1 m tall; data not reported). However, the effect on community composition was also analyzed for wetlands with vs without added coarse woody debris. In this analysis, ground layer community composition significantly differed between treatments (data reported as a graphical analysis). Methods: In June–August 2013, vegetation was surveyed along transects in eight restored/created depressional wetlands (4–6 transects/wetland, extending from the centre to the surrounding upland). The wetlands had been restored or created on farmland in 2003–2004, by: rewetting, adding wheat/barley straw, and planting trees/shrubs in wetland and upland areas. Logs, from trees felled on site, were added to pools/pool margins in six of the wetlands (three low density: 15–50 logs/ha; three high density: 136–333 logs/ha).
(1) Anderson H.M., Gale M.R., Jurgensen M.F. & Trettin C.C. (2007) Vascular and non-vascular plant community response to silvicultural practices and resultant microtopography creation in a forested wetland. Wetlands, 27, 68–79.
(2) Kangas L.C., Schwartz R., Pennington M.R., Webster C.R. & Chimner R.A. (2016) Artificial microtopography and herbivory protection facilitates wetland tree (Thuja occidentalis L.) survival and growth in created wetlands. New Forests, 47, 73–86.
(3) Russell K.N. & Beauchamp V.B. (2017) Plant species diversity in restored and created Delmarva Bay wetlands. Wetlands, 37, 1119–1133.

13. Actions to complement planting
494
13.7.4 Create mounds or hollows before planting trees/shrubs: brackish/
saline wetlands
One study evaluated the effects, on vegetation, of creating mounds or hollows in brackish/saline wetlands before planting trees/shrubs. The study was in Brazil.
VEGETATION COMMUNITY
VEGETATION ABUNDANCE
VEGETATION STRUCTURE
OTHER
Survival (1 study): One replicated, controlled study in a degraded coastal swamp in Brazil1 reported that planting tree seedlings into mounds had mixed effects on survival over three years, depending on the species.
Growth (1 study): The same study1 reported that tree seedlings planted into mounds typically grew at a similar rate, over three years, to seedlings planted at ground level. Growth was measured in terms of diameter, height and canopy area.
A replicated, controlled study in 2002–2005 in a degraded coastal swamp in southeast Brazil (1) reported that creating mounds before planting tree seedlings had mixed effects on their survival over three years, but typically had no significant effect on growth. Planting into mounds rather than at ground level increased survival for two of five species (mounds: 70–77%; ground level: 57–67%), reduced survival for two species (mounds: 57–67%; ground level: 63–73%) and had no effect on survival of one species (100% in mounds or at ground level). Statistical significance of these survival results was not assessed. In 11 of 15 comparisons, growth rates were statistically similar for seedlings planted in mounds and at ground level. In the other four comparisons, seedlings planted in mounds grew more, or shrunk less, than seedlings planted at ground level (see original paper for data). Methods: In May 2002, sixty seedlings of each of five tree species were planted, 1.5 m apart, into a degraded coastal swamp. Thirty seedlings/species were planted into created mounds (10 cm high). Thirty seedlings/species were planted at ground level. All seedlings received 30 L of manure. Invasive trees and grasses were removed from the swamp before planting. Seedling survival was monitored until May 2005. Seedling diameter, height and canopy area were measured in August 2002 and August 2005.
(1) Zamith L.R. & Scarano F.R. (2010) Restoration of a coastal swamp forest in southeastern Brazil. Wetlands Ecology and Management, 18, 435–448.
13.8 Remove surface soil/sediment (before planting)
We found no studies that evaluated the effects, on vegetation, of removing surface soil/sediment before planting emergent marsh/swamp plants.
This means that we have not yet found any studies that have directly evaluated this intervention during our systematic journal and report searches. Therefore we have no evidence to indicate whether or not the intervention has any desirable or harmful effects.
Background

13. Actions to complement planting
495
The surface soil/sediment – and any vegetation on it – could be removed from degraded wetlands, creating a new bare surface for planting vegetation. This new surface may have fewer nutrients and other pollutants, no undesirable seed bank, no hard crust and be wetter since the surface is now closer to the water table.
CAUTION: Heavy machinery is usually needed for this intervention. Heavy vehicles can churn and compress wetland soils (Campbell et al. 2002; see also Chapter 7). Soil removal can also have counter-intuitive effects, such as increasing ammonium concentrations because nitrifying bacteria, which break down ammonia, have been removed (Dorland 2004). Soil removal can be time consuming and expensive.
Related interventions: Remove surface soil/sediment, other than to complement planting (12.11); Reprofile/relandscape before planting (13.6); Bury surface soil/ sediment before planting (13.9); Transplant wetland soil before/after planting (13.17).
Campbell D.A., Cole C.A. & Brooks R.P. (2002) A comparison of created and natural wetlands in Pennsylvania, USA. Wetlands Ecology and Management, 10, 41–49.
Dorland E. (2004) Ecological restoration of wet heaths and matgrass swards: bottlenecks and solutions . PhD Thesis, Utrecht University, The Netherlands.
13.9 Bury surface soil/sediment (before planting)
We found no studies that evaluated the effects, on vegetation, of burying surface soil/sediment before planting emergent marsh/swamp plants.
This means that we have not yet found any studies that have directly evaluated this intervention during our systematic journal and report searches. Therefore we have no evidence to indicate whether or not the intervention has any desirable or harmful effects.
Background
The surface soil/sediment of degraded wetlands – and any vegetation on it – could be buried under deeper layers, for instance by deep ploughing. Burial can create bare soil/sediment with spaces for desirable plants to grow, prevent undesirable plants from growing from seeds already in the soil, remove excess nutrients that favour growth of undesirable weedy plants, and remove any contaminants or pollutants (Glen et al. 2017). Inverting, rather than removing, the upper soil layer maintains the ground level.
CAUTION: Heavy machinery is usually needed for this intervention. Heavy vehicles can churn and compress wetland soils (Campbell et al. 2002; see also Chapter 7).
Related interventions: Bury surface soil/sediment, other than to complement planting (12.12); Remove surface soil/sediment before planting (13.8).
Campbell D.A., Cole C.A. & Brooks R.P. (2002) A comparison of created and natural wetlands in Pennsylvania, USA. Wetlands Ecology and Management, 10, 41–49.
Glen E., Price E.A.C., Caporn S.J.M., Carroll J.A., Jones L.M. & Scott R. (2017) Evaluation of topsoil inversion in UK habitat creation and restoration schemes. Restoration Ecology, 25, 72–81.
13.10 Disturb soil/sediment surface (before planting)
Background

13. Actions to complement planting
496
This intervention involves shallow disturbance of the top few centimetres of soil/sediment (and any vegetation on it), without permanently removing any soil/sediment. Mechanical disturbance could be carried out by tilling, ploughing, disking or scarifying. It may improve survival or growth of planted vegetation. It can clear potentially competing vegetation, and loosen up the soil to allow roots to penetrate more easily.
Related interventions: Remove surface soil/sediment before planting (13.8); Bury surface soil/sediment before planting, including by deep ploughing (13.9).
13.10.1 Disturb soil/sediment surface before planting non-woody plants:
freshwater wetlands
We found no studies that evaluated the effects, on vegetation, of disturbing the surface of freshwater wetlands before planting emergent, non-woody plants.
This means that we have not yet found any studies that have directly evaluated this intervention during our systematic journal and report searches. Therefore we have no evidence to indicate whether or not the intervention has any desirable or harmful effects.
13.10.2 Disturb soil/sediment surface before planting non-woody plants:
brackish/saline wetlands
Two studies evaluated the effects, on vegetation, of disturbing the surface of brackish/saline wetlands before planting emergent, non-woody plants. Both studies were in the USA.
VEGETATION COMMUNITY
VEGETATION ABUNDANCE
Individual plant abundance (1 study): One study1 quantified the effect of this intervention on the abundance of individual plant species. The replicated, randomized, paired, controlled study in a salt marsh in the USA1 found that tilling sediment before planting California cordgrass Spartina foliosa had no significant effect on its biomass or density after two growing seasons, but did reduce its biomass after one growing season.
VEGETATION STRUCTURE
Height (1 study): One replicated, randomized, paired, controlled study in a salt marsh in the USA1 found that tilling sediment before planting California cordgrass Spartina foliosa had no significant effect on its height after 1–2 growing seasons.
Individual plant size (1 study): One replicated, randomized, paired, controlled study on estuarine sediment in the USA2 found that the average size of planted salt marsh plants was similar, after 1–2 years, in tilled and untilled plots. Size was reported as an index incorporating plant height and lateral extent.
OTHER
Survival (1 study): One replicated, randomized, paired, controlled study on estuarine sediment in the USA2 found that survival rates of planted salt marsh plants were similar, over 1–2 years, in tilled and untilled plots.
A replicated, randomized, paired, controlled study in 1990–1991 in a recently excavated estuarine salt marsh in California, USA (1) found that tilling plots before planting California cordgrass Spartina foliosa had no significant effect on cordgrass

13. Actions to complement planting
497
biomass, stem density or plant height after two growing seasons. At this time, there was no significant difference between treatments in above-ground cordgrass biomass (tilled: 100 g/m2; untilled: 220 g/m2), cordgrass density (tilled: 30 stems/m2; untilled: 50 stems/m2) or average cordgrass height (data not reported). The same was true for density and height after one growing season, whilst cordgrass biomass was significantly lower in tilled plots (30 g/m2) than untilled plots (60 g/m2). Methods: In February 1990, four pairs of 5-m2 plots were prepared alongside a tidal creek in a recently excavated salt marsh. In each pair, one random plot was tilled to 15 cm depth. The other plots were left undisturbed. In March 1990, each plot was planted with cordgrass plants from ten 4-L pots. California cordgrass stems were counted and measured until October 1991. Dry biomass was estimated from heights.
A replicated, randomized, paired, controlled study in 2000–2002 in an estuary in California, USA (2) found that tilling plots before planting salt marsh plants typically had no significant effect on their survival or size. Over the first year after initial planting, dead plants were replaced by stock plants of a similar age. The number of replacements needed was statistically similar in tilled plots (9.1 replacements/plot) and undisturbed plots (9.7 replacements/plot). Over the second year of the study, the treatments supported a similar average number of surviving plants (tilled: 2.9; undisturbed: 2.8 survivors/plot) and a similar survival rate under each treatment for five of five planted species (tilled: 31–72%; undisturbed: 19–86%). Across both years, surviving plants were typically a similar size in tilled and undisturbed plots (data reported as an index combining height and lateral extent). This was true in four of four comparisons of the average size of plants per plot, and 9 of 10 comparisons of the average size of individual species. Methods: In January 2000, seventy-two 2.24-m2 plots were established (in 6 sets of 12) on intertidal sediment excavated earlier that winter. Half of the plots (six random plots/set) were rototilled to 30 cm depth. The other plots were left undisturbed. In December 2000, five greenhouse-reared plants (each a different species) were planted into each plot. Colonizing vegetation was removed until October 2001. Dead planted vegetation was replaced until December 2001 to maintain 36 plants/species/soil treatment. Survival, height and lateral spread of planted vegetation were recorded in August 2002.
(1) Gibson K.D., Zedler J.B. & Langis R. (1994) Limited response of cordgrass (Spartina foliosa) to soil amendments in a constructed marsh. Ecological Applications, 4, 757–767.
(2) O'Brien E.L. & Zedler J.B. (2006) Accelerating the restoration of vegetation in a southern California salt marsh. Wetlands Ecology and Management, 14, 269–286.
13.10.3 Disturb soil/sediment surface before planting trees/shrubs:
freshwater wetlands
We found no studies that evaluated the effects, on vegetation, of disturbing the surface of freshwater wetlands before planting trees/shrubs.
This means that we have not yet found any studies that have directly evaluated this intervention during our systematic journal and report searches. Therefore we have no evidence to indicate whether or not the intervention has any desirable or harmful effects.
13.10.4 Disturb soil/sediment surface before planting trees/shrubs:
brackish/saline wetlands
One study evaluated the effects, on vegetation, of disturbing the surface of brackish/saline wetlands before planting trees/shrubs. The study was in Australia.

13. Actions to complement planting
498
VEGETATION COMMUNITY
VEGETATION ABUNDANCE
VEGETATION STRUCTURE
Height (1 study): One replicated, controlled study on an estuarine mudflat in Australia1 found that ploughing the substrate before planting grey mangrove Avicennia marina propagules had no significant effect on their height after two growing seasons.
OTHER
Survival (1 study): One replicated, controlled study on an estuarine mudflat in Australia1 found that ploughing the substrate before planting grey mangrove propagules had no significant effect on their survival over two growing seasons.
A replicated, controlled study in 1995–1997 on an estuarine mudflat in New South Wales, Australia (1) found that ploughing substrate before planting grey mangrove Avicennia marina propagules had no significant effect on their survival or seedling height after two growing seasons. At this time, ploughed and unploughed plots, initially planted with 16 propagules, contained a statistically similar number of seedlings (ploughed: 5.9; not ploughed: 6.7 seedlings/plot) and contained seedlings of statistically similar average height (ploughed: 45 cm; not ploughed: 49 cm). Initial survival rates (after two weeks) were also statistically similar in both treatments (ploughed: 4.7; not ploughed: 5.9 seedlings/plot). Methods: In December 1995, some 1-m2 plots (number not reported) were established in three areas on a tidal mudflat in the Hunter River estuary. The plots were excavated to 20 cm depth then refilled with the local natural substrate (sand/silt/clay). Some of the plots were then ploughed (10–15 cm depth) whilst the others were not ploughed. Sixteen locally collected grey mangrove propagules were planted into each plot. Seedlings were counted in each area after approximately two weeks, then counted and measured in two of the three areas (where some propagules survived) after 15 months.
(1) Day S., Streever W.J. & Watts J.J. (1999) An experimental assessment of slag as a substrate for mangrove rehabilitation. Restoration Ecology, 7, 139–144.
13.11 Add upland topsoil (before/after planting)
Background
Topsoil can be a source of soil organic matter and help to improve water retention (Bruland & Richardson 2004). This might benefit wetland vegetation, particularly when creating new marshes and swamps. Topsoil may often be added to complement planting (current intervention) rather than without planting (Section 12.5): upland soil will probably not contain seeds or fragments of marsh/swamp plants. CAUTION: Topsoil may contain seeds or fragments of undesirable vegetation.
Related interventions: Add upland topsoil, other than to complement planting (12.15); Transplant wetland soil before/after planting (13.17).
Bruland G.L. & Richardson C.J. (2004) Hydrologic gradients and topsoil additions affect soil properties of Virginia created wetlands. Soil Science Society of America Journal, 68, 2069–2077.

13. Actions to complement planting
499
13.11.1 Add upland topsoil before/after planting non-woody plants:
freshwater wetlands
Three studies evaluated the effects, on vegetation, of adding upland topsoil to freshwater wetlands planted with emergent, non-woody plants. Two studies were in the USA1a,1b and one was in Canada2. One study was in a greenhouse1a.
VEGETATION COMMUNITY
VEGETATION ABUNDANCE
Individual species abundance (1 study): One replicated, randomized, paired, controlled study in freshwater trenches in Canada2 found that adding a mixture of mineral soil and peat to pots of mine tailings before planting water sedge Carex aquatilis typically increased its above-ground biomass two growing seasons later.
VEGETATION STRUCTURE
Individual plant size (2 studies): One replicated, controlled study in a greenhouse in the USA1a found that mixing topsoil into pots of mineral soil/compost before planting tussock sedge Carex stricta seedlings typically increased the biomass and number of shoots they developed over three months. However, one replicated, paired, controlled study in a wet meadow restoration site in the USA1b reported that mixing topsoil into the mineral soil/compost substrate before planting tussock sedge seedlings had no clear effect on the number of shoots they developed over two months.
OTHER
Survival (1 study): One replicated, randomized, paired, controlled study in freshwater trenches in Canada2 found that adding a mixture of mineral soil and peat to pots of mine tailings either increased or had no significant effect on survival of planted water sedge Carex aquatilis over two growing seasons.
A replicated, controlled study in 1992 in a greenhouse in Iowa, USA (1a) found that mixing topsoil into mineral soil typically increased the number of shoots and above-ground biomass of planted tussock sedge Carex stricta seedlings, whether topsoil was the only soil amendment or was additional to other amendments. After three months, sedge seedlings planted into a mixture of topsoil and mineral soil were larger (8.8 shoots/plant; 1.6 g/plant) than seedlings planted into mineral soil only (3.3 shoots/plant; 0.6 g/plant). Adding topsoil also increased the size of sedge seedlings in four of six comparisons where it was an additional treatment (i.e. added to pots that were fertilized and/or amended with compost; see original paper for data). In the other two comparisons, topsoil did not have a significant additional effect on sedge size. Methods: In March 1992, tussock sedge seedlings (6–8 weeks old) were planted into 144 pots (probably one seedling/pot). In half of the pots, topsoil was mixed in equal parts with whatever other soil was in the pots (deeper mineral soil, sometimes mixed with compost). Some pots with and without topsoil were also fertilized. All pots were watered to saturation. In June 1992, all sedge shoots were counted, harvested, dried and weighed.
A replicated, paired, controlled study in 1992 in a wet meadow restoration site in Iowa, USA (1b) reported that adding topsoil to plots before planting tussock sedge Carex stricta seedlings had no clear effect on the number of shoots they developed. Two weeks after planting, sedges assigned to each treatment had a statistically similar number of shoots (4.7–5.8 shoots/plant). After two months, sedge seedlings in plots amended with topsoil had a similar number of shoots (12.2–15.5 shoots/plant) to

13. Actions to complement planting
500
seedlings in plots that had not been amended with topsoil (11.8–15.2 shoots/plant). This was true when topsoil was the only amendment to mineral soil plots (statistically tested), or when topsoil was an additional amendment to plots already amended with compost (not statistically tested). Methods: In June 1992, tussock sedge seedlings were planted into twelve sets of four 1-m2 plots of mineral soil (topsoil had been removed). The number of seedlings/plot was not clearly reported. Fresh topsoil was rototilled into the surface of half of the plots (two plots/set). Some plots were also amended with compost.
A replicated, randomized, paired, controlled study in 2010–2011 in six experimental wetland trenches in Alberta, Canada (2) found that adding peat/mineral soil to mine tailings did not reduce survival of planted water sedge Carex aquatilis over two growing seasons, and typically increased the biomass of surviving sedges. In two of four comparisons, pots of mine tailings mixed with peat/mineral soil supported higher sedge survival (50–67%) than pots of raw mine tailings (24–44%). There was no significant difference between treatments in the other two comparisons (peat/mineral soil: 74%; raw tailings: 54–69%). In three of four comparisons, the above-ground biomass of surviving sedges was higher in pots of mine tailings mixed with peat/mineral soil (2.1–2.8 g/trench) than in pots of raw mine tailings (1.1–1.5 g/trench). There was no significant difference between treatments in the other comparisons (peat/mineral soil: 2.2 g/trench; raw tailings: 2.2 g/trench). Methods: In June 2010, water sedges were collected from a natural marsh and randomly planted into 192 one-gallon pots (number of plants/pot not clearly reported). Half of the pots contained mine tailings amended with a mixture of peat and mineral soil (1 part tailings to 2 parts peat/mineral soil). Half of the pots contained pure mine tailings (dense sediments, low in organic matter, rich in salts and metals). The pots were placed into six experimental wetland trenches: 16 amended pots and 16 raw tailings pots/trench. Surviving plants were harvested at the end of the 2011 growing season. Biomass was dried before weighing.
(1) van der Valk A.G., Bremholm T.L. & Gordon E. (1999) The restoration of sedge meadows: seed viability, seed germination requirements, and seedling growth of Carex species. Wetlands, 19, 756–764.
(2) Roy M.-C., Mollard F.P.O. & Foote A.L. (2014) Do peat amendments to oil sands wet sediments affect Carex aquatilis biomass for reclamation success? Journal of Environmental Management, 139, 154–163.
13.11.2 Add upland topsoil before/after planting non-woody plants:
brackish/saline wetlands
We found no studies that evaluated the effects, on vegetation, of adding upland topsoil to brackish/ saline wetlands planted with emergent, non-woody plants.
This means that we have not yet found any studies that have directly evaluated this intervention during our systematic journal and report searches. Therefore we have no evidence to indicate whether or not the intervention has any desirable or harmful effects.
13.11.3 Add upland topsoil before/after planting trees/shrubs: freshwater
wetlands
We found no studies that evaluated the effects, on vegetation, of adding upland topsoil to freshwater wetlands planted with trees/shrubs.
This means that we have not yet found any studies that have directly evaluated this intervention during our systematic journal and report searches. Therefore we have no evidence to indicate whether or not the intervention has any desirable or harmful effects.

13. Actions to complement planting
501
13.11.4 Add upland topsoil before/after planting trees/shrubs: brackish/
saline wetlands
We found no studies that evaluated the effects, on vegetation, of adding upland topsoil to brackish/ saline wetlands planted with trees/shrubs.
This means that we have not yet found any studies that have directly evaluated this intervention during our systematic journal and report searches. Therefore we have no evidence to indicate whether or not the intervention has any desirable or harmful effects.
13.12 Add lime or similar chemicals (before/after planting)
Background
This intervention involves adding chemicals – such as lime (CaO or Ca(OH)2), limestone (CaCO3), magnesium oxide (MgO), fly ash (residue from burning coal) and biochar (a type of charcoal) – to areas planted with marsh or swamp vegetation. These calcium and/or magnesium-rich chemicals may reduce acidity and modify nutrient availability (Weil & Brady 2016), potentially increasing plant survival or growth.
Related interventions: Add lime or similar chemicals to wetlands, other than to complement planting (10.10).
Weil R.R. & Brady N.C. (2016) The Nature and Properties of Soils, Fifteenth Edition. Pearson, USA.
13.12.1 Add lime or similar chemicals before/after planting non-woody
plants: freshwater wetlands
We found no studies that evaluated the effects, on vegetation, of adding neutralizing chemicals to freshwater wetlands planted with emergent, non-woody plants.
This means that we have not yet found any studies that have directly evaluated this intervention during our systematic journal and report searches. Therefore we have no evidence to indicate whether or not the intervention has any desirable or harmful effects.
13.12.2 Add lime or similar chemicals before/after planting non-woody
plants: brackish/saline wetlands
Three studies evaluated the effects, on vegetation, of adding neutralizing chemicals to brackish/ saline wetlands planted with emergent, non-woody plants. Two studies were in Canada2a,2b. One study was in the USA1. One study was in a greenhouse2b.
VEGETATION COMMUNITY
VEGETATION ABUNDANCE
Characteristic plant abundance (1 study): One replicated, paired, controlled, before-and-after study in salt-contaminated bogs in Canada2a reported that liming reduced the above-ground biomass of planted salt marsh vegetation after one year.
Individual species abundance (2 studies): One controlled study in former borrow pits in the USA1 found that limed and unlimed plots supported similar biomass of a planted herb species after 1–2 growing seasons. In contrast, one replicated, randomized, paired, controlled study in salt-contaminated peat in Canada2b found that limed pots supported lower biomass of two sown herb species than unlimed pots, after four months.

13. Actions to complement planting
502
VEGETATION STRUCTURE
OTHER
Germination/emergence (1 study): One replicated, randomized, paired, controlled study in salt-contaminated peat in Canada2b found that for each of two sown herb species, germination rates were similar in limed and unlimed pots.
A controlled study in 1980–1981 on reprofiled borrow pits in North Carolina, USA (1) found that liming had no significant effect on the biomass of planted smooth cordgrass Spartina alterniflora. Limed and unlimed plots supported statistically similar above-ground cordgrass biomass in seven of seven comparisons after one growing season (limed: 7–172 g/m2; unlimed: 6–100 g/m2) and in one of one comparisons after two growing seasons (limed: 2,380 g/m2; unlimed: 1,804 g/m2). The result was the same when lime was applied to fertilized or unfertilized plots, and at two different lime doses (see original paper). Methods: In June 1980, wild-harvested smooth cordgrass plants were planted into coastal land that had been reprofiled (to 6–43 cm above mean sea level; salinity <20 ppt) after excavation of sediment for construction. The site was dry during planting but rewetted after. Some plants were limed after planting (dolomitic limestone; 2,240–4,500 kg/ha) whilst others were not limed. The study does not clearly report the experimental design (including number of plants and plots). In October 1980 and 1981, living cordgrass was cut from 0.25-m2 quadrats then dried and weighed.
A replicated, paired, controlled, before-and-after study in 2011–2012 in two salt-contaminated bogs in New Brunswick, Canada (2a) found that liming reduced the biomass of planted salt marsh vegetation. After one year, limed plots supported a lower above-ground biomass of planted vegetation (26 g/m2) than unlimed plots (42 g/m2). This result is not based on an assessment of statistical significance. Methods: In summer 2011, eighty 9-m2 plots were established (in four blocks of 20) on bare, salt-contaminated peat (0.5–1.4 ppt). Sixty-four of the plots were planted with vegetation (chaffy sedge, prairie cordgrass, or mixed salt marsh plant fragments). Half of the plots were limed (18 g in planting holes; increasing soil pH to 3.8). The other half were not (soil pH 3.5). Some limed and unlimed plots were also fertilized. In July 2012, vegetation was cut from a 250-cm2 quadrat in each plot, then dried and weighed.
A replicated, randomized, paired, controlled study in 2011–2012 in a greenhouse in New Brunswick, Canada (2b) found that liming had no significant effect on seed germination rate of two salt marsh herbs, but reduced the height of transplants of one species and reduced the above-ground biomass of both. For both species, a statistically similar number of seeds germinated over two months in limed and unlimed pots (data not reported). After four months, chaffy sedge Carex paleacea transplants were shorter in limed than unlimed pots, whilst prairie cordgrass Spartina pectinata height did not significantly differ between limed and unlimed plots (data not reported). However, above-ground biomass of transplants was significantly lower for limed than unlimed chaffy sedge (high lime: 30; low lime: 50; no lime: 87 g/m2) and significantly lower for heavily limed than unlimed prairie cordgrass (high lime: 31; low lime: 54; no lime: 69 g/m2). Methods: In October 2011, five pots of salt-contaminated peat were planted per treatment: sedge or cordgrass, with no lime (pH 3.8), low lime (2.5 kg/m3; pH 4.7) or high lime (7.5 kg/m3; pH 6.2). Pots were kept in five groups, each containing one pot of each treatment. Seeds and transplants were kept in the dark at 4°C for three months before planting. Seeds were also kept in

13. Actions to complement planting
503
brackish water for two weeks before sowing. Seed germination was recorded after two months. After four months, all transplants were measured, cut, dried and weighed.
(1) Broome S.W., Seneca E.D. & Woodhouse W.W. Jr. (1982) Establishing brackish marshes on graded upland sites in North Carolina. Wetlands, 2, 152–178.
(2) Emond C., Lapointe L., Hugron S. & Rochefort L. (2016) Reintroduction of salt marsh vegetation and phosphorus fertilisation improve plant colonisation on seawater-contaminated cutover bogs. Mires and Peat, 18, Article 17.
13.12.3 Add lime or similar chemicals before/after planting trees/shrubs:
freshwater wetlands
We found no studies that evaluated the effects, on vegetation, of adding neutralizing chemicals to freshwater wetlands planted with trees/shrubs.
This means that we have not yet found any studies that have directly evaluated this intervention during our systematic journal and report searches. Therefore we have no evidence to indicate whether or not the intervention has any desirable or harmful effects.
13.12.4 Add lime or similar chemicals before/after planting trees/shrubs:
brackish/saline wetlands
We found no studies that evaluated the effects, on vegetation, of adding neutralizing chemicals to brackish/saline wetlands planted with trees/shrubs.
This means that we have not yet found any studies that have directly evaluated this intervention during our systematic journal and report searches. Therefore we have no evidence to indicate whether or not the intervention has any desirable or harmful effects.
13.13 Add inorganic fertilizer (before/after planting)
Background
Inorganic fertilizer can provide nutrients that are in short supply, thereby increasing the initial survival and/or growth rate of introduced plants. Commonly added nutrients include nitrogen (N), phosphorous (P) and/or potassium (K). Fertilizer is usually added immediately before or immediately after planting. It may be sensible to add fertilizer when the focal site is not flooded, to reduce the risk of it dissolving or being washed away.
The effects of this intervention may be heavily dependent on the study context, especially initial site nutrient levels, the amount of fertilizer added, and when it is added. Adding fertilizer when nutrients are already abundant in a site could cause more harm than good, encouraging the growth of undesirable plants or algae and even inhibiting plant growth (Weinbaum et al. 1992).
Related interventions: Add inorganic fertilizer, other than to complement planting (12.17).
Weinbaum S.A., Johnson R.S. & DeJong T.M. (1992) Causes and consequences of overfertilization in orchards. HortTechnology, 2, 112–121.

13. Actions to complement planting
504
13.13.1 Add inorganic fertilizer before/after planting non-woody plants:
freshwater wetlands
Four studies evaluated the effects, on vegetation, of adding inorganic fertilizer to freshwater wetlands planted with emergent, non-woody plants. Two studies were in the USA2a,2b, one was in the Netherlands1 and one was in Ireland3. One of the studies in the USA was in a greenhouse2a.
VEGETATION COMMUNITY
VEGETATION ABUNDANCE
Individual species abundance (1 study): One replicated, paired, controlled study of lakeshores planted with bulrushes Scirpus spp. in the Netherlands1 found that fertilized and unfertilized plots contained a similar amount (density and biomass) of each bulrush species over three growing seasons.
VEGETATION STRUCTURE
Individual plant size (2 studies): Two replicated, controlled studies (one also paired) in the USA2a,2b found that adding fertilizer to mineral soil increased the biomass2a and/or number of shoots2a,2b of tussock sedge Carex stricta seedlings, 2–3 months after planting. However, in both studies, adding fertilizer had no significant or clear effect on sedge size in plots amended with compost and/or topsoil.
OTHER
Growth (1 study): One replicated, paired, controlled, before-and-after study in tubs of mining waste in Ireland3 found that adding fertilizer increased growth of planted sweetgrass Glyceria fluitans in one case but had no significant effect in another.
A replicated, paired, controlled study in 1987–1989 at the edges of three freshwater lakes in the Netherlands (1) found that adding fertilizer to plots planted with bulrushes Scirpus spp. had no significant effect on bulrush density (shoots/m2) or above-ground biomass (g/m2) over three growing seasons. This was true in six of six comparisons between fertilized and unfertilized plots (data not reported). Methods: In spring 1987, lakeshore bulrush Scirpus lacustris ssp. lacustris and saltmarsh bulrush Scirpus maritimus were each transplanted (12 plants/m2) into 24 plots (6–25 m2) at the margins of three freshwater lakes. In half of the plots at each site, fertilizer was buried alongside the roots of all plants (7.5 g/plant of Osmocote NPK). The other plots were not fertilized. All plots were fenced to exclude waterfowl. Bulrush shoots were counted, and shoot dry biomass estimated from length-mass relationships, in spring and summer until August 1989.
A replicated, controlled study in 1992 in a greenhouse in Iowa, USA (2a) found that fertilizing mineral soil increased the number of shoots and above-ground biomass of planted tussock sedge Carex stricta seedlings, but that fertilization typically had no significant effect after adding compost or topsoil. After three months and for plantings in mineral soil, fertilized seedlings were larger (5.4 shoots/plant; 1.3 g/plant) than unfertilized seedlings (3.3 shoots/plant; 0.6 g/plant). In contrast, in five of six comparisons involving plantings in mineral soil mixed with compost and/or topsoil, there was no significant difference in the size of fertilized seedlings (8.3–8.8 shoots/plant; 1.6–2.1 g/plant) and unfertilized seedlings (7.7–9.6 shoots/plant; 1.6–2.2 g/plant). Methods: In March 1992, tussock sedge seedlings were planted into 144 pots (probably one seedling/pot). Half of the pots were fertilized with Greensweep liquid lawn food (dose not clearly reported). All pots contained deep mineral soil,

13. Actions to complement planting
505
sometimes with compost and/or topsoil mixed in. They were watered to saturation. In June 1992, all sedge shoots were counted, harvested, dried and weighed.
A replicated, paired, controlled study in 1992 in a wet meadow restoration site in Iowa, USA (2b) found that adding fertilizer to mineral soil plots before planting tussock sedge Carex stricta seedlings increased the number of shoots they developed, but reported that fertilization had no clear effect after adding compost or topsoil. Two weeks after planting, sedges assigned to each treatment had a statistically similar number of shoots (4.7–5.8 shoots/plant). After two months and for plantings in mineral soil, seedlings in fertilized plots had developed significantly more shoots than seedlings in unfertilized plots (data not reported). In contrast, in two of two comparisons involving plantings in mineral soil amended with compost and/or topsoil, the number of shoots did not clearly differ between fertilized seedlings (11.5–14.3 shoots/plant) and unfertilized seedlings (12.2–15.5 shoots/plant). Statistical significance of these differences was not assessed. Methods: In June 1992, tussock sedge seedlings were planted into twelve sets of six 1-m2 plots of mineral soil (topsoil had been removed). The number of seedlings/plot was not clearly reported. Granular fertilizer (Scott’s® Starter Fertilizer) was rototilled into the surface of half of the plots (three plots/set). Some plots were also amended with topsoil and/or compost.
A replicated, paired, controlled, before-and-after study in 1996–1997 in tubs of mine tailings in Ireland (3) found that fertilization increased the growth of planted floating sweetgrass Glyceria fluitans in one trial, but had no significant effect in one other. One trial used tailings from Tara mines. Over 14 months, leaves grew more in length in fertilized tailings (total growth 42 m/tub) than unfertilized tailings (18 m/tub). After 14 months, above-ground biomass was greater in fertilized tailings (live: 9; dead; 8 g/tub) than unfertilized tailings (live: 3; dead; 3 g/tub). The other trial used tailings from Silvermines. After two months, neither leaf growth rate nor biomass significantly differed between fertilized and unfertilized tubs (see original paper for data). In a previous attempt to plant sweetgrass into Silvermines tailings, all plants died within 3–4 months. Methods: In July 1996 and 1997, six 50 litre plastic tubs of mine tailings were each planted with three sweetgrass runners. Fertilizer (700 kg/ha NPK) was mixed into three of the tubs before planting. Tubs were placed outside and kept flooded (10–15 cm water depth). Measurements were taken at planting (leaf length) and in September 1997 (leaf length, above-ground dry biomass).
(1) Clevering O.A. & van Gulik W.M.G. (1997) Restoration of Scirpus lacustris and Scirpus maritimus stands in a former tidal area. Aquatic Botany, 55, 229–246.
(2) van der Valk A.G., Bremholm T.L. & Gordon E. (1999) The restoration of sedge meadows: seed viability, seed germination requirements, and seedling growth of Carex species. Wetlands, 19, 756–764.
(3) McCabe O.M. & Otte M.L. (2000) The wetland grass Glyceria fluitans for revegetation of metal mine tailings. Wetlands, 20, 548–559.
13.13.2 Add inorganic fertilizer before/after planting non-woody plants:
brackish/saline wetlands
Seven studies evaluated the effects, on vegetation, of adding inorganic fertilizer to brackish/saline wetlands planted with emergent, non-woody plants. Four studies were in the USA1–4. Two of these2,3 were based in the same marsh, but used different experimental set-ups. Two studies were in Canada5,7. One study was in China6.
VEGETATION COMMUNITY

13. Actions to complement planting
506
VEGETATION ABUNDANCE
Overall abundance (2 studies): One replicated, randomized, paired, controlled study in intertidal brackish marshes in Canada5 found that adding fertilizer when planting wetland herbs typically had no significant effect on total live vegetation biomass, after two growing seasons. One replicated, paired, controlled, before-and-after study in salt-contaminated bogs in Canada7 found that overall vegetation biomass and cover were greater in fertilized than unfertilized plots, one year after introducing salt marsh vegetation.
Individual species abundance (6 studies): Six studies1–6 quantified the effect of this intervention on the abundance of individual plant species. For example, three replicated, randomized, paired, controlled studies in intertidal areas in the USA2–4 found that the abundance of cordgrasses Spartina spp. was typically similar in fertilized and unfertilized plots, 1–2 growing seasons after planting. This was true for density2–4, biomass2,4 and/or cover3. However, one controlled study on former borrow pits in the USA1 found that cordgrass Spartina spp. biomass was typically greater in fertilized than unfertilized plots, one growing season after planting. This study1 also found that fertilization typically reduced black rush Juncus roemarianus biomass, one growing season after planting.
VEGETATION STRUCTURE
Height (6 studies): Five replicated, controlled studies (four also paired, three also randomized) in brackish/saline wetlands in the USA2–4, China6 and Canada7 found that adding fertilizer had no significant effect on the height of planted/sown wetland herbs after 1–2 growing seasons. One controlled study on former borrow pits in the USA1 found that fertilized smooth cordgrass Spartina alterniflora was taller than unfertilized smooth cordgrass, two growing seasons after planting.
OTHER
Survival (4 studies): Three replicated, randomized, paired, controlled studies in intertidal areas in the USA2,3 and Canada5 found that adding fertilizer had no significant effect on the survival of planted wetland herbs over 1–2 growing seasons. One controlled study on former borrow pits in the USA1 reported that adding standard fertilizer to planting holes reduced the survival of planted big cordgrass Spartina cynosuroides, after one growing season.
A controlled study in 1979–1981 on reprofiled borrow pits in North Carolina,
USA (1) found that adding fertilizer typically increased the biomass and height of planted cordgrasses Spartina spp., but typically reduced the biomass of planted black rush Juncus roemerianus and sometimes reduced survival of big cordgrass Spartina cynosuroides. After one growing season, fertilized cordgrasses produced more above-ground biomass than unfertilized cordgrasses in 40 of 53 comparisons (for which fertilized: 64–464 g/m2; unfertilized: 6–55 g/m2) with no significant difference in the other 13 comparisons (for which fertilized: 31–177 g/m2; unfertilized: 8–43 g/m2). In contrast, fertilized black rush produced less above-ground biomass than unfertilized black rush in four of six comparisons (for which fertilized: 4 g/m2; unfertilized: 18 g/m2) with no significant difference in the other two comparisons (for which fertilized: 11–12 g/m2; unfertilized: 18 g/m2). After two growing seasons, smooth cordgrass Spartina alterniflora was taller when fertilized (144–152 cm) than when not fertilized (113 cm). Black rush height was not measured. Finally, the study reported that adding standard fertilizer to the planting hole reduced survival of big cordgrass (standard fertilizer: 5–23%; slow-release fertilizer or unfertilized: 80% survival after one growing season). Methods: In June 1979 and 1980, greenhouse-grown or wild-harvested vegetation was planted into reprofiled borrow pits (salinity <20 ppt). Some plants were fertilized (one of 18 different type/dose combinations placed in planting holes, next to planting holes or mixed into soil surface). Other plants were left

13. Actions to complement planting
507
unfertilized. The study does not clearly report the experimental design (including numbers of plants and plots). In October 1980 and 1981, living vegetation was cut from 0.25-m2 quadrats then dried and weighed.
A replicated, randomized, paired, controlled study in 1976–1977 on two intertidal mudflats in Texas, USA (2) found that applying fertilizer after planting smooth cordgrass Spartina alterniflora typically had no significant effect on its survival, height, density or biomass. After one growing season, cordgrass survival was statistically similar in fertilized and unfertilized plots in 12 of 12 comparisons (fertilized: 18–89%; unfertilized: 9–85%). After two growing seasons, cordgrass height was statistically similar under both treatments in 11 of 12 comparisons (for which fertilized: 117–127 cm; unfertilized: 110–122 cm; other comparison shorter in fertilized than unfertilized plots). After 1–2 growing seasons, cordgrass density was statistically similar under both treatments in 20 of 24 comparisons (for which fertilized: 2–252 stems/m2; unfertilized: <1–252 stems/m2; other comparisons a mix of higher and lower density in fertilized than unfertilized plots). Above-ground cordgrass biomass was statistically similar under both treatments in 24 of 24 comparisons (fertilized: 23–1,840 g/m2; unfertilized: 20–1,700 g/m2). The same was true for live and dead biomass separately (12 of 12 comparisons; see original paper for data). Methods: In July 1976, fifty-four 12.5-m2 plots were established across two intertidal mudflats. Smooth cordgrass (20–100 cm tall) was transplanted into each plot (50 plants/plot, 50 cm apart. Thirty-six of the plots (18 random plots/mudflat) were fertilized after planting (NPK; 12 or 24 g/m2). The other plots were not fertilized. Cordgrass was monitored in October–November 1976 and 1977. Monitoring included counting stems, measuring representative flowering stems, and cutting, drying and weighing three cordgrass plants/plot. This study used the same marsh as (3), but a different experimental set-up.
A replicated, randomized, paired, controlled study in 1977 on intertidal sediment in Texas, USA (3) found that applying fertilizer had no significant effect on the survival, cover or height of planted smooth cordgrass Spartina alterniflora, and typically had no significant effect on its density. After two months and/or one growing season, fertilized and unfertilized plots supported similar cordgrass survival in two of two comparisons, had similar cordgrass cover in two of two comparisons, and contained cordgrass of similar height in four of four comparisons (data not reported). Fertilized and unfertilized plots had similar cordgrass densities in three of four comparisons (data not reported). In the other comparison, fertilized plots had higher cordgrass densities on average (17 stems/m2) than unfertilized plots (15 stems/m2). Neither fertilizer dose nor timing of application affected any result. Methods: In 1977, three hundred 15-m2 plots were established (in 30 sets of 10) at varying elevations on created intertidal land (sediment deposited and graded, protected by a breakwater and fenced). All plots were planted with field-collected cordgrass in February or May (60 plants/plot). Two hundred and forty plots (eight plots/set) were fertilized in one of four ways: high dose (244 kg/ha of N, P2O5 and K2O) or low dose (122 kg/ha of N, P2O5 and K2O), all before planting or split before and after planting. The other 60 plots (two plots/set) were not fertilized. After two months (April and July) and one growing season (November), the central 30 cordgrass plants in each plot were surveyed. This study used the same marsh as (2), but a different experimental set-up.
A replicated, randomized, paired, controlled study in 1990–1991 in a recently excavated estuarine marsh in California, USA (4) found that adding inorganic fertilizer to plots planted with California cordgrass Spartina foliosa had no significant effect on
13. Actions to complement planting
508
cordgrass biomass, stem density or plant height after two growing seasons. In four of four comparisons per metric, there was no significant difference between treatments in above-ground cordgrass biomass (fertilized: 180–420 g/m2; unfertilized: 100–500 g/m2), cordgrass density (fertilized: 40–90 stems/m2; unfertilized: 30–100 stems/m2) or average cordgrass height (data not reported). Results were similar after one growing season, with no significant difference between fertilized and unfertilized plots in at least three of four comparisons per metric (see original paper for data). Methods: In February 1990, twenty-eight 5-m2 plots were established, in four sets of seven, alongside a tidal creek in a recently excavated salt marsh. In 12 plots (three random plots/set), ammonium nitrate fertilizer was tilled into the surface (105 g/m2). Twelve plots (three random plots/set) were tilled but not fertilized. The final four plots (one random plot/set) were not even tilled. Some plots were also amended with organic matter. In March 1990, each plot was planted with cordgrass plants from ten 4-L pots. California cordgrass stems were counted and measured until October 1991. Dry biomass was estimated from heights.
A replicated, randomized, paired, controlled study in 1996–1997 in two degraded, intertidal, brackish marshes in Manitoba, Canada (5) found that adding fertilizer increased the cover of one of two planted herb species, but did not significantly affect survival rates of either species or overall above-ground biomass. On all five survey dates across the second growing season after planting, creeping alkaligrass Puccinellia phryganodes cover was higher in fertilized plots (1,720–5,400 mm2/m2) than in unfertilized plots (1,020–4,870 mm2/m2). However, cover of estuary sedge Carex subspathacea never significantly differed between treatments (fertilized: 670–2,880 mm2/m2; unfertilized: 670–2,720 mm2/m2). On all five dates, survival rates were statistically similar under each treatment, for both alkaligrass (fertilized: 52–100%; unfertilized: 47–100%) and estuary sedge (fertilized: 24–58%; unfertilized: 23–50%). On at least two of three dates (results not clearly reported), live above-ground biomass was statistically similar under each treatment for both alkaligrass-dominated vegetation (fertilized: 47–178 g/m2; unfertilized: 29–99 g/m2) and sedge-dominated vegetation (fertilized: 1–4 g/m2; unfertilized: 1–4 g/m2). Methods: In June 1996, plugs of creeping alkaligrass and estuary sedge were transplanted from natural stands to 1-m2 plots within brackish marsh vegetation damaged by geese (one species/marsh; 12 plots/species; 42 plugs/plot). Two random quarters of each plot were fertilized with N and P at planting (10.5 g N/m2 and 4.5 g P/m2). Half of each plot was also mulched. All plots were fenced to exclude geese. Vegetation was surveyed in summer 1997. Survival and cover were monitored for planted plants in the centre of each plot. Vegetation samples were cut from the margins of each plot, then washed to remove dead biomass, dried and weighed.
A replicated, controlled, before-and-after study in an estuarine wetland in eastern China (6) found that adding urea before sowing seeds of seablite Suaeda salsa increased seablite biomass, but had no significant effect on its density or height. Five months after sowing, fertilized plots contained a greater above-ground biomass of seablite (640 g/m2) than unfertilized plots (396 g/m2). Meanwhile, there was no significant difference between treatments in seablite density (fertilized: 292 plants/m2; unfertilized: 365 plants/m2) or height (fertilized: 59 cm; unfertilized: 59 cm). Height was also statistically similar under both treatments for measurements taken 1–4 months after sowing (fertilized: 12–47 cm; unfertilized: 12–51 cm). Methods: In May 2009, three pairs of 6-m2 plots were established in a degraded, unvegetated, hypersaline/alkaline wetland in the Yellow River estuary. Three plots

13. Actions to complement planting
509
were prepared by ploughing (to 20 cm depth) and mixing in urea (130 kg N/ha). The other three plots had been prepared by ploughing only. Approximately 5,000 seablite seeds were sown onto each plot, then watered. Vegetation was sampled in five 1-m2 quadrats/plot until October 2009. Biomass measurements involved samples of approximately 100 plants/plot.
A replicated, paired, controlled, before-and-after study in 2011–2012 in two salt-contaminated bogs in New Brunswick, Canada (7) found that adding fertilizer before introducing vegetation increased overall vegetation cover and above-ground biomass, but had no significant effect on the height of transplanted herbs. After one year, fertilized plots contained more vegetation overall than unfertilized plots. This was true in terms of cover (fertilized: 25%; unfertilized: 13%) and above-ground biomass (fertilized: 161 g/m2; unfertilized: 86 g/m2). Meanwhile, the height of transplanted vegetation did not significantly differ between fertilized and unfertilized plots. This was true for chaffy sedge Carex paleacea (fertilized: 36 cm; unfertilized: 31 cm) and prairie cordgrass Spartina pectinata (fertilized: 25 cm; unfertilized: 19 cm). Methods: In summer 2011, eighty 9-m2 plots were established (in four blocks of 20) on bare, salt-contaminated peat (0.5–1.4 ppt). Sixty-four of the plots were planted with vegetation (chaffy sedge, prairie cordgrass, or mixed salt marsh plant fragments). Half of the plots were fertilized (9 g rock phosphate fertilizer in planting holes) and half were left unfertilized. Some fertilized and unfertilized plots were also limed. In July 2012, vegetation cover was recorded in one 4-m2 quadrat in each plot. Vegetation was cut from a 250-cm2 quadrat then dried and weighed.
(1) Broome S.W., Seneca E.D. & Woodhouse W.W. Jr. (1982) Establishing brackish marshes on graded upland sites in North Carolina. Wetlands, 2, 152–178.
(2) Tanner G.W. & Dodd J.D. (1985) Effects of phenological stage of Spartina alterniflora transplant culms on stand development. Wetlands, 4, 57–74.
(3) Webb J.W. & Dodd J.D. (1989) Spartina alterniflora response to fertilizer, planting dates, and elevation in Galveston Bay, Texas. Wetlands, 9, 61–72.
(4) Gibson K.D., Zedler J.B. & Langis R. (1994) Limited response of cordgrass (Spartina foliosa) to soil amendments in a constructed marsh. Ecological Applications, 4, 757–767.
(5) Handa I.T. & Jeffries R.L. (2000) Assisted revegetation trials in degraded salt-marshes. Journal of Applied Ecology, 37, 944–958.
(6) Guan, B., Yu J., Lu Z., Xie W., Chen X. & Wang X. (2011) 黄河三角洲重度退化滨海湿地盐地碱蓬的生态修复效果
(The ecological effects of Suaeda salsa on repairing heavily degraded coastal saline-alkaline wetlands in the Yellow River Delta). Acta Ecologica Sinica, 31, 4835–4840.
(7) Emond C., Lapointe L., Hugron S. & Rochefort L. (2016) Reintroduction of salt marsh vegetation and phosphorus fertilisation improve plant colonisation on seawater-contaminated cutover bogs. Mires and Peat, 18, Article 17.
13.13.3 Add inorganic fertilizer before/after planting trees/shrubs:
freshwater wetlands
Two studies evaluated the effects, on vegetation, of adding inorganic fertilizer to freshwater wetlands planted with trees/shrubs. Both studies were in the USA.
VEGETATION COMMUNITY
VEGETATION ABUNDANCE
VEGETATION STRUCTURE
Height (1 study): One replicated, paired, controlled study in the USA2 found that adding fertilizer had no significant effect, after two years, on the height of tree saplings planted into floating peat bags.

13. Actions to complement planting
510
Diameter, perimeter, area (1 study): The same study2 found that adding fertilizer had no significant effect, after two years, on the diameter of two of three tree species planted into floating peat bags. However, fertilized pond apple Annona glabra saplings had thicker stems than unfertilized saplings.
OTHER
Growth (1 study): One replicated, randomized, controlled study in the USA1 found that adding fertilizer increased the growth rate of baldcypress Taxodium distichum seedlings planted into a marsh. This was true for both diameter and height growth.
A replicated, randomized, controlled study in 1992 in a freshwater marsh in Louisiana, USA (1) found that adding fertilizer increased growth of planted baldcypress Taxodium distichum seedlings. Over one growing season, fertilized seedlings grew more than unfertilized seedlings in both diameter (fertilized: 0.76 cm; unfertilized: 0.41 cm) and height (data not reported). Fertilizer had a bigger effect on diameter growth for seedlings within plastic guards than without (data not reported), but had a similar effect on diameter growth whether vines were cleared (fertilized seedlings grew 0.31 cm more than unfertilized) or not (fertilized seedlings grew 0.33 cm more than unfertilized). Methods: In January 1992, four hundred baldcypress seedlings were planted into a marsh – with the aim of restoring the swamp that was logged around 80 years previously. Of the 400 seedlings, 200 random seedlings were fertilized (28 kg/ha time-released Osmocote NPK) and 200 were not. An equal number of fertilized and unfertilized seedlings received additional treatments: plastic guards as protection from herbivores and/or clearing competing vines. Seedling diameter and height were measured at planting (January 1992) and after one growing season (October 1992).
A replicated, paired, controlled study in 2013–2015 in an ephemeral freshwater marsh in Florida, USA (2) reported that adding fertilizer typically had no significant effect on tree sapling height or diameter. Three species were planted: pond apple Annona glabra, red maple Acer rubrum, and strangler fig Ficus aurea. After two years, the height of fertilized saplings did not significantly differ from unfertilized seedlings in six of six comparisons (fertilized: 97–151 cm; unfertilized: 80–127 cm). The same was true for sapling diameter in four of six comparisons (for which fertilized: 24–37 mm; unfertilized: 14–20 mm). In the other two comparisons, fertilized pond apple saplings were thicker (62–63 mm) than unfertilized saplings (45 mm). Saplings were 49–112 cm tall and 11–27 cm thick when planted. Methods: The study was testing methods to restore tree islands in marshy areas. In October 2013, fifteen nursery-reared saplings of each species were planted into peat bags (1 sapling/bag). The bags were punctured with multiple holes then floated on the marsh. Ten saplings/species were fertilized with Vigoro® Tree and Shrub fertilizer spikes (five saplings with one spike, five saplings with two spikes). Five saplings/species were not fertilized. The size of surviving seedlings was measured for up to two years after planting.
(1) Myers R.S., Shaffer G.P. & Llewellyn D.W. (1995) Baldcypress (Taxodium distichum (L.) Rich.) restoration in southeast Louisiana: the relative effects of herbivory, flooding, competition and macronutrients. Wetlands, 15, 141–148.
(2) Dreschel T.W., Cline E.A. & Hill S.D. (2017) Everglades tree island restoration: testing a simple tree planting technique patterned after a natural process. Restoration Ecology, 25, 696–704.

13. Actions to complement planting
511
13.13.4 Add inorganic fertilizer before/after planting trees/shrubs:
brackish/saline wetlands
We found no studies that evaluated the effects, on vegetation, of adding inorganic fertilizer to brackish/saline wetlands planted with trees/shrubs.
This means that we have not yet found any studies that have directly evaluated this intervention during our systematic journal and report searches. Therefore we have no evidence to indicate whether or not the intervention has any desirable or harmful effects.
13.14 Add below-ground organic matter (before/after planting)
Background
This section involves adding organic matter (i.e. remains or waste products of living organisms) below the ground surface (i.e. by mixing it into the sediment, or placing it into holes) to areas planted with marsh or swamp vegetation.
Organic matter could increase the initial survival and/or growth rate of introduced plants, helping them to establish. Organic matter directly supplies nutrients to growing plants, supplies carbon and energy to soil organisms (which can indirectly increase nutrient availability), helps bind the soil together, retains water during dry periods, and mediates soil temperature (Donahue et al. 1983; Weil & Brady 2016). However, the soil organic matter content of wetland soils may be reduced by disturbance. For example, drainage allows oxygen into the soil, whilst reprofiling removes surface layers rich in organic matter (Bruland et al. 2006). Substances than can be used to add organic matter to wetland soils include compost, sewage sludge, wood chips and seaweed extract.
Note that many studies testing this intervention do not separate the effects of adding organic matter and disturbing the soil/sediment. We have included such studies, as well as those that do separate the effects of these actions with appropriate controls.
Related interventions: Add below-ground organic matter, other than to complement planting (12.18); Add inorganic fertilizer before/after planting (13.13); Add surface mulch to complement planting (13.15).
Bruland G.L., Richardson C.J. & Whalen S.C. (2006) Spatial variability of denitrification potential and related soil properties in created, restored, and paired natural wetlands. Wetlands, 26, 1042–1056.
Donahue R.L., Shickluna J.C. & Robertson L.S. (1983) Soils: An Introduction to Soils and Plant Growth, Fifth Edition. Prentice-Hall, Englewood Cliffs, NJ, USA.
Weil R.R. & Brady N.C. (2016) The Nature and Properties of Soils, Fifteenth Edition. Pearson, USA.
13.14.1 Add below-ground organic matter before/after planting non-
woody plants: freshwater wetlands
Seven studies evaluated the effects, on vegetation, of adding below-ground organic matter to freshwater wetlands planted with emergent, non-woody plants. All seven studies were in the USA. Two of the studies were in a greenhouse1a,1b.
VEGETATION COMMUNITY
Overall richness/diversity (1 study): One replicated study of marshes alongside a stream in the USA4 found that adding compost before planting wetland herbs typically reduced overall plant

13. Actions to complement planting
512
species richness over the following three growing seasons. Richness was negatively related to the amount of soil organic matter in plots.
VEGETATION ABUNDANCE
Overall abundance (1 study): One replicated study of marshes alongside a stream in the USA4 found that adding compost before planting wetland herbs had no significant effect on total vegetation biomass after three growing seasons. Biomass was not significantly related to the amount of soil organic matter in plots.
Characteristic plant abundance (1 study): One replicated, randomized, paired, controlled, before-and-after study in an experimental wet basin in the USA3 found that adding sawdust to plots before sowing a mixture of target sedge meadow species had no significant effect on the density of target species overall or target grass-like species. Adding sawdust sometimes affected the density of target forbs, depending on the presence/diversity of a nurse crop.
Individual species abundance (2 studies): Two replicated, randomized, paired, controlled studies in wetlands in the USA3,5 quantified the effect of this intervention on the abundance of individual plant species. One study5 found that incorporating woodchips into soil mounds before planting tussock sedge Carex stricta reduced total tussock sedge cover after two growing seasons. The other study3 reported varying effects of sawdust addition on the abundance of individual plant species, depending on factors such as the species and presence/diversity of a nurse crop.
VEGETATION STRUCTURE
Individual plant size (4 studies): Three replicated, controlled studies (one also paired) in the USA1a,1b,1c found that mixing compost into the substrate before planting tussock sedge Carex stricta seedlings typically increased the biomass1a,1b and/or number of shoots1a,1c they developed over 2–3 months. However, in one of the studies1a, compost typically had no significant effect on top of other soil amendments. One replicated, randomized, paired, controlled study in a wetland in the USA5 found that incorporating woodchips into soil mounds had no significant effect on the biomass of planted tussock sedge Carex stricta, over two growing seasons.
OTHER
Germination/emergence (1 study): One replicated, randomized, paired, controlled study in an experimental wet basin in the USA3 found that seeds of mixed sedge meadow species had a similar germination rate, over 16 weeks after sowing, in plots with or without added sawdust.
Survival (2 studies): One replicated, randomized, controlled study in an excavated wetland in the USA2 found that planted lurid sedge Carex lurida tubers had a higher survival rate, after one year, in plots that had been amended with leaf litter than in unamended plots. One replicated, randomized, paired, controlled study in a wetland in the USA5 found that incorporating woodchips into soil mounds increased survival of planted tussock sedge Carex stricta in a drier area, but reduced its survival in a wetter area.
Growth (1 study): One replicated, randomized, paired, controlled study in a wetland in the USA5 found that incorporating woodchips into soil mounds had no significant effect on the growth rate of planted tussock sedge Carex stricta, over two growing seasons.
A replicated, controlled study in 1992 in a greenhouse in Iowa, USA (1a) found that mixing compost alone into mineral soil increased the number of shoots and above-ground biomass of planted tussock sedge Carex stricta seedlings, but typically had no significant effect on top of other soil amendments. After three months, sedge seedlings planted into a mixture of compost and mineral soil were larger (6.4 shoots/plant; 1.6 g/plant) than seedlings planted into mineral soil only (3.3 shoots/plant; 0.6 g/plant). Adding compost had no significant effect on sedge size in

13. Actions to complement planting
513
four of six other comparisons where it was an additional treatment (i.e. added to pots that were fertilized and/or amended with topsoil; see original paper for data). However, compost did increase sedge shoot density when added to fertilized pots (compost + fertilizer: 8.9 shoots/plant; fertilizer only: 5.4 shoots/plant) and sedge biomass when added to topsoil-amended pots (compost + topsoil: 2.1 g/plant; topsoil only: 1.6 g/plant). Methods: In March 1992, tussock sedge seedlings (6–8 weeks old) were planted into 144 pots (probably one seedling/pot). In half of the pots, compost was mixed in equal parts with whatever other soil was in the pots (mineral soil, sometimes mixed with topsoil). Some composted and uncomposted pots were also fertilized. All pots were watered to saturation. In June 1992, all sedge shoots were counted, harvested, dried and weighed.
A replicated, controlled study in 1992–1993 in a greenhouse in Iowa, USA (1b) found that adding organic matter to pots increased the above-ground biomass of tussock sedge Carex stricta seedlings. After three months, sedge seedlings planted into a mixture of compost and sand had developed more above-ground biomass (0.12–0.46 g/plant) than seedlings planted into sand only (0.02 g/plant). Above-ground sedge biomass was greater in pots with higher proportions of compost (e.g. 90% compost: 0.46 g/plant; 50% compost: 0.33 g/plant; 10% compost: 0.12 g/plant). Methods: In October 1992, two- to four-week-old tussock sedge seedlings were planted into 144 pots (probably one seedling/pot). Of these pots, 128 contained some composted garden waste (16 pots for each of 8 proportions: 10%, 20%, 33%, 50%, 67%, 80%, 90% or 100% compost vs sterile sand). The final 16 pots contained sterile sand only. Plants were harvested, dried and weighed in January 1993.
A replicated, paired, controlled study in 1992 in a wet meadow restoration site in Iowa, USA (1c) reported that adding compost to plots before planting tussock sedge Carex stricta seedlings increased the number of shoots they developed, whether compost was the only soil amendment or was additional to other amendments. Two weeks after planting, sedges assigned to each treatment had a statistically similar number of shoots (4.7–5.8 shoots/plant). After two months, sedge seedlings in plots amended with compost had more shoots (15.2 shoots/plant) than seedlings planted into unamended mineral soil (11.8 shoots/plant). The pattern was the same where compost was added to plots receiving other soil amendments, but statistical significance of these comparisons was not assessed (topsoil and/or fertilizer + compost: 14.3–15.5 shoots/plant; topsoil and/or fertilizer only: 11.5–12.2 shoots/plant). Methods: In June 1992, tussock sedge seedlings were planted into twelve sets of eight 1-m2 plots of mineral soil (topsoil had been removed). The number of seedlings/plot was not clearly reported. Composted garden waste was rototilled into the surface of half of the plots (four plots/set). Some plots were also amended with topsoil and/or fertilized.
A replicated, randomized, controlled study in 1991–1992 in an excavated freshwater wetland in Pennsylvania, USA (2) found that amending plots with leaf litter before planting lurid sedge Carex lurida tubers increased their survival. After one growing season, planted lurid sedge had a 79% survival rate in amended plots, on average, compared to only 38% than in unamended plots. Methods: In October 1991, lurid sedge tubers (number not reported) were planted into eight 6 x 6 m plots in a recently excavated wetland (formerly cropland). A 15-cm-thick layer of composted leaf litter was mixed into the top 15 cm of four plots before planting. The other four plots were not amended with leaf litter, and the soil was left undisturbed. All tubers were dug from nearby wetlands, planted 10 cm deep, then watered. Survival was last recorded in August 1992.

13. Actions to complement planting
514
A replicated, randomized, paired, controlled, before-and-after study in 2004–2005 in two wet basins in Minnesota, USA (3) found that adding sawdust to plots before sowing a mixture of sedge meadow species typically had no significant effect on their germination or abundance after one growing season. Sixteen weeks after sowing, the germination rate was statistically similar in plots with sawdust (48%) and plots without sawdust (47%). The same was true in four of four comparisons at earlier dates. After 16 weeks, plots under each treatment contained a statistically similar total density of target species (sawdust: 460–1,300; no sawdust: 370–1,100 shoots/m2) and target grass-like plants (sawdust: 190–690; no sawdust: 150–780 shoots/m2). The effect of sawdust addition on the total density of target forbs depended on the presence/diversity of a cover crop (see original paper for details). The study also reported data on the abundance of individual target species. Sawdust addition had no significant effect on 5 of 10 species for any metric and in any conditions (see original paper for details). Methods: In October 2004, seventy two 1-m2 plots were established (in six sets of 12) across two experimental, vegetation-free wet basins. In half of the plots (6 random plots/set), the top 7 cm of soil was replaced with cedar Thuja sp. sawdust. The plots were then tilled. In May 2005, seeds of 10 target sedge meadow species were sown onto all 72 plots (total 2,250 seeds/m2). Some plots were also sown with other species, as cover crops and/or experimental invaders (reed canarygrass Phalaris arundinacea). Target vegetation was surveyed for 16 weeks after sowing. Seedlings were counted in five 100-cm2 subplots/plot. Shoot density and cover were monitored across the whole of each plot.
A replicated study in 2004–2006 of freshwater marshes alongside a recently reprofiled stream in North Carolina, USA (4) found that adding compost to planted plots typically reduced plant species richness over three growing seasons, but had no significant effect on vegetation biomass. Total plant species richness was negatively related to the amount of soil organic matter in plots, both one and three growing seasons after amendment/planting. There was a similar but insignificant trend after two growing seasons. Above-ground vegetation biomass was not significantly related to the amount of soil organic matter three growing seasons after amendment/planting (data not reported after one and two growing seasons). However, there was a trend towards higher biomass in plots with more organic matter. For data and statistical models, see original paper. Methods: Around July 2004, twenty-one 20-m2 wetland plots alongside a recently re-meandered stream were planted with various herb species (one plant/m2). Fourteen plots had been amended with varying amounts of compost (a mix of topsoil, wood chips and sewage sludge) whilst seven plots had been amended with topsoil only. As a result, the organic matter content of the plots ranged from 6% to 25%. All plots were tilled after adding compost/topsoil. In September 2004–2006, all plant species were counted in 11 of the plots. In September 2006, vegetation was cut from all 21 plots (three 0.5-m2 quadrats/plot), then dried and weighed.
A replicated, randomized, paired, controlled study in 2012–2013 in a freshwater wetland in Wisconsin, USA (5) reported that adding woodchips to soil before planting tussock sedge Carex stricta had mixed effects on sedge survival depending on soil moisture levels, but did not increase sedge growth, biomass or cover under either moisture level. Unless specified, statistical significance was not assessed. After two growing seasons and in a drier area, 67% of sedges survived when planted into mounds with woodchips vs only 27% in mounds without. However, in a wetter area, only 60% of sedges survived when planted into mounds with woodchips vs 93% in

13. Actions to complement planting
515
mounds without. In both areas, mounds with and without woodchips supported a statistically similar sedge growth rate (see original paper for data) and final above-ground biomass of surviving sedges (with: 2–15 g/plant; without: 2–8 g/ plant). Final sedge cover was lower in plots where sedges were planted into mounds with woodchips (11–18%) than mounds without (38%). Methods: In spring 2012, six pairs of 1-m2 plots were established in a wetland undergoing restoration. Five 16-cm-tall mounds were built in each plot. In half of the plots (one random plot/pair), the mounds were built with a mix of 50% woodchip and 50% soil. In the other plots, the mounds were built with soil only. Nursery-reared tussock sedge was planted into each mound (one plant/mound), then regularly watered and weeded. Survival and above-ground biomass of planted sedges, and total tussock sedge cover, were surveyed in June–August 2013. Biomass was dried before weighing. Growth rates were calculated from leaf lengths measured in 2012 and 2013.
(1) van der Valk A.G., Bremholm T.L. & Gordon E. (1999) The restoration of sedge meadows: seed viability, seed germination requirements, and seedling growth of Carex species. Wetlands, 19, 756–764.
(2) Stauffer A.L. & Brooks R.P. (1997) Plant and soil responses to salvaged marsh surface and organic matter amendments at a created wetland in central Pennsylvania. Wetlands, 17, 90–105.
(3) Iannone B.V. III & Galatowitsch S.M. (2008) Altering light and soil N to limit Phalaris arundinacea reinvasion in sedge meadow restorations. Restoration Ecology, 16, 689–701.
(4) Sutton-Grier A., Ho M. & Richardson C.J. (2009) Organic amendments improve soil conditions and denitrification in a restored riparian wetland. Wetlands, 29, 343–352.
(5) Doherty J.M. & Zedler J.B. (2015) Increasing substrate heterogeneity as a bet-hedging strategy for restoring wetland vegetation. Restoration Ecology, 23, 15–25.
13.14.2 Add below-ground organic matter before/after planting non-
woody plants: brackish/saline wetlands
Six studies evaluated the effects, on vegetation, of adding below-ground organic matter to brackish/ saline wetlands planted with emergent, non-woody plants. Five studies were in the USA1,2a,2b,3,5 and one was in China4. Two studies2a,2b were in the same marsh, but used different experimental set-ups.
VEGETATION COMMUNITY
VEGETATION ABUNDANCE
Individual species abundance (5 studies): Three replicated, randomized, controlled studies in the USA1,3,5 found that adding organic matter before/after planting cordgrasses Spartina spp. typically had no significant effect on cordgrass abundance (biomass1,3 and/or density1,5) after 1–2 growing seasons. One replicated, paired, controlled study in an estuary in the USA2a found that mixing kelp compost into the sediment before planting California cordgrass Spartina foliosa increased its density, three growing seasons later. One replicated, controlled, before-and-after study in an estuary in China4 found that mixing reed debris into the sediment before sowing seablite Suaeda salsa increased its biomass, but not its density, five months later.
VEGETATION STRUCTURE
Individual plant size (1 study): One replicated, randomized, paired, controlled study in an estuary in the USA2b found that tilling compost into plots before planting salt marsh vegetation typically increased the overall size of plants surviving after 1–2 growing seasons. Size was reported as a combination of height and lateral spread.
Height (5 studies): Four replicated, controlled studies in the USA1,3,5 and China4 found that adding organic matter before/after introducing salt marsh plants (cordgrasses Spartina spp.1,3,5 or seablite

13. Actions to complement planting
516
Suaeda salsa4) had no significant effect on their height after 1–2 growing seasons. One replicated, paired, controlled study in an estuary in the USA2a found that mixing kelp compost into the sediment before planting California cordgrass Spartina foliosa increased its height, three growing seasons later.
OTHER
Survival (1 study): One replicated, randomized, paired, controlled study in an estuary in the USA2b found that plots amended with kelp compost supported a higher survival rate of planted salt marsh vegetation over 1–2 growing seasons, with a similar but typically insignificant trend for survival rates of individual species.
Growth (1 study): One replicated, randomized, controlled study in a greenhouse in the USA3 found that adding alginate after planting cordgrasses had no significant effect on the average number of shoots per plant, nine weeks later.
A replicated, randomized, paired, controlled study in 1990–1991 in a recently excavated estuarine marsh in California, USA (1) found that tilling organic matter into plots before planting California cordgrass Spartina foliosa typically had no significant effect on cordgrass biomass, stem density or plant height. This was true after both one and two growing seasons. For example, after two growing seasons, plots amended with organic matter contained a similar cordgrass biomass to unamended plots in five of six comparisons (for which amended: 100–220 g/m2; unamended: 290–500 g/m2), a similar cordgrass density to unamended plots in five of six comparisons (for which amended: 70–100 stems/m2; unamended: 30–50 stems/m2), and cordgrass of a similar height to unamended plots in six of six comparisons (data not reported). Methods: In February 1990, twenty-eight 5-m2 plots were established, in four sets of seven, alongside a tidal creek in a recently excavated salt marsh. In 16 plots (four random plots/set), organic matter was tilled into the surface (3 kg/m2 straw or alfalfa). Eight plots (two random plots/set) were tilled but did not receive organic matter. The final four plots (one random plot/set) were not even tilled. Inorganic fertilizer was also added to some plots. In March 1990, each plot was planted with cordgrass plants from ten 4-L pots. California cordgrass stems were counted and measured until October 1991. Dry biomass was estimated from heights.
A replicated, paired, controlled study in 1999–2002 in an estuary in California, USA (2a) found that mixing kelp compost into the sediment before planting California cordgrass Spartina foliosa increased its density and height. After three growing seasons, plots amended with kelp compost contained a higher density of California cordgrass (237 stems/m2) than unamended plots (126 stems/m2). The average height of California cordgrass was also greater in amended plots (48 cm) than unamended plots (37 cm). Methods: In winter 1999/2000, six pairs of 15 x 30 m plots were established during the excavation of a salt marsh. Kelp compost (an industrial waste product) was mixed into the top 30 cm of sediment in one plot/pair (2:1 sediment:compost ratio). No compost was added to the other six plots. In February 2000, plugs of California cordgrass (range 50–100 cm tall) were dug from a nearby marsh and planted (2 m apart) in the plots. In August 2002, cordgrass stems were counted and measured in four 0.25-m2 quadrats/plot (each with ≥15 stems). This study used the same marsh as (2b), but a different experimental set-up.
A replicated, randomized, paired, controlled study in 2000–2002 in an estuary in California, USA (2b) found that tilling kelp compost into plots before planting salt marsh plants increased their overall survival and size, but did not always have significant effects on the survival or size individual species. Over the first year after initial planting, dead plants were replaced by stock plants of a similar age. Fewer

13. Actions to complement planting
517
replacements were needed in composted plots (8 replacements/plot) than in uncomposted plots (tilled: 9.1; undisturbed: 9.7). Over the second year of the study, composted plots supported a higher number of surviving plants on average (3.5 survivors/plot) than uncomposted plots (tilled: 2.9; undisturbed: 2.8). However, the survival rate of individual species was similar under each treatment in 9 of 10 comparisons (for which composted: 42–92%; tilled: 31–72%; undisturbed: 19–86%). Across both years, surviving plants were typically larger in composted than uncomposted plots (data reported as an index combining height and lateral extent). This was true in four of four comparisons of the average size of plants per plot, and 16 of 20 comparisons of the average size of each species. Methods: In January 2000, one hundred and eight 2.24-m2 plots were established (in 6 sets of 18) on intertidal sediment excavated earlier that winter. Thirty-six plots (six random plots/set) received each soil treatment: tilling 40 L of kelp compost into the top 30 cm of soil, tilling only, or no disturbance (no compost or tilling). In December 2000, five greenhouse-reared plants (each a different species) were planted into each plot. Colonizing vegetation was removed until October 2001. Dead planted vegetation was replaced until December 2001 to maintain 36 plants/species/soil treatment. Survival, height and lateral spread of planted vegetation were recorded in August 2002. This study used the same marsh as (2a), but a different experimental set-up.
A replicated, randomized, controlled study in 2005 in a greenhouse in California, USA (3) found that adding alginate after planting California cordgrass Spartina foliosa had no significant effect on the number of shoots, plant height or plant biomass. After nine weeks, plants with added alginate had a statistically similar number of shoots (3.1 shoots/plant) to plots without added alginate (2.8 shoots /plant). Plants with and without added alginate were also of a statistically similar average height and above-ground biomass (data not reported). Methods: In spring 2005, twelve cordgrass plants were collected from salt marshes and planted in individual pots of natural wetland sediment. The pots were placed in a greenhouse with simulated tides. After 45 days acclimation, alginate (a carbon-rich seaweed extract) was added to a trench around six random plants (15 g/plant). A trench was dug around the other six plants but no alginate was added. The number of shoots (ramets) and the maximum height of each plant were measured for nine weeks after intervention. Plants were harvested, dried and weighed after nine weeks.
A replicated, controlled, before-and-after study in an estuarine wetland in eastern China (4) found that mixing reed debris into the sediment before sowing seeds of seablite Suaeda salsa increased seablite biomass, but had no significant effect on its density or height. Five months after sowing, plots amended with reed debris contained a greater above-ground biomass of seablite (771 g/m2) than unamended plots (396 g/m2). Meanwhile, there was no significant difference between treatments in seablite density (amended: 531 plants/m2; unamended: 365 plants/m2) or height (amended: 63 cm; unamended: 60 cm). Height was also statistically similar under both treatments for measurements taken 1–4 months after sowing (amended: 15–56 cm; unamended: 12–51 cm). Methods: In May 2009, three pairs of 6-m2 plots were established in a degraded, unvegetated, hypersaline/alkaline wetland in the Yellow River estuary. Three plots were prepared by ploughing (to 20 cm depth) and mixing in reed debris (2 kg/m2). The other three plots had been prepared by ploughing only. Approximately 5,000 seablite seeds were sown onto each plot, then watered. Vegetation was sampled in five 1-m2 quadrats/plot until October 2009. Biomass measurements involved samples of approximately 100 plants/plot.

13. Actions to complement planting
518
A replicated, randomized, controlled, site comparison study in 2010–2012 in a salt marsh in Georgia, USA (5) found that adding alginate to the sediment before planting smooth cordgrass Spartina alterniflora had no significant effect on cordgrass density or height. The total number of live cordgrass stems increased by a statistically similar amount in plots with added alginate (from 35 stems/m2 at planting to 345 stems/m2 after 1–2 growing seasons) and plots without alginate (from 30 to 369 stems/m2). The same was true for the height of the tallest cordgrass plants (with alginate: from 48 to 58 cm; without alginate: from 45 to 56 cm). After three growing seasons, planted plots had a statistically similar live stem density to mature natural marshes (427 stems/m2) but taller plants than mature natural marshes (29 cm), whether alginate was added or not. The study noted a high sediment organic matter content (15%) before alginate addition. Methods: In May 2010, twenty 1-m2 plots were established on an intertidal mudflat where cordgrass had died off. All plots were planted with swards of cordgrass from nearby natural marsh, in nine holes 45 cm apart. In 10 random plots, 10 g of alginate (a carbon-rich seaweed extract) was poured into each hole before planting. Cordgrass stems were counted, and the five tallest stems/plot measured, in each plot over three growing seasons. A nearby natural marsh was also surveyed.
(1) Gibson K.D., Zedler J.B. & Langis R. (1994) Limited response of cordgrass (Spartina foliosa) to soil amendments in a constructed marsh. Ecological Applications, 4, 757–767.
(2) O'Brien E.L. & Zedler J.B. (2006) Accelerating the restoration of vegetation in a southern California salt marsh. Wetlands Ecology and Management, 14, 269–286.
(3) Cohen R.A., Walker K. & Carpenter E.J. (2009) Polysaccharide addition effects on rhizosphere nitrogen fixation rates of the California cordgrass, Spartina foliosa. Wetlands, 29, 1063–1069.
(4) Guan, B., Yu J., Lu Z., Xie W., Chen X. & Wang X. (2011) 黄河三角洲重度退化滨海湿地盐地碱蓬的生态修复效果
(The ecological effects of Suaeda salsa on repairing heavily degraded coastal saline-alkaline wetlands in the Yellow River Delta). Acta Ecologica Sinica, 31, 4835–4840.
(5) Cain J.L. & Cohen R.A. (2014) Using sediment alginate amendment as a tool in the restoration of Spartina alterniflora marsh. Wetlands Ecology and Management, 22, 439–449.
13.14.3 Add below-ground organic matter before/after planting trees/
shrubs: freshwater wetlands
One study evaluated the effects, on vegetation, of adding below-ground organic matter to freshwater wetlands planted with trees/shrubs. The study was in the USA.
VEGETATION COMMUNITY
Community composition (1 study): One replicated, randomized, paired, controlled study in a created wetland in the USA1 found that amongst plots planted with tree seedlings, those amended with large amounts compost contained a plant community characteristic of drier conditions, three years later, than the community in unamended plots. The lowest compost dose had no significant effect on this outcome.
Overall richness/diversity (1 study): The same study1 found that amongst plots planted with tree seedlings, those amended with a large amount of compost had lower plant species richness and diversity, three years later, than unamended plots. Lower compost doses had no significant effect on either outcome.
VEGETATION ABUNDANCE
Overall abundance (1 study): One replicated, randomized, paired, controlled study in a created wetland in the USA1 found that amongst plots planted with tree seedlings, those amended with compost supported a similar overall vegetation biomass, three years later, to unamended plots.

13. Actions to complement planting
519
VEGETATION STRUCTURE
Individual plant size (1 study): One replicated, randomized, paired, controlled study in a created wetland in the USA1 found that birch Betula spp. saplings were larger, three years after planting seedlings, in plots amended with large amounts of compost than in unamended plots.
A replicated, randomized, paired, controlled study in 2002–2005 in a created freshwater wetland in Virginia, USA (1) found that the effects of adding organic matter to plots planted with tree saplings depended on the dose added. Four different doses of organic matter were used. After approximately three years, plots receiving the three highest doses contained a plant community characteristic of drier – but still wetland – conditions than unamended plots (data reported as a wetland indicator index). In plots receiving the two highest doses, birch Betula spp. saplings were significantly larger than in unamended plots (size calculated as an index combining height, stem diameter and crown diameter; data not reported). Plots receiving the highest dose had lower plant species richness (5.3 species/m2) than unamended plots (7.4 species/m2). The same was true for plant diversity (data reported as a diversity index). In all other comparisons, there were no significant differences between amended and unamended plots (see original paper for data). Further, at all four doses, above-ground vegetation biomass did not significantly differ between amended plots (580–790 g/m2) and unamended plots (604 g/m2). Methods: In June 2002, twenty 14-m2 plots were established, in four sets of five, on an 8-year-old created wetland. All plots were cleared and tilled. In July, organic matter (dry wood and garden compost) was mixed into the surface of 16 plots (four random plots/set, each with a different dose: 56, 112, 224 or 336 Mg/ha). The remaining four plots (one random plot/set) received no organic matter. In December 2002, ten saplings (five birch, five pin oak Quercus palustris) were planted in each plot and fertilized. Vegetation was surveyed in 2005. Plant species and cover were recorded monthly April–October. Surviving birch saplings were counted in June. Vegetation samples were cut in August, then dried and weighed.
(1) Bailey D.E., Perry J.E. & Daniels W.L. (2007) Vegetation dynamics in response to organic matter loading rates in a created freshwater wetland in southeastern Virginia. Wetlands, 27, 936–950.
13.14.4 Add below-ground organic matter before/after planting trees/
shrubs: brackish/saline wetlands
One study evaluated the effects, on vegetation, of adding below-ground organic matter to brackish/ saline wetlands planted with trees/shrubs. The study was in Brazil.
VEGETATION COMMUNITY
VEGETATION ABUNDANCE
VEGETATION STRUCTURE
OTHER
Survival (1 study): One replicated, randomized, controlled study in a coastal swamp in Brazil1 reported that adding manure to plots planted with tree seedlings had mixed effects on their survival over three years, depending on the species of tree and dose of manure.
Growth (1 study): The same study1 reported that adding manure to plots planted with tree seedlings had mixed effects on their growth over three years, depending on the species of tree and dose of manure.

13. Actions to complement planting
520
A replicated, randomized, controlled study in 2002–2005 in a degraded coastal swamp in southeast Brazil (1) reported that adding manure had mixed effects on survival and growth of planted tree seedlings over three years, depending on species, dose and metric. Manure increased survival for one of five planted species (manure: 77–83%; no manure: 67%) but reduced survival for two species (manure: 57–83%; no manure: 77–93%). For the other two species, manure either increased or reduced survival depending on the dose. Statistical significance of these survival results was not assessed. Manure had no significant effect on seedling growth in 20 of 30 comparisons. It did increase diameter growth in 4 of 10 comparisons, height growth in 4 of 10 comparisons, and canopy area growth in 2 of 10 comparisons (see original paper for data). However, manure did not consistently increase growth, across all metrics and doses, for any species. Methods: In May 2002, ninety seedlings of each of five tree species were planted, 1.5 m apart, into a degraded coastal swamp. Thirty seedlings/species received each manure treatment: 30 L/seedling, 15 L/seedling or none. The study does not report further details of the manure or application. Invasive trees and grasses were removed from the swamp before planting. The survival of each seedling was monitored until May 2005. The diameter, height and canopy area of each seedling were measured in August 2002 and August 2005.
(1) Zamith L.R. & Scarano F.R. (2010) Restoration of a coastal swamp forest in southeastern Brazil. Wetlands Ecology and Management, 18, 435–448.
13.15 Add surface mulch (before/after planting)
Background
Organic mulches (i.e. remains or waste products of living organisms) can be placed on the surface of wetlands to stabilize temperatures and humidity, and provide shade to germinating plants. This may create a more hospitable environment for establishment and growth of planted vegetation. Examples of substances than can be used as mulches include compost, straw, seagrass leaves and seaweed (macroalgae).
CAUTION: It may be necessary to sterilize mulch before applying it, with heat or radiation, to kill propagules of undesirable plants. Adding organic matter as a mulch may be less labour intensive than mixing it into the soil or sediment, but increases the risk of the material being washed away.
Related interventions: Add surface mulch, other than to complement planting (12.19); Add cover other than mulch to complement planting (13.16).
13.15.1 Add surface mulch before/after planting non-woody plants:
freshwater wetlands
One study evaluated the effects, on vegetation, of mulching freshwater wetlands planted with emergent, non-woody plants. The study was in Australia.
VEGETATION COMMUNITY
VEGETATION ABUNDANCE
Herb abundance (1 study): One replicated, randomized, paired, controlled study in floodplain swamps in Australia1 found that mulching with woodchips before planting native understory herbs either increased or had no significant effect on their overall cover, one year later.

13. Actions to complement planting
521
Individual species abundance (1 study): The same study1 found that mulching with woodchips before planting native understory herbs reduced the cover of one problematic species (common reed Phragmites australis) one year later, but had no significant effect on another (reed canarygrass Phalaris arundinacea).
VEGETATION STRUCTURE
A replicated, randomized, paired, controlled study in 2014–2015 in two degraded floodplain swamps in Victoria, Australia (1) found that mulching plots with woodchips before planting native understory herbs increased their cover in one of the swamps, but had no significant effect in the other. Cover was monitored one year after planting. In one swamp, invaded by common reed Phragmites australis, mulched plots had higher cover of native understory herbs (26%) than unmulched plots (4%). The mulched plots also had lower reed cover (mulched: 40%; unmulched: 73%). In the other swamp, invaded by reed canarygrass Phalaris arundinacea, mulched plots had statistically similar cover of native understory herbs (3%) to unmulched plots (2%). Canarygrass cover was also similar between treatments (mulched: 96%; unmulched: 99%). Methods: In February–March 2014, four 100-m2 plots were established in each of two floodplain wetlands. All plots had been recently cut and sprayed with herbicide (to control common reed or reed canarygrass) and fenced to exclude large animals. Four plots (two random plots/swamp) were mulched with eucalypt Eucalyptus sp. woodchips. All plots were then planted with native understory herbs (3 plants/m2; species not reported), plus shrubs (1 plant/m2) and tree seedlings (1 plant/2 m2). Vegetation was surveyed in March 2015, in five 1-m2 quadrats/plot.
(1) Greet J., King E. & Stewart-Howie M. (2016) Plastic weed matting is better than jute or woodchips for controlling the invasive wetland grass species Phalaris arundinacea, but not Phragmites australis. Plant Protection Quarterly, 31, 19–22.
13.15.2 Add surface mulch before/after planting non-woody plants:
brackish/saline wetlands
One study evaluated the effects, on vegetation, of mulching brackish/saline wetlands planted with emergent, non-woody plants. The study was in Canada.
VEGETATION COMMUNITY
VEGETATION ABUNDANCE
Overall abundance (1 study): One replicated, randomized, paired, controlled study in intertidal brackish marshes in Canada1 found that adding surface mulch after planting wetland herbs typically had no significant effect on total live vegetation biomass, two growing seasons later.
Individual species abundance (1 study): The same study1 found that adding surface mulch increased the cover of one of two planted herb species (creeping alkaligrass Puccinellia phryganodes) but had no significant effect on cover of the other species (estuary sedge Carex subspathacea). Cover was monitored over the second growing season after planting/mulching.
VEGETATION STRUCTURE
OTHER
Survival (1 study): One replicated, randomized, paired, controlled study in intertidal brackish marshes in Canada1 found that adding surface mulch had no significant effect on the survival of two of two planted herb species, after two growing seasons.

13. Actions to complement planting
522
A replicated, randomized, paired, controlled study in 1996–1997 in two degraded, intertidal, brackish marshes in Manitoba, Canada (1) found that adding surface mulch increased the cover of one of two planted herb species, but did not significantly affect survival rates of either species or overall above-ground biomass. On all five survey dates across the second growing season after planting, creeping alkaligrass Puccinellia phryganodes cover was higher in mulched plots (1,820–5,400 mm2/m2) than unmulched plots (1,090–3,810 mm2/m2). However, cover of estuary sedge Carex subspathacea never significantly differed between treatments (mulched: 670–2,880 mm2/m2; unmulched: 720–2,600 mm2/m2). On all five dates, survival rates were statistically similar under each treatment for both alkaligrass (mulched: 87–100%; unmulched: 52–93%) and estuary sedge (mulched: 28–58%; unmulched: 23–50%). On at least two of three dates (results not clearly reported), live above-ground biomass was statistically similar under each treatment for both alkaligrass-dominated vegetation (mulched: 45–178 g/m2; unmulched: 29–122 g/m2) and sedge-dominated vegetation (mulched: 1–4 g/m2; unmulched: 1–4 g/m2). Methods: In June 1996, plugs of creeping alkaligrass and estuary sedge were transplanted from natural stands to 1-m2 plots within brackish marsh vegetation damaged by geese (one species/marsh; 12 plots/species; 42 plugs/plot). Two random quarters of each plot were mulched after planting (5 mm layer of peat from a nearby marsh). Half of each plot was also fertilized. All plots were fenced to exclude geese. Vegetation was surveyed in summer 1997. Survival and cover were monitored for planted plants in the centre of each plot. Vegetation samples were cut from the margins of each plot, then washed to remove dead biomass, dried and weighed.
(1) Handa I.T. & Jeffries R.L. (2000) Assisted revegetation trials in degraded salt-marshes. Journal of Applied Ecology, 37, 944–958.
13.15.3 Add surface mulch before/after planting trees/shrubs: freshwater
wetlands
One study evaluated the effects, on vegetation, of mulching freshwater wetlands planted with trees/shrubs. The study was in Australia.
VEGETATION COMMUNITY
VEGETATION ABUNDANCE
Tree/shrub abundance (1 study): One replicated, randomized, paired, controlled study in floodplain swamps in Australia1 found that mulching with woodchips before planting native shrubs had no significant effect on their overall cover, one year later.
Individual species abundance (1 study): The same study1 found that mulching with woodchips before planting swamp gum Eucalyptus camphora seedlings had no significant effect on swamp gum cover, one year later. Mulching reduced cover of the problematic herb species in one of two swamps, but had no significant effect in the other.
VEGETATION STRUCTURE
Height (1 study): One replicated, randomized, paired, controlled study in floodplain swamps in Australia1 found that planted swamp gum Eucalyptus camphora seedlings reached a similar height, after one year, in mulched and unmulched plots.
A replicated, randomized, paired, controlled study in 2014–2015 in two degraded floodplain swamps in Victoria, Australia (1) found that mulching plots with

13. Actions to complement planting
523
woodchips before planting native shrubs and tree seedlings had no significant effect on their cover or height. One year after planting, mulched and unmulched plots had statistically similar cover of native shrubs (mulched: 5–14%; unmulched: 4–8%) and swamp gum Eucalyptus camphora (mulched: 6–20%; unmulched: 7–11%). Swamp gum saplings were a statistically similar height in mulched and unmulched plots (data not reported). Mulching reduced the cover of problematic common reed Phragmites australis in one swamp (mulched: 40%; unmulched: 73%) but had no significant effect on the cover of problematic reed canarygrass Phalaris arundinacea in the other (mulched: 96%; unmulched: 99%). Methods: In February–March 2014, four 100-m2 plots were established in each of two floodplain wetlands. All plots had been recently cut and sprayed with herbicide (to control common reed or reed canarygrass) and fenced to exclude large animals. Four plots (two random plots/site) were mulched with eucalypt Eucalyptus sp. woodchips. All plots were then planted with native shrubs (1 plant/m2; species not reported), swamp gum seedlings (1 plant/2 m2) and understory herbs (3 plants/m2). Vegetation was surveyed in March 2015, in five 1-m2 quadrats/plot.
(1) Greet J., King E. & Stewart-Howie M. (2016) Plastic weed matting is better than jute or woodchips for controlling the invasive wetland grass species Phalaris arundinacea, but not Phragmites australis. Plant Protection Quarterly, 31, 19–22.
13.15.4 Add surface mulch before/after planting trees/shrubs: brackish/
saline wetlands
We found no studies that evaluated the effects, on vegetation, of mulching brackish/saline wetlands planted with trees/shrubs.
This means that we have not yet found any studies that have directly evaluated this intervention during our systematic journal and report searches. Therefore we have no evidence to indicate whether or not the intervention has any desirable or harmful effects.
13.16 Add cover other than mulch (before/after planting)
Background
Planted vegetation may be damaged by hot, dry and bright conditions on bare wetland surfaces. Covers such as plastic mesh, sheets, or shelters for individual plants could ameliorate these factors and help planted vegetation to establish. The precise effect of covers may vary depending on the material used and how it is applied (e.g. to a large area vs individual plants; on the wetland surface vs suspended above the surface).
Related interventions: Add cover other than mulch, other than to complement planting (12.20); Add surface mulch to complement planting (13.15); Use fences or barriers to protect planted areas from physical damage, e.g. with tree guards or breakwaters (13.19).
13.16.1 Add cover other than mulch before/after planting non-woody
plants: freshwater wetlands
One study evaluated the effects, on vegetation, of adding cover other than mulch to freshwater wetlands planted with emergent, non-woody plants. The study was in Australia.

13. Actions to complement planting
524
VEGETATION COMMUNITY
VEGETATION ABUNDANCE
Tree/shrub abundance (1 study): One replicated, randomized, paired, controlled study in floodplain swamps in Australia1 found that covering plots with plastic or jute mats before planting native understory herbs increased their overall cover, one year later.
Individual species abundance (1 study): The same study1 found that covering plots with plastic or jute mats before planting native understory herbs reduced the cover of two problematic herb species, one year later.
VEGETATION STRUCTURE
A replicated, randomized, paired, controlled study in 2014–2015 in a degraded floodplain swamp in Victoria, Australia (1) found that covering plots with plastic or jute matting before planting native understory herbs increased their cover. One year after planting, plots with mats had higher cover of native understory herbs (18–33%) than plots without mats (2–4%). Plots with mats also had lower cover of problematic reed canarygrass Phalaris arundinacea and common reed Phragmites australis (4–28%) than plots without mats (73–99%). Methods: In February–March 2014, six 100-m2 plots were established in each of two floodplain wetlands. All plots had been recently cut and sprayed with herbicide (to control reed canarygrass or common reed) and fenced to exclude large animals. Four plots (two random plots/site) received each cover treatment: plastic weed matting, jute matting, or no matting. All plots were then planted with native understory herbs (3 plants/m2; species not reported), plus shrubs (1 plant/m2) and tree seedlings (1 plant/2 m2). Holes were cut in the matting to allow planting. Vegetation was surveyed in March 2015, in five 1-m2 quadrats/plot.
(1) Greet J., King E. & Stewart-Howie M. (2016) Plastic weed matting is better than jute or woodchips for controlling the invasive wetland grass species Phalaris arundinacea, but not Phragmites australis. Plant Protection Quarterly, 31, 19–22.
13.16.2 Add cover other than mulch before/after planting non-woody
plants: brackish/saline wetlands
We found no studies that evaluated the effects, on vegetation, of adding cover other than mulch to brackish/saline wetlands planted with emergent, non-woody plants.
This means that we have not yet found any studies that have directly evaluated this intervention during our systematic journal and report searches. Therefore we have no evidence to indicate whether or not the intervention has any desirable or harmful effects.
13.16.3 Add cover other than mulch before/after planting trees/shrubs:
freshwater wetlands
One study evaluated the effects, on vegetation, of adding cover other than mulch to freshwater wetlands planted with trees/shrubs. The study was in Australia.
VEGETATION COMMUNITY
VEGETATION ABUNDANCE

13. Actions to complement planting
525
Tree/shrub abundance (1 study): One replicated, randomized, paired, controlled study in floodplain swamps in Australia1 found that covering plots with plastic or jute mats before planting native shrubs had no significant effect on their overall cover, one year later.
Individual species abundance (1 study): The same study1 found that covering plots with plastic or jute mats before planting swamp gum Eucalyptus camphora seedlings had no significant effect on swamp gum cover, one year later. Covering plots with mats also reduced cover of two problematic herb species.
VEGETATION STRUCTURE
Height (1 study): One replicated, randomized, paired, controlled study in floodplain swamps in Australia1 found that planted swamp gum Eucalyptus camphora seedlings reached a similar height, after one year, in covered and uncovered plots. Covers were plastic or jute mats.
A replicated, randomized, paired, controlled study in 2014–2015 in two degraded floodplain swamps in Victoria, Australia (1) found that covering plots with plastic or jute matting before planting native shrubs and tree seedlings had no significant effect on their cover or height. One year after planting, plots with and without mats had statistically similar cover of native shrubs (mats: 7–14%; no mats: 4–8%) and swamp gum Eucalyptus camphora (mats: 11–22%; no mats: 7–11%). Swamp gum saplings were a statistically similar height in plots with and without mats (data not reported). Additionally, plots with mats had lower cover of problematic reed canarygrass Phalaris arundinacea and common reed Phragmites australis (4–28%) than plots without mats (73–99%). Methods: In February–March 2014, six 100-m2 plots were established in each of two floodplain wetlands. All plots had been recently cut and sprayed with herbicide (to control reed canarygrass or common reed) and fenced to exclude large animals. Four plots (two random plots/site) received each cover treatment: plastic weed matting, jute matting, or no matting. All plots were then planted with native shrubs (1 plant/m2; species not reported), swamp gum seedlings (1 plant/2 m2) and understory herbs (3 plants/m2). Holes were cut in the matting to allow planting. Vegetation was surveyed in March 2015, in five 1-m2 quadrats/plot.
(1) Greet J., King E. & Stewart-Howie M. (2016) Plastic weed matting is better than jute or woodchips for controlling the invasive wetland grass species Phalaris arundinacea, but not Phragmites australis. Plant Protection Quarterly, 31, 19–22.
13.16.4 Add cover other than mulch before/after planting trees/shrubs:
brackish/saline wetlands
One study evaluated the effects, on vegetation, of adding cover other than mulch to brackish/ saline wetlands planted with trees/shrubs. The study was in Mexico.
VEGETATION COMMUNITY
VEGETATION ABUNDANCE
VEGETATION STRUCTURE
OTHER
Growth (1 study): One controlled study on a sandflat in Mexico1 reported that planted black mangrove Avicennia germinans seedlings grew more in height, over six months, when shaded with black mesh than when not shaded.

13. Actions to complement planting
526
A controlled study on a saltflat in western Mexico (1) reported that planted black mangrove Avicennia germinans seedlings grew faster when shaded than when exposed. Statistical significance was not assessed. Over six months, the height of seedlings planted in a partially-shaded area increased by 0.20 mm/day (from 7.1 cm when planted to 11.0 cm after six months. Meanwhile, the height of seedlings planted in unshaded areas increased by only 0.03–0.09 mm/day (from 6.5–7.2 cm when planted to 7.8–8.5 cm after six months). Methods: In August–September (year not reported), 600 nursery-reared black mangrove seedlings were planted alongside four excavated tidal channels on a bare saltflat. Seedlings were 50–100 cm apart. The 150 seedlings alongside one channel were shaded with black mesh, which blocked 50% of incoming light. The height of surviving seedlings was recorded for approximately six months.
(1) Flores-Verdugo F., Zebadua-Penagos F. & Flores-de-Santiago F. (2015) Assessing the influence of artificially constructed channels in the growth of afforested black mangrove (Avicennia germinans) within an arid coastal region. Journal of Environmental Management, 160, 113–120.
13.17 Transplant wetland soil (before/after planting)
Background
Loose soil can be transplanted from a healthy marsh or swamp to a one that is being created or restored. Soil could simply be added to a recipient site, or be used to replace material in the recipient site.
Soil transplants can be useful to introduce a chemically and physically suitable substrate for growth of wetland vegetation, and a mixture of soil organisms such as bacteria, fungi and invertebrates (Anderson & Cowell 2004). Thus, soil transplants might be used to aid the initial survival and growth of introduced marsh or swamp plants. Soil transplants usually also contain a mixture of wetland plant seeds, roots, tubers or rhizomes, which could supplement the focal introduced vegetation to create a diverse, wetland-characteristic plant community.
CAUTION: This intervention inevitably causes damage to any donor site. Also, transplanted soil could contain invasive plants, animals or microorganisms. A possible solution to these problems is to use soil from healthy marshes or swamps that are earmarked for destruction. Using local donor sites could minimize the spread of invasive species, and make use of communities adapted to local conditions.
Other published names for this intervention include “salvaged marsh surface replacement”, transplanting “seed banks” and “mulching”. We restrict the latter term to the addition of organic matter that is largely free of plant propagules, e.g. domestic compost or seaweed, to the ground surface (see Section 13.15).
Related interventions: Transplant or replace wetland soil, other than to complement planting (12.26); Add upland topsoil before/after planting (13.11).
Anderson C.J. & Cowell B.C. (2004) Mulching effects on the seasonally flooded zone of west-central Florida, USA wetlands. Wetlands, 24, 811–819.
Brown S.C. & Bedford B.L. (1997) Restoration of wetland vegetation with transplanted wetland soil: an experimental study. Wetlands, 17, 424–437.

13. Actions to complement planting
527
13.17.1 Transplant wetland soil before/after planting non-woody plants:
freshwater wetlands
Two studies evaluated the effects, on vegetation, of transplanting wetland soil to freshwater wetlands planted with emergent, non-woody plants. One study was in the USA1 and one was in Canada2.
VEGETATION COMMUNITY
Community composition (1 study): One replicated, site comparison study of created freshwater marshes in the USA1 found that those amended with marsh soil developed plant communities characteristic of wetter conditions than unamended marshes. Most marshes had also been planted. All were ≥5 years old.
Overall richness/diversity (1 study): The same study1 found that marshes amended with marsh soil had similar (dry season) or lower (wet season) plant species richness and diversity to unamended marshes. Most marshes had also been planted. All were ≥5 years old.
VEGETATION ABUNDANCE
Overall abundance (1 study): One replicated, site comparison study of created freshwater marshes in the USA1 reported that amongst planted marshes, adding marsh soil had no significant effect on overall vegetation cover or biomass, after ≥5 years.
Characteristic plant abundance (1 study): One replicated, site comparison study of created freshwater marshes in the USA1 reported that amongst planted marshes, those also amended with marsh soil had greater cover of wetland-characteristic plants than unamended marshes, after ≥5 years.
Individual species abundance (1 study): One replicated, randomized, paired, controlled study in freshwater trenches in Canada2 found that adding peat-rich soil to pots of mine tailings before planting water sedge Carex aquatilis typically increased its above-ground biomass two growing seasons later.
VEGETATION STRUCTURE
OTHER
Survival (1 study): One replicated, randomized, paired, controlled study in freshwater trenches in Canada2 found that adding peat-rich soil to pots of mine tailings either increased or had no significant effect on survival of planted water sedge Carex aquatilis over two growing seasons.
A replicated, site comparison study in 1999–2000 of the ephemeral marsh zone in 33 created freshwater wetlands in Florida, USA (1) found that adding marsh soil before planting marsh vegetation created a plant community characteristic of wetter conditions and had season-specific effects on plant species richness and diversity, but had no significant effect on overall vegetation abundance. Whilst amended and unamended marshes both developed a wetland-characteristic plant community, the community in amended marshes was characteristic of significantly wetter conditions (data reported as a wetland indicator index). Amended marshes had 44–75% cover of wetland-characteristic plants (vs unamended marshes: 32–58%; statistical significance not assessed). In the wet season, plant species richness and diversity were similar or lower in amended marshes than unamended marshes (amended: 9; unamended: 11 species/m2; and diversity reported as an index). In the dry season, these metrics were similar or higher in amended marshes than unamended marshes (amended: 8; unamended: 7 species/m2; diversity reported as an index). Both treatments had statistically similar overall vegetation cover (amended: 54–83%;

13. Actions to complement planting
528
unamended: 49–76%) and above-ground biomass (amended: 87; unamended: 80 g/m2). Cover of plant groups (e.g. grasses/reeds, mosses, and tree/shrub seedlings) was generally similar in amended and unamended marshes (see original paper for data). Methods: Vegetation was surveyed in the marshy, seasonally flooded zone of 33 excavated wetlands (≥5 years old). All but one wetland had been planted with marsh vegetation (details not reported). Marsh soil had been spread on the surface of 17 of the sites, in a layer 15–30 cm thick. In November 1999 (wet season) and June 2000 (dry season), plant species and cover were recorded in three 1-m2 quadrats/marsh. In August 2000, vegetation was cut from three 0.25-m2 quadrats/ marsh, then dried and weighed.
A replicated, randomized, paired, controlled study in 2010–2011 in six experimental wetland trenches in Alberta, Canada (2) found that adding peat/mineral soil to mine tailings did not reduce survival of planted water sedge Carex aquatilis over two growing seasons, and typically increased the biomass of surviving sedges. In two of four comparisons, pots of mine tailings mixed with peat/mineral soil supported higher sedge survival (50–67%) than pots of raw mine tailings (24–44%). There was no significant difference between treatments in the other two comparisons (peat/mineral soil: 74%; raw tailings: 54–69%). In three of four comparisons, the above-ground biomass of surviving sedges was higher in pots of mine tailings mixed with peat/mineral soil (2.1–2.8 g/trench) than in pots of raw mine tailings (1.1–1.5 g/trench). There was no significant difference between treatments in the other comparisons (peat/mineral soil: 2.2 g/trench; raw tailings: 2.2 g/trench). Methods: In June 2010, water sedges were collected from a natural marsh and randomly planted into 192 one-gallon pots (number of plants/pot not clearly reported). Half of the pots contained mine tailings amended with a mixture of peat and mineral soil (1 part tailings to 2 parts peat/mineral soil). Half of the pots contained pure mine tailings (dense sediments, low in organic matter, rich in salts and metals). The pots were placed into six experimental wetland trenches: 16 amended pots and 16 raw tailings pots/trench. Surviving plants were harvested at the end of the 2011 growing season. Biomass was dried before weighing.
(1) Anderson C.J. & Cowell B.C. (2004) Mulching effects on the seasonally flooded zone of west-central Florida, USA wetlands. Wetlands, 24, 811–819.
(2) Roy M.-C., Mollard F.P.O. & Foote A.L. (2014) Do peat amendments to oil sands wet sediments affect Carex aquatilis biomass for reclamation success? Journal of Environmental Management, 139, 154–163.
13.17.2 Transplant wetland soil before/after planting non-woody plants:
brackish/saline wetlands
We found no studies that evaluated the effects, on vegetation, of transplanting wetland soil to brackish/saline wetlands planted with emergent, non-woody plants.
This means that we have not yet found any studies that have directly evaluated this intervention during our systematic journal and report searches. Therefore we have no evidence to indicate whether or not the intervention has any desirable or harmful effects.
13.17.3 Transplant wetland soil before/after planting trees/shrubs:
freshwater wetlands
We found no studies that evaluated the effects, on vegetation, of transplanting wetland soil to freshwater wetlands planted with trees/shrubs.

13. Actions to complement planting
529
This means that we have not yet found any studies that have directly evaluated this intervention during our systematic journal and report searches. Therefore we have no evidence to indicate whether or not the intervention has any desirable or harmful effects.
13.17.4 Transplant wetland soil before/after planting trees/shrubs:
brackish/saline wetlands
We found no studies that evaluated the effects, on vegetation, of transplanting wetland soil to brackish/saline wetlands planted with trees/shrubs.
This means that we have not yet found any studies that have directly evaluated this intervention during our systematic journal and report searches. Therefore we have no evidence to indicate whether or not the intervention has any desirable or harmful effects.
13.18 Introduce nurse plants (before/after planting)
Background
Nurse plants, also known as companion plants or pioneer plants, can be planted alongside focal plants to help the focal plants establish (Padilla & Pugnaire 2006). Nurse plants may benefit focal plants in variety of ways, including: trapping and stabilizing sediments, trapping propagules, mitigating harsh environmental conditions (e.g. temperature fluctuations and strong sunlight), attracting pollinators, deflecting herbivory away from focal species, and/or limiting weed establishment.
CAUTION: Nurse plant species must be chosen carefully. Species that spread easily or are very strong competitors can cause more harm than good. For example, the non-native mangrove apple Sonneratia apetala has been used to restore Chinese mangroves, but has spread into neighbouring forests (Ren et al. 2009). Use of non-native nurse plants may not always be ethically acceptable.
To be summarized as evidence for this intervention, studies must have (a) deliberately introduced nurse plants before planting target marsh or swamp vegetation, and (b) reported the effects of the nurse plants on other vegetation, not just the survival or growth of the nurse plants. Studies must have explicitly planted vegetation for its nursing effect. Studies are not summarized as evidence here if they planted target vegetation into existing nurse vegetation (e.g. Egerova et al. 2003; McKee et al. 2007), or examined spontaneous colonization amongst planted nurse vegetation.
Related interventions: Introduce nurse plants without introducing target marsh or swamp vegetation (12.21); introduce only target marsh or swamp vegetation (12.22–12.26).
Egerova J., Proffitt C.E. & Travis S.E. (2003) Facilitation of survival and growth of Baccharis halimifolia L. by Spartina alterniflora Loisel. in a created Louisiana salt marsh. Wetlands, 23, 250–256.
McKee K.L., Rooth J.E. & Feller I.C. (2007) Mangrove recruitment after forest disturbance is facilitated by herbaceous species in the Caribbean. Ecological Applications, 17, 1678–1693.
Padilla F.M. & Pugnaire F.I. (2006) The role of nurse plants in the restoration of degraded environments. Frontiers in Ecology and the Environment, 4, 196–202.
Ren H., Lu H., Shen W., Huang C., Guo Q., Li Z. & Jian S. (2009) Sonneratia apetala Buch.Ham in the mangrove ecosystems of China: an invasive species or restoration species? Ecological Engineering, 35, 1243–1248.

13. Actions to complement planting
530
13.18.1 Introduce nurse plants to aid focal non-woody plants: freshwater
wetlands
Two studies evaluated the effects, on vegetation, of introducing nurse plants to freshwater wetlands planted with emergent, non-woody plants. Both studies were on the same site in the USA, but used different experimental set-ups.
VEGETATION COMMUNITY
VEGETATION ABUNDANCE
Characteristic plant abundance (1 study): One replicated, randomized, paired, controlled, before-and-after study in an experimental wet basin in the USA2 found that sowing potential nurse plants alongside target sedge meadow species reduced the density of the target species overall, and of target grass-like species. Nurse plant addition sometimes affected the abundance of target forbs, depending on the presence of an invasive species and addition of sawdust to plots.
Individual species abundance (2 studies): Two replicated, randomized, paired, controlled, before-and-after studies in wet basins in the USA1,2 quantified the effect of this intervention on the abundance of individual plant species. One study1 reported that sowing potential nurse plants typically had no significant effect on – and sometimes reduced – the biomass of sown porcupine sedge Carex hystericina, after 1–2 growing seasons. The other study2 reported varying effects of potential nurse plants on the abundance of individual target plant species, depending on factors such as diversity of the nurse crop and addition of sawdust to plots.
VEGETATION STRUCTURE
OTHER
Germination/emergence (1 study): One replicated, randomized, paired, controlled study in an experimental wet basin in the USA2 found that the presence of a high-diversity nurse crop reduced the germination rate of sown sedge meadow species. A low-diversity nurse crop had no significant effect on their germination rate.
A replicated, randomized, paired, controlled, before-and-after study in 1997–1999 in a wet basin in Minnesota, USA (1) found that sowing two potential nurse plant species typically had no significant effect on above-ground biomass of sown porcupine sedge Carex hystericina, after 1–2 growing seasons. Amongst plots experimentally invaded with reed canarygrass Phalaris arundinacea, plots with and without nurse plants contained a statistically similar sedge biomass in 48 of 48 comparisons (with: 0–100 g/m2; without: 0–1 g/m2). Amongst plots that were not experimentally invaded, plots with and without nurse plants contained a statistically similar sedge biomass in 14 of 16 comparisons (with: 0–1,130 g/m2; without: 0–1,790 g/m2). In the other two comparisons, plots with nurse plants contained a lower sedge biomass (0 g/m2) than plots without (2–700 g/m2). Methods: In June 1997 and April 1998, four hundred and eighty 0.25-m2 plots were established (in five sets) in an experimental, vegetation-free wet basin. Porcupine sedge seeds were sown onto all 480 plots (500–5,000 seeds/m2). Seeds of one nurse plant species (either barnyardgrass Echinochloa crusgalli or nodding smartweed Polygonum lapathifolium) were sown onto 384 plots (125–5,000 seeds/m2). Reed canarygrass seeds were sown onto 336 plots (125–5,000 seeds/m2). Treatments were randomly allocated within sets of plots. Biomass was sampled from the centre of the plots – half after one growing season, half after two – then dried and weighed. This study used the same site as (2), but a different experimental set-up.

13. Actions to complement planting
531
A replicated, randomized, paired, controlled, before-and-after study in 2004–2005 in two wet basins in Minnesota, USA (2) found that sowing potential nurse species along with target sedge meadow species did not increase the germination rate or abundance of the target species after one growing season. Sixteen weeks after sowing, the germination rate was significantly lower in plots with a high-diversity nurse crop (33%) than plots with a low-diversity nurse crop (51%) or no nurse crop (61%). Plots with a nurse crop had a lower total density of the target species (with: 370–1,000; without: 980–1,300 shoots/m2) and target grass-like plants (with: 150–660; without: 660–780 shoots/m2). The effect of nurse crops on the total density of target forbs depended on presence of invasive reed canarygrass Phalaris arundinacea and addition of sawdust (see original paper for details). The study also reported data on the abundance of individual target species. Nurse crops had significant effect on 9 of 10 target species, although this sometimes depended on nurse crop diversity, canarygrass presence, sawdust addition and the outcome metric. For example, 6 of 10 target species had lower cover in plots with a high-diversity nurse crop than plots with no nurse crop (data reported as cover classes; see original paper for full details). Methods: In May 2005, seeds of 10 target sedge meadow species were sown onto seventy-two 1-m2 plots (total 2,250 seeds/m2) across two experimental, vegetation-free wet basins. The plots were grouped in six sets of 12. At the same time, a nurse crop was sown onto 48 plots (eight random plots/set; total 2,100 seeds/m2). This contained either five species (24 plots) or one species (24 plots). Some plots had also been amended with sawdust (October 2004) or sown with reed canarygrass (May 2005). Target vegetation was surveyed for 16 weeks after sowing. Seedlings were counted in five 100-cm2 subplots/plot. Shoot density and cover were monitored across the whole of each plot. This study used the same site as (1), but a different experimental set-up.
(1) Perry L.G. & Galatowitsch S.M. (2003) A test of two annual cover crops for controlling Phalaris arundinacea invasion in restored sedge meadow wetlands. Restoration Ecology, 11, 297–307.
(2) Iannone B.V. III & Galatowitsch S.M. (2008) Altering light and soil N to limit Phalaris arundinacea reinvasion in sedge meadow restorations. Restoration Ecology, 16, 689–701.
13.18.2 Introduce nurse plants to aid focal non-woody plants: brackish/
saline wetlands
One study evaluated the effects, on vegetation, of introducing nurse plants to brackish/saline wetlands planted with emergent, non-woody plants. The study was in the USA.
VEGETATION COMMUNITY
VEGETATION ABUNDANCE
VEGETATION STRUCTURE
OTHER
Germination/emergence (1 study): One replicated, controlled study in an estuary in the USA1 reported that planting nurse plants had no effect on germination of sown arrowgrass Triglochin concinna seeds. No seedlings were found around nurse plants or on bare sediment.
A replicated, controlled study in 2001 in an estuary in California, USA (1) reported that planting nurse plants before sowing seeds of arrowgrass Triglochin concinna had no effect on its germination. In the growing season after sowing, no

13. Actions to complement planting
532
arrowgrass seedlings were found – whether seeds were sown under nurse plants or onto bare sediment. The study suggests that high temperatures, high salinities and thick mats of microorganisms may have limited germination across the site. Methods: In March 2001, sets of 25 arrowgrass seeds were sown onto an area of recently reprofiled intertidal sediment. Of these, 288 sets were sown under planted adult nurse plants (alkali heath Frankenia salina, salt marsh daisy Jaumea carnosa or California sea lavender Limonium californicum; single plants or single-species clusters). A further 144 sets were sown onto bare sediment. All seeds sets were covered with burlap fabric after sowing. Any nurse plants that died were replaced. Seedlings were counted over the 2001 growing season.
(1) Zedler J.B., Morzaria-Luna H. & Ward K. (2003) The challenge of restoring vegetation on tidal, hypersaline substrates. Plant and Soil, 253, 259–273.
13.18.3 Introduce nurse plants to aid focal trees/shrubs: freshwater
wetlands
We found no studies that evaluated the effects, on vegetation, of introducing nurse plants to freshwater wetlands planted with trees/shrubs.
This means that we have not yet found any studies that have directly evaluated this intervention during our systematic journal and report searches. Therefore we have no evidence to indicate whether or not the intervention has any desirable or harmful effects.
13.18.4 Introduce nurse plants to aid focal trees/shrubs: brackish/saline
wetlands
One study evaluated the effects, on vegetation, of introducing nurse plants to brackish/saline wetlands planted with trees/shrubs. The study was in the USA.
VEGETATION COMMUNITY
VEGETATION ABUNDANCE
VEGETATION STRUCTURE
OTHER
Survival (1 study): One replicated, controlled study on a mudflat in the USA1 found that planting black mangrove Avicennia germinans seedlings into created stands of saltwort Batis maritima did not clearly affect their survival, over seven weeks, compared to planting into bare mud.
A replicated, controlled study in 2005 on a mudflat in Florida, USA (1) reported that planting saltwort Batis maritima as a nurse plant had no clear effect on survival of planted black mangrove Avicennia germinans. Statistical significance was not assessed. After seven weeks, 6% of black mangrove seedlings planted into newly created saltwort patches were alive, compared to 11% of black mangrove seedlings planted into a bare mudflat. This followed fluctuations over the previous six weeks, when mangrove survival was sometimes higher in saltwort stands than on the bare mudflat (two weeks), sometimes lower (three weeks) and sometimes equal (one week). Methods: In June 2005, saltwort seedlings were planted into a mudflat, where a former mangrove forest had died off, to create patches of saltwort. The study does not clearly report patch number, density or size. Within five days, 18 nursery-reared black

13. Actions to complement planting
533
mangrove seedlings were planted into the saltwort and 18 were planted into the adjacent bare mudflat. Survival was measured over seven weeks.
(1) Milbrandt E.C. & Tinsley M.N. (2006) The role of saltwort (Batis maritima L.) in regeneration of degraded mangrove forests. Hydrobiologia, 568, 369–377.
13.19 Use fences or barriers to protect planted areas
Background
Plants introduced to wetlands may be vulnerable to physical damage from grazing, wind, waves or sediment. Barriers could be used to protect planted vegetation from such physical damage. Here, “barriers” is used quite broadly and includes sleeves, tree guards, fences and fine-meshed silt screens placed around planted vegetation, sticky oils or resins painted onto planted vegetation, and offshore walls or breakwaters. Some of these barriers may have incidental effects on temperature, humidity and sunlight intensity (but covers and screens whose main aim is to modify these factors are considered elsewhere). If the general area containing planted vegetation is fenced, rather than individual planted plants, other colonizing vegetation may benefit too.
Related interventions: Use barriers to keep livestock off ungrazed marshes or swamps (3.8); Exclude or remove livestock from historically grazed marshes or swamps (3.9); Exclude wild vertebrates using physical barriers (9.15); Exclude wild invertebrates using physical barriers (9.17); Add surface mulch to complement planting (13.15); Add cover other than mulch to complement planting (13.16).
13.19.1 Use fences or barriers to protect freshwater wetlands planted
with non-woody plants
Four studies evaluated the effects, on vegetation, of using fences or barriers to protect freshwater wetlands planted with emergent, non-woody plants. There was one study in each of Canada1, the Netherlands2, Israel3 and the USA4.
VEGETATION COMMUNITY
Community composition (1 study): One replicated, site comparison study in the USA4 found that amongst planted/sown lakeshores, those protected with fences or wave breaks contained different wetland plant communities, after 1–6 years, than those without fences or wave breaks.
VEGETATION ABUNDANCE
Individual species abundance (1 study): One replicated, controlled study at the edge of a freshwater lake in the Netherlands2 found that amongst plots planted with lakeshore bulrush Scirpus lacustris, those from which wildfowl had been excluded contained a greater density and biomass of lakeshore bulrush, after 1–2 years, than those that remained open to wildfowl.
VEGETATION STRUCTURE
OTHER
Survival (2 studies): Two replicated, paired, controlled studies in freshwater wetlands in Canada1 and Israel3 reported that protecting emergent herbs, with silt screens or herbivore fencing, increased survival rates over 12–18 months after planting.

13. Actions to complement planting
534
A replicated, paired, controlled study in 1993–1994 in a freshwater marsh in Ontario, Canada (1) reported that silt screens increased survival of emergent vegetation one year after planting. Statistical significance was not assessed. In deep water (>40 cm at planting), 100% of planted arrowheads Sagittaria latifolia survived in a plot surrounded by a silt screen (vs 0% in a plot without a silt screen). In shallow water (15 cm at planting), the survival rate of planted broadleaf cattails Typha latifolia was more than twice as high in a screened plot than an unscreened plot (precise data not reported). Methods: In August 1993, two pairs of plots (one shallow-water, one deep-water) were established in Cootes Paradise Marsh. Each 6-m2 plot was planted with 90 plants: 30 arrowhead, 30 cattails and 30 submerged plants. All plots were fenced to exclude muskrats Ondatra zibethicus. Two plots (one plot/pair) were also surrounded by a finer-mesh silt screen. Vegetation was surveyed in August 1994. The study does not report full results from all plots.
A replicated, controlled study in 1987–1989 at the edge of a freshwater lake in the Netherlands (2) found that protecting plots planted with lakeshore bulrush Scirpus lacustris ssp. lacustris (using fences or wire netting) increased bulrush density and biomass after 1–2 years. In summer, fenced plots contained 300–360 bulrush shoots/m2 with above-ground biomass of 1,250–1,550 g/m2. Plots covered with wire netting contained 60–90 bulrush shoots/m2 with above-ground biomass of 110–280 g/m2. In unprotected plots, bulrush was not present. The pattern of results was similar, although density and biomass lower, in spring (see original paper). Methods: Twenty 6- or 16-m2 plots were established behind breakwaters at the edge of a lake. In May 1987, lakeshore bulrush was transplanted into all plots (12 plants/m2). Eight plots were then fenced to exclude wildfowl (12 cm wire mesh, 1.2 m tall). Six plots were covered in wire netting (2 cm holes) at ground level, to protect the roots from wildfowl. The final six plots were not protected. Lakeshore bulrush shoots were counted and measured in spring and summer 1988 and 1989. Above-ground dry biomass was estimated from length-mass relationships.
A replicated, paired, controlled study in the mid-1990s in a reflooded freshwater wetland in Israel (3) reported that fencing off planted emergent vegetation to protect it from herbivores increased its survival. Statistical significance was not assessed. In four of four comparisons, protected plants had higher survival rates (17–75%) than unprotected plants (0–10%) after 12–18 months. Methods: Emergent wetland plants were introduced to recently rewetted cropland. Yellow flag iris Iris pseudacorus was planted into peat soils flooded with 30 cm of water. Sixteen iris plants were protected and 50 were not. Papyrus Cyperus papyrus was planted into wet, saturated or flooded mineral soils. Seventy-two papyrus plants were protected and 72 were not. Protection involved fencing with wire mesh (5 x 5 cm holes) and plastic netting (mesh size not reported), primarily to exclude nutria Myocastor coypus.
A replicated, site comparison study in 2005–2006 of 22 lakeshore restoration sites in Minnesota, USA (4) reported that protecting planted lakeshores with fences or wave breaks affected the plant community composition 1–6 years later. Data were reported as graphical analyses and statistical significance was not assessed. In the seasonally flooded zone, protected sites developed communities of native perennial species such as Canadian reedgrass Calamagrostis canadensis and swamp milkweed Asclepias incarnata. Exposed sites were sparsely vegetated by annuals and weedy perennials. In the permanently flooded zone, protected sites generally developed emergent vegetation whilst exposed sites were dominated by submerged and floating vegetation. In two of five sites protected with wave breaks, all planted vegetation died.

13. Actions to complement planting
535
Methods: In summer 2005 and spring 2006, plant species and their cover were surveyed in 22 urban lakeshore restoration projects. Native vegetation (mostly emergent wetland herbs) had been planted or sown between 1999 and 2004. Protection involved onshore fences, offshore fences and/or wave breaks. Some fences completely enclosed sites and some partially enclosed sites. In eight sites, protection was only in place for the first growing season after planting.
(1) Chow-Fraser P. & Lukasik L. (1995) Cootes Paradise Marsh: community participation in the restoration of a Great Lakes coastal wetland. Restoration & Management Notes, 13, 183–189.
(2) Clevering O.A. & van Gulik W.M.G. (1997) Restoration of Scirpus lacustris and Scirpus maritimus stands in a former tidal area. Aquatic Botany, 55, 229–246.
(3) Kaplan D., Oron T. & Gutman, M. (1998) Development of macrophytic vegetation in the Agmon Wetland of Israel by spontaneous colonization and reintroduction. Wetlands Ecology and Management, 6, 143–150.
(4) Vanderbosch D.A. & Galatowitsch S.M. (2010) An assessment of urban lakeshore restorations in Minnesota. Ecological Restoration, 28, 71–80.
13.19.2 Use fences or barriers to protect brackish/saline wetlands
planted with non-woody plants
We found no studies that evaluated the effects, on vegetation, of using fences or barriers to protect brackish/saline wetlands planted with emergent, non-woody plants.
This means that we have not yet found any studies that have directly evaluated this intervention during our systematic journal and report searches. Therefore we have no evidence to indicate whether or not the intervention has any desirable or harmful effects.
13.19.3 Use fences or barriers to protect freshwater wetlands planted
with trees/shrubs
Five studies evaluated the effects, on vegetation, of using fences or barriers to protect freshwater wetlands planted with trees/shrubs. Four studies were in the USA1–3,5 and one was in Australia4.
VEGETATION COMMUNITY
VEGETATION ABUNDANCE
Tree/shrub abundance (1 study): One replicated, paired, controlled study in a floodplain swamp clearing in the USA3 found that amongst plots sown with tree seeds, fencing to exclude deer had no significant effect on total tree seedling density after three years.
VEGETATION STRUCTURE
Height (2 studies): One replicated, paired, controlled study in a floodplain swamp clearing in the USA3 found that amongst plots sown with tree seeds, those also fenced to exclude deer contained taller tree seedlings, after three years, than those left unfenced. One replicated, paired, controlled study in created freshwater wetlands in the USA5 found that the average height of white cedar Thuja occidentalis saplings typically increased by a similar amount, between two and five years after planting, in plots fenced to exclude deer and plots left unfenced.
OTHER
Survival (3 studies): One replicated, paired, controlled study in floodplain swamps in Australia4 reported that planted swamp gum Eucalyptus camphora seedlings had a much higher survival rate, over one year, in plots fenced to exclude mammals than in open plots. Two replicated, paired, controlled studies in freshwater wetlands in the USA1,5 reported that exclusion fencing sometimes

13. Actions to complement planting
536
increased survival of planted tree seedlings but sometimes had no clear or significant effect. This depended on factors such as the season of planting1, seedling elevation5, and site5.
Growth (1 study): One replicated, randomized, controlled study in a nutria-invaded wetland in the USA2 found that planted baldcypress Taxodium distichum seedlings grew more, over one growing season, when protected than when left unprotected. Plastic guards increased height and diameter growth rates. Sticky, insect-repellent oil increased the growth rate for height, but not diameter.
A replicated, paired, controlled study in 1985–1987 in a floodplain swamp in Louisiana, USA (1) reported that using chickenwire fencing to exclude herbivores increased survival of baldcypress Taxodium distichum seedlings planted in spring, but had no clear effect on survival of seedlings planted in autumn. Statistical significance was not assessed. For seedlings planted in spring, those surrounded by fencing had an 81–91% survival rate after one growing season and a 40–70% survival rate after three growing seasons. Unfenced spring-planted seedlings were all eaten within the first growing season. For seedlings planted in autumn, there was no clear effect of fencing on overall survival rates (fenced: 20–88%; unfenced: 24–68% after two growing seasons). Methods: Through 1985, three plots were each planted with 250 baldcypress seedlings: 200 in February/March and 50 in September. Of these seedlings, 75 were protected with chickenwire fencing whilst 175 were left unfenced (open to herbivory by nutria Myocastor coypus). Seedlings were stored cold (4°C) before planting. Plots contained other trees (330–590 stems/ha) and saplings/shrubs (1,000–3,500 stems/ha) and had variable water levels. Survival of planted baldcypress seedlings was recorded in October 1985–1987.
A replicated, randomized, controlled study in 1992 in a freshwater marsh in Louisiana, USA (2) found that planted baldcypress Taxodium distichum seedlings protected with plastic guards or a sticky, insect-repellent oil grew more than unprotected seedlings. Over one growing season, seedlings within plastic guards grew significantly more than unguarded seedlings in both height (data not reported) and diameter (guarded: 0.73–0.85 cm; unguarded: 0.28–0.32 cm). Amongst guarded seedlings, growth was similar whether the guards were PVC tubes (0.74 cm diameter increase) or commercial Tubex guards (0.73–0.85 cm diameter increase). Amongst unguarded seedlings, those painted with sticky oil grew significantly more than unpainted seedlings in height (data not reported) but not diameter (painted: 0.32; unpainted: 0.28 cm diameter increase). Painted seedlings grew less than guarded seedlings in both diameter and height. Methods: In January 1992, four hundred baldcypress seedlings were planted into a marsh – with the aim of restoring the swamp that was logged around 80 years previously. Guards against nutria Myocastor coypus herbivory were placed around 240 random seedlings (80 PVC tubing, 80 beige Tubex, 80 white Tubex). Sticky oil was painted onto the lower third of 80 random seedlings. The final 80 seedlings received no protection. Some protected and unprotected seedlings received additional treatments: fertilization or removal of competing vines. Seedling diameter and height were measured at planting (January 1992) and, for surviving seedlings, after one growing season (October 1992).
A replicated, paired, controlled study in 2006–2009 in a floodplain swamp clearing in Wisconsin, USA (3) found that fencing to exclude deer before sowing tree seeds had no significant effect on tree seedling abundance but increased seedling height. After roughly three years, fenced plots contained a statistically similar number of tree seedlings (40 seedlings/m2) to open plots (28 seedlings/m2). However, seedlings in fenced plots were significantly taller (73 cm) than those in open plots (46

13. Actions to complement planting
537
cm). Methods: In November 2006, sixteen pairs of 2.25-m2 plots were established in a floodplain swamp restoration site (clearing created by a storm; invasive vegetation recently removed and ground disked). In each pair, one plot was fenced to exclude white-tailed deer Odocoileus virginianus (plastic mesh fence, 2 m tall) whilst the other was left open. Seeds of five tree species were sown in and around all plots between 2006 and 2009. The plots were also treated regularly with herbicide, to control an invasive grass, between 2006 and 2008). Seedlings were counted and measured in August 2009.
A replicated, paired, controlled study in 2014–2015 in two degraded floodplain swamps in Victoria, Australia (4) reported that fencing to exclude browsing and grazing mammals increased survival of planted swamp gum Eucalyptus camphora seedlings. Over one year, seedlings within fenced plots had a 98–100% survival rate. In contrast, seedlings in unfenced plots had a 0–4% survival rate. Methods: In March 2014, swamp gum seedlings were planted into eighteen 100-m2 plots across two floodplain wetlands (50 seedlings/plot). In each wetland, eight plots had been fenced and one was left open. All plots had been recently cut and sprayed with herbicide (to control reed canarygrass Phalaris arundinacea or common reed Phragmites australis), and planted with native shrubs and herbs along with swamp gum. Some fenced plots were also covered with matting or woodchips. Seedling survival was monitored in March 2015.
A replicated, paired, controlled study in 2008–2013 in two created freshwater swamps in Michigan, USA (5) reported that fencing to exclude white-tailed deer Odocoileus virginianus typically had no significant effect on the survival or height of planted white cedar Thuja occidentalis. After five years, cedar survival was statistically similar in fenced and open plots in three of four comparisons (fenced: 2–61%; open: 0–54%). Between two and five years after planting, the average height of surviving trees changed by a similar amount in fenced and open plots in three of four comparisons (fenced: 2–39 cm/year increase; open: 2 cm/year decrease to 30 cm/year increase). In the other comparisons, involving trees planted on mounds in a site with high browsing pressure, fenced plots supported higher survival (fenced: 94%; open: 70%) and height increase (fenced: 23 cm/year; open: 2 cm/year). Methods: In spring 2008, one-year-old white-cedar seedlings were planted into 37 plots on two recently excavated wetlands (5–106 seedlings/plot, approximately 2.8 m apart). Twenty-one plots were surrounded by 3-m-tall deer-exclusion fencing. Sixteen plots were left open. In some fenced and open plots, seedlings were planted on mounds. Surviving trees were monitored in April 2010 and October 2013.
(1) Conner W.H. & Flynn K. (1989) Growth and survival of baldcypress (Taxodium distichum [L.] Rich.) planted across a flooding gradient in a Louisiana bottomland forest. Wetlands, 9, 207–217.
(2) Myers R.S., Shaffer G.P. & Llewellyn D.W. (1995) Baldcypress (Taxodium distichum (L.) Rich.) restoration in southeast Louisiana: the relative effects of herbivory, flooding, competition and macronutrients. Wetlands, 15, 141–148.
(3) Thomsen M., Brownell K., Groshek M. & Kirsch E. (2012) Control of reed canarygrass promotes wetland herb and tree seedling establishment in an Upper Mississippi River floodplain forest. Wetlands, 32, 543–555.
(4) Greet J., King E. & Stewart-Howie M. (2016) Plastic weed matting is better than jute or woodchips for controlling the invasive wetland grass species Phalaris arundinacea, but not Phragmites australis. Plant Protection Quarterly, 31, 19–22.
(5) Kangas L.C., Schwartz R., Pennington M.R., Webster C.R. & Chimner R.A. (2016) Artificial microtopography and herbivory protection facilitates wetland tree (Thuja occidentalis L.) survival and growth in created wetlands. New Forests, 47, 73–86.

13. Actions to complement planting
538
13.19.4 Use fences or barriers to protect planted brackish/saline
wetlands planted with trees/shrubs
One study evaluated the effects, on vegetation, of using fences or barriers to protect brackish/ saline wetlands planted with trees/shrubs. The study was in the USA.
VEGETATION COMMUNITY
VEGETATION ABUNDANCE
VEGETATION STRUCTURE
Height (1 study): One replicated, paired, controlled study in exposed coastal sites in the USA1 found that red mangrove Rhizophora mangle propagules planted within full-length plastic shelters had grown taller than propagules planted without shelter in three of four comparisons, made 22–129 days after planting.
OTHER
Survival (1 study): One replicated, paired, controlled study in exposed coastal sites in the USA1 reported that full-length plastic shelters increased the survival rate of planted red mangrove Rhizophora mangle propagules over 4–8 months, but that full-length bamboo shelters and below-ground plastic shelters had no clear effect on survival.
A replicated, paired, controlled study in 1997–1998 in four sandy coastal sites in Florida, USA (1) reported that planted red mangrove Rhizophora mangle propagules within full-length plastic shelters – but not full-length bamboo shelters or below-ground plastic shelters – had higher survival rates than unprotected propagules, and found that seedlings within full-length shelters grew taller than seedlings in the other treatments. After 4–8 months, the survival rate was 76–100% for propagules/ seedlings within translucent plastic shelters that extended above and below ground (vs 0–2% within similar shelters made from bamboo; 0% within plastic shelters that extended below ground only; and 0–6% without shelter; statistical significance not assessed). After 22–129 days, seedlings within full-length plastic shelters were significantly taller than unprotected seedlings in three of four comparisons (other comparison no significant difference, because no propagules had developed into seedlings) and significantly taller than seedlings in the other types of shelters in four of four comparisons (see original paper for data). Methods: In August and November 1997, a total of 796 red mangrove propagules were planted, around the high tide level, in four exposed, sandy, coastal sites. There were 13–35 propagules/site/season for each of the four shelter treatments. Shelters differed in material and height (see above) but were all 3.8 cm internal diameter and had a slit running down them to allow water exchange. Propagules (or the seedlings they became) were monitored twice a month for up to eight months after planting.
(1) Salgado Kent C.P. & Lin J. (1999) A comparison of Riley encased methodology and traditional techniques for planting red mangroves (Rhizophora mangle). Mangroves and Salt Marshes, 3, 215–225.
13.20 Remove vegetation that could compete with planted
vegetation
Background

13. Actions to complement planting
539
Removing other plants before or after planting desirable marsh or swamp plants could reduce competition for space, light and nutrients. Survival and growth of planted vegetation may be improved. Note that abundant competitors, and/or the absence of the vegetation to be introduced, could be symptoms of inappropriate physical conditions that may also need to be managed. Also note that existing vegetation may help to protect planted vegetation from extreme temperatures and sunlight (cf. Section 13.18), and protect the wetland surface from erosion.
To be clear, this intervention includes various specific actions that remove undesirable plants (e.g. physical removal, mowing, herbicide application) or kill undesirable seeds (e.g. burning, covering the soil with black plastic) in areas planted with desirable marsh or swamp plants. Management might be one-off or continuous. Evidence summarized for this intervention focuses on responses of the planted vegetation; studies that report responses of other vegetation are also included in Chapter 9.
Related interventions: interventions to control invasive and other problematic plants (Chapter 9); Introduce nurse plants before/after planting target marsh or swamp vegetation (13.18).
13.20.1 Remove vegetation that could compete with planted non-woody
plants: freshwater wetlands
Three studies evaluated the effects, on emergent non-woody vegetation planted in freshwater wetlands, of removing competing plants. All three studies were in the USA. Two studies1,2 used the same experimental wet basins but planted different species.
VEGETATION COMMUNITY
VEGETATION ABUNDANCE
Herb abundance (1 study): One replicated, randomized, paired, controlled study in wet meadows in the USA3 found removing an invasive species with herbicide before sowing mixed grass and forb seeds increased the total biomass of sown species after 1–2 growing seasons, but that burning to remove the invasive species had no significant effect on sown species biomass.
Individual species abundance (1 study): One replicated, paired, controlled study in wet basins in the USA1 found that the effect of weeding to remove competitors on lake sedge Carex lacustris biomass and density, in the three years after planting, depended on the year and water level.
VEGETATION STRUCTURE
Height (2 studies): Two replicated, paired, controlled studies in wet basins in the USA1,2 examined the effect of weeding to remove competitors on the height of planted sedges. One of the studies2 found that weeding had no significant effect on the height of planted tussock sedge Carex stricta in three of three years. The other study1 found that weeding reduced the average height of lake sedge Carex lacustris in the first year after planting, but had no significant effect in the following two years.
OTHER
Survival (2 studies): Two replicated, paired, controlled studies in wet basins in the USA1,2 examined the effect of weeding to remove competitors on the survival of planted sedges Carex spp. Both studies found that weeding had no significant effect on sedge survival in at least two of three years. One of the studies2 found that weeding affected tussock sedge Carex stricta survival in the second year after planting, but that the direction of the effect depended on plot elevation.

13. Actions to complement planting
540
A replicated, paired, controlled, before-and-after study in 1995–1997 in three recently excavated wet basins in Minnesota, USA (1) found that weeding to remove competitors had no significant effect on survival of planted lake sedge Carex lacustris, but that effects on sedge abundance and height depended on other factors. The study generally does not report data for the comparisons in this summary. In each of three years, the survival rate of planted sedges was statistically similar in weeded and unweeded plots. The effect of weeding on sedge above-ground biomass, stem density and height depended on time since planting, elevation and/or water regime. For example, in all three years, weeding increased sedge biomass/m2 in higher/drier plots but had no significant effect in lower, wetter plots. The average height of sedge shoots was lower in weeded than unweeded plots in the first year, but there was no significant difference between treatments in the second and third years. Methods: Forty-eight 5-m2 plots were established, in 12 sets of four, across three wet basins (same as in Study 2). In May 1995, nursery-reared lake sedge was planted into each bare plot (10 or 45 plants/plot). Twenty-four plots (2 plots/set) were weeded (colonizing plants removed) throughout the study. The plots were situated at four different elevations, and each basin had a different water regime (falling, stable or rising through each growing season). Vegetation was surveyed through the 1995, 1996 and 1997 growing seasons.
A replicated, paired, controlled study in 1995–1997 in three recently excavated wet basins in Minnesota, USA (2) found that weeding to remove competitors had no significant effect on the height of planted tussock sedge Carex stricta, and that effect on sedge survival depended on other factors. In each of three years, the height of planted sedges was statistically similar in weeded and unweeded plots (data not reported). Weeding had no significant effect on sedge survival in the first and third years after planting. In the second year, weeding increased planted sedge survival at high elevations (weeded: 100%; unweeded: 57%) but reduced sedge survival at low elevations (weeded: 38%; unweeded: 96%). The study also reported data on biomass/plant and shoot number/plant. The effect of weeding on these metrics depended on time since planting, elevation and/or water regime (see original paper). Methods: Forty-eight 5-m2 plots were established, in 12 sets of four, across three wet basins (same as in Study 1). In May 1995, nursery-reared tussock sedge was planted into each bare plot (10 or 45 plants/plot). Twenty-four plots (2 plots/set) were weeded (colonizing plants removed) throughout the study. The plots were situated at four different elevations, and each basin had a different water regime (falling, stable or rising through each growing season). Vegetation was surveyed through the 1995, 1996 and 1997 growing seasons.
A replicated, randomized, paired, controlled study in 2000–2004 in two wet meadows Minnesota, USA (3) found that the effect of removing invasive reed canarygrass Phalaris arundinacea before sowing mixed grass and forbs seeds depended on the removal method. After 1–2 growing seasons, plots sprayed with herbicide contained more biomass of sown species (total: 0–70 g/m2) than unsprayed plots (total: 0 g/m2). Sprayed plots also contained less canarygrass biomass (10–480 g/m2) than unsprayed plots (420–880 g/m2). In contrast, burned plots contained a statistically similar overall biomass of sown species – and canarygrass – to unburned plots (data not reported). The pattern of results was the same for non-sown and total vegetation biomass (see Sections 9.11 and 9.12). Methods: In the early 2000s, one hundred and sixty 25-m2 plots were established, in 40 sets of four, across two canarygrass-invaded wet meadows. One hundred and twenty plots (three random

13. Actions to complement planting
541
plots/set) were sprayed with herbicide (Roundup® Ultra): in May, August or September and in one or two years. Eighty plots (20 random sets) were burned in spring. Some plots therefore received neither, one, or both removal treatments. All plots were sown with a mixture of grass and forb seeds in the spring after the final removal treatment. Dry biomass samples were taken in August, 1–2 growing seasons after sowing.
(1) Budelsky R.A. & Galatowitsch S.M. (2000) Effects of water regime and competition on the establishment of a native sedge in restored wetlands. Journal of Applied Ecology, 37, 971–985.
(2) Budelsky R.A. & Galatowitsch S.M. (2004) Establishment of Carex stricta Lam. seedlings in experimental wetlands with implications for restoration. Plant Ecology, 175, 91–105.
(3) Reinhardt Adams C. & Galatowitsch S.M. (2006) Increasing the effectiveness of reed canary grass (Phalaris arundinacea L.) control in wet meadow restorations. Restoration Ecology, 14, 441–451.
13.20.2 Remove vegetation that could compete with planted non-woody
plants: brackish/saline wetlands
One study evaluated the effects, on emergent non-woody vegetation planted in brackish/saline wetlands, of removing competing plants. The study was in the USA.
VEGETATION COMMUNITY
VEGETATION ABUNDANCE
VEGETATION STRUCTURE
OTHER
Germination/emergence (1 study): One replicated, randomized, paired, controlled study in an estuarine salt marsh in the USA1 found that thinning cover of the dominant plant before sowing dwarf saltwort Salicornia bigelovii seeds had no significant effect on saltwort seedling density, over the following two months.
Survival (1 study): The same study1 found that thinning the dominant plant increased the survival rate of dwarf saltwort Salicornia bigelovii transplants over the first six months after planting.
A replicated, randomized, paired, controlled study in 2006 in an estuarine salt marsh in California, USA (1) found that thinning dominant pickleweed Salicornia virginica before sowing/planting dwarf saltwort Salicornia bigelovii did not significantly affect the density of saltwort seedlings, but did increase survival of planted saltwort. Two months after sowing/planting, the total density of saltwort seedlings did not significantly differ between thinned and unthinned plots (data not reported). However, after six months, the survival rate of planted saltwort seedlings was 2.4 times greater in thinned than unthinned plots (further data not reported). Methods: In March 2006, dwarf saltwort was planted and sown into seventy-two 0.25-m2 plots (three sets of 24) on a pickleweed-dominated salt marsh. Four seedlings and 1.25 ml of seed were added to each plot. In 36 plots (12 random plots/set), pickleweed had been thinned (stems cut and removed) to leave roughly 50% cover. The other plots were left unthinned (>75% pickleweed cover). Pickleweed cover remained lower in thinned than unthinned plots throughout the growing season. Half of the plots had also been lowered slightly (5–10 cm). Vegetation was surveyed between May and September 2006.
(1) Varty A.K. & Zedler J.B. (2008) How waterlogged microsites help an annual plant persist among salt marsh perennials. Estuaries and Coasts, 31, 300–312.

13. Actions to complement planting
542
13.20.3 Remove vegetation that could compete with planted trees/shrubs:
freshwater wetlands
Five studies evaluated the effects, on trees/shrubs planted in freshwater wetlands, of removing competing plants. Four studies were in the USA1,3–5. Two of these3,4 took place in the same swamp, but with different experimental set-ups. One study was in Australia2.
VEGETATION COMMUNITY
VEGETATION ABUNDANCE
VEGETATION STRUCTURE
Height (3 studies): Three replicated, controlled studies (two also randomized, two also paired) in a wet meadow in Australia2 and a degraded swamp in the USA3,4 found that clearing vegetation before planting tree/shrub seedlings typically had no clear or significant effect on their height, after 1–4 growing seasons. However, one of the studies in the USA4 found that planted baldcypress Taxodium distichum seedlings were taller, after three growing seasons, when planted amongst cut woody vegetation than below an uncleared canopy.
Diameter/perimeter/area (1 study): One replicated, randomized, paired, controlled study in a wet meadow in Australia2 found that clearing vegetation, before planting tree/shrub seedlings, typically had no significant effect on the diameter of these seedlings nine months later.
OTHER
Germination/emergence (1 study): One replicated, randomized, paired, controlled study in a wet meadow in Australia2 found that there were more seedlings in plots that had been cleared of vegetation before sowing tree/shrub seeds, than in plots that had not been cleared before sowing. Seedlings were counted two months after sowing.
Survival (4 studies): Three replicated, controlled studies (two also randomized, two also paired) in a wet meadow in Australia2 and a degraded swamp in the USA3,4 found that clearing vegetation before planting tree/shrub seedlings typically had no clear or significant effect on their survival, after 1–4 growing seasons. However, one of the studies in the USA4 found that planted baldcypress Taxodium distichum seedlings had a lower survival rate, after three growing seasons, when planted amongst cut woody vegetation than below an uncleared canopy. One replicated, randomized, paired, controlled study in degraded swamps in the USA5 found that removing reed canarygrass Phalaris arundinacea before planting tree/shrub seedlings never significantly reduced their survival rate over 1–2 growing seasons, and often increased it.
Growth (1 study): One replicated, randomized, controlled study in the USA1 found that baldcypress Taxodium distichum seedlings planted into a marsh grew more in diameter, but less in height, when planted into plots cleared of vines than when planted into uncleared plots.
A replicated, randomized, controlled study in 1992 in a freshwater marsh in Louisiana, USA (1) found that where competing vines were cleared, planted baldcypress Taxodium distichum seedlings grew more in diameter and less in height than where vines were not cleared. Over one growing season, seedlings in cleared plots grew more in diameter (0.74 cm) than seedlings surrounded by vines (0.43 cm). However, cleared seedlings grew less in height (5.4 cm) than surrounded seedlings (8.7 cm). Clearing vines had a bigger effect on seedlings on diameter growth for seedlings within plastic guards than without (data not reported), but had a similar effect on seedlings whether fertilized (cleared seedlings grew 0.26 cm more than uncleared) or not (cleared seedlings grew 0.28 cm more than uncleared). Methods: In January 1992, four hundred baldcypress seedlings were planted into a marsh – with

13. Actions to complement planting
543
the aim of restoring the swamp that was logged around 80 years previously. Vines were cleared from around 200 random seedlings every 3–4 weeks after planting, but left to grow around the other 200 seedlings. An equal number of cleared and uncleared seedlings received additional treatments: protection from herbivores and/or fertilization. Seedling diameter and height were measured at planting (January 1992) and after one growing season (October 1992).
A replicated, randomized, paired, controlled study in 1994–1995 in a wet meadow in New South Wales, Australia (2) found that clearing vegetation increased germination of sown tree/shrub seeds, but typically had no clear or significant effect on the survival or size of planted seedlings. Statistical significance of survival results was not assessed. Two months after sowing seeds, there were more seedlings in cleared than uncleared plots in 10 of 10 cases (cleared: 1–9 seedlings/plot; uncleared: <1 seedling/plot). Nine months after planting, seedlings in cleared and uncleared plots had similar survival rates in 20 of 20 comparisons (cleared: 96–100%; uncleared: 96–100%), statistically similar heights in 20 of 20 comparisons (cleared: 69–127 cm; uncleared: 68–121 cm), and statistically similar stem diameters in 17 of 20 comparisons (for which cleared: 7–14 mm; uncleared: 7–16 mm). Bi-monthly weeding after initial clearance had no clear effect on seedling survival, and no significant effect on seedling size in 19 of 20 comparisons (see original paper for data). Methods: In spring/summer 1994/1995, five tree and shrub species were planted into a wet meadow, with the aim of restoring a swamp. For each species, 300 plots (25 x 25 cm) were sown with seeds (50 seeds/plot) and 300 plots were sown with nursery-reared seedlings (1 seedling/plot). A random 400 plots/species were cleared of vegetation before planting (details of clearing not reported). Of these, a random 200 plots were also weeded every two months. Seedlings in sown plots were counted after two months. Seedlings in planted plots were counted and measured after nine months.
A replicated, paired, controlled study in 1993–1996 in a degraded swamp in South Carolina, USA (3) found that clearing competing vegetation after planting tree seedlings typically had no significant effect on their survival or average height. After four growing seasons and averaged across species, seedling survival rates did not significantly differ between plots where vegetation was cleared (57–63%) and plots where vegetation not cleared (66%), regardless of the clearance method. For five of six planted species, the average height of surviving seedlings was statistically similar in cleared plots (100–311 cm) and uncleared plots (145–265 cm), regardless of the clearance method. For the other species, baldcypress Taxodium distichum, seedlings were taller in cleared plots (253–285 cm) than uncleared plots (213 cm): significantly so for three of four clearance methods. At planting, seedlings were 40–94 cm tall and did not significantly differ in height within each species and clearance method. Methods: In April 1993, tree seedlings were planted into 25 plots (6 seedlings/species/plot; seedlings 2 m apart) in a degraded swamp (natural forest killed by heated effluent between 1955 and 1985). In spring/summer 1993 and 1994, five plots received each vegetation clearance treatment: mowing whole plot; mowing 1 m strips in which seedlings were planted; applying herbicide (Accord®) to whole plot; applying herbicide to 1 m strips in which seedlings were planted; no clearance. All seedlings were protected with tree guards. Seedling survival and height were recorded at planting, then each autumn until 1996. This study used the same swamp as (4), but a different experimental set-up.
A replicated, randomized, controlled study in 1994–1996 in a degraded swamp in South Carolina, USA (4) found that clearing black willows Salix nigra before planting tree seedlings reduced survival and increased the average height for one of

13. Actions to complement planting
544
three planted species, but had no significant effect on the other two. After three growing seasons, baldcypress Taxodium distichum seedlings had a lower survival rate, but survivors were taller, when planted amongst cut willows (survival: 75%; height: 192 cm) than when planted under a willow canopy (survival: 95%; height: 134 cm). For two other planted species, overcup oak Quercus lyrata and water hickory Carya aquatica, survival rates and the height of survivors did not significantly differ between seedlings planted amongst cut willows (survival: 73–78%; height: 112–148 cm) and seedlings planted under a willow canopy (survival: 90%; height: 104–134 cm). At planting, seedlings were 47–85 cm tall and did not significantly differ in height within each species and clearance treatment. Methods: In winter 1993/1994, ten 180-m2 plots were established in a degraded swamp (natural forest killed by heated effluent between 1955 and 1985). In five random plots, all willow trees were cut to within 15 cm of the ground. In five other plots, the willow canopy was left intact. In February 1994, eight seedlings of each species were planted, 2 m apart, into each plot. All seedlings were protected with tree guards. Seedling survival and height were recorded at planting, then each autumn until 1996. This study used the same swamp as (3), but a different experimental set-up.
A replicated, randomized, paired, controlled study in 2002–2004 in three freshwater wetlands in Wisconsin, USA (5) reported that removing invasive reed canarygrass Phalaris arundinacea either increased or had no significant effect on survival of planted trees/shrubs over 1–2 growing seasons. In 68 of 136 comparisons, plots from which canarygrass had been removed supported significantly higher survival rates of planted trees/shrubs (13–100%) than plots where canarygrass remained (0–73%). In the other 68 comparisons, plots from which canarygrass had been removed supported statistically similar survival rates (0–100%) to plots where canarygrass remained (0–100%), although there was a trend for higher survival in cleared plots in 46 of these comparisons. The effect of canarygrass removal depended on the tree/shrub species, site and removal treatment. In other words, most species responded significantly to canarygrass removal only as a result of certain methods or in certain sites (see original paper). Plots from which canarygrass had been removed before planting also typically had higher overall plant species richness and diversity, and contained more non-planted tree seedlings, than plots where canarygrass was not removed (see Sections 9.5, 9.8, 9.11 and 9.12). Methods: In spring 2003 or 2004, seedlings of 23 tree and shrub species were planted into three degraded wetlands (roughly 1 seedling/m2). Reed canarygrass had been removed from some planted areas, but left in others (distribution of seedlings amongst areas not clear). Removal treatments involved spraying with herbicide in all three wetlands, and in one wetland additional burning, mowing or ploughing. Survival of all seedlings was monitored in September 2003 and 2004. Other plant species and their cover were recorded in August 2004.
(1) Myers R.S., Shaffer G.P. & Llewellyn D.W. (1995) Baldcypress (Taxodium distichum (L.) Rich.) restoration in southeast Louisiana: the relative effects of herbivory, flooding, competition and macronutrients. Wetlands, 15, 141–148.
(2) de Jong N.H. (2000) Woody plant restoration and natural regeneration in wet meadow at Coomonderry Swamp on the south coast of New South Wales. Marine and Freshwater Research, 51, 81–89.
(3) McLeod K.W., Reed M.R. & Wike L.D. (2000) Elevation, competition control, and species affect bottomland forest restoration. Wetlands, 20, 162–168.
(4) McLeod K.W., Reed M.R. & Nelson E.A. (2001) Influence of a willow canopy on tree seedling establishment for wetland restoration. Wetlands, 21, 395–402.
(5) Hovick S.M. & Reinartz J.A. (2007) Restoring forest in wetlands dominated by reed canarygrass: the effects of pre-planting treatments on early survival of planted stock. Wetlands, 27, 24–39.

13. Actions to complement planting
545
13.20.4 Remove vegetation that could compete with planted trees/shrubs:
brackish/saline wetlands
We found no studies that evaluated the effects, on trees/shrubs planted in brackish/saline wetlands, of removing competing plants.
This means that we have not yet found any studies that have directly evaluated this intervention during our systematic journal and report searches. Therefore we have no evidence to indicate whether or not the intervention has any desirable or harmful effects.
Manipulate planted vegetation
13.21 Install physical supports for planted vegetation
Background
Planted vegetation could be supported with structures such as stakes or wire mesh. Supports may be used in areas disturbed by wind, waves or human activity to hold vegetation in place whilst it establishes.
Related interventions: Use fences or barriers to protected planted areas (13.19).
13.21.1 Install physical supports for planted non-woody plants:
freshwater wetlands
One study evaluated the effects of installing physical supports for emergent, non-woody plants planted in freshwater wetlands. The study was in the Netherlands.
VEGETATION COMMUNITY
VEGETATION ABUNDANCE
VEGETATION STRUCTURE
Biomass/plant (1 study): One replicated, controlled study at the edge of a freshwater lake in the Netherlands1 found that supporting planted bulrushes Scirpus spp. with wire mesh had no significant effect on biomass of individual plants after 1–2 years.
Stems/plant (1 study): The same study1 found that supporting planted bulrushes Scirpus spp. with wire mesh had no significant effect on number of shoots/plant after 1–2 years.
A replicated, paired, controlled study in 1989 at the edge of a freshwater lake in the Netherlands (1) found that using wire mesh to support planted bulrushes Scirpus spp. had no significant effect on the number or biomass of bulrush shoots after two months. Bulrush plants in plots with and without support had a similar number of shoots in 12 of 12 comparisons (supported: 2–36 shoots/plant; unsupported: 2–26 shoots/plant) and had similar above-ground biomass in 12 of 12 comparisons (supported: 4–73 g/plant; unsupported: 2–51 g/plant). Methods: In May 1989, bulrushes were transplanted into 96 plots, each 4 m2, at the edge of a tidal freshwater lake. In 48 plots, plants were supported with strips of wire mesh (12 cm holes). There were four supported and four unsupported plots for each combination of two species (lakeshore bulrush Scirpus lacustris ssp. lacustris and saltmarsh bulrush Scirpus maritimus), two water levels (5 or 30 cm average depth) and three planting densities

13. Actions to complement planting
546
(2–20 plants/m2). All plots were fenced to exclude waterfowl. Bulrush shoots were counted and measured in July 1989. Above-ground dry biomass was estimated from length-mass relationships.
(1) Clevering O.A. & van Gulik W.M.G. (1997) Restoration of Scirpus lacustris and Scirpus maritimus stands in a former tidal area. Aquatic Botany, 55, 229–246.
13.21.2 Install physical supports for planted non-woody plants: brackish/
saline wetlands
We found no studies that evaluated the effects of installing physical supports for emergent, non-woody plants planted in brackish/saline wetlands.
This means that we have not yet found any studies that have directly evaluated this intervention during our systematic journal and report searches. Therefore we have no evidence to indicate whether or not the intervention has any desirable or harmful effects.
13.21.3 Install physical supports for planted trees/shrubs: freshwater
wetlands
We found no studies that evaluated the effects of installing physical supports for trees/shrubs planted in freshwater wetlands.
This means that we have not yet found any studies that have directly evaluated this intervention during our systematic journal and report searches. Therefore we have no evidence to indicate whether or not the intervention has any desirable or harmful effects.
13.21.4 Install physical supports for planted trees/shrubs: brackish/
saline wetlands
We found no studies that evaluated the effects of installing physical supports for trees/shrubs planted in brackish/saline wetlands.
This means that we have not yet found any studies that have directly evaluated this intervention during our systematic journal and report searches. Therefore we have no evidence to indicate whether or not the intervention has any desirable or harmful effects.
13.22 Use flotation devices to support planted vegetation
We found no studies that evaluated the effects of using flotation devices to support emergent vegetation planted in wetlands.
This means that we have not yet found any studies that have directly evaluated this intervention during our systematic journal and report searches. Therefore we have no evidence to indicate whether or not the intervention has any desirable or harmful effects.
Background
Marsh and swamp plant species have varying tolerances to flooding (Banach et al. 2009). Plants could be introduced with flotation devices, to ensure they are not flooded too deeply during early growth but remain in contact with the ground when water levels are lower. For example, plants might be introduced within peat bags and/or with attached pool noodles (Dreschel et al. 2017). It will probably be necessary to tether the plants or flotation devices to hold them in place. CAUTION: It

13. Actions to complement planting
547
may be difficult to remove materials (e.g. plastics) used to construct flotation devices, leading to pollution of the conservation site (Dreschel et al. 2017).
We captured no direct quantitative comparisons of plant performance with and without successfully operating flotation devices. Dreschel et al. (2017) reported high survival rates and similar growth rates of saplings planted in peat bags with and without pool noodles, but did not clearly describe the effect of adding pool noodles (peat bags floated anyway) or include saplings planted directly into the marsh.
Banach K., Banach A.M., Lamers L.P.M., De Kroon H., Bennicelli R.P., Smits A.J.M. & Visser E.J.W. (2009) Differences in flooding tolerance between species from two wetland habitats with contrasting hydrology: implications for vegetation development in future floodwater retention areas. Annals of Botany, 103, 341–351.
Dreschel T.W., Cline E.A. & Hill S.D. (2017) Everglades tree island restoration: testing a simple tree planting technique patterned after a natural process. Restoration Ecology, 25, 696–704.
13.23 Plant vegetation into moisture-retaining peat pots
Background
Pots made from compressed peat can retain moisture during dry periods, which may improve survival or growth rates of planted marsh or swamp plants. Focal plants could be grown in peat pots in nurseries then planted with the pot in the field. Alternatively, peat pots could be inserted into the soil before planting. CAUTION: Extracting peat to produce peat pots could damage natural peatlands.
13.23.1 Plant non-woody plants into moisture-retaining peat pots:
freshwater wetlands
One study evaluated the effects of using moisture-retaining peat pots when planting emergent, non-woody vegetation in freshwater wetlands. The study was in the USA.
VEGETATION COMMUNITY
VEGETATION ABUNDANCE
Individual species abundance (1 study): One replicated, randomized, paired, controlled study in a wetland in the USA1 found that tussock sedge Carex stricta cover was similar across plots, after two growing seasons, whether sedges were planted into peat pots or into existing wetland soil.
VEGETATION STRUCTURE
Individual plant size (1 study): One replicated, randomized, paired, controlled study in a wetland in the USA1 found that the biomass of tussock sedge Carex stricta plants was similar, after two growing seasons, whether they were planted into peat pots or into existing wetland soil.
OTHER
Survival (1 study): One replicated, randomized, paired, controlled study in a wetland in the USA1 found that the survival rate of tussock sedge Carex stricta plants was similar, after two growing seasons, whether they were planted into peat pots or into existing wetland soil.
Growth (1 study): The same study1 found that the growth rate of tussock sedge Carex stricta was typically similar, over two growing seasons, when planted into peat pots or into existing wetland soil. However, in a dry area and in a dry year, planting in peat pots did increase the growth rate.

13. Actions to complement planting
548
A replicated, randomized, paired, controlled study in 2012–2013 in a freshwater wetland in Wisconsin, USA (1) found that planting tussock sedge Carex stricta into peat pots had no clear or significant effect on sedge survival, biomass or cover after two growing seasons, but did increase sedge growth rate in drier plots during the first growing season. After two growing seasons, sedges planted into peat pots or bare soil had similar survival rates (peat pots: 87–100%; bare soil: 100%; statistical significance not assessed). The above-ground biomass of surviving sedges was statistically similar under both treatments (peat pots: 6–34 g/plant; bare soil: 4–39 g/plant). The same was true for sedge cover (peat pots: 47–70%; bare soil: 38–62%). The growth rate of planted sedges was statistically similar in three of four comparisons (peat pots: 0.011–0.014 mm/mm/day; bare soil: 0.013–0.014 mm/mm/day). In the other comparison – in drier plots and in the first, drought-affected growing season – the growth rate was greater for sedges planted into peat pots (0.011 mm/mm/day) than sedges planted into bare soil (−0.003 mm/mm/day). Methods: In spring 2012, six pairs of 1-m2 plots were established in a wetland undergoing restoration. Five nursery-reared tussock sedges were planted into each plot, then regularly watered and weeded. In half of the plots (one random plot/pair), the sedges were planted into peat pots sunk into the soil. Survival and above-ground biomass of planted sedges, and total tussock sedge cover, were surveyed in June–August 2013. Biomass was dried before weighing. Growth rates were calculated from leaf lengths measured in 2012 and 2013.
(1) Doherty J.M. & Zedler J.B. (2015) Increasing substrate heterogeneity as a bet-hedging strategy for restoring wetland vegetation. Restoration Ecology, 23, 15–25.
13.23.2 Plant non-woody plants into moisture-retaining peat pots:
brackish/saline wetlands
We found no studies that evaluated the effects of using moisture-retaining peat pots when planting emergent, non-woody vegetation in brackish/saline wetlands.
This means that we have not yet found any studies that have directly evaluated this intervention during our systematic journal and report searches. Therefore we have no evidence to indicate whether or not the intervention has any desirable or harmful effects.
13.23.3 Plant trees/shrubs into moisture-retaining peat pots: freshwater
wetlands
We found no studies that evaluated the effects of using moisture-retaining peat pots when planting trees/shrubs in freshwater wetlands.
This means that we have not yet found any studies that have directly evaluated this intervention during our systematic journal and report searches. Therefore we have no evidence to indicate whether or not the intervention has any desirable or harmful effects.
13.23.4 Plant trees/shrubs into moisture-retaining peat pots: brackish/
saline wetlands
We found no studies that evaluated the effects of using moisture-retaining peat pots when planting trees/shrubs in brackish/saline wetlands.
This means that we have not yet found any studies that have directly evaluated this intervention during our systematic journal and report searches. Therefore we have no evidence to indicate whether or not the intervention has any desirable or harmful effects.

13. Actions to complement planting
549
13.24 Plant vegetation into heavy containers
We found no studies that evaluated the effects of planting emergent wetland vegetation into heavy containers.
This means that we have not yet found any studies that have directly evaluated this intervention during our systematic journal and report searches. Therefore we have no evidence to indicate whether or not the intervention has any desirable or harmful effects.
Background
Heavy containers (e.g. concrete pots, car tyres) may help to anchor planted vegetation in place, especially in high-energy environments. Vegetation could be grown off-site in containers and then transplanted to the field. Alternatively, vegetation could be planted directly into containers in the field. Consider using containers that will break down or can be removed once the plants are established, e.g. biodegradable concrete (Krumholz & Jadot 2009).
Krumholz J. & Jadot C. (2009) Demonstration of a new technology for restoration of red mangrove (Rhizophora mangle) in high-energy environments. Marine Technology Society Journal, 43, 64–72.
13.25 Allow plants to adjust to field conditions before planting
We found no studies that evaluated the effects of allowing emergent vegetation to adjust to field conditions before planting in wetlands.
This means that we have not yet found any studies that have directly evaluated this intervention during our systematic journal and report searches. Therefore we have no evidence to indicate whether or not the intervention has any desirable or harmful effects.
Background
Plants may have higher survival and growth rates if they are allowed to gradually adjust to conditions similar to those in the site where they will be planted (also known as “acclimation” or “hardening off”). Factors such as temperature, salinity or nutrient concentrations might be changed gradually in the greenhouse or laboratory, from the benign conditions in which plants were raised to the conditions in the field.
To be summarized as evidence for this intervention, studies must have explicitly compared the performance of acclimated and non-acclimated plants. Studies that simply report the performance of acclimated plants are not summarized here.
13.26 Add root-associated fungi to plants before planting
We found no studies that evaluated the effects – on emergent wetland plants – of adding root-associated fungi before planting.
This means that we have not yet found any studies that have directly evaluated this intervention during our systematic journal and report searches. Therefore we have no evidence to indicate whether or not the intervention has any desirable or harmful effects.
Background
Many marsh and swamp plants form mutually beneficial associations with fungi (Cooke & Lefor 1998). These ‘mycorrhizal’ fungi live in or around plant roots. They

13. Actions to complement planting
550
can increase plant access to nutrients and minimize the effect of stresses such as drought and pollution (Finlay 2008). Adding mycorrhizal fungi vegetation before it is introduced could therefore help survival and growth. Fungi could be added via a root dip, or by adding spores to the surrounding soil.
To be summarized as evidence for this intervention, studies must have explicitly compared the performance of treated and untreated plants. Studies that simply report the performance of treated plants are not summarized here. Studies do not have to be in flooded/saturated soils, as long as they involve wetland-characteristic species.
Related interventions: Apply root dip to plants before planting, including all non-fungal treatments (13.27).
Cooke J.C. & Lefor M.W. (1998) The mycorrhizal status of selected plant species from Connecticut wetlands and transition zones. Restoration Ecology, 6, 214–222.
Finlay R.D. (2008) Ecological aspects of mycorrhizal symbiosis: with special emphasis on the functional diversity of interactions involving the extraradical mycelium. Journal of Experimental Botany, 59, 1115–1126.
13.27 Apply root dip to plants before planting
Background
Before planting marsh or swamp plants, the roots could be dipped in a substance to retain moisture (e.g. mud or water-retaining gels) or stimulate growth (e.g. plant hormones). These dips may improve survival and/or growth of the planted vegetation. This intervention does not include root dips involving fungi.
To be summarized as evidence for this intervention, studies must have explicitly compared the performance of treated and untreated plants. Studies that simply report the performance of treated plants are not summarized here. Studies do not have to be in flooded/saturated soils, as long as they involve wetland-characteristic species.
Related interventions: Add root-associated fungi to plants before planting, including via a root dip (13.26).
Baskin C.C. & Baskin J.M. (2014) Seeds: Ecology, Biogeography and Evolution of Dormancy and Germination, Second Edition. Academic Press.
Small C.C. & Degenhardt D. (2018) Plant growth regulators for enhancing revegetation success in reclamation: a review. Ecological Engineering, 118, 43–51.
13.27.1 Apply root dip to non-woody plants before planting: freshwater
wetlands
We found no studies that evaluated the effects – on emergent, non-woody plants typical of freshwater wetlands – of applying a non-fungal root dip before planting.
This means that we have not yet found any studies that have directly evaluated this intervention during our systematic journal and report searches. Therefore we have no evidence to indicate whether or not the intervention has any desirable or harmful effects.
13.27.2 Apply root dip to non-woody plants before planting: brackish/
saline wetlands

13. Actions to complement planting
551
One study evaluated the effects – on emergent, non-woody plants typical of brackish/saline wetlands – of applying a non-fungal root dip before planting. The study was in the USA.
VEGETATION COMMUNITY
VEGETATION ABUNDANCE
Individual species abundance (1 study): One replicated, randomized, paired, controlled study on mudflats in the USA1 found that root-dipping smooth cordgrass Spartina alterniflora before planting had mixed effects on cordgrass density after 1–2 growing seasons, but never increased it.
VEGETATION STRUCTURE
Height (1 study): One replicated, randomized, paired, controlled study on mudflats in the USA1 found that root-dipping smooth cordgrass Spartina alterniflora before planting had mixed effects on cordgrass height after two growing seasons.
OTHER
Survival (1 study): One replicated, randomized, paired, controlled study on mudflats in the USA1 found that root-dipped smooth cordgrass Spartina alterniflora plants typically had a lower survival rate, after one growing season, than plants that had not been root-dipped.
A replicated, randomized, paired, controlled study in 1976–1977 on two intertidal mudflats in Texas, USA (1) found that applying root dip to smooth cordgrass Spartina alterniflora before planting typically reduced survival after one growing season, but had mixed effects on cordgrass density and height after 1–2 growing seasons. After one growing season, dipped cordgrass had a lower survival rate than undipped cordgrass in five of six comparisons (for which dipped: 3–19%; undipped: 39–85%; other comparison no significant difference). After 1–2 growing seasons, cordgrass density was statistically similar under both treatments in 7 of 12 comparisons (for which dipped: <1–191 shoots/m2; undipped: <1–168 stems/m2) but was lower in plots planted with dipped cordgrass in the other five comparisons (dipped: 1–38 stems/m2; undipped: 21–252 stems/m2). Finally, after two growing seasons, cordgrass shoots were of statistically similar height under both treatments in three of six comparisons (for which dipped: 117–120 cm; undipped: 112–122 cm) but taller in plots planted with dipped cordgrass in two comparisons (dipped: 132–139 cm; undipped: 110–119 cm) and shorter in plots planted with dipped cordgrass in the final comparison (dipped: 84 cm; undipped: 122 cm). Methods: In July 1976, thirty-six 12.5-m2 plots were established across two intertidal mudflats. Smooth cordgrass (20–100 cm tall) was transplanted into each plot (50 plants/plot, 50 cm apart. For half of the plots (9 random plots/mudflat), cordgrass was dipped into commercial root dip (Algenura-a; designed to increase water uptake) for 15 min immediately before planting. Cordgrass survival and density were recorded in October 1976. Cordgrass density and flowering shoot height were sampled in November 1977.
(1) Tanner G.W. & Dodd J.D. (1985) Effects of phenological stage of Spartina alterniflora transplant culms on stand development. Wetlands, 4, 57–74.
13.27.3 Apply root dip to trees/shrubs before planting: freshwater
wetlands
We found no studies that evaluated the effects – on trees/shrubs typical of freshwater wetlands – of applying a non-fungal root dip before planting.

13. Actions to complement planting
552
This means that we have not yet found any studies that have directly evaluated this intervention during our systematic journal and report searches. Therefore we have no evidence to indicate whether or not the intervention has any desirable or harmful effects.
13.27.4 Apply root dip to trees/shrubs before planting: brackish/saline
wetlands
We found no studies that evaluated the effects – on trees/shrubs typical of brackish/saline wetlands – of applying a non-fungal root dip before planting.
This means that we have not yet found any studies that have directly evaluated this intervention during our systematic journal and report searches. Therefore we have no evidence to indicate whether or not the intervention has any desirable or harmful effects.
13.28 Prune roots before planting
Background
Plants can be stressed by the process of planting into a new site. Pruning before planting can encourage the growth of new, nutrient-assimilating feeder roots close to the plant: within the zone of roots that will be moved with the plant (Swackhamer & Sellmer 2007). It can also make planting process quicker and easier (Allen & Kennedy 1989).
To be summarized as evidence for this intervention, studies must have explicitly compared the performance of pruned and unpruned plants. Studies that simply report the performance of pruned plants are not summarized here. Studies do not have to be in flooded/saturated soils, as long as they involve wetland-characteristic species.
Allen J.A. & Kennedy H.E. (1989) Bottomland Hardwood Reforestation in the Lower Mississippi Valley. USFWS/USDAFS Report.
Swackhamer E. & Sellmer J. (2007) Transplanting or Moving Trees and Shrubs in the Landscape. Available at http://extension.psu.edu/transplanting-or-moving-trees-and-shrubs-in-the-landscape. Accessed 9 December 2019.
13.28.1 Prune roots of non-woody plants before planting: freshwater
wetlands
We found no studies that evaluated the effects – on emergent, non-woody plants typical of freshwater wetlands – of pruning their roots before planting.
This means that we have not yet found any studies that have directly evaluated this intervention during our systematic journal and report searches. Therefore we have no evidence to indicate whether or not the intervention has any desirable or harmful effects.
13.28.1 Prune roots of non-woody plants before planting: brackish/saline
wetlands
We found no studies that evaluated the effects – on emergent, non-woody plants typical of brackish/saline wetlands – of pruning their roots before planting.
This means that we have not yet found any studies that have directly evaluated this intervention during our systematic journal and report searches. Therefore we have no evidence to indicate whether or not the intervention has any desirable or harmful effects.

13. Actions to complement planting
553
13.28.3 Prune roots of trees/shrubs before planting: freshwater wetlands
Two studies evaluated the effects – on trees/shrubs typical of freshwater wetlands – of pruning their roots before planting. Both studies were in the USA. One study was in a laboratory2.
VEGETATION COMMUNITY
VEGETATION ABUNDANCE
VEGETATION STRUCTURE
OTHER
Survival (2 studies): One replicated, controlled study in created wetlands in the USA1 reported that root-pruned red maple Acer rubrum seedlings had a higher survival rate than unpruned seedlings, 1–2 years after planting. One replicated, randomized, controlled study in a laboratory in the USA2 found that root-pruned and unpruned Nuttall oak Quercus nuttallii seedlings had similar survival rates, 108 days after planting.
Growth (1 study): One replicated, randomized, controlled study in a laboratory in the USA2 found that root-pruned and unpruned Nuttall oak Quercus nuttallii seedlings grew in height by a similar amount over the first 108 days after planting.
A replicated, controlled study in 1988–1990 in up to five created freshwater wetlands in eastern Massachusetts, USA (1) reported that pruning the roots of red maple Acer rubrum saplings before planting increased their survival rate. Statistical significance was not assessed. After approximately 1–2 years, saplings with roots pruned “several months” before planting had a >75% survival rate, compared to <25% for unpruned saplings. Methods: In the late 1980s, red maple saplings saved from destroyed wetlands were planted in up to five newly created wetlands (excavated from uplands, connected to natural wetlands, planted with herbs and shrubs as well as red maple). The roots of some saplings were pruned before planting. The study does not report the number of saplings planted, the precise number of wetlands planted with red maple, or precise dates of planting and monitoring.
A replicated, randomized, controlled study in a laboratory in Tennessee, USA (2) found that pruning the roots of Nuttall oak Quercus nuttallii seedlings before planting had no significant effect on their survival or growth after 108 days. Pruned and unpruned seedlings had statistically similar survival rates 108 days after planting (data not reported). Pruned seedlings also grew in height by a statistically similar amount (lightly pruned: 8 cm; heavily pruned: 10 cm) to unpruned seedlings (13 cm). However, over a shorter period (72 days after planting) lightly pruned seedlings grew less (5 cm taller) than unpruned seedlings (10 cm taller). Heavily pruned seedlings grew 7 cm taller over this period. Methods: On an unspecified date, 144 nursery-reared Nuttall oak seedlings (approximately 25 cm tall) were planted in pots in a laboratory. Immediately before planting, 48 seedlings received each pruning treatment: light (25% of root removed), heavy (75% of root removed) or none. After planting, half of the seedlings were intermittently flooded (10 days flooded/10 days freely drained) whilst half were always “well watered”. Seedlings were monitored for up to 108 days after planting.
(1) Jarman N.M., Dobberteen R.A., Windmiller B. & Lelito P.R. (1991) Evaluation of created freshwater wetlands in Massachusetts. Restoration & Management Notes, 9, 26–29.
(2) Farmer J.W. & Pezeshki S.R. (2004) Effects of periodic flooding and root pruning on Quercus nuttallii seedlings. Wetlands Ecology and Management, 12, 205–214.

13. Actions to complement planting
554
13.28.4 Prune roots of trees/shrubs before planting: brackish/saline
wetlands
We found no studies that evaluated the effects the effects – on trees/shrubs typical of brackish/ saline wetlands – of pruning their roots before planting.
This means that we have not yet found any studies that have directly evaluated this intervention during our systematic journal and report searches. Therefore we have no evidence to indicate whether or not the intervention has any desirable or harmful effects.
13.29 Soak vegetation before planting
Background
Soaking vegetation before planting might increase tissue water content, promote root growth and increase survival after planting (Pezeshki et al. 2005). An abundance of roots might help the planted vegetation to take up enough water during dry periods. Adventitious roots may grow from the stem, near the water line, and help with oxygen uptake if the site is flooded or saturated (Havens 1996).
To be summarized as evidence for this intervention, studies must have explicitly compared the performance of soaked and unsoaked plants. Studies that simply report the performance of pruned plants are not summarized here. Studies do not have to be in flooded/saturated soils, as long as they involve wetland-characteristic species.
Related interventions: Soak seeds before sowing (13.30).
Havens K.J. (1996) Plant Adaptations to Saturated Soils and the Formation of Hypertrophied Lenticels and Adventitious Roots in Woody Species. Wetlands Program Technical Report No. 96-2. Virginia Institute of Marine Science, College of William and Mary.
Pezeshki S.R., Brown C.E., Elcan J.M. & Shields, F.D. Jr. (2005) Responses of nondormant black willow (Salix nigra) cuttings to preplanting soaking and soil moisture. Restoration Ecology, 13, 1–7.
13.29.1 Soak non-woody plants before planting: freshwater wetlands
We found no studies that evaluated the effects – on emergent, non-woody plants typical of freshwater wetlands – of soaking them before planting.
This means that we have not yet found any studies that have directly evaluated this intervention during our systematic journal and report searches. Therefore we have no evidence to indicate whether or not the intervention has any desirable or harmful effects.
13.29.2 Soak non-woody plants before planting: brackish/saline wetlands
We found no studies that evaluated the effects – on emergent, non-woody plants typical of brackish/saline wetlands – of soaking them before planting.
This means that we have not yet found any studies that have directly evaluated this intervention during our systematic journal and report searches. Therefore we have no evidence to indicate whether or not the intervention has any desirable or harmful effects.
13.29.3 Soak trees/shrubs before planting: freshwater wetlands
One study evaluated the effects – on trees/shrubs typical of freshwater wetlands – of soaking them before planting. The study was in a greenhouse in the USA.

13. Actions to complement planting
555
VEGETATION COMMUNITY
VEGETATION ABUNDANCE
VEGETATION STRUCTURE
Biomass/plant (1 study): One replicated, randomized, controlled study in a greenhouse in the USA1 found that soaking black willow Salix nigra cuttings before planting had no significant effect on the above-ground biomass of surviving seedlings, over the 48 days after planting.
OTHER
Survival (1 study): One replicated, randomized, controlled study in a greenhouse in the USA1 found that the effect, on survival, of soaking black willow cuttings before planting depended on the water regime after planting. However, all cuttings soaked for 15 days before planting died within 42 days of planting.
A replicated, randomized, controlled study in a greenhouse in Tennessee, USA (1) found that the effects of soaking black willow Salix nigra cuttings before planting depended on both the duration of soaking and soil moisture after planting. All cuttings soaked for 15 days died within 42 days of planting. Under permanently or intermittently flooded conditions, cuttings soaked for 7 days and unsoaked cuttings had statistically similar survival rates after 48 days (soaked: 100%; unsoaked: 86–100%) and shoot biomass over 48 days (soaked: 1.4–1.8 g/plant; unsoaked: 1.4–1.7 g/plant). Under well-watered conditions, cuttings soaked for 7 days had a higher survival rate than unsoaked cuttings after 48 days (soaked: 86%; unsoaked: 57%) but had statistically similar shoot biomass over 48 days (soaked: 1.0 g/plant; unsoaked: 0.5 g/plant). Methods: A total of 378 cuttings (30 cm long, 1 cm diameter) were taken from actively growing black willow trees and planted in pots in a greenhouse (dates not reported). Of these, 252 random cuttings had been soaked in aerated tap water before planting (for 7 or 15 days). The other 126 cuttings had not been soaked. After planting, cuttings were exposed to one of three soil moisture treatments (permanently flooded, flooded for 4 in every 14 days, or daily watering). Seven cuttings/treatment were harvested 0, 4, 10, 17, 42 and 48 days after planting, then dried and weighed.
(1) Pezeshki S.R., Brown C.E., Elcan J.M. & Shields, F.D. Jr. (2005) Responses of nondormant black willow (Salix nigra) cuttings to preplanting soaking and soil moisture. Restoration Ecology, 13, 1–7.
13.29.4 Soak trees/shrubs before planting: brackish/saline wetlands
We found no studies that evaluated the effects – on trees/shrubs typical of brackish/saline wetlands – of soaking them before planting.
This means that we have not yet found any studies that have directly evaluated this intervention during our systematic journal and report searches. Therefore we have no evidence to indicate whether or not the intervention has any desirable or harmful effects.
13.30 Soak seeds before sowing
Background
Soaking seeds in water before sowing could increase germination speed and percentages, although the effect may vary between species (Marty & Kettenring

13. Actions to complement planting
556
2017). This intervention involves soaking in water at near-ambient temperatures; other interventions consider soaking in chilled or heated water.
To be summarized as evidence for this intervention, studies must have explicitly compared the performance of treated and untreated seeds. Studies that simply report the performance of treated seeds are not summarized here. Studies do not have to be in flooded/saturated soils, as long as they involve wetland-characteristic species.
Related interventions: Soak vegetation before planting (13.29); Chill seeds before sowing (13.31); Heat seeds before sowing (13.32); Expose seeds to light before sowing (13.33); Physically damage seeds before sowing (13.34); Treat seeds with chemicals before sowing (13.35).
Marty J.E. & Kettenring K.M. (2017) Seed dormancy break and germination for restoration of three globally important wetland bulrushes. Ecological Restoration, 35, 138–147.
13.30.1 Soak seeds of non-woody plants before sowing: freshwater
wetlands
One study evaluated the effects – on emergent, non-woody plants typical of freshwater wetlands – of soaking their seeds before sowing. The study was in a greenhouse in the USA.
VEGETATION COMMUNITY
VEGETATION ABUNDANCE
VEGETATION STRUCTURE
OTHER
Germination/emergence (1 study): One replicated, randomized, controlled study in a greenhouse in the USA1 found that soaking bulrush seeds in water before sowing typically had no significant effect on their germination rate – especially amongst seeds that had not been manipulated in any other way before soaking.
A replicated, randomized, controlled study in 2015 in a greenhouse in Utah, USA (1) found that soaking seeds of three bulrush species in water typically had no significant effect on their germination rate. Seeds that had been soaked before sowing had statistically similar germination rate in 24 of 30 comparisons (for which soaked: 6–88%; unsoaked: 1–75%). In the other six comparisons, soaked seeds had a higher germination rate (18–69%) than unsoaked seeds (4–50%). Five of these comparisons involved seeds whose dormancy had previously been broken through chilling and/or chemical treatments. Methods: Field-collected seeds of three bulrush species were sown onto sand in the greenhouse (36–72 sets of seeds/species; ≥100 seeds/set). Seeds in 18–36 random sets/species were soaked for two weeks before planting (in deionized water, changed every three days, 28–35°C). The other sets were kept dry. Some sets were also chilled and/or soaked in chemicals before soaking in water. After sowing, seeds were kept saturated. Germination rates for each set were recorded five weeks after sowing.
(1) Marty J.E. & Kettenring K.M. (2017) Seed dormancy break and germination for restoration of three globally important wetland bulrushes. Ecological Restoration, 35, 138–147.

13. Actions to complement planting
557
13.30.2 Soak seeds of non-woody plants before sowing: brackish/saline
wetlands
We found no studies that evaluated the effects – on emergent, non-woody plants typical of brackish/saline wetlands – of soaking their seeds before sowing.
This means that we have not yet found any studies that have directly evaluated this intervention during our systematic journal and report searches. Therefore we have no evidence to indicate whether or not the intervention has any desirable or harmful effects.
13.30.3 Soak tree/shrub seeds before sowing: freshwater wetlands
We found no studies that evaluated the effects – on trees/shrubs typical of freshwater wetlands – of soaking their seeds before sowing.
This means that we have not yet found any studies that have directly evaluated this intervention during our systematic journal and report searches. Therefore we have no evidence to indicate whether or not the intervention has any desirable or harmful effects.
13.30.4 Soak tree/shrub seeds before sowing: brackish/saline wetlands
We found no studies that evaluated the effects – on trees/shrubs typical of brackish/saline wetlands – of soaking their seeds before sowing.
This means that we have not yet found any studies that have directly evaluated this intervention during our systematic journal and report searches. Therefore we have no evidence to indicate whether or not the intervention has any desirable or harmful effects.
13.31 Chill seeds before sowing
Background
Exposing seeds to cold temperatures before planting can help to break seed dormancy and encourage germination. Some species with physiological dormancy must experience a cold period before germinating, in order to break down chemicals that inhibit germination or stop the production of these chemicals. For a database of seed dormancy class by species, see Baskin & Baskin (2014).
To be summarized as evidence for this intervention, studies must have explicitly compared the performance of treated and untreated seeds. Studies that simply report the performance of treated seeds are not summarized here. Studies do not have to be in flooded/saturated soils, as long as they involve wetland-characteristic species.
Related interventions: Soak seeds before sowing (13.30); Heat seeds before sowing (13.32); Expose seeds to light before sowing (13.33); Physically damage seeds before sowing (13.34); Treat seeds with chemicals before sowing (13.35).
Baskin C.C. & Baskin J.M. (2014) Seeds: Ecology, Biogeography and Evolution of Dormancy and Germination, Second Edition. Academic Press.
13.31.1 Chill seeds of non-woody plants before sowing: freshwater
wetlands
Six studies evaluated the effects – on emergent, non-woody plants typical of freshwater wetlands – of chilling their seeds before sowing. All six studies were in the USA. Five of the studies were in laboratories or greenhouses1–3,5a,5b.

13. Actions to complement planting
558
VEGETATION COMMUNITY
VEGETATION ABUNDANCE
VEGETATION STRUCTURE
OTHER
Germination/emergence (6 studies): All six replicated, controlled studies in the USA1–4,5a,5b found that chilling (at 1–10°C) seeds of herbaceous plants before sowing either increased or had no significant effect on their germination rate. Within studies, the direction and/or size of the effect depended on factors such as the duration of chilling1,5a, species3,5a,5b, conditions (light/temperature) after sowing3, and sowing site (restored vs natural meadows)4. One replicated, randomized, controlled study in the USA2 found that freezing sawgrass Cladium jamaicense seeds before sowing reduced their germination rate.
A replicated, controlled study in the early 1990s in a laboratory in Colorado, USA (1) found that chilling hardstem bulrush Scirpus acutus seeds increased their germination rate. In all five of five comparisons, germination rates were higher for seeds that had been chilled before incubation (reaching 32–88% after 12 weeks) than for seeds that had not been chilled (reaching 0–7% after 12 weeks). Longer chilling periods typically increased germination rates (seven of nine comparisons; other two comparisons no significant effect; see original paper for data). Methods: Ninety-six sets of 10–50 hardstem bulrush seeds were incubated in flasks of water at 10/25°C or 18/22°C (night/day temperatures). Of these, 80 sets had been chilled in water (4°C; for 2–12 weeks) before incubation. The remaining 16 sets did not receive this chilling treatment. All seeds had been collected in August 1991 from two wild populations, stored in the laboratory for >5 months, and sterilized immediately before the experiment. Seed germination was monitored weekly during 12 weeks of incubation.
A replicated, randomized, controlled study in 1995–1996 in a greenhouse in Florida, USA (2) found that chilling sawgrass Cladium jamaicense seeds had no significant effect on their germination rate, whilst freezing sawgrass seeds reduced their germination rate. Germination success did not significantly differ between seeds chilled in water (50% germinated) and seeds stored dry at room temperature (57% germinated). However, germination success of seeds that were frozen then chilled in water was significantly lower (41% germinated) than for the chilled-only seeds and the seeds stored at room temperature. Methods: In September 1995, freshly-collected sawgrass seeds were sprinkled onto 12 trays of sterilized soil (100 seeds/tray). Four trays were planted with seeds that had been chilled (stored in tap water at 4–10°C for one month before planting). Four trays were planted seeds that had been frozen then chilled (kept at 0°C for 25 days, then stored in tap water at 4–10°C for three days). The final four trays were planted with seeds that had not been soaked, chilled or frozen. All trays were placed in random positions in a greenhouse and watered daily until no more germination occurred.
A replicated, randomized, paired, controlled study in 1997 in a laboratory in Utah, USA (3) found that chilling sedge Carex spp. seeds before sowing typically had no significant effect on their germination rate, although the precise effect depended on the species and the light/temperature regime after sowing. The germination rate of chilled and unchilled seeds was statistically similar in 22 of 36 comparisons (for which chilled: 0–98%; unchilled: 0–96%). This included 13 of 18 comparisons of seeds germinating in the dark, and 11 of 12 comparisons of seeds germinating in

13. Actions to complement planting
559
summer temperatures. Chilling significantly increased the germination rate in the other 14 of 36 comparisons (for which chilled: 17–86%; unchilled: 0–32%). This included six of six comparisons of seeds germinating in the light in spring temperatures. Methods: Two-year-old seeds of beaked sedge Carex utriculata and Nebraska sedge Carex nebracensis were sown into a total of 384 petri dishes (192 dishes/species; 32 seeds/dish), then incubated in the laboratory. Seeds in 288 dishes were chilled before sowing (moist incubation at 5°C for 7, 30 or 150 days). Seeds in the other 96 dishes were not chilled. Dishes were allocated to various other treatments (including germination in light vs dark and different post-sowing temperature regimes). Each incubator shelf received four random dishes of each treatment combination. Germination rates, as a percentage of viable seeds, were recorded for each dish 36 days after sowing.
A replicated, paired, controlled study in 2003–2004 in six prairie pothole wet meadows in Iowa, USA (4) found that chilling sedge Carex spp. seeds increased germination rates for seeds sown in natural meadows, but not for seeds sown in restored meadows. In natural meadows and averaged across all four sown species, the germination rate was higher for chilled seeds (3%) than seeds kept at room temperature (<0.3%). However, the difference was only significant for one of four species when analyzed separately (bristly sedge Carex comosa; chilled: 3%; room temperature: <0.2%). In recently rewetted meadows, the germination rate did not significantly differ between treatments, whether averaged across species (chilled: 13%; room temperature: 9%) or analyzed for individual species (chilled: 9–17%; room temperature: 8–11%). Methods: In late spring 2003, wild-collected seeds of four sedge species were sown into the wet meadow zone of six prairie potholes (three natural and three rewetted one year previously). Within each pothole, eighteen 50-cm diameter plots/species were sown with 300 seeds. Nine plots/pothole received chilled seeds (kept at 1–5°C over the previous winter) whilst the other nine received unchilled seeds (kept at room temperature over the previous winter). Seedlings were counted for two growing seasons.
A replicated, randomized, paired, controlled study in 2015 in a laboratory in Utah, USA (5a) found that chilling seeds of three bulrush species either increased or had no significant effect on their germination rate, depending on the duration of chilling. Seeds that had been chilled for 180 days before sowing had a higher germination rate than unchilled seeds in 14 of 18 comparisons (for which chilled: 22–90%; unchilled: 0–66%). However, seeds that had been chilled for 30 days before sowing had a statistically similar germination rate to unchilled seeds in 16 of 18 comparisons (for which chilled: 0–62%; unchilled: 0–77%). Chilling seeds never significantly increased the germination rate of one of the species, threesquare bulrush Schoenoplectus americanus (four of four comparisons; chilled: 61–77%; unchilled: 50–75%). Methods: Field-collected seeds of three bulrush species were sown into petri dishes filled with sand (16–64 dishes/species; ≥50 seeds/dish). There were 4–16 dishes/species for each of four pre-sowing temperature treatments: chilling (4°C) for 30 or 180 days, or room temperature for 30 or 180 days. Replicates were split across two incubators. After sowing, dishes were kept saturated or flooded and incubated at 18–35°C. Germination rates for each dish were recorded four weeks after sowing.
A replicated, randomized, controlled study in 2015 in a greenhouse in Utah, USA (5b) found that chilling seeds of three bulrush species either increased or had no significant effect on their germination rate, with the precise effect depending on factors such as the species, source site and whether seeds were soaked in chemicals

13. Actions to complement planting
560
before chilling. Seeds that had been chilled before sowing had a higher germination rate than unchilled seeds in 17 of 30 comparisons (for which chilled: 35–88%; unchilled: 2–26%). This included 9 of 10 comparisons involving seeds that had not been chemically treated before chilling. Chilled seeds had a similar germination rate to unchilled seeds in the other 13 of 30 comparisons (for which chilled: 28–69%; unchilled: 2–75%). This included 10 of 10 comparisons involving seeds that had been soaked in bleach before chilling. Methods: Field-collected seeds of three bulrush species were sown onto sand in the greenhouse (36–72 sets of seeds/species; ≥100 seeds/set). Seeds in 18–36 random sets/species were chilled at 4°C for 30 days before sowing. The other sets were kept at room temperature. Some sets were also soaked in acid, bleach and/or water before or after chilling. After sowing, seeds were kept saturated and at 28–35°C. Germination rates for each set were recorded five weeks after sowing.
(1) Thullen J.S. & Eberts D.R. (1995) Effects of temperature, stratification, scarification, and seed origin on the germination of Scirpus acutus Muhl. seeds for use in constructed wetlands. Wetlands, 15, 298–304.
(2) Ponzio K. (1998) Effects of various treatments on the germination of sawgrass, Cladium jamaicense Crantz, seeds. Wetlands, 18, 51–58.
(3) Jones K.L., Roundy B.A., Shaw N.L. & Taylor J.R. (2004) Environmental effects on germination of Carex utriculata and Carex nebrascensis relative to riparian restoration. Wetlands, 24, 467–479.
(4) Kettenring K. & Galatowitsch S.M. (2011) Carex seedling emergence in restored and natural prairie wetlands. Wetlands, 31, 273–281.
(5) Marty J.E. & Kettenring K.M. (2017) Seed dormancy break and germination for restoration of three globally important wetland bulrushes. Ecological Restoration, 35, 138–147.
13.31.2 Chill seeds of non-woody plants before sowing: brackish/saline
wetlands
We found no studies that evaluated the effects – on emergent, non-woody plants typical of brackish/saline wetlands – of chilling their seeds before sowing.
This means that we have not yet found any studies that have directly evaluated this intervention during our systematic journal and report searches. Therefore we have no evidence to indicate whether or not the intervention has any desirable or harmful effects.
13.31.3 Chill tree/shrub seeds before sowing: freshwater wetlands
We found no studies that evaluated the effects – on trees/shrubs typical of freshwater wetlands – of chilling their seeds before sowing.
This means that we have not yet found any studies that have directly evaluated this intervention during our systematic journal and report searches. Therefore we have no evidence to indicate whether or not the intervention has any desirable or harmful effects.
13.31.4 Chill tree/shrub seeds before sowing: brackish/saline wetlands
We found no studies that evaluated the effects – on trees/shrubs typical of brackish/saline wetlands – of chilling their seeds before sowing.
This means that we have not yet found any studies that have directly evaluated this intervention during our systematic journal and report searches. Therefore we have no evidence to indicate whether or not the intervention has any desirable or harmful effects.

13. Actions to complement planting
561
13.32 Heat seeds before sowing
Background
Heating seeds before planting can help to break seed dormancy and encourage germination. Seeds of some species (with physiological dormancy) must experience high temperatures before germinating, in order to break down chemicals that inhibit germination or stop the production of these chemicals. For other species (with physical dormancy), heat can increase the permeability of the seed coat to water and gases, which are essential for germination. For a database of seed dormancy class by species, see Baskin & Baskin (2014).
To be summarized as evidence for this intervention, studies must have explicitly compared the performance of treated and untreated seeds. Studies that simply report the performance of treated seeds are not summarized here. Studies do not have to be in flooded/saturated soils, as long as they involve wetland-characteristic species.
Related interventions: Soak seeds before sowing (13.30); Chill seeds before sowing (13.31); Expose seeds to light before sowing (13.33); Physically damage seeds before sowing (13.34); Treat seeds with chemicals before sowing (13.35).
Baskin C.C. & Baskin J.M. (2014) Seeds: Ecology, Biogeography and Evolution of Dormancy and Germination, Second Edition. Academic Press.
13.32.1 Heat seeds of non-woody plants before sowing: freshwater
wetlands
One study evaluated the effects – on emergent, non-woody plants typical of freshwater wetlands – of heating their seeds before sowing. The study was in a greenhouse in the USA.
VEGETATION COMMUNITY
VEGETATION ABUNDANCE
VEGETATION STRUCTURE
OTHER
Germination/emergence (1 study): One replicated, randomized, controlled study in a greenhouse in the USA1 found that sawgrass Cladium jamaicense seeds dipped in hot water or dried in an oven before sowing had a similar germination rate to seeds that had not been heated.
A replicated, randomized, controlled study in 1994–1995 in a greenhouse in Florida, USA (1) found that heating sawgrass Cladium jamaicense seeds had no significant effect on their germination rate. Seeds dipped in hot water before soaking in room-temperature water had a 50% germination rate, whilst seeds dried in an oven before soaking in room-temperature water had a 40% germination rate. Seeds only soaked in room-temperature water had a 44% germination rate: not significantly different from either of the heat treatments. For reference, the germination rate of seeds that were neither heated nor soaked was 55%. Methods: In September 1994, three-year-old sawgrass seeds were sprinkled onto 24 trays of sterilized soil (100 seeds/tray). Eighteen trays were planted with seeds that had been soaked in 25°C water for 24 h. Seeds in twelve of these trays had been heated before soaking: six steeped in 80°C water for 3 min, and six dried in an oven at 80°C for 24 h. Ten trays

13. Actions to complement planting
562
were planted with untreated seeds (neither heated nor soaked). The trays were placed in random positions in a greenhouse and watered daily until no more germination occurred.
(1) Ponzio K. (1998) Effects of various treatments on the germination of sawgrass, Cladium jamaicense Crantz, seeds. Wetlands, 18, 51–58.
13.32.2 Heat seeds of non-woody plants before sowing: brackish/saline
wetlands
We found no studies that evaluated the effects – on emergent, non-woody plants typical of brackish/saline wetlands – of heating their seeds before sowing.
This means that we have not yet found any studies that have directly evaluated this intervention during our systematic journal and report searches. Therefore we have no evidence to indicate whether or not the intervention has any desirable or harmful effects.
13.32.3 Heat tree/shrub seeds before sowing: freshwater wetlands
One study evaluated the effects – on trees/shrubs typical of freshwater wetlands – of heating their seeds before sowing. The study was in a laboratory in the USA.
VEGETATION COMMUNITY
VEGETATION ABUNDANCE
VEGETATION STRUCTURE
OTHER
Germination/emergence (1 study): One replicated, controlled study in a laboratory in the USA1 found that heating baldcypress Taxodium distichum seeds in a flame before sowing reduced their germination rate.
A replicated, controlled study in 2004 in a laboratory in Florida, USA (1) found that heating baldcypress Taxodium distichum seeds in a flame reduced their germination rate. Heated seeds had a lower germination rate (0% germinated) than unheated seeds (47% germinated). Methods: In August 2004, sixty baldcypress seeds were planted into trays of growing medium. All seeds had been stored at 4°C for four months before the experiment started, and soaked in distilled water for 24 h before planting. Thirty seeds (three replicates of 10 seeds) had also been held in a gas flame for 3 sec before soaking.
(1) Liu G., Li Y., Hedgepeth M., Wan Y. & Roberts R.E. (2009) Seed germination enhancement for bald cypress [Taxodium distichum (L.) Rich.]. Journal of Horticulture and Forestry, 1, 22–26.
13.32.4 Heat tree/shrub seeds before sowing: brackish/saline wetlands
We found no studies that evaluated the effects – on trees/shrubs typical of brackish/saline wetlands – of heating their seeds before sowing.
This means that we have not yet found any studies that have directly evaluated this intervention during our systematic journal and report searches. Therefore we have no evidence to indicate whether or not the intervention has any desirable or harmful effects.

13. Actions to complement planting
563
13.33 Expose seeds to light before sowing
We found no studies that evaluated the effects – on emergent wetland plants – of exposing their seeds to light before sowing.
This means that we have not yet found any studies that have directly evaluated this intervention during our systematic journal and report searches. Therefore we have no evidence to indicate whether or not the intervention has any desirable or harmful effects.
Background
Exposing seeds to light before planting can help to break seed dormancy and encourage germination. Seeds of some species (with physiological dormancy) must experience high temperatures before germinating, in order to break down chemicals that inhibit germination or stop the production of these chemicals. For other species (with physical dormancy), heat can increases the permeability of the seed coat to water and gases, which are essential for germination. For a database of seed dormancy class by species, see Baskin & Baskin (2014).
To be summarized as evidence for this intervention, studies must have explicitly compared the performance of treated and untreated seeds. Studies that simply report the performance of treated seeds are not summarized here. Studies do not have to be in flooded/saturated soils, as long as they involve wetland-characteristic species.
Related interventions: Soak seeds before sowing (13.30); Chill seeds before sowing (13.31); Heat seeds before sowing (13.32); Physically damage seeds before sowing (13.34); Treat seeds with chemicals before sowing (13.35).
Baskin C.C. & Baskin J.M. (2014) Seeds: Ecology, Biogeography and Evolution of Dormancy and Germination, Second Edition. Academic Press.
13.34 Physically damage seeds before sowing
Background
Damaging, weakening or softening the coating of seeds before planting can help to break seed dormancy and encourage germination. For species with physical dormancy, damage to the seed coat can increase its permeability to water and gases, which are essential for germination. For a database of seed dormancy class by species, see Baskin & Baskin (2014).
This intervention includes mechanically damaging seeds (e.g. by rubbing them with sandpaper or nicking them with a knife) and removing excess tissues from around the seed (e.g. the sac-like perigynia around sedge seeds). To be summarized as evidence for this intervention, studies must have explicitly compared the performance of treated and untreated seeds. Studies that simply report the performance of treated seeds are not summarized here. Studies do not have to be in flooded/saturated soils, as long as they involve wetland-characteristic species.
Related interventions: Soak seeds before sowing (13.30); Chill seeds before sowing (13.31); Heat seeds before sowing (13.32); Expose seeds to light before sowing (13.33); Treat seeds with chemicals before sowing (13.35).
Baskin C.C. & Baskin J.M. (2014) Seeds: Ecology, Biogeography and Evolution of Dormancy and Germination, Second Edition. Academic Press.

13. Actions to complement planting
564
13.34.1 Physically damage seeds of non-woody plants before sowing:
freshwater wetlands
Three studies evaluated the effects – on emergent, non-woody plants typical of freshwater wetlands – of physically damaging their seeds before sowing. All three studies were in greenhouses or laboratories in the USA.
VEGETATION COMMUNITY
VEGETATION ABUNDANCE
VEGETATION STRUCTURE
OTHER
Germination/emergence (3 studies): Two replicated, controlled studies (one also randomized) in greenhouses in the USA1,2 found that rubbing seeds of herbaceous plants with sandpaper before sowing had no significant effect on their germination rate. One replicated, randomized, paired, controlled study in a laboratory in the USA3 found that removing the sac-like seed coating before sowing typically increased, and did not reduce, the germination rate of sedges Carex spp.
A replicated, controlled study in the early 1990s in a laboratory in Colorado, USA (1) found that rubbing hardstem bulrush Scirpus acutus seeds with sandpaper had no significant effect on their germination rate. Germination rates did not significantly differ between seeds that had been rubbed between sandpaper before incubation (0–11% germination) and seeds that had not been rubbed (0–14% germination). Methods: Thirty-two sets of 10–50 hardstem bulrush seeds were incubated in flasks of fresh water at 10/25°C or 18/22°C (night/day temperatures). Of these, 16 sets had been rubbed 20 times with sandpaper immediately before incubation, whilst 16 sets had not. All seeds had been collected in August 1991 from two wild populations, stored in the laboratory for >5 months, and sterilized immediately before the experiment. The study does not clearly report the length of monitoring (probably between six and twelve weeks).
A replicated, randomized, controlled study in 1994–1995 in a greenhouse in Florida, USA (2) found that rubbing sawgrass Cladium jamaicense seeds with sandpaper had no significant effect on their germination rate. Germination rates did not significantly differ between seeds rubbed with sandpaper then soaked in water (44% germinated) and seeds only soaked in water (44% germinated). For reference, the germination rate of seeds that were neither rubbed nor soaked was 55%. Methods: In September 1994, three-year-old sawgrass seeds were sprinkled onto 18 trays of sterilized soil (100 seeds/tray). Six trays were planted with seeds rubbed with sandpaper for one minute then soaked in water for 24 h. Six trays were planted with seeds only soaked in water. Six trays were planted with untreated seeds (neither rubbed nor soaked). The trays were placed in random positions in a greenhouse and watered daily until no more germination occurred.
A replicated, randomized, paired, controlled study in 1997 in a laboratory in Utah, USA (3) found that removing the sac-like coating of sedge Carex spp. seeds before sowing never reduced the germination rate, although the precise effect depended on light conditions after sowing. In three of three comparisons involving seeds germinating in light, exposed seeds had a higher germination rate (43–95%) than seeds still in their sac (26–88%). In two of three comparisons involving seeds germinating in the dark, exposed seeds had a statistically similar germination rate (2–

13. Actions to complement planting
565
12%) to seeds still in their sac (1–8%). In the other comparison, exposed seeds had a higher germination rate (40%) than seeds still in their sac (31%). Methods: Two-year-old seeds of beaked sedge Carex utriculata and Nebraska sedge Carex nebracensis were sown into a total of 384 petri dishes (192 dishes/species; 32 seeds/dish), then incubated in the laboratory. In 192 random dishes, the sac-like coating of the seeds had been removed by tumbling the seeds in sandpaper. In the other 192 dishes, the coating had not been removed. Dishes were allocated to various other treatments (including germination in light vs dark, and different pre- and post-sowing temperature regimes). Each incubator shelf received four random dishes of each treatment combination. Germination rates, as a percentage of viable seeds, were recorded for each dish 36 days after sowing.
(1) Thullen J.S. & Eberts D.R. (1995) Effects of temperature, stratification, scarification, and seed origin on the germination of Scirpus acutus Muhl. seeds for use in constructed wetlands. Wetlands, 15, 298–304.
(2) Ponzio K. (1998) Effects of various treatments on the germination of sawgrass, Cladium jamaicense Crantz, seeds. Wetlands, 18, 51–58.
(3) Jones K.L., Roundy B.A., Shaw N.L. & Taylor J.R. (2004) Environmental effects on germination of Carex utriculata and Carex nebrascensis relative to riparian restoration. Wetlands, 24, 467–479.
13.34.2 Physically damage seeds of non-woody plants before sowing:
brackish/saline wetlands
We found no studies that evaluated the effects – on emergent, non-woody plants typical of brackish/saline wetlands – of physically damaging their seeds before sowing.
This means that we have not yet found any studies that have directly evaluated this intervention during our systematic journal and report searches. Therefore we have no evidence to indicate whether or not the intervention has any desirable or harmful effects.
13.34.3 Physically damage tree/shrub seeds before sowing: freshwater
wetlands
One study evaluated the effects – on trees/shrubs typical of freshwater wetlands – of physically damaging their seeds before sowing. The study was in a laboratory in the USA.
VEGETATION COMMUNITY
VEGETATION ABUNDANCE
VEGETATION STRUCTURE
OTHER
Germination/emergence (1 study): One replicated, controlled study in a laboratory in the USA1 found that cutting baldcypress Taxodium distichum seeds in half before sowing reduced their germination rate.
Growth (1 study): The same study1 found that cutting baldcypress Taxodium distichum seeds in half before sowing had no significant effect on the height of surviving seedlings, 30 days after germination.
A replicated, controlled study in 2004 in a laboratory in Florida, USA (1) found that cutting baldcypress Taxodium distichum seeds in half reduced their germination rate but had no significant effect on seedling growth. Seeds that had been cut in half had a lower germination rate (20% germinated) than whole seeds (48% germinated).

13. Actions to complement planting
566
After 30 days, there was no significant difference in the height of seedlings that had grown from cut seeds (8.3 cm) or whole seeds (8.3 cm). Methods: In August 2004, sixty baldcypress seeds were planted into trays of growing medium. All seeds had been stored at 4°C for four months before the experiment started, and soaked in distilled water for 24 h before planting. Thirty seeds (three replicates of 10 seeds) had also been cut in half with scissors before soaking. Germinated seedlings were transplanted to individual pots of growing medium and measured after 30 days.
(1) Liu G., Li Y., Hedgepeth M., Wan Y. & Roberts R.E. (2009) Seed germination enhancement for bald cypress [Taxodium distichum (L.) Rich.]. Journal of Horticulture and Forestry, 1, 22–26.
13.34.4 Physically damage tree/shrub seeds before sowing: brackish/
saline wetlands
We found no studies that evaluated the effects – on trees/shrubs typical of brackish/saline wetlands – of physically damaging their seeds before sowing.
This means that we have not yet found any studies that have directly evaluated this intervention during our systematic journal and report searches. Therefore we have no evidence to indicate whether or not the intervention has any desirable or harmful effects.
13.35 Treat seeds with chemicals before sowing
Background
Acids and bleach may weaken the seed coat, increasing its permeability to water and gases which are essential breaking dormancy and inducing germination (Baskin & Baskin 2014). They may also sterilize seeds, killing fungi that may otherwise reduce germination rates. Hormones are widely used in agriculture and horticulture to stimulate germination and growth (Small & Degenhardt 2018). Other molecules such as nitrates act as signals within plants and may stimulate germination (Alboresi et al. 2005).
To be summarized as evidence for this intervention, studies must have explicitly compared the performance of treated and untreated seeds. Studies that simply report the performance of treated seeds are not summarized here. Studies do not have to be in flooded/saturated soils, as long as they involve wetland-characteristic species.
Related interventions: Soak seeds before sowing (13.30); Chill seeds before sowing (13.31); Heat seeds before sowing (13.32); Expose seeds to light before sowing (13.33); Physically damage seeds before sowing (13.34).
Alboresi A., Gestin C., Leydecker M.T., Bedu M., Meyer C. & Truong, H.N. (2005) Nitrate, a signal relieving seed dormancy in Arabidopsis. Plant, Cell & Environment, 28, 500–512.
Baskin C.C. & Baskin J.M. (2014) Seeds: Ecology, Biogeography and Evolution of Dormancy and Germination, Second Edition. Academic Press.
Small C.C. & Degenhardt D. (2018) Plant growth regulators for enhancing revegetation success in reclamation: a review. Ecological Engineering, 118, 43–51.
13.35.1 Treat seeds of non-woody plants with chemicals before sowing:
freshwater wetlands

13. Actions to complement planting
567
Six studies evaluated the effects – on emergent, non-woody plants typical of freshwater wetlands – of treating their seeds with chemicals before sowing. All six studies were in greenhouses or laboratories in the USA.
VEGETATION COMMUNITY
VEGETATION ABUNDANCE
VEGETATION STRUCTURE
OTHER
Germination/emergence (6 studies): Of six replicated, controlled studies in greenhouses or laboratories in the USA, five1b,1c,1d,2,3 identified chemicals that sometimes increased, and did not significantly reduce, the germination rate of herb seeds: potassium nitrate1b, nitric acid1c and bleach1d,2,3. The effect of these chemicals depended on factors such as the age of the seeds1b, the species3 and other pre-sowing treatments3. Two of the studies identified chemicals that never had a significant effect on the germination rate of herb seeds: a plant hormone1a and sulfuric acid3.
A replicated, randomized, controlled study in 1994–1996 in greenhouses in Florida, USA (1a) found that soaking sawgrass Cladium jamaicense seeds in gibberellic acid had no significant effect on their germination rate. Germination rates did not significantly differ between seeds soaked in water then gibberellic acid (48–49% germinated) and seeds soaked in water only (44–51% germinated). For reference, seeds that were not soaked in gibberellic acid or water had a germination rate of 55–57%. Methods: Across September 1994 and 1995, sawgrass seeds (either freshly collected or three years old) were sprinkled onto 30 trays of sterilized soil (100 seeds/tray). Ten trays were planted with seeds soaked in water for 24 h then a gibberellic acid solution for 12 h. Ten trays were planted with seeds soaked in water for 24 h. Ten trays were planted with untreated seeds (left dry at room temperature). The trays were placed in random positions in greenhouses and watered daily until no more germination occurred.
A replicated, randomized, controlled study in 1994–1996 in greenhouses in Florida, USA (1b) found that soaking sawgrass Cladium jamaicense seeds in potassium nitrate either increased or had no significant effect on their germination rate. For 3-year-old seeds planted in 1994, seeds soaked in water then potassium nitrate had a higher germination rate (53%) than seeds soaked only in water (44%). For freshly-collected seeds planted in 1995, the germination rate did not significantly differ between seeds soaked in water then potassium nitrate (55%) and seeds soaked only in water (51%). For reference, seeds that were not soaked in potassium nitrate or water had a germination rate of 55–57%. Methods: Across September 1994 and 1995, sawgrass seeds were sprinkled onto 30 trays of sterilized soil (100 seeds/tray). In 10 trays, the seeds had been soaked in water for 24 h then potassium nitrate for 24 h. In 10 trays, the seeds had been soaked in water only. The final 10 trays were planted with untreated seeds (left dry at room temperature). The trays were placed in random positions in greenhouses and watered daily until no more germination occurred.
A replicated, randomized, controlled study in 1994–1996 in greenhouses in Florida, USA (1c) found that soaking sawgrass Cladium jamaicense seeds in nitric acid increased their germination rate. In two of two comparisons, germination rates were higher for seeds soaked in nitric acid then water (55–56%) than for seeds soaked in water only (44–51%). For reference, seeds that were not soaked in nitric acid or

13. Actions to complement planting
568
water had a germination rate of 55–57%. Methods: Across September 1994 and 1995, sawgrass seeds (either freshly collected or three years old) were sprinkled onto 30 trays of sterilized soil (100 seeds/tray). Ten trays were planted with seeds soaked in nitric acid for 12 h then water for 24 h. Ten trays were planted with seeds soaked in water only. Ten trays were planted with untreated seeds (left dry at room temperature). The trays were placed in random positions in greenhouses and watered daily until no more germination occurred.
A replicated, randomized, controlled study in 1995–1996 in a greenhouse in Florida, USA (1d) found that soaking sawgrass Cladium jamaicense seeds in bleach increased their germination rate. The germination rate was significantly higher for seeds that had been soaked in bleach (79% germinated) than for seeds that had only been soaked in water (51% germinated) or had been left dry at room temperature (57% germinated). Methods: In September 1995, freshly-collected sawgrass seeds were sprinkled onto 12 trays of sterilized soil (100 seeds/tray). In four trays, the seeds had been soaked in bleach (2–3% sodium hypochlorite) in a refrigerator for 72 h, then rinsed with tap water. In four trays, the seeds had been soaked in water at 25°C for 24 h. The final four trays were planted with unsoaked seeds. All trays were placed in random positions in a greenhouse and watered daily until no more germination occurred.
A replicated, controlled study in 1999 in a laboratory in Alabama, USA (2) found that sterilizing common rush Juncus effusus seeds before sowing increased their germination rate. In three of three comparisons, the germination rate was higher for sterilized seeds (93–96% germinated) than unsterilized seeds (53–81% germinated). Methods: In June 1999, common rush seeds were added to nutrient medium in 24-well cell culture plates. In 74 wells, the seeds had been sterilized before sowing, i.e. rinsed in deionized water, ethanol and bleach (5.25% sodium hypochlorite). In the other 74 wells, seeds had not been sterilized (presumably subjected to none of the rinsing treatments, although this was not clearly reported). Each well contained 5–10 field-collected seeds, stored for two days, two weeks or one year before sowing. Germination was monitored for 2–3 weeks.
A replicated, randomized, controlled study in 2015 in a greenhouse in Utah, USA (3) found that soaking seeds of three bulrush species in acid or bleach typically increased or had no significant effect on their germination rate, with the precise effect depending on factors such as the chemical used, whether seeds were chilled after soaking, bulrush species and source site. Seeds that had been soaked in bleach before sowing had a higher germination rate than unbleached seeds in 9 of 20 comparisons (for which bleached: 32–74%; unbleached: 2–25%). This included 9 of 10 comparisons involving seeds that were kept at room temperature (not chilled) before planting. Bleached and unbleached seeds had statistically similar germination rates in 8 of the 20 comparisons (for which bleached: 39–68%; unbleached: 27–58%). Seeds that had been soaked in acid before sowing had a statistically similar germination rate to unsoaked seeds in 20 of 20 comparisons (for which acid-soaked: 2–88%; unsoaked: 2–88%). Methods: Field-collected seeds of three bulrush species were sown onto sand in the greenhouse (36–72 sets of seeds/species; ≥100 seeds/set). There were 12–24 sets/species for each of three pre-sowing chemical treatments: soaking in 3% diluted household bleach for 48 h, soaking in 2.7% sulfuric acid for 40 min, or none. Some sets were also chilled and/or soaked in water after chemical treatments. After sowing, seeds were kept saturated and at 28–35°C. Germination rates for each set were recorded five weeks after sowing.

13. Actions to complement planting
569
(1) Ponzio K. (1998) Effects of various treatments on the germination of sawgrass, Cladium jamaicense Crantz, seeds. Wetlands, 18, 51–58.
(2) Ervin G.N. & Wetzel R.G. (2002) Effects of sodium hypochlorite sterilization and dry cold storage on germination of Juncus effusus L. Wetlands, 22, 191–195.
(3) Marty J.E. & Kettenring K.M. (2017) Seed dormancy break and germination for restoration of three globally important wetland bulrushes. Ecological Restoration, 35, 138–147.
13.35.2 Treat seeds of non-woody plants with chemicals before sowing:
brackish/saline wetlands
We found no studies that evaluated the effects – on emergent, non-woody plants typical of brackish/saline wetlands – of treating their seeds with chemicals before sowing.
This means that we have not yet found any studies that have directly evaluated this intervention during our systematic journal and report searches. Therefore we have no evidence to indicate whether or not the intervention has any desirable or harmful effects.
13.35.3 Treat tree/shrub seeds with chemicals before sowing: freshwater
wetlands
Two studies evaluated the effects – on trees/shrubs typical of freshwater wetlands – of treating their seeds with chemicals before sowing. Both studies were in one laboratory in the USA.
VEGETATION COMMUNITY
VEGETATION ABUNDANCE
VEGETATION STRUCTURE
OTHER
Germination/emergence (2 studies): Two replicated, controlled studies in a laboratory in the USA1a,1b found that soaking baldcypress Taxodium distichum seeds in weak sodium hydroxide increased their germination rate. One of the studies1a found that soaking in ethyl alcohol and/or hydrochloric acid reduced the germination rate. One of the studies1b found that soaking in stronger sodium hydroxide, or hydrogen peroxide and ethyl alcohol, had no significant effect on the germination rate.
Growth (1 study): One replicated, controlled study in a laboratory in the USA1a found that soaking baldcypress Taxodium distichum seeds in chemicals before sowing typically had no significant effect on the height of surviving seedlings, 30 days after germination. Soaking in ethyl alcohol, however, reduced seedling height.
A replicated, controlled study in 2004 in a laboratory in Florida, USA (1a) found that soaking baldcypress Taxodium distichum seeds in sodium hydroxide NaOH increased their germination rate, but that soaking in hydrochloric acid HCl or ethyl alcohol reduced their germination rate. Seeds soaked in 1% NaOH then water had a higher germination rate (54% germinated) than seeds soaked only in water (47% germinated). Seeds soaked in other chemicals had a lower germination rate than the seeds soaked only in water. This was true for 1% HCl (34% germinated), 95% ethyl alcohol (7% germinated), ethyl alcohol then NaOH (0% germinated), and ethyl alcohol then HCl (7% germinated). After 30 days and in three of four comparisons, there was no significant difference in the height seedlings that had grown from seeds soaked in chemicals (9.3–10.5 cm) or seeds soaked only in water (8.3 cm). In the other comparison, seedlings that had grown from seeds soaked in ethyl alcohol were

13. Actions to complement planting
570
shorter (4.3 cm) than the seeds soaked only in water. Methods: In August 2004, baldcypress seeds were planted into trays of growing medium. There were three replicates (10 seeds/replicate) for each of six pre-sowing chemical treatments (each involving soaking for 5 min/chemical): NaOH; HCl; ethyl alcohol; ethyl alcohol then NaOH; ethyl alcohol then HCl; or no chemical. All seeds were then soaked in distilled water for 24 h before sowing. All seeds had been stored at 4°C for four months before the experiment started. Germinated seedlings were transplanted to individual pots of growing medium and measured after 30 days.
A replicated, controlled study in 2004–2005 in a laboratory in Florida, USA (1b) found that soaking baldcypress Taxodium distichum seeds in weak sodium hydroxide NaOH increased their germination rate, but that soaking in stronger NaOH or hydrogen peroxide H2O2 + ethyl alcohol had no significant effect on their germination rate. Seeds soaked in 0.5% NaOH then water had a higher germination rate (45% germinated) than seeds soaked only in water (36% germinated). Seeds soaked in other chemicals had a statistically similar germination rate to seeds soaked only in water. This was true for 2% NaOH (33% germinated), 4% NaOH (36% germinated), 0.03% H2O2 + ethyl alcohol (36% germinated), and 0.3% H2O2 + ethyl alcohol (28% germinated). Methods: In November 2004, baldcypress seeds were planted into trays of growing medium. There were three replicates (12 seeds/replicate) for each of six pre-sowing chemical treatments: 0.5% NaOH for 24 h; 2% NaOH for 24 h; 4% NaOH for 24 h; 0.3% H2O2 + ethyl alcohol for 5 min; 0.03% H2O2 + ethyl alcohol for 5 min; or no chemical. All seeds were then soaked in distilled water for 24 h before sowing. All seeds had been stored at 4°C for four months before the experiment started.
(1) Liu G., Li Y., Hedgepeth M., Wan Y. & Roberts R.E. (2009) Seed germination enhancement for bald cypress [Taxodium distichum (L.) Rich.]. Journal of Horticulture and Forestry, 1, 22–26.
13.35.4 Treat tree/shrub seeds with chemicals before sowing: brackish/
saline wetlands
We found no studies that evaluated the effects – on trees/shrubs typical of brackish/saline wetlands – of treating their seeds with chemicals before sowing.
This means that we have not yet found any studies that have directly evaluated this intervention during our systematic journal and report searches. Therefore we have no evidence to indicate whether or not the intervention has any desirable or harmful effects.

571
14. Habitat protection
Background
This chapter considers the protection of marshes and swamps through legislation, voluntary agreements and economic incentives. These protection mechanisms are designed to prevent damage, loss or fragmentation of habitats linked to one or more of the threats outlined in Chapters 2–10.
Note that protection on paper does always confer protection in reality, as regulations might not be respected or enforced (Geldmann et al. 2019). Protection on paper also may not mitigate external or large-scale threats like climate change or pollution. Strictly protecting sites may inflict negative impacts on local people (Colchester 2004); limited, “wise” use of marshes and swamps may be a better way to maintain their value and ensure long-term protection (Ramsar Convention Secretariat 2010).
Protection might be the only intervention necessary for pristine or relatively undisturbed sites. Active management of such pristine sites can often cause more harm than good. High-level interventions and societal change, such as increasing use of renewable energy sources to reduce greenhouse gas emissions, could help to conserve pristine marshes and swamps but are beyond the scope of this synopsis.
Related chapters: Threat: Agriculture and aquaculture (Chapter 3), Threat: Pollution (Chapter 10) and Threat: Climate change and severe weather (Chapter 11), which all include interventions to physically protect marshes and swamps with fences, walls or barriers; Education and awareness-raising interventions that may contribute to habitat protection (Chapter 15).
Colchester M. (2004) Conservation policy and indigenous peoples. Environmental Science & Policy, 7, 145–153.
Geldmann J., Manica A., Burgess N.D., Coad L. & Balmford A. (2019) A global-level assessment of the effectiveness of protected areas at resisting anthropogenic pressures. Proceedings of the National Academy of Sciences USA, 201908221.
Ramsar Convention Secretariat (2010) Wise Use of Wetlands: Concepts and Approaches for the Wise Use of Wetlands, Fourth Edition. Ramsar Convention Secretariat, Gland.
14.1 Designate protected area
Four studies evaluated the overall effects, on vegetation or human behaviour, of designating protected areas involving marshes or swamps. There were two studies in China3,4, one in Malaysia1 and one in Puerto Rico2.
VEGETATION COMMUNITY
Overall extent (4 studies): Two studies (one replicated, one before-and-after) in China3,4 reported that the area of marsh, swamp or unspecified wetland in protected areas declined over 6–12 years. One replicated, site comparison study in Puerto Rico2 reported that protection had no clear effect on mangrove forest area, with similar changes over 25 years in protected and unprotected sites. One study of a mangrove forest in Malaysia1 reported that it retained at least 97% of its forest area over 98 years of protection as a forest reserve.

14. Habitat protection
572
VEGETATION ABUNDANCE
VEGETATION STRUCTURE
Overall structure (2 studies): One replicated study in China3 reported “degradation” of the landscape structure of protected wetlands over 12 years. One before-and-after study in China4 reported fragmentation of wetland habitat within a protected area, but that this meant its structure became more like it had been 10–40 years previously.
Background
This intervention includes protection of specific marshes or swamps, or areas that contain these habitats, whether through legal means (e.g. many National Parks and Marine Protected Areas) or some other agreement or commitment (e.g. Biosphere Reserves, Ramsar Sites, Wild and Scenic Rivers). Protected areas may be publicly or privately owned.
Protected areas may prohibit all human uses, or allow sustainable use to varying degrees and perhaps within designated zones. ‘Wise use’ of wetlands – allowing activities such as collection of plant materials for handicrafts, fishing, hunting, charcoal production and scientific research, as long as the ecological character of the site is maintained – is a fundamental principle of the Ramsar Convention (Ramsar Convention Secretariat 2010).
Studies that include, or aim to conserve, at least some marsh or swamp habitat are summarized as evidence for this intervention. Given the broad scale of this intervention, results may include other wetland habitats (e.g. peatlands and mudflats), aquatic habitats (e.g. rivers and lakes) or upland habitats (e.g. forests). It is not unusual for an entire catchment or watershed to be protected (Sullivan et al. 2018). We have not summarized the following types of information, which are particularly weak or misleading when assessing effectiveness of protected areas:
Information about implementation only (i.e. area or number of protected sites).
Studies comparing protected and unprotected areas at a single time point (e.g. Imbert & Delbé 2006; Di Bella et al. 2014). In such studies, differences between protected and unprotected areas may simply reflect the fact that “better” areas (e.g. containing more species or marsh/swamp habitat) were selected for protection (Joppa & Pfaff 2009).
Studies examining the effects of specific interventions designed to tackle threats within protected areas (e.g. hunting, vehicle use, overharvesting). These studies are considered in other chapters.
CAUTION: Restricting certain activities in protected areas could actually increase the threat they pose. For example, restricting prescribed burning might (a) cause a build-up of vegetation or litter, stockpiling fuel for wild fires, or (b) encourage more illicit and uncontrolled burning due to the hurdle of obtaining permits (Pott & Pott 2004).
Related interventions: bans/restrictions specifically to manage human intrusions and disturbance (Chapter 7); Provide general protection for marshes or swamps (14.2); Require mitigation of impacts to marshes or swamps (14.3); Pay stakeholders to protect marshes or swamps (14.4); Increase ‘on the ground’ protection for marshes or swamps (14.5).
Di Bella C.E., Jacobo E., Golluscio R.A. & Rodríguez A.M. (2014) Effect of cattle grazing on soil salinity and vegetation composition along an elevation gradient in a temperate coastal salt marsh of Samborombón Bay (Argentina). Wetlands Ecology and Management, 22, 1–13.

14. Habitat protection
573
Imbert D. & Delbé L. (2006) Ecology of fire-influenced Cladium jamaicense marshes in Guadeloupe, Lesser Antilles. Wetlands, 26, 289–297.
Joppa L.N. & Pfaff A. (2009) High and far: biases in the location of protected areas. PLoS ONE, 4, e8273.
Pott A. & Pott V.J. (2004) Features and conservation of the Brazilian Pantanal wetland. Wetlands Ecology and Management, 12, 547–552.
Ramsar Convention Secretariat (2010) Wise Use of Wetlands: Concepts and Approaches for the Wise Use of Wetlands, Fourth Edition. Ramsar Convention Secretariat, Gland.
Sullivan C.A., Finlayson C.M., Heagney E., Pelletier M.-C., Acreman M.C. & Hughes J.M.R. (2018) Wetland landscapes and catchment management. Pages 404–421 in: J.M.R. Hughes (ed.) Freshwater Ecology and Conservation: Approaches and Techniques. Oxford University Press, Oxford.
A study in 1908–2006 of a sustainably managed mangrove forest in Peninsular Malaysia (1) reported that it retained at least 97% of its mangrove coverage over this period. Mangrove coverage may even have increased slightly, through colonization of newly deposited sediments. For context, the study reports 16% loss of mangrove forest coverage across Malaysia between 1973 and 2000, but an increase of around 6% in Perak State (where the studied managed forest is located) between 1980 and 2000. Methods: The Matang Mangrove Forest Reserve has been protected and managed with sustainable, rotational wood harvesting since 1908. The study does not report details of the methods used to monitor mangrove coverage. Most data are taken from previously published sources.
A replicated, site comparison study in 1977–2002 of 97 mangrove forest sites in Puerto Rico (2) reported that site-level protection had no clear effect on mangrove forest area. Statistical significance was not assessed. Between 1977 and 2002, the total area of mangrove forest increased by 10% in protected sites (from 4,440 to 4,900 ha), 9% in partially protected sites (part protected, part unprotected; from 1,880 to 2,050 ha) and 15% in unprotected sites (from 1,090 to 1,250 ha). Considering individual sites, mangrove area increased in 52% of protected sites, 53% of partially protected sites and 40% of unprotected sites. Mangrove area decreased in 18% of protected sites, 17% of partially protected sites and 25% of unprotected sites. Methods: The study was based on historical estimates of mangrove forest area in 97 discrete sites across Puerto Rico, derived from aerial photos or satellite images. Note that site-level protection of mangroves in Puerto Rico occurs against a background of general legal protection of these habitats since 1972.
A replicated study in 2000–2012 of 28 protected areas in northeast China (3) reported that the area of marsh and swamp within them decreased over time. Statistical significance was not assessed. The combined area of marshes and swamps decreased by 9% between 2000 and 2012, from 8,444 km2 to 7,724 km2. The area of natural aquatic habitats (rivers and lakes) decreased by 16%, from 5,805 km2 to 4,886 km2. The biggest cause of these losses was conversion to cropland (responsible for 39% of the area of marsh/swamp/aquatic habitat lost). The study also reported “degradation” of the landscape-scale structure of marsh/swamp/aquatic habitats in 21 of the 28 protected areas (reported as an index based on metrics such as the size, shape and separation of habitat patches). Methods: Twenty-eight protected areas were studied. They had been established between 1979 and 2003 (22 before 2000). All but one contained areas of marsh and/or swamp. Most were probably freshwater but some were probably brackish/saline (not explicitly reported). Land cover was determined from satellite images taken in summer or autumn 2000 and 2012. Classifications were verified in the field. Rainfall was similar in both years for each protected area (statistical significance not assessed).

14. Habitat protection
574
A before-and-after study in 1972–2013 of a protected area in northwest China (4) reported that the area of wetland habitat declined despite protection, and that the habitat became more fragmented. Statistical significance was not assessed. The study site was protected as a National Nature Reserve in 2007. Between 2007 and 2013, wetland area declined from 657 km2 to 588 km2. For comparison, wetland covered 755 km2 in 1972 and 798 km2 in 1998. Between 2007 and 2013, the wetland habitat also became more fragmented, comprised of more, smaller patches with more complex borders (data reported as landscape metrics). This was a return towards the habitat configuration recorded in 1972 and 1998. The study also noted increasing rainfall, temperature, human population and farmland area near the study site. Methods: Land cover on the site of Ebinur Lake Wetland National Nature Reserve was mapped in two years before protection (1972, 1998) and two years after protection (2007, 2013). The date of protection was verified for this summary using Zhang et al. (2019). Data sources included satellite images, photos and GPS data. Wetland habitat excluded water bodies.
(1) Chong V.C. (2006) Sustainable utilization and management of mangrove ecosystems in Malaysia. Aquatic Ecosystem Health & Management, 9, 249–260.
(2) Martinuzzi S., Gould W.A., Lugo A.E. & Medina E. (2009) Conversion and recovery of Puerto Rican mangroves: 200 years of change. Forest Ecology and Management, 257, 75–84.
(3) Lu C., Wang Z., Li L., Wu P., Mao D., Jia M. & Dong Z. (2016) Assessing the conservation effectiveness of wetland protected areas in northeast China. Wetlands Ecology and Management, 24, 381–398.
(4) Yu H., Zhang F., Kung H., Johnson V.C., Bane C.S., Wang J., Ren Y. & Zhang Y. (2017) Analysis of land cover and landscape change patterns in Ebinur Lake Wetland National Nature Reserve, China from 1972 to 2013. Wetlands Ecology and Management, 25, 619–637.
Additional Reference:
Zhang F., Yushanjiang A. & Jing Y. (2019) Assessing and predicting changes of the ecosystem service values based on land use/cover change in Ebinur Lake Wetland National Nature Reserve, Xinjiang, China. Science of the Total Environment, 656, 1133–1144.
14.2 Provide general protection for marshes or swamps
Three studies evaluated the overall effects, on vegetation or human behaviour, of providing general protection for marshes or swamps. There was one study in each of Puerto Rico1, China2 and Canada3.
VEGETATION COMMUNITY
Overall extent (3 studies): Two studies in China2 and Canada3 reported that the area of wetlands (including habitats other than marshes or swamps) in their study regions declined over 10–29 years, despite general protection of wetlands. However, in China2, the decline was slower than in a previous period without protection. One before-and-after study of mangrove forests in Puerto Rico1 reported that their area increased following legal protection.
VEGETATION ABUNDANCE
VEGETATION STRUCTURE
Overall structure (1 study): One before-and-after study in China2 reported degradation in wetland landscape structure over 29 years when wetlands were generally protected. However, the decline was slower than in a previous period when wetlands were not protected.

14. Habitat protection
575
Background
This intervention involves general protection of marshes or swamps by hard law, policy or regulation, usually at a national or international level. Conceptually, this is similar to protecting individual species, such as in the European Union Habitats Directive. In 1760, King Don José of Portugal issued an order to restrict the widespread cutting of mangroves in Brazil (FAO 2007). More recently, the Sri Lankan Environment Ministry agreed to establish legal protection for all of the country’s mangroves (Seacology 2016).
Studies that include, or aim to conserve, at least some marsh or swamp habitat are summarized as evidence for this intervention. Given the broad scale of this intervention, results may include other wetland habitats (e.g. peatlands and mudflats), aquatic habitats (e.g. rivers and lakes) or upland habitats (e.g. forests).
Related interventions: Designate protected area involving marshes or swamps (14.1); Require mitigation of impacts to marshes or swamps (14.3).
FAO (2007) The World’s Mangroves 1980–2005. Food and Agriculture Organization of the United Nations, Rome, Italy.
Seacology (2016) The Sri Lanka Mangrove Conservation Project. Seacology Report. Available at https://www.seacology.org/wp-content/uploads/2016/11/Sri-Lanka-prospectus-2016-web-pages.pdf. Accessed 24 July 2020.
A before-and-after study in 1959–2002 of mangrove forests in Puerto Rico (1) reported that their area increased following legal protection of all mangroves on the island. Between 1959 and 1971, the area of mangroves in Puerto Rico declined from approximately 7,285 ha to 6,745 ha. The study attributes this to urban expansion. In 1972, legal protection was granted to all mangroves in Puerto Rico. Subsequently, the area of mangroves increased to 7,443 ha in 1977 and 8,323 ha in 2002. The study suggests that active restoration efforts and declining agricultural production contributed to this increase, alongside legal protection. The study also notes that lowland freshwater swamps, which were not granted the same protection as mangroves, were “almost none existent” by the early 2000s. Methods: The study was based on historical estimates of mangrove forest area across Puerto Rico, derived from aerial photos or satellite images. Estimates were corrected to include mangrove forests only, not associated wetland ecosystems.
A before-and-after study in 1954–2005 in northeast China (2) reported that following legal protection of wetlands, the area of marshland on the plain decreased but at a slower rate than before protection, and that the same was generally true for landscape structural metrics. Statistical significance was not assessed. Between 1954 and 1986, when wetlands were not protected and government polices instead encouraged conversion of wetlands to farmland, the area of marshland on the plain had decreased by 668 km2/year (from 35,300 km2 to 13,900 km2). Between 1986 and 2005, when local and national governments prohibited wetland reclamation and established protected areas, the area of marshland on the plain decreased by 305 km2/year (from 13,900 km2 to 8,100 km2). Most landscape structural metrics declined more slowly after protection than before (i.e. largest patch size, variation in patch size, complexity of patch outlines; see original paper for data). In contrast, average patch size declined after protection (from 941 to 781 ha) compared to an increase before (from 735 to 941 ha). Throughout the study, there were increases in cropland area, human population and air temperature, but no significant change in precipitation.

14. Habitat protection
576
Methods: Digital maps of marshland on the Sanjiang Plain were created from paper maps (drawn around the 1954 growing season) and satellite images (taken in growing seasons between 1976 and 2005). The digital maps were verified in the field. “Marshland” was defined as all non-woody vegetated wetlands, so included some open bogs as well as true marshes.
A study in 1999–2009 of wetlands in the Beaverhill Subwatershed, Alberta, Canada (3) reported that legal protection did not prevent the loss of wetlands. From 1999, wetlands in Alberta were protected by a general policy to conserve their natural state and maintain their area (1993 Wetland Policy), and a legal requirement to obtain a permit for activities that would negatively impact them (1999 Water Act). Between 1999 and 2009, a total of 242 wetlands covering 71 ha were lost in the Beaverhill Subwatershed. Of the area lost, 82% occurred without a permit. The authors suggest they underestimated wetland loss, as they only included cases when the wetland basin was completely removed (and not cases where the basin was drained but its profile remained). Methods: The number and area of wetlands in the Beaverhill Subwatershed were estimated based on remotely-sensed elevation data collected in 1999 and 2009.
(1) Martinuzzi S., Gould W.A., Lugo A.E. & Medina E. (2009) Conversion and recovery of Puerto Rican mangroves: 200 years of change. Forest Ecology and Management, 257, 75–84.
(2) Wang Z., Song K., Ma W., Ren C., Zhang B., Liu D., Chen J.M. & Song C. (2011) Loss and fragmentation of marshes in the Sanjiang Plain, northeast China, 1954–2005. Wetlands, 31, 945–954.
(3) Clare S. & Creed I.F. (2014) Tracking wetland loss to improve evidence-based wetland policy learning and decision making. Wetlands Ecology and Management, 22, 235–245.
14.3 Require mitigation of impacts to marshes or swamps
Nine studies evaluated the overall effects – on vegetation or human behaviour – of requiring mitigation of impacts to marshes or swamps. All nine studies were in the USA.
VEGETATION COMMUNITY
Overall extent (6 studies): Four studies in the USA1–4 reported that requiring mitigation of impacts to wetlands did not prevent loss of wetland area: the total area restored/created was less than the area destroyed. One study in the USA5 reported that the total area of wetlands restored/created for mitigation was greater than the area destroyed. However, the area restored/created was smaller in most individual projects. Two of the studies1,5 reported that fewer individual wetlands were restored/created than destroyed. One before-and-after study in the USA8 found that wetland area declined after legislation to offset impacts came into force, but at a slower rate than before the legislation applied. Four of the studies1–3,5 reported discrepancies between the area of specific vegetation types restored/created vs destroyed.
VEGETATION ABUNDANCE
VEGETATION STRUCTURE
OTHER
Compliance (8 studies): Eight studies, all in the USA1–7,9, provided information about compliance with required mitigation. Five of the studies1–5 reported that the total area of wetlands conserved was less than the area required in permits. Three of the studies2,4,6 reported that most mitigation projects failed to meet targets stipulated in permits. One of the studies9 reported that only one of

14. Habitat protection
577
seven vegetation targets was met in all mitigation sites. One of the studies7 reported that 64–74% of assessed mitigation areas met success criteria stipulated in permits.
Background
Authorities may require mitigation of impacts to the environment (State of Queensland 2017) or wetlands specifically (Gardner et al. 2012; Poulin et al. 2016). For example, under the Section 404 of the Clean Water Act in the USA, a permit is required for discharging sediment into wetlands. Where possible, impacts should be avoided or minimized. Any unavoidable impacts must be compensated for (or offset) by protection, restoration or creation of wetlands elsewhere. Mitigation legislation is intended to protect the overall quantity and quality of wetlands in a region or country.
Given that mitigation requiriements typically have broad coverage, results may include other wetland habitats (e.g. peatlands and mudflats), aquatic habitats (e.g. rivers and lakes) or upland habitats (e.g. forests). Studies that include, or aim to conserve, at least some marsh or swamp habitat are summarized as evidence for this intervention. Where possible, specific results for marshes and swamps have been extracted.
To be summarized as evidence for this intervention, studies must have looked at the impact of permits on the number/area/type of wetlands created or restored in practice. Studies only looking at permits issued and mitigation required by permits are not included as evidence (although this information may be included as context for the summarized studies). Results relating to detailed characteristics of vegetation within restored/created mitigation wetlands (e.g. Balcombe et al. 2005) are summarized elsewhere in this synopsis (e.g. Section 12.1).
Related interventions: Designate protected area involving marshes or swamps (14.1); habitat restoration and creation interventions, which could be used for mitigation (Chapter 12).
Balcombe C.K., Anderson J.T., Fortney R.H., Rentch J.S., Grafton W.N. & Kordek W.S. (2005) A comparison of plant communities in mitigation and reference wetlands in the mid-Appalachians. Wetlands, 25, 130–142.
Gardner, R. C., Bonells, M., Okuno, E., Zarama, J. M (2012) Avoiding, Mitigating, and Compensating For Loss and Degradation of Wetlands in National Laws and Policies. Ramsar Scientific and Technical Briefing Note No. 3. Ramsar Convention Secretariat, Gland.
Poulin M., Pellerin S., Cimon-Morin J., Lavallée S., Courchesne G. & Tendland Y. (2016) Inefficacy of wetland legislation for conserving Quebec wetlands as revealed by mapping of recent disturbances. Wetlands Ecology and Management, 24, 651–665.
State of Queensland (2017) Queensland Environmental Offsets Policy: General Guide v1.2. Available at https://environment.des.qld.gov.au/__data/assets/pdf_file/0018/90180/offsets-policy-general-guide.pdf. Accessed 30 June 2020.
A study in the late 1980s/early 1990s in Ohio, USA (1) reported that five development permits that demanded compensation for impacts to marshes and swamps did not maintain their area, number or vegetation type. The permits required creation of 42 ha of marsh/swamp in five sites, compared to 24 ha lost to development in five sites. All five permits were followed through, but only restored/ created 16 ha of marsh/swamp: a net loss of 8 ha. Further, compensation was not “in kind” in two of the five sites: one failed to establish woody vegetation that was present in a lost swamp, and one created a deep pond surrounded by trees on upland (rather than a marsh). The study also quantified the vegetation of created sites in more detail

14. Habitat protection
578
(see Section 12.1). Methods: This study analyzed data relating to five permits, issued in the late 1980s/early 1990s for projects involving filling of marshes or swamps. Permits were issued under Section 404 of the Clean Water Act. The assessment was based on available published reports and field surveys carried out 1–4 years after restoration/creation was completed.
A study in 1983–1997 of 114 development projects in Massachusetts, USA (2) reported that permits requiring compensation for impacts to marshes and swamps did not prevent a loss in their area, and found that compensation was compliant with permit conditions in only 43% of completed projects. The study examined 114 development projects which encroached onto marshes or swamps and for which permits required compensatory mitigation. Compensatory sites required by the permits were 23% larger than impacted sites on average, but they were generally not the same type (e.g. impacted: 71% forested; designated: 61% shrubby). In practice, compensatory sites were 34% smaller than impacted sites. Furthermore, 39% were not even wetlands. In only 47 of 109 completed projects was compensation compliant with the permit (i.e. a wetland was created of similar size to the impacted wetland, with ≥75% cover of emergent vegetation). The study also compared vegetation in compensatory wetlands and remnant natural wetlands (see Section 12.1). Methods: The study examined 114 projects that were granted permits, between 1983 and 1994, to destroy marshes or swamps as long as replacements were created elsewhere. Data were extracted from permit records and collected in vegetation surveys in summer 1997.
A study in 1998–1999 in Indiana, USA (3) reported that permits requiring compensation for impacts to marshes and swamps did not prevent a loss in marsh/swamp area or maintain habitat types. The study examined 345 sites where marsh/swamp or aquatic habitats should have been restored or created to compensate for loss. Of these sites, 214 had been constructed as planned. In a sample of 31 constructed sites, permits required restoration/creation of 26.3–30.2 ha of marshes/swamps to compensate for impacts to 12.1–12.8 ha. The actual area of marsh/swamp created was 10.2 ha. So, there was a 16–20% net loss of marsh/swamp area in constructed sites. For three of four vegetation types (shrubby swamps, wet meadows, shallow marsh), the area restored/created (6.4 ha) was greater than the area lost (4.1 ha). For forested swamps, the area restored/created (3.8 ha) was less than the area lost (8.0 ha). Methods: The status of 345 compensatory mitigation sites, required by Section 404 permits issued before December 1996, was checked in 1998–1999. Status was classified as constructed, incomplete or no construction attempted. Vegetation of 31 sites was surveyed in more detail.
A study in the 1990s of 50 development projects in Tennessee, USA (4) reported that requiring mitigation of impacts to wetlands did not prevent loss of wetland area. Permits for 50 completed development projects required conservation of 104 ha of wetlands to mitigate impacts to 38 ha of wetlands. However, only 78 ha of wetlands were conserved in practice. Furthermore, only 35 ha of these were restored or created, leading to a net loss of 3 ha of wetlands. The other 43 ha of conservation involved preservation or enhancement of existing wetlands, which does not replace lost area. Finally, the study reports that in only 2 of the 50 projects did conservation meet all permit specifications (e.g. hydrology and vegetation establishment). Methods: This study analyzed data from 50 completed development projects across Tennessee, for which state-level Aquatic Resource Alteration Permits demanded mitigation of impacts to wetlands. Wetland areas were surveyed in the field in summer 1997 and 1998: 1–6 years after project completion.

14. Habitat protection
579
A study in 1995–2004 in Ohio, USA (5) reported that 23 development permits requiring mitigation of impacts to wetlands prevented the loss of wetland area, but not habitat types or wetland number. Mitigation was carried out for all 23 permits. For two permits, compensation involved preserving existing wetlands. The other 21 permits mandated 27.8 ha of wetland restoration/creation as compensation. In practice, 26.3 ha of wetlands were restored/created, compared to 15.0 ha lost due to development: a net gain of 11.3 ha. However, 8 of 12 projects examined in more detail failed to restore/create the area mandated in their permits. Further, compensation in these projects was rarely “in kind”. Restored/created wetlands were mostly marsh (83% by area), whilst the impacted wetlands were a mixture of shrubby or forested swamp (57%) and marsh (43%). The 12 projects also restored/created fewer wetlands (65) than were impacted (134). Methods: The 23 permits in this study were issued between 1995 and 2003 for activities impacting wetlands. The permits were issued under the Clean Water Act. Information was taken from permit documentation and from field surveys of restored/created wetlands in summer 2004. Estimates of wetland area included some aquatic habitats (open water/submerged vegetation) and some existing natural wetlands incorporated into restoration/creation sites.
A study in 2008 of 11 compensatory wetlands in Michigan, USA (6) reported that only 45% were compliant with the permit requirement of <10% invasive plant cover. In the five compliant wetlands, invasive plant cover was 4–7%. In the six non-compliant wetlands, invasive plant cover was 11–26%. Compliance was greater in wetlands restored directly adjacent to existing wetlands (five of six compliant) than in wetlands created far from existing wetlands (zero of five compliant). Methods: Vegetation was surveyed in 11 compensatory wetlands in summer 2008. The wetlands had been restored or created 2–5 years previously, to compensate for impacts from road construction. All contained some emergent vegetation. Permits for impact were issued between 2003 and 2006, under Section 404 of the Clean Water Act and Part 303 of Michigan’s Natural Resources Environmental Protection Act.
A study in 2007–2009 of 205 wetland components within 82 development projects in North Carolina, USA (7) reported 64–74% compliance with success criteria outlined in permits. The study examined 205 individual wetland components: distinct areas of wetland, habitat or mitigation type (e.g. “4 ha of swamp restoration” and “10 ha of marsh preservation”). Of these, 70–74% met permit success criteria. In turn, 64–70% of the area of these wetland components met permit success criteria. The lower values are for all projects (mitigation by creation, restoration, enhancement or preservation); the higher values exclude preservation projects, which were more likely to meet success criteria. Methods: This study analyzed the success rate of 205 wetland components within 82 randomly selected development projects. These had been granted permits to impact wetlands between 1996 and 2006. Permits were issued under Section 401 of the Clean Water Act. Mitigation success was assessed through field surveys carried out between 2007 and 2009. Success was defined as compliance with vegetation, hydrological, soil and/or protection criteria outlined in each permit. Vegetation criteria usually involved a minimum abundance of emergent vegetation.
A before-and-after study in 1972–2012 in Oregon, USA (8) found that after legislation to offset impacts to wetlands came into force, the overall area of vegetated wetlands still decreased, but at a significantly slower rate than before the legislation came into force. Over 22 years with offsetting legislation, the area of vegetated wetlands in the study region decreased by 2.1 ha/year (vs 13.3 ha/year over the 17

14. Habitat protection
580
years before legislation). More specifically, the area of shrubby and forested wetlands decreased by only 3.6 ha/year after legislation (vs 9.3 ha/year before legislation). Furthermore, the area of emergent herbaceous wetlands (marshes, wet meadows, bogs and fens) increased by 1.4 ha/year after legislation (vs 3.5 ha/year decrease before legislation). The study notes that wetland gains/losses in the study area might compensate for losses/be compensated by gains outside the study area. Methods: Section 404 of the Clean Water Act came into force in 1990 and required compensatory mitigation for some unavoidable impacts to wetlands. The area of vegetated wetlands along the Willamette River floodplain was estimated from satellite images, taken every summer between 1972 and 2012. Wetland classifications were checked using aerial photographs and field surveys.
A study in 1996–2012 of 30 compensatory mitigation sites in Illinois, USA (9) reported that that they did not consistently meet targets specified in permits after 4–21 years. Of the 30 mitigation sites, 29 were classified as wetlands based on vegetation, water levels and soils. However, of seven targets related to vegetation, only one (cover of wetland plants) was met in 100% of applicable sites at some point during monitoring. The other targets were met in 13–86% of applicable sites at some point during monitoring. The study does not report the precise target for each site. The study also compared vegetation in compensatory sites and remnant natural wetlands (see Section 12.1). Methods: The study involved 30 sites where wetland restoration was required by permits for road construction and maintenance. Target wetlands were marshes (15 sites), swamps (13 sites) or a mixture of both (2 sites). Restoration was carried out between 1992 and 2004. Vegetation was surveyed once/site in 1996–2009 and once/site in 2012.
(1) Wilson R.F. & Mitsch W.J. (1996) Functional assessment of five wetlands constructed to mitigate wetland loss in Ohio, USA. Wetlands, 16, 436–451.
(2) Brown S.C. & Veneman P.L.M. (2001) Effectiveness of compensatory wetland mitigation in Massachusetts, USA. Wetlands, 21, 508–518.
(3) Robb J.T. (2002) Assessing wetland compensatory mitigation sites to aid in establishing mitigation ratios. Wetlands, 22, 435–440.
(4) Morgan K.L. & Roberts T.H. (2003) Characterization of wetland mitigation projects in Tennessee, USA. Wetlands, 23, 65–69.
(5) Kettlewell C.I., Bouchard V., Porej D., Micacchion M., Mack J.J., White D. & Fay L. (2008) An assessment of wetland impacts and compensatory mitigation in the Cuyahoga River Watershed, Ohio, USA. Wetlands, 28, 57–67.
(6) Kozich A.T. & Halvorsen K.E. (2012) Compliance with wetland mitigation standards in the Upper Peninsula of Michigan, USA. Environmental Management, 50, 97–105.
(7) Hill T., Kulz E., Munoz B., Dorney J.R. (2013) Compensatory stream and wetland mitigation in North Carolina: an evaluation of regulatory success. Environmental Management, 51, 1077–1091.
(8) Fickas K.C., Cohen W.B. & Yang Z. (2016) Landsat-based monitoring of annual wetland change in the Willamette Valley of Oregon, USA from 1972 to 2012. Wetlands Ecology and Management, 24, 73–92.
(9) van den Bosch K. & Matthews J.W. (2017) An assessment of long-term compliance with performance standards in compensatory mitigation wetlands. Environmental Management, 59, 546–556.
14.4 Pay stakeholders to protect marshes or swamps
Two studies evaluated the overall effects, on vegetation or human behaviour, of paying stakeholders to protect marshes or swamps. There was one study in each of the UK1 and Nigeria2.
VEGETATION COMMUNITY

14. Habitat protection
581
Overall extent (1 study): One replicated, before-and-after, site comparison study in the UK1 found that paying landowners to manage farmland ditches under agri-environment rules had no clear or significant effect on the frequency of emergent vegetation.
Overall richness/diversity (1 study): One replicated, site comparison study in the UK1 found that farmland ditches managed under agri-environment rules contained a similar number of plant species to ditches not managed under these rules.
VEGETATION ABUNDANCE
VEGETATION STRUCTURE
OTHER
Human behaviour (1 study): One study in Nigeria2 reported that 58 communities with access to micro-credits for sustainable development changed their behaviour. In particular, they switched from livelihood practices that damaged mangrove forests to more sustainable practices.
Background
Stakeholders could be paid to conserve marshes or swamps and the benefits they provide (e.g. wildlife habitat and carbon storage). This may involve protection of individual extant sites, or restoration/creation of sites to protect large-scale extent of marsh and swamp habitats. Participation is typically voluntary. Payments could be made directly or as tax incentives, could be paid as cash or as alternative lands, and could come from governments, non-governmental organizations or private sponsorship. Advice, monitoring and enforcement are often offered alongside payments.
Examples of payment schemes relevant to marsh and swamp conservation include the Wetland Reserve Programme in the USA (NRCS 2019), nationally or internationally funded agri-environment schemes (Keenleyside & Moxey 2011), and the Bio-Rights programme in which funding for community development is contingent on the community carrying out agreed conservation actions (van Eijk & Kumar 2009).
Studies that include, or aim to conserve, at least some marsh or swamp habitat are summarized as evidence for this intervention. Given the broad scale of this intervention, results may include other wetland habitats (e.g. peatlands and mudflats), aquatic habitats (e.g. rivers and lakes) or upland habitats (e.g. forests). Studies must quantify the overall effects of paying stakeholders, with some comparison of conservation activities with vs without payment (e.g. in management units enrolled on payment schemes vs not, states with payment schemes vs without, or times before vs after introduction of payment schemes). The following types of study have not been summarized as evidence of this intervention:
Studies simply examining vegetation within wetlands restored/created under payment schemes (e.g. De Steven & Gramling 2012).
Studies reporting uptake only (e.g. area of land contracted to payment schemes, or number of people signed up).
Studies examining effects of specific interventions carried out under payment schemes (e.g. abandoning land, rewetting, planting, or multiple interventions). These are included in other chapters.
Related interventions: Adopt ecotourism principles/create an ecotourism site as a source of funding to protect marshes and swamps (7.7); habitat restoration and creation interventions, which may be funded by payment schemes (Chapter 12).

14. Habitat protection
582
De Steven D. & Gramling J.M. (2012) Diverse characteristics of wetlands restored under the Wetlands Reserve Program in the southeastern United States. Wetlands, 32, 593–604.
Keenleyside C. & Moxey A. (2011) Public Funding of Peatland Management and Restoration in the UK – a Review. Report to IUCN UK Peatland Programme, Edinburgh.
NRCS (2017) Wetlands Reserve Program. Available at http://www.nrcs.usda.gov/wps/portal/nrcs/ detail/null/?cid=nrcs143_008419. Accessed 6 December 2019.
van Eijk P. & Kumar R. (2009) Bio-Rights in Theory and Practice. A Financing Mechanism for Linking Poverty Alleviation and Environmental Conservation. Wetlands International, Wageningen.
A replicated, before-and-after, site comparison study in 2005–2012 of farmland ditches in England, UK (1) found that managing ditches under an agri-environment scheme had no significant effect on the frequency of emergent vegetation or total plant species richness. After six years, 48–55% of ditches managed under agri-environment rules contained emergent vegetation. There were 6.1–6.5 plant species/ditch (emergent, aquatic and terrestrial combined). These values did not significantly differ from ditches not managed under agri-environment rules: 62% contained emergent vegetation and there were 6.4 plant species/ditch. Additionally, there was no change over time in the proportion of managed ditches that contained emergent vegetation: 39% just before or just after the agri-environment scheme began, then 34% five years later (statistical significance not assessed). Methods: The “Entry Level Stewardship” agri-environment scheme began in 2005/2006. Rules for ditch management included leaving half of the ditch banks uncut every year, and not cultivating within 2 m of the ditch centre. Vegetation in and along ditches was surveyed in 2005/2006, 2011 and 2012. Surveys included 52–170 ditches/year managed under agri-environment rules, and 16–17 ditches/year on farms not participating in the scheme.
A study in 2008–2016 in Nigeria (2) reported that paying community groups to use wetlands sustainably changed their behaviour. Fifty-eight community groups provided with access to micro-credits for sustainable development stopped practices that damaged mangrove forests (mainly cutting mangrove trees). They switched to practices less damaging to mangrove forests (such as fish and periwinkle farming) and contributed to wetland restoration. Methods: The payment scheme was implemented within the Bio-Rights framework. The study does not provide further details of the scheme, or quantify the behavioural changes.
(1) FERA (2013) Monitoring the Impacts of Entry Level Stewardship. Natural England Commissioned Report No. 133.
(2) Wetlands International (2016) Conserving and restoring wetlands in Nigeria’s Niger River Delta. Available at https://www.wetlands.org/casestudy/conserving-and-restoring-wetlands-in-nigerias -niger-river-delta/. Accessed 30 June 2020.
14.5 Increase ‘on-the-ground’ protection (e.g. rangers) for marshes
or swamps
We found no studies that evaluated the effects, on vegetation or human behaviour, of increasing ‘on-the-ground’ protection for marshes or swamps.
This means that we have not yet found any studies that have directly evaluated this intervention during our systematic journal and report searches. Therefore we have no evidence to indicate whether or not the intervention has any desirable or harmful effects.

14. Habitat protection
583
Background
This intervention involves using an ‘on-the-ground’ human presence to protect marshes or swamps from immediate threats. This includes rangers or wardens that may patrol sites, ensuring legislation and voluntary agreements are followed (Moore et al. 2018). It also includes creating teams, such as firefighters, to directly manage threats.
Studies that include, or aim to conserve, at least some marsh or swamp habitat are summarized as evidence for this intervention. Given the broad scale of this intervention, results may include other wetland habitats (e.g. peatlands and mudflats), aquatic habitats (e.g. rivers and lakes) or upland habitats (e.g. forests).
Related interventions: Adopt ecotourism principles/create an ecotourism site (7.7).
Moore J.F., Mulindahabi F., Masozera M.K., Nichols J.D., Hines J.E., Turikunkiko E. & Oli M.K. (2018) Are ranger patrols effective in reducing poaching-related threats within protected areas? Journal of Applied Ecology, 55, 99–107.

584
15. Education and awareness-raising
Background
Education and awareness-raising programmes can teach people about the value of marshes and swamps and suitable techniques for their management. The Ramsar Convention, for example, recognizes the importance of Communication, Capacity Building, Education, Participation and Awareness (CEPA) with a dedicated programme (Ramsar Convention Secretariat 2017).
Ideally, this synopsis would include studies that directly measured the effects of such programmes on vegetation. More often, studies measure other intermediate outcomes. We have summarized studies that quantify intermediate behavioural outcomes (e.g. change in management techniques, change in consumer behaviour), under the assumption that they would ultimately translate into an effect on wetland vegetation or habitats. Note that there may be a chain of changed behaviours. For example, lobbying may lead to a change in the behaviour of a National Park Authority (they agree to fine people who illegally burn wetlands), which may lead to a change in the behaviour within wetlands (fewer illegal fires), which may ultimately lead to an impact on wetland vegetation.
For this synopsis we have not summarized studies that quantify outcomes relating to knowledge, awareness or attitudes. The link between these outcomes and effects on wetland habitats is less clear (Christiano & Niemand 2017). For a similar reason, we have not included studies that simply report outputs such as the number of leaflets produced, wetlands surveyed by volunteers, people involved in an education programme, participants in a conference, or people engaging (liking, commenting, viewing) with social media posts.
A conceptual sequence from education/awareness-raising interventions to outcomes. This synopsis includes studies that report any of the bold outcomes, as long as they are clearly related to an intervention.
As throughout the synopsis, we have included studies and outcomes that are substantially related to wetlands, even if they include aquatic or upland habitats. We have not included studies or outcomes principally related to these other habitats (e.g. a study examining the effect of information sheets about the value of a specific lake, or outcomes related to the purchase of peat-free compost) or outcomes that might be more generally beneficial to the environment (e.g. increased use of public transport, or increased recycling rates).
Related chapters: volunteers could be engaged to carry out interventions in many of the other chapters, providing an opportunity for education and awareness-raising.
Christiano, A. & Neimand, A. (2017) Stop raising awareness already. Stanford Social Innovation Review, 15, 34–41.
Ramsar Convention Secretariat (2017) The Ramsar CEPA Programme. Available at http:// www.ramsar.org/activity/the-ramsar-cepa-programme. Accessed 10 October 2017.
Outcome Change in
knowledge/ attitude
Outcome Change in
behaviour 1
Outcome Vegetation/
habitat
Intervention Output Outcome Change in
behaviour 2

15. Education and awareness-raising
585
15.1 Raise public awareness about marshes or swamps
We found no studies that evaluated the effects, on vegetation or human behaviour, of interventions to raise public awareness about marshes or swamps.
This means that we have not yet found any studies that have directly evaluated this intervention during our systematic journal and report searches. Therefore we have no evidence to indicate whether or not the intervention has any desirable or harmful effects.
Background
This intervention involves educating the public about the importance of marshes and swamps, the threats they face and what can be done to protect them (Ramsar Convention on Wetlands 2018). Messages could be conveyed through information boards, talks, art projects, adverts, leaflets, celebrity endorsements, blogs, news articles, social media and videos (e.g. www.youtube.com/watch?v=v3GXlESxaR4). The aim is to change public attitudes and behaviour to benefit marshes and swamps: anything from encouraging people to use less water, to use environmentally-friendly cleaning products, to lobby governments to better protect marshes and swamps, or to take direct action to conserve these habitats. Note that the effects of these specific actions are considered elsewhere in the synopsis.
To be clear, studies would be summarized as evidence for this intervention if the awareness raising is substantially related to marshes and swamps, even if it involves other wetland habitats (e.g. peatlands), aquatic habitats (e.g. rivers and lakes) or upland habitats (e.g. forests).
Related interventions: Engage local people in management/monitoring of marshes or swamps (15.2); Provide education/training programmes about marshes or swamps (15.3); Put up signs to discourage fires (8.22); Put up signs to discourage littering (10.12).
Ramsar Convention on Wetlands (2018) Global Wetland Outlook: State of the World’s Wetlands and their Services to People. Ramsar Convention Secretariat, Gland.
15.2 Engage local people in management/monitoring of marshes or
swamps
Two studies evaluated the effects, on vegetation or human behaviour, of engaging local people in management/monitoring of marshes or swamps. One study was in Senegal1 and one was in India2.
VEGETATION COMMUNITY
Overall extent (1 study): One before-and-after study of a coastal wetland in India2 reported that after implementing a community-based restoration programme, the area of high-quality mangrove forest increased. Meanwhile, the area of degraded mangrove forest decreased.
VEGETATION ABUNDANCE
VEGETATION STRUCTURE
OTHER
Human behaviour (1 study): One before-and-after study of a wetland National Park in Senegal1 reported that after switching from authoritarian protection to community-based management, fewer fines were issued for illegal activities (including illegal settlement and uncontrolled grazing).

15. Education and awareness-raising
586
Background
Local people may be engaged in a range of marsh and swamp conservation projects, from designing management plans, to carrying out practical management and even monitoring as citizen scientists. Local people may be fundamentally integrated into management (“community-based conservation”) or participate occasionally. They may be volunteers or employees. Projects that actively engage local people could increase awareness of marshes and swamps and their value, increase awareness of rules and regulations, change perceptions, and create a sense of ownership (Danielsen et al. 2003; Evely et al. 2011; Mombo et al. 2013). Local knowledge may also enhance the success of conservation actions.
To be clear, studies would be summarized as evidence for this intervention if the management or monitoring is substantially related to marshes and swamps, even if it involves other wetland habitats (e.g. peatlands), aquatic habitats (e.g. rivers and lakes) or upland habitats (e.g. forests). The effects of specific interventions carried out by local people are considered elsewhere in the synopsis (e.g. control of problematic species in Chapter 9 and introduction of emergent vegetation in Chapter 12).
Related interventions: Raise public awareness about marshes or swamps (15.1).
Danielsen F., Mendoza M.M., Alviola P., Balete D.S., Enghoff M., Poulsen M.K. & Jensen A.E. (2003) Biodiversity monitoring in developing countries: what are we trying to achieve? Oryx, 37, 407–409.
Evely A.C., Pinard M., Reed M.S. & Fazey L. (2011) High levels of participation in conservation projects enhance learning. Conservation Letters, 4, 116–126.
Mombo F., Speelman S., Hella J. & Van Huylenbroeck G. (2013) How characteristics of wetlands resource users and associated institutions influence the sustainable management of wetlands in Tanzania. Land Use Policy, 35, 8–15.
A before-and-after study in 1990–1997 of a wetland protected area in Senegal (1) reported that after switching from authoritarian control to community-based management, the number of fines for illegal activity dropped to zero. Over three years under authoritarian control, 44 fines were issued for illegal settlement, uncontrolled livestock, fishing and hunting. Over four years under community-based management, no fines were issued. Methods: The study site, Djoudj National Park, is in the delta of the River Senegal. It contains patches of emergent vegetation such as reedbeds interspersed with lakes, pools, channels and upland areas. Until 1994, the National Park was strictly protected with “authoritarian measures” excluding local people. From 1994, with a deliberate policy shift, the local population became partners in National Park management (including investments and education).
A before-and-after study in 1986–2002 of a coastal wetland in southern India (2) reported that following a community-based restoration programme, the area of mangrove forest increased. Before intervention, the site contained only 325 ha of mangrove forest (all mature) and 375 ha of degraded mangrove. Approximately six years after intervention began, the site contained 618 ha of mangrove forest (411 ha mature; 297 ha developing) and only 65 ha of degraded mangrove. Methods: Large scale restoration of a degraded mangrove forest began in 1996. The local community was involved in identifying the cause of degradation, planning and implementing restoration activities (excavating tidal channels and planting mangrove seedlings) and long-term management of the site (e.g. de-silting tidal channels, protecting young trees from herbivores). The area covered by mangrove vegetation was measured from satellite images, and verified with field surveys, before intervention (1982) and approximately six years after it began (2002).

15. Education and awareness-raising
587
(1) Matar Diouf A. (2002) Djoudj National Park and its periphery: an experiment in wetland co-management. Pages 13–17 in: M. Gawler (ed.) Strategies for Wise Use of Wetlands: Best Practices in Participatory Management. Proceedings of a Workshop held at the 2nd International Conference on Wetlands and Development, November 1998, Dakar, Senegal. Wetlands International, Wageningen; IUCN, Gland; WWF, Gland.
(2) Selvam V., Ravichandran K.K., Gnanappazham L. & Navamuniyammal M. (2003) Assessment of community-based restoration of Pichavaram mangrove wetland using remote sensing data. Current Science, 85, 794–798.
15.3 Provide education/training programmes about marshes or
swamps
Two studies evaluated the effects, on vegetation or human behaviour, of providing education/ training programmes related to marshes or swamps. One study was in Kenya1 and one was in Vietnam2.
VEGETATION COMMUNITY
VEGETATION ABUNDANCE
VEGETATION STRUCTURE
OTHER
Human behaviour (2 studies): One study in Kenya1 reported that after a series of seminars and workshops about marsh conservation, two community-based management groups were established by local stakeholders and a grazing fee was introduced. One before-and-after study in Vietnam2 reported that after local people were trained to make more complex handicrafts from marsh plants (along with helping them to sell those handicrafts in markets), their income increased.
Background
This intervention involves education programmes, training courses or workshops, aimed at people who directly use, manage or influence marshes and swamps (e.g. managers, farmers in the catchment, local people). Education or training may be about these habitats in general (e.g. their wildlife, their value to humans) or about management techniques (including sustainable water use and land use practices). It may aim to increase the income of local people using marshes or swamps, in order to sustain their livelihoods without intensification or expansion of environmentally damaging activities (but consider that higher incomes could also encourage expansion of activities, as in farmed dambos in Malawi/Zambia; Wetlands International 2009). Education or training may be specifically about vegetation, or about broader aspects of marsh or swamp habitats.
To be clear, studies would be summarized as evidence for this intervention if the education or training programmes are substantially related to marshes and swamps, even if they involves other wetland habitats (e.g. peatlands), aquatic habitats (e.g. rivers and lakes) or upland habitats (e.g. forests).
Related interventions: Designate protected area involving marshes or swamps, which may be supported by education or training (14.1); Pay stakeholders to protect marshes or swamps, which may involve education or training (14.4); Raise public awareness about marshes or swamps, other than with formal education or training (15.1).
Wetlands International (2009) Planting Trees to Eat Fish: Field Experiences in Wetlands and Poverty Reduction. Wetlands International, Wageningen, The Netherlands.

15. Education and awareness-raising
588
A study in 2006–2007 in Kenya (1) reported that following a series of seminars and workshops on marsh conservation, two community-based management groups were established and a grazing fee was introduced. The Ondiri Water Resource Users Association aimed to develop an integrated management plan, and controlled water abstraction. The Manugo Ecotourism and Conservation Group aimed to oversee the creation of bylaws to guide sustainable management, and secured funding for conservation activities. A grazing fee was also introduced for the Manugo wetland to control overgrazing, with the proceeds used to fence critical areas and employ a caretaker. Methods: Seminars and workshops were held with communities around the Ondiri and Manugo marshes. Seminars allowed dissemination of information about the state of the marshes. Workshops allowed stakeholders to exchange ideas and experiences, identify key threats, and discuss sustainable management. Participants included community members, researchers, resource managers and government ministers.
A before-and-after study in 2004–2007 in southern Vietnam (2) reported that training locals to make fine handicraft products from marsh plants, along with helping them to sell products in tourist markets, increased their income. Statistical significance was not assessed. Before intervention, the average income of people making products from grey sedge Lepironia articulata was 8,000–10,000 VND/day. Mat-makers earned around 5,000 VND/day. After running the training and marketing scheme for three years, the average income had doubled (data not reported). Mat-makers now earned 30,000 VND/day. Handbag-makers now earned 50,000 VND/day. The study also reported a reduction in human disturbance and encroachment during the scheme, but this was not quantified. Methods: Between 2004 and 2007, the Phu My project aimed to facilitate sustainable use of the Ha Tien marshes by training locals to make fine handicraft products and helping them to sell for higher prices (e.g. in tourist markets). It was hoped that higher quality products (requiring fewer raw materials) and higher incomes (from selling in tourist areas) would reduce harvesting pressure and pressure to convert the marshes to other land uses. The study does not distinguish between the effects of training and marketing. It also does not report further details of the training, marketing or income estimation.
(1) Macharia J.M., Thenya T. & Ndiritu G.G. (2010) Management of highland wetlands in central Kenya: the importance of community education, awareness and eco-tourism in biodiversity conservation. Biodiversity, 11, 85–90.
(2) Triet T. (2010) Combining biodiversity conservation with poverty alleviation – a case study in the Mekong Delta, Vietnam. Aquatic Ecosystem Health & Management, 13, 41–46.
15.4 Produce guidance for marsh or swamp conservation
One study evaluated the effects, on vegetation or human behaviour, of producing guidance for marsh or swamp conservation. The study was in Sri Lanka.
VEGETATION COMMUNITY
VEGETATION ABUNDANCE
VEGETATION STRUCTURE
OTHER

15. Education and awareness-raising
589
Survival (1 study): One study of coastal sites in Sri Lanka1 found that planted mangrove propagules/seedlings had a higher survival rate in sites where published guidance had been consulted to select appropriate areas for planting, than in sites where guidance was not consulted.
Background
Producing guidance, manuals or evidence syntheses to improve the effectiveness of marsh or swamp conservation is, in itself, a conservation intervention! Effectiveness could be considered in terms of changing the behaviour of practitioners (Is the guidance consulted? Do practitioners change their behaviour when presented with guidance?) and, ideally, in terms of impacts on marsh or swamp vegetation (Are projects that use guidance more effective than those that do not?).
Guidance may be based on personal knowledge or experience, or be a more formal synthesis of published evidence (e.g. the synopses produced by Conservation Evidence, systematic reviews or meta-analyses). However, to be considered as evidence for this intervention, the guidance must have been written or used for the conservation of marsh or swamp vegetation.
To be clear, studies would be summarized as evidence for this intervention if the guidance is substantially related to marshes and swamps, even if it involves other wetland habitats (e.g. peatlands), aquatic habitats (e.g. rivers and lakes) or upland habitats (e.g. forests).
A study in 2012–2014 of 23 coastal sites in Sri Lanka (1) found that the average survival rate of planted mangrove propagules/seedlings was higher in sites where technical guidance was used (46%) than in sites where it was not used (0%). Methods: Between 2012 and 2014, the number of surviving, healthy mangrove trees was counted or estimated in 23 coastal sites around Sri Lanka. Mangrove propagules and seedlings (97% of which were Rhizophora spp.) had been planted between 1996 and 2009, with multiple planting attempts in all sites. Six sites used published technical guidance to direct planting towards sites thought to be ecologically, socially and/or politically suitable. The other 17 sites did not refer to technical guidance. Note that all of the sites that used guidance also carried out post-planting care (e.g. removing debris and righting fallen seedlings), whereas 13 of the 17 sites that did not use guidance did not carry out post-planting care.
(1) Kodikara K.A.S., Mukherjee N., Jayatissa L.P., Dahdouh-Guebas F. & Koedam N. (2017) Have mangrove restoration projects worked? An in-depth study in Sri Lanka. Restoration Ecology, 25, 705–716.
15.5 Use marketing strategies to increase the value of marshes or
swamps
One study evaluated the effects, on vegetation or human behaviour, of using marketing strategies to increase the value of marshes or swamps. The study was in Vietnam.
VEGETATION COMMUNITY
VEGETATION ABUNDANCE
VEGETATION STRUCTURE

15. Education and awareness-raising
590
OTHER
Human behaviour (1 study): One before-and-after study in Vietnam1 reported that helping local people to sell handicrafts made from marsh plants in tourist markets (along with training to improve the quality of those products) increased their income.
Background
This intervention includes various specific actions that could increase the value of marshes/swamp or their products through marketing, advertising, branding or certification schemes. For example, in Kenya, certification of Nyando Wetland honey by the Kenya Bureau of Standards added credibility to the brand and increased demand (Raburu et al. 2012). In theory, this intervention could strengthen economic arguments to protect marshes and swamps. Increasing the value of products could also reduce the amount of habitat that must be used to provide a sustainable income, or even encourage creation of new habitat areas. Creating an emblem or brand for a marsh or swamp could directly generate income through licensing (e.g. for use on clothing), and indirectly increase the value of the site for tourism (van der Duim & Henkens 2007; Chellan et al. 2013).
CAUTION: Marketing could also have negative effects on marshes and swamps. For example, if marsh or swamp products become more valuable, there may be greater incentive for people to harvest or exploit these habitats.
To be clear, studies would be summarized as evidence for this intervention if the marketing is substantially related to marshes and swamps, even if it involves other wetland habitats (e.g. peatlands), aquatic habitats (e.g. rivers and lakes) or upland habitats (e.g. forests).
Related interventions: Designate protected area, including areas that allow sustainable use of marshes or swamps (14.1).
Chellan N., Mtshali M. & Khan S. (2013) Rebranding the Greater St Lucia Wetlands Park in South Africa: reflections on benefits and challenges for the former of St Lucia. Journal of Human Ecology, 43, 17–28.
Raburu P.O., Okeyo-Owuour J.B. & Kwena F. (2012) Community Based Approach to the Management of Nyando Wetland, Lake Victoria Basin, Kenya. KDC/VIRED/UNDP Report.
van der Duim R. & Henkens R. (2007) Wetlands, Poverty Reduction and Sustainable Tourism Development: Opportunities and Constraints. Wetlands International, Wageningen, The Netherlands.
A before-and-after study in 2004–2007 in southern Vietnam (1) reported that helping local people to sell handicrafts made from marsh plants in tourist markets, along with training to improve the quality of products, increased income. Statistical significance was not assessed. Before intervention, the average income of people making products from grey sedge Lepironia articulata was 8,000–10,000 VND/day. Mat-makers earned around 5,000 VND/day. After running the marketing and training scheme for three years, the average income had doubled (data not reported). Mat-makers now earned 30,000 VND/day. Handbag-makers now earned 50,000 VND/day. The study also reported a reduction in human disturbance and encroachment during the scheme, but this was not quantified. Methods: Between 2004 and 2007, the Phu My project aimed to facilitate sustainable use of the Ha Tien marshes by helping to locals to sell handicrafts in tourist areas, and training locals to make higher quality goods. It was hoped that higher quality products (requiring fewer raw materials) and higher incomes (from selling in tourist areas) would reduce harvesting pressure and pressure to convert the marshes to other land uses. The study does not distinguish

15. Education and awareness-raising
591
between the effects of marketing and training. It also does not report further details of the marketing, training or income estimation.
(1) Triet T. (2010) Combining biodiversity conservation with poverty alleviation – a case study in the Mekong Delta, Vietnam. Aquatic Ecosystem Health & Management, 13, 41–46.
15.6 Lobby/campaign/demonstrate to protect marshes or swamps
One study evaluated the effects, on vegetation or human behaviour, of lobbying/campaigning/ demonstrating to protect marshes or swamps. The study was in Brazil.
VEGETATION COMMUNITY
VEGETATION ABUNDANCE
VEGETATION STRUCTURE
OTHER
Human behaviour (1 study): One study in Brazil1 reported after lobbying local and national governments, a wetland complex was designated as a sustainable development reserve (rather than being strictly protected) and a sustainable development research institute was created.
Background
Lobbying or peaceful demonstrations could put pressure on projects that threaten marshes or swamps, preventing them from occurring or minimizing their impact. Specific actions include demonstrating on site, writing letters and social media campaigns.
To be summarized as evidence for this intervention, studies must involve campaigns targeted at organizations such as businesses or governments. Studies must provide some detail about what the lobbying, campaigning or demonstrating involved in practice. For example, Wetlands International (2014) report that their “advocacy influence” has led to the alteration or abandonment of several projects that could have impacted marshes or swamps (e.g. delay and redesign of the Fomi Dam, Upper Niger River, and consideration of marsh ecosystems in Shell’s oil and gas operations in Iraq). We have not summarized these examples as evidence because there is little detail about the methods used in their advocacy.
To be clear, studies would be summarized as evidence for this intervention if the lobbying is substantially related to marshes and swamps, even if it involves other wetland habitats (e.g. peatlands), aquatic habitats (e.g. rivers and lakes) or upland habitats (e.g. forests).
Related interventions: Raise public awareness about marshes or swamps (15.1).
Wetlands International (2014) Our Achievements 2011–2013. Available at https://www.wetlands.org/ download/5101/. Accessed 9 February 2020.
A study in 2008 of a wetland complex in northwest Brazil (1) reported that following lobbying of national and local governments in the 1990s, the area was designated as a sustainable development reserve (in 1996) and a new research institute for sustainable development was created (in 1999). The sustainable

15. Education and awareness-raising
592
development reserve designation, which allowed sustainable use of resources by local and indigenous people, was a relaxation of former strict protection. Methods: The Mamirauá wetlands are a complex of seasonally flooded forest, rivers and lakes. In the early 1990s, they were strictly protected but were faced with pressure from commercial loggers and hunters. From 1992, a conservation group lobbied the Brazilian Government to allow sustainable use of the wetlands by local people. This lobbying was backed by biological and socioeconomic studies, and supported by national and international media campaigns. The conservation group leader also personally lobbied the State Governor, with arguments about political benefits of allowing sustainable use.
(1) Sellamuttu S.S., de Silva S., Khoa S.N. & Samarakoon J. (2008) Good Practices and Lessons Learned in Integrating Ecosystem Conservation and Poverty Reduction Objectives in Wetlands. International Water Management Institute, Colombo & Wetlands International, Wageningen.
15.7 Classify conservation status of individual sites
We found no studies that evaluated the effects, on vegetation or human behaviour, of classifying the conservation status of individual marshes or swamps.
This means that we have not yet found any studies that have directly evaluated this intervention during our systematic journal and report searches. Therefore we have no evidence to indicate whether or not the intervention has any desirable or harmful effects.
Background
Classifying the conservation status of individual marshes or swamps, or the level of threat that they face, may help to prioritize sites in need of the most urgent intervention – or avoid wasting resources on sites that are unlikely to be saved by intervention. Lists of the most threatened or degraded sites may also help in arguments to secure funding for conservation. The Montreux Record, for example, is a register of internationally important wetlands where changes in ecological character have occurred, are occurring, or are likely to occur (Ramsar Convention Secretariat 2013).
To be clear, studies would be summarized as evidence for this intervention if the classification is substantially related to marshes and swamps, even if it involves other wetland habitats (e.g. peatlands), aquatic habitats (e.g. rivers and lakes) or upland habitats (e.g. forests).
Related interventions: Designate protected area involving marshes or swamps (14.1); Provide general protection for marshes or swamps (14.2).
Ramsar Convention Secretariat (2013) The Ramsar Convention Manual: A Guide to the Convention on Wetlands (Ramsar, Iran, 1971), 6th Edition. Ramsar Convention Secretariat, Gland.

593
Appendix 1: Glossary
Glossary of terms as used in the Marsh and Swamp Conservation synopsis. Note that alternative definitions exist in the wider literature for many of these terms.
Abundance: any measurement of the amount of plant material within vegetation stands, including cover, biomass, volume, frequency, plant density and stem/shoot density. Unless specified, refers to all standing vegetation (live and dead).
Alginate: a starchy, carbon rich substance present in some brown seaweeds. Sometimes added to wetland soils to help with restoration (e.g. Section 12.18).
Aquatic: (a) an area covered by water that is too deep to support emergent vegetation. If any vegetation is present, it is submerged below the water surface or floats on the water surface. Includes rivers, lakes and lagoons; (b) a submerged or floating plant.
Biomass: the total mass of all the organisms of a given type and/or in a given area5. Plant biomass is usually dried before weighing. In this synopsis, only results relating to above-ground plant biomass are reported. Results clearly based on, or including, below-ground biomass are not included.
Conservatism score: a score based on a plant species’ fidelity to habitats that are more, or less, degraded by human disturbances1. The score ranges between 0 and 10, and are unique to a defined region. High values are assigned to native species that are exclusive to undegraded, relictual, native habitats in the region. These species tend to be more sensitive to anthropogenic disturbances. Scores are defined by regional botanical experts. Synonym used in scientific literature: coefficient of conservatism.
Conservation: discipline concerned with protecting, maintaining, restoring, rehabilitating, creating, managing and sustainably using natural and semi-natural resources.
Control: (a) noun: plot/site not treated with intervention. (b) verb: any action to manage a population of a problematic species – eradication, suppression, or containment.
Cover: the proportion of ground that is occupied by the aerial parts of plants, or the perpendicular projection of them on to the ground6,11. May be measured for each species individually, with the sum of individual species’ cover potentially exceeding 100%. Or may be measured for vegetation overall, so maximum cover is 100%. So, note that overall cover values are not necessarily comparable across studies.
Creation: establishing a habitat type where it does not currently, or did not recently, occur2. For example, the conversion of a non-wetland area (i.e. persistent upland or aquatic habitat) into a wetland, or conversion of one persistent wetland type into another wetland type (e.g. converting a persistent salt marsh into a mangrove forest).
Degraded: a habitat that is reduced in quality relative to the target (often natural) state – but that is still recognizable as, or retains substantial characteristics of, the target habitat.
Dune slack: low-lying area amongst the ridges of sand dunes. Dune slacks are wetter than the surrounding dunes, so often harbour pockets of wetland vegetation.
Emergent plants: plants that usually grow in water or saturated soils, rooted in the soil but with their upper stems and leaves emerging above water (if/when the ground is

594
flooded). May exist in drier or wetter conditions in some locations or at some times. Does not include plants with leaves that float on the water surface, such as water lilies Nymphaea spp.
Ephemeral wetlands: areas with saturated or flooded soils during part of the year, but which also experience significant periods when the soil is not saturated or flooded2–4. There may be a clear seasonal pattern (e.g. saturated/flooded at the start of each growing season, but dry by the end) or not (e.g. alternating saturated/flooded and dry conditions throughout each growing season). Also includes habitats saturated or flooded in occassional years – but flooded often enough to influence the type of vegetation present. Compare permanent wetlands.
Floristic quality index: an index of the quality of the plant community in a certain area, where high quality communities contain lots of species that are exclusive to undegraded, relictual, native habitats1. Calculated as average (mean) conservatism score of all plant species in the community × square root of number of species in the community.
Genus (pl. genera): a category used in the classification of organisms, consisting of a number of similar or closely related species5. For example, the genus Equus contains horses (e.g. Equus ferus), zebras (e.g. Equus quagga) and donkeys (e.g. Equus africanus).
Harvest: cut or pull up plant material and remove it from site.
Herb: a seed-bearing plant that has no, or little, permanent woody tissue6. Above-ground tissue usually dies back at the end of each growing season. For the purposes of this synopsis, herbs are considered in their broadest possible sense: including grass-like plants (graminoids), forbs (non-graminoid herbs), succulents (fleshy plants) and some vines.
Invasive species: established non-native species that have negative impacts on the environment and/or humans, usually at considerable distance from the original site of introduction7. In this synopsis, native species with negative impacts are referred to as “problematic native species”.
Marsh: any wetland dominated by herbaceous or non-woody vegetation, and with mineral soils (rather than peat)2,8. Marshes that are never or only occasionally flooded, and so may support plant communities characteristic of slightly drier conditions, are also known as wet meadows or wet prairies.
Native species: species that have evolved in a given area or that arrived there by natural means from an area where they are native, without the intentional or accidental intervention of humans9. Compare non-native species.
Non-native species: species whose presence in a region is attributable to human actions that enabled them to overcome fundamental biogeographical barriers (e.g. mountain ranges or oceans)9. Synonyms in the literature: alien, exotic, non-indigenous. Compare native species and invasive species.
Open water: water without vegetation at or above the surface; may cover submerged vegetation or bare rock/sediment.
Permanent wetlands: areas with saturated or flooded soils for all or most of the growing season, in all or most years3,4. Includes some wetlands described as semi-permanent in the literature. Compare ephemeral wetlands.

595
ppt: parts per thousand. A unit for measuring salinity. The average salinity of seawater is 35 ppt, meaning that there are 35 g of salt in every 1,000 mL. In this synopsis, freshwater habitats have a salinity of <0.5 ppt, brackish habitats 0.5–15 ppt, and saline habitats >15 ppt.
Propagule: any cellular structure produced by an organism that is capable of dispersing and surviving in the environment before developing into a new individual6. For example, seeds and spores. The propagules of many mangrove trees are small, mature plants (unlike seeds which are embryonic plants enclosed in a protective outer coating).
Restoration: returning a habitat from a disturbed or altered condition towards a previously existing condition2. In this sense restoration may, but almost always does not, return the vegetation exactly to that previous condition. This may be impossible due to changes in the physical habitat.
Rhizome: a horizontal underground stem5. It enables the plant to survive from one growing season to the next and in some species it also serves to propagate the plant vegetatively. It may be thin and wiry or fleshy and swollen.
Shrub: a perennial woody plant which branches below or near ground level into several main stems6.
Species: a category used in the classification of organisms. According to the biological species concept, a species is a group of individuals that can usually breed among themselves and produce fertile offspring5. For example, all humans belong to the species Homo sapiens.
Stolon: a long aerial side stem that gives rise to a new daughter plant when the bud at its apex touches the soil5. Plants that multiply in this way include strawberries Fragaria spp. and grasses like creeping bentgrass Agrostis stolonifera.
Swamp: wetland dominated by trees or shrubs2,8.
Taxon (pl. taxa): a group of organisms at any level in the hierarchical classification of organisms5. For example, the species Homo sapiens is a taxon, as is the genus Homo, and the class Mammalia.
Tree: a perennial plant with an elongated woody trunk, supporting branches and leaves.
Wetland: area transitional between terrestrial and aquatic systems, with shallow water or flooded soils for a substantial part of the growing season (or longer)2,10. Any vegetation present is adapted to this wet environment, and soil properties reflect the presence of water. Note that many alternative wetland definitions exist, for example under the Ramsar Convention.
Wetland plants: plant species that can live in wetlands. Where possible, corresponds to the OBL–FACU categories of the USA National Wetland Plant List12. In some studies, corresponds to OBL–FAC categories. For studies in countries other than the USA, similar verbal classifications are acceptable, e.g. “wetland plants” or “hydrophytes”13.
Wetland-characteristic plants: plant species that always or usually grow in wetlands. Where possible, corresponds to the OBL–FACW categories of the USA National Wetland Plant List12. For studies in countries other than the USA, similar verbal classifications are acceptable.

596
References
(1) Spyreas G. (2019) Floristic Quality Assessment: a critique, a defense, a primer. Ecosphere, 10, e02825.
(2) Mitsch W.J. & Gosselink J.G. (2015) Wetlands, Fifth Edition. Wiley, New Jersey. (3) Ramsar Convention Secretariat (2016) An Introduction to the Convention on Wetlands. Ramsar
Convention Secretariat, Gland. (4) IUCN (2020) Habitats Classification Scheme (Version 3.1). Available at https://
www.iucnredlist.org/resources/habitat-classification-scheme. Accessed 24 August 2020. (5) Daintith J. & Martin E.A. (eds.) (2010) A Dictionary of Science, Sixth Edition. Oxford University
Press, Oxford. (6) Allaby M. (ed.) (1998) A Dictionary of Plant Sciences. Oxford University Press, Oxford, UK. (7) ISSG (2020) About Invasive Species. Available at http://www.issg.org/is_what_are_they.htm.
Accessed 24 August 2020. (8) Keddy PA. (2010) Wetland Ecology Principles and Conservation, Second Edition. Cambridge
University Press, Cambridge. (9) Richardson D.M., Pyšek P. & Carlton JT. (2010) A compendium of essential concepts and
terminology in invasion ecology. Pages 409–420 in: D.M. Richardson (ed.) Fifty Years of Invasion Ecology. Wiley-Blackwell, Oxford.
(10) Cowardin L.M., Carter V., Golet F.C. & Laroe E.T. (1979) Classification of Wetlands and Deepwater Habitats of the United States. US Department of the Interior, Fish and Wildlife Service Report FWS/OBS-79/31.
(11) Wilson J.B. (2011) Cover plus: ways of measuring plant canopies and the terms used for them. Journal of Vegetation Science, 22, 197–206.
(12) Lichvar R.W., Banks D.L., Kirchner W.N. & Melvin N.C. (2016) The National Wetland Plant List: 2016 wetland ratings. Phytoneuron, 30, 1–17.
(13) Tiner R.W. (1991) The concept of a hydrophyte for wetland identification. BioScience, 41, 236–247.

597
Appendix 2: Overview of reviewed literature
Publications included in synopsis from all systematic searches:
431
Publications included in synopsis from all sources:
473
CE English-language database
Journals scanned: 240 Papers scanned: ca. 590,000 Papers in synopsis: 205
CE non-English database
Journals scanned: 94 Papers scanned: ca. 230,000 Papers in synopsis: 10
Publications included in synopsis from existing databases:
217
CE additional literature database
Sources scanned: 8 Documents scanned: ca. 3,500 Documents in synopsis: 2
Additional wetland journals (English)
Journals scanned: 14 Papers scanned: ca. 20,000 Papers in synopsis: 207
Additional literature sources
Sources scanned: 6 Documents scanned: ca. 900 Documents in synopsis: 7
Identified by Advisory Board
Documents suggested: 80 Documents in synopsis: 34
Additional searches on CE website
Documents in synopsis: 8

598
Appendix 3: List of searched literature
This appendix lists journals and other literature sources searched by the Conservation Evidence project for evidence relevant to the Marsh and Swamp Conservation synopsis. All issues and documents within the given years have been screened. Where possible, general searches carried out by Conservation Evidence were extended to check for studies relevant to the current synopsis. The synopsis includes some references from sources not listed in this appendix, e.g. papers recommended by the Advisory Board.
English-language journals
254 journals for which the primary language is English (i.e. for ≥80% of papers, an English full text is available).
○ indicates journals most likely to be relevant to the Marsh and Swamp Conservation synopsis (e.g. with a focus on wetlands, vegetation or general ecology/conservation)
● indicates journals that contributed studies to the Marsh and Swamp Conservation synopsis
Journals in italics are those that were searched specifically for the Marsh and Swamp Conservation synopsis (i.e. particularly relevant journals that had not already been screened by Conservation Evidence)
Journal Name Dates Searched
Acrocephalus 2009–2017
Acta Chiropterologica 1999–2017
Acta Herpetologica 2006–2017
○ Acta Oecologica 1990–2017
○ African Journal of Ecology 1963–2017
African Journal of Herpetology (formerly The Journal of the Herpetological Association of Africa) 1990–2017
○ African Journal of Marine Science (formerly South African Journal of Marine Science) 1983–2017
African Journal of Wildlife Research (formerly South African Journal of Wildlife Research) 1971–2017
African Zoology (formerly South African Journal of Zoology) 1979–2017
● Agriculture, Ecosystems & Environment 1983–2017
○ Agroforestry Systems 1982–2017
● Ambio 1972–2017
○ American Naturalist 1867–2017
Amphibian & Reptile Conservation 1996–2017
Amphibia-Reptilia 1980–2017
Animal Biology 2003–2017
Animal Conservation 1998–2017
Animal Nutrition 2015–2017
Animal Welfare 1992–2017
Animals 2011–2017
Annales Zoologici Fennici 1964–2017
Annales Zoologici Societatis Zoologicae Botanicae Fennicae Vanamo 1932–1963

599
○ Annual Review of Ecology, Evolution and Systematics (formerly Annual Review of Ecology and Systematics)
1970–2017
○ Antarctic Science 1989–2017
Anthrozoos 1987–2017
Apidologie (formerly Annales de l'Abeille) 1958–2017
Applied Animal Behaviour Science 1984–2017
● Applied Vegetation Science 1998–2017
Aquarium Sciences and Conservation 1997–2001
● Aquatic Conservation: Marine and Freshwater Ecosystems 1991–2017
○ Aquatic Ecology (formerly Hydrobiologische Vereniging: Mededelingen van de Hydrobiologische Vereniging; Hydrological Bulletin; Netherland Journal of Aquatic Ecology)
1968–2017
● Aquatic Ecosystem Health & Management 1998–2017
○ Aquatic Invasions 2006–2017
○ Aquatic Living Resources 1988–2017
Aquatic Mammals 1972–2017
Ardeola 1954–2017
● Arid Land Research and Management (formerly Arid Soil Research and Rehabilitation) 1987–2017
Asian Herpetological Research 2010–2017
○ Asian Journal of Conservation Biology 2012–2017
Asiatic Herpetological Research 1993–2008
○ Austral Ecology (formerly Australian Journal of Ecology) 1976–2017
Australian Mammalogy 2000–2017
○ Basic and Applied Ecology 2000–2017
Basic and Applied Herpetology 2011–2017
Behavioral Ecology 1990–2017
Behaviour 1948–2017
Biawak 2007–2017
Bibliotheca Herpetologica (formerly International Society for the History and Bibliography of Herpetology Newsletter and Bulletin)
1999–2017
○ BioControl (formerly Entomophaga) 1956–2017
○ Biocontrol Science and Technology 1991–2017
● Biodiversity 2000–2017
● Biodiversity and Conservation (formerly Biodiversity & Conservation) 1992–2017
● Biological Conservation 1981–2017
○ Biological Control 1991–2017
● Biological Invasions 1999–2017
○ Biology and Environment: Proceedings of the Royal Irish Academy 1993–2017
○ Biology Letters 2005–2017
○ Biotropica 1990–2017
○ Boreal Environment Research 1996–2017
Bulletin of the Chicago Herpetological Society 1990–2017
Bulletin of the Maryland Herpetological Society 1980–2015
○ Canadian Field-Naturalist (formerly Ottawa Naturalist) 1887–2017
○ Canadian Journal of Fisheries and Aquatic Sciences (formerly Journal of the Biological Board of Canada; Journal of the Fisheries Research Board of Canada)
1934–2017
○ Canadian Journal of Forest Research 1971–2017
Caribbean Herpetology 2010–2017
○ Caribbean Journal of Science 1961–2016
CCAMLR Science 1994–2016

600
Chelonian Conservation and Biology 2006–2017
Chelonian Research Monographs 1996–2017
○ Coastal Engineering 2000–2017
Collinsorum 2012–2017
○ Community Ecology 2000–2017
● Conservation Biology 1987–2017
● Conservation Evidence 2004–2017
○ Conservation Genetics 2000–2017
○ Conservation Letters 2008–2017
○ Contributions to Canadian Biology and Fisheries 1901–1933
Copeia 1913–2017
○ Cunninghamia 1981–2017
Current Herpetology (formerly Acta Herpetologica Japonica; Japanese Journal of Herpetology) 1964–2017
Dodo 1977–2001
● Ecological Applications 1991–2017
Ecological Entomology 1985–2017
● Ecological Management & Restoration 2000–2017
● Ecological Restoration (formerly Restoration & Management Notes; Ecological Restoration, North America)
1981–2017
● Ecology 1936–2017
○ Ecology Letters 1998–2017
● Écoscience 1994–2017
● Ecosystems 1998–2017
Endangered Species Research 2004–2017
Entomologia Experimentalis et Applicata 2015–2017
● Environmental Conservation 1974–2017
Environmental Entomology 1990–2017
○ Environmental Evidence 2012–2017
● Environmental Management 1977–2017
○ Ethology Ecology & Evolution 1989–2017
European Journal of Wildlife Research (formerly Zeitschrift für Jagdwissenschaft) 1955–2017
○ Evolutionary Ecology 1987–2017
○ Evolutionary Ecology Research 1999–2017
● Fire Ecology 2005–2017
Fish and Fisheries 2000–2017
Fisheries 2015–2017
Fisheries Management and Ecology 1994–2017
Fisheries Oceanography 1992–2017
Fisheries Research 1990–2017
Folia Zoologica 1959–2013
● Forest Ecology and Management 1976–2017
○ Freshwater Biology 1971–2017
○ Freshwater Science (formerly Freshwater Invertebrate Biology; Journal of the North American Benthological Society)
1982–2017
○ Frontiers in Marine Science 2014–2017
○ Functional Ecology 1987–2017
Genetics and Molecular Research 2002–2017
○ Global Change Biology 1995–2017

601
○ Global Ecology and Biogeography (formerly Global Ecology and Biogeography Letters) 1991–2017
○ Global Ecology and Conservation 2014–2017
○ Grass and Forage Science 1980–2017
Herpetologica 1936–2017
Herpetological Conservation and Biology 2006–2017
Herpetological Monographs 1982–2017
Herpetological Review 1967–2017
Herpetology Notes 2008–2017
Herpetozoa 1988–2017
Human-Wildlife Interactions (formerly Human-Wildlife Conflicts) 2007–2017
● Hydrobiologia 1995–2017
Hystrix, the Italian Journal of Mammalogy 1986–2017
○ ICES Journal of Marine Science 1990–2017
○ iForest 2008–2017
Insect Conservation and Diversity 2008–2017
Integrative Zoology 2006–2017
○ International Journal of the Commons 2007–2017
○ International Journal of Wildland Fire 1991–2017
International Zoo Yearbook 1960–2017
● Invasive Plant Science and Management 2008–2017
○ Israel Journal of Ecology & Evolution (formerly Israel Journal of Zoology) 1963–2017
● Journal for Nature Conservation 2002–2017
Journal of Animal Ecology 1932–2017
Journal of Apicultural Research 1962–2017
Journal of Applied Animal Nutrition 2012–2017
Journal of Applied Animal Welfare Science 1998–2017
● Journal of Applied Ecology 1964–2017
● Journal of Aquatic Plant Management (formerly Hyacinth Control Journal) 1991–2017
Journal of Arid Environments 1993–2017
○ Journal of Asia-Pacific Biodiversity (formerly Journal of Korean Nature) 2008–2017
Journal of Cetacean Research and Management 1999–2017
● Journal of Coastal Research 2015–2017
● Journal of Ecology 1933–2017
○ Journal of Ecology & Natural Resources 2017
● Journal of Environmental Management 1973–2017
○ Journal of Forest Research 1996–2017
○ Journal of Great Lakes Research 1975–2017
Journal of Herpetological Medicine and Surgery 2009–2017
● Journal of Herpetology 1968–2017
Journal of Insect Conservation 1997–2017
Journal of Insect Science 2001–2017
Journal of Kansas Herpetology 2002–2011
Journal of Mammalian Evolution 1993–2017
○ Journal of Mountain Science 2004–2017
○ Journal of Negative Results: Ecology and Evolutionary Biology 2004–2017
Journal of North American Herpetology 2014–2017
Journal of Ornithology 2004–2017
○ Journal of Sea Research (formerly Netherlands Journal of Sea Research) 1961–2017

602
○ Journal of the Marine Biological Association of the United Kingdom 1887–2017
○ Journal of Tropical Ecology 1985–2017
● Journal of Vegetation Science 1990–2017
○ Journal of Wetlands Ecology 2008–2012
○ Journal of Wetlands Environmental Management 2013–2017
Journal of Wildlife Diseases 1965–2017
● Journal of Wildlife Management 1937–2017
Journal of Zoo and Wildlife Medicine (formerly Journal of Zoo Animal Medicine) 1970–2017
Journal of Zoology 1966–2017
○ Knowledge & Management of Aquatic Ecosystems (formerly Bulletin Français de la Pêche et de la Pisciculture)
1986–2017
○ Lake and Reservoir Management 1984–2017
○ Land Degradation & Development 1989–2017
Latin American Journal of Aquatic Mammals 2002–2017
● Limnologica 1999–2017
Mammal Research (formerly Acta Theriologica) 1977–2017
Mammal Study 2005–2017
Mammalia 1936–2017
Mammalian Biology 2002–2017
Mammalian Genome 1991–2017
○ Management of Biological Invasions 2010–2017
● Mangroves and Saltmarshes 1996–1999
● Marine and Freshwater Research (formerly Australian Journal of Marine and Freshwater Research) 1980–2017
○ Marine Ecology 1980–2017
○ Marine Environmental Research 1978–2017
Marine Mammal Science 1985–2017
● Marine Pollution Bulletin 2010–2017
Marine Turtle Newsletter 1976–2017
● Marsh Bulletin 2006–2016
Mesoamerican Herpetology 2014–2017
● Mires and Peat 2006–2017
● Natural Areas Journal 1992–2017
○ Nature Conservation 2012–2017
○ NeoBiota 2011–2017
Neotropical Entomology 2001–2017
○ New Journal of Botany 2011–2017
○ New Zealand Journal of Marine and Freshwater Research 1967–2017
New Zealand Journal of Zoology 1974–2017
○ New Zealand Plant Protection 2000–2017
● Northwest Science 2007–2017
○ Oecologia 1968–2017
○ Oikos 1949–2017
○ Oryx 1950–2017
● Pacific Conservation Biology 1993–2017
Pakistan Journal of Zoology 2004–2017
○ PANS (formerly PANS Pest Articles & News Summaries) 1969–1979
● Plant Ecology (formerly Vegetatio) 1948–2017
● Plant Protection Quarterly 2008–2016

603
○ Polish Journal of Ecology 2002–2017
○ Population Ecology (formerly Researches on Population Ecology) 1952–2017
○ Preslia 1973–2017
Primates 1957–2017
● Rangeland Ecology & Management (formerly Journal of Range Management) 1948–2017
Raptors Conservation 2005–2016
● Regional Studies in Marine Science 2015–2017
● Restoration Ecology 1993–2017
○ Riparian Ecology and Conservation 2013–2017
● River Research and Applications (formerly Regulated Rivers: Research & Management) 1987–2017
○ Russian Journal of Ecology 1993–2017
Russian Journal of Herpetology 1994–2017
Salamandra 2000–2017
Small Ruminant Research 1988–2017
Solvak Raptor Journal 2007–2017
● South African Journal of Botany 1982–2017
South American Journal of Herpetology 2006–2017
● Southern Forests 2008–2017
Testudo 1978–2017
○ The Environmentalist 1981–1988
The European Zoological Journal (formerly Bollettino de Zoologia; Italian Journal of Zoology) 1978–2017
The Open Ornithology Journal 2008–2017
○ The Rangeland Journal (formerly The Australian Rangeland Journal) 1976–2017
○ The Southwestern Naturalist 1976–2017
○ Trends in Ecology and Evolution 1986–2017
○ Tropical Conservation Science 2008–2017
○ Tropical Ecology 1960–2017
○ Tropical Grasslands 1967–2010
Tropical Zoology 1988–2017
Turkish Journal of Zoology 1996–2017
Ursus (formerly Proceedings of the First Bear Workshop, Whitehorse, Yukon; Bears: Their Biology and Management)
1968–2017
○ Weed Research 1961–2017
○ West African Journal of Applied Ecology 2000–2017
● Western North American Naturalist 2000–2017
● Wetlands 1981–2017
● Wetlands Ecology and Management 1989–2017
● Wildfowl 1948–2017
Wildlife Biology 1995–2017
Wildlife Monographs 1958–2017
Wildlife Research (formerly CSIRO Wildlife Research; Australian Wildlife Research) 1956–2017
● Wildlife Society Bulletin 1973–2017
Zoo Biology 1982–2017
Zookeys 2008–2017
Zoologica Scripta 1971–2017
Zoological Journal of the Linnean Society 1856–2017
Zootaxa 2004–2017

604
Non-English journals
94 journals which include a substantial proportion of non-English articles (i.e. for >20% of papers, the full text is only available in a language other than English; papers may or may not be accompanied by an English abstract).
○ indicates journals most likely to be relevant to the Marsh and Swamp Conservation synopsis (e.g. with a focus on wetlans, vegetation or general ecology/conservation)
● indicates journals that contributed studies to the Marsh and Swamp Conservation synopsis
* indicates journals that changed their name after the given year and began publishing predominantly in English. If these new journals were searched, they are included in the list of English-language journals above.
Language Journal Name (Original Language) Journal Name (English Translation) Dates Searched
● Chinese 生态学报 Acta Ecologica Sinica 1981–2017
○ Chinese 水生生物学报 Acta Hydrobiologica Sinica 1997–2017
Chinese 兽类学报 Acta Theriologica Sinica 1981–2017
Chinese 动物学报 Acta Zoologica Sinica 1935–2008*
○ Chinese 海洋科学进展 Advances in Marine Science 1983–2017
○ Chinese 生物多样性 Biodiversity Science 1993–2017
○ Chinese 中国环境科学 China Environmental Science 1981–2017
○ Chinese 植物学报 Chinese Bulletin of Botany 2006–2017
Chinese 生命科学 Chinese Bulletin of Life Science 1988–2017
○ Chinese 应用与环境生物学报 Chinese Journal of Applied and Environmental Biology
1995–2017
○ Chinese 应用生态学报 Chinese Journal of Applied Ecology 1990–2017
○ Chinese 中国生态农业学报 Chinese Journal of Eco-Agriculture 1993–2017
○ Chinese 生态学杂志 Chinese Journal of Ecology 1982–2017
Chinese 中国草地学报
Chinese Journal of Grassland (formerly Grassland of China)
1976–2017
○ Chinese 植物生态学报 Chinese Journal of Plant Ecology (formerly Acta Phytoecologica Sinica)
1963–2017
Chinese 野生动物学报 Chinese Journal of Wildlife 1979–2016
● Chinese 生态科学 Ecological Science 1982–2017
○ Chinese 生态环境学报 Ecology and Environment 1992–2017
○ Chinese 环境科学 Environmental Science 1976–2017
○ Chinese 农业环境科学学报 Journal of Agro-Environment Science 1981–2017
Chinese 中国农业大学学报 Journal of China Agricultural University 1955–2017
○ Chinese 生态与农村环境学报 Journal of Ecology and Rural Environment
1985–2017
Chinese 水产学报 Journal of Fisheries of China 1965–2017
○ Chinese 自然资源学报 Journal of Natural Resources 1986–2017
○ Chinese 植物资源与环境学报 Journal of Plant Resources and Environment
2006–2017
○ Chinese 热带亚热带植物学报 Journal of Tropical and Subtropical Botany
1992–2017
Chinese 生命科学研究 Life Science Research 1997–2017

605
○ Chinese 海洋科学 Marine Sciences 1977–2017
○ Chinese 植物保护 Plant Protection 1963–2017
○ Chinese 资源科学 Resources Science 1977–2017
Chinese 四川动物 Sichuan Journal of Zoology 1996–2017
○ Chinese 城市环境与城市生态 Urban Environment & Urban Ecology 1988–2016
Chinese 动物学研究 Zoological Research 1980–2017
Chinese 动物分类学报 Zoological Systematics 1964–2017
● French Revue d'Écologie (Terre et Vie) Ecology Review (Earth and Life) 2006–2017
○ French Ecologia Mediterranea Mediterranean Ecology 2000–2017
○ French Bois et Forêts des Tropiques Tropical Woodlands and Forests 2009–2017
○ German ABU-Info – 2006–2017
German Nyctalus – 2005–2017
○ German Pulsatilla – 2000–2016
○ German Tuexenia – 1981–2017
German Arachnologische Mitteilungen Arachnological Communications 1991–2017
German Vogelwarte Bird Observations 2005–2017
○ German ANLiegen Natur Concerning Nature 2006–2017
● German Naturschutz und Landschaftsplanung Conservation and Landscape Planning 2003–2017
German Zeitschrift für Feldherpetologie Journal of Field Herpetology 1994–2017
German Journal für Ornithologie Journal of Ornithology 1959–2003*
German Ornithologischer Anzeiger Ornithological Journal 1951–2017
Japanese 爬虫両棲類学会報
Bulletin of the Herpetological Society of Japan
1999–2008
● Japanese 保全生態学研究 Japanese Journal of Conservation Ecology
1996–2017
● Japanese 日本生態学会誌 Japanese Journal of Ecology 1954–2017
Japanese 日本鳥学会誌 Japanese Journal of Ornithology 1917–2017
○ Japanese 景観生態学 Landscape Ecology and Management 2005–2017
Japanese 哺乳類科学 Mammalian Science 1961–2017
○ Persian Environmental Research 2010–2017
Persian Experimental Animal Biology 2012–2017
○ Persian Iranian Journal of Applied Ecology 2012–2017
○ Persian Iranian Journal of Natural Resources 2002–2009
Persian Journal of Animal Environment 2014–2017
Persian Journal of Animal Research 2013–2017
○ Persian Journal of Environmental Sciences 2004–2017
○ Persian Journal of Environmental Studies 1975–2017
○ Persian Journal of Natural Environment 2010–2017
Portuguese Megadiversidade – 2005–2009
Portuguese MG Biota – 2008–2017
○ Portuguese Neotropical Biology and Conservation – 2006–2017
○ Portuguese Revista Bioikos Bioikos Journal 1987–2016
○ Portuguese Biodiversidade Brasileira Brazilian Biodiversity 2011–2016
○ Portuguese Natureza & Conservação Brazilian Journal for Nature Conservation
2003–2016*
○ Portuguese Revista Brasileira de Ecologia Brazilian Journal of Ecology 1997–2015
○ Portuguese Revista Brasileira de Gestão Ambiental e Sustentabilidade
Brazilian Journal of Environmental Management and Sustainability
2014–2017

606
○ Portuguese Revista CEPSUL - Biodiversidade e Conservação Marinha
CEPSUL Journal - Marine Biodiversity and Conservation
2010–2017
○ Portuguese Evolução e Conservação da Biodiversidade
Evolution and Conservation of Biodiversity
2010–2011
○ Portuguese Floresta Forest 1969–2017
● Portuguese Biota Neotropica Neotropical Biota 2001–2017
Russian Известия РАН, серия биологическая Biology Bulletin 1957–2017
○ Russian Бюллетень МОИП, серия биологическая
Bulletin of Moscow Society of Naturalists, Biological Series
1935–2016
○ Russian Сибирский экологический журнал Contemporary Problems of Ecology 1994–2017
Russian Журнал Общей Биологии Journal of General Biology 1972–2017
○ Russian Поволжский экологический журнал Povolzhsky Journal of Ecology 2002–2017
Spanish Galemys – 2007–2017
Spanish Journal of Bat Research & Conservation (formerly Barbastella)
– 2000–2017
Spanish Therya – 2010–2017
○ Spanish Ecología Aplicada Applied Ecology 2002–2017
○ Spanish Revista Chilena de Historia Natural Chilean Journal of Natural History 1897–2017
○ Spanish Ecosistemas Ecosystems 2001–2017
○ Spanish Gestión Ambiental Environmental Management 1999–2017
● Spanish Revista de Biología Tropical Journal of Tropical Biology 1976–2017
○ Spanish Revista Mexicana de Biodiversidad Mexican Journal of Biodiversity 2005–2017
○ Spanish Revista Mexicana de Ciencias Forestales
Mexican Journal of Forest Science 2010–2017
Spanish Mastozoología Neotropical Neotropical Mammology 1994–2017
Spanish Ornitología Neotropical Neotropical Ornithology 1990–2017
Spanish Revista Peruana de Biología Peruvian Journal of Biology 1974–2017
● Spanish Madera y Bosques Wood and Forests 1995–2017

607
Additional literature sources
A list of all documents screened, including individual URLs, has been archived and is available on request. As far as possible, documents in any language were screened.
○ indicates sources most likely to be relevant to the Marsh and Swamp Conservation synopsis (e.g. with a focus on wetlans, vegetation or general ecology/conservation)
● indicates sources that contributed studies to the Marsh and Swamp Conservation synopsis
Sources in italics are those that were searched specifically for the Marsh and Swamp Conservation synopsis (i.e. particularly relevant sources that had not already been screened by Conservation Evidence)
Organization Documents URL Dates Searched
British Trust for Ornithology Research Reports
https://www.bto.org/our-science/ publications/research-reports
1981–2017
○ Centre for Evidence Based Conservation
CEE Reviews http://www.cebc.bangor.ac.uk/CEElibrary.php
2004–2016
● International Society for Mangrove Ecosystems
Occasional Papers http://www.mangrove.or.jp/english/subp
age/publications.html
1993–2013
○ Technical Reports
1993–2014
○
International Union for Conservation of Nature: Freshwater Plant Specialist Group
Reports https://www.iucn.org/commissions/ssc-groups/plants-fungi/plants/plants-a-g/freshwater-plant
2016–2017
○
International Union for Conservation of Nature: Invasive Species Specialist Group
Aliens Bulletin
http://www.issg.org/publications.htm 1995–2013
○ Joint Nature Conservation Committee Reports https://jncc.gov.uk/ 1991–2017
Kansas Herpetological Society Newsletter http://ksherp.com/khs-newsletter/ 1974–2001
○ MedWet Publications https://medwet.org/publications/ 1994–2017
● Natural England/English Nature Publications http://publications.naturalengland.org.uk/ 1991–2017
○ Ramsar Documents https://www.ramsar.org/search 1998–2017
○ Scottish Natural Heritage Reports https://www.nature.scot/information-hub/information-library?f%5B0%5D =document_type%3A191
1980–2017
South Asian Reptile Network Reptile Rap Newsletter
N/A 1999–2016
● Wetlands International Publications, Case Studies
https://www.wetlands.org/resources/ 1980–2017

608
Appendix 4: Complete reference list
This appendix lists all references summarized as evidence within the Marsh and Swamp Conservation synopsis. It does not include references used only in background sections.
Abella S.R., Schetter T.A. & Walters T.L. (2017) Restoring and conserving rare native ecosystems: a 14-year
plantation removal experiment. Biological Conservation, 212, 265–273.
Abernethy R.K. & Gosselink J.G. (1988) Environmental conditions of a backfilled pipeline canal four years after construction. Wetlands, 8, 109–121.
Abo El-Nil M.M. (2001) Growth and establishment of mangrove (Avicennia marina) on the coastlines of Kuwait. Wetlands Ecology and Management, 9, 421–428.
Adams M.J., Pearl C.A., McCreary B., Galvan S.K., Wessell S.J., Wente W.H., Anderson C.W. & Kuehl A.B. (2009) Short-term effect of cattle exclosures on Columbia spotted frog (Rana luteiventris) populations and habitat in northeastern Oregon. Journal of Herpetology, 43, 132–138.
Affandi N.A.M., Kamali B., Rozianah M.Z., Mohd Tamin N. & Hashim R. (2010) Early growth and survival of Avicennia alba seedlings under excessive sedimentation. Scientific Research and Essays, 5, 2801–2805.
Akers P. & Alcorn R.I. (2006) Re-colonization of wetland plants following scrub removal at the Open Pits, Dungeness RSPB reserve, Kent, England. Conservation Evidence, 3, 92–93.
Al-Abbawy D.A.H. & Al-Mayah (2010) Ecological survey of aquatic macrophytes in restored marshes of southern Iraq during 2006 and 2007. Marsh Bulletin, 5, 177–196.
Allen J.C., Krieger S.M., Walters J.R. & Collazo J.A. (2006) Associations of breeding birds with fire-influenced and riparian-upland gradients in a longleaf pine ecosystem. The Auk, 123, 1110–1128.
Allen S.L., Hepp G.R. & Miller J.H. (2007) Use of herbicides to control alligatorweed and restore native plants in managed marshes. Wetlands, 27, 739–748.
Allen-Diaz, B. & Jackson, R.D. (2000) Grazing effects on spring ecosystem vegetation of California's hardwood rangelands. Journal of Range Management, 53, 215–220.
Alphin T.D. & Posey M.H. (2000) Long-term trends in vegetation dominance and infaunal community composition in created marshes. Wetlands Ecology and Management, 8, 317–325.
Anastasiou C.J. & Brooks J.R. (2003) Effects of soil pH, redox potential, and elevation on survival of Spartina patens planted at a West Central Florida salt marsh restoration site. Wetlands, 23, 845–859.
Anderson C.J. & Cowell B.C. (2004) Mulching effects on the seasonally flooded zone of west-central Florida, USA wetlands. Wetlands, 24, 811–819.
Anderson H.M., Gale M.R., Jurgensen M.F. & Trettin C.C. (2007) Vascular and non-vascular plant community response to silvicultural practices and resultant microtopography creation in a forested wetland. Wetlands, 27, 68–79.
Andresen H., Bakker J.P., Brongers M., Heydemann B. & Irmler U. (1990) Long-term changes of salt marsh communities by cattle grazing. Vegetatio, 89, 137–148.
Anon (2010) Sustainable Coastal Livelihood: Integrated Mangrove Fishery Farming System (IMFFS). Final Report (October 2008 to December 2009).
Arihafa A. (2016) Factors influencing community mangrove planting success on Manus Island, Papua New Guinea. Conservation Evidence, 13, 42–46.
Armitage A.R., Boyer K.E., Vance R.R. & Ambrose R.F. (2006) Restoring assemblages of salt marsh halophytes in the presence of a rapidly colonizing dominant species. Wetlands, 26, 667–676.
Aronson M.F.J. & Galatowitsch S. (2008) Long-term vegetation development of restored prairie pothole wetlands. Wetlands, 28, 883–895.
Asaeda T., Rajapakse L., Manatunge J. & Sahara N. (2006) The effect of summer harvesting of Phragmites australis on growth characteristics and rhizome resource storage. Hydrobiologia, 553, 327–335.
Aschehoug E.T., Sivakoff F.S., Cayton H.L., Morris W.F. & Haddad N.M. (2015) Habitat restoration affects immature stages of a wetland butterfly through indirect effects on predation. Ecology, 96, 1761–1767.
Ashworth S.M. (1997) Comparison between restored and reference sedge meadow wetlands in south-central Wisconsin. Wetlands, 17, 518–527.
Aust W.M., Schoenholtz S.H., Zaebst T.W. & Szabo B.A. (1997) Recovery status of a tupelo-cypress wetland seven years after disturbance: silvicultural implications. Forest Ecology and Management, 90, 161–169.

609
Austin J.E., Keough J.R. & Pyle W.H. (2007) Effects of habitat management treatments on plant community composition and biomass in a montane wetland. Wetlands, 27, 570–587.
Back C.L., Holomuzki J.R., Klarer D.M. & Whyte R.S. (2012) Herbiciding invasive reed: indirect effects on habitat conditions and snail-algal assemblages one year post-application. Wetlands Ecology and Management, 20, 419–431.
Badley J. & Allcorn R.I. (2006) Changes in bird use following the managed realignment at Freiston Shore RSPB Reserve, Lincolnshire, England. Conservation Evidence, 3, 102–105.
Bahm M.A., Barnes T.G. & Jensen K.C. (2014) Evaluation of herbicides for control of reed canarygrass (Phalaris arundinacea). Natural Areas Journal, 34, 459–464.
Baigorría Montero D., Rodríguez Crespo G., Domínguez Junco D. & Milián Cabrera I. (2008) Nueva experiencia en la restauración de manglares, Playa las Canas, La Coloma (New experience in mangrove restoration, Playa las Canas, La Coloma). Revista Forestal Baracoa, 27, 3–12.
Bailey D.E., Perry J.E. & Daniels W.L. (2007) Vegetation dynamics in response to organic matter loading rates in a created freshwater wetland in southeastern Virginia. Wetlands, 27, 936–950.
Bakker J.P. & de Vries Y. (1992) Germination and early establishment of lower salt-marsh species in grazed and mown salt marsh. Journal of Vegetation Science, 3, 247–252.
Bakker J.P., Esselink P., Dijkema K.S., van Duin W.E. & de Jong D.J. (2002) Restoration of salt marshes in the Netherlands. Hydrobiologia, 478, 29–51.
Balas C.J., Euliss N.H. Jr. & Mushet D.M. (2012) Influence of conservation programs on amphibians using seasonal wetlands in the prairie pothole region. Wetlands, 2012, 333–345.
Balcombe C.K., Anderson J.T., Fortney R.H. & Kordek W.S. (2005) Wildlife use of mitigation and reference wetlands in West Virginia. Ecological Engineering, 25, 85–99.
Balcombe C.K., Anderson J.T., Fortney R.H., Rentch J.S., Grafton W.N. & Kordek W.S. (2005) A comparison of plant communities in mitigation and reference wetlands in the mid-Appalachians. Wetlands, 25, 130–142.
Bantilan-Smith M., Bruland G.L., MacKenzie R.A., Henry A.R. & Ryder C.R. (2009) A comparison of the vegetation and soils of natural, restored and created coastal lowland wetlands in Hawai’i. Wetlands, 29, 1023–1035.
Barrett N.E. & Niering W.A. (1993) Tidal marsh restoration: trends in vegetation change using a geographical information system (GIS). Restoration Ecology, 1, 18–28.
Baschuk M.S., Ervin M.D., Clark W.R., Armstrong L.M., Wrubelski D.A. & Goldsborough G.L. (2012) Using satellite imagery to assess macrophyte response to water-level manipulations in the Saskatchewan River Delta, Manitoba. Wetlands, 32, 1091–1102.
Bashan Y., Moreno M., Salazar B.G. & Alvarez L. (2013) Restoration and recovery of hurricane-damaged mangroves using the knickpoint retreat effect and tides as dredging tools. Journal of Environmental Management, 116, 196–203.
Bassett P.A. (1980) Some effects of grazing on vegetation dynamics in the Camargue, France. Vegetatio, 43, 173–184.
Baustian J.J. & Turner R.E. (2006) Restoration success of backfilling canals in coastal Louisiana marshes. Restoration Ecology, 14, 636–644.
Baustian J.J., Turner R.E., Walters N.F. & Muth D.P. (2009) Restoration of dredged canals in wetlands: a comparison of methods. Wetlands Ecology and Management, 17, 445–453.
Bayraktarov E., Saunders M.I., Abdullah S., Mills M., Beher J., Possingham H.P., Mumby P.J. & Lovelock C.E. (2016) The cost and feasibility of marine coastal restoration. Ecological Applications, 26, 1055–1074.
Beas B.J. & Smith L.M. (2014) Amphibian community responses to playa restoration in the Rainwater Basin. Wetlands, 34, 1247–1253.
Beas B.J., Smith L.M., LaGrange T.G. & Stutheit R. (2013) Effects of sediment removal on vegetation communities in Rainwater Basin playa wetlands. Journal of Environmental Management, 128, 371–379.
Begam M.M, Sutradhar T., Chowdhury R., Mukherjee C., Basak S.K. & Ray K. (2017) Native salt-tolerant grass species for habitat restoration, their acclimation and contribution to improving edaphic conditions: a study from a degraded mangrove in the Indian Sundarbans. Hydrobiologia, 803, 373–387.
Benner C.S., Knutson P.L., Brochu R.A. & Hurme A.K. (1982) Vegetative erosion control in an oligohaline environment Currituck Sound, North Carolina. Wetlands, 2, 105–117.
Berg M., Joyce C. & Burnside N. (2012) Differential responses of abandoned wet grassland plant communities to reinstated cutting management. Hydrobiologia, 692, 83–97.

610
Bergen A., Alderson C., Bergfors R., Aquila C. & Matsil M.A. (2000) Restoration of a Spartina alterniflora salt marsh following a fuel oil spill, New York City, NY. Wetlands Ecology and Management, 8, 185–195.
Berney P.J., Wilson G.G., Ryder D.S., Whalley R.D.B., Duggin J. & McCosker R. (2014) Divergent responses to long-term grazing exclusion among three plant communities in a flood pulsing wetland in eastern Australia. Pacific Conservation Biology, 20, 237–251.
Best E.P.H. (1994) The impact of mechanical harvesting regimes on the aquatic and shore vegetation in water courses of agricultural areas of the Netherlands. Vegetatio, 112, 57–71.
Bhat N.R., Suleiman M.K. & Shahid S.A. (2004) Mangrove, Avicennia marina, establishment and growth under the arid climate of Kuwait. Arid Land Research and Management, 18, 127–139.
Bohnen J.L. & Galatowitsch S.M. (2005) Spring Peeper Meadow: revegetation practices in a seasonal wetland restoration in Minnesota. Ecological Restoration, 23, 172–181.
Bóhorquez C.A. & Prada M.C. (1988) Transplante de plántulas de Rhizophora mangle (Rhizophoraceae) en el Parque Nacional Corales del Rosario, Colombia (Transplantation of Rhizophora mangle (Rhizophoraceae) seedlings in the Corales del Rosario National Park, Colombia). Revista de Biología Tropical, 36, 555–557.
Booth V. & Ausden M. (2009) The invertebrate population of a created reedbed after seven years: Lakenheath Fen RSPB reserve, Suffolk, England. Conservation Evidence, 6, 105–110.
Bosire J.O., Dahdouh-Guebas F., Kairo J.G. & Koedam N. (2003) Colonization of non-planted mangrove species into restored mangrove stands in Gazi Bay, Kenya. Aquatic Botany, 76, 267–279.
Bouahim S., Rhazi L., Amami B., Sahib N., Rhazi M., Waterkeyn A., Zouahri A., Mesleard F., Muller S.D. & Grillas P. (2010) Impact of grazing on the species richness of plant communities in Mediterranean temporary pools (western Morocco). Comptes Rendus Biologies, 333, 670–679.
Boughton E.H., Quintana-Ascencio P.F., Bohlen P.J., Fauth J.E. & Jenkins D.G. (2016) Interactive effects of pasture management intensity, release from grazing and prescribed fire on forty subtropical wetland plant assemblages. Journal of Applied Ecology, 53, 159–170.
Bouzillé J.-B., Kernéis E., Bonis A. & Touzard B. (2001) Vegetation and ecological gradients in abandoned salt pans in western France. Journal of Vegetation Science, 12, 269–278.
Boyer K.E. & Burdick A.P. (2010) Control of Lepidium latifolium (perennial pepperweed) and recovery of native plants in tidal marshes of the San Francisco Estuary. Wetlands Ecology and Management, 18, 731–743.
Brockmeyer R.E. Jr., Rey J.R., Virnstein R.W., Gilmore R.G. & Earnest L. (1996) Rehabilitation of impounded estuarine wetlands by hydrological reconnection to the Indian River Lagoon, Florida (USA). Wetlands Ecology and Management, 4, 93–109.
Broome S.W., Seneca E.D. & Woodhouse W.W. Jr. (1982) Establishing brackish marshes on graded upland sites in North Carolina. Wetlands, 2, 152–178.
Brown S.C. & Bedford B.L. (1997) Restoration of wetland vegetation with transplanted wetland soil: an experimental study. Wetlands, 17, 424–437.
Brown S.C. & Veneman P.L.M. (2001) Effectiveness of compensatory wetland mitigation in Massachusetts, USA. Wetlands, 21, 508–518.
Bruland G.L. & Richardson C.J. (2005) Hydrologic, edaphic, and vegetative responses to microtopographic reestablishment in a restored wetland. Restoration Ecology, 13, 515–523.
Budelsky R.A. & Galatowitsch S.M. (2000) Effects of water regime and competition on the establishment of a native sedge in restored wetlands. Journal of Applied Ecology, 37, 971–985.
Burdick D.M., Dionne M., Boumans R.M. & Short F.T. (1996) Ecological responses to tidal restorations of two northern New England salt marshes. Wetlands Ecology and Management, 4, 129–144.
Burton E.C., Gray M.J., Schmutzer A.C. & Miller D.L. (2009) Differential responses of postmetamorphic amphibians to cattle grazing in wetlands. Journal of Wildlife Management, 73, 269–277.
Buschbaum R.N., Catena J., Hutchins E. & James-Pirri M.-J. (2006) Changes in salt marsh vegetation, Phragmites australis, and nekton in response to increased tidal flushing in a New England salt marsh. Wetlands, 26, 544–557.
Buttler A. (1992) Permanent plot research in wet meadows and cutting experiment. Vegetatio, 103, 113–124.
Cain J.L. & Cohen R.A. (2014) Using sediment alginate amendment as a tool in the restoration of Spartina alterniflora marsh. Wetlands Ecology and Management, 22, 439–449.
Callaway J.C., Sullivan G. & Zedler J.B. (2003) Species-rich plantings increase biomass and nitrogen accumulation in a wetland restoration experiment. Ecological Applications, 13, 1626–1639.

611
Campbell D.A., Cole C.A. & Brooks R.P. (2002) A comparison of created and natural wetlands in Pennsylvania, USA. Wetlands Ecology and Management, 10, 41–49.
Carpenter K., Sasser C.E., Visser J.M. & DeLaune R.D. (2007) Sediment input into a floating freshwater marsh: effects on soil properties, buoyancy and plant biomass. Wetlands, 27, 1016–1024.
Castillo J.M. & Figueroa E. (2009) Restoring salt marshes using small cordgrass, Spartina maritima. Restoration Ecology, 17, 324–326.
Chang E.R., Veeneklaas R.M., Bakker J.P., Daniels P. & Esselink P. (2016) What factors determined restoration success of a salt marsh ten years after de-embankment? Applied Vegetation Science, 19, 66–77.
Chapman M.G. & Roberts D.E. (2004) Use of seagrass wrack in restoring disturbed Australian saltmarshes. Ecological Management & Restoration, 5, 183–190.
Chong V.C. (2006) Sustainable utilization and management of mangrove ecosystems in Malaysia. Aquatic Ecosystem Health & Management, 9, 249–260.
Chow-Fraser P. (2005) Ecosystem response to changes in water level of Lake Ontario marshes: lessons from the restoration of Cootes Paradise Marsh. Hydrobiologia, 539, 189–204.
Chow-Fraser P. & Lukasik L. (1995) Cootes Paradise Marsh: community participation in the restoration of a Great Lakes coastal wetland. Restoration & Management Notes, 13, 183–189.
Clare S. & Creed I.F. (2014) Tracking wetland loss to improve evidence-based wetland policy learning and decision making. Wetlands Ecology and Management, 22, 235–245.
Clark D.L. & Wilson M.V. (2001) Fire, mowing, and hand-removal of woody species in restoring a native wetland prairie in the Willamette Valley of Oregon. Wetlands, 21, 135–144.
Clevering O.A. & van Gulik W.M.G. (1997) Restoration of Scirpus lacustris and Scirpus maritimus stands in a former tidal area. Aquatic Botany, 55, 229–246.
Clewell A.F. (1981) Vegetational restoration techniques on reclaimed phosphate strip mines in Florida. Wetlands, 1, 158–170.
Cohen R.A. & Kern H. (2012) Alginate addition influences smooth cordgrass (Spartina alterniflora) growth and macroinvertebrate densities. Wetlands, 32, 51–58.
Cohen R.A., Walker K. & Carpenter E.J. (2009) Polysaccharide addition effects on rhizosphere nitrogen fixation rates of the California cordgrass, Spartina foliosa. Wetlands, 29, 1063–1069.
Collinge S.K. & Ray C. (2009) Transient patterns in the assembly of vernal pool plant communities. Ecology, 90, 3313–3323.
Collinge S.K., Ray C. & Gerhardt F. (2011) Long-term dynamics of biotic and abiotic resistance to exotic species invasion in restored vernal pool plant communities. Ecological Applications, 21, 2105–2118.
Combroux I.C.S., Bornette G. & Amoros C. (2002) Plant regenerative strategies after a major disturbance: the case of a riverine wetland restoration. Wetlands, 22, 234–246.
Comín F.A., Romero J.A., Hernández O. & Menéndez M. (2001) Restoration of wetlands from abandoned rice fields for nutrient removal, and biological community and landscape diversity. Restoration Ecology, 9, 201–208.
Confer S.R. & Niering W.A. (1992) Comparison of created and natural freshwater emergent wetlands in Connecticut (USA). Wetlands Ecology and Management, 2, 143–156.
Conner W.H. & Flynn K. (1989) Growth and survival of baldcypress (Taxodium distichum [L.] Rich.) planted across a flooding gradient in a Louisiana bottomland forest. Wetlands, 9, 207–217.
Coops H., Vulink J.T. & van Nes E.H. (2004) Managed water levels and the expansion of emergent vegetation along a lakeshore. Limnologica, 34, 57–64.
Cowie N.R., Sutherland W.J., Ditlhogo M.K.M. & James R. (1992) The effects of conservation management of reed beds. II. The flora and litter disappearance. Journal of Applied Ecology, 29, 277–284.
Crona B.I., Holmgren S. & Rönnbäck P. (2006) Re-establishment of epibiotic communities in reforested mangroves of Gazi Bay, Kenya. Wetlands Ecology and Management, 14, 527–538.
Currin C.A., Delano P.C. & Valdes-Weaver L.M. (2008) Utilization of a citizen monitoring protocol to assess the structure and function of natural and stabilized fringing salt marshes in North Carolina. Wetlands Ecology and Management, 16, 97–118.
Dagley J.R. (1995) Northey Island: Managed Retreat Scheme; Results of Botanical Monitoring 1991–1994. English Nature Research Report 128.
Dalrymple G.H., Doren R.F., O'Hare N.K., Norland M.R. & Armentano T.V. (2003) Plant colonization after complete and partial removal of disturbed soils for wetland restoration of former agricultural fields in Everglades National Park. Wetlands, 23, 1015–1029.

612
Darnell T.M. & Smith E.H. (2001) Recommended design for more accurate duplication of natural conditions in salt marsh creation. Environmental Management, 29, 813–823.
Das P., Basak U.C. & Das A.B. (1997) Restoration of the mangrove vegetation in the Mahanadi Delta, Orissa, India. Mangroves and Salt Marshes, 1, 155–161.
Day S., Streever W.J. & Watts J.J. (1999) An experimental assessment of slag as a substrate for mangrove rehabilitation. Restoration Ecology, 7, 139–144.
de Jong N.H. (2000) Woody plant restoration and natural regeneration in wet meadow at Coomonderry Swamp on the south coast of New South Wales. Marine and Freshwater Research, 51, 81–89.
De Martis G., Mulas B., Malavasi V. & Marignani M. (2016) Can artificial ecosystems enhance local biodiversity? The case of a constructed wetland in a Mediterranean urban context. Environmental Management, 57, 1088–1097.
De Steven D. & Gramling J.M. (2012) Diverse characteristics of wetlands restored under the Wetlands Reserve Program in the southeastern United States. Wetlands, 32, 593–604.
De Steven D. & Sharitz R.R. (2007) Transplanting native dominant plants to facilitate community development in restored coastal plain wetlands. Wetlands, 27, 972–978.
De Steven D., Sharitz R.R. & Barton C.D. (2010) Ecological outcomes and evaluation of success in passively restored Southeastern depressional wetlands. Wetlands, 30, 1129–1140.
De Steven D., Sharitz R.R., Singer J.H. & Barton C.D (2006) Testing a passive revegetation approach for restoring coastal plain depression wetlands. Restoration Ecology, 14, 452–460.
De Szalay F.A. & Resh V.H. (1997) Responses of wetland invertebrates and plants important in waterfowl diets to burning and mowing of emergent vegetation. Wetlands, 17, 149–156.
DeBerry D.A. & Perry J.E. (2012) Vegetation dynamics across a chronosequence of created wetland sites in Virginia, USA. Wetlands Ecology and Management, 20, 521–537.
Decleer K. (1990) Experimental cutting of reedmarsh vegetation and its influence on the spider (Araneae) fauna in the Blankaart Nature Reserve, Belgium. Biological Conservation, 52, 161–185.
Dee S.M. & Ahn C. (2012) Soil properties predict plant community development of mitigation wetlands created in the Virginia Piedmont, USA. Environmental Management, 49, 1022–1036.
Delaney T.P., Webb J.W. & Minello T.J. (2000) Comparison of physical characteristics between created and natural estuarine marshes in Galveston Bay, Texas. Wetlands Ecology and Management, 8, 343–352.
DeLaune R.D., Pezeshki S.R., Pardue J.H., Whitcomb J.H. & Patrick W.H. Jr. (1990) Some influences of sediment addition to a deteriorating salt marsh in the Mississippi River deltaic plain: a pilot study. Journal of Coastal Research, 6, 181–188.
Desrochers D.W., Keagy J.C. & Cristol D.A. (2008) Created versus natural wetlands: avian communities in Virginia salt marshes. Écoscience, 15, 36–43.
Di Bella C.E., Jacobo E., Golluscio R.A. & Rodríguez A.M. (2014) Effect of cattle grazing on soil salinity and vegetation composition along an elevation gradient in a temperate coastal salt marsh of Samborombón Bay (Argentina). Wetlands Ecology and Management, 22, 1–13.
Doherty J.M., Callaway J.C. & Zedler J.B. (2011) Diversity-function relationships changed in a long- term restoration experiment. Ecological Applications, 21, 2143–2155.
Doherty J.M. & Zedler J.B. (2015) Increasing substrate heterogeneity as a bet-hedging strategy for restoring wetland vegetation. Restoration Ecology, 23, 15–25.
Donnelly M., Shaffer M., Connor S., Sacks P. & Walters L. (2017) Using mangroves to stabilize coastal historic sites: deployment success versus natural recruitment. Hydrobiologia, 803, 389–401.
Dreschel T.W., Cline E.A. & Hill S.D. (2017) Everglades tree island restoration: testing a simple tree planting technique patterned after a natural process. Restoration Ecology, 25, 696–704.
Dugger B.D. & Feddersen J.C. (2009) Using river flow management to improve wetland habitat quality for waterfowl on the Mississippi River, USA. Wildfowl, 59, 62–74.
Dumortier M., Verlinden A., Beeckman H. & van der Mijnsbrugger K. (1996) Effects of harvesting dates and frequencies on above and below-ground dynamics in Belgian wet grasslands. Écoscience, 3, 190–198.
Duncan C., Primavera J.H., Pettorelli N., Thompson J.R., Loma R.J.A. & Koldewey H.J. (2016) Rehabilitating mangrove ecosystem services: a case study on the relative benefits of abandoned pond reversion from Panay Island, Philippines. Marine Pollution Bulletin, 109, 772–782.
Earhart H.G. & Garbisch E.W. Jr. (1983) Habitat development utilizing dredged material at Barren Island Dorchester County, Maryland. Wetlands, 3, 108–119.
Edwards K.R. & Proffitt C.E. (2003) Comparison of wetland structural characteristics between created and natural salt marshes in southwest Louisiana, USA. Wetlands, 23, 344–356.

613
Egerova J., Proffitt C.E. & Travis S.E. (2003) Facilitation of survival and growth of Baccharis halimifolia L. by Spartina alterniflora Loisel. in a created Louisiana salt marsh. Wetlands, 23, 250–256.
Ehl K.M., Raciti S.M. & Williams J.D. (2017) Recovery of salt marsh vegetation after removal of storm-deposited anthropogenic debris: lessons from volunteer clean-up efforts in Long Beach, NY. Marine Pollution Bulletin, 117, 436–447.
Elliott S. (2015) Coastal realignment at RSPB Nigg Bay Nature Reserve. RSPB Research Report.
Elphick C.S., Meiman S. & Rubega M.A. (2015) Tidal-flow restoration provides little nesting habitat for a globally vulnerable saltmarsh bird. Restoration Ecology, 23, 439–446.
Elster C. (2000) Reasons for reforestation success and failure with three mangrove species in Columbia. Forest Ecology and Management, 131, 201–214.
Emond C., Lapointe L., Hugron S. & Rochefort L. (2016) Reintroduction of salt marsh vegetation and phosphorus fertilisation improve plant colonisation on seawater-contaminated cutover bogs. Mires and Peat, 18, Article 17
Engeman R.M., Stevens A., Allen J., Dunlap J., Daniel M., Teague D. & Constantin B. (2007) Feral swine management for conservation of an imperiled wetland habitat: Florida's vanishing seepage slopes. Biological Conservation, 134, 440–446.
Ervin G.N. & Wetzel R.G. (2002) Effects of sodium hypochlorite sterilization and dry cold storage on germination of Juncus effusus L. Wetlands, 22, 191–195.
Erwin K.L. & Best G.R. (1985) Marsh community development in a Central Florida phosphate surface-mined reclaimed wetland. Wetlands, 5, 155–166.
Esselink P., Frescok L.F.M. & Dijkema K.S. (2002) Vegetation change in a man-made salt marsh affected by a reduction in both grazing and drainage. Applied Vegetation Science, 5, 17–32.
Farmer J.W. & Pezeshki S.R. (2004) Effects of periodic flooding and root pruning on Quercus nuttallii seedlings. Wetlands Ecology and Management, 12, 205–214.
Farnsworth E.J. & Meyerson L.A. (1999) Species composition and inter-annual dynamics of a freshwater tidal plant community following removal of the invasive grass, Phragmites australis. Biological Invasions, 1, 115–127.
Feagin R.A. & Wu X.B. (2006) Spatial pattern and edge characteristics in restored terrace versus reference salt marshes in Galveston Bay. Wetlands, 26, 1004–1011.
Feldman S.R. & Lewis J.P. (2005) Effects of fire on the structure and diversity of a Spartina argentinensis tall grassland. Applied Vegetation Science, 8, 77–84.
Feldman S.R. & Lewis J.P. (2007) Demographic responses to fire of Spartina argentinensis in temporary flooded grassland of Argentina. Wetlands, 27, 785–793.
Félisiak D., Duborper E. & Yavercovski N. (2004) An example of management by removal of vegetation: Lac des Aurèdes (Var, France). Page 84 in: P. Grillas, P. Gauthier, N. Yavercovski & C. Perennou (eds.) Mediterranean Temporary Pools Volume 1 – Issues Relating to Conservation, Functioning and Management. Station Biologique de la Tour du Valat, Arles.
Fennessy M.S., Rokosch A. & Mack J.J. (2008) Patterns of plant decomposition and nutrient cycling in natural and created wetlands. Wetlands, 28, 300–310.
FERA (2013) Monitoring the Impacts of Entry Level Stewardship. Natural England Commissioned Report No. 133.
Fickas K.C., Cohen W.B. & Yang Z. (2016) Landsat-based monitoring of annual wetland change in the Willamette Valley of Oregon, USA from 1972 to 2012. Wetlands Ecology and Management, 24, 73–92.
Fitzsimmons O.N., Ballard B.M., Merendino M.T., Baldassarre G.A. & Hartke K.M. (2012) Implications of coastal wetland management to nonbreeding waterbirds in Texas. Wetlands, 32, 1057–1066.
Fleming K.S., Kaminski R.M., Tietjen T.E., Schummer M.L., Ervin G.N. & Nelms K.D. (2012) Vegetative forage quality and moist-soil management on Wetlands Reserve Program lands in Mississippi. Wetlands, 32, 919–929.
Flitcroft R.L., Bottom D.L., Haberman K.L., Bierly K.F., Jones K.K., Simenstad C.A., Gray A., Ellingson K., Baumgartner E., Cornwell T.J. & Campbell L.A. (2016) Expect the unexpected: place-based protections can lead to unforeseen benefits. Aquatic Conservation: Marine and Freshwater Ecosystems, 26(S1), 39–59.
Flores-Verdugo F., Zebadua-Penagos F. & Flores-de-Santiago F. (2015) Assessing the influence of artificially constructed channels in the growth of afforested black mangrove (Avicennia germinans) within an arid coastal region. Journal of Environmental Management, 160, 113–120.
Flynn K.M., Mendelssohn I.A. & Wilsey B.J. (1999) The effect of water level management on the soils and vegetation of two coastal Louisiana marshes. Wetlands Ecology and Management, 7, 193–218.

614
Fogli S., Brancaleoni L., Lambertini C. & Gerdol R. (2014) Mowing regime has different effects on reed stands in relation to habitat. Journal of Environmental Management, 134, 56–62.
Forbes M.G., Alexander H.D. & Dunton K.H. (2008) Effects of pulsed riverine versus non-pulsed wastewater inputs of freshwater on plant community structure in a semi-arid salt marsh. Wetlands, 28, 984–994.
Ford M.A., Cahoon D.R. & Lynch J.C. (1999) Restoring marsh elevation in a rapidly subsiding salt marsh by thin-layer deposition of dredged material. Ecological Engineering, 12, 189–205.
Ford M.A. & Grace J.B. (1998) The interactive effects of fire and herbivory on a coastal marsh in Louisiana. Wetlands, 18, 1–8.
Fraser A. & Kindscher K. (2001) Tree spade transplanting of Spartina pectinata (Link) and Eleocharis macrostachya (Britt.) in a prairie wetland restoration site. Aquatic Botany, 71, 297–304.
Fraser A. & Kindscher K. (2005) Spatial distribution of Spartina pectinata transplants to restore wet prairie. Restoration Ecology, 13, 144–151.
Friess D.A. (2017) Mangrove rehabilitation along urban coastlines: a Singapore case study. Regional Studies in Marine Science, 16, 279–289.
Fuller D.A., Sasser C.E., Johnson W.B. & Gosselink J.G. (1985) The effects of herbivory on vegetation on islands in Atchafalaya Bay, Louisiana. Wetlands, 4, 105–114.
Fuselier L.C., Donarski D., Novacek J., Rastedt D. & Peyton C. (2012) Composition and biomass productivity of bryophyte assemblages in natural and restored marshes in the prairie pothole region of Northern Minnesota. Wetlands, 32, 1067–1078.
Gabor T.S., Haagsma T. & Murkin H.R. (1996) Wetland plant responses to varying degrees of purple loosestrife removal in southeastern Ontario, Canada. Wetlands, 16, 95–98.
Gabrey S.W., Afton A.D. & Wilson B.C. (1999) Effects of winter burning and structural marsh management on vegetation and winter bird abundance in the Gulf Coast Chenier Plain, USA. Wetlands, 19, 594–603.
Gabrey S.W., Afton A.D. & Wilson B.C. (2001) Effects of structural marsh management and winter burning on plant and bird communities during summer in the Gulf Coast Chenier Plain. Wildlife Society Bulletin, 29, 218–231.
Galatowitsch S.M. & van der Valk A.G. (1995) Natural revegetation during restoration of wetlands in the southern prairie pothole region of North America. Pages 129–142 in B.D. Wheeler, S.C. Shaw, W.J. Fojt & R.A. Robertson (eds.) Restoration of Temperate Wetlands. John Wiley and Sons Ltd., Chichester.
Galatowitsch S.M. & van der Valk A.G. (1996) Characteristics of recently restored wetlands in the prairie pothole region. Wetlands, 16, 75–83.
Galatowitsch S.M. & van der Valk A.G. (1996) The vegetation of restored and natural prairie wetlands. Ecological Applications, 6, 102–112.
Galatowitsch S.M. & van der Valk A.G. (1996) Vegetation and environmental conditions in recently restored wetlands in the prairie pothole region of the USA. Vegetatio, 126, 89–99.
Galbraith-Kent S.L. & Handel S.N. (2007) Lessons from an urban lakeshore restoration project in New York City. Ecological Restoration, 25, 123–128.
Garbutt A. & Wolters M. (2008) The natural regeneration of salt marsh on formerly reclaimed land. Applied Vegetation Science, 11, 335–344.
Gibson K.D., Zedler J.B. & Langis R. (1994) Limited response of cordgrass (Spartina foliosa) to soil amendments in a constructed marsh. Ecological Applications, 4, 757–767.
Gilbert T., King T., Hord L. & Allen J.N. Jr. (1980) An assessment of wetlands establishment techniques at a Florida phosphate mine site. Proceedings of the Annual Conference on Restoration and Creation of Wetlands 7, Tampa, Florida, 245–263.
Gorman T.A., Haas C.A. & Himes J.G. (2013) Evaluating methods to restore amphibian habitat in fire-suppressed pine flatwoods wetlands. Fire Ecology, 9, 96–109.
Green E.K. & Galatowitsch S.M. (2002) Effects of Phalaris arundinacea and nitrate-N addition on wetland plant community establishment. Journal of Applied Ecology, 39, 134–144.
Green J., Reichelt-Brushett A. & Jacobs S.W.L. (2009) Re-establishing a saltmarsh vegetation structure in a changing climate. Ecological Management & Restoration, 10, 20–30.
Greet J., King E. & Stewart-Howie M. (2016) Plastic weed matting is better than jute or woodchips for controlling the invasive wetland grass species Phalaris arundinacea, but not Phragmites australis. Plant Protection Quarterly, 31, 19–22.
Groenendijk A.M. (1986) Establishment of a Spartina anglica population on a tidal mudflat: a field experiment. Journal of Environmental Management, 22, 1–12.

615
Grootjans A.P., Everts H., Bruin K. & Fresco L. (2001) Restoration of wet dune slacks on the Dutch Wadden Sea islands: recolonization after large-scale sod cutting. Restoration Ecology, 9, 137–146.
Gryseels M. (1989) Nature management experiments in a derelict reedmarsh. I: effects of winter cutting. Biological Conservation, 47, 171–193.
Gryseels M. (1989) Nature management experiments in a derelict reedmarsh. II: effects of summer mowing. Biological Conservation, 48, 85–99.
Guan, B., Yu J., Lu Z., Xie W., Chen X. & Wang X. (2011) 黄河三角洲重度退化滨海湿地盐地碱蓬的生态修复效果 (The
ecological effects of Suaeda salsa on repairing heavily degraded coastal saline-alkaline wetlands in the Yellow River Delta). Acta Ecologica Sinica, 31, 4835–4840.
Guo H., Weaver C., Charles S.P., Whitt A., Dastidar S., D'Odorico P., Fuentes J.D., Kominoski J.S., Armitage A.R. & Pennings S.C. (2017) Coastal regime shifts: rapid responses of coastal wetlands to changes in mangrove cover. Ecology, 98, 762–772.
Hackney C.T. & de la Cruz A.A. (1981) Effects of fire on brackish marsh communities: management implications. Wetlands, 1, 75–86.
Hagan S.M., Brown S.A. & Able K.W. (2007) Production of mummichog (Fundulus hereroclitus): response in marshes treated for common reed (Phragmites australis) removal. Wetlands, 27, 54–67.
Hall S.J., Lindig-Cisneros R. & Zedler J.B. (2008) Does harvesting sustain plant diversity in Central Mexican wetlands? Wetlands, 28, 776–792.
Hall S.J. & Zedler J.B. (2010) Constraints on sedge meadow self-restoration in urban wetlands. Restoration Ecology, 18, 671–680.
Hamdan M.A., Asada T., Hassan F.M., Warner B.G., Douabdul A., Al-Hilli M.R.A. & Alwan A.A. (2010) Vegetation response to re-flooding in the Mesopotamian Wetlands, southern Iraq. Wetlands, 30, 177–188.
Hammersmark C.T., Rains M.C., Wickland A.C. & Mount J.F. (2009) Vegetation and water-table relationships in a hydrologically restored riparian meadow. Wetlands, 29, 785–797.
Handa I.T. & Jeffries R.L. (2000) Assisted revegetation trials in degraded salt-marshes. Journal of Applied Ecology, 37, 944–958.
Haramis G.M. & Kearns G.D. (2007) Herbivory by resident geese: the loss and recovery of wild rice along the tidal Patuxent River. Journal of Wildlife Management, 71, 788–794.
Harris S.W. & Marshall W.H. (1963) Ecology of water-level manipulations on a northern marsh. Ecology, 44, 331–343.
Hart T.M. & Davis S.E. III (2011) Wetland development in a previously mined landscape of East Texas, USA. Wetlands Ecology and Management, 19, 317–329.
Hart J.D., Milsom T.P., Baxter A., Kelly P.F. & Parkin W.K. (2002) The impact of livestock on lapwing Vanellus vanellus breeding densities and performance on coastal grazing marsh. Bird Study, 49, 67–78.
Hartzell D., Bidwell J.R. & Davis C.A. (2007) A comparison of natural and created depressional wetlands in central Oklahoma using metrics from indices of biological integrity. Wetlands, 27, 794–805.
Hashim R., Kamali B., Tamin N.M. & Zakaria R. (2010) An integrated approach to coastal rehabilitation: mangrove restoration in Sungai Haji Dorani, Malaysia. Estuarine, Coastal and Shelf Science, 86, 118–124.
Haukos D.A. & Smith L.M. (2006) Effects of soil water on seed production and photosynthesis of pink smartweed (Polygonum pensylvanicum L.) in playa wetlands. Wetlands, 26, 265–270.
Henszey R.J., Skinner Q.D. & Wesche T.A. (1991) Response of montane meadow vegetation after two years of streamflow augmentation. Regulated Rivers: Research & Management, 6, 29–38.
Herndon A., Gunderson L. & Stenberg J. (1991) Sawgrass (Cladium jamaicense) survival in a regime of fire and flooding. Wetlands, 11, 17–27.
Hill T., Kulz E., Munoz B., Dorney J.R. (2013) Compensatory stream and wetland mitigation in North Carolina: an evaluation of regulatory success. Environmental Management, 51, 1077–1091.
Hillhouse H.L., Tunnell S.J. & Stubbendieck J. (2010) Spring grazing impacts on the vegetation of reed canarygrass-invaded wetlands. Rangeland Ecology & Management, 63, 581–587.
Hillman E.J., Bigelow S.G., Samuelson G.M., Herzog P.W., Hurly T.A. & Rood S.B. (2016) Increasing river flow expands riparian habitat: influences of flow augmentation on channel form, riparian vegetation and birds along the Little Bow River, Alberta. River Research and Applications, 32, 1687–1697.
Hine C.S., Hagy H.M., Horath M.M., Yetter A.P., Smith R.V. & Stafford J.D. (2017) Response of aquatic vegetation communities and other wetland cover types to floodplain restoration at Emiquon Preserve. Hydrobiologia, 804, 59–71.
Hoppe-Speer S.C.L. & Adams J.B. (2015) Cattle browsing impacts on stunted Avicennia marina mangrove trees. Aquatic Botany, 121, 9–15.

616
Hoppe-Speer S.C.L., Adams J.B. & Rajkaran A. (2015) Mangrove expansion and population structure at a planted site, East London, South Africa. Southern Forests, 77, 131–139.
Hovick S.M. & Reinartz J.A. (2007) Restoring forest in wetlands dominated by reed canarygrass: the effects of pre-planting treatments on early survival of planted stock. Wetlands, 27, 24–39.
Howe A.J., Rodríguez J.F., Spencer J., MacFarlane G.R. & Saintilan N. (2010) Response of estuarine wetlands to reinstatement of tidal flows. Marine and Freshwater Research, 61, 702–713.
Hu Z., Ma Q., Cao H., Zhang Z., Tang C., Zhang L. & Ge Z. (2016) 长江口滨海湿地原生海三棱藨草种群恢复的实验研究
(A trial study on revegetation of the native Scirpus mariqueter population in the coastal wetland of the Yangtze Estuary). Ecological Science, 35, 1–7.
Humphrey J.W. & Patterson G.S. (2000) Effects of late summer cattle grazing on the diversity of riparian pasture vegetation in an upland conifer forest. Journal of Applied Ecology, 37, 986–996.
Hutchinson J.T. & Langeland K.A. (2015) Response of Old World climbing fern and native vegetation to repeated ground herbicide treatments. Journal of Aquatic Plant Management, 53, 14–21.
Iannone B.V. III & Galatowitsch S.M. (2008) Altering light and soil N to limit Phalaris arundinacea reinvasion in sedge meadow restorations. Restoration Ecology, 16, 689–701.
Imbert D. & Delbé L. (2006) Ecology of fire-influenced Cladium jamaicense marshes in Guadeloupe, Lesser Antilles. Wetlands, 26, 289–297.
Ishii J., Hashimoto L. & Washitani I. (2011) 渡良瀬遊水地の湿地再生試験地における初期の植生発達 (Early vegetation growth in an experimental restoration site in the Watarase wetland). Japanese Journal of Conservation Ecology, 16, 69–84.
Jarman N.M., Dobberteen R.A., Windmiller B. & Lelito P.R. (1991) Evaluation of created freshwater wetlands in Massachusetts. Restoration & Management Notes, 9, 26–29.
Jellinek S., Te T., Gehrig S.L., Steward H. & Nicol J.M. (2016) Facilitating the restoration of aquatic plant communities in a Ramsar wetland. Restoration Ecology, 24, 528–537.
Jenkins N.J., Yeakley J.A. & Stewart E.M. (2008) First-year responses to managed flooding of lower Columbia River bottomland vegetation dominated by Phalaris arundinacea. Wetlands, 28, 1018–1027.
Jensen A. (1985) The effect of cattle and sheep grazing on salt-marsh vegetation at Skallingen, Denmark. Vegetatio, 60, 37–48.
Jessop J., Spyreas G., Pociask G.E., Benson T.J., Ward M.P., Kent A.D. & Matthews J.W. (2015) Tradeoffs among ecosystem services in restored wetlands. Biological Conservation, 191, 341–348.
Johnson Randall L.A. & Foote A.L. (2005) Effects of managed impoundments and herbivory on wetland plant production and stand structure. Wetlands, 25, 38–50.
Jones K.L., Roundy B.A., Shaw N.L. & Taylor J.R. (2004) Environmental effects on germination of Carex utriculata and Carex nebrascensis relative to riparian restoration. Wetlands, 24, 467–479.
Kadiri M., Spencer K.L., Heppell C.M. & Fletcher P. (2011) Sediment characteristics of a restored saltmarsh and mudflat in a managed realignment scheme in southeast England. Hydrobiologia, 672, 79–89.
Kangas L.C., Schwartz R., Pennington M.R., Webster C.R. & Chimner R.A. (2016) Artificial microtopography and herbivory protection facilitates wetland tree (Thuja occidentalis L.) survival and growth in created wetlands. New Forests, 47, 73–86.
Kaplan D., Oron T. & Gutman, M. (1998) Development of macrophytic vegetation in the Agmon Wetland of Israel by spontaneous colonization and reintroduction. Wetlands Ecology and Management, 6, 143–150.
Keer G.H. & Zedler J.B. (2002) Salt marsh canopy architecture differs with the number and composition of species. Ecological Applications, 12, 456–473.
Kettenring K. & Galatowitsch S.M. (2011) Carex seedling emergence in restored and natural prairie wetlands. Wetlands, 31, 273–281.
Kettlewell C.I., Bouchard V., Porej D., Micacchion M., Mack J.J., White D. & Fay L. (2008) An assessment of wetland impacts and compensatory mitigation in the Cuyahoga River Watershed, Ohio, USA. Wetlands, 28, 57–67.
Kidd S.A. & Yeakley J.A. (2015) Riparian wetland plant response to livestock exclusion in the Lower Columbia River Basin. Natural Areas Journal, 35, 504–514.
Kiehl K., Eischeid I., Gettner S. & Walter J. (1996) Impact of different sheep grazing intensities on salt marsh vegetation in northern Germany. Journal of Vegetation Science, 7, 99–106.
Kirui B.Y.K., Huxham M., Kairo J. & Skov M. (2008) Influence of species richness and environmental context on early survival of replanted mangroves at Gazi Bay, Kenya. Hydrobiologia, 603, 171–181.
Kiwango Y., Moshi G., Kibasa W. & Mnaya B. (2013) Papyrus wetlands creation, a solution to improve food security and save Lake Victoria. Wetlands Ecology and Management, 21, 147–154.

617
Kleppel G.S. & LaBarge E. (2011) Using sheep to control purple loosestrife (Lythrum salicaria). Invasive Plant Science and Management, 4, 50–57.
Kodikara K.A.S., Mukherjee N., Jayatissa L.P., Dahdouh-Guebas F. & Koedam N. (2017) Have mangrove restoration projects worked? An in-depth study in Sri Lanka. Restoration Ecology, 25, 705–716.
Kolozsvary M.B. & Holgerson M.A. (2016) Creating temporary pools as wetland mitigation: how well do they function? Wetlands, 36, 335–345.
Komiyama A., Santiean T., Higo M., Patanaponpaiboon P., Kongsangchai J. & Ogino K. (1996) Microtopography, soil hardness and survival of mangrove (Rhizophora apiculata BL.) seedlings planted in an abandoned tin-mining area. Forest Ecology and Management, 81, 243–248.
Konisky R.A., Burdick D.M., Dionne M. & Neckles H.A. (2006) A regional assessment of salt marsh restoration and monitoring the Gulf of Maine. Restoration Ecology, 14, 516–525.
Kost M.A. & De Steven D. (2000) Plant community responses to prescribed burning in Wisconsin sedge meadows. Natural Areas Journal, 20, 36–45.
Kozich A.T. & Halvorsen K.E. (2012) Compliance with wetland mitigation standards in the Upper Peninsula of Michigan, USA. Environmental Management, 50, 97–105.
Kristiansen J.N. (1998) Nest site preference by greylag geese Anser anser in reedbeds of different harvest age. Bird Study, 45, 337–343.
Krumholz J. & Jadot C. (2009) Demonstration of a new technology for restoration of red mangrove (Rhizophora mangle) in high-energy environments. Marine Technology Society Journal, 43, 64–72.
Kuhn N.L. & Zedler J.B. (1997) Differential effects of salinity and soil saturation on native and exotic plants of a coastal salt marsh. Estuaries, 20, 391–403.
Lagendijk D.D.G., Howison R.A., Esselink P., Ubels R. & Smit C. (2017) Rotation grazing as a conservation management tool: vegetation changes after six years of application in a salt marsh ecosystem. Agriculture, Ecosystems & Environment, 246, 361–366.
Landin M.C., Clairain E.J. Jr. & Newling C.J. (1989) Wetland habitat development and long-term monitoring at Windmill Point, Virginia. Wetlands, 9, 13–25.
Langis R., Zalejko M. & Zedler J.B. (1991) Nitrogen assessments in a constructed and natural salt marsh of San Diego Bay. Ecological Applications, 1, 40–51.
LaSalle M.W., Landin M.C. & Sims J.G. (1991) Evaluation of the flora and fauna of a Spartina alterniflora marsh established on dredged material in Winyah Bay, South Carolina. Wetlands, 11, 191–208.
Laubhan M.K. (1995) Effects of prescribed fire on moist-soil vegetation and soil macronutrients. Wetlands, 15, 159–166.
Lawrence B.A., Lishawa S.C., Rodriguez Y. & Tuchman N.C. (2016) Herbicide management of invasive cattail (Typha x glauca) increases porewater nutrient concentrations. Wetlands Ecology and Management, 24, 457–467.
Lawrence B.A. & Zedler J.B. (2013) Carbon storage by Carex stricta tussocks: a restorable ecosystem service? Wetlands, 33, 483–493
Leck M.A. (2003) Seed-bank and vegetation development in a created tidal freshwater wetland on the Delaware River, Trenton, New Jersey, USA. Wetlands, 23, 310–343.
Lee C.-S., You Y.-H. & Robinson G.R. (2002) Secondary succession and natural habitat restoration in abandoned rice fields of central Korea. Restoration Ecology, 10, 306–314.
Lee L.S., Garnett J.A., Bright E.G., Sharitz R.R. & Batzer D.P. (2016) Vegetation, invertebrate, and fish community response to past and current flow regulation in floodplains of the Savannah River, southeastern USA. Wetlands Ecology and Management, 24, 443–455.
Lee S.K., Tan W.H. & Havanond S. (1996) Regeneration and colonisation of mangrove on clay-filled reclaimed land in Singapore. Hydrobiologia, 319, 23–35.
Lewis R.R. III (2005) Project facilitates the natural reseeding of mangrove forests (Florida). Ecological Restoration, 23, 276–277.
Lindig-Cisneros R. & Zedler J. (2002) Halophyte recruitment in a salt marsh restoration site. Estuaries, 25, 259–273.
Linke M.G., Godoy R.S., Rolon A.S. & Maltchik L. (2014) Can organic rice crops help conserve aquatic plants in southern Brazil wetlands? Applied Vegetation Science, 17, 346–355.
Linz G.M., Blixt D.C., Bergman D.L. & Bleier W.J. (1996) Response of ducks to glyphosate-induced habitat alterations in wetlands. Wetlands, 16, 38–44.
618
Linz G.M., Blixt D.C., Bergman D.L. & Bleier W.J. (1996) Response of red-winged blackbirds, yellow-headed blackbirds and marsh wrens to glyphosate-induced habitat alterations in wetlands. Journal of Field Ornithology, 67, 167–176.
Lishawa S.C., Lawrence B.A., Albert D.A. & Tuchman N.C. (2015) Biomass harvest of invasive Typha promotes plant diversity in a Great Lakes coastal wetland. Restoration Ecology, 23, 228–237.
Liu G., Li Y., Hedgepeth M., Wan Y. & Roberts R.E. (2009) Seed germination enhancement for bald cypress [Taxodium distichum (L.) Rich.]. Journal of Horticulture and Forestry, 1, 22–26.
Liu G., Tian K., Sun J., Xiao D. & Yuan X. (2016) Evaluating the effects of wetland restoration at the watershed scale in northwest Yunnan Plateau, China. Wetlands, 36, 169–183.
López Rosas H., Moreno-Casasola P. & Mendelssohn I.A. (2006) Effects of experimental disturbances on a tropical freshwater marsh invaded by the African grass Echinochloa pyramidalis. Wetlands, 26, 593–604.
Lu C., Wang Z., Li L., Wu P., Mao D., Jia M. & Dong Z. (2016) Assessing the conservation effectiveness of wetland protected areas in northeast China. Wetlands Ecology and Management, 24, 381–398.
Lu J., Wang H., Wang W. & Yin C. (2007) Vegetation and soil properties in restored wetlands near Lake Taihu, China. Hydrobiologia, 581, 151–159.
Luvuno L. (2013) Burning wetlands: the influence of fire on wetland vegetation structure and composition. Masters Thesis. University of KwaZulu-Natal.
Lyons G. & Ausden M. (2005) Raising water levels to revert arable land to grazing marsh at Berney Marshes RSPB Reserve, Norfolk, England. Conservation Evidence, 2, 47–49.
Macharia J.M., Thenya T. & Ndiritu G.G. (2010) Management of highland wetlands in central Kenya: the importance of community education, awareness and eco-tourism in biodiversity conservation. Biodiversity, 11, 85–90.
Mackun I.R., Leopold D.J. & Raynal D.J. (1994) Short-term responses of wetland vegetation after liming of an Adirondack watershed. Ecological Applications, 4, 535–543.
Magee T.K., Ernst T.L., Kentula M.E. & Dwire K.A. (1999) Floristic comparison of freshwater wetlands in an urbanizing environment. Wetlands, 19, 517–534.
Martin K.L. & Kirkman L.K. (2009) Management of ecological thresholds to re-establish disturbance-maintained herbaceous wetlands of the south-eastern USA. Journal of Applied Ecology, 46, 906–914.
Martinuzzi S., Gould W.A., Lugo A.E. & Medina E. (2009) Conversion and recovery of Puerto Rican mangroves: 200 years of change. Forest Ecology and Management, 257, 75–84.
Marty J.E. & Kettenring K.M. (2017) Seed dormancy break and germination for restoration of three globally important wetland bulrushes. Ecological Restoration, 35, 138–147.
Marty J.T. (2005) Effects of cattle grazing on diversity in ephemeral wetlands. Conservation Biology, 19, 1626–1632.
Marty J.T. (2015) Loss of biodiversity and hydrologic function in seasonal wetlands persists over 10 years of livestock grazing removal. Restoration Ecology, 23, 548–554.
Matar Diouf A. (2002) Djoudj National Park and its periphery: an experiment in wetland co-management. Pages 13–17 in: M. Gawler (ed.) Strategies for Wise Use of Wetlands: Best Practices in Participatory Management. Proceedings of a Workshop held at the 2nd International Conference on Wetlands and Development, November 1998, Dakar, Senegal. Wetlands International, Wageningen; IUCN, Gland; WWF, Gland.
Matsui N., Suekuni J., Nogami M., Havanond S. & Salikul P. (2010) Mangrove rehabilitation dynamics and soil organic carbon changes as a result of full hydraulic restoration and re-grading of a previously intensively managed shrimp pond. Wetlands Ecology and Management, 18, 233–242.
Matthews J.W. & Endress A.G. (2010) Rate of succession in restored wetlands and the role of site context. Applied Vegetation Science, 13, 346–355.
McCabe O.M. & Otte M.L. (2000) The wetland grass Glyceria fluitans for revegetation of metal mine tailings. Wetlands, 20, 548–559.
McKee K.L. & Faulkner P.L. (2000) Restoration of biogeochemical function in mangrove forests. Restoration Ecology, 8, 247–259.
McKee K.L., Rooth J.E. & Feller I.C. (2007) Mangrove recruitment after forest disturbance is facilitated by herbaceous species in the Caribbean. Ecological Applications, 17, 1678–1693.
McKinstry M.C. & Anderson S.H. (2005) Salvaged-wetland soil as a technique to improve aquatic vegetation at created wetlands in Wyoming, USA. Wetlands Ecology and Management, 13, 499–508.
McKnight S.K. (1992) Transplanted seed bank response to drawdown time in a created wetland in East Texas. Wetlands, 12, 79–90.

619
McLeod K.W., Reed M.R. & Nelson E.A. (2001) Influence of a willow canopy on tree seedling establishment for wetland restoration. Wetlands, 21, 395–402.
McLeod K.W., Reed M.R. & Wike L.D. (2000) Elevation, competition control, and species affect bottomland forest restoration. Wetlands, 20, 162–168.
McWilliams S.R., Sloat T., Toft C.A. & Hatch D. (2007) Effects of prescribed fall burning on a wetland plant community, with implications for management of plants and herbivores. Western North American Naturalist, 67, 299–317.
Mesléard F., Lepart J., Grillas P. & Mauchamp A. (1999) Effects of seasonal flooding and grazing on the vegetation of former ricefields in the Rhône delta (southern France). Plant Ecology, 145, 101–114.
Metsoja J.-A., Neuenkamp L., Pihu S., Vellak K., Kalwij J.M. & Zobel M. (2012) Restoration of flooded meadows in Estonia – vegetation changes and management indicators. Applied Vegetation Science, 15, 231–244.
Middleton B.A., van der Valk A.G., Mason D.H., Williams R.L. & Davis C.B. (1991) Vegetation dynamics and seed banks of a monsoonal wetland overgrown with Paspalum distichum L. in northern India. Aquatic Botany, 40, 239–259.
Milbrandt E.C. & Tinsley M.N. (2006) The role of saltwort (Batis maritima L.) in regeneration of degraded mangrove forests. Hydrobiologia, 568, 369–377.
Miller R.L. & Fujii R. (2010) Plant community, primary productivity, and environmental conditions following wetland re-establishment in the Sacramento-San Joaquin Delta, California. Wetlands Ecology and Management, 18, 1–16.
Mook J.H. & van der Toorn J. (1982) The influence of environmental factors and management on stands of Phragmites australis. II. Effects on yield and its relationships with shoot density. Journal of Applied Ecology, 19, 501–517.
Moore H.H., Niering W.A., Marsicano L.J. & Dowdell M. (1999) Vegetation change in created emergent wetlands (1988–1996) in Connecticut (USA). Wetlands Ecology and Management, 7, 177–191.
Morgan K.L. & Roberts T.H. (2003) Characterization of wetland mitigation projects in Tennessee, USA. Wetlands, 23, 65–69.
Morgan P.A. & Short F.T. (2002) Using functional trajectories to track constructed salt marsh development in the Great Bay Estuary, Maine/New Hampshire, U.S.A. Restoration Ecology, 10, 461–473.
Morimoto J., Shibata M., Shida Y. & Nakamura F. (2017) Wetland restoration by natural succession in abandoned pastures with a degraded soil seed bank. Restoration Ecology, 25, 1005–1014.
Morrison J.A. (2002) Wetland vegetation before and after experimental purple loosestrife removal. Wetlands, 22, 159–169.
Moseley K.R., Castleberry S.B. & Schweitzer S.H. (2003) Effects of prescribed fire on herpetofauna in bottomland hardwood forests. Southeastern Naturalist, 2, 475–486.
Mossman H.L., Davy A.J. & Grant A. (2012) Does managed coastal realignment create saltmarshes with 'equivalent biological characteristics' to natural reference sites? Journal of Applied Ecology, 49, 1446–1456.
Motamedi S., Hashim R., Zakaria R., Song K.-I. & Sofawi B. (2014) Long-term assessment of an innovative mangrove rehabilitation project: case study on Carey Island, Malaysia. The Scientific World Journal, 2014, 953830.
Mu C., Lu H., Wang B., Bao X. & Cui W. (2013) Short-term effects of harvesting on carbon storage of boreal Larix gmelinii–Carex schmidtii forested wetlands in Daxing’anling, northeast China. Forest Ecology and Management, 293, 140–148.
Mulhouse J.M. & Galatowitsch S.M. (2003) Revegetation of prairie pothole wetlands in the mid-continental US: twelve years post-reflooding. Plant Ecology, 169, 143–159.
Mushet D.M., Euliss N.H. & Harris S.W. (1992) Effects of irrigation on seed production and vegetative characteristics of four moist-soil plants on impounded wetlands in California. Wetlands, 12, 204–207.
Mushet D.M., Euliss N.H. Jr. & Shaffer T.L. (2002) Floristic quality assessment of one natural and three restored wetland complexes in North Dakota, USA. Wetlands, 22, 126–138.
Myers R.S., Shaffer G.P. & Llewellyn D.W. (1995) Baldcypress (Taxodium distichum (L.) Rich.) restoration in southeast Louisiana: the relative effects of herbivory, flooding, competition and macronutrients. Wetlands, 15, 141–148.
Nakamura F., Ishiyama N., Sueyoshi M., Negishi J. & Akasaka T. (2014) The significance of meander restoration for the hydrogeomorphology and recovery of wetland organisms in the Kushiro River, a lowland river in Japan. Restoration Ecology, 22, 544–554.

620
Nam V.N., Sasmito S.D., Murdiyarso D., Purbopuspito J. & MacKenzie R.A. (2016) Carbon stocks in artificially and naturally regenerated mangrove ecosystems in the Mekong Delta. Wetlands Ecology and Management, 24, 231–244.
Nedland T.S., Wolf A. & Reed T. (2007) A re-examination of restored wetlands in Manitowoc County, Wisconsin. Wetlands, 27, 999–1015.
Neill C. & Turner R.E. (1987) Backfilling canals to mitigate wetland dredging in Louisiana coastal marshes. Environmental Management, 11, 823–836.
Nichols T.C. (2014) Integrated damage management reduces grazing of wild rice by resident Canada geese in New Jersey. Wildlife Society Bulletin, 38, 229–236.
Niswander S.F. & Mitsch W.J. (1995) Functional analysis of a two-year-old created in-stream wetland: hydrology, phosphorus retention, and vegetation survival and growth. Wetlands, 15, 212–225.
Nolte S., Esselink P., Smit C. & Bakker J.P. (2014) Herbivore species and density affect vegetation-structure patchiness in salt marshes. Agriculture, Ecosystems & Environment, 185, 41–47.
O'Brien E.L. & Zedler J.B. (2006) Accelerating the restoration of vegetation in a southern California salt marsh. Wetlands Ecology and Management, 14, 269–286.
O'Connell J.L., Johnson L.A., Beas B.J., Smith L.M., McMurry S.T. & Haukos D.A. (2013) Predicting dispersal-limitation in plants: optimizing planting decisions for isolated wetland restoration in agricultural landscapes. Biological Conservation, 159, 343–354.
O'Connell J.L., Johnson L.A., Smith L.M., McMurry S.T. & Haukos D.A. (2012) Influence of land-use and conservation programs on wetland plant communities of the semiarid United States Great Plains. Biological Conservation, 146, 108–115.
Oh R.R.Y., Friess D.A. & Brown B.M. (2017) The role of surface elevation in the rehabilitation of abandonedaquaculture ponds to mangrove forests, Sulawesi, Indonesia. Ecological Engineering, 100, 325–334.
Osland M.J., González E. & Richardson C.J. (2011) Restoring diversity after cattail expansion: disturbance, resilience, and seasonality in a tropical dry wetland. Ecological Applications, 21, 715–728.
Osland M.J., Spivak A.C., Nestlerode J.A., Lessmann J.M., Almario A.E., Heitmuller P.T., Russell M.J., Krauss K.W., Alvarez F., Dantin D.D., Harvey J.E., From A.S., Cormier N. & Stagg C.L. (2012) Ecosystem development after mangrove wetland creation: plant–soil change across a 20-year chronosequence. Ecosystems, 15, 848–866.
Ouali M., Daoud-Bouattour A., Etteieb S., Gammar A.M., Ben Saad-Limam S. & Ghrabi-Gammar Z. (2014) Le marais de Joumine, Parc National de l’Ichkeul, Tunisie: diversité floristique, cartographie et dynamique de la végétation (1925–2011) [Joumine Marsh, National Park of Ichkeul, Tunisia: floristic diversity, vegetation mapping and dynamics (1925–2011)]. Revue d'Écologie (Terre et Vie), 69, 3–23.
Palmik K., Mäemets H., Haldna M. & Kangur K. (2013) A comparative study of macrophyte species richness in differently managed shore stretches of Lake Peipsi. Limnologica, 43, 245–253.
Parikh A. & Gale N. (1998) Vegetation monitoring of created dune swale wetlands, Vanderberg Air Force Base, California. Restoration Ecology, 6, 83–93.
Patten K., O'Casey C. & Metzger C. (2017) Large-scale chemical control of smooth cordgrass (Spartina alterniflora) in Willapa Bay, WA: towards eradication and ecological restoration. Invasive Plant Science and Management, 10, 284–292.
Patterson S., McKee K. & Mendelssohn I.A. (1997) Effects of tidal inundation and predation on Avicennia germinans seedling establishment and survival in a sub-tropical mangal/salt marsh community. Mangroves and Salt Marshes, 1, 103–111.
Paynter Q. (2004) Revegetation of a wetland following control of the invasive woody weed, Mimosa pigra, in the Northern Territory, Australia. Environmental Management and Restoration, 5, 191–198.
Paynter Q. & Flanagan G.J. (2004) Integrating herbicide and mechanical control treatments with fire and biological control to manage an invasive wetland shrub, Mimosa pigra. Journal of Applied Ecology, 41, 615–629.
Pehrsson O. (1988) Effects of grazing and inundation on pasture quality and seed production in a salt marsh. Vegetatio, 74, 113–124.
Peng Y., Diao J., Zheng M., Guan D., Zhang R., Chen G. & Lee S.Y. (2016) Early growth adaptability of four mangrove species under the canopy of an introduced mangrove plantation: implications for restoration. Forest Ecology and Management, 373, 179–188.
Perry L.G. & Galatowitsch S.M. (2003) A test of two annual cover crops for controlling Phalaris arundinacea invasion in restored sedge meadow wetlands. Restoration Ecology, 11, 297–307.

621
Perry M.C., Sibrel C.B. & Gough G.A. (1996) Wetlands mitigation: partnership between an electric power company and a federal wildlife refuge. Environmental Management, 20, 933–939.
Pétillon J., Erfanzadeh R., Garbutt A., Maelfait J.-P. & Hoffmann M. (2010) Inundation frequency determines the post-pioneer successional pathway in a newly created salt marsh. Wetlands, 30, 1097–1105.
Pezeshki S.R., Brown C.E., Elcan J.M. & Shields, F.D. Jr. (2005) Responses of nondormant black willow (Salix nigra) cuttings to preplanting soaking and soil moisture. Restoration Ecology, 13, 1–7.
Pezeshki S.R., DeLaune R.D. & Pardue J.H. (1992) Sediment addition enhances transpiration and growth of Spartina alterniflora in deteriorating Louisiana Gulf Coast salt marshes. Wetlands Ecology and Management, 1, 185–189.
Piazza B.P., Banks P.D. & La Peyre M.K. (2005) The potential for created oyster shell reefs as a sustainable shoreline protection strategy in Louisiana. Restoration Ecology, 13, 499–506.
Pier B.M., Dresser B.R., Lee J.J., Boylen C.W. & Nierzwicki-Bauer S.A. (2015) Ecological analysis before and after planting in a constructed wetland in the Adirondacks. Wetlands, 35, 611–624.
Pitre R.L. & Anthamatten F. (1981) Successful restoration of filled wetlands at four locations along the Texas Gulf Coast. Wetlands, 1, 171–177.
Plassmann K., Jones M.L.M. & Edwards-Jones G. (2010) Effects of long-term grazing management on sand dune vegetation of high conservation interest. Applied Vegetation Science, 13, 100–112.
Ponzio K. (1998) Effects of various treatments on the germination of sawgrass, Cladium jamaicense Crantz, seeds. Wetlands, 18, 51–58.
Ponzio K.J., Miller S.J. & Lee M.A. (2004) Long-term effects of prescribed fire on Cladium jamaicense Cranz and Typha domingensis Pers. densities. Wetlands Ecology and Management, 12, 123–133.
Poptcheva K., Schwartze P., Vogel A., Kleinebecker T. & Hölzel N. (2009) Changes in wet meadow vegetation after 20 years of different management in a field experiment (north-west Germany). Agriculture, Ecosystems & Environment, 134, 108–114.
Poulin B. & Lefebvre G. (2002) Effect of winter cutting on the passerine breeding assemblage in French Mediterranean reedbeds. Biodiversity and Conservation, 11, 1567–1581.
Primavera J.H. & Esteban J.M.A. (2008) A review of mangrove rehabilitation in the Philippines: successes, failures and future prospects. Wetlands Ecology and Management, 16, 345–358.
Proffitt C.E. & Devlin D.J. (2005) Long-term growth and succession in restored and natural mangrove forests in southwestern Florida. Wetlands Ecology and Management, 13, 531–551.
Randall L.A.J. & Foote A.L. (2005) Effects of managed impoundments and herbivory on wetland plant production and stand structure. Wetlands, 25, 38–50.
Ranwell D.S. (1961) Spartina salt marshes in southern England: I. The effects of sheep grazing at the upper limits of Spartina marsh in Bridgwater Bay. Journal of Ecology, 49, 325–340.
Raulings E.J., Boon P.I., Bailey P.C., Roache M.C., Morris K. & Robinson R. (2007) Rehabilitation of swamp paperbark (Melaleuca ericifolia) wetlands in south-eastern Australia: effects of hydrology, microtopography, plant age and planting technique on the success of community-based revegetation trials. Wetlands Ecology and Management, 15, 175–188.
Reimold R.J., Linthurst R.A. & Wolf P.A. (1975) Effects of grazing on a salt marsh. Biological Conservation, 8, 105–125.
Reinartz J.A. & Warne E.L. (1993) Development of vegetation in small created wetlands in southeastern Wisconsin. Wetlands, 13, 153–164.
Reinhardt Adams C. & Galatowitsch S.M. (2006) Increasing the effectiveness of reed canary grass (Phalaris arundinacea L.) control in wet meadow restorations. Restoration Ecology, 14, 441–451.
Reyes Chargoy M.A. & Tovilla Hernández C. (2002) Restauración de áreas alteradas de manglar con Rhizophora mangle en la Costa de Chiapas (Restoration of altered mangrove areas with Rhizophora mangle on the Chiapas coast). Madera y Bosques, 8, 103–114.
Rickert C., Fichtner A., van Klink R. & Bakker J.P. (2012) α- and β-diversity in moth communities in salt marshes is driven by grazing management. Biological Conservation, 146, 24–31.
Riddin T., van Wyk E. & Adams J. (2016) The rise and fall of an invasive estuarine grass. South African Journal of Botany, 107, 74-79.
Ritter M.W. & Sweet T.M. (1993) Rapid colonization of a human-made wetland by Mariana common moorhen on Guam. Wilson Bulletin, 105, 685–687.
Robb J.T. (2002) Assessing wetland compensatory mitigation sites to aid in establishing mitigation ratios. Wetlands, 22, 435–440.

622
Rochlin I., James-Pirri M.-J., Adamowicz S.C., Dempsey M.E., Iwanejko T. & Ninivaggi D.V. (2012) The effects of integrated marsh management (IMM) on salt marsh vegetation, nekton, and birds. Estuaries and Coasts, 35, 727–742.
Rolletscheck H., Rolletscheck A., Hartzendorf T. & Kohl J.-G. (2000) Physiological consequences of mowing and burning of Phragmites australis stands for rhizome ventilation and amino acid metabolism. Wetlands Ecology and Management, 8, 425–433.
Rolon A.S. & Maltchik L. (2010) Does flooding of rice fields after cultivation contribute to wetland plant conservation in southern Brazil? Applied Vegetation Science, 13, 26–35.
Roman C.T., Raposa K.B., Adamowicz S.C., James-Pirri M.-J. & Catena J.G. (2002) Quantifying vegetation and nekton response to tidal restoration of a New England salt marsh. Restoration Ecology, 10, 450–460.
Rovai A.S., Soriano-Sierra E.J., Pagliosa P.R., Cintrón G., Schaeffer-Novelli Y., Menghini R.P. Coelho-Jr C., Horta P.A., Lewis R.R. III, Simonassi J.C., Alves J.A.A., Boscatto F. & Dutra S.J. (2012) Secondary succession impairment in restored mangroves. Wetlands Ecology and Management, 20, 447–459.
Rowe J.C. & Garcia T.S. (2014) Impacts of wetland restoration efforts on an amphibian assemblage in a multi-invader community. Wetlands, 34, 141–153.
Roy M.-C., Foote L. & Ciborowski J.J.H. (2016) Vegetation community composition in wetlands created following oil sand mining in Alberta, Canada. Journal of Environmental Management, 172, 18–28.
Roy M.-C., Mollard F.P.O. & Foote A.L. (2014) Do peat amendments to oil sands wet sediments affect Carex aquatilis biomass for reclamation success? Journal of Environmental Management, 139, 154–163.
Rupprecht F., Wanner A., Stock M. & Jensen K. (2015) Succession in salt marshes – large-scale and long-term patterns after abandonment of grazing and drainage. Applied Vegetation Science, 18, 86–98.
Russell I.A. & Kraaij T. (2008) Effects of cutting Phragmites australis along an inundation gradient, with implications for managing reed encroachment in a South African estuarine lake system. Wetlands Ecology and Management, 16, 383–393.
Russell K.N. & Beauchamp V.B. (2017) Plant species diversity in restored and created Delmarva Bay wetlands. Wetlands, 37, 1119–1133.
Ryder C., Moran J., Donnell R. & Gormally M. (2005) Conservation implications of grazing practices on the plant and dipteran communities of a turlough in Co. Mayo, Ireland. Biodiversity and Conservation, 14, 187–204.
Sah J.P., Ross M.S., Saha S., Minchin P. & Sadle J. (2014) Trajectories of vegetation response to water management in Taylor Slough, Everglades National Park, Florida. Wetlands, 34(S1), 65–79.
Salgado Kent C.P. & Lin J. (1999) A comparison of Riley encased methodology and traditional techniques for planting red mangroves (Rhizophora mangle). Mangroves and Salt Marshes, 3, 215–225.
Salmo S.G. III, Lovelock C. & Duke N.C. (2013) Vegetation and soil characteristics as indicators of restoration trajectories in restored mangroves. Hydrobiologia, 720, 1–18.
Samson M.S. & Rollon R.N. (2008) Growth performance of planted mangroves in the Philippines: revisiting forest management strategies. Ambio, 37, 234–240.
Sarneel J.M., Huig N., Veen G.F., Rip W. & Bakker E.S. (2014) Herbivores enforce sharp boundaries between terrestrial and aquatic ecosystems. Ecosystems, 17, 1426–1438.
Scarton F., Cecconi G. & Valle R. (2013) Use of dredge islands by a declining European shorebird, the Kentish plover Charadrius alexandrinus. Wetlands Ecology and Management, 21, 15–27.
Scarton F., Day J.W. Jr., Rismondo A., Cecconi G. & Are D. (2000) Effects of an intertidal sediment fence on sediment elevation and vegetation distribution in a Venice (Italy) lagoon salt marsh. Ecological Engineering, 16, 223–233.
Schaich H., Szabó I. & Kaphegyi T.A.M. (2010) Grazing with Galloway cattle for floodplain restoration in the Syr Valley, Luxembourg. Journal for Nature Conservation, 18, 268–277.
Scherrer P., Blasco F. & Imbert D. (1989) Etude experimentale in situ de la toxicite du petrole brut et de 2 additifs envers les plantules de Rhizophora mangle (In situ experimental study of the toxicity of crude oil and 2 additives to Rhizophora mangle seedlings). Environmental Technology Letters, 10, 323–332.
Schmalzer P.A., Hinkle C.R. & Mailander J.L. (1991) Changes in community composition and biomass in Juncus roemerianus Scheele and Spartina bakeri Merr. Marshes one year after a fire. Wetlands, 11, 67–86.
Schmidt M.H., Lefebvre G., Poulin B. & Tscharntke T. (2005) Reed cutting affects arthropod communities, potentially reducing food for passerine birds. Biological Conservation, 121, 157–166.
Scholte P., Kirda P., Adam S. & Kadiri B. (2000) Floodplain rehabilitation in North Cameroon: impact on vegetation dynamics. Applied Vegetation Science, 3, 33–42.

623
Schrift A.M., Mendelssohn I.A. & Materne M.D. (2008) Salt marsh restoration with sediment-slurry amendments following a drought-induced large-scale disturbance. Wetlands, 28, 1071–1085.
Schummer M.L., Palframan J., McNaughton E., Barney T. & Petrie S.A. (2012) Comparisons of bird, aquatic macroinvertebrate, and plant communities among dredged ponds and natural wetland habitats at Long Point, Lake Erie, Ontario. Wetlands, 32, 945–953.
Scyphers S.B., Powers S.P., Heck K.L. Jr. & Byron D. (2011) Oyster reefs as natural breakwaters mitigate shoreline loss and facilitate fisheries. PLoS ONE, 6, e22396.
Seabloom E.W. & van der Valk A.G. (2003) Plant diversity, composition, and invasion of restored and natural prairie pothole wetlands: implications for restoration. Wetlands, 23, 1–12.
Sellamuttu S.S., de Silva S., Khoa S.N. & Samarakoon J. (2008) Good Practices and Lessons Learned in Integrating Ecosystem Conservation and Poverty Reduction Objectives in Wetlands. International Water Management Institute, Colombo & Wetlands International, Wageningen.
Selvam V., Ravichandran K.K., Gnanappazham L. & Navamuniyammal M. (2003) Assessment of community-based restoration of Pichavaram mangrove wetland using remote sensing data. Current Science, 85, 794–798.
Seneca E.D., Broome S.W. & Woodhouse W.W. Jr. (1985) Comparison of Spartina alterniflora Loisel. transplants from different locations in a man-initiated marsh in North Carolina. Wetlands, 5, 181–190.
Shafer D.J. & Roberts T.H. (2008) Long-term development of tidal mitigation wetlands in Florida. Wetlands Ecology and Management, 16, 23–31.
Shafer D.J. & Streever W.J. (2000) A comparison of 28 natural and dredged material salt marshes in Texas with an emphasis on geomorphological variables. Wetlands Ecology and Management, 8, 353–366.
Sherfy M.H. & Kirkpatrick R.L. (2003) Invertebrate response to snow goose herbivory on moist-soil vegetation. Wetlands, 23, 236–249.
Silveira T.C.L., Rodrigues G.G., Coelho de Souza G.P. & Würdig N.L. (2012) Effect of Typha domingensis cutting: response of benthic macroinvertebrates and macrophyte regeneration. Biota Neotropica, 12, 124–132.
Silver C.A. & Vamosi S.M. (2012) Macroinvertebrate community composition of temporary prairie wetlands: a preliminary test of the effect of rotational grazing. Wetlands, 32, 185–197.
Sleeper B.E. & Ficklin R.L. (2016) Edaphic and vegetative responses to forested wetland restoration with created microtopography in Arkansas. Ecological Restoration, 34, 117–123.
Sloey T.M., Willis J.M. & Hester M.W. (2015) Hydrologic and edaphic constraints on Schoenoplectus acutus, Schoenoplectus californicus, and Typha latifolia in tidal marsh restoration. Restoration Ecology, 23, 430–438.
Smith A.M., Reinhardt Adams C., Wiese C. & Wilson S.B. (2016) Re-vegetation with native species does not control the invasive Ruellia simplex in a floodplain forest in Florida, USA. Applied Vegetation Science, 19, 20–30.
Smith A.N., Vernes K.A. & Ford H.A. (2012) Grazing effects of black swans Cygnus atratus (Latham) on a seasonally flooded coastal wetland of eastern Australia. Hydrobiologia, 697, 45–57.
Smith C., DeKeyser E.S., Dixon C., Kobiela B. & Little A. (2016) Effects of sediment removal on prairie pothole wetland plant communities in North Dakota. Natural Areas Journal, 36, 48–58.
Smith P.H. & Kimpton A. (2008) Effects of grey willow Salix cinerea removal on the floristic diversity of a wet dune-slack at Cabin Hill National Nature Reserve on the Sefton Coast, Merseyside, England. Conservation Evidence, 5, 6–11.
Smith T., Lundholm J. & Simser L. (2001) Wetland vegetation monitoring in Cootes Paradise: measuring the response to a fishway/carp barrier. Ecological Restoration, 19, 145–154.
Snell-Rood E.C. & Cristol D.A. (2003) Avian communities of created and natural wetlands: bottomland forests in Virginia. The Condor, 105, 303–315.
Sollie S., Coops H. & Verhoeven J.T.A. (2008) Natural and constructed littoral zones as nutrient traps in eutrophicated shallow lakes. Hydrobiologia, 605, 219–233.
Song Y., Song C., Yang G., Miao Y., Wang J. & Guo Y. (2012) Changes in labile organic carbon fractions and soil enzyme activities after marshland reclamation and restoration in the Sanjiang Plain in northeast China. Environmental Management, 50, 418–426.
Spencer L.J. & Bousquin S.G. (2014) Interim responses of floodplain wetland vegetation to Phase I of the Kissimmee River Restoration Project: comparisons of vegetation maps from five periods in the river's history. Restoration Ecology, 22, 397–408.
Spieles D.J. (2005) Vegetation development in created, restored, and enhanced mitigation wetland banks of the United States. Wetlands, 25, 51–63.

624
Stagg C.L. & Mendelssohn I.A. (2012) Littoraria irrorata growth and survival in a sediment-restored salt marsh. Wetlands, 32, 643–652.
Stauffer A.L. & Brooks R.P. (1997) Plant and soil responses to salvaged marsh surface and organic matter amendments at a created wetland in central Pennsylvania. Wetlands, 17, 90–105.
Stevenson N.J., Lewis R.R. & Burbridge P.R. (1999) Disused shrimp ponds and mangrove rehabilitation. Pages 277–297 in W. Streever (ed.) An International Perspective on Wetland Rehabilitation. Springer, Dordrecht.
Streever W.J. (2000) Spartina alterniflora marshes on dredged material: a critical review of the ongoing debate over success. Wetlands Ecology and Management, 8, 295–316.
Streever W.J., Portier K.M. & Crisman T.L. (1996) A comparison of dipterans from ten created and ten natural wetlands. Wetlands, 16, 416–428.
Sutton-Grier A., Ho M. & Richardson C.J. (2009) Organic amendments improve soil conditions and denitrification in a restored riparian wetland. Wetlands, 29, 343–352.
Swanson L.J. Jr. & Shuey A.G. (1980) Freshwater marsh reclamation in west central Florida. Proceedings of the Annual Conference on Restoration and Creation of Wetlands 7, Tampa, Florida, 51–61.
Tamaei S. (2004) ヒルギダマシ植林による砂漠沿岸緑化に関する研究: 養殖廃水を利用したヒルギダマシ植林と形成され
た生態系 (Study of gray mangrove (Avicennia marina) afforestation for greening of desert coasts: afforestation with gray mangroves combined with aquaculture waste water for ecosystem establishment). Japanese Journal of Ecology, 54, 35–46.
Tamaei S. (2005) ヒルギダマシ植林による砂漠沿岸緑化に関する研究: サブカに人工水路を掘り込むことによるヒルギダ
マシ植林とそこに形成された生物群集 (Study of gray mangrove (Avicennia marina) afforestation for greening of desert coasts: gray mangrove afforestation on banks of artificial channel across a sabkha and the established biotic community). Japanese Journal of Ecology, 55, 1–9.
Tanner G.W. & Dodd J.D. (1985) Effects of phenological stage of Spartina alterniflora transplant culms on stand development. Wetlands, 4, 57–74.
Tarasoff C.S., Streichert K., Gardner W., Heiser B., Church J. & Pypker T.G. (2016) Assessing benthic barriers vs. aggressive cutting as effective yellow flag iris (Iris pseudacorus) control mechanisms. Invasive Plant Science and Management, 9, 229–234.
Taylor D.S. (2012) Removing the sands (sins?) of our past: dredge spoil removal and saltmarsh restoration along the Indian River Lagoon, Florida (USA). Wetlands Ecology and Management, 20, 213–218.
Taylor K.L. & Grace J.B. (1995) The effects of vertebrate herbivory on plant community structure in the coastal marshes of the Pearl River, Louisiana, USA. Wetlands, 15, 68–73.
Taylor K.L., Grace J.B., Guntenspergen G.R. & Foote A.L. (1994) The interactive effects of herbivory and fire on an oligohaline marsh, Little Lake, Louisiana, USA. Wetlands, 14, 82–87.
Taylor S.M. & Santelmann M.V. (2014) Comparing vegetation and soils of remnant and restored wetland prairies in the Northern Willamette Valley. Northwest Science, 88, 329–343.
Teas H.J. (1977) Ecology and restoration of mangrove shorelines in Florida. Environmental Conservation, 4, 51–58.
ter Heerdt G.N.J. & Drost H.J. (1994) Potential for the development of marsh vegetation from the seed bank after a drawdown. Biological Conservation, 67, 1–11.
Thom R.M., Zeigler R. & Borde A.B. (2002) Floristic development patterns in a restored Elk River estuarine marsh, Grays Harbor, Washington. Restoration Ecology, 10, 487–496.
Thomsen D., Marsden I.D. & Sparrow A.D. (2005) A field experiment to assess the transplant success of salt marsh plants into tidal wetlands. Wetlands Ecology and Management, 13, 489–497.
Thomsen M., Brownell K., Groshek M. & Kirsch E. (2012) Control of reed canarygrass promotes wetland herb and tree seedling establishment in an Upper Mississippi River floodplain forest. Wetlands, 32, 543–555.
Thullen J.S. & Eberts D.R. (1995) Effects of temperature, stratification, scarification, and seed origin on the germination of Scirpus acutus Muhl. seeds for use in constructed wetlands. Wetlands, 15, 298–304.
Tobias V.D., Block G. & Laca E.A. (2016) Controlling perennial pepperweed (Lepidium latifolium) in a brackish tidal marsh. Wetlands Ecology and Management, 24, 411–418.
Toledo G., Rojas A. & Bashan Y. (2001) Monitoring of black mangrove restoration with nursery-reared seedlings on an arid coastal lagoon. Hydrobiologia, 444, 101–109.
Toth L.A. & van der Valk A. (2012) Predictability of flood pulse driven assembly rules for restoration of a floodplain plant community. Wetlands Ecology and Management, 20, 59–75.
Toth L.A. (2010) Restoration response of relict broadleaf marshes to increased water depths. Wetlands, 30, 263–274.

625
Toth L.A. (2015) Invasibility drives restoration of a floodplain plant community. River Research and Applications, 31, 1319–1327.
Toth L.A. (2016) Cover thresholds for impacts of an exotic grass on the structure and assembly of a wet prairie community. Wetlands Ecology and Management, 24, 61–72.
Toth L.A. (2017) Variant restoration trajectories for wetland plant communities on a channelized floodplain. Restoration Ecology, 25, 342–353.
Trama F.A., Rizo-Patrón F.L., Kumar A., Gonzalez E., Somma D. & McCoy M.B. (2009) Wetland cover types and plant community changes in response to cattail-control activities in the Palo Verde Marsh, Costa Rica. Ecological Restoration, 27, 278–289.
Triet T. (2010) Combining biodiversity conservation with poverty alleviation – a case study in the Mekong Delta, Vietnam. Aquatic Ecosystem Health & Management, 13, 41–46.
Tsuruda K. (2013) Silviculture manual for mangrove restoration in the Yucatan Peninsula, Mexico. Pages 23–34 in: H.T. Chan, M. Cohen & S. Baba (eds.) Mangrove Ecosystems Occasional Papers No. 4. International Society for Mangrove Ecosystems.
Turner R.E., Lee J.M. & Neill C. (1994) Backfilling canals to restore wetlands: empirical results in coastal Louisiana. Wetlands Ecology and Management, 3, 63–78.
Uhrin A.V. & Schellinger J. (2011) Marine debris impacts to a tidal fringing-marsh in North Carolina. Marine Pollution Bulletin, 62, 2605–2610.
Ulrich K.E. & Burton T.M. (1984) The establishment and management of emergent vegetation in sewage-fed artificial marshes and the effects of these marshes on water quality. Wetlands, 4, 205–220.
van den Bosch K. & Matthews J.W. (2017) An assessment of long-term compliance with performance standards in compensatory mitigation wetlands. Environmental Management, 59, 546–556.
van der Toorn J. & Mook J.H. (1982) The influence of environmental factors and management on stands of Phragmites australis. I. Effects of burning, frost and insect damage on shoot density and shoot size. Journal of Applied Ecology, 19, 477–499.
van der Valk A.G., Bremholm T.L. & Gordon E. (1999) The restoration of sedge meadows: seed viability, seed germination requirements, and seedling growth of Carex species. Wetlands, 19, 756–764.
van Klink R., Nolte S., Mandema F.S., Lagendijk D.D.G., Wallis De Vries M.F., Bakker J.P., Esselink P. & Smit C. (2016) Effects of grazing management on biodiversity across trophic levels—the importance of livestock species and stocking density in salt marshes. Agriculture, Ecosystems & Environment, 235, 329–339.
van Klink R., Rickert C., Vermeulen R., Vorst O., WallisDeVries M.F. & Bakker J.P. (2013) Grazed vegetation mosaics do not maximize arthropod diversity: evidence from salt marshes. Biological Conservation, 164, 150–157.
van Loon-Steensma J.M., van Dobben H.F., Slim P.A., Huiskes H.P.J. & Dirkse G.M. (2015) Does vegetation in restored salt marshes equal naturally developed vegetation? Applied Vegetation Science, 18, 674–682.
Vanderbosch D.A. & Galatowitsch S.M. (2010) An assessment of urban lakeshore restorations in Minnesota. Ecological Restoration, 28, 71–80.
Vanderbosch D.A. & Galatowitsch S.M. (2011) Factors affecting the establishment of Schoenoplectus tabernaemontani (C.C. Gmel.) Palla in urban lakeshore restorations. Wetlands Ecology and Management, 19, 35–45.
VanRees-Siewert K.L. & Dinsmore J.J. (1996) Influence of wetland age on bird use of restored wetlands in Iowa. Wetlands, 16, 577–582.
Varty A.K. & Zedler J.B. (2008) How waterlogged microsites help an annual plant persist among salt marsh perennials. Estuaries and Coasts, 31, 300–312.
Vasconcelos D. & Calhoun A.J.K. (2006) Monitoring created seasonal pools for functional success: a six-year case study of amphibian responses, Sears Island, Maine, USA. Wetlands, 26, 992–1003.
Venne L.S., Trexler J.C. & Frederick P.C. (2016) Prescribed burn creates pulsed effects on a wetland aquatic community. Hydrobiologia, 771, 281–295.
Vivian-Smith G. & Handel S.N. (1996) Freshwater wetland restoration of an abandoned sand mine: seed bank recruitment dynamics and plant colonization. Wetlands, 16, 185–196.
Vovides A.G., Bashan Y., López-Portillo J.A. & Guevara R. (2011) Nitrogen fixation in preserved, reforested, naturally regenerated and impaired mangroves as an indicator of functional restoration in mangroves in an arid region of Mexico. Restoration Ecology, 19, 236–244.
Wall C.B. & Stevens K.J. (2014) Assessing wetland mitigation efforts using standing vegetation and seed bank community structure in neighbouring natural and compensatory wetlands in north-central Texas. Wetlands Ecology and Management, 23, 149–166.

626
Wang J., Seliskar D.M., Gallagher J.L. & League M.T. (2006) Blocking Phragmites australis reinvasion of restored marshes using plants selected from wild populations and tissue culture. Wetlands Ecology and Management, 14, 539–547.
Wang Z., Song K., Ma W., Ren C., Zhang B., Liu D., Chen J.M. & Song C. (2011) Loss and fragmentation of marshes in the Sanjiang Plain, northeast China, 1954–2005. Wetlands, 31, 945–954.
Webb J.W. & Dodd J.D. (1989) Spartina alterniflora response to fertilizer, planting dates, and elevation in Galveston Bay, Texas. Wetlands, 9, 61–72.
Webb J.W. & Newling C.J. (1984) Comparison of natural and man-made salt marshes in Galveston Bay Complex, Texas. Wetlands, 4, 75–86.
Weller M.W., Kaufman G.W. & Vohs P.A. Jr. (1991) Evaluation of wetland development and waterbird response at Elk Creek Wildlife Management Area, Lake Mills, Iowa, 1961–1990. Wetlands, 11, 245–262.
Welling C.H., Pederson R.L. & van der Valk A.G. (1988) Recruitment from the seed bank and the development of zonation of emergent vegetation during a drawdown in a prairie wetland. Journal of Ecology, 76, 483–496.
Welling C.H., Pederson R.L. & van der Valk A.G. (1988) Temporal patterns in recruitment from the seed bank during drawdowns in a prairie wetland. Journal of Applied Ecology, 25, 999–1007.
Wetlands International (2016) Conserving and restoring wetlands in Nigeria’s Niger River Delta. Available at https://www.wetlands.org/casestudy/conserving-and-restoring-wetlands-in-nigerias-niger-river-delta/. Accessed 30 June 2020.
Wetlands International (2016) Mangrove restoration: to plant or not to plant? Available at http://www.wetlands.org/publications/mangrove-restoration-to-plant-or-not-to-plant/. Accessed 20 February 2020.
Whitcraft C.R. & Grewell B.J. (2012) Evaluation of perennial pepperweed (Lepidium latifolium) management in a seasonal wetland in San Francisco Estuary prior to restoration of tidal hydrology. Wetlands Ecology and Management, 20, 35–45.
Wibisono I.T.C. & Sualia I. (2008) An assessment of lessons learnt from the “Green Coast Project” in Nanggroe Aceh Darussalam (NAD) Province and Nias Island, Indonesia (Period 2005–2008). Wetlands International, Bogor.
Wilcox D.A. & Whillans T.H. (1999) Techniques for restoration of disturbed coastal wetlands of the Great Lakes. Wetlands, 19, 835–857.
Williams P.B. & Orr M.K. (2002) Physical evolution of restored breached levee salt marshes in the San Francisco Bay estuary. Restoration Ecology, 10, 527–542.
Wilson M.J., Forrest A.S. & Bayley S.E. (2013) Floristic quality assessment for marshes in Alberta's northern prairie and boreal regions. Aquatic Ecosystem Health & Management, 16, 288–299.
Wilson R.F. & Mitsch W.J. (1996) Functional assessment of five wetlands constructed to mitigate wetland loss in Ohio, USA. Wetlands, 16, 436–451.
Wold E.N., Jancaitis J.E., Taylor T.H. & Steeck D.M. (2011) Restoration of agricultural fields to diverse wet prairie plant communities in the Willamette Valley, Oregon. Northwest Science, 85, 269–287.
Wolinski A.L.T.O., Lana P.C. & Sandrini-Neto L. (2011) Is the cutting of oil contaminated marshes an efficient clean-up technique in a subtropical estuary? Marine Pollution Bulletin, 62, 1227–1232.
Wolters M., Garbutt A., Bekker R.M., Bakker J.P. & Carey P.D. (2008) Restoration of salt-marsh vegetation in relation to site suitability, species pool and dispersal traits. Journal of Applied Ecology, 45, 904–912.
Wood J.K., Gold W.G., Fridley J.L., Ewing K. & Niyogi D.K. (2017) An analysis of factors driving success in ecological restoration projects by a university-community partnership. Ecological Restoration, 35, 60–69.
Worthington D.R. & Helliwell T.R. (1987) Transference of semi-natural grassland and marshland onto newly created landfill. Biological Conservation, 41, 301–311.
Yetka L.A. & Galatowitsch S.M. (1999) Factors affecting revegetation of Carex lacustris and Carex stricta from rhizomes. Restoration Ecology, 7, 162–171.
Yu H., Zhang F., Kung H., Johnson V.C., Bane C.S., Wang J., Ren Y. & Zhang Y. (2017) Analysis of land cover and landscape change patterns in Ebinur Lake Wetland National Nature Reserve, China from 1972 to 2013. Wetlands Ecology and Management, 25, 619–637.
Zabbey N. & Tanee F.B.G. (2016) Assessment of asymmetric mangrove restoration trials in Ogoniland, Niger Delta, Nigeria: lessons for future intervention. Ecological Restoration, 34, 245–257.
Zahn V.A., Meinl M. & Niefermeier U. (2003) Auswirkungen extensiver rinderbeweidung auf die wegetation einer feuchtbrache (Effects of low maintenance grazing on the vegetation of a wetland fallow). Naturschutz und Landschaftsplanung, 35, 171–178.

627
Zaldívar-Jiménez A., Ladrón-de-Guevara-Porras P., Pérez-Ceballos R., Díaz-Mondragón S. & Rosado-Solórzano R. (2017) US-Mexico joint Gulf of Mexico large marine ecosystem based assessment and management: experience in community involvement and mangrove wetland restoration in Términos lagoon, Mexico. Environmental Development, 22, 206–213.
Zamith L.R. & Scarano F.R. (2010) Restoration of a coastal swamp forest in southeastern Brazil. Wetlands Ecology and Management, 18, 435–448.
Zedler J.B. (1993) Canopy architecture of natural and planted cordgrass marshes: selecting habitat evaluation criteria. Ecological Applications, 3, 123–138.
Zedler J.B., Morzaria-Luna H. & Ward K. (2003) The challenge of restoring vegetation on tidal, hypersaline substrates. Plant and Soil, 253, 259–273.
Zengel S.A. & Michel J. (1996) Vegetation cutting as a clean-up method for salt and brackish marshes impacted by oil spills: a review and case history of the effects on plant recovery. Marine Pollution Bulletin, 32, 876–885.
Zheng L. & Stevenson R.J. (2006) Algal assemblages in multiple habitats of restored and extant wetlands. Hydrobiologia, 561, 221–238.
Zheng L., Stevenson R.J. & Craft C. (2004) Changes in benthic algal attributes during salt marsh restoration. Wetlands, 24, 309–323.
Zilverberg C.J., Johnson W.C., Boe A., Owens V., Archer D.W., Novotny C., Volke M. & Werner B. (2014) Growing Spartina pectinata in previously farmed prairie wetlands for economic and ecological benefits. Wetlands, 34, 853–864.