land suitability evaluation using gis for vegetable crops in ...
259
LAND SUITABILITY EVALUATION USING GIS FOR VEGETABLE CROPS IN KATHMANDU VALLEY /NEPAL Dissertation zur Erlangung des akademischen Grades Doctor rerum agriculturarum (Dr.rer.agr.) eingereicht an der Landwirtschaftlich-Gärtnerischen Fakultät der Humboldt-Universität zu Berlin von M.Sc. Nabarath Baniya geboren am 01.12.1969 in Kathmandu, Nepal dem Präsident der Humboldt-Universität zu Berlin Prof. Dr. Christoph Markschies Dekan der Landwirtschaftlich-Gärtnerischen Fakultät Prof. Dr. Dr. N.c. Otto Kaufmann Gutachter: Prof. Dr. sc Drs. h. c. Michael H. Böhme Dr. rer. agr. Michael La Rosa Perez Berlin, 13. Oktober 2008
-
Upload
khangminh22 -
Category
Documents
-
view
2 -
download
0
Transcript of land suitability evaluation using gis for vegetable crops in ...

LAND SUITABILITY EVALUATION USING GIS FOR VEGETABLE CROPS
IN KATHMANDU VALLEY /NEPAL
Dissertation
zur Erlangung des akademischen Grades Doctor rerum agriculturarum
(Dr.rer.agr.)
eingereicht an der Landwirtschaftlich-Gärtnerischen Fakultät
der Humboldt-Universität zu Berlin
von
M.Sc. Nabarath Baniya geboren am 01.12.1969 in Kathmandu, Nepal
dem Präsident der Humboldt-Universität zu Berlin
Prof. Dr. Christoph Markschies
Dekan der Landwirtschaftlich-Gärtnerischen Fakultät Prof. Dr. Dr. N.c. Otto Kaufmann
Gutachter: Prof. Dr. sc Drs. h. c. Michael H. Böhme
Dr. rer. agr. Michael La Rosa Perez
Berlin, 13. Oktober 2008

II
Dedication
To my parents, Udaya Bahadur Baniya and Til Kumari Baniya,
who would have appreciated seeing it if they were still alive.

III
ACKNOWLEDGEMENT
I wish to express my gratitude to all those who have given me assistance, help and support
during the completion of my PhD in Faculty of Agriculture and Horticulture, Institute of
Horticultural Sciences, Humboldt University of Berlin.
I acknowledge a deep sense of gratitude to Prof. Dr. Michael Böhme my supervisor, who had
always spread his helping hands during my PhD study periods, and given me guidance,
valuable suggestion, critical comments and kindness during and completion of present work.
His innovative research ideas kind patient and effective guidance throughout my work need
not to be exaggerated. This thesis would never be accomplished in this shape without his
selfless contributions in various aspects. I am very happy to state that I got to learn a lot from
his experience in field of horticulture science.
I gratefully acknowledge Dr. rer. agr. Michael La Rosa Perez, LGF, WISOLA, for guiding
me on analytical aspect of the present dissertation. GIS tool is the crux of my study, is
accomplished with his tireless help. Thanks to Dr. Ina Pinker for constant inspiration and
supportive remarks for the completion of this thesis.
My appreciation is extended to Mr. Mirko Houseworth, a good friend of mine for his
valuable support in GIS work and to Dr. Shyam Pathak for appreciable help in text
arrangements.
I am very much thankful to all my family members who always support me to pursue my
goal. My sincere gratitude goes to my late parents and parents in law for their support. My
daughters Ahushuya and Awantika and son Abhinav are also equally thankful for being
patient and supportive when I was away from them during my study periods. Finally, very
special thanks to my beloved wife Saroja for her support and understanding during my
absence and taking care of household matters in the most unfortunate situation ever come in
my life. Her inspirational remarks led me toward this path of the achievement. Her support
in my achievement is always immense.
I am very indebted to my late parents, mother Til Kumari Baniya and Father Udaya Bahadur
Baniya, who were much interested to see my PhD in their life time. They were the crux of

IV
my encouragement and achievement. I wish to offer sincere thanks to my elder brothers Mr.
Dasharath Baniya and Bhagirath Baniya from whom; I received positive and supportive
inspiration that led me to materialize my goal.
At last, my colleagues, Chuong (Vietnam), Ida Asranti (Indonesia) who helped in one way or
the other while working together in institute. I thank them from core of my heart..
Finally, I am grateful to the members and staff of Institute of horticulture, Lentzaalee 75 for
their timely cooperation.
N. Baniya Institute of Horticutural Scienc Faculty of Agriculture and Horticulture Humboldt University zu Berlin Berlin Germany Berlin, July 2008

V
ABSTRACT
Kathmandu is a valley situated in hilly area of central Nepal. It has high population density
and ever increasing food demand. Land capabilities and cultivation potential seems
diminishing. This could results negative consequences to environment and livelihood of
Kathmandu dwellers as well. Therefore, research hypothesized that, if land suitability
evaluation in wider range is performed, production potential and production of the land
would be revitalized. Multi-criteria land suitability evaluation of Kathmandu valley for
vegetable crop is felt necessary for the sustainable land use and better vegetable production.
So, a main objective of this study is to classify available agricultural land area of Kathmandu
valley into different suitable classes for vegetable crop cultivation. Field level information
has been gathering through different possible sources. Main spatial and non spatial data were
obtained through field work, literature review, expert opinions, interviews of local farmers,
professional agencies and other information from the local authorities. Blending up of
bottom-up and Top-down approach for decision making process results very positively.
Methodology follows the guidelines prepared by FAO (1976) and later version. Considering
environmental condition, social parameters and economic indicators are subjected to basic
data sources analysis because of the unique social and economic status in Kathmandu valley.
This is an approach for site specific modification of the FAO guideline (1976). Analytical
part begins with development of Land information System (LIS), which is computer aided
GIS based data management. Built up area and non-agriculture were omitted from the
analysis. Suitability evaluation was carried out in two different phases, namely 1) Physical
land suitability evaluation and 2) Socio-economic-infrastructural land evaluation. From the
GIS data, Kathmandu valley still shows the area of 23519ha of potential land for agricultural
of which only 1.33 percent land is unsuitable. Currently no land units are highly suitable
(S1) and 31 percent and 66 percent area are falls in the category of S2 and S3 respectively. If
land condition is improved and updated from current physical suitability with appropriate
management input, potential land suitability will be achieved. So, 17.3 percent, 38.6 percent
and 42.6 percent area computed as potentiality suitability class of S1, S2 and S3
respectively. Each land mapping unit is bases for the suitability analysis which collectively
makes the overlaying thematic maps in GIS tool. Result from the physical land suitability
subject to make combined with socioeconomic land suitability evaluation. Together research
identifies 15 challenging sub-criteria from three main criteria. This is the fundamental aspect

VI
of multi-criteria land suitability evaluation where economic and social dimension is
incorporated into GIS technical tool. For ranking and important judgment of the sub-criteria,
pair-wise comparison using AHP process was carried out. The total out put is portrayed in
the thematic map of the Kathmandu valley. In this case physical land evaluation includes
parameter that satisfy requirement of the vegetable crops and multi-criteria analysis
evaluated social and economic indicators of Kathmandu valley. Final result of the multi-
criteria land suitability evaluation of Kathmandu valley show that more than 90 percent land
area can hold good vegetable cultivation. Together they can meet little above 70 percent
demand of the Kathmandu valley. So, result of this study hast to communicate to farmers to
make full use of land potential for the development of vegetable cultivation.
Furthermore, LIS prepared in this research could lead to make analysis for other agricultural
crops in Kathmandu. At the same time, this model can also be expanded in other parts of
country for better land management purpose. From the result, multi-criteria Land suitability
evaluation with the use of GIS and AHP is appropriate methodology in the countries like
Nepal. However in Nepal, availability of the up-to-date data information is problem that
cause building the LIS database is difficult task. Therefore it is recommended from the
research to set a panel for gathering and updating reliable and consistent data, both spatial
and attribute data. It is also concluded that besides, governmental organisation, INGOs and
NGOs involved in this field needs to contribute on managing information and data and also
the software systems.

VII
ZUSAMMENFASSUNG
Kathmandu befindet sich in einem Tal in der Gebirgsregion Zentral-Nepals. Bedingt durch
die hohe Bevölkerungsdichte gibt es eine steigende Nachfrage nach Lebensmitteln. Die
Ressourcen des Landes und der potenzielle Ertrag scheinen demgegenüber aber
abzunehmen. Ein Resultat sind negative Auswirkungen auf die Umwelt und die
Existenzgrundlage der Bewohner dieser Region. Aus diesem Grund ist die Hypothese dieser
Arbeit, dass durch eine großmaßstäbige Untersuchung der Bodenbeschaffenheit das
Produktionspotenzial und damit die Produktion des Landes erhöht werden kann. Eine
Evaluation nach entscheidungstheoretischen Ansätzen des Kathmandu-Tals im Hinblick auf
den Gemüseanbau erscheint unter dem Aspekt einer nachhaltigen Landnutzung und einer
erhöhten Gemüseproduktion notwendig. So ist ein entscheidender Ansatz dieser Arbeit, die
verfügbaren Anbauflächen im Kathmandu-Tal in verschiedene Eignungsklassen für den
Gemüseanbau zu klassifizieren. Informationen über Zustand und Wert der Anbauflächen
wurden aus verschiedensten möglichen Quellen zusammengestellt. Grundsätzliche räumliche
und nicht-räumliche Daten wurden durch eigene Erhebungen, Literaturrecherche,
Expertenmeinungen, Interviews lokaler Bauern, professionellen Beratungsunternehmen und
anderer Informationen der lokalen Behörden erfasst. Durch die Mischung eines ”bottom-up”
bzw. “top-down” Ansatzes für den Entscheidungsfindungsprozess wurden positive Resultate
erzielt. Die Methode folgte den Vorgaben der FAO (1976) und den nachfolgenden
Fassungen. Unter Berücksichtigung der einzigartigen sozialen und ökonomischen
Bedingungen im Kathmandu-Tal beziehen sich der Zustand der Umwelt, die sozialen
Parametern und ökonomischen Indikatoren die Untersuchung auf Basisdaten der Region.
Der Anspruch ist eine Modifikation der FAO Richlinie (1976). Der analytische Teil beginnt
mit der Entwicklung eines Landesinformationssystems (LIS), einem coputergestütztens,
GIS-basierten System. Bebaute und nicht agrarisch genutzte Gebiete wurden bei der
Untersuchung ausgelassen. Die Evaluation der Beschaffenheit wurde in zwei Phasen
durchgeführt, namentlich 1) einer Betrachtung der Bodenfruchtbarkeit 2) einer Evaulation
der Sozio-ökonomischen Infrastruktur. Nach einer GIS-Analyse existieren im Kathmandu-
Tal eine Fläche von 23.519ha potenzielles Ackerland, von dem lediglich 1.33% nicht
nutzbar sind. Gegenwertig ist keine Region im hohen Maße fruchtbar (S1) und 31% bzw.
66% der Region fallen in die Kategorien S2 respektive S3. Eine potenzielle hohe
Bodenfruchtbarkeit kann dadurch erreicht werden, wenn der Bodenzustand durch geeignete
Mittel verbessert werden kann. Unter diesem Gesichtspunkt konnten 17.3%, 38.6% bzw.

VIII
42.6% des Gebiets mit Hilfe geostatistischer Analysen potenziell den Bodenklassen S1, S2
und S3 zugeordnet werden. Jeder einzelne thematische Layer war Basis für eine
Fruchtbarkeitsanalyse mittels einer räumlichen Überdechung mit Hilfe verschiedener GIS-
Werkzeuge. Die Ergebnisse dieser Analyse wurden weiterhin mit den Ergebnissen der sozio-
ökonomischen Evaulation kombiniert. Zusammengenommen förderten die Ergebnisse 15
Unter-Kriterien von 3 Hauptkriterien zu Tage. Dies ist ein fundamentaler Aspekt einer
entscheidungstheorethischen Fruchtbarkeitsanalyse in die mit Hilfe eines GIS-Werkzeugs
ökonomische und soziale Dimensionen einfließen. Für die Abfolge und einer Einschätzung
der Gewichtung der Unter-Kriterien wurde ein paarweiser vergleich mittels eines AHP-
Prozesses ausgearbeitet. Als Endergebnis wurde eine thematische Karte des Kathmandu-Tals
erstellt. In diesem Fall kamen für die Analyse der Bodenfruchtbarkeit Parameter zum
Einsatz, welche den Anspüchen der Gemüsepflanzen entsprechen. Die
entscheidungstheoretische Analyse der sozialen und ökonomischen Parameter orientierte
sich an den Indikatoren im Kathmandu-Tal. Die endgültigen Ergebnisse dieser Analyse
zeigt, dass 90% des Anbaugebietes im Kathmandu-Tal gut für den Gemüseanbau geeignet
sein können und damit etwa mehr als 70% des Bedarfs der Region decken können.
Weiterhin kann das entwickelte LIS zur Analyse anderer kulturan herangezogen und auch in
anderen Regionen Nepals für ein besseres Ertragsmanagement benutzt werden.
Zusammenfassend lässt sich sagen, dass die Entscheidungstheorie unter der Benutzung von
GIS und AHP eine probate Methode für Länder wie Nepal darstellen. Lediglich die
Bereitstellung und Verfügbarkeit aktueller Daten zum Aufbau eines LIS stellt ein Problem
dar. Eine Voraussetzung ist daher die Schaffung einer Plattform zur aktuellen Verfügbarkeit
dieser Daten, sowohl räumlicher als auch Sachdaten. Es sollte weiterhin neben den
Regierungsorganisationen verschiedene INGOs und NGOs aus diesen Bereichen
eingebunden werden, um eine funktionierendes Informationens-, Daten- und auch Software-
System aufzubauen.

IX
CONTENTS Dedication ... .... ... I I
Acknowledgement ... .... ... III
Abstract ... .... ... V
Zusammenfassung ... .... ... VII
List of abbreviations ... .... ... XIII
1. Introduction ... .... .... 1 - 8
1.1 General background ... .... ... 1
1.2 Problem statement ... .... ... 5
1.3 Organisation of thesis ... .... ... 7
2. Literature Review ... .... ... 9 - 42
2.1 Land resources ... .... ... 9
2.1.1 Definition ... .... ... 9
2.1.2 Land use and land tenure ... .... ... 11
2.1.3 Farming systems for vegetables ... .... ... 14
2.1.4 Vegetable production in hilly areas in the subtropics 16
2.1.5 Land qualities and land characteristics ... .... ... 18
2.1.6 Land mapping units ... .... ... 19
2.1.7 Land sustainability ... .... ... 20
2.1.8 Concepts of land suitability evaluation ... .... ... 20
2.1.9 New trends of land suitability evaluation ... .... ... 30
2.1.9.1 Qualitative to quantitative land evaluation ... .... ... 30
2.1.9.2 Multi-disciplinary land evaluation ... .... ... 30
2.1.9.3 Land suitability assessment approaches ... .... ... 31
2.2 GIS Application for land suitability evaluation ... .... ... 32
2.3 Multi-criteria evaluation for land suitability ... .... ... 37
2.4 Land evaluation process in Kathmandu, Nepal ... .... ... 39
3. Aim of Research ... .... ... 43 - 45
3.1 Hypothesis ... .... ... 43
3.2 Objectives ... .... ... 43
3.3 Rational of the study ... .... ... 44

X
3.4 Research questions ... .... ... 45
4. Materials and Methods ... .... ... 46 – 65
4.1 Data sources and collection ... .... ... 46
4.2 Methods of land suitability evaluation ... .... ... 49
4.2.1 GIS application ... .... ... 49
4.2.2 Criteria for physical suitability evaluation ... .... ... 50
4.2.3 Selection of promising vegetable crops ... .... ... 53
4.3 Social-economic and environmental suitability evaluation... .... ... 56
4.4 Analytical hierarchy process (AHP) ... .... ... 58
5. Description of the Study Area ... .... ... 66 - 101
5.1 Outline of physiography of Nepal ... .... ... 66
5.2 An overview of Nepalese agriculture ... .... ... 69
5.2.1 Characteristics of agricultural holdings and holders... ... 70
5.2.2 Land fragmentation in Nepal ... .... ... 72
5.2.3 Land holdings ... .... ... 73
5.2.4 Cultivation system ... .... ... 74
5.2.5 Agricultural systems in Kathmandu valleys ... .... ... 76
5.3 Features of Kathmandu valley ... .... ... 77
5.3.1 Regional geology ... .... ... 79
5.3.2 Climate ... .... ... 82
5.3.3 Water resources ... .... ... 87
5.4 Forest vegetation and biodiversity ... .... ... 90
5.5 Erosion level ... .... ... 92
5.6 Vegetable markets ... .... ... 92
5.7 Demography and socio-economy ... .... ... 96
5.7.1 Demography ... .... ... 96
5.7.2 Socio-economic condition ... .... ... 98

XI
6. Data Analysis and Results ... .... ... 102 - 135
6.1 Land use in Kathmandu valley ... .... ... 102
6.1.1 Land characteristics ... .... ... 102
6.1.1.1 Soil Groups ... .... ... 103
6.1.1.2 Physical soil characteristics ... .... ... 106
6.1.1.3 Chemical soil characteristics ... .... ... 110
6.1.1.4 Land characteristics ... .... ... 111
6.1.2 Changes in land use and land use categories ... .... ... 114
6.1.2.1 Land use category ... .... ... 114
6.1.2.2 Changes in land use pattern ... .... ... 116
6.1.3 Agricultural practices in Kathmandu valley ... .... ... 120
6.1.3.1 Agricultural land holding ... .... ... 120
6.1.3.2 Horticultural practices ... .... ... 122
6.1.3.3 Considerations of traditional vegetable farming ... ... 124
6.1.4 Stakeholder analysis for land evaluation ... .... ... 132
6.1.5 Discussion 134
6.2 Land Resources Inventory and Land Mapping Units ... .... ... 136 - 153
6.2.1 Land information system (LIS) databases ... .... ... 136
6.2.2 Generation of land mapping units and thematic maps .... ... 140
6.2.3 Resource potential of land unit ... .... ... 143
6.2.4 Discussion 152
6.3 Result of Land suitability analysis ... .... ... 154 - 184
6.3.1 Evaluation of natural land resource ... .... ... 154
6.3.1.1 Physical suitability ... .... ... 156
6.3.1.2 Natural and socio-economic suitability ... .... ... 168
6.3.2 Selection of criteria for land suitability evaluation ... .... ... 169
6.3.3 Comparison of criteria for multi-criteria suitability ... .... ... 171
6.3.4 Discussion ... .... ... 182

XII
7. General Discussion ... .... ... 184 - 196
8. Conclusion and Recommendations ... .... ... 197 -199
9. References ... .... ... 198 – 210
List of Tables ... .... ... 211 - 212
List of Figures ... .... ... 213 - 214
List of Appendix ... .... ... 215

XIII
LIST OF ABBREVIATIONS
% : Percentage
< : Less than
= : Equals to
> : Greater than ° : Degree
°C : Degree Celsius
°N : Degree north
AEZ : Agro-Ecological Zones ()
AHP : Analytical Hierarchy Process
APP : Agricultural Perspective Plan
CBS : Central Bureau of Statistics
CDRC : Coefficient of Domestic Resource Cost
CEC : Cation Exchange Capacity
CI : Consistency Index
CR : Consistency Ratio
CRA : Capital Resources Accessibility
DHM : Department of Hydrology and Meteorology
e.g. : exempli gratia (for example)
ESRI : Environmental Systems Research Institute
et al. : et alia (and others)
ET : Evapotranspiration
etc. : et cetera (and so on)
FAO : Food and Agricultural Organisation of United Nations
FCC : fertility capability classification
GDP : Gross Domestic Product
GIS : Geographic Information Systems
GON : Government of Nepal
GPS : Global Positioning System
ha : hectare(s)
HDI : Human Development Index
HMG : His Majesty of Government of Nepal
i.e. : id est (that is)

XIV
ICIMOD : International Centre for Integrated Mountain Development
IPNM : Integrated plant nutrient management
ITC : International Institute for Aerospace Survey and Earth Science
IUC : World Conservation Union
K2O : Available Potassium
Kg : Kilogram
Km : kilometer
km2 : square kilometre
KU : Kathmandu University
KV : Kathmandu Valley
KVTDC : Kathmandu Valley Town Development Committee
LC : Land Characteristic(s)
LE : Land Evaluation
LIS : Land Information System
LMU : Land Mapping Units
LQ : Land Quality(s)
LRMP : Land Resources Mapping Project
LSA : Land Suitability Analysis
LUT : Land Utilization Type(s)
M : meter
m2 : square meter
MCDA : Multi Criteria Decision Analysis on computer
MCE : Multi Criteria Evaluation
mm : millimetre
MoA : Ministry of Agriculture of Nepal
MoPE : Ministry of Population and Environment of Nepal
MPFS : Master Plan of Forestry Sector
N : Non-suitability
N% : Total Nitrogen
N1 : Currently not suitable
N2 : Permanently not suitable
NARC : Nepal Agriculture Research Council
NEPAP : Nepal Environmental Policy and Action Plan
NGO : Non-Governmental Organisation

XV
NPC : National Planning Commission
NPK : Nitrogen, Phosphorus and Potassium
NRI : National Research Institute
NRs : Nepalese Rupees
NSDI : National Spatial Database Infrastructure
OM : Organic Matter
P2O : Phosphorus availability
pH : Soil reaction
PRA : Participatory Rural Approach
R/C : Ratio of cost revenue
RI : Random Index
RS : Remote Sensing
S1 : High Suitability
S2 : Medium Suitability
S3 : Low Suitability
SOTER : Global and National Soils and Terrain Digital Databases (SOTER)
SWOT : Strength, Weakness, Opportunity and Threaten
T.U. : Tribhuvan University
UMP : Urban management Plan
UNESCO : United Nations Educational, Scientific and Cultural Organization
US$ : The United States Dollar
USDA : United States Department Agriculture
USAID : United States Agency for International Development
UTM : Universal Transverse Mercator
VDC : Village Development Committee
VDD : Vegetable Development Division
VFS : Vegetable farming system
WHC : Water Holding Capacity
WRB : World Reference Base Soil Resource

1
1 INTRODUCTION Agriculture is one of the world’s most important activities supporting human life. From the
beginning of the civilization man has used the land resources to satisfy his needs. The land
resources regeneration is very slow while the population growth is very fast, leading to an
unbalance. On a global scale, agriculture has the proven potential to increase food supplies
faster than the growth of the population (Davidson, 1992). Lack of wise and suitable
agricultural practices results the degradation of natural habitats, ecosystems and
agricultural lands round the globe. Therefore concept of land suitability evaluation was
evolved. Land suitability evaluation is the process of determining the fitness of a given tract
of land for a defined use (Marsh. and MacAulay, 2002).Land system analysis through
improved methodology of land suitability evaluation is the main aim of present research
undertaken in Kathmandu Valley of Nepal.
1.1 General background
In order to determine the most desirable direction for future development, the suitability for
various land uses should be carefully studied with the aim of directing growth to the most
appropriate sites. Establishing appropriate suitability factors is the construction of suitability
analysis. Careful planning of the use of land resources is based on land evaluation, which is
the process of assessing the suitability of land for alternative land uses (Fresco et al, 1994).
Information on land resources is a key to their careful and effective evaluation.
Land comprises the physical environment, including climate, relief, soils, hydrology and
vegetation which, to the extent influence potential for land use (FAO, 1976). From the
beginning of the civilization human being has used land resources to satisfy their needs. So
agriculture is the very first occupation of the civilized man. Now a days agriculture became
one of the good profession which has given the name as commercial agriculture, precision
agriculture, etc. and sustainable agriculture as being the part of it.
Rapidly increasing populations in developing countries in recent years caused to increase the
demand for food and fuel (FAO, 1986) from agricultural. Fresco et al., (1994) predicted that
after 2000, population increases and income growth will increase the demand for food and
other agricultural products by over 3% annually. The regeneration rate of land resources is
very slow. It is not able to cope up with the ever increasing population growth; hence this
situation leads to the alteration in the balanced relationship. The land is either over used or

2
under used without considering its potential and constraints. This consequence brings a set of
different problems like under production, land degradation, land use conflicts, etc.
Population of the planet is growing dramatically farming community has to produce more
production in order to meet the growing demand of growing population. Under present
situations, where the land is one of the limiting factors, apparently it is impossible to bring
more area under cultivation therefore farming community should tackle this challenge
through more production from available land with intensive input. It is therefore, careful
evaluation of land would help mitigate production challenge.
Land evaluation has traditionally been based primarily on soil resource inventories,
commonly called soil surveys. Land evaluation is concerned with the assessment of land
performance when used for specified purposes. It involves the execution and interpretation
of basic surveys of climate, soils, vegetation and other aspects of land in terms of the
requirements of alternative forms of land use. Land evaluation is concerned with the
assessment of land performance when used for specified purposes. Land evaluation is also
part of the process of land use planning. The main objective of the land evaluation is the
prediction of the inherent capacity of a land unit to support a specific land use for a long
period of time without deterioration, in order to minimize the socio-economic and
environmental costs (de la Rosa 2000). Finding suitable land area for demanding
agriculture crops is the need of present day farming system.
Farming systems involve a complex combination of inputs, managed by farm households but
influenced by environmental, political, economic, institutional and social factors. Farming
system corresponds closely with the land use planning. The main idea is the suitability
assessment of different land uses for a given location. These were then subdivided into
guidelines for rain feed agriculture in 1983, forestry in 1984, irrigated agriculture in 1985,
and extensive grazing in 1991 (FAO 1995), however suitability assessment framework for
the mountainous area with rough and undulating topography is still lacking. Nepal being one
of the same areas, it is required to develop an intuitive model for suitability evaluation.
The suitability is a function of crop requirements and land characteristics. 'Suitability is a
measure of how well the qualities of land unit match the requirements of a particular form of
land use' (FAO 1976). In brief, “what is to grow where?” Besides the land/soil
characteristics socio-economic, market and infrastructure characteristics are some other

3
driving forces that can influence the land selection eg. environment. Therefore, land
suitability analysis is an interdisciplinary approach that includes the information from
different sources like ecology, soil science, crop science, meteorology, social science,
economics and management. It is also equally necessary to incorporate the expert knowledge
at various levels of decision making. Land suitability is the fitness of a given type of land for
a defined use. The land can be considered well supportive to specific crops in either present
condition or after necessary improvements. The process of land suitability classification is
the appraisal and grouping of specific areas of land in terms of their suitability for defined
uses (FAO, 1976, bulletin 32). The results of land suitability are a set of land suitability
classes for crops grown on different land units with specified level of inputs
The FAO has also started to classify Agro-Ecological Zones (AEZ) in order to develop an
overview of production potentials. it characterized tracts of land by quantified information
on climate, soils and other physical factors, which are used to predict the potential
productivity for various crops according to their specific environmental and management
needs. Agro-ecological zones are defined, which have similar combinations of climate and
soil characteristics, and similar physical potentials for agricultural production, as part of
FAO procedures (FAO 1995).
Nepal is predominantly an agricultural country with over half of its gross domestic product
originating in agriculture, and more than 80% of its labor force engaged in the sector. It is
obvious that agriculture must play a dominant role in the country's development, mainly
through the creation of employment for the expanding labor force and by increasing labor's
productivity. Farm families, generally, derive a precarious living from crop and livestock
productions, often of inferior quality, on smallholdings. Physiography, agroecological
zonation and climatic variation provide numerous potential for agricultural expansion in the
country. Vegetable is one of the sectors in Nepalese agriculture which is supposed to make
best use of available land, all form of labour force round the year, lower down poverty
through nutritional supplements and upgrade living standard generating income. Therefore
it is recognized by the Eighth Five Year Plan of Nepal, vegetable cultivation can contribute
towards meeting most of the development objectives (NPC, 1992). Vegetable production is
an important component of agriculture and also an essential part of a balanced human diet. In
recent years, vegetable production has also become an income generating enterprise for
those farmers who are located close to markets and road sides (Budathoki, 2002). Vegetable

4
farming is increasing in Nepal as it has more economic returns than growing other crops,
especially in the areas that have easy access to market. Vegetable farming demands intensive
care and balanced nutrients input.
The diverse topographic features and climatic conditions in Nepal permit the successful
production of a large number of vegetables. About 250 vegetable crops are grown in Nepal,
of which more than 50 are common (Pun 1987). There is extremely limited scope for the
expansion of cultivated land and almost impossible to expand anymore. Haphazard
cultivation without considering land capability is further deteriorating productivity. The
urbanization and wrong land use and unorganized market system in recent years has resulted
in degraded scenario of agricultural output. Similar problem is transforming Kathmandu
valley from a vegetable surplus valley into a vegetable deficit area (Budhathiki 2002).
Therefore it is very essential to make wise assessment of the land suitability evaluation for
the Kathmandu valley for the cultivation so that land capacity and crop need would be
matched. This help preventing land degradation and further generate maximum possible
production with minimum input cost. It is further lead towards sound and sustainable
cultivation practices.
Vegetable farming is popular in peri-urban areas of Nepal as it has reasonable economic
returns than growing other cereal crops. Vegetables are more profitable so, farmers allocate
more resources including organic manure for its cultivation especially in the areas that have
easy access to market. Vegetable farming needs balanced care of land and crops so, farmers
very often cultivate vegetables near the residence. In general, using more organic manure in
vegetable farms means making an amount of organic manure less available for non-
vegetable farms, unless alternative arrangements for producing more quantity and quality
organic manure are made. There is a risk that the soil fertility of non-vegetable farms
belonging to the households growing vegetables for a long period of time may have
deteriorated due to low use of organic manure. It is also possible that farmers might have
used some other croping mechanisms but adequate information was not available to support
this argument.

5
1.2 Problems Statement
A number of studies proved that increasing population and enhancing urbanization processes
are converting softer green spaces into impermeable hard concrete surfaces. This trend is
more serious particularly in a developing country (Shi 2002). Urban extension in Kathmandu
valley is as example of this kind.
Nepal lies in the Hindukush mountain range of the Asia. Mountainous regions are at serious
disadvantage when compared to flatter areas because of higher input costs for agriculture
activities. One of the topographically induced main threats is erosion hazards. The effects of
erosion in steep sloping mountainous areas on the degradation of the environment are widely
known (ICIMOD 1999, Sherestha 2000). FAO guidelines for the land evaluation had
developed for all types of land but not yet for mountainous areas which is one of the
setbacks for the land areas like Kathmandu valley.
Kathmandu is the capital of Nepal. Encroachment of land areas here, for off farm use is
increasing in a tremendous pace since a decade. Problem is not only limited to encroachment
of the agricultural land area, is also diminishing productivity and production potential due to
insufficient input owing to its higher cost. Degradation of land resources further effects on
the rural livelihood, which might results into migration of the rural population towards urban
centers. This result in shortage of labour supplies, especially during periods of field
preparation and harvesting, and contrarily increase rate of unemployment in urban areas.
There has been a dramatic change in land use composition of Valley in the periods 1984-
1994 and 1994-2000. During these periods, agricultural land shrank from 64% to 52%, and
further to less than 42% respectively. Agricultural land has been decreasing annually by
7.4%. Meanwhile, non-agricultural land has increased from 5.6% to 14.5% to 28% in the
Valley during the same periods. (KVTDC, 2002; APO, 2002).
Present production is just enough to meet a quarter of total vegetable demand of Kathmandu
dwellers. This seems under production from available land resources (KFVMDB, 2007).
Although there is a lot of attraction of the farmers towards seasonal vegetable cultivation
however knowledge of farmers on the land capacity for sustainable output is still not
updated.

6
Selective land area within Kathmandu valley is being converted into settlement areas in
geometric ratio. Population growth rate of Kathmandu is 5.11% and two third of which is
contributed by influx of immigrants. This scenario seems to exert severe pressure on
available land resources offered for cultivation valley boundary. Assuming that the present
trend of urbanization continues, the total urban area will reach 34.3% of the Valley by the
end of 2020. As a result of urban expansion over agricultural land it is estimated to shrink
from 42.2% (2000) to just 14.5% during the same period (Shrestha, 2003; HMG/IUCN,
1995).
Core of the valley with fertile transported soil is getting rampant urbanizations. Slopping
hilly areas passes high erosion risk. Therefore it is necessary to identify the land capable of
supporting emerging horticulture development within the valley boundary and that is
supposed to be environmentally benign. And it is necessary to strictly protect agricultural
land in order to reduce the adverse environmental consequences. Further trade liberalization
by adjusting crop structures, choosing appropriate plants according to eco-physiological
zones and enhancing agricultural production will ameliorate the pressure to some extent.
Spontaneous exploitation of land resources, as it is occurring now, will result in an
impoverished soil (Ha & Pham, 2003). Each village should have selection of suitable crops
for each soil type thereby increasing the effectiveness of agriculture development programs.
Theoretically this will boost inhabitants' income, prevent erosion, land degradation, protect
living environment and social sustainability. There have been many studies on soil and land
management in hilly region of Kathmandu Valley. However, most of the research focuses on
investigating and establishing the agricultural soil map; analysing the situations of land using
and management in accordance with the land law and macroscopic criteria (Ho and Huynh,
2004); assessing land and analysing natural conditions for land use planning which restricted
in regional scale research and initial application of FAO assessment framework (Ha and
Pham, 2003). Moreover, all of the studies are independently and sporadically conducted and
lack information at community level. A new research approach in land suitability evaluation
is needed from farmer’s perspective and influence to make decision for the cultivation of the
specific type of the crops in field. For this a complete blending of the “top-down” and
“bottom-up” approaches for the selection of land area is a more realistic assessment at the
village level. Land suitability evaluation always done considering the principles of
sustainability of land resources.

7
1.3 Organisation of the thesis
Chapter 1 outlines introduction and offers basic foundations to comprehend the research.
The study has been carried out in the Kathmandu valley, so general description of the study
area with regard to broad Nepalese scenario is presented in chapter 5.
A conceptual framework and literatures review on aspect related to land suitability analysis
are organized in chapter 2. This chapter aims to evaluate methodological approaches, taking
limitation and potentiality of the land use planning into consideration. Chapter also gathering
information abut agronomical need of the vegetables to be studied. Linking agronomical
requirement with land potential is the crux of the study.
Setting of the hypothesis and putting objective forward for the research was systematically
presented in chapter 3. Research questions putting in this chapter is the basis of
investigations. In chapter 4, research methods and techniques involved on research work are
presented.
Result of land resource inventory will be presented. Data sources and background of the
descriptive analysis is discussed in the chapter 6, where the physical, environmental, socio-
economic and infrastructure attributes are reviewed with application of adopted
methodologies. In this chapter key soil properties of the study area in relation with the
topographic factors and land use or potential use are presented .Chapter 6.2 is dealing with
Multi-criteria land suitability analysis procedure for the present study area. Generation of
LIS database is present in this chapter. Role of GIS has been discussed up to the desired
detail which is incorporated with AHP methods.
In sub-chapters of 6 results of the research are discussed within the existing frame work and
comparison and relationship with available literature is discussed. Difficulties and challenges
to implement out come of this research are also discussed. The suitability maps will show the
limitation factors of suitability level for each evaluated land unit will be validated with
existing references.

8
Discussions over multi-criteria analysis where non attribute values are incorporated into
spatial pattern are mentioned in sub section of chapter 6.3. Comparative discussion over the
results obtained in research is presented in chapter 7. Chapter 8 offers conclusion and
recommendation to the stakeholders. This chapter also offers some of the reasonable
recommendation to the farmers as well as for policy makers.
Further chapters will covers mandatory parts like References, Appendix, etc.

9
2 LITERATURE REVIEW Research works relevant to the agricultural land suitability is explored. This chapter made
the compilation of the works carried out by researchers in different parts of the globe. It is
very important part of the research work to make comparative assessment of the related
work done in following chapters. It gives logical explanation to make conclusion through the
appropriate discussion over the defined theme. Excerpts of the reviewed literature relevant
to the present research work have been systematically cited. Moreover this chapter aims at
presenting results of various works to readers to have clear picture over research theme and
understand in wider dimension.
In Nepalese perspectives, land is the important property and is potential economic resources
where all the development activities are concentrated. Economy of Nepal is predominantly
based on agriculture and majority of population depends on agricultural occupation.
Therefore, it requires to carry long term scientific land use planning and to implement for the
balanced, multi-dimensional and sustainable development of the country on the basis of
physical features, composition, quantity and capability of the land (Oli, 2001).
2.1 Land resources
2.1.1 Definition
FAO (1993) defined land is an area of the earth’s surface, including all elements of the
physical and biological environment that influences land use. Land comprises the physical
environment including climate, relief, soils, hydrology and vegetation, to the extent that
these influence potential for land use (FAO, 1976). Indeed, land is an essential natural
resource, both for the survival and prosperity of humanity, and for the maintenance of all
terrestrial ecosystems. Over millennia, people have become progressively more expert in
exploiting land resources for their own ends. The limits on these resources are shown up
while human demands on land are very large (FAO, 1995).
Land has been defined in varieties of ways by different researchers and organisations
working in the field of agriculture and land reforms. It includes the results of past and
present human activities e.g., reclamation from the sea, vegetation clearance and also
adverse results, like soil salinization. Purely economic and social characteristics, however,
are not included in the concept of land; these form part of the economic and social context

10
(FAO, 1976; Dent and Young, 1981). Land is not the same everywhere; it is, self-evidently,
the other focus of land-use planning. Capital, labour, management skills and technology can
be moved to where they are needed, land can not be moved and different areas posses
different opportunities and also different management problems. Reliable information about
land resource is thus essential for the land use planning (FAO, 1993). As definition of land is
concerned, soil, climate, relief and hydrology, etc are incorporated as key words. Socio-
economic and demographic parameter are not taken as an integral part of the definition. Thus
it could say that land refers not only to soil but also landform, climate, hydrology, vegetation
and fauna, together with land improvements such as terraces and drainage works. An other
definition of land adapted by land degradation is that as a delineable area of the earth's
terrestrial surface, embracing all attributes of the biosphere above or below this surface,
including those of the near surface climate, the soil and terrain forms, the surface hydrology
including shallow lakes, rivers, marshes and swamps, the near-surface sedimentary layers
and associated groundwater and geo-hydrological reserves, the plant and animal populations,
the human settlement pattern and physical results of past and present human activity
(terracing, water storage or drainage structures, roads, buildings, etc.) (IDWG/LUP, 1994).
However FAO (1995) for the first time, put forward the complete definition of land
incorporating socio-economic aspects as well. Land resources consist of two main
categories:
1. Natural land resources without any effort made through human activities
2. Land resources created including the product of human activities such as dike and
plodders (Dent and Young, 1981)
At the same time basic functions performed by land to support of the human being and other
terrestrial ecosystems had numerically presented as follows (FAO, 1995):
Provision of biological habitats for plants, animals and micro-organisms and
provides physical space for settlements, industry and recreation;
A store of wealth for individuals, groups, or a community through production of
food, fiber, fuel or other biotic materials for human use;
Co-determinant in the global energy balance and the global hydrological cycle,
which provides both a source and a sink for greenhouse gases;
Storehouse of minerals and raw materials for human use with regulation of the
storage and flow of surface water and groundwater and buffer, filter or modifier
for chemical pollutants;

11
Storage and protection of evidence from the historical or pre-historical record
(fossils, evidence of past climates, archaeological remains, etc);
Concept of land is very vague and agricultural land is only a part of this pocket cultivation
and agricultural production activities are act to be carried out. In this piece the cultivation
and production process impact to land resources causes to change. Land and soil is two
completely different concepts, but sometime it is very confused when only concerning to the
agriculture activities. Land has a much broader meaning than soil and soil is indeed a part of
the land and soil quality is a subset of land quality (Kavetskiy et al, 2003). Suitability
fundamentally starts with soil and land use planning accepts the soil categorization for
specific purpose. In the process of land suitability evaluation and land use planning, these
concepts must be clearly distinguished.
Systematic vegetable production has barely been in existence for more than three decades in
Nepal. In the late 1950s local Asian varieties of mustard, pumpkin and raddish were seen in
and around the Kathmandu Valley. Then, with the establishment of the Vegetable
Development Division (VDD) in 1972, technical activities like indigenous and exotic
germplasm collection, variety testing and seed production were initiated. In the last 10 years
more serious attention has been given to identifying farmer’s problems, and using trials and
experiments in an attempt to solve them. More recently yield performance trials, and
agronomical, fertilizer and plant protection experiments for all important summer and winter
vegetables; have been conducted at all horticulture farms (NARC, 1988). Research on land
suitability assessment has been initiated in the name of identification of potential packet
areas for the different types of crops. They have been categorized into highly potential area,
medium potential area and low potential areas for specific crops. Such activities have to be
done manually using set of plant parameters and climatic background. Application of GIS
has later been started.
2.1.2 Land use and land tenure
Land use is characterized by the arrangements, activities and inputs people undertake in a
certain land cover type to produce, change or maintain it (Di Gregorio and Jansen, 1998;
FAO, 1997). It is a series of operations on land, carried out by man, with the intention to
obtain products and/or benefits through using land resources. According to Huizing et.al.
(1995) land use can lead to the positive or negative impacts on land cover because land use

12
is the human activities of natural environment (as defined by Di Dregorio and Janse, 1998
and FAO a report).
In Nepal, land use refers to the major classification of the use of the different parcels of land
in the holdings. All land operated by agricultural holdings are classified as either agricultural
land or non-agricultural land. The total numbers of all agricultural holdings in the country
has been increasing (CBS 2005). On the other hand, non-agricultural land are those lands
which are part of the holdings comprise woodland or forest (not commercial) and all other
land, unused and undeveloped but potentially productive land and all other land in the
holding not elsewhere classified including the home of the holder.
In definition of land use, it establishes a direct link between land cover and the actions of
human being in their environment. The concept of land use is often considered a relatively
stable subject related mainly to the use to which the land, in a certain region at a certain time,
is put (Jamal, 2003). Land use is the result of a continuous field of tension created between
available resources and human needs and acted upon by human efforts (Vink, 1975). The
types of land use considered are limited to those, which appear to be relevant under general
physical, economic and social conditions prevailing in an area. These kinds of land use serve
as the subject of land evaluation. They may consist of major kinds of land use or land
utilization types (FAO, 1976). FAO (1993) also defined that land use is the management of
land to meet human needs including rural land use, for example, agriculture, forestry,
wildlife and also urban and industry land use, for example, city, towns, industrial zones, etc.
Land use and land management practices have a major impact on natural resources including
water, soil, fertility, plants and animals.
The land is owned by an individual, is said to be "hold" the land. Land tenure refers to
arrangements or rights under which the holder holds or uses land for particular purpose. A
holding may be operated under one or more tenure forms, with each parcel normally
operated under one tenure form (FAO, 1995). Many land tenure systems allow people to use
the same property for different purposes. In Nepal, land tenure refers to arrangements or
rights under which the holders holds or uses the land of the holding. Land owned but rented
out to other is not considered as part of the holding. In Nepal, while the average holding size
is small, most of the holdings are owned. The ownership of the holdings under one form of
tenure is estimated to be 2,939.6 thousand ha in 2001/02 (CBS 2006).

13
Leasing and renting are kinds of land tenure which is very essential for farmers. Land tenure
security exits when an individual perceives that she or he rights to a piece of land on a
continuous basis, free from imposition or interference from outside sources, as well as the
ability to reap the benefits of labour and capital invested in the land, whether in use or upon
transfer to another holders.
Nepalese agricultural economy still suffers from various infrastructural, institutional,
technological and agro-climatic constraints. The land tenure system is of rural type like
shared cropping which could not enhance the expected productivity. The overall national
policy environment may require further improvement to satisfy the needs of sustainable
agricultural development rational tenure systems. The land tenure system has resulted in
substantial improvements in land use efficiency and agricultural output growth.
The terms of the major kind of land use and land use type are frequently mentioned in the
farming system, land suitability evaluation and land use planning, very much. A major kind
of land use is a major subdivision of rural land use, such as rainfed agriculture, irrigated
agriculture, grassland, forestry, etc. Major kinds of land use are usually considered in land
evaluation studies of a qualitative or reconnaissance nature (FAO, 1976).
In land use classification the land utilization types (LUT) are not a categorical level but refer
to any defined use below the level of the major kind of land use. It consists of a set of
technical specifications in a given physical, economic and social setting for specific plant or
crop patterns. This may be the current environment or a future betting modified by major
land improvement, e.g. an irrigation and drainage scheme (FAO, 1976). A LUT is a kind of
land use described or defined in a degree of detail greater than that of a major kind of land
use (FAO, 1976). In detailed or quantitative land suitability evaluation studies, the kinds of
land use considered will usually consist of land utilization types. They are described with as
much detail and precision as the purpose requires. LUT has categorically presented by FAO
for land with specific facilities of input. In the context of irrigated agriculture, a land
utilization type refers to a crop, crop combination or cropping system with specified
irrigation and management methods in a defined technical and socio-economic setting. In the
context of rainfed agriculture, a land utilization type refers to a crop, crop combination or
cropping system with a specified technical and socio-economic setting. A forest land
14
utilization type consists of technical specifications in a given physical, economic and social
setting. Attributes of land utilization types in general include data or assumptions on (FAO,
1976) as:
Produce, including goods (e.g., crops, livestock timber), services (e.g.,
recreational facilities) or other benefits (e.g., wildlife conservation);
Market orientation, including whether towards subsistence or commercial
production;
Capital intensity;
Labour intensity;
Power sources;
Technical knowledge and attitudes of land users;
Technology employed;
Infrastructure requirements;
Size and configuration of land holdings;
Land tenure, the legal or customary manner in which rights to land are held, by
individuals or groups;
Income levels, expressed per capita, per unit of production or per unit area;
However during the land suitability evaluation process, not of all attributes above are equally
concerned, the selection of attributes and detailed description level depends on current land
use conditions of region as well as limitations, requirements and goals of different land
evaluation projects.
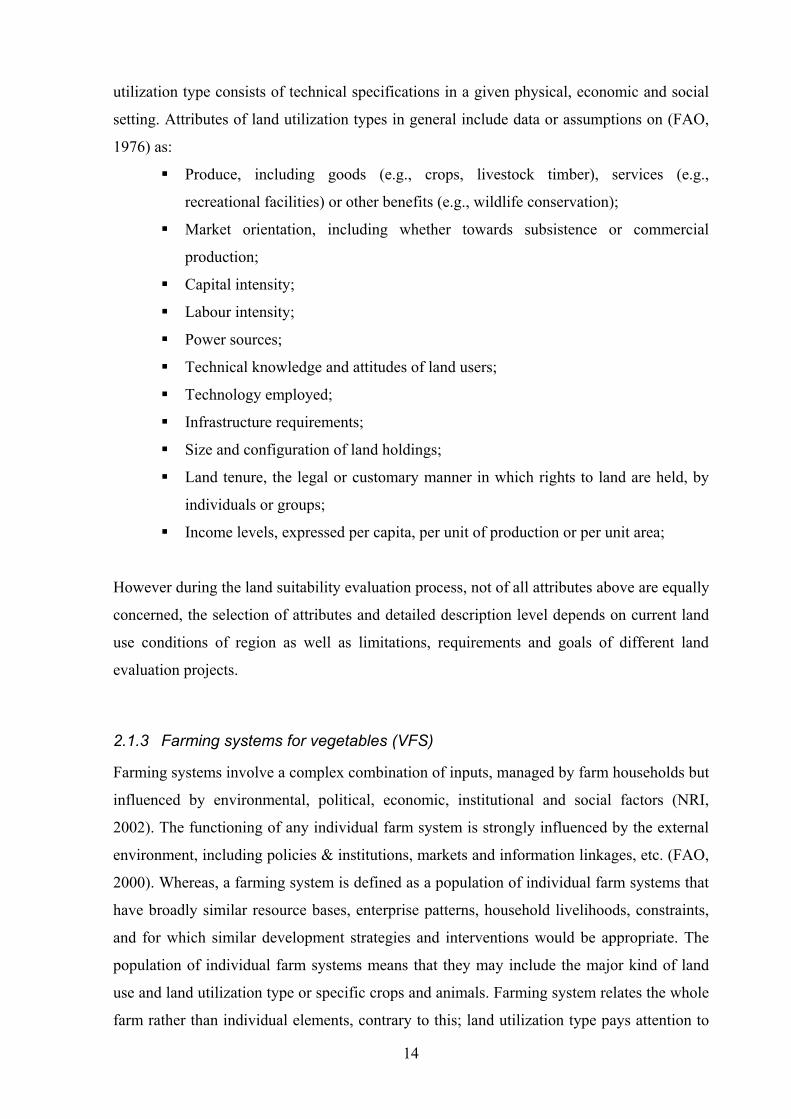
2.1.3 Farming systems for vegetables (VFS)
Farming systems involve a complex combination of inputs, managed by farm households but
influenced by environmental, political, economic, institutional and social factors (NRI,
2002). The functioning of any individual farm system is strongly influenced by the external
environment, including policies & institutions, markets and information linkages, etc. (FAO,
2000). Whereas, a farming system is defined as a population of individual farm systems that
have broadly similar resource bases, enterprise patterns, household livelihoods, constraints,
and for which similar development strategies and interventions would be appropriate. The
population of individual farm systems means that they may include the major kind of land
use and land utilization type or specific crops and animals. Farming system relates the whole
farm rather than individual elements, contrary to this; land utilization type pays attention to

15
the specific elements in farming system. Farming system is a complicated interwoven mesh
of soil, plants, animals, implements, workers, other inputs, and environmental influences
held together and manipulated by the farmers. There are several types of farming system as
introduced by Kavetskiy et.al. (2003) as
a. Intensive farming system
b. Extensive farming system
c. Traditional farming system
d. Conventional farming system
e. Integrated farming system
f. Organic farming system
Figure: 2.1 Relationship of Farming system
If vegetable farming is ecologically sound, economically viable, socially just, culturally
appropriate, long-term production, humane and based on a holistic scientific approach, it is
considered as sustainable vegetable farming (FAO, 2004). Sustainable vegetable farming
system is associated with good practices related to people cantered development, sustainable
livelihood, sound agro-ecological practices, sustainable forestry system, community based
natural resources management, participatory policy development, indigenous farming
system, fair labour condition, good agricultural practises, equitable access to water and
others.
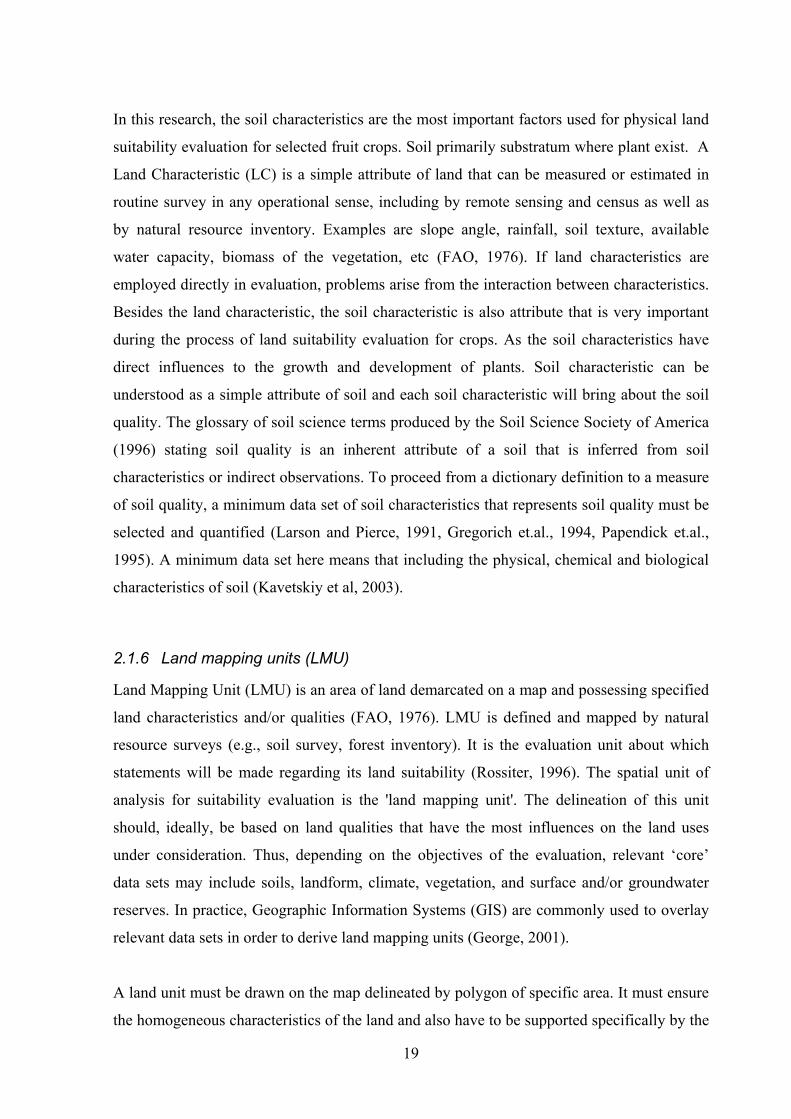
Vegetable production systems in Nepal vary in land form, farm size and intention of
cultivation. The production processes includes preparing seed for sowing, growing
transplant, transplanting, direct seeding, land preparation, field management practice,
cropping pattern and water management. The vegetable production in upland areas, declines
faster compared to the decreasing size of the cultivation areas. This is mainly due to (1)

16
decrease of quality seeds, (2) cultivation area expanded into the forest, (3) top soil erosion
decreasing land fertility and (4) land degradation caused by non-conservation agriculture
system, which adopt cultivation by land structure not by contour (Saptana, 2004).
Figure: 2.2 Land utilization type and vegetable cropping system in Kathmandu
2.1.4 Vegetable production in hilly areas in the subtropics
From the competitiveness point of view, most of the vegetable farming system (VFS)
activities have competitive and comparative advantages. The farming system of potatoes
and tomatoes has the highest competitiveness providing the application of multi culture
cropping pattern. However, the category with no competitiveness is VFS of headed cabbages
in Indonesia. This is explained by: (1) low market values of land for the cultivation, resulted
from price and policy distortion, depresses further the rental rate, (2) extensive usage of
chemical input, much higher than the recommended one, (3) high cost per unit; (4) low
productivity level and (5) limited farmers’ accessibility to the market prices (Arsanti, 2008).
Arsanti (2008) further conclude that the development of the VFS will be optimized, and
highly profitable with a competitive competence in all aspects especially in financial,
economic and sustainability providing the cultivation of potatoes by using multi culture
cropping pattern as the first priority and monoculture with the different crop along year or
fallow as a second priority.
Sub-tropics and Asian region has still not much developed method of farming system
involving multiple sources. In order to sustain the VFS in these regions, it might have many
difficulties facing regarding the natural conditions, socio-economic conditions, infrastructure
and the markets. Case studies from Vietnam, Nepal, Thailand and Malaysia (Jansen et al.,

17
1995) clearly establish the private profitability of peri-urban vegetable production but are
less specific about its communal benefits. On an average financial returns were greater than
for cereal production but also much more variable (FAO, 2004).
Among the horticultural sub-sectors, vegetable production increased at the fastest rate,
especially during the last decade. Although the growth in the vegetable sector in developing
countries was high, almost equal to the highest growing livestock sector in these countries,
expansion in this sector was exceptionally high in China, especially during 1995-2004.
Production growth in horticulture in developed countries was small during the overall
period, and was even negative for fruits in the later period. Most horticultural commodities
are commercially produced for the market (except from home-garden), which creates
substantial demand for marketing activities. In developing countries, the share of vegetable
area in the farming system remained stagnant over the period. Most of the developing
countries like Nepal are still adopting indigenous vegetable species which is constraints for
fast expansion of the horticulture industry.
The horticultural farming as an industry is responding to environmental challenges through a
number of mechanisms, including:
• Industry strategic planning;
• Adoption of management practice;
• Development and implementation of Codes of Practice;
• Research and development; and
• Interaction with State government groups.
Ecological requirements of crop
Land is always productive to specific crop with defined set of input, where selection of the
crop to be planted is made considering minimum input is applied. Better the suitability of
land less input is needed; where as less suitable land requires high input for production so
that output cost is affected heavily. In this case suitability does not address reasonably. Input
for the cropping is based on the agronomical and physiological need of specific crops.
Ecological requirements of crop are the needs of an individual crop or cultivar for an
appropriate development and yield. Plant growth requires a reasonable moisture and nutrient
supply, linked to a sufficient rooting depth and to a proper energy regime for photosynthesis
and biomass production (Verheye, 1996). FAO (1976) defined that the requirements of the

18
land utilization type or crop refer to the set of land qualities that determine the production
and management conditions of a kind of land use. Cropping system or cultivation system is
the cropping patterns used on a farm and their interaction with farm resources, other farm
enterprises, and available technology which determine their cultivation. The cropping system
is subsystem of a farming system (FAO, 1996) and is illustrated as figure 2.1 and 2.2.
Ecological requirements of crops are information source used for combining with the land
quality and characteristic to physical land suitability evaluation.
2.1.5 Land qualities (LQ) and land characteristics (LC)
A land quality (LQ) is relevant to a given type of land use if it influences either the level of
inputs required, or the magnitude of benefits obtained, or both. Land qualities may be
expressed in a positive or negative way (limiting factors). Examples are moisture
availability, erosion resistance, flooding hazard, nutritive value of pastures, accessibility, etc.
A Land quality is a complex attribute of land which acts in a distinct manner in its influence
on the suitability of land for a specific kind of use (Kavetskiy et.al., 2003). There are a very
large number of land qualities, but only those relevant to land use alternatives under
consideration need be determined. Land qualities can sometimes be estimated or measured
directly, but are frequently described by means of land characteristics. Besides the land
quality, for crop growing, the soil quality also is a vital factor to be concerned. Soil is indeed
a part of the land and soil quality a subset of land quality.
Soil quality examines how well a soil performs the functions of maintaining biodiversity and
productivity, partitioning water and solute flow, filtering and buffering, nutrient cycling, and
providing support for plants and other structures. United States Department of Agriculture
(USDA) Natural Resource Conservation Service adopted the definition of soil quality is “the
capacity of a specific kind of soil to function, within natural or managed ecosystem
boundaries, to sustain plant and animal productivity, maintain or enhance water and air
quality, and support human health and habitation”. One of the earliest definitions of soil
quality made by Larson and Pierce in 1991 (cited in Kavetskiy et al, 2003), soil quality is as
the state of existence of soil relative to a standard, or in terms of a degree of excellence.
Later, Gregorich et.al. (1994) definite that “soil quality is a composite measure of both a
soil’s ability to function and how well it functions relative to a specific use”. Management of
a soil has a major impact on soil quality.
19
In this research, the soil characteristics are the most important factors used for physical land
suitability evaluation for selected fruit crops. Soil primarily substratum where plant exist. A
Land Characteristic (LC) is a simple attribute of land that can be measured or estimated in
routine survey in any operational sense, including by remote sensing and census as well as
by natural resource inventory. Examples are slope angle, rainfall, soil texture, available
water capacity, biomass of the vegetation, etc (FAO, 1976). If land characteristics are
employed directly in evaluation, problems arise from the interaction between characteristics.
Besides the land characteristic, the soil characteristic is also attribute that is very important
during the process of land suitability evaluation for crops. As the soil characteristics have
direct influences to the growth and development of plants. Soil characteristic can be
understood as a simple attribute of soil and each soil characteristic will bring about the soil
quality. The glossary of soil science terms produced by the Soil Science Society of America
(1996) stating soil quality is an inherent attribute of a soil that is inferred from soil
characteristics or indirect observations. To proceed from a dictionary definition to a measure
of soil quality, a minimum data set of soil characteristics that represents soil quality must be
selected and quantified (Larson and Pierce, 1991, Gregorich et.al., 1994, Papendick et.al.,
1995). A minimum data set here means that including the physical, chemical and biological
characteristics of soil (Kavetskiy et al, 2003).
2.1.6 Land mapping units (LMU)
Land Mapping Unit (LMU) is an area of land demarcated on a map and possessing specified
land characteristics and/or qualities (FAO, 1976). LMU is defined and mapped by natural
resource surveys (e.g., soil survey, forest inventory). It is the evaluation unit about which
statements will be made regarding its land suitability (Rossiter, 1996). The spatial unit of
analysis for suitability evaluation is the 'land mapping unit'. The delineation of this unit
should, ideally, be based on land qualities that have the most influences on the land uses
under consideration. Thus, depending on the objectives of the evaluation, relevant ‘core’
data sets may include soils, landform, climate, vegetation, and surface and/or groundwater
reserves. In practice, Geographic Information Systems (GIS) are commonly used to overlay
relevant data sets in order to derive land mapping units (George, 2001).
A land unit must be drawn on the map delineated by polygon of specific area. It must ensure
the homogeneous characteristics of the land and also have to be supported specifically by the

20
description of attribute data. Land units must be determined by simple measures based on
features that are observed directly on the field or remote sensing or others.
2.1.7 Land Sustainability
Nowadays, sustainability is one of the important issues in land use system. Sachs (1992)
defined five dimensions of sustainability namely, economic, social, spatial, cultural and
ecological, which should be taken into consideration while dealing with land use. It is a
measure of the extent to which a form of land use is expected to meet the 'pillar'
requirements of productivity, security, protection, viability and acceptability into the future.
Sustainability is the ability of an agricultural system to meet evolving human needs without
destroying and, if possible, by improving the natural resource base on which it depends
(USAID, 1988). FAO briefly define sustainable land use as perfect balance between
production and conservation (FAO, 1993) and commonly use popular definition is use of
land which meets the needs of the present while at the same time conserving resources for
future generations (WCED, 1987).
FAO (1976) define land suitability as the fitness of land for a specified kind of use. In
general definition of sustainability indicates that there is a relationship between sustainability
and suitability, stability, land degradation, and land use. This suitability of land is a function
of crop requirements and soil/land characteristics and land suitability refers to use of land on
a sustainable basis. It means that land suitability evaluation should take account of the
hazards of soil erosion and other types of soil degradation (FAO, 1983). The sustainable land
use should have maximum suitability and minimum vulnerability (de la Rosa, 2000). Land
suitability is a component of sustainability evaluation of a land use.
2.1.8 Concepts of land suitability evaluation
According to FAO (1976) land evaluation (LE) is the assessment of land performance when
used for a specified purpose, involving the execution and interpretation of surveys and
studies of land forms, soils, vegetation, climate and other aspects of land in order to identify
and make a comparison of promising kinds of land use in terms applicable to the objectives
of the evaluation. Land suitability evaluation can also be defined as the assessment or
prediction of land quality for specific use. This process includes identification, selection and

21
description of land use types relevant to the area under consideration; mapping and
description of the different types of land that occur in the area and the assessment of the
suitability of the different types of land for the selected land use types (FAO, 1976). Rossiter
(1995) stated that the modern era of land evaluation began with the publication of the FAO
“Framework for Land Evaluation” (1976) and subsequent guidelines for land evaluation of
general kinds of land use (FAO, 1983; 1984; 1985; 1991).
Land suitability evaluation is the prerequisites for sustainable agricultural production. It
involves evaluation of the criteria ranging from soil, terrain to socio-economic, market and
infrastructure (Prakash, 2003). Land evaluation for ecological regions, territories aims at
creating a new good production power together with stability and sustainability (Jamal,
2003). Land suitability evaluation requires specialists of different disciplines like soil
scientists, agro-ecologists, socio-economists and planners. The evaluation relates to the
environmental and socio-economic conditions of the area as it includes a consideration of
inputs and projected outputs of production process.
This is the process of estimating the potential of land units for alternative kinds of use (Dent
and Young, 1981). Land suitability evaluation can also be defined as the assessment or
prediction of land quality for a specific use, in terms of its productivity, degradation hazards
and management requirements (Austin and Basinski, 1978). Abiotic, biotic, and socio-
economic factors decide the success of a crop. So the assessment regarding crop value
should include the abiotic, biotic and socio-economic factors that determine the profitability
(Prakash, 2003). Generally, land suitability evaluation is done for specific types of land use.
Land use may be defined either at a general level (such as rainfed arable cropping) or as a
particular crop at a specified level of inputs. The level of material inputs is defined in the
evaluation as are land improvements such as soil conservation or drainage and their overall
impact is taken into account in predicting crop yields or outputs. Recommended land uses
must not cause soil erosion but must conserve the land for long-term production; improving
the productivity of land use systems may involve introduction of new crops, changes in land
management or other innovations in the existing farming system (FAO, 1986).
Land suitability evaluation systems
The suitability of a given piece of land is its natural ability to support a specific purpose.
Suitability can be scored based on factor rating or degree of limitation of land use

22
requirements when matched with the land qualities. In other words land suitability
evaluation is a comparison and matching of land utilization type’s requirements with land
units’ characteristics. Land suitability classes reflect degrees of suitability as shown in table
2.1.
Table: 2.1 Structure of the suitability classification (FAO, 1976) SN Categories Explanation
1 Land Suitability Orders Reflecting kinds of suitability
2 Land Suitability Classes Reflecting degrees of suitability within Orders
3 Land Suitability Subclasses Reflecting kinds of limitation or main kinds of
improvement measures required, within Classes
4 Land Suitability Units Reflecting minor differences in required management
within Subclasses
According to the FAO general framework for land suitability evaluation (1976), the land
suitability classification consists of assessing and grouping the land types in orders and
classes according to their capacity. There are two orders represented by the symbols S and
N. The classes (1, 2 and 3 for suitable and; 1 and 2 for unsuitable order) express the degrees
of suitability or unsuitability, presented in the table 2.2. The areas that were not assessed are
allocated to an extra class "NR" meaning not relevant. Land suitability orders indicate
whether land is assessed as suitable or not suitable for the use under consideration. Land may
be classed as not suitable for a given use for a number of reasons. It may be that the
proposed use is technically impracticable, such as the irrigation of rocky steep land, or that it
would cause severe environmental degradation, such as the cultivation of steep slopes.
Table 2.2 Structure of land suitability classes and subclasses (FAO, 1976) Order Class Description
S1 (Highly suitable) Land having no, or insignificant limitations to the given
type of use
S2 (Moderately suitable) Land having minor limitations to the given type of use Suitable
(S) S3 (Marginally suitable) Land having moderate limitations to the given type of use
N1 (Currently not suitable)
Land having severe limitations that preclude the given
type of use, but can be improved by specific management Non-
suitable N2 (Permanently not suitable)
(N)
Land with so severe limitations which are very difficult to
be overcome

23
Suitability categorization with very highly suitable (S1), moderately suitable (S2),
marginally suitable (S3) and not suitable (N) only are being used by many researchers for
different crops like Pyrethrum flower production in Kenya (Wandahwa and Ranst, 1996),
Robusta coffee in Brazil and date palm in the Middle East. However in Nepalese contest
highly preferable, medium preferable and low preferable pocket are for vegetable cultivation
has been identified by panel of the expert. In this system existence of the not suitable land
has strictly be omitted (MoA 2005).
Land suitability classes reflect degrees of suitability. The classes are numbered
consecutively, by Arabic numbers, in sequence of decreasing degrees of suitability within
the order. Within the order suitable the number of classes is not specified. There might, for
example, be only two, S1 and S2. The number of classes recognized should be kept to the
minimum necessary to meet interpretative aims; five should probably be the most ever used.
Land suitability subclasses reflect kinds of limitations, e.g. moisture deficiency, erosion
hazard. Subclasses are indicated by lower-case letters with mnemonic significance, e.g. S2m,
S2e, and S3me. There are no subclasses in class S1. The number of subclasses recognized
and the limitations choosen to distinguish them will differ in classifications for different
purposes. The limitation factors although identified, not included in the Nepalese system of
suitability evaluation. Only high, medium and low suitability classes don’t reflect parameters
specifically so it is a bit impractical. Limitation factors as indicated in FAO (1976) has been
used by several authors like Choung (2007), Nguyen (1996), etc. Such and limitation factors
are indicated by small alphabet as follows.
d : Limitations by rootable soil depth,
f : Limitations by flooding in rainy season,
g : Limitations by inappropriate soil conditions,
p : Limitations by fertility conditions,
t : Limitations by soil texture condition,
sl : Limitation by land slope of an area,
Land suitability units are subdivisions of a subclass. All the units within a subclass have the
same degree of suitability at the class level and similar kinds of limitations at the subclass
level. The units differ from each other in their production characteristics or in minor aspects
of their management requirement. Their recognition permits detailed interpretation at the

24
farm planning level. Suitability units are distinguished by Arabic numbers following a
hyphen, e.g. S2e-1, S2e-2.
Table: 2.3 Structure of land suitability classes and sub-classes Land suitability
orders Land suitability classes
Land suitability
subclasses
S1 (highly suitable)
S2 (moderately suitable) S
S3 (marginally suitable)
N1 (Currently not suitable) N
N2 (Permanently not suitable)
e.g. S2t° or S3sl
t° = temperature, sl =
soil slope
There is no limit to the number of units recognized within a subclass.
On the basis of scope of suitability two types of classifications proposed by FAO framework
(1976).
1. Current suitability: refers to the suitability for a defined use of land in its present
condition, without any major improvements in it.
2. Potential suitability: for a defined use, of land units in their condition at some future
date, after specified major improvements have been completed where
necessary.
Land suitability evaluation used to be done with consideration of the local need, land
availability and use. There are three different methods in use to classify general land
suitability for physical land conditions as described below;
1) The subjective combination method: The basis of land evaluation and classification is
according to the subjective opinion of each individual. These comments will be combined
and then arranged into suitable ranks. For example, if collected opinions and reference
experience from people in the researched area show that there are two criteria of S2 which
harmfully affects LUT, the combined land suitability (general) will be S3. Thus, if the
collected opinions are of qualified and acknowledged experts with experience in natural
conditions, land characteristics and socio-economic conditions of the region, this method is
very good, ensuring accuracy, simplicity and rapidity.

25
2) Shortcoming combination method: This is the most logical and simplest method which
considers the least suitable factors to be shortcomings. The general suitability level of a
LMU to a LUT or plant is the lowest suitability level ever ranked of land characteristic. For
instance, if there are 3 criteria of S3, S2 and S1, the general land suitability level will be S3.
3) Parameter method: According to this method, land ranking can be evaluated by adding
points, multiplying by percentage or grading according prescribed rank. In this method the
best land is assessed as 100 points or 100% or 1, worse land is ranked in descending order
like 80, 60, 40, 20 points or percentage (%), or 0.8, 0.6, 0.4, 0.2. This method of ranking is
simple, easy to understand and applicable with the support of computers. During the process
of ranking land suitability, it is necessary to identify dominant factors. These are decisive
and irreplaceable factors, for example: types of soil, topography, depth of land layers,
structures of soil and so on. Other factors can be considered as normal one which hardly
affects the ranking of land suitability.
If the dominant factor has the highest limit (the most limited factor), the ranking is taken
according to that level. If a normal factor has the highest limit whereas the other dominant
and normal factors are at a lower limit, the rank is elevated to one more level. For instance, a
normal factor is at S3 level, the other factors are at S2 and S1, then LUT will be ranked S2
(or from N to S3, or from S2 to S1). If two normal factors are at S3 and dominant factors are
at S1, LUT will be ranked S2 (or from N3 to S3, or from S2 to S1). If more than 3 normal
factors are at the limit, LUT will remain the rank.
Table 2.4 is the example for limits and suitability classification. When total points of all
factors of land quality or characteristics is 90-100 or 0.9-1.0, the suitability class will be
determined with high suitability (S1); 70-80 or 0.7-0.8, the suitability class will be medium
(S2); 50-70 or 0.5-0.7, the suitability class will be low (S3); and other smallest points will be
determined with non suitability (N). The selected factors of land qualities and characteristics
for suitability evaluating depend on the each specific crop or land utilization types and the
specific conditions of each ecological region. In addition, the methodology used for
evaluating also impacts to this factor selection.

26
Table 2.4 Example of degrees of limitation and suitability classification (Adapted from Prakash, 2003)
Degrees of Limitation (L) and Suitability Class
100 80 60 40 20
Land
Characteristics (None) (Slight) (Moderate) (Severe) (V.Severe)
(Paddy)
S1 S2 S3 N1 N2
Rainfall (mm) >1500 1000-
1500 750-1000 <750
Slope % 0-1 1-3 3-5 5-8 >8
Drainage Class Imperfect Mod.
well
Well
drained Excessive Excessive
Textural Class Sic,
coarse
Sic,
sc(s) l, sl, sil (m) Ls, fs Sandy
(% Clay) c(s) 40-
60%
Depth (cm) >80 50-80 30-50 15-30 <15
NPK Rating HHH MMM MML LLL
Organic Carbon (%) >1.5 1-1.5 0.5-1 0.2-0.5 <0.2
Temperature ( ° C) 25-30 30-35 20-25 >35 <20
pH 6-7 5.5-6 7-7.5 5-5.5 <5.5,>7.5
Land evaluation is the process of predicting land performance over time according to
specific types of uses (Rossiter, 1996). Land suitability evaluation is needed for various
purposes in the context of present day agriculture and has to be carried out in such a way that
local needs and conditions are reflected well in the final decisions (Prakash, 2003).

27
Figure 2.3 Steps of land evaluation and land use planning (FAO, 1986)
Land use planning is a tool to help policy makers, decision makers, and land users, to use
land in a way (a) that current land use problems are reduced; and (b) that specified, social,
economic or environmental goals (e.g., sustainability, food self-sufficiency, income,
environmental conservation) are achieved (Omakupt and Huizing, 1992). Land evaluation is
part of the process of land-use planning (FAO, 1986) and the results should be useful for
rational land use planning (FAO, 1993). Land suitability evaluation runs as shown in the
figure 2.3.
The aim of land evaluation is to determine the suitability of land for alternative, actual or
potential, land uses that are relevant to the area under consideration. Land evaluation is the
process of predicting the use potential of land on the basis of its attributes. Determining
suitable land for a particular use is a complex process involving multiple decisions that may
relate to biophysical, socio-economic and institutional/organizational aspects. A structured
and consistent approach to land suitability analysis is therefore essential. The results are
intended to be used for land resource related decision making, both strategic land use
planning by policy/planning institutions such as extension agencies, and specific local land
allocation by the direct land users, that is, the farmers (Bacic, 2003).
The evaluation of land is interdisciplinary activities that rely on large amounts of
information from different sources. Finally they must present the results of the evaluation
with reports and maps. This output has to be dynamic, considering the continuous refinement
of the whole land evaluation process. Land evaluation is the process of predicting land
performance over time according to specific types of uses (van Diepen et.al., 1991; Rossiter,
1996).

28
Land evaluation has traditionally been primarily based on soil resource inventories,
commonly called soil surveys (Bacic 2003). These were carried out for more than a hundred
years in Russia, the USA, Hungary and for at least fifty years in most other parts of the
world (Boulaine, 1989; Zinck, 1995; Yaalon and Berkowicz, 1997). They were initiated
mainly as support for rural land use decision making, in particular the matching of
production systems (crops, varieties, rotations, fertilization and other cultural practices,
conservation measures) to soil types. This support became systematized in the land
capability approach (Bibby et al., 1991), where soil types were categorized by their ability to
sustain general classes of land use. Starting in the 1950’s, multi-purpose soil survey
interpretations for non-agricultural uses became increasingly important (Bartelli, 1966). In
the early 1970s, there was growing dissatisfaction with then-existing land classification
systems insofar as their ability to support rational land-use planning in three main respects
(Rossiter, 1994) as;
(1) Existing land classification systems were mostly or completely based on
physical factors and ignored socioeconomic aspects of land use;
(2) They did not specify land uses in sufficient detail for realistic evaluation, i.e.,
a single classification was being applied to land uses with distinctly different
requirements;
(3) They were being uncritically applied outside of their area of calibration.
These were leading to the development of land evaluation methodologies in the 1970’s.
According to the paper of Rossiter (1994), the FAO’s Land and Water Development
Division (AGL), in approximately 1973, sponsored working groups, leading to publication
of the Framework for Land Evaluation in 1976. Subsequently, the FAO organized
workshops leading to publication of guidelines for land evaluation (FAO, 1983; 1984; 1985;
1991; Siderius, 1986).
The participants of an international workshop for heads of national soil survey discussed the
relevance of soil resource inventories was held at ITC (Holland) in 1992 and agreed on the
importance of soil surveys with reservations (Zinck, 1995). Many scientists and research
organizations in the world have carried out land evaluation, and the result is used in land use
planning (Vo et.al. 2003), however, a lot of information is not effectively used for land use
planning. The results of land evaluation from almost 15 years of working as a soil surveyor
and land evaluator felt that the work was not useful to and used by the potential clients

29
(Bacic, 2003). Several authors have stated that decision makers do not in general make use
of these land assessment results, nor are they particularly satisfied with them, if indeed they
know of their existence (Rossiter, 1996; Bouma, 1997; Bouma, 1999).
The land evaluation method of FAO is adapted in many countries in the world proves to be
widely feasible and significantly improved. Land statistic registration, soil map
investigation, land suitability evaluation and land use planning are the main duties of land
management. Together with the research achievements of edaphology, land evaluation in the
past three decades has become a popular scientific field and has obtained many modern
achievements. However, there are many different view points and schools in which two
prominent ones are: land evaluation from the viewpoint of development and generation of
Docuchaev (1983) and quantitative land evaluation (Soil Taxonomy) (Soil Survey Staff,
1962 and 1975).
At present, the FAO Framework of land suitability evaluation has been used in FAO and
UNDP projects, and many national agencies, with necessary locally acceptable modifications
and simplifications. The FAO Framework represented the state of the art, borrowing the best
from the existing land classification methods; many weaknesses apparent on close
examination and attempts to implement; “it is becoming outdated from an operational point
of view, but with a function as background philosophy” (van Diepen et.al., 1991). Judgment
of Rossiter on land evaluation framework of van Diepen et.al. (1991), the framework is
capable of modification and interpretation, the problems have been with unimaginative
applications, and the framework can be extended with new analytical techniques. The system
that evaluates land in accordance with development and generation, viewpoint in Russia
claimed that (Docuchaev, 1983), according to him, land evaluation should indicate the soil
types and natural quality of land. These are subjective and reliable criteria. He proposed
some rules in land evaluation, factors for land evaluation must be clearly and stably
identified, the factors must be distinguished subjectively and scientifically, there must be
research and study to improve land productivity in localities and in the whole country and
finally there must be economic statistics and agricultural statistics to propose the best land
use measures.

30
2.1.9 New trends of land suitability evaluation
Land evaluation is either of qualitative or quantitative in nature where quantitative is
particularly important for economic surveys. Most land evaluation are qualitative, based on
the expert judgment of soil surveyors and agronomists who interpret their field data to make
understandable to planners, engineers, extension officers and farmers. More recently in-
depth studies of specific soil related constraints (in particular soil fertility, available water,
available oxygen, soil workability and degradation hazards such as soil erosion and soil
salinization) have all facilitated quantitative simulation of specific land use processes and
opened the way for yield prediction. The development of information technology during the
last twenty years has enabled researchers to make rapid progress in the analysis of
interactions between land resources and land use and in quantitative land evaluation based
on quantitative land use systems analysis.
2.1.9.1 Qualitative to quantitative land evaluation
Quantitative economic evaluations, however, require estimates of crop yields, rates of plant
growth, or other measures of performance. Quantitative models have been developed for
several major crops but these demands reliable data. Such decisions need only qualitative
land evaluation even when predictions are based on carefully controlled trials, they may be
confounded in practice by variations in management. Therefore, it tries to estimate a range of
performance under the likely standards of management (Beek et al., 2000). The Framework
for land evaluation (FAO 1976) is meant particularly for use in the areas with limited
availability of basic data and can function at several levels of detail. But most applications
are qualitative, matching degrees of limitation of the land with the corresponding
requirements of specific kinds of land use, and the overall suitability class is usually based
on.
2.1.9.2 Multi-disciplinary land evaluation
Some other requirements include both the bio-physical requirements and the socio-economic
setting. A choice is offered between a two-stage land evaluation procedure where the bio-
physical analysis is followed by socio-economic analysis (which is preferred by most of the
physical scientists) and a parallel procedure that attempts to integrate biophysical and socio-
economic analyses (favoured by social scientists, especially at the farm level). Land
suitability analysis and land use planning are important and being considered as a very
complex question since it is usually solved by multi-criteria and interdisciplinary

31
approaches. In general, land suitability analysis indicates the influences of physical in
relation with social-economic, infrastructure, environmental issues for vegetable crops. In
which social-economic and infrastructure database are used and described for maps
manipulation in land evaluation and land use planning (Chuong, et al., 2006).
2.1.9.3 Land suitability assessment approaches
There are several research and studies round the globe carried out aiming on linking local
and scientific knowledge like Kundiri et.al. (1997) in Nigeria, and Guillet et.al. (1996) in
Peru, and Norton et.al. (1998) in New Mexico. Little work has been done in Asia and North
Africa. Briggs et al (1998) studied the choice and management of cultivation sites by
Bedouin in Upper Egypt. Recently Zurayk et.al. (2001) carried out a participatory land
capability classification for suitability and a land use analysis in a semi-arid mountainous
village in Lebanon. These efforts after all make an attempt to established relation between
farmers’ perception and expert knowledge. A generalised land use planning approach has to
be adapted to and integrated into a prevalent political and administrative system. The issue
of planning approaches has become significantly important and has been examined under
seemingly opposed centralised top-down planning and participatory bottom-up planning,
influenced by the increasing orientation to local needs and people that began in the 1980s
(Chambers, 1994).
a) Top-down approach
When land use planning and land use evaluation carried with the decision from the state or
expert or policy maker and implemented in the bottom level i.e. farming level, then it is
termed as top-down approach. The classic or traditional model of top-down planning places
the state as the administrator of the environment, and the state makes all decisions about
resource utilisation. This makes land use planning an instrument of governmental guidance
and control, closely linked to national development plans. Development potentials are
assessed for all regions and goals set for all administrative levels, while monitoring is purely
an assessment of goal achievement. This approach was particularly widespread in Indonesia
in the National Land Agency and Sri Lanka in the Land Use Planning Division (Betke 1994).
b) Bottom-up Approach
The opposite term is bottom-up planning initiated at the local level and involves the active
participation by the local community. Main decision of the land use planning will be based

32
on the view and information raised from the level of the growers and later will incorporate in
the national plan by policy makers or experts. The aim of the community at village or one
level higher is the development of local planning and implementing capacities in natural
resource management (Betke 1994). The experience and knowledge of land users and
technical staff are mobilised to select development priorities and to formulate
implementation plans. In terms of actors at the local level and responsible administrators,
there are a great variety of institutions. Reference is made to now defunct Community Based
Land Use Planning and Local Watershed Management Committees in Thailand within the
context of the TG-HDP (Betke 1994), which shows that this idea was important, but perhaps
not realistic under a contradictory policy framework.
2.2 GIS Application for land suitability evaluation
Useful suitability assessments cannot solely be based upon biophysical resource information.
The other factors include transportation networks, scale dependent localized economies, and
social factors such as education and demographics. Geographical Information Systems (GIS)
consists of various components, starting with the incorporation of geographical data from
remote sensing sources or maps and is then converted into a computer-readable form. This
data can be manipulated and different data themes such as land cover and soil types can be
overlaid for analytical operations. Agricultural suitability mapping involves identifying land
use patterns and assessing whether the current use is the most feasible both economically and
environmentally. The GIS required to service such research must incorporate high
functionality and an ability to work seamlessly with both raster and vector data structures.
Tabular information from census and agricultural statistics, raster image data and vectorized
productivity field data all add elements to the overall study. Such data integration and equal
efforts need be applied in mapping and understanding relationships evident in the compiled
information. Crop modeling, including soil/water requirement and geostatistical analysis, is
critical at this stage to identify and make sense of complicated spatial relationships and,
ultimately, substantiate trends and theories. Progress in computing sciences, regarding this,
GIS and Multi Criteria Decision Analysis on computer (MCDA) as the typical cases that can
help planners handle this complexity of voluminous calculating relation to many criteria.
Instead, a set of contributions concerning three areas of application of land planning has
been reviewed: location choice, land suitability assessment, and collaborative decision
support systems (Joerin et al., 2001). Combining GIS and MCDA is also a powerful tool to
land suitability assessments. New concepts and approaches like multi-criteria method and

33
GIS application have developed dramatically in land evaluation, especially since 2000. This
opened new directions in land evaluation so as to have appropriate crop allocation, and get
higher effects when being applied to agricultural land planning. Some studies on land
evaluation from new international perspectives in which the evaluation procedure of FAO is
used just the initial grounds for further more detail study.
Since 1990s, GIS has been claimed as a magic tool in natural resource management as “it is
ultimate in GIS the perfect answer to each and every resource problem” (Heit and Shortreid,
1991). GIS is a powerful and sophisticated tool for displaying and analyzing spatial
relationships between geographic phenomena in the form of vectors and images.
With the advent of GIS, there is ample of opportunities for a more explicitly reasoned land
evaluation. Geographic data as spatial data that “result from observation and measurement of
earth phenomena” referenced to their locations on the earth’s surface (Tomlinson, 1987).
GIS is an information system including works and links together with the ability to perform
numerous tasks utilizing both spatial and attribute data stored in it (ESRI, 2001). It has the
ability to integrate variety of geographic technologies like Global Positioning System (GPS),
and Remote Sensing (RS). The strength of GIS lies in its ability to integrate different types
of data into a common spatial platform. This information should present both opportunities
and constraints for the decision maker (Ghafari et al., 2000). Data from different sectors can
be integrated into a single analysis without the need for each sector duplicating data
collection efforts.
The powerful query, analysis and integration mechanism of GIS makes it an ideal scientific
tool to analyse it for land use planning. Management of agricultural resources based on their
potential and limitation is essential for development of land and other resources on
sustainable basis. GIS technology is being increasingly employed by different users to create
resource database and to arrive at appropriate solutions/strategies for sustainable
development of agricultural resources (Venkataratnam, 2002). GIS techniques are being
effectively used in recent times as tools in carrying out the morphometric analysis, which
helps in suitability evaluation and management of the land resources (Obi Reddy et.al.,
2002). Agriculture GIS is a tool that can assist a community to plan and to support the
information management during the agricultural production process, while at the same time
ensuring the proper balance between competing resource values. It can enhance the

34
accessibility and flexibility of information and can improve the linkages and understandings
of relationship between different types of information. On the average, about 80% of the
resources allocated to good GIS are related to database development and management
(ESRI, 1994). The spatial datasets become rather static once created. In most multi resource
inventories, descriptive data are more dynamic than spatial data and as such, require more
frequent updates. A good GIS design is one that incorporates a powerful database
management system for efficient data storage, retrieval and manipulation of data.
There are numerous avenues where GIS can be integrated with agricultural economic
studies. Changes in agricultural land use are one of the areas that agricultural economists are
interested in (Shrestha, 2003). GIS is a software package or compilation of software that
links a digital map with a database. Features on the map (which represent objects in the real
world) are linked to records in the database, which contain a multitude of attributes and
values. These components serve as a storehouse of information. The map stores physical
features and the database stores information about them. A decision on the land use for crop
production depends on many spatially related factors such as, microclimate, vegetation,
location specific attributes such as prices of inputs, outputs, household characteristics, land
holdings, land area, parcels of land holdings, land ownership and the combination of these
factors with a set of production technologies that relates inputs and outputs. An active GIS
market has resulted in lower costs and continual improvements in the hardware and software
components of GIS. In the process of land suitability evaluation, it can be said that
components of land unit, inquiries on land use for each agricultural crop are input data of
this process; spatial allocation, boundary, area and scale of each suitability level for each
crop are output data of land evaluation process. They are also considered as important input
data to create the problem of land use (Nguyen, 2004). The land suitability classifications
will be determined by overlaying thematic maps and by analysing attribute data with
supporting of GIS those lead to the presentation of results faster and more exactly. The
building of a GIS is a chain of operations that leads us from planning data observation and
collection, to their storage and analysis, to the use of the derived information in some
decision making process (Chuong 2007).
The building of a GIS is a chain of operations that leads us from planning data observation
and collection, to their storage and analysis, to the use of the derived information in some
decision making process. The main components of a GIS are:

35
Data input: Data is the most expensive GIS component. Digital data are collected
from many sources such as aerial photographs, satellite images, field samples, and
scanning or digitization of hard copy maps.
Data management (storage and retrieval): One of the main key elements of this
work is the building of the database capable for the storage, retrieval, and sharing
of the data in an easy and efficient way. The database consists of detailed
information obtained during the field observation, describing the site and land
facets of a particular land unit in terms of geomorphology, soil, and vegetation. The
main objective of this phase is making the data ready for various types of
classification for different applications mostly for land suitability evaluation. For
each theme, data are selected and extracted from the data base and exported to
elaboration software (spreadsheet and GIS) to produce the required output.
Spatial data manipulation and analysis: The manipulation and analysis of data
determine the information that can be utilised by the GIS. Analysis is a process for
looking at geographic patterns in your data and at the relationship between features;
and this can be as simple as making a map or as complex as involving models that
mimic the real world by combining many data layers. Manipulation involves
transformation (i.e., from raster to vector data structure), generalization, overlay,
and interpolation procedures.
Output: The final stage is the presentation of the result to the end users and decision
makers. The results of GIS can be reported as a map, values in a table, or as a chart.
A team of expert includes physical geographers, agronomists, climate-soil-crop modelers,
geostatisticians, computer programmers, economists, social scientists, and also data
extension workers to ensure that the system and its products are transparent to the occasional
users such as policy-makers and stakeholders at every level (FAO, 1995). Multidisciplinary
natural resources teams are required to make GIS systems an effective tool in support of land
evaluation and land use planning. Database is set up in form of maps and layers of
information. Each map demonstrates information, spatial and non-spatial attributive relating
to land evaluation objective. Sets of evaluation criteria are established in accordance with
land use inquiries of each specific crop group. This step is independently conducted with
employing GIS technique. Then, evaluation criteria in GIS context will be set up. Land unit
map and land use inquiries for each crop types are also established and evaluation criteria are
standardised to make the criterion comparable with each other. Finally, establishing land
36
suitability map for each crop and group of crops and applying the findings to sustainable
planning for agricultural land use.
Some limitations to the use of GIS technology
Application of the GIS in suitability evaluation has been use in wide range crops and land
forms but still in many part of the world limitations exists as follows (FAO, 1995);
1. “The inadequate analysis of real-life problems as they occur in complex land
management and sustainability issues at the household level, and as they involve the
integration of biophysical, socio-economic and political considerations in a truly
holistic manner;
2. The limitation in data availability and data quality at all scales, especially those that
require substantial ground truthing;
3. The lack of common data exchange formats and protocol;
4. The inadequate communication means between computer systems, data suppliers and
users due, for instance, to poor local telephone networks.”
Some limitations that are identified to make use of GIS technology for land evaluation
process in Nepal are listed as follows;
1. The local experts with insufficient training, lack of enough experiences.
2. Defective system of update and data management system and proper institutional
network need to be built up a proper data management system in all fronts of
research areas.
3. Networking functions among the government institutions, research agencies and
academic organizations for, data collection, data exchange and updating is still
lacking.
4. Lack of sufficient temporal remotely sensed and digital data coverage.
5. Level of awareness regarding GIS functionality is still rudimentary.
In recent days organisation are making good use of GIS for land related activities and
gradual start in other sectors is encouraging.

37
2.3 Multi-criteria evaluation for land suitability
Three major phases for suitability analysis with GIS are listed as they are
a) problem formulation phase, where the situation is analysed for the problem and
prospects,
b) problem understanding, generating alternatives, selecting criteria and establishing
relationships among them and
c) evaluation of the alternatives using the set criteria to achieve the objective (Sharifi,
2003).
Decision making is the process that leads to a choice between a set of alternatives, and is
often used in land suitability evaluation of alternatives like S1, S2, S3, and N.
The main purpose of the Multi-criteria evaluation techniques is to investigate a number of
alternatives in the light of multiple criteria and conflicting objectives (Voogd, 1983). Multi-
criteria decision making could be understood as a world of concepts, approaches, models and
methods that aid an evaluation according to several criteria (Barredo, 1996). Multi-criteria
evaluation for land use issues is not a new concept, however multi-criteria evaluation based
on the same principle, but implements explicitly reasoned decision rules to enable the
combination of many criteria into a single index of suitability is the new concept. Multi-
criteria evaluation is a transparent way of systematically collecting and processing objective
information, and expressing and communicating subjective judgments concerning choice
from a set of alternatives affecting several stakeholders. Such systematic, rational and
transparent judgments most probably lead to more effective and efficient decisions by
individuals or groups of decision makers (Sharifi et.al., 2004). The main goal of multi-
criteria evaluation is to generate a gauge to compare possible alternatives or solutions. These
methods integrate multiple criteria in order to combine all the relevant concerns in the
decision problem as a gauge for comparison (Prakash, 2003). For continuous factors, a
weighted linear combination (Voogd, 1983) is usually used. With a weighted linear
combination, factors are combined by applying a weight to each followed by a summation of
the results to yield a suitability map.
Agricultural crop land suitability is one of the interdisciplinary approaches that involve
integration of criteria from different branches of science. Criterion may be both qualitative as
well as quantitative and are involved in analysing different alternatives. Decisions have to be
taken at various levels starting from selecting the land utilization types or crops till the

38
allocation of the land utilization types or crops for area that suit best. So the suitability
evaluation is a multiple criteria decision making process (Prakash, 2003). Therefore, multi-
criteria analysis can be used to define the most suitable areas for agricultural crops. In multi-
criteria analysis technique, generation of the suitability maps for given corps is the very first
step. Combining these maps to decide which crop to be best fitted for a specific location is a
difficult task, so relative importance of various criteria can be well evaluated to determine
the suitability by multi-criteria evaluation techniques (Ceballos and Blanco, 2003). Ceballos
and Blanco (2003) conducted a study on delineation of suitable areas for crops using a multi-
criteria evaluation approach and land use/cover mapping. They had shown that multi-criteria
evaluation–GIS combination has potentiality to provide a rational, objective and non-biased
approach on making decisions in agriculture applications. Multi-criteria decision making,
combined with GIS data, is a powerful approach to systematically and comprehensively
analyze a problem. Fundamental components of a multi-criteria problem are human value
judgment, trade-off evaluations, and assessments of the importance of criteria. Nonetheless,
criteria that have GIS capabilities can be used to achieve a desired objective (Moldovanyi,
2003).
The integration of multi-criteria evaluation method with GIS has considerably advanced the
conventional map overlay approaches to the land-use suitability analysis (Carver, 1991;
Banai, 1993; Eastman, 1997). GIS-based multi-criteria evaluation can be thought of as a
process that combines and transforms spatial and a spatial data (input) into a resultant
decision (output) (Malczewski, 2004). Analytical Hierarchy Process (AHP) is a widely used
method in multi-criteria decision making and was introduced by Saaty (Saaty 1977; Saaty
and Vargas 2001). It is developed to select the best from a number of alternatives with
respect to several criteria. AHP is a proven, effective means of dealing with complex
decision making and can assist with identifying and weighting selection criteria, analyzing
the data collected for the criteria, and expediting the decision-making process. By making
pair-wise comparisons at each level of the hierarchy, participants can develop relative
weights, called priorities, to differentiate the importance of the criteria (Hossain et.al. 2007).
Matching of social-economic, environmental conditions and different requirements to assess
the suitability is carried out by different methods. Although a variety of techniques exist
comparison of weight is most accepted type. Development of weight in pairwise
comparisons developed by Saaty (1977) is one of the promising decision making tool. In the

39
past the AHP method was used for evaluation of technological processes mainly in
agriculture and horticulture (Böhme, 1986). This approach enables us to compare different
variants and rank the factors, criteria and parameters according to their importance. The first
introduction of this technique to a GIS application was that of Rao et.al. (1991), although the
procedure was developed outside the GIS software using a variety of analytical resources
(Vo, et.al., 2003). The AHP is a practical and effective method for solving multi-criteria
decision problems (Guo and He, 1998) which uses hierarchical structures to represent a
problem and then develop priorities for alternatives based on the judgment of the user
(Saaty, 1980). Land suitability analysis consists of multiple criteria and alternatives which
must be evaluated by a decision-maker in order to achieve a goal. The AHP provides a
systematic method for comparison and weighting of these multiple criteria and alternatives
by decision-makers.
Compared with other methods used for determining weights, e.g., Delphi method, the AHP
method is superior because it can deal with inconsistent judgments and provides a measure
of the inconsistency of the judgment of the respondents. Multi-level hierarchical structure of
objectives, criteria, sub-criteria and alternatives are uses in AHP. The fundamental input to
the AHP is the decision maker's answers to a series of questions of the general form, “how
important is criterion A relative to criterion B, C, D, E etc” which is called pairwise
comparisons. The comparisons are measured on a ratio scale. These comparisons are used to
obtain the weights of importance of the decision criteria, and the relative performance
measurements of the alternatives in terms of each individual decision criterion. Evaluation of
the elements by comparison will yield preferences these preferences carries numerical values
in nine point scale as described by Saaty and Vargas (1988).
The steps involved in AHP as designed by Saaty (2000) were further elaborated by (Mau-
Crimmins et.al., 2003). He described the processes as objective criteria and alternatives can
be many which are organize in hierarchical form. Relative importance of the criteria and
preferences among the alternatives is to be made by pairwise comparisons. Then priority
weight for criteria is calculated through preference. Finally the AHP process is completed by
multiplying the criteria vector by the alternative matrix.

40
2.4 Land evaluation process in Nepal
Land evaluation on the agroecological background has begun very earlier as Dobermez
(1970) made botanical exploration in the Nepal. Most of the works were carried out by
Stainton (1972) on evaluation of ecosystems on the basis of climate, altitude, land soil and
physiography. He identified 118 different types of ecosystems in Nepal including forest
ecosystem. Most of the researches were diverted into evaluation of forestry sector because of
the decreasing trend of forest cover in Nepal.
Systematic policy making processes started in Nepal in the mid 1950s with the concept of
national development plans in five-year cycles. The National Planning Commission (NPC)
coordinates the formulation of national development plans, as well as evaluating the annual
plans of the line agencies (Subedi et.al., 2002). Inclusion of the land management policy in
the plan had started quite late. Many pioneer researches were experimental and introduced
solely on theoretical framework for land evaluation as introduced by FAO, but the work
were putting emphasised on evaluating natural and physical conditions, land quality and
fertility, where socio-economic conditions were not incorporated on the processes.
The studies carried out in the past revealed certain shortcomings, such as inflexible
application of FAO procedure; merely concentrating on macroscopic projects which served
big planning programs, but not directly worked with each commune where the projects were
actually implemented. However, the research only employed land evaluation procedure of
FAO, and evaluated natural characteristics of land affecting land use types, not focusing on
socio-economic conditions and rural infrastructure during land evaluation process. The
development of new viewpoints and new land evaluation approaches in the world and the
occurrence of the shortcomings of the procedure have positively affected the process of land
evaluation process in Nepal. New concepts and approaches like multi-criteria method and
GIS application have developed gradually in land evaluation, specifically since 2000. This
opened new directions in land evaluation so as to have appropriate crop allocation, and get
higher effects when being applied to agricultural land planning. By calculating important
indicators for three criteria economy, society and environment, the research concluded that
multi-criteria analysis in land evaluation offered more positive results in selecting
sustainable agricultural developing zones.

41
Land evaluation had apparently been started with physiographic zonation of the country.
Later on this was converted into agroecological zonation. Land suitability evaluation of
Kathmandu valley was started long ago but it was purely based on the soil characteristics
and was done manually. Land suitability evaluation process in Nepal is gradually
developing. Majority of the studies and researches are concentrating on the erodibility and
erosion potential of the soil resources. Development of the model to account sedimentation
and erosion is also done (Shrestha 2000) making use of the GIS and Remote Sensing
technology. ICIMOD is one of the leading organisation working in the field of the land
evaluation using GIS. GIS database of Kathmandu valley is one of the comprehensive
publications to digitize existing land use scenario of the Kathmandu Valley (Shrestha. and
Pradhan, 2000). The combination between FAO procedure and multi-criteria evaluation
technique was also experimented in some areas. GIS and remote sensing technique were also
employed to establish thematic map and map overlaying to create land unit map, serving
land evaluation activity. Shrestha (2000) has combined slope, elevation and aspect to model
erosion hazard and sedimentation proves in Nepalese mountain primarily with use of Remote
Sensing images in GIS environment. He aims to evaluate land resources on the basis of its
erosion hazards for the cultivation and other land use. The research in the past few years
have contributed greatly to the orientation of agro-forestry developing strategies and national
land use planning in term of both scientific and realistic significance.
Identification of the pocket areas by policy making institution is one of the types of the
suitability classification where consideration of the land attributes and population
dimensions used to be considered (MoA, 2005). Land use planning and land suitability
within Nepal has been worked to some extent by OLI (2001), Thapa and Murayama (2006)
and Shrestha (2000). ICIMOD and Kathmandu University (KU) had also put considerable
efforts on this field.
GIS in Kathmandu valley
Recently, there is a continuing growth in use of GIS and related technologies by many
researchers, professionals and organizations engaged in planning and management of the
Kathmandu valley. Such studies are about an attempt to build a part of the comprehensive
GIS database of the Kathmandu valley more specifically emphasized on agriculture as a
means of bridging important data gaps. The study employs a fresh approach using the maps
available and integrating with satellite images. The use of maps in publication visualizes

42
prevailing status of environment and raise awareness about digital databases is in progress
(ICIMOD, 1999).
It is expected that the GIS application presented in this research will expected increase
awareness about the usefulness of digital databases and demonstrate benefit can be achieved
with GIS and related technologies. It is also hoped that this database will improve
information on the Kathmandu Valley and assist different stakeholders engaged in planning
and management of services (Oli, 2001).
Furthermore, the study advocates a building block approach to development, management,
and revision of databases in a complementary way to avoid duplication of efforts in costly
production of digital data. The study aims to sensitize senior executives and decision-makers
about the need for a sound policy on database sharing, development, and standards. Such a
policy, at the national level, known as a National Spatial Database Infrastructure (NSDI),
should evolve in order for everyone to benefit from the prevailing GIS technology.

43
3 AIM OF THE RESEARCH This chapter deal with the hypotheses put forward to set out the research objective. To
achieve the formulated objective, research questions are prepared which are based on the
problem identified during the research period. Research question are guided generally by
literatures and lays directions towards the development of right methodology to have
expected outcome.
3.1 Hypothesis
1. Land areas of Kathmandu valley used to cultivate different races of indigenous types of
vegetable crops from the very beginning. In this area it appears that vegetable
cultivation practices are decreasing considerably due to some obstacles. So, first
hypothesis is set as land and soil of Kathmandu valley may be selectively suitable site
for vegetable crops, considerable number of selective pocket area can be identified to
support vegetable farming.
2. It is expected to obtain best output on suitability analysis with collective application of
participatory research appraisal as a “bottom-up” approach and land evaluation
framework of FAO (1976), experts’ opinion and government policies as “top-down”
approach. There could be area specific modification on the suitability evaluation
procedures.
3. Use of the social and economic parameter on land suitability can reflect real on farm
scenario to produce promising result. This situation can effectively be handled with
GIS and multi-criteria analysis. So another hypothesis can be set as application of GIS
technology for databases processing, help on strengthening reliability of the result.
Similarly the integration of GIS and AHP is the demanding method for the result
oriented and meaningful land evaluation approach for the land area with rough
topography and climatically variable area like hilly region of Nepal. Therefore,
Kathmandu being one of the representative areas in this process brings real time,
authentic and reliable land suitability classification map.
3.2 Objectives of the Study
The purpose of this study is to make an assessment of how is it effected by the rapid,
improper and rampant growth of the urban settlements on agricultural land area of

44
Kathmandu Valley? The study will enumerate existing land use system, land capability and
preparation of land inventory in order to produce the land suitability classification through
application of AHP and GIS for the selected vegetable crops.
The specific objectives are;
1. To analyze the transformation pattern of agricultural land to non-agricultural uses in
the Kathmandu Valley.
2. To develop the land information system (LIS), databases of study area.
3. To develop a land suitability model for Vegetable crop in peri-urban and rural areas
of Kathmandu valley and develop model of to attain nutritional security.
4. To make analysis of the environmental, social-economic, and infrastructural
conditions prevailing in the Kathmandu Valley.
5. To assess suitability integrating multi-criteria analysis and GIS making use of
existing geo-database.
6. To suggest the policy guidelines that could effectively maintain sustainable balance
between agriculture and non-agricultural sectors and reduce vegetable dependency
out side the Valley.
3.3 Rationale of the study
Improper urban development can cause an adverse impact on agricultural land use and
environmental conditions also on the livelihoods of poor inhabitants of the area. Unplanned
urban growth in the valley may worsen the quality and quantity of agricultural land and its
productivity in the long run. It may also have an adverse impact on agriculture-dependent
disadvantaged groups in the valley. It may attract the rural poor, who will then transform
into urban poor. There is a need for study on the impact of urban development on
agricultural land use as well as urban poverty.
Contribution of the vegetable production from the valley land area is 23%, which could be
increase to 71% with proper utilization of land and cropping pattern (Pradhan & Perara,
2005). So identification of the suitable land areas for specific vegetable seems pre-requisite.
The research outcomes will expect to benefit the urban planners and policy makers and
agricultural sector in the following ways:
a. Identification of the role of the government in managing agricultural land area and
also plan for urban environment in the Valley.

45
b. The study will facilitate the conceptualization and formulation of sustainable
agriculture policy to attain sustainable vegetable production and reduce adverse
environmental impacts associated with cultivation
3.4 Research Questions
The soil quality of Kathmandu valley is traditionally known for the vegetable cultivation
since very beginning but adoption of new and modern technology in horticultural sector is in
very sluggish pace in comparison with the population out burst. Kathmandu valley is home
for more and more economically active population. Being capital of the country selective
migration from rural parts of the nation for employment and security is very high. Would
land area of Kathmandu valley is able to meet the vegetable demand of such ever growing
population? To be very efficient in vegetable production is land units produce up to their
capacity? May be more important question is the cultivation in such hilly area with fragile
topography ensures land use sustainability measures?
The need of very specific and detailed studies cannot be overlooked. To answer these
questions related to agriculture and Kathmandu valley following research questions have
been put forward to understand the matter to the reasonable depth.
Query1: How is the vegetable cultivation practices and land use condition in
Kathmandu Valley?
Query 2: What are the promising vegetables in the existing land, climates, social-
economic and infrastructural conditions study area?
Query 3: How does land information system (LIS) play role in suitability evaluation?
Query 4: How is physical land suitability assessment resulted?
Query 5: What are the criteria for suitability evaluation and how does multi-criteria
land suitability evaluation classify land in different suitability ratings?
Query 6: Will suitability evaluation help Kathmandu valley attain vegetable self-
sufficiency?
Query 7: Who are the main beneficiary of present research?

46
4 MATERIALS AND METHODS
The purpose of this chapter is to present fundamental materials and methods applied to
obtain the required data from respective sources and a research design describes a
procedural plan adopted to answer the research questions, objectively, accurately and
economically (Kumar, 1996). Methodology includes the following concepts as they relate to
a particular discipline or field of inquiry like a. collection of theories, concepts or ideas; b.
comparative study of different approaches; and c. critique of the individual Therefore a
research design provide answer for such questions as what techniques will be used to gather
the data, what kind of model used to make analysis and presentation of the results.
4.1 Data sources and collection
The research focuses on the study of land suitability evaluation of vegetables in three
districts namely Kathmandu, Bhaktapur and Lalitpur of Kathmandu valley. Research
methods include collection of available and new field work data, data analysis using various
tools and techniques. Several sources were used to gather up required data. The research
needed data on climate, hydrology, topography, soil, land cover and land use. In addition to
these, data were collected to assess indicators of land utilization in various altitudinal ranges.
Data gathering included field surveys, laboratory analysis and secondary data collection
from various organizations and individuals.
a. Attribute data sources
Majority of the attribute data were gathered from the Central Bureau of Statistics (CBS),
Kathmandu. Majority of the demographic and socio-economic figures are based on the
Population census 2001 and Sample Agriculture Census 2004 and Monograph of
Agricultural Census 2006 has provided much more valuable data of agriculture of Nepal.
Soil inventory was based on Global and National Soils and Terrain Digital Databases
(SOTER 2004) of Nepal. Soil observations were carried out using soil samples collected in
the randomly sampled locations of the horticultural area. Soil descriptions were according to
the FAO guidelines. Soil classifications are based on the USDA system. To study the spatial
variations of selected soil properties, observations were carried out considering variations in
the physiography. Existing soil fertility data were also derived through department of Soil
Science, Nepal Agriculture Research Center (NARC). Data on climate and hydrology were

47
collected from the department of hydrology and meteorology in Kathmandu. Sixteen
weather stations including two agro ecological stations scattered in different locations
within Kathmandu valley was used to collect climate data. More than 20 years of
meteorological data were gathered and analyzed using standard methods to examine
climatic variation of within the valley.
FAO Guidelines for Land Evaluation (FAO 1976, 1983, and 1993) are the basis of present
research. It. would further used for analyzing agricultural structure in order to lay the
foundation for collecting, evaluating and analyzing information. Further modification into
Nepalese context on the basis of parameter prevails in Kathmandu valley was made
according to FAO (1976) instruction. Identification of suitable land class on the basis of
parameter is presented as follows;
a) Land suitability orders that reflects kinds of suitability: S (suitable) and N (Nonsuitable).
b) Land suitability classes that reflects the degrees of suitability within orders: S1 (high
suitable), S2 (medium suitable), S3 (low suitable), N (non suitable).
c) Land suitability subclasses that reflect kinds of limitations required within classes, for
example: m = (moisture), n = (soil nutrient), t° = (temperature), e = (erosion hazard),
etc.
b. Attribute data gathering and the Inventory
Database is the building blocks of the research, so primary material required for research are
data. Among those climates data gathered form department of meteorology and hydrology,
information on geology of the Kathmandu valley from department of mine, data about
terrain, vegetation cover, infrastructure, socio-economy is from district development
committee of Kathmandu, Lalitpur and Bhaktapur districts. Similarly information about
vegetable crops and production of the area gathered from NARC and District Agriculture
Development Centers all the three districts of valley.
Three year plan on vegetable sector in future was collected from national planning
commission (NPC). In addition, national and international institutions are also contacted for
the collecting up necessary information and literatures. Ministry of Agriculture, Ministry of
Forest and Soil Conservation, Ministry of Local Development are also contacted for the
necessary data collection. Market related information like price and quantity available,
export and import data were provided by Kalimati Fruits and Vegetable Market

48
Development Board (KFVMDB. Collected materials include annual reports, five-year
summation reports, agricultural projects and research, statistic figures of district level, some
map. National remote sensing section was contacted to collect satellite image which will
logically be used to check biophysical changes in the map of study site.
c. Interview, discussion and seminar
Primary data collection accomplished by questionnaire survey which is one of the important
social research methodologies. It is best used to identify problem in the study area and to
setting up priority of requirement is made. Conclusion brought was derived as attribute data.
Direct and indirect unstructured interview (Participatory Research Appraisal, PRA) were
also done with farmers. This research makes use of well structured questionnaire to farmer
households in intensive vegetable farming areas. Formal and informal interview, group
discussion was also conducted to gather information.
Seminars and meetings conducted with experts, officials, and policy makers were also used
to make assessment of the valley agriculture condition. All these data were tabulated in the
MS Access format and further processing was done under specific heading. Seminars were
used to receive feedback information and also set the assessment criteria appropriately on
the basis of bio-physical condition of the locality.
d. Thematic maps
Thematic maps are the basis of the suitability analysis. The maps in present study include
land use map, land capability, soil maps and map of administrative boundaries. Those
thematic maps are created and edited, overlaid and visualized on ArcGIS and ArcView
software of ESRI. Application of GIS for overlaying thematic layers to establish land
databases, all the layer maps has to be converted into consistent coordinate system.
Geometric correction has been performed for the maps of different origin were converted
into Universal Transverse Mercator (UTM) projection. Topographic data were derived from
map sheets from Department of Land Survey, Government of Nepal, at scales of 1:25,000
and 1:50:000 for present study. Several maps like land capability map, land use map, road
map and administrative boundary maps were collected. Some map designed in GIS data base
of Kathmandu had been derived through the courtesy of the Integrated Mountain
Development (ICIMOD). With application of ArcGIS 9, coordinate system had been
amended from UTM projection with false easting 400,000 to the Modified Universal
Transverse Mercator with false easting 500,000.

49
Software used for data management
Software used for this study includes;
1) MS word is use to make creation of all this thesis type setting and printing.
2) MS Access and MS Excel 2003 were used to create the attribute databases and
import or export to GIS environment for next implementation. Macro created on MS
Excel software was used for multi-criteria analysis (weighting, rating) based on
Analytical Hierarchy Process as theory put forward by Saaty (1980).
3) ArcGIS is the software use to make analysis of all the GIS work in the thematic
layers of the study area map.
4) ERDAS is used just to make visualization of satellite images. Such images are used
to check real time changes in the study area and make necessary amendments on the
thematic layers.
5) Arc view 3.3 and MapInfo 7.5 software were used to analysis, store, query, and
outputs and convert the GIS data collected from different sources.
4.2 Methods of land suitability evaluation
4.2.1 GIS application
One of the most useful applications of GIS for planning and management is the land use
suitability mapping and analysis. The GIS-based land-use suitability analysis has been
applied in a wide variety of situations including ecological approaches for defining land
suitability/habitant for animal and plant species (Store and Kangas, 2001). ArcVeiw and
ArcGIS from ESRI has been used as tool for the GIS analysis of present study. The map
overlay approach has been typically applied to land-use suitability in the form of weighed
linear combination (WLC). The primary reason for the popularity of these methods is that
they are easy to implement within the GIS environment using map algebra operations. The
methods are also easy-to-understand and intuitively appealing to decision makers.
Most GIS systems are database oriented. The integration of multi-criteria decision
management (MCDM) techniques with GIS has considerably advanced the conventional
map overlay approaches to the land-use suitability analysis (Malczewski, 2004). GIS-based
MCDA can be thought of as a process that combines and transforms spatial and non-spatial
data (input) into a resultant decision (output). The MCDM procedures (or decision rules)
define a relationship between the input maps and the output map. The procedures involve the

50
utilization of geographical data, the decision maker’s preferences and the manipulation of
the data and preferences according to specified decision rules. Accordingly, two
considerations are of critical importance for spatial MCDA: (i) the GIS capabilities of data
acquisition, storage, retrieval, manipulation and analysis, and (ii) the MCDM capabilities for
combining the geographical data and the decision maker’s preferences and non-spatial
attributive data into unidimensional values of alternative decisions. A number of multi-
criteria decision rules have been implemented in the GIS environment for tackling land-use
suitability problems.
4.2.2 Criteria for physical suitability evaluation
Suitability analysis is the decision making part which is the vital of the suitability assessment
job. Based on the vegetable cultivation parameter, selection of the suitable mode for the
decision analysis is needed. The criteria are selected from physical environment, social and
economic aspects including infrastructural aspect. It works as shown in the organized
conceptual flow research diagram in this text (figure 4.1)
Physical land suitability evaluation is carried out with analysis of soil characteristics, land
characteristic and climate characteristic. The method use for the analysis is presented as
follows.
Figure: 4.1 Conceptual flow of the research approach

51
Soil analysis
Soil collection
A special type of soil auger was used for soil collection. When the auger was pushed and
screwed in clockwise direction, soil moved upward in to the auger after driving up to
required depth it was pulled out and the soil collected in side was removed. With the help of
this auger soil sample was collected from upper 10cm of surface soil. Litter layer was
collected from three stations, randomly located inside the quadrate considering three altitude
classes, the soil samples from each quadrate were mixed together in a cellophane bag and
brought in to laboratory the following day for investigation.
Analytical Methods
The collected soil samples were investigated in laboratory of Soil Science Division,
Agriculture Department, HMG, Khumaltar and Central Department of Environmental
sciences, T.U., Kirtipur using following methods;
Soil Texture
Texture of soil samples was done determining percentage of sand, silt and clay according to
USDA system by Hydrometer method (Piper, 1942). Then texture class was determined by
texture triangle.
Water Holding Capacity
A clean filter paper was placed in funnel. Ten ml of water was poured on filter paper and
excess water was collected in petridish below and measured. Volume of water absorbed by
filter paper was calculated. 50 gm of dry soil was placed on filter paper inside the funnel.
Then water was poured carefully on it with the help of pipette. A drop of water coming out
of the funnel marked the maximum water holding capacity of soil.
Soil pH
Soil reaction (pH) was measured by potentiometric method. Soil suspension was made with
distilled water in 1:1 ratio. Then the pH was measured with a Coleman glass electrode pH
meter.

52
Nitrogen
Nitrogen in the soil is present in different forms and in very small quantities. This total
nitrogen was estimated by modified Kjeldahl method.
Potassium
Soil was extracted with neutral 1 N ammonia acetate. Exchangeable potassium in the soil
was replaced by ammonia ion and the potassium released into solution and that was
estimated by the flame photometer method.
Phosphorus
Amount of phosphorus in the soil was estimated using spectrophotometer by Bray No.2
method.
Organic Matter
Organic matter of the soil sample was determined by Grahm Colorimetric method. This
procedure involves oxidation of readialy oxidizable soil organic matter by potassium
dichromate solution and measuring reduced chromium ion colorimetrically (Grahm, 1948).
The selection of criteria is the crux of the suitability analysis. Physical land suitability
evaluation is based on biophysical conditions of the study area. The process of selecting the
main criteria and sub-criteria is iterative in nature. Literature review, analytical study and the
local opinions were basic tools for selection of evaluation criteria. Based on FAO
Framework for Land Evaluation mapping unit was determined physical land suitability will
be assessed on the basic of soil parameter as follows.
1. Soil unit type (according to FAO soil classification system)
2. Soil texture
3. Soil effective depth
4. Soil slope degree
5. Soil fertility
Besides soil parameters, the climate factor like rainfall, temperature, humidity, wind regime,
sunshine hours, drought, flood, and erosion are also taken into consideration. Area like
Kathmandu valley where topography, slope, aspect, etc develop considerable difference in
the micro-climatic regime within study area the land unit can carefully be delineated.
However, in the area of topographic homogeneity, these factors are supposed to be

53
consistent and not showed in land unit. To physical land suitability evaluation, the detailed
flowchart of physical land suitability evaluation is showed in the Figure 4.2.
Figure: 4.2 Chart of GIS application to physical land suitability evaluation (Inherited from
Chuong, 2007)
4.2.3 Selection of promising vegetable crops
In determining the vegetable having high priority for the cultivation in the study area, the
product should focus on an array of aspects. For examples, profitability or the ratio of
revenue cost (R/C), and the sustainability factors, including the physical and agro-ecological
adjustment are considered. Similarly availability and type of input, local culture and habit,
demography, potential local market, institution and government and accessibility are also
taken into account.
The aim of this step is to select promising vegetable crop for study area within given set of
physical and socio-economical condition. Since vegetable are short term crops requiring
intensive attention and input, they are grouped for the purpose of study. On the basis of
existing cropping systems, social acceptance of vegetable crops, agricultural know-how of
vegetable growers, major agricultural markets, facilities availability, population and
economic status of the society and from the experience of long period of growing by farmers
it is decided which crops are promising in given locality. Vegetable constitutes major portion
of daily diet of local people hence consumption rate is also another parameter for vegetable

54
selection. Besides those, local food habit, nutritional requirements etc were also look upon to
make decision. Prevalence of the under weight due to the malnutrition in Kathmandu valley
is still 19% (CBS, WFP and World Bank, 2006). Cauliflower, potato and carrots could be
major supplement to the nutritional deficiency occurrence in many parts of country.
Kathmandu valley once used to vegetable exporting valley is getting completely dependent
on outside for more then 72% of its need (Pradhan & Perara, 2005). It is highly aimed that if
production of selected vegetable is done identifying suitable area, that will help reduce half
the total demand of vegetable in study area. From the Kalimati market data, it appeared that
little about half of imported vegetable in the valley makes up with potato, tomato,
cauliflower and cabbage (KFVMDB 2007). Selected vegetables are those which used to be
exported from the valley to outer district of the country. Basis of selection has been
presented in bullet as follows;
• Very high consumption.
• Help reduce vegetable demand and decrease dependency to outside valley.
• Contribution to family income considerably.
• Availability of local demanding varieties as well as improved varieties.
• As a potential nutritional supplements and help reduce poverty.
• Climatic favourability.
• Popularity on vegetable cultivation.
Table: 4.1 Groups of vegetable to be evaluated for land suitability Crops Group Representative species Nepali Name Family
Cole crops Cabbage & Cauliflower Kauli Brasicaceae
Root and tuber crops Potato, Radish & Carrot Aalu Mula, gasar Solanaceae/
Apiceae
Fruit and leaves crops Tomato Golvenda Solanaceae
Priority rating of the willingness of the vegetable growers in rural area of Kathmandu valley
was also assessed during field visit. Participatory Research Appraisal (PRA) with growers
also forms the basis for selection of given vegetable groups. Therefore, with consideration
and peer review of background and consultation with horticulturist, promising vegetable for
study in case of Kathmandu has been selected. Table 4.1 shows vegetable groups with high
rate of consumption are considered for the suitability assessment.

55
Land, soil and climatic parameter of given area has variability in certain range. Fluctuation
of this range could cause change in growth and development of vegetable crops effecting is
final yield. Such parameters, therefore catagorised in potential ranges according to need of
the crops as shown in the table: 4.2, 4.3 and 4.4 for cole crops, tomato and root and tuber
crops respectively.
Table: 4.2 Diagnostic characteristics for Cole Crops (Cabbage, Cauliflower, Broccoli), Potential Ratings
Parameters High Moderate Low Very Low
Temperature 18 - 27 15-18, 28 -35 10 -15 <10 & > 27
Soil Texture Loam Silty Loam,
Clay Loam Silty Clay, Bouldery, clay
Fertility High Moderate Low Very low
Aspect (in hills
only) South East North East South West-North
Soil pH 5.5 – 6.5 6.5 -7.5 > 7.5 <4.4
Irrigation Regular Partial Rainfed devoid
Input Readily
Available Available
Not
available Not available
Services (km) < 5 5 -10 10 - 15 > 15
Soil depth > 100cm 55 – 100cm 30 – 55 cm < 55
Slope(degree) Flat to 1 1 – 5 3 - 8 steep
References, Ministry of Agriculture and Agronomy of vegetables crops, 2004

56
Table: 4.3 Diagnostic characteristics for suitability of Tomato Potential Ratings Parameters High Moderate Low Very Low
Temperature 18 - 27 15-18, 28 -35 10 -15 < 15 & >35
Soil Texture Loamy sand Sandy Loam Clay, sand Bouldery Fertility High Moderate Low Very low Organic matter content (%) > 3 3 - 2 2 - 1 <1
Soil pH 5.0 -6.5 6.5 -7.5 < 5.0 and > 7.5
Irrigation Regular Readily available Rained Not
available
Input Readily Available Available Not available
Soil depth (cm) > 100cm 55 – 100cm 30 – 55 cm < 30 Slope (degree) Flat to 1 1 – 5 3 - 8 steep
References, Ministry of Agriculture and Agronomy of vegetables crops, 2004
Table: 4.4 Diagnostic characteristics for suitability Root crops (Radish and Turnip, carrot)
Potential Ratings Parameters High Moderate Low Very Low
Soil Texture Sandy Loam, Loam Silt loam Clay loam Gravel
Temperature (0C) > 10 - < 15 15 – 20 > 20 Fertility High Moderate Low Very low Soil pH < 5.5 -6.0 >6.0 - 6.5 < 5.0 & > 6.5 Irrigation Regular Partly available Rain feed Not available Access of Road (km) Near < 2 2 >2 Access to collection center (km) 5 15 >15
Soil depth (cm) > 100 80 – 100 55 - 80 < 55 Slope (degree) Flat to 1 1 – 8 3 - 15 steep Aspects (direction) South East North east South Pocket area (ha) =>20 10 <10
References, Ministry of Agriculture and Agronomy of vegetables crops, 2004
The methodology is based on matching soil/land characteristics against agronomical
requirements of crop and then the suitability classification will be assessed. The physical
land suitability evaluation used limiting factors method assigning the suitability classes, in
which the lowest suitability class will limit for the rest of factor. Therefore, the overall
suitability class will be the lowest suitability class.

57
4.3 Social-economic and environmental suitability evaluation
Social and cultural characteristics influence cultivation pattern land evaluation in developing
countries like Nepal is also effected by social attributes. Importance of social parameter for
suitability classification should be raised from the opinion of individual and corresponding
weight can be given for analysis purpose. These parameters are then classified into certain
and sub criteria for evaluation purpose. The weight and rates of each criterion and sub-
criteria, the multiplication process and reclassification for different suitability classes use
AHP for comparisons (Saaty, 1977). The flowchart of social, economic and environmental
land suitability analysis is presented as follows (figure 4.3).
Figure 4.3 flow chart showing application of GIS and AHP for physical environment, social
and economic-infrastructure suitability evaluation.
Socio-economic, environmental suitability evaluation is carried only on those areas which
are physically suitable. If land unit show degree of unsuitability in physical suitability
assessment, they are further not taken for the suitability assessment. So, non-suitable land
areas (N) are not considered for suitability evaluation step.
Hierarchical organization of criteria
The selection of the main criteria and sub-criteria for each of the Social-economic and
environmental evaluation is the first step as done in physical suitability evaluation process.
This is much interactive in nature. Literature reviewing, analytical studying and the expert
opinions gathering were tools that aided in the selection of evaluation criteria. Based on the
output of the research there are three main criteria groups are considered including economy-

58
infrastructure, society, and environment. These are further fragmented into number of sub-
criteria. The detail of the selection and development of the criteria and sub-criteria is
represented in lay out below (Figure 4.4). Hierarchical organization of the criteria and sub-
criteria was required which was based on opinions and ideas of farmers, expert knowledge,
and key groups. In hierarchical structure, main criteria forms highest hierarchical position
where as, the sub-criteria are decomposed at lower levels.
Weightings of criteria and sub-criteria
In the procedure for multi-criteria evaluation using a weighting and comparisons of criteria
involved to determine suitability for the stated objective. Ratings are provided on a 1 point
continuous scale.
Figure: 4.4 flow chart of the suitability analysis methodology
4.4 Analytical hierarchy process (AHP)
Analytic Hierarchy Process is a widely used method in decision-making. AHP is introduced
by Saaty (1977), with the basic assumption that comparison of two elements is derived from
their real- time importance. AHP technique is the crux of this assessment, because careful
organisation of sub-criteria of main criteria if weights properly, represent perfect suitability
order and fulfills the goal. After all AHP is the weighting and comparing procedure.
The AHP is based on three principles:

59
a. Decomposition of the overall goal (suitability),
b. Comparative judgment of the criteria, and
c. Synthesis of the priorities.
The first step of AHP technique begins with the structuring of the criteria and sub-criteria
required for the land suitability and set them in a hierarchical form. The overall goal of the
research is suitability evaluation which occupies the top most level in the hierarchy. The next
level consists of the main criteria set out to support the goal, and sub-criteria of the criteria
occupy position in the next hierarchical level. At the bottom level there are the alternatives to
be evaluated. Applying this step to land suitability evaluation, decision criteria relevant to
the goal were identified and arranged in the hierarchy illustrated in figure above. Such
structure allows the incorporation and accommodation of both qualitative and quantitative
criteria for assessing land suitability. GIS have emerged as useful computer-based tools for
spatial description and manipulation.
Table: 4.5 Fundamental Scale used in Pairwise Comparison (Saaty and Vargas 2001)
Qualitative Definition Explanation Intensity
of Importance
Equal importance Two activities contribute equally to the objective 1
Weak 2
Moderate importance Experience and judgments slightly favour one activity
over another 3
Moderate plus 4
Strong importance Experience and judgment strongly favour one activity
over another 5
Strong plus 6
Very strong or
demonstrated
importance
An activity is favored very strongly over another and
dominance is demonstrated in practice
7
Very, very strong 8
Extreme importance The evidence favoring one activity over another is of
the highest possible order of affirmation 9
Hierarchical organization is followed by is the comparison between the alternatives, criteria
and sub-criteria. They are compared in pairs with respect to each factor of the next higher
level. For this relative comparison, the fundamental scale of table 4.5 can be used. It allows
expressing the comparisons in verbal terms which are then translated in the corresponding

60
numbers. When the factor on the vertical axis is more important than the factor on the
horizontal axis, this value varies between 1 and 9. Conversely, the value varies between the
reciprocals 1/2 and 1/9 (see table 4.6).
For example, if comparing criteria A to criteria B, a score of 1 indicates that they are equally
relevant to the evaluation of suitability and a score of 9 indicates that B is of little
significance relative to A. All scores can be assembled in a pair-wise comparison matrix
with 1s on the diagonal (e.g., A to A is 1) and reciprocal scores in the lower left triangle
(e.g., if A to B is 5, then B to A is 1/5).
Table 4.6 An example of pair wise comparison matrix of criteria in AHP Goal A B C D E F Weights Ranking
A 1 2 7 3 5 3 0.365 1
B 1/2 1 6 3 5 2 0.264 2
C 1/7 1/6 1 1/2 1/4 1/2 0.064 6
D 1/3 1/3 4 1 4 1 0.127 3
E 1/5 1/5 2 1/4 1 1/3 0.073 5
F 1/3 1/2 4 1 3 1 0.125 4
λmax = 6.428 CI =0.086 CR = 0.069 Σ=1
AHP finally set out the priorities of the alternatives and the weights of each criterion with
respect to the goal. The local priorities are then multiplied by the weights of the respective
criterion. The results are summed up to get the overall priority of each alternative. For each
level in the hierarchy it is necessary to know whether the pair-wise comparison has been
consistent in order to accept the results of the weighting. The Consistency Ratio (CR) is a
measure of how much variation is allowed for reasonable results that is expected to be less
than 10 percent for the reasonable result. CR calculation is described as in following formula
from the matrix Goal calculation, λmax value can be gained and later it is used to count
Consistency Ratio (CR) and Wi which becomes the priority vector. The formula of
Consistency Ratio (CR) got from the Consistency Index (CI) is as follows:
CI = (λmax - n) / (n – 1)
CR = CI / RI
Where: λmax: The maximum eigen value
CI : Consistency Index

61
CR : Consistency Ratio
RI : Random Index
n: The numbers of criteria or sub-criteria in each pairwise comparison matrix
Random Index (RI) says that the average of consistency of comparative matrix in pairs is 1-
10, got from the experiment of Oak Ridge National Laboratory and Wharton School. The
bigger the matrix is, the higher the inconsistency level will be (Permadi, 1992). Matrix
Random Index can be seen in table below.
Table 4.7 Average Random Consistency Index (RI) (Permadi, 1992) N 1 2 3 4 5 6 7 8 9 10
RI 0 0 0,58 0,90 1,12 1,24 1.32 1,41 1,45 1,49
The requirements needed are:
If CR ≤ 10%, means matrix is consistent and AHP can be continued.
If CR > 10%, assessment require revision because matrix is not consistent.
If CR in level 1 meets the requirement, the next step is making pairwise comparison matrix
for level 2 for each sub criterion applied. In every matrix, λmax, CI, and CR are also counted
by using the same formula and requirement. Applying the above following steps, the final
weights for criteria and sub-criteria are shown in chapter 7. The fact value (X) of evaluated
criteria and suitability index (S) of land unit for vegetable crops in the study area are
presented in the table below. Value or score (Xi) of each level 2 of criterion is computed for
each land unit. Scores for the socio-economic, physical environment criteria are calculated
based on expert knowledge and farmer opinions. Local conditions assessment and outcome
of the questionnaire, seminar and discussion were also made use for this. These fact values
(Xi) are combined with the above weightings (Wi) to provide suitability value for each land
unit corresponding to each selected fruit crop.

62
Table: 4.8 Fact value classifications for each criterion for each LMU
Sub-criteria Attribute values of criteria Score
(xi)
Criteria 1 : Infrastructural Parameters
Perennial irrigation sources 9
Seasonal irrigation availability 7 Irrigation facilities
availability No irrigation except rein fed 5
Good condition motorable road 9
Far from road head 7 Road Network and
condition Far and bad road condition 5
Available processing know-how 9 Value addition
process Lack of processing facilities 7
Good institutionalized regular market 9 Market channel
Lack of proper market system to sell product 7
Available all the time 9
Seasonal unavailability 7
Agricultural input
availability
Unavailable 5
Above 1.2 9
Revenue Cost ratio Below 1.2 7
Criteria 2 : Social Parameters
Good market accessibility and marketing
information 9
Lack of marketing information 7 Marketing know how
Inaccessible markets 5
Motivated and trained 9
Trained 7 Motivation of Farmers
Unskilled 5
Market oriented 9
Household consumption 7 Cultivation Pattern
Utilization of farmland only 5
Easy and round the year available 9
Easy and seasonal availability 7
Scarce labour force 5
Labour force
Scarce and expensive 3
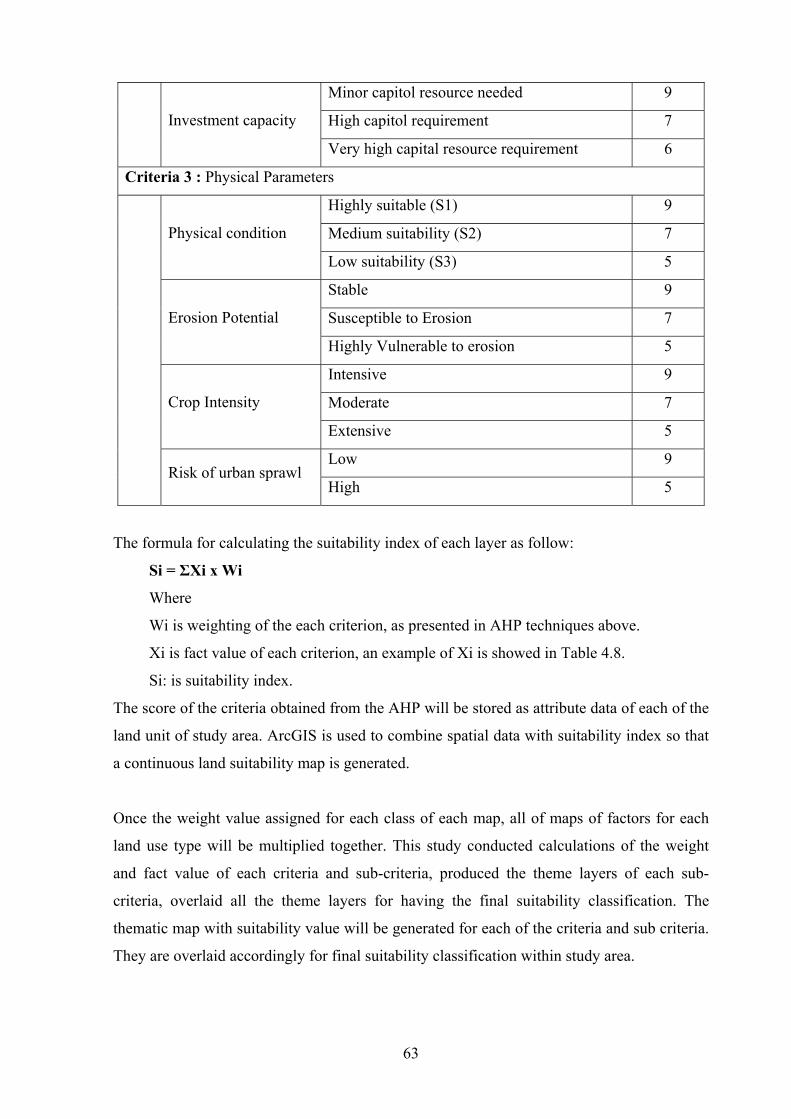
63
Minor capitol resource needed 9
High capitol requirement 7 Investment capacity
Very high capital resource requirement 6
Criteria 3 : Physical Parameters
Highly suitable (S1) 9
Medium suitability (S2) 7 Physical condition
Low suitability (S3) 5
Stable 9
Susceptible to Erosion 7 Erosion Potential
Highly Vulnerable to erosion 5
Intensive 9
Moderate 7 Crop Intensity
Extensive 5
Low 9
Risk of urban sprawl High 5
The formula for calculating the suitability index of each layer as follow:
Si = ΣXi x Wi
Where
Wi is weighting of the each criterion, as presented in AHP techniques above.
Xi is fact value of each criterion, an example of Xi is showed in Table 4.8.
Si: is suitability index.
The score of the criteria obtained from the AHP will be stored as attribute data of each of the
land unit of study area. ArcGIS is used to combine spatial data with suitability index so that
a continuous land suitability map is generated.
Once the weight value assigned for each class of each map, all of maps of factors for each
land use type will be multiplied together. This study conducted calculations of the weight
and fact value of each criteria and sub-criteria, produced the theme layers of each sub-
criteria, overlaid all the theme layers for having the final suitability classification. The
thematic map with suitability value will be generated for each of the criteria and sub criteria.
They are overlaid accordingly for final suitability classification within study area.

64
Standardization of the criteria maps
The process of setting the relative importance of the classes of criteria is called
standardization. Criteria standardization is done in present study on scale of 1-9 (table 4.9).
Table: 4.9 Suitability classifications with numerical value
Si (point) Suitability
classification Explanation
8-9 High suitable
(S1)
Suitable capacity of locations is high and satisfies all criteria
set up.
7-8 Medium suitable
(S2)
Suitable capacity of locations is medium and satisfies most
of the criteria set up, but some criteria are not satisfied.
<7 Low suitable
(S3)
Suitable capacity of locations is low and satisfies some of
the criteria set up, but most of the criteria are not satisfied.
After weightings and rating of all criteria over the hierarchy obtained, standardized criteria
maps are multiplied (Si = ΣXi x Wi) with these criteria weights at each level of the hierarchy
as shown in Figure 4.5. In land suitability analysis, a map represents each evaluation
criterion with alternatives (like S1, S2, S3, and N) indicating the degree of suitability with
respect to a criterion. These classes have to be rated, how important is the class S1 with
respect to a particular criteria to contribute for the final goal (suitability). In this particular
land suitability analysis the criteria are mainly related to economy-infrastructure, society,
and environment. Some sub-criteria of them can be represented by the GIS layer and some
are purely non spatial.

65
PhysicalSocial Economic Economic
Figure: 4.5 GIS based model for multi-criteria land suitability evaluations for agriculture

66
5 BACK GROUDND OF THE STUDY AREA Brief Description of the study area in general is presented in this chapter. Attributes of the
study area has marked effects on the tradition and culture and in turn to the cultivation
practices. So the result of the data collection is influenced by characteristics of farmers,
climate and topography research locations. The information presented in this chapter would
show the basic facts to be considered for the data analysis and interpretation of the results.
Being one of the mountainous areas and rough topography, consideration of the study area
information is of prime importance. This chapter also includes information from the
socioeconomic, demography, Meteorology and vivid dimensions
Today, the Kathmandu valley faces a number of serious environmental and ecological
challenges. The ecological degradation in the hills and the rapid degradation in the quality of
the urban environment, including riverine ecology, have raised concerns both at home and
abroad. Rapid environmental issues addressed by the Nepal Environmental Policy and
Action Plan (NEPAP), which were endorsed by the Environmental Protection council, Nepal
government in September 1993. The development and implementation of an environmental
action plan for the valley is identified in NEPAP as a priority area of action.
5.1 Outline of Physiography of Nepal
Nepal, with its land area of 147,181km2 between the latitudes of 26°22’N and longitudes of
80°04’ E occupies the central third of the massive Himalayan chain 2500 km long. It has a
length of about 885km, and an average width of 193km.
Figure: 5.1 Map of Nepal showing physiographic zones with outlined administrative
boundaries.

67
Physiography
Nepal endowed with rugged hills and mountains that covers more than 80% of the lands has
eight of the world’s 10 highest peaks including Mt. Everest at 8848m. The extreme range of
topography results in a wide variety of climatic conditions ranging from the tropic in the
south to the upper tree limit and perennial show, within a horizontal distance of less than
150km. Land Resources Mapping Project (LRMP, 1986) with Master Plan of Forestry
Sector, 1988 categorized Nepal into five broad physiographic categories as follows
A) Terai: The Terai occupies the southernmost part of Nepal. It stretches from east to
west. It comprises 12% of the total area of Nepal. Altitude varies from
60m to 300m above mean sea level. Conditions in the east are more
tropical than in the west: Mean annual precipitation in the far western
1547mm where as Jhapa in the Far East has 2000mm.
b) Siwaliks: The Siwaliks or Churia hills are the smallest and youngest range of the
Himalaya. They enclose some elongated east to west running cultivated
valleys known as the inner Terai (Bhitri Madesh) and some intricately
dissected outwash plains. Altitude varies with in the west the peaks being
at around 1500m with a high point of 1800m and in the east between 500
and 700m high. The Siwalik range occupies 13% of the total area of the
country.
c) Mid Mountain: Mid-mountains are the great central belt of Nepal. It extends to about
30% of the country and is composed almost entirely of a network of
ridges and valleys. It contains less than 5% of the flat land. Scarcity of
land has made farmers here use slopes that are intricately interwoven with
extensible terraces system. The highest points are in the ridges that extend
down from the high mountains (3000m)
d) High Mountains: The high Mountain zone occupies 20% of the country. Its upper
boundary is the forest line at about 4000m. The High Mountains slopes
are long, straight and steep that makes them quite sensitive to erosion
resulting high rates of sediment delivery.
e) High Himal: High Himal zone occupies 23% of Nepal. It lies between the upper
limits of forest vegetation and the crests of the Himalaya. Overgrazing has
eliminated forests from many of the valley slopes and bottom lands.

68
Table: 5.1 Physical specification of Nepal Characteristic Terai Hills Mountains Nepal
Area (km2) 34,019 61,344 51,818 147,181
Area (%) 23.1 41.7 35.2 100
Population (%) 48.5 44.2 7.3 100
Eastern Development Region (%) 14.3 7.1 1.7 23.1
Central Development Region (%) 17.0 15.3 2.4 34.7
Western Development Region (%) 7.5 12.0 0.1 19.6
Mid-Western Development Region
(%) 5.3 6.3 1.3 12.9
Far-Western Development Region
(%) 4.3 3.5 1.7 9.5
Density (per km2) 330.78 167.44 32.62 157.73
An out line of agro-ecological setting of Nepal
Nepal enjoys a monsoon type of climate with wet summers and dry winters. Maximum
rainfall occurs during June to September. Southern slopes of the himalayan mountain
receives higher rainfall (3477mm in Pokhara) while Jomsom lying north of the main
Himalayan range receives 295mm. Temperature variation with change in altitude also has
marked effects on the cropping pattern and crop production. Given the tremendous diversity
of landscapes and climate in Nepal, own system for classifying agro-ecological zones. For
such a system to be useful it must a) reflect as nearly as possible the biophysical constrains
b) be simple enough to focus on optimum land resource development. c) use existing
classification system d) delineate clearly defined altitudinal zonation and e) assist planners in
providing justification for natural resource development (Carson 1992).
Based on physiography, delineation of presently cultivated area, and altitude, four distinct
agroecological zones can be identified with different potentials for vegetable production
(PACMAR and EC 1991).
1. Tropical Zone: The tropical zone runs east-west along the southern part of Nepal, with
elevation ranging from 60 to 1000m. The temperature fluctuates between 7° and
24°C in December-January and between 24" and 41°C in June-July, with the mean
temperatures around 20-24°C. Annual rainfall varies from 1300mm in the east to
600mm in the west. This climate is found in some parts of the mid Hills and

69
Siwaliks and all parts of the Tarai. This zone accounts for about 60% of the total
cultivated land in the country.
2. Subtropical Zone: The subtropical zone also runs east-west almost along the middle
part of the country with elevation between 1000 and 1500m. Summer is long,
humid, and warm, with temperatures of 13-27°C in June-July and 2-17°C in
December-January. Annual rainfall varies between 2800mm in the east and 1000
mm in the west. This covers about 20% of the cultivated land.
3. Warm Temperate Zone: The elevation ranging from 1500 to 2000m. The weather of
moderate type, but there is occasionally snow in the higher areas. The average
winter daily temperatures fluctuate between 9° and 10°C in December-January and
between 12° and 21°C in June-July. Annual mean temperature ranges from 15° to
17°C, while annual rainfall varies from 900mm in the east to 140mm in the west.
This covers about 12% of the cultivated land. The most commonly grown
vegetables in this zone include cauliflower, cabbage, radish, broad-leaf mustard,
and potato. Road access is even more limited in this zone, which means there are
fewer accessible commercial production pockets.
4. Cool Temperate Zone: In the cool temperate zone, elevation ranges from 2000 to
3000m. Temperatures are usually low and there is snowfall every year. Mean
annual temperatures range from 10° to 15°C. This zone has about 1.5% of the total
arable land. Fresh vegetables and virus-free, good quality vegetable seed can be
produced. Commercial production is constrained by lack of roads in this zone.
5.2 An overview of Nepalese agriculture
For the purpose of the 2001/02 Agriculture Census of Nepal, an agricultural holding was
defined as an economic unit of agricultural production under a single management
comprising all livestock and all land used wholly or partly for agricultural production
purposes. In Nepal it is not uncommon that an agricultural holding is equivalent to a farm
household. There were 3.3641 million agricultural holdings identified from the listing
operation. In a span of ten years, the number of agricultural holdings increased by 22.8%, an
average annual increase of 2.3% which is also almost the same rate of increase in the
population. There have been a decreasing proportion of households that operated agricultural
holding between 1991/92 and 2001/02 in Nepal from 82.2% to 79.1%. The decrease in the
proportion of households operating an agricultural holding was felt most in the hill
ecological belt. The proportion of households who operated an agricultural holding even
increased slightly to 75.8% in 2001/02 (CBS 2006). The population census 2001 has put the

70
farm population count at 19.0325 million people. There has been a decline in the proportion
of the farm population to the total population in Nepal from 87.9% to 82.2% in the period of
10 years from 1991. Same pattern is observed among all the development regions of the
nation.
Agriculture census revealed that there were 3364.1 thousand land agriculture land holdings
in Nepal, of these 3337.4 thousands holdings were with land area of 2,653.9 thousand
hectares. A total of 26.7 thousand agricultural holdings were without land. Numbers of
agricultural land holdings are increasing in every successive decade. Similarly total area of
land holdings has been increasing steadily. Figure shows that it has increased by 57.5% over
40 years. There was a big increase in the area of land holdings between 1971/72 and 1981/82
censuses. In last decade number of agricultural land holdings without land has decreased to
26.7%. There is a steady increase in the total land area of the holdings, the average area per
holding which was 1.11 hectares in 1961/62 decreased to 0.80 hectares in 2001/02. This is
expected because the increase in the number of agricultural holdings was faster than the
increase in the total area of all holdings in the country.
Table: 5.2 Size of holdings in Nepal Census year Classification 1961/62 1971/72 1981/82 1991/92 2001/02
Total Holding 1540.0 1721.2 2194.0 2736.1 3364.1 Holdings with land 1685.4 1654.0 2463.7 2597.4 2653.9
Source: CBS, 2006
The farm size in Nepal is becoming smaller. Almost three-fourth (74.7%) of the holdings
reported less than a hectare in area in 2001/02 compared with 69.5% in 1991/92 and 66.6%
in 1981/82.
5.2.1 Characteristics of agricultural holdings and holders
At the national level 78.2% of the total holdings reported that their agricultural produce was
used only for household consumption while 21.6% of the holdings used for both purposes-
consumption and sale. Summary of characteristics of agricultural holders and holdings is
presented in table 5.3. In 2001/02 about 39.8% of the total holdings reported that their
agricultural produce was sufficient to feed the house hold throughout the agricultural year
while some 60.2% of the total holdings reported that their produce was insufficient to fee the
household for the whole year.

71
Table: 5.3 Summary tables of characteristics of agricultural holders and holdings Nepal SN Description 2001/02
A Percentage of Male agriculture holders 91.9
Percentage of female agriculture holders 8.1
B Average size of male holdings 0.81
Average size of female holdings 0.53
C Use of produce of male holdings
a. Home consumption 78.2
v. Home consumption and sale (both) 21.8
D. Sufficiency/Insufficiency of agricultural produce (%)
Sufficient to feed household 39.8
Insufficient to feed household 60.2
E Area of holding by soil type (%)
a. sand 22.2
b. Loam 33.3
c. Silt 6.3
d. Clay 20.1
e. Clay-Loam 5.5
Market oriented farming are generally in Nepal managed by farm manager. Appointing
manager in the agricultural activities is not much prevalent in context of Nepal. A hired
manager is a person who takes technical and administrative responsibilities in the
management of holdings on the holder’s behalf. There were only 7837 holdings, equivalent
to only 0.23% of the total, with a hired manager in 2001/02. Of this number, 104 holdings or
1.33% were without land and 7733 holdings or 98.67% were with land. Land holdings in the
Terai belt reported to have highest percentage of hired manager. This can be correlated with
the prevalence of higher numbers of commercial farming activities.

72
Table: 5.4 Farm labour characteristics Nepal Census year
Description 1991/92 2001/02
A Total farm population 10 years old and above 11843.5 13954.0
Economically active population 8379.6 9968.3
% of total farm population 70.8 71.4
Net economically active population 3463.9 3985.7
% of total farm population 29.2 26.6
B Agriculture Workers (%) 100 100
a. Holdings employing permanent agricultural works only 1.4 0.7
b. Holding employing both permanent & occasional workers 3.9 2.0
c. Employing occasional workers only 30.3 31.1
d. No workers employed 64.2 66.2
Figures presented in thousands
Source: CBS, 2004
Number of parcels in the country does not show a particular trend. It has been going up and
down in every successive census. At the same time average size of parcel is also changing
erratically. The average parcel size was 0.16ha in 1961/62. This value was 0.24ha for
1991/92 and it remained almost constant till now. Number of parcels is more often attributed
by rate of process of land fragmentation.
5.2.2 Land fragmentation in Nepal
In Nepal there is traditional system of family separation each individual separated family
members, especially sons get equal quantity of property including land. This means each
fragment of family land is inheritable. As land divided into small parcels, the production
efficiency of land increases but input in farm land increased considerable. So, cost benefit
analysis goes in negative direction (Upreti and Uprei, 2002). Even though the production are
not be enough to support total family for whole year. Then the further family members have
two options: either they leave farming and take up industrial or governmental work in cities
for additional income, or they sell their lands and migrate to other near by villages where
they can buy enough plot of land to continue farming.
Land tenure refers to arrangements or rights under which the holders holds or uses the land
of the holding. Land owned but rented out to other is not considered as part of the holding. In
Nepal, while the average holding size is small, most of the holdings are owned. The

73
ownership of the holdings under one form of tenure is estimated to be 2,939.6 thousand
hactare in 2001/02. It is very popular to rent land are on the share cropping basis. Of the total
rented land, 56.5% area being rented at that time (CBS 2006).
5.2.3 Land holdings
Land use refers to the major classification of the use of the different parcels of land in the
holdings. All land operated by agricultural holdings is classified as either agricultural land or
non-agricultural land. The total area of all agricultural holdings in the country has been
increasing (table: 5.5). On the other hand, non-agricultural land are those lands that are part
of the holdings that comprise woodland or forest (not commercial) and all other land, unused
and undeveloped potentially productive land and all other land in the holding not elsewhere
classified including the home of the holder.
Table: 5.5 Summary of land use in Nepal in chronological order Census year Description
1961/62 1971/72 1981/82 1991/92 2001/02 Total area of holding 1685.4 1654.0 2463.7 2557.4 2653.9 Agricultural land 1626.4 1592.3 2359.2 2392.9 2497.7 Arable land 1591.0 1567.0 2287.5 2323.4 2357.0
Agricultural land as % of total area of holding 96.5 96.3 95.8 92.1 94.1
Arable land as % of total area of holding 94.5 94.7 92.8 89.5 88.8
Non agricultural land 59.0 91.7 104.5 204.5 156.3 Non agricultural lad as % of total area of holding 3.5 3.7 4.2 7.9 5.9
Numbers in ‘000 ha Source : CBS, 2006
When agricultural land use in Nepal is concerned, there identified only four major kinds of
land use types. This catagorisation has been done in traditional ways and is incorporated
within the legal frame work. The properties of such land use type have been based on the
land characteristics. These four traditional categories of agriculture land use type are legally
recognized by Nepalese Land reform act. Characteristics of each of them are specifically
given in table 5.6.

74
Table: 5.6 Legal land use types in Nepal Major kind of Land Use Type (LUT) Characteristics ABBAL DOAM SIM CHAHAR
Main Attribute Good quality fertile land
Well drain sloppy land
Water logging land
Soil mixed with gravel
Soil Loam type Sandy Clay soil in low land Gravel texture
Cropping system Paddy-Wheat Maiye-mustard Single paddy Maize
Land Tax More Lesser Wetland rete Very low Assign by society Cultivation Cultivation Wetland crops Buiding up
area
Land under temporary crops is under the category of arable land which is very important in
attaining food self-sufficiency in Nepal. Such land is legally denoted as Abbal.
5.2.4 Cultivation system
The total area under temporary corps had increased by 23% between period of 1981/82 and
1991/92 however increment is rather slow between 1991/92 and 2001/02. Among temporary
crops, different kinds of vegetables are common commodity in the diet of the Nepalese
especially those who are vegetarian by choice. In 2001/02, the number of vegetable growers
has not really increased proportionally relative to other temporary crops in the last ten years
having registered a proportion of 29.6% in 2001/02 compared with 28.2% in 1991/92.
However, if we examine its growth as a group, the number of holdings raising vegetables
had increased by 28.2% in the last ten years, from 763.1 thousand holdings to 978.1
thousand holdings in 2001/02. The area used in growing vegetables also increased by 51.9%
in the last ten years although proportional with other crops, vegetables growing shares only
1.4% of the total area under temporary corps in 2001/02. Majority of the holdings growing
vegetables are found in the hilly belt composed of 53.1% (518.9 thousand) of the total
growers but a significant number (387.6 thousand) are found in Terai belt.
Total area under vegetables in 1995 was estimated to be about 144,000ha, only about 4% of
the total cropped area. In 1995, total vegetable production, excluding potato, was estimated
to be 1.33 million ton, at an average yield of roughly 9.2 t/ha. With an estimated population
of 22 million in 1995, annual per capita vegetable availability at the farm level was estimated
to be about 60kg (Pradhan and Perara, 2005).

75
Average area of vegetable crop was only 200m2 for the country, which is the same size
found in hill and Terai belts. In terms of rate of usage of the vegetable area, the mountain
belt holdings reported the highest at 500% followed by Terai belt holdings with 400%. Hill
belt holdings reported the lowest utilization rate of 250%. This low utilization rate in Hill
belt may be due to the cultivation of long maturing type of vegetables like Asparagus.
Tubers group is another group of temporary crops that are equal important to the diet of the
Nepalese people. This crop is grown all over Nepal but in small scale. The average area
planted was only one tenth of a hectare, which can be considered as subsistence type of
farming. Potato, Yam, Taro, etc. are the major crops of this category. In 2001/02 there were
950.1 thousand holdings raising any kind of tubers, most of which are planting potatoes both
during winter and summer. The tuber growers comprise about 28.7% of all holdings engaged
in raising temporary crops in 2001/02. About 91% of the total tubers crops are occupied by
the potato alone (CBS 2006). Spices is one of the cash crops, which is categorized as one of
the non food crops that can provide immediate cash income to the farmer since these crops
are not for table consumption of the family. Only 14.3% of the totals holding raising
temporary crops were engaged in spices growing in the very small aggregate area of 40.7
thousand hectares which is only 1 percent of the total cropped area. Figure shows that there
was an increase in the number of holdings growing spices in consecutive years.
There has been an increasing use of chemical fertilizers in the cultivation of important crops
in Nepal since 1981/82. It is notable that in the increase in area fertilized were vegetables
and maize with 150.5% and 81.6% increase respectively. The use of fertilizers among
vegetable farmers is comparatively lower than potato growers both in 1991/92 and 2001/02.
Vegetable growers in terai belt still reported to have the highest percentage of fertilizer users
compared with the other belts (CBS, 2006). The use of pesticides by crops growers in the
80s decade was practically unknown where the highest percentage was reported among
wheat growers with only 1 percent that applied pesticides in their farming operations. Less
then 1% among rice, maize, potato and sugar cane growers used pesticides during the same
period. Potato growers also increased their utilization of pesticides from 0.5% in 1981/82 to
10.7% in 1991/92 to 19.5% in 2001/02 (CBS, 2006).

76
5.2.5 Agricultural systems in Kathmandu valleys
Agricultural land dominated the Kathmandu Valley over 35 years ago. The largest
conversion occurred between 1991 and 2000. GIS study show that between 1984 and 1998,
about 6,300ha of fertile and productive agricultural land were lost to urbanization,
industrialization, and quarrying of sand, soil, and stone (IUCN, 2001).
In uplands of Kathmandu Valley there are both subsistence and at semi-commercial systems
of vegetable production are practiced. Subsistence farmers generally grow vegetable crops in
small areas, mostly mix-cropped with staple food crops for domestic use. Commercial
cultivation produces for market consumption. Due to the commercialization, there is a
change in the agricultural system from traditional to more specialized monoculture practices.
This causes changes in the productivity of crops (Budathoki, 2002). Introduced varieties of
seed and agricultural inputs are also in use. Kathmandu valley posses, both urban and peri-
urban vegetable cultivation practices. Special peri-urban is more important and cultivated in
commercial scale then urban.
Kathmandu valley represents middle hills of Nepal. Hill farmers in general are small scale,
resource poor and they farm at subsistence level. Modern technologies offered by various
governmental and non-governmental organisations are often inappropriate for them and
therefore they cannot reap the harvest of these technologies. Most of these technologies need
high external inputs, ideal environmental conditions and good and timely crop management,
which is not within the capacity of resource poor hill farmers. However, the hills of Nepal
are a good source of local, traditional and indigenous vegetable crops and varieties. These
may not be superior, but they are appropriate for the local conditions. Therefore, it is
suggested that programs of collection, identification and evaluation of these crops be started
however, there are some varieties and technologies that need further research. These
activities could be done jointly by research stations, farmers and concerned Agriculture
Development District Offices for fast expansion of the appropriate technologies (Budhathoki
1992).
In 1997 HMG/N adopted a 20-year Agricultural Perspective Plan (APP) with the aim of
accelerating agricultural growth from about 3% in the first half of the 1990s to 5% in the
following 20 years. The APP emphasizes realigning investments in selected priority inputs,
particularly: (i) shallow tube well irrigation in the Tarai; (ii) agricultural roads; (iii) fertilizer;

77
and (iv) technology development and delivery (research and extension). It directs new
investments to priority outputs, especially rice, citrus, apple, vegetables, livestock, and
forestry products. Agribusiness is emphasized as part of a commercialisation strategy. The
increased farm incomes arising out of realigned investments are expected not only to bring
direct benefits to the farming community but also to generate strong multiplier effects on
growth of output and employment in the rural non-farm sector, as the principal means of
addressing unemployment, poverty and environmental degradation. The strategy requires
packaging the component parts at the district, village and farm levels. The APP further
envisages a decentralized and participatory implementation mechanism that operates at the
district and national levels and is complemented by an analytical body at the national level to
facilitate reinforcement and adjustment of the plan targets over time. Once implemented this
innovative implementation mechanism is expected to constitute a major step towards
improved participatory Governance (FAO and UNDP 2003).
5.3 Features of Kathmandu valley
The valley is elliptical in outline 25km along east west axis with maximum width of 19km.
The mountain ranges rise rather abruptly on all sides of the valley. These mountains attains
heights of 1800m to more in east and west, where as in north and south they culminate in
Shivapuri peak (2732m) and Choking peak (3132m) respectively. The grains of geological
structures run in east -west direction and consequently several ridges run into the valley in
the form of east-west directions. With the exception of Nagarjuna ridge, these ridges seldom
rise above 1500m altitude.
Kathmandu Valley lies at 1300m above sea level and is located between latitudes 27°32’13”
and 27°49’10” north and longitudes 85°11’31” and 85°31’38” east. Its three districts,
Kathmandu, Lalitpur, and Bhaktapur, cover an area of 899km2, whereas the area of the
valley as a whole is 665km2. Kathmandu Valley lies in the central hilly region of Nepal
(Figure: 5.2). The valley with bowl shape is 19 by 30km. The total area of the Kathmandu
Valley is 640km2. The valley encloses the entire area of Bhaktapur district, 85% of
Kathmandu district and 50% of Lalitpur district. It comprises three districts: Kathmandu
(395km2), Lalitpur (385km2) and Bhaktapur (119km2). There are 115 VDCs and five
municipalities in these three districts. Of these, 25 VDCs are situated outside the watershed
boundary of the Kathmandu Valley. These five municipalities are the main growing urban
areas of Nepal: Kathmandu Metropolitan, Lalitpur sub-metropolitan, Bhaktapur

78
Municipality, Kirtipur Municipality and Madhyapur Thimi Municipality, covering an urban
area of about 97km2.
The net area of Kathmandu Valley which is based on a watershed boundary covers 81% of
total area of Kathmandu district, 32% of Lalitpur district, and the whole of the Bhaktapur
district (Figure 5.2). At the same way part of the Kathmandu district covers 55% share of the
total study area, similarly Lalitpur covers 26.2% and Bhaktapur district covers 18.8% of the
potential study area.
Figure: 5.2 Map of the study area
The valley has tectonic origin (Hagen 1998). The floor of the valley lies at an average
elevation of 1250m from the mean sea level from which mountains rise rather steeply on all
sides above 1800m the highest being the Phulchoki ridge with elevation of 2831m in the
east. The valley floor is made up of fluvio-lacustrine sediments with vertebrate fossils of
quaternary age (ESCAP / HMG 1993). Two other distinctive associated physical features of
the valley basin are Dol and Tar. The former is an alluvial flood plain, formed by recent
alluvia freshly deposited by the rivers while the latter is an elevated terrace or table land and
is relatively old. In Kathmandu Valley, elevated terraces are formed in between alluvial
flood plains.

79
Figure: 5.3 Alluvial plains with terraced rice field
The valley is bowl shaped and surrounded by the Mahabharata mountain range on all sides.
There are four hills acting as forts of the valley, Phulchowki in the South East,
Chandragiri/Champa Devi in the South West, Shivapuri in the North West, and Nagarkot in
the North East. The highest altitudes are 2,166m (in Bhaktapur), 2,732m (in Kathmandu),
and 2,831m (in Lalitpur).It is surrounded by hill in all the sides and ridgeline of which forms
the potential limits of its watershed. The prominent boundary features of Valley inclueds
Shivapuri peak (2732m) in the north, Phulchoki ridge (2831m) in the south, Chandagiri lake
(2200m) in the south-west, Bad-bhanjyang in the west and Sanga Bhanjyang in the east. It is
one of the typical hilli regions. The surrounding mountains also known as Mahabharat range
are composed of a thick sequence of meta-sedimentary and metamorphic rocks such
phyllites, quartzites, siltstones, schists and marble. These sediments are formed between
Precambrian and Tertiary age (HMG / ICIMOD / CDG / UNEP 1994). The hills are
generally heavily dissected. The lower and gentler slopes have been used for terrace
cultivation and forests are found only on higher elevations.
5.3.1 Regional geology
The alluvium filled valley of Kathmandu is bordered by a sequence of unmetamorphosed to
slightly metamorphosed sedimentary rocks of Paleozoic and Precambrian age in south east
and west directions. In the north it is bordered by schist, gneiss and granitic rocks. The
southern range of Phulchoki and Chandragiri consists of cross bedded radish sandstones and
shales, indicating their deposition under oxidizing conditions, perhaps continental. These are
overlaid by gray and purple shales, white quartzite, bluish green calcareous shales, and
hematite bed. The western range of Bhedunga and Nargarjun, and eastern ranges of Soorya

80
Binayak, contain a sequence of phyllites, limestone and quartizes. These are some what more
metamorphosed. Traces of fossil like markings are known. The calcareous rocks of Nagarjun
show ripple marks and are high in sandy fractions where as those of Adeswor are finally
bedded and rich in calcium carbonate. These rocks also indicate deposition in shallow
waters.
North of this in Mudku-tin Piple and Dhulikhel areas lies sandstone and siltstone which have
been partly metamorphosed to phyllites and fine grained schists. These rocks have been
described as Precambrian in age. The main hills of Kakani-Shivapuri range, north of
Kathmandu are made up of gneissic granite, and gneisses with occasional bands of garnet-
sillimanite schists. These are intruded by tourmaline-bearing granites.
The Kathmandu Valley itself is made up of fleuvo-lacu-strine deposits of Pleistocene age,
exposed in terraces situated at various altitudes. These are dominantly clay and sands with
minor gravel beds. Diatomaceous white clay and minor peat horizons are also present
associated with a major formation of vivianite-bearing bluish gray clay. The geological
formations of this area are unique in Nepal in having fossiliferous Paleozoic rocks south of
the main Himalayan Range. These fossils show affinities with those of Kashmir, Spiti and
Northern Kumaon on one hand and those of Shan State of Burma of other. Whether this
represents a continuous sea joining these areas in the Silurian age (450 million years ago) is
a question beyond the scope of the present paper. After this there is a very big gap in the
sedimentary sequence of this area, the next being the alluvium formations of Kathmandu
Valley of Pleistocene age (less than one million years old).
What was the factor that caused the formation of alluvium filled valley of Kathmandu is a
question which is yet to be answered. It will require some geophysical investigation to
establish the nature and configuration of the valley below the alluvium. It is seen that at the
northern half of Kathmandu Valley the development of coarse sand of granitic composition
is widespread. This reflects the lithology of the provenance (Shivapuri-kakani Range) from
where these sediments were derived. In the central area Kalimati (a variety of porous bluish
gray clay, which looks black when wet) is well represented. This clay contains traces of
vivianite (a phosphate of iron) and some diatoms. In the southern edges of this formation at
places, whitish diatomaceous clay is represented. It is locally called 'Kamero'.

81
In the south pebble beds containing pebble of quartzites and phyllites make a capping on the
fine sand. It is well representative in Nakhu Khola area. Apart from this mountain wash and
talus of angular materials skirts the valley along the foot of the hills. Lentricular bodies and
thin horizons of peat are exposed at various places in the valley most of which are
concentrated at the outer edges. Some drill holes ranging from 200 meter to 375 meters in
depth were drilled fro underground water. Most of these holes could not reach bedrock. The
nature of sediments encountered was in the main similar to those at the surface. A typical
drill log at central of the valley is represented below in the table 5.7.
Table: 5.7 Typical drill log in centre of Kathmandu valley at Lagan Tole apprance of horizon in different distance range from the land surface.
Depth Range in Meters Strata
0 - 10 Sand, vary coarse to fine grained, micaceous, with quartzite pebbles, occasionally.
10 - 221 Clay, dark black, with light greenish dark clay intercalations often in laminated form, occasionally gritty, with green hyalite shale pieces and peat and lignite bands.
221 - 230 Sand, coarse to medium grained with peaty to lignitic clay bands.
230 – 283 Clay, black, plastic, gritty, with sand, consisting of quartz, felspar, muscovite, granite, chips and phyllites chips.
283 - 286 Sand as above, coarse grained, with small gravel essentially quartzite-quartz and felspar with few schistose sandstone pieces.
283 -313 Clay, dark black, very compact sand, with sand fine grained, micaceous and occasionally pebbles (resulting in angular quartz gravel on drilling)
313 -325 Predominately sand, very coarse grained arid pebbles with intercalation of clay, dark black compact of ten gritty and carbonaceous.
325 - 355 Gravel, small sized and sand very coarse grained of the same composition as above with or without lignite and peat.
355 - 361 Clay, dark black, as above, with some gravel in the bottom 2 meters.
361 - 367 Sand, coarse to very coarse grained granitic in composition with thin gravel and clay intercalations.
367 - 376 Clay and sand, as above, intercalated. Analysis carried out by Geologist P. N. Sharma
The sedimentary in the valley seem to be partly deposited in lacustrine conditions giving rise
to diatomaceous clay and partly along meandering rivers in swampy conditions giving rise to
peatalenses at several horizons. The Pliestocene age of these deposits in indicated by the

82
presence of fossil teeth of an extinct species of elephant, Stegodan ganesha. It shows that
conditions were suitable for the elephant to ream in the valley in Pleistocene.
5.3.2 Climate
The Kathmandu valley belongs to the sub-tropical to temperate physiographic zone.
However, topographic setting causes to have great variation in climatic condition between
the valley basin and the surrounding hill ridge. The broken topography of mountainous
regions creates a complex mosaic of topoclimates. Spatial analyses of many climatic
elements on a horizontal planar projection of such topography are almost meaningless.
Therefore, consideration of the vertical dimension (elevation) for spatial analysis of climate
in Kathmandu valley is an important matter. Climate data for the study area has been
collected from 16 different weather stations scattered within the valley (table 5.8). Stations
are situated in different altitudinal range.
Table: 5.8 Meteorological stations in Kathmandu Valley Msld Station Altitude (m) Longitude Latitude 1007 Kakani 2064 85.250000 27.800000 1015 Thankot 1630 85.200000 27.683333 1022 Godavari 1400 85.400000 27.583333 1029 Khumaltar 1350 85.333333 27.666667 1030 Kathmandu 1336 85.366667 27.700000 1035 Sankhu 1449 85.483333 27.750000 1039 Panipokhari 1335 85.350000 27.733333 1043 Nagarkot 2163 85.516667 27.700000 1052 Bhaktapur 1330 85.416667 27.670000 1059 Changunarayan 1543 85.416667 27.750000 1060 Chapagaun 1448 85.333333 27.600000 1061 Lubhu 1341 85.383333 27.650000 1071 Buddhanilkantha 1350 85.367000 27.783333 1073 Khokana 1212 85.283333 27.633333 1074 Sundarijal 1490 85.416666 27.766666 1075 Lele 1590 85.283333 27.583333
Precipitation
According to Department of Hydrology and Meteorology (DHM), mean annual precipitation
at the study area ranges between 1500mm to 2000mm and an average rainfall of 3220mm
annually for long period of time. The valley receives south-east monsoon is the main rain
bearing wind which delivers about three fourths of the total rainfall during the wet summer
seasons i.e. June thorough September. While the winter months remain mostly dry,

83
occasional precipitation occurs in the form of winter rains caused by westerly cyclones
(Suman, 2004).
Figure: 5.4 Spatial distribution of precipitation (Source: Suman, 2005)
Rainfall in the valley is not evenly distributed within geographical range of the valley. The
highest precipitation is normally occurring on the southern slopes of Shivapuri peek
(2732m). The amount declines considerably from the surrounding ridge to the valley bottom
with decreasing trend at Nagarkot, than at Godavari and finally lowest at Kathmandu foot
plains. However, the rainfall in the hilly areas was found almost double to the rainfall in the
valley floor. About 80% of the annual rainfall was found to be occurred in the monsoon
season. In an average 37% of the days in a year were rainy days in the valley.
050
100150200250300350400450500
Jan Feb Mar Apr May Jun Jul Aug Sep Oct Nov Dec
Rai
nfal
l (m
m
Figure: 5.5 Average monthly precipitation in Kathmandu valley

84
Temperature
Minimum temperature at the study area ranges from 0°C to -4°C. Similarly, maximum
temperature ranges from 26°C to 30°C.Elevation is the main influencing factor on
temperature, together with geographical location and aspect. About 99% of the variation in
temperature can be explained by elevation and geographical location, and 90% by elevation
alone. In Kathmandu valley, the observed average lapse rate for the period from 1992 to
2002/03 was -0.5°C/100m on the basis of annual data. 16 climatological stations at study
area are considered. All available mean monthly maximum and minimum temperature values
from 1992 to 2001-2003 are complied. For other stations, the maximum and minimum
temperatures were estimated using the temperature model. The average monthly
temperatures from 16 different stations are presented in figure 5.6.
Average Temperature in Kathmandu Valley
0
5
10
15
20
25
30
Jan Feb Mar Apr May Jun Jul Aug Sep Oct Nov DecTime in Month
Tem
pera
ture
(cel
cius
)
T_Max
T_Min
T_Mean
Figure: 5.6 average monthly temperature of Kathmandu valley.
From the available temperature data analysis in the Kathmandu valley, slight increasing
trend was observed over the period from 1992 to 2003. Mean annual temperatures in this
period were about 18°C to 19° C at the valley floor and about 14.5°C to 15.5°C at Nagarkot,
the higher elevation station considered for the study. The maximum annual temperature
reached up to 32° C (26.7) with a lowest value of 24.7°C. The minimum annual temperature
ranged from 0.7°C (11) to 12.6°C. From the analysis of temperature data of last 10 years, it
was found that for mean monthly temperature it is increasing and reaches up to 32°C at
Kathmandu Airport in 1999, for mean monthly minimum temperature it is decreasing and
falls up to 0.7°C – 0.9°C at Khumaltar station during 1995 to 1999 A.D.
Within a year, there is a temperature variation between average temperatures of 9.7°C in
January to 22.2°C in July measured in Kathmandu airport station and between 9.76°C in
January to 24°C in July measured in Khumaltar station. The highest maximum temperatures

85
are measured in May to June months, in the pre-monsoon season, although the highest
average temperatures are usually observed in the monsoon season. This is mainly due to the
increased cloud cover during the rainy season. In the pre-monsoon season cloud cover often
breaks up and allows full sunshine and heating up the air. The diurnal temperature range or
variation in the summer is small because nights are usually warm. While in winter as nights
are usually cold the diurnal range of temperature is greater. The range is greater for
Kathmandu core area than for higher elevation stations. Kathmandu core area has an annual
range nearly twice as high (14.3°C) as that of high elevation stations.
Wind Speed
Wind was classified as light, medium and strong wind due to the limited data (Nayava,
1981). DHM has published wind speed data only up to 1990. Wind speed in the valley was
only published for very few stations. The wind speed data measured at some of the 6 stations
are used to plot chart, shown below.
In Kathmandu valley, Maximum wind speed is 170.23km/day in the month of April and
Minimum is 101.5km/day in the month of September. In Kathmandu Valley most of the
days have a daily wind speed of 1 to 1.5m/s. The average wind speed is 127.09km/day.
80
90
100
110
120
130
140
150
160
170
180
Jan Feb Mar Apr May Jun Jul Aug Sep Oct Nov Dec
Spee
d K
m\d
ay
Figure: 5.7 Average monthly wind speed of Kathmandu valley.
Relative Humidity
Average mean monthly relative humidity for 08:45 and 17:45 NST have been tabulated for
the periods from 1992 to 2002 for all the 6 stations in Kathmandu valley. The relative
humidity in January (minimum) ranges between 70% to 80% and that in July (maximum) is
greater than 85%. The average of the relative humidity taken at the above mentioned hours

86
is taken as the mean relative humidity. The spatial variability of this parameter is too high
and cannot be estimated from the single location. Therefore the FAO (1998) method was
used to determine relative humidity from the maximum and minimum temperatures
measured at each site.
Solar Radiation and Sunshine Hours
Total sunshine duration has been derived for the formula presented by Frere and Popov
(1979) reference of latitude and longitude of the location. Calculation shows that
photoperiod extends from 13 hour 52 minutes in June to 10 hour 24 minutes in the winter
day of December. There are 2 stations which have records of sunshine hours in Kathmandu
valley used for the study. The cloud cover itself is an important factor in the amount of
radiation that reaches the earth‘s surface and actual sunshine hour calculation.
Evapotranspiration
Apart from precipitation, the most significant component of the hydrologic budget is
evapotranspiration (ET). ET varies regionally and seasonally; during the drought period it
varies according to weather and wind conditions. It also alters with the elevation, surface
steepness (slope) and surface orientation i.e. aspect (Shilpakar, 2003). The highest annual
ET is 1492mm/year and lowest goes as low as 262mm/year for Katmandu Valley (Suman
2004). The higher variation in ET in the mountain environment is mainly due to higher
variation in solar radiation resulting from surface steepness and orientation.
Lambart and Chitrakar (1992) studied the potential evapotranspiration of Nepal had
concluded that the PET values for each month regressed against elevation (which ranged
from 100 to 3700m) give quite consistent, good correlations (r2 ranging from 0.61 to 0.89).
Recently, WELINK(1998) has used only light wind in all the ET Calculations in the gandaki
Water Basins study. FAO‘s method (1998) assumes that the dew point temperature is close
to the minimum daily temperature and therefore uses this value for the estimation of the
actual vapor pressure.

87
Spatial Distribution of ET
The spatial distribution of evapotranspiration in the Kathmandu valley show ET lapse rates
varied between about 18mm and 42mm per 100m decrease in elevation during the study
period from 1992 to 2003. On an average, the reference evapotranspiration is estimated to
change at about 28 to 32mm in every 100m elevation difference (Shilpakar, 2003).
Figure: 5.8 Spatial distribution of evapotranspiration ( Source: Suman, 2005)
Pan evaporation method may help to determine rough crop water requirement. In
Kathmandu, general estimation shows that there accounts eight months of high ET and less
rainfall. This condition may lead to water stress situation.
5.3.3 Water Resources
Water, a basic need for survival, is in constant short supply in the Kathmandu valley.
Formally, the Bagmati River and its tributaries were able to fulfill the irrigation, drinking
water and other needs of the valley. Water demand for domestic use has increased due to the
high population growth, while the increasing numbers of industrial, tourism and institutional
establishments have put tremendous pressure on the already diminishing water sources.
Alternative sources of ground water abstraction are also limited due to the geological
condition of valley’s sub-strata. In order to increase the water supply to meet current
demands, water sources outsides the valley needs to exploit. At the same time water
resources present within the valley needs to be handled wisely with proper management.

88
River System
The Bagmati River system originates at Bagdwar, about 15km north of Kathmandu city, in
the Shivapuri hills (2723m). the major tributaries of the Bagmati river system are a)
Bishnumati, Tukucha khola, dhobi Khola, Bagmati, Manahara and Hanumante, all flowing
from the north and northeast part of the valley, b)Nakhu Khola, Khodku Khola, Godawari
and Gundu Khola, from the south and c)Tribeni khola and Balkhu khloa from the western
part of the valley. The total drainage outlet at chobhar is 585km2, while the Bishnumati
River has the highest drainage outlet at 103.4km2 and Dhobi khola the lowest at 28.9km2
Table: 5.9 River System of Kathmandu Valley
Name of Length Elevation Origin Name of Length Elevation Origin
river (km) (m) river (km) (m)
Bagmati 35.5 2732 Shivapuri Bandar Manamati 6.1 2000 Bhandari danda
Bishnumati 17.3 2300 Shivapuri tarebhir Manohara 23.5 2375 Manichur danda
Bosan 6.1 1800 Pokhari bhanjyang Matatirtha 5.0 2000 Matatirtha danda
Dhobi 18.2 2732 Shivapuri danda Nagmati 7.9 2443 Shivapuri danda
Godavari 14.8 2200 Phulchoki danda Nakhu 17.6 2200 Bhardeu ridge
Hanumante 23.5 2000 Mahadevpokhari Samakhusi 6.4 1350 Dharampur-east
Indrawati 16.8 1700 Dahachok danda Sangla 10.7 2000 Aale dnada
Indrayani 7.0 2000 Bhangari danda Syalmati 4.8 2200 Shivapuri danda
Kodku 14.9 2000 Tileswor danda Tribeni 10.7 1700 Bhirkot
Mahadev 9.2 2000 Aale danda Tukucha 6.4 1325 Maharajganj
Source: Pradhan 1998
The general slope of the valley area is towards the central part and hence to the south-west.
All the tributaries flow centripetally towards the centre of the valley to meet the Bagmati.
During monsoon season the rivers get flooded and deposited enormous amount of sands and
fine particles over the banks. In dry season, their water level is unusually small despite they
are perennial. Besides rivers, there are other water sources such as ground water and springs
in the valley. The total annual runoff of the Bagmati River at chobhar, the outlet point, is
estimated to be approximately 500 million cubic meters, with a mean annual flow of
15.5m3/s between 1963 and 1980. The maximum mean monthly average discharge of
53.4m3/s occurs in August and the minimum of 1.55m3/s in March. However there is a
significant fluctuation in the annual discharge, the range being 9.3m3/s in 1969 to 23.2m3/s
in 1975.

89
Most of the rivers that flow through urban Kathmandu are now polluted and are unsuitable
for drinking and other domestic use. Pollution is primarily attributed by mixing of sewage
and industrial effluents. The increasing population density in Kathmandu valley, in the
absence or lack of suitable urban planning, a haphazard manner and large-scale
encroachment in the floodplain of the river systems are clearly evident problems. Squeezing
of natural river channel and construction of human settlements near flood plains of Bagmati,
Bishnumati and Balkhu rivers are the major causes in deepening of the river channel. This
accelerates the soil loss rate (Ranjit and Shakya, 2005).
It is estimated that about 135000tones/year (Binnie, 1988) to 760,500tones/year (SMEC,
1992) of sediment passes through the valley. Due to landslide, erosion and bank cave-ins
with land washouts on the riversides; the sediment transport is higher during times of high
flood. Besides this, the forest area of the surrounding watersheds decreased by 40% from
1955-1996. The watershed of the Bagmati River and its tributaries are deteriorating.
Hydrologic cycle of the valley is being affected after rapid devastation of the forests in the
valley area.
The valley has also witnessed an increase in industrialization and commercialization. The
number of manufacturing establishments has gone up from 608 in 1976 to 2142 (with more
than 10 persons employed) in 1993. Manufacturing establishments, which has grown quickly
and haphazardly in the past decade, have contributed to the valley's economic growth but
have also contributed to unplanned urbanization and pollution on prime agricultural land.
Manufacturing establishments in the valley have contributed significantly to water and air
pollution. Industries often overlook the regency to maintain built-in-pollution control
mechanism in their establishments. Quarries such as the Godavari marble quarry and many
other smaller units scattered throughout the valley, and the practices of cement factories,
brick factories and other industrial establishments, have also caused continuous degradation
of the valley's unique geography and threatened the valley's tar (uplands) ecosystems
including surrounding hills.

90
5.4 Forest vegetation and biodiversity
The forests on the valley floor and around the valley rim provide basic needs to rural
communities. However, raid, haphazard urbanization, high demand for forest products,
illegal and unregulated quarrying has depleted much of the forest vegetation except in
protected forests. The major ecological implications are loss of vegetation, declining
recreational sites and decreasing water resources.
In 1996 forest land covers 20,945ha (32.7%) of the total area of the Kathmandu Valley. Land
use changes between 1984 and 1996 show that the quality of forests has greatly declined
with a significant depletion in biomass. There has been a significant increase in shrub land.
Gradual conversion of forest into shrub land and then to grasslands is very rapid. It was
estimated to be 6 fold more than last decade (interpretation of digital data).
Figure: 5.9 Agriculture land invading forest area
The forests in and around the valley of Kathmandu provide basic needs to rural
communities, clean water for valley residents, and recreational sites for tourism in addition
they also help in situ conservation of biological diversity. The natural vegetation, except in a
few conservation areas, has been under intense pressure. The area under natural forest cover,
excluding shrubs, is 10847ha. Conversation of natural forest into shrub land causes increase
into shrub land area presently is estimated into3688.4ha. In total only about 25% natural
forest area is remaining in the valley. This fact suggests that part of the natural vegetative
area also under active urban sprawl. Natural mature hardwood forests are now confined to
parks and sacred areas such as Nagarjun (Raniban), Gokarna and Shivapuri watershed and
Wildlife Conservation forest, and Bajrabarahi forest. Quarries cover 84ha of forest land in
the valley (MoPE, 2003).

91
Forest vegetation types
The main vegetation types prevalent in the valley are as follows;
1. Schima-castanopsis association on the valley floor and hill slopes,
2. Pinus roxburghii on the lower hill slopes and on the southern aspects such as
Bhobhar, Jargajun, Nagrakot, Bisankhu and so on,
3. Quercus lanata dominating the upper hill slopes of Phulchoki, Shivapuri and
Chandagiri,
4. Quercus lamellose-Lauraceae in the middle of Phulchowki,
5. Quercus semecarpifolia is abundant in the hill slopes of Shivapuri and Phulchowki
6. Rhododendron arboretum on the upper raches of the valley hills eg. Phulchowki
Forest stock of the valley is not in good condition. Quercus and Rhododendron have more
than 70% crown cover whereas most of the natural Pinus roxburghii, Schima-Castanopsis
forests have less than 40% crown cover and are rapidly turning into shrub land. About 1,312
plant species belonging to 162 vascular families are found in the valley, representing 26% of
the total of plants recorded in Nepal (KVWMP, 1994). Among 256 species of birds about 33
bird species have disappeared from the valley due to habitat destruction. Most of the quarries
are located in medium to steep slopes and cause considerable damage to the adjacent areas.
Some smaller scattered patches of forests found in the valley which are about 25-30 patches.
In 15 VDCs no forest stand exists. Majority of the patches possess of Pinus roxburghii
species of reforested stands. Trees are planted along the roads in the urban areas but are
poorly managed. They are mostly of Eucalyptus, Protea sp, Jacaranda sp, and Camphor.
The depletion of vegetation cause eco-degradation in the valley, resulting in a) as unbalanced
hydrological cycle, b) loss in plant and animal species, and c) landslides, slips and gullies.
Since 1996 there were no significant changes in the forest land of the valley because public
forest had already used by local people to certain extent and remaining forests stocks are
been conserved under community management i.e. community forestry.
Utilization and management of forest resources
Fuel wood is the main sources of energy for cooking in rural households. People harvest
directly from the forest.

92
In some of the forest around the valley is devastated for the charcoal making, timber
extraction, uncontrolled livestock grazing, etc. This adversely effects on growth and natural
regeneration.
5.5 Erosion level
With increasing demand for high quality vegetables, new land areas (inevitably with steeper
slopes than presently under cultivation) are being opened, despite difficulties in crop
management practices. The dissected land morphology of the highlands, often with
cultivated slopes of up to 30°, and intense rainfall (2500-3000mm year) largely confined to
the rainy season, are conducive to serious soil erosion which, besides causing a loss of soil
fertility which results in declining crop productivity. Seasonality in the harvest of cabbage
and cauliflower has the greatest influence on exposed cultivated land area, particularly since
farmers are accustomed to collect and remove crop residues from their fields (Midmore
at.al., 1996). Rill erosion is considered the most serious.
The deteriorating condition of the watershed in the valley is mainly attributed to
anthropogenic cause. The Kathmandu Valley Watershed Management Project (KVWMP,
1994) identified 23 sub watersheds in the valley. It is estimated that the soil loss on sloping
terraces, shrub, and landslide areas is 40mt, 32mt and 200mt/ha respectively. There is an
urgent need to assess the ecological effects of such activities, especially in the forest areas.
Certainly, the long term loss will be much greater than the immediate economic benefits.
Based on the experience of topsoil it is assumed that more eroded soils would have lower
clay fractions and higher sand fractions. Clay content in the soil of Kathmandu valley is
decreasing with increase of altitude and slope (Baniya, 1995). This signifies the extent of the
erosion in valley landscape. Data on the percentage of clay in soil from farms gives an idea
of soil erosion.

93
5.6 Vegetable markets
One of the important government policies in the Eighth Five-Year Plan is to improve the
agricultural marketing system through government and private sector participation (NPC
1992). The plan recognizes that it will not be possible to increase vegetable production and
consumption in the country unless appropriate marketing infrastructure is developed and
other related support is provided. Basically, there are two types of vegetable markets:
1. Producers' supply markets: It is generally located in the vicinity of production
pockets. Here producers bring product to deal with middleman and also for
sale to wholesalers
2. Consumer markets: It is located near major urban centers or urban market centers and
gets supplies from producers' markets as well as from out side. Involvement
of wholesalers and commission agents will be there. The marketing
channels for vegetables differ by the origin of the product. Also, there are
different systems for each type of vegetables. Some of the market channels
are:
Figure: 5.10 Marketing channels for tomato in Kathmandu
It is found that marketing channel is one of the prime concerns of the producers.
Involvement of the middle man is not preferred to the small holding farmers because of
output of the product is lowered. However farmers producing in commercial scale has
obligation to make use of middleman because of regular and in time marketing.
From the official record of the Kalimati Vegetable and Fruit Market Development Board
(KFVMDB, 2007) total vegetable import in 2006 was 1849.24278Mton and in 2005 it was

94
1315.26691Mton. This scenario shows that there is increase in the vegetable import per
year. It appears from the data analysis from different sources as well as GIS data analysis as
well the land area is decreasing inside the Kathmandu Valley and simultaneously population
pressure increasing. This creates more dependency on the vegetable on neighboring districts.
Local farmers sell their production on their own, without passing through any marketing
channel. Such marketing do not have any records, so it makes problem to make marketing
assessment. Present shows that less than 5% farmers go through this channel and it takes less
than 3% share of channalised marketable vegetables amount.
4% 6%1%
89%
Bhaktapur KathmanduLalitpur Rest contribution
Figure 5.11 Share of vegetable arrival in Kalimati contributed by valley districts
Figure 5.11 shows that only in Kathmandu District, about 90% vegetable come from outside
the valley. All together some one tenth of the total consumption in the valley has been
supplied by within the valley. But market study of all three districts indicates that about 72%
of demand fulfilled by the import from outside including India and Tibet and about one
fourth is produced within the valley. This reduced production is neither because of the lack
of the availability of the sufficient land resources, not faulty cultivation method, but
technically sound cultivation with realization of the land capability is not properly addressed.
Therefore, research like present study with well addressed land suitability situation is much
relevant to enhance productivity and to meet growing demand of the valley.

95
21122.351
19956.300
10640.240
12732.970
15390.535
17475.077
5500.858
7103.460
2371.803
0
5000
10000
15000
20000
25000
Tomato Potato R Potato W Onion bulb Cabbage Couliflower Reddish W Cucumber Ginger
Qua
ntity
in M
Ton
Figure: 5.12 Species wise vegetable marketed in Kathmandu vegetable market.
Of total vegetable imported in the Kathmandu Valley, Potato, including both red and white
potato, occupies top position with more than 30000Mton. Tomato occupies second position
with 21122Mton and cauliflower occupies third position. Similarly cabbage and onion
occupies fourth and fifth position respectively. All above mentioned vegetable species are
suitably grown in Kathmandu valley.
Dhading19.66%
Gorkha1.22%
Jhapa0.97%
Kathmandu5.73%Kavre
17.71%Lalitpur1.45%
Makawanpur9.15%
Nuwakot1.72%
Other5.60%
Sarlahi5.94%
Chitwan6.83%
Morang0.09%
Bara0.10%
Bhaktapur3.86%
Tibet1.06%
India14.04%Tanahu
0.44%
Sunsari0.47%
Rautahat0.80%
Parsa2.96%
Nawalparasi0.19%
Figure: 5.13. Sources of the vegetable import in main market of valley

96
Kathmandu valley is one of the attractive markets for the vegetable growers in the
neighboring district dwellers. Figure 5.13 gives an indication of vegetable imported to the
valley from different source district, besides this about 15% contribution come from the
India. In the same way contribution of the China (Tibet) is about 1.6%. All sorts of fresh
vegetable come from India where as only dried vegetable is imported from the China.
5.7 Demography and socio-economy
Kathmandu valley being capital city, all the opportunities and economy is concentrated.
Besides this since emergence of Maoist insurgency in the country, many people get migrated
to the valley due to sense of security. Therefore, whole socio-economic and population trend
has changed drastically.
5.7.1 Demography
The Kathmandu Valley has witnessed rapid population growth in urban areas and adjoining
Village Development Committees (VDC). During the past 20 years, there has been a
phenomenal rate of growth in the Kathmandu valley's population with significant role of in-
migration. According to the census of 1920 (although not a scientifically conducted census)
the total population of the Kathmandu valley was 306,909. The1950s marked a turning point
in Nepal's demographic and political history. The first scientific census was undertaken
during 1952/54, in two phases. According to this census there was a total population of
410,955 in the valley, of which 52.2% were rural residents. The size of the population in the
valley has gone up from 0.41 million in 1952/54 to 1.1 million in 1991 (table as shown).
The growth rate between 1981 and 1991 is alarmingly high. The average annual growth rate
for the three districts of valley is 3.7% with 5.1% in the urban areas and 2.3% in the rural
areas while the growth rate of the Kathmandu Valley during the same period was 3.83%. If
this rate continues unabated, the total population of the valley districts will double in less
than 19 years. Among the three districts, Kathmandu had the highest annual growth rate of
4.81%, Lalitpur 3.81% and Bhaktapur 0.8% between 1981 and 1991.

97
Figure: 5.14 Map of population distribution in study area
The growth rate of the urban population is higher than the rural population. The intercensal
growth rate of the rural population was much higher during 1961 – 1971 and lower for the
period 1971 – 1981. It is probable that most of the permanent migrants to the valley districts
prior to 1971, lived in the rural settlements close to urban localities. In later years more
people began to concentrate in the urban areas, contributing to the rapid growth of the urban
population. The accelerated growth of the urban population after 1971 is further reinforced
as the adjoining rural areas were amalgamated into the municipal areas.
Table: 5.10 Distribution of population by districts of Kathmandu valley, 1991-2001
District 1991 % of total population 2001 % of total
population
Annual growth
rate Lalitpur 257,086 1.39 337,785 1.46 2.73 Bhaktapur 172,95 0.94 225,461 0.97 2.65 Kathmandu 675,341 3.65 1,081,845 4.67 4.71 KVD* 1,105,37 9 5.98 1,645,091 7.10 4.06 Source: CBS 2003 * Kathmandu valley districts
Population growth of the valley
First population census was carried out in 1952 official figures of that census showed the
population of urban area of Kathmandu Valley (KV) was 196,777, which is less than half the

98
urban population of whole Nepal. Due to the development trend and migration towards the
urban centers causes the urban population of KV increases to 995,966 against 2,227,879
people living in urban areas of whole Nepal.
Table: 5.11 Population density (per sq. km) from 1971 to 2001 Year
Location 1971 1981 1991 2001
Kathmandu 646.71 1068.95 1709.72 2738.85
Lalitpur 392.89 478.81 667.76 877.36
Bhaktapur 830.68 1342.58 1453.38 1894.63
Kathmandu Valley 623 963 1277 1837
Nepal 79 102 126 157
Level of urbanization is 60% in Kathmandu and that of the whole Nepal is accounts only
13.9%.
5.7.2 Socio-economic condition
Human development
The Human Development Index (HDI) provides a composite measure of three dimensions of
human development: living a long and healthy life, being educated and having a decent
standard of living. The HDI for Nepal is 0.534 (Appendix table 5). The UNDP Human
Development Report (2004) indicates that Nepal is ranked 140th in HDI. It belongs to the
category of low human development countries. However, it has been steadily increasing
since 1975.
ICIMOD et al (2003) report that Kathmandu district is ranked first in the overall composite
index of National development; the other two districts of Kathmandu Valley, Bhaktapur and
Lalitpur rank 4 and 5 respectively ( Appendix table 6).
Lalitpur district has a larger population and area than Bhaktapur. But the distribution of the
per capita development budget is higher in Bhaktapur district. It also shows that Kathmandu
has higher non-agricultural occupation than other districts in the Valley. The income gap
spurs migration into the Kathmandu Valley. This survey has also identified that 44% of the
poor live in rural areas, compared to 23% in the urban area (UNDP, 2004).

99
Poverty
The Human Poverty Index for developing countries (HPI-1), focuses on the proportion of
people below a threshold level in the same dimensions of human development as the human
development index - living a long and healthy life, having access to education, and a decent
standard of living. The HPI-1 value of 38.1 for Nepal, ranks 84th among 108 developing
countries. All three districts are placed in the higher level of the National poverty and
deprivation index. Among these districts, Kathmandu ranks first, Bhaktapur second and
Lalitpur third. 25 years ago, then Nepal’s economy was predominantly agricultural. Still, the
agricultural sector has more than 36% in the GDP, while the non-agricultural sector has 63%
at the national level. Population migration also had a major effect on the economically active
population rate in the Valley. In 1991, almost 15% of the total urban populations were
migrants.
Employment Opportunities
Table: 5.12 Distribution of Population by Industry in 1995-96
Industry % of Population Agriculture 14.8 Mining 0.1 Manufacturing and Processing 21.9 Electricity, water and sanitation 1.2 Trade/commerce and related services 20.8
Construction 4.4 Transport and communication 5.5 General Labours (not specified) 4.4 Services (other than commercial) 26.9
Source: Nepal Rastra Bank, 1999
Most of the economic activity in the country is centered in Kathmandu Valley. Table 5.12
shows that more than 20% of the economically active population is engaged in the services
sector. Only about 15% is engaged in agriculture compared to 80% at the national level.
Income and Expenditure
Nepal Rastra Bank (NRB, 1999) reports that an average per capita income of Kathmandu
valley urban area is more than NRs 24,000 (US $ 343). Higher per capita income in the
Kathmandu valley is in administrative and managerial work. Farmers also have a good
income compared to other groups but higher family members in a household reduce
purchasing capacity. Marginal farm households are operational agricultural landholdings
(work themselves on farm as owner or tenant) having farm size of 0.5ha or less.

100
The major food production in each district is converted into kilocalories per capita per day
and used as an indicator of the availability of food. Major food production is taken as the
total production of rice, maize, wheat, millet, barley and potatoes. In this regard, Bhaktapur
district produces more food. It is because larger proportion of Bhaktapur's population is
involved in farming activities.
Table: 5.13 Food productions in KV Indicator Kathmandu Lalitpur Bhaktapur
Per capita food production (kilo calories) 2,263 2,385 4,267
Source: ICIMOD et al, 2003
Kathmandu district ranks first in total development facilities, but third in development
facilities related to agriculture. All agricultural facilities are high in Lalitpur district, but it
has poor irrigation facility compared to Bhaktapur. Bhaktapur produces surplus food, which
it sells to the city area of the Valley. Bhaktapur's per capita food production is at 4,267 kilo-
calories, which is higher than the other two districts (Table: 5.13). Lalitpur district comes
third in total infrastructural development. This is because all 20 VDCs (68% of land) of
Lalitpur district are situated in the hilly area of Mahabharat Range; only 32 per cent of the
district’s area is situated inside the Valley, causes to place it at lowest overall development
rank.
As we descend from periphery of valley to the central followings changes are evident.
a. Cost of land per unit area is higher, which has influence on R/C ration. This used to
be inspirational factor for conversion of agricultural land into non-agricultural and
use.
b. Increase number of construction on agricultural land area. Number of holding
adopting vegetable cultivation is reduced.
c. Decrease in agricultural labour availability, because high turn over rate of off farm
employment.
d. Increase in rate of land fragmentation and decrease in area per land holdings this
situation results into high input cost for cultivation.
e. Increase in water scarcity for irrigation.

101
6 DATA ANALYSIS AND RESULTS
Present chapters have been concerned primarily with the land and key soil properties, soil
classification soil qualities & characteristics of soil found in the study area. It aims to
identify current status of land use, land management and changes in land use form. In
addition, this Chapter briefly lights on main land utilization types and cropping systems, and
makes description on the production situation of the vegetables crops. Results obtained will
be relates to multi-criteria land suitability evaluation in following chapters.
6.1 Land use in Kathmandu valley
6.1.1 Land characteristics
Basic sources of soil data in the present study is Global and National Soils and Terrain
Digital Databases (SOTER), Digital soils and Terrain of Nepal, Version one released in
2004. Greater soil types and sub types are inherited according to the designated land unit.
The soil data related to spatial information and boundary are calculated with the scale of
1:50,000. Soil collection was done through random sampling methods and taken for the
fertility test. Digital soil maps developed by the department of Survey, Government of Nepal
are further combined with the soil data collected during the field visit. Necessary updating
was done especially physical and chemical soil properties of the study area. Land form and
terrain type has also selectively inherited from different data sources. All of soil classes, sub
classes and their physical and chemical properties have certain degree of influences to the
cultivation practices in the study area. Therefore, the land suitability evaluation for the
selected different vegetables crops would have to judge primarily on the basis of the soil
characteristics. This has been found in the study area about indigenous names of soil types
and production potential which was normally used by farmers to denote land types and
practices on it.
Kathmandu valley is one of the represented land mass of the middle mountain of Nepal. The
features and land characteristics of the valley resembles the middle mountain are presented
in a generalised form like land form with dominant soil type and slope level in the table
6.1.1. According to Land System Report 1986, the major soil types found are Psamments,
Ustorthents, Ustifluvents, Fluvaquents, Ustochrepts, Haplustalfs, Typic, Rhodic, Udic,
Lithic, Anthrophic and Haplumbrepts (LRMP, 1986). Typic, Rhodic, Udic and Anthropic are
dominant.

102
Table: 6.1.1 General land and soil characteristics in the middle Mountain of the Nepal Land
System Landform Land Unit Dominant Soils Dominant Slopes
Dominant Texture
9a River channel Psamments, Ustorthents <10 Fragmental
Sandy 9b alluvial plains
Ustifluvents, Fluvaquents, Ustochrepts <10 Loamy /
Bouldry 9 Alluvial plains
and fans 9c Alluvial fans Ustochrepts, Haplustolfs, 1-50 Loamy /
Bouldry 10a non-dissected
Typic and Rhodic, Haplustalfs, Ustochrepts 0-50 Loamy
10 Ancient Lake and River Terraces 10b
dissected Typic and Rhodic, Haplustalfs,Ustochrepts 0-50 Loamy
11
Moderately tosteeply sloppingmountainous terrain
Typic, Rhodic, Udic, Anthropic, Subgroups of Ustochrepts, Dystrochrepts, Haplumbrepts
<300 Loamy Skeletal
12
Steeply to verysteeply slopingmountainous terrain
Lithic, Subgroups of 11 and Usatorthents >300 Loamy
Skeletal
Source: Land Resource Mapping Project, System Report, LRMP, 1986.
6.1.1.1 Soil Groups
Soils of the Kathmandu valley was classified according to soil classification methods from
the FAO-UNESCO classification system. Soil has been categorised in the broad groups and
sub groups. The valley area accounts for five major soil groups & seven sub soil units (table
6.1.2). Distribution pattern of the soil groups are associated with the physiography of the
valley and they are redially distributed. Dystrochrept and Rhodustalf groups have two sub-
groups each while, rests of all other are single.
First group of soil Dystrochrept Anthropic show its distribution in the northern periphery of
the valley boundary. There are series of uplands which extends up the 2600m above sea
level. Altogether 14 land units have this type of soil covering an area of 1733.27ha which
accounts for 7.2% of total agricultural land are in the valley. From productivity point of
view, these types of soil holds moderate amount of the soil nutrients and most of them are of
residual type; therefore they are taken as moderately productive type.
Dystrochrept Aquic is another sub group of Dystrochrept soil group which is distributed
more in the north west part of the valley in between hills. Only single land unit is represented

103
by this soil type. 572.38ha of land with 2.4% of total agricultural area of the valley has been
covered by this type. Cereal corps are cultivating in this type of land continuously.
Fluvaquent Aeric is one of the most recognized soil types for the cultivation in the valley.
Flat land in the valley floor is covered with this type. Loamy textured soil is with recent
pedogenetic history are accumulated. Alluvial plains of the valley are made up of this soil.
This is of transported soil and is formed due to the deposition of the soils around the hills. In
these areas rate of conversion into build up area is very high. Unfortunately majority of the
urban settlements are encroaching fertile land. In an existing condition, 4250.7ha from 12
land units have these types of soil group. In total they occupy 18.1% of current agricultural
land area of the valley.
A Rhodustalf soil group has two sub groups in Kathmandu valley namely Rhodustalf
Anthropic Udic and Rhodustalf Scalpic. They cover an area of 2792.84ha and 5515.78ha
respectively with percentile conversion accounts 11.9% and 23.5% respectively. This is the
dominant soil types in the ancient lakes like in Kathmandu and river channels. Majority of
the periurban area in the Kathmandu valley has Rhodic soil type, where extensive cultivation
of paddy-wheat is done. This soil groups occur in between surrounding hills and alluvial
plains. Few patches of Ustifluvent Aquic Anthropic soil groups are also present in scattered
form within valley. Altogether it is 6.4% of agricultural land area which accounts 1503.61ha.
Maize-Barley cultivation pattern are dominant in this type of soils. Coarse textured soil in
moderately steep land posses this soil groups. This soil type is often found in the mountain
terrain of the middle hills of Nepal.
Greater soil group found in Kathmandu is Ustochrept soil, there are two sub groups of this
soil types namely Ustochrept Aquic and Ustochrept Paralithic. Paralithic sub group of soil is
one of the dominant soil types in the northern to east northern upland of Kathmandu valley.
Eastern part of Kathmandu district and Bhaktapur district posses this type of soil. This soil
group covers largest area that account for 25.4% with an area of 5965ha of agricultural land
area. However, soil texture category of skeletal loamy are dominant with mixture of gravel
and residual soil proportions. Area occupied with this soil groups are moderately slope of
less then 30 degree. So water retention capacity is drastically reduced and organic matter
content is also low. Therefore soil quality in general is categorized as low.

104
Table: 6.1.2 Soil types in Kathmandu Valley Soil Types Count Area (ha) % of Ag land
Dystrochrept Anthropic 14 1733.24 7.4
Dystrochrept Aquic 1 572.37 2.4
Fluvaquent Aeric 12 4250.71 18.1
Rhodustalf Anthropic Udic 22 2792.84 11.9
Rhodustalf Scalpic 17 5515.78 23.5
Ustifluvent Aquic Anthropic 6 1503.63 6.4
Ustochrept Aquic 11 1102.75 4.7
Ustochrept Paralithic 2 5965.79 25.4
Total 85 23519.33 100
Map depicted for the soil classification according to FAO-UNESCO system, show eight soil
groups present within small area of the valley (figure: 6.11). On this basis it can be
concluded that variations in the soil types can be related in the variation and orientation in
the land form and cultivation practices. Pattern of land use and cultivation implies that soil
appears to be exhausted in terms of nutrients. To bring back soil into good quality require to
increase the organic matter contents, therefore need of constant application of organic
manure seems necessary.
Figure: 6.1.1Greater soil types map of Kathmandu Valley

105
Moreover, topographic diversity has also contributed to some extent on diversity of soil
group. Terrain type also causes soil loss, it can be mitigated but cannot completely be
prevented. This fact has little been supported by the cultivation of the indigenous varieties of
large number of vegetables within Kathmandu uplands.
6.1.1.2 Physical soil characteristics
Texture
Soil parameter to be studied has been categorised into physical characteristics and chemical
characteristics. Soil texture means the relative proportion of the various size groups of
individual soil particles. Texture provides important information regarding water holding
capacity, permeability, irrigation requirement and erodibility. Growth and development of
the plant primarily based on the soil texture. Root penetration, nutrition absorption through
soil particles, water holding capacity, water infiltration and percolation are affected by
texture type. Similarly, type of plant like tuber crop or leafy vegetables etc are well grown in
specific soil texture class. There is little diversity found in terms of soil texture in
Kathmandu valley. It possesses Loamy, loamy skeletal and loamy bouldery type of broad
texture class.
Figure: 6.1.2 Area covered by soil texture in Kathmandu valley

106
Soil test analysis reveals that loam, sandy loam, sandy bouldery, and silty loam are
distributed in different land units. Loam and sandy loam are much more preferred soil type
for the Kathmandu valley vegetable farming community which is one of the most suitable
categories and accounts for 45% of the total existing agricultural land area of the valley. This
figure is about 18% of total land mass of the Kathmandu valley. About 1% i.e. 260ha of
agricultural land area has very rough texture and apparently not able to support any crop
cultivation, this is catagorised into unsuitable on the basis of texture parameter (figure 6.1.2).
Figure: 6.1.3 General land form in Kathmandu Valley
The particularly, soils on the valley bottom are of alluvial type where as on the peripheral
mountain range are skeletal ones. Majority of the land unit possess different form of loamy
soil. Pedogenesis in the Kathmandu valley is not much old, recent history of pedogenesis has
been attributed general types of land form as indicated in the SOTOR (2004) database. Area
coverage of general land type is given in the table 6.1.3.
Table: 6.1.3 General land forms in Kathmandu Valley SN GENERAL Land Forms Counts Area (ha) 1 Alluvial plains and fans (depositional) 18 4948.45 2 Ancient lakes and river terraces (tars) (erosional) 45 9285.97 3 Moderately to steeply sloping mountainous terrain 12 7491.63 4 Roughy alluvial slopes 6 1503.61 5 Steeply to very steeply sloping mountainous terrain 4 289.62 Total 23519.33
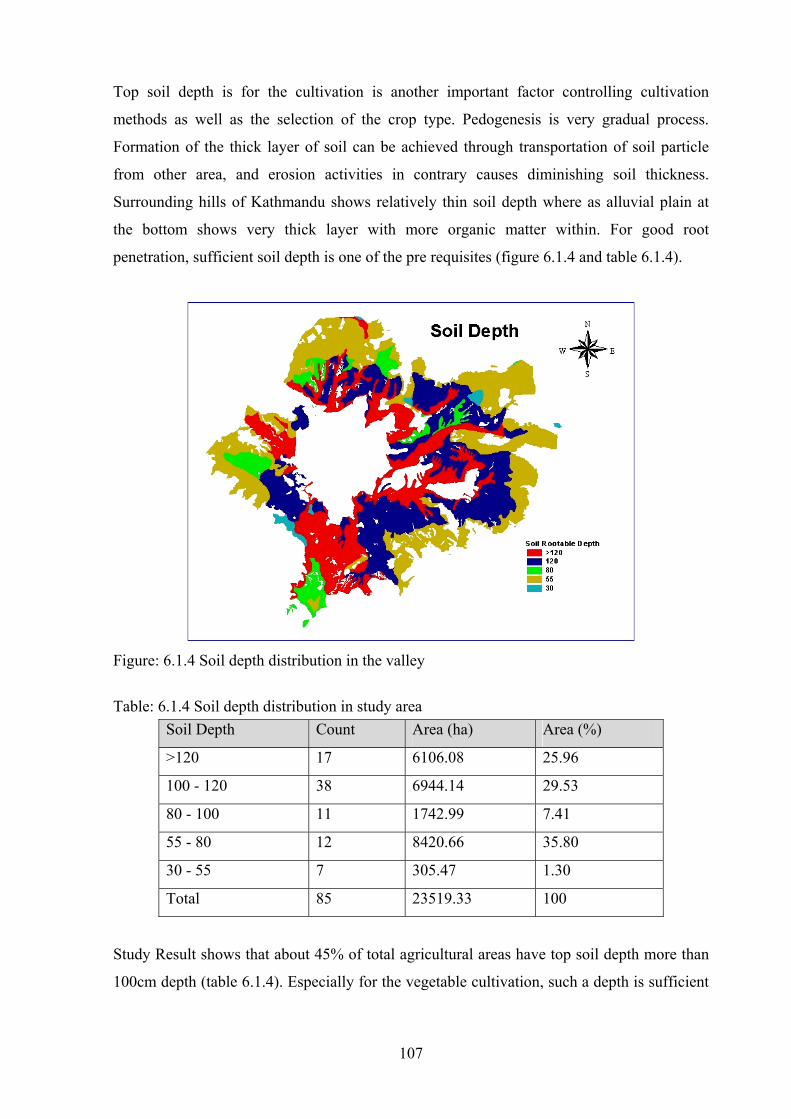
107
Top soil depth is for the cultivation is another important factor controlling cultivation
methods as well as the selection of the crop type. Pedogenesis is very gradual process.
Formation of the thick layer of soil can be achieved through transportation of soil particle
from other area, and erosion activities in contrary causes diminishing soil thickness.
Surrounding hills of Kathmandu shows relatively thin soil depth where as alluvial plain at
the bottom shows very thick layer with more organic matter within. For good root
penetration, sufficient soil depth is one of the pre requisites (figure 6.1.4 and table 6.1.4).
Figure: 6.1.4 Soil depth distribution in the valley
Table: 6.1.4 Soil depth distribution in study area Soil Depth Count Area (ha) Area (%)
>120 17 6106.08 25.96
100 - 120 38 6944.14 29.53
80 - 100 11 1742.99 7.41
55 - 80 12 8420.66 35.80
30 - 55 7 305.47 1.30
Total 85 23519.33 100
Study Result shows that about 45% of total agricultural areas have top soil depth more than
100cm depth (table 6.1.4). Especially for the vegetable cultivation, such a depth is sufficient

108
and categorised to the most suitable soil depth category. Most of the hilly landscapes with
sloppy topography have thin soil layers with lesser number of horizons.
6.1.1.3 Chemical soil characteristics
Soil fertility
Cultivation always aims for productivity. Production potential of the soil is based on the
quality of the soil. More precisely, fertility of the soil is a key to the growth and development
of the soil and productivity. The fertility of soil is a decisive factor for plant growth. And
fertility is the factor cumulatively attributed by different chemical parameter. Most
specifically Nitrogen, Phosphorus, Potassium, pH, and organic matter content are the key
parameters. So these factors work together for the productivity decision of the vegetable
crops. Fertility of the all 85 land units are given in the appendix. Moreover NPK used to get
fluctuate within given period of time it is not taken as the permanent soil parameter.
Therefore, external input can make necessary correction over soil fertility of any area.
Nitrogen in soil is an important indicator reflecting biological condition and the nutrient
status of soil. Microbes in soil change in to microbial protein. Nitrogen content of the soil
averages about 0.14% with only 5% land area contains more than 0.2% total nitrogen.
Similarly phosphorous is ranges from high to medium level.
Table: 6.1.5 Average fertility level of different soil group from study area
Soil Group pH OM
%
N
%
P
Kg/ha
K
Kg/ha
WHC
%
Dystrochrept Anthropic 6.10 2.17 0.11 41.40 49.97 11
Dystrochrept Aquic 5.07 2.33 0.22 92.10 98.16 28
Fluvaquent Aeric 5.20 2.37 0.12 123.40 68.04 16
Rhodustalf Anthropic Udic 6.60 2.23 0.16 171.42 210.30 15
Rhodustalf Scalpic 6.00 1.32 0.07 33.20 278.88 23
Ustifluvent Aquic Anthropic 5.40 2.45 0.12 173.00 206.00 21
Ustochrept Aquic 4.90 2.90 0.15 155.70 282.70 12
Ustochrept Paralithic 5.90 4.22 0.13 395.00 381.00 12

109
Soil pH
Soil reaction is the degree of acidity or alkalinity of the soil and pH is the negative logarithm
of the H ion activity. This refers to the relative activity of the H ion in the soil solution. In
present investigation pH value ranges from 3.9 to 6.8. pH of given soil presents an indication
of the degree of availability of many soil nutrients and the favourability of soil condition to
microbial activity which contributes to the fertility in turn.
Organic matter
Organic matter content of the soil is an important parameter related to soil fertility. Further
decomposition of organic matters by microbial activities yields humus. These are true
nutrient to the plant available in soil. Good humus content in soil improves infiltration rate
and water holding capacity. The high amount of soil nutrients such as nitrogen (over 90%)
and phosphorous are in organic form which become available to plants upon mineralization.
Organic matter contributes much to the cation exchange capacity (CEC) of soils and plays a
major role in retaining potassium, calcium, magnesium etc. Organic matter is ranging from
0.12% to 7.8%. This value is not the appreciably high. This indicates that constant
application of the organic matter in the soil is not appropriately done. In long run, lack of
sufficient organic matter may cause several soil complications like decrease in productivity
to soil erosion.
Water holding capacity (WHC)
Water holding capacity is the amount of water taken by unit weight of dry soil when
immersed in water. Water holding capacity gives an indication of the ability of the soil to
provide moisture over a non irrigated drought period. This capacity related to soil texture
and soil organic matter. Sand possesses low WHC, while silt, clay and soil rich in organic
matter have high values. Present investigation shows water holding capacity ranges from
28% in Dystrochrept Aquic soil type to 11% in case of Dystrochrept Anthropic. There is
fluctuation in the value of WHC even in all the sample plots within same land units.
6.1.1.4 Land characteristics
Slope gradient
As we ascend from alluvial plain towards the rocky, rough sloping mountain terrain, the top
soil depth decreases accordingly. In the hilly steep area rate of soil formation is very slow
and soil runoff due to rainfall is high. It is also evident from the slope map of study area,

110
more than half (60%) of the agriculturally significance land area posses gentle sloping
ranging from 0 to 5° slopping topography.
Figure: 6.1.5 Land slope map of Kathmandu valley
Traditionally, in the study area agriculturally practices are done making terrace, however in
the rainfeed uplands, cultivation in the sloppy areas still in practice. Due to complex land
structural slopping land has been categorised into flat, gentle slop, slightly slop, highly slop
and steep slop. Agricultural practice in the steep slop is regarded as highly unsustainable
agricultural practices. With appropriate technology, cultivation in the slope up to 30° can
have satisfactory production.
Aspect
Sun shine duration to the agricultural crop is one of the important physiological needs. Long-
day, short-day and day neutral plant can be selected for the cultivation according the suitable
day light duration. Since Kathmandu is much hilly with crisscross topography all areas are
not equally illuminated all the days of year. According to the sunshine hour data, on summer
sun shines for 14 hours and 10 hours on winter days however real sunshine hour for
particular are differs. This has affected by the terrain, so aspect is one of the important
attributes to be consider for the suitability assessment. Land units of Kathmandu valley
cannot be generalised. Aspect must be considered during land selection procedure. Majority
of the vegetables on north and north-east facing slop couldn’t contribute for the appropriate

111
growth. In the study area existing agricultural land are categorised into three different aspect
categories (table 6.1.6). First category includes flat land to east to south facing slope, second
category is land facing towards south, north and south-west where plant grow well. Finally
last category includes land facing west and west-north direction. On degree of suitability,
category I is the best and category III is holding low importance. This aspect map was
derived from the Digital Elevation Model developed from the contour map of 20m contour
line.
Table: 6.1.6 Orientation of Agricultural Land ASPECT Direction AREA (ha) %
Aspect I Flat, E, N-E, E-S 23278.68 65.1
Aspect II S, S-W, N 5875.65 16.5
Aspect III W, W-N 6607.98 18.5
35762.31
Study area shows degree of limitation to restrict growth and development of vegetable crops
homogenously. Limitations degrade the land capability to support the vegetation, so
suitability evaluation will be effected. A general climatic limitation is the inadequate
climatic factors for the optimal growth of the specified crops. Temperature indicates
inadequate heat unit, moisture indicates inadequate moisture and precipitation relates to
insufficient or excess rainfall in an area. Similarly, a general soil restriction includes water
holding capacity/texture which indicates land area where the specified crops are adversely
affected by lack of water due to inherent soil characteristics. Soil structure limitation
adversely affects the plant growth by soil structure that limits the depth of rooting, or by
surface crusting that limits the emergence of shoots. Such a restriction can be seen in organic
matter, depth of topsoil soil reaction and drainage. Similarly, general landscape restriction is
the slope limitation, landscape pattern, altitude and aspect (Pettapiece 1995). The suitability
evaluation will help on identification of the limitation so that appropriate soil and land
management approaches can be applied. Hence production potential of the land can be
enhanced.
Discussion
Soil parameters of the investigated are reveals that soil quality can support wide range of
cultivation. Most land surface has gentle slope cultivated making terrace. Irrigation facilities
are not enough in all cases. In many areas it has to depend upon rainfall. Top cultivable soil

112
depth is enough for the root depth. Organic matter content in soil is moderate, the higher
value is found in the agricultural area near the natural vegetation or forest stands. Total
fertility is low to moderate in valley soil. Fertility of the soil is more about temporary matter
and can easily be enhanced by external application of fertilizers. Nitrogen, phosphorus and
potassium fluctuation are usually maintained through external application. Integrated plant
nutrient management (IPNM) is an important component for the sustainable agriculture
intensification in an area like Kathmandu valley. It includes technologies like soil
conservation, nitrogen fixation and organic and inorganic fertilizer application (Gruhn et.al.
1995). Lower the elevation, higher the clay content in the soil is observed. More then 70%
area is loamy soil of different category that is good enough to support plant growth. Water
holding capacity coincides with the textural properties of soil; it is optimal for the growth
and development of vegetable crops. Moderate diversity of soil group in valley related with
the variation in soil parameters. Strength and limitation of the soil parameters help making
decision on soil improvement activities to enhance production potential of land.

113
6.1.2 Changes in land use and land use categories pattern
6.1.2.1 Land use categories
The urbanization of the valley started in the late 1950s, since 1970s urban growth has been
rapid and unplanned. Land use in greater Kathmandu has changed dramatically in the last
two decades. In greater Kathmandu, the urban area has expanded from 24% of the total area
in 1971 to 67% in 1991 at the expense of prime agricultural land. It is estimated that urban
areas have increased by 7% of the total valley surface area between 1984 and 1990 and
prime agricultural and has declined from 63% to 56% (Harcrow Fox and Associates, 1991).
Now the urban areas are expanding at an annual rate of 4.4% (Karki, 1991). It is estimated
that more than half of the valley's top class agricultural land is under the threat of urban
sprawl. Agricultural land occupies 40% of the total area. Combination of level terraces,
irrigated tars and sloping terraces form the agricultural lands. Similarly forest in the
peripheral area of valley and shrub land together occupies forested land category that
cumulatively occupies almost 24% land area. Shrinkage of the forested land area is not much
evident then other category. Soil clefts, sand bed in the riverbanks are also accounting some
less than 1% of land area. Forests and shrubs occupy 25%. Plantations has been carried out
since long time, this also makes the balance between degradation of existing forest and
development of forest in the marginal area, bringing almost to balance state. While urban
and industrial areas occupy 33% of the valley. The reported area ranges from 596 to 760km2.
(HMG/ IUCN, 1995). In this study, the area of the Kathmandu Valley is calculated from a
topographic map on a scale of 1:50,000; the area is 583km2. Kathmandu Valley is at a mean
elevation of 1,350 meters above sea level. The land use analysis of the Kathmandu valley
region is intended to provide for an understanding of status of the ecological conditions both
natural and man-made. In Lalitpur district establishment of stone quarries and brick
industries are also in expense of the agricultural lands.
Current land use, particularly in the urban areas, is unregulated and unscientific (table 6.1.7).
Such unplanned growth is not only prevalent in urban areas but also in rural areas such as
hilly site like Nagarkot, where tourism infrastructure and facilities are developing at
entrepreneur’s will, without any consideration for proper use of land based on its
capabilities. Soil is the major treasure of the land, qualities of the soil has not been
considered while making decision regarding its use. There has not been any defined strategy

114
and guidelines to develop the valley as an industrial and commercial centre or as a cultural,
tourist, administrative and political capital. Consequently, the valley has developed with
mixed features of industry, tourism, education and administration. Spatial representation of
current land use is presented in figure 6.1.6. The uncertainty about the Kathmandu valley’s
feature is of great concern to urban planners.
Table: 6.1.7 Land use category in Kathmandu valley Land use category Area (ha) % of valley area
Agriculture 23519.3 40.3
Built-up 19484.4 33.3
Forest 10847.7 18.6
Open field 413.9 0.7
Shrub land 3688.4 6.3
Water body 416.1 0.71
Total 58369.9
Figure: 6.1.6 Land Use Category in Kathmandu Valley, with valley boundary

115
6.1.2.2 Changes in Land use Pattern
Agricultural land dominated the Kathmandu Valley over 35 years ago. However, it has been
converted to various uses like building construction, industrial establishment, governmental
premises, etc. GIS analysis shows that 7% (2,848ha), 6% (1,962ha) and 26% (8,765ha) of
agricultural land has been converted for non-agricultural purposes from 1955 to 1978, 1978
to 1991 and 1991 to 2000 respectively. Similarly 4.6% agricultural land had converted in the
period of 2000 to 2005. The largest conversion occurred between 1991 and 2000 (IUCN,
2001). It is estimated that more than half of the valley’s ‘A’ grade land will be lost to urban
sprawl by 2010 if present trend of urbanization continue without any control measures
imposed by policy making body (MoPE 2003). The agricultural land use of three districts in
Kathmandu Valley was also studied to pinpoint the location of change. The agricultural land
use change of three districts is shown in figure 6.1.7.
Therefore district wise statistics shows that 10%, 8% and 24% of agricultural land has been
converted from 1955 to 1978, 1978 to 1991 and 1991 to 2000 respectively in Kathmandu
district. In Lalitpur District, 5%, 6% and 20% of agricultural land has been converted from
1955 to 1978, 1978 to 1991 and 1991 to 2000, respectively. Similarly, 5%, 1% and 36%of
agricultural land has been converted from 1955 to 1978, 1978 to 1991 and 1991 to 2000
respectively in Bhaktapur district (figure 6.1.7). This shows that while the lowest rate of
conversion happened in Bhaktapur district from 1778 to 1991, the highest rate of conversion
also happened in the same district from 1991 to 2000. This phenomenon can be attributed to
the value of land, which is cheaper in Bhaktapur district compared to the other two districts
(CBS, 2002, i.e. Sample Agriculture Census 2001)
The agricultural land use of three districts in Kathmandu Valley was affected by urban
sprawl within this period. Most affected district is Kathmandu while Lalitpur and Bhaktapur
are comparatively less affected. Because of the cheaper price of an agricultural land in
Bhaktapur, more land area in recent days has been going under conversion to non-
agricultural purpose.

116
Figure: 6.1.7 (a and b) Land use change in Kathmandu Valley
Unfortunately, Bhaktapur district has large number of small poor farmers compared to other
districts. Land developers bought large tracts of agricultural land in the peri-urban area, and
divided them into smaller plots of different sizes and shapes for building construction. This
is found to be peak stage of land fragmentation (figure 6.1.6). One of the main reasons of
conversion of agricultural land to non-agricultural land is the rising market prices for land.
Table: 6.1.8 Land use changes in Kathmandu valley in different course of time Land Use 1955 1978 1991 2000 2005
Agricultural 38,226 35,378 33,416 24,651 23,519
Built-up 3,330 6,152 8,917 16,472 19,484
Forest 16,810 16,831 16,028 16,350 14,948
Recreational 416
Water body 473 416
Built-up Area
Figure: 6.1.8 Expansion of unplanned settlements in agriculturally active land

117
GIS analysis shows that the built-up area has expanded from 3,330ha in 1955 to 6,152ha in
1778, to 8,917ha in 1991 and further to 16,472ha in 2000 and 19484ha in 2005 (table 6.1.8).
Figure: 6.1.9 Land use Change in Kathmandu Valley (in chronological Order)
During the period of half a century (from 1955 to 2005), the built-up area has expanded six-
fold. A district-wise analysis revealed that the built-up area was much larger in Kathmandu
district compared to other districts. Population increase is one of the main causes of the

118
urban sprawl in the valley. In migration for the facility and security are the driving factors of
the migration.
In general, GIS analysis shows that agriculture land is shrinking, forestland is stable and
built-up area is increasing in the Kathmandu Valley (figure 6.1.9). Uncontrolled and
unplanned growth has had a negative impact on the whole community, especially in
agricultural land use, such as deterioration of quality of agricultural land, shortage of labour
and domestic water, problem of solid waster management, etc. Expansion of built up area is
inevitable but well planned settlements can mitigate the related consequences.
6.1.3 Agricultural practices in Kathmandu valley
6.1.3.1 Agricultural land holding
It also accommodated the largest and most rapidly growth urban population and economy in
the country. Valley’s urban activities are taking place on flat valley bottom that is rapidly
replacing agricultural land. Average land holding size of the Kathmandu Valley is 0.263ha
(CBS, 2003). Land holding size in three districts of the valley, Kathmandu, Lalitpur and
Bhakapur are 0.25ha, 0.31ha and 0.23ha respectively. These values are quite smaller against
average land holding size against whole Nepal which is 0.80ha further this value for hilly
region of Nepal is 0.66ha and for the central development region is 0.73ha (CBS, 2006). At
the present stage of development, converting agricultural land to urban settlements appears
to be economically and socially lucrative. The high land prices on the urban fringe certainly
indicate that the rate of return and net benefits of converting agricultural land to urban uses is
encouraging. Yet the potential benefits of converting agricultural land to urban use conceal
other costs, including those caused by pollution, congestion, loss of green space rising costs
for urban management, services and agricultural products. If the present trend of
urbanization continues, all prime agricultural land in the valley, except in the hills (i.e. about
15%) will be converted into urban area by the year 2020. This would invariably lead to an
increasing encroachment on forest land for cultivation and for other purposes. The riverine
ecosystem is undergoing rapid degradation, as rivers become a major depository for urban
wastes.
National sample census of Agriculture 2001/02 shows the average area under cultivation in
Kathmandu district 13,285.4ha which has been divided into 129,897 parcels. 26354 holding

119
are getting different form of irrigation this altogether covers up the area of 5,004.1ha. Still
there are 27270 holdings are deprived of any form of irrigation sources.
Table: 6.1.9 Agricultural land area in Kathmandu valley districts Description Kathmandu Lalitpur Bhaktpur
Total Agricultural area (ha) 13285.4 9958.6 6000.1
Total number of parcel 129,897 89825 86773
Area of land with own Ownership, ha 9839 8693.1 3422.4
Area under temporary crops ha 12,718.4 9305.1 5517.6
Area under Irrigation ha 5004.1 2824.0 2588.1
Area of vegetable cultivation ha 1200.5 413.8 458.0
Area under tuber crops 1005.8 190.8 354.1
Area cultivation of Spices ha 93.9 63.9 49.7
Area of winter potato 929.2 105.2 326.8
Summer potato 37.5 57.2 26.9
Area of cardamom ha 5.6 2.0 0.0
Winter vegetables 960.5 260.6 347.0
Simmer vegetables 240 153.1 111.1
Total Land area (sq km) 395 385 119
Source: CBS (2002)
In Kathmandu district, out of 13285 hectare of agricultural land, 329.2 hectare of land area
made uncultivable due to flood or soil erosion. This area comprises 4660 number of
agricultural holdings. Sample agricultural Census, 2001/02 has indicated area with different
soil type of the valley districts on the basis of the response from the farmers is presented in
table 6.1.9.
Major issues and problems of land use in Kathmandu Valley
Prime agricultural land is rapidly being converted for urban use, and increasing demand for
fuel wood, fodder and timber in the surrounding hills has resulted in massive conversion of
forest land into scattered forests, shrub land and grassland. The major land issues facing the
Kathmandu valley are a) Lack of a comprehensive land use policy base on the land

120
capability, b) Sustainability of both agricultural and forest land in the valley has been
threatened and c) Declining forest biomass and loss of soil fertility.
The basic objective related to urban development of Kathmandu valley was set out to
promote urban development & play supportive role in economic development. It is also
aiming to establish urban-rural friendly relation. During the last two to three decades, the
transportation network has increased in the urban areas. The road network in Kathmandu is
composed of radial roads extending out from the core area of Kathmandu and functioning as
arterial roads in the valley which works as the frame work for the housing development and
expansion of settlements (table 6.1.10).
Table: 6.1.10 Interventions and their Impact of on the Kathmandu valley Intervention Impact
1. Urban uses &
Manufacturing industries
� Loss of prime agricultural land, misuse of land
� Increased extraction of sand/gravel from riverbed
� Degradation of riverine ecology
2. Industry
a. Quarrying � Loss of forest land and degradation of surrounding
forest
� Loss of agricultural productivity in the
downstream areas
b. Brick-making industry � Loss of Prime agriculture land
� Loss of mineral rich topsoil, loss of agricultural
productivity
c. Extraction of
sand/gravel from the
riverbed
� Loss of riverine features such as riverbanks
� Deepening and narrowing of river channels
� Biological threat to aquatic life and physical threat
to existing bridges
Growing household number and increasing economic activities in the valley demands much
energy in the form of electricity, petrol, diesel, gas and kerosene. Increasing demand for
electrical energy coupled with limited supply has in fact forced to use fuel wood as the main
source of energy in rural household. There is ever increasing demand of the electricity in the
valley with is presently 10%, but capacity has yet to be developed to meet the demand.
Poorer sector of the society depends on cheaper modes of energy.

121
6.1.3.2 Horticultural practices
Kathmandu Valley was predominantly an agricultural area until the 1960s, and grew surplus
crops and vegetables to feed people, shrinkage of the agricultural land caused difficult to
support the people through production of crops and vegetables within the Valley. However,
urban and peri-urban agriculture still plays a critical role in sustaining livelihoods in
Kathmandu Valley. Close to 23% of the vegetables consumed in Kathmandu are produced
by farmers in urban and peri-urban agricultures. This figure can be raised to 76% by
improving farming practices and constructing a road networking system from the peri-urban
to urban area and help to attain self-reliance in food and vegetables (Annonymus, 2001).
In Kathmandu valley two systems of vegetable production are in practice, namely at
subsistence and at semi-commercial level. In the first system' most of the vegetables that are
produced are utilized for domestic consumption, and it is estimated that about 84 percent of
the farmers belong to this group. 16% of the farmers are semi-commercial and are producing
for the market as well (Morris, 1990). Subsistence farmers generally grow vegetable crops in
small areas, mostly mix-cropped with staple food crops. Traditional and indigenous
knowledge and practices prevail. Little seed of improved varieties, or introduced practices
and inputs are adopted, and a very small fraction of time or labour is devoted to vegetable
farming. Production and productivity are both below the semi-commercial farming. In up
lands hill farming, practices are related with the tribal culture.
Figure: 6.1.10 Periurban Horticultural Practices in Kathmandu Valley
The agricultural system of valleys has rapidly changed from indigenous knowledge-based
integrated subsistence agriculture to more specialised monoculture practices. Introduction of

122
new technologies, adaptation of high yielding varieties and commercialisation of agriculture
contribute to such changes (Gautam, 2004).
Many factors have been identified causing poor productivity of vegetable crops under home
gardening conditions. The technologies were not accepted by the resource poor hill farmers,
because most of the technologies were developed for good management, high inputs, and
ideal environment conditions. Performance is found very poor under various stress
conditions, which are common in subsistence hill farming. Although many good local and
wild varieties and appropriate local farmers' practices have been reported as being available
and practiced in the hills of Nepal (Budathoki, 1992), very little attention was paid to
collection, identification, evaluation, multiplication, extension, and training activities on
these crops, varieties and practices. Another reason for failure is farmers' needs, problems,
their socio-economic conditions, access to inputs, markets, and resources are rarely
considered while planning and executing improvement programs.
A specialised core valley farming community is collectively known as ‘Jyapoos’. This
community used to produces the greatest share of fresh vegetables for the Kathmandu
market, and is known for its good practical skills and expertise in intensive traditional
agriculture, especially for vegetable production (FAO 1994). Traditional methods included
keeping and maintaining quality seeds, using local compost and organic manure are peculiar
to Kathmandu farmers. Every bit of land is used efficiently. Black clay, compost, and human
excrement were the traditional sources of manure. Similarly soil condition and crops status
were also maintained by indigenous methods. But at present number of families devoted on
the vegetable farming reduced drastically and traditional method has largely been replaced
by new ways of cultivation.
6.1.3.3 Considerations of traditional vegetable farming
A. Indigenous technologies
Local varieties and practices may be of low productivity but their production is stable. They
produce some yield, instead of complete failure and are not prone to diseases, pests, high or
low moisture levels, high or low temperature, and poor soil fertility. They are suitable for
local farming systems and practices, e.g. mixed cropping with staple crops.

123
B. Ethnicity
The geographically concentrated ethnic distribution pattern generally remained effect in way
of cultivation and farming pattern. Place like Kathmandu valley, where upland area is still
dominated by indigenous local people shows traditional pattern of farming. Conglomeration
of ethnic tribe in any locality results cultivation practice to be increasingly dispersed.
Lowland, flat area of Kathmandu basin is inhabited mostly by Newars. They historically
have been the prime agents of Nepalese culture and art. Cultivation is still adopted by
significant number of them also were engaged in farming. In that sense, they can be
described as agro-commercialists. Existing farming pattern carries a lot of traditional
practices developed by Newar of Kathmandu.
C. Labour system
Farmers could cultivate land intensively using the family labour force and labour exchanged
within the community, which enabled them to secure produces with little direct financial
cost. The labour exchange system is a social capital still widely found in subsistence
economies and popularly known as “Parma System”. But the system is slowly deteriorating
because there is less number of families fully dependent on agricultural system. This trend of
involving off farm employment is particularly seen in the younger generation. As a response
to this problem, horticulture practice has been slowly shifting towards crops that require less
labour, such as fruit plantations. However, due to the ever increasing rural–urban migration
in pursuit of better income opportunities, small farmers increasingly face labour problems
(FAO and UNDP 2003).
D. Agricultural equipment
Mechanisation of agriculture in Kathmandu valley is very rudimentary and at low level.
Majority of the holdings using the most common hand drawn agricultural equipment, the
trend is increasing in last census. The use of tractors is uncommon due to the topographic
constrains. Use of the tractor and heavy machines in Terai belt had higher incident compared
to other parts. Its use is limited in hills and mountain regions due to the topographic
constrains. Iron plough, tractor, thresher, pump set (water), sprayer, etc are the common
types of equipments used in Nepal.

124
E. Capital investments
There needs agricultural running capital especially in the seasonal basis but small farmers
are in search of such capital. It is common to obtain loan for the agriculture from different
sources. Agricultural credit was taken from the institutional sources like banks but
considerable numbers of farmers also take it from non-institutional sources. Long and
tedious bureaucratic paper works and processes discourage farmers to go through legal and
institutional channel.
F. Cropping patterns
The cropping systems in Kathmandu valley are reported in table 6.1.11 (a). Three distinct
cropping systems are prevalent in the valley: rice-based, maize-based, and vegetable-based.
Rice-based cropping systems are predominant, although vegetable-based cropping systems
are more common than in other regions. Vegetable-based cropping systems are being
adopted by farmers in other hill areas of Nepal.
Adoption of Vegetable Material
Seeds are the basic input for vegetable farming and outside sources for quality seeds are not
always reliable. Most of the vegetable material (or varieties of different vegetables) have
been adapted, acclimatized, and naturalized by local farmers, and these varieties have
acquired indigenous traits due to the processes of natural selection and genetic shift. This
indigenous germplasm has also been used as a source of breeding material by leading
vegetable agronomist of Nepal. Although most local farmers lack formal training in plant
breeding, they use individual/mass selection procedures for crop maintenance and seed
production. For example, medium- and early-maturing plants are allowed to flower and set
seeds. Seeds from these plants are then combined and used as planting material in the next
season. This practice was found very successful and vigor was maintained. Improved and
quality seeds are mostly in scarcity.
Cropping pattern prevailing in Kathmandu valley is presented below.

125
Table: 6.1.11 (a) Existing paddy and maize based cropping pattern of Kathmandu valley
a. Irrigated area
1. Paddy-Wheat-fallow 2 Paddy-potato-potato 3. paddy-Mustard-fallow
4. Paddy-potato-fallow 5. Paddy-fallow-potato 6.Paddy-vegetable-vegetable
7.Paddy-Potato-radish 8. Paddy-fallow-daddy
Partially irrigated area (not perennial source of water)
1. Rice-wheat-Fallow 2. rice-Mustard-Fallow 3. Paddy-Wheat-Mustard
4. Paddy-potato-fallow 5. Paddy-Oat-fallow 6. Paddy-fallow-potato
7. paddy-Pea-potato 8. Paddy-fallow-Fallow
Non-irrigated area (dry-slope land area)
1. Maize-Kodo-fallow 2. maize-Soyabean-fallow 3. Maize-Mustard-fallow
4. Maize-buck wheat-fallow 5. Maize-Potato-fallow 6. Maize-Vegetable-fallow
7. Maize-mas-fallow 8. Maize-fallow-fallow
Source : District Agriculture Development Centre, 2007, Kathmandu
One of the reasons for shortage of suitable seed is lack of sufficient information on seed
production aspects despite their keen interests and desperate needs. Another reason is the
introduction and extension of vegetable crops with very difficult seed production methods.
Vegetable types adopted and maintained by Jyapoo farmers in Kathmandu Valley is
presented in the appendix table.
In some of the area in Kathmandu valley farmers who are fully involved in the commercial
horticulture, use vegetable based cropping pattern (table 6.1.11,b).
Table: 6.1.11 (b) Existing vegetable based Cropping Pattern of Kathmandu Valley First crop Months Second crop Month Third crop Month
Vegetable-based
cropping patterns
Beans/cowpeas May-
Aug/sept Rasish/Turnip
Aug-
Dec Onion/Garlic
Dec-
Apr
Carrot May-
Aug/sept Beans/cowpeas
Aug-
Dec Radish/Knolkhol/turnip
Dec-
Apr
Chilli May-
Aug/sept Broad lead Mustard
Aug-
Dec Potato/Radish
Chilli/ginger May- Winter Vegetables Aug- Winter vegetables

126
Aug/sept Dec
Colocasia May-
Aug/sept Broad bean
Aug-
Dec Mustard
Gourd May-
Aug/sept
Spinach/cress/coriand
er/fenugreek
Aug-
Dec
Peas/turnip/carot/sinach/
Cress/coriander
Okra/Pumpkin/cu
cumber
May-
Aug/sept Cole crops
Aug-
Dec Squash/cucumber/potato
Soyabean May-
Aug/sept Onion green
Aug-
Dec Coriander/lettuce
Sweet Pepper May-
Aug/sept Potato
Aug-
Dec Late cauliflower/cabbage
Tomato/egg plant May-
Aug/sept Radish/mustard
Aug-
Dec Onion/Potato
Soil preparation
Human labor is used for soil preparation in the valley as the use of animal labor in the valley
floor is prohibited for religious reasons. Land is prepared by pulverizing soils to allow easier
root penetration, to facilitate mixing manure and fertilizer, and to help destroy harmful
insects and pests.
Planting and nursery management
The choice of plantation technique is influenced by factors such as the type of vegetable, the
schedule for marketing, the desired yield, and the shape, size or weight of the product. For
example, carrot, radish, turnip, spinach, cress, coriander, celery, beans, and okra are sown
directly. Eggplant, cauliflower, broad leaf mustard, chili, cucumber, and tomato are
transplanted. Cauliflower, eggplant, and chili are also replanted for delayed production.
Vegetable crops such as cress, spinach, fennel, fenugreek, garlic, onion, and coriander are
sown on sunken beds, and crops such as cauliflower, cabbage, broad leaf mustard, potato,
radish, tomato, chili, and eggplant are planted on raised beds. Nursery seedbeds are generally
preferred near the residence or in a safe corner of the main field. The nursery soil is given a
fine tilt and weeds, plant debris, pebbles, chaff, etc., are removed. After preparation of a
raised or sunken beds, 2-5 kg/m² of well decomposed compost is mixed with the nursery
soil. Seeds are usually broadcast and covered with a mixture of soil, ash, and compost.

127
Irrigation
The timing and quantity of irrigation water to be applied are influenced by conditions such
as the type of crop produced, type of soil, temperature, stage of plant growth, etc. In
Kathmandu valley, soils are heavy clay, so drainage is more important than irrigation for
successful vegetable production, especially during the monsoon and autumn seasons.
Figure: 6.1.11 Irrigation channel in rice field in Lalitpur
Good drainage is essential in rice based vegetable cropping patterns and for rainy season
vegetable production. Crops such as cauliflower and cabbage, which are highly susceptible
to high soil moisture, are planted on raised beds.
Weeding and other cultural practices
Weeding is mostly done manually, and there was no report of herbicide use. Weeds are fed
to animals or are composted, depending upon the distance of the farm from the household,
the type of animal raised, and the quantity and type of weeds gathered. Vegetable growers of
the Kathmandu valley have traditionally practiced biological methods to control insects and
diseases in vegetables. For example, when garlic, onion, carrot, ginger, basil, dundu, chive,
and coriander are inter planted with Brassicas and other vegetable crops, the incidence of
feeding and sucking insects on vegetable crops is low. Mixed or companion crop planting
also promotes the population of predators of most harmful insects.
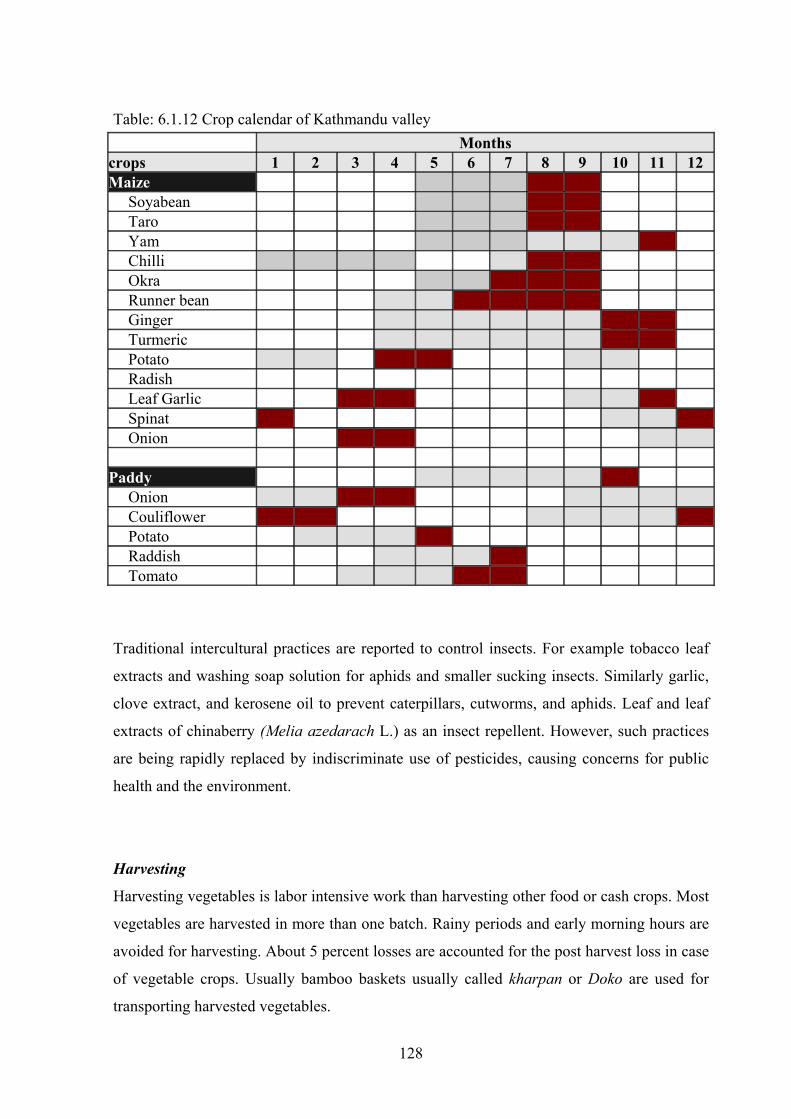
128
Table: 6.1.12 Crop calendar of Kathmandu valley Months crops 1 2 3 4 5 6 7 8 9 10 11 12 Maize
Soyabean Taro Yam Chilli Okra Runner bean Ginger Turmeric Potato Radish Leaf Garlic Spinat Onion
Paddy
Onion Couliflower Potato Raddish Tomato
Traditional intercultural practices are reported to control insects. For example tobacco leaf
extracts and washing soap solution for aphids and smaller sucking insects. Similarly garlic,
clove extract, and kerosene oil to prevent caterpillars, cutworms, and aphids. Leaf and leaf
extracts of chinaberry (Melia azedarach L.) as an insect repellent. However, such practices
are being rapidly replaced by indiscriminate use of pesticides, causing concerns for public
health and the environment.
Harvesting
Harvesting vegetables is labor intensive work than harvesting other food or cash crops. Most
vegetables are harvested in more than one batch. Rainy periods and early morning hours are
avoided for harvesting. About 5 percent losses are accounted for the post harvest loss in case
of vegetable crops. Usually bamboo baskets usually called kharpan or Doko are used for
transporting harvested vegetables.
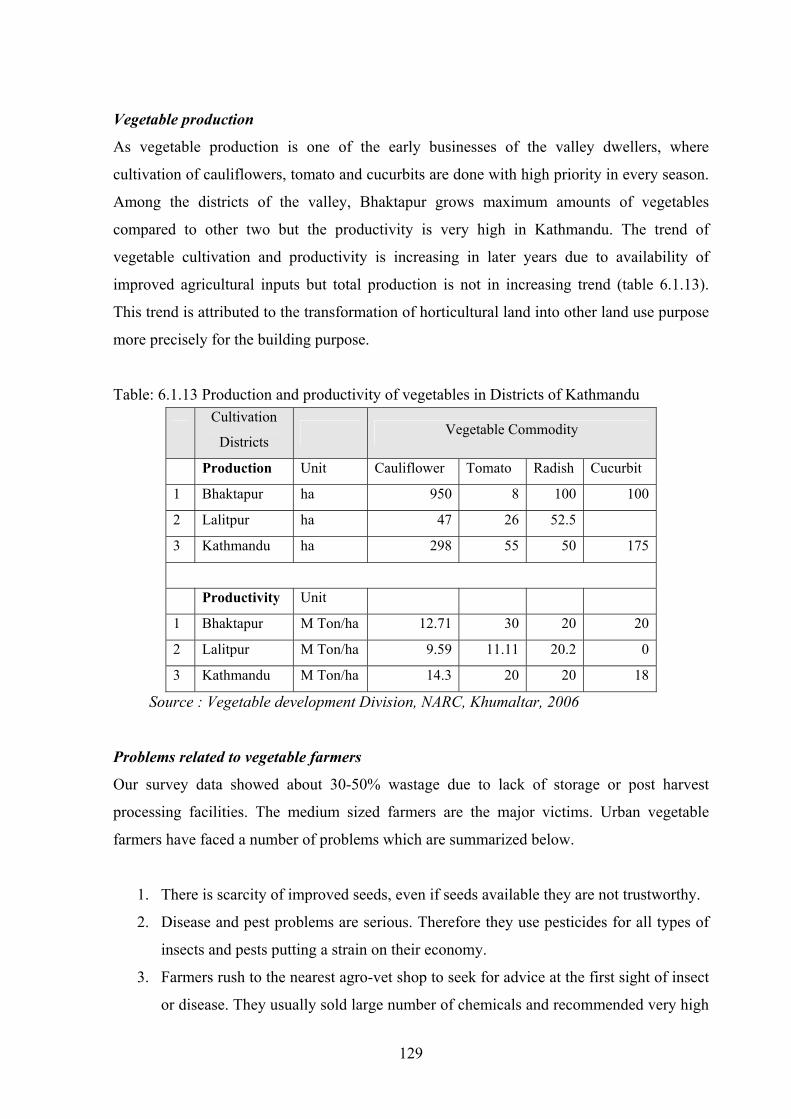
129
Vegetable production
As vegetable production is one of the early businesses of the valley dwellers, where
cultivation of cauliflowers, tomato and cucurbits are done with high priority in every season.
Among the districts of the valley, Bhaktapur grows maximum amounts of vegetables
compared to other two but the productivity is very high in Kathmandu. The trend of
vegetable cultivation and productivity is increasing in later years due to availability of
improved agricultural inputs but total production is not in increasing trend (table 6.1.13).
This trend is attributed to the transformation of horticultural land into other land use purpose
more precisely for the building purpose.
Table: 6.1.13 Production and productivity of vegetables in Districts of Kathmandu
Cultivation
Districts Vegetable Commodity
Production Unit Cauliflower Tomato Radish Cucurbit
1 Bhaktapur ha 950 8 100 100
2 Lalitpur ha 47 26 52.5
3 Kathmandu ha 298 55 50 175
Productivity Unit
1 Bhaktapur M Ton/ha 12.71 30 20 20
2 Lalitpur M Ton/ha 9.59 11.11 20.2 0
3 Kathmandu M Ton/ha 14.3 20 20 18
Source : Vegetable development Division, NARC, Khumaltar, 2006
Problems related to vegetable farmers
Our survey data showed about 30-50% wastage due to lack of storage or post harvest
processing facilities. The medium sized farmers are the major victims. Urban vegetable
farmers have faced a number of problems which are summarized below.
1. There is scarcity of improved seeds, even if seeds available they are not trustworthy.
2. Disease and pest problems are serious. Therefore they use pesticides for all types of
insects and pests putting a strain on their economy.
3. Farmers rush to the nearest agro-vet shop to seek for advice at the first sight of insect
or disease. They usually sold large number of chemicals and recommended very high

130
rates of application because the shop keeper's intent is maximum sale and profit. This
causes a serious health hazard to the consumer.
4. The market is very unstable. The middlemen ensure maximum benefit for themselves
by controlling the price of the vegetables.
5. The urban poor need to be trained on how to preserve unsold vegetables for use in the
house and to market preserved vegetables for cash.
6. The government has identified and selected pocket areas for vegetable cultivation but
the growers received very little support. The technicians are few and over worked.
They don't have traveling time.
7. In some areas, farmers have suffered due to misunderstandings and confusion about
authority and responsibility between two or more policy making institutions.
8. Vegetable farmers do all cultivation activities manually-mechanisation is nonexistent
in most of the peri-urban area of Kathmandu valley due to topographic factor.
9. Bio-pesticides are not popular because their impact is slow, they are difficult to make
and need large quantity for application.
Improving vegetable farming
Overhead production loss is primary problem to the resource poor farmers. Present research
work concluded that the following points are suggested to increase and expand vegetable
farming by subsistence farmers in a sustainable manner.
Promote those vegetable crops, the seed production of which is possible, simple
and easy to operate for common farmers. Self-pollinated crops should be
preferred when starting. This should then be gradually followed by often-cross
pollinated and highly-cross pollinated crops. Priority should be given to
indigenous vegetable crops.
Impart training on production, post-production and post-harvest activities related
to seed. If possible, establish small seed or plant producer groups. Develop a
system so that produced seeds are distributed or exchanged or bartered on cash or
kind within the given command area. This may be extended to inter-command
areas as well if surplus seed is available.

131
6.1.4 Stakeholder analysis for land evaluation
Stakeholders are those whose interests are affected by the issue or those whose activities
strongly affect the issue. Stakeholder Analysis is a vital tool for identifying those people,
groups and organizations that have significant and legitimate interests in specific land issues.
Clear understanding of the potential roles and contributions of different stakeholders is a
fundamental prerequisite for successful participatory agricultural governance process, and
stakeholder analysis is a basic tool for achieving the understanding (Hemmati 2002). As
such, four group stakeholders are involved in the analysis.
a) Local Farmers
Farmers are the group of people whose livelihood is closely ties with land. The farmers felt
that cultivation of the crop accordance with the capacity of the soil and land type could be
beneficial for cultivation of crop for both commercial as well as domestic consumption.
Existing traditional pattern of cultivation do not care for the climate and soil. They were
mostly concerned about the increase in production. It is therefore suitability identifies land
area which brings more production with existing amount of input. So, local residents would
be in favour. The local residents acknowledged the suitability result to cope up with the fast
growing market channel. At the same time, it led to mitigate the problem of soil quality
degradation. However, farmers felt that the local government officials is the main
responsible body to set out decent market channel for the vegetable they produce after
identification of suitable cropping area. The government authority should keep hold in the
market to adsorb the product. In addition, some families stated the appropriate
mechanization input can be implementation after land suitability assessment so as to make it
more sustainable cultivation. Rational application of the suitability outcome guarantees
sustainability of vegetable cultivation.
b) Environmentalists
The environmentalists mostly were concerned about the pollution being generated in the city
and amplification could be seen by happazard and rampant expansion of buildup area in
potential agriculture land. The most important benefit is the control of the soil erosion.
Identification of the slope and erosion potential is prime job of suitability analysis. This

132
definitely helps developing suitable crop zone for particular vegetable. Development and
degrading the urban environment and the existing green spaces were not enough with the fast
increase of urban population.
Hence, a new suitable vegetable cultivation area even in the urban and peri-urban area could
help mitigating urban garbage in compost form. So it could effectively be able to deal with
the pollution problem to some extent. On the other hand, the land suitability assessment
should approach the water source, and be located with appropriate slope and good surface
water quality. It helps in water problem in the growing area like Kathmandu. At the same
time other environmentalists pointed out the suitable area for particular vegetable, cereal,
fruits and so on can build up like a new park, that contribute in many respect to decrease air
pollution and carbon sequestration. Thus it can be showed that further concerned on both
economic benefits and ecological benefits should be considered in future plans.
c) Urban planners
Six experts were invited to the group discussion. This group provided the most vivid
discussion, mostly about the potential for the development of tourism and the problems
existing land utilization for various purpose. Four urban planners acknowledged that
suitable agricultural area identification could not only play a role in the agricultural
development of an area, but also help on setting planning for the allocation of the build up
area and designate area for the urban expansion. This further could help to develop tourism
in area like Kathmandu to attract more tourists just because of its rational layout and high
landscape quality. The ecological benefit of rational use of land for specific crop is also
immense. They felt the most important was that green spaces can effectively clean air,
improve process of soil stabilization and help on climate stabilization. Of course there are
social benefits such as improving landscape quality, historic culture value and economic
benefits were not very important. Overall, the group accepted the comment that the problems
existing in the present cropping system were because it did not understand capacity of the
land for systematically planned agriculture. So the urban planners had responsibility to solve
these problems by planning an urban area suitable in many aspects through understanding
capacity to the cropping as well.
133
d) Local government officials
The officials concern more with setting up plan for the future development. It is their duty to
designate the area for specific type of utilization, for which they need first to consider the
existing land use. A separate site for built up areas should be allocated so that rampant
scattering of industries and other construction does not engulf cultivation area. Such a
conflict will appropriately solved by the suitability analysis. Since analysis incorporate
environmental criteria, social factors and economic parameters, so that more reality would be
added on the suitability job. Increasing population density and decreasing per capita land
area can be balanced. Land fragmentation problem can also be managed through legal
framework so that land retains its capacity to meet need of mankind. Future planning for the
environmental pollution, soil erosion hazards, crop development, city expansion, road
network extension and many more facilities can be handles with optimum efficiency, if
result of land suitability is taken into account.
6.1.5 Discussion
Soil parameters of the investigated area reveal that soil quality seems to support vegetable
cultivation. Land surface has gentle slope. Sufficient irrigation facilities are lacking. Good
top soil depth with moderate organic matter content. Fertility of the soil is more about
temporary parameter and can easily be enhanced by external application of fertilizers. Lower
the elevation, higher the clay content in the soil. Moderate diversity of soil group in valley
related with the variation in soil parameters. Due to the physiogeographical setting
Kathmandu valley had been using vegetable cultivation from the very beginning. Wide range
of vegetable of indigenous varieties used to cultivate in traditional manner. Intensification in
peri-urban agriculture needs improvement in traditional farming system so that optimum
benefit can be achieved for growers (Gautam, 2004).
Recently urban growth in fast rate with high influx of the migrant cause valley land area
under pressure. High rate of fragmentation and conversion of agricultural land into non
agriculture is main problem. This situation leading to decrease in R/C ration, hence less
benefit goes to the farmers. So, urban sprawl is ongoing problem in many growing cities
including Kathmandu (Pradhan and Perara 2005), had to be managed on time to keep pace of
vegetable development in high standard. Farmers are the main target group of this analysis to

134
be benefited directly. Success of research result is to address the need of target group
(Hemmati 2002). This model of land evaluation helps farmers and vegetable growers to
realise potentiality of their land parcel and required management procedures. Besides, urban
planners, experts and environmentalist are also targeted to share the utmost benefit.

135
6.2 Land Resources Inventory and Land Mapping Units
Main aim of this chapter is the generation of Land Information System (LIS). Spatial
distribution of land attributes will be represented into thematic map to be used for the
suitability evaluation. Spatial information and tabulated content of non spatial information
on thematic maps will be overlaid using GIS software so as to develop land suitability maps
for the development of vegetable crops in Kathmandu Valley. Land information system
developed in this chapter could be used as model for similar purpose in similar areas in
Nepal.
6.2.1 Land Information System (LIS) databases
The interaction of human societies with land is becoming crucial for the economic, social,
political and environmental development. Organised display of the land information is very
important to make decision of land use. Land Information System (LIS) is one of the
intuitive components of the Geographic Information System (GIS). Various aspects of LIS
such as capturing, storing, processing, managing, analysing and disseminating the land
information have tremendous impacts on result output. Spatial information is the crux of the
LIS and non spatial information is also contains equal importance. Those together can play
the leading role for building and maintaining a LIS for particular land area. Introduction of
geographical information system has impacts relate to institutional, legal, financial and
technical issues, and need to be carefully planned and managed to build and maintain a LIS.
Hence the tasks of building, operating and maintaining LIS require clear strategies that
should adopt established framework.
Land suitability evaluation by nature is a complex process which integrates information from
the related sector like physical environments, social parameters, economic condition of an
area and so on. When non-spatial information is integrated with LIS, a new approach needs
to deal with, that is said to be multi-criteria land suitability evaluation. This includes the
physical environment, social-economic conditions along with crop agronomical
requirements regarding the crop specific evaluation. On the top of all, digital information in
the form of soil map is the core of process.

136
Application of computer technology with updated land information system in Nepal is not
yet been developed. Computer added cadastral system of land management was started from
the Ministry of Land Reform and Management (MLRM), Department of Land Information
and Archive (DoLIA). For managing and controlling the use of land and resources, a reliable
LIS is necessary. The LIS is required for timely supply of reliable land information to all its
users at an affordable cost. Since such tasks are complex in nature, time consuming and
costly, it requires the realistic strategies to carry out its tasks. This chapter aims to prepare
LIS of Kathmandu valley. This could be real time, realistic, easy to use model to be used for
land evaluation. Further extension of the LIS in the countrywide, this model would play base
line information source. All the stakeholders for example farmers, urban planners, municipal
workers, etc. would appropriately benefit from this LIS.
Consideration of LIS preparation
The LIS database for land suitability evaluation in Kathmandu valley is based on some basic
considerations. The database development must be consistent and convenient for accessing,
updating figures and transferring to the related specialised software. Providing sufficient and
accurate information so as to assess objectively the situation and the changing trend of land
use and setting up models for prediction, analysis and assistance to sustainable land use.
The input information includes both map information i.e. spatial and attributive information
which is non-spatial. The spatial information must identify the projection, co-ordinates, map
scale and the annotations as well as the consistent attributives for each type of thematic map.
Non spatial attributive data must be prepared in well designed tabular forms with every kind
of information and special attention has to be paid to make it easy access for editing data in
special software. As for arranging information in the system, each thematic map will have 1
or 2 layers of information, depending on the content and structure of the information. The
spatial data can be created either in vector or in raster format. Each type of data has a
different way of drawing map for a specific geographical region. The vector geographical
data represent the geographic objects by a set of co-ordinates including points, lines, area
and set. The raster geographic data represent geographic objects by a set of pixels; each pixel
has a certain value denoted by digital number. The attributive data in LIS can be code values,
or actual values. Code values are integers, while actual values can be either integers, real
numbers, logic or character and string. Thematic map prepared for the LIS of Kathmandu

137
has prepared in scale of 1:25,000. In this study, the soil data are the main data source for LIS
with developing other layers of information.
Database generation
Information in the database includes attributes with map information and layer information.
They all have special consideration in terms of code used and represent in the tabular form.
Appendix 3 shows the detail requirements of the attributes to be included in the database.
Land use structure
Thematic map of Kathmandu valley includes a layer of information which shows existing
land use types. Agricultural land, build-up land, forest and shrub area, water bodies etc are
included in the map. Each land use categories has demoted in the given format with attribute
data (table 6.2.1). The structure of which is presented as follow.
Table 6.2.1 Structure of land use attribute for LIS database Objects Field name Type Width Unit
1. Land use types Lu_type Char 30
2. Code of land use types lu_Code Char 16
3. Area covered by each land use type Area_ha Num 16 ha
Land suitability unit information:
For the purpose of using to delineate lands for vegetable crops in Kathmandu valley the form
system of LIS and database is necessary for the demand of sufficient, accurate and
convenient information on environmental and socio-economic factors. The data derive from
the process of generalising and analysing information on land assessment, including land
unit map, land use requirement and adapting classification analysis.
Map of land suitability will be generated with reasonable overlay of necessary thematic
layers. It has basic spatial information layer. The data consist of attribute data and spatial
distribution of the layer. The structure has been set as follows in table 6.2.2.
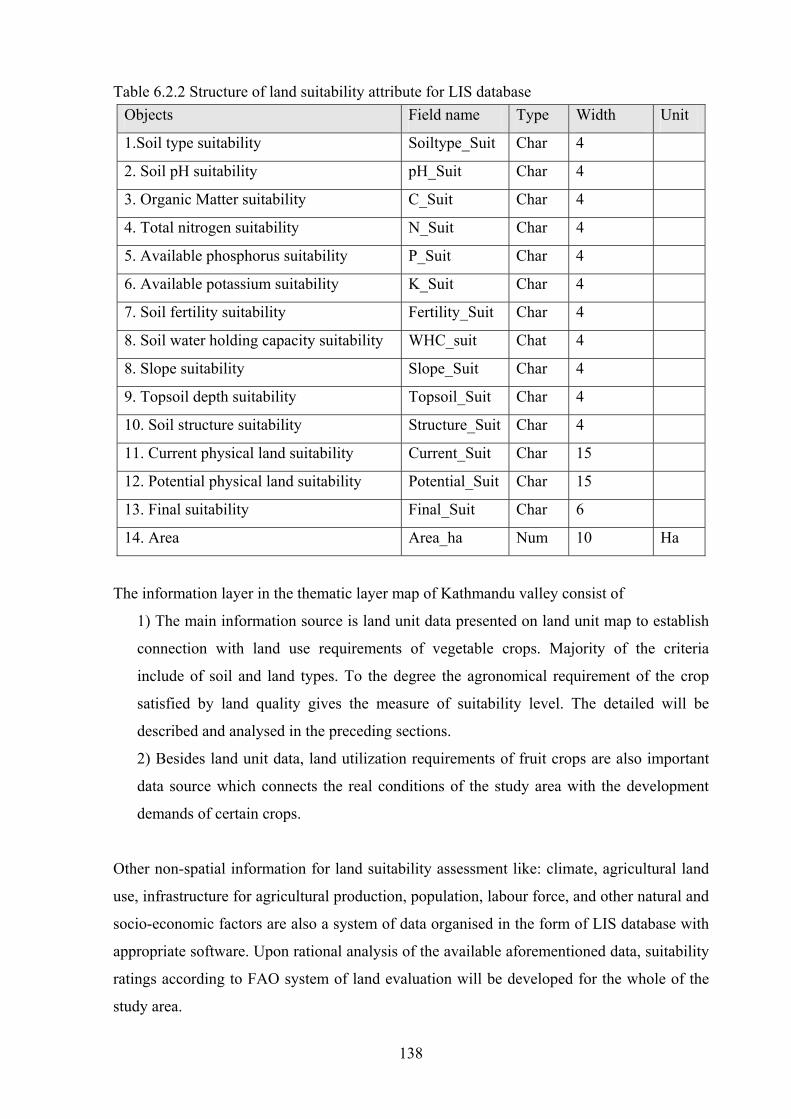
138
Table 6.2.2 Structure of land suitability attribute for LIS database Objects Field name Type Width Unit
1.Soil type suitability Soiltype_Suit Char 4
2. Soil pH suitability pH_Suit Char 4
3. Organic Matter suitability C_Suit Char 4
4. Total nitrogen suitability N_Suit Char 4
5. Available phosphorus suitability P_Suit Char 4
6. Available potassium suitability K_Suit Char 4
7. Soil fertility suitability Fertility_Suit Char 4
8. Soil water holding capacity suitability WHC_suit Chat 4
8. Slope suitability Slope_Suit Char 4
9. Topsoil depth suitability Topsoil_Suit Char 4
10. Soil structure suitability Structure_Suit Char 4
11. Current physical land suitability Current_Suit Char 15
12. Potential physical land suitability Potential_Suit Char 15
13. Final suitability Final_Suit Char 6
14. Area Area_ha Num 10 Ha
The information layer in the thematic layer map of Kathmandu valley consist of
1) The main information source is land unit data presented on land unit map to establish
connection with land use requirements of vegetable crops. Majority of the criteria
include of soil and land types. To the degree the agronomical requirement of the crop
satisfied by land quality gives the measure of suitability level. The detailed will be
described and analysed in the preceding sections.
2) Besides land unit data, land utilization requirements of fruit crops are also important
data source which connects the real conditions of the study area with the development
demands of certain crops.
Other non-spatial information for land suitability assessment like: climate, agricultural land
use, infrastructure for agricultural production, population, labour force, and other natural and
socio-economic factors are also a system of data organised in the form of LIS database with
appropriate software. Upon rational analysis of the available aforementioned data, suitability
ratings according to FAO system of land evaluation will be developed for the whole of the
study area.

139
6.2.2 Generation of land mapping units and thematic maps
The GIS model may be vector-based or raster-based model. The raster model is based on a
regular grid of cells that is placed over a study area. For each cell, thematic information is
recorded about the underlying location, e.g. land use at the location. Each theme can be
represented by a grid layer. In vector-based models, points, lines and polygons represent the
geographical objects in the study area. Present study uses vector based model for each of the
land mapping unit as geographical objects of the study area for every thematic maps.
Difficulties on using raster based model for building up thematic map is topographic set up.
Land areas of single land mapping units are not homogenous. Setting up of the spatial
resolution is found to be difficult task, where information is short fall. Thematic information
about these geographical objects is stored in a separate attribute table. Every row in the table
represents one geographical object and every column represents an attribute describing the
geographical objects. A unique identification code is attached to each object in order to link
the attribute table to the geographical objects. Creating this link is only possible when every
row in the attribute table starts with the attribute ID of the corresponding geographical
object.
Thematic map consists of information distributed spatially in the units of the map itself.
Such units in the map are names as Land Mapping Unit (LMU). They are the basic
constituent of thematic map. Therefore, LMU is defined as a land plot which is specifically
identified in the map with distinct characteristics. The characteristics within each LMU
homogeneously distributed differences or fluctuations in the land attributes will lead to the
further fragmentation of the land mapping units into smaller pieces. From the agricultural
point of view, each LMU is more suitable for specific types of cultivated crops in the
existing land management condition. Each LMU is the individual entity of an area which
bears characteristics of its own for example soil characteristics like soil type, soil texture,
slope gradient, rootable soil depth, organic matter content and also fertility status. Such and
information also reflects relatedness with the flood, erosion, etc so that allocation of the land
for specific purpose can simply be defined.
Ideal delineation of the land mapping unit of the Kathmandu valley is very important for the
suitability assessment. This provides basic ground for the allocation of the land to be used
not only for the agricultural purpose but also for the planning to expand urbanization, and so
on. Long term land use and land utilisation planning can also be done with the current

140
thematic map, provided wise and chronological updating, correction, amendment and
supplementing under the change process of related spatial databases and attributes of each
land unit. Use of the GIS software for the preparation of the LMU can accommodate large
number of non-land related information, but social attributes and economic indicators as
well. This fact further strengthening output of the suitability evaluation of any land units.
While working for the land suitability evaluation in Kathmandu valley, following
considerations were taken into account to build map of appropriate land units. More
precisely, land characteristics are the basic ground of evaluation procedure, so land form and
soil types are certainly carries more weights.
Considerations to delineate LMU,
a. LMUs must be drawn on the map with well defined boundaries.
b. LMU is more consistent in the criterion used.
c. LMUs must be practically significant for the specific crops to be analysed.
d. LMUs must be easily defined based on characteristics understanding land’s capacity.
e. Particularities of LMUs should relatively be stable and can be used for a longtime
for the assessment of land suitability.
Characterization of LMU
It is widely established fact that every land mapping unit should have certain land capability
either in terms of agricultural strength or non-vegetational potential. Land Mapping Units
should have distinct natures that have connection with ecology and environmental conditions
of specific area. Land resources, production potential and materials characteristics of
ecological aspect of study area are necessary to identify. Such information of criteria must be
generated from the study site, if doesn’t exist, that can be inherited from the different related
sources. Quality and standard of the land mapping unit is influenced by the information used
to build map.
Present research gather up digital information from different sources. International Center
for Integrated Mountain Development (ICIMOD), central office, Kathmandu is the source of
the land use map. Land system thematic layer which satisfy the criteria of ecological
parameters and land capabilities has been adopted. Soil and Terrain Digital Database of the
World (SOTER) provides the basic ground of greater soil group diversity and land units,
however majority of soil data has been generated from study area through field visit and soil

141
analysis. These data resources are in untreated forms showing only general properties for the
area which is then re-organised in information layers. Merging of the land unit with identical
attribute characters and separation of the heterogeneous land unit was performed. Using
questionnaire, holding seminars with professional groups were used as means to generate
necessary data. All the information generated is finally used in thematic maps.
Soil and terrain type plays very important role delimiting land unit in the areas like
Kathmandu valley. Most of the features are controlled by the topographic factor. Therefore
physiographic detail of study area is controlling process of land unit building. Therefore data
for building a map of land unit in Kathmandu valley recognise ecological plots and agro-
ecological sub-areas. Agro ecological areas are relatively consistent in natural and ecological
conditions especially for cultivation, forestry, etc. Concerned data of research and analysis
includes elements of climate, terrain, types of soil, vegetation cover and current land
utilization, water source, etc. Current vegetable production can be spatially represented
making attribute table.
Land Unit Map of the study area can be used to established relationship among natural
elements, socio-economic conditions, cultivated crops system and potentiality of vegetable
farming. Currently agricultural production of the area also gives the scenario of land ability.
All criteria assembled together to give satisfactory result of suitability assessment.
To identify land units manifested on the map of Kathmandu valley, first of all, it is necessary
to choose and rank criteria and then build up thematic maps under set of criteria. Choosing
and ranking thematic criteria for building a map of land units is a relatively complicated job
because there are often many differences of data among different areas and ecological zones.
The selection of thematic criteria has depended greatly on available sources of data as well
as ability, accessibility, limitation of the topic. Therefore, for the land evaluation purpose, as
criteria setout in the guideline of FAO (1976) for this research, following general
foundations are adopted.
- The natural conditions including soil characteristics and agro-ecological factors,
- Land use requirements and ecological requirements of vegetable crops,
- Socio-economic conditions, spatial data source and attributive data,

142
- Land use change of the study area in chronological order based on both primary and
secondary data
6.2.3 Resource potential of land unit
Land suitability evaluation, on basis of physical or ecological condition requires criterion
mostly from the soil and land attributes. Following criteria has been selected for generation
of the thematic map layer, final suitability will be developed upon overlay of the following
ones. Soil units of the study area follow the classification adopted FAO-UNESCO
classification method
• Soil classification including main soil groups, and sub soil group
• Land sloping,
• Rootable soil depth,
• Soil texture,
• Soil fertility (cumulative level of nitrogen, phosphorus, potassium, pH, OM),
• Water holding capacity
• Land aspect
• Current land use structure
Research work intended to build spatial distribution of the climatic parameters. Temperature,
relative humidity, precipitation, and evepotranspiration are interpolated into thematic
characteristics. However the area of the study site is not wider enough to bring clear cut
variation in the distributional pattern of climate. Socio-economic information can be
depicted into the spatial form with gives more realistic figure of the thematic layer. Some of
the climatic parameters like relative humidity, temperature, rainfall etc are more related with
the land form like altitude, aspect, slope, etc which already had well defined thematic layer.
So finally it can be conclude that on the basis of climatic parameter, given land mapping unit
are not supposed to separate into further small sub regions.
Soil units
Soil taxonomy follows the classification system follows FAO-UNESCO soil classification.
Code for the soil type is assigned to G. Altogether there are eight different soil types are
presented where the highest area is covered by Rhodustalf Scalpic with 23% of total
agricultural area. Each type of soil has difference in other associated parameters. The
description of soil unit type, its area and count of LMU is presented in table 6.2.3.

143
Figure: 6.2.1 Soil types in Kathmandu Valley
Table 6.2.3 Information of soil types for producing the LMU in Kathmandu Valley Soil Texonomy Code Count Area (ha) Ag Area (%)
Dystrochrept Anthropic G1 14 1733.24 7.4
Dystrochrept Aquic G2 1 572.37 2.4
Fluvaquent Aeric G3 12 4250.71 18.1
Rhodustalf Anthropic Udic G4 22 2792.84 11.9
Rhodustalf Scalpic G5 17 5515.78 23.5
Ustifluvent Aquic Anthropic G6 6 1503.63 6.4
Ustochrept Aquic G7 11 1102.75 4.7
Ustochrept Paralithic G8 2 5965.79 25.4
Total 85 23519.33 100
Rootable soil depth
As steepness in the area increases, land possesses less soil depth. This scenario to some
extent coincides with the land mass of Kathmandu valley (Baniya, 1995). Kathmandu has a
different history of origin, soil depth is much higher than any other flat land of country. A
drill hole at the middle of valley bottom shows that soil horizon exist up to 360m deep from
the surface (table 5.7 of study area).

144
Table 6.2.4 Information on rootable soil depth of LMU in Kathmandu Valley
Depth (cm) Code Count Area (ha) Area (%)
> 100 D1 55 13050.22 55.49
55 100 D2 23 10163.64 43.21
30 -55 D3 7 305.47 1.30
Total 85 23519.33 100
Figure 6.2.2: Rootable Soil Depth in Kathmandu valley
Present study show that 17 land mapping unit of 85 have rootable depth of the soil is more
than 120cm, which come around one fourth of the total agricultural area. Similarly D2 as
encoded for the depth between 55 to100cm covers 42.21% of agricultural area of valley,
which accounts for 10163.64ha of potential agricultural land. Land mapping unit with lesser
depth denoted with code D3 covers only about 1.2% of land area. Table 6.2.4 gives a detail
glimpse of the soil depth scenario in Kathmandu valley.

145
Soil texture class
Texture is one of the important parameter of soil. Most of the physical characteristics of the
soil depend upon texture class. The relative proportion of Sand, Silt and Clay when
combined and compared to texture triangle, produces texture class of the soil.
Table: 6.2.5 Soil texture information of Kathmandu valley for LMU preparation Soil texture Code Count Area (ha) %
Loam / Sandy Loam T1 38 10798.071 45.9
Silty Loam T2 17 2906 12.4
Loamy Clay T3 25 9472.078 40.3
Sandy Bouldery T4 5 260.97 1.1
Total 85 23519.33 100
Figure: 6.2.3 Soil texture map of Kathmandu valley
As in present study, vegetable cultivation mostly prefers loamy to sandy loam soil. Such soil
would be easier to work with and needs moderate irrigation facilities. Soil of the study area
show 45 percent of agricultural land in valley is categorised as T1 with Loam to sandy loam
texture class (figure 6.2.3). Most of the gentle slope to flat area and in the river channels
posses these kinds of soil. Out of the 85 LMU, only 5 units with 260ha of land area possess
rough texture with bouldery appearance. This makes working on the field practically
difficult.

146
Land slop gradient
Kathmandu is in mid hills of Nepal; naturally it is composed of large number of slop land
with different degree of slop. Here land Sloping is encoded as SL on LIS database. This
plays important role on selection of the crop because it affects working pattern, irrigation
style and of course cultivation mode. Increase in land slope directly proportional to higher
erosion risks. There protection cost of the land is relatively high in comparison to the normal
flat land. Degradation of the soil quality with slight rain fall erosion also cost for
improvement. Land slope map derived from ICIMOD was found to be used by the
Department of land reform, GON and drawn similar conclusion.
In present study, land level has been categorized into four slope level ranging from flat land
to steep slope as given in table 6.2.6. Most of the flat land has engulfed by the urban
extension. 46% agricultural land is moderately slope, where with indigenous technology, all
types of agricultural practices can be carried out. Little more than one percent land is of
steep slope, where agriculture activities are unsustainable; therefore it is categorised into
unsuitable land for the cultivation. Most of the land area needs some extent of management
input to keep safer from slope induced land degradation. The slope here is quantitatively
categorized into 4 levels namely SL1, SL2, SL3 and SL4.
Table 6.2.6 information on slope level for producing the LMU in Kathmandu valley
Slope status Code COUNT Area (ha) %
Flat to gentle slop SL1 18 4948.5 21.3
Moderately slope SL2 51 10789.6 46.4
Undulating slope SL3 12 7491.6 32.3
Steep slop SL4 4 289.6 1.2
Total 85 23519.33

147
Figure: 6.2.4 Slope map of Kathmandu Valley
Soil fertility
Production potential of the soil depends upon its capacity to support plant growth. Therefore,
soil fertility is the ability of soil to server as a habitat for plants and to produce yield crops or
it is the natural, sustainable productivity of soil under given climatic conditions. The fertile
soil has the following properties:
• It is rich in nutrients necessary for basic plant nutrition, including nitrogen,
phosphorus and potassium.
• It contains sufficient minerals (trace elements) for plant nutrition, including
boron, chlorine, cobalt, copper, iron, manganese, molybdenum, sulfur, and zinc.
• It contains soil organic matter that improves soil structure and soil moisture
retention.
• Soil pH is in the range 6.0 to 6.8.
• Good soil structure, creating well drained soil.
• A range of microorganisms that support plant growth.
• It often contains large amounts of topsoil.
Soil fertility as indicated in the land evaluation guideline by FAO, it is denoted by alphabet
p. Production potential of soil is influenced by the fertility. In fact fertility is the collective
measure of the all the soil nutrients, both micro and macro more specifically, nitrogen,
phosphorous and potassium. Fertility of the soil is merely the permanent attribute, but it gets
constantly fluctuate within the time frame depending upon type of crop grown. Fertility also

148
influenced by the fertility investment as well as technical handling of the land. Besides NP
and K, fertility is also incorporate other quantitative parameters like pH, availability of
organic matter in the soil and humus content, soil texture component and associated water
holding capacity (table 6.2.7). The level of current soil fertility will help to identify the level
of fertility investment and proper technical methods required for the effective cultivation of
the vegetables in the study area. The soil fertility in each land unit is categorized into 3 main
levels namely high (P1), medium (P2) and low (P3), spatial distribution and tabular
expression are given below in table: 6.2.8 (a –f) and figure 6.2.5 (a - f).
Table: 6.2.7 Total fertility in the soils of Kathmandu FERTILITY Code COUNT Area (ha) %
Medium P1 35 10957.59 46.75
Low P2 45 11805.06 50.37
very low P3 5 674.48 2.88
Figure: 6.2.5 Soil fertility status of Kathmandu Valley
Table 6.2.9 gives generalized figure of the fertility status of Kathmandu Valley. The fertility
status of each soil group is presented in generalised form. Altogether 8 soil groups found in
the area are supplied with the medium fertility status. Organic matter content of the soil
groups is satisfactory and most of them rated as medium. pH of valley are acidic however

149
the value is moderate in majority of soil types. Rhodustalf Scalpic (G5) soil type is fairly
good with all fertility factor in food condition.

150

151
About 5.5 thousands hectare of agricultural land with this category possess high value of
water holding capacity. Other fertility factors like nitrogen, potassium and phosphorus do
fluctuate even within the cultivation period, therefore mostly depends upon the external
application. This is regarded as temporary fertility factor which can be corrected as and
when needed.
Table: 6.2.9 Overall fertility status of the soil groups present in Kathmandu Fertility Factors
Soil Group Code pH OM N P K WHC p Area(ha)
Dystrochrept Anthropic G1 M M L L L L L 1733.24
Dystrochrept Aquic G2 L M H M M H M 572.37
Fluvaquent Aeric G3 L M M M M L L 4250.71
Rhodustalf Anthropic Udic G4 M M H M M L M 2792.84
Rhodustalf Scalpic G5 M M M M H H M 5515.78
Ustifluvent Aquic Anthropic G6 M M M M M M M 1503.63
Ustochrept Aquic G7 L M M M H L L 1102.75
Ustochrept Paralithic G8 M H M H H L L 5965.79
H = High, M = Medium and L = Low
Results of the fertility status of the soil types in the Kathmandu can be conclude that the over
all suitability rating in the Kathmandu valley has less impact by fertility status of particular
soil type. This fertility scenario not necessarily reflected in the fertility of each LMU, it is
because in many LMU, they are composed of combination of soil types, aspect and slope
categories.
6.2.4 Discussion
Development of the LIS for the purpose of using to delineate lands for vegetable crops in
Kathmandu valley is necessary for the demand of sufficient, accurate and convenient
information on land and soil characteristics. The database development must be consistent
and convenient for accessing, updating figures and transferring to the related specialised
software. The data derive from the process of generalising and analysing information on land
assessment, including land unit map, land use requirement and classification analysis.
Building of LIS was not successful as expected in the past because of lack of serous
structural planning and clear strategy (Tuladhar et.al. 2004). Present LIS database of

152
Kathmandu has high prospectus for further extension and act as model for other area in
country. Data base includes information related to resource potential of land parameters.
Present study uses vector based model for each of the land mapping unit as geographical
objects of the study area for every thematic maps. The information of soil and land
parameters has been transformed into thematic map layer through GIS application. Total
land area is divided into 85 consistent land mapping units. Spatial distribution of the climatic
parameters viz. temperature, relative humidity, precipitation, and evepotranspiration are
interpolated into thematic characteristics however the total area is not wider enough to bring
clear cut variation in the distributional pattern of climate. The thematic maps of all physical
criteria will be subjected to overlay for the suitability evaluation.
In present study thematic layers of all parameters shows that soil quality of valley is found to
be fairly good. Land use should be completed that is, all land should be used; and
reasonable, that is, the land should be farmed efficiently with appropriate crops and rotations
and attention paid to maintaining the fertility of the land (Marsh and MacAulay 2002). A
fertile soil could be described as one that provides all the plant nutrients in the right
proportion with adequate aeration and soil moisture. Soil management plays a very
important role in vegetable production as it maintains/improves soil fertility and provides a
good medium for plant growth. Soil management is the sum total of all the tillage operations,
cropping practices, lime, fertilizer, and other treatments applied to the soil for the production
of a crop. Even with the land area with highly suitable condition, all the soil management
operation has to be done to keep the soil in the potential status. Suitability evaluation further
helps putting emphasis on particular soil management event because it identifies limitation
of land area.

153
6.3 Result of Land Suitability Evaluation
The land suitability is the aptitude of a given type of land to support a defined use. This
chapter presents the results of physical land suitability assessment done in previous chapter.
Further more, incorporation of the socio-economic attributes along with physical and
climatic suitability for vegetable cultivation will be done. Out put of this chapter will be
suitability map depicted with the suitability degree and limitations involved. The later part of
this Section offers the discussion on the multi-criteria land suitability evaluation on the basis
of the entire criterion including physical social-economic and environmental.
6.3.1 Evaluation of natural land resource
Cultivation is the act of making use of land resources to get production for livelihood of
mankind. Therefore, cultivation involves both land characteristics including qualities and
human attitudes. Social parameter of human being determines the need moreover need make
decision parameter for the type of crop to be cultivated in given plot of available land.
Production from the land is based on the land capability and investment input in terms of
materials and services. Land capability gives rough sketch of the land to be used for specific
use for the utmost out put. Separating land area for specific use by knowing its capacity to
support type of crop is land suitability classification. So the process of land suitability
classification is the appraisal and grouping of specific areas of land in terms of their
suitability for a defined use.
Land suitability assessment for vegetable development in Kathmandu Valley is influenced
by many fundamental parameters namely, soil and land parameters, climatic attributes,
terrain and physiographic, social characteristics, cultural aspects, cultivation customs,
infrastructure development, services available, market situations and many more. All of them
can logically be discussed under two categories
Physical and environmental parameters
Socio-economic parameter
Former factor more related to the growth and development of the plant species that supply
physiological need. Plant growth is influenced by components of the physical environment.
Almost all agronomical need of a crop is fulfilled by components of physical environment.

154
Where as latter parameter is more likely to effects on final yield and handling of the product
and post harvest handling is also depends upon same parameters.
Cultivation trend in society and land use practices is social and cultural traits, which makes
impacts on yield of crop. From field to kitchen (from soil to consumer) or to market is
affected by the socio-economic and infrastructure attributes.
For the development of the vegetable farming in the areas like Kathmandu valley needs to
understand fully the land capability, which is the first and far most important aspects. Land
set up and soil characteristics are of unique type. Physiographic setting allows specific crop
species attains full growth in such an environment. Planning of vegetable crops begins with
the selection of the suitable species based on the ecological condition of the valley. Very
often local species are selected for the cultivation because of the genetic acclimatisation for
specific environment. It was observed in several instances that under production and
economic loss are caused by introduction of the new species. Traditional way of cultivar
improvements and selection is cultural practice in many parts of valley on which farmers are
accustomed. Understanding of soil quality and climatic condition assist to a greater extent on
selection of suitable species of vegetable. Infrastructure development and investment of state
and central government on the horticultural sector also plays role. Road access network,
setting up market place and controlling price, agricultural subsidy, etc would make impact
on the yield and economic benefit from the farming. In several instances, lack of proper
storage arrangement caused heavy economic loss to the farmers. Distance to nearest road
head and to the market is also a problem. Contrary to this, introduction of the plastic tunnel
farming produces large amount of the off season vegetable, leading to good economic
benefits. From these facts, it can simply be concluded that vegetable cultivation is act which
need to be considered with set of conditions from all possible sector like physical
environment, climatic, social, economic, infrastructure and agricultural input availability.
Relationship among different influencing factors should be judged properly for selection of
the land area according to agronomical need of plants, capability possess by land area,
farming attitude of the society and economic potentiality with infrastructure investment in
land. Similar consideration has been shown by Hossain et.al. (2007). All these criteria are
considered in the order of importance i.e. ratings. Evaluation of rated component of the
factors will generate land area which is suitable for the specific type of crop with degree of
155
difficulty and limitations. The classification result will yield suitability evaluation of land
area.
Suitability evaluation is carried out considering each component separately. Physical land
suitability, socio-economic suitability and environmental suitability are established ones.
6.3.1.1 Physical land suitability
Based on the current land use map, agricultural area has extracted from build up area and
forest region with GIS tools. As indicated in previous chapter while making land mapping
units, altogether 85 homogenously distributed land units are selected. Each of the land units
with their attributive characteristics are considered for the suitability evaluation. While
evaluation is purely based on the land, soil and climatic parameters, it is simply called as the
physical land suitability evaluation.
Condition of land could be suitable for the agricultural purpose. If suitable, it can be
categorized into different suitability class according to existing limiting factors. As the LMU
is the regarded as homogenously categorised for each of the parameter, degree of suitability
is attributed for particular LMU. According to FAO guidelines for land suitability evaluation
(1976, and 1983) classification of suitable land considers land characters with crop
requirements. FAO system of classification has appropriately used in Kathmandu valley
condition. Modified form of the land suitability evaluation in this case consist of three basic
methods namely the subjective combination method, the limitations combining method, and
parameter methods.
Land and topographic variation as seen in the Kathmandu valley allowed using limitation
combination method of land suitability evaluation for the vegetable crops. Literature survey
and expert consultation has forwarded to use this method of suitability evaluation, because
physical land suitability evaluation for the vegetable crops always based on identification of
limiting factors. Present study based on the following principal considerations
1. Principle for identification of diagnostic factors with most serious limits;
2. Principle for most important limits in consideration with dominant factors;

156
1. Identification of decisive factors:
It is also called as dominant factor. These are decisive and unchangeable factors in land
classification, for instance: soil type, terrain, slope, soil layer depth, etc. Other factors are
ordinary ones, which hardly affect the classification of land. The classification of dominant
factors and ordinary factors is clearly expressed with having the presence of socio-economic
conditions, infrastructure in the evaluating process. This will be minutely presented in the
final land assessment results in this Chapter
2. Classifying criteria:
(1) If a dominant factor has the highest limitation level, the suitability is ranked in
accordance with that level, for example: a dominant factor is at S3, the other factors
are at S2 and S1, and then the suitability level is ranked S3.
(2) If an ordinary factor has the highest limitation level while the other factors
(dominant and ordinary) are at lower ones, the suitability is ranked one-level
higher, for example: an ordinary factor is at S3, the other factors are at S2 and S1,
and then the suitability level is ranked S2.
(3) If two ordinary factors are at S3 whereas all dominant factors are at S1, S2, the
suitability level is ranked S2, or from N to S3, and from S2 to S1;
(4) If more than three ordinary factors are at the same level, the suitability level
remains the same.
Literature survey and field study has identified list of land and climatic factors which is
catagorised as the dominant and ordinary factors. Relationship with crop and degree of
influence are the sole consideration for this categorization. The list is presented in table
6.3.1.
As presented in table 6.3.1, most of the land and climatic factors are rated as the dominant
factor, which can lead large scale effects on the suitability analysis. All weather
characteristics i.e. temperature, precipitation, relative humidity and sunshine hour are
categorised as dominant. Similarly soil type, land slop and rootable soil depth also made
dominant factors. Land aspect and altitudinal range are excluded in this category ratings
because climatic parameters like temperature and sunshine durations are affected. Of the
pedological parameter except soil texture, all other parameters carry less importance on
making suitability classification. It is because such factors can be enhanced with necessary

157
investment during the cultivation. N, P and K collectively contribute to the soil fertility (p).
Water holding capacity (w) has close association with the textural class (t). Organic matter
content and pH of the soil depends upon external input on the soil. Kalogirou (2002)
suggested that the enhancement of the physical evaluation by involving climate
characteristics and the development of a complete economic evaluation brings valuable
results.
Table 6.3.1 Category of dominant and ordinary factors for vegetable crops in Kathmandu valley
Characteristics Land quality/characteristics Code Unit
Dominant Ordinary
WEATHER CHARACTERISTICS
1.Temperature t ° ° C �
2. Rainfall r mm �
3. Relative Humidity rh % �
4. Sunshine hour sh hr. �
LAND CHARACTERISTICS
1. Soil type g �
2. Land slope sl degree �
3. Soil effective depth d cm �
4. Altitudinal Range al �
SOIL CHARACTERISTICS
1. Soil texture t �
2. Soil Fertility p �
- Total Nitrogen (N) % �
- Available Phosphorus (P) Kg/ha �
- Available Potassium (K) Kg/ha �
3. Soil reaction (pH) pH - �
4. Organic Matter (OM) om % �
5. Water holding Capacity (WHC) w % �
All of the dominant as well as ordinary characteristics are ranked on the basis of
agronomical and physiological requirement of the selected crops. Such factors ranked in
following levels;

158
1. High level of suitability (S1AHP),
2. Medium level of suitability (S2 AHP),
3. Low level of suitability (S3 AHP) and
4. Non-suitability (N)
A FAO guideline for land suitability evaluation (1976) has identified non suitable land into
further two sub levels, temporarily non suitable (N) and permanently non suitable (N2). For
the purpose of present study non suitability class is not further separated, because once it is
unsuitable with the dominant factor, it is categorised as an unsuitable category.
For the purpose of determination of ecological requirements for vegetable crops in this study
base on theoretical consideration, like reference materials, agronomy of vegetable crops,
specialists' opinions, and more precisely base on the local cultivation knowledge. Moreover,
the classification of these requirements is the average of a set of standard criteria, which
decide the limitations of different levels, below are some specific examples of ranking
ecological requirement of fruit crops:
- The very first limitation farmers normally take care of the limitation to make cultivation
much safer. Growth and development of plant has to be secure. So, the gap between
S1/S2 is a collection of lower limitations of high suitability levels. e.g., maximum land
slope for vegetable should be less then 1° to 5° but from 8° of slope gradient, crop is
greatly affected, so demarcation between S1/S2 could be started right from the 5°.
- Second demarcation point between S2/S3 is considered such limitation level which could
reduce the productivity to desirable extent.
- Whether the condition of land gives economical benefits both on growth as well as
productivity. Input investment is much higher then the output from the field, therefore,
the gap between S3/N is a demarcated with the limitations that make the crops unrealistic
and un-economically benefit,
Category of Physical land suitability
Most important is the existing land or soil characteristics of particular land units. When
making assessment for the land suitability for the current physical land suitability evaluation
condition prevailing in LMU is to be matched with the eco-physiological requirement of the
plant. More it satisfies the requirement, better will the suitability. Present GIS study shows
that existing land area of the Kathmandu valley in total is 58,369.9ha. Of which ever
increasing urbanization occupies 33.3% of land. Existing agriculturally active land mass is

159
23,519.3ha. In this area cultivation of all possible crops has been done with traditional
practices, primarily paddy cultivation and maize crops. Vegetable cultivation carried out in
paddy base farming system in low land and maize based farming system in uplands.
Therefore, in prevailing condition, temporary soil measures for example fertility, organic
matter and pH cannot be stabilized as it done for the vegetable. To make it considered
properly vegetable crops should be carried out in field continuously. On the basis of land
form, homogeneity of land characteristics and soil characteristics, total agricultural area is
divided into 85 land mapping units.
Majority of vegetables are the annual crops. They complete their vegetative and reproductive
phase of the life cycle within single season and some will continue for a year. They need
annual input in terms of labour, material and preparation yearly manner for expected yield.
Even though some of the land and soil factors limits effective growth and development of
the plant and in turn, lowers the potential production. Those factors are called as the limiting
factors. Suitability rating of the land gets altered because of the presence of one or more such
limiting factors. For vegetable cultivation practices, on the basis of presence of limiting
factor, physical land suitability has popularly been identified as
a. Current physical land suitability,
b. Potential land suitability
In case of current land suitability, existing condition is considered. Type of land, prevalence
of soil characteristics, diversity of crop used and ways of land preparations are prevailing act
to effect limiting factors. All of these have marked effects on the physiological functioning
of the plant. Suitability classification of the land mapping unit with existing condition of
physical parameter with potential crop is current physical land suitability. In some of the
research physical land suitability has been separated as soil suitability, land suitability and
climatic suitability like Bydekerke et.al. (1998). There is no opportunity to make any
improvement over existing condition to enhance production capacity of the land in this
condition. The current land suitability assessment is very important because it helps users to
recognise the current limitations of the land area for particular land utilization. It provides
opportunity to take necessary steps for the further improvement and transferring higher level
of suitability in potential suitability evaluation.
Characteristics from soil, land and climate which are the main component of physical
suitability is rated into high, medium, low and very low value for the given group of

160
vegetable crops. On the basis of agronomical requirements of crops all of the characteristics
are rated on the suitability ground into highly suitable, medium suitable, low suitable and
non suitable.
Figure: 6.3.1 Flow chart explaining model of determining suitability rating of each physical
parameter.
On the other hand, limiting factors which limits the growth and development of the plant can
be improved through external inputs. If organic matter is the limiting factor of any land
units, it can be managed by external application of the organic fertilizers. This means that
land is potentially fertile. Therefore, there is opportunity of transforming suitability rating of
the land in higher suitability level. This type of land suitability evaluation is called as
potentially land suitability. Potential suitability provides opportunity for the farmers to adopt
appropriate action towards production enhancement so as to get expected output. On the
basis of the above model of determining suitability ratings of each of the characteristic in
every land unit has been done. The result has been presented below in table 6.3.2.
Temperature and climate condition for maize in Mexico was rated by Alejandro Ceballos
and Lopez (2002) is similar with present study. They use it as spatial information and kept in
the GIS framework. In the present study, all the land mapping units show temperature
suitability as highly suitable condition. Since, average daily temperature for most of the
vegetable growing period ranges from 18 to 27°C. In such case if average daily temperature
above desirable limits will be rated as S2 and below required limits rated as S3. Similarly,
highly suitable (S1) altitudinal condition ranges 1200m to 1600m above sea level, land
mapping unit within this range given S1 and above 1600m to 2400m is categorised as S2
(MOA, 2006). Because increase in altitudinal range cause alteration in climatic factors.

161
Knowledge derived from the literature is subsidiary bases for the characteristics ratings. This
rating corresponds to the suitability ratings (figure 6.3.1).
Table: 6.3.2 Current suitability ratings of diagnostic characteristics for vegetable cultivation in Kathmandu valley.
Suitability Status of Diagnostic Characters Land
units Area to r hu s p a t d w sl Suitability
1 13.06 S1 S1 S1 S1 N S2 N S3 S1 S3 N
2 3541.75 S1 S1 S1 S1 S3 S2 S3 S2 S1 S3 S3p.t.sl
Full table including all LMU is presented in appendix table 12
Table 6.3.2 show details of the diagnostic factors with their level of suitability for the
support of the vegetable cultivation. No land unit in the Kathmandu valley falls under the
highly suitable ratings. There exist varieties of limitation which eventually degrade the
suitability rating to lower one. Highly influencing limiting factor for the suitability
evaluation is seen as fertility factors. Of 85 land units, 24 land units belong to the S2AHP
category. Influence of texture, fertility, and slope are seen in many land units. Altogether 54
land mapping unit are under the S3 ratings of the suitability evaluation. Figure 6.3.2 gives
the current land suitability evaluation map of Kathmandu valley. Study results seven land
mapping units with several slope gradient and unusable soil texture makes them fall under
the category of N i.e. non suitable for any vegetable cultivation. Data analysis reveal that
fertility factor alone in current suitability effects 11846ha of land area which is exactly 50%
of total agricultural land area is suffering from the low fertility, it has sever effect on the
suitability rating. Similarly, texture class affects some 40% of potential agricultural land area
in Kathmandu, it account for 9497.27ha. Problem is too clay and bouldery soil. In case of
vegetable cultivation, correction of this category needs very high amount of investment.
Slope gradient is another set back for about 22% land area of valley. Long, steep slope
makes land prone to heavy loss of top soil. On top of it, cultivation practices are very
impractical. There some of the land unit, due to the slope gradient factor, they are rated as
the non-suitable for the cultivation. Soil depth in study area seems enough for the vegetable
cultivation as it crosses the limits of 55cm. Only 1.4% land area got limitation of this type.
Altogether 65.8% of land area under consideration are suffering from any form of limitation
and cause to degrade into S3AHP category of suitability ratings.

162
All of above limitation are associated with the soil characteristics and slope. No climatic
factors are causing hurdle for the suitability evaluation. Most of the land areas in the valley
lie in between 1200 to 1600m above sea level. This altitudinal range falls under warm to
cool temperate climate region. Daily sunshine hour, temperature, average annual
precipitation and spatial distribution of evapotranspiration are supplemented by irrigation
processes are also found to be favourable to vegetable crops.
In conclusion, soil of the study area is suffering from lack of fertility investment. Application
of chemical fertilizers is the temporary solution to upgrade fertility ratings, however timely
application of compost manure can improve humus content and also enhance soil fertility.
pH of the soil in all area are acidic in nature, but are moderate. Study also suggest for the
agricultural lime application during the land preparation for the vegetable cultivation. Water
holding capacity of soil is more associated with organic matter content and texture of the
soil.
Table: 6.3.3 Current physical suitability evaluation for vegetable cultivation Current
Suitability Count Area (ha) Area (%)
S1 0 0 0
S2 24 7273.14 30.92
S3d.sl 1 23.05 0.10
S3p 25 4633.13 19.70
S3p.sl 4 1335.53 5.68
S3p.t 10 1792.45 7.62
S3p.t.d 2 162.53 0.69
S3p.t.d.sl 1 29.35 0.12
S3p.t.sl 3 3893.20 16.55
S3t 6 3542.27 15.06
S3t.d 1 75.65 0.32
S3t.d.sl 1 1.82 0.01
N 7 760.38 3.23
Total 85 23519.50 100.00

163
Since suitability analysis is multi dimensional approach, it is affected by many other factors
which may not be related to the land itself. Non spatial information like cultivation attitude
of the society and economic ability of the farmers are also associated with suitability.
Therefore complete suitability evaluation is multidimensional approach which should
incorporate both socio-economic criteria and infrastructural set up.
Table 6.3.3 about current suitability shows that the limitations are caused by the nutrient
content of the soil. The area of limitation is represented in figure 6.3.3 and 6.3.4. Such
problems can easily be maintained by the timely application of the manure and fertilizers.
Increase in the nutrient content can improve over all soil condition like soil atmosphere, soil
moisture and microbial activity of the soil and so on. Situations like this can offer higher
productivity and in turn shifting suitability level S3 to S2 or S2 to S1. If limiting factors are
of dominant or decisive ones like slope and texture or soil depth, the possibility of making
improvement is unlikely. Change in such criteria needs longer time. In such a case level of
suitability remain unchanged. In case of the texture, remote chances of making improvement
are always there.
Figure: 6.3.2 Current suitability map for Vegetable crops in Kathmandu

164
Thus, classifying and evaluating potential physical land suitability are valuable proposals for
effective land use planning. This requires close consideration into current limitations. As
stated above, review and close consideration over the limitation is very necessary because
that affect the growth, development and productivity of vegetable crops. Correction and
upgrading over current suitability into potential suitability is much beneficial. For this,
feasible measures and recommendations are proposed to improve the land, either by
technical measures or by economic measures.
In consideration of the current land conditions, as analysed above, there are many different
limitations affecting the growth, development and productivity potential of vegetable crops
in Kathmandu. To upgrade the current land suitability, it is essential to improve and
overcome these limitations. The suitability after improving limitation is potential suitability.
In case of Kathmandu 17% of the agricultural land area falls under highly suitable class i.e.
S1AHP category, after necessary improvement in general or minor limitation factors. Most of
them are fertility factor. 1087ha of land transformed from S2 level to S1 level. For example
in the table 6.3.2, land unit 27, current suitability level of S2 with limitation of fertility factor
has transformed into S1 in current suitability rating. Similarly, land unit 57 and many other
transformed to S2 category form S3p, limiting factor is fertility. This condition suggests that
land of the Kathmandu is potentially suitable for the vegetable cultivation. Similarly 38
percent of land which account for 9085ha falls under level of S2. In this category, many land
units with S3 level has been improved and upgraded to this class. Only 313ha of land are
cannot be improved to the workable category, which permanently falls under the category of
N

165
Table 6.3.4 and figure 6.3.5 presents the potential suitability scenario of Kathmandu both in
tabular data and map of spatial distribution. Potential suitability is still suffering from the
severe limitation, which is very hard to upgrade and bring back into upper suitability level.
Fertility factor is still limiting some 4% of total land. Soil depth is creating problem for
282ha of agricultural land i.e. 1.2% of all agricultural land. On many instances other factors
like irrigation also improves soil condition of LMU. But slope for such condition is also
problems. Slope of the land still effecting suitability level of 31% of land area. This is hard
to be improved. Making terraces needs longer time and high capital investment, which may
not be economically feasible. In the study area Slopping Agricultural Land Technology
(SALT) was introduced to convert slop land into terraced land. Plantation of hedge crops in
contour line and cultivation of alternate rows of permanent and vegetable crops could be
effective on improving land area. This technology improves the soil condition in the slop
land by slowing down speed of rain water flow and improves infiltration. Simultaneously
improves ground water recharge. After keen consideration of agro-ecological requirements
of selected vegetable in Kathmandu land units area transformed into higher level of potential
physical land suitability classification. Details are presented as figure 6.3.6 and 6.3.7 as
follows.
Table: 6.3.4 Potential suitability rating Potential Suitability Count Area (ha) Area (%)
S1 11 4087.95 17.38
S2 42 9085.10 38.62
S3d 1 13.07 0.06
S3p.d 1 21.33 0.09
S3p.sl 2 554.30 2.36
S3p.t 4 373.16 1.59
S3p.t.d 1 141.20 0.60
S3sl 1 552.28 2.35
S3t 9 1953.70 8.31
S3t.d 1 75.65 0.32
S3t.d.sl 2 31.18 0.13
S3t.sl 5 6320.93 26.87
N 5 312.67 1.33
Total 23519.50 100.00

166
If land users can conduct specific measures to improve and overcome the current limitations
of land units, they can raise the current suitability up to 1 level, for example from N to S3,
from S3 to S2, from S2 to S1 and also, can maintain the stable level of S1. In the present
study, land parameter evaluation and current and potential physical land suitability rating for
selected vegetable will be presented in preceding chapters.
Figure: 6.3.5 Potential land suitability map of Kathmandu Valley

167
In addition to technical measures, attention must be paid to environmental components and
socio-economic matters for better result in broader perspectives. Connection of these
components and attributes with their effects on suitability analysis will be discussed and
present in the latter sub-chapters.
6.3.1.2 Natural and Socio-economic suitability
The influence of physical land, environmental condition and socio-economic traits on
classification of the suitability levels of the land mapping unit is correlating in this chapter.
Infrastructure and input availability has marked effects on the yield and economic benefits
from the crop. Socio economic criteria selection is popular on GIS workings (Vo, Le &
Yamada, 2003). Marketing channel and proper market information to the growers has lead to
make decision over selection of type, time and varieties of crop to be cultivated.
Identification of physical capability of the land area has therefore, been discussed parallel
with physical parameters. The parameters in this study are regarded as the crux of the land
suitability evaluation in multi-criteria analysis.
It seems strange to incorporate social traits in the land suitability analysis because land is
purely physical entity, where social parameters merely exist. However some of the study has
successfully carried out research with suitability evaluation in this direction (Chuong, 2007).
Especially developing countries like Nepal, incorporation of the social and economic trait for
the classification of land for vegetable cultivation is new which may lead to lay milestone on
for new studies in the future. The model of present research can be generalised for the
application in the similar area of the country as well as outside.
Multi-criteria land suitability analysis, by its title is the cumulative use of all the sectors
including physical land characteristics, economic parameters and social traits. Physical
parameters are prerequisite, so multi-criteria evaluation will be proceeding only if land area
is physically suitable. Land area with suitability level S1 S2 and S3 are considered for
incorporation of social and economic component for further analysis. Non suitable land area
(N1 and N2) are omitted from suitability evaluation. Figure 5.4 in chapter 4 of methodology
illustrated detailed outline of the suitability ratings.

168
6.3.2 Selection of criteria for land suitability evaluation
Suitability evaluation always based on evaluating criteria, which is determined with the help
of varieties of information sources, field survey, group discussion and available secondary
data sources. Sustainable land management guideline (FAO, 1993) forms the framework for
setting up evaluating criteria and alternatives.
Criteria selection for the suitability assessment in the Kathmandu valley has certain
background. They are raised mainly through PRA with vegetable growers and selected
cautiously with recommendation from the experts and policy makers. After careful
consideration and criteria selection for the existing realistic local conditions, present study
has decided to set up criteria in three different hierarchical levels. First level consists of the
main group of criteria incorporating environmental, economic, infrastructural, and social
criteria. FAO (1976), Hossain et.al. (2007), Choung (2007) have used 3 aforementioned
main criteria. Physical and infrastructural criteria also very important to be considered. In
context of Kathmandu valley, three main groups of criteria are selected with careful
consideration of literatures and bio-physical condition. Every criterion has number of criteria
available. It is very important to scale up the criteria and apply them for multi-criteria
suitability analysis. Qualitative assessment was applied to select required number of sub-
criteria. From the list of sub-criteria, vegetable growers and extension workers are allowed to
select number important and influencing parameters for vegetable cultivation in Kathmandu
valley. The selected parameters are subjected to discussion with the experts. Literature aided
selection procedure concluded with selection of in total 15 sub criteria from 3 main criteria.
These sub-criteria make second line of evaluating criteria. Here economic-infrastructural
group has six sub-criteria, the social group has five sub-criteria and the environmental group
has four sub-criteria (table 6.3.5). In present research second level of criteria has not been
fragmented further into smaller criteria; however alternatives of the sub-criteria are subject
to make quantitative analysis for the suitability rating of individual land units. Therefore, this
research consists of 3 main criteria with 15 sub-criteria. In the same way a double track
approach was followed to compare land suitability as perceived by local farmers and through
evaluation of expert judgment was also done by Cools et.al. (2003) in Syria.

169
Fundamental of setting up criteria and sub-criteria can be summarised as follows.
1) Existing cultivation pattern adopted by farmers are greatly affected by the current
physical land parameters. Economic status of vegetable growers and infrastructure
development of an area also plays role on production. Social attributes leads decision
on type and varieties of crops to be planted and adoption of cultivation pattern.
Therefore, this situation is reviewed by experts and set up as three main criteria.
Broken down into sub criteria with degree of difficulties that creates for the
cultivation, here each alternative carries score value corresponding to the existing
challenges offered within piece of land.
2) Economic limitation is one of the prime causes to limit vegetable cultivation and
production process. Production related with the income from the farm, influencing
R/C ratio. This has further been closely linked with the availability of agricultural
inputs like fertilizers as well as technical service. Therefore, setting up sub-criteria
was tough job, which needs successful consultation with the farmers. It is also
important on finding influencing factors and trace out degree of difficulties arises
with socio-economic status of farmers on each land units.
3) Very important response of the farmers on choosing vegetable crop is spontaneous
which primarily based on the market prices. Other market parameters like product
quality, value addition, demand and time are not seriously considered. This situation
has over shadowed the role of physical land condition on crop growth because
majority of respondent had limited knowledge. On top of this, more attention has
been drawn by low economic condition of land users.
Therefore, many of the land users fail to choose appropriate crops in relation to market
demand and land prospectus. So it is advised to combine all of the above methods for long-
term as well as seasonal selection of the vegetable varieties for the specific land units. From
above discussion, following criteria with sub-criteria are considered for study. Furthermore,
for purpose of GIS analysis each criteria and sub criteria have to be provided with
appropriate codes to be used as field name in GIS database as shown in table 6.3.5.
Each sub criteria is provided with several alternatives that differ in different land units,
community level and household condition. Site specific importance of every alternative is

170
assigned with appropriate score value. The score value represents possible influence on crop
cultivation in that area. Score of each of the alternatives that are presented in the table 5.8 of
methodology i.e. in chapter 5.
Table 6.3.5 List of evaluating criteria and sub-criteria considered for Kathmandu valley Evaluating Criteria Code
Criteria I : Economic and Infrastructure
Irrigation facilities availability IRIGN
Road Network and condition ROAD
Value addition process VALUE
Market channel MARKT
Agricultural input availability AGINPUT
Revenue Cost Ratio R/C
Criteria II : Social Parameters
Marketing know how MINFO
Motivation of Farmers MOTIV
Cultivation Pattern CULTV
Labour force LABFR
Investment capacity CAPINV
Criteria III : Physical Parameters
Physical condition PHY
Erosion Potential ERO
Crop Intensity CRP
Risk of urban influence URB
6.3.3 Comparison of criteria for final suitability
Saaty’s theory (1977) on analytical hierarchy process (AHP) is the backbone of the pairwise
comparison of criteria and sub-criteria in present study. Large the number of sub-criteria
more complicated is the process of suitability assessment (Böhme, 1986). Each criteria and
alternatives of the criteria has different influence. According to degree of influence, score
values of each of the alternatives are created in the priority order which is subject to analysis
in the pair-wise comparison model presented in the methodology (table: 5.6). In this study,

171
factors were rated according to the PRA and evaluation of crop experts. Similar process was
also done by Alejandro and Lopez-Blanco (2002) for suitability analysis for potato in Mixico
Valley.
Pair-wise comparison is carried out in hierarchical order of the criteria. It begins with the
first level i.e. main criteria. If output of main criteria comparison is verified, further
comparison process has jumped up into second level which contains sub criteria of the main
criteria. While making analysis, an AHP matrix is prepared in the special module developed
in Microsoft Office (Excel) which yields final weight of the sub-criteria according to its
influence. Weight of the alternatives corresponds with importance of the criteria in the
vegetable cultivation in given land area. However it is necessary for the result to be
consistent that is determined by Consistency Ratio (CR). CR index is the basis for testing
reliability of the comparison result. The result is said to be consistent if CR index is below
0.10, otherwise it is necessary to repeat with revised consideration in AHP matrix for the
faithful result. Furthermore, the answers for the questions in pair-wise comparison have
close relationship with each other, the questions must be addressed at the same time for more
logical feedback. Besides, the final results of weighting are also influenced by the goal of the
research as well as the knowledge of the respondent.
First of all, each main criterion has to be fragmented into sub criteria. Each criterion has
alternatives, which carries values according to its influences. The nature of AHP method is
based on how to analyse intricate problems with number of criteria into simple groups of
sub-criteria and set them into priority order without changing their stability and consistency.
AHP is an uninterrupted process in which the input data are the results of pairwise
comparison based on the response of the research. The AHP has been presented stepwise in
the following tables. Each table presents workout of each level. The process of work out, the
weights and pairwise comparison first level of main criteria is conducted as in Table 6.3.6.
Table 6.3.6 Pair wise comparison of main criteria in Kathmandu ECO SOC PHY Weights
ECONOMIC 1 5 1 0.435
SOCIAL 1/5 1 1/7 0.078
PHYSICAL 2 7 1 0.487
Consistency Ratio (CR) =0.011

172
CI: Consistency Index
CR: Consistency Ratio
RI: Random Index
CI = (λmax - n) / (n – 1)
CR = CI / RI
λmax: The maximum eigenvalue
Table 6.3.6 demonstrates that the weights of three main criteria (level 1) for vegetable
cultivation in Kathmandu valley by employing AHP method. With consideration of above
weights, the physical environmental condition including soil factor claimed to be the most
important criteria. Similarly, economic and infrastructural condition is second important
criteria where as social attributes are in least important criteria. The CR index is less than
0.011 which verify validity and consistency of so the weights are acceptable and reliable.
1. Economic factors play major role than social factors in selection of the cropping and
cropping plot. Infrastructures if laid properly, it stimulate farmers to find particular
type of the crops and will create better environment for productions as well.
2. So social factor is less important to a greater degree with compare to economic
factors. (table 6.3.6)
3. With physical environment, farmer’s response that land physical criteria carries little
more importance then infrastructural and economic criteria. This is the condition
peculiar to the area like Kathmandu valley with typical physiographic settings.
Pair wise comparison and weights of sub-criteria in second hierarchical level within the main
criterion of economy-infrastructure is presented in the appendix table 13 which demonstrates
the result of AHP. The higher the weight is, the more important the sub-criterion is, and vice
versa. Present research in the periphery of Kathmandu valley show that irrigation is most
important factor (weight value 0.322) for vegetable cultivation. Revenue cost ratio is second
important sub-criteria. Market channel and road network are next almost equally important
criterion. The CR indexes in Table 6.3.4 is 0.027.
Irrigation facility is one of the basic requirements for the cropping but type of the irrigation
facilities available influences the decision regarding site selection for the vegetable cropping.
In present research irrigation system finds very important and prerequisite for the cultivation

173
if it is moving towards the commercial production from subsistence farming. Therefore
suitability determination is based on the irrigation provision. Revenue cost ratio is one of the
important factor influence living style of farmers as well as vegetable selection. Well
organized vegetable market are not yet been established in all sector of Kathmandu valley.
So it is in need to the welfare of farmers. Decent road network connecting all vegetable
cultivation pocket areas and market channel are essential for vegetable cultivation
development. Process of value addition to the product is important to get good market value.
Most of the farmers responding to present research make minor processing like washing and
bund making only. So, it seems to carry less value. Agricultural input availability is if
compared with other sub criterion, longing of farmers to have fertilizers, manures, improved
seeds, etc on time and in required amount is pretty much. Agricultural service centers are
scattered within valley but in irregular distance because technical input is equally necessary
as materials.
Marketing know-how carries the highest value influencing suitability evaluation process.
Based on the weight value presented in the last column, market information, cultivation
pattern, capital investment and labour force availability holds weight of 0.440, 0.250, 0.159
and 0.104. Motivation of the farmers is least importance among all sub criteria with weight
value 0.048. Appendix 14 offers the result of pairwise comparison of social attributes. Whole
process is consistent with CR 0.052.
Expert and the policy makers from the Ministry of Agriculture pointed out that the market
policy should be aiming towards the attracting farmers to bring their product for sale. It is
necessary for farmers to be informed about ongoing market policies. If farmers are well
informed about market and prices of product, they may be motivated with bottom-up
approach, it revealed that they are more interested to know about market happening because
they can plan their cultivation and farm management according to the market demand.
Shortage of labour force was felt around the lower part of the peri-urban area. The matter
was more seriously raised because youth are more influenced by urban style of living. They
are reluctant in farm related work/profession. The inflow of the seasonal workers from the
neighboring district is not permanent solution. Majority of the farmers are small holders, big
capital investment is problem. Here motivation is found to the satisfactory level. This weight
gained in each individual sub criteria while working with the AHP model, fairly reflects the
scenario that was in the field.

174
Physical environment is the most important criteria, which was further divided into four
components of sub criteria affecting vegetable farming in Kathmandu. All of these sub-
criteria are related with ongoing processes within the valley. Among them, physical land
suitability is very important with weight of 0.635 followed by crop intensity with weight
value of 0.201. Erosion intensity and urban encroachment has almost equal value of 0.084
and 0.080 respectively. Consistency ratio is 0.34, which is well below 0.10. Pairwire
comparison result of sub-criteria of physical factors is presented in appendix table 15.
Experts and fieldworkers as well as farmers, all of them are well aware of the physical
setting and topographic undulations of the Kathmandu valley. Therefore all of them keep
physical land suitability as the prime criteria for the judgment of the land. Crop intensity in
the field is second important parameter on which most of the land characteristics depends. It
might be detrimental if land is cultivated with intensified crops without making proper use of
land improvement measures. It also carries value for the consideration. Prevalence of soil
erosion hazard threat can be taken into consideration during the land evaluation process.
Risk of the urbanization and land encroachment of the cultivated land is ongoing problem in
the greater Kathmandu area. But farmers are not much worried on this matter and said that
vegetable cultivation does not get much affected with urban expansion. Scattered and small
patches of land area can successfully be used for appropriate vegetable cultivation.
Weight of the main criteria and weight of corresponding sub criteria are the basic component
of the overall weight of the each individual criterion. Overall weight finally shows its role
and possible influence on vegetable crops. Overall weight is computed from multiplication
of the weight of main criteria and sub criteria. For example, as shown in the table 6.3.7
weight of the economy criteria i.e. 0.435 is multiplied with weight of its sub-criteria market
channel i.e. 0.138 yield overall weight 0.060. This value determines the position of the sub
criteria on the importance order. Sum of the overall weight of all criteria involved in
calculation will the 1.0.
The overall weight carried by each main criteria and sub a criterion with possible alternatives
has been derives through procedure shown in figure 6.3.8. In priority order to make on
decision for the vegetable cultivation physical environment plays the most important role. In
comparison to other major criteria it draws utmost importance of the farmers and policy
makes for the selection of the vegetables.

175
Table 6.3.7 Calculation and estimation of weights for criterion in Kathmandu valley for vegetable cultivation
Criteria Sub criteria Overall Weight
W1 W2 Wi= W1 x W2
1.1 Market Channel 0.138 0.060
1.2 Road Network 0.148 0.064
1.3 Value addition
processes availability 0.034 0.015
1.4 Agricultural input
availability 0.096 0.042
1.5 Irrigation facilities 0.322 0.140
1. Economy and
Infrastructures 0.435
1.6 Revenue/Cost 0.262 0.114
1.1 Marketing know-how
and information 0.44 0.034
1.2 Motivation of farmers 0.048 0.004
1.3 Cultivation pattern 0.25 0.020
1.4 Labour force
Availability 0.104 0.008
2. Social
Attributes 0.078
1.5 Capital investment 0.159 0.012
1.1 Physical Condition 0.635 0.309
1.2 Erosion Hazard
potential 0.084 0.041
1.3 Cropping Intensity 0.201 0.098
3. Physical and
Environmental
Factors
0.487
1.4 Urbanization
Influences 0.08 0.039
According to AHP methods, weight value has been calculated as 0.487, 0.435 and 0.078 for
physical environmental factors, economic parameters and social attributes respectively.
Economy and infrastructural criteria is second important and social attributes has least
influence over decision making procedure. Altogether there are 15 sub criteria from 3 main
criteria assess for the weight value on the basis of its influence over vegetable cultivation.
All of them are assessed separately on AHP as developed by Saaty (1977). Last column of

176
the table 6.3.7 presents variable value for each of the sub-criteria which indicate their
Overall Weight.
Figure: 6.3.8 Generation of overall weight of criteria and sub criteria through AHP
According to the result of AHP among 15 sub criteria, physical condition of the Kathmandu
valley stood first and primary criteria with overall weight value of 0.309. Being unique set
up of the Kathmandu valley and its topographic condition, almost all farmers are concerned
with soil condition. Therefore, physical land suitability always makes primary criteria for
decision making. Similarly irrigation facilities make second important sub-criteria with over
all weight of 0.14. Very limited area is facilitated with perennial irrigation system and most
of them depend upon rain water irrigation facilities. In the same way revenue/cost ratio is
one of the important factors which draws most attention of the commercial farmers. In
present research it stood in the third main parameter influencing development of the
vegetable production in Kathmandu valley. Larger the cultivation parcel, higher would be
the R/C ratio. But in the Kathmandu valley land fragmentation is in continue state, this
causes higher intensive labour input, this situation certainly causes to recede R/C ration and
decrease net profit. Market channel and road network are inseparable entities for the
vegetable crop development. Both have almost similar weight value, 0.06 and 0.064
respectively and stands in 6th and 5th important parameters. Cropping intensity is placed in
4th important value with overall weight value of 0.098.In general land of the Kathmandu
valley holds intense cropping system. Present study reveals that motivation of the farmers is
least important parameter with weight value of 0.004. Although Kathmandu valley gradually
facing labours force shortage in near future, present research identifies it as second least
important parameter. Small land parcels and small farmers and huge amount of capital
investment are not seen and any parts of valley. Capital investment sub-criterion has overall
weight 0.012 indicating slightly influencing role. However farmer’s response shows that

177
they also influence vegetable cultivation to some extent but not severely. Most of the
cultivation areas located in the valley periphery is still in cultivation friendly condition. It
occupies 8th position in the ranking of the sub-criteria based on its influence for cultivation,
which has overall weight 0.041. Weight value of the criteria has been presented in the table
below in increasing order of its weight value.
Overall weight of the all the criteria and sub criteria are supposed to be distributed
homogenously within study area. Therefore in GIS analysis, all land mapping units have
same weight value of particular criteria. It is regarded as the constant for all land unit of
study area. These overall weights of criteria are main basis for suitability analysis. Suitability
classification is carried out on the basis of Suitability index (Si) value. For particular land
mapping unit within study area, situation of the criteria may have different in compared to
other land mapping units. Every land mapping units, therefore, have to identify exact status
of the criteria. This status is given in the numerical value in the range of 1 to 10. 10 is highly
favourable condition and 1 is not at all. The evaluation model is defined using the value of
factor rating used to be done by many researchers like, Mongkolsawat et.al. (2002) use value
0.250-1.0 to evaluate S1, 0.1 -0.250 as S2, 0.100 – 0.25 as S3 and less than 0.025 as N. Same
author made another numerical classification for grape crop like > 0.2 is S1, 0.1 to 0.2 as S2,
0.01 to 0.1 as S3 and <0.01 as unsuitable. Similarly Kalogiroua (2002) had develop model
for land suitability classification in five different scale of score in the range of 100 to 0
where Score 100–98 as S1, 98–85 as S2, 85–65 as S3, 60–40 as N1 and <40 as N2.
Therefore, numerical classification is different for different crops in varieties of location.
Generation of fact value for any given LMU is very important and crucial. In present study,
it is determined through “bottom-up” approach by participatory research appraisal that
includes group meeting, questionnaire analysis and brain storming among farmers. The out
come is further blended consulting with experts and agricultural extension workers. Field
survey of the researcher also gives real time evaluation of the situation because consideration
of field condition is mandatory. Weight score of criteria and fact value of alternatives are
basic components for the computation of land suitability index.
Then, all information relating to the scores of weighting and fact value of each sub-criterion
is transferred to and stored in the land unit database in GIS. The layer of information of
scores and fact values of each criterion and sub-criterion is created as thematic maps for
conducting the overlaying process. Overlaying the information layers and calculating the

178
suitability level in accordance with the real conditions of Kathmandu valley applies
following formula: Si= ΣXi x Wi (Table 6.3.11). Based on the established classification of
suitability index (S) Table 5.7 of methodology, the area and suitability level of each land unit
for vegetable cultivation in Kathmandu valley is determined. Those land units with general
suitability indexes (Si) from 8 to 9 are classified as high level of suitability (S1AHP);
suitability indexes from 7 to 8 are medium level (S2AHP); and less than 7.0 are low level of
suitability (S3AHP) as shown in the figure 3.6.9. Calculation of suitability index of all 85
LMU is presented in table 6.3.8. Categorisation of non-suitable land area are not
incorporated in further lower level it is because when land area is physically unable to allow
optimum growth and development of plant, it is worthless making remarks over social and
economic attributes. Therefore, non suitable class of land is physically N.
Figure: 6.3.9 Model of suitability rating of individual LMU
Vegetable cultivation in Kathmandu valley plays important role in sustainable agricultural
development. According to International Framework for Evaluating Sustainable Land
Management (FAO, 1993), FAO instructs that the sustainable evaluation of a land use
system requires comprehensive consideration of related criteria, including: economic
sustainability, social acceptance and natural sustainability. Depending on the characteristics
and development objectives of specific land use types or crops, these criteria have different
significance and priority weights. This causes certain difficulties for land users to decide
which crops or land use types are suitable. The results of land suitability evaluation for land
utilization type of specific vegetable varieties in study area involve AHP analysis method,
this is an approach to deal with multi-criteria problems to identify the suitability level of
each land unit and propose sustainable agricultural land use orientations in the future.

179
Table: 6.3.8 Suitability indexes of all the criteria for multi-criteria land suitability evaluation. Si= ΣXi x Wi Suitability LU
ID
AREA
(Ha) Irign road value Markt Aginp n1 n2 n Crop Urb
Index
(Si) So-eco
1 13.0 0.98 0.32 0.11 0.36 0.29 0.69 0.35 4.9 N
2 3541.7 0.98 0.45 0.14 0.42 0.29 0.78 0.35 6.6 S3
3 572.3 1.12 0.45 0.12 0.48 0.34 0.78 0.31 6.7 S3
4 338.3 0.70 0.38 0.11 0.36 0.29 0.69 0.35 4.6 N
Detail of all land mapping units are presented in the table in appendix table 16
Result obtain from the physical land suitability evaluation and multi-criteria analysis of all
the criteria further blend in the LIS database for the estimation of the final result of land
suitability. Each of the attributive information of the study area is designed to form separate
layer for production of thematic layer. All of them are subjected to overlay in GIS
environment for estimation of final results of multi-criteria land suitability evaluation of
Kathmandu valley for vegetable crop production. The attributive information from 15 sub-
criteria of 3 main criteria is overlaid and used for reckoning suitability index (Si) for each
and every land mapping units within study area.
Figure: 6.3.10 Multicriteria land suitability evaluation of the Kathmandu for vegetable
cultivation
Figure 6.3.10 is the GIS map of Kathmandu valley showing distribution of the different land
unit in their own suitability classes. Allocation of the information regarding fact value for

180
each of the alternatives is basically based on bottom up approach which is giving real time
situation estimation
12%3%22%63%
Highly Suitability (S1) Medium Suitability (S2)
Low Suitability (S3) Non-Suitable Area (N)
Fig: 6.3.11 Percentage of land area for different suitability evaluation
From the analysis it appeared that in Kathmandu valley severity of the limitation has resulted
into differences in suitability classes. Present analysis shows that only single land units with
an area of 2834.2ha falls under the S1 category. This is purely peri-urban area with lowland
alluvial plains with good drainage soil. Still the area is variously used for the vegetable
cultivation. Second category of medium suitability (S2) is distributed into 24 land mapping
units cumulatively accounting for 22% to total land area. More than half the total land area is
belongs under low suitability classes i.e. S3 class (figure: 6.3.11). Number of land mapping
units for this category is 53 and is distributed through the inner periphery of valley. Although
socio-economic condition and infrastructural availability are in normal condition some land
mapping units have unsuitable type of land settings. Therefore, in present study altogether 7
land units with total area of 664ha is falls under unsuitable area for vegetable cultivation
purpose. Table 6.3.9 provides summary of land units with suitability ratings of study area.

181
Table: 6.3.9 Details of the Multi-criteria land suitability evaluation of Kathmandu Valley for
vegetable crops.
Suitability Ratings Counts Area (ha) Area (%) Land Units Highly Suitability (S1) 1 2834.2 12.05 10
Medium Suitability (S2) 24 5185 22.05
8, 11, 13, 17, 18, 19, 23, 24, 27, 31, 34, 37, 41, 48, 49, 53, 58, 60, 63, 67, 68, 70, 74, and 75
Low Suitability (S3) 53 14836 63.08
2, 3, 6, 7, 9, 12, 14, 16, 20, 22, 25, 26, 28, 29, 30, 32, 33, 35, 36, 38, 39, 40, 42, 43, 44, 45, 47, 50, 51, 52, 54, 55, 56, 57, 59, 61, 62, 64, 65, 66, 69, 71, 72, 73, 76, 77, 78, 79, 80, 81, 82, 83 and 84
Non-Suitable (N) 7 664 2.82 1, 4, 5, 15, 21, 46 and 85
Total 85 23519.2 100.00
6.3.4 Discussion
Application of the multi-criteria land suitability evaluation based on the FAO method has
been adopted in the context of hilly area with appropriate modification. Unlike some of the
literatures (choung, 2007) physical land parameters are identified as most important criteria.
It is very natural because the case would be true only in the area like Kathmandu valley with
undulating uplands with many limitations. Urban sprawl is also continuing because of
topographic setting and centre for economic. A second important criterion is economic-
infrastructure and social attributes has least weight, so it is third important criteria. Multi-
criteria analysis was carried out through MCH process, and among 15 sub criteria, physical
land parameters and irrigation facilities and revenue/cost ratio are calculated as first, second
and third important sub-criteria respectively which are influencing suitability ratings of land
area accordingly. Among other sub-criteria most of the sub criteria of economic-
infrastructure are decisive in the processes like market channel and road network. AHP
process to calculate weight for the importance identification of the sub-criteria, consistent
182
ratio (CR) has been maintained for reliability because CR has to be below 0.10 otherwise the
calculation is taken as an inconsistent.
An important advantage of GIS is the ability to update current ratings easily when new or
better information becomes available (Pradhan & Perera, 2005) and the ability to obtain
output from the improved model. A new map can be generated in a relatively short time with
less effort and lower cost than for additions to files on paper, manual planimetry, and
conventional map updating (Hossain et.al., 2007).
General impression from the research is drawn that motivation of the rural people towards
cultivation is praiseworthy in comparison to urban dwellers. Basic factors for making
changes in the suitability ratings of the land area are availability of the irrigation sources and
market related knowledge of the farmers. Physical land characteristics like soil fertility is
one of the prevalent factors which make most of the land mapping unit falls under lower
suitability class. So availability of the agricultural inputs in the uplands of Kathmandu valley
seems important. If correction is done over problems identified in present study, majority of
land area can be rated into highly suitable class. Farmers have to be considered as core
factors for the motivation. Awareness and motivation will develop level of agricultural
practices and information about market know-how to the farmers. If farmers are motivated to
make use of output this study, empowerment of vegetable growers can be done.
Land fragmentation is another factor to effect land use discussion. Fragmentation results in
small size of land holdings. Smaller the size of land, intensive input applied keeping
production constant (Upreti and Upreti, 2002). So, R/C ration would be affected. Urban
sprawl in Kathmandu is one of the burning problems for the urban vegetable growers
because present trend of urbanization resulting into conversion of agricultural land into small
fragments and sell it for the purpose of construction. Still half the total vegetable growers are
adopting traditional way of cultivation which doesn’t apply any measures to control erosion.
This is related to cultivation pattern for specific crop and physical land setting. Therefore
majority of the respondent are reluctant to know more about soil conservation measures.
However this issue was main theme of discussion on seminar with experts.

183
7 GENERAL DISCUSSION
Multi-criteria land suitability evaluation in this study uses physical and environmental
parameters, social attributes and economic indicator as necessary factors for best possible
outcome consulting both with farmers and experts (Cools et al. 2003). Spatial information
like maps and land related attributive characteristics are incorporated into GIS based data
of land suitability evaluation as a system. Use of social and economic parameters through
AHP analysis provides reflection of real situation of study area. GIS technique along with
AHP used for the land suitability evaluation improves efficacy of the outputs of the
evaluation.
Agricultural land use planning, resources management decision making in Nepal required
consideration of land ownership and land tenure policy. Lack of access to agricultural land is
probably the main contributor to rural poverty but poor quality of land, such as in the rainfed
areas of the Hindu Kush (Mountain) region, has become a major obstacle to agricultural
growth and alleviation of poverty (Khan, 2000). Land degradation aggravates poverty but
equally poor agricultural practices induced by poverty exacerbate land degradation creating a
downward spiral of human and environmental exhaustion. So Kathmandu valley coincides
with the situations mentioned above. The reasons for uncontrolled urban growth are the
massive in-migration and natural growth in the Kathmandu valley. There are urban plan and
policy guidelines to manage the urban growth in the country but these are not implemented
properly at the city level (Pradhan & Perera, 2005). Transformation of agricultural land to
non agricultural purpose is growing problem in Kathmandu valley, and agricultural land is
getting depleted mostly in the core area of valley. Therefore, result of this study can lay one
milestone for the stakeholder to know potentiality of the land for effective land use and land
management.
Under the Agriculture Perspective Plan(APP), priority has been given to soil fertility
research and extension particularly through integrated plant nutrient management systems
(IPNMS) that incorporate both organic and inorganic fertilisers (MoA, 2005). Due to
inadequate attention to land ownership issues and tenure arrangements the future impacts on
soil fertility and expansion of intensive farming in hill and mountain areas will be effected.
(Blaikie and Sadeque, 2000). Therefore guidance must come from the policy statements and
translated into operational plans that help implementation of land management activities.

184
The existing policies need to be simplified, harmonised and brought into line with other
policies.
Application of information technology in this area is inevitable. However it is not gaining
enough attention of planners and policy makers for land management in Kathmandu valley.
Present research work indicated the need of all round information exploration for
development of vegetable farming at the community level. Output of the scientific result
should aim to enhance the sustainability of natural resources for livelihood of the local
people concerned. Therefore social and economic attribute together with land quality
information in present work are combined to have useful, comprehensive, systematic, easy-
to-use and easy-to-update information system. This type of study from national level to
village committee level is very essential to enhance vegetable farming system in particular
and overall agriculture in general is needed to uplift economic level of local farmers. Given
the continued degradation of natural resources, appropriate natural resource management
policy decisions are arguably the most important among various policies implemented in
developing countries (Babu and Roe, 2000).
Soil fertility and nutrient availability in soil of Kathmandu demands reasonably external
input. Soil fertility capability classification can be performed through GIS, after LIS
generation is complete where external fertility status of soil is expressed. Fertilizer
application has to be coupled with use of all natural and man made sources of plant nutrients
so as to increase crop productivity in an efficient and environmentally benign manner,
without diminishing the capacity of the soil to be productive for present and future
generation (Gruhn et.al., 1995). Fertilizer nutrient applications are necessary to maintain soil
fertility and sustain agriculture over long time, however over application is simply wasteful.
Low use of fertilizer reduces fertility of soil and it also increases soil degradation through
nutrient mining (World Bank, 1992)
Vegetable sector is one of the important components of Nepalese agriculture where diversity
in vegetable cropping brought about by different agro-ecological regions of the country.
Nepal falls under category of low human development index country. High economic growth
rate is expected in the long term which is necessarily contributed by National agricultural
Plan. It simply aiming to

185
a) Increase on vegetable consumption to support on nutritional security of the people
b) Emphasis on intensive farming rather than in extension of the land area
c) Diversify vegetable farming according to agro-ecological zones of Nepal
d) Put emphasis on commercialization of vegetable cultivation
Kathmandu valley is popularly known for its contribution on vegetable production. However
in the recent decade, population explosion, ecological degradation in the hills and the rapid
degradation in the quality of the urban environment, including riverine ecology, have raised
concerns. The growth rate of the urban population is higher than the rural population.
Topographic setting causes to have great variation in climatic condition between the valley
basin and the surrounding hill ridge. Kathmandu valley possesses suitable physical
environments for vegetable production. Nowadays identification of the land area matching
specific vegetable varieties is becoming major concern. Although total land area has
potentiality to supply about 72% of total demand of vegetables, it is supplying only about
one tenth of the total consumption. Therefore relevance of this type of research can make
sincere contribution to lead farmers towards economic benefits and also maintains agro-
ecological prosperity. While making suitability analysis, it is very important to incorporate
aspiration of the farmers to motivate them on the mainstream of peri-ruban vegetable
cultivation. Along with physical and land attributes, importance of the social attributes to the
vegetable crop development and overall agricultural enhancement in Kathmandu valley has
achieved by present research. Especially broken and undulating topographic land area needs
to be segregated and specially allocated for the development of vegetable self sufficiency. If
result of the present study is followed at least within Kathmandu valley, this will contributes
to the greater extent to National Agricultural Plan.
Indigenous knowledge of farmers is one of the major factors contributing to conservation of
agrobiodiversity. Berkes et.al. (1995) describe that an important element of indigenous
knowledge is its foundation in several years of experience and observation of farmers on
particular species and their interaction with ecosystems. If land is utilized with its full
capacity to grow potential cash crops like seasonal vegetable compatible with local farming
system, it helps on reduce poverty and enhance land improvement process. Farmers make
efforts to maintain and conserve the diversity of living organisms and their habitat through
the particular farming systems of their area. Changing in farming system over time could
bring counter productive result. Conservation of indigenous species with improved method

186
of cultivation incorporating in existing farming system of Kathmandu valley can help
conservation of agro-biodiversity. At the same time increasing population pressure, rampant
poverty and environmental degradation in Nepal are posing severe threats to floral and
faunal diversity in Nepal (Upreti and Upreti 2002).
Vegetable farming in chronological basis in planned way makes optimum utilisation of land
capacity. Result of multi-criteria evaluation of land will determined investment requirement.
If area comprises with smaller holdings should only have intensive cropping which require
high investment.
Suitability index is one of the best measures for the decision making for land selection. The
result of present study suggest that land area with suitability index above 6.0 (Si >6.0) can be
used by user for vegetable farming. If Si index is below 6.0, it possess with different degree
of limitation, some of which are related with social and economic limitation. Numerical
categorisation for the suitability index will more precisely site specific (Kalogiroua, 2002)
however the range more often is in the scale of 1 to 10. Such area cannot be allocated for the
cultivation purpose. The investment requirement for such area is very high depending upon
degree of limitation. Those areas can be used for alternative purpose, like forestry or
recreational or may be building up area. If minor soil related limitations are there, gradual
process can also be recommended to correct limitation in the long term basis.
If massive land area is selected for the vegetable cultivation in commercial basis, multi-
criteria suitability analysis is only alternative to assist for decision making process.
Infrastructural criteria can have big role however, small area cultivation for domestic
purpose can be carried out as a test plot. Looking at the economic status of Nepal,
identification of suitable land area for any kind of vegetable cultivation ensure food security
and uplift nutritional security within country. If fertility management of the soil is done as
indicated by present study, it will definitely enhance productivity. More production can
reduce market price of the vegetable commodity which can be purchased by lower class
population. This certainly helps on ensuring nutritional security of resource poor household.
Hence, the model of suitability analysis is decent method to be applied for the extension of
the cultivation area and selection of the variety of vegetable crop for the enhancement of
economic status of farmers.

187
It is the responsibility of land users to make clear selection of the area to be used for
cultivation, which further be evaluated through multi-criteria analysis using AHP. GIS being
one of the powerful tools, efficacy of the evaluation process will be maintained. Non spatial
parameters can also be analysed in the spatial basis to help making decision process easier
Response to Research Questions
The findings of this study are able to address the research query set during hypothesis
setting. The success of the research lies in level of satisfactory answer put forward by
research result.
Query 1: How is the vegetable cultivation practices and land use condition in Kathmandu
Valley?
Introduction of study area in previous chapter provides baseline data for the selection
of evaluating criteria. Following conclusion are made after carrying out descriptive
analysis of the study area. The climate conditions of the study area like precipitation,
temperature, humidity, wind speed, etc. supports development of wide range of
vegetable crops. This is a very big advantage which can offer high productivity.
However, irregular annual rainfall distribution, longer drought period would result in
water shortage condition which has to be mitigated with irrigation arrangements.
Clear seasonal gradient is helping for growth of specific crops but off seasonal
vegetable production in plastic tunnel and temporary green house is also popularly
adopting by the farmers. In addition, altitudinal gradient demands mixed type
horticultural practices like agro-forestry which is in practice in peripheral slop upland
area. The terrain of the valley is very complicated. Mountainous terrain with various
slope gradients is difficult for designing fields and growing vegetable crops. This is
very potential to cause erosion and severe soil impoverishment and deterioration if
cultivation doesn’t consider right methods. Although water bodies in the valley are
evenly distributed, they are not able to sufficiently supply the water demand for
domestic and irrigation purpose. Therefore, easy and accessible alternatives for
irrigation system are necessary to clear severe limitation for suitable land allocation.
It is very discouraging situation for extension of agricultural land, at present
situation, it can only be done with expense of valuable forest area. However this

188
activity causes gradual corrosion in biodiversity. Rather agricultural land area is
constantly been sprawl with settlement extension.
The socio-economic status of the farmers in study area is up to average level. There
are good network of rural road system, but poor irrigation possibilities. There is
couple of well organized markets places with good marketing channel. Field-to-Sell
system of marketing is popularly established in Kathmandu valley, where farmers
bring vegetables directly from farm and sell them directly to the consumer.
Complicated marketing network involving series of middleman is unpopular to the
small producers.
Because of topographic constrains, larger machines and tractors cannot be used.
Small holdings of agricultural land are managed with hand used simple agricultural
tools. Availability of agricultural labour force in some area limits cultivation
activities. Education and technical know-how is limited among majority of the
farming population. Most of them are manual workers and are champion in
traditional ways of farming. In the same way farmers from low income group have
incapable of enough capital investment which affects agricultural activities during
sowing period. Agricultural service centers are not evenly distributed along study
area this limits easy and frequent consultation to every farmer as and when they need
it.
Of total area of 58,369ha, only 23,519.3ha of land is presently available for
agricultural activities. Research reveal that only about 33% of present total
agricultural land used for vegetable cultivation purpose, rest area is permanently used
for the traditional cereal crops cultivation. From the analysis of soil characteristics,
soil in the valley has potentiality to support diverse vegetable crops. Decrease in
organic matter (OM) content and low soil fertility is prevalent limitations of study
area. Only about 3% area holding very low fertility status, rest belongs to medium
fertility status. The level of soil fertility can be ranked through assessment of
Potassium>Carbon>Nitrogen>Phosphorus in soil. This parameters is temporary and
be corrected with necessary input. With wise and appropriate agricultural input, they
can bring about long-term effect to support vegetable crops.

189
Lack of a comprehensive land use policy base on the land capability is one of the big
problems. Rice-wheat and maize-mustard is most common agricultural land use
pattern. But since a decade, wheat and mustard in both pattern of cultivation is
gradually replaced by vegetable. Some of the land mapping units in eastern periphery
of valley, vegetable crops is only cultivated round the year. Vegetable cultivation
brings diversity on cultivation and higher quick turn over, which bring about high
and stable economic benefits. Market oriented cultivation derive farmers to make
decision on selection of vegetable varieties. Therefore, suitability assessment will
have marked benefits in this regard.
Query 2: What are the promising vegetables in the existing land, climates, social-economic
and infrastructural conditions study area?
During period of investigation, three main group of vegetable found to be promising
in existing condition of Kathmandu valley. First group of Cole crops which includes
cauliflower and cabbage. Local varieties of cauliflower are one of the oldest
cultivating species and popularly consumed by people. Due to the climatic severity,
such vegetables can only be cultivated on specific season. These vegetable provides
good economic return to the growers. Similarly, among root crop, raddish and carrot
are promising ones. Soil of upland with higher sand content is better option. Slope
and rough topographic land area is also successfully be used. Low economic input
and high and fast return would help growers uplift their economic condition. Low
land of the valley basin is popularly used for the potato cultivation. Most of the
lowland areas are supplied with perennial water sources which makes them easy for
irrigation. Third category includes fruit and leafy vegetable like tomato, egeplants
(brinjal), beans, and so on. Cultivation of such vegetables is diversified in season and
quantity. Local food habit, tradition and social structure are seen as driving forces for
vegetable growers in peri-urban area of Kathmandu valley. Market demand is very
often determined by food habit and tradition. Therefore, farmers are selecting
vegetables which require less value addition procedure and high demand commodity
for commercial purpose. Couliflowers, raddish and potatoes are most used and
largely cultivated in Kathmandu valley. Climatic condition analysis shows that
condition is appropriate for vegetable and seasons.

190
Query 3: How does land information system (LIS) play role in suitability evaluation?
Land information system (LIS) is the back bone of the land suitability analysis
through GIS application. For the purpose of present research the land suitability
evaluation. Different information sources were used for soils and land information
collection where the real conditions of the study area were also consided. This study
has identified major factors to be contributed to establish land unit map, including
soil unit types, soil slope level, soil layer depth, soil texture, etc as spatial
information. Database is entered in the GIS environment and separate thematic layers
are produced. Each of the thematic maps with information on all 85 land mapping
units is for the generation of land suitability map for vegetable crops in Kathmandu
Valley. Using LIS a database system is created with help of the GIS software,
allowing users to access, edit, overlay and analysis to establish a new map that meets
the requirements of the study. Moreover, LIS helps to create new information, saving
time searching for fundamental figures from the very beginning. The land use
consultancy and land suitability assessment for agricultural crops, sustainable land
use planning and land allocation are therefore easier, which directly benefits the
users. Existing land information system and database of land units managed and
stored in the GIS can be updated and be used for land suitability assessment of
different agriculture crops and land management.
Besides this area for the suitability analysis can be brought into any boundary level
from Kathmandu valley to district level and also in the village development
committee (VDC) level. Land information system is necessary and usefulness village
level because local authorities always prepare policies in micro-level targeting poor
farmer with small holdings. Land information system prepared in this study for
Kathmandu valley can be use for the other non agricultural purpose. Agroforestry
development, land use planning and land management. Therefore, suitability
evaluation of the land in Kathmandu can be done for many other crops and
sustainable land management as well. Erosion hazard distribution map can also be
prepared with some more subsidiary data. This further helps on handling of
agricultural land with appropriate technology and crops. This makes further easy and
accessible to update and apply LIS database for effective result.

191
Query 4: How is physical land suitability assessment resulted?
Physical land suitability evaluation involves land and climatic attributes only. Among
them soil parameter are important parameters that makes decisive role on physical
land suitability analysis. In physical land suitability the high suitability level (S1)
does not exist in any land units but in potential land suitability, S1 category was
found in some 17% land area belonging to 11 land mapping units. Similarly, 30%
(7273.14ha) of Kathmandu valley shows second category S2 level where as in
potential suitability, it extends up to 38% (9085.10ha) of land area. Third category
(S3) was most prevalent in the suitability class. It account for 33% land mass of study
area belongs to current suitability which is improved into 38% in potential suitability.
Among all these major limiting factor for current suitability is soil fertility. Here in
this case regular input can improves the soil condition. In potential suitability, land
slope is major limiting factor, which can’t be corrected easily unless improved
technology is applied for example Sloping Agricultural Land Technology (SALT).
Result concluded that suitability of all the land units are consisting of land quality
with limitations of certain degree. These limitations are dominant ones which are
very difficult to transform, including: unsuitable soil types, soil texture, steep slope
and so on. Some limitations can have marked effects on suitability rating but can
easily be improved, such limitation are called as ordinary limitation. For example,
low soil fertility (pH, OM, N, P, and K). From the suitability level of current physical
land, analysis and evaluation of potential suitability level of land units is done.
Technical and economic measures are considered to make correction on the
limitations, so that the result of potential land suitability is achieved. After
recommended remedial activities, suitability ratings of land units get improved. The
potential physical land suitability is then brought to the second stage of suitability
analysis, together with the socioeconomic and infrastructural conditions. In later
cases, area with physical suitability level of S1, S2 and S3 are taken into
consideration; where as non-suitable land (N) is not considered for further evaluation.

192
Query 5: What are the criteria for suitability evaluation and how does multi-criteria land
suitability evaluation classify land in different suitability ratings?
For vegetable crop development in Kathmandu valley, in present research, land
suitability evaluation has been carried out based on three main criteria: namely
physical environmental conditions, social parameters and economy and infrastructure
conditions. Total assessment process was laid out in two ways: first, evaluating the
physical land suitability level where land characteristics are evaluated and Second is
outcome of physical land suitability evaluation in combination with social parameters
and economic-infrastructure condition of study area. Sub-criteria of these three
sectors are blended for multi-criteria analysis making use of AHP procedure. Results
of Multi-criteria land suitability evaluation has been presented in chapter 6.3.
In Multi-criteria land suitability assessment for vegetable crops in Kathmandu valley,
first of all three main criteria and 15 sub-criteria was set as mention above. Through
pair-wise comparison, among them physical land criteria was computed as most
important characteristics, because it has highest weight value. This is very natural
result to the area like Kathmandu valley. Second important parameter belong to the
economic and infrastructural parameters and social indicator stood third criteria with
lowest weight. The result mostly based on the “bottom up” approach.
Among three main criteria most important physical and environmental criteria has
further fragmented into 4 sub criteria. Physical condition (PHY), erosion hazard
potential (ERO), cropping intensity (CRP) and urbanization influences (URB) are
sub criteria of physical environment. Importance order generated as PHY, CRP, ERO
and URB. Similarly, economy-infrastructure criterion has six sub-criteria, namely
market channel (MARKT), irrigation (IRRIGN), Road network (ROAD), Value
addition Process (VALUE), Agricultural input availability (AGINPUT) and revenue
cost ratio (R/C). In importance analysis, an irrigation facility is rated as prime
important parameter followed by revenue cost ratio. Road network falls in third
important criteria. Value addition procedure is least important one. Social criteria has
5 sub criteria namely marketing know how (MINIFO), motivation of farmers
(MOTIV), cultivation pattern (CULTV), labour force availability (LABER) and
investment capacity (CAPINV) rural road systems. In important rating through pair-

193
wise comparison in AHP process, marketing know-how and cultivation pattern are
important ones.
In next phase of analysis, all of these 15 sub criteria belongs of 3 main criteria are
analysed through AHP for the multi-criteria evaluation of the land area. In this case
physical land condition has highest weight value among 15 sub-criteria. It is followed
by irrigation sub-criteria of economic infrastructural criteria. Revenue cost ratio,
cropping intensity, road network, market channel are group of most important
criteria. All these together makes influence on overall suitability ratings. While
making computation the result has to be consistent, for which during pair wise
comparison, consistent ratio (CR) index should be below 0.10. Majority of social
attributes are falling under less important criteria which make less contribution on
multi-criteria land suitability evaluation.
After these entire endeavors, it comes into final suitability evaluation with inclusion
of all the criteria and sub criteria. The result of suitability assessment based on the
above criteria and sub-criteria show that there is only one land mapping unit falls
under high level of suitability (S1) for vegetable cultivation in Kathmandu valley.
Most of the area with 63% (14836ha) categorized as low suitability (S3) and 5185ha
accounting for 22.05% of total agricultural and area is categorized as medium
suitability (S2) class. Still 2.82% falls under permanently unsuitable category.
Query 6: Will suitability evaluation help Kathmandu valley attain vegetable self-sufficiency?
Kathmandu valley is experiencing mishandling of the prime agricultural land for off
farm purposes. So, the major problem in the valley regarding land use is loss of
prime agricultural land and depletion of forest resources in expense of built up area
extension. In Kathmandu valley two systems of vegetable production are in practice,
namely at subsistence and at semi-commercial level. Land suitability evaluation
stimulates farmers to transform from non commercial level to purely commercial
level. More than one third farmers are cultivating vegetable considering market
demand and social causes. They do not consider land capability. Even in the existing
condition, in total contribution is 23% total vegetable consumption of the valley. If it
is wisely managed, it would be sufficient to rise up to 73% of existing consumption.
Therefore, if cultivation of the vegetable crop in Kathmandu valley considers

194
findings of Multi-criteria land suitability evaluation, it has greater contribution other
way round. Sustainable use of the land and rational use of agricultural inputs reduces
economic burden of the farmers. Intensification of agriculture is also possible
through identification of the suitable land area. For suitability assessment,
development of the LIS is mandatory; therefore land management for alternative
crops can be done on needy basis.
Query 7: Who are the main beneficiary of present research?
Among four stakeholders i.e. farmers, environmentalist, urban planner and
governmental officers, farmers is the crux to make use of present research out put.
Research process could be the matters of interest for further extension to the urban
planners and extension officers. Identification of the capability of fertility status of
the each parcel of land is concern of grower. Limitation pointed out by present
research is major concern of the vegetable growers. Therefore, present research
includes dimension from all the sectors, of society and environment, suitability
evaluation will benefits to those who is directly use land for the purpose of vegetable
growing. At the same time, urban planners are also having peer view on result so that
agricultural land with high degree of suitability can keep allocated for agricultural
priority in planning process. Government officers are concern more to formulate the
Agricultural Perspective Plan (APP). Result of the suitability evaluation can
contribute to greater extent land management and planning process for particular
area. Therefore, all the stakeholders are supposed to exploit outcome of present
research result.
During study process, research is encountered with number of problems. Social taboo,
internal labour exchange system, mal functioning of the agriculture service center and under
skilled human resources, etc. are prevalent issues to be corrected. Probability of intensive
vegetable farm development still has hurdles like capacity of farmers to make investment
and availability of easy and accessible labour force. Post harvest processing would also
increase farmers capacity of enhance production. These types of the problems, although not
the spatial attributes, need to be addressed timely. These can play decent role in
improvement of the suitability evaluation of any piece of land mapping unit in study area.
Therefore, result of present research would be the interest of all stakeholders including farm
people to policy makers.

195
8 CONCLUSION AND RECOMMENDATIONS
8.1 Conclusion
Study area located in Kathmandu valley, capital of Nepal. Agricultural land area is
constantly transforming into non-agriculture. Valley dwellers are depending on outside
source for vegetable. It is very essential to understand land capacity to support appropriate
vegetable cultivation. Land suitability evaluation is one of the best alternatives and multi-
criteria land evaluation further gives best suitability classification considering wide range of
multi-disciplinary alternatives. It also identifies land limitation and offers possible land
management measures. Methodology for present analysis presented in chapter 5 described
the land suitability evaluation process based on FAO framework is appropriately amended
for the case of Kathmandu valley. Analysis has been carried out developing LIS and
processing was done using GIS-based the multi-criteria evaluation approach. So, two sided
important application of present research is development of the methodology which includes
multi-dimensional approach. The generation of specific numerical order for suitability
evaluation is one of the major out come for the Kathmandu valley’s horticultural
development. This model of land evaluation can successfully used in other similar valleys of
Nepal.
First and foremost important is development of LIS for any piece of land to be evaluated for
any kind of cultivation. For land inventory system updating require sufficient, consistent and
continuous data sources to analyse current status, to predict changing trends land resources
deterioration, and to assess land suitability evaluation for crops precisely. Emphasis was
given to develop LIS up to the local village level in Nepalese context. In present context, one
of the main hurdles is lack of information dissemination and attitude not work under
information sharing culture (Tuladhar et.al. 2004). Information collection was basically done
through bottom-up procedure, so that real circumstances are incorporated into final result.
Such collected information has to put before expert opinion for top-down approach. Here the
involvement of local farmers, land users, and specialists for comprehensive evaluation is
mandatory. The study has also indicated that GIS is a useful supporting tool in integrating
socio-economic and environmental data the comprehensive LIS databases could provide
needed details of information to stakeholders (Oli, 2001). Second important outcome of the
research is the evaluation of land area with particular identification of strength and limitation
for horticultural crops. So farmers are advised to make use of research result to cultivate

196
vegetable according to its potentiality. Site specific classification in order of suitability is
main interest of vegetable growers for further vegetable crop development.
8.2 Recommendations
It is urgently recommended to disseminate result of present research in Kathmandu valley
because identification of very suitable and promising vegetable growing area might be
protected from the urban sprawl. It is also recommended to make vegetable sector
development plan for Kathmandu including Nepal because vegetable sector is one of the
important components of Nepalese agriculture, where diversity in vegetable crop brought
about by the diversity in agro-ecological zones. It is necessary to enhance the fresh vegetable
production and productivity for
a. Nutritional supplement
b. Strengthening local agro-business in the rural area
c. Economic benefits to the poor and under privileged farmers.
d. Contribution to the environmental conservation
Very important is the result of suitability evaluation must be brought into the reach of
vegetable growers. Multidimensional approach of present research has put a number of
recommendation forward to the stakeholders are as follows.
1. It is important to create the soil databases and land information system, including
soil types, soil fertility, terrain, current land use status, climate, slope, vegetation
cover, soil erosion, land unit map. The database system will be created on the GIS
software, allowing users to access, edit, up-to-date, overlay and analysis to create a
new map which meets the requirements of the study problem. Application of other
information sources like remote sensing images, Global Positioning System (GPS),
etc should be encourage because it will help on bringing real time change in land
use and management strategy.
2. Further study should be carried out to construct a complete and official database
with close links among different information sources of natural environment,
economy conditions, infrastructure, and the society.
3. The model of present research work must be applied to determine land evaluation for
other agricultural crops as well. Fundamental aspect of the research is feasible in
context of Nepal however, flexibility on selection of the criteria and sub-criteria for
different crops and in other geographical locations should be offered.

197
During the period of data collection, researcher was encountered with urgent necessity of
soil improvement and soil protection for sustainable agricultural productivity. Soil
management measure is also necessary tool for the farmers to harness potentiality of the land
are in Kathmandu valley because of reduced fertility; especially the level of potassium
availability, organic carbon, total nitrogen, and phosphorus availability. Regular application
of lime is also recommended. Care of top soil is still not up to standard. In the same way
cultivation in the slop land is still in practice but it is not recommend, however conversion
into terraced land with recent technology will be appreciated.
4. Some of the problem of vegetable farming sector like lack of the human resources,
lack of institutional reform, insufficient budget, lack of infrastructural reforms and
tough national situation has to be tackled with enhanced vegetable planning
through suitable area allocation for specific vegetable. Therefore, suitability
assessment has to be implemented in every sector of agricultural development.
5. To emphasize on generation of competitive capability of the farmers from the
national level it is necessary to put emphasis on enhancement of qualified field
level technical man power so that effective services can be delivered promptly.
6. Input subsidy policy, improved irrigation facilities, quality agricultural inputs,
development of market support system, capital investment facilities are very
necessary steps to be implemented. Then after suitability assessment will be
implemented in that area.
Finally the out come of the research has to be disseminated among local vegetable growers
and make them understand about capacity and limitation in range of suitability of their farm
holding. Land parcel use potential, limitations prevail and management measure should
clearly be conveyed to land users, so that the real use of research will be seen.

198
9 REFERENCES
Alejandro Ceballos-Silva, Jorge Lopez-Blanco, 2002. Delineation of suitable areas for crops using a Multi-Criteria Evaluation approach and land use/cover mapping: a case study in Central Mexico, Agricultural Systems 77 (2002) 117–136
Anonymous, 2001. Periurban Horticulture of Kathmandu Valley, internet publication, 2001.
APO, 2002. Urban Fringe Agriculture, Asian Productivity Organization, Tokyo, Japan.
Arsanti Idha Widi, 2008. Evaluation of Vegetable Farming Systems in Upland Areas of Java and Sumatra, Indonesia. A PhD dissertation submitted to Humboldt-Universität zu Berlin, Germany
Asian Vegetable Research and Development Center. 1990. Vegetable Production Training Manual. Tainan, Taiwan, pp. 154-252.
Astin, M. P and J. J. Basinsky, 1978. Biophysical survey techniques: CSIRO, Australia: 62-67
Babu, S. and V. Roe, 2000. Capacity Strengthening in Environmental and Natural Resource Policy Analysis: Meeting the Changing Needs. Journal of Environmental Management 58(July): 4.
Bacic, I. L. Z (2003) Demand-driven land evaluation with case studies in Santa Catarina, Brazil, ITC Dissertation number 105, ITC, Enschede, Netherland: 25.
Banai, R., 1993. Fuzziness in geographic information systems - contributions from the analytic hierarchy process. International Journal of Geographical Information Systems, Vol. 7: 315-329.
Baniya, N., 1995. Ecological Study of Shivapuri Forest, M. Sc. Dissertation submitted to CDB, Tribhuvan University, Kathmandu, Nepal.
Barredo, C. J. I., 1996. Sistemas de Informacio´ n Geogra´ fica y evaluacio´ n ulticriterio en la ordenacio’ n delterritorio. Editorial RA-MA: Madrid, Espana: 310p.
Bartelli, L. J, 1966. Soil surveys and land use planning: Soil Science Society of America and American Society of Agronomy, Madison, Wis: 45-67.
Beek, K. J., K. de Bie and P. Driessen, 2000. Land information and land evaluation for landuse planning and sustainable land management: International Institute for Aerospace Survey and Earth Sciences (ITC). Enschede, The Netherlands: 19 p.
Berkes F., Folke C. and Gadgil M. 1995. Traditional ecological knowledge, biodiversity, resilience and sustainability. In: Perrings C.S., Maler K.G., Folke C., Holing C.S. and Jansson B.O. (eds), Biodiversity Conservation: Problems and Policies. Kluwer Academic Publishers, Dordrecht, the Netherlands, pp. 281–300.

199
Betke, D., 1994. "Top down" meets "bottom up": zur Institutionalisierung der Landnutzungsplanung in Projekten der technischen Zusammenarbeit in Asien. In: Preuss and Roos (Eds.): Ländliche Entwicklung und regionales Ressourcenmanagement: Konzepte, Instrumente, Erfahrungen, Materialien 32, Justus-Liebig Universität Giessen, pp. 131-143
Bibby, J. S., H. A. Douglas, A. J. Thomasson and I. S. Robertson, 1991. Land capability classification for agriculture: Development of soil survey interpretations-Soil survey horizons. Macaulay Land Use Research Institute, Aberdeen. Klingebiel, Vol. 32: 53-66.
Binnie, 1988. Water Supply for Kathmandu Valley from outside the valley. Report prepared for Nepal Water Supply and Sewerage Co-operation, August, 1988. Kathmandu
Böhme, M., 1986. Die Erarbeitung technologischer Lösungen ausgewählter Anbauverfahren für die Gemüseproduktion in Gewächshäusern und deren Bewertung, Habilitation, Humboldt-Universität zu Berlin.
Boulaine, J., 1989. Histoire des pedologues et de la science des sols: Institut National de la Recherche Agronomique, Paris: 15.37.
Bouma, J., 1997. The land use systems approach to planning sustainable land management at several scales: ITC Journal, Vol. 3/4: 237-242. 211
Bouma, J., 1999. Land evaluation for landscape units: Sumner, M.E., CRC Press, Boca Raton, FL, (eds.): E393-E412.
Budhathoki, K., 2002. Vegetable Sustain Farmers, Lumle Regional Agricultural Research Centre, Unpublished documents, Pokhara Nepal.
Bydekerke L., E. Van Ranst, L. Vanmechelen and R. Groenemans, 1998. Land suitability assessment for cherimoya in southern Ecuador using expert knowledge and GIS, ELSEVIER, Agriculture, Ecosystems and Environment 69 (1998) 89±98
Carson Brian, 1992. The Land, the farmer and the future, A soil fertility management strategy for Nepal. ICIMOD occasional paper No. 21, Kathmandu, Nepal
Carver, S. J., 1991. Integrating multi-criteria evaluation with geographical information systems: International Journal of Geographical Information Systems, Vol. 5 (3): 321- 339.
CBS, 2002. National Population Census 2001: Summary Sheet, Central Bureau of Statistics, National Planning Commission Secretariat, HMG of Nepal, Kathmandu, Nepal.
CBS, 2003. Population Monograph-2003. Central Bureau of Statistics, Kathmandu
CBS, 2005. A Report of Water Survey of Kathmandu - 2005. Kathmandu: NPC/CBS
CBS, 2005. Poverty Trends in Nepal (1995-96 and 2003-04). Kathmandu: Central Bureau of Statistics, NPC 2005

200
CBS, 2006. Monograph, Agriculture Census Nepal 2001/02, Central Bureau of Statistics, National Planning Commission Secretariate, Kathmandu, Nepal 2006
CBS, WFP and World Bank, 2006. Small Area Estimation of Poverty, Caloric intake and Malnutrition in Nepal, Central Bureau of Statistics and World Food Program of UN and world bank. PP46
Ceballos Silva, A and J. Lopez-Blanco, 2003. Delineation of suitable areas for crops using a multi- criteria evaluation approach and land use/cover mapping: a case study in Central Mexico: Agricultural Systems, Vol. 77(2): 117-136.
Chambers, R., 1994. The Origins and Practice of Participatory Rural Appraisal. World Development, Vol. 22, No. 7, Elsevier Science Ltd., pp. 953-969
Chuong, M, 2007. Multi-criteria Land Suitability evaluation for selected fruit crops in Hilly Region of Central Vietnam. PhD dissertation submitted to Humboldt University of Berlin, Germany.
Chuong, V.H., Böhme M.H. and La Rosa, M. 2006. Social-economical Database Implementation into GIS to Analysis Land Suitability for Citrus Fruit Production; A Case Study in the Thua Thien Hue Province, central Vietnam. Tropentag, Bonn, Germany.
Cools N., E. De Pauwb, J. Deckers, 2003. Towards an integration of conventional land evaluation methods and farmers’ soil suitability assessment: a case study in northwestern Syria. Agriculture, Ecosystems and Environment 95 (2003) 327–342
Davidson, D. A., 1992. The evaluation of land resources, Stirling university published in USA with John Wiley, NewYork.
de La Rosa, D., 2000. MicroLEIS 2000: Conceptual Framework: Instituto de Recursos Naturalesy Agrobiologia, CSIC, Avda. Reina Mercedes 10, 41010 Sevilla, Spain: 267 pp. 212
Dent, D and A. Yong, 1981. Soil survey and land evaluation: Allen & Unwin, London.
Di Gregorio, A and L. J. M. Jansen, 1998. A new concept for a land cover classification system: The Land, Vol. 2: 55-65.
DoAD (Department of Agricultural Development) 1992. Food Balance Sheet of Nepal, 1991/92. Agricultural Marketing Development Division, Harihar Bhawan, Lalitpur, Nepal
Dobermez, J.F., 1970. La Nepal Ecologic et biogeographie, Grenobel.
Dokuchaev V.V., 1883. Russian Chernozems (Russkii Chernozems). Israel Prog. Sci. Trans., Jerusalem, 1967. Transl. from Russian by N. Kaner. Available form U.S. Dept. of Commerce, Springfield, VA.
Eastman, J. R. 1997. IDRISI for Windows, version 2.0 (Tutorial Exercises): Graduate Schoolof Geography-Clark University, Worcester, MA.

201
ESRI, 1994. Cell-based modelling with GRID: ArcInfo Manual, Version 7.0, Environmental Systems Research Institute, Redlands, CA.
ESRI, 2001. ArcInfo Manual, Version 7.0, Cell-based modeling with GRID: Environmental Systems Research Institute, Redlands, CA
FAO and UNDP, 2003. Nepal : Agricultural Policy and Strategies For Poverty Alleviation and Food Security, Main Report, Kathmandu Nepal, June 2003.
FAO, 1976. A framework for land evaluation: Soils Bulletin 32, Food and Agriculture Organization of the United Nations, Rome, Italy.
FAO, 1983. Guidelines: Land evaluation for rainfed agriculture: Soils Bulletin 52, Food and Agriculture Organization of the United Nations, Rome, Italy: 233 p.
FAO, 1984. Land evaluation for forestry, forestry paper 48: Food and Agriculture Organization of the United Nations, Rome, Italy.
FAO, 1985. Guidelines: land evaluation for irrigated agriculture: Soils Bulletin 55, Food and Agriculture Organization of the United Nations, Rome, Italy: 219 p.
FAO, 1986. Land evaluation for development: Food and Agriculture Organization of theUnited Nations, Rome, Italy: 4-59 (74p).
FAO, 1988. FAO-UNESCO Soil Map of the World: Revised Legend. FAO World Soil Resources Reports No. 60, Rome: 119pp.
FAO, 1990. Guidelines for soil profile description: FAO, Rome, Italy: 66p.
FAO, 1991. Guidelines: land evaluation for extensive grazing: Soils Bulletin 58, Food and Agriculture Organization of the United Nations, Rome, Italy.
FAO, 1993. An international framework for evaluating sustainable land management (FESLM): Rome, Italy.
FAO, 1993. Guideline for land use planning: FAO development series 1, Vol.8 (96): Food and Agriculture Organization of the United Nations, Rome, Italy.
FAO, 1994. Agricultural policy analysis for transition to a market-oriented economy in Vietnam, FAO Paper No. 123. Rome: 12-16.
FAO, 1995. Planning for sustainable use of land resources: Towards a new approach: Land and Water Bulletin 2, Rome, Italy: 53 p.
FAO, 1995. Programme for the World census of agriculture 2000: FAO Statistical Development Series No.5, FAO, Rome, Italy.
FAO, 1995. The Future of our land: Facing the challenges. FAO, Rome, Italy: 23-24.
FAO, 1996. Agro-ecological zoning, guidelines: FAO Soils Bulletin 73. FAO, Rome.
FAO, 1997. Africover land cover classification: FAO, Rome.

202
FAO, 1998. Terminology for Integrated Resources Planning and Management: available at: http://intranet.fao.org/offsiteframe.jsp?uu=http://www.fao.org/ag/agl/aglhomep.stm,
FAO, 2000. Farming System and Alleviating Poverty. New York, USA. FAO, 2004. Statistical Database. New York, USA.
Frere, M., and G. Popov. 1979. Agrometeorological crop monitoring and forecasting. FAO, Plant production and protection Paper 17:64 pp.
Fresco, L. O., Huizing, H., Keulen, H. v., Luning, H. A., & Schipper, R. A. 1994. Land Evaluation and Farming Systems Analysis for Land Use Planning. FAO Working Document.
Gautam, I.P., K.P. Upadhyay, J.N. Choudhary and B. Khatri, 2004. Study on Inter Cropping Vegetables in Maize Based Cropping System in Tar Area of Western Nepal. Proceedings of IV National Conference on Science and Technology, RONAST 110-114pp
George, H, 2001. An overview of land evaluation and land use planning at FAO: Land and Plant Nutrition Management Service, AGLL, FAO, Rome, Italy: 3.
Ghafari, A., H. F.Cook, and H. C. Lee, 2000. Integrating climate, soil and crop information: a land suitability study using GIS.: 4th International Conference on Integrating GIS and Environmental Modeling (GIS/EM4): Problems, Prospects and Research Needs.
Grahm, G.R. 1948. Determination of soil organic matter by means of photoelectric calorimeter, soil science 65:181-183.
Gregorich , E. G., M. R. Carter., D. A. Angers., C. M. Monreal., B. H. Ellert, 1994. Towards a minimum data set to assess soil organic matter quality in agricultural soils. Can. J. Soil Sci. 74: 367-386.
Gruhn P., Francesco Goletti and Montague Udelman, 1995. Fertilizer, Plant nutritient Management and sustainable agriculture: Usage, problems and challenges. Proceedings of the IFPRI/FAO workshop on plant nutrient management, food security and sustainable agriculture, Italy. 1995
Guillet, D. W., L. Furbee, and J. H. B. R. Sandor, 1996. The Lari soils project in Peru-a methodology for combining cognitive and behavioral research. In: Warren, D., Slikkerveer, J.L., Brokensha, D. (Eds.): The Cultural Dimension of Development: Indigenous Knowledge Systems, Intermediate Technology Publications, London: 77-81.
Guo, L. S., and Y. S. He, 1998. Integrated multi-criteria decision model: A case study for the allocation of facilities in Chinese Agriculture: J. Agric. Engng Res. (1999), Silsoe Research Institute (Article No. jaer.1998.0393, available online at http://www.idealibrary.com), Vol. 73: 87-94.
Ha, V. H and T. B. Phạm, 2003. Ket qua danh gia tong hop dieu kien tu nhien bang Phuong phap canh quan cho phat trien nong lam nghiep o huyen Hai Lang, tinh Quang Tri (General evaluation Result of natural conditions by landscape method for agro –

203
forestry development in hai lang district, Quang Tri province): Science Journal of Hue University, Hue, Vol. 20(9): 67-73.
Hagen, T. 1998. Nepal - the Kingdom in the Himalaya (4th edn). Himal Books, Lalitpur, Nepal
Halcrow Fox and Associatges, 1991. Kathmandu Valley Urban Development Plans and Programme. Department of Housing and Urban Development, Kathmandu
Heit, M and A. Shortreid (Eds), 1991. GIS applications in natural resource: Colorado, GIS World.
Hemmati, M., 2002. Multi-stakeholder processes for governance and sustainability: beyond deadlock and conflict. London, Earthscan.
HMG/IUCN, 1995. Regulating Growth: Kathmandu Valley, National Planning Commission, HMG collaboration with IUCN, Kathmandu, Nepal.
HMGN/MOF, 2001. Economic Survey, Fiscal Year 2000/2001, Ministry of Finance, Kathmandu, Nepal.
Ho, K and C. V Huynh, 2004. Danh gia tinh hinh quan ly va su dung dat go doi huyen Huong Tra, tinh Thua Thien Hue (Investigation and assessment to land use management in the hilly area of Huong Tra district, Thua Thien Hue province): Science Journal of Hue University, Hue, Vol. 21, 5-13.
Hossain, M. S. S. R. Chowdhury, N. Gopal Das and M. M. Rahaman, 2007. Multi-criteria evaluation approach to GIS-based land-suitability classification for tilapia farming in Bangladesh, Journal of the European Aquaculture Society Springer Science+Business Media B.V. 2007
Huizing, H. A., Farshad and C. Debie, 1995. Land evaluation (ITC lecture notes): ITC, Enschede, The Netherlands.
Hussein Harahsheh, 1994. Agricultural Applications of Remote Sensing and Geographic Information System in Land-use and Land Suitability Mapping, Royal Jordanian Geographic Centre, Amman-Jordan 1994
ICIMOD, 1999. Mountains 2000 and Beyond. ICIMOD, Kathmandu.
ICIMOD, CBS/HMGN and SNV, 2003. Districts of Nepal Indicators of Development Update 2003, ICIMOD, Kathmandu, Nepal.
IDWG/LUP, 1994. Glossary of land use terms, Working Paper, Draft. Interdepartmental Working Group on Land Use Planning Subgroup 1: Methodology. FAO, Rome.
IUCN, 1991. Sources of Industrial Pollution in Nepal – A National Survey. Kathmandu: National Conservation Implementation Programme and National Planning Commission, in collaboration with IUCN
Jamal, B. N., 2003. Land evaluation for land use planning with especial attention to sustainable fodder production in the Rouzeh Chai catchment of Orumiyeh area - Iran., MSc thesis, ITC, Netherlands: 17 (145p).

204
Kalogiroua S., 2002. Expert systems and GIS: an application of land suitability evaluation Computers, Environment and Urban Systems 26 (2002) 89–112
Karki, T.K., 1991. Establishing and Expanding the Private Sector Land Development Industry in Greater Kathmandu, Nepal (Unpublished M. Sc. Thesis), Asian Institute of Technology, Bangkok.
Kavetskiy, S., M. Kraynyuk., G. Hofman., M. Boehme., O. V. Cleemput, 2003. Soil quality and fertilization. Joint European Project, Tempus Tacis, Kyiv: 5-9 (243pp).
KFVMDB, 2007. Early report of pricing and arrival of vegetable 2007. Kalimati Fruits and Vegetable Market Development Board, Kathmandu.
Khan, M. H., 2000. Rural Poverty in Developing Countries: Issues and Policies. Washington, DC, International Monetary Fund: 32.
Kumar, R., 1996. Research Methodology, a Step-by-Step Guide for Beginner. Longman, Melbourne, Australia, pp. 74.
Kundiri, A. M., M. G. Jarvis and P. Bullock, 1997. Traditional soil and land appraisal on fadama lands in northeast Nigeria: Soil Use Manage, Vol. 13: 205-208.
KVTDC, 2002. Kathmandu Upatyakako Dirghakalin Bikash Abadharana, Kathmandu Valley Town Development Committee, Nepal.
KVWMP, 1994. Kathmandu Valley Watershed Management Project, Project Report. 1994.
Larson, W. E and J. F. Pierce, 1991. Conservation and enhancement of soil quality. In: Evaluation for sustainable land management in the developing world. International Board Soil Resarch and Management, Bangkok, Thailand: 115-203.
LRMP, 1986. Land Utilization Report. Land Resource Mapping Project, HMG, Kathmandu
Malczewski, J. 2004. GIS-based land-use suitability analysis: a critical overview: Progress in Planning, 2003 Elsevier Ltd., Vol. 62: 3-65.
Malczewski, J. 2004. GIS-based land-use suitability analysis: a critical overview: Progress in Planning, 2003 Elsevier Ltd., Vol. 62: 3-65.
Marsh Sally P. and T. Gordon MacAulay , 2002. Land reform and the development of commercial agriculture in Vietnam: policy and issues. Agribusiness Review - Vol. 10 Paper 1 2002
Mau Crimmins, T., J. E. de-Steiguer and D. Dennis, 2003. AHP as a means for improving public participation: a pre-post experiment with university students: Forest Policy and Economics, Elsevier B.V: 15
Midmore, D. J., Hans G. P. Jansen and Robert G. Dumsday, 1996. Soil erosion and environmental impact of vegetable production in the Cameron Highlands, Malaysia Agriculture, Ecosystems & Environment, Science Direct 60 : 1, November 1996, 29-46

205
Ministry of Agriculture, food and fisheries, 2004. AGFocus: A Guide to Agricultural Land Use Inventory, Australia Revised October 2004.
MoA, 2005. Annual Progress Report, Ministry of Agriculture, Kathmandu, Nepal.
Moldovanyi, A, 2003. GIS and multi-criteria decision making to determine marketability of pay pond businesses in West Virginia., Division of Forestry, West Virginia University.
Mongkolsawat, C. P., Thirangoon, and P. Kuptawutinan, 2002. A physical evaluation of land suitability for rice: A methodological study using GIS.: Computer Centre, Khon Kaen University, Thailand (online at http://www.gisdevelopment.net).
MoPE, 2003. Nepal Population and Environment Facts and Figures, Ministry of Population and Environment, Kathmandu, Nepal.
NARC, 1988. Annual Report. Nepal Agriculture Resarch Council, Vegetable Development Division (VDD), Khumaltar, Kathmandu. Pp 148
NARC, 2006. Vegetable Research Highlights, NARC Annual Report, Nepal agriculture Research Centre, Kathmandu (www.narc.gov.np)
Nayava, J. L., 1981. Arial Rainfall in the Kathmandu valley. Mausam, 32: 4 343-348
Nayava, J. L., 2005. "The estimation of evapotranspiration by climate models for Western Nepal", SOHAM-Nepal, Journal of Hydrology and Meteorology, Vol. 2, No. 1, pp. 16 – 23.
NBS, 2002. Nepal Biodiversity Strategy, His Majesty’s Government, Nepal, Ministry of Forest and Soil Conservation, Kathmandu, Nepal.
Nepal Rastra Bank, 1999. Household Budget Survey: Urban Nepal, (mid July 1995-Mid July 1996), Nepal Rastra Bank, Kathmandu, Nepal.
Nguyen, N. C. 2004. Ket qua buoc dau nghien cuu giam ngheo theo phuong phap cung tham gia o xa Binh Thanh, huyen Huong Tra, tinh Thua Thien Hue (Some primary results of participatory poverty assessment of binh thanh commune,huong tra district, thua thien hue province): Science Journal of Hue University, Hue, Vol. 23 (2004): 88-94.
Nguyen, V. N. 1996. Dac diem dat dai va danh gia kha nang su dung dat trong san xuat nong nghiep cua vung dong bang song Cuu Long (Soil characteristics and agricultural land\useable assessment of Cuu Long river delta region: PhD dissertation, Hanoi University of Agriculture, Hanoi, Vietnam.
NIDI, 2006. District Profile, 2006. Kathmandu: Nepal Information Development Institute sourced from Department of Postal Services
Norton, J. B., R. Roman, and J. A. Sandor, 1998. Observation and experience linking science and indigenous knowledge at Zuni, New Mexico: J. Arid Environ (Eds), Vol. 39: 331-340.
NPC (National Planning Commission), 1992. Eighth Five Year Plan, 1992-93 to 1996-97 (In Nepali). NPC, Kathmandu, Nepal. pp: 144-146.

206
NPC, 2003. The Tenth Plan (Poverty Reduction Strategy Paper ) summary 2002-2007. National Planning Commission, Kathmandu, Nepal. July 2003.
NRB (Nepal Rastra Bank), 1989. Multipurpose household budget survey: A study on income distribution, employment, and consumption patterns in Nepal. NRB, Kathmandu, Nepal.
NRB, 1980. Agricultural credit review survey, Nepal. Nepal Rastra Bank, Kathmandu, Nepal.
NWSC, 2004. Annual Report, 2004. Nepal Water Supply Corporation, Kathmandu
Obi Reddy, B. P., A. K. Maji, C. Srinivas, K. H. Kamble and M. Velayutham, 2002. GIS\ based basin morphometric information system for terrain and resources analysis.: First National Conference on Agro-Informatics: 37-42.
Oli P. P. 2001. Spatial Date for Land Use Planning in Nepal, International Conference on Spatial Information for Sustainable Development, Nairobi, Kenya
Omakupt, M and H. Huizing, 1992. Land evaluation and land use planning. In: The Workshop on GIS and RS for Natural Resources Management by ILWIS: 23-29.
PACMAR (Pacific Management Resources Inc.) and EC (East Consult (P) Ltd.). 1991. Master plan for horticulture development. Various volumes. Project Report Submitted to His Majesty's Government of Nepal and Asian Development Bank. pp: 43.
Papendick, R. I; P. I. Parr and L. van Schilfgaarde, 1995. Soil quality: New perspective for sustainable agriculture. In: Proc. International Soil Conservation Organization, New Delhi, India, 1995.
Permadi, 1992, inharited from Chuong, M, 2007. Multi-criteria Land Suitability evaluation for selected fruit crops in Hilly Region of Central Vietnam. PhD dissertation submitted to Humboldt University of Berlin, Germany.
Pettapiece W.W., 1995. Land Suitability Rating System for Agricultural Crops. A technical report prepared by Agronomic Interpretations Working Group, Agriculture and Agri Food Canada. 1995
Piper, C.S. 1942. Soil plant analysis. How publishers. Bombay, India.
Poudyal, S. 1983. Planned Development in Nepal: A Study, Educational Enterprises (Pvt.) Ltd., Kathmandu, Nepal.
Pradhan P and R. Perara, 2005. Urban growith and its impact on the livelihoods of Kathmandu Valley, Nepal, UMP-Asia Occasional Paper No. 63. Urban Management Program for Asia and the Pacific, Feb 2005
Prakash, T. N. 2003. Land Suitability Analysis for Agricultural Crops: A Fuzzy Multicriteria Decision Making Approach, MSc thesis, ITC, Netherlands: 6-13.

207
Ranjit R., B.Shakya, 2005. A High Flow Turning Into Catastrophic Floods In Kathmandu Valley, Unpublished documents, Tribhuvan University Kathmandu, Nepal
Rao, M., Sastry, S.V.C., Yadav, P.P., Kharod, K., Pathan, S.K., Dhinwa, P.S., Majumdar, K.L., 1991. A Weighted Index Model for Urban Suitability Assessment and GIS Approach (Report No. SAC/RSA/NRIS-URIS/TN-03/Feb) Space Applications Centre, Ahmedabad, India.
Rossiter, D. G 1996. A theoretical framework for land evaluation (with Discussion): Geoderma, 72 (1996): 165-202.
Rossiter, D. G. 1994. Lecture Notes: "Land Evaluation", Part 1: Basic concepts & procedures of land evaluation. Department of Soil, Crop, & Atmospheric Sciences, College of Agriculture & Life Sciences, Cornell University: 14-15 (58).
Rossiter, D. G. 1995. Economic land evaluation: why and how, Soil Use & Management Dept of Soil, Crop & Atmospheric Sciences, Cornell University: 2. 11: 32-140,
Saaty, L.and Luis G. Vargas. 1988. Decision Making in Economic, Political, Social, and Technological Environment with the Analytic Hierarchy Process. RWS Publications, Pittsburgh, USA, 1-13 pp.
Saaty, T. L 1977. A scaling method for priorities in hierarchical structure: Journal of Mathematical Psychology 15.3: 34-39.
Saaty, T. L 2000. Fundamentals of decision making and priority theory with the analytic hierarchy process: RWS Publications, Pittsburgh., Vol. 6: 21-28
Saaty, T. L and L. G. Vargas, Eds 2001. Models, methods, concepts & applications of analytical hierarchy process.: International Series in Operations Research and Management sciences. Boston/Dodrecht/London, Kluwer Academic Publishers.
Saaty, T. L. 1980. The analytic hierarchy process: McGraw Hill International., New York.
Sachs, I. 1992. Transition Strategies for the 21st Century. Nature and Resources, 28:4-17.
Saptana, Saktyanu K.D., et. al. 2004. Integrasi Kelembagaan Forum KASS dan Program Agropolitan dalam rangka Pengembangan Agribisnis Sayuran Sumatera Utara. Analisis Kebijakan Pertanian. Pusat Penelitian dan Pengembangan Sosial Ekonomi Pertanian. Bogor, Indonesia, pp. 268-270.
Sharifi, M. A and M. V. Herweijnen, 2003. Spatial decision support systems: Enschede, ITC.
Sharifi, M. A., K. Shamsudin and L. Boerboom, 2004. Evaluating rail network options using multiple criteria decision analysis (MCDA): case study Klang Valley, Malaysia: 24- 35.
Sharma, P. 1990. Perspective on Urbanization in Nepal, Papers of the East-West Population Institute, Honolulu.
Shi, S. 2002. Research on the Urban Spatial Structure Guided by the Urban Green Space System. Physical Geography., Central China Normal University Wuhan: 112

208
Shrestha Sundar S. 2003. GIS and Agricultural Economics, GIS Resource Document 03-54 (GIS_RD_03-54) March 2003
Shrestha, B. and Pradhan, S. 2000. Kathmandu Valley GIS database, Bridging the data gap. ICIMOD and UNEP, Kathmandu
Shrestha, D.P., 2000. Aspects of erosion and sedimentation in the Nepalese Himalaya, Highland low land relations. ITC Dissertation no 77 (10-227p)
Siderius, W., (ed) 1986. Land evaluation for land-use planning and conservation in sloping areas: ILRI Publication 40, Wageningen: International Institute for Land Reclamation and Improvement (ILRI): S605.I61p no. 40 Mann.
SMEC, 1992. Greater Kathmandu Water Supply Project. Cemat, Scott and Murphy, Kathmandu
SOTER database, 2004. Global and National Soils and Terrain Digital Databases (SOTER),
Stainton, J, D. A. 1972. Forest of Nepal, John Murry, London
Store, R., Kangas, J., 2001. Integrating spatial multi-criteria evaluation and expert knowledge for GIS-based habitat suitability modelling. Landscape and Urban Planning 55 (2), 79–93.
Subedi A. G. Holt and C. Garforth, 2002. Review of Land Management Policy in Nepal, DFID NRSP R7958 Linking Field Level Findings with Policy Making in Nepal working paper 1. DFID, Feb 2002
Suman S. 2005. Estimation of Net Solar radiation & Upper evaporative water loss i.e. evapotranspiration (ET) using climatic models by Modified Penman-Monteith method in Kathmandu valley. M. Sc. Dissertation submitted to DMH, TU Kathmandu.
Thapa Rajesh Bahadur and Yuji Murayama, 2006. Land Use Change Analysis Using Remote Sensing and GIS: A Case Study of Kathmandu Metropolitan, Nepal, CSIS DAYS C4, pp 22, 2006
Tomlinson, R. F, 1987. Current and potential uses of geographical information systems: The North American experience: International Journal of Geographical Information Systems, Vol. 1: 203-218.
Tuladhar Arbind Man, Krishna Raj BC and Nama Raj Budhathoki, 2004. Towards Strategic Planning For Building Land Information System (Lis) In Nepal, International Institute for Geo-Information Science and Earth Observation (ITC), Enschede THE NETHERLANDS
UNDP, 2004. Factsheets of Nepal, http://hdr.undp.org/ statistics/data/ cty/cty_f_ NPL.html, Dec 8, 2004
UNDP, 2006. Human Development Report, Highlights, United Nations Development Program, 2006. (http://hdrstats.undp.org/countries/ countryfact_sheets /cty_fs_ NPL.html)

209
Upreti B. R. and Yamuna Ghale Upreti, 2002. Factors leading to agro-biodiversity loss in developing countries: the case of Nepal Biodiversity and Conservation, Kluwer Academic Publishers 11: 1607–1621, 2002.
USAID, 1988. The transition to sustainable agriculture: an agenda for A.I.D: Committee for Agr. Sust.for Developing Countries, Washington D.C.
Van der Merwe and Hendrik Johannes, 1997. GIS-aided land evaluation and decision-making for regulating urban expansion: A South African case study GeoJournal 43: 135–151
Van Diepen, C. A., H. van Keulen, J. Wolf, and J. A. A. Beout, 1991. Land evaluation: from intuition to quantification. In: B.A. Stewart (Editor): Advances in Soil Science, Springer, New York, Vol. 15: 139-204.
Venkataratnam, L. 2002. Remote sensing and GIS in agricultural resources management. In: First National Conference on Agro-Informatics: INSAIT.
Verheye., W. H., 1996. Advanced course on land evaluation and land use planning. Sierra Leone, 4-16 July 1996. FAO & Government of Sierra Leone Land Use Committee. FAO, Rome.
Vink, A. P. A, 1975. Land use in advancing agriculture: Springer Verlag. Germany: 122p.
Vo Quang Minh1, Le Quang Tri1, Yamada, 2003. Delineation and incorporation of socio-infrastructure database into GIS for land use planning: A case study of Tan Phu Thanh village, ChauThanh District, Cantho Province. Land Use Analysis, Map Asia 2003
Vo, Q. M., T. Q. Le and Yamada, 2003. Delineation and incorporation of socio infrastructure database into GIS for land use planning in Tan Phu Thanh village, ChauThanh District, Cantho Province.: Land use analysis, Map Asia Conference 2003: 14-16.
Voogd, H, 1983. Multicriteria Evaluation for Urban and Regional Planning: Pion, London: 74p.
Wandahwa P. and E. van Ranst, 1996. Qualitative land suitability assessment for pyrethrum cultivation in west Kenya based upon computer-captured expert knowledge and GIS. Agriculture, Ecosystem and Environment 56 (1996) 187-202
WCED, 1987. Our Common Future: Oxford University Press, UK: 400p.
World Bank, 1992. World development Report: Development and environment. Washington, D.C.
Yaalon, D. H and S. Berkowicz, (ed), 1997. History of soil science: international perspectives.: Catena Verlag GMBH, Reiskirchen.
Zinck, J. A., 1995. Soil survey: perspectives and strategies for the 21st century: FAO/ITC, Rome.

210
Zurayk, R., F. El Awar, S. Hamadeh, S. Talhouk, C. Sayegh, A. Chelab, and K. Al-Shab 2001 Using indigenous knowledge in land use investigations: a participatory study in a semi-arid mountainous region of Lebanon.: Agric. Ecosyst. Environ, Vol. 86: 247-262.

211
LIST OF TABLES
Table: 2.1 Structure of the suitability classification (FAO, 1976) ......................................... 22
Table 2.2 Structure of land suitability classes and subclasses (FAO, 1976) .......................... 22
Table: 2.3 Structure of land suitability classes and sub-classes ............................................. 24
Table 2.4 Example of degrees of limitation and suitability classification (Adapted from
Prakash, 2003)................................................................................................. 26
Table: 4.1 Groups of vegetable to be evaluated for land suitability....................................... 54
Table: 4.2 Diagnostic characteristics for Cole Crops (Cabbage, Cauliflower, Broccoli), ..... 55
Table: 4.3 Diagnostic characteristics for suitability of Tomato ............................................. 56
Table: 4.4 Diagnostic characteristics for suitability Root crops (Radish and Turnip, carrot) 56
Table: 4.5 Fundamental Scale used in Pairwise Comparison (Saaty and Vargas 2001) ........ 59
Table 4.6 An example of pair wise comparison matrix of criteria in AHP............................ 60
Table 4.7 Average Random Consistency Index (RI) (Permadi, 1992)...................................61
Table: 4.8 Fact value classifications for each criterion for each LMU .................................. 62
Table: 4.9 Suitability classifications with numerical value.................................................... 64
Table: 5.1 Physical specification of Nepal ............................................................................. 68
Table: 5.2 Size of holdings in Nepal ...................................................................................... 70
Table: 5.3 Summary tables of characteristics of agricultural holders and holdings Nepal .... 71
Table: 5.4 Farm labour characteristics Nepal......................................................................... 72
Table: 5.5 Summary of land use in Nepal in chronological order.......................................... 73
Table: 5.6 Legal land use types in Nepal................................................................................ 74
Table: 5.7 Typical drill log in centre of Kathmandu valley at Lagan Tole apprance of horizon
in different distance range from the land surface............................................ 81
Table: 5.8 Meteorological stations in Kathmandu Valley...................................................... 82
Table: 5.10 Distribution of population by districts of Kathmandu valley,1991-2001 .......... 97
Table: 5.11 Population Density (per sq. km) from 1971 to 2001........................................... 98
Table: 5.12 Distribution of Population by Industry in 1995-96 ............................................ 99
Table: 5.13 Food production in KV ..................................................................................... 100
Table: 6.1.1 General land and soil characteristics in the middle Mountain of the Nepal..... 102
Table: 6.1.2 Soil types in Kathmandu Valley....................................................................... 104
Table: 6.1.3 General land forms in Kathmandu Valley........................................................ 106
Table: 6.1.4 Soil depth distribution in study area................................................................. 107
Table: 6.1.5 Average fertility level of different soil group from study area ........................ 108

212
Table: 6.1.6 Orientation of Agricultural Land...................................................................... 111
Table: 6.1.7 Land use category in Kathmandu valley .......................................................... 114
Table: 6.1.8 Land use changes in Kathmandu valley in different course of time ................ 116
Table: 6.1.9 Agricultural land area in Kathmandu valley districts....................................... 119
Table: 6.1.10 Interventions and their Impact of on the Kathmandu valley .......................... 120
Table : 6.1.11 (a) Existing Paddy and Maize based Cropping Pattern of Kathmandu Valley
....................................................................................................................... 125
Table: 6.1.11 (b) Existing vegetable based Cropping Pattern of Kathmandu Valley .......... 125
Table: 6.1.12 Crop calendar of Kathmandu valley............................................................... 128
Table: 6.1.13 Production and productivity of vegetables in Districts of Kathmandu .......... 129
Table 6.2.1 Structure of land use attribute for LIS database ................................................ 137
Table 6.2.2 Structure of land suitability attribute for LIS database ..................................... 138
Table 6.2.3 Information of soil types for producing the LMU in Kathmandu Valley ......... 143
Table 6.2.4 Information on rootable soil depth of LMU in Kathmandu Valley................... 144
Table: 6.2.5 Soil texture information of Kathmandu valley for LMU preparation.............. 145
Table: 6.2.7 Total fertility in the soils of Kathmandu .......................................................... 148
Table: 6.2.9 Overall fertility status of the soil groups present in Kathmandu...................... 151
Table 6.3.1 Category of dominant and ordinary factors for vegetable crops in Kathmandu
valley............................................................................................................. 157
Table: 6.3.2 Current suitability ratings of diagnostic characteristics vegetable cultivation.161
Table: 6.3.3 Current physical suitability evaluation for vegetable cultivation..................... 162
Table: 6.3.4 Potential suitability rating ................................................................................ 165
Table 6.3.5 List of evaluating criteria and sub-criteria considered for Kathmandu valley .. 170
Table 6.3.6 Pair wise comparison of main criteria in Kathmandu ....................................... 171
Table 6.3.7 Calculation and estimation of weights for criterion in Kathmandu valley for
vegetable cultivation ..................................................................................... 175
Table: 6.3.8 Suitability indexes of all the criteria for multi-criteria land suitability evaluation.
....................................................................................................................... 179
Table: 6.3.9 Details of the Multi-criteria land suitability evaluation of Kathmandu Valley for
vegetable crops.............................................................................................. 181

213
LIST OF FIGURES
Figure: 2.1 Relationship of Farming system .......................................................................... 15
Figure: 2.2 Land utilization type and vegetable cropping system in Kathmandu .................. 16
Figure 2.3 Steps of land evaluation and land use planning (FAO, 1986)............................... 27
Figure: 4.1 Conceptual flow of the research approach........................................................... 50
Figure: 4.2 Chart of GIS application to physical land suitability evaluation (Inherited from
chuong 2007) .................................................................................................. 53
Figure 4.3 flow chart showing application of GIS and AHP for physical environment, social
and economic-infrastructure suitability evaluation......................................... 57
Figure: 4.4 flow chart of the suitability analysis methodology .............................................. 58
Figure: 4.5 GIS based model for multi-criteria land suitability evaluations for agriculture .. 65
Figure:5.1 Map of Nepal showing physiographic zones with outlined administrative
boundaries. ...................................................................................................... 66
Figure: 5.2 Map of the study area........................................................................................... 78
Figure: 5.3 Alluvial plains with terraced rice field................................................................. 79
Figure: 5.4 Spatial distribution of precipitation ..................................................................... 83
Figure: 5.5 Average monthly precipitation in Kathmandu valley .......................................... 83
Figure: 5.6 average monthly temperature of Kathmandu valley. ........................................... 84
Figure: 5.7 Average monthly wind speed of Kathmandu valley............................................ 85
Figure: 5.8 Spatial distribution of evapotranspiration (Suman, 2005) ................................... 87
Figure: 5.9 Agriculture land invading forest area................................................................... 90
Figure: 5.10 Marketing channels for tomato in Kathmandu .................................................. 93
Figure 5.11 Share of vegetable arrival in Kalimati contributed by valley districts................ 94
Figure: 5.12 Species wise vegetable marketed in Kathmandu vegetable market................... 95
Figure: 5.13. Sources of the vegetable import in main market of valley ............................... 95
Figure: 5.14 Map of population distribution in study area ..................................................... 97
Figure: 6.1.1Greater soil types map of Kathmandu Valley.................................................. 104
Figure: 6.1.2 Area covered by soil texture in Kathmandu valley......................................... 105
Figure: 6.1.3 General land form in Kathmandu Valley........................................................ 106
Figure: 6.1.4 Soil depth distribution in the valley ............................................................... 107
Figure: 6.1.5 Land slope map of Kathmandu valley ............................................................ 110
Figure: 6.1.6 Land Use Category in Kathmandu Valley, with valley boundary .................. 114

214
Figure: 6.1.7 (a and b) Land use change in Kathmandu Valley ........................................... 116
Figure: 6.1.8 Expansion of unplanned settlements in agriculturally active land.................. 116
Figure: 6.1.9 Land use Change in Kathmandu Valley (in chronological Order) ................. 117
Figure: 6.1.10 Periurban Horticultural Practices in Kathmandu Valley .............................. 121
Figure: 6.1.11 Irrigation channel in rice field in Lalitpur.....................................................127
Figure: 6.2.1 Soil types in Kathmandu Valley ..................................................................... 143
Figure 6.2.2: Rootable Soil Depth in Kathmandu valley ..................................................... 144
Figure: 6.2.3 Soil texture map of Kathmandu valley ........................................................... 145
Figure: 6.2.4 Slope map of Kathmandu Valley.................................................................... 147
Figure: 6.2.5 Soil fertility status of Kathmandu Valley ....................................................... 148
Figure: 6.3.1 Flow chart explaining model of determining suitability rating of each physical
parameter....................................................................................................... 160
Figure: 6.3.2 Current suitability map for Vegetable crops in Kathmandu ........................... 163
Figure: 6.3.5 Potential land suitability map of Kathmandu Valley...................................... 166
Figure: 6.3.8 Generation of overall weight of criteria and sub criteria through AHP......... 176
Figure: 6.3.9 Model of suitability rating of individual LMU ............................................... 178
Figure: 6.3.10 Multicriteria land suitability evaluation of the Kathmandu for vegetable
cultivation ..................................................................................................... 179

215
LIST OF APPENDIX
Appendix Table: 1 Trends of urban and agricultural land use in the valley ........................ 216
Appendix Table: 2 Consumption figures in Kathmandu valley ........................................... 216
Appendix Table: 3 Soil texture type of valley districts identified by national sample
agricultural census, 2001/02 ......................................................................... 216
Appendix Table: 4 Revenue Cost Ratio for the vegetable cultivation in Kathmandu Valley
....................................................................................................................... 217
Appendix Table: 5 Nepal’s human development index (HDI) 2005................................... 218
Appendix Table: 6 Major indices level of development ...................................................... 218
Appendix Table: 7 Health and primary sector development................................................ 218
Appendix Table: 8 Infrastructural development in the Kathmandu valley .......................... 219
Appendix Table: 9 Population distribution form 1971 to 2001 ........................................... 219
Appendix Table: 10 Land characteristics of each LMU in Kathmandu valley .................... 220
Appendix Table: 11 Fertility rating of the individual LMU in the Kathmandu valley ........ 223
Appendix Table: 12 Current suitability ratings of diagnostic characteristics vegetable
cultivation ..................................................................................................... 225
Appendix Table: 13 Sub criteria of infrastructure and economic attributes........................ 227
Appendix Table: 14. Sub criteria of the social attribute....................................................... 227
Appendix Table: 15 Sub criteria of physical environment................................................... 227
Appendix table: 16 Suitability indexes of different sub-criteria for multi-criteria land
suitability evaluation................................................................................... 228

216
APPENDIX
Appendix Table: 1 Trends of urban and agricultural land use in the valley
Year 1984 1991 1994 2000 2010 2020
Urban area ( % of total valley area) 4.8 11.0 13.1 18.0 26.0 34.3
Agricultural area ( % of total valley area) 64.0 56.0 49.6 42.2 28.3 14.5
Source : Pradhan and Parera ,2005
Appendix Table: 2 Consumption figures in Kathmandu valley
Category 1996 Consumption (kg/capita/year)
Total Demand in 2000/01 (kg) in ‘000
Projected Demand in 2015/16 (kg) in ‘000
Vegetable 66.2 10,664 174,755
Fruit 11.3 18,814 43,587
Spices 3.0 3,912 7,368
Appendix Table: 3 Soil texture type of valley districts identified by national sample agricultural census, 2001/02
Districts
SN Soil type Kathmandu Lalitpur Bhaktapur
Sand (Balaute) 4366.3 3039.0 1033.8
Loam (Domat) 1967.0 1062.4 631.2
Silt (Pango) 1784.7 1443.1 538.4
Clay (Chimtyalo) 3909.7 3237.5 1217.6
Clay Loam (Chimtylo Domat) 240.0 93.7 109.6
Area (ha) 13285.4 9958.6 6000.1

217
Appendix Table: 4 Revenue Cost Ratio for the vegetable cultivation in Kathmandu Valley Particulars Average
LAND AREA 1 Ropani* A. INCOME 31700 B. VARIABLE COST 25,329,721 1. Seed 650 2. Fertilizer 4650 2.1. Inorganic 900 2.9. Organic 380 2.10. Other (Lime) 70 3. Pesticide 740 3.1. Insecticide 150 3.4. Fungicide 50 4. Labor 6920 4.2. Land preparation 4.4. Planting 4.5. Mulching / Staking 4.7. Irrigation / Fertilizing 4.11. Harvesting 4.16. Value addition 4.17. Transporting 300 C. GENERAL COST 7990 5. Tax/ Rent 3000 7. Interest 50 10. Social Cost 13. Maintenance 500 14. Depreciation 300 D. FIX COST 3200 15. Staking/Mulch 700 19. Transportation 200 24150C. Net Benefit 7550D. R/C Ratio 1.3126294
* 1 Ropani of land = 0.025ha.
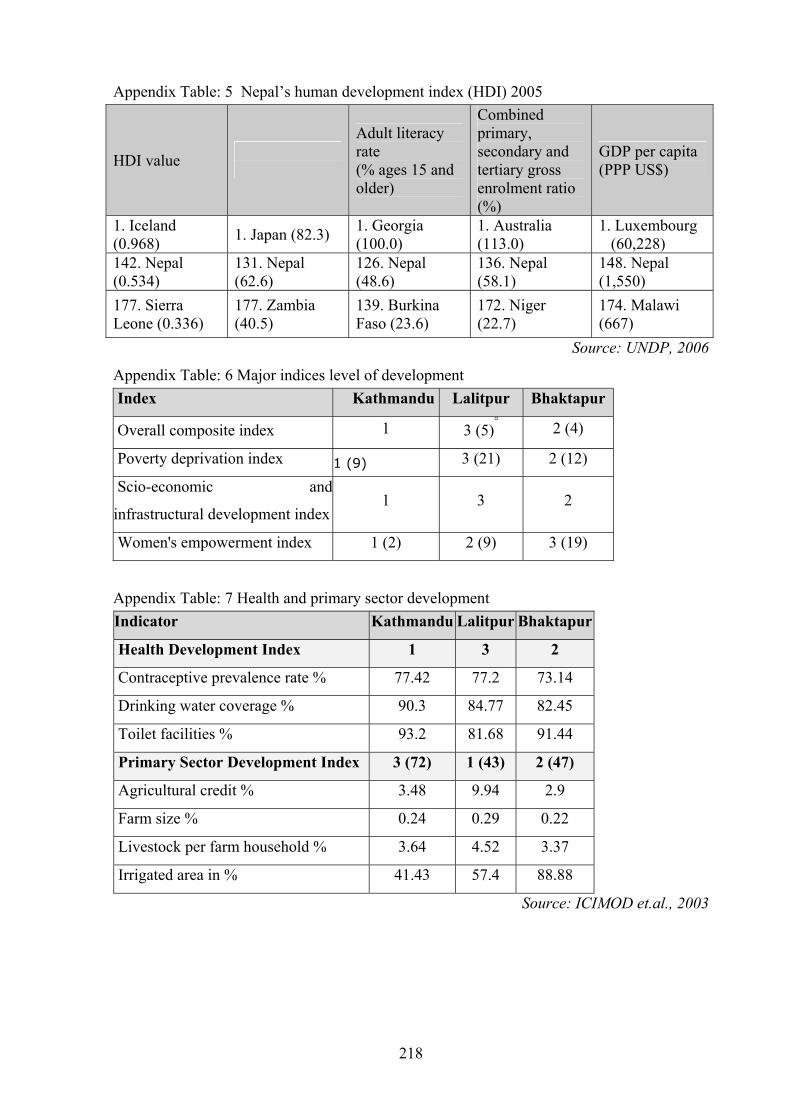
218
Appendix Table: 5 Nepal’s human development index (HDI) 2005
HDI value
Adult literacy rate (% ages 15 and older)
Combined primary, secondary and tertiary gross enrolment ratio (%)
GDP per capita (PPP US$)
1. Iceland (0.968) 1. Japan (82.3) 1. Georgia
(100.0) 1. Australia (113.0)
1. Luxembourg (60,228)
142. Nepal (0.534)
131. Nepal (62.6)
126. Nepal (48.6)
136. Nepal (58.1)
148. Nepal (1,550)
177. Sierra Leone (0.336)
177. Zambia (40.5)
139. Burkina Faso (23.6)
172. Niger (22.7)
174. Malawi (667)
Source: UNDP, 2006
Appendix Table: 6 Major indices level of development Index Kathmandu Lalitpur Bhaktapur
Overall composite index 1 3 (5)° 2 (4)
Poverty deprivation index 1 (9) 3 (21) 2 (12)
Scio-economic and
infrastructural development index 1 3 2
Women's empowerment index 1 (2) 2 (9) 3 (19)
Appendix Table: 7 Health and primary sector development Indicator Kathmandu Lalitpur Bhaktapur
Health Development Index 1 3 2
Contraceptive prevalence rate % 77.42 77.2 73.14
Drinking water coverage % 90.3 84.77 82.45
Toilet facilities % 93.2 81.68 91.44
Primary Sector Development Index 3 (72) 1 (43) 2 (47)
Agricultural credit % 3.48 9.94 2.9
Farm size % 0.24 0.29 0.22
Livestock per farm household % 3.64 4.52 3.37
Irrigated area in % 41.43 57.4 88.88
Source: ICIMOD et.al., 2003

219
Appendix Table: 8 Infrastructural development in the Kathmandu valley Indicator Kathmandu LalitpurBhaktapur
Infrastructural development index 1 3 2
Road density 100 sq. km 203.54 87.79 148.74
Cooperatives density (%) 27.69 23.39 25.37
Health institutions density (%) 3.48 3.77 4.25
Forest user households (%) 6.37 15.33 17.37
Per capita budget expenditure (NRs.) 20,537 1,500 1,278
Per capita development budget expenditure (NRs.) 16,532 4,238 4,871
Overall literacy rate (%) 77.21 70.92 70.57
Ratio of non-agricultural and agricultural occupation (%) 3.69 1.78 1.41
Source: ICIMOD et.al., 2003
Appendix Table: 9 Population distribution form 1971 to 2001 Year
Districts 1971 1981 1991 2001
Area
Sq. km
Kathmandu 353,756 422,237 675,341 1,081,845 395
Lalitpur 154,998 184,341 257,086 337,785 385
Bhaktapur 110,157 159,767 172,952 225,461 119
Kathmandu Valley 618,911 766,345 1,105,379 1,645,091 899
Source: ICIMODet.al., 2003

220
Appendix Table: 10 Land characteristics of each LMU in Kathmandu valley
Altitude Slope Soil depth Area
LU_ID SOIL_TYPE ALT_CLASS SL_CLASS D_CLASS (ha)
1 Dystrochrept Anthropic AL2 SL4 D5 13.066
2 Ustochrept Paralithic AL2 SL4 D4 3541.752
3 Dystrochrept Aquic AL2 SL2 D1 572.377
4 Ustifluvent Aquic Anthropic AL2 SL3 D4 338.309
5 Dystrochrept Anthropic AL2 SL5 D4 154.321
6 Dystrochrept Anthropic AL2 SL4 D4 552.276
7 Dystrochrept Anthropic AL2 SL4 D4 303.668
8 Dystrochrept Anthropic AL1 SL4 D5 29.352
9 Rhodustalf Scalpic AL1 SL2 D3 221.160
10 Fluvaquent Aeric AL1 SL1 D1 2834.244
11 Rhodustalf Anthropic Udic AL1 SL2 D2 144.105
12 Fluvaquent Aeric AL1 SL1 D3 32.505
13 Rhodustalf Scalpic AL1 SL2 D2 178.368
14 Rhodustalf Scalpic AL1 SL2 D3 109.874
15 Dystrochrept Anthropic AL1 SL5 D3 7.610
16 Rhodustalf Anthropic Udic AL1 SL2 D2 193.556
17 Rhodustalf Anthropic Udic AL1 SL2 D2 71.698
18 Rhodustalf Anthropic Udic AL1 SL2 D3 43.127
19 Rhodustalf Scalpic AL1 SL2 D2 134.258
20 Rhodustalf Scalpic AL1 SL2 D3 81.969
21 Dystrochrept Anthropic AL2 SL5 D4 45.475
22 Rhodustalf Anthropic Udic AL1 SL2 D2 118.553
23 Rhodustalf Scalpic AL1 SL2 D2 12.482
24 Rhodustalf Scalpic AL1 SL2 D2 642.409
25 Rhodustalf Anthropic Udic AL1 SL2 D2 89.694
26 Rhodustalf Anthropic Udic AL1 SL2 D2 41.648
27 Fluvaquent Aeric AL2 SL1 D2 102.026
28 Rhodustalf Anthropic Udic AL1 SL2 D1 128.712
29 Ustifluvent Aquic Anthropic AL1 SL3 D5 75.650
30 Rhodustalf Anthropic Udic AL1 SL2 D1 2.507
31 Rhodustalf Scalpic AL1 SL2 D2 14.763
32 Ustifluvent Aquic Anthropic AL1 SL3 D5 21.325
33 Rhodustalf Anthropic Udic AL1 SL2 D2 38.823
34 Rhodustalf Anthropic Udic AL1 SL2 D2 58.757
35 Ustochrept Aquic AL1 SL1 D2 19.522
36 Rhodustalf Anthropic Udic AL1 SL2 D1 38.642
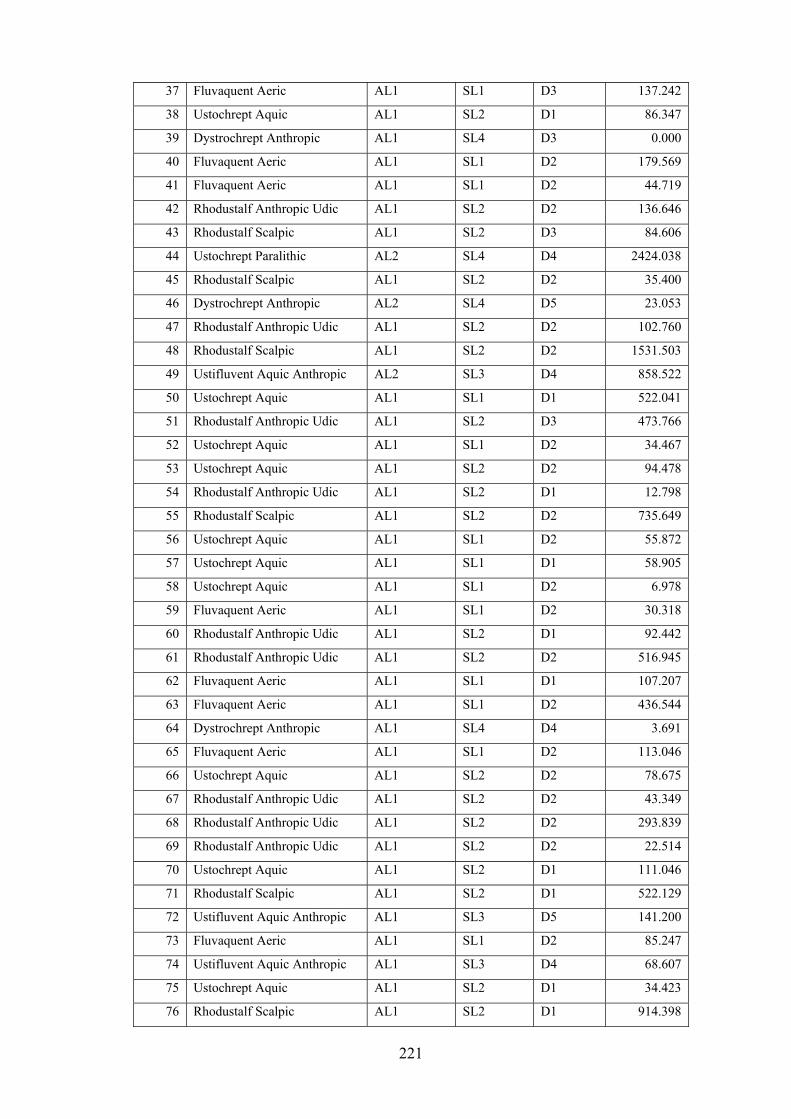
221
37 Fluvaquent Aeric AL1 SL1 D3 137.242
38 Ustochrept Aquic AL1 SL2 D1 86.347
39 Dystrochrept Anthropic AL1 SL4 D3 0.000
40 Fluvaquent Aeric AL1 SL1 D2 179.569
41 Fluvaquent Aeric AL1 SL1 D2 44.719
42 Rhodustalf Anthropic Udic AL1 SL2 D2 136.646
43 Rhodustalf Scalpic AL1 SL2 D3 84.606
44 Ustochrept Paralithic AL2 SL4 D4 2424.038
45 Rhodustalf Scalpic AL1 SL2 D2 35.400
46 Dystrochrept Anthropic AL2 SL4 D5 23.053
47 Rhodustalf Anthropic Udic AL1 SL2 D2 102.760
48 Rhodustalf Scalpic AL1 SL2 D2 1531.503
49 Ustifluvent Aquic Anthropic AL2 SL3 D4 858.522
50 Ustochrept Aquic AL1 SL1 D1 522.041
51 Rhodustalf Anthropic Udic AL1 SL2 D3 473.766
52 Ustochrept Aquic AL1 SL1 D2 34.467
53 Ustochrept Aquic AL1 SL2 D2 94.478
54 Rhodustalf Anthropic Udic AL1 SL2 D1 12.798
55 Rhodustalf Scalpic AL1 SL2 D2 735.649
56 Ustochrept Aquic AL1 SL1 D2 55.872
57 Ustochrept Aquic AL1 SL1 D1 58.905
58 Ustochrept Aquic AL1 SL1 D2 6.978
59 Fluvaquent Aeric AL1 SL1 D2 30.318
60 Rhodustalf Anthropic Udic AL1 SL2 D1 92.442
61 Rhodustalf Anthropic Udic AL1 SL2 D2 516.945
62 Fluvaquent Aeric AL1 SL1 D1 107.207
63 Fluvaquent Aeric AL1 SL1 D2 436.544
64 Dystrochrept Anthropic AL1 SL4 D4 3.691
65 Fluvaquent Aeric AL1 SL1 D2 113.046
66 Ustochrept Aquic AL1 SL2 D2 78.675
67 Rhodustalf Anthropic Udic AL1 SL2 D2 43.349
68 Rhodustalf Anthropic Udic AL1 SL2 D2 293.839
69 Rhodustalf Anthropic Udic AL1 SL2 D2 22.514
70 Ustochrept Aquic AL1 SL2 D1 111.046
71 Rhodustalf Scalpic AL1 SL2 D1 522.129
72 Ustifluvent Aquic Anthropic AL1 SL3 D5 141.200
73 Fluvaquent Aeric AL1 SL1 D2 85.247
74 Ustifluvent Aquic Anthropic AL1 SL3 D4 68.607
75 Ustochrept Aquic AL1 SL2 D1 34.423
76 Rhodustalf Scalpic AL1 SL2 D1 914.398

222
77 Rhodustalf Scalpic AL1 SL2 D2 228.956
78 Rhodustalf Anthropic Udic AL1 SL2 D2 127.960
79 Rhodustalf Scalpic AL1 SL2 D1 5.856
80 Dystrochrept Anthropic AL2 SL4 D5 1.824
81 Dystrochrept Anthropic AL1 SL4 D4 47.784
82 Fluvaquent Aeric AL1 SL1 D2 148.047
83 Dystrochrept Anthropic AL1 SL4 D3 551.126
84 Rhodustalf Scalpic AL1 SL2 D1 62.004
85 Dystrochrept Anthropic AL1 SL5 D4 82.213

223
Appendix Table: 11 Fertility rating of the individual LMU in the Kathmandu valley Soil Paremeters LMU_ID
PH OM WHC TOT_N P2O5 K2O T_FERT T_CLASS AREA(ha)
1 VL VL M L M M L T5 13.066 2 VL VH M M M L L T5 3541.752 3 L M H H M L L T3 572.377 4 L VL M L VL L VL T1 338.309 5 VL VL L L M M L T5 154.321 6 VL L M L VL L VL T1 552.276 7 L M L L H M L T3 303.668 8 M M M M L L L T4 29.352 9 M M M M VL L VL T5 221.160 10 M M M M H M M T1 2834.244 11 M M M M H H M T1 144.105 12 M M L M H H M T4 32.505 13 M H M M H M M T1 178.368 14 VL VL L M VL M VL T1 109.874 15 VL L L L M M L T5 7.610 16 M M M M H M M T3 193.556 17 M M M M H M M T1 71.698 18 L H H H H M M T1 43.127 19 VL M L M H M M T1 134.258 20 M L M M H M L T4 81.969 21 M M M M H M M T5 45.475 22 M M M M M M L T3 118.553 23 M M M M M M M T2 12.482 24 M L M L VL M VL T1 642.409 25 L H M M H M L T1 89.694 26 L M H M H M M T4 41.648 27 M M M M M M M T1 102.026 28 L H M H H M L T2 128.712 29 M H H M H M M T5 75.650 30 VL M M M H M M T1 2.507 31 M M M M H M M T3 14.763 32 VL M M M L M M T3 21.325 33 L H M M H M L T1 38.823 34 M H M M H M M T1 58.757 35 VL M M L H M L T2 19.522 36 M M M M H M M T2 38.642 37 L M M M H M L T3 137.242 38 VL M M M H M M T2 86.347 39 VL H M M H M M T1 0.000 40 M M L M VL M L T1 179.569 41 M H M M H M M T1 44.719 42 L M M L H M L T1 136.646 43 VL H M H L M L T1 84.606 44 M H M M H M M T4 2424.038 45 VL M L M H M M T4 35.400

224
46 M M L M H M M T5 23.053 47 M M H L H M L T1 102.760 48 M M H M M M M T1 1531.503 49 L M H M H M M T1 858.522 50 M M H L H M L T2 522.041 51 M M M M H M M T1 473.766 52 M M M M VL M VL T2 34.467 53 L M M M H M M T1 94.478 54 M M M M M M M T2 12.798 55 L M M M H M M T4 735.649 56 VL M M L M M L T2 55.872 57 L VL L L H M L T2 58.905 58 M H M M H M M T2 6.978 59 VL L M L M M L T1 30.318 60 M M M M H M M T2 92.442 61 VL M L M H M M T4 516.945 62 VL L L L M M L T1 107.207 63 M M M L M M L T1 436.544 64 M M L M L M L T5 3.691 65 VL L M M H M M T1 113.046 66 M M M M L M M T4 78.675 67 VL M M M H M M T2 43.349 68 M M M M H M M T1 293.839 69 VL M M M M M M T4 22.514 70 M H H M M M M T4 111.046 71 VL H M M M M M T2 522.129 72 VL H M L M M L T5 141.200 73 M M H M H M M T1 85.247 74 M H H M H M M T1 68.607 75 M H M M H M M T1 34.423 76 VL M M M L M M T2 914.398 77 VL H M M H M M T2 228.956 78 VL H M M M M M T2 127.960 79 VL M H M H M M T1 5.856 80 M H M VH M M M T5 1.824 81 M H M M H M L T4 47.784 82 M L H M H M M T1 148.047 83 VL M H M L M L T1 551.126 84 M H H M H M L T1 62.004 85 VL H M M H M M T5 82.213
H: High, M: Medium, L: Low and VL: Very Low
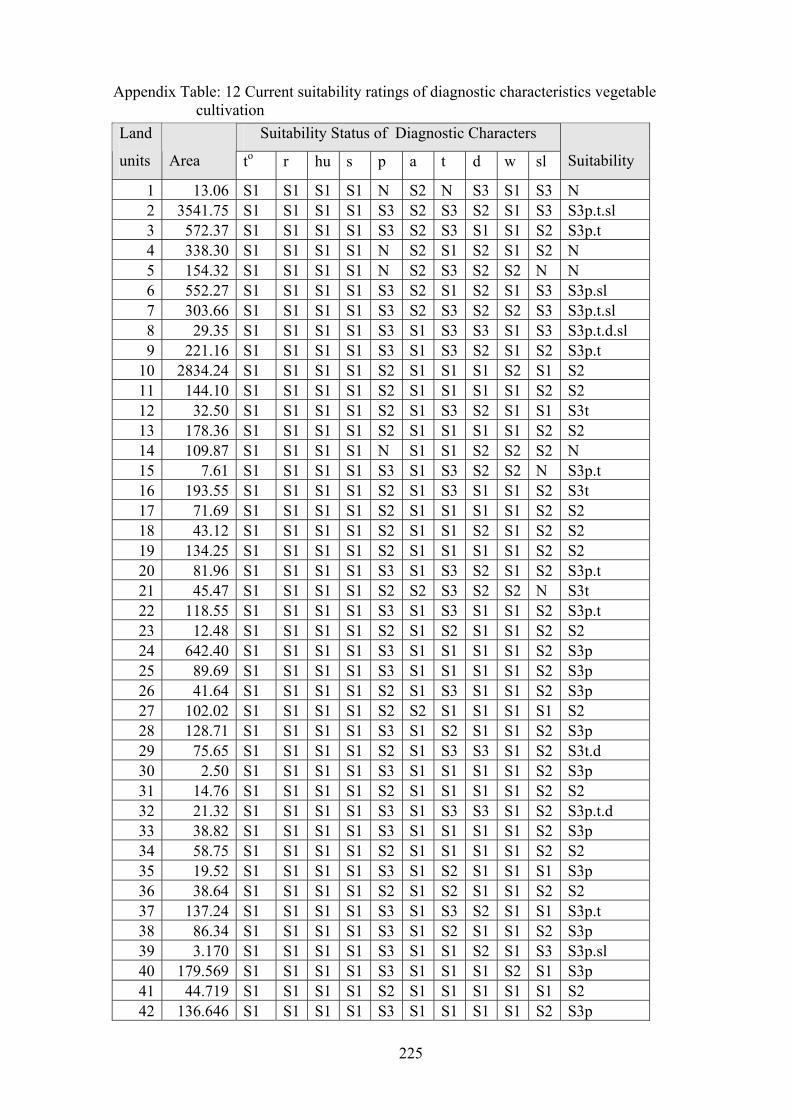
225
Appendix Table: 12 Current suitability ratings of diagnostic characteristics vegetable cultivation
Suitability Status of Diagnostic Characters Land
units Area to r hu s p a t d w sl Suitability
1 13.06 S1 S1 S1 S1 N S2 N S3 S1 S3 N 2 3541.75 S1 S1 S1 S1 S3 S2 S3 S2 S1 S3 S3p.t.sl 3 572.37 S1 S1 S1 S1 S3 S2 S3 S1 S1 S2 S3p.t 4 338.30 S1 S1 S1 S1 N S2 S1 S2 S1 S2 N 5 154.32 S1 S1 S1 S1 N S2 S3 S2 S2 N N 6 552.27 S1 S1 S1 S1 S3 S2 S1 S2 S1 S3 S3p.sl 7 303.66 S1 S1 S1 S1 S3 S2 S3 S2 S2 S3 S3p.t.sl 8 29.35 S1 S1 S1 S1 S3 S1 S3 S3 S1 S3 S3p.t.d.sl 9 221.16 S1 S1 S1 S1 S3 S1 S3 S2 S1 S2 S3p.t
10 2834.24 S1 S1 S1 S1 S2 S1 S1 S1 S2 S1 S2 11 144.10 S1 S1 S1 S1 S2 S1 S1 S1 S1 S2 S2 12 32.50 S1 S1 S1 S1 S2 S1 S3 S2 S1 S1 S3t 13 178.36 S1 S1 S1 S1 S2 S1 S1 S1 S1 S2 S2 14 109.87 S1 S1 S1 S1 N S1 S1 S2 S2 S2 N 15 7.61 S1 S1 S1 S1 S3 S1 S3 S2 S2 N S3p.t 16 193.55 S1 S1 S1 S1 S2 S1 S3 S1 S1 S2 S3t 17 71.69 S1 S1 S1 S1 S2 S1 S1 S1 S1 S2 S2 18 43.12 S1 S1 S1 S1 S2 S1 S1 S2 S1 S2 S2 19 134.25 S1 S1 S1 S1 S2 S1 S1 S1 S1 S2 S2 20 81.96 S1 S1 S1 S1 S3 S1 S3 S2 S1 S2 S3p.t 21 45.47 S1 S1 S1 S1 S2 S2 S3 S2 S2 N S3t 22 118.55 S1 S1 S1 S1 S3 S1 S3 S1 S1 S2 S3p.t 23 12.48 S1 S1 S1 S1 S2 S1 S2 S1 S1 S2 S2 24 642.40 S1 S1 S1 S1 S3 S1 S1 S1 S1 S2 S3p 25 89.69 S1 S1 S1 S1 S3 S1 S1 S1 S1 S2 S3p 26 41.64 S1 S1 S1 S1 S2 S1 S3 S1 S1 S2 S3p 27 102.02 S1 S1 S1 S1 S2 S2 S1 S1 S1 S1 S2 28 128.71 S1 S1 S1 S1 S3 S1 S2 S1 S1 S2 S3p 29 75.65 S1 S1 S1 S1 S2 S1 S3 S3 S1 S2 S3t.d 30 2.50 S1 S1 S1 S1 S3 S1 S1 S1 S1 S2 S3p 31 14.76 S1 S1 S1 S1 S2 S1 S1 S1 S1 S2 S2 32 21.32 S1 S1 S1 S1 S3 S1 S3 S3 S1 S2 S3p.t.d 33 38.82 S1 S1 S1 S1 S3 S1 S1 S1 S1 S2 S3p 34 58.75 S1 S1 S1 S1 S2 S1 S1 S1 S1 S2 S2 35 19.52 S1 S1 S1 S1 S3 S1 S2 S1 S1 S1 S3p 36 38.64 S1 S1 S1 S1 S2 S1 S2 S1 S1 S2 S2 37 137.24 S1 S1 S1 S1 S3 S1 S3 S2 S1 S1 S3p.t 38 86.34 S1 S1 S1 S1 S3 S1 S2 S1 S1 S2 S3p 39 3.170 S1 S1 S1 S1 S3 S1 S1 S2 S1 S3 S3p.sl 40 179.569 S1 S1 S1 S1 S3 S1 S1 S1 S2 S1 S3p 41 44.719 S1 S1 S1 S1 S2 S1 S1 S1 S1 S1 S2 42 136.646 S1 S1 S1 S1 S3 S1 S1 S1 S1 S2 S3p

226
43 84.606 S1 S1 S1 S1 S3 S1 S1 S2 S1 S2 S3p 44 2424.038 S1 S1 S1 S1 S2 S2 S3 S2 S1 S3 S3t 45 35.400 S1 S1 S1 S1 S3 S1 S3 S1 S1 S2 S3p.t 46 23.053 S1 S1 S1 S1 S2 S2 N S3 S1 S3 S3d.sl 47 102.760 S1 S1 S1 S1 S3 S1 S1 S1 S1 S2 S3p 48 1531.503 S1 S1 S1 S1 S2 S1 S1 S1 S1 S2 S2 49 858.522 S1 S1 S1 S1 S2 S2 S1 S2 S1 S2 S2 50 522.041 S1 S1 S1 S1 S3 S1 S2 S1 S1 S1 S3p 51 473.766 S1 S1 S1 S1 S2 S1 S1 S2 S1 S2 S2 52 34.467 S1 S1 S1 S1 S3 S1 S2 S1 S1 S1 S3p 53 94.478 S1 S1 S1 S1 S2 S1 S1 S1 S1 S2 S2 54 12.798 S1 S1 S1 S1 S2 S1 S2 S1 S1 S2 S2 55 735.649 S1 S1 S1 S1 S2 S1 S3 S1 S1 S2 S3t 56 55.872 S1 S1 S1 S1 S3 S1 S2 S1 S1 S1 S3p 57 58.905 S1 S1 S1 S1 N S1 S2 S1 S1 S1 N 58 6.978 S1 S1 S1 S1 S2 S1 S2 S1 S1 S1 S2 59 30.318 S1 S1 S1 S1 S3 S1 S1 S1 S1 S1 S3p 60 92.442 S1 S1 S1 S1 S2 S1 S2 S1 S1 S2 S2 61 516.945 S1 S1 S1 S1 S3 S1 S3 S1 S1 S2 S3p.t 62 107.207 S1 S1 S1 S1 S3 S1 S1 S1 S1 S1 S3p 63 436.544 S1 S1 S1 S1 S3 S1 S1 S1 S1 S1 S3p 64 3.691 S1 S1 S1 S1 S3 S1 N S2 S2 S3 N 65 113.046 S1 S1 S1 S1 S3 S1 S1 S1 S1 S1 S3p 66 78.675 S1 S1 S1 S1 S3 S1 S3 S1 S1 S2 S3p.t 67 43.349 S1 S1 S1 S1 S2 S1 S2 S1 S1 S2 S2 68 293.839 S1 S1 S1 S1 S2 S1 S1 S1 S1 S2 S2 69 22.514 S1 S1 S1 S1 S3 S1 S3 S1 S1 S2 S3p.t 70 111.046 S1 S1 S1 S1 S2 S1 S3 S1 S1 S2 S3t 71 522.129 S1 S1 S1 S1 S3 S1 S2 S1 S1 S2 S3p 72 141.200 S1 S1 S1 S1 S3 S1 S3 S3 S1 S2 S3p.t.d 73 85.247 S1 S1 S1 S1 S2 S1 S1 S1 S1 S1 S2 74 68.607 S1 S1 S1 S1 S2 S1 S1 S2 S1 S2 S2 75 34.423 S1 S1 S1 S1 S2 S1 S1 S1 S1 S2 S2 76 914.398 S1 S1 S1 S1 S3 S1 S2 S1 S1 S2 S3p 77 228.956 S1 S1 S1 S1 S3 S1 S2 S1 S1 S2 S3p.sl 78 127.960 S1 S1 S1 S1 S3 S1 S2 S1 S1 S2 S3p 79 5.856 S1 S1 S1 S1 S3 S1 S1 S1 S1 S2 S3p 80 1.824 S1 S1 S1 S1 S2 S2 S3 S3 S1 S3 S3t.d.sl 81 47.784 S1 S1 S1 S1 S3 S1 S3 S2 S1 S3 S3p.t.sl 82 148.047 S1 S1 S1 S1 S3 S1 S1 S1 S1 S1 S3p 83 551.126 S1 S1 S1 S1 S3 S1 S1 S2 S1 S3 S3p.sl 84 62.004 S1 S1 S1 S1 S3 S1 S1 S1 S1 S2 S3p 85 82.213 S1 S1 S1 S1 S2 S1 N S2 S1 N N

227
Appendix Table: 13 Sub criteria of infrastructure and economic attributes MARKT ROAD VALUE AGINPUT IRIGN R/C Weights
MARKT 1 2 5 3 1/3 1/3 0.138
ROAD 1/2 1 6 2 1/2 1/2 0.148
VALUE 1/5 1/6 1 1/4 1/5 1/9 0.034
AGINPUT 1/3 1/2 4 1 1/3 1/2 0.096
IRIGN 3 2 5 3 1 2 0.322
R/C 3 2 9 2 1/2 1 0.262
Consistency Ratio (CR) = 0.027
Appendix Table: 14. Sub criteria of the social attribute MINFO MOTIV CULTV LABFR CAPINV Weights
MINFO 1 7 3 5 2 0.440
MOTIV 1/7 1 1/5 1/3 1/3 0.048
CULTV 1/3 5 1 2 3 0.250
LABFR 1/5 3 1/2 1 1/2 0.104
CAPINV 1/2 3 1/3 2 1 0.159
Consistency Ratio (CR) = 0.052
Appendix Table: 15 Sub criteria of physical environment PHY ERO CRP URB Weights
PHY 1 6 5 7 0.635
ERO 1/6 1 1/3 1 0.084
CRP 1/5 3 1 3 0.201
URB 1/7 1 1/3 1 0.080
Consistency Ratio (CR) = 0.034

228
Appendix table: 16 Suitability indexes of different sub-criteria for multi-criteria land suitability evaluation. Si= ΣXi x Wi Suitability
LU
ID
AREA
(Ha) Irign road value Markt Aginp R/C Minfo Motiv Cultv Labfr Capin Phy Ero Crop Urb
Index
(Si) So-
eco Phy
1 13.07 0.98 0.32 0.11 0.36 0.29 0.91 0.20 0.04 0.14 0.07 0.06 0.00 0.37 0.69 0.35 4.9 N N
2 3541.75 0.98 0.45 0.14 0.42 0.29 0.80 0.27 0.03 0.12 0.06 0.07 1.55 0.33 0.78 0.35 6.6 S3 S3a.t.sl
3 572.38 1.12 0.45 0.12 0.48 0.34 0.68 0.27 0.03 0.14 0.07 0.07 1.55 0.29 0.78 0.31 6.7 S3 S3t
4 338.31 0.70 0.38 0.11 0.36 0.29 0.91 0.27 0.03 0.14 0.06 0.06 0.00 0.29 0.69 0.35 4.6 N N
5 154.32 0.84 0.32 0.11 0.30 0.25 0.91 0.24 0.04 0.14 0.06 0.07 0.00 0.37 0.69 0.35 4.7 N N
6 552.28 1.12 0.51 0.11 0.48 0.29 0.80 0.27 0.03 0.18 0.06 0.08 1.55 0.29 0.78 0.23 6.8 S3 S3sl
7 303.67 0.98 0.51 0.09 0.42 0.29 0.91 0.20 0.03 0.14 0.07 0.06 1.55 0.33 0.69 0.35 6.6 S3 S3t. sl
8 29.35 1.26 0.58 0.11 0.48 0.34 0.80 0.31 0.04 0.12 0.06 0.10 1.55 0.33 0.88 0.23 7.2 S2 S3t.d.sl
9 221.16 1.12 0.45 0.09 0.48 0.34 0.91 0.24 0.04 0.14 0.06 0.08 1.55 0.29 0.69 0.27 6.7 S3 S3t
10 2834.24 1.26 0.58 0.12 0.54 0.38 0.80 0.27 0.02 0.16 0.04 0.10 2.78 0.33 0.69 0.20 8.3 S1 S1
11 144.11 1.12 0.45 0.09 0.42 0.29 0.80 0.24 0.03 0.16 0.06 0.07 2.16 0.25 0.69 0.23 7.1 S2 S2
12 32.51 0.98 0.45 0.09 0.48 0.25 0.91 0.24 0.03 0.14 0.06 0.08 1.55 0.25 0.69 0.23 6.4 S3 S3t
13 178.37 0.98 0.51 0.11 0.48 0.29 0.80 0.27 0.03 0.14 0.05 0.10 2.16 0.25 0.78 0.20 7.1 S2 S2
14 109.87 0.98 0.51 0.11 0.48 0.29 0.80 0.24 0.03 0.14 0.06 0.08 1.55 0.21 0.69 0.31 6.5 S3 S3p
15 7.61 0.84 0.32 0.09 0.42 0.29 0.91 0.24 0.03 0.12 0.07 0.07 0.00 0.25 0.59 0.35 4.6 N N
16 193.56 1.26 0.51 0.11 0.54 0.29 0.91 0.27 0.02 0.14 0.05 0.10 1.55 0.25 0.69 0.20 6.9 S3 S3t
17 71.70 1.12 0.51 0.11 0.48 0.29 0.91 0.27 0.02 0.14 0.05 0.10 2.16 0.25 0.69 0.20 7.3 S2 S2
18 43.13 1.26 0.51 0.09 0.42 0.29 0.91 0.20 0.03 0.18 0.07 0.07 2.16 0.25 0.78 0.31 7.6 S2 S2
19 134.26 1.12 0.45 0.08 0.48 0.25 0.91 0.31 0.03 0.14 0.04 0.10 2.16 0.33 0.59 0.20 7.2 S2 S2
20 81.97 0.98 0.38 0.11 0.42 0.34 0.80 0.20 0.03 0.14 0.06 0.07 1.55 0.29 0.69 0.31 6.4 S3 S3p.t

229
21 45.48 0.84 0.32 0.09 0.36 0.29 0.91 0.20 0.03 0.14 0.07 0.06 0.00 0.29 0.59 0.35 4.5 N N
22 118.55 1.12 0.51 0.11 0.42 0.29 0.91 0.24 0.04 0.14 0.06 0.07 1.55 0.29 0.59 0.31 6.6 S3 S3p.t
23 12.48 1.12 0.51 0.11 0.48 0.34 0.80 0.24 0.03 0.16 0.05 0.08 2.16 0.29 0.78 0.20 7.3 S2 S2
24 642.41 1.26 0.58 0.11 0.36 0.34 0.91 0.24 0.04 0.16 0.07 0.07 1.55 0.29 0.88 0.35 7.2 S2 S3p
25 89.69 1.26 0.45 0.09 0.42 0.29 0.91 0.24 0.03 0.14 0.07 0.08 1.55 0.21 0.59 0.35 6.7 S3 S3p
26 41.65 0.84 0.45 0.09 0.42 0.29 1.03 0.20 0.04 0.16 0.06 0.06 1.55 0.29 0.69 0.27 6.4 S3 S3t
27 102.03 1.26 0.58 0.11 0.42 0.29 0.80 0.17 0.03 0.18 0.06 0.06 2.16 0.29 0.49 0.20 7.1 S2 S2
28 128.71 0.98 0.58 0.09 0.42 0.34 0.91 0.24 0.03 0.14 0.07 0.08 1.55 0.29 0.88 0.35 6.9 S3 S3p
29 75.65 1.26 0.32 0.11 0.30 0.29 1.03 0.20 0.03 0.12 0.07 0.06 1.55 0.37 0.69 0.35 6.7 S3 S3t.d
30 2.51 1.26 0.58 0.08 0.48 0.29 0.57 0.24 0.02 0.14 0.04 0.08 1.55 0.29 0.69 0.20 6.5 S3 S3p
31 14.76 1.26 0.58 0.08 0.48 0.29 0.57 0.24 0.02 0.14 0.04 0.08 2.16 0.33 0.69 0.23 7.2 S2 S2
32 21.33 0.98 0.58 0.09 0.42 0.29 0.68 0.24 0.03 0.12 0.06 0.07 1.55 0.29 0.69 0.27 6.3 S3 S3p.d
33 38.82 0.98 0.58 0.08 0.54 0.29 0.80 0.17 0.03 0.14 0.05 0.08 1.55 0.21 0.69 0.27 6.4 S3 S3p
34 58.76 1.12 0.58 0.11 0.30 0.29 0.80 0.24 0.03 0.12 0.06 0.06 2.16 0.29 0.69 0.35 7.2 S2 S2
35 19.52 0.70 0.58 0.11 0.54 0.29 0.80 0.27 0.03 0.14 0.04 0.08 1.55 0.21 0.69 0.20 6.2 S3 S3p
36 38.64 0.70 0.51 0.11 0.54 0.29 0.80 0.27 0.03 0.14 0.04 0.08 2.16 0.25 0.69 0.20 6.8 S3 S2
37 137.24 1.26 0.58 0.11 0.36 0.34 0.91 0.24 0.04 0.16 0.07 0.07 1.55 0.29 0.78 0.35 7.1 S2 S3p.t
38 86.35 0.84 0.58 0.09 0.48 0.29 0.57 0.24 0.03 0.14 0.04 0.08 1.55 0.21 0.69 0.20 6.0 S3 S3p
39 0.00 1.26 0.45 0.11 0.48 0.25 1.03 0.24 0.04 0.14 0.06 0.06 1.55 0.21 0.69 0.27 6.8 S3 S3p.sl
40 179.57 0.98 0.58 0.08 0.42 0.38 0.80 0.24 0.04 0.14 0.04 0.08 1.55 0.29 0.69 0.35 6.6 S3 S3p
41 44.72 1.26 0.45 0.08 0.30 0.29 0.80 0.17 0.04 0.14 0.07 0.06 2.16 0.29 0.69 0.35 7.1 S2 S2
42 136.65 0.98 0.58 0.11 0.36 0.29 0.80 0.24 0.04 0.18 0.06 0.06 1.55 0.21 0.69 0.27 6.4 S3 S3p
43 84.61 0.70 0.58 0.14 0.54 0.29 0.68 0.27 0.03 0.14 0.04 0.08 1.55 0.29 0.69 0.27 6.3 S3 S3p
44 2424.04 0.70 0.45 0.14 0.54 0.29 0.80 0.31 0.04 0.14 0.06 0.08 1.55 0.37 0.78 0.27 6.5 S3 S3p.t.sl

230
45 35.40 0.98 0.58 0.11 0.36 0.29 0.80 0.24 0.04 0.18 0.06 0.06 1.55 0.29 0.69 0.35 6.6 S3 S3p.t
46 23.05 0.70 0.45 0.08 0.30 0.29 0.80 0.17 0.04 0.14 0.07 0.06 0.00 0.21 0.69 0.35 4.3 N N
47 102.76 0.98 0.45 0.08 0.42 0.34 0.80 0.17 0.03 0.14 0.07 0.06 1.55 0.29 0.69 0.35 6.4 S3 S3p
48 1531.50 0.98 0.58 0.14 0.54 0.34 0.80 0.31 0.03 0.14 0.06 0.08 2.16 0.29 0.69 0.27 7.4 S2 S2
49 858.52 0.98 0.58 0.11 0.42 0.21 0.80 0.27 0.04 0.14 0.05 0.08 2.16 0.21 0.78 0.31 7.1 S2 S2
50 522.04 1.12 0.58 0.12 0.54 0.29 0.80 0.31 0.04 0.16 0.04 0.11 1.55 0.37 0.69 0.20 6.9 S3 S3p
51 473.77 0.70 0.58 0.09 0.54 0.29 0.80 0.24 0.02 0.14 0.06 0.06 2.16 0.29 0.69 0.20 6.8 S3 S2
52 34.47 0.84 0.58 0.09 0.54 0.29 0.80 0.24 0.03 0.14 0.04 0.08 1.55 0.33 0.59 0.20 6.3 S3 S3p
53 94.48 0.98 0.58 0.12 0.54 0.29 0.68 0.31 0.04 0.14 0.05 0.08 2.16 0.29 0.69 0.23 7.2 S2 S2
54 12.80 0.70 0.58 0.11 0.42 0.34 0.80 0.27 0.03 0.12 0.05 0.08 2.16 0.33 0.69 0.20 6.9 S3 S2
55 735.65 0.98 0.58 0.11 0.54 0.29 0.91 0.24 0.04 0.14 0.06 0.07 1.55 0.33 0.69 0.27 6.8 S3 S3t
56 55.87 0.70 0.58 0.12 0.48 0.29 0.80 0.24 0.04 0.12 0.04 0.07 1.55 0.33 0.69 0.27 6.3 S3 S3p
57 58.91 0.98 0.51 0.11 0.48 0.29 0.80 0.27 0.04 0.14 0.06 0.06 1.55 0.33 0.59 0.27 6.5 S3 S3p
58 6.98 1.26 0.58 0.12 0.54 0.29 0.68 0.27 0.04 0.18 0.04 0.08 2.16 0.37 0.69 0.20 7.5 S2 S2
59 30.32 1.12 0.45 0.11 0.48 0.29 0.91 0.24 0.04 0.14 0.06 0.07 1.55 0.33 0.69 0.31 6.8 S3 S3p
60 92.44 1.12 0.58 0.12 0.54 0.34 0.80 0.27 0.04 0.14 0.05 0.07 2.16 0.33 0.78 0.23 7.6 S2 S2
61 516.95 0.98 0.51 0.09 0.42 0.34 0.91 0.20 0.03 0.12 0.06 0.08 1.55 0.33 0.69 0.31 6.6 S3 S3p
62 107.21 0.84 0.45 0.12 0.48 0.34 0.80 0.31 0.03 0.14 0.06 0.07 1.55 0.37 0.78 0.31 6.6 S3 S3p
63 436.54 1.26 0.51 0.11 0.42 0.34 0.91 0.20 0.03 0.16 0.06 0.08 1.55 0.29 0.78 0.35 7.1 S2 S3p
64 3.69 0.98 0.45 0.11 0.42 0.34 0.91 0.20 0.03 0.14 0.07 0.07 1.55 0.21 0.69 0.27 6.4 S3 S3p
65 113.05 0.98 0.51 0.12 0.54 0.34 0.91 0.27 0.04 0.14 0.04 0.08 1.55 0.33 0.69 0.31 6.8 S3 S3p
66 78.68 0.70 0.45 0.11 0.42 0.29 0.91 0.17 0.03 0.14 0.04 0.08 1.55 0.29 0.69 0.20 6.1 S3 S3p.t
67 43.35 0.98 0.45 0.12 0.42 0.34 0.80 0.27 0.04 0.14 0.06 0.07 2.16 0.37 0.69 0.27 7.2 S2 S2
68 293.84 0.70 0.45 0.11 0.48 0.38 0.80 0.24 0.04 0.14 0.07 0.08 2.16 0.33 0.69 0.35 7.0 S2 S2

231
69 22.51 0.98 0.51 0.12 0.48 0.38 0.68 0.24 0.04 0.14 0.07 0.08 1.55 0.33 0.69 0.35 6.6 S3 S3p.t
70 111.05 0.98 0.58 0.11 0.48 0.34 0.68 0.27 0.03 0.12 0.06 0.10 2.16 0.29 0.69 0.20 7.1 S2 S2
71 522.13 0.70 0.45 0.11 0.42 0.34 0.91 0.24 0.03 0.14 0.06 0.07 1.55 0.25 0.69 0.31 6.3 S3 S3p
72 141.20 0.98 0.58 0.09 0.48 0.29 0.91 0.27 0.03 0.14 0.06 0.08 1.55 0.21 0.69 0.35 6.7 S3 S3p.t.d
73 85.25 0.70 0.58 0.11 0.48 0.29 0.80 0.20 0.03 0.14 0.05 0.07 2.16 0.37 0.69 0.27 6.9 S3 S2
74 68.61 0.98 0.45 0.14 0.48 0.29 0.80 0.31 0.04 0.14 0.06 0.08 2.16 0.37 0.69 0.35 7.3 S2 S2
75 34.42 0.98 0.58 0.11 0.42 0.34 0.68 0.24 0.02 0.14 0.05 0.06 2.16 0.33 0.69 0.23 7.0 S2 S2
76 914.40 1.26 0.45 0.11 0.48 0.34 0.91 0.24 0.04 0.14 0.06 0.06 1.55 0.29 0.69 0.35 6.9 S3 S3p
77 228.96 1.26 0.58 0.09 0.42 0.34 0.91 0.17 0.03 0.16 0.07 0.07 1.55 0.21 0.69 0.35 6.9 S3 S3p
78 127.96 1.12 0.58 0.09 0.42 0.29 0.80 0.24 0.03 0.14 0.06 0.07 1.55 0.29 0.78 0.31 6.8 S3 S3p
79 5.86 0.84 0.51 0.11 0.42 0.34 0.91 0.24 0.03 0.14 0.05 0.06 1.55 0.25 0.69 0.31 6.4 S3 S3p
80 1.82 0.70 0.45 0.09 0.36 0.34 0.80 0.20 0.03 0.14 0.07 0.06 1.55 0.37 0.69 0.35 6.2 S3 S3t.d.sl
81 47.78 0.98 0.45 0.09 0.42 0.29 0.80 0.24 0.03 0.14 0.06 0.07 1.55 0.33 0.69 0.35 6.5 S3 S3p.t.sl
82 148.05 1.26 0.45 0.11 0.42 0.34 0.91 0.20 0.04 0.14 0.07 0.06 1.55 0.37 0.69 0.35 6.9 S3 S3p
83 551.13 0.70 0.38 0.09 0.42 0.29 0.91 0.20 0.04 0.14 0.07 0.06 1.55 0.21 0.59 0.35 6.0 S3 S3p.sl
84 62.00 0.98 0.51 0.09 0.42 0.29 0.80 0.24 0.03 0.14 0.06 0.07 1.55 0.29 0.69 0.31 6.5 S3 S3p
85 82.21 0.70 0.32 0.09 0.36 0.34 0.91 0.20 0.04 0.14 0.07 0.06 0.00 0.21 0.59 0.35 4.4 N N

232
Appendix Box: 1 Details of land attributes for LIS database generation:
1. Attribute name : Attribute-ID
Description : ID for the profile layer attribute that was analyzed
Field name : AT_ID
Unit : n/a
Data type : Character
Field size : 8
Values : A integer value is assign to indicate each type of attributes
2. Attribute name : Soil Taxonomy
Description : The Soil Taxonomy classification for the soil profile as is indicated
in the national database or relevant report. FAO-UNESCO name is
assigned
Field name : S_TAX
Required : Yes
Unit : n/a
Data type : text
Field size : 50
Values : All valid (full) taxonomic names according to Soil Taxonomy
3. Attribute name : Land use
Description : Land use class (Remmelzwaal, 1990); a hierarchical system on the
basis of the type of land use and the occurrence of input and/or
output (animal products, crops)
Field name : L_USE
Unit : n/a
Data type : text
Field size : 3
Values : All valid land use class codes in the Country Codes table

233
4. Attribute name : Total sand
Description : Weight % of particles 2.0-0.05 mm (sand) in fine earth fraction.
The total sand fraction, as the sum of the subfractions.
Field name : SAND
Unit : percent
Data type : number
Field size : 4
Values : All integers between 0 and 100
5. Attribute name : Silt
Description : Weight% of particles 0.05-0.002 mm (silt) in fine earth fraction
Field name : SILT
Unit : percent
Data type : number
Field size : 4
Values : All integers between 0 and 100.
6. Attribute name : Clay
Description : Weight% of particles < 0.002 mm (clay) in fine earth fraction
Field name : CLAY
Unit : percent
Data type : number
Field size : 4
Values : All integers between 0 and 100.
7. Attribute name : Soil Texture
Description : The collective particle size class as derived from the particle size
analysis results.
Field name : SOTEX
Unit : n/a
Data type : text
Field size : 6
Values : alphabetical representation for each of the texture classes of soil
S : Sand
SL : Sandy loam
SIL : Silty loam

234
L : Loam
LC : loamy Clay
SC : Sandy clay
8. Attribute name : Total nitrogen
Description : The content of total N
Field name : NITRO
Unit : %
Data type : Decimal
Field size : 6
Values : all floating numbers equal to, or greater than, zero, with a precision of at least
1 digit
9. Attribute name : P2O5
Description : The P2O5 content
Field name : PHOS
Unit : Kg/ha
Data type : Decimal
Field size : 6
Values : All integers equal to, or greater than, zero
10. Attribute name : Soil Reaction (pH)
Description : The pH as determined in the supernatant suspension of a 1:2.5 soil-
water mixture
Field name : PH
Unit :
Data type : float
Field size : 6
Values : A floating number equal to, or greater than, 0, with a precision of at least 1
digit
11. Attribute name : POTA
Description : The potassium content in the soil
Field name : K
Unit : kg/ha
Data type : Decimal
Field size : 6
Values : All integers equal to, or greater than, zero

235
12. Attribute name : Water Holding Capacity
Description : The amount of water absorbed by unit weight of soil in given
period of time. This related with particle size
Field name : WHC
Unit : Percent
Data type : Decimal
Field size : 4
Values : All integers between 0 and 100
13. Attribute name : Organic matter
Description : Litter or organic matter on the surface, described after thicknes (in
cm) and degree of decomposition (Soil Survey Staff, 1975)
Field name : OM
Unit : Percent
Data type : Decimal
Field size : 4
Values : all the numerical values starting from 0
14. Attribute name : Degree of erosion
Description : Degree of erosion in classes after FAO (1990)
Field name : ERO
Unit : n/a
Data type : text
Field size : 1
Values : As designated types as follows
S : Slight
M : Moderate
V : Severe
E : Extreme
15. Attribute name : Soil Rootable depth
Description : Estimated depth to which root growth is unrestricted by physical or
chemical impediments - in classes after FAO (1990)
Field name : DEPTH
Unit : cm
Data type : text
Field size : 1

236
Values
V : Very shallow (< 30 cm) & (30-55 cm)
S : Shallow (55-80 cm)
M : Moderately deep (80-100 cm)
D : Deep (100-120 cm)
X : Very deep (> 120 cm)
237
Appendix box: 2 Future Plan of Vegetable Development Program
Government of Nepal
National Planning Commission
Future plan of Vegetable Development Program
Concept:
Constant increase in demand over vegetable attributed by increasing population, awareness on
food and nutrition, industrialization and urbanization, increment in GDP, export promotion, etc.
Similarly, transportation facilities, marketing network, production technology, improved seed
accessibility, application of fertilizers and pesticides are responsible for the increased supply of
the fresh vegetable else where in country. Vegetable cultivation is income generating and labor
intensive activities, this generate employment opportunity and economic benefit to the small
farmers in rural areas, nutritional security. Continuous increased supplies of vegetables will
guarantee nutritional security.
Objective of the three year future plan of vegetable sector
To enhance the fresh vegetable production and productivity for
a. Nutritional supplement
b. Strengthening local agro-business in the rural area
c. Economic benefits to the poor and under privileged farmers.
d. Contribution to the environmental conservation
Pocket Areas
Future plan identifies following pocket areas for vegetable cultivation according to
physiographic zones of Nepal as given in following table.
Physiographic zone
Development Region
Potato, vegetable and spice development program
High Himal Potato from seed, Alaichi, Capsicum, off-season fresh vegetable production, vegetable seed production
Middle Mountain
Khayan Potato, Potato from seed, Cardomom, Akware Capsicum, Export oriented vegetable and vegetable seed production
Kathmandu Valley
Akbare Capsicum, Khayan Potato, Export quality off-seasonal and seasonal Organic vegetable farming
Terai Potato from seed, Potato with tubers, Khayan Potato, Zinger, Off-seasonal vegetable for export, vegetable seed production

238
Procedure for program implementation
Production program has been categorized as
a. commercial fresh vegetable production (for domestic market)
b. Fresh vegetable production for the export (For external markets)
c. General fresh vegetable production (For household consumption)
Vegetable seed development program
Development of the seed selection or genetic development Germplasm identification and
registration of the plant used as vegetable in Nepal.
Improvement over the traditional knowledge and technique about cultivation and
consumption of fresh vegetable in Nepal
Horticulture farms are to be categorized according to the Agri-ecological zone and assign
full responsibility on the research and development of the specific vegetables and spice of
the very ecological zone.
059/60 (2003) 060/61 (2004) 061/62 (2005) 062/63 (2006) SN Article Unit Base yr.
Goal Success Goal Success Goal Success Goal Success
Growth
(%)
base yr.
Fresh Vegetables
1 Area ha 161048 164926 165988 173073 172586 181623 180823 190595 190597 18.35
2 Production Mt 1738086 1767365 1799973 1889667 1890100 2020432 2065193 2160246 2185193 25.72
3 Productivity Mt/ha 10.7 10.69 10.84 10.92 10.95 11.11 11.42 11.31 11.46 7.10
Spice
Problems and limitations of the tenth plan
7. Lack of the human resources
8. Difficult to have right man at right palace
9. Lack of institutional reform and improper coordination up to bottom level
10. Insufficient budget
11. Lack of Infrastructural reforms
12. Seed production has been affected due to the lack of sufficient budget
13. Tough National situation

239
Forth coming three year plan and its goal
064/65 2008)
065/66 (2009)
066/67 (2010)
SN Particular Unit
Base year 062/63 (2006) Target Target Target Growth (%) on
base year Fresh Vegetables 1 Area ha 189832 209550 219965 232540 22.00 2 Production Mt 2190100 2430780 25669911 2790480 25.41 3 Productivity Mt/ha 11.51 11.60 11.67 12 4.0
Policies
1.1 Specific vegetable cultivation will be promoted on the basis of comparative profit and
physiographic region. Rural poverty will be expected to recede down through
promotion and commercialization of vegetable, potato, spice and tuber crops.
2.1 To emphasize on generation of competitive capability of the farmers
3.1 Put emphasis on enhancement of higher level and field level technical man power so
that effective services can be delivered promptly.
4.1 Inclusion of gender, ethnic concept in the program
Strategy
e) Increase on vegetable consumption to support on nutritional security of the people
f) Emphasis on intensive farming rather than in extension of the land area
g) Put emphasis on commercialization of vegetable cultivation
h) To export fresh organic vegetable
i) Identification and allocation of the export pocket are of the vegetable cultivation for
export.
j) Diversification of the agriculture according to agro-ecological zones of Nepal
k) Establishment of the commercial nurseries
l) Extension of agriculture research and development centers in the country
m) Reduction in the application of the pesticides and harmful toxic materials
n) Promote private sector for the seed production export
o) Promote hybrid seed production
p) Prime importance should be given to those pocket areas where only export varieties of
the vegetable seed will be produced.
q) To enhance commercial capability of the vegetable, packaging and labeling of the sell

240
r) Constant monitoring of the vegetable production and development program
Working policies
Fresh vegetable production program is to be conducted on two categories namely
commercial and ordinary
Arrangements will be made to produce off season vegetables like production in plastic
tunnel.
Organic vegetables production are to be conducted on categorized manner
Vegetable markets and production sites are to be arranged according to available road
network.
Export pocket area will be furnished with the cultivation of specified vegetable varieties
Promotion of kitchen gardening for the production of fresh vegetable round the year is
arranged in the area with lack of adequate transportation facilities and market channel.
Agricultural research will be coordinated with the established research institutions.
Existing agriculture farm and centers are used to promote research, investigations,
hybridization and so on.
Integrated Pest Management (IPM) program will be emphasized to reduce use of
insecticides.
Government organizations are to collaborate with private sector for the production of
the high yielding hybrid varieties.
Evaluation of vegetable seed will be done in every two years
Keeping buffer stock of the seed will be institutionalized.
Construction and handing over of seed processing and testing lab and store to the
farmers of the pocket area where production is fairly high enough to enhance export
quantity.
Regular and effective technical support will be offered at doorstep.
Long term and short term training to farmers and workers will be conducted.
Gender issues is to be consider for effective implementation of the program
Vegetable policies
Demand and supply projections
A major effort was made recently to project the demand and supply of vegetables and potato
for the country to the year 2010. The Master Plan for Horticulture Development was prepared
in 1991 by Pacific Management Resources Inc., USA, and the East Consult (P) Ltd, Nepal, for
the Government of Nepal and the Asian Development Bank. This study estimated current per

241
capita consumption levels for subsistence and commercial consumers for 28 individual
vegetable species. Assumptions were made about changes in consumption patterns associated
with a shift toward urban living and cash economy and about population growth. Using these
data, production targets were computed and various strategies and programs were identified to
achieve the production targets.
Input subsidy policy
The government provides price and transportation subsidies on fertilizer with the objective of
increasing food production through lowering farmers' costs. However, Agricultural Input
Corporation is unable to import enough fertilizer to meet farmers' demand. In addition,
continuation of the subsidy encourages unauthorized cross-border movement of fertilizer
(Wallace 1986; Crown Agents 199 1). Government of Nepal provides a transportation subsidy
for remote Hill districts. Various studies have shown that the availability of fertilizer is a
greater constraint than is price.
Underdeveloped markets for inputs
Distribution systems and markets for fertilizers, pesticides, seeds, and other inputs are well
established in Kathmandu valley but perfect coordination is still to be set. In the absence of a
good network of dealers and cooperatives, farmers have to travel long distances to purchase
these inputs. Moreover, inputs are not available at the right time and in the quantities required.
Lack of credit
Studies show that only 24% of the farm families who took loans, obtain them from institutional
sources, where as rest have to use the non-formal sector (NRB 1980). Among those who
borrow from institutional sources, large farmers have better access to such credit than small
and marginal farmers. Time consuming procedure and provision are situations which require
simplification.
Poor irrigation facilities
Most of the farmers have used groundwater schemes, particularly shallow tube wells, for
vegetable production. New and buildup irrigation channels are not distributed through out the
area however traditional channels, called Raj-Kulo become worn out, which was not
maintained. No proper mapping and maintenance program has been put forward

242
Shortage of good quality seeds
Climatically adapted and disease-free seeds or seedlings are not usually available in
Kathmandu. Many studies have shown that seed production in Nepal is profitable. However,
seed production has been limited due to several constraints, including an unfavorable policy
environment. There is a need for comprehensive study about the requirement of the seed for the
specific region needs to be done. Then the action should be initiated to alleviate these
constraints.
Support for the cold storage industry
Poor performance of the cold storage in the Kathmandu valley is the result not only of technical
factors, such as design and construction defects and the small size of operations, but also of
government policies. For example: cold stores in Nepal are listed as industries and do not
qualify for the special provisions given to agro-based industries, such as tax holidays, low
interest rates, and lower electricity tariffs. Electricity charges for cold storage do not take into
account off-peak-hour facilities. The system needs to be developed.
Trade restrictions
Although the Municipality Act of 1992 clearly specifies that agricultural produce brought into
municipal areas for commercial purposes is to be charged in total at 1% of the value of the
goods, some municipalities are charging different rates. These lead to unnecessary cost and
delay. Vegetable exports from Nepal are subjected to ad hoc valuation and exporters face
harassment by municipal authorities because such supplies do not possess official valuation
papers, unlike supplies coming from India which carry official receipts given by customs
offices.
Pesticide regulations
Studies show that there is indiscriminate and heavy use of broad-spectrum pesticides on
vegetable crops all over Nepal (Baker and Gyawali 1994). Farmers continue to use dangerous
chemicals, such as organochlorines and organophosphates. According to a survey of farmers
who had been using pesticides for over five years, more than 60% waited less than two weeks
between spraying and harvesting the crop. This has led to increased health hazards, particularly
in urban areas like Kathmandu valley. On the production front, regular misuse of broad-
spectrum pesticides has resulted in resistance of pests to pesticides, resurgence of pests, and
secondary pest outbreaks. However, the government enacted the Pesticides Act in 1992, and

243
the Act has been promulgated. An effective implementation of the act is an urgent need in the
Kathmandu valley and suburb areas.
Exchange rate policy
Nepal has a floating exchange rate with other currencies, but a fixed exchange rate with the
Indian currency. Higher inflation and lower growth in factor productivity in Nepal compared to
India is making Nepal's exports to India uncompetitive (Sharma 1994). On the other hand,
Indian agricultural products, including fresh vegetables, are competing with Nepali produce in
Nepali markets. The uncontrolled flow of about 14% of total vegetable entered in Kathmandu
valley from India results in un-remunerative farm-gate prices of vegetables in Nepal,
particularly during peak production. On the other hand, off-season supplies mostly come from
India, and fetch good prices in Nepal.
Inadequate marketing support system
There has to be good extension system for the dissemination information regarding new
production technology to farmers, post-production aspects, information on markets, volume of
arrivals or prices offered, and development of a support system, etc. (Pun 1987This has
resulted in an inefficient market system, where marketing margins are excessive and losses in
the system are enormous. The government should work as a facilitator in creating infrastructure
and in providing market information to mitigate these problems.
Future Research Priorities
Biophysical research
Several studies have identified important biophysical research priorities for Nepal (Rekhi et al.
1990; Shah 1990). Some of these priorities are:
1. Breeding of varieties suitable for the different farming systems in Nepal
2. Improvement of traditional vegetables so far neglected by the national and international
research systems
3. Development of appropriate post-harvest and processing technologies
4. Production of high-quality seeds both for domestic and export markets
5. Collection, conservation, and utilization of local genetic resources
6. Development of varieties suitable for off-season vegetable production
7. Development of crop production technologies with emphasis on the time and method of
planting, plant production, weed control, fertilizer management, and pest control
8. Species purification and maintenance.

244
STATEMENT OF ORIGINALITY
This dissertation report submitted to the Faculty of Agriculture and Horticulture at Humboldt
University of Berlin for fulfillment of the requirements for the degree of PhD of Science in
Agriculture is the original work of the author, except as otherwise stated. I declare that this
has not been previously submitted for similar degree to any university. I therefore, certify
that although I may have conferred with others in preparing for this assignment and drawn
upon a range of sources cited in this work, the content of this thesis report is my original
work.
…………………….
Nabarath Baniya
Berlin, July 2008