Mineral Management in African Indigenous Vegetable ...
180
Mineral Management in African Indigenous Vegetable Production Systems D I S S E R T A T I O N For obtaining the academic degree Doctor of Philosophy (Ph.D.) Submitted to the Faculty of Life Sciences of the Humboldt-Universität zu Berlin By Godfrey Nakitare Nambafu President of Humboldt-University of Berlin: Prof. Dr.-Ing. Dr. Kunst Dean of the Faculty of Life Sciences: Prof. Dr. Grimm Doctoral Degrees Committee 1. Prof. Dr. Christof Engels 2. Prof. Dr. Andreas Bürkert Date of disputation: 06.07.2018
-
Upload
khangminh22 -
Category
Documents
-
view
4 -
download
0
Transcript of Mineral Management in African Indigenous Vegetable ...

Mineral Management in African
Indigenous Vegetable Production Systems
D I S S E R T A T I O N
For obtaining the academic degree Doctor of Philosophy (Ph.D.)
Submitted to the Faculty of Life Sciences of the Humboldt-Universität zu Berlin
By Godfrey Nakitare Nambafu
President of Humboldt-University of Berlin: Prof. Dr.-Ing. Dr. Kunst
Dean of the Faculty of Life Sciences: Prof. Dr. Grimm
Doctoral Degrees Committee
1. Prof. Dr. Christof Engels
2. Prof. Dr. Andreas Bürkert
Date of disputation: 06.07.2018

ii
Acknowledgements
I would like to gratefully acknowledge the guidance and supervision of Prof. Dr. Christof
Engels. It is through his corrections, criticism and guidance that I was able to write this
scientifically well formulated document. I am also indebted to Dr. Joseph Patrick Onyango
Gweyi, for his advice towards my PhD work and not forgetting Holger Besser and Annika
Nerlich for their mentorship during my stay in Berlin.
Deserving of special mention is HORTINLEA (Horticultural Innovation and Learning for
Improved Nutrition and Livelihood in East Africa) research project, for their financial support
and skills accorded throughout my study period in Germany and Kenya.
I am also thankful to my late dad, Abel Nambafu and mum, Scholastica Namalwa for their
spiritual support and motivation. Not to forget my wife, Naomi Kollongei and my two
daughters Melony Sipha and Ruby Zawadi for their prayers, moral support and
encouragement.

iii
Table of Contents
Acknowledgements ................................................................................................................ ii
List of tables ......................................................................................................................... vii
List of figures ......................................................................................................................... x
List of abbreviations ............................................................................................................. xii
Abstract ............................................................................................................................... xiv
Chapter 1: General Introduction ............................................................................................. 1
1.1 Food production and soil fertility status .................................................................. 1
1.2 Human health, nutrition and risks associated with crop production............................. 2
1.3 African indigenous vegetables in Sub Saharan Africa ................................................. 3
1.4 Growth of AIVs in Kenya and their importance .......................................................... 3
1.5 Interest in AIVs ............................................................................................................ 4
1.6 Aims.............................................................................................................................. 5
Chapter 2: Nutritional value of AIVs ..................................................................................... 7
2.1 Nutritional value of AIVs: Essential element concentrations of samples from open air and
supermarkets in Nairobi ......................................................................................................... 7
2.1.1 Abstract ...................................................................................................................... 7
2.1.2 Introduction ............................................................................................................... 8
2.1.2.1 Food security and nutrition ................................................................................. 8
2.1.2.2 Essential elements in AIVs and their importance in addressing hidden hunger . 9
2.1.2.3 Aims .................................................................................................................. 10
2.1.3 Materials and methods ............................................................................................. 10
2.1.3.1 Study area .......................................................................................................... 10
2.1.3.2 Sampling size .................................................................................................... 11
2.1.3.3 Collection of fresh vegetable samples .............................................................. 11
2.1.3.4 Pretreatment and washing of fresh vegetable samples ..................................... 12
2.1.3.5 Sample digestion and laboratory analysis ......................................................... 13
2.1.3.6 Statistical data analysis ..................................................................................... 13
2.1.4 Results and discussion ............................................................................................. 13
2.1.4.1 Differences among species in concentration of essential elements .................. 13

iv
2.1.4.1.1 Differences among species in the concentration of macro elements absorbed by
plants as cations ............................................................................................................ 14
2.1.4.1.2 Differences among species in the concentration of macro elements absorbed by
plants as anions ............................................................................................................. 17
2.1.4.1.3 Concentration of micro elements in vegetable species .................................. 19
2.1.4.2 Effects of markets on essential element concentrations in vegetable species .. 25
2.1.4.2.1 Effects of markets on macro element concentrations in vegetables species .. 25
2.1.4.2.2 Effects of market on micro element concentration in vegetable species ....... 27
2.1.4.3 Effect of seasons on concentration of essential elements in vegetable species 29
2.1.4.3.1 Effects of seasons on macro element concentrations in vegetable species .... 29
2.1.4.3.2 Effects of seasons on micro element concentrations in vegetable species .... 31
2.1.5 General discussion and recommendation ................................................................ 33
2.1.5.1 To what extent can our data concerning differences among species in the
concentrations of macro- and micro elements be generalized? .................................... 33
2.1.5.2: Can AIVs substantially contribute to dietary element supply? ........................ 35
2.2 Nutritional value of AIVs: Heavy metal concentrations of samples from open air and
supermarkets in Nairobi .................................................................................................... 39
2.2.1 Abstract .................................................................................................................... 39
2.2.2 Introduction ............................................................................................................. 40
2.2.2.1 Heavy metals, their sources and effects to humans .......................................... 40
2.2.2.2 Accumulation of heavy metals in plants ........................................................... 40
2.2.2.3 Aims .................................................................................................................. 41
2.2.3 Materials and methods ............................................................................................. 41
2.2.4 Results and discussion ............................................................................................. 41
2.2.4.1 Differences among species in the concentration of heavy metals .................... 41
2.2.4.2 Effects of market types on heavy metal concentrations in vegetable species ... 44
2.2.4.3 Effects of seasons on heavy metal concentration in vegetables species ........... 46
2.2.5 General discussion and recommendation ................................................................ 50
Chapter 3: Phosphorus use strategies of leafy vegetables: Responses of species to different
rates and forms of phosphorus supply .................................................................................. 53
3.1 Abstract ....................................................................................................................... 53
3.2 Introduction ................................................................................................................ 54

v
3.2.1 Soil phosphorus pools and their availability to plants ......................................... 54
3.2.2 Plant traits relevant to soil phosphorus acquisition .............................................. 55
3.2.3 Soil phosphorus status in small holder farming systems in sSA ......................... 56
3.2.4 Aims ..................................................................................................................... 56
3.3 Material and methods ................................................................................................. 57
3.3.1 Study area ............................................................................................................. 57
3.3.2 Experimental design ............................................................................................. 57
3.3.3 Substrate and pots ................................................................................................ 59
3.3.4 Planting, watering and general plant management .............................................. 59
3.3.5 Measurement of biomass ..................................................................................... 60
3.3.6 Analysis of morphological root traits .................................................................. 60
3.3.7 Chemical analysis ................................................................................................ 61
3.3.8 Calculation of apparent, relative and internal phosphorus use efficiency ........... 61
3.3.9 Statistical analysis ................................................................................................ 61
3. 4 Results and discussion ............................................................................................... 62
3.4.1 Effect of P treatments on yield (shoot fresh mass) .............................................. 62
3.4.2 Effect of P treatments on shoot and root (total biomass) biomass ....................... 66
3.4.3 Effect of P treatments on shoot and root P concentrations and plant P accumulation
....................................................................................................................................... 68
3.4.4 Morphological root traits ..................................................................................... 74
3.4.5 Rhizosphere pH levels ......................................................................................... 82
3.5 General discussion and recommendation ................................................................... 84
Chapter 4: Quantification of nutrient fluxes in AIVs: Effects of species, harvesting techniques
and production systems on nutrient export from soil ........................................................... 86
4.1 Abstract ....................................................................................................................... 86
4.2 Introduction ................................................................................................................ 87
4.2.1 Soil fertility status of small holder farming systems in sub-Saharan Africa ....... 87
4.2.2 Aims ..................................................................................................................... 89
4.3 Materials and methods ................................................................................................ 91
4.3.1 Study area ............................................................................................................. 91
4.3.2 Experimental design ............................................................................................. 91
4.3.3 Crop establishment and management .................................................................. 92

vi
4.3.4 Harvesting procedures ......................................................................................... 93
4.3.5 Laboratory analysis .............................................................................................. 94
4.3.6 Calculations and Statistics ................................................................................... 94
4.3.7 Data analysis ........................................................................................................ 96
4.4 Results ........................................................................................................................ 96
4.4.1 Yield of edible plant organs ................................................................................. 96
4.4.2 Biomass partitioning between edible organs and non-edible organs ................... 98
4.4.3 Nitrogen concentration in different organs ........................................................ 100
4.4.4 Effects of production systems and harvesting techniques on nutrient fluxes from
soil to market ............................................................................................................... 102
4.4.5 Potential for saving nutrients in batch and continuous systems through optimization
of harvest technique .................................................................................................... 118
4.5 Discussion ................................................................................................................. 120
4.5.1 Effect of species, harvest technique and production system on nutrient fluxes from
soil to market ............................................................................................................... 120
4.5.2 Fertilizer demand of vegetable species relative to maize .................................. 124
4.6 Conclusion and recommendation ............................................................................. 127
5.0 Summary ...................................................................................................................... 129
6.0 References .................................................................................................................... 138
Declaration ......................................................................................................................... 165

vii
List of tables
Table 2.1: Number of samples of vegtable species collected in open air and supermarkets
during the dry and wet season .............................................................................................. 11
Table 2.2: Collected vegetable species in open air and supermarkets during the dry and wet
season ................................................................................................................................... 12
Table 2.3: Concentrations of macro elements taken up as cations in vegetable species s ... 16
Table 2.4: Concentrations of macro elements taken up as anions in vegetable species. ..... 19
Table 2.5: Concentrations of micro elements Fe, Zn, Cu and Mn in vegetable species. ..... 21
Table 2.6: Reduction of micro element concentrations in percent (%) by washing vegetable
species with water. ............................................................................................................... 24
Table 2.7: Effects of market type on concentrations of macro elements in vegetable species26
Table 2.8: Effect of market type on concentrations of micro elements in vegetable species28
Table 2.9: Effect of seasons on concentrations of macro elements in vegetables species ... 30
Table 2.10: Effect of seasons on concentrations of micro elements in vegetable species ... 32
Table 2.11: Recommended daily nutrient intakes (RNI) of elements for different age groups
.............................................................................................................................................. 35
Table 2.12: Potential contribution of vegetable species to dietary element supply ............ 36
Table 2.13: Potential ontribution of a daily dish of 400 g fresh mass of various vegetable
species to the daily recommended intake of mineral elements (RNI) .................................. 37
Table 2.14: Concentration of heavy metals in vegetable species ......................................... 42
Table 2.15: Effects of market type on concentrations of heavy metals in vegetable species.45
Table 2.16: Effects of seasons on concentrations of heavy metals in vegetable species. .... 46
Table 2.17: Reduction of Cd and Pb concentrations in percent due to washing vegetable
species with water.. .............................................................................................................. 49
Table 2.18: Potential Cd and Pb intake ................................................................................ 51
Table 3.1: Plant traits related to P efficiency for different forms of soil P .......................... 55
Table 3.2: Macro nutrients applied at the start of the experiment ........................................ 59
Table 3.3: Effect of P-treatment on shoot fresh mass of different vegetable species .......... 64
Table 3.4: Suitability of different P sources for yield production in vegetables .................. 66
Table 3.5: Effect of P-treatment on total dry mass (g plant -1) of different vegetable species67
Table 3.6: Effect of P-treatment on shoot P concentration in different species of AIVs ..... 69
Table 3.7: Effect of P-treatment on root P concentration in different species of AIVs ....... 70
Table 3.8: Effect of P-treatment on P accumulation in different AIV species ..................... 71

viii
Table 3.9: Effect of species and P treatment on internal P utilization efficiency in different
AIV species .......................................................................................................................... 73
Table 3.10: Effect of P-treatment on root length to shoot biomass ratio of different vegetable
species .................................................................................................................................. 75
Table 3.11: Effect of P-treatment on specific root length of different AIV species ............ 76
Table 3.12: Effect of P-treatment on root diameter of different AIV species ...................... 77
Table 3.13: Effect of P-treatment on root hair density of different AIV species ................. 79
Table 3.14: Effect of P-treatment on soil leachate pH of different AIV species ................. 82
Table 4.1: Major crops in Kenya and their N, P, K contents in harvested organs and crop
residues and removal factors. ............................................................................................... 90
Table 4.2: Weather information for the months June to September 2015 ........................... 91
Table 4.3: Initial soil chemical and physical properties of the field experiment site ........... 91
Table 4.4: Sketchy representation of field experiment plots ................................................ 92
Table 4.5: Planting time and spacing of each vegetable species grown in the field ........... 93
Table 4.6: Number of harvested plants per plot and cultivation period until harvest .......... 94
Table 4.7: Temperature sums during the first, second, and third growth cycle of AIVs ..... 95
Table 4.8: Species-specific coefficients used to calculate the expected yields for harvests 2
and 3 in batch system ........................................................................................................... 95
Table 4.9: Fresh mass of edible organs (leaves and laterals) of vegetable species .............. 97
Table 4.10: Dry mass of various plant organs in batch production system ......................... 99
Table 4.11: Dry mass of various plant organs in continuous production system ............... 100
Table 4.12: Nitrogen concentration in plant organs of vegetable species under batch
production system .............................................................................................................. 101
Table 4.13: Nitrogen concentration in plant organs in the continuous production system 102
Table 4.14: Yield-based nitrogen removal with harvested plant organs from soil to market as
affected by species, production system and harvest method .............................................. 104
Table 4.15: Yield-based phosphorus removal with harvested plant organs from soil to market
as affected by species, production system and harvest method. ........................................ 107
Table 4.16: Yield-based potassium removal with harvested plant organs from soil to market as
affected by species, production system and harvest method. ............................................. 109
Table 4.17: Yield-based sulphur removal with harvested plant organs from soil to market as
affected by species, production system and harvest method t ............................................ 112
Table 4.18: Yield-based magnesium removal with harvested plant organs from soil to market
as affected by species, production system and harvest method ......................................... 114

ix
Table 4.19: Yield-based calcium removal with harvested plant organs from soil to market as
affected by species, production system and harvest method .............................................. 117
Table 4.20: Nutrient ratio in maize and vegetable species ................................................. 125

x
List of figures
Figure 2.1: Box plots showing, minimum, first quartile, median, third quartile and maximum
potassium (a), magnesium (b) and calcium (c) concentration levels ................................... 15
Figure 2.2: Box plots showing, minimum, first quartile, median, third quartile and maximum
phosphorus (a) and sulphur (b) concentration levels ........................................................... 18
Figure 2.3: Box plots showing, minimum, first quartile, median, third quartile and maximum
iron (a), zinc (b), copper (c) and manganese (d) concentration levels ................................. 20
Figure 2.4: Relationship between Al and Fe concentrations in vegetables. ……………...24
Figure 2.5: Box plots showing, minimum, first quartile, median, third quartile and maximum
cadmium (a) and lead (b) concentration levels .................................................................... 42
Figure 2.6: A line graph showing the distribution of samples based on concentrations of
cadmium and lead measured in vegetable species. .............................................................. 44
Figure 2.7: Relationship between Al and lead Pb in vegetable samples collected in the
markets. ................................................................................................................................ 48
Figure 2.8: Relationship between aluminum and Cd concentrations in vegetable samples
collected in the markets ........................................................................................................ 48
Figure 3.1: Arrangement of pots in the glass house ............................................................. 58
Figure 3.2: Appearance of vegetable species 4 weeks after sowing.. .................................. 63
Figure 3.3: Visual representation of root hairs as seen under a microscope with lens diameter
of 1 and 2 mm. ...................................................................................................................... 80
Figure 3.4: Effect of P treatments on the root system of various species ............................ 81
Figure 4.1: Soil nutrient input and output pathways in agricultural production systems..... 89
Figure 4.2: Plant organs that transported to the market and those left in the soil. ............... 98
Figure 4.3: Effect of harvest technique and production system on N export from soil to market
in different vegetable species ............................................................................................. 105
Figure 4.4: Effect of harvest technique and production system on P export from soil to market
in different vegetable species ............................................................................................. 108
Figure 4.5: Effect of harvest technique and production system on K export from soil to market
in different vegetable species ............................................................................................. 110
Figure 4.6: Effect of harvest technique and production system on S export from soil to market
in different vegetable species ............................................................................................. 113
Figure 4.7: Effect of harvest technique and production system on Mg export from soil to
market in different vegetable species ................................................................................. 115

xi
Figure 4.8: Effect of harvest technique and production system on Ca export from soil to
market in different vegetable species ................................................................................. 118
Figure 4.9: Amount of nutrients saved on export to the market when harvest method changed
from pulling to picking in the batch system. . .................................................................... 119
Figure 4.10: Amount of nutrients saved on export to the market when harvest method changed
from pulling to picking in the continuous system .............................................................. 120
Figure 4.11: Nutrient export in maize and vegetable species within 120 days of growth. 127

xii
List of abbreviations
AIVs – African Indigenous Vegetables
Al – Aluminum
ANOVA – Analysis of Variance
ASDSP – Agricultural Sector Development Support Programme
AVRDC – World Vegetable Center
Ca – Calcium
Cd – Cadmium
CODEX – Codex Alimentarius collection of food standards
Cu – Copper
DAP – Days after planting
DAS – Days after sowing
DMRT – Duncan Multiple Range Test
EFSA – European Food Safety Authority
FAO – The Food and Agriculture Organization of the United Nations
Fe – Iron
FePO4 – Iron phosphate
Fig. – Figure
g – Grams
GDP – Gross domestic product
GOK – Government of Kenya
Ha – Hectares
HNO3 – Nitric acid
ICP – OES – Inductively Coupled Plasm with optical Emission Spectroscopy
IPUE – Internal Phosphorus Use Efficiency
JECFA – Joint Expert Committee on Food Additives
K – Potassium
Kg – Kilograms
KH2PO4 – Potassium phosphate
KNBS – Kenya National Bureau of Statistics
m – Meters
Mg – Magnesium
Ml – Milliliter
mm – Millimeters

xiii
Mn – Manganese
N – Nitrogen
P – Phosphorus
Pb – Lead
Rock P / CaPO4 – Rock Phosphate fertilizer
RSA – Research Solution Africa
S – Sulphur
sSA – Sub-Saharan Africa
Ton – Tonnes
TP – Transplanting
UNESCO – United Nations Educational, Scientific and Cultural Organization
WHO – World Health Organization
Zn – Zinc

xiv
Abstract
African Indigenous Vegetables (AIVs) have recently captured considerable attention as
“super vegetables” due to their nutritional and environmental benefits (Cernansky 2015). As
AIVs include many species belonging to different botanical families, more species-specific
knowledge e.g. on nutritional value and agronomic management is needed to fully exploit
those benefits. In this thesis we compared leafy AIV species from five families including C3
and C4 species, and a legume and non-legume species (Brassica carinata/Cruciferae -
Ethiopian kale, Amaranthus cruentus/Amaranthaceae - amaranth, Vigna
unguiculata/Leguminosae cowpea, Solanum scabrum/Solanaceae - African nightshade,
Cleome gynandra/Capparaceae - spider plant) with a non-indigenous species, which is
commonly grown in Kenya (Brassica oleracea acephala/Cruciferae - “exotic kale”). We
compared the leaf concentrations of beneficial nutrients and heavy metals as an index for the
nutritional value, the performance under different rates and forms of phosphorus (P) supply as
an index for adaptation to suboptimal chemical soil conditions, and the harvest-related
nutrient outflow from soil as an index for fertilizer need. The thesis was embedded in the
interdisciplinary research program HORTINLEA (Horticultural Innovation and Learning for
Improved Nutrition and Livelihood in East Africa).
Keywords: African Indigenous Vegetables, nutritional value, Phosphate availability, nutrient
export

xv
Abstract (German)
Durch ihre Umwelt- und Nährwertvorteile erweckten Afrikanische indigene Blattgemüse –
„African Indigenous Vegetables“ (AIV) in letzter Zeit Aufmerksamkeit als „Supergemüse“
(Cernansky 2015). Da mehrere Spezies aus unterschiedlichen botanischen Familien innerhalb
der AIVs vertreten sind, ist ein besseres Verständnis Spezies spezifischer Eigenschaften, wie
z.B. Ernährungswert und agronomischem Management nötig, um diese Vorteile voll
ausschöpfen zu können. In dieser Arbeit haben wir Afrikanisch indigene Blattgemüsearten
aus fünf Familien, inklusive C3 and C4 Spezies und Leguminosen und nicht-Leguminosen
(Brassica carinata/Cruciferae - Ethiopian Kale, Amaranthus cruentus/Amaranthaceae -
Amaranth, Vigna unguiculata/Leguminosae - Cowpea, Solanum scabrum/Solanaceae -
African Nightshade, Cleome gynandra/Capparaceae - Spiderplant) mit einer importierten und
in Kenia häufig angebauten Gemüseart (Brassica oleracea acephala/Cruciferae - Exotic Kale)
verglichen. Wir betrachteten die Pflanzenarten hinsichtlich ihrer Konzentrationen an
wertgebenden und toxischen Elementen in Blättern als Index für den Nährwert, ihrer
Reaktionen auf unterschiedliche zur Verfügung gestellten Mengen und Formen an Phosphor
(P) als Index für die Adaptation an suboptimale chemische Bodenbedingungen und ihre
erntebedingten Nährstoffausfuhren aus dem Boden als Index für den Düngerbedarf. Die
Arbeit war in das interdisziplinäre Forschungsprogramm HORTINLEA (Horticultural
Innovation and Learning for Improved Nutrition and Livelihood in East Africa) eingebunden.
Keywords: African Indigenous Vegetables, Ernährungswert, Phosphatverfügbarkeit,
Nährstoffausfuhr

1
Chapter 1: General Introduction
1.1 Food production and soil fertility status
Sub-Saharan African (sSA) is one of the regions in the world where people depend entirely on
agriculture for their livelihood. Agriculture has largely contributed to sSA’s Gross Domestic
Product (GDP) but food production in this region still lags behind. The region is one of the
poorest, whose per capita income in 2010 stood at $688 compared to $1717 in other
developing countries (Chauvin et al. 2012). With a rapidly growing population in sSA, nearly
one third of the population is food insecure leading to cereal imports increasing to about 25%
by early 2000s (De Graaff et al. 2011).
Food production in sSA is negatively affected by land degradation with high levels of soil
mining and very low fertilizer application in agriculture (Stoorvogel and Smaling 1990; Hengl
et al. 2017). Low soil fertility has an impact on vegetable and grain crop production in this
region, hence vegetable availability is far below 150 kg per capita per year (Ganry 2009).
Currently, the soil nutrient balance in sSA, both at regional and national levels, shows a
general deficit of soil minerals, especially phosphorus, in cropland soils (MacDonald et al.
2011) alongside other nutrients like nitrogen and potassium. The average mineral loss was
estimated to be 660 kg N, 75 kg P, and 450 kg K ha-1 year-1 in 0.2 billion hectares of
cultivated land in 37 countries of Africa (Stoorvogel and Smaling 1990; Sanchez et al. 1997).
Losses of up to 130 kg N, 5 kg P and 25 kg K ha-1 year-1 were reported in East Africa
(Smaling et al. 1996).
Different soil properties have led to nutrient gradients in soils at the county level, sub-county
level and villages. Additionally the socio-economic status of the farmers (wealth) influences
the farming systems used and thereby nutrient gradients within farms or even individual field
levels (Haileslassie et al. 2005). Other factors include the previous and current ground/ field
cover, which is related to the crop species and production strategies employed in the
management of the plants and the soil. Most of the soil nutrients are lost through harvested
crop organs and crop residues, which can be quantified with modeling (Faerge and Magid
2004). These harvested organs are mostly the basis of human nutrition. Nevertheless, it should
be noted that these nutrients were obtained from the soil and need to be replaced for
sustainable crop production.
Soil nutrients like P, may also be limited or unavailable due to acidic nature of some soils in
sSA, phosphate is bound in Fe- and Al-phosphates, which reduce P availability for plants. For

2
this case, production of vegetables with high uptake and internal P utilization may be
advantageous. Plant species exist, which developed different adaptive traits for P deficiency,
which might mobilize P out of adsorbed P fractions (Schnug and Haneklaus 2016). The use of
such plants may reduce the application of P fertilizer and thus cut down the cost of food
production and reduce environmental damages as a result of eutrophication.
1.2 Human health, nutrition and risks associated with crop production
Human health is associated with food. Food should provide the required minerals and
vitamins that the body needs to perform effectively. Due to poverty and suboptimal
production of food, the majority of people, especially children, are malnourished in sSA,
Malnutrition includes micronutrient deficiencies, under-nutrition and hunger (Fanzo 2012).
Lack of vitamin A and minerals like Ca, Mg, Fe and Zn are widespread among people in this
region. Africa records for about 10 % of wasting, 25 % of underweight and 39 % of stunted
growth in children aged below five years with sSA accounting for one third of all
undernourished children globally, by 2015 (Akombi et al. 2017). This problem might be
solved by promoting the consumption of vegetables rich in nutrients, which are found in sSA
by all individuals despite the economic or social class. Consumption of vegetables in sSA has
been declining over the past years due to preference for starchy plant products that quickly
satisfy hunger and provide required energy (Chauvin et al. 2012). African indigenous
vegetables (AIVs) are known to contain higher levels of vitamins, minerals and have
medicinal properties (Makokha and Ombwara, 2005). Until now AIVs have been under-
utilized and yet they can be the preferred remedy to address the mentioned health problems.
In addition, heavy metal contamination is also rampant in agricultural crops, especially in
urban and peri-urban areas. Heavy metals, e.g. cadmium and lead are of environmental
concern and continuous uptake of these metals within human diet is detrimental to human
health. Diseases associated with heavy metals include hemoglobin synthesis disorders,
nervous system diseases, cancer and kidney disorders (Okoronkwo et al. 2005; White 2012).
Crops growing in the farm are contaminated with heavy metals either through the systemic
pathway by uptake of heavy metals from soil solution by the roots or by adhering
contaminated soil or dust particles from atmosphere or contaminated water for irrigation
(Muchuweti et al. 2005; Kapungwe 2013; Kananke et al. 2014). Many leafy vegetables,
including AIVs, are super accumulators of anti-nutritional components like heavy metals
(Shackleton et al. 2009). Translocation and accumulation of these heavy metals to harvested
or edible plant parts depends on the plant genotype, climatic factors, soil characteristics and

3
agronomic management (McLaughlin et al 1999). Comparing the concentration of heavy
metals in vegetables with world health organization (WHO) maximal dietary weekly intake
limits of heavy metals is credible to avoid diseases.
1.3 African Indigenous Vegetables in Sub Saharan Africa
AIVs are leafy, domesticated vegetable species, that were in the past treated as ‘wild’ plants,
which make part of the diet in the rural, poor communities in Africa (Shackleton et al. 2009).
Sub-Saharan Africa is a renowned natural habitat for over 40,000 AIV species, out of these,
1,000 can be consumed as vegetables (Muhanji et al. 2011). In East Africa, the most
consumed ones are amaranth (Amaranthus sp), pumpkin leaves (Cucurbita sp), jute plant
(Corchorus molitorius), sunnhemp (Crotalaria brevidens), cowpea (Vigna sp), black
nightshade (Solanum nigrum), spider plant (Gynandropsis gynandra) and Ethiopian kale
(Brassica carinata) among many others.
Over long time, these vegetables have been associated with poverty and that’s why the rich
and middle class people rarely consumed them. Due to neglect, the production and
distribution of this vegetables across countries is too low (Habwe et al. 2008). With the
increase of diseases and malnutrition, indigenous vegetables are increasingly becoming
valued in sSA countries, among people of all cultures, traditions and religions (Smith and
Eyzaguirre 2007). Thus, the growth, distribution and utilization of these vegetables have to be
enhanced through research and innovation.
1.4 Growth of AIVs in Kenya and their importance
In Kenya, horticulture is among the leading contributors to the GDP accounting for 36%
(vegetables 36%, flowers 30%, fruits 26%, nuts 5% of domestic value) and 38% of export
earnings and continues to grow between 15 and 20% per year (HCD 2016). AIVs are among
major vegetables produced in Kenya, alongside tomatoes (Solanum lycopersicum), cabbages
(Brassica oleracea var. capitate), snow peas (Pisum sativum var. saccharatum), kales
(Brassica oleracea acephala), spinach (Spinacia oleracea), runner beans (Phaseolus
coccineus), French beans (Phaseolus vulgaris), carrots (Daucus carota), broccoli (Brassica
oleracea var. italic) and Asian vegetables (HCD 2016).
Indigenous vegetables have contributed immensely to human diet in Kenya although a large
population preferred exotic vegetables like spinach, cabbage and exotic kales. The vegetables
are majorly grown in Kisii, Kakamega, Nakuru and Kiambu County. Recently, most people
are purchasing traditional vegetables for consumption (Ngugi et al. 2007). The demand is also

4
high in Kenya’s bigger and smaller towns as well as in Uganda and Tanzania (Weinberger
and Msuya 2004). Nevertheless, communities are still selective in vegetables they eat based
on their culture and availability. High consumption has led to high demand of AIVs (Shiundu
and Oniang’o, 2007; Habwe, 2008).
The vegetables are able to tolerate diseases, harsh climatic conditions and easily adapt to local
atmospheric conditions, hence can be grown throughout the seasons. The growing of
vegetables can be a better source of income and employment especial in rural areas (Muhanji
et al. 2011). The raising status of AIVs will highly contribute to alleviation of food insecurity,
malnutrition and poverty in Kenya and other countries in sub-Saharan Africa.
1.5 Interest in AIVs
Enhancement of soil fertility levels results in high vegetable yield on poor soils. Most farmers
add organic and inorganic fertilizers to replenish their soils nutrients, but the amounts are far
below the recommended ones. At some point the recommended levels are not species-specific
(Shackleton et al. 2009), since species differ in amount and form of nutrients required. Some
species might use different nutrient forms more efficiently than other species, e.g. P in form
of rock P or Fe-P or are able to tolerate deficiency and yield more than the other species.
Regarding AIVs, there is less information regarding their ability to perform under different
forms of essential nutrients and their ability to perform well under nutrient deficiency.
Furthermore, there is no information on fertilizer recommendations that match the amount of
nutrients taken out through harvesting of these species. Since, agronomic practices like
harvesting techniques and production systems differ among farmers, they were used in our
study to generate information that can be important to policy makers, extension officers and
farmers. It would be important to identify:
i) AIV species with highest P use efficiency
ii) AIV species removing less minerals from the soils although producing sufficient edible
biomass and
iii) Which production or harvesting system removes fewer minerals from soil.
Most people in sSA consider AIVs to be of less value since they have no information on their
nutritional value (Kamga et al. 2013). People regard AIVs as poor or low status food for
people who cannot afford ‘proper’ (exotic) vegetables and fruits. Shackleton et al. (2009),
states that AIVs are vital food components of human diets and they possess essential
nutritional value for the development and better health of the human body. The amount of
distinct nutrients present in each species tested will act as a basis for nutritionist to be able to

5
adequately instruct people (patients) on the number of times a week a patient has to eat a
particular vegetable(s) in order to get required nutrients. There has been a general notion that
AIVs are sources of essential minerals, but less information is available on which species is
best suited in addressing certain deficiency or health problems.
Improper packaging, transportation and poor handling of AIVs at the market place may result
in heavy metal contamination. In the urban and peri-urban areas, pollutants, which may
contain heavy metals from industrial, commercial, residential and other urban activities are of
environmental concern and may be found in the vegetables. It was important to know, which
AIVs accumulate less heavy metals. There was need to distinguish between the contaminants
adhering on particulates from the atmosphere and those that are taken up by the AIVs during
growth to advice consumers and traders on proper way of handling vegetables before
consumption and farmers for consideration of planting site and species before planting
vegetables.
1.6 Aims
Our study was an integral part of the HORTINLEA (Horticultural Innovation and Learning
for Improved Nutrition and Livelihood in East Africa) research project. HORTINLEA is an
interdisciplinary research program with the purpose of addressing food security in East
Africa, particularly in Kenya and Tanzania. The main aim of the program was to improve
peoples’ livelihood and nutritional situation among rural and urban poor. In order to address
these problems, HORTINLEA used an integrated approach that targeted the entire food chain
(from production to consumption) of AIVs. This resulted in the formation of 14 sub-projects
whereby our research work was part of the first three subprojects that addressed problems in
production of AIVs. Our subproject (subproject 3) looked at soil related issues affecting
production with a main focus on five AIVs namely Solanum scabrum, Amaranthus cruentus,
Vigna unguiculata, Cleome gynandra and Brassica carinata. An exotic vegetable, Brassica
oleracea acephala, species was also included in the study for comparison purpose.
The main objective of subproject 3 was to provide knowledge and information on species-
specific nutrient requirements and vegetable nutrient composition with regard to essential and
heavy metals. The specific objectives addressed in this study are:

6
To assess phosphorus use strategies of leafy vegetables: Responses of species to different
rates and forms of phosphorus supply
To quantify nutrient fluxes in AIVs: Effects of species, harvesting technique and production
system on nutrient export from soil
To assess nutritional value of AIVs: Essential and heavy metal concentration from open air
and supermarkets in Nairobi
These objectives will be illustrated in chapter 2, 3 and 4 in more detail.

7
Chapter 2: Nutritional value of AIVs
This chapter was divided into two sections; the first section is dealing with essential macro
and micro elements, and the second section with heavy metals.
2.1 Nutritional value of AIVs: Essential element concentrations of samples from open air
and supermarkets in Nairobi
2.1.1 Abstract
Deficiency of macro elements such as calcium (Ca) and micro elements like zinc (Zn) is
widespread in sub-Saharan Africa, particularly among the poor who strongly depend on staple
crops like maize and sorghum for food. Increasing diet diversity through utilization of AIVs
might be an option to reduce hidden hunger caused by macro and micro element deficiency.
In this study, essential elements were measured in edible plant organs of vegetables sold on
markets in Nairobi to assess potential health benefits associated with consumption of AIV.
Fresh samples of AIVs; African nightshade (Solanum scabrum), amaranth (Amaranthus
cruentus), cowpea (Vigna unguiculata), spider plant (Cleome gynandra), Ethiopian kale
(Brassica carinata) and a standard species commonly grown in Kenya, exotic kale (Brassica
oleracea acephala group) were collected from ten open air and five supermarkets. Macro
(potassium - K, phosphorus - P, magnesium - Mg, sulphur - S and calcium - Ca) and micro
(iron - Fe, zinc - Zn, copper - Cu and manganese - Mn) elements were measured.
The results showed that macro and micro element concentrations were similar in vegetable
species irrespective of the market type (open air or supermarkets). Element concentrations in
most vegetable species showed no differences between seasons, apart from K that showed
much higher concentration in the wet season than the dry season in all the species. Exotic
kale, Ethiopian kale and African nightshade had higher Fe concentrations in the wet season.
Vegetable species differed in the amount of element concentrations with amaranth having the
highest concentrations of K, Mg, Ca, Fe and Zn. Spider plant was higher in Ca, P and Cu, and
cowpea higher in Mn, while exotic kale showed higher concentrations of S and Ca. Among
the AIVs, cowpea was the species with the lowest concentration of most minerals including
K, Mg, P, S and Zn, whereas exotic kale was lower in most element concentrations compared
to AIVs.
Keywords: Hidden hunger, nutritional value, essential elements, external contamination

8
2.1.2 Introduction
2.1.2.1 Food security and nutrition
Nutrition is a broader term that means intake of food in relation to the body needs. Nutrients
needed are divided in to two broader groups namely macro nutrients, which include
carbohydrates, lipids and proteins, and micro nutrients (Mahan and Escott-Stump 2000).
Minerals that are needed by the body in large amounts are macro elements, while micro
elements are needed in trace amounts (FAO 2004a). Low dietary micro nutrient supply is
leading to malnutrition, which is commonly referred to as hidden hunger. Hidden hunger is a
major food security problem affecting millions of people across the world. Out of the 20 most
important human health risks/ problems world-wide, three are a result of macro and micro
element malnutrition (Stein 2010).
Malnutrition has become a global issue with under nutrition leading to death of millions of
children yearly (Ismail and Suffla 2013). Sub-Saharan Africa is among the regions, where
deficiency of macro elements such as calcium (Ca) and micro elements like zinc (Zn) is wide
spread (Caulfield et al. 2006). In Kenya, half of the population is unable to meet their
nutritional demands. AIVs are likely to provide the minerals/elements to counteract
deficiencies affecting millions of the population. In most African countries, Kenya included,
concentration has been focused on improving and increasing mechanisms for food availability
through innovative technologies with less concern on nutritional and health aspects, thus, high
quality nutritious food is now a challenge in Africa (Fanzo 2012). In Africa continent, about
40% of children under 2 years are persistently malnourished. This is not associated with the
quantity of food they are fed, but rather poor quality food. In a year, 10.8 million child deaths
occur globally, of which 19% of the deaths are associated with Fe, Zn, iodine and vitamin A
deficiencies. Generally, in developing countries, 54% of deaths in children is associated with
malnutrition (Bain et al. 2013). In addition, 2.2 billion people, particularly pregnant mothers
and children suffer from iron related anemia (Hart et al. 2005).
The consumption of indigenous species is low for the fact that most households are unable to
access them (Ekesa et al. 2009) due to low market availability. A study by RSA (2015), found
out that the most consumed leafy vegetables in Kenya’s big cities (Nairobi, Mombasa and
Nakuru) were exotic kale (42%), spinach (42%), cabbage (29%), leaf amaranth (16%),
African nightshade (12%), cowpea leaves (7%), whereas, Ekesa et al (2009), found cowpea
leaves (85%) followed by jute mallow (63.3%) to be the most consumed vegetables in rural
areas of western Kenya. The problem of malnutrition can be addressed through eating food

9
rich in nutrient elements like Mg and Fe. Although AIVs are said to be rich in macro and
micro elements like Ca, Mg, Fe and Zn, little information concerning their concentrations and
bioavailability exists.
2.1.2.2 Essential elements in AIVs and their importance in addressing hidden hunger
Vegetables form part of our daily food intake with dietary recommendation of 400g per day
per person (FAO 2005). Vegetables are known to be the reliable and accessible source of
energy based on their wide and easy availability. There are two groups of vegetables in sSA
i.e. exotic and indigenous vegetables. Exotic vegetables have outweighed traditional
vegetables in production and consumption in most countries in sSA. However, production and
consumption of AIVs in Kenya is increasing yearly (Habwe et al. 2008), since they are rich in
essential elements (Fe, Ca and zinc Zn), vitamins and they are highly medicinal effective
(Shackleton et al. 2009). They are also rich in antioxidants, e.g. ß-carotene, (Abukutsa 2010).
In human body, Fe is present in hemoglobin and is essential in the transportation of oxygen
from the lungs to the tissues. Its deficiency results in anemia. It is also a component of
enzyme systems. Zn is a co-factor for many enzymes that are responsible for tissue
differentiation and cellular growth. Its deficiency leads to stunted growth in children. Ca
being the most abundant element in the human body, helps in metabolic processes like muscle
contraction, cell adhesion, blood clotting, hormone and neurotransmitter release, skeletal
strength maintenance among other roles. Its deficiency leads to week bones and bleeding
disorders (Allen et al. 2006). Mg is a cofactor in over 300 enzyme systems that regulate
protein synthesis, diverse biochemical reactions, blood glucose control and pressure
regulation, muscles and nerve functions. Low Mg in the body has been associated with
chronic illness including coronary heart disease, osteoporosis, diabetes and hypertension
(Swaminathan, 2003). There are other essential elements, which are important to human
health although they are not deficient in the human body. These elements are K, P, S and Cu
whereby K is important in heart beat regulation and nerve conduction. Phosphorus provides
energy to the body, is mostly found in bones and teeth, and helps in body protein building,
while copper plays a vital role of incorporating iron in hemoglobin (Soetan et al. 2010).
To improve nutritional status of the people in sub-Saharan Africa, focus should be put on the
growth and high utilization of AIVs, among other strategies. The vegetables had been
neglected in the past, but considering their health aspects they could be a good remedy for
malnutrition problems in Africa.

10
2.1.2.3 Aims
In this study, we quantified the concentrations of essential macro- and micro elements in leafy
vegetables sold on markets in Nairobi with the aim to inform consumers and nutritionists
about the value of AIVs for meeting human element needs. Specifically, we were interested if
element concentrations are higher in AIVs than in “exotic kale” (Brassica oleracea acephala,
common name in Nairobi, Sukuma wiki).
We compared element concentrations of samples from supermarkets and open air markets. It
was assumed that there is quality control of vegetables sold in supermarkets not only with
respect to freshness and external quality, but also concerning field management. For example,
vegetables sold in supermarkets might have been mainly produced on fields supplied with
mineral fertilizers. In Kenya, mineral P-fertilizer is available in the form of super phosphates,
which contains Ca, P and S. Thus, we expected vegetables from supermarkets to contain
higher concentrations of Ca, P and S than vegetables from open air markets.
We collected vegetable samples from all 15 markets twice, in November 2014 and in June
2015. November-sampling falls in the dry, and June-sampling in the rainy season. We wanted
to know if element concentrations systematically vary with season. The availability of plant
elements in the soil is higher in wet than in dry soil, because element diffusion towards the
roots is increased (Kuchenbuch et al. 1986; Marschner, 1995). Thus, high element
concentrations in vegetables produced in the wet as compared to the dry season, were
expected.
2.1.3 Materials and methods
2.1.3.1 Study area
The study was done in Nairobi County, a county hosting the capital city of Kenya. The county
is located within 1°18'S and 36°45'E and covers an area of approximately 694.9 km2 with a
population of over 3 million people (KNBS, Kenya census 2010). The county has an altitude
of about 1798m (5899 ft.) and varying temperatures ranging from 12°C to 27°C annually. It
experiences a bimodal precipitation with an average annual rain fall ranging from 800 – 1,050
mm. The long rains are received in March and April while short rainy season comes between
November and December (JICA). This climate favours the growth of crops such as
vegetables, bananas (Musaceae sp.), irish potatoes (Solanum tuberosum), maize (Zea mays)
and coffee (Coffea sp.), that cover 9% of the area, (ASDSP 2015).

11
2.1.3.2 Sampling size
Big retail markets, selling vegetables to consumers and frequented by many buyers and sellers
were selected. The selected markets were found to be evenly located within the county, with
some being in the outskirts, within the city, along the road side and near residential areas. Ten
open air markets (Wakulima, Kangemi, Kawangware, Kibera, Mtindwa, Kayole, Ruai,
Dandora, Githurai 45 and Ruiru) and five supermarkets (Uchumi, Naivas, Nakumatt, Ukwala
and Tuskys) were selected for the study. The samples collected in the markets and in the two
seasons are shown in Table 2.1.
Table 2.1: Number of samples of vegetable species collected in open air and supermarkets
during the dry and wet season; where ∑ denote the total number of the samples; XK – exotic
kale, EK – Ethiopian kale, AN - African nightshade, AM - amaranth, CP - cowpea and SP -
spider plant.
Species Dry season Wet season ∑ ∑
Open air
market
Super-
market
Open air
market
Super-
market
Open air
market
Super-
market Total
XK 10 5 9 5 19 10 29
EK 6 4 9 2 15 6 21
NS 9 5 10 4 19 9 28
AM 10 4 10 5 20 9 29
CP 8 4 9 3 17 7 24
SP 8 1 5 1 13 2 15
∑ 51 23 52 20 103 43 146
2.1.3.3 Collection of fresh vegetable samples
Plant samples were collected in two periods, in the dry spell and during the rainy season. The
first sampling was carried out from 13th – 20th November, 2014, and the second sampling
from 15th – 22nd June, 2015. Both samplings were done during the day, between 10 am and 6
pm. Five AIV species and one exotic vegetable species were collected. These species were
African Night Shade (Managu) - Solanum scabrum, amaranth (Terere) - Amaranthus
cruentus, cowpea (Kunde) - Vigna unguiculata, spider plant (Saga) - Cleome gynandra,
Ethiopian kale (Kansira) - Brassica carinata) and exotic kale (Sukuma wiki)- Brassica
oleracea acephala. Not all vegetables were found in all markets Table 2.2). A vendor was
randomly selected from the market and about 2 kg of fresh vegetables belonging to each
species bought. The samples were packed carefully in big paper bags, placed in a cooler box,
and then taken to the cold chamber (10oC).

12
Table 2.2: Collected vegetable species in open air and supermarkets during the dry and wet
season; where XK – exotic kale, EK – Ethiopian kale, AN - African nightshade, AM -
amaranth, CP - cowpea and SP - spider plant (open air market =10 and supermarkets = 5).
Market type Market name Species collected
Dry season Wet season
Open air market Wakulima XK, AM, CP AM, NS, CP, EK, XK, SP
Open air market Ruai XK, EK, NS, AM, SP
AM, NS, EK, XK,
Open air market Kawangware XK, AM, CP, SP
XK, EK, NS, AM, CP
Open air market Mutindwa XK, NS, AM, CP, SP
XK, EK, NS, AM, CP, SP
Open air market Githurai XK, EK, NS, AM, CP, SP
XK, EK, NS, AM, CP
Open air market Ruiru XK, EK, NS, AM, CP, SP
XK, EK, NS, AM, CP, SP
Open air market Kibera XK, EK, NS, AM, CP
AM, NS, CP, EK, XK
Open air market Kangemi XK, EK, NS, AM, SP
XK, EK, NS, AM, CP, SP
Open air market Kayole XK, EK, NS, AM, SP
XK, NS, AM, CP,
Open air market Dandora XK, NS, AM, CP, SP
EK, NS, AM, CP, SP
Supermarket Nakumatt XK, EK, NS, CP
XK, EK, NS, AM, CP,
Supermarket Uchumi XK, AM, CP
XK, EK, NS, AM, SP
Supermarket Naivas XK, EK, NS, AM, SP
XK, NS, AM
Supermarket Tuskys XK, EK, NS, AM, CP
XK, NS, AM, CP,
Supermarket Ukwala XK, EK. NS, AM, CP
XK, NS, AM, CP
2.1.3.4 Pretreatment and washing of fresh vegetable samples
All samples collected from the markets were divided into edible parts including leaves,
petioles and stipules, and non-edible parts, mainly stems. The non-edible parts were discarded
and the edible parts were placed in labeled bags. The samples were later divided into two
bunches; one part was washed thoroughly with tap water for 2 minutes and rinsed with
distilled water, while the other part was not washed at all. Then, all samples were dried in the
oven at 70oC until a constant weight was obtained. Dried samples were finely ground into
powder form, sieved by 2 mm gauge sieves and stored in clean polyethylene bags for
chemical analysis.

13
2.1.3.5 Sample digestion and laboratory analysis
A 250 mg aliquot of each powdered sample was weighed into a glass bottle and burned in a
furnace at 500o C for 12 hours. The samples were cooled and 2.5 ml of nitric acid (21.5 %
HNO3) was added. To evaporate the acid samples were placed on a heating plate in a hood.
The samples were later cooled and the residue dissolved in 2.5 ml of hydrochloric acid
(12.0% HCl). The mixture was then transferred to 25 ml flask and double distilled water
added up to the mark. The liquid was then filtered into a clean, well labeled plastic bottle
using size 42 filter paper. The filtered liquid was subjected to inductively coupled plasma with
optical emission spectroscopy (ICP – OES) analyzer for macro, trace and ultra-trace element
determination in the vegetable samples. The elements analysed included, K, P, S, Mg, Ca, Fe,
Zn, Cu, Mn, Cd and Pb.
2.1.3.6 Statistical data analysis
R statistical software was used to generate boxplots, means and standard deviation
determination. The residuals were tested for normality using q-q plots, histogram and density
mean. Homogeneity of variances was tested using Bartlett’s test for equal variance. One and
two way analysis of variance (ANOVA) was used to find out the significant differences (p <
0.05) among the plant species and interactions between species, market type and seasons. A
post hoc LSD test for mean separation was also done. Unpaired T-test was used to determine
significant differences (p < 0.05) in vegetable species between the two markets and two
seasons.
2.1.4 Results and discussion
2.1.4.1 Differences among species in concentration of essential elements
For assessment of differences among species in concentration of essential elements, data from
the washed samples were analysed. Chapter 2.1.4.1 contains data showing the overall
variance of species-specific mineral element concentration (box plots), and data on mean
species-specific mineral element concentration across the two market types and growing
seasons. The median in the box plots showed how samples were distributed to the top and
bottom of box plot whereas the mean denoted the average representative of samples for
further use in discussion part. Chapter 2.1.4.1 was further subdivided to present and discuss
data on macro elements absorbed by plants in the form of cations, i.e. K+, Mg2+ and Ca2+
(2.1.4.1.1), and in the form of anions (H2PO4- or HPO4
2- and SO42-) (2.1.4.1.2), and data on
micro elements (2.1.4.1.3).

14
2.1.4.1.1 Differences among species in the concentration of macro elements absorbed by
plants as cations
Concentrations of K in edible plant organs of the vegetables varied from a minimum of 22 to
a maximum of 65 g kg-1 dry mass (Fig. 2.1a). The range of concentrations, which covers 50%
of all data, which is indicated by the extension of the boxes, was largest for African
nightshade, and smallest for exotic kale. The means were 36 g K kg-1 leaf dry mass for exotic
kale, 42 g K kg-1 leaf dry mass for Ethiopian kale, 46 g K kg-1 leaf dry mass for African
nightshade, 48 g K kg-1 leaf dry mass for amaranth, 32 g Mg kg-1 leaf dry mass for cowpea
and 35 g K kg-1 leaf dry mass for spider plant. The mean K concentrations significantly
differed among species from 48 g K kg-1 leaf dry mass for amaranth to 32 g K kg-1 leaf dry
mass in cowpea (Table 2.3). The mean K concentration of exotic kale, although higher, did
not significantly differ from the mean concentrations of cowpea and spider plant, but was
significantly lower than the mean concentrations of Ethiopian kale, African nightshade and
amaranth. Data concerning K concentrations in AIVs from literature strongly vary within and
among species (Adam 2016, non-published study project, section of Plant Nutrition and
Fertilization, Humboldt University Berlin). For example, for spider plant, Abugre et al. (2011)
indicate K concentrations in edible plant organs of 5-6 g K kg-1 dry mass, whereas Van
Jaarsveld et al. (2014) indicate 27 g K kg-1 dry mass, and Wehmeyer (1986) indicate 34 g K
kg-1 dry mass. For leafy vegetables, the sufficiency range, which indicates leaf K
concentrations sufficient for supporting normal growth, is between 30 and 70 mg K kg-1 dry
mass (Bergmann et al. 1976). Neglecting literature data on K concentrations, which would
clearly indicate K deficiency (Abugre et al. 2011), our data are in the same range as data from
literature (Adam, 2016).
Concentrations of Mg in edible organs of the vegetables ranged from a minimum of 2.5 to a
maximum of 19 g kg-1 dry mass (Fig. 2.1b). The range of Mg concentrations, which covered
50% of all data, was generally smaller than the same range of K concentrations (compare the
extension of the boxes in Fig. 2.1b and Fig. 2.1a). This range of Mg concentrations was
largest for amaranth and spider plant, and smallest for exotic kale.

15
Figure 2.1: Box plots showing, minimum, first quartile, median, third quartile and maximum
potassium (a), magnesium (b) and calcium (c) concentration levels (g kg-1 leaf dry mass) of
samples from respective vegetable species. The dots represents (outliers) samples with
extreme ranges from the rest, determined by Q3 + 3*IQR or Q1 - 3*IQR formula; where, Q1 –
first quartile, Q3 – third quartile, IQR – interquartile range.
The means were 4.8 g Mg kg-1 leaf dry mass for exotic kale, 5.1 g Mg kg-1 leaf dry mass for
Ethiopian kale, 6.6 g Mg kg-1 leaf dry mass for African nightshade, 12 g Mg kg-1 leaf dry
mass for amaranth, 5.1 g Mg kg-1 leaf dry mass for cowpea and 7.4 g Mg kg-1 leaf dry mass
for spider plant. The mean Mg concentrations significantly differed among species (Table
2.3). For amaranth, the mean concentration was more than two fold higher than for exotic
kale. The mean Mg concentration of exotic kale did not significantly differ from that of
Ethiopian kale and cowpea, but was significantly lower than that of African nightshade, spider
plant and amaranth.
a b
c

16
Table 2.3: Concentrations (g kg-1 leaf dry mass) of macro elements taken up as cations in
vegetable species (means ± standard deviation). Columns with same lower case letters behind
the means indicate no significant differences between means (p > 0.05, ANOVA, LSD test).
Species K Mg Ca
Element concentrations (g kg-1 leaf dry mass)
Exotic kale 36 ± 6 c 4.8 ± 1.3 c 31 ± 6 a
Ethiopian kale 42 ± 8 b 5.1 ± 0.9 c 26 ± 5 b
African nightshade 46 ± 11 ab 6.6 ± 2.3 b 18 ± 6 c
Amaranth 48 ± 8 a 12 ± 2.9 a 32 ± 8 a
Cowpea 32 ± 6 c 5.1 ± 1.3 c 24 ± 5 b
Spider plant 35 ± 11 c 7.4 ± 1.9 b 30 ± 6 a
Calcium concentrations in edible organs varied between 9.0 and 52 g kg-1 dry mass (Fig.
2.1c). The range of Ca concentrations, which covered 50% of all data, was generally
somewhat smaller than the same range of K concentrations but somewhat larger than the
range of Mg concentration (compare the extension of the boxes in Fig. a, b and c). This range
of Ca concentrations was largest for exotic kale, amaranth and spider plant, and smallest for
Ethiopian kale. The means were 31 g Ca kg-1 leaf dry mass for exotic kale, 26 g Ca kg-1 leaf
dry mass for Ethiopian kale, 18 g Ca kg-1 leaf dry mass for African nightshade, 32 g Ca kg-1
leaf dry mass for amaranth, 24 g Ca kg-1 leaf dry mass for cowpea and 30 g Ca kg-1 leaf dry
mass for spider plant.The mean Ca concentrations significantly differed among the species
from 32 g kg-1 leaf dry mass for amaranth to 18 g kg-1 leaf dry mass for African nightshade
(Table 2.3). The mean Ca concentration of exotic kale was not significantly different from
that of amaranth and spider plant, but was significantly higher than that of Ethiopian kale,
cowpea and African nightshade.
The Mg and Ca concentrations in our study were similar to those earlier reported by Uusiku et
al. (2010), in a review article on unknown amaranth species, African nightshade, cowpea and
spider plant. Jiménez-Aguilar and Grusak (2015) found mean concentration of K, Mg and Ca
in African nightshade similar to our findings. Similarities with this study were seen in Mg
concentrations in amaranth and cowpea and Ca concentrations in cowpea and spider plant
(Schönfeldt and Pretorius 2011). Previous study by Kamga et al. (2013), revealed similarities
in Mg and Ca concentration in amaranth and African nightshade. Schönfeldt and Pretorius
(2011), findings revealed higher Mg concentration in spider plant (1.5 g kg-1 fresh mass or 15

17
g kg-1 dry mass) and lower Ca in amaranth (23 g kg-1 dry mass). On the contrary, Kruger et al.
(1998) found brassica species (kale) to contain 1.3 mg Ca kg-1 dry mass while mean Ca
concentration in cowpea were higher than previously reported values (Gonçalves et al. 2016).
Habwe et al. (2008) showed the vegetables to have low concentration of K and also indicated
that spider plant had higher concentration of Ca than amaranth while African nightshade had
the highest Mg concentration.
In our study, amaranth had the highest concentrations of K, Mg and Ca among all species
(Table 2.3). From a plant nutritional point of view, this raises the question how the positive
charge associated with mineral cation accumulation is balanced with negative charge.
Nitrogen, P and S do presumably not much contribute to charge balance, because the main
part of these elements, which are absorbed by plants in the form of anions, is assimilated to
organic compounds without charge (Marschner 2012). Thus, in amaranth, the large positive
charge associated with accumulation of cations (3.8 val kg-1 dry mass in amaranth in
comparison to 2.4 val kg-1 dry mass in cowpea) is presumably balanced by high cation
exchange capacity of the cell walls (“non-diffusible anions” in the form of negatively loaded
carboxylic groups) and by high cellular content of organic acid anions, e.g. citrate and malate.
2.1.4.1.2 Differences among species in the concentration of macro elements absorbed by
plants as anions
Concentration of P in edible vegetable organs ranged from a minimum of 2.8 to a maximum
12 g kg-1 dry mass (Fig. 2.2a). The range of P concentrations, which covered 50% of all data,
was largest in spider plants, while the rest of the vegetables had a smaller range. The mean P
concentrations significantly differed among species ranging from 5.2 g kg-1 leaf dry mass in
cowpea to 12 g kg-1 leaf dry mass in spider plant (Table 2.4). The means were 5.3 g P kg-1 leaf
dry mass for exotic kale, 7.3 g P kg-1 leaf dry mass for Ethiopian kale, 7.5 g P kg-1 leaf dry
mass for African nightshade, 6.2 g P kg-1 leaf dry mass for amaranth, 5.2 g P kg-1 leaf dry
mass for cowpea and 12 g P kg-1 leaf dry mass for spider plant.The P concentration of exotic
kale did not differ from that of cowpea and amaranth but was significantly lower than that of
Ethiopian kale, African nightshade and spider plant. Among the AIVs, P concentration of
African nightshade (7.5 g kg-1 leaf dry mass) was significantly lower than of spider plant but
significantly higher than the P concentration of amaranth and cowpea. A previous study by
Jiménez-Aguilar and Grusak (2015) found the mean concentration of P in African nightshade
to match with the ranges in our study. The concentration of P in amaranth was similar to that
found in South Africa by Odhav et al. (2007). The mean concentration of P in cowpea were

18
higher than in the accessions examined in Ghana by Ahenkora et al. (1998) and that by
Chweya et al. 1999, but lower than those found by Imungi et al. (1983), in Kenya. Our study
on P concentration of cowpea was in line with the previous study by (Schönfeldt and
Pretorius 2011), but disagreed with (Chweya et al. 1999; Abugre et al. 2011; Van Jaarsveld et
al. 2014). Also, our study was in line with Abugre et al. (2011) on the concentrations of P in
spider plant.
The concentrations of S in the edible plant organs of the vegetables ranged from 1.6 to 19
g/kg dry mass (Fig 2.2b). The range of S concentrations, which covered 50% of all data, was
largest for exotic kale, and smallest for amaranth. The means were 11 g S kg-1 leaf dry mass
for exotic kale, 8.2 g S kg-1 leaf dry mass for Ethiopian kale, 4.9 g S kg-1 leaf dry mass for
African nightshade, 3.9 g S kg-1 leaf dry mass for amaranth, 2.4 g S kg-1 leaf dry mass for
cowpea and 6.4 g S kg-1 leaf dry mass for spider plant. The mean concentrations of S varied
among species by more than 4 times, from 2.4 g kg-1 leaf dry mass for cowpea to 11 g kg-1
leaf dry mass in exotic kale (Table 2.4). Among all the vegetable species and in comparison to
AIVs, exotic kale had the highest concentration of S.
Figure 2.2: Box plots showing minimum, first quartile, median, third quartile and maximum
phosphorus (a) and sulphur (b) concentration levels (g kg-1 leaf dry mass) of samples from
respective vegetable species. The dots represents (outliers) samples with extreme ranges from
the rest, determined by Q3 + 3*IQR or Q1 - 3*IQR formula; where, Q1 – first quartile, Q3 –
third quartile, IQR – interquartile range.
a b

19
Table 2.4 Concentrations (g kg-1 leaf dry mass) of macro elements taken up as anions in
vegetable species (means ± standard deviation). Columns with same lower case letters behind
the means indicate no significant differences between means (p > 0.05, ANOVA, LSD test).
Species P S
Element concentrations (g kg-1 leaf dry mass)
Exotic kale 5.3 ± 1.4 d 11.0 ± 3.9 a
Ethiopian kale 7.3 ± 1.5 bc 8.2 ± 1.8 b
African nightshade 7.5 ± 1.3 c b 4.9 ± 1.6 d
Amaranth 6.2 ± 1.3 cd 3.9 ± 0.5 d
Cowpea 5.2 ± 1.2 d 2.4 ± 0.6 e
Spider plant 12 ± 4.7 a 6.4 ± 1.3 c
Comparing the AIVs, Ethiopian kale had the highest S concentrations, followed by spider
plant, which was significantly higher than African nightshade and amaranth. The
concentration of S in African nightshade and amaranth were higher than in cowpea.
Not so many data are available on the S concentration in vegetable species. Previous study by
Jiménez-Aguilar and Grusak (2015), found the mean concentration of S in African nightshade
to be higher than in our study. Sulfur is a component of glucosinolates, which are secondary
metabolites of Brassicaceae including exotic kale, Ethiopian kale and spider plant (Mithen et
al. 2010). Thus, the high S concentration in these species is presumably due to their ability to
accumulate glucosinolates.
2.1.4.1.3 Concentration of micro elements in vegetable species
Iron concentrations in edible organs varied from a minimum of 92 to maximum of 3531 mg
kg-1 dry mass (Fig. 2.3a). The range of Fe concentrations, which covered 50% of all data, was
generally somewhat smaller than the range of other micro element concentrations (compare
the extension of the boxes in Fig. b, c and d). This range of Fe concentrations was largest for
Ethiopian kale and amaranth, and smallest for exotic kale. The means were 233 mg Fe kg-1
leaf dry mass for exotic kale, 636 mg Fe kg-1 leaf dry mass for Ethiopian kale, 711 mg Fe kg-1
leaf dry mass for African nightshade, 839 mg Fe kg-1 leaf dry mass for amaranth, 640 mg Fe
kg-1 leaf dry mass for cowpea and 559 mg Fe kg-1 leaf dry mass for spider plant. The mean Fe
concentrations significantly differed among the species from 839 mg kg-1 leaf dry mass for
amaranth to 233 mg kg-1 leaf dry mass for exotic kale (Table 2.5). Among the AIVs, spider
plant (559 mg kg-1 leaf dry mass) had a significantly lower Fe concentration than amaranth.

20
Ethiopian kale, African nightshade and cowpea had lower Fe concentration than amaranth and
higher than spider plant, but did not show significant differences.
Concentrations of Zn in the edible plant organs of the vegetables varied from a minimum of
26 to a maximum of 253 mg kg-1 leaf dry mass (Fig. 2.3b). The range of concentrations,
which covered 50% of all data, was largest for amaranth and smallest for cowpea. The means
were 55 mg Zn kg-1 leaf dry mass for exotic kale, 83 mg Zn kg-1 leaf dry mass for Ethiopian
kale, 70 mg Zn kg-1 leaf dry mass for African nightshade, 96 mg Zn kg-1 leaf dry mass for
amaranth, 53 mg Zn kg-1 leaf dry mass for cowpea and 80 mg kg-1 leaf dry mass for spider
plant.
Figure 2.3: Box plots showing, minimum, first quartile, median, third quartile and maximum
iron (a), zinc (b), copper (c) and manganese (d) concentration levels (mg kg-1 leaf dry mass)
of samples from respective vegetable species. The dots represents (outliers) samples with
extreme ranges from the rest, determined by Q3 + 3*IQR or Q1 - 3*IQR formula; where, Q1
– first quartile, Q3 – third quartile, IQR – interquartile range.
a b
c d

21
The mean Zn concentration significantly differed among species from 96 mg Zn kg-1 leaf dry
mass for amaranth to 53 mg Zn kg-1 leaf dry mass in cowpea (Table 2.3). Exotic kale had the
lowest Zn concentration, which was not significantly different from cowpea. No significant
differences in Zn concentration were observed between Ethiopian kale and spider plant. On
the other hand, African nightshade had a significantly lower concentration of Zn than
amaranth.
Copper concentration in edible organs of the vegetables ranged from a minimum of 1.9 to a
maximum of 22 mg kg-1 leaf dry mass (Fig 2.3c). The range of Cu concentrations, which
covered 50% of all data, was largest for African nightshade and smallest for exotic kale.
Table 2.5: Concentrations (mg kg-1 leaf dry mass) of micro elements Fe, Zn, Cu and Mn in
vegetable species (means ± standard deviation). Columns with same lower case letters behind
the means indicate no significant differences between means (p > 0.05, ANOVA, LSD test).
Species Fe Zn Cu Mn
Element concentrations (mg kg-1 leaf dry mass)
Exotic kale 233 ± 99 c 55 ± 24 c 3.4 ± 1.2 d 109 ± 67 c
Ethiopian kale 636 ± 364 ab 83 ± 24 ab 6.1 ± 1.7 c 116 ± 42 c
African nightshade 711 ± 401 ab 70 ± 23 b 12 ± 4.8 a 238 ± 101 b
Amaranth 839 ± 548 a 96 ± 36 a 6.6 ± 1.9 c 222 ± 119 b
Cowpea 640 ± 363 ab 53 ± 19 c 8.8 ± 2.5 b 332 ± 165 a
Spider plant 559 ± 311 b 80 ± 21 ab 11 ± 2.3 a 159 ± 50 bc
The means were 3.4 mg Cu kg-1 leaf dry mass for exotic kale, 6,1 mg Cu kg-1 leaf dry mass
for Ethiopian kale, 12 mg Cu kg-1 leaf dry mass for African nightshade, 6.6 mg Cu kg-1 leaf
dry mass for amaranth, 8.8 mg Cu kg-1 leaf dry mass for cowpea and 11 mg Cu kg-1 leaf dry
mass for spider plant. The mean Cu concentrations significantly differed among species from
12 mg kg-1 leaf dry mass for African nightshade to 3.4 mg kg-1 leaf dry mass for exotic kale
(Table 2.5). The concentration of Cu in exotic kale was significantly lower than in all AIV
species. Among the AIVs, Ethiopian kale (6.1 mg kg-1 leaf dry mass) and amaranth had the
lowest Cu concentrations. Concentration of Cu in cowpea was significantly lower than in
African nightshade and spider plant. African nightshade and spider plant had almost the same
concentrations of Cu.
The concentration of Mn in edible organs varied from a minimum of 44 to a maximum of
1124 mg kg-1 leaf dry mass (Fig. 2.3d). The range of Mn concentrations, which covered 50%
22
of all data, was largest for cowpea and smallest for exotic kale. The means were of 109 mg
Mn kg-1 leaf dry mass for exotic kale, 116 mg Mn kg-1 leaf dry mass for Ethiopian kale, 238
mg Mn kg-1 leaf dry mass for African nightshade, 222 mg Mn kg-1 leaf dry mass for
amaranth, 332 mg Mn kg-1 leaf dry mass for cowpea and 159 mg Mn kg-1 leaf dry mass for
spider plant. The mean Mn concentrations significantly differed among species ranging from
109 mg kg-1 leaf dry mass for exotic kale to 332 mg kg-1 leaf dry mass for cowpea (Table 2.5).
The mean Mn concentration of exotic kale was similar to that of Ethiopian kale and spider
plant. The Mn concentration of African nightshade was significantly lower than that of
cowpea. The Mn concentrations of amaranth, African nightshade and spider plant did not
significantly differ.
While the Zn concentration ranges in amaranth and nightshade in this study were within the
findings of Kamga et al. (2013), the Fe concentration was lower; 201 and 147 mg kg-1 dry
mass as compared to 839 and 711, respectively. The concentrations of Zn and Fe in cowpea
were similar to Gonçalves et al. (2016), but much higher than those indicated in the study of
Frossard et al. (2000). In a similar study done in Dar es Salaam, Tanzania, the range of Zn and
Cu concentrations was found to be similar in cowpea and amaranth (Othman 2001). Mutune
et al. (2013), did almost a similar study in Kenya and found much higher concentration of
copper in spider plant (19 mg kg-1 dry mass). The Fe, Zn, Cu and Mn concentrations in
African nightshade were higher than those reported in a study on two African nightshade
genotypes (Solanum scabrum, PI 643126 and Grif 14198) in Central America by Jiménez-
Aguilar and Grusak (2015). The overall mean concentration of elements among vegetables
was higher in our study than in the study of Fang et al. (2014), who found leafy vegetables
collected in China open air and supermarkets to contain average concentrations of 108 mg Fe
kg-1 dry mass, 29 mg Mn kg-1 dry mass, and 36 mg Zn kg-1 dry mass.
From the point of view of dietary value, exotic kale for all micro elements was a comparably
poor source for intake (Table 2.5). Mean concentration of each micro element differed among
AIVs. For example, Ethiopian kale was among the species with the highest concentrations of
Zn, but was low in Cu and Mn. Amaranth was among the species with the highest
concentrations of Fe and Zn, but not of Cu. In principal, plant micro element concentrations
depend on element availability in soil and the ability of plants for element acquisition
(Frossard et al. 2000). The differences in micro element concentration among species may
also depend on the market types, crop growth seasons and plant traits.

23
The differences in element concentration was attributed to the fact that plants take up these
elements from soil solution in the form of free ions (Fe2+, Zn2+, Cu2+, Mn2+), which depend on
the soil physiochemical and biological properties (Frossard et al. 2000). The key soil
properties related to micro elements availability in the soil are pH, CEC, soil structure and
water content. Plants also differ in the root architecture, e.g. distribution of root hairs, root
molecular and physiological mechanisms, which determine the volume from which micro
elements can be extracted (Marschner 1993), and thus regulate the elements uptake. Changes
induced by roots in rhizosphere by plants, regulates uptake of micro elements i.e. Zn. Unlike
macro elements (Ca, Mg, K), which are bound to negatively charged cell wall, Fe and Zn are
not. This may also apply to Cu and Mn. Iron loading in the plant is facilitated by Fe-chelate,
which may differ among plant species (Grusak 1994), while uptake of Cu dependent on plant
type rather than soil Cu (Nabulo et al. 2011).
The concentrations of Fe in the vegetables were far higher than those reported in previous
studies (Jiménez-Aguilar and Grusak 2015). In the study of Joy et al. (2015), vanadium (V)
was used as an indicator for contamination of plant samples with soil particles. In this study,
the mean contribution of soil particles to the Fe concentration of (carefully washed) leaves of
vegetables was 77%. For specific species, the contribution of soil particles was 97% (Joy et
al. 2015). The mean contribution of soil particles to the leaf concentrations of Zn (6%) and Cu
(6%) was much lower. The higher levels could be associated to Fe that gets attached to
edibles parts through contamination by dust and gets into plant tissue. The Fe concentration is
thus not entirely bioavailable to human beings.
The Al concentrations in the vegetables were determined in order to reveal the source of
excess Fe concentration in vegetables. Al translocation from roots to shoots in most plants is
usually insignificant (Klug et al. 2015). Thus the measured Al in vegetables/ crops originates
from the soil/ ‘dust’. A significant positive correlation between Al and Fe was a clear
indication that excess Fe in the vegetable species was a result of atmospheric contamination
(Fig. 2.4). The coefficient of determination indicated that 95% of the samples showed a
positive relationship between Al and Fe as opposed to other elements. The coefficient of
determination (r2) for other elements were below 0.4 as follows; 0.11 for Zn, 0.24 for Cu, 0.34
for Mn, 0.39 for K, 0.018 for Ca, 0.27 for Mg, 0.17 for P and 0.29 for S. Since a fraction of Fe
concentration in vegetables species was a result of atmospheric deposition, washing of the
samples was done to determine the amount of Fe that can be eliminated and the species that
accumulated a lot of aerial deposited Fe concentration.

24
Figure 2.4: Relationship between Al and Fe concentrations (mg kg-1 leaf dry mass) vegetable
samples, n = 140; R2 = coefficient of determination.
Comparison was done between the unwashed and washed samples in order to find out the
differences in the Fe concentration among vegetables species. This study found out that,
washing was able to remove a range of 24% - 60% of Fe adhered to the edible vegetable parts
(Table 2.6). Fe concentration in exotic kale was least removed. The order of removal of the Fe
concentrations was exotic kale < Ethiopian kale/amaranth < African nightshade < cowpea <
spider plant. Zn and Cu concentration were not reduced by washing of vegetables species
whereas little reduction of Mn concentration was observed in all the vegetable species apart
from exotic kale.
Table 2.6: Reduction of micro element concentrations in percent (%) by washing vegetable
species with water (means ± standard error of means).
Species Fe Zn Cu Mn
Percentage (%) element concentration
Exotic kale 24 ± 4 -5.3 ± 4 -6.4 ± 5 -4.6 ± 5
Ethiopian kale 38 ± 6 -18 ± 8 -12 ± 3 12 ± 8
African nightshade 47 ± 4 -1.8 ± 3 -8.2 ± 5 11 ± 4
Amaranth 38 ± 6 0.02 ± 3 0.4 ± 3 12 ± 5
Cowpea 50 ± 3 -0.6 ± 3 -7 ± 4 7.5 ± 4
Spider plant 60 ± 6 5.4 ± 4 0.2 ± 5 28 ± 8
The reduction observed in Fe was in agreement with Sharma et al. (2008b), who discovered
reductions at production sites to be less than 10% while reductions at the market sites varied

25
from 23 to 68% in micro and heavy metal concentrations. These results disagreed with
Sharma et al. (2007) who found washing vegetables with water to have reduced the levels of
Zn and Cu concentrations in the vegetables. The effects of washing indicated that atmospheric
deposition contributed immensely to the increased levels of Fe in vegetables (Sharma et al.
2008a), which suggest that urban atmospheric contamination as a result of automobile and
accumulated dust may be a major source of heavy metals.
2.1.4.2 Effects of markets on essential element concentrations in vegetable species
To determine the effect of market type on element concentration of vegetable species,
unwashed data were used. The data for both seasons within respective markets were
combined and analysed to get the mean concentrations. Comparisons between markets were
done using unpaired T-tests.
2.1.4.2.1 Effects of markets on macro element concentrations in vegetables species
Vegetable species varied in their concentrations between open air and supermarkets, however
there were no significant differences between markets in most element concentrations of
vegetables (Table 2.7). There were no differences in K concentrations between markets in all
the vegetables species. The concentration of Ca and Mg was higher in exotic kale collected
from the supermarkets (33 and 5.4 g kg-1 leaf dry mass, respectively) than open air markets
(28 and 4.3 g kg-1 leaf dry mass, respectively). On the other hand, supermarkets showed the
highest concentrations of P in exotic kale and amaranth compared to open air markets,
whereas cowpea found in the supermarket had the highest concentrations of S (2.8 g kg-1 leaf
dry mass) unlike in the open air market where S concentrations were as less as 0.7 g kg-1 leaf
dry mass. All the macro element concentrations in Ethiopian kale and spider plant were the
same in open air markets and supermarkets.
Little study has been done in the past to determine the differences in macro element
concentrations in vegetables between markets. Most of the studies done concentrated on the
vegetables grown in the field. In case of market study, some research concentrated on
pathogen contamination (Newman 2005; Mohamed et al. 2016), micro nutrients and heavy
metal concentrations in vegetables.
In our study, exotic kale collected from supermarkets had the highest concentrations of P, Ca
and Mg compared to exotic kale collected from open air market. The presence of higher levels
of Ca, Mg and P in kale from supermarket was an indication of preference given to exotic
kales that are produced for the supermarkets by use of fertilizer as opposed to AIVs.

26
Table 2.7: Effects of market type on concentrations (g kg-1 leaf dry mass) of macro elements in vegetable species (means ± standard deviation);
where XK – exotic kale, EK – Ethiopian kale, AN - African nightshade, AM - amaranth, CP - cowpea and SP - spider plant. Rows with same
lower case letters behind the means indicate no significant differences between means of a respective element (p > 0.05, ANOVA, unpaired t-
test, n = 10 for open air markets, n = 5 for supermarkets).
Species K Mg Ca P S
Open air
market Supermarket
Open air
market Supermarket
Open air
market Supermarket
Open air
market Supermarket
Open air
market Supermarket
Element concentrations (g kg-1 leaf dry mass)
XK 32 ± 6 a 33 ± 6 a 4.3 ± 1.1 a 5.4 ± 1.2 b 28 ± 8 b 33 ± 4 a 4.8 ± 1 b 5.8 ± 1 a 10.2 ± 3.0 a 9.8 ± 5.3 a
EK 41 ± 9 a 42 ± 12 a 4.8 ± 0.8 a 4.9 ± 1.3 a 25 ± 5 a 21 ± 5 a 6.6 ± 1 a 7.8 ± 2 a 7.6 ± 2.2 a 8.6 ± 0.7 a
NS 44 ± 10 a 44 ± 11 a 6.7 ± 2.6 a 5.4 ± 1.3 b 16 ± 3 a 19 ± 7 a 7.3 ± 1 a 7.1 ± 2 a 4.2 ± 0.8 a 4.7 ± 2.0 a
AM 43 ± 9 a 49 ± 7 a 12 ± 3.1 a 11 ± 1.5 a 29 ± 4 a 29 ± 6 a 6.0 ± 1 b 7.2 ± 1 a 3.4 ± 0.6 a 3.6 ± 0.7 a
CP 29 ± 6 a 32 ± 4 a 5.0 ± 1.4 a 4.8 ± 0.9 a 22 ± 4 a 25 ± 4 a 4.8 ± 1 a 5.3 ± 1 a 2.1 ± 0.4 b 2.8 ± 0.6 a
SP 34 ± 8 a 47 ± 16 a 6.9 ± 1.6 a 7.9 ± 0.5 a 26 ± 6 a 32 ± 5 a 10.6 ± 3 a 16.0 ± 2 a 6.0 ± 1.3 a 6.6 ± 0.7 a

27
In the previous study, Cunnigham et al. (2001), suggested that element contents in vegetables
are affected by soil type and conditions like fertilizer type and application among other
factors. It was expected that vegetables bought in supermarkets will contain high levels of
macro elements based on the fact that farmers use good agronomic measures while producing
vegetables for supermarket supply. A survey by RSA (2015), showed that most consumers
prefer buying vegetables in the supermarket (45%) because they believe the vegetables are of
good quality while 36% who buy from open air markets cited closeness to their offices or
homes and easy accessibility as reasons to buy there.
2.1.4.2.2 Effects of market on micro element concentration in vegetable species
Although vegetable species varied in micro element concentrations, there were no significant
differences observed between markets in most vegetables (p<0.05, LSD post hoc test; Table
2.8). Mean Fe concentration was higher in exotic kale, Ethiopian kale, amaranth and spider
plant collected from the supermarket but there were no significant differences between the
two markets under the above specified vegetables. On the other hand, spider plant, among all
the species, showed significant differences in Zn concentrations between markets, where the
concentrations were higher in the supermarket (104 mg kg-1 leaf dry mass). The concentration
of Zn in exotic kale, Ethiopian kale, African nightshade, amaranth and cowpea did not have
differences between markets. No significant differences between markets were observed in
the concentration of Cu and Mn in all the vegetable species.
The results of our study were in agreement with Fang et al. (2014) who found Fe, Zn, Mn and
Cu concentrations in leafy vegetables from traditional markets and supermarkets, in Beijing
China, to be relatively equal. The amount of Zn in vegetables found in both markets was
higher than in the study by Li et al. (2006) in China. Our study findings suggest that micro
elements are not affected by the market type, as it was observed with macro elements. It was
expected that open air markets will have higher levels of Fe and to some extent Zn and Cu
due to the exposed nature of the market that is prone to dust and contamination (Abdu et al.
2011). This doesn’t rule out the issue of dust contamination in vegetables. Vegetables in the
supermarkets and open markets were both contaminated with Fe equally since the
concentration levels were much higher than the dietary intake recommended values and what
other studies have found out. Contamination by dust was looked into more detail in the
previous sections.

28
Table 2.8: Effect of market type on concentrations (mg kg-1 leaf dry mass) of micro elements in vegetable species (means ± standard deviation);
where XK – exotic kale, EK – Ethiopian kale, AN - African nightshade, AM - amaranth, CP - cowpea and SP - spider plant. Rows with same
lower case letters behind the means indicate no significant differences between means of a respective element (p > 0.05, ANOVA, unpaired T-
test, n = 10 for open air markets, n = 5 for supermarkets).
Species Fe Zn Cu Mn
Open air
market Supermarket
Open air
market Supermarket
Open air
market Supermarket
Open air
market Supermarket
Element concentrations (mg kg-1 leaf dry mass)
XK 317 ± 164 a 352 ± 191 a 57 ± 23 a 47 ± 13 a 3.2 ± 1 a 3.4 ± 1 a 101 ± 49 a 101 ± 26 a
EK 1137 ± 600 a 1184 ± 924 a 70 ± 17 a 79 ± 21 a 5.5 ± 1 a 5.5 ± 1 a 128 ± 49 a 137 ± 49a
NS 1771 ± 1201 a 1403 ± 1177 a 68 ± 18 a 67 ± 13 a 12.3 ± 5 a 10.1 ± 4 a 315 ± 197 a 281 ± 158a
AM 1095 ± 569 a 1985 ± 1032 a 94 ± 34 a 106 ± 44 a 7.0 ± 2 a 6.9 ± 1 a 301 ± 232 a 244 ± 89 a
CP 1536 ± 1369 a 1415 ± 730 a 51 ± 23 a 63 ± 15 a 8.8 ± 2 a 9.4 ± 5 a 335 ± 190 a 457 ± 224 a
SP 1497 ± 979 a 4523 ± 1152 a 78 ± 23 b 104 ± 10 a 10.5 ± 3 a 13.6 ± 3 a 222 ± 132 a 478 ± 95 a

29
2.1.4.3 Effect of seasons on concentration of essential elements in vegetable species
The seasons influence on element concentrations were determined by combining the data
from both markets for a particular season belonging to a given vegetable species.
2.1.4.3.1 Effects of seasons on macro element concentrations in vegetable species
Vegetable species differed in the concentration of macro elements between seasons (Table
2.9). The concentration of K in all the vegetable species showed significant differences
between seasons. Wet season vegetables had the highest concentration of K in exotic kale at
35 g kg-1 leaf dry mass, Ethiopian kale at 47 g kg-1 leaf dry mass, African nightshade at 57 g
kg-1 leaf dry mass, amaranth at 52 g kg-1 leaf dry mass, cowpea at 32 g kg-1 leaf dry mass and
spider plant at 44 g kg-1 leaf dry mass. Only cowpea was significantly highest in Mg
concentration (5.6 g kg-1 leaf dry mass), in the dry season compared to wet season (4.3 g kg-1
leaf dry mass). Exotic kale was significantly high in Ca in the dry season (32 g kg-1 leaf dry
mass) and low in wet season (27 g kg-1 leaf dry mass) while other vegetables did not show
differences between seasons. All the vegetable species had the same amount of P
concentration between the two seasons. On the other hand, amaranth, cowpea, exotic kale and
spider plant showed differences between seasons in S concentrations.
The concentrations of S in amaranth and spider plant were higher in wet season (3.7 and 7.0 g
kg-1 leaf dry mass, respectively) compared to dry season (3.2 and 5.5 g kg-1 leaf dry mass,
respectively). On the other hand, cowpea and exotic kale showed higher concentrations of S
in dry season (2.5 and 12 g kg-1 leaf dry mass, respectively) than wet season (2.1 and 8.6 g kg-
1 leaf dry mass, respectively).
This study showed that seasons affected vegetables species differently with respect to element
concentrations. This is partially in agreement with Ziblim et al. (2012), who found an
Ethiopian indigenous grass (Pennisetum pedicellatum) to be high in K and P in the wet season
whereas there were no differences between Mg and Ca in the wet and the dry season. Another
study by Bryla and Duniway (1997) found safflower (Carthamus tinctorius) and wheat
(Triticum aestivum) to accumulate higher levels of P in well-watered soils than in dry soils.

30
Table 2.9: Effect of seasons on concentrations (g kg-1 leaf dry mass) of macro elements in vegetables species (means ± standard deviation); where
XK – exotic kale, EK – Ethiopian kale, AN - African nightshade, AM - amaranth, CP - cowpea and SP - spider plant. Rows with same lower case
letters behind the means indicate no significant differences between means of a respective element (p > 0.05, ANOVA, unpaired T-test).
Species K Mg Ca P S
Dry
season
Wet
season
Dry
season
Wet
season
Dry
season
Wet
season Dry season
Wet
season
Dry
season
Wet
season
Element concentrations (g kg-1 leaf dry mass)
XK 30 ± 5 b 35 ± 6 a 5.0 ± 1.4 a 4.3 ± 0.9 a 30 ± 8 a 30 ± 6 a 5.1 ± 1.4 a 5.2 ± 0.7 a 12 ± 4.0 a 8.6 ± 3.2 b
EK 35 ± 8 b 47 ± 7 a 4.8 ± 0.9 a 4.7 ± 0.9 a 22 ± 5 a 25 ± 5 a 6.6 ± 1.4 a 7.2 ± 1.4 a 7.8 ± 1.7 a 8.0 ± 2.2 a
NS 37 ± 4 b 51 ± 10 a 5.9 ± 0.8 a 6.6 ± 2.9 a 17 ± 6 a 16 ± 4 a 7.1 ± 1.4 a 7.3 ± 1.1 a 4.4 ± 1.7 a 4.3 ± 0.9 a
AM 38 ± 5 b 52 ± 5 a 13 ± 1.5 a 11 ± 3.4 a 32 ± 4 a 27 ± 3 b 6.4 ± 1.0 a 6.4 ± 1.6 a 3.2 ± 0.6 b 3.7 ± 0.5 a
CP 28 ± 4 b 32 ± 6 a 5.6 ± 1.1 a 4.3 ± 1.1 b 22 ± 5 a 24 ± 3 a 5.2 ± 0.7 a 4.7 ± 1.2 a 2.5 ± 0.6 a 2.1 ± 0.4 b
SP 30 ± 3 b 44 ± 11 a 6.9 ± 1.4 a 7.1 ± 1.9 a 25 ± 3 a 29 ± 8 a 12 ± 3.1 a 11 ± 4.6 a 5.5 ± 0.8 a 7.0 ± 1.3 b

31
Higher concentrations of K during wet season were expected based on the diffusion and
soluble nature of the element. Uptake of K by the plants is highly depended on soil moisture.
Increase in soil moisture leads to increased movement of K to plants and hence higher
availability. Since P movement to plants is also dependent on soil moisture, it was expected
that the trend will be the same in this study, unless the P in the soil was adsorbed. Despite
moisture being a driving force in P availability for plants, its use by plants mainly depends on
supplied P form and ability of the plant to take up the available P. The limitation in the study
was that soil samples were not collected for analysis in areas where these vegetables were
grown.
2.1.4.3.2 Effects of seasons on micro element concentrations in vegetable species
Differences between seasons were observed only in Fe concentrations (Table 2.10). Exotic
kale, Ethiopian kale and African nightshade (1429, 2203 and 392 mg Fe kg-1 leaf dry mass,
respectively) recorded higher concentrations of iron in the wet season unlike in the dry
season. No difference between seasons was observed in iron concentrations in amaranth,
cowpea and spider plant. There were no seasonal changes in Zn, Cu and Mn concentrations
among vegetable species.
The results of this study agrees with a previous study by Birnin-Yauri et al. (2011), who
found the values for the micro elements higher in leafy vegetable samples during the rainy
season. Also, Angle et al. (2003) found zinc alongside nickel to be highly accumulated in
leaves of hyper accumulators at 80% and 100% water holding capacity. On the contrary,
Sharma et al. (2009), found the concentration of Zn and Cu higher in summer than winter,
Sharma’s arguments are based on high atmospheric contamination during the summer period.
In this study, high concentration of Fe during the wet season may be as a result of aerial
deposits during rainfall events or as a result of soil contamination since at most cases wet soils
are likely to be attached on plant leaves during harvest. Another reason could be the
sprinkling of water to vegetables at the market place to keep them fresh leading to minute
aerial deposits sticking on the vegetables (Sharma et al. 2009).

32
Table 2.10: Effect of seasons on concentrations (mg kg-1 leaf dry mass) of micro elements in vegetable species (means ± standard deviation);
where XK – exotic kale, EK – Ethiopian kale, AN - African nightshade, AM - amaranth, CP - cowpea and SP - spider plant. Rows with same
lower case letters behind the means indicate no significant differences between means of a particular element (p > 0.05, ANOVA, unpaired T-
test).
Vegetables Fe Zn Cu Mg
Dry season Wet season Dry season Wet season Dry season Wet season Dry season Wet season
Element concentrations (mg kg-1 leaf dry mass)
XK 271 ± 180 b 392 ± 143 a 53 ± 21 a 55 ± 20 a 3.1 ± 1 a 3.5 ± 1 a 93 ± 45 a 110 ± 38 a
EK 844 ± 517 b 1429 ± 716 a 70 ± 20 a 75 ± 17 a 5.2 ± 1 a 5.8 ± 2 a 114 ± 41 a 146 ± 50 a
NS 1017 ± 518 b 2203 ± 1332 a 69 ± 17 a 67 ± 16 a 12 ± 3 a 12 ± 5 a 283 ± 212 a 322 ± 159 a
AM 1537 ± 1009 a 1218 ± 634 a 107 ± 40 a 89 ± 33 a 7.7 ± 1 a 6.2 ± 2 a 360 ± 247 a 212 ± 106 a
CP 1367 ± 627 a 1634 ± 1610 a 51 ± 13 a 57 ± 28 a 8.6 ± 3 a 9.3 ± 3 a 339 ± 185 a 402 ± 224 a
SP 2074 ± 1193 a 1640 ± 1824 a 86 ± 22 a 74 ± 25 a 11 ± 3 a 10 ± 3 a 276 ± 156 a 226 ± 159 a

33
2.1.5 General discussion and recommendation
We found that the mean element concentrations in edible organs across market types and
growing seasons were significantly different among species (Tables 2.3, 2.4 and 2.5). In the
general discussion, we discuss two questions: 1) to what extent can our data concerning
differences among species in the concentrations of macro- and micro elements be
generalized? The discussion of this question is relevant for any comparative statements
concerning the nutritional value of specific species, e.g. AIV-species in comparison to
“exotic” vegetable species. Must these statements be confined to the specific context of our
investigation, i.e., markets in Nairobi, or can statements about the nutritional value of specific
species relative to that of other species be generalized? 2) Can AIV substantially contribute to
dietary element supply? The discussion of this question is relevant for assessing the potential
contribution of AIV for prevention of insufficient dietary mineral element intake, and thus for
reducing “hidden hunger”.
2.1.5.1 To what extent can our data concerning differences among species in the
concentrations of macro and micro elements be generalized?
It is well documented, that the plant mineral concentration is dependent on environmental
conditions that control soil nutrient availability, e.g., soil nutrient content and soil moisture
content, and on other environmental conditions that control leaf growth, and thus growth-
related “dilution” of leaf nutrients (Marschner 2012; Dickinson et al. 2014). Accordingly,
previous studies have shown that mineral nutrient concentrations in leafy vegetables vary,
depending on soil nutrient content (Kiba et al. 2012; Joy et al. 2015). The samples included in
our study were collected from 15 markets in each of two seasons. It is not known under which
specific site conditions the vegetables included in our study were cultivated. In Kenya, no
species-specific fertilizer recommendations exist, and there are no recommendations for
growing specific species under specific site conditions. Thus, there is no reason to assume that
specific species were mainly cultivated under specific soil fertility conditions. For that case, it
was assumed that, the soil fertility conditions did not differ among species. Thus, the
differences in the mean mineral concentrations among species (Tables 2.3, 2.4, 2.5) were
primarily due to plant traits, which control leaf mineral concentrations, and not due to
different site conditions.
With regard to the concentrations of macro elements, which are absorbed by plants in the
form of cations, the most prominent result was the very high Mg concentration in amaranth
(Table 2.3). This is in line with other studies in which several AIVs were grown under

34
identical site conditions (Kamga et al. 2013; see also chapter 4 of this thesis). In amaranth, the
concentrations of other cationic macro nutrients were also high (Table 2.3), whereas
concentrations of macro nutrients, which are absorbed and at least in part accumulated in the
form of anions, were not particularly high (Table 2.4). This indirectly points to the cation
exchange capacity of cell walls and/or organic acid anion metabolism and accumulation as
possible causes for the high concentrations of cationic macro elements in amaranth.
With regard to the concentrations of macro elements, which are absorbed by plants in the
form of anions, the most prominent results are the very high S concentrations in the exotic
and Ethiopian kales, followed by spider plant, and the very high P concentrations in spider
plants (Table 2.4). The kales and spider plant belong to the Brassicaceae, a family which is
containing many species, which accumulate sulphurous glucosinolates (Mithen et al. 2010). In
a recent study glucosinolate accumulation was confirmed in all tested spider plant genotypes
(Omondi et al. 2017). Higher P concentrations in spider plant in comparison to other AIV and
exotic kale are in line with data from Jiménez-Aguilar and Grusak (2015), and our own data
reported in chapter 3 and 4 of this thesis, which were derived from experiments, in which all
species were cultivated under identical site conditions. Our data on internal P utilization
efficiency of spider plants in comparison to other species (chapter 3) point to high metabolic P
demand of spider plant as a possible cause for the high P concentrations in edible organs.
Thus, we assume that our data showing that in comparison to other AIV the concentrations of
S in the kales and spider plant, and P in spider plant are particularly high can be generalized.
With regard to micro elements, Zn and Fe have an outstanding role for the nutritional value
(Frossard et al. 2000; Lim et al. 2012; Kumssa et al. 2015b). In our study, Zn concentrations
were particularly high for amaranth, Ethiopian kale and spider plant, and particularly low for
cowpea and exotic kale (Table 2.5). In line with these results, higher Zn concentrations in
spider plant in comparison to nightshade were also found by Jiménez Aguilar and Grusak
2015 (in comparison to nightshade). In the study of van Jaarsveld et al. (2014), spider plant
had the highest leaf Zn concentrations among 8 leafy African vegetable species. Lower Zn
concentrations in cowpea than in amaranth and spider plant were also found by Schönfeldt
and Pretorius (2001), Uusiku et al. (2010) and Kruger et al. (2015). Thus, there is some
support from other studies, in which the species were cultured under identical site conditions
that Ethiopian kale, spider plant and amaranth have particularly high Zn concentrations in
edible organs.

35
Fe concentrations showed very large variation within each species, and were significantly
higher in the AIVs than in exotic kale (Table 2.5). Higher Fe concentrations in leaves of AIV
species in comparison to exotic kale is in line with our data from two field experiments
(Nambafu et al. non-published results), in which all six species were cultivated under identical
site conditions. In the study of van Jaarsveld et al. (2014), leaf Fe concentrations of AIV
species were also higher than that of Chinese cabbage (Brassica rapa L. subspecies
chinensis). Iron concentrations in leaves are strongly influenced by external contamination
with soil particles (Table 2.6; Joy et al. 2015). Thus, higher leaf Fe concentrations in AIV in
comparison to exotic kale may possibly result from morphological and anatomical leaf traits,
e.g. fleshy leaves with low surface to volume ratio, that lead to lower surface contamination
with Fe containing particles.
2.1.5.2: Can AIVs substantially contribute to dietary element supply?
Concerning the dietary element supply we confine our discussion to the macro elements Mg
and Ca, and the micro elements Fe and Zn, as low supply of these elements is generally
considered to play a prominent role for malnutrition in sub-Sahara Africa (Lim et al. 2012;
Joy et al. 2014; Kumssa et al. 2015a, 2015b). For these elements, age- and sex-specific values
for recommended daily intake (RDI) were given in a joint report of FAO and WHO (2001;
Table 2.11). The daily recommended nutrient intakes for adults are 13.7 mg Fe, 14.0 mg Zn,
260 mg and 1000 mg Ca for males, and 29.4 mg Fe, 9.8 mg Zn, 220 mg and 1000 mg Ca for
females.
Table 2.11: Recommended daily nutrient intakes (RNI) of elements for different age groups
and sexes (FAO/WHO 2001); data for Zn are based on food with low Zn bioavailability; data
for Fe are based on food with 10% Fe bioavailability.
Age (years) Sex Fe (mg) Zn (mg) Mg (mg) Ca (mg)
1 - 3
5.8 8.3 60 500
4 - 6
6.3 9.6 76 600
7 - 9
8.9 11.2 100 700
10-18 Male 17 17.1 230 1300
Female 31.9 14.4 220 1300
19 - 65 Male 13.7 14 260 1000
Female 29.4 9.8 220 1000
Source: Uusiku et al. (2010)

36
In the study of Ruel et al. (2005), it is stated that the average vegetable intake in Kenya is 2.88
kg fresh mass/person/week for the rural population and 1.46 kg fresh mass/person/week for
the urban population. We assumed a daily vegetable dish of 400 g fresh mass. For assessing
the potential contribution of leafy vegetables to dietary element supply, we used the mean
concentrations of Mg, Ca (Table 2.3), Fe and Zn (Table 2.5). As these concentrations are
given on the basis of dry mass, we used our data on species-specific dry matter percentage in
edible organs from our field experiment (see Chapter 4) to calculate the dietary supply of Mg,
Ca, Fe and Zn, which is associated with consumption of 400 g fresh mass of various vegetable
species (Table 2. 12). Finally, from the data in Table 2.12, and the data on RDI in Table 2.11,
we calculated the percentage of RDI, which is supplied through daily consumption of 400 g
fresh mass of the different species (Table 2.13).
Table 2.12: Potential contribution of vegetable species to dietary element supply (mg) per
daily dish of 400 g fresh mass of various vegetables; calculation of dietary element supply is
based on the mean values across markets and growing seasons (Tables 2.3 and 2.5) and the
assumption of a dry matter content of edible organs of 11% for exotic and Ethiopian kale, 8%
for African nightshade, 13% for amaranth, and 14% for cowpea and spider plant.
Species Fe Zn Mg Ca
Dietary element supply (mg per 400 g fresh mass)
Exotic kale 10 2.4 211 1364
Ethiopian kale 28 3.7 224 1144
African nightshade 23 2.2 211 576
Amaranth 44 5.0 624 1664
Cowpea 36 3.0 286 1344
Spider plant 31 4.5 414 1680
Leafy vegetables may substantially contribute to the RNI, whereby large differences existed
depending on which nutrient is considered and which species is consumed (Tables 2.12 and
2.13). With regard to micro element supply, our data indicate that leafy vegetables may
contribute more to dietary supply of Fe than Zn. For example, in average, a daily 400 g dish
of all the vegetables species would cover 97% (ranging from 34% with consumption of exotic
kale to 150% with consumption of amaranth) of the recommended intake of Fe for females,
but only 35% (ranging from 22% with African nightshade to 51% with amaranth) of the
recommended intake of Zn. Lower dietary supply of Zn than of Fe associated with

37
consumption of AIV has also been reported in other studies (van Jaarsveld et al. 2014; Kruger
et al. 2015; van der Hoeven et al. 2016) indicating that leafy vegetables are a poorer source of
Zn than of Fe.
Table 2.13: Potential contribution (percentage) of a daily dish of 400 g fresh mass of various
vegetable species to the daily recommended intake of mineral elements (RNI); RNI values of
male and female adults between the age of 19 and 65 years, and the data from table 2.12 were
used for calculation of the contribution.
Species Fe Zn Mg Ca
Male Female Male Female Male Female Male Female
Contribution of daily vegetable dish to RNI (% of RNI)
Exotic kale 73 34 17 24 81 96 136 136
Ethiopian kale 204 95 26 38 86 102 114 114
African nights. 168 78 16 22 81 96 58 58
Amaranth 321 150 36 51 240 284 166 166
Cowpea 263 122 21 31 110 130 134 134
Spider plant 226 105 32 46 159 188 168 168
ø all species 209 97 25 35 126 149 129 129
For dietary supply of elements, not only the amount of element intake but also the
bioavailability (termed also “bioaccessibility”) of elements in the food is important. The
values for the contribution of a daily vegetable dish of 400 g fresh mass to the recommended
Fe intake (Table 2.13) are based on a bioavailability of 10%. In a study on 13 crude leafy
vegetables in India, the bioavailability of Fe as assessed by an in vitro test, varied between 6
and 44% (Fairweather-Tait et al. 2007).
Bioavailability of Fe depends on both, host factors, e.g., the iron status or infection with
malaria (Cercamondi et al. 2010), and food factors, i.e. the content of inhibitors and
promotors of Fe absorption (Ancueanau et al. 2015; Icard-Verniere et al. 2016). The content
of inhibitors, e.g. phytate, and promotors, e.g. ascorbic acid, in turn, is dependent not only on
species-specific plant traits, but also on post-harvest technology and food processing (Uusiku
et al. 2010; Grefeuille et al 2011; Gupta et al. 2013). It is often assumed, that Fe
bioavailability in vegetables in comparison to cereals is high due to high contents of ascorbic
acid and low phytate contents (Frossard et al. 2000). However, in leafy vegetables, external
Fe from dust and soil particles may substantially contribute to the Fe content. In our study, the
close relationship between Fe- and Al-concentrations clearly indicated external contamination

38
of carefully washed samples with Fe from soil (Fig. 2.4). In the study of Joy et al. (2015), the
mean contribution of soil particles to the Fe concentration of (carefully washed) leaves of
vegetables was 77%. For specific species, the contribution of soil particles was up to 97%
(Joy et al. 2015).
There is conflicting evidence for bioavailability of soil Fe for humans. In a study about
geophagy (soil eating) of pregnant women in Tanzania, it was found that soil consumption
was associated with an increased risk of Fe deficiency-induced anaemia, suggesting that soil
Fe is not bioavailable (Kawai et al. 2009). This is in agreement with other studies that show
that soil ingestion can potentially reduce the absorption of already bioavailable micro
elements (Hooda et al. 2004). In a recent study, however, it was found that external Fe from
contamination with acidic soil but not calcareous soil can make small contribution to Fe
nutrition (Gibson et al. 2015). Irrespectively, whether external Fe from soil contamination has
negative effects on bioavailability of internal plant Fe or can make small positive contribution
to Fe nutrition, we assume that our data in Table 2.13, which are based on a Fe bioavailability
of 10% overestimate the true potential contribution of vegetable consumption to Fe supply for
humans strongly. Thus, for assessment of potential contribution of leafy vegetables to dietary
Fe supply, more knowledge on bioavailabilty of Fe is needed.
For the other elements (Zn, Mg, Ca), the contribution of external soil contamination to the
measured element concentrations is expected to be substantially lower, as the concentrations
of these elements in soil are much lower. In line with this expectation, Joy et al. (2015) found
that the contribution of soil contamination with these elements was less than 6%. Therefore,
we assume that our data in Table 2.13 do not strongly overestimate the true potential
contribution of vegetable consumption to the dietary supply of Zn, Mg and Ca.

39
2.2 Nutritional value of AIVs: Heavy metal concentrations of samples from open air and
supermarkets in Nairobi
2.2.1 Abstract
Problems in food safety exist as a result of heavy metals accumulation in leafy vegetables in
urban and peri-urban small holder systems in sub Saharan Africa (sSA). Heavy metals like
cadmium (Cd) and lead (Pb) accumulation in plants discredits the nutritional and health
aspects found in leafy vegetables. Vegetables may be contaminated by heavy metals through
superficially adhering dust on edible surfaces or root uptake from soil and internal distribution
to edible organs. This study was done to measure heavy metals in edible plant organs of
vegetables sold on markets in Nairobi in order to assess potential health risks associated with
consumption of AIVs. Fresh samples of AIVs (African nightshade - Solanum
scabrum, amaranth - Amaranthus cruentus, cowpea - Vigna unguiculata, spider plant -
Cleome gynandra, Ethiopian kale - Brassica carinata) and a standard species commonly
grown in Kenya (exotic kale - Brassica oleracea acephala group) were collected from ten
open air and five supermarkets in Nairobi. Before elements were analysed, the edible parts of
the vegetables were washed with normal water and rinsed with distilled water to remove
elements associated with externally adhering soil /dust or not washed at all. Two heavy
metals, namely Cd and Pb, where measured. The results showed that heavy metal
concentrations were similar in samples from open air and supermarkets. Cd concentrations in
almost all the vegetables, apart from spider plant and Ethiopian kale, were higher in the dry
season compared to the wet season. About 98% of the samples did not exceed 2 mg Cd kg-
1 dry mass, indicating that vegetables may be safe for consumption. Washing with water
strongly reduced Pb concentrations (up to 59% for spider plant), indicating that external
adhering dust or soil can be a major source of heavy metals in vegetables.
Keywords: Heavy metals, health risks, leafy vegetables, surface contamination
40
2.2.2 Introduction
2.2.2.1 Heavy metals, their sources and effects to humans
Urban population is projected to increase to nearly a half of the total population by 2030 (UN
2014), this means that most of the food crops, vegetables included, produced will be grown
purposely to feed urban dwellers. However, heavy metal contamination in vegetables and
other food stuffs may be a threat to food safety especially in urban and peri-urban areas in
sub-Saharan Africa. Heavy metals, like some heavy metals, are naturally occurring metallic
elements with densities greater than 5g/cm3, which are toxic to humans, e.g. Cd and Pb
(Tchounwou et al. 2012). Elements like Cd and Pb are of environmental concern due to their
cumulative behavior in plants and human tissues (Stylianou et al. 2007; Taiwo et al. 2014)
since they are not degradeable (Lasat 1997; Gall and Rajakaruna 2013).
Chronic or acute accumulation of heavy metals in the human body may result in cancer,
genetic damage, mutations and damage of brain, kidney and bones (WHO 2007). These heavy
metals enter the food chain through natural and anthropogenic means. Industrial production,
transportation, agricultural activities and mining are key emitters of heavy metals (Tangahu et
al. 2011; Sardar et al. 2013), whose primary sources are use of municipal waste, sewage
sludge/waste water (bio solids), manures, burning of fossil fuels, iron ores smelting during
mining and use of pesticides and fertilizers (Nriagu 1979; Pendias and Pendias 1989; Wuana
and Okieimen 2011).
2.2.2.2 Accumulation of heavy metals in plants
Some plants avoid uptake of heavy metals (excluders), whereas some might take up these
elements through their roots, but transfer of heavy metals from roots into stems or transfer
from stem to leaves might be reduced (Sekara et al. 2005). Heavy metal concentrations in
different plant organs show following order in most cases: roots>stem>leaf>fruits (Andal
2016). Several factors govern the uptake of the heavy metals from the soil. Plants take up
elements selectively based on the transporters in their membranes. These transporters might
be selective for specific elements, e.g. Zn. Since Cd is very similar to Zn, Cd can be taken up
by the plant “accidentally” (Davila et al. 2011). Besides accumulation of heavy metals
through soil uptake, plants can also be contaminated with heavy metals through superficial
particulate deposit. The extent of contaminated deposit depends with the levels and type of
contaminants in the atmosphere, the atmospheric conditions and surface of the exposed part of
the plant (Gunawardena et al. 2013). Hairy leaf surfaces accumulate more traces of heavy
metals from the atmosphere than smooth surfaces, from which contaminants can be removed

41
by washing more easily. However, the surface contaminants can be removed by wind blow or
rains. Therefore, thoroughly washing of leafy vegetables before consumption may reduce or
even avoid the health threat of vegetables grown in contaminated soils (Oniang’o et al. 2005).
Green, leafy vegetables are the most susceptible plants to contamination by heavy metals,
followed by root crops, while most fruit trees are less susceptible to heavy metal
contamination (Ali and Al-Qahtani 2012). Thus, quality and safety measures of AIVs need to
be looked into, to minimize ingestion of heavy metals in human dietary intakes.
2.2.2.3 Aims
The aims of the study were equivalent to those stated in chapter 2, section 2.1 under sub
section 2.1.2.3, but with respect to heavy metals (Cd and Pb).
2.2.3 Materials and methods
Material and methods were as stated in chapter 2, section 2.1 under sub section 2.1.3
2.2.4 Results and discussion
Concentrations of heavy metals among different leafy vegetable species were determined. The
information will be vital to nutritionist in guiding consumers on proper ways of handling
vegetables before eating to avoid contamination. Extension officers and government agencies
will also use the information in advising farmers and traders on good agronomic and post-
harvest practices to avoid contamination with heavy metals. The effects of markets and
seasons were also determined (2.2.4.2 and 2.2.4.3) in order to understand nutrient variations
associated with market type and season.
2.2.4.1 Differences among species in the concentration of heavy metals
As stated earlier, the data collected from the markets was separated into data for washed
samples and unwashed samples, data from open air market and supermarket and data from dry
and rainy seasons. The data of washed samples were used to determine the heavy metal
concentrations in vegetable species. To get the concentrations of heavy metals in individual
crops, the data for seasons and markets were treated as one. In this study heavy metals
considered were Cd and Pb, because of their abundance in the environment and the health
effects associated with them. The presence of these elements may be a result of intensive use
of artificial P fertilizer by farmers, use of untreated water and automobile movement as well
as aerial collection of these heavy metal particulates.
Concentrations of Cd in the edible plant organs of the vegetables varied from a minimum of 0
to a maximum of 4.1 mg kg-1 leaf dry mass (Fig. 2.5a). The vegetable species varied in Cd

42
concentration within themselves; with African nightshade having a huge variation and exotic
kale a smaller one. The means were 0.37 mg Cd kg-1 leaf dry mass for exotic kale, 0.23 mg
Cd kg-1 leaf dry mass for Ethiopian kale, 0.48 mg Cd kg-1 leaf dry mass for African
nightshade, 0.24 mg Cd kg-1 leaf dry mass for amaranth, 0.30 mg Cd kg-1 leaf dry mass for
cowpea and 0.30 mg Cd kg-1 leaf dry mass for spider plant. The mean Cd concentrations did
not significantly differ among species although they varied from 0.23 mg Cd kg-1 leaf dry
mass for Ethiopian kale to 0.48 mg Cd kg-1 leaf dry mass for African nightshade (Table 2.13).
There were no significant differences in the Cd concentration between exotic kale and
Ethiopian kale and amaranth.
Figure 2.5: Box plots showing, minimum, first quartile, median, third quartile and maximum
cadmium (a) and lead (b) concentration levels (mg kg-1 leaf dry mass) of samples from
respective vegetable species. The dots represents (outliers) samples with extreme ranges from
the rest, determined by Q3 + 3*IQR or Q1 - 3*IQR formula; where, Q1 – first quartile, Q3 –
third quartile, IQR – interquartile range.
Table 2.14: Concentrations (mg kg-1 dry mass) of heavy metals in vegetable species (means ±
standard deviation). Columns with same lower case letters behind the means indicate no
significant differences between means (p > 0.05, ANOVA, LSD test)
Species Cd Pb
Element concentrations (mg kg-1 leaf dry mass)
Exotic kale 0.37 ± 0.83 a 0.19 ± 0.21 c
Ethiopian kale 0.23 ± 0.17 a 0.41 ± 0.41 b
African nightshade 0.48 ± 0.48 a 0.61 ± 0.45 a
Amaranth 0.24 ± 0.22 a 0.38 ± 0.22 b
Cowpea 0.30 ± 0.42 a 0.38 ± 0.32 b
Spider plant 0.30 ± 0.20 a 0.32 ± 0.17 bc
a b

43
Concentrations of Pb in edible organs of the vegetables ranged from a minimum of 0 to a
maximum of 1.7 mg kg-1 leaf dry mass (Fig. 2.5b). The range of Pb concentrations, which
covered 50% of all data, was generally similar to the range of Cd concentrations (compare the
extension of the boxes in Fig. 2.5a and Fig. 2.5b). The range of Pb concentrations was largest
for African nightshade and, smallest for exotic kale, Ethiopian kale and spider plant. The
meians were 0.19 mg Pb kg-1 leaf dry mass for exotic kale, 0.41 mg Pb kg-1 leaf dry mass for
Ethiopian kale, 0.61 mg Pb kg-1 leaf dry mass for African nightshade, 0.38 mg Pb kg-1 leaf
dry mass for amaranth, 0.38 mg Pb kg-1 leaf dry mass for cowpea and 0.32 mg Pb kg-1 leaf
dry mass for spider plant. The mean Pb concentrations significantly differed among species
(Table 2.14). The mean Pb concentration in vegetables had a minimum of 0.19 mg kg-1 leaf
dry mass for exotic kale and maximum of 0.61 mg kg-1 leaf dry mass for African nightshade.
Exotic kale had the significantly lowest concentration of Pb compared to all other species,
except for spider plant. No significant differences were observed among Ethiopian kale,
amaranth, cowpea and spider plant, but they all showed significantly higher Pb concentrations
than exotic kale.
Comparing the concentrations of Cd and Pb with previous research findings, it was found that
the average mean values of Ethiopian kale reported by Weldegebriel et al. (2012) were higher
than our findings, although our highest value was in line with their study. The study by
Nabulo et al. (2008), showed much higher concentrations of Cd and Pb in exotic kale and
amaranth than found in our study. Our results were also not in line with Kananke et al. (2014),
who found higher concentrations of Cd and Pb in amaranth species collected from 4 markets.
Other studies have also found high concentrations of Cd and Pb in vegetables within the cities
(Sharma et al. 2008b; Sharma et al. 2009). On the other hand, studies by Radwan and Salama
(2006) and Fang et al. (2014), found lower concentrations of Cd and Pb in leafy vegetables.
The variation in the concentration of Cd and Pb within vegetable species can be attributed to
soil factors at the production point i.e. soil pH, organic matter and soil moisture. Other factors
include species type, availability of the toxic soil elements and location/sites. That was why a
wide range of concentrations were seen within individual species and among vegetables
species (Sharma et al. 2007). For the case of Cd, phytoavailability of total soil Cd and plant
Cd uptake varies more significantly with plant species. Cd might be taken up through carriers
or channels that are actually meant for necessary ions (Rangnekar et al. 2013). Since cadmium
appears to be similar to other divalent ions that are necessary for cellular metabolism, e.g. Zn,
low Cd to Zn ratio interferes with Cd uptake among different species (Brown et al. 1995). Cd

44
is more likely translocated to the shoots/leaves than Pb, whose large portion is found in the
roots (Fontes et al. 2014). Plants with high tolerance for Cd are likely to take up substantial
amounts of the heavy metal through the plant roots and translocate it to the stems and leaves
(Smolders 2001; Uraguchi et al. 2009). On the other hand, Pb has got poor solubility in water
and thus plants don’t take up much Pb through the roots (Tangahu et al. (2011). Studies have
shown that more than a half of the amount of Pb taken up by the plants is retained in the roots
and not translocated to the stem and leaves. The ability for plants to bind Pb to the roots also
differs among the species (Rangnekar et al. 2013) since plant roots selectively absorb
nutrients from the soil.
To save humans from contaminated food, FAO/WHO set a limit for Cd content in food to 0.2
mg per kg fresh mass and for Pb to 0.3 mg per kg fresh mass (WHO/FAO 2006). Edible plant
organs exceeding these limits should not be sold and consumed. Most, if not all, of samples
collected in this study were within the recommended maximum limit for Cd and Pb
concentration in vegetables (Fig. 2.6), thus may be of less health concern.
0
20
40
60
80
100
120
0 1 2 3 4 5
Nu
mb
er o
f sa
mp
les
in
per
cen
tage
Concentration in mg kg-1 leaf dry mass% Cd % Pb
Figure 2.6: A line graph showing the distribution of samples (in percentages) based on
concentrations of Cd and Pb (mg kg-1 leaf dry mass) measured in vegetable species.
2.2.4.2 Effects of market types on heavy metal concentrations in vegetable species
To determine the effect of market type on heavy metal concentrations in vegetable species,
unwashed vegetable data were used, where wet and dry season data were combined and
analysed for respective markets to get the mean concentrations for respective vegetables.

45
According to the study, few vegetable species showed differences in heavy metal
concentrations between supermarkets and open air markets (Table 2.15). There were no
differences between markets in Cd concentrations in exotic kale, Ethiopian kale, African
nightshade, amaranth and cowpea. Differences in Cd concentrations between markets were
seen in spider plant, where the concentration was higher in open air market (0.3 mg kg-1 leaf
dry mass) than in supermarkets (0.19 mg kg-1 leaf dry mass). The study also showed that Pb
concentrations in all the vegetables species were not different between the two markets.
The study is in agreement with Fang et al. (2014) who found Cd and Pb concentrations in
leafy vegetables from traditional markets and supermarkets in China to be relatively equal. It
was expected that supermarkets will have the highest Cd accumulations in the vegetables,
while the open air markets will have high levels of Pb. Due to the probability of Cd
contamination by the use of phosphate fertilizers, P concentrations of all species were
analyzed, see previous chapter (Table 2.7) and higher concentrations of P were found in
exotic kale and amaranth collected from super markets. The presence of Cd in vegetables
found in the markets could be attributed to application of fertilizer among farms in the
production of AIVs. The concentration of Cd in exotic kale from the supermarket was almost
two times higher than in exotic kale from the open air market, although not significantly
different. This might be related to the higher P concentrations in supermarket vegetables. The
assumption is, most farmers who produce for the supermarkets are likely to give more
preference to exotic kale than AIVs.
Table 2.15: Effects of market type on concentrations (mg kg-1 leaf dry mass) of heavy metals
in vegetable species (means ± standard deviation). Rows with same lower case letters behind
the means indicate no significant differences between means of a particular element (p > 0.05,
ANOVA, unpaired T-test, n = 10 for open air markets, n = 5 for supermarkets).
Species Cd Pb
Open air market Supermarket Open air market Supermarket
Element concentrations (mg kg-1 leaf dry mass)
Exotic kale 0.27 ± 0.39 a 0.49 ± 0.69 a 0.24 ± 0.21 a 0.20 ± 0.11 a
Ethiopian kale 0.17 ± 0.11 a 0.20 ± 0.15 a 0.61 ± 0.35 a 0.49 ± 0.29 a
African nightshade 0.38 ± 0.28 a 0.45 ± 0.58 a 0.87 ± 0.55 a 0.64 ± 0.44 a
Amaranth 0.26 ± 0.24 a 0.26 ± 0.27 a 0.72 ± 0.63 a 0.63 ± 0.22 a
Cowpea 0.17 ± 0.20 a 0.17 ± 0.16 a 0.82 ± 0.96 a 0.75 ± 0.55 a
Spider plant 0.30 ± 0.16 a 0.19 ± 0.01 b 1.07 ± 0.79 a 1.24 ± 0.08 a

46
2.2.4.3 Effects of seasons on heavy metal concentration in vegetables species
To determine the seasonal effects on heavy metal concentration in vegetable species,
unwashed vegetable data was used by combining the data from both markets for a particular
season and means for specified vegetables were generated. The means for vegetable species
collected during the wet and dry seasons were compared by T-test analysis procedure.
Heavy metal concentrations in vegetables significantly differed between seasons (Table 2.16).
Exotic kale (0.55 mg kg-1 leaf dry mass), African nightshade (0.54 mg kg-1 leaf dry mass),
amaranth (0.39 mg kg-1 leaf dry mass) and cowpea (0.26 mg kg-1 leaf dry mass), had
significantly higher Cd concentrations in dry season than wet season. Spider plant and
Ethiopian kale did not show any seasonal effects in Cd concentration. Although differences
between seasons in Pb concentration were traced in Ethiopian kale and spider plant, the
seasonal effects were interchangeably. The Pb concentration in Ethiopian kale was highest in
wet season (0.74 mg kg-1 leaf dry mass) while spider plant was highest in dry season (1.44 mg
kg-1 leaf dry mass). The remaining vegetable species did not show significant differences
between seasons.
Table 2.16: Effects of seasons on concentrations (mg kg-1 leaf dry mass) of heavy metals in
vegetable species (means ± standard deviation). Rows with same lower case letters behind the
means indicate no significant differences between means of a particular element (p > 0.05,
ANOVA, unpaired T-test).
Species Cd Pb
Dry season Wet season Dry season Wet season
Element concentrations (mg kg-1 leaf dry mass)
Exotic kale 0.55 ± 0.64 a 0.13 ± 0.17 b 0.18 ± 0.11 a 0.28 ± 0.22 a
Ethiopian kale 0.22 ± 0.14 a 0.13 ± 0.07 a 0.41 ± 0.23 b 0.74 ± 0.34 a
African nightshade 0.54 ± 0.51 a 0.28 ± 0.20 b 0.75 ± 0.55 a 0.84 ± 0.52 a
Amaranth 0.39 ± 0.30 a 0.13 ± 0.07 b 0.86 ± 0.69 a 0.53 ± 0.29 a
Cowpea 0.26 ± 0.23 a 0.07 ± 0.06 b 0.59 ± 0.70 a 1.0 ± 0.96 a
Spider plant 0.31 ± 0.14 a 0.26 ± 0.19 a 1.44 ± 0.71 a 0.57 ± 0.38 b
The present results agree with Sharma et al. (2007) who found the uptake, distribution and
accumulation of Cd in Beta vulgaris – belongs to amaranthaceae family - higher during the
summer season, whereas it accumulated more Pb in the winter season. The finding in this

47
study differs with findings from Birnin-Yauri et al. (2011) on Pb concentrations. The study
found Pb concentrations higher in leafy vegetables, sampled from fields during the rainy
season. Most studies have shown that, the concentrations of Cd found in most crops are a
result of plant uptake from the roots and not atmospheric contamination (Smolders 2001;
Manara 2012). The high levels of Cd concentrations in the dry season were an indication that
Cd can be highly absorbed by plants under high soil temperature and low soil moisture.
Rieuwerts et al. 1998, found that in soils with excess water, Cd solubility was reduced,
minimizing the ability of Cd to be taken up by the plants, resulting in low Cd concentrations
in plants. Smolder (2001), stated that the uptake of Cd by plants is determined by soil factors
and not total Cd content in the soil. Cd solubility is increased with decrease in soil pH and
organic matter content (Szabela et al. 2015). The high uptake of Cd during the dry season may
be attributed to high rate of transpiration due to high soil temperature (Ingwersen and Streck
2005). High decomposition rates during the dry season can release cadmium bound to organic
material into the soil solution, from which it can be uptaken by plants (McGrath et al. 1994).
It was expected that Pb concentration will be high in vegetables collected during the dry
season (as a result of atmospheric deposition), but that was not the case. Exotic kale and
spider plant never showed any effect between seasons with Cd, however they showed changes
in Pb concentration under different seasons. Cowpeas showed high levels in the dry season
and exotic kale in the wet season, so this cannot rule out atmospheric deposition. The
accumulation of Pb in plants is basically a result of contamination, because plants take up
little Pb through their roots. The presence of almost equal Pb concentrations could be an
indication that most Pb contamination took place at the markets. Since markets were in one
locality there was possibility of equal atmospheric deposition of contaminants throughout the
year. Although, during the rainy season wash out of surface attached elements often occur
(Wong 2003; Sharma 2008b), this might mainly happen at farm level.
In order to understand whether the concentrations of Cd or Pb could be a result of
atmospheric contamination or not, a correlation analysis between Al and Cd was done (Fig
2.7 and 2.8). Al is an element, which is not translocated from root to shoot in most species.
Thus, Al concentrations in shoots are an indicator of contamination of the shoot with dust. In
dust, Al is always existing and at a higher concentration.
There was a positive relationship between the concentrations of Al and Pb (R2 = 0,16)
indicating that Pb found in vegetables species could be as a result of atmospheric
contamination with soil/ dust. On the other hand, there was neither a positive nor negative

48
relationship between the concentrations of Al and Cd in vegetable species (Figure 2.8)
indicating that Cd found in vegetables was not a result of atmospheric contamination.
Figure 2.7: Relationship between Al and Pb concentrations (mg kg-1 leaf dry mass) in
vegetable samples, n = 140; R2 = coefficient of determination.
Figure 2.8: Relationship between Al and Cd concentrations (mg kg-1 leaf dry mass) in
vegetable samples, n = 140; R2 = coefficient of determination.
Washing of the samples was done to identify the heavy metals that can be removed and the
amount likely to be eliminated in each vegetable species. To arrive at this, both, unwashed
and washed data of the vegetable samples were considered and analysis was done separately.

49
Before analysis all the seasons and markets were combined for individual vegetable species.
The respective data from unwashed samples were subtracted from washed data then divided
by its respective unwashed data and multiplied by 100. Thereafter, means were generated and
mean comparison among vegetable species determined.
The results showed that Cd was not reduced by washing (Table 2.17). This was indicated by
negative reduction. On the other hand, washing of samples did not have any effect on the Pb
concentration of exotic kale and African nightshade. Washing reduced Pb concentration to
27% in Ethiopian kale, 38% in amaranth, 42% in cowpea and 59% in spider plant.
Table 2.17: Reduction of Cd and Pb concentrations in percent due to washing vegetable
species with water (Mean ± standard deviation). Columns with same lower case letters behind
the means indicate no significant differences between means (p > 0.05, ANOVA, LSD test).
Species Cd Pb
Percentage (%) elements reduction
Exotic kale -117 ± 57 a -43 ± 38 b
Ethiopian kale -92 ± 47 a 27 ± 13 ab
African nightshade -43 ± 23 a -2.2 ± 27 ab
Amaranth -3.5 ± 13 a 38 ± 6 a
Cowpea -133 ± 47 a 42 ± 7 a
Spider plant -9.4 ± 22 a 59 ± 9 a
The reduction of Pb among Ethiopian kale, amaranth and spider plant was not significant
from each other. This study is in agreement with Sattar et al. (2013), who found different
washing methods to have a greater effect on Pb and Cd reduction on vegetables with tap water
having a reduction of 4-6% in Cd concentration and 6 – 9% in Pb. These results agree with
Sharma et al (2007) on reduction of Pb concentration in vegetables but disagree with this
study’s findings on effect of washing on Cd concentration. Generally, previous studies have
found reduction of Cd concentrations in the leafy vegetables contrary to this study (Sing et al.
2004; Perveen et al. 2011). Leafy vegetables are known to accumulate a lot of Cd and Pb, due
to environmental pollution, compared to other vegetables found in the market (Sharma 2009)
and in this study high atmospheric accumulation was shown by Pb unlike Cd, although
significant differences between the heavy metals were not tested. Among the vegetables,
AIVs accumulated higher Pb concentrations compared to exotic kale. This could be due to
low surface area to volume ratio of the kales compared to the AIVs.
50
Pb found in leaves of plants resulted rather from contaminated particulates of the air attached
to the leaf surface, than from uptake of Pb by roots and translocation into stem and leaves,
because lead is taken up rarely and thus accumulated in the roots (WHO, 2007). Whereas Cd,
due to its similarity to Zn, might be taken up by Zn transporters and translocated to stems and
leaves inside the plant and can therefore not be removed by washing the leaf surface like in
case with Pb.
2.2.5 General discussion and recommendation
The key focus in discussion was based on the ability of washing to remove surface adhered
particulates and whether the heavy metals found in the vegetables are not exceeding limits of
allowed concentrations of these toxins.
Vegetable species differed in the Cd and Pb concentrations. The range of mean Cd and Pb
concentrations were 0.23 - 0.48 and 0.20 - 0.61 mg kg-1 leaf dry mass (Table 2.14). Despite
the concentration of Cd and Pb in African nightshade being higher than in other vegetable
species, the concentrations were within the permissible levels allowed in leafy vegetables
(WHO/FAO 2006). Sometimes vegetables may contain minimum toxic concentrations, but
continuous or long term uptake might result in high accumulation of heavy metals in the body
and thus leading to health complications. For that case, further calculations were needed to
determine, whether the vegetables collected in this study will eventually have some health
effects in the long run (Table 2.18). Using the average vegetable intake in urban and rural
Kenya of 2.88 and 1.46 kg fresh mass/person/week respectively (Ruel et al. 2005),
computations on weekly Cd uptake were determined based on the concentrations of Cd found
in the vegetables under this study. It is recommended and care should be taken not to exceed
the human tolerable weekly Cd intake of 0.175 mg and 0.406 mg Cd week-1 person-1 (70kg
body weight) according to European food safety authority, EFSA and Joint FAO/WHO
experts committee on food additives, JECFA, respectively (Clemens et al. 2012). The
permissible Pb intake is 1.8 mg Pb week-1 person-1 (WHO 1995).
The potential dietary intake of heavy metals was calculated to determine the suitability of
leafy vegetables for consumption (Table 2.1.8). The concentrations of Cd in all the vegetables
were below the weekly EFSA recommendations for Cd, but were above provisional safe
intake limits prescribed by agency for toxic substances and disease registry, ATSDR of 0.049
mg Cd week-1 person-1 (Clemens et al. 2012), in all vegetables in urban area and for African

51
nightshade, cowpea and spider plant in rural area. On the other hand, the calculated Pb
concentrations were below the weakly intake limit levels.
Table 2.18: Potential Cd and Pb intake (mg person-1 week-1) when an average of 2.88 kg of
vegetables per adult per week in urban and 1.46 kg of vegetables per adult per week in rural
Kenya is comsumed. Calculations were based on the mean values across markets and growing
seasons (Table 2.14) and the assumption of a dry matter content of edible organs of 11% for
exotic and Ethiopian kale, 8% for African nightshade, 13% for amaranth, and 14% for cowpea
and spider plant.; XK – exotic kale, EK – Ethiopian kale, AN - African nightshade, AM -
amaranth, CP - cowpea and SP - spider plant.
Species
Mean urban Cd
intake (2.88 kg
vegetable person-1
week-1)
Mean rural Cd
intake (1.46 kg
vegetable person-1
week-1)
Mean urban Pb
intake (2.88 kg
vegetable person-1
week-1)
Mean rural Pb
intake (1.46 kg
vegetable person-1
week-1)
Intake (mg Cd person-1 week-1)* Intake (mg Pb person-1 week-1)*
XK 0.076 0.039 0.063 0.032
EK 0.073 0.037 0.127 0.064
NS 0.111 0.056 0.141 0.071
AM 0.090 0.046 0.142 0.072
CP 0.121 0.061 0.153 0.077
SP 0.125 0.063 0.125 0.063
It was expected that vegetables drawn in the supermarkets will have high Cd concentrations,
while those from the open air markets will have high concentrations of Pb. The results
obtained from this study showed no differences in heavy metal concentrations in both markets
apart from spider plant, which was unique by containing higher Cd concentrations in the open
air market. The high concentrations of Cd in spider plant collected from open air markets
cannot be attributed to the use of phosphate fertilizer by farmers as they are known to contain
Cd (McLaughlin et al. 1999), since there was no indication of higher P concentration in spider
plant found in the supermarkets. This means that no one is under risk of heavy metal
contamination by either buying vegetables from the open air market or supermarkets, because
the level of exposure and contamination was almost the same.
The high concentrations of Cd element in some vegetable species during dry season were an
indication that Cd can be highly absorbed by plants under high soil temperature and low soil

52
moisture. Thus, growing of AIVs should be avoided during the dry season in areas with high
Cd concentrations in soil. Further research on moisture regimes to measure the Cd uptake by
AIVs is recommended to clearly affirm this conclusion as our study has found Cd uptake in
some vegetable species to be primarily dependent on seasons.
Increased contamination of Pb by atmospheric deposits was found in spider plant, cowpea and
amaranth. This can be attributed to leaf size/ area and surface of the edible plant organs of the
vegetables species. The hairy nature of spider plants, high canopy ability of amaranth and
broad leaved cowpea trapped more dust and aerosol particulates from the atmosphere unlike
exotic kale, which had a slippery surface due to waxy cuticle cover. Leaf surface
contamination needs to be further looked into, to determine the extent of contamination by
each species and the ability of the leaves to translocate the surface attached Pb into the
internal organs of the leaves and plants in general. Washing of the vegetables eliminated
traces of Pb, thus, measures for reducing contamination with Pb should be considered in the
whole value chain (Shackleton et al. 2009), from field (surface cover), post-harvest handling
(packaging) up to consumption (washing). For the case of Cd, effective measures should be
taken at the field (e.g. selection of site, adjustment of soil pH, use of phosphate fertilizer).

53
Chapter 3: Phosphorus use strategies of leafy vegetables: Responses of species to
different rates and forms of phosphorus supply
3.1 Abstract
Crop production for small holder farming systems of sub-Saharan Africa is often constrained
by low soil contents of plant-available phosphorus (P). A better and cheaper option, rather
than inorganic source of P to increase crop production, is cultivation of species with a high P
efficiency. A study was conducted to measure plant responses to low P availability in soil and
to determine variations among AIVs and one exotic species in their ability to use organic
P and sparingly soluble P forms. Six leafy vegetables (spider plant - Cleome gynandra,
African nightshade - Solanum scabrum, amaranth - Amaranthus cruentus, cowpea - Vigna
unguiculata, Ethiopian kale - Brassica carinata, and exotic kale - Brassica oleracea) were
cultivated under controlled conditions in pots. The substrate was amended with 49 mg P kg-
1 soil using four different forms (highly soluble KH2PO4, phytate as organic P source and
sparingly soluble FePO4 and rock phosphate). The ability to use soluble P- forms did not
differ among vegetable species, but utilization of sparingly soluble forms differed between
forms of P supplied to the soil and species. All species were able to use P from phytate for
biomass formation as effectively as P from KH2PO4. FePO4 was most efficiently used by
Ethiopian kale (14.4 g fresh mass plant-1) and exotic kale (12.8 g fresh mass plant-1), while
rock P was efficiently utilized by Ethiopian kale (19.6 g fresh mass plant-1) and cowpea (18.5
g fresh mass plant-1). The efficiency for utilization of sparingly soluble P forms (either
FePO4 or rock phosphate) was low in African nightshade and spider plant. The
vegetable species responded to different P treatments with significant differences in
morphological root traits and changes of rhizosphere pH. In average, the overall observed
rhizosphere pH across the treatments, varied from 3.4 in amaranth to 7.0 in Ethiopian
kale. Under P deficiency all species increased biomass partitioning to roots. African
nightshade and cowpea increased specific root length, while spider plant and amaranth
increased root hair density and length in P depleted treatment. Thus, vegetable species showed
large variations in root traits relevant for P acquisition and their ability to use soil P from
different sparingly soluble P forms. For that case, species and site-specific properties have to
be considered to choose optimal plant species for certain fields containing known P-forms in
soil.
Key words: P acquisition, rock phosphate, phytate, rhizosphere pH, root morphology

54
3.2 Introduction
3.2.1 Soil phosphorus pools and their availability to plants
Low P availability in agricultural soils is a major constraint to better crop growth, quality and
yield. P is among the most quantitatively needed minerals, besides N and K, needed by plants
to perform processes such as respiration, photosynthesis, energy generation, N2-fixation,
carbohydrate metabolism, glycolysis, respiration, enzyme activation/inactivation and redox
reactions and is part of several plant structures (e.g. phospholipids, Vance et al. 2003; Balemi
and Negisho 2012). Sufficient availability of P for plants promotes early maturity, enables far-
reaching, vigorous root development and support resistance to diseases among plants. P
deficiency may result in reduced growth rate, increased production and secretion of
phosphatases, exudation of organic acids, increased root growth and modified root
architecture, increased root surface area and increased expression of pi transporters (Vance et
al. 2003).
Plants take up P from the soil rhizosphere within the reach of the roots. Soil P exists in two
main chemical forms including inorganic P (Pi) and organic P (Po). Po tend to be high in most
Alfisols soils of tropical Africa constituting about 30 - 50% of total P (Reddy et al. 2005),
while Pi in the soil ranges from 35 - 70% of the total P. Primary P minerals,
like variscite, apatites or strengite are not readily available to plants as a result of slow release
of available P by weathering processes, although direct application of apatites (Rock P) has
proven to be effective for crops grown in acidic soils (Shen et al. 2011). Three main pools of
P exist in soil, namely solution P, active P and fixed P. Solution P comprises mostly inorganic
P and small amounts of organic P and represents the pool from which plants take up
P. Active P is a solid phase of P easily released to the soil solution, thus remaining as a source
of available P to crops. Active P is made up of organic P that is readily mineralized and
inorganic phosphate that is adsorbed to Ca and Al to form soluble solid P. Fixed P contains
insoluble inorganic P and organic P resilient to mineralization. This pool is no longer
available to plants and may exist in the soil for years, thus having little impact on P soil
fertility (Balemi and Negisho 2012). At low pH and presence of Fe/Al, P is fixed as Fe-/Al-P,
at high pH and presence of Ca, P is fixed as Ca-P. Soil solution typically contains around
2 μM Pi, while plants show concentrations of Pi from 5 to 20 mM (Bieleski 1973). The
optimal pH for effective uptake of inorganic P ranges between 4.5 and 5.0 (Raghothama
1999; Vance et al. 2003), highest uptake rates are at pH 5.0 - 6.0, where H2PO4-
dominates (Schachtman et al. 1998). In mineral soils larger portions of P ions get to plant

55
roots through diffusion. Only small portion of phosphate ions (1-5% of plant demand) reach
the root surface via mass flow (Balemi and Negisho 2012). Two main factors affect plant/crop
P content, one factor is the uptake ability by the crop and the other factor is phosphorus
availability in the soil solution (Beegle and Durst 2002). Thus, in most food crops, the P
concentration ranges from 0.05 to 0.50% dry weight (Vance et al. 2003).
Understanding of P dynamics and movement from soil to plant calls for improving P-uptake
efficiency and proper phosphorus management thus reducing the need for high input of
inorganic fertilizer.
3.2.2 Plant traits relevant to soil phosphorus acquisition
Plants take up P from the soil solution in form of anions. The ability to take up P is
determined by the plant species and the available soluble P in the rhizosphere (Hammond et
al. 2009). Variation of P uptake in plants is majorly determined by physiological and
biochemical factors; P transporters, root morphology (specific root length, root diameter, root
hairs), the mycorrhiza symbiosis mechanism and rhizosphere processes (or-ganic acid release,
pH adjustment, phosphatase activity) among other traits (Gahoonia1 and Nielsen 1996).
Deficiency of plant available P in the soil has been a worldwide problem to many agricultural
crops. Reducing P demands can enhance phosphorus sustainability in crop production
systems. Under low supply of P, plants have adopted strategies to improve P acquisition and
growth. Some of these strategies include root foraging to improve spatial soil exploitation, P
mining strategies to enhance desorption, solubilization or mineralization of soil P and
improving internal P utilization efficiency (Richardson et al. 2011). Plant species behave
differently towards the four forms of P existent in the soil (Table 3.1). Thus, different plant
characteristics will emerge.
Table 3.1: Plant traits related to P efficiency for different forms of soil P.
Plant trait/rhizosphere characteristic Effective for
Internal use efficiency (biomass formation per unit plant P) All P forms
Root surface (e.g., root hairs, specific root length) All P forms
Rhizosphere phytase activity Organic P
Low rhizosphere pH, release of carboxylates (e.g., citrate) Calcium-P
High rhizosphere pH, release of carboxylates (e.g., citrate) Fe-P, Al-P

56
3.2.3 Soil phosphorus status in small holder farming systems in sSA
Phosphorus depletion in Rwanda, Ethiopia and Kenya soils is at an alarming state, where
annual depletion rates go beyond 6.6 kg P ha−1 (Smaling et al. 1997). The main causes of P
deficiency vary from intensive cultivation without adequate nutrient replenishment, farming
systems, to water erosion. Besides P losses, soils in East Africa, which comprise
acrisols, ferralsols and nitisols are prone to fixing P in the soils due to their acidic nature.
Wealth status of farmers has contributed immensely to variability of mineral fertilizer use
between the rich and the poor (Zingore et al. 2007). In most cases poor farmers have found
mineral fertilizers being inaccessible and unaffordable leading to less or no application of
fertilizers, resulting in poor crop growth and yield.
Crop growth and yield has been significantly improved by application of P fertilizer, which
has caused increased environmental risks, adsorption of P leading to high accumulation of P
in the soil and low P utilization efficiency (Li et al. 2011). Farmers mainly use P fertilizers
and organic P in form of animal manure and compost. In the process, only 10 - 25% of the
applied P is utilized by the plants, the rest is adsorbed by the soil (about 70-90%) and
transformed into a form that is not available to plants (Wang et al 2015; Bai et al. 2016). This
implies that much P fertilizer is needed to achieve a higher yield, thus become too costly for
smallholder farming systems.
To enhance food productivity among the resource poor farmers, reliable and reasonably
priced mineral P fertilizer is needed, which has been a challenge in most countries. Thus, the
best option is to identify crop varieties, with ability to withstand P poor soils and produce an
equivalent high yields (George et al. 2016). The study and selection of species with great P
efficiency will result in high use of soil P, increased P fertilizer uptake efficiency leading to
reduced fertilizer requirements (Shujie and Yunfa 2011). Hence there is need to protect the
environment and improve yield, since vegetables demand more P fertilizers as compared to
other crops. This is why this study was conducted to measure plant responses to low P
availability in soil and to determine variations among AIVs in their ability to use organic P
and sparingly soluble P forms in comparison to soluble P. Currently, there is no available data
on the utilization of P forms by AIVs and their interaction effects on P deficient soils.
3.2.4 Aims
In this study, the accumulation of P in plant species and internal P utilization efficiency was
quantified under different P treatments in order to examine, which vegetable species can
perform well under the investigated P forms. The information obtained will act as a guideline

57
to farmers, which vegetables species to choose for production as a function of soil type found
on their farm/field. Specifically, we were interested to know whether AIVs can yield more,
when grown in soils with different P forms, than exotic kale. It is known that different crop
species have different ability to take up different forms of P in the soil. This is based on the
type of species and ability of plant roots to exploit soil and modify the rhizosphere in order to
obtain sparingly and highly soluble phosphorus from all directions within the soil rhizosphere.
Since the vegetable species investigated were drawn from different plant families, there are
possibilities for some of them to have high affinity for either organic, sparingly or highly
soluble P. Through yield, we shall be able to determine which species can yield more with
less P uptake and vice versa.
It is known that plants adapt to P limitations by changing root length, fine root density,
rhizosphere pH and/or biomass partitioning, as mentioned above. So these parameters were
analyzed in all AIVs and exotic kale. The different forms of P considered for the analysis
were KH2PO4 representing the mineral/ highly soluble phosphorus form, phytate representing
the organic P form and Fe-P as well as rock phosphate representing adsorbed P in acidic soils
and calcareous soils, respectively.
3.3 Material and methods
3.3.1 Study area
The experiment was conducted in the glass house at Humboldt University, Research Institute
Albrecht Thaer Weg – Dahlem in the south-west of Berlin. The study was done during the
autumn period (14th October to 26th November 2015). The temperatures in the glass house
were regulated between 20 - 25oC during the day and between 18 - 20oC at night using
automated greenhouse control system. Light from electrical bulbs were used to provide
artificial lighting to enhance plant light hours and radiation between 0530 – 0800 hrs and
1630 – 1900 hrs. This was to ensure that the conditions are in conformity with
the sSA mean temperature and light durations.
3.3.2 Experimental design
The experiment was set up as a two factorial experiment with six species (spider plant -
Cleome gynandra, cowpea - Vigna unguiculata, amaranth - Amaranthus cruentus, African
nightshade - Solanum scabrum, Ethiopian kale - Brassica carinata and exotic kale -
Brassica oleracea acephala) and five P treatments (49 mg P per pot in the form of potassium
phosphate - KH2PO4, phytate, iron phosphate - FePO4, rock phosphate - CaPO4 and
no P). Each treatment comprised four replicates, resulting in a total of 120 pots (Fig.

58
3.1). Nutrients were added to each pot in the quantity indicated in Table 3.2. Vegetable seeds
planted were purely bred and supplied by the World Vegetable Centre (AVRDC) located in
Tanzania. During pot set up, 49 kg P pot-1 (Table 3.2) was mixed with the substrate as
described in section 3.3.3, except for the -P pots. A complete randomization of treatments
within each replicate and randomization of species among replicates were done. This was
achieved by labeling species and their treatments, then a table of random numbers was used to
select from the labelled subjects.
Figure 3.1: Arrangement of pots in the glass house; where A - a photo showing the manner in
which pots with growing vegetables were arrangement in one of the four replicates, B – a
photo showing the arrangement of pots in the four replicates with different vegetable species
arranged horizontally and treatments arranged vertically (n=120).
A
B

59
Table 3.2: Macro nutrients applied at the start of the experiment in mg per pot within the
different P treatments and levels (n = 120).
Treatment P N K Ca Mg S
mg pot-1 mg pot-1 mg pot-1 mg pot-1 mg pot-1 mg pot-1
without P 0 61 62 82 18 53
KH2PO4 49 61 62 82 18 53
Rock P 49 61 62 82 18 53
FePO4 49 61 62 82 18 53
Phytate 49 61 62 82 18 53
3.3.3 Substrate and pots
Before planting, sand granules were thoroughly washed and rinsed several times with distilled
water to wash out adsorbed P on the surfaces of sand and any other minerals that may be
present in sand. The washed sand was air-dried for three days. After drying, sand was mixed
with non-fertilized soil, whose chemical composition was known, in the ratio of 60:1 (1.2 kg
sand and 20 g soil) during individual pot filling. The purpose of the soil was to provide soil
microorganisms. Soil bulk density was adjusted to 1.3 g/cm3in each pot.
3.3.4 Planting, watering and general plant management
Due to different speed in germination and biomass production at the start of the growth
period, planting of the different species was done on different days, starting with the species,
which develops slowest at the beginning of our experiment. Ten seeds of Amaranth were
planted in each pot on the first day (14th October, 2015), followed by spider plant and African
nightshade (both 10 seeds/pot) on 15th October. The kales (Ethiopian and exotic) were planted
on 16th October, 2015 and cowpea was the last species to be planted on 19th October with four
seeds planted in each pot. The crops differed in crop emergences with Cowpea taking three
days to emerge whereas the rest took at least five days to fully emerge from the soil.
First thinning was done on 27th October, where only four plants were left on each pot
containing spider plant, amaranth, African nightshade, Ethiopian and exotic kale. For
cowpeas, two plants were left per pot. The second thinning was done six days after first
thinning, whereby, only one plant was left, for all the species, to grow until harvesting.

60
Additional 0.25ml of 0.5M ammonium nitrate were applied sequential to all the pots on
28th October, 4th November and daily starting from 9th November. Watering of the pots up to
80% water holding capacity (equivalent to approximately 236 ml) was done daily. Before
watering, the pots were placed on a weighing balance to determine the amount of water lost as
a result of evapotranspiration. The amount was recorded for later tabulation and comparison.
After noting the amount of water lost, each pot was filled up to the required weight.
Monitoring of water levels was done to ensure that it did not drop below 40% water holding
capacity. The times of watering doubled when nearing harvesting time. Water loss was high
(especially for cowpeas and African nightshade), thus watering was done in the morning and
evening. The second and last reapplication of N, K, Mg, S and micronutrients was done on
17th November with same rates as shown in table 3.2.
3.3.5 Measurement of biomass
All the vegetable species were harvested on 26th November 2015. Plant height was recorded
and vegetables were harvested by cutting the stem 5 cm above the soil and the above ground
biomass fresh weight was recorded and afterwards packed in a bag and oven-dried at 70°C for
two days.
The rhizosphere pH was determined by adding 100 ml more water than needed to reach 100%
of water holding capacity. The leachates were collected in a beaker and pH measurements
were done immediately using a pH meter. The recorded pH readings were compared with the
initial soil pH (6.0) taken before planting. Thereafter, the substrates in each pot were carefully
removed and a subsample of each substrate was air-dried and later taken for analysis.
All the roots in each pot were carefully removed by soaking them in distilled water in order to
loosen the attached soil and facilitating to remove the roots. The roots were immediately
placed in a beaker containing water to avoid any mineral loss or drying. Root samples were
used to determine root length, root hair density, root diameter and fresh weight. After root
characterization, root samples were dried at 70°C. Dried samples (root and shoot)
were crushed in a ball mill (Retsch type MM2) for approximately two minutes into powder
form. The powder was then packed in small labeled plastic bottles for chemical analysis.
3.3.6 Analysis of morphological root traits
The roots were taken to the laboratory for further preparations. First, whole roots for each
species planted under different phosphorus forms were mounted on the wall and a photo of
the structure was taken. Sub samples of the roots from KH2PO4, rock P and without P
61
treatments were picked for scanning. Root fly (Birchfield 2008) and Gimp 2.8 software (Matti
1995) were used to determine root length and diameter from the scans. The roots
from KH2PO4, rock P and without P treatments, were observed through high level concave
lenses (1 or 2 mm diameter) microscope to analyze the number and distribution of root hairs.
Root hair density was determined by counting the number of root hairs taken from ten
different roots of the same treatment and divided with the lens diameter.
3.3.7 Chemical analysis
250 mg of each powdered sample was weighed in a glass bottle and burned in a furnace
chamber at 500o C for 12 hours. The samples were cooled and 2.5 ml of nitric acid (1:3
diluted 65% HNO3) was added, then placed in a burner to evaporate the acid. Again samples
were placed in a furnace chamber at 500o C for 2 hours. The samples were cooled and the
residue dissolved in 2.5 ml of 1:3 diluted 37% hydrochloric acid. The mixture was then
transferred to a 25 ml flask and double distilled water was added up to the mark. The liquid
was then filtered into a clean well labeled plastic bottle using size 42 filter paper. The filtered
liquid was subjected to Inductively Coupled Plasma with Optical Emission Spectroscopy
(ICP – OES) analyzer for macro and trace element determination in the vegetable sample.
3.3.8 Calculation of apparent, relative and internal phosphorus use efficiency
Apparent values were calculated by taking the values of P concentration or dry weight
values or root to shoot ratio obtained from treatment without P and subtract them from
KH2PO4, phytate, rock P and FePO4treatments.
Relative values of P concentration, dry weight and root to shoot ratios were calculated based
on the KH2PO4 treatment; all the values for this treatment were treated to be 100%, thus
relative value was equal to value from either phytate, rock P or FePO4 dived by values
from KH2PO4 of the respective species multiplied by 100. Internal phosphorus use efficiency
was equal to dry mass produced by a particular species divided by phosphorus uptake of the
same species.
3.3.9 Statistical analysis
Data on plant biomass, plant P concentrations, root morphology and rhizosphere leachate pH,
were analysed using R statistical software for means and standard deviation. The residuals
were tested for normality using q-q plots, histogram and density mean. Homogeneity of
variances was tested using Bartlett’s test for equal variance. ANOVA was performed to

62
determine statistical differences (p < 0.05) among treatments and species. A further post hoc
LSD test for mean separation was also done.
3. 4 Results and discussion
In this section we first (3.4.1) consider the effects of the P treatments (different P forms) on
shoot fresh mass. Shoot fresh mass is sold by the farmers, and thus, from the farmers’ point of
view is presumably the most important parameter for assessing P-form effects, and answering
the question if species differ in their yielding ability on fields in which different forms of P
are prevailing. Second (3.4.2), we consider the effects of the P treatments on total plant
biomass. About 45% of the plant biomass is consisting of organic C. Thus, from the
agronomists´ and crop physiologists´ point of view, total plant biomass is an important
parameter for assessing the ability of species to use different P forms in soil for C
assimilation. Differences among species in the ability to use various external P forms may
result from uptake efficiency, and internal P utilization efficiency. To assess the role of uptake
and internal P utilization efficiency for explaining species-specific P form effects, we then
consider effects of the P treatments on P accumulation (3.4.3), and biomass production per
unit of accumulated P (3.4.4). In response to different P supply, plants may change biomass
allocation between organs responsible for acquisition of soil resources (i.e. roots) and organs
responsible for acquisition of light and CO2 (i.e. shoots). Another class of responses is change
of morphological and physiological root characteristics. All these changes may lead to
increased plant fitness, and thus, may be regarded as plant adaptation to a specific rate and
form of P supply. In the last section (3.4.5) we present data on species-specific responses to
assess, whether these responses may explain species differences in P use efficiency, and the
use of different P forms.
3.4.1 Effect of P treatments on yield (shoot fresh mass)
Phosphorus treatment effects became visible about two weeks after plant emergence. The
most obvious visible P treatment effects were differences in total plant growth and leaf size,
whereas typical symptoms of P deficiency described in textbooks, such as senescence of basal
leaves, dark green colour and reddish marbling of non-senescent leaves and stems were nearly
absent (Fig. 3.2).
At harvest, the shoot fresh mass was significantly influenced by species and P treatment,
whereby the P treatment effect was dependent on species (significant interaction species x P
treatment) (Table 3.3). In plants supplied with readily soluble inorganic P (KH2PO4), shoot

63
fresh mass decreased in the order cowpea > Ethiopian kale and African nightshade > exotic
kale > spider plant and amaranth.
Figure 3.2: Appearance of vegetable species 4 weeks after sowing. Each tray represent a
particular species with vegetables in the pots arranged systematically according to the P forms
(treatments) used. In each tray, starting from the top left moving in clockwise direction, the
treatments are; rock P, without P, phytate, KH2P04 and FePO4, where A – exotic kale, B -
Ethiopian kale, C – African nightshade, D – amaranth, E – cowpea and F – spider plant.
This show that under conditions, in which P was not limiting for plant growth, shoot fresh
mass differed among species. Possible reasons for growth differences under these conditions
include the rate of emergence and infestation with seed-borne diseases (Bachelor-thesis
Hoeppner).
A B
C D
E F

64
Shoot fresh mass of plants supplied with organic P in the form of phytate did not significantly
differ from that of plants supplied with KH2P04. This indicates that phytate was a good source
of P supply for all species (Table 3.4). This is in agreement with studies on other crop species
(Abel 2011). It is well documented, that phytases derived from plants and/or microorganisms
can release orthophosphate P from phytate, and thus make phytate-P available for plants
(Richardson et al. 2011).
Table 3.3: Effect of P-treatment on shoot fresh mass (g plant-1) of different vegetable species
(mean ± standard deviation); where XK: exotic kale, EK: Ethiopian kale, NS: African
nightshade, AM: amaranth, CP: cowpea, SP: spider plant. Columns with same lower case
letters behind the means indicate no significant differences between means of vegetable
species, rows with same upper case letters behind the means indicate no significant
differences between means of treatments (p > 0.05, ANOVA, LSD test, n = 4).
Species P-treatment
KH2PO4 Phytate Rock P FePO4 Without P
Shoot fresh mass (g plant-1)
XK 18.3 ± 2.0 cA 17.1 ± 1.0 cdA 12.6 ± 3.0 bB 12.8 ± 1.2 aB 6.0 ± 0.9 aC
EK 21.9 ± 1.9 bA 20.8 ± 0.5 bAB 19.6 ± 0.3 aB 14.4 ± 0.5 aC 6.4 ± 0.7 aD
NS 21.4 ± 0.8 bA 18.5 ± 2.8 bcA 7.2 ± 3.7 cB 3.9 ± 0.7 dC 1.0 ± 0.5 bC
AM 13.1 ± 2.2 dA 14.8 ± 0.7 dA 12.6 ± 1.5 bA 6.4 ± 2.2 cB 2.4 ± 0.9 bC
CP 25.4 ± 1.9 aA 25.1 ± 1.9 aA 18.5 ± 1.0 aB 9.5 ± 1.3 bC 5.7 ± 2.1 aD
SP 14.5 ± 1.4 dA 14.8 ± 3.3 dA 2.5 ± 0.8 dB 2.1 ± 0.4 dB 1.1 ± 0.9 bB
Shoot fresh mass of plants supplied with rock P was significantly lower than that of plants
supplied with KH2PO4 for all species except amaranth. However, there were marked
differences among species in the extent of growth reduction, indicating that the suitability of
rock P as fertilizer source was strongly dependent on the specific species (Table 3.4).
Whereas growth reduction of plants supplied with rock P in comparison to KH2PO4 was only
11% in Ethiopian kale, growth was reduced by about 30% in cowpea and exotic kale, by 66%
in African nightshade, and by 83% in spider plant. Rock P is a comparably cheap P fertilizer,
which is produced in several African countries. Rock P contains mainly poorly water soluble
calcium phosphate.
Shoot fresh mass of plants supplied with FePO4 varied between 2.1 g for spider plant and 14.4
g for Ethiopian kale, and thus, was significantly lower for all species than shoot fresh mass of

65
plants supplied with KH2PO4. Again, there were marked differences among species in the
extent of growth reduction indicating that the suitability of FePO4 as fertilizer source was
strongly dependent on the specific species (Table 3.4). Whereas growth reduction of plants
supplied with FePO4 in comparison to KH2PO4 was only 32% for exotic kale and 34% for
Ethiopian kale, growth was reduced by 51% in amaranth, by 63% in cowpea, by 82% in
African nightshade, and by 86% in spider plant.
The shoot fresh mass of plants cultured in substrate without P supply varied between 1 g for
African nightshade and 6.4 g for Ethiopian kale. Shoot fresh mass was significantly higher in
Ethiopian and exotic kales and cowpea, than for amaranth, and for amaranth, shoot fresh mass
was significantly higher than for African nightshade and spider plant. The P content per seed
of cowpea (700 µg P) and the kales (31 µg P in exotic, and 43 µg P in Ethiopian kale) was
substantially larger than in spider plant (10 µg), African nightshade (9 µg) and amaranth (3
µg). Larger seed P content might have allowed better initial root growth, and thus better
spatial exploitation of the soil volume, and consequently, more efficient use of the small plant
available soil P pool in non-fertilized pots for shoot growth (Raboy 2001; Zhu and Smith
2001).
Based on the shoot fresh mass reduction in comparison to KH2PO4 supply, phytate was a
good source for all species, whereas the suitability of other inorganic P sources for shoot fresh
mass growth strongly differed among species (Table 3.4). For spider plant, shoot fresh mass
of plants supplied with FePO4 or rock P did not significantly differ from shoot fresh mass of
plants without P amendment, indicating that FePO4 and rock P are extremely poor P sources
for this species. For African nightshade, the shoot fresh mass of plants supplied with FePO4
did not significantly differ from shoot fresh mass of plants without P amendment, whereas
shoot fresh mass of plants supplied with rock P was significantly higher than shoot fresh mass
of plants without P amendment. Nevertheless, the shoot fresh mass with rock P was
substantially (more than 50%) lower, than with phytate and KH2PO4, indicating that rock P is
a poor P source for African nightshade. For cowpea, shoot fresh mass of plants supplied with
FePO4 was substantially reduced, whereas shoot fresh mass of plants supplied with rock P
was only moderately lower than shoot fresh mass of plants supplied with KH2PO4 indicating,
that for this species FePO4 is a poor, and rock P a fairly good P source. Based on the shoot
fresh mass reduction in comparison to KH2PO4 supply, rock P and FePO4 were fairly good P
sources for exotic kale. For amaranth, rock P was a good P source, whereas FePO4 was a poor

66
P source. For Ethiopian kale all P forms were good or fairly good sources for shoot fresh mass
growth.
Table 3.4: Suitability of different P sources for yield production (shoot fresh mass) in various
AIVs; +++ about same (± 20%) yield effect as KH2PO4; ++ yield reduction 20-50% in
comparison to KH2PO4; + yield reduction >50% in comparison to KH2PO4 but significantly
higher yield than without P amendment; - no significant increase in yield in comparison with
no P amendment (p > 0.05, ANOVA, LSD test, n = 4).
3.4.2 Effect of P treatments on total biomass
We assessed the effect of P treatments on the total biomass, which is made up of shoot and
root biomass in order to assess the ability of plant species to assimilate carbon. The total dry
mass (total biomass) was significantly influenced by the plant species and P treatment (Table
3.5). The performance and trend of vegetable’s total dry mass was somehow similar to the
yield (shoot fresh mass).
In the plants supplied with readily soluble inorganic P (KH2PO4), total dry mass decreased in
the order cowpea and African nightshade > exotic kale and Ethiopian kale > amaranth and
spider plant. This also shows that under conditions in which P was not limiting for plant
growth, total dry mass differed among species. Total dry mass of plants supplied with organic
P in the form of phytate did not significantly differ from that of plants supplied with KH2P04
apart from amaranth, which showed higher biomass with phytate supply than with
KH2PO4supply.
Total dry mass of plants supplied with rock P was significantly lower than that of plants
supplied with KH2PO4 for all species except for Ethiopian kale. For Ethiopian kale, total
biomass did not significantly differ between rock P supply and supply of phytate or KH2PO4.
Species P source
Phytate Rock P FePO4
Spider plant +++ - -
African nightshade +++ + -
Cowpea +++ ++ +
Exotic kale +++ ++ ++
Amaranth +++ +++ +
Ethiopian kale +++ +++ ++

67
Table 3.5: Effect of P-treatment on total dry mass (g plant -1) of different vegetable species
(mean ± standard deviation). Columns with same lower case letters behind the means indicate
no significant differences among means of vegetable species, rows with same upper case
letters behind the means indicate no significant differences among means of treatments (p >
0.05, ANOVA, LSD test, n = 4); XK: exotic kale, EK: Ethiopian kale, NS: African
nightshade, AM: amaranth, CP: cowpea, SP: spider plant.
Species P-treatment
KH2PO4 Phytate Rock P FePO4 Without P
Total dry mass (g plant-1)
XK 3.0 ± 0.3 bA 3.1 ± 0.4 bA 1.9 ± 0.5 bB 1.8 ± 0.2 abB 1.0 ± 0.2 aC
EK 3.5 ± 0.1 bA 3.3 ± 0.3 bA 3.2 ± 0.5 aA 2.1 ± 0.1 aB 1.1 ± 0.1 aC
NS 4.3 ± 0.5 aA 4.3 ± 0.5 aA 1.0 ± 0.6 cB 0.6 ± 0.2 dBC 0.2 ± 0.1bC
AM 2.2 ± 0.5 cB 2.8 ± 0.2 bcA 1.8 ± 0.2 bB 1.2 ± 0.4 cC 0.5 ± 0.2 bD
CP 4.2 ± 0.3 aA 4.1 ± 0.3 aA 3.3 ± 0.5 aB 1.7 ± 0.3 bC 1.0 ± 0.3 aD
SP 1.9 ± 0.3 cA 2.2 ± 0.7 cA 0.4 ± 0.1 cB 0.4 ± 0.1 dB 0.2 ± 0.1 bB
However, there were marked differences among species with Ethiopian kale and cowpea
having the highest total dry mass. Total dry mass of plants supplied with FePO4 was
significantly lower than that supplied with KH2PO4 for all the species. Total dry biomass
production in plants supplied with FePO4 ranged from 2.1 g plant-1 for Ethiopian kale to 0.4 g
plant-1 for spider plant. Considering poorly soluble inorganic P forms, total dry mass of exotic
kale, amaranth and cowpea supplied with FePO4 was significantly lower than that supplied
with rock P. Total dry mass of plants not supplied with P were significantly lower than those
plants, which were supplied with the different P treatments apart from spider plant and
African nightshade. Exotic kale, Ethiopian kale and cowpea showed similar biomasses and
grew a little better in unfertilized soils than African nightshade, amaranth and spider plant,
which had a lower biomass.
Most studies have shown reduced biomass (shoot biomass) production in plant species, when
grown under P deficient soils compared to soils treated with highly soluble P (Pearse et al.
2006; Hammond et al. 2009; Wang et al 2010; Shen et al. 2011; Rose et al. 2013; Lambers et
al. 2015). At this state, P is inadequate to plants and thus plants are unable to efficiently
undertake their physiological processes leading to low plant biomass accumulation. Also the
68
study by Liang et al (2009) showed increased dry matter yield of amaranth with increasing P
rates.
Generally, cowpea performed well, while spider plant performed poorly in all the P
treatments. On the other hand, Ethiopian kale produced the highest dry mass in sparingly
soluble P treatment and in soils without P compared to other species. This implies that
cowpea and Ethiopian kale are likely to have properties superior in P use efficiency compared
to the other species, which will be analyzed further in this study. The ability for cowpea to
produce well in all the P treatments makes the plant suitable for growth in all types of soils
composed with different P pools. A study by Ansah et al. (2016), found out that a reasonable
number of cowpea genotypes is able to respond and produce well under low P and sufficient P
media, thus is in agreement with our study. Also Alkama et al (2008), found cowpea to grow
better in P deficient soils compared to soy bean and common beans. Crop species that respond
well to presence or absence of P are the most desirable. Our findings are not in agreement
with Oladeji et al. (2006), who found no differences between yields of cowpea in rock P and
without P treatments.
3.4.3 Effect of P treatments on shoot and root P concentrations and plant P
accumulation
In the shoot, P concentration was influenced by P forms and the plant species (Table 3.6).
Shoot P concentration in plants supplied with KH2PO4 was significantly higher than in those
plants supplied with other forms of P. This was due to the high solubility of KH2PO4. Species
utilized KH2PO4 differently, varying in P concentrations from 10 mg per kg dry mass for
spider plant and 4.9 mg P per kg dry mass for African nightshade. Acros species the shoot P
concentration of plants supplied with phytate was significantly lower than of those supplied
with KH2P04. Species supplied with rock P had significantly lower shoot P concentrations
than those in KH2PO4-treatment. Rock P was efficiently acquired by African nightshade,
amaranth, Ethiopian kale and exotic kale showing the same concentration of P in the shoot as
species supplied with phytate. Amaranth had the highest concentration (4.9 g kg-1 dry mass),
when rock P was supplied, while cowpea was least in P concentration (2.7 g kg-1 dry mass).
Shoot P concentration of all species supplied with FePO4 was lower than that supplied with
rock P, apart from spider plant. Amaranth and Ethiopian kale had significantly lower shoot P
concentrations when not supplied with P compared to FePO4 and other P treatments. Spider
plant could take up minimal amounts of P into the shoot, when grown under FePO4, rock P

69
and without P. The differences in shoot P concentration among species supplied with different
P forms contributed to differences in shoot biomass production among species.
On the other hand, shoot P concentrations did not strongly vary among the P treatments in
African nightshade, whereas for spider plant concentrations strongly varied. This is relevant
under two points of view. First, for assessment of the P nutritional status of plants through
chemical plant analysis, it is desirable that plant P concentration strongly responds to
alteration of the P status in the growth media. As such, spider plant is better suited for plant
analysis than African nightshade. Second, for agronomic P efficiency (saving P fertilizer) it is
desirable that leafy vegetables do not accumulate high internal P reserves under conditions of
high soil P availability, because high concentration leads to high P transfer to the market. As
such, spider plant is worse than African nightshade.
Table 3.6: Effect of P-treatment on shoot P concentration (g kg-1 dry mass) in different
species of AIVs (mean ± standard deviation). Mean values marked with same small letters
within a column indicate no significant differences among the species, mean values marked
with same capital letters within a row indicate no significant differences among different P-
treatments (p > 0.05, ANOVA, LSD test, n = 4); XK: exotic kale, EK: Ethiopian kale, NS:
African nightshade, AM: amaranth, CP: cowpea, SP: spider plant.
Species P-treatment
KH2PO4 Phytate Rock P FePO4 Without P
Phosphorus concentrations in the shoot (g kg-1dry mass)
XK 6.8 ± 1.2 cA 3.3 ± 0.4 bB 3.8 ± 0.9 bcB 2.7 ± 0.6 bBC 1.8 ± 0.3 cdC
EK 6.0 ± 0.5 cdA 3.4 ± 0.5 bB 3.1 ± 0.2 cdB 2.2 ± 0.2 bBC 1.5 ± 0.1 dD
NS 4.9 ± 0.6 dA 3.4 ± 0.2 bB 3.6 ± 0.4 bcB 2.6 ± 0.4 bC 2.4 ± 0.4 abC
AM 9.0 ± 0.6 bA 5.0 ± 0.3 aB 4.9 ± 0.2 aB 2.9 ± 0.4 bC 2.1 ± 0.3 bcD
CP 5.6 ± 0.8 cdA 3.7 ± 0.6 bB 2.7 ± 0.2 dC 1.9 ± 0.4 bCD 1.6 ± 0.2 cdD
SP 10.4 ± 1.1 aA 6.1 ± 2.1aB 4.4 ± 0.8 abBC 4.1 ± 1.4 aBC 2.7 ± 0.6 aC
The concentration of P in the roots was also influenced by species and supplied P forms
(Table 3.7). The root P concentration of all species was lower than the shoot P concentration
in the respective plant species supplied with all forms of P and vice versa for those not
supplied with P. This is an indication that, with absence of P, plants highly invest in the roots
rather than in the shoot in order to ‘look’ for extra P in the soils. Root P concentration in
plants supplied with KH2PO4 was significantly higher than root P concentrations in plants
treated with all other P forms apart from African nightshade. Root P concentrations of Exotic

70
kale, Ethiopian kale, cowpea and spider plant were the same, when supplied with other P
forms apart from KH2PO4. With the absence of P, root P accumulation in the species was
significantly lower than in species supplied with KH2PO4. Spider plant and cowpea did not
show significant differences in root P concentration, when supplied with phytate, rock P,
FePO4 and without P.
Table 3.7: Effect of P-treatment on root P concentration (g kg-1 dry mass) in different species
of AIVs (mean ± standard deviation). Mean values marked with same small letters within a
column indicate no significant differences among the species, mean values marked with same
capital letters within a row indicate no significant differences among different P-treatments (p
> 0.05, ANOVA, LSD test, n = 4); XK: exotic kale, EK: Ethiopian kale, NS: African
nightshade, AM: amaranth, CP: cowpea, SP: spider plant.
Species P-treatment
KH2PO4 Phytate Rock P FePO4 Without P
Phosphorus concentrations in the root (g kg-1dry mass)
XK 4.2 ± 0.7 bA 3.1 ± 0.2 bB 3.6 ± 0.4 aAB 3.2 ± 0.8 abB 2.2 ± 0.1 aC
EK 4.1 ± 0.5 bA 3.0 ± 0.4 bAB 2.8 ± 0.6 abB 2.8 ± 0.5 abB 1.8 ± 0.1 aC
NS 2.7 ± 0.4 cAB 3.1 ± 0.2 bA 2.2 ± 0.6 bB 2.7 ± 0.3 bAB 2.2 ± 0.1 aB
AM 6.1 ± 1.6 aA 4.5 ± 1.0 aB 3.0 ± 0.6 aC 3.4 ± 0.3aBC 2.2 ± 0.2 aC
CP 3.2 ± 0.5 bcA 2.2 ± 0.3 cB 2.0 ± 0.2 bB 1.6 ± 0.2 cB 2.3 ± 1.1 aB
SP 4.2 ± 0.7 bA 3.2 ± 0.3 bB 3.2 ± 0.5 aB 2.7 ± 0.4 abB 2.7 ± 0.1 aB
3.4.3.1 Phosphorus accumulation in vegetable species
When vegetable species were supplied with different P forms, the P accumulation in their
tissues varied significantly among the treatments (Table 3.8). P accumulation was highest in
all the species grown in soils supplied with KH2PO4 and lowest in soils, which were not
fertilized with P. All species showed similar P accumulation, when supplied with KH2PO4
ranging from 17.8 mg plant-1 for spider plant to 21.6 mg plant-1 for cowpea.
Despite observing no significant changes in P accumulation among all vegetables species
under KH2PO4 treatment, they ended up having different shoot fresh mass and total dry mass
(Table 3.3 and 3.5). All the species supplied with phytate were significantly lower in P
accumulation, when compared with KH2PO4 treatment, but were significantly higher than all
species in rock P treatment. Nevertheless, P accumulation in exotic kale supplemented with
Rock P was not significantly different from that supplied with phytate

71
Table 3.8: Effect of P-treatment on P accumulation (mg plant-1) in different AIV species
(mean ± standard deviation). Mean values marked with same small letters within a column
indicate no significant differences among the species, mean values marked with same capital
letters within a row indicate no significant differences among different P-treatments (p > 0.05,
ANOVA, LSD test, n = 4); XK: exotic kale, EK: Ethiopian kale, NS: African nightshade,
AM: amaranth, CP: cowpea, SP: spider plant.
Species P-treatment
KH2PO4 Phytate Rock P FePO4 Without P
Phosphorus accumulation (mg plant-1)
XK 18.9 ± 3.2 aA 10.1 ± 1.4 cB 7.1 ± 3.2 aBC 5.2 ± 0.2 aCD 1.9 ± 0.3 aD
EK 19.9 ± 1.4 abA 10.9 ± 0.7 cB 9.7 ± 1.4 aB 4.9 ± 0.3 aC 1.7 ± 0.1 abD
NS 19.1 ± 0.5 abA 14.0 ± 1.4 aB 3.5 ± 2.6 bC 1.5 ± 0.4 cCD 0.4 ± 0.1 cD
AM 19.2 ± 5.0 abA 13.7 ± 1.8 abB 8.5 ± 1.2 aC 3.5 ± 1.1 bD 0.9 ± 0.5 bcD
CP 21.6 ± 3.2 aA 14.0 ± 1.0 abB 8.8 ± 2.1 aC 3.2 ± 0.6 bD 1.9 ± 0.6 aD
SP 17.8 ± 1.0 aA 10.9 ± 1.1 bcB 1.5 ± 0.4 bC 1.4 ± 0.1 cC 0.7 ± 0.6 cC
Exotic kale, amaranth, cowpea and spider plant differed in the amount of P accumulated in
phytate and KH2PO4 treatment, but ended up producing similar shoot fresh mass and total dry
mass (Table 3.3 and 3.5). This signified, that the amount of P taken up by plants supplied with
KH2PO4 was somehow in excess, leading to luxury uptake that was not useful to plants. When
P was supplied as phytate, exotic kale, Ethiopian kale and spider plant had lower P
accumulation than other species. African nightshade had the highest accumulation of P in
phytate treatment, but the P accumulation was not significantly different from those in
amaranth and cowpea. When rock P was supplied as P source, exotic kale, Ethiopian kale,
amaranth and cowpea accumulated similar and significantly higher P amounts, whereas
African nightshade and spider plant had the least accumulation. Ethiopian kale, amaranth and
cowpea accumulated about two times higher P levels, when rock P was supplied, than when
FePO4 was used. Thus, Ethiopian kale, amaranth and cowpea had greater preference for rock
P over FePO4. It implies that rhizosphere processes like root-triggered processes (uptake,
growth and release of solutes/acids), differed between species or within the species depending
on the P treatment.
The acquisition of P from sparingly soluble treatments can be linked to either morphological
root mechanisms of the plant by enhancing root growth rate, root hair formation (density and

72
length), increased specific root length and reduced root diameter or modification of
rhizosphere pH or release of phenolic compounds, phosphatase, carboxylates and mucilage to
mobilize P (Lambers et al. 2006; Pearse 2011; Shen et al. 2011). Plant P accumulation in
species not supplied with P was significantly lower than those supplied with KH2PO4, phytate
and rock P in all species apart from spider plant. There were no significant differences in P
accumulation, between species not supplied with P and those supplied with FePO4 apart from
Ethiopian kale.
The trend in P accumulation among the treatments was in agreement with Pearse et al. (2007),
who used similar P treatments on Lupinus albus, Lupinus cosentinii, Lupinus angustifolius,
Brassica napus, Triticum aestivum, Pisum sativum and Cicer arietinum. Vegetable species are
known to accumulate different amounts of nutrients, including P, in their organs (Schachtman
et al. 1998; Ramaekers et al 2010). Effective transport of P within the plant, across plasma
membrane, is facilitated by high Pi concentration in the cytoplasm, P-transporters and
negative membrane potential (Schachtman et al. 1998). At the same time, species had
different ability to take up and translocate P at different plant stages and thus each species had
to build up different amounts of biomass depending on developmental stage of vegetable
species (IPNI 1999; Veneklaas et al. 2012). Li et al. (2011), review article stated that critical
plant yield depends on species characteristics. The amount of P in species under highly
soluble P implied, that the amount of P taken up by the plants does not only determine the dry
mass of the plant, but is effective in other processes within the plant. Compared to other
vegetable species, African nightshade effectively acquired more P in organic and highly
soluble P treatments, but not in other forms of P. African nightshade can be a good indicator
for presence or absence of P in the soil since it does well in places with readily available P.
Cowpea had an overall ability to acquire P in almost all the treatments in comparison to all
other species and that’s why it had the highest yield and total biomass (Table 3.3 and 3.4).
Cowpea is a high P use efficient species because of its ability to produce high biomass in low
P soils. This is in agreement with the recommendations stated by Ansah et al. (2016).
3.4.3.2 Biomass production per unit of plant accumulated P
The measurement of biomass produced per unit P is termed internal phosphorus use efficiency
(IPUE). IPUE was measured to identify vegetable species that can achieve more yields per
unit P uptake from the soil. The IPUE is affected by the presence or absence of P fertilizer in
the soil. The study used different P treatments, which lead to different levels of P
accumulation in plants (Table 3.8).

73
The IPUE of plants supplied with KH2PO4 was significantly lower than that supplied with
phytate in all the species apart from cowpea and spider plant (Table 3.9). The IPUEs for
cowpea and spider plant were similar, when supplied with KH2PO4 or phytate. African
nightshade and cowpea obtained the highest IPUE among the species, while amaranth and
spider plant had the least IPUE, when supplied with KH2PO4.
Table 3.9: Effect of species and P treatment on internal P utilization efficiency (g mg-1 P
accumulation) in different AIV species (mean ± standard deviation). Mean values marked
with same small letters within a column indicate no significant differences among the species,
mean values marked with same capital letters within a row indicate no significant differences
among different P-treatments (p > 0.05, ANOVA, LSD test, n = 4); XK: exotic kale, EK:
Ethiopian kale, NS: African nightshade, AM: amaranth, CP: cowpea, SP: spider plant.
Species P-treatment
KH2PO4 Phytate Rock P FePO4 Without P
Internal P utilization efficiency (g mg-1 P)
XK 0.16 ± 0.03 bD 0.31 ± 0.03 aBC 0.27 ± 0.06 bcC 0.36 ± 0.05 bcB 0.52 ± 0.06 abcA
EK 0.18 ± 0.01 bD 0.30 ± 0.04 aC 0.33 ± 0.01 bC 0.42 ± 0.02 bB 0.62 ± 0.02 aA
NS 0.23 ± 0.02 aC 0.30 ± 0.01 aB 0.31 ± 0.04 bB 0.39 ± 0.04 bA 0.44 ± 0.08 bcA
AM 0.12 ± 0.01 cD 0.21 ± 0.02 bC 0.22 ± 0.01 cC 0.34 ± 0.04 bcB 0.46 ± 0.04 bcA
CP 0.20 ± 0.04 abC 0.30 ± 0.04 aBC 0.40 ± 0.04 aB 0.55 ± 0.11 aA 0.57 ± 0.11 abA
SP 0.10 ± 0.01 cC 0.19 ± 0.06 bBC 0.25 ± 0.04 cB 0.27 ± 0.08 cB 0.41 ± 0.11 cA
IPUE did not significantly differ between the phytate and Rock P treatment in all species.
Between species, Ethiopian kale, nightshade and cowpea had the highest IPUE, when
supplied with phytate compared with other species. Comparing poorly soluble P (rock P and
FePO4), the IPUE of all vegetables supplied with FePO4 were significantly higher than that
supplied with rock P apart from spider plant. Cowpea had the highest IPUE in both
treatments, rock P and FePO4. The IPUE of plants not supplied with P was significantly
higher than those supplied with KH2PO4, phytate or rock P, where for instance, Ethiopian
kale, amaranth and spider plant showed a more than 3-fold higher IPUE when soils were not
supplied with P compared to that, when supplied with KH2PO4. Species not supplied with P
had also significantly higher IPUE than those supplied with FePO4 apart from African
nightshade and cowpea. The plants not supplied with P had a high IPUE to enable them to
produce biomass with limited available P derived from the seeds, thus maximizing biomass

74
production from all P available. Ethiopian kale and cowpea had a higher IUPE when grown
without P, whereas spider plant had the least IPUE, compared to other species.
Many studies have looked at genotypic variation of IPUE among species (Greenwood et al.
2005; Hammond et al. 2009; Rose et al. 2011, 2016; Ansah et al 2016) and the IPUE among
species in P starved soils (Simpson et al 2011; Plaxton and Tran 2011; Pant et al. 2015), but
not along the P forms. Cowpea had the highest IPUE under all P forms indicating that it can
yield more than other plant species when supplied with same P amount or in limited amount,
because it has a lower requirement for P in biomass production. The identified species
(Ethiopian kale and cowpea, to some extend exotic kale) have the capacity to grow well in P
limited soils or with minimal application of P fertilizer, which could reduce the need for P
fertilizer. Crops that are more efficient in P uptake and utilization, produce higher yields since
they have low internal P demand for growth and metabolic activities (Balemi and Negisho,
2012).
3.4.4 Morphological root traits
Plant allocation traits considered in our study were; root to shoot ratio, specific root length,
root diameter and root hair density. Root morphological traits were measured in H2PO4, rock
P and P deficient treatments. Phytate and FePO4 treatments were not considered for
determination of morphological root traits, because phytate supply resulted in similar results
in biomass production as KH2PO4 supply did and FePO4 and rock P treatments resulted in
similar biomass production as well, which was seen in the previous paragraphs.
3.4.4.1 Root length to shoot biomass ratio
Comparing the root length of vegetable species with corresponding biomass was fundamental
in order to determine their relationships and how this relationships were affected by P forms
and P rates. The results showed that, exotic kale, Ethiopian kale and amaranth did not show
any differences in their ratios under KH2PO4, rock P and without P treatments. (Table 3.10).
On the other hand, African nightshade, cowpea and spider plant had a lower root length to
shoot biomass in plants supplied with KH2PO4, than those not supplied with P. Therefore,
growth of biomass of the kales and amaranth was not related to root length, while within the
remaining species, root length was positively related to plant biomass. This study agrees with
Leon and Schwang (1992), who found the yield of barley and oat cultivars to be related to
root length. The study indicated that plants did not invest much in root length, when supplied
with highly soluble P (and to some extent rock P) and rather invested in shoot biomass, unlike
in soils not supplied with P.

75
Table 3.10: Effect of P-treatment on root length to shoot biomass ratio (m g-1) of different
vegetable species (mean ± standard deviation). Mean values marked with same small letters
within a column indicate no significant differences among the species, mean values marked
with same capital letters within a row indicate no significant differences among different P-
treatments (p > 0.05, ANOVA, LSD test, n = 4).
Species P-treatment
KH2PO4 Rock P Without P
Root length to shoot biomass ratio (m g-1)
Exotic kale 55 ± 12 aA 62 ± 13 abA 91 ± 45 bA
Ethiopian kale 46 ± 6 abA 38 ± 5 bcA 78 ± 36 bcA
African nightshade 40 ± 8 bB 83 ± 34 aB 163 ± 33 aA
Amaranth 36 ± 3 bA 43 ± 3 bcA 45 ± 9 cA
Cowpea 21 ± 3 cB 26 ± 6 cB 39 ± 3 cA
Spider plant 46 ± 8 abB 79 ± 11 aAB 90 ± 31 bA
Vegetable species differed greatly in the root length to shoot biomass ratio. When KH2PO4
was used as a source of P, exotic kale showed the highest ratio, while cowpeas had the least.
On the other hand, African nightshade had the highest root length to shoot biomass ratio in P
depletion treatment, whereas cowpea and amaranth had the least. Considering KH2PO4
treatment, cowpea accumulated significantly higher shoot biomass compared to exotic kale
(Table 3.3). In KH2PO4 treatment, higher root length to shoot biomass ratios in African
nightshade and spider plant lead to low P accumulation and thus significantly lower shoot
biomass compared to other vegetables species. The same behavior among species was
manifested in soils without P, where African nightshade had the highest ratio among the
species. Thus, African nightshade, cowpea and spider plant responded to increasing P
demands, with an increase in root length, which results in higher ratios. Whereas, in exotic
kale, Ethiopian Kale and amaranth ratios did not significantly alter between P forms.
3.4.4.2 Specific root length of AIVs
Specific root length was calculated by measuring the vegetables root length divided by root
biomass. Specific root length varied among species and among P treatments of individual
species (Table 3.11). Exotic kale, Ethiopian kale and spider plant did not increase or decrease
their specific root length in all the P treatments since their differences were not significant.
African nightshade and cowpea significantly increased their specific root length when soils

76
were not supplied with P and in rock P treatment compared to KH2PO4 treatment. However,
the specific root length of amaranth was significantly lower in soils unfertilized with P
compared to KH2PO4 treatment, but higher in soils supplied with rock P.
Past studies associated P deficiency with enhanced root length or specific root length in some
crop species (Vance et al. (2003), wheat (Manske 2000; Liao et al. 2008), Brassica oleracea
(Hammond et al 2009), beans (Miller et al. 2003), Brassica napus (Lyu et al. 2016) and
Rytidosperma species (Waddell 2017). Our results showed, that most of the vegetable species
did not modify their root length in order to acquire more P, neither in soils containing plant
available P nor in soils without P/adsorbed P. Increased root length was only observed in
cowpea and African nightshade, which increased their root length in P deficient soil and in
soil containing sparingly soluble P compared to soil containing plant available P.
Table 3.11: Effect of P-treatment on specific root length (m g-1) of different AIV species
(mean ± standard deviation). Mean values marked with same small letters within a column
indicate no significant differences among the species, mean values marked with same capital
letters within a row indicate no significant differences among different P-treatments (p > 0.05,
ANOVA, LSD test, n = 4).
Species P-treatment
KH2PO4 Rock P Without P
Specific Root length (m g-1)
Exotic kale 231 ± 15 bA 208 ± 17 abcA 270 ± 91 aA
Ethiopian kale 188 ± 21 cA 168 ± 27 bcA 215 ± 77 abcA
African nightshade 136 ± 24 dB 270 ± 114 aA 290 ± 66 aA
Amaranth 192 ± 21 cB 230 ± 16 abA 154 ± 28 bcC
Cowpea 100 ± 7 eB 141 ± 10 cA 127 ± 19 cA
Spider plant 316 ± 37 aA 271 ± 12 aA 229 ± 80 abA
Our study showed, that increase in specific root length is a carbon efficient mechanism by the
roots for increasing rhizosphere soil exploration (Waddell et al. 2017), which leads to
increased rates of P uptake (Brown et al. 2013).
Among all the vegetable species, cowpea had the least specific root length, when P was
supplied in all the three forms. When P was supplied as KH2PO4, spider plant had the highest
specific root length. The specific root length decreased in the order; spider plant > exotic kale
> Ethiopian kale and amaranth > African nightshade > cowpea. On the other hand, when

77
plants were supplied with rock P, African nightshade and spider plant acquired the highest
specific root length although not significantly different from the specific root length obtained
by exotic kale and amaranth. However, exotic kale and African nightshade had higher specific
root lengths in soils not fertilized with P, although not significantly different from Ethiopian
kale and spider plant. Cowpea showed least responses to reduced P availability with lower
specific root length. The ability to increase root length in P deficient soils led to higher yield
and total dry mass found in the kales compared to other species. In rock P, the increased
specific root length of African nightshade and spider plant did not contribute to biomass
production.
3.4.4.3 Root diameter for AIVs
There were significant differences in root diameter among species (p < 0.05) as well as
between species and phosphorus forms (p < 0.05) interactions, while no significant
differences were observed among P forms (p = 0.23; Table 3.12). There were no differences
in root diameter among the P treatments of exotic kale, Ethiopian kale and cowpea. The root
diameter of spider plant species supplied with KH2PO4 was significantly lower than that
supplied with rock P and without P.
Table 3.12: Effect of P-treatment on root diameter (mm) of different AIV species (mean ±
standard deviation). Mean values marked with same small letters within a column indicate no
significant differences among the species, mean values marked with same capital letters
within a row indicate no significant differences among different P-treatments (p > 0.05,
ANOVA, LSD test, n = 4).
Species P-treatment
KH2PO4 Rock P Without P
Root diameter (mm)
Exotic kale 0.23 ± 0.01 deA 0.27 ± 0.02 cdA 0.27 ± 0.06 cdA
Ethiopian kale 0.27 ± 0.02 cA 0.31 ± 0.03 bA 0.32 ± 0.05 bA
African nightshade 0.31 ± 0.03 bA 0.30 ± 0.02 bcA 0.23 ± 0.02 dB
Amaranth 0.25 ± 0.01 cdB 0.23 ± 0.01 eB 0.30 ± 0.03 bcA
Cowpea 0.43 ± 0.03 aA 0.40 ± 0.02 aA 0.42 ± 0.01 aA
Spider plant 0.21 ± 0.02 eB 0.26 ± 0.01 deA 0.26 ± 0.03 cdA
African nightshade had a smaller diameter of roots in treatments without P compared to
supply with KH2PO4 or Rock P. A smaller root diameter has the ability to explore a bigger

78
soil volume per unit root surface area. Although thinner roots can be efficient in acquiring P,
the carbon cost of maintaining and producing finer roots may be high due to frequent
replacement (Gahoonia1 and Nielsen 1996). Amaranth obtained a thicker root diameter in
soils without P. It was able to maintain intermediate P accumulation and total dry mass.
Spider plant showed a thicker diameter in sparingly soluble P and in P deficiency treatments
compared to soluble P, which was not useful in P acquisition and biomass accumulation.
When all the vegetables were grown under same P treatment, the result showed that growing
them in KH2PO4 resulted in highest root diameter in cowpea (0.43 mm) and lowest root
diameter in spider plant (0.21 mm), which was not significantly different from exotic kale
(0.23 mm). Cowpea grown in rock P and without P treatment had the highest diameter of all
species in both treatments. Amaranth supplied with rock P showed smallest root diameter
among species. When P was not supplied to the soils, African nightshade developed thinnest
roots. Exotic kale was among the species that showed thinnest roots. With this reduced root
diameter, exotic kale was able to acquire more P (table 3.8) and biomass (Table 3.5), than
other species.
3.4.4.4 Root hair density
Vegetable species differed in root hair density under different P treatments (Table 3.13). The
root hairs were counted from a set of 10 roots derived from each species and from each
treatment and then the average was used. The root hair appearance is displayed in figure 3.3.
There was no significant difference in the specific root hair density of exotic kale, Ethiopian
kale and African nightshade, when supplied with the three P forms. Instead, amaranth and
spider plant had significantly lower root hair density when supplied with KH2PO4 and rock P
than when not supplied with P. Cowpea showed a significantly decreased root hair density in
P deficient soil compared to soil supplied with KH2PO4.
Previous studies have found out that deficiency of nutrients, especially P, stimulates root hair
production leading to higher root hair density and length (Lambers et al. 2006; Hammond et
al. 2009; Peret et al. 2011). In our study, the findings of spider plant and amaranth agreed
with the past study in other crop species (Williamson et al. 2001; Hammond et al 2009; Niu et
al. 2013; Vejchasarn et al 2016). Production of more root hairs among vegetables in soils
deficient in P may be due to root cortical cells providing more sites where trichoblasts can
grow, thus allowing production of numerous root hairs (Ma et al. 2001) or stimulation and
presence of auxin and ethylene (Ma et al. 2001; Neumann and Martinoia 2002). The high
stimulation of root hair density may lead to short main root as seen in Arabidopsis grown in P

79
deficient soils (Williamson 2001). This is also displayed in the vegetable species in figure 3.4.
There were no differences among species in root hair density when P was supplied in the form
of KH2PO4. When P was supplied as rock P, exotic kale obtained a significantly higher root
hair density than African nightshade, but there were no differences in the other species. Also,
Ethiopian kale, amaranth, cowpea and spider plant had almost the same root hair density that
was not significantly different from African nightshade when grown in soils supplied with
rock P. In P deficient soils, spider plant had highest and cowpea lowest root hair density,
while the remaining vegetable species had an almost similar density.
The root hair density among species did not play a vital role in biomass production. For
instance, the kales and cowpea had a higher shoot mass and total dry weight in soils
unfertilized with P, but they acquired an intermediate and lower root hair density.
Table 3.13: Effect of P-treatment on root hair density (number per mm of root) of different
AIV species (mean ± standard deviation). Mean values marked with same small letters within
a column indicate no significant differences among the species, mean values marked with
same capital letters within a row indicate no significant differences among different P-
treatments (p > 0.05, ANOVA, LSD test, n = 4).
Species P-treatment
KH2PO4 Rock P Without P
Root hair density (number of hairs per mm root)
Exotic kale 9.5 ± 4.1 aA 11.2 ± 3.9 aA 10.8 ± 3.4 bA
Ethiopian kale 10.1 ± 5.0 aA 9.1 ± 2.8 abA 11.1 ± 4.2 bA
African nightshade 6.4 ± 2.4 aA 5.0 ± 2,6 bA 5.7 ± 2.0 bcA
Amaranth 5.1 ± 2.9 aB 6.2 ± 1.8 abAB 9.9 ± 3.2 bA
Cowpea 7.7 ± 2.3 aA 6.9 ± 2.2 abAB 4.1 ± 1.6 cB
Spider plant 7.3 ± 2.7 aB 9.7 ± 6.8 abB 19.0 ± 5.4 aA
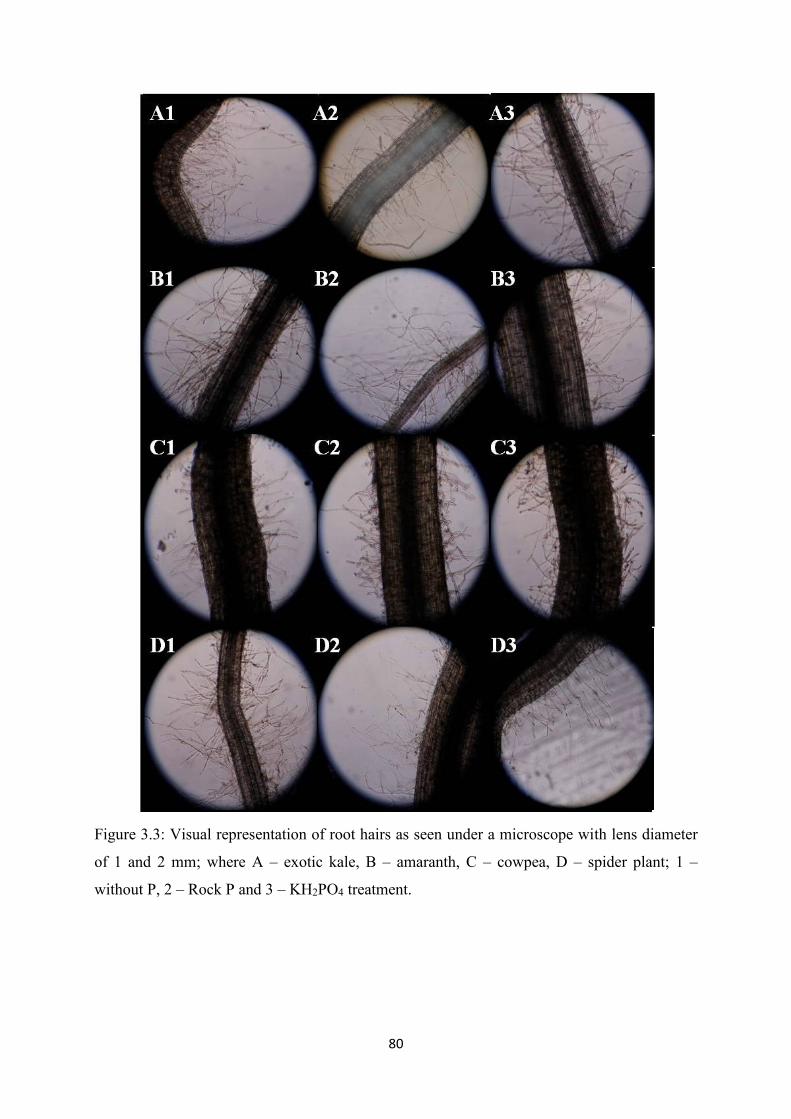
80
Figure 3.3: Visual representation of root hairs as seen under a microscope with lens diameter
of 1 and 2 mm; where A – exotic kale, B – amaranth, C – cowpea, D – spider plant; 1 –
without P, 2 – Rock P and 3 – KH2PO4 treatment.

81
Figure 3.4: Effect of P treatments on the root system of various vegetable species (visual
representation of each species in different P treatments); where XK – exotic kale, EK –
Ethiopian kale, NS – African nightshade, AM – amaranth, CP – cowpea and SP – spider
plant.
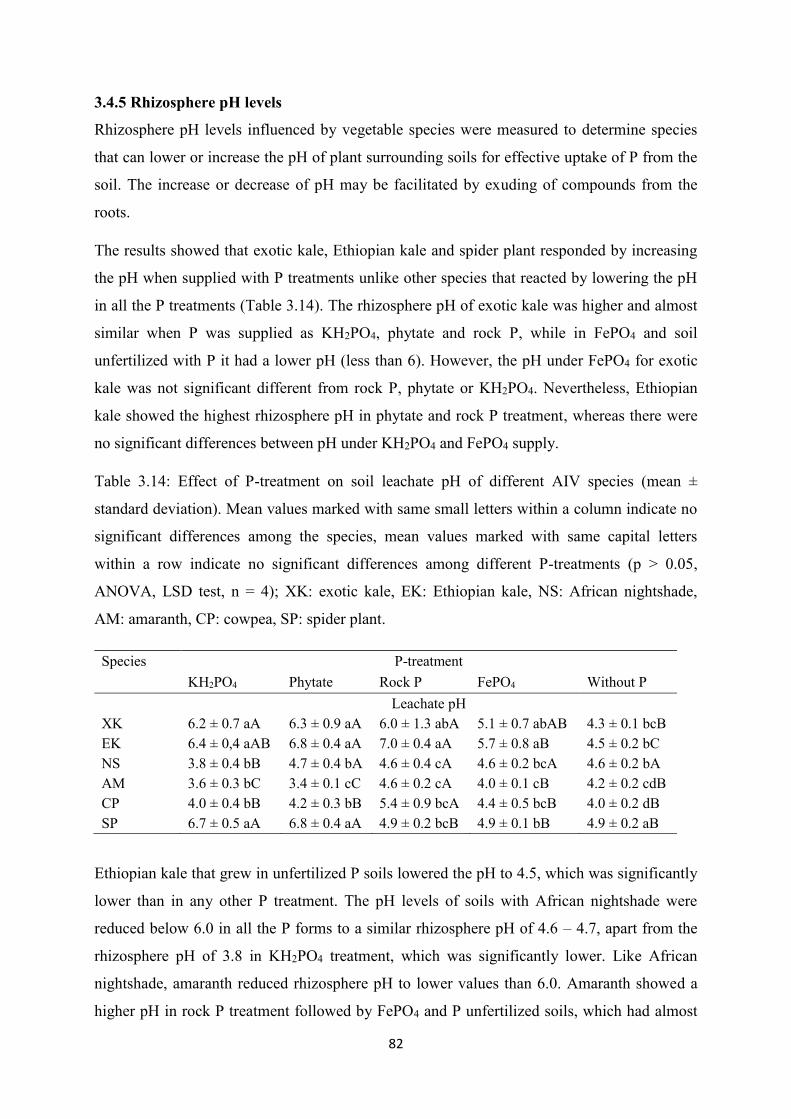
82
3.4.5 Rhizosphere pH levels
Rhizosphere pH levels influenced by vegetable species were measured to determine species
that can lower or increase the pH of plant surrounding soils for effective uptake of P from the
soil. The increase or decrease of pH may be facilitated by exuding of compounds from the
roots.
The results showed that exotic kale, Ethiopian kale and spider plant responded by increasing
the pH when supplied with P treatments unlike other species that reacted by lowering the pH
in all the P treatments (Table 3.14). The rhizosphere pH of exotic kale was higher and almost
similar when P was supplied as KH2PO4, phytate and rock P, while in FePO4 and soil
unfertilized with P it had a lower pH (less than 6). However, the pH under FePO4 for exotic
kale was not significant different from rock P, phytate or KH2PO4. Nevertheless, Ethiopian
kale showed the highest rhizosphere pH in phytate and rock P treatment, whereas there were
no significant differences between pH under KH2PO4 and FePO4 supply.
Table 3.14: Effect of P-treatment on soil leachate pH of different AIV species (mean ±
standard deviation). Mean values marked with same small letters within a column indicate no
significant differences among the species, mean values marked with same capital letters
within a row indicate no significant differences among different P-treatments (p > 0.05,
ANOVA, LSD test, n = 4); XK: exotic kale, EK: Ethiopian kale, NS: African nightshade,
AM: amaranth, CP: cowpea, SP: spider plant.
Species P-treatment
KH2PO4 Phytate Rock P FePO4 Without P
Leachate pH
XK 6.2 ± 0.7 aA 6.3 ± 0.9 aA 6.0 ± 1.3 abA 5.1 ± 0.7 abAB 4.3 ± 0.1 bcB
EK 6.4 ± 0,4 aAB 6.8 ± 0.4 aA 7.0 ± 0.4 aA 5.7 ± 0.8 aB 4.5 ± 0.2 bC
NS 3.8 ± 0.4 bB 4.7 ± 0.4 bA 4.6 ± 0.4 cA 4.6 ± 0.2 bcA 4.6 ± 0.2 bA
AM 3.6 ± 0.3 bC 3.4 ± 0.1 cC 4.6 ± 0.2 cA 4.0 ± 0.1 cB 4.2 ± 0.2 cdB
CP 4.0 ± 0.4 bB 4.2 ± 0.3 bB 5.4 ± 0.9 bcA 4.4 ± 0.5 bcB 4.0 ± 0.2 dB
SP 6.7 ± 0.5 aA 6.8 ± 0.4 aA 4.9 ± 0.2 bcB 4.9 ± 0.1 bB 4.9 ± 0.2 aB
Ethiopian kale that grew in unfertilized P soils lowered the pH to 4.5, which was significantly
lower than in any other P treatment. The pH levels of soils with African nightshade were
reduced below 6.0 in all the P forms to a similar rhizosphere pH of 4.6 – 4.7, apart from the
rhizosphere pH of 3.8 in KH2PO4 treatment, which was significantly lower. Like African
nightshade, amaranth reduced rhizosphere pH to lower values than 6.0. Amaranth showed a
higher pH in rock P treatment followed by FePO4 and P unfertilized soils, which had almost

83
the same pH. Amaranth in phytate and KH2PO4 treatment recorded the lowest pH compared
to other P treatments. Cowpea lowered rhizosphere pH to a similar extend like shown in
nightshade and amaranth for all P treatments, except in the rock P treatment, where the
highest pH (pH 5.4) was measured. All other P treatments of cowpea lead to similar
rhizosphere pH. Spider plant grown in phytate and KH2PO4 treatments had significant higher
pH values of 6.8 and 6.7, respectively, than those from the remaining P treatments.
Previous studies have also shown that a number of species, such as soybean (Shujie and
Yunfa 2011), L. albus (Pearse et al. 2006), wheat and barley (Gahoonia and Nielsen 1996)
decrease the rhizosphere pH in order to cope with P deficiency. Acidification of soil
rhizosphere is associated with dissociation of organic acid to discharge anions (Hinsinger
2001).
The soil pH of exotic kale increased with increase in P accumulation in vegetable species.
This was in agreement with the previous study by Pearse et al. (2006) on Triticum aestivum
and Lupinus albus. The form in which P exists in soil solution was mostly affected by the
rhizosphere pH. Uptake levels of P are highest between pH 5.0 - 6.0, where monovalent
H2PO4- dominates (Schachtman et al. 1998). Plants can either increase or reduce the optimal
soil pH for effective uptake of P. Except for pH above 8, rock P had increasing solubility with
decreasing pH, whereas FePO4 had an increasing solubility with increasing pH (Hinsinger
2001). That is why African nightshade, amaranth and cowpea obtained higher P in rock than
FePO4. It can be attributed that vegetables with the capacity to increase soil pH are able to
perform better in FePO4, but for our case, the vegetables species lowered the pH, thus
performed poorly compared to the same species under rock P. They ended up reducing the pH
in both P treatments favoring the uptake of rock P. The ability to produce similar yield (shoot
fresh mass) and dry mass for exotic kale (Table 3.3 and 3.4) grown in rock P and FePO4 can
be attributed to their rhizosphere pH. This was because both treatments had their pH within
optimal level when exotic kale was grown.
In phytate and KH2PO4, the kales and spider plant increased their pH beyond 6.0, while the
remaining vegetable species reduced their soil pH. Hinsinger et al. (2003), link the increase in
soil pH to increased NO3- uptake by vegetable species, causing higher release of OH- or
HCO3- or increased uptake of H+ to balance the soil ion charges. The reason why the kales
performed well in FePO4, was because, unlike other vegetables species, their pH was within
the optimal range necessary for plants to acquire P. Other species in FePO4 treatments
lowered rhizosphere pH from the initial soil pH, which reduces the ability to extract P from

84
the soil and that’s why most vegetable species with pH below the normal 5.0 – 6.0 in FePO4
treatment extracted less P from the soil, resulting in lower P accumulation per plant (Table
3.8.) Previous study by Rose et al. (2010) showed wheat to increase the rhizosphere pH in
order to acquire the adsorbed P in the soils, which was in agreement with Ethiopian kale in
our study. Ethiopian kale had a higher pH of above 6, but was able to take up more P from
rock P treated soils resulting to higher biomass compared to other species. Thus, the
distribution of P in most species is determined by solution pH, which leads to dissociation of
orthophosphoric acid to produce phosphate ions (Hinsinger 2001).
In treatments without P, all the plants had to lower their pH below 5.0 in order to acquire the
little P available in the soil. Cowpea had the lowest pH and that’s likely the reason it had
higher P concentration and biomass.
3.5 General discussion and recommendation
In agricultural ecosystems, P is increasingly lost from soil through reactions with numerous
soil constituents, greatly reducing bioavailability of soil P to plants. Our results indicated that
vegetables behaved and responded differently when supplied with different P forms. From the
experiment, deficiency of P did not become visible (Fig. 3.1) by change of leaf colour i.e.
reddish- purple colour caused by sugar accumulation resulting in anthocyanin pigments
(Gruhn et al. 2000), but most species showed deficit through retardant growth. Hence with
increasing availability /solubility of the P source more biomass was produced in the vegetable
species studied. Our vegetables under study, had more biomass and P accumulation in
KH2PO4 and phytate treatments, because these P forms are highly soluble and therefore easily
available to plants. It is well known, that diffusion of Pi to the roots can be improved by
increasing its concentration in soil solution (Balemi and Negisho, 2012). Although all species
responded well to KH2PO4, African nightshade and cowpea produced the highest total dry
mass (shoot and root), while cowpea alone produced the highest yield (shoot fresh mass).
However, FePO4 was most efficiently utilized by Ethiopian kale and exotic kale while rock P
was efficiently utilized by cowpea and Ethiopian kale. The efficiency for utilization of
sparingly soluble P forms (either FePO4 or rock phosphate) was low in African nightshade
and spider plant, thus they are not suitable for growth in P absorbing soils. Rock P and FePO4
are known for their slow P release into the soil solution, thus low availability to the plant.
Plant species that grow well in sparingly soluble P are most suited in acidic and/ or basic
soils, where P is limited by adsorption. The ability for cowpea to produce high yields in all
the P forms in relation to the plant‘s P accumulation shows that it has the highest IPUE.

85
Cowpea had the ability to build more biomass under low P conditions and produced more
than other species given the same amount and forms of P, thus can be a cost effective species
in terms of P fertilizer application. Cowpea is a leguminous plant, which also used N2 from
the atmosphere and fixed it to the plants through the root. With its higher IPUE and its ability
to fix N2, the use of cowpea can reduce the cost of purchasing P and N fertilizers.
Vegetable species adopted different strategies in order to cope with P availability. Vegetables
grown in soil containing highly soluble P, invested more in the shoot biomass and less in the
root biomass, while those grown in P deficient soils invested more biomass in the roots than
in shoots. It is known that P deficiency (as well as N and S deficiency) favors the allocation of
biomass to the roots (Péret et al. 2011). Thus, allocation of more carbon to roots, leads to
higher root exploration in the soil and increased root growth (Balemi and Negisho, 2012), to
access extra P to produce a reasonably high yield (Balemi and Negisho, 2012). Despite
vegetables developing large root to shoot ratios in P deficient soils, other mechanisms (i.e.
plant physiological and morphological traits) play a role in ensuring that the species grows
well and yields. This explains why African nightshade had higher root to shoot ratio, but
ended up accumulating less plant P and lowest dry matter.
On the other hand, African nightshade and cowpea reacted to P deficiency by increasing
specific root length unlike other vegetable species, which showed almost the same root length
in treatments without P and with soluble P (KH2PO4). This facilitated the production of plant
biomass by decreasing carbon cost for the formation of roots. Cowpeas with elongated
specific root length showed a high yield, which was attributed to its ability to form more
biomass per unit P. Decrease of rhizosphere pH by Ethiopian kale, exotic kale and spider
plant in order to efficiently acquire rock P makes them most suitable to be grown in
calcareous soil. Thus, plants showed varied traits, which were independent of one another.
Some of these identified responses are likely to be genetically influenced (Peret et al. 2011) or
a result of complex interactions in the rhizosphere leading to availability or adsorption of P
(Ansah et al. 2016), because they only occurred in specific vegetable species. These traits or
strategies exist and work independently, however, when combined they may work effectively
to acquire higher P levels leading to higher yield and total plant biomass.

86
Chapter 4: Quantification of nutrient fluxes in AIVs: Effects of species, harvesting
techniques and production systems on nutrient export from soil
4.1 Abstract
Intensification of agriculture due to population increase has led to negative soil nutrient
balances in sub Saharan Africa, hence low food production. In vegetable production systems,
nutrients from the soil are exported to the markets via harvesting of the edible organs and at
some point non-edible organs (residues) go along with edible ones. Variation in soil fertility
associated with agronomic measures like harvesting methods and production systems have
been overlooked. For that case, a field experiment was conducted to determine species and
site-specific, harvest related nutrient exports by individual vegetable species in order to
provide information on species-specific fertilizer needs for farmers. Six leafy vegetables
(spider plant - Cleome gynandry, cowpea - Vigna unguiculata, amaranth - amaranthus
cruentus, African nightshade - Solanum scabrum, Ethiopian kale - Brassica carinata and
exotic kale - Brassica oleracea) were cultivated in batch and continuous production systems
and harvested by picking, cutting and pulling. The results showed that spider plant had the
ability to remove higher levels of N (6.2 - 9.9 kg N per 103 kg leaf fresh mass) and P (1.41 –
2.40 kg P per 103 kg leaf fresh mass). Amaranth exported high amount of K (17.2 – 18.9 kg K
per 103 kg leaf fresh mass) and Mg (0.94 – 1.65 kg Mg per 103 kg leaf fresh mass), while
Ethiopian kale, exotic kale and spider plant exported a lot of sulphur from the soil to the
market. Pulling of vegetables during harvesting, removed a lot of nutrients compared to
picking and cutting methods, although species differed in the amount removed under the
production systems. The continuous production system removed a lot of nutrients from the
soil, especially under cutting and pulling harvesting techniques. Therefore, better crop
management practices should be used to decrease the export of nutrients and reduce the
amount of fertilizer applied as soil nutrients amendments.
Key words: Vegetable production systems, crop management, soil fertility, nutrient export,
fertilizer needs.

87
4.2 Introduction
4.2.1 Soil fertility status of small holder farming systems in sub-Saharan Africa
Soil fertility degradation is among the major factors that have contributed to low food
production in sub-Saharan Africa (sSA) among small scale farming systems. For a longer
period, land has been overworked and continuous growing of crops has led to removal of soil
nutrients that were not replenished. Nutrient balances, both at national and regional levels of
sSA, have shown relatively large negative variations, which are attributed to soil forming
factors, resource management, wealth categories and distance from homesteads (Zingore et al.
2007). The soils are more acidic pH < 5.5 and low in soil organic matter (World Bank 1998).
In addition sSA soils are dominated with sandy loam and clay loam categories and thus low in
macro nutrients (N, P, K, S and Mg) and micro nutrients (Zn and B). Stoorvogel et al. (1993)
projected that the average nutrient loss by 2000 for sub-Saharan Africa was 26 kg N, 3 kg P,
and 19 kg K ha-1 year-1. Narrowing it down, under same management and environmental
conditions in Tanzania, maize and beans removed almost 58 kg N ha-1 year-1, 13 kg P ha-1
year-1and 56 kg K ha-1 year-1 (Micheni et al. 2011), while in Ethiopia, nutrient depletion rate
averages 122 kg N ha-1 yr-1, 13 kg P ha-1 yr-1 and 82 kg K ha-1 yr-1 (Haileslassie et al. 2005). In
Kenya maize alone is able to remove 25, 6 and 7 kg ha-1 year-1 of N, P, K respectively from
harvested products and 11, 2, 24 kg ha-1 year-1 of N, P, K respectively from crop residues
(FAO 2004b). Smaling et al. (1993), measured the aggregated nutrient balance in Kisii
county, one of the major producers of vegetables, especially AIVs, in Kenya to be -112 kg N,
-3 kg P and -70 kg K ha−1 yr−1.
Poor soil fertility among the small holder farmers has been largely associated with
inappropriate soil management techniques (crop removal, overgrazing, deforestation and
converting marginal lands to agriculture use) and the nature of the soil, which accounts for
large volume of nutrient losses in sSA (Omotayo and Chukwuka 2009). In most cases, high
yield results in high nutrient export from the field to either market or store and vice versa.
Harvested crop parts and removal of plant residues for fuel or feeds removes about 37% of the
nutrients from the soil (Oenema et al. 2003). Drechsel, (2002), estimated crop harvests
(products and residues) in addition to erosion, to contribute for about 70 % of all N losses,
nearly 90% of all K losses, and 100% of the P losses in sub-Saharan Africa. Soil erosion
highly depends on the slope. The water runoff deposits the nutrients in water bodies, causing
eutrophication (Nyenje et al. 2010). Another source of soil nutrient loss is leaching, where N
and P get leached from the soil depth at which plants can easily obtain these nutrients. Since

88
soils in sub-Saharan Africa might be acidic in nature, denitrification is highly facilitated,
where N in form of nitrate (NO3) is converted to inert nitrogen gas (N2) and lost to the
atmosphere (Stoorvogel et al. 1993).
Use of mineral fertilizer has been seen as the most appropriate way of restoring soil fertility
and crop yield. Appropriate use of mineral fertilizer has resulted in potential yield increase
over years, although most small scale farmers are unable to use the right quantity at the right
time and place due to high prices and its unavailability (Vanlauwe et al. 2014). Soil quality
among small scale farms is spatially heterogeneous (Tittonell et al. 2008) and a number of
crops are grown, which require different nutrient levels. That is why the existing blanket
recommendation of mineral application cannot be an effective approach.
Farmers also replenished soil nutrients by addition of organic resources (majorly animal
manure, composite and crop residues), which play an important short- and long-term role in
nutrient availability and organic matter maintenance (Palm et al. 2001). The organic nutrient
sources also minimize soil erosion and improve water retention capacity of the soil. Thus, it is
the appropriate method for small scale farmers, who can use crop residues as mulch or
incorporate them into the soil. But due to competing uses of harvested residues among small
holder farmers, there might be not enough organic residues to restore soil fertility. Small
scale, poor farmers use the residues as feed for animals, as fuel to supplement other forms of
energy or burn them for other uses, which should be discouraged at farming level (Yevich and
Logan 2003).
Other ways through which nutrients can be added to the soil, is by wet and dry deposition as a
result of rain fall or deposition with dust. This method only applies to a few minerals and thus
its contribution is less felt. However, N in the atmosphere can be fixed by biological N2
fixation, which mostly happens by rhizobia living in symbiosis with leguminous plants
(Stoorvogel et al. 1993). That adds almost 60% of N needed by the plant either symbiotically
or non- symbiotically. Addition of nutrients through sedimentation has not been well
quantified although evidence suggests that a significant amount of nutrients can be added
through this pathway (Piggott et al. 2012).
The calculations involving addition and removal of nutrients in the ecosystem (soil) result in a
nutrient balance (Fig 4.1), which can either be negative or positive. Nutrient balances are the
differences in nutrient fluxes, which add nutrients to soils (inorganic fertilizer, use of organic
manure, biological N fixation, atmospheric deposition - rain, sedimentation during flooding

89
and irrigation water) and nutrient fluxes, which withdraw nutrients from soil (crop products -
grains or edible leafy organs, crop residues, leaching, soil erosion and gaseous losses,
Stoorvogel et al. 1993).
Figure 4.1: Soil nutrients input and output pathways in agricultural production systems.
Among the nutrient fluxes, crop production, crop residues, inorganic fertilizer and manure
adding are mainly species-specific and can easily be identified, measured and quantified at
field level.
4.2.2 Aims
Most research on AIVs has been done on their importance for human health in terms of
vitamins, minerals, proteins and calorie provision. Little or nothing is known about the
amount of nutrients (N, P, K, Mg, S and Ca) that are exported from the farm. Available
publications on nutrient export focused on N, P, K losses from the soil by cereals. There is
less information about the amount of S, Mg and Ca removed by crops grown in sSA and yet
these elements have been listed among the limiting nutrients in the soil.
The purpose of this study was to determine the amount of nutrients extracted from the soil by
edible organs and crop residues, which are exported by selling the harvest. Of particular
interest was the extent to which the species, the production system or the harvesting technique
influence the exported quantity of nutrients. Two cropping systems will be compared. In the
“batch” system, the crop was completely harvested, clearing the field for the next crop on the
same field. In the “continuous” system, at harvest one and two only the edible plant organs
were harvested leaving the roots and basal 10 - 15 cm of the shoot in the field. At the third

90
harvest plants were completely harvested. Furthermore, three harvesting methods were
compared for the batch system and the last harvest of the continuous system. Plants were
either uprooted, cut 5 cm above the soil surface, or only edible organs were harvested. To
obtain general data on harvest-related nutrient fluxes, the nutrient enrichment in different
plant organs per ton of edible yield is calculated for all species.
When generalized, vegetables are said to have a low nutrient output compared to cereals and
pulses (Table 4.1). The determination of the species-specific removal of nutrients by
vegetables can help to eliminate the distortion caused by the gerenalization of vegetables.
Furthermore, the growth period has to be considered in determining the crop species with
high nutrient fluxes.
Table 4.1: Major crops in Kenya and their N, P, K contents (kg ton-1) in harvested organs and
crop residues and removal factors (FAO 2004b).
Crop Harvested product Crop residues Removal factor
N P K N P K
(kg ton-1) %
Vegetables 9 0.9 2.6 3.2 1.4 7.8 60
Maize 16.8 4.1 4.8 9.7 1.9 21.4 75
Wheat 22.3 4.3 5.8 4.3 1.8 26.7 60
Sorghum 14.5 5.5 3.8 10.8 4.6 29.2 70
Pulses 20 3.4 11.1 10.4 1 13.1 70
Tea 35 3.8 13.4 0.1 0 0 15
Sugar cane 0.6 0.2 1.2 0.3 0.3 0.3 20
Banana 1.2 0.3 4.5 1.6 0.3 11.9 20
Potatoes 4.4 1.3 6.9 2.3 0.7 4.5 20
The aim of the study of AIVs was to find out whether fertilisation recommendations for a
cereal plant such as maize are suitable for leafy vegetables and whether the AIVs remove
equal amounts of nutrients from the soil. The time of stay and subsequent cycles of planting
within a given period determines the amount of soil nutrients exported by a single species.
Majumdar et al. (2016), showed that a single crop growth period or cropping cycle determines
the amount of nutrients to be applied. It was believed that continuous system could be
superior over batch system in terms of minimal soil nutrient export. The information could
help farms in choosing the best production system to apply, depending on the fertility of their
soils and the vegetable species grown.

91
4.3 Materials and methods
4.3.1 Study area
A field experiment was conducted at Albrecht Thaer Institute, Dahlem, Berlin - Germany,
from June to September 2015. The site lies within latitude 52° 28' N and longitude 13° 18' E.
The area receives an average annual temperature of 9.9◦ C and mean annual rainfall of 562
mm. The field weather data during the study period was as summarized in Table 4.2, while
some key physio-chemical soil parameters are shown in Table 4.3.
Table 4.2: Weather information for the months June to September 2015, showing the
minimum, average and maximum temperature, relative humidity and precipitation during the
time vegetable species were growing on the experimental experiment in berlin.
Month Average
temp (°C)
Maximum
temp. (°C)
Minimum
temp. (°C)
Relative
humidity (%)
NS (mm)
June 17.3 24.8 14.3 65.5 17.7
July 20.1 25.8 15.1 62.4 86.8
August 22.5 29.3 16.2 60.0 30.6
September 14.3 20.6 11.1 75.0 54.8
Table 4.3: Initial soil chemical and physical properties of the field experiment site.
Parameter pH Texture %C Total content in mg 100 g-1 soil
N P K
Value 6.7 Loamy sand 2:6 n.n. 38 13
4.3.2 Experimental design
The test species comprised of five African indigenous vegetable species Cleome gynandra
(spider plant), Vigna unguiculata (cowpea), Amaranthus cruentus (amaranth), Solanum
scabrum (nightshade) and Brassica carinata (Ethiopian kale) and one exotic vegetable,
Brassica olearaceae (exotic kale). The experiment was laid out as a completely randomized
block design, with four blocks and four replicates of six species, respectively. Each plot
measured 2 meter length and 1 meter width and a separation pathway of 0.8 m. Two-
production systems (batch and continuous) were super- imposed on the study set-up by
splitting each plot into two equal parts (Table 4.4).

92
Table 4.4: Sketchy representation of field experiment plots, where Rep stands for replicate; 1,
2, 3, 4, 5, 6 represent the six vegetable species planted at random; a stands for the batch and b
for continuous production system.
Rep. 1 1a 1b 3a 3b 6a 6b 5a 5b 4a 4b 2a 2b
Rep. 2 5a 5b 2a 2b 1a 1b 4a 4b 3a 3b 6a 6b
Rep. 3 4a 4b 5a 5b 2a 2b 6a 6b 1a 1b 3a 3b
Rep. 4 3a 3b 6a 6b 4a 4b 1a 1b 2a 2b 5a 5b
4.3.3 Crop establishment and management
The study site was prepared to a fine tilth mechanically by a tractor plough. To ensure a
uniform germination and growth, plant species with low thousand seed weight (amaranth,
Ethiopian kale, exotic kale, nightshade and spider plant) were first sown in a greenhouse
nursery and later transplanted to the field. To enable a comparable growth, sowing was
organized in tiers. Amaranth, African nightshade and spider plant were sown on 2nd of June
2015, while Ethiopian kale and exotic kale were sown on 8th of June 2015. For the
greenhouse nursery, three seeds were sown per seed tray compartment. On 25th June, the
seedlings (two seedlings per hill) were transplanted from the greenhouse to the field. For
cowpea, however, two seeds were sown per hill directly into the field. Two weeks after
transplanting/sowing, the plants were thinned to one plant/hill. The field spacing of the
species was in accordance to Shackleton et al. (2009). Planting details including days after
sowing and spacing are summarized in Table 4.5.
Fertilizer was applied to each plot three days prior to planting. Fertilizers at the rate of 100 kg
N ha−1 (calcium ammonium nitrate), 100 kg K ha−1 (potassium sulfate) and 50 kg P ha−1
(triple superphosphate) were applied for amaranth, Ethiopian kale, exotic kale, nightshade and
spider plant. Cowpea, being a legume, was only fertilized at the rate of 100 kg K ha−1 and 50
kg P ha−1. Nitrogen was not applied to cowpea to encourage nodulation. The experimental
plots were kept weed free through manual weeding, while optimum irrigation was done to
ensure adequate soil moisture supply to the plants and frequent pest management were
undertaken throughout the growing periods to avoid any biotic stress on crop growth.

93
Table 4.5: Planting time (days) and spacing (cm) of each vegetable species grown in the field
experimental site.
Species Planting
DAS
Spacing (cm)
Inter-row Intra-row
Amaranth 23 20 20
Cowpea 0 50 20
Ethiopian kale 17 50 33
Exotic kale 17 50 33
Nightshade 23 20 20
Spider plant 23 40 20
4.3.4 Harvesting procedures
Only plants from the center of the plots were harvested to ensure that all harvested plants
were surrounded by neighbor plants. The plants were harvested when they had reached a size
suitable for harvesting according to the guidelines of Shackleton et al. (2009). Plant age at
harvest in days after sowing (DAS) and days after transplanting to the field (DAP) are given
in Table 4.6.
For the batch system, the plants were pulled out of the soil, so the whole shoot with coarse
roots adhering to the shoot were harvested. After harvest from the field, the plants were
divided into coarse roots, basal 5 cm of the shoot (“stubble”) and leaves including petioles,
laterals and stems.
For the continuous system, three harvests were done. At the first and second harvest, only the
young parts of the shoot were harvested. This was done by cutting all shoots at about 10 cm
above the soil surface. After harvest, the plants were separated into leaves plus young laterals
(considered as “edible” plant organs), and stems. At the third (final) harvest, plants were
pulled out of the soil, as for the batch system. After harvest, the plants were separated into
leaves plus young laterals, stems, stubbles (basal 5 cm of the shoot), and coarse roots.

94
Table 4.6: Number of harvested plants per plot and cultivation period until harvest in days
after sowing (DAS) and days after planting (DAP) for batch and continuous systems for the
field experiment in Berlin. (TP-H1: Transplanting to harvest 1; H1-H2: Harvest 1 to harvest
2; H2-H3: Harvest 2 to harvest 3).
No.of harvested
plants
Cultivation
Period (days)
Harvest time (days)
DAS DAP TP- H1 H1-H2 H2-H3
Batch production system
Amaranth 8 57 34 34 - -
Cowpea 12 47 47 47 - -
Ethiopian kale 8 51 34 34 - -
Exotic kale 8 51 34 34 - -
Nightshade 8 57 34 34 - -
Spider plant 12 57 34 34 - -
Continuous production system
Amaranth 24 111 88 34 21 33
Cowpea 15 87 87 48 16 23
Ethiopian kale 10 105 88 34 15 39
Exotic kale 10 105 88 34 19 26
Nightshade 27 111 88 34 21 33
Spider plant 18 111 88 34 21 33
4.3.5 Laboratory analysis
All fresh plant samples were washed with distilled water to remove soil and dust adhering to
the surface. Then, fresh mass and dry mass (drying at 70◦C to constant mass) were
determined. Dried plant samples were milled and stored in plastic bottles for element
analysis. Sample digestion and analysis for N, P, K, S, Ca, Mg and Zn was done as prescribed
in paragraph 3.3.7 of the chapter 3.
4.3.6 Calculations and Statistics
For the batch system, cowpea grew 47 days, all other plants grew for 34 days in the field,
whereas for the continuous system, cowpea grew 87 days and all other plants grew for 88
days in the field. To compare yield and nutrient withdrawal in the two systems, we assumed
that 88 (87) days for the batch system were equivalent to 2.5 cropping seasons (from
transplanting to harvest). Thus, we calculated the data for the second and third batch crop
yield on the basis of the data of the first crop yield. For that case, we assumed that under the

95
prevailing growing conditions, i.e. supply of water and mineral nutrients, plant growth would
only depend on temperature. We determined the actual temperature sum (degree days) during
the first, second, and third growth cycle, which was actually imposed on the plants of the
continuous system (Table 4.7). Then we calculated species-specific coefficients, which were
used for calculation of the biomass for plants that would have grown in a batch system in the
second and third growth cycle (Table 4.8). With this coefficients and the yield of harvest 1 in
the batch system we calculated the potential yield at harvest 2 and 3.
Table 4.7: Temperature sums (degree days) during the first, second, and third growth cycle of
AIVs in continuous production system. In batch system AIVs were harvested once at harvest
1.
Species Harvest 1 Harvest 2 Harvest 3
Batch Continuous Batch Continuous Batch Continuous
Growth duration in degree days
Amaranth 709 709 0 464 0 579
Cowpea 1008 1008 0 343 0 401
Ethiopian kale 709 709 0 347 0 696
Exotic kale 709 906 0 403 0 443
Nightshade 709 709 0 464 0 579
Spider plant 709 709 0 464 0 579
Table 4.8: Species-specific coefficients used to calculate the expected yields for harvests 2
and 3 in the batch system. Coefficients for harvest 2 are the ratios of degree-days during
second and first growth period, Coefficients for harvest 3 are the ratios of degree-days during
third and first growth period.
Species Harvest 1 Harvest 2 Harvest 3
Species-specific coefficients
Amaranth 1 0.65 0.82
Cowpea 1 0.34 0.40
Ethiopian kale 1 0.49 0.98
Exotic kale 1 0.44 0.49
Nightshade 1 0.65 0.82
Spider plant 1 0.65 0.82

96
Yield data
At harvest, the yields of plant fresh and dry mass were determined in grams per unit area
harvested (m2). Since the absolute unit harvest areas varied across the species, the fresh and
dry mass yields were converted to tons per hectare as detailed below.
Since, 1 g = 0.001kg or 0.000001 tons, and 1 m2 = 0.0001 hectare,
Therefore, X yield in g/m2 = (X * 0.000001/0.0001) tons/ ha
4.3.7 Data analysis
R statistical software was used for means and standard deviation determination. The residuals
were tested for normality using q-q plots, histogram and density mean. Homogeneity of
variances was tested using Bartlett’s test for equal variance. One and two way analysis of
variance (ANOVA) was used to find out the significant differences (p < 0.05) among the plant
species, followed by a post hoc LSD test for mean separation. Paired T-test (p < 0.05) was
used to determine differences in nutrient removal among vegetable species between the
production systems.
4.4 Results
4.4.1 Yield of edible plant organs
Leaf fresh mass, which was considered to be an appropriate measure for the yield of edible
organs, significantly differed among species and production systems (Table 4.9). In the batch
production system, the yield at harvest 1 varied between 33.6 x 10³ kg ha-1 for Ethiopian kale
and 14.1 x 10³ kg ha-1 for cowpea. As the yields for harvests 2 and 3 were calculated on the
basis of the yield for harvest 1, the yields of the different species for these harvests, and total
yield (sum of harvests 1 to 3) reflected the differences found for harvest 1. In the continuous
production system, the yield at harvest 1 varied between 25.4 x 10³ kg ha-1 for exotic kale and
9.3 x 10³ kg ha-1 for cowpea.
The yield differences among species and the ranking of species do not exactly correspond to
those found for the batch system, because the contribution of leaves in 0 - 10 cm plant height,
which were not harvested in the continuous system, varied among species. In the continuous
system, the yields at harvest 2 were larger than at harvest 1 despite of the lower temperature
sum acting on the plants in the second period (343 - 464 degree days) in comparison to the
first period (709 degree days, except for cowpea and exotic kale) (Table 4.7).

97
Table 4.9: Fresh mass (103 kg ha-1) of edible organs (leaves and laterals) of vegetable species
(mean ± standard deviation) in batch and continuous production system at three harvests.
Columns with same lower case letters behind the means indicate no significant differences
between means of production systems of a particular species, rows with same upper case
letters behind the means indicate no significant differences among means of harvests of a
particular species (p > 0.05, ANOVA, LSD test, n = 4) (p > 0.05, ANOVA, LSD test, n = 4).
Yield for harvests 2 and 3 in batch production sytem were calculated from yields of harvest 1
and coefficients of table 4.8; XK: exotic kale, EK: Ethiopian kale, NS: African nightshade,
AM: amaranth, CP: cowpea, SP: spider plant.
Species Production Harvesting period
Harvest 1 Harvest 2 Harvest 3 Total
Edible fresh mass (103 kg per ha)
XK Batch 20.3 ± 3.4 aA 8.9 ± 1.5 bB 9.9 ± 1.7 bB 39.2 ± 6.5 b
Continuous 25.4 ± 7.8 aA 31.5 ± 5.2 aA 21.9 ± 1.3 aA 78.8 ± 3.8 a
EK Batch 33.6 ± 4.4 aA 16.5 ± 2.2 bB 33.0 ± 4.3 aA 83.1 ± 10.9 a
Continuous 13.6 ± 0.9 bB 20.0 ± 4.7 aAB 25.5 ± 6.4 aA 59.1 ± 5.4 b
NS Batch 28.9 ± 4.4 aA 18.8 ± 2.0 aC 23.7 ± 2.6 aB 71.4 ± 7.8 a
Continuous 14.3 ± 1.8 bB 22.4 ± 3.0 aA 13.7 ± 2.4 bB 50.4 ± 4.5 b
AM Batch 19.9 ± 3.1 aA 12.9 ± 2.0 bB 16.3 ± 2.5 aAB 49.2 ± 7.6 a
Continuous 11.9 ± 0.8 bB 20.1 ± 2.0 aA 12.5 ± 2.1 aB 44.4 ± 4.0 a
CP Batch 14.1 ± 3.8 aA 4.8 ± 1.3 bB 5.6 ± 1.5 bB 24.5 ± 6.6 a
Continuous 9.3 ± 1.0 aA 9.7 ± 1.7 aA 2.8 ± 0.6 aB 21.9 ± 2.7 a
SP Batch 18.5 ± 2.3 aA 12.0 ± 1.5 aC 15.2 ± 1.9 aB 45.7 ± 5.8 a
Continuous 12.7 ± 3.6 bA 15.2 ± 5.1 aA 8.8 ± 4.5 aA 36.7 ± 12.3 a
The higher yields in the second period in continuous production system are presumably due to
the fact that the plants started into the second period with a well-developed root system and
further reserves contained in the shoot base. Accordingly, the time needed to reach nearly
complete soil cover by foliage was lower in the second, than in the first period (Marlene
Bittner, Master-thesis 2017). The yields at harvest 3, in tendency, decreased again (except for
Ethiopian kale). This was possibly due to the higher physiological age of plants, which was
associated with increased biomass allocation to reproductive plant organs (flowers, berries,
seeds).

98
The production system influenced total yield in a species-specific way. For Ethiopian kale and
African nightshade, the total yield was significantly higher in the batch system than in the
continuous system (Table 4.9). However, exotic kale’s total yield in continuous system was
significantly higher than batch system due to much less yield produced in harvest 2 and 3 as a
result of late harvesting in harvest 1. For the other three species, there were no significant
effects of the production system on total yield, whereby, in tendency, their total yields were
higher in the continuous, than in the batch system. These species-specific differences in the
yield response to the production system may possibly reflect differences among species in
physiological ageing and ability for re-sprouting after cutting. Presumably, the response of
species to the production system and harvesting periods is dependent on the specific
environmental conditions, e.g. day lengths and air temperatures, and thus is site-specific.
4.4.2 Biomass partitioning between edible organs and non-edible organs
From a nutritional point of view, total plant biomass of leafy vegetables can be divided into
edible organs (leaves) and non-edible organs (rest of the plant). From a horticultural point of
view, non-edible organs can be further divided into organs, which are sold in the market
together with the leaves and organs, which remain in the field or are used within the farm (e.g.
as feed or fuel). The ratio of organs sold in the market is dependent on the harvest technique
(Fig.4.2). The organs sold in the market include leaves, stems and coarse roots for plants
harvested by pulling them out of the soil, total shoots except the basal part for plants
harvested by cutting, and leaves only for the harvest technique “picking”.
Figure 4.2: Plant organs that are transported to the market and those left in the soil (as shown
by the black line) depending on the harvest technique. The organs above the black lines are
those exported to the markets while those below the line are imported into the soil.
In our study, we quantified the biomass of different organs separately to assess the effects of
vegetable species, harvest technique, and production system on the ratio of total plant biomass

99
sold in the market. Fine roots were not considered, because most of them remain in the soil
when the crops are pulled. Leaves made up the largest portion of the separated plant organs in
all vegetables in the batch system, ranging between 2.1 x 10³ kg ha-1 for cowpea and 8.8 x 10³
kg ha-1 for Ethiopian kale (Table 4.10). On the other hand, spider plant produced similar
amount of leaves and stem dry mass. Amaranth and spider plant produced the highest amount
of stem dry mass while stem yields of cowpea and exotic kale were significantly lower. The
amount of dry mass produced in the coarse roots was equivalent to the mass of stubbles for all
the species. The stubbles were the part of the stem left after cutting the plants at 5 cm height
from ground. Amaranth had significantly higher stubbles and coarse roots biomass compared
to other vegetables species.
Table 4.10: Dry mass (103 kg ha-1) of various plant organs in batch production system (mean
± standard deviation). Data are means of the sum of all three harvests for all plant organs.
Means marked with same lower case letters within a column indicate no significant
differences among means of species, means with same upper case letters within rows indicate
no significant differences among means of plant organs (p > 0.05, ANOVA, LSD test, n = 4).
*Coarse roots and stubbles were bulked for the analysis.
Species Plant organ
Leaves Stems Stubbles Coarse roots
Dry mass (10³ kg ha-1)
Exotic kale 4.2 ± 0.64 cA 0.47 ± 0.09 cB 0.33 ± 0.12 dB 0.14 ± 0.04 cB
Ethiopian kale 8.8 ± 1.46 aA 2.87 ± 0.78 bB 1.06 ± 0.19 bC 0.20 ± 0.02 cC
African nightshade 5.6 ± 0.61 bA 2.25 ± 0.35 bB 0.62 ± 0.16 cC 0.57 ± 0.08 aC
Amaranth 6.5 ± 0.80 bA 5.28 ± 0.82 aB 1.30 ± 0.04 aC 0.66 ± 0.07 aC
Cowpea 2.1 ± 0.50 dA 0.41 ± 0.08 cB nd 0.22 ± 0.06 cB*
Spider plant 6.3 ± 1.46 bA 5.65 ± 0.88 aA 0.79 ± 0.20 cB 0.42 ± 0.13 bB
In case of continuous system, all species obtained the highest dry mass in the leaves
compared to other plant organs, apart from spider plant, that had similar dry mass with its
stem (Table 4.11). The kales obtained the highest (8.4 and 7.5 x 10³ kg ha-1) leaf dry mass and
cowpea the least (3.4 x 10³ kg ha-1) leaf dry mass compared with other species. In continuous
system, coarse roots had the lowest dry mass from all the other organs ranging between 0.10 x
10³ kg ha-1 for cowpea and 0.72 x 10³ kg ha-1 for amaranth. Unlike in the batch system, the
stubbles of all the vegetable species had significantly higher dry mass than the coarse roots.
Amaranth had the largest stubble and coarse root dry mass, compared with other species. In

100
this production system, the stubbles grew bigger in order to provide better support to the
stems, laterals and many branching of the leaves canopy and that is the reason why some
species like exotic kale and amaranth had significantly higher stubble dry mass compared to
the stems, whereas the stem and stubble dry mass for cowpea and African nightshade were
similar.
Table 4.11: Dry mass (103 kg ha-1) of various plant organs in continuous production system
(mean ± standard deviation). Data for Leaves and stems are means of the sum of all three
harvests, while for stubble, coarse and fine roots data are means for harvest 3. Means marked
with same lower case letters within a column indicate no significant differences among means
of species, means with same upper case letters within rows indicate no significant differences
among means of plant organs (p > 0.05, ANOVA, LSD test, n = 4).
Species Plant organ
Leaves Stems Stubbles Coarse roots
Dry mass (10³ kg ha-1)
Exotic kale 8.4 ± 0.40 aA 0.66 ± 0.16 dC 1.45 ± 0.18 cB 0.29 ± 0.05 bcC
Ethiopian kale 7.5 ± 0.39 aA 6.88 ± 0.56 aB 2.23 ± 0.30 bC 0.47 ± 0.06 bD
African nightshade 5.2 ± 0.35 cA 1.61 ± 0.12 dB 1.92 ± 0.22 bcB 0.48 ± 0.03 bC
Amaranth 6.4 ± 0.21 bA 2.71 ± 0.42 cC 4.91 ± 0.30 aB 0.72 ± 0.27 aD
Cowpea 3.4 ± 0.45 dA 0.88 ± 0.10 dB 0.65 ± 0.18 dB 0.10 ± 0.03 cC
Spider plant 4.7 ± 1.44 cA 4.51 ± 1.39 bA 2.35 ± 0.62 bB 0.39 ± 0.05 bC
4.4.3 Nitrogen concentration in different organs
Mineral concentrations in plants differ according to the organs, as plant minerals are majorly
translocated from the roots up to the leaves or plant reproductive organs. The trend in which
nutrients accumulate in plants differs due to their mobility. In order to avoid repetitions in the
description of the results, we have decided to present the results for the N concentration in the
harvested plant organs of the studied vegetable species as a representative of other measured
mineral concentrations.
For the batch system, the concentration of N was higher in the leaves than the other organs of
the plant ranging from 29 g N kg-1 dry mass for cowpea to 52 g N kg-1 dry mass for spider
plant (Table 4.12). It should be noted that the concentration of P, K, S, Mg and Ca (g kg-1 dry
mass) in the leaves differed among the vegetable species and did not follow the same order as
it appears for N (not shown in the table). The concentration of N was high in the leaves for the

101
fact that leaves play a major role for physiological functions and thus require nutrients for
effective functioning. Most minerals usually end up in leaves unless the plants are entering
reproductive stage, where minerals are translocated to flowers and seeds/fruits. Furthermore,
nutrient deficiency might result in nutrient re-translocation out of leaves. Some plant activities
take place in the stems as well and that is why stems were second largest reservoirs of N in
most vegetable species apart from amaranth, whose concentrations in the stem, stubbles,
course roots and fine roots were similar.
Table 4.12: Nitrogen concentration (g kg-1 dry mass) in plant organs of vegetable species
under batch production system (mean ± standard deviation). Means marked with same lower
case letters within a column indicate no significant differences among means of species,
means with same upper case letters within rows indicate no significant differences among
means of plant organs (p > 0.05, ANOVA, LSD test, n = 4).
Species Plant organ
Leaves Stem Stubbles
Coarse
roots
Fine
roots
Nitrogen concentration (g kg-1 dry mass)
Exotic kale 49 ± 3 aA 38 ± 4 aB 21 ± 1 aCD 25 ± 3 aC 19 bD
Ethiopian kale 40 ± 2 bA 23 ± 5 bB 19 ± 3 abC 21 ± 1 bBC 8 fD
African nightshade 42 ± 7 bA 26 ± 2 bB 12 ± 1 cC 13 ± 1 cC 14 dC
Amaranth 31 ± 3 cA 15 ± 2 cB 16 ± 3 bB 17 ± 2 cB 15 cB
Cowpea 29 ± 5 cA 16 ± 4 cBC nd 14 ± 2 cC 20 aB
Spider plant 52 ± 4 aA 24 ± 6 bB 17 ± 2 bCD 20 ± 3 bBC 11 eD
Nitrogen concentrations were at intermediate levels in stubbles and coarse roots, while fine
roots had significantly lower concentrations in both kale species and spider plant. African
nightshade showed similar N concentrations in stubbles, coarse and fine roots. In amaranth
similar N concentrations in stems, stubbles and the root fractions were found. Interestingly,
cowpea had higher N concentrations in fine roots than in the course roots. Among all species,
exotic kale had the highest levels of N in all the plant organs, exept fine roots, while amaranth
and cowpea had the lowest N concentrations in most of their plant organs.
The continuous system was roughly similar to the batch system, where the leaves had the
highest N concentrations in all vegetables species, although the high nitrogen concentrations
in leaves could be found in stems of exotic kale as well (Table 4.13). The N concentrations in
leaves ranged from 27 g kg-1 dry mass for cowpea to 47 g kg-1 dry mass for spider plant. The

102
concentration of N in stems was significantly higher than in the stubbles and coarse roots in
all vegetable species. For the case of this production system, fine roots of cowpea, amaranth
and spider plant had similar N concentrations as stems. The N concentrations in the stem
ranged from 16 g kg-1 dry mass for amaranth to 40 g kg-1 dry mass in exotic kale, whereas
stubbles had N concentration ranges of 9 g kg-1 dry mass for African nightshade and amaranth
to 20 g kg-1 dry mass for exotic kale. The concentration range for coarse roots was slightly
lower than for stubbles (8 – 15 g kg-1 dry mass), nevertheless, there were no significant
differences among vegetables species. Fine roots showed a typical N concentration range of
between 13 g kg-1 dry mass for African nightshade and amaranth to 21 g kg-1 dry mass for
exotic kale.
Table 4.13: Nitrogen concentration (g kg-1 dry mass) in plant organs in the continuous
production system (mean ± standard deviation). Data for Leaves and stems are means for all
three harvests, while for stubble, coarse and fine roots data are means for harvest 3. Means
marked with same lower case letters within a column indicate no significant differences
among means of species, means with same upper case letters within rows indicate no
significant differences among means of plant organs (p > 0.05, ANOVA, LSD test, n = 4).
Species Plant organ
Leaves Stem Stubbles Coarse roots
Fine
roots
Nitrogen concentration (g kg-1 dry mass)
Exotic kale 39 ± 3 bA 40 ± 7 aA 20 ± 2 aBC 15 ± 4 aC 21 aB
Ethiopian kale 30 ± 2 cdA 23 ± 2 bcB 10 ± 3 bD 10 ± 4 aD 15 bC
African nightshade 33 ± 2 cA 25 ± 1 bB 9 ± 1 bD 10 ± 3 aCD 13 bC
Amaranth 32 ± 2 cdA 16 ± 1 dB 9 ± 1 bCD 8 ± 5 aD 13 bBC
Cowpea 27 ± 4 dA 19 ± 3 cdB 12 ± 2 bC 13 ± 3 aC 19 aB
Spider plant 47 ± 4 aA 21 ± 2 bcB 12 ± 2 bC 12 ± 2 aC 18 aB
4.4.4 Effects of production systems and harvesting techniques on nutrient fluxes from
soil to market
As described in section 4.3.2, farmers apply different techniques in harvesting their crops.
Most farmers prefer the batch system, where they terminate the crops as soon as they attain
the harvesting stage. The common harvesting method preferred by many farmers is pulling
and to some small extent cutting, because these methods are less time consuming.

103
Unfortunately, farmers are not aware of the amount of nutrients that go alongside the
harvested plant organs. In our experiment, we quantified the amount of nutrients that is
removed by these three harvesting techniques in both production systems.
4.4.4.1 Effects of production systems and harvesting techniques on N removal
Vegetable species, harvested by picking exported less N to the market as opposed to cutting
and pulling harvesting system (Table 4.14). This was expected because only a small portion
of the plant was removed from the farm. The exportation of N from the soil ranged from 3.0
kg per 103 kg leaf fresh mass for African nightshade harvested by picking to 9.9 kg per 103 kg
leaf fresh mass for spider plant harvested by pulling. Considering picking of edible organs,
there were no differences in the amount of N removed between the batch and continuous
system in all vegetables. In both harvesting techniques, spider plant accumulated the highest
levels of N in its leaves and cowpea the lowest compared to other species. It was only
Ethiopian kale that showed significant differences between the batch and continuous
production system by removing highest amount of N from the soil to the market in the
continuous system. Pulling of vegetables led to Ethiopian kale and African nightshade
exporting more N in the continuous system than batch, while the other species did not show
any significant difference between production systems.
The production system had little impact/effect on the amount of N removed from the soil
since few species showed significant differences. On the other hand, there were pronounced
species differences in the N removed per kg fresh mass, whereby spider plant would remove
remarkably more N per kg fresh mass from the soil and African nightshade the least amount
of N per kg fresh mass.

104
Table 4.14: Yield-based nitrogen removal (kg per 103 kg leaf fresh mass) with harvested plant organs from soil to market as affected by species,
production system and harvest method (mean ± standard deviation). Means with the same lower case letters within the columns show no
significant difference between the two production systems for each of the harvest methods analysed, means with the same upper case letters
within rows indicate no significant differences among species (p > 0.05, ANOVA, LSD test, n = 4).
Production system Species
Exotic kale Ethiopian kale African nightshade Amaranth Cowpea Spider plant
N removal (kg per 103 kg leaf fresh mass)
Picking
Batch 4.4 ± 0.34 aB 3.5 ± 0.34 aCD 3.0 ± 0.43 aD 4.2 ± 0.22 aB 3.9 ± 0.41 aBC 6.5 ± 0.50 aA
Continuous 4.2 ± 0.30 aBC 3.7 ± 0.17 aBC 3.5 ± 0.34 aC 4.5 ± 0.31 aB 4.2 ± 1.03 aBC 6.2 ± 0.30 aA
Cutting
Batch 4.8 ± 0.32 aC 4.3 ± 0.56 bCD 3.8 ± 0.45 aD 5.8 ± 0.33 aB 4.2 ± 0.46 aCD 9.5 ± 0.99 aA
Continuous 4.5 ± 0.41 aCD 5.9 ± 0.55 aB 4.3 ± 0.32 aD 5.5 ± 0.32 aBC 5.0 ± 1.19 aBC 8.7 ± 0.43 aA
Pulling
Batch 5.1 ± 0.31 aC 4.6 ± 0.55 bCD 4.0 ± 0.46 bD 6.5 ± 0.30 aB 4.3 ± 0.46 aCD 9.9 ± 1.10 aA
Continuous 4.9 ± 0.41 aD 6.3 ± 0.61 aBC 4.7 ± 0.33 aD 6.7 ± 0.47 aB 5.4 ± 1.30 aCD 9.6 ± 0.48 aA

105
Species relative N export values were calculated relative to the batch production system under
picking harvesting technique (Fig. 4.3). Exotic kale showed no big differences in N export
among the three harvesting methods. In all remaining species, little differences existed
between continuous system harvested by picking and the standard measure for all the species.
Ethiopian kale, African nightshade, amaranth and spider plant removed over 1.2 times more N
under cutting and pulling in both production systems, with Ethiopian kale removing the
highest amounts of N, of about 1.7 and 1.8 times more than the standard system when
continuously produced. Cowpea grown in continuous production system, harvested by cutting
and pulling, removed 1.2 times more N as in batch system.
0
20
40
60
80
100
120
140
160
180
200
Pic
kin
g
Cutt
ing
Pull
ing
Pic
kin
g
Cutt
ing
Pull
ing
Pic
kin
g
Cutt
ing
Pull
ing
Pic
kin
g
Cutt
ing
Pull
ing
Pic
kin
g
Cutt
ing
Pull
ing
Pic
kin
g
Cutt
ing
Pull
ing
Exotic kale Ethiopiankale
Africannightshade
Amaranth Cowpea Spider plant
N e
xport
(re
lative v
alu
es)
*
Batch Continuous
Figure 4.3: Effect of harvest technique (cutting, picking, pulling) and production system
(batch, continuous) on N export from soil to market in different vegetable species; *for each
species, the N export in the batch system harvested by picking was set to 100%.
4.4.4.2 Effects of production systems and harvesting techniques on P removal
The amount of P exported from the soil to the market was dependant on, harvesting
techniques and production systems (Table 4.15). The P export ranged from 0.54 kg per 103 kg
leaf fresh mass for African nightshade grown in the batch system and harvested by picking to
2.76 kg per 103 kg leaf fresh mass for amaranth grown in the continuous system and harvested
by cutting the crop. African nightshade and cowpea removed significantly higher amounts of
P in the continuous system than in the batch system when harvested by picking. When cutting
edible organs, Ethiopian kale, African nightshade and cowpea showed significantly higher P
removal in the continuous system as well. For pulling, more crops showed differences

106
between the production systems, whereby all species, apart from spider plant, removed
significantly more P from the soil under continuous system. Spider plant exported the highest
P amounts to the market among all the species in both production systems with picking and
cutting, whereas with pulling, under continuous system, amaranth removed the highest
amount of P of all species. In comparison to other species, exotic kale exported the lowest
amount of P, when crops were harvested by cutting and pulling. The characteristic
morphology of exotic kale with small stem, stubble and coarse roots (Table 4.10 and 4.11)
could have played a role for the low P accumulation.
Considering the relative values, more than twice of the P removed in the standard system was
removed in Ethiopian kale grown in the continuous system and harvested by cutting and
pulling as well as in amaranth harvested by pulling (Fig 4.4). Cowpea showed an increase of
30 % in export of P in continuous system harvested by picking, whereas the P removal just
slightly increased from the standard system in all other species except, spider plant, which
showed a weak decrease in P export.
The amounts of P exported by Ethiopian kale, amaranth and spider plant in the batch system
were more than 1.4 times higher, when harvested by cutting or pulling in comparison to
picking. Thus, in all the vegetable species, cutting and pulling harvesting technique removed
more P than N compared with picking.

107
Table 4.15: Yield-based phosphorous removal (kg per 103 kg leaf fresh mass) with harvested plant organs from soil to market as affected by
species, production system and harvest method (mean ± standard deviation). Means with the same lower case letters within the columns show no
significant difference between the two production systems for each of the harvest methods analysed, means with the same upper case letters
within rows indicate no significant differences among species (p > 0.05, ANOVA, LSD test, n = 4).
Production system Exotic kale Ethiopian kale African nightshade Amaranth Cowpea Spider plant
P removal (kg per 103 kg leaf fresh mass)
Picking
Batch 0.57 ± 0.01 aC 0.55 ± 0.08 aC 0.54 ± 0.01 bC 0.92 ± 0.04 aB 0.58 ± 0.02 bC 1.41 ± 0.13 aA
Continuous 0.59 ± 0.02 aD 0.61 ± 0.03 aD 0.62 ± 0.04 aD 0.96 ± 0.05 aB 0.75 ± 0.10 aC 1.31 ± 0.04 aA
Cutting
Batch 0.65 ± 0.01 aD 0.79 ± 0.09 bC 0.72 ± 0.03 bCD 1.86 ± 0.14 aB 0.63 ± 0.03 bD 2.21 ± 0.04 aA
Continuous 0.64 ± 0.01 aF 1.24 ± 0.10 aC 0.81 ± 0.04 aE 1.49 ± 0.04 bB 0.94 ± 0.11 aD 2.02 ± 0.10 bA
Pulling
Batch 0.73 ± 0.01 bCD 0.87 ± 0.09 bC 0.79 ± 0.03 bCD 2.19 ± 0.18 bB 0.65 ± 0.03 bD 2.38 ± 0.12 aA
Continuous 0.78 ± 0.01 aE 1.44 ± 0.12 aC 1.06 ± 0.03 aD 2.76 ± 0.17 aA 1.06 ± 0.14 aD 2.40 ± 0.12 aB

108
0
50
100
150
200
250
300
350
Pic
kin
g
Cutt
ing
Pull
ing
Pic
kin
g
Cutt
ing
Pull
ing
Pic
kin
g
Cutt
ing
Pull
ing
Pic
kin
g
Cutt
ing
Pull
ing
Pic
kin
g
Cutt
ing
Pull
ing
Pic
kin
g
Cutt
ing
Pull
ing
Exotic kale Ethiopiankale
Africannightshade
Amaranth Cowpea Spider plant
P e
xport
(re
lativ
e va
lues
)*
Batch Continuous
Figure 4.4: Effect of harvest technique (cutting, picking, pulling) and production system
(batch, continuous) on P export from soil to market in different vegetable species; *for each
species, the N export in the batch system harvested by picking was set to 100%.
4.4.4.3 Effects of production systems and harvesting techniques on K removal
Vegetable species differed in the amount of K exported to the market, ranging from 4.4 kg per
103 kg leaf fresh mass for cowpea grown in batch system, harvested by picking to 18.9 kg per
103 kg leaf fresh mass for amaranth grown in continuous system and harvested by pulling
(Table 4.16). Most species did not have significant differences in K removal between the
production systems when harvested by picking apart from African nightshade that exported
more K in the continuous system than in batch system.

109
Table 4.16: Yield-based potassium removal (kg per 103 kg leaf fresh mass) with harvested plant organs from soil to market as affected by species,
production system and harvest method (mean ± standard deviation). Means with the same lower case letters within the columns show no
significant difference between the two production systems for each of the harvest methods analysed, means with the same upper case letters
within rows indicate no significant differences among species (p > 0.05, ANOVA, LSD test, n = 4).
Production system Species
Exotic kale Ethiopian kale African nightshade Amaranth Cowpea Spider plant
K removal (kg per 103 kg leaf fresh mass)
Picking
Batch 4.9 ± 0.09 aCD 5.1 ± 0.51 aBC 4.6 ± 0.09 bDE 7.2 ± 0.18 aA 4.4 ± 0.26 aE 5.4 ± 0.33 aB
Continuous 5.0 ± 0.35 aB 5.2 ± 0.21 aB 5.1 ± 0.11 aB 7.5 ± 0.29 aA 5.0 ± 1.41 aB 4.7 ± 0.17 bB
Cutting
Batch 5.5 ± 0.05 aDE 7.1 ± 0.79 bC 6.3 ± 0.82 aCD 14.9 ± 0.90 aA 5.1 ± 0.27 aE 10.8 ± 0.54 aB
Continuous 5.5 ± 0.42 aD 9.0 ± 0.55 aB 7.2 ± 0.17 aC 11.9 ± 0.28 bA 6.7 ± 1.46 aC 9.4 ± 0.30 bB
Pulling
Batch 5.9 ± 0.12 aDE 7.6 ± 0.84 bC 6.9 ± 0.78 bCD 17.4 ± 1.02 aA 5.4 ± 0.27 bE 12.0 ± 0.81 aB
Continuous 6.5 ± 0.38 aE 10.2 ± 0.84 aC 9.3 ± 0.41 aCD 18.9 ± 0.56 aA 8.2 ± 1.67 aD 11.8 ± 0.41 aB

110
Species varied in the amount of K exported when harvested by picking with amaranth
exporting the highest K amounts of all the species. Harvesting of vegetables by cutting
resulted in Ethiopian kale exporting significantly higher amounts of K in the continuous
system. However, amaranth and spider plant exported larger amounts of K in the batch system
compared to continuous system. Pulling of vegetables increased K export in the continuous
system by Ethiopian kale, African nightshade and cowpea. Regardless of harvest technique or
production system, amaranth exported always highest amounts of K among species. Exotic
kale always exported the least amounts of K in continuous system and together with cowpea
least quantities of K in batch system as well.
The relative values calculated from table 4.16 showed that amaranth and spider plant
harvested by pulling are likely to export more than 2 times more K than when the species
were picked (Fig. 4.5). In the continuous system, Ethiopian kale, African nightshade, cowpea
and spider plant tentatively removed above 1.5 times more of K when harvested by cutting
and pulling as compared with the standard measure. In the batch system, most species did not
exceed 1.5 times the amount of K when harvested by cutting and pulling, compared with the
standard, apart from amaranth and spider plant.
0
50
100
150
200
250
300
Pic
kin
g
Cutt
ing
Pull
ing
Pic
kin
g
Cutt
ing
Pull
ing
Pic
kin
g
Cutt
ing
Pull
ing
Pic
kin
g
Cutt
ing
Pull
ing
Pic
kin
g
Cutt
ing
Pull
ing
Pic
kin
g
Cutt
ing
Pull
ing
Exotic kale Ethiopiankale
Africannightshade
Amaranth Cowpea Spiderplant
K e
xpo
rt (
rela
tive
va
lues
)*
Batch Continuous
Figure 4.5: Effect of harvest technique (cutting, picking, pulling) and production system
(batch, continuous) on K export from soil to market in different vegetable species; *for each
species, the N export in the batch system harvested by picking was set to 100%.
When picking edible plant organs, K export in most species is hardly influenced by the
production system. As it was observed with N and P, exotic kale exported the lowest amount
of K among all the vegetable species when pulled.

111
4.4.4.4 Effects of production systems and harvesting techniques on S removal
Vegetable species also varied in the amount of S they exported to the market with a range
between 0.36 kg per 103 kg leaf fresh mass for cowpea harvested by picking leaves in the
batch production system and 2.86 kg per 103 kg leaf fresh mass for Ethiopian kale harvested
by pulling in the continuous production system (Table 4.17). Picking of leaves during harvest
resulted in Ethiopian kale, African nightshade and amaranth exporting more S in the
continuous system than in the batch system. Among all species, the kales exported highest
amounts of S to the market and cowpea exported least. When the species were harvested by
cutting, exotic kale, Ethiopian kale and spider plant exported highest amounts of S in the
continuous system as well. In the continuous system, pulling of leafy vegetables resulted in a
higher S export for all species than in the batch system.
The kales and spider plant exported more S than other species when harvested by cutting and
pulling in the batch system, while only Ethiopian kale removed significantly higher S in the
continuous system. Cutting and pulling of Cowpea exported the least S compared to all other
vegetable species.
Considering the relative values, cutting and pulling of Ethiopian kale and pulling amaranth,
cowpea and spider plant, exported more than twice the amount of S in the continuous system
(Fig. 4.6). The amount of S removed by pulling Ethiopian kale, amaranth and cowpea in the
batch system was almost half that of the continuous system. Among all vegetable species,
amaranth and spider plant exported more than 1.5 times the amount of S when harvested by
cutting and pulling. Exotic kale and African nightshade exported similar amounts of S among
the three harvesting systems.
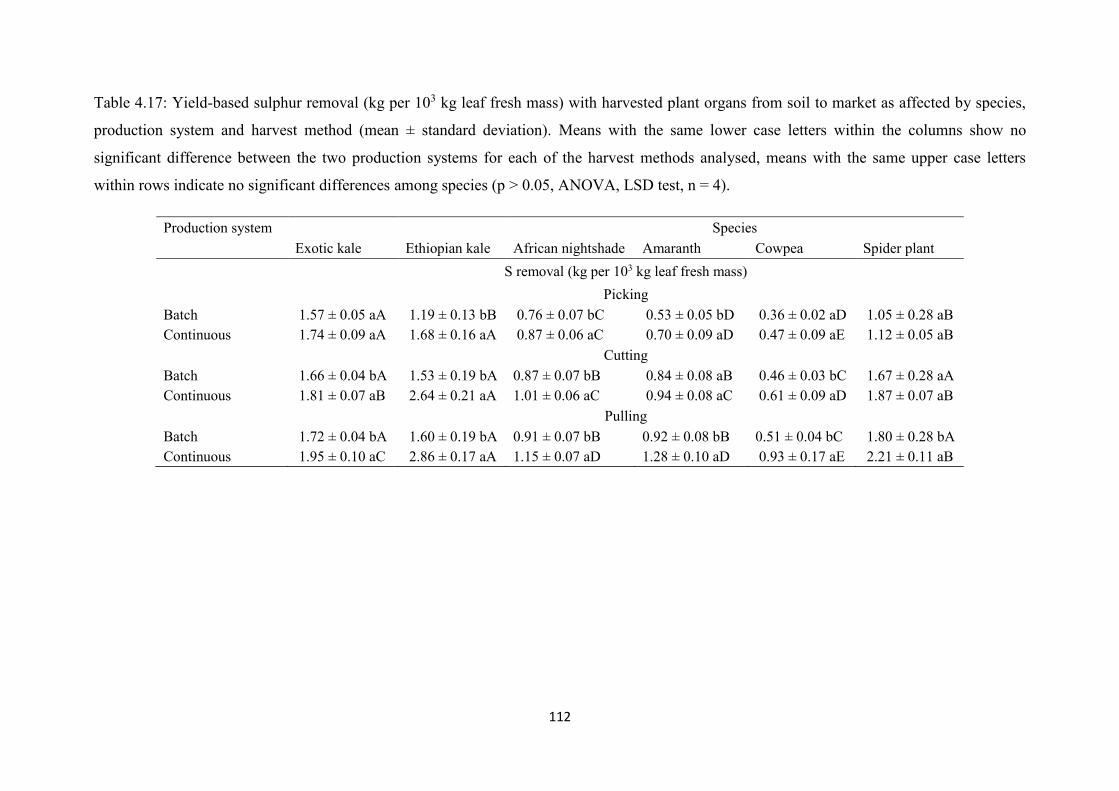
112
Table 4.17: Yield-based sulphur removal (kg per 103 kg leaf fresh mass) with harvested plant organs from soil to market as affected by species,
production system and harvest method (mean ± standard deviation). Means with the same lower case letters within the columns show no
significant difference between the two production systems for each of the harvest methods analysed, means with the same upper case letters
within rows indicate no significant differences among species (p > 0.05, ANOVA, LSD test, n = 4).
Production system Species
Exotic kale Ethiopian kale African nightshade Amaranth Cowpea Spider plant
S removal (kg per 103 kg leaf fresh mass)
Picking
Batch 1.57 ± 0.05 aA 1.19 ± 0.13 bB 0.76 ± 0.07 bC 0.53 ± 0.05 bD 0.36 ± 0.02 aD 1.05 ± 0.28 aB
Continuous 1.74 ± 0.09 aA 1.68 ± 0.16 aA 0.87 ± 0.06 aC 0.70 ± 0.09 aD 0.47 ± 0.09 aE 1.12 ± 0.05 aB
Cutting
Batch 1.66 ± 0.04 bA 1.53 ± 0.19 bA 0.87 ± 0.07 bB 0.84 ± 0.08 aB 0.46 ± 0.03 bC 1.67 ± 0.28 aA
Continuous 1.81 ± 0.07 aB 2.64 ± 0.21 aA 1.01 ± 0.06 aC 0.94 ± 0.08 aC 0.61 ± 0.09 aD 1.87 ± 0.07 aB
Pulling
Batch 1.72 ± 0.04 bA 1.60 ± 0.19 bA 0.91 ± 0.07 bB 0.92 ± 0.08 bB 0.51 ± 0.04 bC 1.80 ± 0.28 bA
Continuous 1.95 ± 0.10 aC 2.86 ± 0.17 aA 1.15 ± 0.07 aD 1.28 ± 0.10 aD 0.93 ± 0.17 aE 2.21 ± 0.11 aB

113
0
50
100
150
200
250
300
Pic
kin
g
Cutt
ing
Pull
ing
Pic
kin
g
Cutt
ing
Pull
ing
Pic
kin
g
Cutt
ing
Pull
ing
Pic
kin
g
Cutt
ing
Pull
ing
Pic
kin
g
Cutt
ing
Pull
ing
Pic
kin
g
Cutt
ing
Pull
ing
Exotic kale Ethiopian
kale
African
nightshade
Amaranth Cowpea Spider
plant
S e
xport
(re
lati
ve
val
ues
)*
Batch Continuous
Figure 4.6: Effect of harvest technique (cutting, picking, pulling) and production system
(batch, continuous) on S export from soil to market in different vegetable species; *for each
species, the N export in the batch system harvested by picking was set to 100%.
4.4.4.5 Effects of production systems and harvesting techniques on Mg removal
The vegetable species removed different amount of Mg with respect to production system and
harvesting technique (Table 4.18). The amount of Mg removed ranged from 0.28 kg per 103
kg leaf fresh mass for picking Ethiopian kale in the batch system to 1.65 kg per 103 kg leaf
fresh mass for pulling amaranth in continuous system. Ethiopian kale and African nightshade
always exported more Mg in the ontinuous production system than in the batch system,
regardless of harvesting technique. Pulling the plants during harvest resulted in a higher Mg
export in the continuous system than in the batch system for all species, with the exception of
exotic kale. Among all vegetable species, across the production systems and harvesting
techniques, amaranth removed much higher amounts of Mg. Ethiopian kale and African
nightshade removed least amouonts of Mg in the batch production system.

114
Table 4.18: Yield-based magnesium removal (kg per 103 kg leaf fresh mass) with harvested plant organs from soil to market as affected by
species, production system and harvest method (mean ± standard deviation). Means with the same lower case letters within the columns show no
significant difference between the two production systems for each of the harvest methods analysed, means with the same upper case letters
within rows indicate no significant differences among species (p > 0.05, ANOVA, LSD test, n = 4).
Production system Species
Exotic kale Ethiopian kale African nightshade Amaranth Cowpea Spider plant
Mg removal (kg per 103 kg leaf fresh mass)
Picking
Batch 0.41 ± 0.02 aC 0.28 ± 0.03 bD 0.32 ± 0.02 bD 0.94 ± 0.08 aA 0.55 ± 0.03 aB 0.43 ± 0.06 aC
Continuous 0.40 ± 0.03 aC 0.39 ± 0.02 aC 0.42 ± 0.03 aC 0.97 ± 0.05 aA 0.66 ± 0.11 aB 0.44 ± 0.02 aC
Cutting
Batch 0.44 ± 0.02 aC 0.35 ± 0.04 bD 0.41 ± 0.05 bCD 1.29 ± 0.09 aA 0.63 ± 0.04 bB 0.67 ± 0.04 aB
Continuous 0.43 ± 0.03 aE 0.58 ± 0.04 aD 0.51 ± 0.04 aDE 1.27 ± 0.05 aA 0.81 ± 0.12 aB 0.71 ± 0.04 aC
Pulling
Batch 0.46 ± 0.02 aC 0.37 ± 0.04 bD 0.43 ± 0.05 bCD 1.40 ± 0.10 bA 0.65 ± 0.05 bB 0.70 ± 0.04 bB
Continuous 0.49 ± 0.03 aC 0.63 ± 0.05 aC 0.56 ± 0.04 aC 1.65 ± 0.08 aA 0.95 ± 0.17 aB 0.87 ± 0.07 aB

115
Relative values showed, that Ethiopian kale exported more than twice the amount of Mg was
exported, when harvested by cutting and pulling (Fig. 4.7). Cutting or pulling Ethiopian kale
resulted in greater differences in Mg export between the two productions systems when
compared to the other species. African nightshade and spider plant exported 1.5 times more
Mg, when harvested by cutting or pulling in the continuous production system. This increase
was also observed in amaranth and cowpea harvested by pulling in continuous system. In the
batch production system, spider plant harvested by cutting or pulling removed more than 1.5
times of Mg. There were almost no effects of production system or harvest technique on Mg
export visible in exotic kale.
0
50
100
150
200
250
Pic
kin
g
Cutt
ing
Pull
ing
Pic
kin
g
Cutt
ing
Pull
ing
Pic
kin
g
Cutt
ing
Pull
ing
Pic
kin
g
Cutt
ing
Pull
ing
Pic
kin
g
Cutt
ing
Pull
ing
Pic
kin
g
Cutt
ing
Pull
ing
Exotic
kale
Ethiopian
kale
African
nightshade
Amaranth Cowpea Spider
plant
Mg E
xport
(re
lati
ve
val
ue)
*
Batch Continuous
Figure 4.7: Effect of harvest technique (cutting, picking, pulling) and production system
(batch, continuous) on Mg export from soil to market in different vegetable species; *for each
species, the N export in the batch system harvested by picking was set to 100%.
4.4.4.6 Effects of production systems and harvesting techniques on Ca removal
Ca removal among vegetable species differed according to production system and harvesting
method (Table 4.19) The range among species for Ca removal varied from 2.9 kg per 103 kg
leaf fresh mass for African nightshade harvested by picking leaves in the batch production
system to 9.1 kg per 103 kg leaf fresh mass for spider plant harvested by cutting or pulling in
the batch system. When vegetables were harvested by picking, Ethiopian kale and cowpea
exported significantly more Ca from the continuous system than from batch system. On the
other hand, spider plant was the highest Ca exporter in the batch system, while cowpea
exported least.

116
In the continuous system, picking of leaves resulted in similar Ca export in all species, apart
from African nightshade. The behavior among species in Ca removal was different from other
minerals. When harvested by pulling or cutting, species removed more Ca in the batch
system. This was not observed for the previous described elements. There the highest
amounts exported were found in the continuous system, when species showed significant
differences. For instance, all species apart from cowpea removed a significantly higher
amount of Ca in the batch system than in continuous system, when harvested by cutting.
Pulling of vegetables during harvest removed higher amounts of Ca by exotic kale and
African nightshade in the batch system and amaranth in the continuous system, when the
production systems were compared. Among all species, spider plant and exotic kale grown
under batch system removed more Ca from the soil. Ca export values for cutting and pulling
did not differ for all species grown in the batch production system.
The relative values for exotic kale harvested by cutting or pulling showed a doubled export of
Ca in the batch system (Fig. 4.8). All species that were grown in the batch system removed
almost 1.5 times more of Ca when harvested by cutting or pulling. Ethiopian kale, African
nightshade, amaranth, cowpea and spider plant exported at least 1.5 times more Ca when the
continuous system was harvested by pulling. In spider plant, harvesting by picking the leaves
resulted in a lower value of Ca removed.

117
Table 4.19: Yield-based calcium removal (kg per 103 kg leaf fresh mass) with harvested plant organs from soil to market as affected by species,
production system and harvest method (mean ± standard deviation). Means with the same lower case letters within the columns show no
significant difference between the two production systems for each of the harvest methods analysed, means with the same upper case letters
within rows indicate no significant differences among species (p > 0.05, ANOVA, LSD test, n = 4).
Production system Species
Exotic kale Ethiopian kale African nightshade Amaranth Cowpea Spider plant
Ca removal (kg per 103 kg leaf fresh mass)
Picking
Batch 4.2 ± 0.4 aAB 3.4 ± 0.3 bCD 2.9 ± 0.1aD 4.1 ± 0.4 aBC 3.5 ± 0.3 bCD 4.9 ± 0.9 aA
Continuous 4.1 ± 0.1 aA 4.3 ± 0.5 aA 3.0 ± 0.2 aB 4.1 ± 0.2 aA 4.3 ± 0.5 aA 4.2 ± 0.1 aA
Cutting
Batch 8.3 ± 0.7 aA 6.6 ± 0.6 aB 5.6 ± 0.3 aB 6.6 ± 0.8 aB 5.4 ± 0.6 aB 9.1 ± 1.7 aA
Continuous 4.2 ± 0.2 bC 5.4 ± 0.6 bB 3.6 ± 0.2 bD 5.4 ± 0.3 bB 4.8 ± 0.5 aC 6.3 ± 0.2 bA
Pulling
Batch 8.3 ± 0.7 aA 6.7 ± 0.6 aB 5.6 ± 0.3 aB 6.6 ± 0.8 bB 5.4 ± 0.6 aB 9.1 ± 1.7 aA
Continuous 4.5 ± 0.2 bC 5.7 ± 0.6 aB 4.5 ± 0.3 bC 8.0 ± 0.5 aA 5.2 ± 0.6 aBC 7.4 ± 0.4 aA

118
0
50
100
150
200
250
Pic
kin
g
Cutt
ing
Pull
ing
Pic
kin
g
Cutt
ing
Pull
ing
Pic
kin
g
Cutt
ing
Pull
ing
Pic
kin
g
Cutt
ing
Pull
ing
Pic
kin
g
Cutt
ing
Pull
ing
Pic
kin
g
Cutt
ing
Pull
ing
Exotic
kale
Ethiopian
kale
African
nightshade
Amaranth Cowpea Spider
plant
Ca
Ex
po
rt (
rela
tiv
e v
alu
e)*
Batch Continuous
Figure 4.8: Effect of harvest technique (cutting, picking, pulling) and production system
(batch, continuous) on Ca export from soil to market in different vegetable species; *for each
species, the N export in the batch system harvested by picking was set to 100%.
4.4.5 Potential for saving nutrients in batch and continuous systems through
optimization of harvest technique
In Kenya, most farmers harvest their vegetables by pulling. As seen in the results above,
pulling carried lots of nutrients with the harvested organs from the soil to the market along
with the non-edible organs, which are fed to animals or are used as fuel during vegetable
preparation. In figures 4.9 and 4.10, the amount of nutrients was determined, that can be
saved in both production systems, when vegetables are picked rather than pulled at harvest.
Considering batch production system, the results showed that harvesting exotic kale by
picking leaves saved less than 20% of N, K, Mg and S, from being exported to the market
whereas 22% and 49% of P and Ca are saved, respectively (Fig 4.9). In Ethiopian kale,
between 24 – 26% of N, Mg and S was saved by picking leaves rather than pulling.
Harvesting of Ethiopian kale also saved 37% P, 33% K and 49% Ca. African nightshade
harvested by picking reduced exports of N, P, K and Mg between 25% and 32%, whereby
16% S and 48% Ca were the lowest and highest values of all saved minerals. Production and
harvest of amaranth by picking saved about 35% N, 58% P, 59% K, 33% Mg, 42% S and
38% Ca, whereas in cowpea 9% N, 11% P, 19% K, 15 Mg, 29% S and 35% Ca were saved

119
from export. More than 30% of all measured nutrients were saved when the spider plant was
harvested by picking instead of pulling, saving 55 % K.
0
10
20
30
40
50
60
70
Exotic kale Ethiopian
kale
African
nightshade
Amaranth Cowpea Spider plant
Per
cen
tage
min
eral
s sa
ved
N P K Mg S Ca
Figure 4.9: Amount of nutrients (percentage) saved on export to the market when harvest
method changed from pulling to picking in the batch system. The nutrients removed (kg per
103 kg leaf fresh mass) in specific vegetable species through picking were compared to those
removed by pulling and then made up to percentage (n = 4).
More nutrients were saved in the continuous system compared to the batch system, when
vegetables were harvested by picking rather than pulling (Fig. 4.10). Exotic kale saved the
least nutrients ranging from 6% for Ca to 23 % and 24 % for K and P respectively, thus
different harvesting techniques of exotic kale does not have a big impact on nutrient export as
opposed to other species. Picking of Ethiopian kale saved over 40% of N, P, K and S from
export as well as 38% Mg and 25% Ca in the continuous system. For African nightshade,
picking saved between 24% and 30% of N, Mg, S, Ca and over 40% of P and K. Amaranth
could save a huge amount of nutrients when harvested by picking, saving up to 33% N, 65%
P, 60% K, 41% Mg, 45% S and 49% Ca. On the other hand, cowpea saved 17% Ca and 49%
S. Picking spider plant saved 35 % of N and more than 40% of all other minerals exports.

120
0
10
20
30
40
50
60
70
Exotic kale Ethiopian
kale
African
nightshade
Amaranth Cowpea Spider plant
Per
ecen
tage
min
eral
sav
ed
N P K Mg S Ca
Figure 4.10: Amount (percentage) of nutrients saved from exportation to the market when
vegetables in the continuous system are harvested by picking. The nutrients removed (kg per
103 kg leaf fresh mass) in specific vegetable species through picking were compared to those
removed by pulling and then made up to percentage (n = 4).
4.5 Discussion
4.5.1 Effect of species, harvest technique and production system on nutrient fluxes from
soil to market
The study showed that vegetable species differed in the amount of nutrients they export to the
market from the soil. This can be attributed to physiological nutrient demand of the plant
species or germplasm (Vanlauwe et al. 2015). Majumdar et al. (2016), outlined that plant
genotype, root system and harvest index affected plant nutrient uptake and export. Overall,
spider plant removed higher amounts of N and P, while kales exported a lot of S from the soil
to the market (Table 4.14, 4.15 and 4.17, respectively). Nevertheless, amaranth exported high
levels of K and Mg, which were approximately three times higher than the least exporters in
the pulling system (table 4.15 and 4.18). This clearly showed that these vegetables differ in
most of their physiological characteristics, which affected demand for particular nutrients.
Past study found out that species indeed differed in the amount of nutrients exported. Abdalla
et al. (2012) found leafy vegetables to differ in nutrient export with cowpea having the highest
export of N (39 kg N per 103 kg dry mass) followed by (in decreasing order) purslane
(Portulaca oleracea), radish (Raphanus raphanistrum subsp. sativus), Jew’s mallow

121
(Corchorus olitorius) and rocket (Eruca vesicaria ssp. sativa). The amounts of P and K
exported were higher in cowpea and Jew’s mallow, respectively. The nutrient exports for
cowpea in this study by Abdalla et al. (2012) were similar to our study for N (assuming that
dry mass was equivalent to 10% of fresh mass) and slightly lower for P (0.38 kg P per 103
fresh mass) and K (3.1 kg K per 103 fresh mass). Diogo et al. (2010) found amaranth to export
more N (41 kg per 103 dry mass), P (6.3 kg per 103 dry mass) and K (64 kg per 103 dry mass)
than lettuce - Lactuca sativa, 35 N kg, 5.9 kg P, 72 kg K per 103 dry mass), cabbage -
Brassica oleracea var. capitate (33 kg N, 6.8 kg P, 36 kg K per 103 dry mass) and tomatoes -
Solanum lycopersicum (27 kg N, kg per 103 dry mass). In findings of Diogo et al. (2010) it
was clear, that leafy vegetables exported more nutrients from the soil compared to fruit
vegetables. Other studies that have found variations of nutrient export include Lu et al. (2011)
on tomatoes, radish (Raphanus raphanistrum subsp. sativus) and pakchoi (Brassica rapa
subsp. chinensis), Siegfried et al. (2011) on cropping sequence involving carrot (Daucus
carota subsp. Sativus), cauliflower (Brassica oleracea var. botrytis), and radish (Raphanus
raphanistrum subsp. sativus), and Khai et al. (2007) on 20 different vegetable tin species in
South Asia. It should be deduced from findings of Diogo et al. (2010) on nutrient export in
millet (21 kg N, 5.2 kg P, 12 kg K per 103 dry mass), that vegetables are heavy exporters of
minerals from the soil compared to cereals or pulses. Also Safi et al. (2011) found N, P, K
export in three farming systems to be highest in vegetables compared to cereals and grapes,
for instance with 46% of total N applied, followed closely by cereals (40%) and grapes (14%).
Plant biomass and mineral allocation among vegetable organs also played a major role in
mineral export. For instance, the kales and African nightshade obtained the highest total yield
compared to the remaining three species (Table 4.9) and thus are likely to export more
nutrients from the soils compared to those species that produced low yield under the same
nutrient application. Biomass allocation was highest towards leaves, followed by the stems in
all the vegetable species. Given that high amounts of nutrients were found in the leaves,
undoubtedly most nutrients are lost through harvesting of leaves and transport to the market.
Our findings are in agreement with Liu et al. (2010), whose study revealed that nearly 55% of
N exportss came from harvested crop organs (35%) and crop residues (20%). For our case, the
harvested organs are the leaves, while the residues are the stems, stubbles and coarse roots.
The differences in biomass allocation affected the nutrient export among species. At harvest,

122
removal of plant organs led to both non – productive losses and losses, which are beneficial to
human beings in form of nutrients. The beneficial losses comprised mainly of leaves (edible
organs), while the non – productive were made up of stems, stubbles and coarse roots. Thus,
differences in nutrient loss among species can also be derived from the plant organs that are
transported to the market. In Kenya, most farmers harvest their vegetables by pulling and then
transfer all the nutrients to the market without considering replenishment of lost nutrients to
the soil. Considering all the nutrients measured, harvesting by picking transported less
nutrients compared to cutting and pulling of the vegetables (Table 4.14 – 4.19). This was
expected, because in cutting and pulling, non-edible plant parts which could be incorporated
into soil after harvesting are also transported to the market. Considering nutrient export
relative values, exotic kale did not show large differences in nutrient export among the
harvesting techniques, especially for N, S and Mg. Ethiopian kale and amaranth, showed a big
difference (more than 1.5 times) between picking in the batch system and pulling both
production systems for most nutrients. Thus amaranth and Ethiopian kale should be
preferably harvested by picking of leaves to avoid heavy export of nutrients.
Production systems did not differ in nutrient export in most species, when vegetables were
harvested by picking, because at the time of harvest the leaves contained the maximum
amount of nutrients needed and no translocation had occurred as a result of deficiency or for
production of reproductive organs in the plant, in both production systems. When pulling or
cutting, most vegetables showed the highest nutrient export in the continuous system,
especially Ethiopian kale, African nightshade and cowpea. Some vegetables did not show any
difference in nutrient export between the production systems. The differences were an
indication that nutrient accumulation in the vegetable species, especially in the stems of the
plant, varies with time and was species-specific. The longer the plant stays on the farm, the
higher the amount of nutrients and carbon incorporated into biomass. Thus, for the soil
organic matter enrichment and effective nutrient replenishment through non-edible plant
organs, continuous method can be the most preferred system. As discussed before, pulling can
deprive the soil more nutrients, especially in continuous production of vegetable species. A
survey study by Onyuka et al. (personal communication) showed soils from AIVs growing
areas in Kenya (Kisii and Kakamega County) to be very low in N, P and S. These could be

123
attributed to vegetable species majorly grown in that parcel of land, harvesting techniques and
production methods.
Although we were interested in measuring harvest related nutrient removal in our study,
which included edible and non-edible organs, some of the nutrients may have been lost
through leaching, soil erosion and, in case of N, by denitrification. Leaching of nutrients,
especially N and K, can be difficult to extrapolate, which basically depends on nutrient form
applied, soil moisture and rainfall pattern and amount. Since our experiment involved use of
irrigation water, it could have leached the nutrients deep to the ground, where plant roots
cannot reach. Predotova et al. (2011), found leaching in vegetable garden in Niger to remove
0.7 kg P ha-1 year-1, while N varied according to soil texture. For our study, it was anticipated
that most leaching occurred in the batch system, where vegetables were harvested and the
ground left without cover. Since some minerals had not been fully utilized and were still in
the soil, they could be leached away. Neeteson et al. (2003), did a study in field vegetable
production and stated that large amounts of residual soil mineral N was lost through leaching
after harvesting vegetables.
On the other hand, denitrification was possible. Our experiment involved the use of calcium
ammonium nitrate as a source of N. There were possibilities of N losses as a result of
ammonia volatilization, which highly depended on soil pH, texture and climatic factors. Our
soils, that were finely tilled, provided room for exchange of oxygen due to aeration.
Denitrification is likely to occur in the top 10 cm of fine textured soils (Neeteson and Carton
2001). There was speculation of lower denitrification in vegetables compared to cereals.
When vegetables are grown under continuous system regeneration of new leaves is allowed
after harvest of older leaves and this gives room for carbon build up throughout the roots,
which reduces the chances of denitrification unlike in cereals, where harvesting is only done
once. Also exposure to direct sunlight without soil cover activates the denitrification process,
which could be higher in the batch system than continuous system after harvesting. It was
found out, that after first and second round harvesting of AIVs in the continuous system, the
vegetables covered over 50% of the ground, thus minimizing exposure and N loss.
Erosion also contributed to nutrient losses in our experiment, which, according to Stoorvogel
and Smaling (1990), is attributed to soil crop/species cover. The review article reported soil
loss in Kenya under maize to be 20 – 40 t ha-1 year-1, 10 – 15 t ha-1 year-1 for vegetables and

124
15 – 20 t ha-1 year-1 for tea and coffee. The amount of nutrients removed through erosion
depends on the topography of the area (slope gradient) and field management as well. Wind
and water can move the soil from one point to another. In our experiment possible erosion
could be minimal and in case of occurrence it was likely to be in the batch system, when the
plants were harvested and ground left bare for some time, unlike in the continuous system,
where the crops covered the soil for a longer period. Also, harvesting by pulling exposed the
soil to erosion and thus results to nutrient loss and this should be avoided.
Our study could not quantify these losses and thus an extensive research has to be conducted
to bridge this gap and come up with correct findings on vegetables and specifically AIVs.
Loss of nutrients through leaching, denitrification and soil erosion are not as large as those
from harvested organs and plant residues. In a study done in Kisii, Kakamega and Embu
counties in Kenya, Van den Bosch et al. (1998), estimated the annual losses per hectare due to
leaching at 53 kg N, due to gaseous emissions at 24 kg N and due to erosion at 28 kg N, 10 kg
P and 33 kg K. These losses are site specific, depending on factors like topography, physical
soil characteristics and weather.
4.5.2 Fertilizer demand of vegetable species relative to maize
The above discussion shows that vegetables export more nutrients and differ greatly in the
type and amount of nutrients exported. The amount of nutrients exported from the farm with
the products sold on the market is closely related to the yield levels. The differences between
species in the total dry matter (Table 4.10 and 4.11) of our results reflect the site-specific
species-environmental interaction, amaranth and spider plant were the most productive and
cowpea the least productive. Under other environmental conditions (temperatures, occurrence
of pests and diseases, availability of water), the ranking of species with regard to productivity
would have been possibly different.
To obtain more generally applicable data on the amount of nutrients removed from the farm
with the products and to derive species-specific fertilizer recommendations, we calculated the
amount of nutrients removed from the farm per 10-3 kg of edible yield (leaves and tender
laterals) for all species.
The nutrient concentrations of the edible plant organs in the batch system were used to
calculate the nutrient ratios in the edible organs of vegetables compared to those of the edible
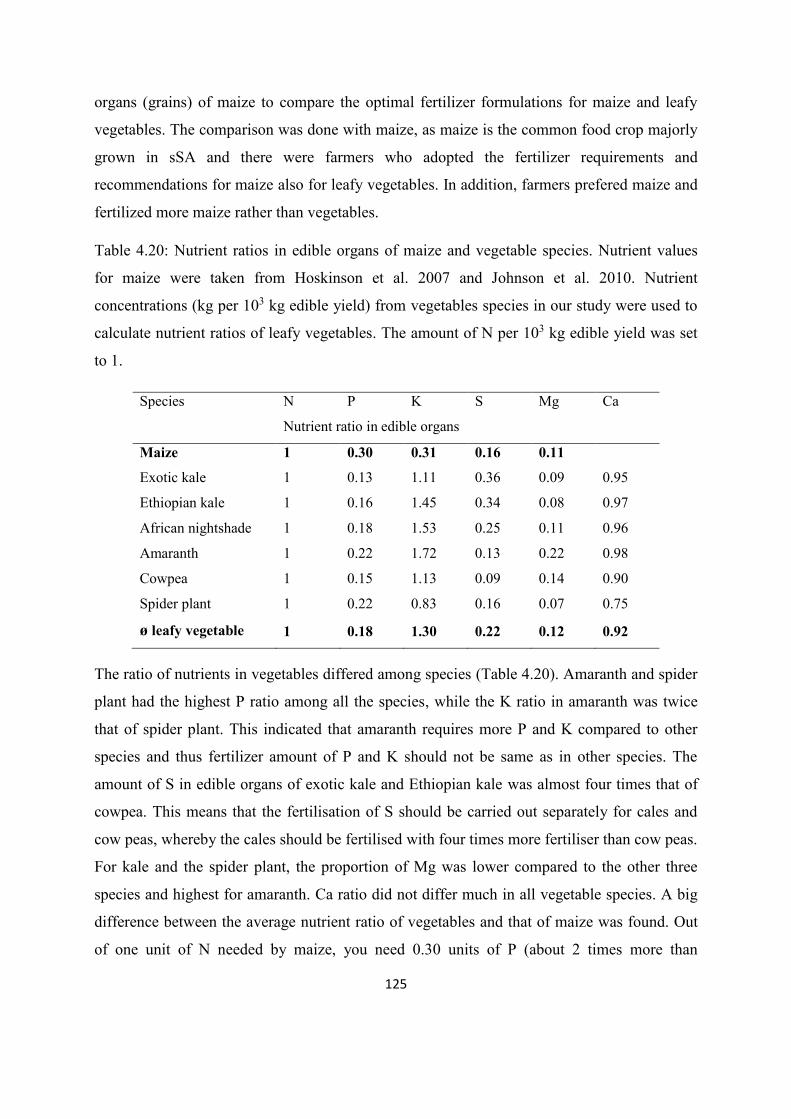
125
organs (grains) of maize to compare the optimal fertilizer formulations for maize and leafy
vegetables. The comparison was done with maize, as maize is the common food crop majorly
grown in sSA and there were farmers who adopted the fertilizer requirements and
recommendations for maize also for leafy vegetables. In addition, farmers prefered maize and
fertilized more maize rather than vegetables.
Table 4.20: Nutrient ratios in edible organs of maize and vegetable species. Nutrient values
for maize were taken from Hoskinson et al. 2007 and Johnson et al. 2010. Nutrient
concentrations (kg per 103 kg edible yield) from vegetables species in our study were used to
calculate nutrient ratios of leafy vegetables. The amount of N per 103 kg edible yield was set
to 1.
Species N P K S Mg Ca
Nutrient ratio in edible organs
Maize 1 0.30 0.31 0.16 0.11
Exotic kale 1 0.13 1.11 0.36 0.09 0.95
Ethiopian kale 1 0.16 1.45 0.34 0.08 0.97
African nightshade 1 0.18 1.53 0.25 0.11 0.96
Amaranth 1 0.22 1.72 0.13 0.22 0.98
Cowpea 1 0.15 1.13 0.09 0.14 0.90
Spider plant 1 0.22 0.83 0.16 0.07 0.75
ø leafy vegetable 1 0.18 1.30 0.22 0.12 0.92
The ratio of nutrients in vegetables differed among species (Table 4.20). Amaranth and spider
plant had the highest P ratio among all the species, while the K ratio in amaranth was twice
that of spider plant. This indicated that amaranth requires more P and K compared to other
species and thus fertilizer amount of P and K should not be same as in other species. The
amount of S in edible organs of exotic kale and Ethiopian kale was almost four times that of
cowpea. This means that the fertilisation of S should be carried out separately for cales and
cow peas, whereby the cales should be fertilised with four times more fertiliser than cow peas.
For kale and the spider plant, the proportion of Mg was lower compared to the other three
species and highest for amaranth. Ca ratio did not differ much in all vegetable species. A big
difference between the average nutrient ratio of vegetables and that of maize was found. Out
of one unit of N needed by maize, you need 0.30 units of P (about 2 times more than

126
vegetables), 0.31 units of K (about 4 times less than vegetables). This clearly shows that the
fertilizer formula for maize, especially for the main nutrients N, P and K, is unsuitable for the
fertilization of leafy vegetables.
Considering the minimum duration maize takes on the farm (120 days) and comparing it with
vegetables grown in this time period, it was found that maize exported much less nutrients
through harvested organs when compared to vegetables (Fig. 4.11). It is estimated that in
Kenya, farmers produce an average of 2 tons ha-1 of maize grain in 120 days and 60 tons of
vegetables per ha-1 (3 seasons of vegetables grown in 120 days, AFDB 2015). From the data it
was clear that more than 6 times N, more than 3 times P, more than 25 times K, more than 4
times S and more than 5 times Mg might be exported by vegetables compared to maize. Some
species were bigger exporters than others, like spider plant, which exported 390 kg N ha-1 as
opposed to cowpea that exported 180 kg N ha-1. Highest and lowest nutrient exporters were:
spider plant exported 85 kg P ha-1 and African nightshade exported 32 kg P ha-1, amaranth
exported 432 kg K ha-1 and cowpea 264 kg K ha-1, exotic kale exported 94 kg S ha-1 and
cowpea 22 kg S ha-1, amaranth exported 56 kg Ca ha-1and Ethiopian kale 17 kg Ca ha-1. The
higher export of nutrients from leafy vegetables requires that farms where vegetables are
grown are fertilised with fertilisers with a suitable formula to maintain soil fertility. The
choice of vegetables is of the utmost importance in order to prevent strong nutrient exporters
being cultivated on less fertile soils or in the case of limited fertilizer availability.

127
0
50
100
150
200
250
300
350
400
450
500
MZ XK EK NS AM CP SP
Nutr
ient
transf
er
(kg h
a-1
in 1
20 d
ays
N P K S Mg
Figure 4.11: Nutrient export in maize and vegetable species in kg ha-1 within 120 days of
growth. The average yield of maize was 2 tons per ha and of vegetables 60 tons per ha.
Mineral concentrations (kg per kg 103 edible yield) of vegetables species from our study were
used to calculate amounts of nutrients exported. Nutrient values for maize were taken from
Hoskinson et al. 2007 and Johnson et al. 2010; MZ: maize, XK: exotic kale, EK: Ethiopian
kale, NS: African nightshade, AM: amaranth, CP: cowpea, SP: spider plant.
4.6 Conclusion and recommendation
Leafy vegetables, specifically AIVs, can play a major role in soil nutrient balance. It was
found, that these vegetables exported a lot of nutrients from the soil to the market compared to
exotic kale and to some extend maize or cereals. Thus, for farmers to get a better yield they
need to apply more fertilizer to these vegetables to avoid soil nutrient depletion. Farmers
should be made aware that the recommended fertilizer formula for maize does not contain the
optimal nutrient composition for vegetables and is therefore unsuitable for vegetable
fertilization.
On the other hand, for leafy vegetables the amount of nutrients leaving the farm per 103 kg of
edible yield strongly differs among species. Furthermore, the ratio of different nutrients (e.g.
the ratio of N to S) strongly differs. Thus, the fertilizer recommendation for leafy vegetables
should be species-specific with regard to total amount and nutrient ratio in fertilizer.

128
In the study, fewer nutrients were primarily lost when plant leaves were harvested, than
pulling of whole plant, which also depended on the vegetable species. Thus, harvest related
nutrient losses can be considerably reduced by harvesting only edible organs (picking) instead
of pulling the whole plant. Farmers can control the export of nutrients by choosing the
pickung harvesting technique and vegetable species. The choice of production method also played a role in some vegetable species, especially on
yield, where it was found that Ethiopian kale and African nightshade had a higher total yield
in batch system, while exotic kale did best in continuous system. Furthermore, the continuous
system resulted in higher levels of nutrient replenishment at the end of the growth cycle
compared with the batch system and considering growth duration. Use of continuous system
may lead to minimal amount of fertilizer application unlike for the batch system, where
fertilizer should be applied every planting time, because the initially applied may have been
lost through other means (leaching, erosion etc.).
The fertilization recommendation is based on the amount of individual nutrients that the plant
needs for optimal plant growth and on the knowledge of the optimal/potential yield of the
species. In order to provide the soil with sufficient nutrients, nutrients extracted from the soil
by crops in the previous growing season, nutrient losses by leaching, erosion and gaseous
emission as well as nutrients introduced into soil by irrigation, nitrogen fixation and
atmospheric deposition should be taken into account. Besides selecting the appropriate plant
species, the farmer can reduce the amount of nutrients extracted from the soil by by the choice
of production system and harvest technology. Thus, putting all the above factors into
consideration will lead to better fertilizer recommendation for achieving maximum
productivity.

129
5.0 Summary
AIVs have recently captured considerable attention as “super vegetables” due to their
nutritional and environmental benefits (Cernansky 2015). As AIVs include many species
belonging to different botanical families, more species-specific knowledge e.g. on nutritional
value and agronomic management is needed to fully exploit those benefits. In this thesis we
compared leafy AIV species from five families including C3 and C4 species, and a legume and
non-legume species (Brassica carinata/Cruciferae - Ethiopian kale, Amaranthus
cruentus/Amaranthaceae - amaranth, Vigna unguiculata/Leguminosae cowpea, Solanum
scabrum/Solanaceae - African nightshade, Cleome gynandra/Capparaceae - spider plant) with
a non-indigenous species, which is commonly grown in Kenya (Brassica oleracea
acephala/Cruciferae - “exotic kale”). We compared the leaf concentrations of beneficial and
heavy metals as an index for the nutritional value, the performance under different rates and
forms of phosphorus (P) supply as an index for adaptation to suboptimal chemical soil
conditions, and the harvest-related nutrient outflow from soil as an index for fertilizer need.
The thesis was imbedded in the interdisciplinary research program HORTINLEA
(Horticultural Innovation and Learning for Improved Nutrition and Livelihood in East
Africa).
For the assessment of leaf mineral element concentrations, we analysed 146 samples collected
from open-air and supermarkets in Nairobi during the dry and wet season. The element
concentrations significantly differed among species. For example, amaranth had particularly
high concentrations of K, Mg, Ca, Fe and Zn. Spider plant was characterized by particularly
high concentrations of P, Ca and Cu. Cowpea contained high Mn concentrations, while exotic
kale showed higher concentrations of S and Ca. The effect of market type (open air vs.
supermarket) on leaf mineral concentrations was negligible. Mineral concentrations in most
vegetable species did not differ between seasons, apart from K, for which concentration in all
species was higher in the wet than in the dry season. Exotic kale, Ethiopian kale and African
nightshade had higher Fe concentration in the wet season.
Our data indicate that AIV may substantially contribute to the recommended dietary intake
(RDI) of mineral elements for humans. For example a daily dish of 400 g vegetable fresh
mass depending on the specific species would contribute for Fe from 34% to 321% of RDI,
for Zn 16% to 51%, for Mg 81% to 284% and for Ca 58% to 168% of RDI. The potentially

130
high contribution of AIV to the RDI of Fe should be critically questioned, however, as high
leaf iron concentrations might have been the consequence of externally adhering ferrous
dust/soil particles.
Just like the essential mineral concentrations also the leaf concentrations of the heavy metals
Cd and Pb showed no differences between supermarkets and open air markets. In most AIVs,
the leaf Cd concentrations were higher in the dry than in the wet season. African nightshade
had somewhat higher Cd and Pb concentrations than other species. However, in nearly all
samples from all species, the concentrations of Cd and Pb were within the permissible levels
for leafy vegetables (WHO/FAO 2006).
Plant performance under different rates and forms of P supply was assessed in a pot
experiment in which plant were supplied with 49 mg P in form of soluble KH2PO4, or phytate
or poorly soluble rock P or FePO4. In a control treatment no P was applied. Shoot fresh mass
(i.e. agronomic yield) for all species was similar with P supply in form of KH2PO4 and
phytate indicating that all species were effective in using organic P sources. However, species
differed in their ability to use poorly soluble inorganic phosphates for yield production. Spider
plant had very low yield when supplied with either rock P or FePO4. Amaranth and Ethiopian
kale were particularly effective in using rock P, and Ethiopian kale and “exotic” kale were
effective in using FePO4 for yield production. The low ability of spider plant to use poorly
soluble inorganic P sources was associated with both, low uptake efficiency and low internal
utilization efficiency. Species also differed in their root morphology responses to low P
supply. For example, P deficiency was associated with a decrease in mean root diameter and
an increase of specific root length in African nightshade, whereas specific root length of
amaranth was decreased. In spider plant and amaranth, root hair density increased under
conditions of P deficiency, whereas root hair density was not modified by P supply in the
other species. Species also differed in their rhizosphere pH. In spider plant and both kales
rhizosphere pH was above 6 when the plants were well supplied with P, and decreased to
below 5 under conditions of P deficiency. In African nightshade, amaranth and cowpea,
rhizosphere pH was below 4 when plants were well supplied with P in form of KH2PO4, and
slightly increased under conditions of P deficiency. It is concluded that generalization about P
efficiency of AIV species is not justified. To inform farmers about the best choice of AIV

131
species under specific farm conditions, species-specific knowledge about P efficiency and
site-specific knowledge about the most important P forms in soil is needed.
For the assessment of harvest-related nutrient outflow from soil, which is an index for
fertilizer demand, we conducted a field experiment. At harvest we measured the nutrient
accumulation separately in fine and coarse roots, stubble, stems and edible organs (laterals
and leaves). We compared two cropping systems: In the “batch” system, the crop was
completely harvested, clearing the field for the next crop on the same field. In the
“continuous” system, at harvest one and two only the edible plant organs were harvested
leaving the roots and basal 10 - 15 cm of the shoot in the field. At the third harvest plants
were completely harvested. Furthermore, three harvesting methods were compared for the
batch system and the last harvest of the continuous system. Plants were either uprooted, cut 5
cm above the soil surface, or only edible organs were harvested. To obtain general data on
harvest-related nutrient fluxes, we calculated for all species the nutrient accumulation in
various plant organs per ton of edible yield. The harvest-related nutrient outflow from soil
was dependent on AIV species and harvest technique. In the “batch” system, harvest by
pulling out the plant removed between 4 kg N per ton edible yield for nightshade and 10 kg N
per ton edible yield for spider plant. The harvest-related P outflow per ton edible yield varied
between 0.65 kg P for cowpea and 2.38 kg P for spider plant. The largest amounts of N, P and
Ca were exported from soil with harvest of spider plant. The largest amounts of K and Mg
were exported in amaranth, and the largest amounts of S were exported with African kale and
“exotic” kale.
The harvest technique considerably influenced the amount of nutrients exported from soil to
market. Harvesting only edible plant organs resulted in highest savings of exported nutrients
compared to harvest by pulling the complete plant, as expected. For example, nutrient export
by spider plant could be reduced by 35 % for N, 40 % for P and 56 % for Ca, by changing
harvest method. In case of amaranth nearly 60 % of P and Mg could be saved. Change of the
harvest technique to picking leaves reduced export of Ca by 35 % up to 50 % in all AIVs. The
amounts of N, P, K and Mg saved form export in exotic kale and cowpea were lower, ranging
between 10 % und 20 %.
The production system had no influence on yield of amaranth, cowpea and spider plant.
Exotic kale had higher yield in the “batch” system whereas the yield of Ethiopian kale and

132
nightshade was higher in the continuous system. When harvesting just edible parts, almost no
effect of production system on nutrient export was observed. When harvested by cutting,
spider plant and amaranth exported higher amounts of P, K and Ca in the “batch” system.
Generally, export of calcium was higher in the “batch” system, except in cowpea. On the
other hand, P, K, S and Mg were exported in higher amounts in the “continuous” system,
especially when plants were pulled for harvest. High amounts of nutrients could be saved by
optimizing harvest procedures in “continuous” system as well. To summarize, our data show
that recommendations about the amount and composition of fertilizer input, which is
necessary to replace harvest-related nutrient losses from soil should be species-specific, and
should also take into consideration the harvest technique and the production system.
In conclusion, the data of this thesis showed that generalizations about AIV should be
avoided. Significant differences among AIV species with regard to their nutritional value,
their performance under suboptimal P supply and in fertilizer requirements make it very clear
that each species should be evaluated separately.

133
5. Zusammenfassung
Durch ihre Umwelt- und Nährwertvorteile erweckten Afrikanische indigene Blattgemüse –
„African Indigenous Vegetables“ (AIV) in letzter Zeit Aufmerksamkeit als „Supergemüse“
(Cernansky 2015). Da mehrere Spezies aus unterschiedlichen botanischen Familien innerhalb
der AIVs vertreten sind, ist ein besseres Verständnis Spezies spezifischer Eigenschaften, wie
z.B. Ernährungswert und agronomischem Management nötig, um diese Vorteile voll
ausschöpfen zu können. In dieser Arbeit haben wir Afrikanisch indigene Blattgemüsearten
aus fünf Familien, inklusive C3 and C4 Spezies und Leguminosen und nicht-Leguminosen
(Brassica carinata/Cruciferae - Ethiopian Kale, Amaranthus cruentus/Amaranthaceae -
Amaranth, Vigna unguiculata/Leguminosae - Cowpea, Solanum scabrum/Solanaceae -
African Nightshade, Cleome gynandra/Capparaceae - Spiderplant) mit einer importierten und
in Kenia häufig angebauten Gemüseart (Brassica oleracea acephala/Cruciferae - Exotic Kale)
verglichen. Wir betrachteten die Pflanzenarten hinsichtlich ihrer Konzentrationen an
wertgebenden und toxischen Elementen in Blättern als Index für den Nährwert, ihrer
Reaktionen auf unterschiedliche zur Verfügung gestellten Mengen und Formen an Phosphor
(P) als Index für die Adaptation an suboptimale chemische Bodenbedingungen und ihre
erntebedingten Nährstoffausfuhren aus dem Boden als Index für den Düngerbedarf. Die
Arbeit war in das interdisziplinäre Forschungsprogramm HORTINLEA (Horticultural
Innovation and Learning for Improved Nutrition and Livelihood in East Africa) eingebunden.
Für die Beurteilung der Elementkonzentrationen in Blättern haben wir 146 Proben von Open
Air- und Supermärkten in Nairobi während der Trocken- und Regenzeit gesammelt und
untersucht. In den unterschiedlichen AIV Spezies gab es signifikante Unterschiede in den
Nährstoffkonzentrationen. So wurden, zum Beispiel, in Amaranth hohe Konzentrationen an
K, Mg, Ca, Fe und Zn gefunden. Spiderplant enthielt hohe Konzentrationen an P, Ca und Cu,
Cowpea mehr Mn und Exotic Kale höhere Konzentrationen an S und Ca. Der Effekt des
Markttyps auf die Nährstoffkonzentration war vernachlässigbar. Die Elementkonzentrationen
in den meisten Gemüsearten zeigten keine Unterschiede zwischen der Regen- und
Trockenzeit, abgesehen von Kalium, welches in höheren Konzentrationen während der
Regenzeit in allen Spezies gefunden wurde. Exotic Kale, Ethiopian Kale und African
Nightshade zeigten zudem auch höhere Konzentrationen an Eisen während der Regenzeit.
Aus unseren Daten geht hervor, dass AIV Spezies wesentlich dazu beitragen können die

134
empfohlenen täglichen Aufnahmemengen an Mineralstoffen für Menschen zur Verfügung zu
stellen. Der Verzehr einer Gemüsemahlzeit von 400 g Frischgewicht könnte je nach Spezies
z.B. die empfohlenen täglichen Aufnahmemengen an Eisen zu 34% bis 321% decken, an Zink
zu 16% bis 51%, an Mg zu 81% bis 284% und an Ca von 58% bis zu 168%. Der Anteil an
Eisen, welcher durch AIV aufgenommen werden kann, sollte kritisch betrachtet werden, da
anhaftende, eisenhaltige Staub-/Bodenpartikel die Ursache für die höheren gemessenen
Eisenkonzentrationen in den Blättern sein können.
Wie bei den gewünschten Nährstoffen zeigte sich auch bei den Schwermetallgehalten in den
Gemüsen kein Effekt zwischen Open Air- und Supermarkt. In Bezug auf die Jahreszeiten
wurden in den meisten AIVs höhere Cadmiumkonzentrationen während der Trockenzeit
gefunden als in der Regenzeit, was auf die Bleigehalte nicht zutraf. Innerhalb der AIVs hatte
African Nightshade die höchsten Konzentrationen an Cadmium und Blei. Dabei wurden die
von der WHO/ FAO 2006 festgesetzten erlaubten Höchstkonzentrationen bei allen
gemessenen Cadmium- und Bleikonzentrationen nicht überschritten.
Die Reaktionen der Pflanzen auf unterschiedliche Mengen und Formen an Phosphor wurden
mit Hilfe eines Gefäßversuchs untersucht. Dabei wurden die Pflanzen jeweils mit 49 mg P
versorgt, zum einen in löslicher P-Form mittels KH2PO4, zum andern mit organisch
gebundenem P in Form von Phytat oder mit schwer löslichen Phosphat in Form von
Rohphosphat, bzw. FePO4. Zusätzlich gab es eine Variante in der kein P zugegeben wurde.
Die Sprossfrischmasse (agronomischer Ertrag) war für alle Spezies ähnlich, wenn P in Form
von KH2PO4 oder Phytat zur Verfügung stand, was darauf hinweist, dass alle Spezies die
organische P-Quelle effektiv nutzen konnten. Die Spezies unterschieden sich jedoch in Ihrer
Fähigkeit schwer lösliche P-Quellen zur Ertragsbildung zu nutzen. Spiderplant hatte sehr
geringe Erträge mit Rohphosphat oder auch FePO4 als P-Quelle. Amaranth und Ethiopian
Kale hingegen konnten Rohphosphat sehr gut nutzen, Ethiopian Kale und Exotic Kale
konnten FePO4 effektiv zur Ertragsbildung nutzen. Die geringe Fähigkeit von Spiderplant die
schwer löslichen P- Angebotsformen verwerten zu können stand in Zusammenhang mit
geringer Aufnahmeeffizienz als auch geringer interner Nutzungseffizienz. Die Spezies
unterschieden sich auch hinsichtlich ihrer Reaktionen der Wurzelmorphologie auf niedrige
Phosphorverfügbarkeit. Unter P-Mangel kam es zur Abnahme des Wurzeldurchmessers und
zur Zunahme der spezifischen Wurzellänge in African Nightshade, wohingegen die

135
spezifische Wurzellänge in Amaranth abnahm. In Spiderplant und Amaranth erhöhte sich die
Wurzelhaardichte unter P-Mangel, wohingegen sich die Wurzelhaardichte der anderen
Spezies nicht änderte. Ebenso wurde der pH-Wert der Rhizosphäre innerhalb der
unterschiedlichen Spezies unterschiedlich beeinflusst. Bei Spiderplant und beiden Kales lag
der pH-Wert der Rhizosphäre unter optimaler Versorgung mit P bei über 6, sank aber auf
Werte unter 5 unter P-Mangelbedingungen. Bei African Nightshade, Amaranth und Cowpea
lag der pH-Wert der Rhizosphäre unter 4 bei Zugabe von KH2PO4 und stieg leicht an unter P-
Mangelbedingungen. Daraus wurde geschlossen, dass keine generelle Aussage zur P-
Effizienz der AIV Spezies getroffen werden kann. Um Bauern beraten zu können, welche
Spezies zum Anbau auf einer bestimmten Farm ausgewählt werden sollte, benötigt man
Kenntnis der Spezies spezifischen P-Effizienz und Kenntnis über die P-Formen im Boden der
Farm.
Die Untersuchung der erntebedingten Nährstoffströme aus dem Boden, als Index für den
Düngebedarf, wurde mittels eines Feldexperimentes bestimmt. Zur Ernte wurde die Menge an
Nährstoffen in Fein- und Grobwurzeln, Stoppeln, Stängeln und verzehrbaren Organen (Blätter
und Seitentriebe) gemessen. Wir verglichen zwei Anbausysteme: Im „Batch“ System wurden
die gesamten Pflanzen geerntet und die nächsten Pflanzen wurden anschließend auf
demselben Feld angebaut. Im „Continuous“ System wurden bei der ersten und zweiten Ernte
nur die essbaren Pflanzenteile geerntet, wobei Wurzeln und die unteren 10-15 cm des
Sprosses auf dem Feld verblieben. Bei der dritten Ernte wurde die komplette Pflanze geerntet.
Zusätzlich wurden drei Erntemethoden für das „Batch“ System und die letzte Ernte des
„Continuous“ Systems miteinander verglichen. Dabei erfolgte die Ernte entweder durch
Herausziehen der gesamten Pflanze, Abschneiden der Pflanze 5 cm über dem Boden oder
Abschneiden nur der essbaren Pflanzenteile. Zum Vergleich der erntebedingten
Nährstoffexporte vom Feld wurden für alle Spezies die Nährstoffgehalte einzelner
Pflanzenorgane pro Tonne essbarem Ertrag berechnet. Es wurde gezeigt, dass der
Nährstoffaustrag aus dem Boden abhängig ist von den einzelnen Pflanzenarten, als auch der
Erntetechnik. Betrachtet man das “Batch“ Produktionssystem in dem die Ernte durch
Herausziehen der gesamten Pflanze erfolgte, so wurden im Fall von Stickstoff zwischen 4 kg
N pro Tonne Blattfrischmasse bei Nightshade und 10 kg N pro Tonne Blattfrischmasse bei
Spiderplant vom Feld ausgetragen. Bei Phosphor waren es zwischen 0,65 kg P pro Tonne

136
Blattfrischmasse (Cowpea) und 2,38 kg P pro Tonne Blattfrischmasse (Spiderplant), die
ausgetragen wurden. Insgesamt wurden die höchsten Mengen an Stickstoff, Phosphor und
Calcium durch Spiderplant ausgetragen. Der Austrag von Kalium und Magnesium erfolgte
hauptsächlich durch Amaranth. Die beiden Kalearten exportierten besonders viel Schwefel.
Die Höhe der Nährstoffexporte wurde in Abhängigkeit von betrachteter Pflanzenart und
Nährstoffe durch Anwendung der beiden anderen Erntetechniken reduziert. Die Ernte nur der
essbaren Planzenteile führte erwartungsgemäß zu den deutlichsten Einsparungen im Vergleich
zum Herausziehen der gesamten Pflanze. So wurde der Nährstoffentzug von, z.B. Spiderplant
durch Ernte nur der essbaren Teile um 35 % bei Stickstoff, 40% bei Phosphor und 56 % bei
Calcium gesenkt. Bei Amaranth konnten knapp 60% an Phosphor und Magnesium eingespart
werden. Der Calciumaustrag wurde bei allen Spezies um 35 % bis 50 % gesenkt. Geringer
fielen die eingesparten Mengen an exportiertem Stickstoff, Phosphor, Kalium und Magnesium
bei Exotic Kale und Cowpea aus, sie bewegten sich in einem Bereich zwischen 10 % und 20
%.
Der Vergleich der Produktionssysteme zeigte keinen Einfluss auf die Erträge von Amaranth,
Cowpea und Spiderplant. Exotic Kale lieferte höhere Erträge im “Batch“ System, Ethiopian
Kale und Nightshade im “Continuous“ System. Erntet man ausschließlich die Blätter, so sind
die Nährstoffausträge in beiden Produktionssystemen ähnlich. Schneidet man die Pflanzen zur
Ernte ab führt dies bei Spiderplant und Amaranth für Phosphor, Kalium und Calcium zu
höheren Austrägen im “Batch“ System. Für Calcium fand sich generell ein höherer Austrag
im “Batch“ System, mit Ausnahme von Cowpea. Phosphor, Kalium, Schwefel und
Magnesium hingegen wurden tendenziell vermehrt im “Continuous“ System entzogen, v.a.
beim Ernten durch Herausziehen der Pflanze. Auch im “Continuous“ System können große
Mengen an Nährstoffen durch eine optimierte Erntemethode eingespart werden. Letztendlich
zeigen unsere Daten, dass Empfehlungen zur Menge und Zusammensetzung von
einzusetzendem Dünger, welcher die erntebedingten Nährstoffverluste aus dem Boden
ersetzen soll, abgestimmt sein sollte auf die angebaute Spezies, dem Produktionssystem und
der Erntetechnik.
Die Daten dieser Arbeit zeigen, dass verallgemeinerte Aussagen zu den AIVs vermieden
werden sollten. Es wurden signifikante Unterschiede der einzelnen AIVs hinsichtlich ihres
Nährwerts, ihres Umgangs mit suboptimaler Phosphorversorgung und im Düngerbedarf

137
gefunden, so dass für eine genaue Bewertung jeder aufgeführte Gesichtspunkt für jede
Gemüseart separat betrachtet werden sollte.

138
6.0 References
Abdalla, S. B., Predotova, M., Gebauer, J. and Buerkert, A. (2012): Horizontal nutrient flows
and balances in irrigated urban gardens of Khartoum, Sudan. Nutrient Cycling in
Agroecosystems, 92(2), 119–132. http://doi.org/10.1007/s10705-011-9476-7.
Abdu, N., Agbenin, J. O. and Buerkert, A. (2011): Phytoavailability, human risk assessment
and transfer characteristics of cadmium and zinc contamination from urban gardens in
Kano, Nigeria. Journal of the Science of Food and Agriculture, 91(15), 2722–2730.
http://doi.org/10.1002/jsfa.4583.
Abel, S. (2011): Phosphate sensing in root development. Current Opinion in Plant Biology,
14(3), 303–309. http://doi.org/10.1016/j.pbi.2011.04.007.
Abugre, C., Appiah, F. and Kumah, P. (2011): The effect of time of harvest and drying
method on the nutritional composition of spider flower (Cleome gynandra L).
International Journal of Postharvest Technology and Innovation, 2(3), 221.
http://doi.org/10.1504/IJPTI.2011.043327.
Abukutsa Onyango, M. O. (2010): Strategic repositioning of African indigenous vegetables in
the Horticultural sector.
Adam A. (2016): Der Nährstoff- und Mineralstoffgehalt von vier ausgewählten afrikanischen
indigenen Blattgemüsearten (Amaranthus cruentus, Cleome gynandra, Solanum scabrum
und Vigna unguiculata) - eine Literaturrecherche.
AFDB (2015): Cereal Crops: Rice, Maize, Millet, Sorghum, and Wheat. Background paper
Ahenkora, K., Adu Dapaah, H. K. and Agyemang, A. (1998): Selected nutritional components
and sensory attributes of cowpea (Vigna unguiculata [L.] Walp) leaves. Plant Foods for
Human Nutrition, 52(3), 221–229. http://doi.org/10.1023/A:1008019113245.
Akombi, B. J., Agho, K. E., Merom, D., Renzaho, A. M. and Hall, J. J. (2017): Child
malnutrition in sub-Saharan Africa: A meta-analysis of demographic and health surveys
(2006-2016). PLoS ONE, 12(5), 1–11. http://doi.org/10.1371/journal.pone.0177338.

139
Ali, M. H. H. and Al-Qahtani, K. M. (2012): Assessment of some heavy metals in vegetables,
cereals and fruits in Saudi Arabian markets. Egyptian Journal of Aquatic Research, 38(1),
31–37. http://doi.org/10.1016/j.ejar.2012.08.002.
Alkama, N. E., Bolou, B. B., Vailhe, H., Roger, L., Ounane, J. M. and Drevon, J .J. (2008):
Genotypic variability in P use efficiency for symbiotic nitrogen fixation is associated with
variation in proton efflux in cowpea rhizosphere. Soil Biol. Biochem. 41 (9), 1823–1824.
Allen, L., de Benoist, B., Dary, O. and Hurrell R. (eds) (2006): Guidelines on food
fortification with micronutrients. World Health Organization, Geneva Also available via
http://www.who.int/nutrition/publications/micronutrients/.
Ancuceanau, R., Dinu, M., Hovane, M. V., Anghel, A. I., Popescu, C. V. and Negre, S.
(2015): A Survey of Plant Iron Content — A Semi-Systematic Review, 10320–10351.
http://doi.org/10.3390/nu7125535.
Andal, F. A (2016): Assessment of the Possible Utilization of Tomato as a Phytoremediant in
Soils Artificially Contaminated with Heavy Metals. International Journal of Applied
Environmental Sciences ISSN 0973-6077 Volume 11, Number 1 (2016), pp. 193-209.
Angel, S. J., Baker, M. J. A., Whiting S. N. and Chaney, L. R. (2003): Soil moisture effects
on uptake of metals by Thlaspi, Alyssum, and Berkheya. Plant and soil, 256: 325–332.
Ansah, G S., Adu-Dapaah, H., Kumaga, F., Gracen, V. and Nartey, F. K. (2016): Evaluation
of cowpea (Vigna unguiculata L. Walp.) genotypes for phosphorus use efficiency. Acta
Horticulturae, (1127), 373–380. http://doi.org/10.17660/ActaHortic.2016.1127.58.
ASDSP. (2015): Nairobi County. Agricultural Sector Development Support Programme.
Retrieved from http://www.asdsp.co.ke/index.php/nairobi-county.
Bai, Z., Ma, L., Ma, W., Qin, W., Velthof, G. L., Oenema, O. and Zhang, F. (2016): Changes
in phosphorus use and losses in the food chain of China during 1950–2010 and forecasts
for 2030. Nutrient Cycling in Agroecosystems, 104(3), 361–372.
http://doi.org/10.1007/s10705-015-9737-y.

140
Bain, L. E., Awah, P. K., Geraldine, N., Kindong, N. P., Sigal, Y., Bernard, N. and Tanjeko,
A. T. (2013): Malnutrition in Sub - Saharan Africa: Burden, causes and prospects. Pan
African Medical Journal, 15, 1–9. http://doi.org/10.11604/pamj.2013.15.120.2535.
Balemi, T. and Negisho, K. (2012): Management of soil phosphorus and plant adaptation
mechanisms to phosphorus stress for sustainable crop production: A review. Journal of
Soil Science and Plant Nutrition, 12(3), 547–561. http://doi.org/10.4067/S0718-
95162012005000015.
Beegle, D. B. and Durst, P. T. (2002): Managing Phosphorus for Crop Production. Penn state
extension. Agronomy Facts 13.
Bieleski, R. L. (1973): Phosphate pools, phosphate transport, and phosphate availability.
Annu. Rev. Plant Physiol. 24, 225–252.
Birchfield S. (2008) Rootfly; software for Minirhizotron Image Analysis.
https://cecas.clemson.edu/~stb/rootfly/Rootfly_help.html.
Birnin-Yauri, A. U., Yahaya, Y., Bagudo, U. B. and Noma, S. S (2011): Seasonal variation in
nutrient content of some selected vegetables from Wamakko, Sokoto State, Nigeria.
journal of Soil Science and Environmental Management Vol. 2(4), pp. 117-125.
Bittner, M. (2017): Effect of harvest technique and production system on yield, root
architecture and carbon input into soil of Amaranth.
Brown, L. K., George T. S., Dupuy L. X. and White P. J. (2013): A conceptual model of root
hair ideo types for future agricultural environments: what combination of traits should be
targeted to cope with limited P availability? Ann Bot 112:317–330.
Brown, S. L., Chaney, R. L., Angle, J. S. and Baker, A. M. (1995): Zinc and cadmium uptake
by hyperaccumulator Thlaspi caerulescens grown in nutrient solution. Soil Sci Am J 59:
125-133.
Bryla, D. R. and Duniway, J. M. (1997): Growth, phosphorus uptake, and water relations of
safflower and wheat infected with an arbuscular mycorrhizal fungus. New Phytol. (1997),
136, 581-590.

141
Caulfield, E. L., Richard, A. S., Rivera, A. J., Musgrove, P. and Black E. R (2006). Stunting,
Wasting, and Micronutrient Deficiency Disorders, Chapter 28; 551 – 567.
Cercamondi, C. I., Egli, I. M., Ahouandjinou, E., Dossa, R., Zeder, C., Salami, L. and
Zimmermann, M. B. (2010): Afebrile Plasmodium falciparum parasitemia decreases
absorption of fortification iron but does not affect systemic iron utilization : a double
stable-isotope study in young Beninese women 1 – 3, (2).
http://doi.org/10.3945/ajcn.2010.30051.Iron.
Cernansky, R., (2015): The rise of Africa’s super vegetables: Long overlooked in parts of
Africa, indigenous greens are now capturing attention for their nutritional and
environmental benefits. Nature 522 (7555), 146-148
Chauvin, N. D., Mulangu, F. and Porto, G. (2012): Food Production and Consumption Trends
in Sub-Saharan Africa: Prospects for the Transformation of the Agricultural Sector.
Working Papers, 76. http://doi.org/10.1016/j.foodpol.2013.10.006
Clemens, S., Aarts M. G. M., Thomine S. and Verbruggen N. (2012). Plant science: the key to
preventing slow cadmium poisoning. Vol. 18, issue 2; 92-99.
Chweya, J. A., Eyzaguirre, P. B. (eds). (1999): The biodiversity of traditional leafy
vegetables. IPGRI.
Crusak, M. A. (1994): Iron Transport to Developing Ovules of Pisum safivud. Seed lmport
Characteristics and Phloem Iron-loading Capacity of Source Regions. Plant Physiol. 104,
649-655.
Cunnigham, J. H., Milligan, G. and Trevisan L. (2001): Minerals in Australian fruits and
vegetables- a comparison of levels between the 1980s and 2000, Food Standards,
Australia and New Zealand, 10–16.
Dávila, O. G., Gómez-bernal, J. M. and Ruíz-huerta, E. A. (2011): Plants and Soil
Contamination with Heavy Metals in Agricultural Areas.
De Graaff, J., Kessler, A. and Nibbering, J. W. (2011): Agriculture and food security in
selected countries in Sub-Saharan Africa: Diversity in trends and opportunities. Food
Security, 3(2), 195–213. http://doi.org/10.1007/s12571-011-0125-4.

142
Dickinson, N., Rankin, J., Pollard, M., Maleta, K., Robertson, C. and Hursthouse, A. (2014):
Science of the Total Environment Evaluating environmental and social influences on iron
and zinc status of pregnant subsistence farmers in two geographically contrasting regions
of Southern Malawi. Science of the Total Environment, 500–501, 199–210.
http://doi.org/10.1016/j.scitotenv.2014.08.087.
Diogo, R. V. C., Buerkert, A. and Schlecht, E. (2010): Horizontal nutrient fluxes and food
safety in urban and peri-urban vegetable and millet cultivation of Niamey, Niger. Nutrient
Cycling in Agroecosystems, 87(1), 81–102. http://doi.org/10.1007/s10705-009-9315-2.
Drechsel, P. (2002): Comparing soil nutrient depletion in typical urban, peri-urban and rural
farming systems in Ghana. Practices and Constraints of Land and Water Resources
Management in Urban and Peri-Urban Agriculture, 7.
Ekesa, B. N., Walingo, M. K. and Abukutsa-Onyango, M. O. (2009): Accesibility to and
Consumption of Indigenous Vegetables and Fruits By Rural Households in Matungu
Division, Western Kenya. African Journal of Food Agriculture Nutrition and
Development, 9(8).
Faerge, J. and Magid, J. (2004): Evaluating NUTMON nutrient balancing in Sub-Saharan
Africa. Nut. Cyc. Agroecosyst., 69, 101–110.
Fang, Y., Nie, Z., Liu, F., Die, Q., He, J. and Huang, Q. (2014): Concentration and health risk
evaluation of heavy metals in market-sold vegetables and fishes based on questionnaires
in Beijing, China. Environmental Science and Pollution Research, 21(19), 11401–11408.
http://doi.org/10.1007/s11356-014-3127-x.
Fanzo, J. (2012): The Nutrition Challenge in Sub-Saharan Africa. UNDP - Regional Bureau
for Africa - Working PAper, (January), 1–68.
FAO (2004a). Vitamin and mineral requirements in human nutrition: report of a joint
FAO/WHO expert consultation, Bangkok, Thailand, 21–30 September 1998.
FAO (2004b): Scalling Soil Nutrient Balances. Enabling Mesolevel Application of African
Realities. FAO Fertilizer and Plant Nutrition Bulletin (Vol. 53).
http://doi.org/10.1017/CBO9781107415324.004.

143
FAO, & WHO (2001): Human Vitamin and Mineral Requirements. Human Vitamin and
Mineral Requirements, 303. http://doi.org/10.1016/B978-0-323-06619-8.10013-1.
FAO (2005). United Nations Food and Agriculture Organization. Increasing fruit and
vegetable consumption becomes a global priority. Available from:
http://fao.org/english/newsroom/focus/2003/fruitveg1.htm.
Fontes, F. L. R., Pereira, J. M. N. and Neves, L. C. J. (2014): Uptake and translocation of Cd
and Zn in two lettuce cultivars. http://dx.doi.org/10.1590/0001-37652014117912.
Frossard, E., Bucher, M., Ma, F., Mozafar, A. and Hurrell, R. (2000): Potential for increasing
the content and bioavailability of Fe, Zn and Ca in plants for human nutrition. Journal of
the Science of Food and Agriculture, 80, 861–879.
Gahoonia, T. S. and Nielsen, N. E. (1996): Variation in acquisition of soil phosphorus among
wheat and barley genotypes. Plant and Soil, 223–230. http://doi.org/10.1007/BF00011587.
Gall, J. E. and Rajakaruna, N. (2013): The physiology, functional genomics, and applied
ecology of heavy metal-tolerant Brassicaceae. Brassicaceae: Characterization, Functional
Genomics and Health Benefits, 121–148.
Ganry, J. (2009): Current Status of Fruits and Vegetables Production and Consumption in
Francophone African Countries - Potential Impact on Health. Human Health Effects of
Fruits and Vegetables, 249–256.
George, T. S., Hinsinger, P. and Turner, B. L. (2016): Phosphorus in soils and plants – facing
phosphorus scarcity, 1–6. http://doi.org/10.1007/s11104-016-2846-9.
Gibson, R. S., Wawer, A. A., Fairweather-tait, S. J., Hurst, R., Young, S. D., Broadley, M. R.,
Chilimba, C. D. A., Louise Ander, E., Watts J. M., Kalimbira A., Bailey B. K. and
Siyame, E. W. P. (2015): Dietary iron intakes based on food composition data may
underestimate the contribution of potentially exchangeable contaminant iron from soil.
Journal of Food Composition and Analysis, 40, 19–23.
http://doi.org/10.1016/j.jfca.2014.11.016.

144
Gonçalves, A., Goufo, P., Barros, A., Domínguez-Perles, R., Trindade, H., Rosa, E. A. S. and
Rodrigues, M. (2016): Cowpea (Vigna unguiculata L. Walp), a renewed multipurpose
crop for a more sustainable agri-food system: Nutritional advantages and constraints.
Journal of the Science of Food and Agriculture, 96(9), 2941–2951.
http://doi.org/10.1002/jsfa.7644.
Greenwood, D. J., Stellacci A. M., Meacham M. C., Broadley M. R. and White P. J. (2005):
Components of P response of different Brassica oleracea genotypes are reproducible in
different environments. Crop Science 45, 1728–1735.
Greffeuille, V., Kayodé, A. P. P., Icard-vernière, C., Gnimadi, M., Rochette, I. and Mouquet-
rivier, C. (2011): Changes in iron, zinc and chelating agents during traditional African
processing of maize : Effect of iron contamination on bioaccessibility, 126, 1800–1807.
http://doi.org/10.1016/j.foodchem.2010.12.087.
Gruhn, P., Goletti, F. and Yudelman, M. (2000): Integrated Nutrient Management, Soil
Fertility, and Sustainable Agriculture: Current Issues and Future Challenges. Food Policy.
http://doi.org/ISBN 0-89629-638-5.
Grusak, M. A. (1994): Iron transport to developing ovules of Pisum sativum. I. Seed import
characteristics and phloem iron-loading capacity of source regions. Plant Physiol. 104,
649-655.
Gunawardena, J., Egodawatta, P., Ayoko, G. A. and Goonetilleke, A. (2013): Atmospheric
deposition as a source of heavy metals in urban storm water. Atmospheric Environment,
68, 235–242. http://doi.org/DOI 10.1016/j.atmosenv.2012.11.06.2
Gupta, S., Gowri, B. S. and Lakshmi, A. J. (2013): Retention of nutrients in green leafy
vegetables on dehydration, 50(October), 918–925. http://doi.org/10.1007/s13197-011-
0407-z.
Habwe, F. O. and Walingo, K. M. (2008): Food processing and preparation technologies for
sustainable utilization of Africa indigenous vegetables for nutrition security and wealth
creation in Kenya. Using Food Science and Technology to Improve Nutrition and
Promote National Development.

145
Haileslassie, A., Priess, J., Veldkamp, E., Teketay, D. and Lesschen, J. P. (2005): Assessment
of soil nutrient depletion and its spatial variability on smallholders’ mixed farming
systems in Ethiopia using partial versus full nutrient balances. Agriculture, Ecosystems
and Environment, 108(1), 1–16. http://doi.org/10.1016/j.agee.
Hammond, J. P., Broadley, M. R., White, P. J., King, G. J., Bowen, H. C., Hayden, R. and
Greenwood, D. J. (2009): Shoot yield drives phosphorus use efficiency in Brassica
oleracea and correlates with root architecture traits. Journal of Experimental Botany,
60(7), 1953–1968. http://doi.org/10.1093/jxb/erp083.
Hart, A. D., Ajubuike, C. U., Barimalaa, I. S. and Achinewhu, S. C. (2005): Vegetable
consumption pattern of households in selected areas of the old Rivers State of Nigeria.
African J. of Food Agriculture Nutrition and Development Online 2005; 5(1). Available
from http://www.ajfand.net/index.html Accessed October 19th 2005.
HCD (2016). Horticulture validated report 2014, 1 – 68.
Hengl, T., Leenaars, J. G. B., Shepherd, K. D., Walsh, M. G., Heuvelink, G. B. M., Mamo, T.
and Kwabena, N. A. (2017): Soil nutrient maps of Sub-Saharan Africa: assessment of soil
nutrient content at 250 m spatial resolution using machine learning. Nutrient Cycling in
Agroecosystems, 109(1), 77–102. http://doi.org/10.1007/s10705-017-9870-x.
Hinsinger, P. (2001): Bioavailibility of soil inorganic P in the rhizosphere as effected by root-
induced chemical changes. Plant and Soil, 237, 173–195.
http://doi.org/10.1023/A:1013351617532.
Hinsinger, P., Plassard C., Tang C. and Jaillard B. (2003): Origins of root-mediated pH
changes in the rhizosphere and their responses to environmental constraints: A review.
Hoeppner, N. (2017): Nutzung anorganischer und organischer Phosphorquellen durch
verschiedene afrikanische Gemüsearten.
Hooda, P. S., Henry, C. J. K., Seyoum, T. A., Armstrong, L. D. M. and Fowler, M. B. (2004):
The potential impact of soil ingestion on human mineral metabolism’, Science of the Total
Environment, vol 333, pp75–87.

146
Hoskinson, R. L., Karlen, D. L., Birrell, S. J., Radtke, C. W. and Wilhelm, W. W. (2007).
Engineering, nutrient removal, and feedstock conversion evaluations of four corn stover
harvest scenarios. Biomass Bioenergy 31, 126–136.
Icard-Vernière, C., Picq, C., Courbis, L. and Mouquet-Rivier C. (2016). The Type of
Fortificant and the Leaf Matrix Both Influence Iron and Zinc Bioaccessibility in Iron-
fortified Green Leafy Vegetable Sauces from Burkina Faso. The Royal Society of
Chemistry, 1-3.
Imungi, J. K. and Potter, N. N. (1983): Nutrient Contents of Raw and Cooked Cowpea
Leaves. Journal of Food Science, 48(4), 1252–1254. http://doi.org/10.1111/j.1365-
2621.1983.tb09204.x.
Ingwersen, J. and Streck, T. (2005): A regional scale study on the crop uptake of cadmium
from sandy soils: measurement and modeling. J. Environ. Qual. 34, 1026–1035.
IPNI (1999): Functions of Phosphorus in Plants. Better Crops, 83(1), 6–7.
Ismail, G. and Suffla S. (2013). Child Safety, Peace and Health Promotion Child
Malnutrition.
JICA (2014): The Project on Integrated Urban Development Master Plan for the City of
Nairobi in the Republic of Kenya Final Report (Draft), (May), 221. Retrieved from
http://citymasterplan.nairobi.go.ke/index.php/downloads/doc_download/132-draft-final-
report-main1.
Jiménez-Aguilar, D. M. and Grusak, M. A. (2015): Evaluation of Minerals, Phytochemical
Compounds and Antioxidant Activity of Mexican, Central American, and African Green
Leafy Vegetables. Plant Foods for Human Nutrition, 70(4), 357–364.
http://doi.org/10.1007/s11130-015-0512-7.
Johnson, J. M. F., Wilhelm W. W., Karlen D. L., Archer D. W., Wienhold B., Lightle D. T. et
al. (2010): Nutrient removal as a function of corn stover cutting height and cob harvest.
BioEnergy Research, 3, 342–352.

147
Joy, E. J. M., Ander, E. L., Young, S. D., Black, C. R., Watts, M. J., Chilimba, A. D. C. and
Broadley, M. R. (2014): Dietary mineral supplies in Africa. Physiologia Plantarum,
151(3), 208–229. http://doi.org/10.1111/ppl.12144.
Joy, E. J. M., Broadley, M. R., Young, S. D., Black, C. R., Chilimba, A. D. C., Ander, E. L.
and Watts, M. J. (2015): Science of the Total Environment Soil type influences crop
mineral composition in Malawi. Science of the Total Environment, The, 505, 587–595.
http://doi.org/10.1016/j.scitotenv.2014.10.038.
Kabata-Pendias, A. and Pendias, H. (1989): Trace elements in the Soil and Plants. CRC Press,
Boca raton, FL.
Kamga, R. T., Kouamé, C., Atangana, A. R., Chagomoka, T. and Ndango, R. (2013):
Nutritional Evaluation of Five African Indigenous Vegetables. Journal of Horticultural
Research, 21(1), 99–106. http://doi.org/10.2478/johr-2013-0014.
Kananke, T., Wansapala, J. and Gunaratne, A. (2014): Heavy Metal Contamination in Green
Leafy Vegetables Collected from Selected Market Sites of Piliyandala Area, Colombo
District, Sri Lanka. American Journal of Food Science and Technology, 2(5), 139–144.
http://doi.org/10.12691/ajfst-2-5-1.
Kapungwe, E. M. (2013): Heavy Metal Contaminated Water, Soils and Crops in Peri Urban
Wastewater Irrigation Farming in Mufulira and Kafue Towns in Zambia. Journal of
Geography and Geology, 5(2), 55–72. http://doi.org/10.5539/jgg.v5n2p55.
Kawai, K., Saathoff, E., Antelman, G., Msamanga, G. and Fawzi, W. W. (2009): Geophagy
(Soil-eating) in Relation to Anemia and Helminth Infection among HIV – Infected
Pregnant Women in Tanzania, 80(1), 36–43.
Khai, N. M., Ha, P. Q. and Öborn, I. (2007): Nutrient flows in small-scale peri-urban
vegetable farming systems in Southeast Asia-A case study in Hanoi. Agriculture,
Ecosystems and Environment, 122(2), 192–202.
http://doi.org/10.1016/j.agee.2007.01.003.

148
Kiba, D. I., Zongo, N. A., Lompo, F., Jansa, J., Compaore, E., Sedogo, P. M. and Frossard, E.
(2012): The diversity of fertilization practices affects soil and crop quality in urban
vegetable sites of Burkina Faso. European Journal of Agronomy, 38(1), 12–21.
http://doi.org/10.1016/j.eja.2011.11.012.
Klug, B., Kirchner, T. W. and Horst, W. J. (2015). Differences in aluminium accumulation
and resistance between genotypes of the genus Fagopyrum. Agronomy, 5, 418–434.
http://dx.doi.org/10.3390/agronomy5030418.
KNBS. (2010): The 2009 Kenya Population and Housing Census - Population Distribution by
Age, Sex and Administrative Units, IC, 546. Retrieved from
http://www.knbs.or.ke/index.php?option=com_phocadownload&view=category&downloa
d=584:volume-1c-population-distribution-by-age-sex-and-administrative-
units&id=109:population-and-housing-census-2009&Itemid=599.
Kruger, J., Mongwaketse, T., Faber, M., van der Hoeven, M., and Smuts, C. M. (2015):
Potential contribution of African green leafy vegetables and maize porridge composite
meals to iron and zinc nutrition. Nutrition, 31(9), 1117–1123.
http://doi.org/10.1016/j.nut.2015.04.010.
Kruger, M., Sayed, N., Langenhoven, M. and Holing, F. (1998): Composition of South
African Foods: Vegetables and Fruit. Medical Research Council’s tables (MRC), 1988.
Kuchenbuch, R., Claassen, N. & Jungk, A. P (1986): Potassium availability in relation to soil
moisture. Plant Soil (1986) 95: 233. Https://doi.org/10.1007/BF02375075.
Kumssa, D. B., Joy, E. J. M., Ander, E. L., Watts, M. J., Young, S. D., Rosanoff, A., White,
P. J., Walker, S., and Broadley, M. R. (2015a): Global magnesium supply in the food
chain. Crop & Pasture Science, 66, 1278–1289 http://dx.doi.org/10.1071/CP15096.
Kumssa, D. B., Joy, E. J. M., Ander, E. L., Watts, M. J., Young, S. D., Walker, S. and
Broadley, M. R. (2015b): Dietary calcium and zinc deficiency risks are decreasing but
remain prevalent. Nature Publishing Group, 1–11. http://doi.org/10.1038/srep10974.
Lambers, H., Martinoia, E. and Renton, M. (2015): Plant adaptations to severely phosphorus-
impoverished soils. Current Opinion in Plant Biology, 25, 23–31.
http://doi.org/10.1016/j.pbi.2015.04.002.

149
Lambers, H., Shane, M. W., Cramer, M. D., Pearse, S. J. and Veneklaas, E. J. (2006): Root
structure and functioning for efficient acquisition of phosphorus: Matching morphological
and physiological traits. Annals of Botany, 98(4), 693–713.
http://doi.org/10.1093/aob/mcl114.
Lasat, M. M. (1997): The Use of Plants for the Removal of Toxic Metals from Contaminated
Soil. American Association for the Advancement of Science Environmental Science and
Engineering Fellow, 18, 359–362. http://doi.org/10.1080/09593331808616549.
Leon, J. and Schwang, K. U. (1992): Description and application of a screening method to
determine root morphology traits of cereals cultivars. Z. Acker. Pflanzenbau 169, 128–
134.
Li, H., Huang, G., Meng, Q., Ma, L. and Yuan, L. (2011): Integrated soil and plant
phosphorus management for crop and environment in China. A review, 1, 157–167.
http://doi.org/10.1007/s11104-011-0909-5.
Li, j., Xie, M. Z., Xu, M. J. and Sun, F. Y. (2006): Risk assessment for safety of soils and
vegetables around a lead/zinc mine. Volume 28, Issue 1–2, pp 37–44.
Liang, L. Z., Shen, R. F., Yi, X. Y., Zhao, X. Q., Chen, Z. C., Chen, R. F. and Dong, X. Y.
(2009): The phosphorus requirement of Amaranthus mangostanus L. exceeds the “change
point” of P loss. Soil Use and Management, 25(2), 152–158.
http://doi.org/10.1111/j.1475-2743.2009.00211.x.
Liao, M., Hocking, P. J., Dong, B., Delhaize, E., Richardson, A. E. and Ryan, P. R. (2008):
Genotypic variation in phosphorus efficiency among wheat genotypes grown on two
contrasting Australian soils. Aust J Agr Res 59:157–166.
Lim, S. S., Vos, T., Flaxman, A. D., Danaei, G., Shibuya, K., Adair-Rohani, H. and Ezzati,
M. (2012). A comparative risk assessment of burden of disease and injury attributable to
67 risk factors and risk factor clusters in 21 regions, 1990-2010: A systematic analysis for
the Global Burden of Disease Study. The Lancet, 380(9859), 2224–2260.
http://doi.org/10.1016/S0140-6736 (12) 61766-8.

150
Liu, J., You, L., Amini, M., Obersteiner, M., Herrero, M., Zehnder, A. J. B. and Yang, H.
(2010): A high-resolution assessment on global nitrogen flows in cropland. Proceedings of
the National Academy of Sciences, 107(17), 8035–8040.
http://doi.org/10.1073/pnas.0913658107.
Lu, H. J., Ye, Z. Q., Zhang, X. L., Lin, X. Y. and Ni, W. Z. (2011): Growth and yield
responses of crops and macronutrient balance influenced by commercial organic manure
used as a partial substitute for chemical fertilizers in an intensive vegetable cropping
system. Physics and Chemistry of the Earth, 36(9–11), 387–394.
http://doi.org/10.1016/j.pce.2010.03.030.
Lyu, Y., Tang, H., Li, H., Zhang, F., Rengel, Z., Whalley, W. R. and Shen, J. (2016): Major
Crop Species Show Differential Balance between Root Morphological and Physiological
Responses to Variable Phosphorus Supply. Frontiers in Plant Science, 7 (December), 1–
15. http://doi.org/10.3389/fpls.2016.01939.
Ma, Z., Bielenberg, D. G., Brown, K. M. and Lynch, J. P. (2001): Regulation of root hair
density by phosphorus availability in Arabidopsis thaliana. Plant, Cell and Environment,
24(4), 459–467. http://doi.org/10.1046/j.1365-3040.2001.00695.x.
MacDonald, G. K., Bennett, E. M., Potter, P. A. and Ramankutty, N. (2011): Agronomic
phosphorus imbalances across the world’s croplands. Proceedings of the National
Academy of Sciences, 108(7), 3086–3091. http://doi.org/10.1073/pnas.1010808108.
Mahan, L.K. and Escott-Stump, S. (2000). Krause’s Food Nutrition and Diet Therapy (10th
ed.). Philadelphia, Pa.: W.B. Saunders Company.
Majumdar, K., Sanyal, S. K., Kumar Dutta, S. K., Satyanarayana, T. and Singh, V. K. (2016):
Nutrient Mining: Addressing the Challenges to Soil Resources and Food Security, 1–490.
http://doi.org/10.1007/978-81-322-2716-8.
Makokha, A. O. and Ombwara F. (2005): Potential for increased use of indigenous Kenyan
Vegetables as functional foods. In: In: Proceedings of the third Horticulture Workshop on
Sustainable Horticultural Production in the Tropics, 26th -29th November 2003. Maseno
University MSU, Maseno, Kenya. ISBN: 9966-758-11-9. pp 102-116.

151
Manara, A. (2012): Plants and Heavy Metals. Signal Transduction, 27–54.
http://doi.org/10.1007/978-94-007-4441-7.
Manske, G. G. B., Ortiz-Monasterio, J. I., Van Ginkel, M., Gonzalez, R. M., Rajaram, S.,
Molina, E and Vlek P. L. G. (2000): Traits associated with improved P-uptake efficiency
in CIMMYT’s semi dwarf spring bread wheat grown on acid Andisols in Mexico. Plant
Soil 221:189–204.
Marschner, H. (1993): Zinc uptake from soils. In: Robson AD (ed) Zinc in Soils and Plants.
Kluwer, Dordrecht, the Netherlands, pp 59–77.
Marschner P. (2012). Marschner’s Mineral nutrition of higher plants, 3rd edition Academic
Press., London, UK:
Marschner, H. (1995): Marschner’s Mineral nutrition of higher plants. 2nd edition Academic
Press., London, UK.
Matti P. (1995): Image manipulation Program Features.
https://www.gimp.org/about/prehistory.html
McGrath, S.P., Chang, A.C., Page, A.L. and Wilter, E. (1994): Land application of sewage
sludge: scientific perspectives of heavy metal loading limits in Europe and the United
States. Environ. Rev. 2, 108–118.
McLaughlin, M. J., Parker, D. R. and Clarke, J. M. (1999): Metals and micronutrients - Food
safety issues. Field Crops Research, 60(1–2), 143–163. http://doi.org/10.1016/S0378-4290
(98)00137-3.
McLaughlin, M.J. and Singh, B.R. (2000): Cadmium in soil and plants: a global perspective.
Dordrecht, The Netherlands: Kluwer Academic Publish 13-21.
Micheni, A. N., Kanampiu, F. K. and Rodriguez, D. (2011): Characterization of Soil Nutrient
Levels in Smallholder Farms in Eastern Kenya. 5th WCCA & 3rd FSD, 4–6.
Miller, C. R., Ochoa, I., Nielsen, K. L., Beck, D. and Lynch, J. P. (2003): Genetic variation
for adventitious rooting in response to low phosphorus availability: potential utility for
phosphorus acquisition from stratified soils. Functional Plant Biology 30: 973–985.

152
Mithen, R., Bennett, R. and Marquez, J. (2010): Phytochemistry Glucosinolate biochemical
diversity and innovation in the Brassicales. Phytochemistry, 71(17–18), 2074–2086.
http://doi.org/10.1016/j.phytochem.2010.09.017.
Mohamed, M. A., Siddig, E. E., Elaagip, A. H., Edris, A. M. and Nasr, A. A. (2016): Parasitic
contamination of fresh vegetables sold at central markets in Khartoum state, Sudan. 15:17.
doi: 10.1186/s12941-016-0133-5.
Muchuweti, M., Birkett, J. W., Chinyanga, E., Zvauya, R., Scrimshaw, M. D. and Lester, J. N.
(2006): Heavy metal content of vegetables irrigated with mixtures of wastewater and
sewage sludge in Zimbabwe: Implications for human health. Agriculture, Ecosystems and
Environment, 112(1), 41–48. http://doi.org/10.1016/j.agee.2005.04.028.
Muhanji, G., Roothaert, R. L., Webo, C. and Stanley, M. (2011): African indigenous
vegetable enterprises and market access for small-scale farmers in East Africa.
International Journal of Agricultural Sustainability, 9(November), 194–202.
http://doi.org/10.3763/ijas.2010.0561.
Mutune, N., Makobe, M. and Abukutsa-Onyango, M. O. O. (2013): Impact analysis of lead,
copper and zinc content in selected African indigenous and exotic vegetables from
Nairobi markets, Kenya. African Journal of Environmental Science and Technology, 7(6),
540–545. http://doi.org/10.5897/AJEST2013.1511.
Nabulo, G., Black, C. R. and Young, S. D. (2011): Trace metal uptake by tropical vegetables
grown on soil amended with urban sewage sludge. Environmental Pollution, 159(2), 368–
376. http://doi.org/10.1016/j.envpol.2010.11.007.
Nabulo, G., Origa, H. O., Nasinyama, G. W. and Cole, D. (2008): Assessment of Zn, Cu, Pb
and Ni contamination in wetland soils and plants in the Lake Victoria basin. Int J.
Environ. Sci. Tech, 5(1), 65–74. http://doi.org/10.1007/BF03325998.
Neeteson, J. J., Langeveld, J. W. A., Smit, A. L. and de Haan, J. J. (2003): Nutrient balances
in field vegetable production systems. Toward Ecologically Sound Fertilization Strategies
for Field Vegetable Production, (627), 13–23.
Neeteson, J. and Carton, O. (2001): The environmental impact of nitrogen in field vegetable
production. Acta Horticulturae, 563(1), 21–28.

153
Neumann, G. and Martinoia, E. (2002): Cluster roots – an underground adaptation for
survival in extreme environments. Trends in Plant Science, 7: 162–167.
Newman, A. L. and Reynolds, M. C. (2005): Bacteria and phytoremediation: new uses for
endophytic bacteria in plants, VoL. 23, Issue 1; 6-8.
Ngugi, I., Gitau, R. and Nyoro, J. (2007). Access to high value markets by smallholder
farmers of African Indigenous vegetables. Tegemeo Institute of Agricultural Policy and
Development, Egerton University.
Niu, Y. F., Chai, R. S., Jin, G. L., Wang, H., Tang, C. X. and Zhang, Y. S. (2013): Responses
of root architecture development to low phosphorus availability: A review. Annals of
Botany, 112(2), 391–408. http://doi.org/10.1093/aob/mcs285.
Nriagu, J. O. (1979): Global inventory of natural and anthropogenic emissions of trace metals
to the atmosphere. Nature 279: 1247-1294.
Nyenje, P. M., Foppen, J. W., Uhlenbrook, S., Kulabako, R. and Muwanga, A. (2010):
Eutrophication and nutrient release in urban areas of sub-Saharan Africa - A review.
Science of the Total Environment, 408(3), 447–455.
http://doi.org/10.1016/j.scitotenv.2009.10.020.
Odhav, B., Beekrum, S., Akula, U. and Baijnath, H. (2007): Preliminary assessment of
nutritional value of traditional leafy vegetables in KwaZulu-Natal, South Africa. Journal
of Food Composition and Analysis, 20(5), 430–435.
http://doi.org/10.1016/j.jfca.2006.04.015.
Oenema, O., Kros, H. and De Vries, W. (2003): Approaches and uncertainties in nutrient
budgets: Implications for nutrient management and environmental policies. European
Journal of Agronomy, 20(1–2), 3–16. http://doi.org/10.1016/S1161-0301 (03)00067-4.
Okoronkwo, N. E., Igwe, J. C. and Onwuchekwa, E. C. (2005): Risk and health implications
of polluted soils for crop production. African Journal of Biotechnology, 4(13), 1521–
1524.

154
Oladeji, O. O., Kolawole, G. O., Adeoye, G. O. and Tian, G. (2006): Effects of plant residue
quality, application rate, and placement method on phosphorus availability from Sokoto
rock phosphate. Nutrient Cycling in Agroecosystems, 76(1), 1–10.
http://doi.org/10.1007/s10705-006-9021-2.
Omondi, E. O., Engels, C., Nambafu, G., Schreiner, M., Neugart, S., Abukutsa-onyango, M.
and Winkelmann, T. (2017): Nutritional compound analysis and morphological
characterization of spider plant (Cleome gynandra) - an African indigenous leafy
vegetable. Food Research International, 100(April), 284–295.
http://doi.org/10.1016/j.foodres.2017.06.050.
Omotayo, O. E. and Chukwuka, K. S. (2009): Soil fertility restoration techniques in sub-
Saharan Africa using organic resources. African Journal of Agricultural Research, 4(3),
144–150.
Oniang ’o, R., Grum, M. and Obel-Lawson E. (2005): Developing African leafy vegetables
for improved nutrition. African Journal of Food, Agriculture, Nutrition and Development
(Vol. 7).
Onyuka, E., Nambafu, G., Holst, S., Bessler, H., Andika, D., Gweyi-Onyango, P. J., Mwonga,
S. and Engels, C. (nd). Challenges for Soil fertility on AIV farms in Kenya:
Socioeconomic and /or natural factors.
Othman, O. C. (2001): Heavy metals in green vegetables and soils from vegetable gardens in
Dar es Salaam, Tanzania. Tanzania Journal of Science.
http://doi.org/10.4314/tjs.v27i1.18334.
Palm, C. A., Gachengo, C. N., Delve, R. J., Cadisch, G. and Giller, K. E. (2001): Organic
inputs for soil fertility management in tropical agro ecosystems: Application of an organic
resource database. Agriculture, Ecosystems and Environment, 83, 27–42.
Pant, B. D., Burgos, A., Pant, P., Cuadros-Inostroza, A., Willmitzer, L. and Scheible, W. R.
(2015): The transcription factor PHR1 regulates lipid remodeling and triacylglycerol
accumulation in Arabidopsis thaliana during phosphorus starvation. Journal of
Experimental Botany, 66(7), 1907–1918. http://doi.org/10.1093/jxb/eru535.

155
Pearse, S. J. (2011): Why does the musketeer approach to phosphorus acquisition from
sparingly soluble forms fail: All for one, but not one for all? Plant and Soil, 348(1–2), 81–
83. http://doi.org/10.1007/s11104-011-0975-8.
Pearse, S. J., Veneklaas, E. J., Cawthray, G., Bolland, M. D. A. and Lambers, H. (2006):
Triticum aestivum shows a greater biomass response to a supply of aluminium phosphate
than Lupinus albus, despite releasing fewer carboxylates into the rhizosphere. New
Phytologist, 169(3), 515–524. http://doi.org/10.1111/j.1469-8137.2005.01614.x.
Pearse, S. J., Veneklaas, E. J., Cawthray, G., Bolland, M. D. A. and Lambers, H. (2007):
Carboxylate composition of root exudates does not relate consistently to a crop species’
ability to use phosphorus from aluminium, iron or calcium phosphate sources. New
Phytologist, 173(1), 181–190. http://doi.org/10.1111/j.1469-8137.2006.01897.x.
Péret, B., Clément, M., Nussaume, L. and Desnos, T. (2011): Root developmental adaptation
to phosphate starvation: Better safe than sorry. Trends in Plant Science, 16(8), 442–450.
http://doi.org/10.1016/j.tplants.2011.05.006.
Perveen, S., Ihsanullah, I., Shah, Z., Nazif, W., Shah, S. S. and Shah, H. (2011): Study on
accumulation of heavy metals in vegetables receiving sewage water. Journal of the
Chemical Society of Pakistan, 33, 21-28.
Piggott J. J., Lange K., Townsend R. C. and Mathaei D. C. (2012): Multiple Stressors in
Agricultural Streams: A Mesocosm Study of Interactions among Raised Water
Temperature, Sediment Addition and Nutrient Enrichment.
https://doi.org/10.1371/journal.pone.0049873.
Plaxton, W. C. and Tran, H. T. (2011): Metabolic Adaptations of Phosphate-Starved Plants.
Plant Physiology, 156(3), 1006–1015. http://doi.org/10.1104/pp.111.175281.
Predotova, M., Bischoff, W. A. and Buerkert, A. (2011): Mineral-nitrogen and phosphorus
leaching from vegetable gardens in Niamey, Niger. Journal of Plant Nutrition and Soil
Science, 174(1), 47–55. http://doi.org/10.1002/jpln.200900255.
Raboy V. (2001): Seeds for a better future: ‘low phytate’ grains help to overcome
malnutrition and reduce pollution. Volume 6, issue 10, p458-462,
DOI: http://dx.doi.org/10.1016/S1360-1385(01)02104-5.

156
Radwan, M. A. and Salama, A. K. (2006): Market basket survey for some heavy metals in
Egyptian fruits and vegetables. Food and Chemical Toxicology, 44(8), 1273–1278.
http://doi.org/10.1016/j.fct.2006.02.004.
Raghothama, K. G. (1999): Phosphate acquisition. Annual Review of Plant Physiology 50,
665–693.
Ramaekers, L., Remans, R., Rao, I. M. and Blair, M. W. (2010): Strategies for improving
phosphorus acquisition efficiency of crop plants, 1–26.
Rangnekar, S. S., Sahu, S. K., Pandit, G. G. and Gaikwad V.B. (2013: Study of Uptake of Pb
and Cd by Three Nutritionally Important Indian Vegetables Grown in Artificially
Contaminated Soils of Mumbai, India. Int. Res. J. Environment Sci., Vol. 2(9), 53-59.
Reddy, D. D., Rao, A. S. and Singh M. (2005): Changes in P fractions and sorption in an
Alfisol following crop residues application. J. Plant Nutr. Soil Sci. (168), 241 – 247.
DOI:10.1002/jpln.200421444.
Richardson, A. E., Lynch, J. P., Ryan, P. R., Delhaize, E., Smith, F. A., Smith, S. E. and
Simpson, R. J. (2011): Plant and microbial strategies to improve the phosphorus
efficiency of agriculture. Plant and Soil, 349(1–2), 121–156.
http://doi.org/10.1007/s11104-011-0950-4.
Rieuwerts, J. S., Thornton, I., Farago, M. E., Ashmore, M. R., (1998): Factors influencing
metal bioavailability in soils: preliminary investigations for the development of a critical
load approach for metals. Chemical Speciation and Bioavailability 10, 61-75.
Rose, T. J., Hardiputra, B. and Rengel, Z. (2010): Wheat, canola and grain legume access to
soil phosphorus fractions differs in soils with contrasting phosphorus dynamics. Plant and
Soil, 326(1), 159–170. http://doi.org/10.1007/s11104-009-9990-4.
Rose, T. J., Liu, L. and Wissuwa, M. (2013): Improving phosphorus efficiency in cereal
crops: Is breeding for reduced grain phosphorus concentration part of the solution?
Frontiers in Plant Science, 4(November), 444. http://doi.org/10.3389/fpls.2013.00444.

157
Rose, T. J., Mori, A., Julia, C. C. and Wissuwa, M. (2016): Screening for internal phosphorus
utilisation efficiency: comparison of genotypes at equal shoot P content is critical. Plant
and Soil, 401(1–2), 79–91. http://doi.org/10.1007/s11104-015-2565-7.
Rose, T. J., Rose, M. T., Pariasca-Tanaka, J., Heuer, S. and Wissuwa, M. (2011): The
Frustration with Utilization: Why Have Improvements in Internal Phosphorus Utilization
Efficiency in Crops Remained so Elusive? Frontiers in Plant Science, 2(November), 1–5.
http://doi.org/10.3389/fpls.2011.00073.
Rouached, H., Arpat, A. B. and Poirier, Y. (2010): Regulation of phosphate starvation
responses in plants: Signaling players and cross-talks. Molecular Plant, 3(2), 288–299.
http://doi.org/10.1093/mp/ssp120.
RSA (2015): Report of a Market Study on Fresh Vegetables Market in Kenya Consumer’s
Survey By Research Solutions Africa (RSA) Ltd, 1–37.
Ruel, M. T., Minot, N. and Smith, L. (2005): Patterns and determinants of fruit and vegetable
consumption in sub-saharan Africa: a multicountry comparison. Joint FAO/WHO
Workshop on Fruit and Vegetables for Health, 45.
Safi, Z., Predotova, M., Schlecht, E. and Buerkert, A. (2011): Horizontal matter fluxes and
leaching losses in urban and peri-urban agriculture of Kabul, Afghanistan. Journal of Plant
Nutrition and Soil Science, 174(6), 942–951. http://doi.org/10.1002/jpln.201000385.
Sanchez, P. A., Shepherd, K. D., Soule, M. J., Place, F. M., Mokwunye, A. U., Buresch, R. J.,
Kwesiga, F. R., Izac, A-M. N., Ndiritu, C. G. and Woomer, P. L. (1997): Soil fertility
replenishment in Africa: An investment in natural resource capital. pp 1-46. In (R.J.
Buresch, P.A. Sanchez and F. Calhoon, Eds.) Replenishing Soil Fertility in Africa. Soil
Science Society of America Special Publication No. 51. Madison, Wisconsin.
Sardar K., Ali S., Hameed S., Afzal S., Fatima S., Shakoor M. B., Bharwana S. A. and
Tauqeer H. M. (2013): Heavy Metals Contamination and what are the Impacts on Living
Organisms. Greener Journal of Environmental Management and Public Safety. ISSN:
2354-2276 Vol. 2 (4), pp. 172-179.
Sattar, M. U., Khan, M. A., Khalil, A. A. and Amir, R. M. (2013): Mitigation of Heavy
Metals in Vegetables through Washing with House Hold Chemicals, 3(5), 1–12.

158
Schachtman, D. P., Reid, R. J. and Ayling, S. M. (1998): Update on Phosphorus Uptake by
Plants: From Soil to Cell, 447–453. http://doi.org/10.1104/pp.116.2.447.
Schnug, E. and Haneklaus, H. S. (2016): The Enigma of Fertilizer Phosphorus Utilization, 1–
926. http://doi.org/10.1007/978-94-017-7612-7.
Schönfeldt, H. C. and Pretorius, B. (2011): The nutrient content of five traditional South
African dark green leafy vegetables-A preliminary study. Journal of Food Composition
and Analysis, 24(8), 1141–1146. http://doi.org/10.1016/j.jfca.2011.04.004.
Sekara, A., Poniedziaek, M., Ciura, J. and Jedrszczyk, E. (2005): Zinc and copper
accumulation and distribution in the tissues of nine crops: Implications for
phytoremediation. Polish Journal of Environmental Studies, 14(6), 829–835.
Shackleton, C. M., Pasquini, M. W. and Drescher, A. W. (2009): African indigenous
vegetables in urban agriculture. Earthscan. London, England.
Sharma, R. K, Agrawal, M. and Marshall, F. (2007): Heavy metal contamination of soil and
vegetables in suburban areas of Varanasi, India. Ecotoxicology and Environmental Safety,
66(2), 258–266. http://doi.org/10.1016/j.ecoenv.2005.11.007.
Sharma, R. K., Agrawal, M. and Marshall, F. M. (2008a): Atmospheric deposition of heavy
metals (Cu, Zn, Cd and Pb) in Varanasi City, India. Environmental Monitoring and
Assessment, 142(1–3), 269–278. http://doi.org/10.1007/s10661-007-9924-7.
Sharma, R. K., Agrawal, M. and Marshall, F. M. (2008b): Heavy metal (Cu, Zn, Cd and Pb)
contamination of vegetables in urban India: A case study in Varanasi. Environmental
Pollution, 154(2), 254–263. http://doi.org/10.1016/j.envpol.2007.10.010.
Sharma, R. K., Agrawal, M. and Marshall, F. M. (2009): Heavy metals in vegetables collected
from production and market sites of a tropical urban area of India. Food and Chemical
Toxicology, 47(3), 583–591. http://doi.org/10.1016/j.fct.2008.12.016.
Shen, J., Lixing, Y., Junling, Zhang. Haigang, L., Zhaohai, B., Xinping, Chen. Weifeng, Z.
and Fusuo, Z. (2011): Phosphorus Dynamics: From Soil to Plant. Plant Physiology,
156(3), 997–1005. http://doi.org/10.1104/pp.111.175232.

159
Shiundu, K. M. and Oniang’o, R. (2007): Marketing African leafy vegetables, challenges and
opportunities in the Kenyan context. African Journal of Food Agriculture Nutrition and
Development, 17: 4-12.
Shujie, M. and Yunfa, Q. (2011): Effects of phosphorus concentration on adaptive
mechanisms of high-and low-P efficiency soybean genotypes when grown in solution.
Plant, Soil and Environment-UZEI, 57(1998), 61–66.
Siegfried, K., Dietz, H., Schlecht, E. and Buerkert, A. (2011): Nutrient and carbon balances in
organic vegetable production on an irrigated, sandy soil in northern Oman. Journal of
Plant Nutrition and Soil Science, 174(4), 678–689. http://doi.org/10.1002/jpln.201000318.
Simpson, R. J., Oberson, A., Culvenor, R. A., Ryan, M. H., Veneklaas, E. J., Lambers, H.and
Richardson, A. E. (2011): Strategies and agronomic interventions to improve the
phosphorus-use efficiency of farming systems. Plant and Soil (Vol. 349).
http://doi.org/10.1007/s11104-011-0880-1.
Singh, M. (2004): An evaluation of heavy metals concentration in vegetables grown in the
vicinity of industrial area. Journal of Agroalimentary Processes and Technology, 17(1),
36-41.
Smaling, E. M. A., Stoorvogel, J. J. and Windmeijer, P. N. (1993): Calculating soil nutrient
balances in Africa at different scales - II. District scale. Fertilizer Research, 35(3), 237–
250. http://doi.org/10.1007/BF00750642.
Smaling, E. M. A., Fresco, L. O. and De Jager, A. (1996): Classifying and monitoring soil
nutrient stocks and flows in African agriculture. Ambio 25, 492–496.
Smaling, E. M. A., Nandwa, S. M. and Janssen, B. H. (1997): Soil fertility in Africa is at
stake. In (R.J. Buresh et al., Eds) Replenishing soil fertility in Africa. SSSA Special
Publication 51. Soil Science Society of America, Madison, USA. pp. 47-61.
Smith, I. F. and Eyzaguirre, P. (2007): African leafy vegetables: Their role in the World
Health Organization’s Global Fruit and Vegetable Initiative. African Journal of Food
Agriculture Nutrition and Development 7(3), 1–17.

160
Smolders, E. (2001): Cadmium uptake by plants. International Journal of Occupational
Medicine and Environmental Health, 14(2), 177–183.
Soetan, K. O., Olaiya, C. O. and Oyewole, O. E. (2010): The importance of mineral elements
for humans, domestic animals and plants : A review. African Journal of Food Science,
4(May), 200–222. http://doi.org/10.1186/s12302-017-0116-y.
Stein, A. J. (2010): Global impacts of human mineral malnutrition. Plant and Soil, 335(1),
133–154. http://doi.org/10.1007/s11104-009-0228-2.
Stoorvogel, J. J., Smaling E. M. A. and Janssen B. H. (1993): Calculating soil nutrient bal-
ances in Africa at different scales. Fertilizer Research. No. 35: 227-335.
Stoorvogel, J. J. and Smaling, E. M. A. (1990): Assessment of soil nutrient depletion in sub-
Saharan Africa: 1983-2000. Report 28. Wageningen, The Netherlands, Winand Staring
Centre.
Stylianou, M. (2007): Effect of acid treatment on the removal of heavy metals from sewage
sludge. Desalination, 248(November 2006), 123–130.
http://doi.org/10.1016/j.desal.0000.00.000.
Swaminathan, M.S. (2003): Biodiversity: an effective safety net against environmental
pollution. Environmental Pollution 126, 287–291.
Szabela, A. D., Markiewicz J. and Wolf M. W. (2015): Heavy Metal Uptake by Herbs. IV.
Influence of Soil pH on the Content of Heavy Metals in Valeriana officinalis L. Water Air
Soil Pollut. 2015; 226(4): 106. doi: 10.1007/s11270-015-2360-3.
Taiwo, I. E., Henry, A. N. and Imbufe, A. P. (2014): Heavy metal bioaccumulation and
biomarkers of oxidative stress in the wild African tiger frog, Hoplobatrachus occipitalis.
African Journal of Environmental Science and Technology, 8(January), 6–15.
http://doi.org/10.5897/AJEST2013.
Tangahu, B. V., Sheikh Abdullah, S. R., Basri, H., Idris, M., Anuar, N. and Mukhlisin, M.
(2011): A review on heavy metals (As, Pb, and Hg) uptake by plants through
phytoremediation. International Journal of Chemical Engineering, 2011.
http://doi.org/10.1155/2011/939161.

161
Tchounwou, P. B., Yedjou, C. G., Patlolla, A. K. and Sutton, J. D. (2012): Heavy Metals
Toxicity and the Environment. 101: 133–164. doi:10.1007/978-3-7643-8340-4_6.
Tittonell, P., Vanlauwe, B., Corbeels, M. and Giller, K. E. (2008): Yield gaps, nutrient use
efficiencies and response to fertilisers by maize across heterogeneous smallholder farms
of western Kenya. Plant and Soil, 313(1–2), 19–37. http://doi.org/10.1007/s11104-008-
9676-3.
UN (2014). World Urbanization Prospects. The 2014 Revision. ISBN 978-92-1-151517-6.
Uraguchi, S., Mori, S., Kuramata, M., Kawasaki, A., Arao, T. and Ishikawa, S. (2009): Root-
to-shoot Cd translocation via the xylem is the major process determining shoot and grain
cadmium accumulation in rice. Journal of Experimental Botany, 60(9), 2677–2688.
http://doi.org/10.1093/jxb/erp119.
Uusiku, N. P., Oelofse, A., Duodu, K. G., Bester, M. J. and Faber, M. (2010): Nutritional
value of leafy vegetables of sub-Saharan Africa and their potential contribution to human
health: A review. Journal of Food Composition and Analysis, 23(6), 499–509.
http://doi.org/10.1016/j.jfca.2010.05.002.
Van den Bosch, H., De Jager, A. and Vlaming, J. (1998): Monitoring nutrient flows and
economic performance in African farming systems (NUTMON).
Van der Hoeven, M., Faber, M., Osei, J., Kruger, A. and Smuts, C. M. (2016): Effect of
African leafy vegetables on the micronutrient status of mildly deficient farm-school
children in South Africa: a randomized controlled study. Public Health Nutrition, 19(5),
935–945. http://doi.org/10.1017/S1368980015002037.
Van Jaarsveld, P., Faber, M., van Heerden, I., Wenhold, F., Jansen van Rensburg, W. and Van
Averbeke, W. (2014): Nutrient content of eight African leafy vegetables and their
potential contribution to dietary reference intakes. Journal of Food Composition and
Analysis, 33(1), 77–84. http://doi.org/10.1016/j.jfca.2013.11.003.
Vance, C., Uhde-Stone, C. and Allan, D. (2003): Phosphorus aquisition and use: critical
adaptations by plants for securing a nonrewable resource. New Phytologist, 157, 423–447.
http://doi.org/10.1046/j.1469-8137.2003.00695.x.

162
Vanlauwe, B., Descheemaeker, K., Giller, K. E., Huising, J., Merckx, R., Nziguheba, G. and
Zingore, S. (2015): Integrated soil fertility management in sub-Saharan Africa:
unravelling local adaptation. Soil, 1(1), 491–508. http://doi.org/10.5194/soil-1-491-2015.
Vanlauwe, B., Wendt, J., Giller, K. E., Corbeels, M., Gerard, B. and Nolte, C. (2014): A
fourth principle is required to define Conservation Agriculture in sub-Saharan Africa: The
appropriate use of fertilizer to enhance crop productivity. Field Crops Research, 155, 10–
13. http://doi.org/10.1016/j.fcr.2013.10.002.
Vejchasarn, P., Lynch, J. P. and Brown, K. M. (2016): Genetic Variability in Phosphorus
Responses of Rice Root Phenotypes. Rice, 9(1), 29. http://doi.org/10.1186/s12284-016-
0102-9.
Veneklaas, E. J., Lambers, H., Bragg, J., Finnegan, P. M., Lovelock, C. E., Plaxton, W. C.,
Price, C. A., Scheible, W. R., Shane, M. W., White, P. J. and Raven, J. A. (2012):
Opportunities for improving phosphorus- use efficiency in crop plants. New Phytol
195:306–320.
Waddell, H. A., Simpson, R. J., Ryan, M. H., Lambers, H., Garden, D. L. and Richardson, A.
E. (2017): Root morphology and its contribution to a large root system for phosphorus
uptake by Rytidosperma species (wallaby grass). Plant and Soil, 412(1–2), 7–19.
http://doi.org/10.1007/s11104-016-2933-y.
Wang, X., Shen, J. and Liao, H. (2010): Acquisition or utilization, which is more critical for
enhancing phosphorus efficiency in modern crops? Plant Science, 179(4), 302–306.
http://doi.org/10.1016/j.plantsci.2010.06.007.
Wang, Y., Zhang, H., Tang, J., Xu, J., Kou, T. and Huang, H. (2015). Accelerated phosphorus
accumulation and acidification of soils under plastic greenhouse condition in four
representative organic vegetable cultivation sites. Scientia Horticulturae, 195(M), 67–73.
http://doi.org/10.1016/j.scienta.2015.08.041.
Wehmeyer, A. S. (1986): Edible Wild Plants of South- ern Africa: Data on the Nutrient
Contents of over 300 Species. CSIR, Pretoria.
163
Weinberger K. and Msuya J. (2004): Indigenous Vegetables in Tanzania- Significance and
Prospects. Shanhua, Taiwan: AVRDC-The World Vegetable Center, Technical Bulletin
No. 31, AVRDC Publication 04-600, 70 p.
Weldegebriel, Y., Chandravanshi, B. S. and Wondimu, T. (2012): Concentration levels of
metals in vegetables grown in soils irrigated with river water in Addis Ababa, Ethiopia.
Ecotoxicology and Environmental Safety, 77, 57–63.
http://doi.org/10.1016/j.ecoenv.2011.10.011.
White J. P (2012): Heavy metal toxicity in plants. Scottish Crop Research Institute,
Invergowrie, UK, 210 – 237.
WHO/FAO (2006). Guidelines on food fortification with micronutrients. Unscn.Org, 341.
http://doi.org/10.1242/jeb.02490.
WHO (1995): Environmental Health Criteria, vol. 165. Inorganic lead. International
Programme on Chemical Safety, Geneva.
WHO (2007): Health risks of heavy metals from long-range transboundary air poluution.
Joint WHO L Convention Task Force on Health Aspects of Air Pollution, 2–144.
http://doi.org/10.1002/em.
WHO (2010): Exposure to lead: A major public health concern
Williamson, L. C., Ribrioux, S., Fitter, A. H. and Leyser, H. M. O. (2001): Phosphate
availability regulates root system architecture in Arabidopsis. Plant Physiology, 126(2),
875–882. http://doi.org/10.1104/pp.126.2.875.
Wong, C. S. C., Li, X. D., Zhang, G., Qi, S. H. and Peng, X. Z. (2003): Atmospheric
depositions of heavy metals in the Pearl River Delta, China. Atmospheric Environment
37, 767–776.
World Bank (1998): Soil Fertility Manangement in Sub − Saharan Africa, 58.
Wuana, R. A. and Okieimen, F. E. (2011): Heavy Metals in Contaminated Soils: A Review of
Sources, Chemistry, Risks and Best Available Strategies for Remediation. ISRN Ecology,
2011, 1–20. http://doi.org/10.5402/2011/402647.

164
Yahaya, Y., Bagudo, B. U. and Noma, S. S. (2011): Seasonal variation in nutrient content of
some selected vegetables from Wamakko, Sokoto State, Nigeria, 2(April), 117–125.
Yevich, R. and Logan, A. J. (2003): An assessment of biofuel use and burning of agricultural
waste in the developing world, Global Biogeochem. Cycles, 17(4), 1095, doi:
10.1029/2002GB001952, 2003.
Zhu, Y. and Smith, S. E. (2001): Seed phosphorus (P) content affects growth, and P uptake of
wheat plants and their association with arbuscular mycorrhizal (AM) fungi, 105–112.
Ziblim, A. I., Khan A. T. and Akaffo P. (2012): Effects of Season on the Mineral (Potassium,
Calcium, Phosphorus, Magnesium) Levels of Pennisetum Pedicellatum in Northern
Ghana. Greener Journal of Agricultural Sciences ISSN: 2276-7770 Vol. 2 (7), pp. 329-
333.
Zingore, S., Murwira, H. K., Delve, R. J. and Giller, K. E. (2007). Influence of nutrient
management strategies on variability of soil fertility, crop yields and nutrient balances on
smallholder farms in Zimbabwe. Agriculture, Ecosystems and Environment, 119(1–2),
112–126. http://doi.org/10.1016/j.agee.2006.06.019.

165
Declaration
I hereby declare that I completed the doctoral thesis independently based on the stated
resources and aids. I have not applied for a doctoral degree elsewhere and do not have a
corresponding doctoral degree. I have not submitted the doctoral thesis, or parts of it, to
another academic institution and the thesis has not been accepted or rejected. I declare that I
have acknowledged the Doctoral Degree Regulations, which underlie the procedure of the
Faculty of Life Sciences of Humboldt-Universität zu Berlin, as amended on 5th March 2015.
Furthermore, I declare that no collaboration with commercial doctoral degree supervisors took
place, and that the principles of Humboldt-Universität zu Berlin for ensuring good academic
practice were abided by.
Berlin, August, 2018.