Plant Analysis for Vegetable Crops - Soil Wealth
31
This project has been funded by Hort Innovation using the vegetable research and development levy and contributions from the Australian Government. Hort Innovation is the grower-owned, not-for-profit research and development corporation for Australian horticulture. Plant Analysis for Vegetable Crops A Practical Guide to Sampling, Analysis and Interpretation Doris Blaesing, RMCG Version 2 February 2020
-
Upload
khangminh22 -
Category
Documents
-
view
2 -
download
0
Transcript of Plant Analysis for Vegetable Crops - Soil Wealth
This project has been funded by Hort Innovation using the vegetable research and development levy and contributions from the Australian Government. Hort Innovation is the grower-owned, not-for-profit research and development corporation for Australian horticulture.
Plant Analysis for Vegetable CropsA Practical Guide to Sampling, Analysis and Interpretation
Doris Blaesing, RMCG
Version 2 February 2020

Plant Analysis Guide
2
Table of Contents
Why use plant analysis for vegetables?.................................................................................... 3Purpose of this document 3Types of plant analysis 4
Plant Analysis Overview ........................................................................................................... 4Which analysis to choose 5
Sampling Strategies ................................................................................................................ 6General sampling methods 6Sampling for dry matter analysis 10Sampling for sap analysis 11
Typical nutrient ranges in plants ............................................................................................. 13Using desirable nutrient ranges 13Typical nutrient concentrations in crops 13Establishing desirable nutrient ranges 14
Interpretation of results .......................................................................................................... 16Dry matter data 16Sap analysis data 17
Comparison between dry matter and sap analyses for nutrient management decisions ......... 20Getting results on a dry matter basis (%) or sap mg/L (ppm), does it matter? 20References and desirable ranges 21
References and Additional Information .................................................................................. 22
Acknowledgements ............................................................................................................... 22
Appendix 1 Elemental composition of plants ....................................................................... 23
Appendix 2 Nutrient functions & interactions ....................................................................... 24Nutrient functions 24Nutrient fixing 24
Appendix 3 Nutrient deficiency and toxicity symptoms ........................................................ 25
Appendix 4 Nutrient uptake over time .................................................................................. 28
Appendix 5 Sample information ........................................................................................... 29
Plant Analysis Guide
3
The main purpose of a plant analysis is to gain information of the nutritional status of a crop. Plant analysis allows you to:
1. Monitor a crop’s nutrient status and diagnose nutrition problems likely to affect production, i.e.:
• Identify deficiencies or imbalances early and before nutrient levels are low enough to cause symptoms and reduce potential yield or quality
• Diagnose visual deficiency or toxicity symptoms correctly to at least reduce the damage caused by the deficiency, and to select the correct management intervention
2. Assess nutrient availability of the soil, substrate or nutrient solution (i.e. nutrients may be in the rootzone but not be available to the plant, e.g. due to nutrient fixing, ion competition, disease or growing conditions [temperature, dry or wet conditions, humidity, management inputs])
3. Provide a basis for adjusting a nutrient management program and fertiliser recommendations
4. Monitor the outcome of fertiliser applications
5. Predict whether nutrient deficiencies are likely to occur in the current or even succeeding crops
6. Estimate the removal of key nutrients by a crop with a view to replacing them and maintaining soil fertility.
The mineral nutrition of crops has a major impact on yield and quality. It also plays a vital role in the food value of vegetables. Crops take up most of their mineral
nutrients from the soil via roots and associated symbiotic organisms such as mycorrhizal fungi.
The best way of knowing whether a crop is taking up the right combination and amount of nutrients before it is affected by a shortfall is to check via plant analysis. Waiting for visible deficiency symptoms in a crop to find out about a nutrient shortfall will mean that yield and quality have already been compromised by the time symptoms appear. Symptoms do not allow correct identification of which nutrient(s) are low and how severe the shortfall is. A setback in a crop due to a deficiency that lasts long enough to produce symptoms cannot be ‘repaired’.
This Guide explains how to use plant analysis to monitor and manage vegetable crop nutrition.
Soil testing can provide an estimate of potential nutrient availability from a soil. However, soil testing cannot predict the quantity of nutrients a crop will actually use because many factors other than soil fertility levels are involved in plant nutrient uptake.
A crop’s nutritional status, i.e. how well the soil/water/air/root system and nutrition program is providing for the crop’s nutritional requirements can only be
assessed via plant analysis.
Using both soil testing and plant analysis will provide the best picture of plant health.
A root zone solution analysis usually relates well to nutrient availability.
Purpose of this document This document provides a guide to the use of plant analyses. It explains:• Thebenefitsofusingplantanalysistoachievebalanced,sitespecificcropnutrientmanagement
• Plant analysis approaches and how they can be used in vegetable crops
• How to interpret plant analysis results.
Why use plant analysis for vegetables?
Plant Analysis Guide
4
Types of plant analysis Plant analysis is used as a tool to fine tune the nutrition of crops. The nutrient status of plants or parts of plants can be determined directly via laboratory analysis or estimated via in-field testing, while the overall health and nutrient status of a crop can be assessed via non-destructive sensing technologies, e.g. using colourimeters, Normalised Difference Vegetation Index (NDVI) or other remote sensing technologies.
This guide only deals with laboratory based plant nutrient analyses, specifically dry matter analysis and sap analysis. These are analyses of specific plant parts
sampled from an entire crop or distinct area(s) in a crop using standardised sampling and sample handling methods. The analyses can be used for leaves, petioles, fruit, tubers/rhizomes/bulbs or entire plants.
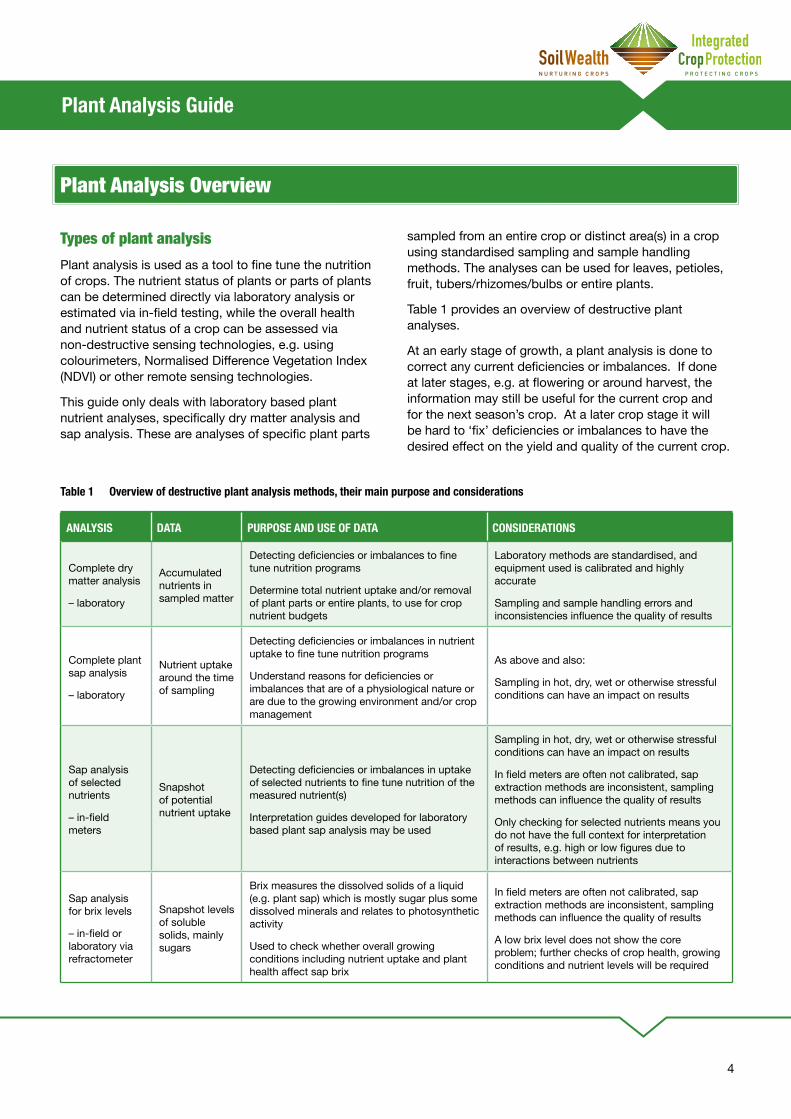
Table 1 provides an overview of destructive plant analyses.
At an early stage of growth, a plant analysis is done to correct any current deficiencies or imbalances. If done at later stages, e.g. at flowering or around harvest, the information may still be useful for the current crop and for the next season’s crop. At a later crop stage it will be hard to ‘fix’ deficiencies or imbalances to have the desired effect on the yield and quality of the current crop.
ANALYSIS DATA PURPOSE AND USE OF DATA CONSIDERATIONS
Complete dry matter analysis
– laboratory
Accumulated nutrients in sampled matter
Detecting deficiencies or imbalances to fine tune nutrition programs
Determine total nutrient uptake and/or removal of plant parts or entire plants, to use for crop nutrient budgets
Laboratory methods are standardised, and equipment used is calibrated and highly accurate
Sampling and sample handling errors and inconsistencies influence the quality of results
Complete plant sap analysis
– laboratory
Nutrient uptake around the time of sampling
Detecting deficiencies or imbalances in nutrient uptake to fine tune nutrition programs
Understand reasons for deficiencies or imbalances that are of a physiological nature or are due to the growing environment and/or crop management
As above and also:
Sampling in hot, dry, wet or otherwise stressful conditions can have an impact on results
Sap analysis of selected nutrients
– in-field meters
Snapshot of potential nutrient uptake
Detecting deficiencies or imbalances in uptake of selected nutrients to fine tune nutrition of the measured nutrient(s)
Interpretation guides developed for laboratory based plant sap analysis may be used
Sampling in hot, dry, wet or otherwise stressful conditions can have an impact on results
In field meters are often not calibrated, sap extraction methods are inconsistent, sampling methods can influence the quality of results
Only checking for selected nutrients means you do not have the full context for interpretation of results, e.g. high or low figures due to interactions between nutrients
Sap analysis for brix levels
– in-field or laboratory via refractometer
Snapshot levels of soluble solids, mainly sugars
Brix measures the dissolved solids of a liquid (e.g. plant sap) which is mostly sugar plus some dissolved minerals and relates to photosynthetic activity
Used to check whether overall growing conditions including nutrient uptake and plant health affect sap brix
In field meters are often not calibrated, sap extraction methods are inconsistent, sampling methods can influence the quality of results
A low brix level does not show the core problem; further checks of crop health, growing conditions and nutrient levels will be required
Plant Analysis Overview
Table 1 Overview of destructive plant analysis methods, their main purpose and considerations
Plant Analysis Guide
5
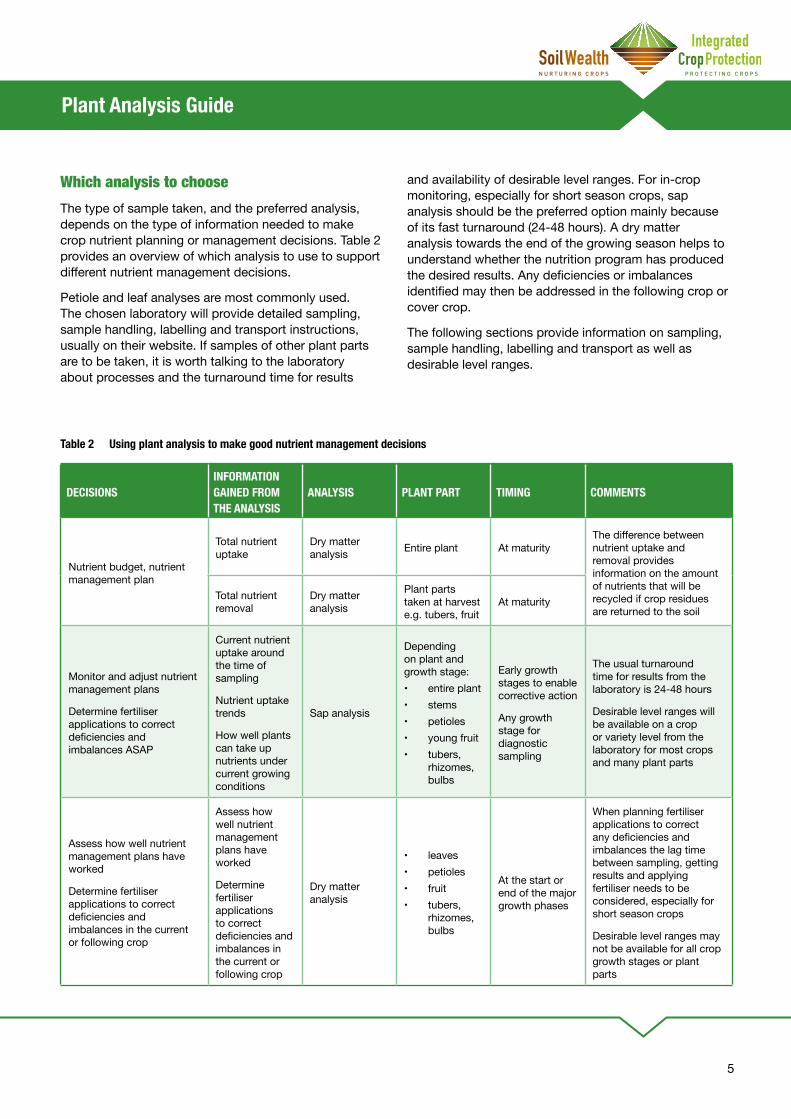
Which analysis to choose The type of sample taken, and the preferred analysis, depends on the type of information needed to make crop nutrient planning or management decisions. Table 2 provides an overview of which analysis to use to support different nutrient management decisions.
Petiole and leaf analyses are most commonly used. The chosen laboratory will provide detailed sampling, sample handling, labelling and transport instructions, usually on their website. If samples of other plant parts are to be taken, it is worth talking to the laboratory about processes and the turnaround time for results
and availability of desirable level ranges. For in-crop monitoring, especially for short season crops, sap analysis should be the preferred option mainly because of its fast turnaround (24-48 hours). A dry matter analysis towards the end of the growing season helps to understand whether the nutrition program has produced the desired results. Any deficiencies or imbalances identified may then be addressed in the following crop or cover crop.
The following sections provide information on sampling, sample handling, labelling and transport as well as desirable level ranges.
DECISIONSINFORMATION GAINED FROM THE ANALYSIS
ANALYSIS PLANT PART TIMING COMMENTS
Nutrient budget, nutrient management plan
Total nutrient uptake
Dry matter analysis Entire plant At maturity
The difference between nutrient uptake and removal provides information on the amount of nutrients that will be recycled if crop residues are returned to the soil
Total nutrient removal
Dry matter analysis
Plant parts taken at harvest e.g. tubers, fruit
At maturity
Monitor and adjust nutrient management plans
Determine fertiliser applications to correct deficiencies and imbalances ASAP
Current nutrient uptake around the time of sampling
Nutrient uptake trends
How well plants can take up nutrients under current growing conditions
Sap analysis
Depending on plant and growth stage:• entire plant• stems• petioles• young fruit• tubers,
rhizomes, bulbs
Early growth stages to enable corrective action
Any growth stage for diagnostic sampling
The usual turnaround time for results from the laboratory is 24-48 hours
Desirable level ranges will be available on a crop or variety level from the laboratory for most crops and many plant parts
Assess how well nutrient management plans have worked
Determine fertiliser applications to correct deficiencies and imbalances in the current or following crop
Assess how well nutrient management plans have worked
Determine fertiliser applications to correct deficiencies and imbalances in the current or following crop
Dry matter analysis
• leaves • petioles• fruit• tubers,
rhizomes, bulbs
At the start or end of the major growth phases
When planning fertiliser applications to correct any deficiencies and imbalances the lag time between sampling, getting results and applying fertiliser needs to be considered, especially for short season crops
Desirable level ranges may not be available for all crop growth stages or plant parts
Table 2 Using plant analysis to make good nutrient management decisions
Plant Analysis Guide
6
A plant sample has to represent the crop/paddock, distinct areas within a crop or distinct treatments, for example of a trial. The person sampling must collect an adequate number of plants or plant parts of a certain growth stage and age to represent the total plant population. A sample is usually made up of 20 – 100 plant parts or plants. The analytical laboratory will provide detailed advice on how and how much to sample for certain crops and analyses. The below overview provides information on typical sampling strategies.
General sampling methods The quality of a sample submitted to a laboratory will directly affect the quality of the analysis, the results and their interpretation. It is important to plan sampling and prepare all material needed before the day of sampling. It may be helpful to label bags or containers before going into the field.
Taking samplesMost analytical laboratories provide information on sampling methods (growth stages, plant parts, timing); some provide help with interpretation.
Irrespective of whether you are sampling for dry matter or sap analysis samples should NOT be collected:
• late in the week, causing them to be in the mail or with a courier over the weekend
• near roads, livestock pads or camps, trees, waterlogged areas or other abnormal parts of a crop
• with dirty or sweaty hands, when having sunscreen or other contaminants on hands
• into dirty sampling containers or bags
• whenacropisaffected by heat, drought, wind or water logging
• directly after irrigation or rain; ideally, the soil should be at field capacity
• from plants or plant parts that are: dry or dead, mechanically damaged, sunburned or affected by insects and diseases (unless they are diagnostic samples)
• from plants that have been recently sprayed with
pesticides or fertilisers
• from plants that are covered in dirt
• for 5-7 days after fungicide or foliar nutrient applications
If forced to sample under difficult conditions (see above) or you want to monitor the effect of certain conditions make sure you record conditions and purpose of sampling and consider conditions when interpreting results.
Try to collect a sample that is clean and free of dirt, obvious spray residues or any other type of contamination (e.g. sunscreen, sweat), however, do not attempt to wash the sample, if you cannot get a 100% clean one, the laboratory will clean it.
Paper bags are used for dry matter samples and plastic bags for sap samples. Place samples in an esky or car fridge but not directly on a freezer pack.
Other points to consider are:
• A minimum of 30 individual petioles or shoots (or other plant parts as specified for the crop and growth stage) should be collected, if individual items are small, 50+ may have to be collected to allow for sufficient sap to be extracted in the laboratory; if samples are large, e.g. fruit or tuber samples, it may be worth discussing minimum sample numbers with the laboratory e.g. whether perhaps 10-12 pieces will be sufficient.
• After sampling for a sap analysis, remove leaf blades from petioles, or excess foliage from e.g. onion, corn or carrot samples prior to posting. This minimises moisture loss and ensures the sample quality is maintained during transit.
• When sampling young fruit (e.g. cucumbers, tomatoes, capsicums), collect around 200 g of fruitlets.
If not sure, ask the laboratory for specific instructions.
Recording sample informationRecord information that helps interpretation of results - as soon as possible - after sampling. This additional information should be sent to the laboratory together with the standard sample information requested by the laboratory if it provides comments on results.
Sampling Strategies
Plant Analysis Guide
7
Record the following: • sampling site location or paddock
identification(alwaysusethesameidentificationforthesamesite)
• crop species and variety
• plant part and development stage, e.g. youngestfullyexpandedleaf(YFEL)
• planting date
• soil moisture status at the time of sampling, soil texture
• any observed symptoms above and below ground(e.g.rootdamageordiscolouration)
• previouscrop(s)
• fertiliser history
• last irrigation or rain
• cropgrowthstages(seeaccompanyingbox)
Crop growth stagesatthetimeofsampling(asper information provided by the laboratory or BBCH growth stages1);principalBBCHgrowthstages are:
0 Germination, sprouting, bud development
1 Leafdevelopment
2 Formationofsideshoots,tillering
3 Stem elongation or rosette growth, shoot development
4 Development of harvestable vegetative plant parts, bulb development, bolting
5 Inflorescenceemergence,heading
6 Flowering
7 Developmentoffruitortubers,roots(sizesshould be given e.g. length of cucumbers or carrots,diameterofpumpkinsorpotatoes)
1 Meier, Uwe: Growth stages of mono- and dicotyledonous plants. Berlin [u.a.] 1997. Blackwell.
Use instructions, bags and sample information forms (labels) provided by the laboratory. Send those with samples and, if the laboratory provides advice, add records on any of the above (see information in boxes above). Keep a copy of the labels and additional information sent and recorded. Verbal records may be kept as voice records (Dictaphone, smartphone).
Typical sample information is provided in Appendix 5.
If the laboratory does not provide bags, use paper (dry matter analysis) or plastic ziplock (sap analysis) lunch bags that are large enough to be comfortably closed. Observe handling and shipping instructions provided by the laboratory, especially for interstate shipments (quarantine requirements). Call the laboratory if unsure!
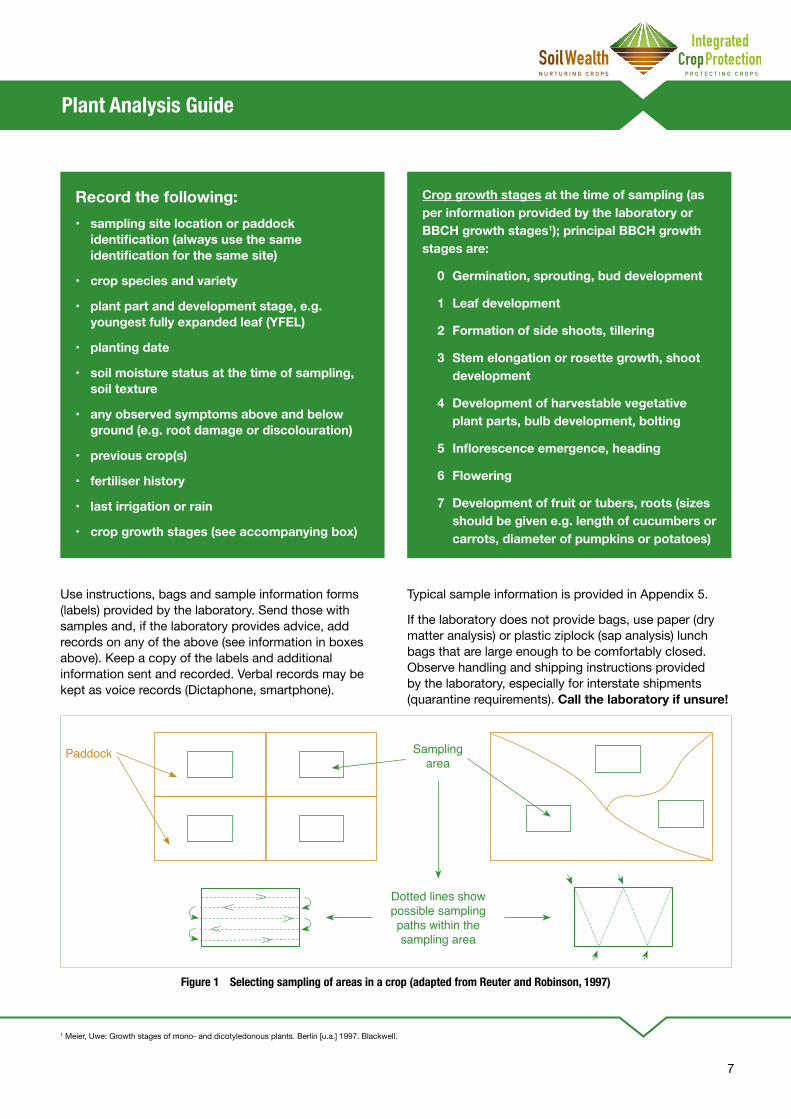
Figure 1 Selecting sampling of areas in a crop (adapted from Reuter and Robinson, 1997)
Paddock Sampling area
Dotted lines show possible sampling paths within the sampling area

Plant Analysis Guide
8
Sampling for diagnostic samples Regular crop monitoring should be conducted to eliminate the need for diagnostic sampling. Diagnostic sampling is used if a crop has already been affected by a nutrient deficiency or imbalance, symptoms have been observed (Appendix 3) and it is not clear which nutrient(s) are causing the issue. Both types of analysis are suitable, however, sap analysis may be more sensitive for identifying issues.
For diagnostic samples, if a deficiency is suspected, and especially if desirable ranges may not exist, separate samples should be collected from “deficient” and “normal” or “non-deficient” areas or paddocks (preferable of an identical growth stage). Where a crop is uniformly affected, one sample representing the affected crop might be compared to a sample from another, not affected crop, of the same variety, growth stage and growing conditions. This will allow for comparison between the samples and their results and potentially identify the nutrient deficiency/imbalance.
If samples are taken from a crop that already shows signs of nutrient stress, corrective action such as topdressing or foliar applications will likely be too late to avoid a reduction in crop yield or quality.
Figure 2 In-field sampling (image courtesy of AgVita Analytical)
Sampling for crop monitoringCrop monitoring provides information on how well a nutrition program is working, given the growing conditions and management inputs. Dry matter or sap analysis may be used. Refer to Which Analysis to Choose (page 5) to help with decisions.
Traditional sampling approach
For traditional crop nutrient monitoring, the paddock should be roughly divided into sections and each section should be sampled systematically using one of the methods illustrated in Figure 1. The location of subsections should be recorded to allow going back to the same areas for subsequent samples.
The samples from each subsection can be combined into one sample, if subsections are uniform. If the crop is not uniform, each paddock subsection will need to be sampled and analysed separately.
Spatially informed sampling
Ideally, maps (e.g. yield maps, nutrient maps) or outputs from geographic information system (GIS) based sensing technologies should be used to plan sampling. Some options for using spatial information to delimit sampling zones are described in Table 3.
Plant Analysis Guide
9
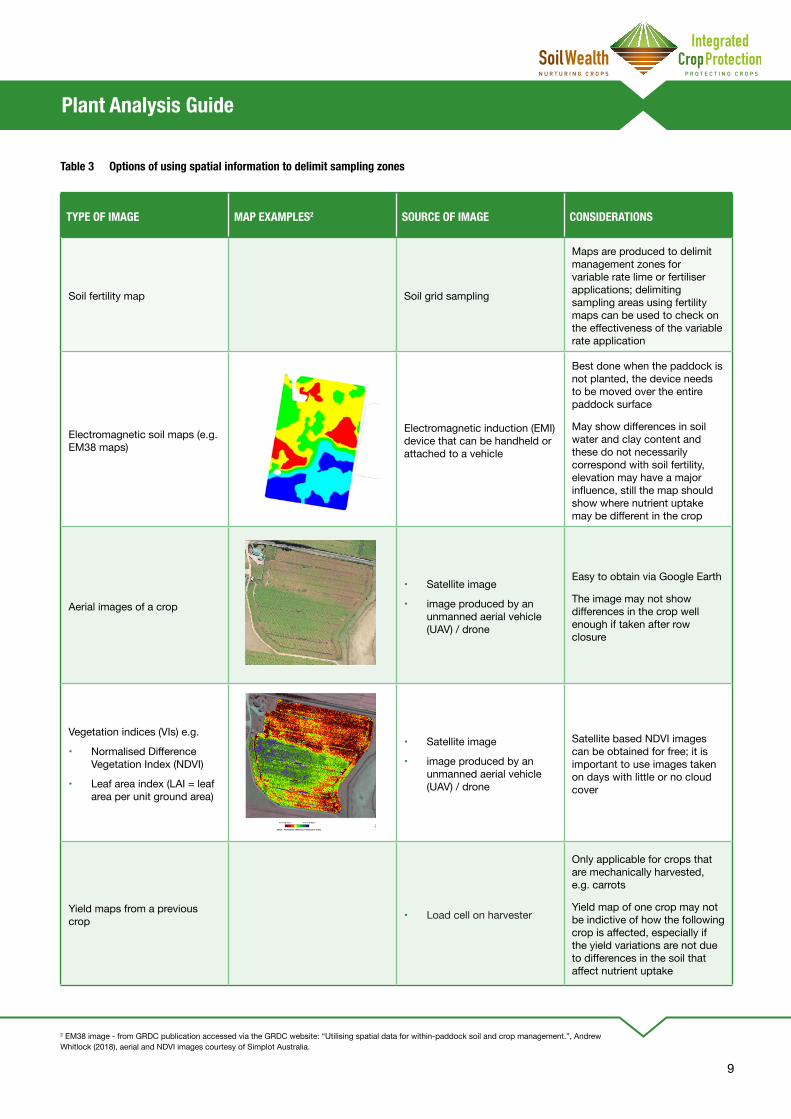
TYPE OF IMAGE MAP EXAMPLES2 SOURCE OF IMAGE CONSIDERATIONS
Soil fertility map Soil grid sampling
Maps are produced to delimit management zones for variable rate lime or fertiliser applications; delimiting sampling areas using fertility maps can be used to check on the effectiveness of the variable rate application
Electromagnetic soil maps (e.g. EM38 maps)
Electromagnetic induction (EMI) device that can be handheld or attached to a vehicle
Best done when the paddock is not planted, the device needs to be moved over the entire paddock surface
May show differences in soil water and clay content and these do not necessarily correspond with soil fertility, elevation may have a major influence, still the map should show where nutrient uptake may be different in the crop
Aerial images of a crop
• Satellite image
• image produced by an unmanned aerial vehicle (UAV) / drone
Easy to obtain via Google Earth
The image may not show differences in the crop well enough if taken after row closure
Vegetation indices (VIs) e.g.
• Normalised Difference Vegetation Index (NDVI)
• Leaf area index (LAI = leaf area per unit ground area)
• Satellite image
• image produced by an unmanned aerial vehicle (UAV) / drone
Satellite based NDVI images can be obtained for free; it is important to use images taken on days with little or no cloud cover
Yield maps from a previous crop • Load cell on harvester
Only applicable for crops that are mechanically harvested, e.g. carrots
Yield map of one crop may not be indictive of how the following crop is affected, especially if the yield variations are not due to differences in the soil that affect nutrient uptake
Table 3 Options of using spatial information to delimit sampling zones
2 EM38 image - from GRDC publication accessed via the GRDC website: “Utilising spatial data for within-paddock soil and crop management.”, Andrew Whitlock (2018), aerial and NDVI images courtesy of Simplot Australia.
Plant Analysis Guide
10
Sampling for dry matter analysisTimingIn most cases, plant samples are taken just before or after a rapid growth stage to check whether the nutrition program has worked for the crop. The turnaround time for a dry matter sample is typically one to three weeks. For a fast growing crop, this may mean that deficiencies or imbalances cannot be rectified effectively before the crop matures. Interventions may be effective if the crop still has several weeks to grow once the results have been received. Therefore, dry matter analysis is often used as a diagnostic tool rather than a crop management tool, i.e. to adjust nutrition programs.
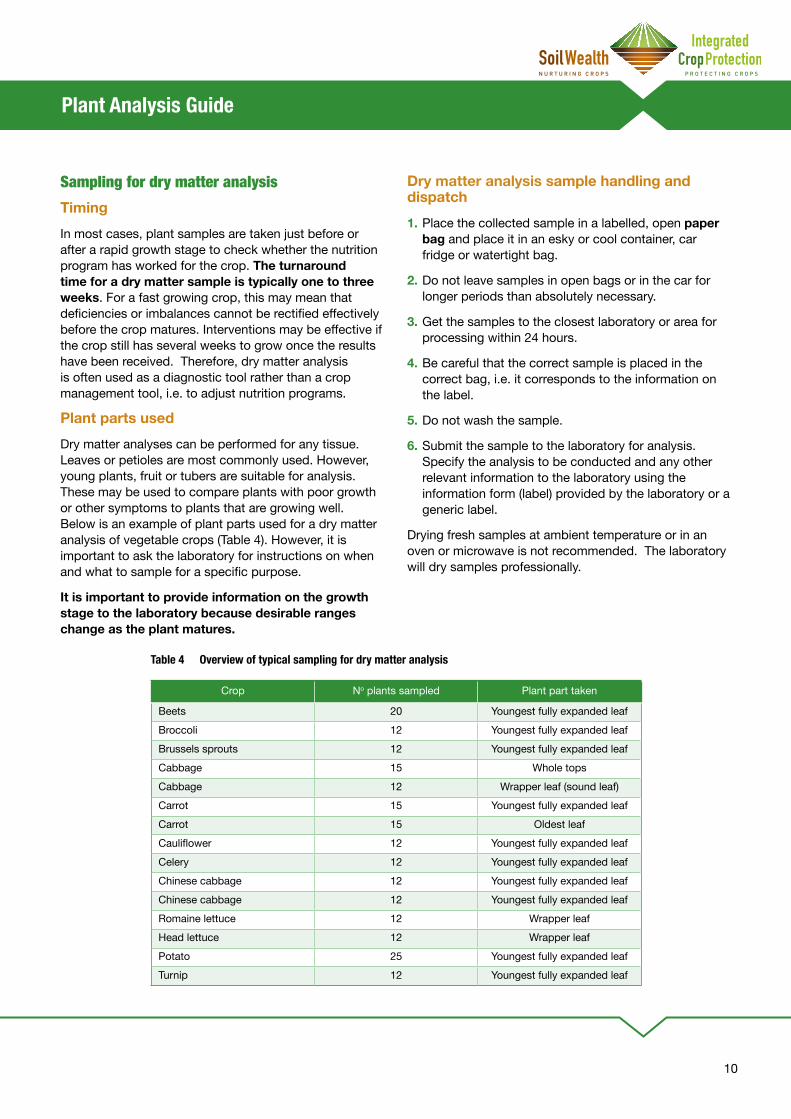
Plant parts usedDry matter analyses can be performed for any tissue. Leaves or petioles are most commonly used. However, young plants, fruit or tubers are suitable for analysis. These may be used to compare plants with poor growth or other symptoms to plants that are growing well. Below is an example of plant parts used for a dry matter analysis of vegetable crops (Table 4). However, it is important to ask the laboratory for instructions on when and what to sample for a specific purpose.
It is important to provide information on the growth stage to the laboratory because desirable ranges change as the plant matures.
Dry matter analysis sample handling and dispatch1. Place the collected sample in a labelled, open paper
bag and place it in an esky or cool container, car fridge or watertight bag.
2. Do not leave samples in open bags or in the car for longer periods than absolutely necessary.
3. Get the samples to the closest laboratory or area for processing within 24 hours.
4. Be careful that the correct sample is placed in the correct bag, i.e. it corresponds to the information on the label.
5. Do not wash the sample.
6. Submit the sample to the laboratory for analysis. Specify the analysis to be conducted and any other relevant information to the laboratory using the information form (label) provided by the laboratory or a generic label.
Drying fresh samples at ambient temperature or in an oven or microwave is not recommended. The laboratory will dry samples professionally.
Crop No plants sampled Plant part taken
Beets 20 Youngest fully expanded leaf Broccoli 12 Youngest fully expanded leafBrussels sprouts 12 Youngest fully expanded leafCabbage 15 Whole topsCabbage 12 Wrapper leaf (sound leaf)Carrot 15 Youngest fully expanded leafCarrot 15 Oldest leafCauliflower 12 Youngest fully expanded leafCelery 12 Youngest fully expanded leafChinese cabbage 12 Youngest fully expanded leafChinese cabbage 12 Youngest fully expanded leafRomaine lettuce 12 Wrapper leafHead lettuce 12 Wrapper leafPotato 25 Youngest fully expanded leafTurnip 12 Youngest fully expanded leaf
Table 4 Overview of typical sampling for dry matter analysis
Plant Analysis Guide
11
Sampling for sap analysisTimingSampling for sap analysis for crop monitoring can take place at any time during the growing season. If the primarypurposeistocorrectnutrientdeficiencies,samples should be taken during early growth, before harvestable plant parts start to develop and/or grow rapidly.
The timing and frequency of sampling depends on the crop and the initial results obtained from the first sample. A regular sampling program with 3 to 5 samples taken during the main growing season, when correction of deficiencies or imbalances is still possible, is recommended.
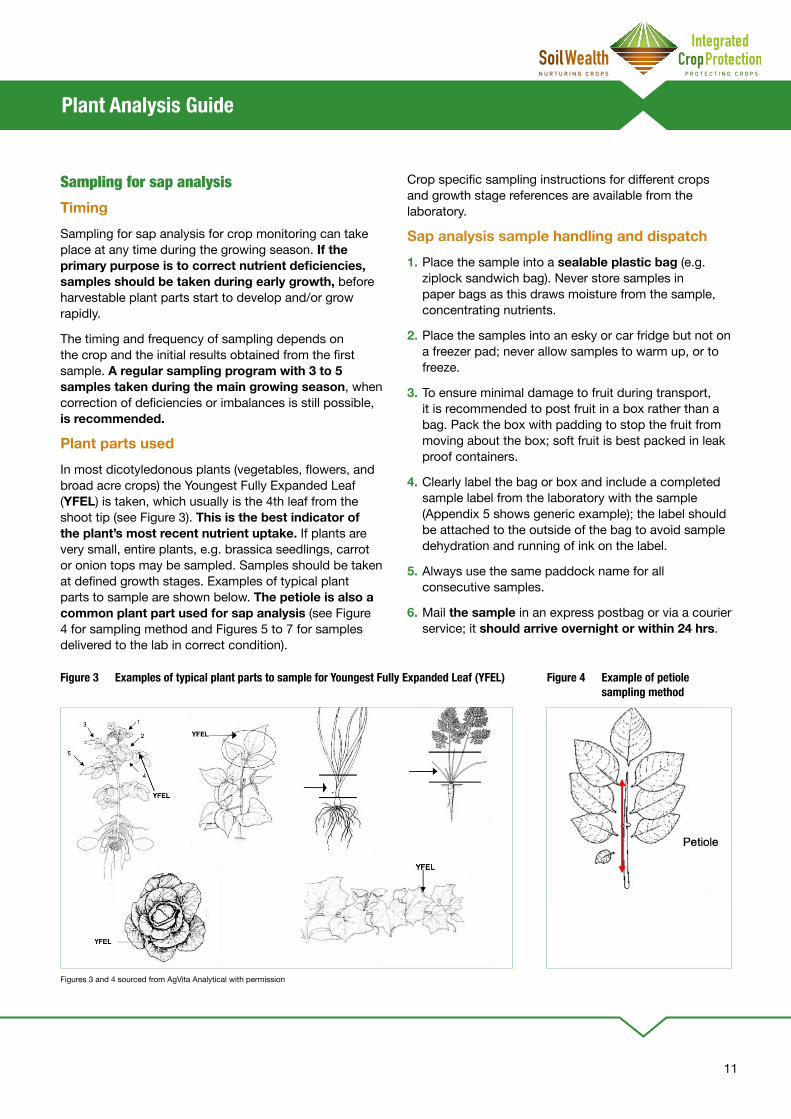
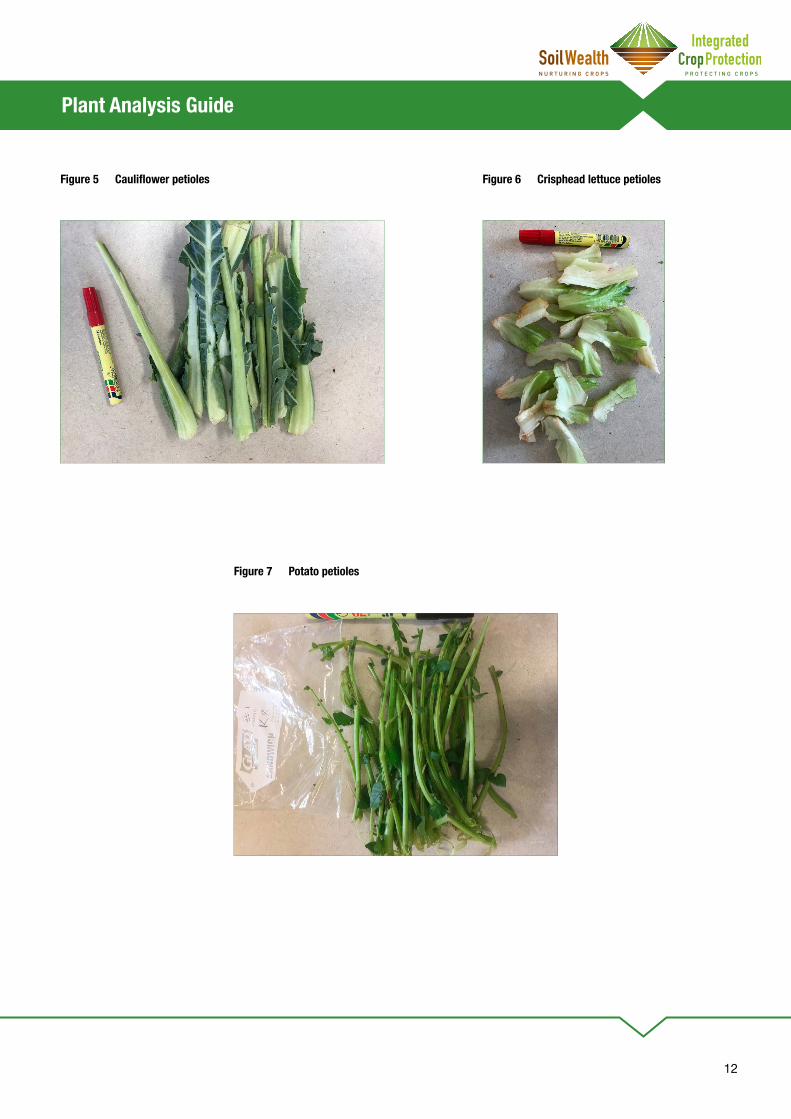
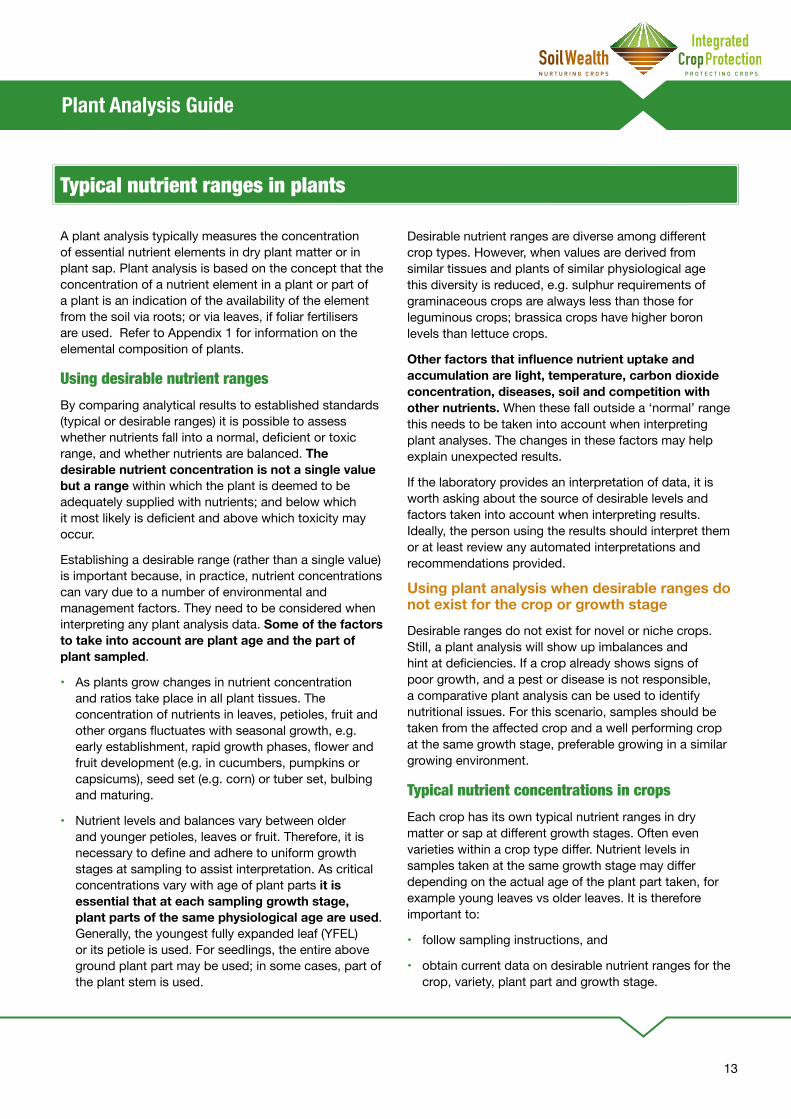
Plant parts usedIn most dicotyledonous plants (vegetables, flowers, and broad acre crops) the Youngest Fully Expanded Leaf (YFEL) is taken, which usually is the 4th leaf from the shoot tip (see Figure 3). This is the best indicator of the plant’s most recent nutrient uptake. If plants are very small, entire plants, e.g. brassica seedlings, carrot or onion tops may be sampled. Samples should be taken at defined growth stages. Examples of typical plant parts to sample are shown below. The petiole is also a common plant part used for sap analysis (see Figure 4 for sampling method and Figures 5 to 7 for samples delivered to the lab in correct condition).
Crop specific sampling instructions for different crops and growth stage references are available from the laboratory.
Sap analysis sample handling and dispatch1. Place the sample into a sealable plastic bag (e.g.
ziplock sandwich bag). Never store samples in paper bags as this draws moisture from the sample, concentrating nutrients.
2. Place the samples into an esky or car fridge but not on a freezer pad; never allow samples to warm up, or to freeze.
3. To ensure minimal damage to fruit during transport, it is recommended to post fruit in a box rather than a bag. Pack the box with padding to stop the fruit from moving about the box; soft fruit is best packed in leak proof containers.
4. Clearly label the bag or box and include a completed sample label from the laboratory with the sample (Appendix 5 shows generic example); the label should be attached to the outside of the bag to avoid sample dehydration and running of ink on the label.
5. Always use the same paddock name for all consecutive samples.
6. Mail the sample in an express postbag or via a courier service; it should arrive overnight or within 24 hrs.
Figure 3 Examples of typical plant parts to sample for Youngest Fully Expanded Leaf (YFEL) Figure 4 Example of petiole sampling method
Figures 3 and 4 sourced from AgVita Analytical with permission
Plant Analysis Guide
12
Figure 5 Cauliflower petioles Figure 6 Crisphead lettuce petioles
Figure 7 Potato petioles
Plant Analysis Guide
13
A plant analysis typically measures the concentration of essential nutrient elements in dry plant matter or in plant sap. Plant analysis is based on the concept that the concentration of a nutrient element in a plant or part of a plant is an indication of the availability of the element from the soil via roots; or via leaves, if foliar fertilisers are used. Refer to Appendix 1 for information on the elemental composition of plants.
Using desirable nutrient rangesBy comparing analytical results to established standards (typical or desirable ranges) it is possible to assess whether nutrients fall into a normal, deficient or toxic range, and whether nutrients are balanced. The desirable nutrient concentration is not a single value but a range within which the plant is deemed to be adequately supplied with nutrients; and below which it most likely is deficient and above which toxicity may occur.
Establishing a desirable range (rather than a single value) is important because, in practice, nutrient concentrations can vary due to a number of environmental and management factors. They need to be considered when interpreting any plant analysis data. Some of the factors to take into account are plant age and the part of plant sampled.
• As plants grow changes in nutrient concentration and ratios take place in all plant tissues. The concentration of nutrients in leaves, petioles, fruit and other organs fluctuates with seasonal growth, e.g. early establishment, rapid growth phases, flower and fruit development (e.g. in cucumbers, pumpkins or capsicums), seed set (e.g. corn) or tuber set, bulbing and maturing.
• Nutrient levels and balances vary between older and younger petioles, leaves or fruit. Therefore, it is necessary to define and adhere to uniform growth stages at sampling to assist interpretation. As critical concentrations vary with age of plant parts it is essential that at each sampling growth stage, plant parts of the same physiological age are used. Generally, the youngest fully expanded leaf (YFEL) or its petiole is used. For seedlings, the entire above ground plant part may be used; in some cases, part of the plant stem is used.
Desirable nutrient ranges are diverse among different crop types. However, when values are derived from similar tissues and plants of similar physiological age this diversity is reduced, e.g. sulphur requirements of graminaceous crops are always less than those for leguminous crops; brassica crops have higher boron levels than lettuce crops.
Otherfactorsthatinfluencenutrientuptakeandaccumulation are light, temperature, carbon dioxide concentration, diseases, soil and competition with other nutrients. When these fall outside a ‘normal’ range this needs to be taken into account when interpreting plant analyses. The changes in these factors may help explain unexpected results.
If the laboratory provides an interpretation of data, it is worth asking about the source of desirable levels and factors taken into account when interpreting results. Ideally, the person using the results should interpret them or at least review any automated interpretations and recommendations provided.
Using plant analysis when desirable ranges do not exist for the crop or growth stageDesirable ranges do not exist for novel or niche crops. Still, a plant analysis will show up imbalances and hint at deficiencies. If a crop already shows signs of poor growth, and a pest or disease is not responsible, a comparative plant analysis can be used to identify nutritional issues. For this scenario, samples should be taken from the affected crop and a well performing crop at the same growth stage, preferable growing in a similar growing environment.
Typical nutrient concentrations in cropsEach crop has its own typical nutrient ranges in dry matter or sap at different growth stages. Often even varieties within a crop type differ. Nutrient levels in samples taken at the same growth stage may differ depending on the actual age of the plant part taken, for example young leaves vs older leaves. It is therefore important to:
• follow sampling instructions, and
• obtain current data on desirable nutrient ranges for the crop, variety, plant part and growth stage.
Typical nutrient ranges in plants
Plant Analysis Guide
14
While standards for desirable concentration ranges of essential nutrients in dry matter and sap analyses exist for most crops, desirable ranges and even functions of beneficial nutrients such as cobalt, vanadium, nickel, selenium, aluminium, silicon and sodium, to name a few, are still mostly unclear.
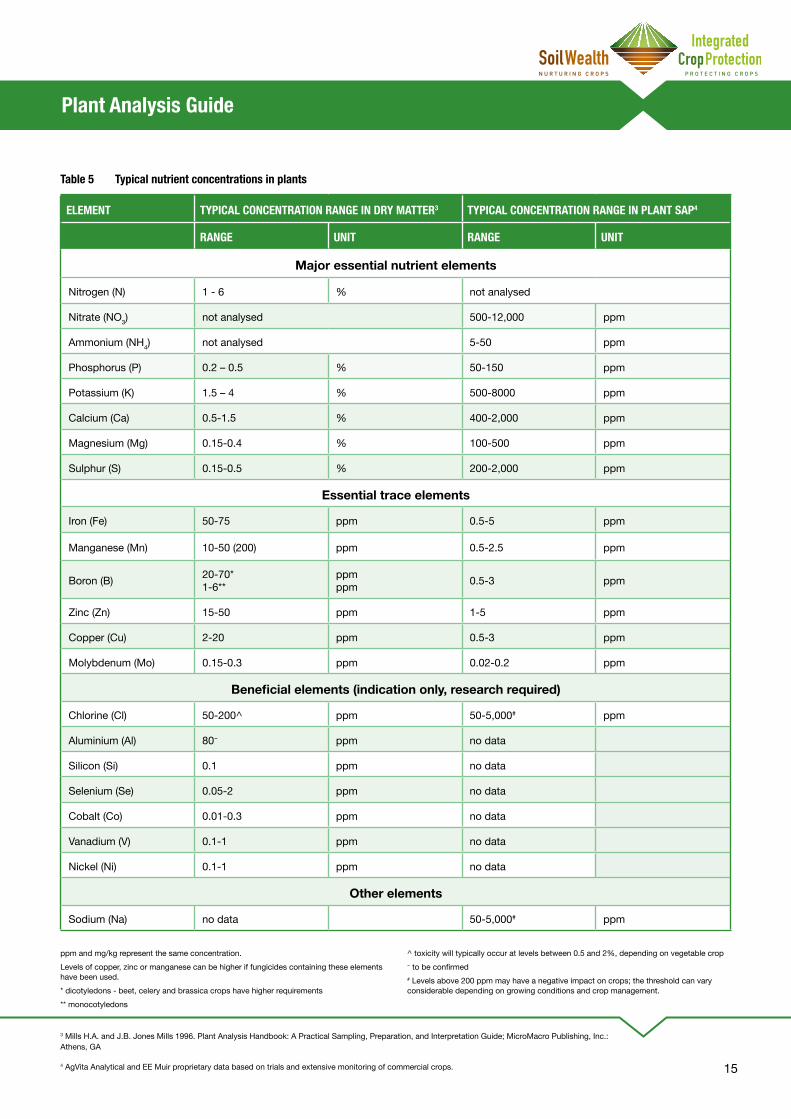
Table 5 provides an overview of typical nutrient ranges in plants for dry matter or sap analysis. These ranges are an indication only. Sap and dry matter analysis data cannot be ‘converted’ from one to the other. Both measure different crop responses to nutrients in the soil and applied to leaves (Table 1). Both have a place and a purpose to support good nutrient management decisions (Table 2). Crop specific sampling instructions for different crops and growth stage references are available from the laboratory.
Establishing desirable nutrient rangesExperimentsMany desirable ranges for dry matter analysis have been obtained via experiments in sand culture, water culture, green-house or field experiments using increasing levels of specific nutrients in a deficient growing medium. An appropriate yield (generally 90% of maximum yield) is selected and the nutrient concentration range in the dry matter of the selected plant part (e.g. leaf, petiole or fruit) at this yield level from a number of experiments is used as the desirable nutrient concentration range.
This approach has been traditionally used to establish desirable ranges for interpreting dry matter analysis data of plant samples taken towards the end of the growing season to review the season’s nutrient management. Dry matter analysis conducted close to harvest or after harvest, can be used to investigate the effect of different fertiliser or soil treatments on the nutrient composition of certain plant organs, yield and quality.
Most of the data provided in the standard publication on nutrient levels in plant tissues (dry matter analysis) by Reuter and Robinson (19973) have been obtained via experiments in the Northern Hemisphere. This data provides valuable guidance; however, since that time, varieties, growing practices, growing environments and yield levels have changed greatly so that this early data should be used as a guide only.
Commercial crop dataDesirable ranges, especially for Australian conditions and for early crop development stages, have been derived via analysing data from a great number of commercial plant analyses obtained over several years, conducted to monitor crops that grew ‘normally’. Mean values, medians and standard deviations from a great number of data points for a certain crop, plant part and variety at a defined growth stage have been used to determine desirable ranges. This data from commercial crops has been mainly analysed to establish desirable ranges for use in crop monitoring and for fine tuning nutrition programs.
In Table 5 the dry matter analysis data is from experimental data while the sap analysis data is based on trials and extensive monitoring of commercial crops. Only data from healthy crops has been included in the development of desirable ranges.
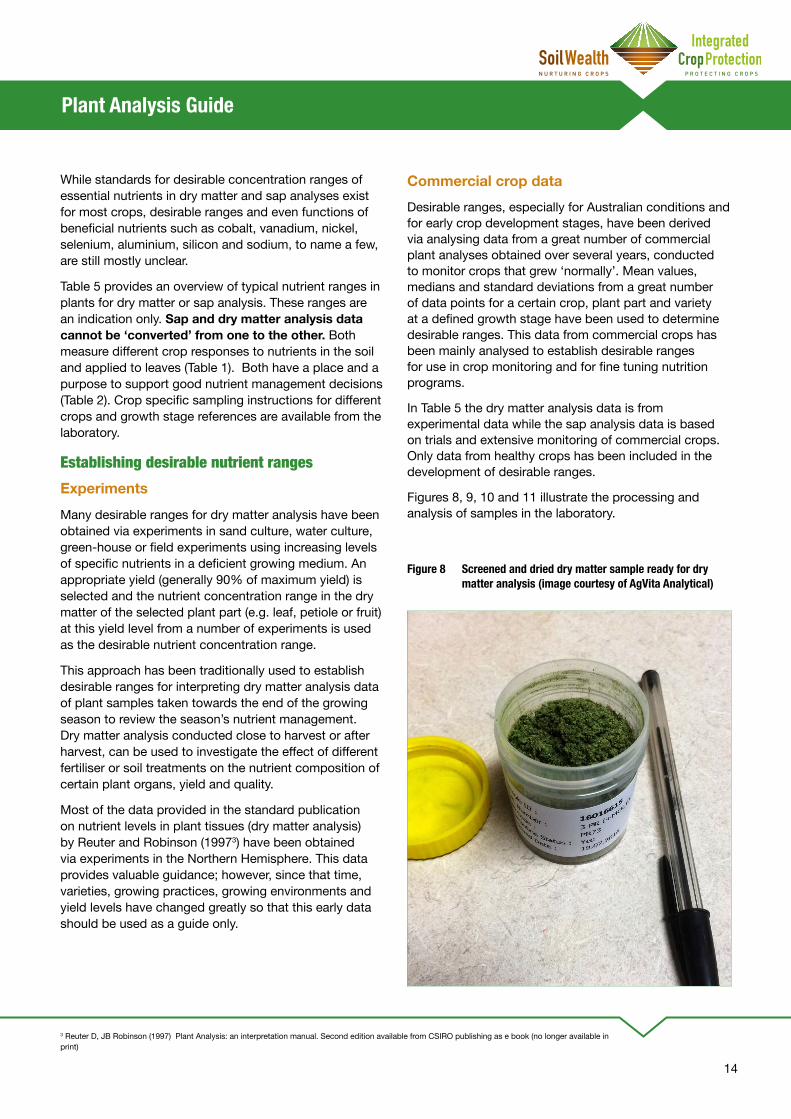
Figures 8, 9, 10 and 11 illustrate the processing and analysis of samples in the laboratory.
3 Reuter D, JB Robinson (1997) Plant Analysis: an interpretation manual. Second edition available from CSIRO publishing as e book (no longer available in print)
Figure 8 Screened and dried dry matter sample ready for dry matter analysis (image courtesy of AgVita Analytical)
Plant Analysis Guide
15
ELEMENT TYPICAL CONCENTRATION RANGE IN DRY MATTER3 TYPICAL CONCENTRATION RANGE IN PLANT SAP4
RANGE UNIT RANGE UNIT
Major essential nutrient elements
Nitrogen (N) 1 - 6 % not analysed
Nitrate (NO3) not analysed 500-12,000 ppm
Ammonium (NH4) not analysed 5-50 ppm
Phosphorus (P) 0.2 – 0.5 % 50-150 ppm
Potassium (K) 1.5 – 4 % 500-8000 ppm
Calcium (Ca) 0.5-1.5 % 400-2,000 ppm
Magnesium (Mg) 0.15-0.4 % 100-500 ppm
Sulphur (S) 0.15-0.5 % 200-2,000 ppm
Essentialtraceelements
Iron (Fe) 50-75 ppm 0.5-5 ppm
Manganese (Mn) 10-50 (200) ppm 0.5-2.5 ppm
Boron (B) 20-70* 1-6**
ppm ppm 0.5-3 ppm
Zinc (Zn) 15-50 ppm 1-5 ppm
Copper (Cu) 2-20 ppm 0.5-3 ppm
Molybdenum (Mo) 0.15-0.3 ppm 0.02-0.2 ppm
Beneficialelements(indicationonly,researchrequired)
Chlorine (Cl) 50-200^ ppm 50-5,000# ppm
Aluminium (Al) 80~ ppm no data
Silicon (Si) 0.1 ppm no data
Selenium (Se) 0.05-2 ppm no data
Cobalt (Co) 0.01-0.3 ppm no data
Vanadium (V) 0.1-1 ppm no data
Nickel (Ni) 0.1-1 ppm no data
Other elements
Sodium (Na) no data 50-5,000# ppm
ppm and mg/kg represent the same concentration.Levels of copper, zinc or manganese can be higher if fungicides containing these elements have been used.* dicotyledons - beet, celery and brassica crops have higher requirements ** monocotyledons
^ toxicity will typically occur at levels between 0.5 and 2%, depending on vegetable crop ~ to be confirmed # Levels above 200 ppm may have a negative impact on crops; the threshold can vary considerable depending on growing conditions and crop management.
Table 5 Typical nutrient concentrations in plants
3 Mills H.A. and J.B. Jones Mills 1996. Plant Analysis Handbook: A Practical Sampling, Preparation, and Interpretation Guide; MicroMacro Publishing, Inc.: Athens, GA
4 AgVita Analytical and EE Muir proprietary data based on trials and extensive monitoring of commercial crops.
Plant Analysis Guide
16
The results from a plant analysis provide an insight into nutrient availability to the crop from the soil (unless foliar nutrients have been used prior to the analysis).
Comparing soil analysis5 and plant analysis results can provide an insight into nutrient uptake conditions. A nutrient may be in an adequate range in soil analysis results but appear to be below optimum according to a plant analysis. Why this may be occurring can be due to one or several influences, some of which are listed below.
Under the premise that there have been no sampling errors, factors that may influence nutrient uptake have to be investigated.
Possible influences on nutrient uptake include but are not limited to:
• Weather conditions
• Soil fertility
• Rainfall
• Irrigation management
• Irrigation water quality
• Rooting depths, root distribution and density
• Physical constraints such as compaction
• Biological constraints that prevent nutrient cycling from the soil
• Chemical constraints such as low or high pH, pH changes in the profile, salinity, or sodicity6
• Fertilisers used
• Soil amendments used
• Crop health
• Nutrient interactions (see Appendix 2).
When interpreting data, it is important to look fortrendsandfluctuationsduringtheseasonorinconsistencies between soil and plant analyses. Nutrient ratios can give valuable information. Desirable ranges provide information on deficiencies and they should always be used in combination with information about the crop.
If the data is used to determine fertiliser inputs, it is important to have seen the crops and understand growing conditions as listed above, management inputs applied and planned as well as yield expectations. It is also critical to know whether the crop has been stressed at any stage during its life.
Dry matter dataFigure 8 shows an example of a dry matter sample ready for analysis.
Interpretive tables of desirable range by crop are commonly used for the interpretation of dry matter analysis data. Results are compared to a desirable range.
Formostofthemajornutrients,plantconcentrationsin plant tissues are greatest when the plants are young. As the plants grow, more and more of the plant mass is made up of structural material that contains very few mineral nutrients. The growth of this structural material “dilutes” the dry matter concentrations of nutrients like N, P and K in particular, which decline as the plants get older and bigger. Therefore, desirable ranges of N, P and K in plants will fall markedly as plants grow. Appendix 4 gives an overview of nutrient uptake over time.
For some crops, the change in desirable ranges over time is well documented for dry matter and data is recent. However, most data is based on overseas experiments where the original research was conducted some time ago. This means that levels may be based on data from older varieties and crop management inputs and do not reflect modern production techniques and yield levels. Some new data has been compiled by analytical laboratories and specialist consultants. Laboratories will be able to provide information on how the desirable ranges they are using have been obtained and how they are kept up to date.
Interpretation of results
5 Refer to the Soil Wealth and Integrated Crop Protection ‘Soil Testing and Interpretation for Vegetable Crops: A guide’ available from www.soilwealth.com.au.
6 Refer to the Soil Wealth and Integrated Crop Protection factsheets ‘Managing salinity in vegetable crops’ and ‘Managing sodicity in vegetable crops’ available from www.soilwealth.com.au.
Plant Analysis Guide
17
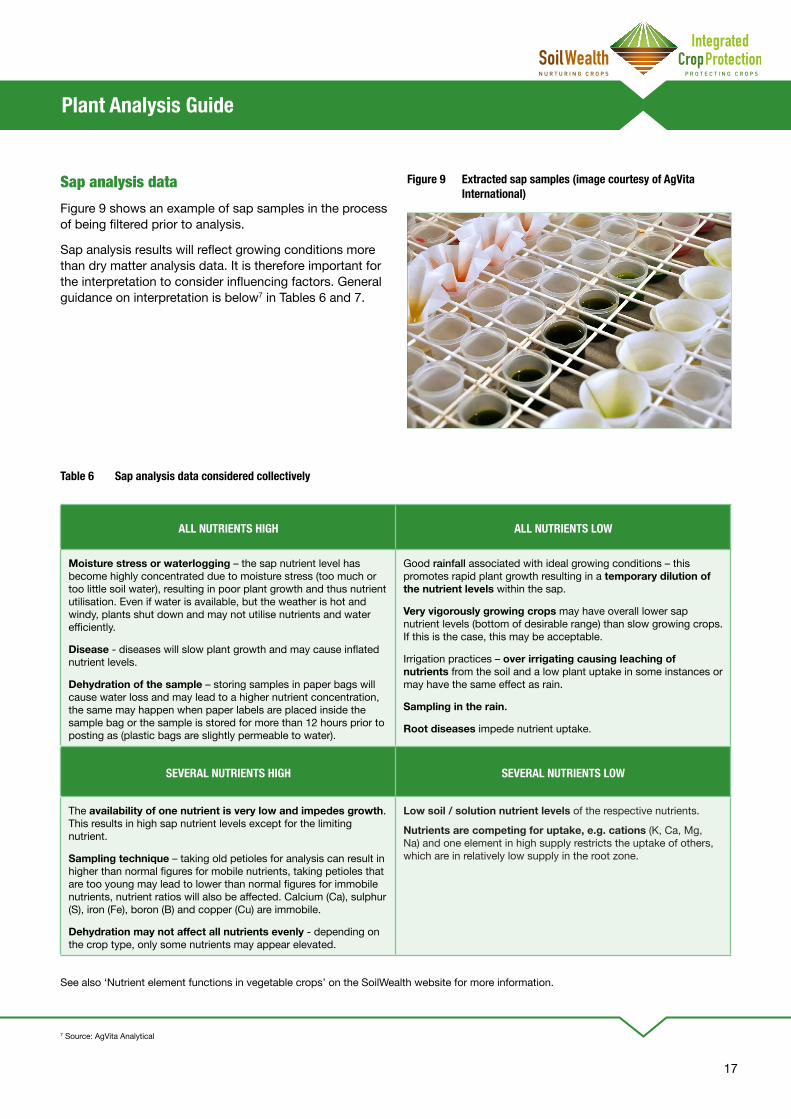
Sap analysis dataFigure 9 shows an example of sap samples in the process of being filtered prior to analysis.
Sap analysis results will reflect growing conditions more than dry matter analysis data. It is therefore important for the interpretation to consider influencing factors. General guidance on interpretation is below7 in Tables 6 and 7.
Figure 9 Extracted sap samples (image courtesy of AgVita International)
7 Source: AgVita Analytical
ALL NUTRIENTS HIGH ALL NUTRIENTS LOW
Moisture stress or waterlogging – the sap nutrient level has become highly concentrated due to moisture stress (too much or too little soil water), resulting in poor plant growth and thus nutrient utilisation. Even if water is available, but the weather is hot and windy, plants shut down and may not utilise nutrients and water efficiently.
Disease - diseases will slow plant growth and may cause inflated nutrient levels.
Dehydration of the sample – storing samples in paper bags will cause water loss and may lead to a higher nutrient concentration, the same may happen when paper labels are placed inside the sample bag or the sample is stored for more than 12 hours prior to posting as (plastic bags are slightly permeable to water).
Good rainfall associated with ideal growing conditions – this promotes rapid plant growth resulting in a temporary dilution of the nutrient levels within the sap.
Very vigorously growing crops may have overall lower sap nutrient levels (bottom of desirable range) than slow growing crops. If this is the case, this may be acceptable.
Irrigation practices – over irrigating causing leaching of nutrients from the soil and a low plant uptake in some instances or may have the same effect as rain.
Sampling in the rain.
Root diseases impede nutrient uptake.
SEVERAL NUTRIENTS HIGH SEVERAL NUTRIENTS LOW
The availability of one nutrient is very low and impedes growth. This results in high sap nutrient levels except for the limiting nutrient.
Sampling technique – taking old petioles for analysis can result in higher than normal figures for mobile nutrients, taking petioles that are too young may lead to lower than normal figures for immobile nutrients, nutrient ratios will also be affected. Calcium (Ca), sulphur (S), iron (Fe), boron (B) and copper (Cu) are immobile.
Dehydrationmaynotaffectallnutrientsevenly - depending on the crop type, only some nutrients may appear elevated.
Lowsoil/solutionnutrientlevels of the respective nutrients.
Nutrients are competing for uptake, e.g. cations (K, Ca, Mg, Na) and one element in high supply restricts the uptake of others, which are in relatively low supply in the root zone.
Table 6 Sap analysis data considered collectively
See also ‘Nutrient element functions in vegetable crops’ on the SoilWealth website for more information.
Plant Analysis Guide
18
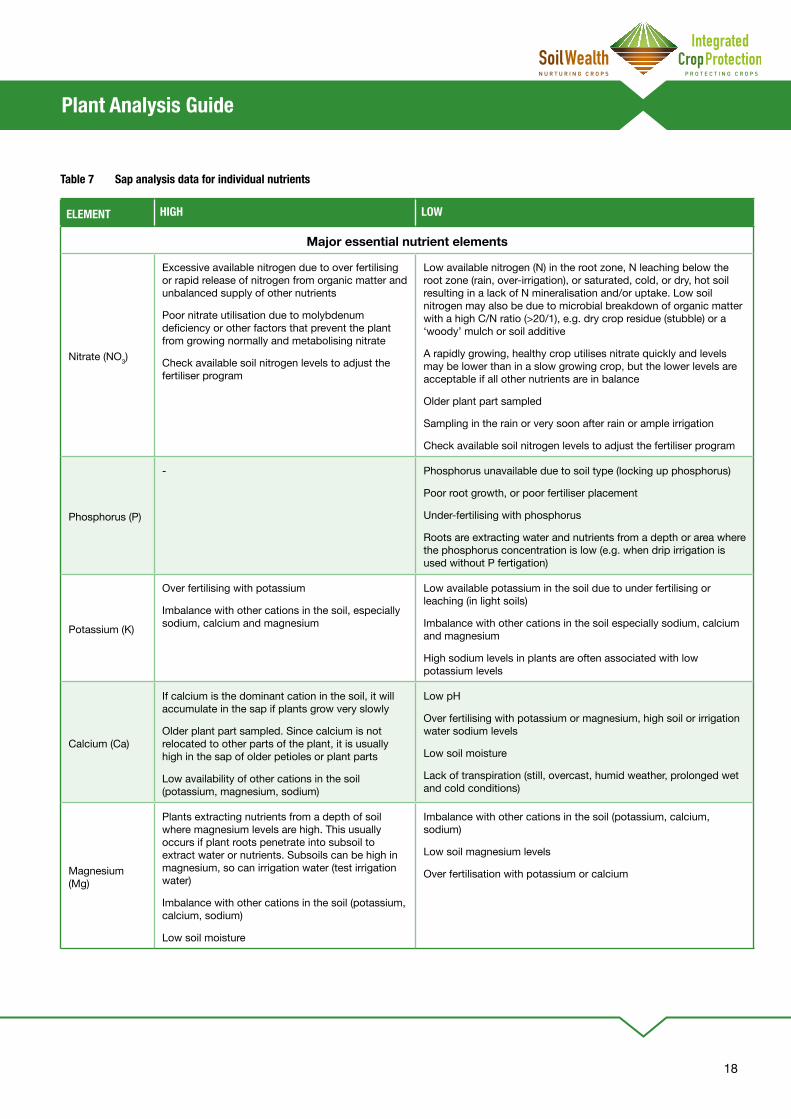
ELEMENT HIGH LOW
Major essential nutrient elements
Nitrate (NO3)
Excessive available nitrogen due to over fertilising or rapid release of nitrogen from organic matter and unbalanced supply of other nutrients
Poor nitrate utilisation due to molybdenum deficiency or other factors that prevent the plant from growing normally and metabolising nitrate
Check available soil nitrogen levels to adjust the fertiliser program
Low available nitrogen (N) in the root zone, N leaching below the root zone (rain, over-irrigation), or saturated, cold, or dry, hot soil resulting in a lack of N mineralisation and/or uptake. Low soil nitrogen may also be due to microbial breakdown of organic matter with a high C/N ratio (>20/1), e.g. dry crop residue (stubble) or a ‘woody’ mulch or soil additive
A rapidly growing, healthy crop utilises nitrate quickly and levels may be lower than in a slow growing crop, but the lower levels are acceptable if all other nutrients are in balance
Older plant part sampled
Sampling in the rain or very soon after rain or ample irrigation
Check available soil nitrogen levels to adjust the fertiliser program
Phosphorus (P)
- Phosphorus unavailable due to soil type (locking up phosphorus)
Poor root growth, or poor fertiliser placement
Under-fertilising with phosphorus
Roots are extracting water and nutrients from a depth or area where the phosphorus concentration is low (e.g. when drip irrigation is used without P fertigation)
Potassium (K)
Over fertilising with potassium
Imbalance with other cations in the soil, especially sodium, calcium and magnesium
Low available potassium in the soil due to under fertilising or leaching (in light soils)
Imbalance with other cations in the soil especially sodium, calcium and magnesium
High sodium levels in plants are often associated with low potassium levels
Calcium (Ca)
If calcium is the dominant cation in the soil, it will accumulate in the sap if plants grow very slowly
Older plant part sampled. Since calcium is not relocated to other parts of the plant, it is usually high in the sap of older petioles or plant parts
Low availability of other cations in the soil (potassium, magnesium, sodium)
Low pH
Over fertilising with potassium or magnesium, high soil or irrigation water sodium levels
Low soil moisture
Lack of transpiration (still, overcast, humid weather, prolonged wet and cold conditions)
Magnesium (Mg)
Plants extracting nutrients from a depth of soil where magnesium levels are high. This usually occurs if plant roots penetrate into subsoil to extract water or nutrients. Subsoils can be high in magnesium, so can irrigation water (test irrigation water)
Imbalance with other cations in the soil (potassium, calcium, sodium)
Low soil moisture
Imbalance with other cations in the soil (potassium, calcium, sodium)
Low soil magnesium levels
Over fertilisation with potassium or calcium
Table 7 Sap analysis data for individual nutrients
Plant Analysis Guide
19
Other elements and brixLowzincandboron
Under-fertilising with zinc and boron. If the crop is sensitive to zinc and/or boron deficiency or is a high user of zinc and boron, it is advised to aim for relatively high sap levels (top of the desirable range) during periods of rapid growth.
Lowmolybdenum
Low molybdenum availability in the soil.
Lowbrixlevel(solublesolidslevel)
Research has shown that when brix levels are low then sap sulphur, potassium, phosphorus, zinc or manganese levels are low. Often more than one of these elements is low which may occur in combination with high nitrogen uptake.
High copper, sulphur, manganese or zinc
High levels may be due to recent fungicide applications.
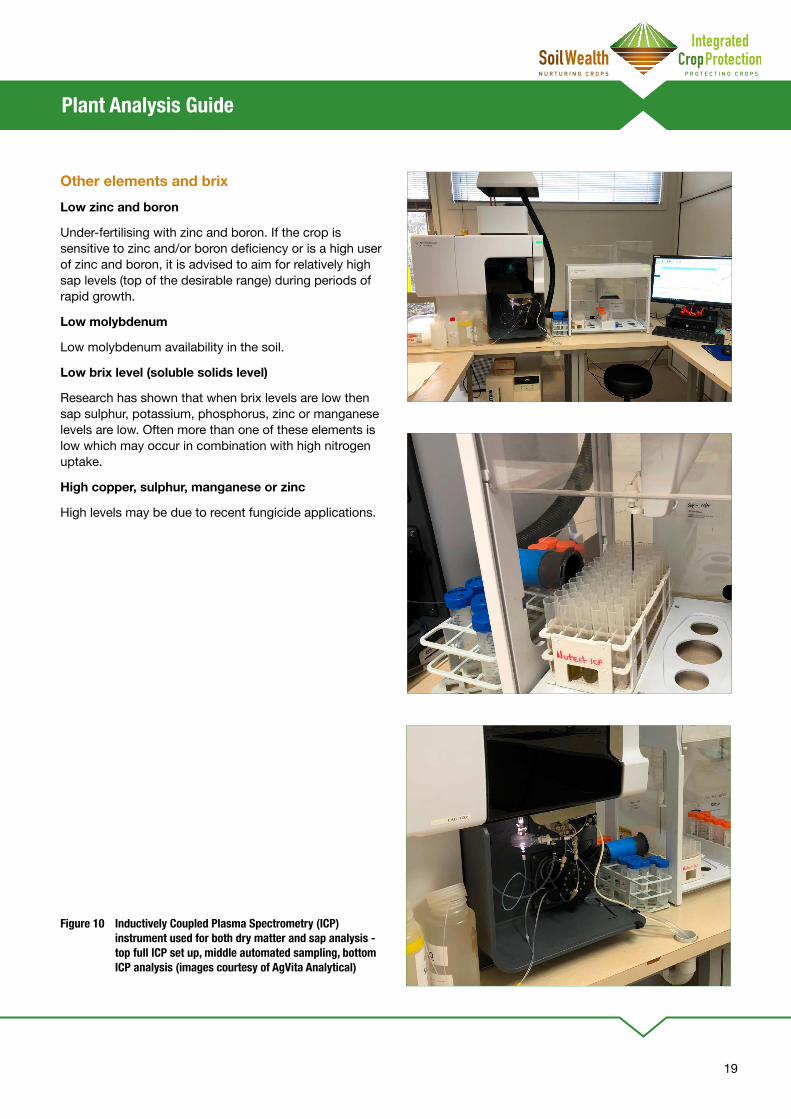
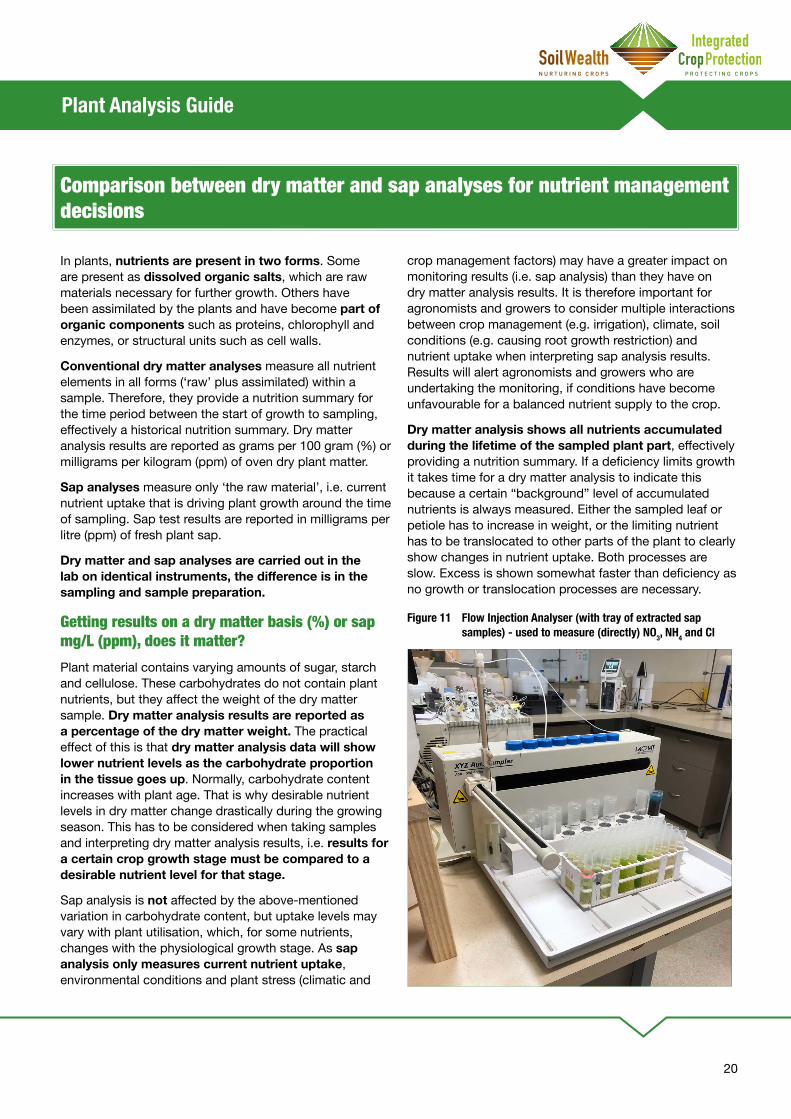
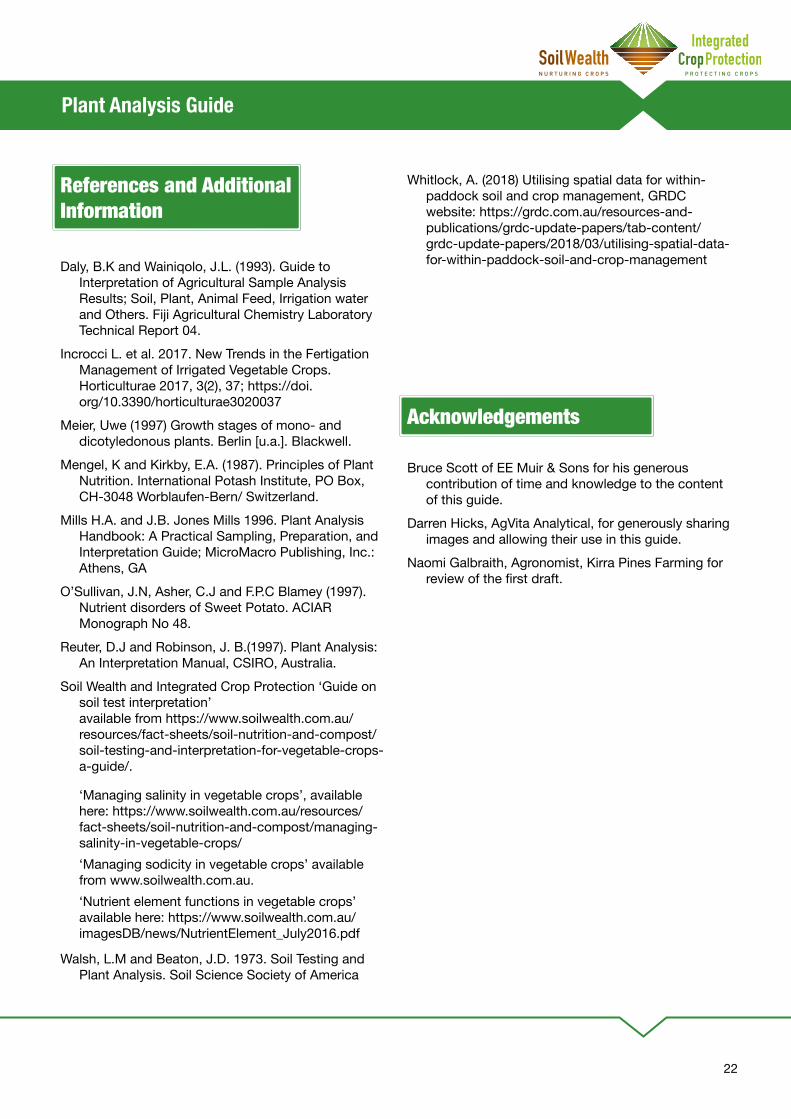
Figure 10 Inductively Coupled Plasma Spectrometry (ICP) instrument used for both dry matter and sap analysis - top full ICP set up, middle automated sampling, bottom ICP analysis (images courtesy of AgVita Analytical)
Plant Analysis Guide
20
In plants, nutrients are present in two forms. Some are present as dissolved organic salts, which are raw materials necessary for further growth. Others have been assimilated by the plants and have become part of organic components such as proteins, chlorophyll and enzymes, or structural units such as cell walls.
Conventional dry matter analyses measure all nutrient elements in all forms (‘raw’ plus assimilated) within a sample. Therefore, they provide a nutrition summary for the time period between the start of growth to sampling, effectively a historical nutrition summary. Dry matter analysis results are reported as grams per 100 gram (%) or milligrams per kilogram (ppm) of oven dry plant matter.
Sap analyses measure only ‘the raw material’, i.e. current nutrient uptake that is driving plant growth around the time of sampling. Sap test results are reported in milligrams per litre (ppm) of fresh plant sap.
Dry matter and sap analyses are carried out in the labonidenticalinstruments,thedifferenceisinthesampling and sample preparation.
Getting results on a dry matter basis (%) or sap mg/L (ppm), does it matter?Plant material contains varying amounts of sugar, starch and cellulose. These carbohydrates do not contain plant nutrients, but they affect the weight of the dry matter sample. Dry matter analysis results are reported as a percentage of the dry matter weight. The practical effect of this is that dry matter analysis data will show lower nutrient levels as the carbohydrate proportion in the tissue goes up. Normally, carbohydrate content increases with plant age. That is why desirable nutrient levels in dry matter change drastically during the growing season. This has to be considered when taking samples and interpreting dry matter analysis results, i.e. results for a certain crop growth stage must be compared to a desirable nutrient level for that stage.
Sap analysis is not affected by the above-mentioned variation in carbohydrate content, but uptake levels may vary with plant utilisation, which, for some nutrients, changes with the physiological growth stage. As sap analysis only measures current nutrient uptake, environmental conditions and plant stress (climatic and
crop management factors) may have a greater impact on monitoring results (i.e. sap analysis) than they have on dry matter analysis results. It is therefore important for agronomists and growers to consider multiple interactions between crop management (e.g. irrigation), climate, soil conditions (e.g. causing root growth restriction) and nutrient uptake when interpreting sap analysis results. Results will alert agronomists and growers who are undertaking the monitoring, if conditions have become unfavourable for a balanced nutrient supply to the crop.
Dry matter analysis shows all nutrients accumulated during the lifetime of the sampled plant part, effectively providing a nutrition summary. If a deficiency limits growth it takes time for a dry matter analysis to indicate this because a certain “background” level of accumulated nutrients is always measured. Either the sampled leaf or petiole has to increase in weight, or the limiting nutrient has to be translocated to other parts of the plant to clearly show changes in nutrient uptake. Both processes are slow. Excess is shown somewhat faster than deficiency as no growth or translocation processes are necessary.
Comparison between dry matter and sap analyses for nutrient management decisions
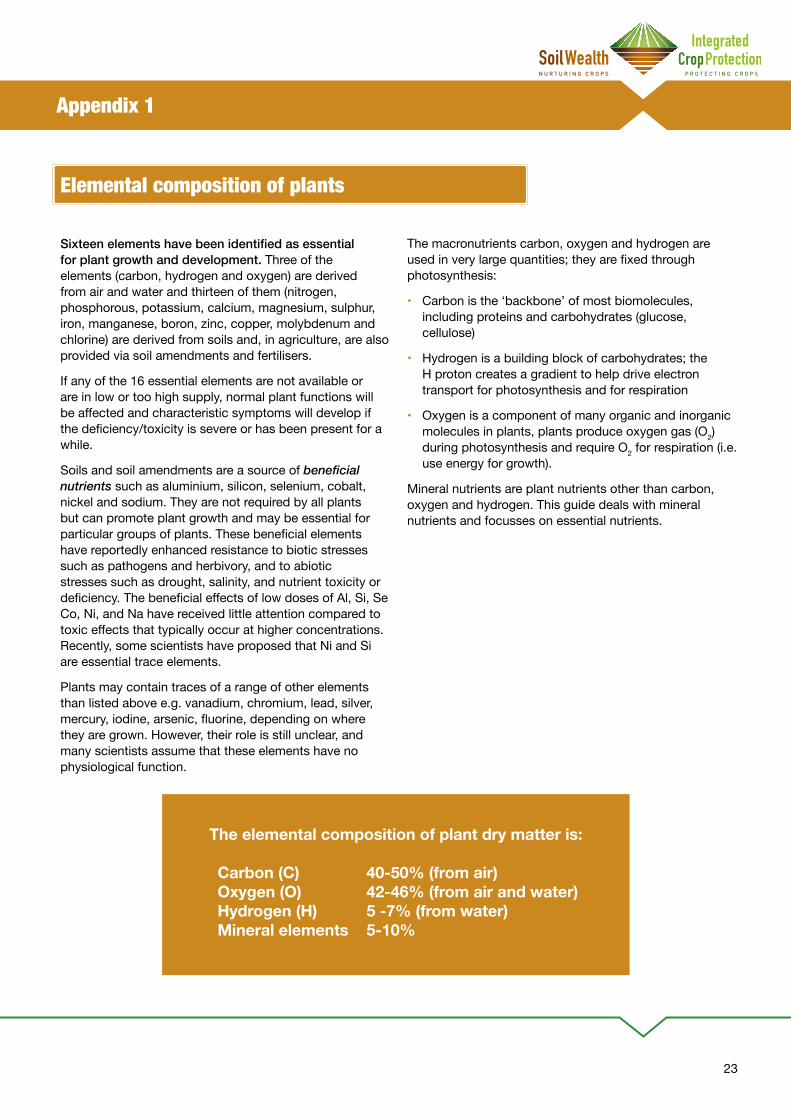
Figure 11 Flow Injection Analyser (with tray of extracted sap samples) - used to measure (directly) NO3, NH4 and Cl

Plant Analysis Guide
21
Sap analysis measures only the current nutrient status of a crop. Both deficienciesandexcessesare shown by the analysis within a short time of the change in uptake. Reaction to nutrient application can be monitored effectively by post application sap analysis. For an experienced user of the technology the odds are high that a treatment has a predictable, positive effect on yield and quality. Nutrient uptake ratios give an insight into uptake conditions in the root zone around the time of sampling. A sap brix test in addition to nutrients, gives information on the crop’s carbohydrate production and thus energy level.
Forcorrectevaluationofeitheranalysisresult,attention must be paid to ratios between elements as well as absolute levels (see Interpretation of Results section, page 16 onwards). Still, the two analytical methods are completely different. Experiences from one method must be applied to the other with caution.
References and desirable rangesMost worldwide references are for dry matter analysis. However, some of these references are quite old and do not relate to current local yield levels, varieties and rootstocks. For a crop that does not follow ‘normal’ development, references for dry matter analysis may be misleading.
A wide range of crop and environment specific sap analysis references exists for Australian conditions. These are reviewed and fine-tuned annually. These references (desirable level ranges) have mostly been developed by laboratories, usually in cooperation with agronomists and plant nutrition specialists. Data covers vegetative plant parts as well as fruit, tubers or bulbs for some vegetables. Laboratories offering sap analysis provide desirable levels and information on how they have been arrived at to their clients.
Plant Analysis Guide
22
References and Additional Information
Daly, B.K and Wainiqolo, J.L. (1993). Guide to Interpretation of Agricultural Sample Analysis Results; Soil, Plant, Animal Feed, Irrigation water and Others. Fiji Agricultural Chemistry Laboratory Technical Report 04.
Incrocci L. et al. 2017. New Trends in the Fertigation Management of Irrigated Vegetable Crops. Horticulturae 2017, 3(2), 37; https://doi.org/10.3390/horticulturae3020037
Meier, Uwe (1997) Growth stages of mono- and dicotyledonous plants. Berlin [u.a.]. Blackwell.
Mengel, K and Kirkby, E.A. (1987). Principles of Plant Nutrition. International Potash Institute, PO Box, CH-3048 Worblaufen-Bern/ Switzerland.
Mills H.A. and J.B. Jones Mills 1996. Plant Analysis Handbook: A Practical Sampling, Preparation, and Interpretation Guide; MicroMacro Publishing, Inc.: Athens, GA
O’Sullivan, J.N, Asher, C.J and F.P.C Blamey (1997). Nutrient disorders of Sweet Potato. ACIAR Monograph No 48.
Reuter, D.J and Robinson, J. B.(1997). Plant Analysis: An Interpretation Manual, CSIRO, Australia.
Soil Wealth and Integrated Crop Protection ‘Guide on soil test interpretation’ available from https://www.soilwealth.com.au/resources/fact-sheets/soil-nutrition-and-compost/soil-testing-and-interpretation-for-vegetable-crops-a-guide/.
‘Managing salinity in vegetable crops’, available here: https://www.soilwealth.com.au/resources/fact-sheets/soil-nutrition-and-compost/managing-salinity-in-vegetable-crops/
‘Managing sodicity in vegetable crops’ available from www.soilwealth.com.au.
‘Nutrient element functions in vegetable crops’ available here: https://www.soilwealth.com.au/imagesDB/news/NutrientElement_July2016.pdf
Walsh, L.M and Beaton, J.D. 1973. Soil Testing and Plant Analysis. Soil Science Society of America
Acknowledgements
Bruce Scott of EE Muir & Sons for his generous contribution of time and knowledge to the content of this guide.
Darren Hicks, AgVita Analytical, for generously sharing images and allowing their use in this guide.
Naomi Galbraith, Agronomist, Kirra Pines Farming for review of the first draft.
Whitlock, A. (2018) Utilising spatial data for within-paddock soil and crop management, GRDC website: https://grdc.com.au/resources-and-publications/grdc-update-papers/tab-content/grdc-update-papers/2018/03/utilising-spatial-data-for-within-paddock-soil-and-crop-management
23
Appendix 1 Elemental composition of plants
Elemental composition of plants
Sixteen elements have been identified as essential for plant growth and development. Three of the elements (carbon, hydrogen and oxygen) are derived from air and water and thirteen of them (nitrogen, phosphorous, potassium, calcium, magnesium, sulphur, iron, manganese, boron, zinc, copper, molybdenum and chlorine) are derived from soils and, in agriculture, are also provided via soil amendments and fertilisers.
If any of the 16 essential elements are not available or are in low or too high supply, normal plant functions will be affected and characteristic symptoms will develop if the deficiency/toxicity is severe or has been present for a while.
Soils and soil amendments are a source of beneficial nutrients such as aluminium, silicon, selenium, cobalt, nickel and sodium. They are not required by all plants but can promote plant growth and may be essential for particular groups of plants. These beneficial elements have reportedly enhanced resistance to biotic stresses such as pathogens and herbivory, and to abiotic stresses such as drought, salinity, and nutrient toxicity or deficiency. The beneficial effects of low doses of Al, Si, Se Co, Ni, and Na have received little attention compared to toxic effects that typically occur at higher concentrations. Recently, some scientists have proposed that Ni and Si are essential trace elements.
Plants may contain traces of a range of other elements than listed above e.g. vanadium, chromium, lead, silver, mercury, iodine, arsenic, fluorine, depending on where they are grown. However, their role is still unclear, and many scientists assume that these elements have no physiological function.
The macronutrients carbon, oxygen and hydrogen are used in very large quantities; they are fixed through photosynthesis:
• Carbon is the ‘backbone’ of most biomolecules, including proteins and carbohydrates (glucose, cellulose)
• Hydrogen is a building block of carbohydrates; the H proton creates a gradient to help drive electron transport for photosynthesis and for respiration
• Oxygen is a component of many organic and inorganic molecules in plants, plants produce oxygen gas (O2) during photosynthesis and require O2 for respiration (i.e. use energy for growth).
Mineral nutrients are plant nutrients other than carbon, oxygen and hydrogen. This guide deals with mineral nutrients and focusses on essential nutrients.
The elemental composition of plant dry matter is:
Carbon(C) 40-50%(fromair) Oxygen(O) 42-46%(fromairandwater) Hydrogen(H) 5-7%(fromwater) Mineralelements 5-10%
24
Appendix 2 Nutrient functions & interactions
Nutrient functions & interactions
Nutrient functions Refer to https://www.soilwealth.com.au/resources/fact-sheets/nutrient-element-functions-in-vegetable-crops-/
Nutrient interactionsMany scientists have tried to clarify the complicated relationships between nutrients. Some of these relationships are straight forward but, most are not. A few examples from agricultural laboratory research and field based experiments have shown the below relationships.
Antagonistic nutrients A nutrient that is at excessive levels in the soil or soil solution can affect the uptake of other nutrients via ion competition. Major antagonists are shown in bold.
Synergistic nutrients Synergism is where the optimum availability of one nutrient generally supports the uptake of other nutrients.
Nutrient fixingNutrients can become unavailable when added as fertiliser to soils. This is called nutrient fixing. Nutrient fixing can be a biological or chemical process. Fixed nutrients are not available for uptake but can be made available via chemical or microbiological reactions.
Phosphorus can be fixed via freely available calcium in the soil solution, typically in soils with pH > 7 (alkaline soils). Phosphorus can be fixed via available iron and aluminium in the soil solution, typically in soils with pH < 6 (acidic soils).
Nitrogen can be fixed when microbes absorb it to build their body mass. This typically occurs when the carbon to nitrogen (C:N) ratio is high i.e. there is a large amount of carbon in the organic matter they are using as a nutrient source, compared to nitrogen. Once the C:N ration exceed 20:1, nitrogen fixing can be expected.
Excess Imbalance / Reduced uptake
N S, Cu / P, K, Fe, Ca, Mg Fe, Mn, ZnNH4 all cationsP Zn, Fe, Mn, CuK Mg, Ca Ca FeCa & Mg KS SeZn MnMo CuCl NO3
Na K, (Ca, Mg)
In principle all trace metals elements compete
Optimum Ensures good uptake of
N K also P, Mg, Fe, Mn and ZnCa & Zn P, KS Mn, ZnMn CuCu & B NMo P, N utilisation (in plant)
25
Appendix 3 Nutrient deficiency and toxicity symptoms
Nutrient deficiency and toxicity symptoms
Growers, agronomists and scientists for generations have used visual symptoms to identify nutrient deficiencies. However, waiting for deficiencies means that the crop will not grow to its full potential. Still, symptoms can be observed at times.
General deficiency symptoms include stunted growth, chlorosis, interveinal chlorosis, purple or red discoloration and necrosis. Deficiencies of mobile nutrients first appear in older, lower leaves, whereas deficiencies of immobile nutrients will occur in younger, upper leaves. Nutrient toxicity is most often the result of over-application, with symptoms including abnormal growth (excessive or stunted), chlorosis, leaf discoloration and necrotic spotting. When in excess, many nutrients will inhibit the uptake of other nutrients, thus potentially causing deficiency symptoms to occur as well.
• Deficiencysymptomsonolderleavesmeanthatamobileelement(N,P,K,Mg,Mn)isinshortsupply.
• Deficiencysymptomsonyoungleavesmeanthatanimmobileelement(Ca,S,Fe,Cu,Zn,B,Mo)isinshort supply.
Diagnosing high value crops via symptoms is flawed. Once a deficiency is visible, the crop has been set back in development and this set back cannot be recovered, even if the symptoms can be alleviated.
Symptoms of poor growth or abnormalities in leaf colour are hard to interpret. A number of factors other than low nutrients can cause similar symptoms to a lack of nutrients.
Precautions in identifying nutrient stress or deficiency symptoms are summarised in the following:
• Many symptoms appear similar. For instance, Mn and Fe deficiency symptoms can look very alike, S and N deficiency look similar depending upon plant growth stage and severity of deficiencies.
• An oversupply of one nutrient can disguise a deficiency in another e.g. a plant high in magnesium looks green, even if low in nitrogen.
• Multiple deficiencies and/or toxicities can occur at the same time. More than one deficiency or toxicity
can produce symptoms, or possibly an abundance of one nutrient can induce the deficiency of another (e.g. excessive P causing Zn deficiency).
• Crop species, and even some cultivars of the same species, differ in their ability to adapt to nutrient deficiencies and toxicities. For example, corn is typically sensitive to a Zn deficiency.
• Pseudo (false) deficiency symptoms (visual symptoms appearing similar to nutrient deficiency symptoms). Potential factors causing pseudo deficiency include, but are not limited to: disease, drought, excess water, genetic abnormalities, herbicide and pesticide residues, insects, soil compaction, moisture stress, high salinity, herbicide damage or disease caused by bacteria, fungi or viruses.
• ‘Hidden hunger’; plants may be nutrient deficient without showing visual clues.
• Field symptoms appear different than ‘ideal’ symptoms. Many of the plant deficiency symptoms shown in photographs were grown under controlled nutrient conditions with just one nutrient in low supply; and deficiency/toxicity symptoms observed in the field may or may not appear as they do in photos. Experience and knowledge of field history are excellent aids in determining causes for nutrient stress.
• Betweenthetimeaplantisnutrientdeficient(hiddenhunger)andvisualsymptomsappear,crop health and productivity may be substantially reduced, and corrective actions may or may not be effective.
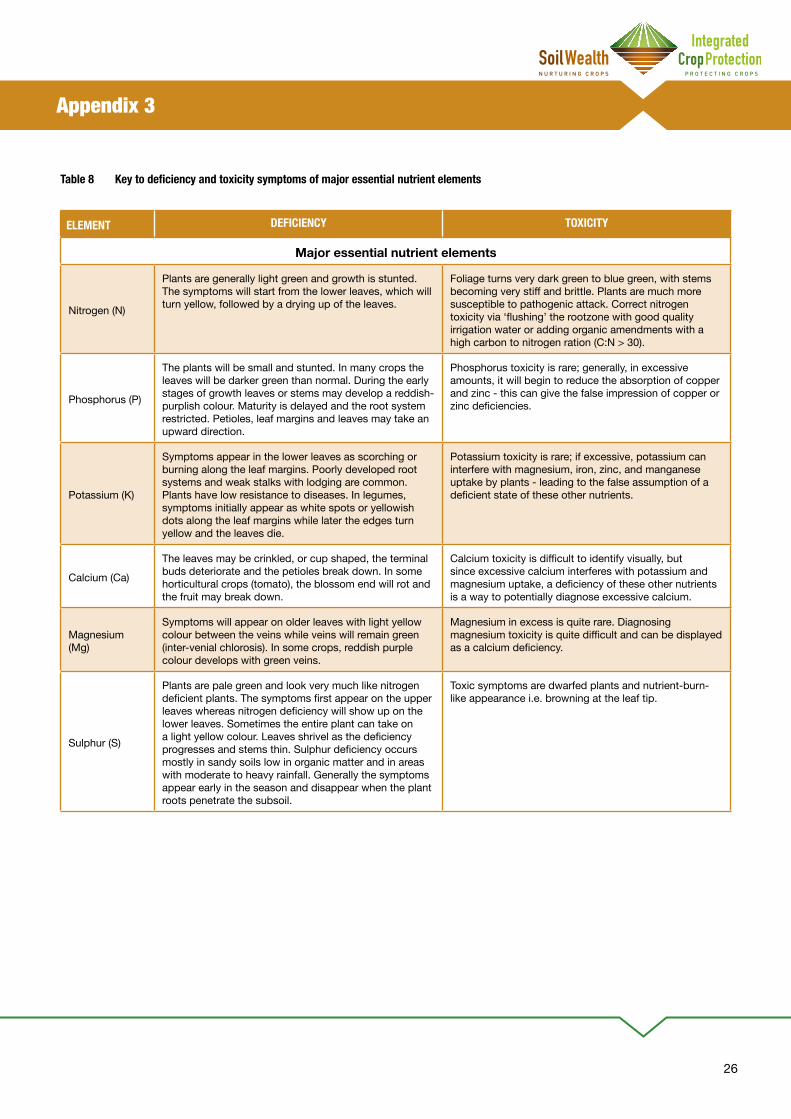
For those who like a general guide to deficiency and toxicity symptoms that you never want to see, a list is provided below in Tables 8 and 9.
26
ELEMENT DEFICIENCY TOXICITY
Major essential nutrient elements
Nitrogen (N)
Plants are generally light green and growth is stunted. The symptoms will start from the lower leaves, which will turn yellow, followed by a drying up of the leaves.
Foliage turns very dark green to blue green, with stems becoming very stiff and brittle. Plants are much more susceptible to pathogenic attack. Correct nitrogen toxicity via ‘flushing’ the rootzone with good quality irrigation water or adding organic amendments with a high carbon to nitrogen ration (C:N > 30).
Phosphorus (P)
The plants will be small and stunted. In many crops the leaves will be darker green than normal. During the early stages of growth leaves or stems may develop a reddish- purplish colour. Maturity is delayed and the root system restricted. Petioles, leaf margins and leaves may take an upward direction.
Phosphorus toxicity is rare; generally, in excessive amounts, it will begin to reduce the absorption of copper and zinc - this can give the false impression of copper or zinc deficiencies.
Potassium (K)
Symptoms appear in the lower leaves as scorching or burning along the leaf margins. Poorly developed root systems and weak stalks with lodging are common. Plants have low resistance to diseases. In legumes, symptoms initially appear as white spots or yellowish dots along the leaf margins while later the edges turn yellow and the leaves die.
Potassium toxicity is rare; if excessive, potassium can interfere with magnesium, iron, zinc, and manganese uptake by plants - leading to the false assumption of a deficient state of these other nutrients.
Calcium (Ca)
The leaves may be crinkled, or cup shaped, the terminal buds deteriorate and the petioles break down. In some horticultural crops (tomato), the blossom end will rot and the fruit may break down.
Calcium toxicity is difficult to identify visually, but since excessive calcium interferes with potassium and magnesium uptake, a deficiency of these other nutrients is a way to potentially diagnose excessive calcium.
Magnesium (Mg)
Symptoms will appear on older leaves with light yellow colour between the veins while veins will remain green (inter-venial chlorosis). In some crops, reddish purple colour develops with green veins.
Magnesium in excess is quite rare. Diagnosing magnesium toxicity is quite difficult and can be displayed as a calcium deficiency.
Sulphur (S)
Plants are pale green and look very much like nitrogen deficient plants. The symptoms first appear on the upper leaves whereas nitrogen deficiency will show up on the lower leaves. Sometimes the entire plant can take on a light yellow colour. Leaves shrivel as the deficiency progresses and stems thin. Sulphur deficiency occurs mostly in sandy soils low in organic matter and in areas with moderate to heavy rainfall. Generally the symptoms appear early in the season and disappear when the plant roots penetrate the subsoil.
Toxic symptoms are dwarfed plants and nutrient-burn-like appearance i.e. browning at the leaf tip.
Table 8 Key to deficiency and toxicity symptoms of major essential nutrient elements
Appendix 3
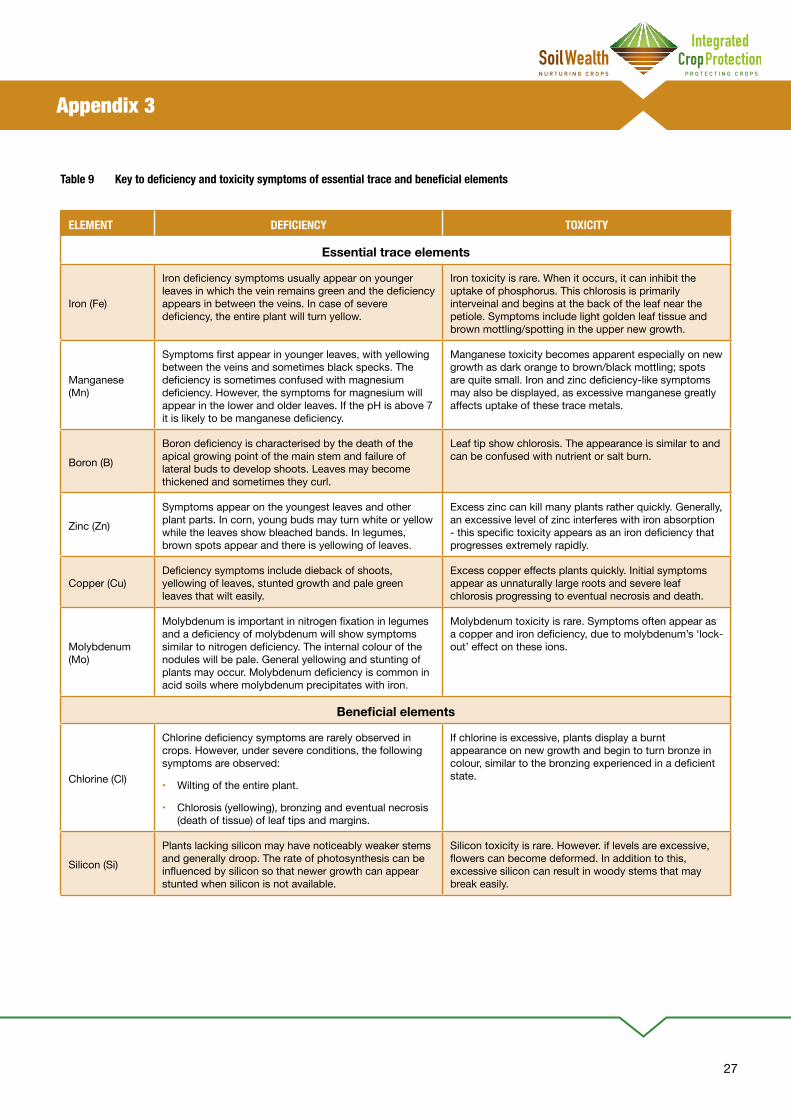
27
ELEMENT DEFICIENCY TOXICITY
Essentialtraceelements
Iron (Fe)
Iron deficiency symptoms usually appear on younger leaves in which the vein remains green and the deficiency appears in between the veins. In case of severe deficiency, the entire plant will turn yellow.
Iron toxicity is rare. When it occurs, it can inhibit the uptake of phosphorus. This chlorosis is primarily interveinal and begins at the back of the leaf near the petiole. Symptoms include light golden leaf tissue and brown mottling/spotting in the upper new growth.
Manganese (Mn)
Symptoms first appear in younger leaves, with yellowing between the veins and sometimes black specks. The deficiency is sometimes confused with magnesium deficiency. However, the symptoms for magnesium will appear in the lower and older leaves. If the pH is above 7 it is likely to be manganese deficiency.
Manganese toxicity becomes apparent especially on new growth as dark orange to brown/black mottling; spots are quite small. Iron and zinc deficiency-like symptoms may also be displayed, as excessive manganese greatly affects uptake of these trace metals.
Boron (B)
Boron deficiency is characterised by the death of the apical growing point of the main stem and failure of lateral buds to develop shoots. Leaves may become thickened and sometimes they curl.
Leaf tip show chlorosis. The appearance is similar to and can be confused with nutrient or salt burn.
Zinc (Zn)
Symptoms appear on the youngest leaves and other plant parts. In corn, young buds may turn white or yellow while the leaves show bleached bands. In legumes, brown spots appear and there is yellowing of leaves.
Excess zinc can kill many plants rather quickly. Generally, an excessive level of zinc interferes with iron absorption - this specific toxicity appears as an iron deficiency that progresses extremely rapidly.
Copper (Cu)Deficiency symptoms include dieback of shoots, yellowing of leaves, stunted growth and pale green leaves that wilt easily.
Excess copper effects plants quickly. Initial symptoms appear as unnaturally large roots and severe leaf chlorosis progressing to eventual necrosis and death.
Molybdenum (Mo)
Molybdenum is important in nitrogen fixation in legumes and a deficiency of molybdenum will show symptoms similar to nitrogen deficiency. The internal colour of the nodules will be pale. General yellowing and stunting of plants may occur. Molybdenum deficiency is common in acid soils where molybdenum precipitates with iron.
Molybdenum toxicity is rare. Symptoms often appear as a copper and iron deficiency, due to molybdenum’s ‘lock-out’ effect on these ions.
Beneficialelements
Chlorine (Cl)
Chlorine deficiency symptoms are rarely observed in crops. However, under severe conditions, the following symptoms are observed:
• Wilting of the entire plant.
• Chlorosis (yellowing), bronzing and eventual necrosis (death of tissue) of leaf tips and margins.
If chlorine is excessive, plants display a burnt appearance on new growth and begin to turn bronze in colour, similar to the bronzing experienced in a deficient state.
Silicon (Si)
Plants lacking silicon may have noticeably weaker stems and generally droop. The rate of photosynthesis can be influenced by silicon so that newer growth can appear stunted when silicon is not available.
Silicon toxicity is rare. However. if levels are excessive, flowers can become deformed. In addition to this, excessive silicon can result in woody stems that may break easily.
Table 9 Key to deficiency and toxicity symptoms of essential trace and beneficial elements
Appendix 3
28
Appendix 4 Nutrient uptake over time
Nutrient uptake over time
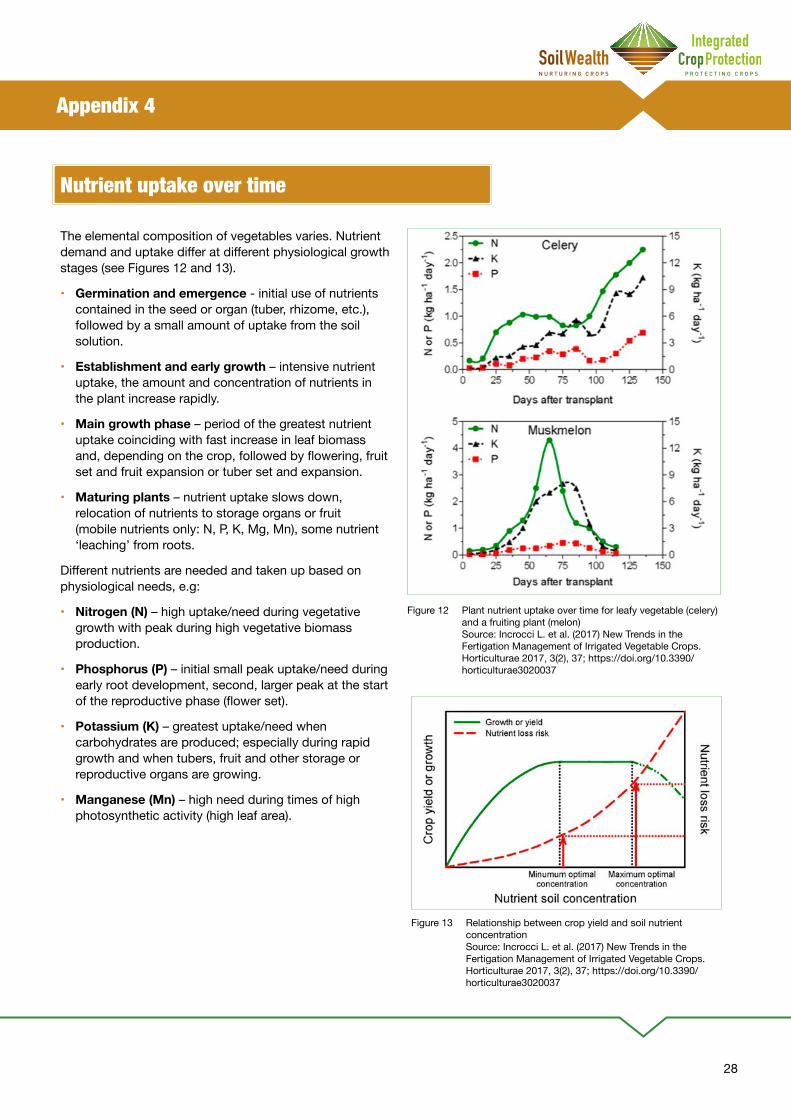
The elemental composition of vegetables varies. Nutrient demand and uptake differ at different physiological growth stages (see Figures 12 and 13).
• Germination and emergence - initial use of nutrients contained in the seed or organ (tuber, rhizome, etc.), followed by a small amount of uptake from the soil solution.
• Establishmentandearlygrowth – intensive nutrient uptake, the amount and concentration of nutrients in the plant increase rapidly.
• Main growth phase – period of the greatest nutrient uptake coinciding with fast increase in leaf biomass and, depending on the crop, followed by flowering, fruit set and fruit expansion or tuber set and expansion.
• Maturing plants – nutrient uptake slows down, relocation of nutrients to storage organs or fruit (mobile nutrients only: N, P, K, Mg, Mn), some nutrient ‘leaching’ from roots.
Different nutrients are needed and taken up based on physiological needs, e.g:
• Nitrogen(N) – high uptake/need during vegetative growth with peak during high vegetative biomass production.
• Phosphorus(P) – initial small peak uptake/need during early root development, second, larger peak at the start of the reproductive phase (flower set).
• Potassium(K) – greatest uptake/need when carbohydrates are produced; especially during rapid growth and when tubers, fruit and other storage or reproductive organs are growing.
• Manganese(Mn) – high need during times of high photosynthetic activity (high leaf area).
Figure 12 Plant nutrient uptake over time for leafy vegetable (celery) and a fruiting plant (melon) Source: Incrocci L. et al. (2017) New Trends in the Fertigation Management of Irrigated Vegetable Crops. Horticulturae 2017, 3(2), 37; https://doi.org/10.3390/horticulturae3020037
Figure 13 Relationship between crop yield and soil nutrient concentration Source: Incrocci L. et al. (2017) New Trends in the Fertigation Management of Irrigated Vegetable Crops. Horticulturae 2017, 3(2), 37; https://doi.org/10.3390/horticulturae3020037

29
Appendix 5 Sample information
Sample information
A. Personal details:
Name: ____________________________________________ Telephone: ______________________
Address: __________________________________________________________________
Facsimile: ______________________ E-mail address ____________________________________________
Name of the person /organization who took the sample ____________________________________________
Has this area been sampled previously? Yes ( ) No ( )
Name of the farm/ block/ experiment ____________________________________________
Nearest Town or Locality of the farm (District, Census Division) ____________________________________________
Date of sampling ______________________
Person(s) to send results to (e-mail address) ____________________________________________________________
Person to send invoices to (email address) _____________________________________________________________
B. Site Details
Block/Farm size (hectares) Drainage Topography Rainfall (annual, mm)
Under one hectare ( ) Poor ( ) Flat ( ) Under 1500 ( )
1-5 hectares ( ) Average ( ) Slope ( ) 1500-2500 ( )
6-20 hectares ( ) Good ( ) Hilly ( ) 2500-4000 ( )
over 20 hectares ( ) above 4000 ( )
C. Sample Description:
Crop ______________________ Species ______________________ Variety ______________________
Age/ Date sown ______________________ Previous crop ______________________
Stage of Growth: Seedling ( ) Vegetative ( ) Flowering ( ) Harvest/Fruiting ( )
Other
Plant part submitted : Whole plant ( ) Leaf Blade ( ) Stems ( ) Petiole ( ) Fruit ( )
Description of crop symptoms if any : __________________________________________________________________
Are the symptoms on: Old leaves ( ) Young leaves ( ) Terminal new leaves ( )
Has the crop been subjected to: Waterlogging ( ) Drought ( ) Pests ( ) Diseases ( ) Wind ( ) Heat ( )
Other ______________________
If yes describe the situation or symptoms:
How do you rate the crop vigour ? Good ( ) Average ( ) Poor ( ) and Even ( ) Uneven ( )

30
D.Croprotationandblockhistoryforthelastfiveyears:
Year: ______________________
Rotation: ______________________
Crop Yield: is Good ( ) Average ( ) Poor ( )
Fertiliser inputs ______________________
Soil amendments used ______________________
Any other information you think may be useful: ________________________________________________________________
Appendix 5

31Hort Innovation, Applied Horticultural Research Pty Ltd (AHR) and RM Consulting Group (RMCG) make no representations and expressly disclaims all warranties (to the extent permitted by law) about the accuracy, completeness, or currency of information in this fact sheet. Users of this material should take independent action before relying on it’s accuracy in any way. Reliance on any information provided by Hort Innovation, AHR or RMCG is entirely at your own risk. Hort Innovation, AHR or RMCG are not responsible for, and will not be liable for, any loss, damage, claim, expense, cost (including legal costs) or other liability arising in any way (including from Hort Innovation, AHR, RMCG or any other person’s negligence or otherwise) from your use or non-use of information from project VG16078 - Soil Wealth and Integrated Crop Protection - Phase 2 or from reliance on information contained in this material or that Hort Innovation, AHR or RMCG provides to you by any other means.