Estimation of sampling uncertainty for pesticide residues in root vegetable crops
15
This article was downloaded by: [Zsuzsa Farkas] On: 20 October 2013, At: 12:13 Publisher: Taylor & Francis Informa Ltd Registered in England and Wales Registered Number: 1072954 Registered office: Mortimer House, 37-41 Mortimer Street, London W1T 3JH, UK Journal of Environmental Science and Health, Part B: Pesticides, Food Contaminants, and Agricultural Wastes Publication details, including instructions for authors and subscription information: http://www.tandfonline.com/loi/lesb20 Estimation of sampling uncertainty for pesticide residues in root vegetable crops Zsuzsa Farkas a , Zsuzsanna Horváth a , Kata Kerekes a , Árpád Ambrus a , András Hámos b & Mária Szeitzné Szabó a a National Food Chain Safety Office , Directorate for Food Safety Risk Assessment , Budapest , Hungary b SynTech Research , Szombathely , Hungary To cite this article: Zsuzsa Farkas , Zsuzsanna Horváth , Kata Kerekes , Árpád Ambrus , András Hámos & Mária Szeitzné Szabó (2014) Estimation of sampling uncertainty for pesticide residues in root vegetable crops, Journal of Environmental Science and Health, Part B: Pesticides, Food Contaminants, and Agricultural Wastes, 49:1, 1-14, DOI: 10.1080/03601234.2013.836851 To link to this article: http://dx.doi.org/10.1080/03601234.2013.836851 PLEASE SCROLL DOWN FOR ARTICLE Taylor & Francis makes every effort to ensure the accuracy of all the information (the “Content”) contained in the publications on our platform. However, Taylor & Francis, our agents, and our licensors make no representations or warranties whatsoever as to the accuracy, completeness, or suitability for any purpose of the Content. Any opinions and views expressed in this publication are the opinions and views of the authors, and are not the views of or endorsed by Taylor & Francis. The accuracy of the Content should not be relied upon and should be independently verified with primary sources of information. Taylor and Francis shall not be liable for any losses, actions, claims, proceedings, demands, costs, expenses, damages, and other liabilities whatsoever or howsoever caused arising directly or indirectly in connection with, in relation to or arising out of the use of the Content. This article may be used for research, teaching, and private study purposes. Any substantial or systematic reproduction, redistribution, reselling, loan, sub-licensing, systematic supply, or distribution in any form to anyone is expressly forbidden. Terms & Conditions of access and use can be found at http:// www.tandfonline.com/page/terms-and-conditions
-
Upload
independent -
Category
Documents
-
view
1 -
download
0
Transcript of Estimation of sampling uncertainty for pesticide residues in root vegetable crops
This article was downloaded by: [Zsuzsa Farkas]On: 20 October 2013, At: 12:13Publisher: Taylor & FrancisInforma Ltd Registered in England and Wales Registered Number: 1072954 Registered office: Mortimer House,37-41 Mortimer Street, London W1T 3JH, UK
Journal of Environmental Science and Health, Part B:Pesticides, Food Contaminants, and Agricultural WastesPublication details, including instructions for authors and subscription information:http://www.tandfonline.com/loi/lesb20
Estimation of sampling uncertainty for pesticideresidues in root vegetable cropsZsuzsa Farkas a , Zsuzsanna Horváth a , Kata Kerekes a , Árpád Ambrus a , András Hámos b &Mária Szeitzné Szabó aa National Food Chain Safety Office , Directorate for Food Safety Risk Assessment ,Budapest , Hungaryb SynTech Research , Szombathely , Hungary
To cite this article: Zsuzsa Farkas , Zsuzsanna Horváth , Kata Kerekes , Árpád Ambrus , András Hámos & Mária Szeitzné Szabó(2014) Estimation of sampling uncertainty for pesticide residues in root vegetable crops, Journal of Environmental Scienceand Health, Part B: Pesticides, Food Contaminants, and Agricultural Wastes, 49:1, 1-14, DOI: 10.1080/03601234.2013.836851
To link to this article: http://dx.doi.org/10.1080/03601234.2013.836851
PLEASE SCROLL DOWN FOR ARTICLE
Taylor & Francis makes every effort to ensure the accuracy of all the information (the “Content”) containedin the publications on our platform. However, Taylor & Francis, our agents, and our licensors make norepresentations or warranties whatsoever as to the accuracy, completeness, or suitability for any purpose of theContent. Any opinions and views expressed in this publication are the opinions and views of the authors, andare not the views of or endorsed by Taylor & Francis. The accuracy of the Content should not be relied upon andshould be independently verified with primary sources of information. Taylor and Francis shall not be liable forany losses, actions, claims, proceedings, demands, costs, expenses, damages, and other liabilities whatsoeveror howsoever caused arising directly or indirectly in connection with, in relation to or arising out of the use ofthe Content.
This article may be used for research, teaching, and private study purposes. Any substantial or systematicreproduction, redistribution, reselling, loan, sub-licensing, systematic supply, or distribution in anyform to anyone is expressly forbidden. Terms & Conditions of access and use can be found at http://www.tandfonline.com/page/terms-and-conditions

Journal of Environmental Science and Health, Part B (2014) 49, 1–14Copyright C© Taylor & Francis Group, LLCISSN: 0360-1234 (Print); 1532-4109 (Online)DOI: 10.1080/03601234.2013.836851
Estimation of sampling uncertainty for pesticide residuesin root vegetable crops
ZSUZSA FARKAS1, ZSUZSANNA HORVATH1, KATA KEREKES1, ARPAD AMBRUS1,ANDRAS HAMOS2 and MARIA SZEITZNE SZABO1
1National Food Chain Safety Office, Directorate for Food Safety Risk Assessment, Budapest, Hungary2SynTech Research, Szombathely, Hungary
The sampling uncertainty for pesticide residues in carrots, parsley leaves and selected medium size crops was estimated with simplerandom sampling by applying range statistics. The primary samples taken from treated fields consisted of individual carrots or ahandful of parsley leaves. The samples were analysed with QUEChERs extraction method and LCMS/MS detection with practicalLOQ of 0.001 mg/kg. The results indicate that the average sampling uncertainties estimated with simple random sampling andrange statistics were practically the same. The confidence interval for the estimated sampling uncertainty decreased with the numberof replicate samples taken from one lot and the number of lots sampled. The estimated relative ranges of sampling uncertainty areindependent from the relative standard deviation of the primary samples. Consequently the conclusions drawn from these experimentsare generally applicable. There is no optimum for sample size and number of lots to be tested for estimation of sampling uncertainty.Taking a minimum of 6 replicate samples from at least 8–12 lots is recommended to obtain a relative 95% range of samplinguncertainty within 50%. The cost of sampling/analyses, the consequences of wrong decision should also be taken into account whena sampling plan is prepared.
Keywords: Uncertainty of sampling, range statistics, simple random sampling.
Introduction
Elaboration of statistically based sampling plans for controlof food requires information on the distribution of residueswithin a lot/batch of a commodity and how this distri-bution varies between lots. The distribution of pesticideresidues varies to a large extent within individual trees [1,2]
and plots,[3,4] and between treated fields.[5,6] The environ-mental and weather conditions,[7,9] agro-technology,[10,11]
pesticide application methods [12,13] are considered to bethe major factors affecting the initial deposit and thedistribution of pesticides residues. There are a numberof publications reporting the distribution of pesticideresidues in individual fruits (apple, banana, kiwi, orange,peach, pear, plum) and medium-size vegetables (potato andtomato),[4,14–16] small and large crops, and leafy vegetables(cabbage, kale, chicory),[17–20] lettuce and grape.[21]
The relative sampling uncertainties were estimated [22,23]
based on over 20000 residue data obtained from some of
Address correspondence to Zsuzsa Farkas, National FoodSafety Office, Directorate for Food Safety Risk Assess-ment, Tabornok Street 2, Budapest 1143, Hungary; E-mail:[email protected] June 11, 2013.
the above-mentioned studies.[3,4,14,17,21] Composite sampleswere drawn by applying random sampling with replace-ment, which corresponded to the sample sizes specified bythe Codex [24] and EU [25] sampling procedures. It was con-cluded that the typical sampling uncertainties expressed asthe relative standard deviation are for:
I. small and medium size crops (unit mass ≤ 250 g, min-imum sample size = 10): 25%
II. large crops (unit mass > 250 g, minimum sample size =5): 33%
III. Brassica leafy vegetables (unit mass > 250 g, minimumsample size = 5): 20%
The smaller sampling uncertainty calculated for Brassicaleafy vegetables was attributed to their more uniform spe-cial arrangements compared to trees and bush crops. How-ever, it was pointed out that the number of data sets waslimited and did not contain, for instance, root vegetablesand leafy vegetables with small leaves.
The objective of this study was to fill the information gapby conducting field trials in carrot and parsley leaves rep-resenting root vegetables and vegetables with small leaves,respectively, and to estimate the uncertainty of sampling forsuch crops, by applying simple replicate random samplingand duplicate sampling.[26]
Dow
nloa
ded
by [
Zsu
zsa
Fark
as]
at 1
2:13
20
Oct
ober
201
3
2 Farkas et al.
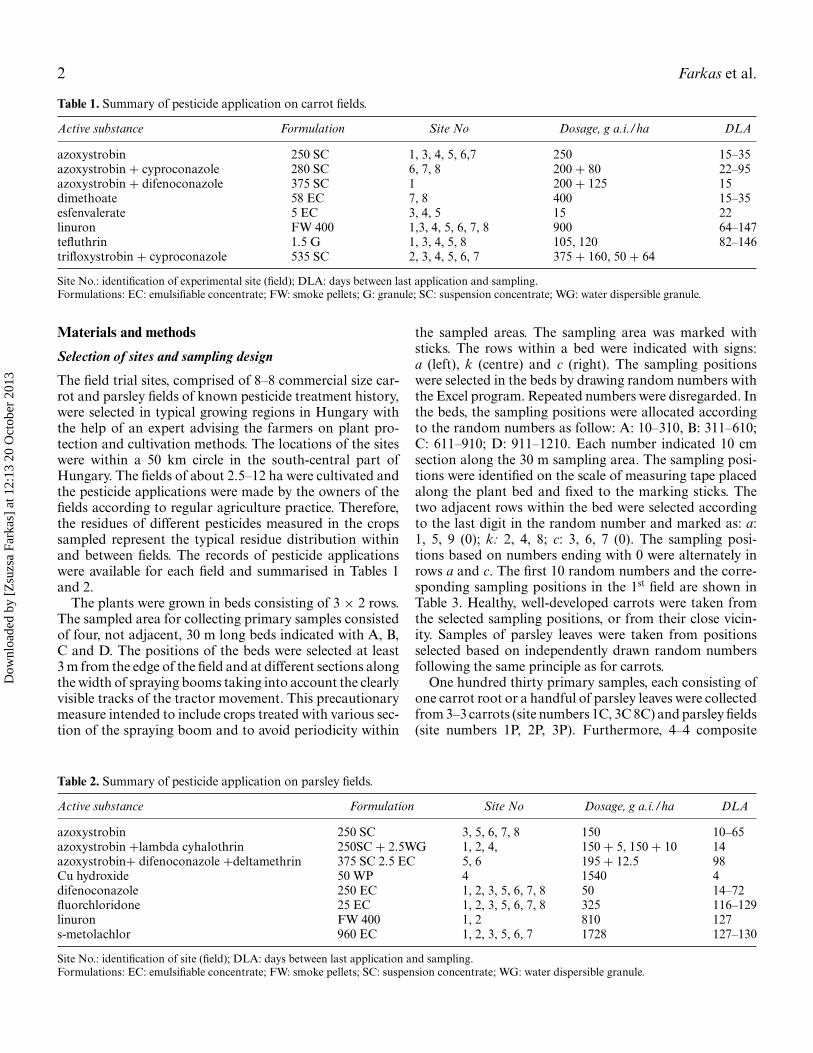
Table 1. Summary of pesticide application on carrot fields.
Active substance Formulation Site No Dosage, g a.i./ha DLA
azoxystrobin 250 SC 1, 3, 4, 5, 6,7 250 15–35azoxystrobin + cyproconazole 280 SC 6, 7, 8 200 + 80 22–95azoxystrobin + difenoconazole 375 SC 1 200 + 125 15dimethoate 58 EC 7, 8 400 15–35esfenvalerate 5 EC 3, 4, 5 15 22linuron FW 400 1,3, 4, 5, 6, 7, 8 900 64–147tefluthrin 1.5 G 1, 3, 4, 5, 8 105, 120 82–146trifloxystrobin + cyproconazole 535 SC 2, 3, 4, 5, 6, 7 375 + 160, 50 + 64
Site No.: identification of experimental site (field); DLA: days between last application and sampling.Formulations: EC: emulsifiable concentrate; FW: smoke pellets; G: granule; SC: suspension concentrate; WG: water dispersible granule.
Materials and methods
Selection of sites and sampling design
The field trial sites, comprised of 8–8 commercial size car-rot and parsley fields of known pesticide treatment history,were selected in typical growing regions in Hungary withthe help of an expert advising the farmers on plant pro-tection and cultivation methods. The locations of the siteswere within a 50 km circle in the south-central part ofHungary. The fields of about 2.5–12 ha were cultivated andthe pesticide applications were made by the owners of thefields according to regular agriculture practice. Therefore,the residues of different pesticides measured in the cropssampled represent the typical residue distribution withinand between fields. The records of pesticide applicationswere available for each field and summarised in Tables 1and 2.
The plants were grown in beds consisting of 3 × 2 rows.The sampled area for collecting primary samples consistedof four, not adjacent, 30 m long beds indicated with A, B,C and D. The positions of the beds were selected at least3 m from the edge of the field and at different sections alongthe width of spraying booms taking into account the clearlyvisible tracks of the tractor movement. This precautionarymeasure intended to include crops treated with various sec-tion of the spraying boom and to avoid periodicity within
the sampled areas. The sampling area was marked withsticks. The rows within a bed were indicated with signs:a (left), k (centre) and c (right). The sampling positionswere selected in the beds by drawing random numbers withthe Excel program. Repeated numbers were disregarded. Inthe beds, the sampling positions were allocated accordingto the random numbers as follow: A: 10–310, B: 311–610;C: 611–910; D: 911–1210. Each number indicated 10 cmsection along the 30 m sampling area. The sampling posi-tions were identified on the scale of measuring tape placedalong the plant bed and fixed to the marking sticks. Thetwo adjacent rows within the bed were selected accordingto the last digit in the random number and marked as: a:1, 5, 9 (0); k: 2, 4, 8; c: 3, 6, 7 (0). The sampling posi-tions based on numbers ending with 0 were alternately inrows a and c. The first 10 random numbers and the corre-sponding sampling positions in the 1st field are shown inTable 3. Healthy, well-developed carrots were taken fromthe selected sampling positions, or from their close vicin-ity. Samples of parsley leaves were taken from positionsselected based on independently drawn random numbersfollowing the same principle as for carrots.
One hundred thirty primary samples, each consisting ofone carrot root or a handful of parsley leaves were collectedfrom 3–3 carrots (site numbers 1C, 3C 8C) and parsley fields(site numbers 1P, 2P, 3P). Furthermore, 4–4 composite
Table 2. Summary of pesticide application on parsley fields.
Active substance Formulation Site No Dosage, g a.i./ha DLA
azoxystrobin 250 SC 3, 5, 6, 7, 8 150 10–65azoxystrobin +lambda cyhalothrin 250SC + 2.5WG 1, 2, 4, 150 + 5, 150 + 10 14azoxystrobin+ difenoconazole +deltamethrin 375 SC 2.5 EC 5, 6 195 + 12.5 98Cu hydroxide 50 WP 4 1540 4difenoconazole 250 EC 1, 2, 3, 5, 6, 7, 8 50 14–72fluorchloridone 25 EC 1, 2, 3, 5, 6, 7, 8 325 116–129linuron FW 400 1, 2 810 127s-metolachlor 960 EC 1, 2, 3, 5, 6, 7 1728 127–130
Site No.: identification of site (field); DLA: days between last application and sampling.Formulations: EC: emulsifiable concentrate; FW: smoke pellets; SC: suspension concentrate; WG: water dispersible granule.
Dow
nloa
ded
by [
Zsu
zsa
Fark
as]
at 1
2:13
20
Oct
ober
201
3

Sampling uncertainty of pesticide residues 3
Table 3. Illustration of random sampling positions.
Serial Corresponding Samplingnumber of Random position along position withinsamples number the bed [m] row [m]
1 708 708−610 = 98 8.8 C-9.8k2 813 813−610 = 203 20.3 C-20.3c3 1112 1112−910 = 202 20.2 D-20.2k4 15 15 0.1 A-0.1a5 1162 1162−910 = 252 25.2 D-25.2k6 671 671−610 = 71 6.1 C-6.1a7 604 614−610 = 4 0.1 C-0.4k8 393 393−300 = 93 9.3 B-9.3c9 65 65 6.5 A-6.5a
10 357 357−300 = 57 5.7 B-5.7c
samples were collected from each of the 8 carrot and 8parsley fields.
The leaves of carrot were cut off, the adhering sandysoil was brushed off and the carrot roots were placed inpre-labelled polyethylene bags. The parsley leaves were di-rectly placed in the polyethylene bags. The adhesive labelscontained the identification of the field, the sampling posi-tion and the date of sampling. The bags were arranged inthe order of sampling positions. The sampling was carriedout simultaneously by 2 pairs of trained sampling officerswho had written instructions describing the procedure tobe followed.
The composite samples of carrot and parsley consistingof 10 primary samples each were taken independently bythe four sampling officers from 10 positions. Two sampleswere taken along the two diagonal lines of the whole fieldsstarting from the opposite corners of the side of the fields.The other two composite samples were taken following theso-called “S” pattern starting from the other corners. Thesame method was applied for handling of the compositesamples as described for the primary samples.
The sample bags belonging to one field were placed inseparate plastic boxes and transported by car to the ana-lytical laboratory within 8 hours from the start of samplingthe first field. The parsley samples were processed imme-diately upon reception, the carrot samples were processedwithin 24 hours. The weight of primary carrot and parsleysamples ranged between 85.14 and 289.7 g and 62.71 and207.01 g, respectively. The variation of mass of parsley leafsamples were attributed to the difference in height of theplants grabbed from one position.
Analysis of residues
The pesticide residues were determined in 120–120 sam-ples of carrots and parsley, respectively. The additional10 samples collected were kept as reserve, but there wasno need to analyse them. The residues were determinedwith the QUEChERS method applying liquid chromatog-
raphy with dual mass spectometric (LCMS/MS) detec-tion.[27] The method had been fully validated and usedroutinely in the testing laboratory and its performancehad been tested regularly according to the quality con-trol standard operation procedures (SOPs) of the labo-ratory. In addition, the performance of the method wasverified with recovery studies conducted with the pesticideresidues specifically looked for based on the pesticide ap-plication records. The recoveries of alpha-cypermethrin,azoxystrobin, cyproconazole, dimethoate, esfenvalerate,fluorchloridone, lambda-cyhalothrin, linuron, tefluthrinand trifloxystrobin were tested with three replicates in car-rot at 0.005, 0.01 and 0.05 mg/kg spike levels. In parsley,the recoveries of azoxystrobin, difenoconazole, fluorchlo-ridone, hexaconazole, linuron and metolachlor were deter-mined with three replicates at 0.005, 0.01 and 0.1 mg/kglevels. The composite samples taken from the treatedfields were analysed with the same method as the primarysamples.
The reproducibility of laboratory phase of analyses (ex-pressed as the relative standard deviation, CVL), which in-cludes homogenization of laboratory sample, withdrawing15 g test portion (sample processing CVSp) and analysis(CVA) (Equation (1)), was calculated according to Equa-tion (2) from the repeated analysis of retained replicate testportions:
CVL =√
CV2Sp + CV2
A (1)
CVL =(∑�
n
)/1.128 (2)
where � = R1−R2
R, R1 and R2 are the results of analyses of
retained test portions, and n is the number of test portionsreanalysed on different days.
Estimation of sampling uncertainty
The uncertainty of sampling was only estimated from thoseprimary residue data sets that contained residues aboveLOQ. The CVR of measured residues reflect the combineduncertainty of sampling (CVS) and within laboratory re-producibility (CVL) of the determination of residues (Eq.(3)):
CVR =√
CV2S + CV2
L → CVS =√
CV2R − CV2
L (3)
The sampling uncertainty was calculated based the follow-ing procedures.
(1) Random composite samples of size 5, 10 and 25 weredrawn with replacement from the primary residuepopulations by applying an Excel macro.[23] The av-erage residues in composite samples (Rn) were calcu-lated from the mass of individual primary samples (gi)and the concentration of the residues (ci) measured
Dow
nloa
ded
by [
Zsu
zsa
Fark
as]
at 1
2:13
20
Oct
ober
201
3
4 Farkas et al.
in the primary samples.
Rn =∑N
i=1 ci× × gi∑Ni=1 gi
(4)
The relative standard deviations of the calculated aver-age residues in the composite samples reflect the uncer-tainty of sampling. The sample sizes of 5 and 10 wereselected to model the sampling uncertainty when thestandard sampling procedures are applied for testingcompliance with maximum residue limit, (MRL),[24,25]
while 25 represents the typical sample size employed insupervised residue trials.[28]
(a) Ten thousand random samples were drawn fromeach of the residue populations derived from 120primary samples.
(b) As Horvath et al.[29] found that the potential dif-ferences between the real distribution of pesticideresidues depending on the chemical structures andcrops cannot be distinguished based on 100–300samples, the various pesticide residues detectedabove the limit of quantification (LOQ) in carrotand parsley taken from individual fields were com-bined after dividing the individual residue valueswith the respective average residues of ∼120 pri-mary samples. In this way combined normalizedprimary residue populations were obtained for car-rot (N = 1080, µ = 1, and CV = 0.602) and parsley(N = 1079, µ = 1 and CV = 0.792). The overallaverage CV of normalized carrot and parsley datasets was 0.703. Ten thousand random samples ofsize 5, 10 and 25 were drawn with replacement fromthe normalized parent populations.
(2) Ten-ten thousand replicate random samples of size 5,10 and 25, obtained with method 1, were drawn inde-pendently 4, 8 12, 20 and 30 (p) times with replacementfrom the normalized parsley and carrot sample popula-tions. The replicate random samples were organised incolumns. The CV values were calculated (Equation (2))by dividing the relative differences with 1.128, 2.059,2.534 and 2.84 in case of 2, 4, 6 and 8 replicate samples,respectively.[30] For instance, the calculations of the CVvalues from 2 and 4 replicate samples being in the first2 rows of the columns are illustrated in Table 4.
(3) Twenty synthetic lognormal distributions, consistingof 10000 values, were generated with @-Risk softwarewith µ = 1 and CV = 0.8 representing the typical unitvariability of pesticide residues).[29] In this experiment2, 4, 6 and 8 (p) replicate random composite samples ofsize 10 were drawn with replacement ten thousand timesfrom each of the 20 parent populations for examiningthe effect of the number of lots (L) sampled. The relativestandard deviation of sampling was calculated as inmethod 2.
(4) To explore the general applicability of the conclusionsdrawn from sampling of different lots, the procedure
Table 4. Example for the calculations of the CV values from 2and 4 replicate samples.
Rel. dif. of CalculatedResidues in residues in CV formcomposite replicate replicate
Columns samples samples samplesRowNo 1 2 3 4 2 4 2 4
1 0.989 0.953 0.918 0.730 0.037 0.288 0.033 0.1402 0.970 1.147 1.077 0.975 0.167 0.165 0.148 0.080
The sampling uncertainty for 12, 20 and 30 replicate composite sampleswas calculated as the relative standard deviation (CV) of the correspond-ing residues.
described under (3) was repeated with residues in com-posite samples consisting of 10000 values of size 10 gen-erated from the residues measured in individual carrotand parsley primary samples. In addition, the mod-elling was repeated with residues in samples of mar-keted apple, banana and kiwi[4] taken from differentlots.
(5) The relative sampling uncertainty from the 4 repli-cate composite field samples was calculated with rangestatistics as in the previous cases.
Results and discussion
Field trials
The residues of different pesticides measured in the cropssampled represent the typical residue distribution withinand between fields because the carrot and parsley sam-ples were collected from commercial fields cultivatedaccording to normal agriculture practice. The pesticideproducts containing single active ingredients were appliedin most of the cases (Tables 1 and 2) at different times
Table 5. Average recoveries and reproducibility of analysis (CVA)of tested compounds.
Spike level mg/kg Average recovery CVA%
Carrot1 0.005 0.927 0.0790.01 0.932 8.330.05 0.855 7.25
Grand average 0.904 7.83Parsley2 0.005 0.94 11.4
0.01 0.99 9.630.1 0.81 7.80
Grand average 0.914 9.61
Notes: 1Compounds included in the tests: alpha-cypermethrin,azoxystrobin, cyproconazole, dimethoate, esfenvalerate, fluorchloridone,lambda-cyhalothrin, linuron, tefluthrin and trifloxystrobin. 2Compoundsincluded in the tests: azoxystrobin, difenoconazole, fluorchloridone, hex-aconazole, linuron and metholachlor.
Dow
nloa
ded
by [
Zsu
zsa
Fark
as]
at 1
2:13
20
Oct
ober
201
3

Sampling uncertainty of pesticide residues 5
Table 6. Summary statistics of residues determined in individual carrot root (primary) samples.
Residues (mg/kg)
Field Pesticide residue No. of samples1 Min Ave Max CVL CVR CVS
1 Azoxystrobin 119 0.03 0.07 0.16 0.10 0.35 0.331 Linuron 119 0.01 0.08 0.21 0.14 0.48 0.463 Azoxystrobin 120 0.03 0.08 0.15 0.10 0.33 0.313 Cyproconazole 120 0.05 0.17 0.37 0.07 0.36 0.353 Tefluthrin 120 0.003 0.034 0.14 0.20 0.91 0.893 Trifloxystrobin 119 0.004 0.020 0.13 0.05 0.98 0.988 Azoxystrobin 120 0.005 0.013 0.03 0.14 0.37 0.348 Cyproconazole 120 0.003 0.012 0.03 0.07 0.48 0.488 Linuron 106 0.001 0.017 0.090 0.14 0.99 0.998 Tefluthrin 120 0.012 0.15 0.74 0.20 0.74 0.71
Average 0.12 0.598 0.584
Note: 1Samples containing residues above the established LOQ of 0.001 mg/kg; residue values are rounded.
independently, therefore the distributions of residues ofdifferent pesticides measured in primary samples takenfrom one field represent the variability resulted fromapplication conditions and methods but will not reflectother potential influencing factors such as weather, soilcharacteristics, etc.
Analysis of samples
Of the 130 primary samples (single carrot and handful ofparsley leaves), 120 were analysed with the method apply-ing LCMS/MS detection. The performance of the previ-ously fully validated QUEChERS method was verified withconcurrent recovery tests performed in three replicates atlevels ranging from 0.005 to 0.1 mg/kg. There was no sig-nificant difference between the average recoveries based onANOVA test (P = 0.623), and their variances (Cochrantest, at P = 0.05) at the different spike levels. The typicalrelative standard deviation of analysis, CVA, was calculatedfrom the pooled variances of recovery values. The typicalrecoveries, calculated as the average of recoveries obtained
at all spike levels, were 90.4% and 91.4% and for carrot andparsley, respectively. The typical reproducibility CA valueswere 7.83% and 9.61% for carrot and parsley, respectively.The summary of concurrent recoveries performed togetherwith the analyses of samples is given in Table 5. The re-producibility of laboratory analyses (CVL) including thehomogenization of laboratory sample and analysis of 15 gtest portions was determined from the results of the reanal-yses of retained test portions performed at different days.The number of test portions reanalysed ranged from 8 fortrifloxystrobin to 24 for azoxystrobin. The typical CVL val-ues ranging between 0.07–0.21 were calculated accordingto Equation (2). They are listed in Tables 6 and 7. Welldefined and reproducible peaks were observed in case ofreanalyses of replicate test portions containing residues be-tween 0.0015 and 0.28 mg/kg for carrot and 0.0011 and0.20 mg/kg for parsley leaves. Therefore the LOQ was es-tablished at 0.001 mg/kg level.
The composite field samples were analysed with thesame method. The reproducibility of the measurement ofresidues (CVL) was determined with reanalysis of retained
Table 7. Summary statistics of residues determined in parsley primary samples.
Residues (mg/kg)
Field Pesticide residue No of samples1 Min Ave Max CVL CVR CVS
1 Azoxystrobin 120 0.005 0.015 0.051 0.17 0.47 0.431 Difenoconazole 120 0.033 0.113 0.245 0.21 0.36 0.302 Azoxystrobin 120 0.0096 0.0241 0.0781 0.17 0.47 0.442 Difenoconazole 120 0.0538 0.1338 0.3831 0.21 0.39 0.332 Linuron 120 0.034 0.068 0.135 0.21 0.43 0.172 Metolachlor 120 0.001 0.005 0.0086 0.24 0.31 0.193 Azoxystrobin 119 0.001 0.003 0.029 0.17 1.35 1.333 Difenoconazole 120 0.001 0.0124 0.1675 0.21 1.64 1.62
Average 0.199 0.678 0.601
Note: 1Samples containing residues above the established LOQ of 0.001 mg/kg; residue values are rounded.
Dow
nloa
ded
by [
Zsu
zsa
Fark
as]
at 1
2:13
20
Oct
ober
201
3

6 Farkas et al.
0.00
0.05
0.10
0.15
0.20
1 11 21 31 41 51 61 71 81 91 101 111
Res
idue
s
Sampling position
Azoxystrobin
0.00
0.05
0.10
0.15
0.20
0.25
1 11 21 31 41 51 61 71 81 91 101 111
Res
idue
s
Sampling position
Linuron
0.00
0.05
0.10
0.15
0.20
0.25
0.30
0.35
0.40
1 11 21 31 41 51 61 71 81 91 101 111
Res
idue
s
Sampling position
Cyproconazole
Fig. 1. Examples for the variability of residues (mg/kg) in primarycarrot samples taken from Field 1C (color figure available online).
test portions as described for the primary samples. The av-erage CVL values for carrot and parsley were 0.08 for carrot(30 tests) and 0.13 for parsley (12 tests).
In the discussion of the results hereunder, the residuesmeasured in field samples or generated by random samplingare referred to as follows:
I. residues measured in random primary samples takenfrom the fields are called “primary residues”;
II. residues measured in random composite samples takenfrom the fields are called “residues in composite fieldsamples”;
0.0
10.0
20.0
30.0
40.0
50.0
60.0
1 11 21 31 41 51 61 71 81 91 101 111
Res
idue
s
Sampling position
Azoxystrobin
0.0
50.0
100.0
150.0
200.0
250.0
300.0
1 11 21 31 41 51 61 71 81 91 101 111
Res
idue
s
Sampling position
Difenoconazole
0.0
2.0
4.0
6.0
8.0
10.0
12.0
1 11 21 31 41 51 61 71 81 91 101 111
Res
idue
s
Sampling position
Metolachlor
Fig. 2. Examples for the variability of residues (µg/kg) in pri-mary parsley samples taken from Field 1P (color figure availableonline).
III. the normalized residues are called normalized primaryresidues or “residues in normalized composite sam-ples”;
IV. the average residue values obtained with computer sim-ulation of random sampling are called “residues incomposite samples.”
The residues in individual carrot roots and parsley pri-mary samples varied at various extents as shown with someexamples in Figures 1 and 2.
Dow
nloa
ded
by [
Zsu
zsa
Fark
as]
at 1
2:13
20
Oct
ober
201
3

Sampling uncertainty of pesticide residues 7
Table 8. Residues detected in replicate composite field samples of carrot.
Residues (mg/kg)
Carrot Field Individual samples Average CVR
Azoxystrobin 1 0.031 0.043 0.049 0.045 0.0420 0.2113 0.087 0.087 0.058 0.068 0.0752 0.1894 0.099 0.061 0.077 0.059 0.0738 0.2685 0.023 0.023 0.023 0.034 0.0258 0.2036 0.026 0.028 0.019 0.030 0.0256 0.2147 0.029 0.011 0.014 0.010 0.0160 0.6008 0.010 0.013 0.013 0.011 0.0117 0.155
Average 0.263Cyproconazole 2 0.015 0.020 0.021 0.022 0.0194 0.187
3 0.249 0.253 0.130 0.141 0.1932 0.3074 0.210 0.131 0.124 0.121 0.1463 0.2955 0.070 0.107 0.077 0.086 0.0849 0.2126 0.044 0.028 0.024 0.042 0.0348 0.2767 0.022 0.012 0.020 0.005 0.0147 0.5508 0.0091 0.0103 0.0145 0.0079 0.0104 0.305
Average 0.305Linuron 1 0.031 0.046 0.073 0.064 0.0535 0.388
3 0.011 0.005 0.053 0.002 0.0178 1.4034 0.017 0.008 0.003 0.015 0.0106 0.6248 0.0091 0.0230 0.0180 0.0151 0.0163 0.415
Average 0.707Tefluthrin 3 0.022 0.030 0.030 0.072 0.0386 0.627
4 0.040 0.057 0.005 0.015 0.0291 0.8725 0.031 0.017 0.056 0.003 0.0268 0.9548 0.066 0.092 0.075 0.136 0.0921 0.367
Average 0.705Trifloxystrobin 3 0.036 0.053 0.026 0.013 0.0319 0.599
4 0.015 0.012 0.015 0.009 0.0127 0.2416 0.038 0.021 0.037 0.032 0.0319 0.2637 0.006 0.013 0.027 0.004 0.0121 0.925
Average 0.476
Estimated typical CVR and CVS calculated from all replicate composite samples of size 10 with the typical CVL of 0.08 are 0.427 and 0.419,respectively.
The summary statistics of residues in individual carrotroots and primary parsley leaf samples are given in Ta-bles 6 and 7. The pesticide residues present in the samplesonly in traces are not included in the tables. The relativeuncertainties of sampling, CVS, were calculated with Equa-tion (3) from the CVR of residues measured in carrot rootsand parsley leaves and the combined uncertainty of labora-tory phase of the analyses (CVL). Based on the experiencegained with previous studies on characterization of residuedistributions and estimation of sampling uncertainty,[23–30]
the average of CV values obtained for individual crop pes-ticide combinations were considered as the best estimatefor the typical CV values. The average CVL values wererelatively small compared to the CVR values (Tables 6 and7) and the CVS values were within 10% of the CVR, whichindicates that the major source of uncertainty is the vari-ability of residues in primary samples. The residues mea-sured in composite field samples are shown in Tables 8and 9.
Estimation of sampling uncertainty
The uncertainty of sampling was studied by generating10000 composite samples of size 5, 10 and 25 from theprimary residue populations obtained from the field sam-ples (method 1a). The residue values in composite sam-ples were calculated with Equation (4). The average andthe 95% range, represented by the P0.025 and P0.975percentiles of residues in composite samples generatedfrom the primary residue populations are summarised inTables 10 and 11.
Each primary residue data set obtained from one fieldprovides an estimate for the variability of residues. In or-der to get the best estimate of the within field variability ofresidues,[29] the primary residues were divided by their cor-responding average values and combined to obtain “nor-malized” primary residue populations in carrot (µ = 1,CV = 0.602) and parsley (µ = 1, CV = 0.792). The CVvalues of normalized residues are somewhat higher than
Dow
nloa
ded
by [
Zsu
zsa
Fark
as]
at 1
2:13
20
Oct
ober
201
3
8 Farkas et al.
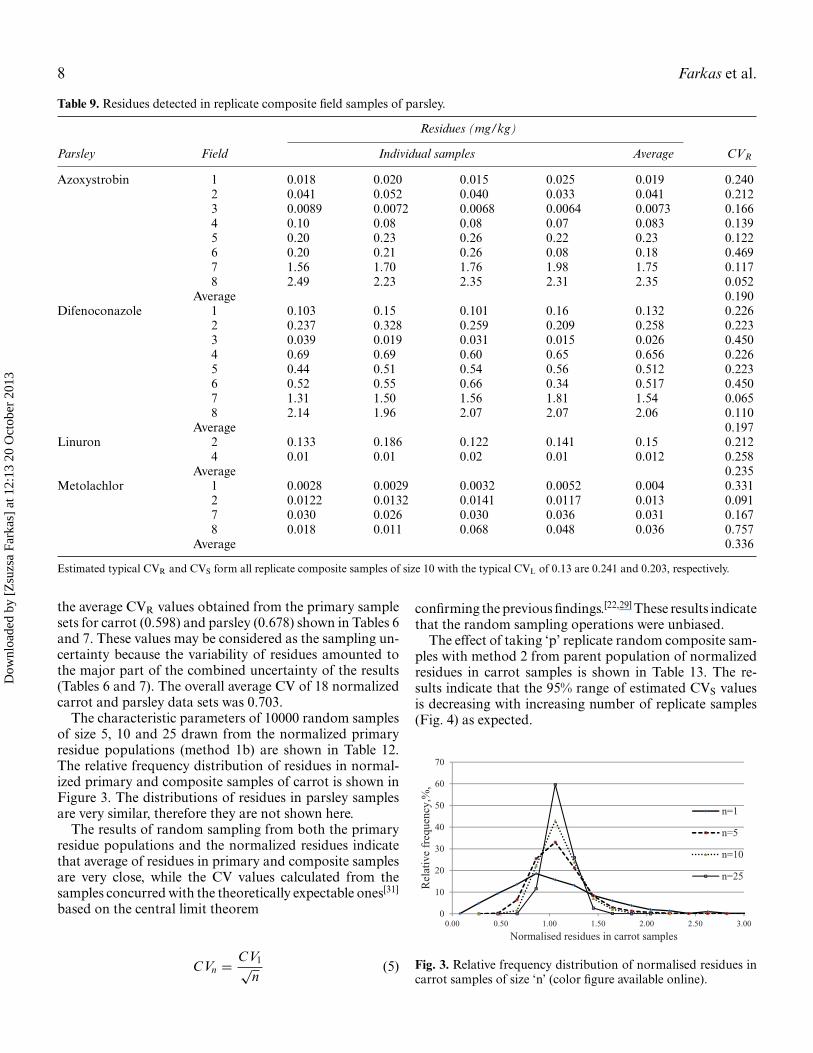
Table 9. Residues detected in replicate composite field samples of parsley.
Residues (mg/kg)
Parsley Field Individual samples Average CVR
Azoxystrobin 1 0.018 0.020 0.015 0.025 0.019 0.2402 0.041 0.052 0.040 0.033 0.041 0.2123 0.0089 0.0072 0.0068 0.0064 0.0073 0.1664 0.10 0.08 0.08 0.07 0.083 0.1395 0.20 0.23 0.26 0.22 0.23 0.1226 0.20 0.21 0.26 0.08 0.18 0.4697 1.56 1.70 1.76 1.98 1.75 0.1178 2.49 2.23 2.35 2.31 2.35 0.052
Average 0.190Difenoconazole 1 0.103 0.15 0.101 0.16 0.132 0.226
2 0.237 0.328 0.259 0.209 0.258 0.2233 0.039 0.019 0.031 0.015 0.026 0.4504 0.69 0.69 0.60 0.65 0.656 0.2265 0.44 0.51 0.54 0.56 0.512 0.2236 0.52 0.55 0.66 0.34 0.517 0.4507 1.31 1.50 1.56 1.81 1.54 0.0658 2.14 1.96 2.07 2.07 2.06 0.110
Average 0.197Linuron 2 0.133 0.186 0.122 0.141 0.15 0.212
4 0.01 0.01 0.02 0.01 0.012 0.258Average 0.235
Metolachlor 1 0.0028 0.0029 0.0032 0.0052 0.004 0.3312 0.0122 0.0132 0.0141 0.0117 0.013 0.0917 0.030 0.026 0.030 0.036 0.031 0.1678 0.018 0.011 0.068 0.048 0.036 0.757
Average 0.336
Estimated typical CVR and CVS form all replicate composite samples of size 10 with the typical CVL of 0.13 are 0.241 and 0.203, respectively.
the average CVR values obtained from the primary samplesets for carrot (0.598) and parsley (0.678) shown in Tables 6and 7. These values may be considered as the sampling un-certainty because the variability of residues amounted tothe major part of the combined uncertainty of the results(Tables 6 and 7). The overall average CV of 18 normalizedcarrot and parsley data sets was 0.703.
The characteristic parameters of 10000 random samplesof size 5, 10 and 25 drawn from the normalized primaryresidue populations (method 1b) are shown in Table 12.The relative frequency distribution of residues in normal-ized primary and composite samples of carrot is shown inFigure 3. The distributions of residues in parsley samplesare very similar, therefore they are not shown here.
The results of random sampling from both the primaryresidue populations and the normalized residues indicatethat average of residues in primary and composite samplesare very close, while the CV values calculated from thesamples concurred with the theoretically expectable ones[31]
based on the central limit theorem
CVn = CV1√n
(5)
confirming the previous findings.[22,29] These results indicatethat the random sampling operations were unbiased.
The effect of taking ‘p’ replicate random composite sam-ples with method 2 from parent population of normalizedresidues in carrot samples is shown in Table 13. The re-sults indicate that the 95% range of estimated CVS valuesis decreasing with increasing number of replicate samples(Fig. 4) as expected.
0
10
20
30
40
50
60
70
0.00 0.50 1.00 1.50 2.00 2.50 3.00
Rel
ativ
e fr
eque
ncy,
%,
Normalised residues in carrot samples
n=1
n=5
n=10
n=25
Fig. 3. Relative frequency distribution of normalised residues incarrot samples of size ‘n’ (color figure available online).
Dow
nloa
ded
by [
Zsu
zsa
Fark
as]
at 1
2:13
20
Oct
ober
201
3

Sampling uncertainty of pesticide residues 9
Table 10. Residues in 10000 composite carrot samples obtainedfrom residues in primary samples with random sampling withreplacement.
Residues in samples ofsize ‘n’ (mg/kg)
Pesticide Sample(Field number) size (n) P0.025 Average P0.975 CV
Azoxystrobin (1) 1a 0.0718 0.3505 0.0524 0.0718 0.0957 0.1559
10 0.0573 0.0719 0.0884 0.110525 0.0626 0.0719 0.0822 0.0698
Azoxystrobin (3) 1a 0.0824 0.3295 0.0595 0.0823 0.1073 0.1473
10 0.0663 0.0823 0.0996 0.103425 0.0721 0.0825 0.0929 0.0646
Azoxystrobin (8) 1a 0.0128 0.3665 0.0090 0.0128 0.0171 0.1625
10 0.0101 0.0128 0.0158 0.115125 0.0110 0.0128 0.0147 0.0726
Cyproconazole (3) 1a 0.17355 0.1246 0.1733 0.2332 0.1610
10 0.1380 0.1732 0.2135 0.111225 0.1502 0.1733 0.1986 0.0710
Cyproconazole (8) 1a 0.0121 0.4835 0.0075 0.0121 0.0175 0.2134
10 0.0087 0.0121 0.0158 0.152825 0.0099 0.0121 0.0145 0.0967
Linuron (1) 1a 0.0824 0.4775 0.0510 0.0824 0.1197 0.2128
10 0.0596 0.0826 0.1091 0.152825 0.0677 0.0825 0.0982 0.0948
Linuron (8) 1a 0.0167 0.9955 0.0062 0.0167 0.0345 0.4435
10 0.0086 0.0168 0.0287 0.312425 0.0111 0.0167 0.0238 0.1969
Tefluthrin (3) 1a 0.0338 0.9085 0.0108 0.0336 0.0633 0.4052
10 0.0166 0.0338 0.0541 0.285425 0.0228 0.0339 0.0466 0.1807
Tefluthrin (8) 1a 0.1524 0.7385 0.0772 0.1521 0.2715 0.3228
10 0.0957 0.1526 0.2336 0.232025 0.1132 0.1522 0.2016 0.1492
Trifloxystrobin (3) 1a 0.0202 0.9845 0.0095 0.0203 0.0430 0.4439
10 0.0117 0.0204 0.0356 0.309125 0.0139 0.0202 0.0293 0.1964
Note: aAverage residue in primary samples.
The average of relative differences of the 95% rangeof estimated sampling uncertainties of composite sam-ples of size 5, 10 and 25 drawn from primary populationswith CV1 ranging from 0.11 to 1.44, representing residuedistributions occurring under practical conditions, showedvery similar tendencies, regardless the magnitude of CV1values as can be seen in Figure 5. The slight variation ofthe shape of the curves may be attributed to the random
Table 11. Residues in 10000 composite parsley samples obtainedfrom residues in primary samples with random sampling withreplacement.
Residues in samples ofsize ‘n’ (mg/kg)
Pesticide Sample(Field number) size (n) P0.025 Average P0.975 CV
Azoxystrobin (1) 1a 0.015 0.4675 0.0098 0.0150 0.0220 0.21
10 0.0111 0.0150 0.0198 0.1525 0.0125 0.0150 0.0179 0.09
Azoxystrobin (2) 1a 0.024 0.475 0.0158 0.0240 0.0354 0.21
10 0.0179 0.0241 0.0317 0.1525 0.0200 0.0241 0.0289 0.09
Azoxystrobin (3) 1a 0.0027 1.355 0.0008 0.0027 0.0076 0.60
10 0.0011 0.0027 0.0056 0.4225 0.0016 0.0027 0.0045 0.27
Difenoconazole (1) 1a 0.113 0.365 0.0795 0.1127 0.1496 0.16
10 0.0889 0.1128 0.1387 0.1125 0.0979 0.1131 0.1297 0.07
Difenoconazole (2) 1a 0.134 0.3875 0.0949 0.1339 0.1866 0.17
10 0.1049 0.1337 0.1697 0.1225 0.1150 0.1339 0.1551 0.08
Difenoconazole (3) 1a 0.0124 1.645 0.0033 0.0124 0.0406 0.74
10 0.0045 0.0124 0.0287 0.5225 0.0065 0.0124 0.0223 0.33
Linuron (2) 1a 0.0683 0.2715 0.0533 0.0681 0.0855 0.12
10 0.0575 0.0684 0.0802 0.0825 0.0612 0.0683 0.0758 0.05
Metolachlor (2) 1a 0.0048 0.5685 0.0035 0.0047 0.0061 0.14
10 0.0039 0.0048 0.0057 0.1025 0.0042 0.0048 0.0053 0.06
Note: aAverage residue in primary samples.
0
1
2
3
4
5
6
7
8
0.00 0.10 0.20 0.30 0.40 0.50
Rel
ativ
e fr
eque
ncy,
%
CV of normalised residues in replicate samples (p)
p=4
p=8
p=12
p=20
p=30
Fig. 4. Distribution of CV of residues in ‘p’ replicate samplesof size 10 drawn from normalised primary residues in carrot.Expected CV is 0.19 (color figure available online).
Dow
nloa
ded
by [
Zsu
zsa
Fark
as]
at 1
2:13
20
Oct
ober
201
3
10 Farkas et al.
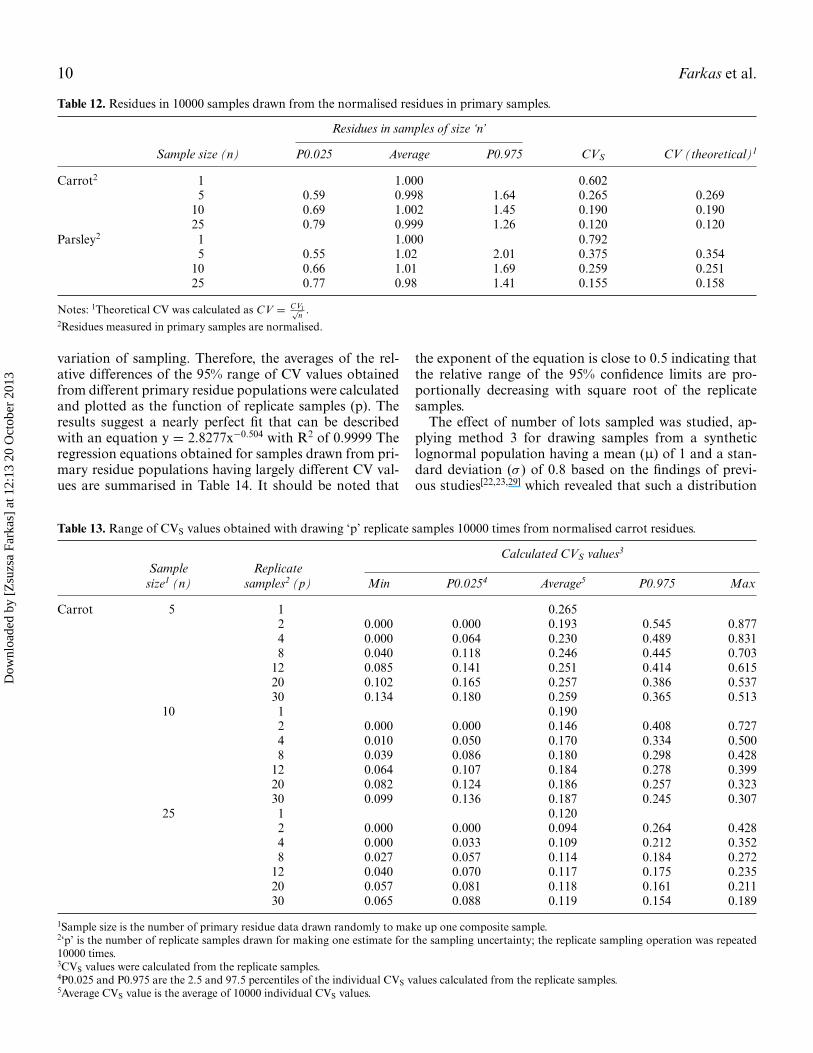
Table 12. Residues in 10000 samples drawn from the normalised residues in primary samples.
Residues in samples of size ‘n’
Sample size (n) P0.025 Average P0.975 CVS CV (theoretical)1
Carrot2 1 1.000 0.6025 0.59 0.998 1.64 0.265 0.269
10 0.69 1.002 1.45 0.190 0.19025 0.79 0.999 1.26 0.120 0.120
Parsley2 1 1.000 0.7925 0.55 1.02 2.01 0.375 0.354
10 0.66 1.01 1.69 0.259 0.25125 0.77 0.98 1.41 0.155 0.158
Notes: 1Theoretical CV was calculated as CV = CV1√n .
2Residues measured in primary samples are normalised.
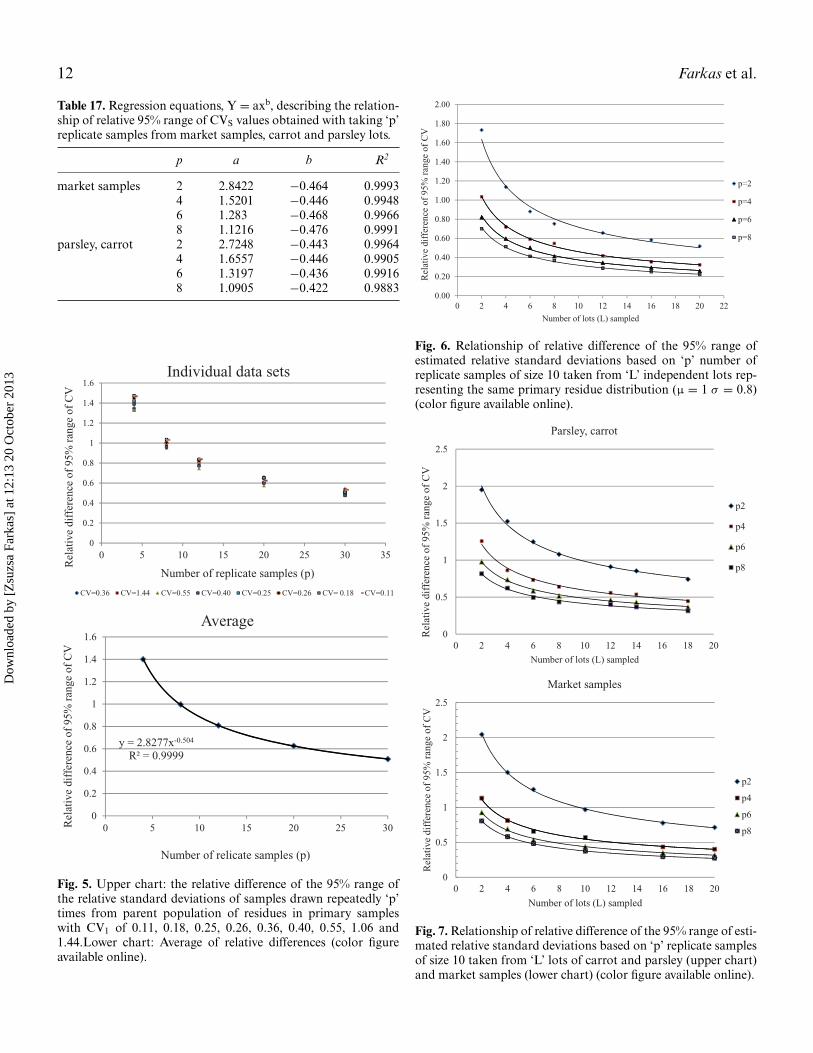
variation of sampling. Therefore, the averages of the rel-ative differences of the 95% range of CV values obtainedfrom different primary residue populations were calculatedand plotted as the function of replicate samples (p). Theresults suggest a nearly perfect fit that can be describedwith an equation y = 2.8277x−0.504 with R2 of 0.9999 Theregression equations obtained for samples drawn from pri-mary residue populations having largely different CV val-ues are summarised in Table 14. It should be noted that
the exponent of the equation is close to 0.5 indicating thatthe relative range of the 95% confidence limits are pro-portionally decreasing with square root of the replicatesamples.
The effect of number of lots sampled was studied, ap-plying method 3 for drawing samples from a syntheticlognormal population having a mean (µ) of 1 and a stan-dard deviation (σ ) of 0.8 based on the findings of previ-ous studies[22,23,29] which revealed that such a distribution
Table 13. Range of CVS values obtained with drawing ‘p’ replicate samples 10000 times from normalised carrot residues.
Calculated CVS values3
Sample Replicatesize1 (n) samples2 (p) Min P0.0254 Average5 P0.975 Max
Carrot 5 1 0.2652 0.000 0.000 0.193 0.545 0.8774 0.000 0.064 0.230 0.489 0.8318 0.040 0.118 0.246 0.445 0.703
12 0.085 0.141 0.251 0.414 0.61520 0.102 0.165 0.257 0.386 0.53730 0.134 0.180 0.259 0.365 0.513
10 1 0.1902 0.000 0.000 0.146 0.408 0.7274 0.010 0.050 0.170 0.334 0.5008 0.039 0.086 0.180 0.298 0.428
12 0.064 0.107 0.184 0.278 0.39920 0.082 0.124 0.186 0.257 0.32330 0.099 0.136 0.187 0.245 0.307
25 1 0.1202 0.000 0.000 0.094 0.264 0.4284 0.000 0.033 0.109 0.212 0.3528 0.027 0.057 0.114 0.184 0.272
12 0.040 0.070 0.117 0.175 0.23520 0.057 0.081 0.118 0.161 0.21130 0.065 0.088 0.119 0.154 0.189
1Sample size is the number of primary residue data drawn randomly to make up one composite sample.2‘p’ is the number of replicate samples drawn for making one estimate for the sampling uncertainty; the replicate sampling operation was repeated10000 times.3CVS values were calculated from the replicate samples.4P0.025 and P0.975 are the 2.5 and 97.5 percentiles of the individual CVS values calculated from the replicate samples.5Average CVS value is the average of 10000 individual CVS values.
Dow
nloa
ded
by [
Zsu
zsa
Fark
as]
at 1
2:13
20
Oct
ober
201
3

Sampling uncertainty of pesticide residues 11
Table 14. Regression equations, Y = axb, describing the relation-ship of relative 95% range of CVS values obtained with replicatesampling.
CV1 a b R2
0.11 2.987 −0.513 0.99810.18 3.0631 −0.523 0.99890.25 2.8955 −0.509 0.99720.26 2.8275 −0.493 0.9990.36 2.611 −0.469 0.99710.55 2.6952 −0.51 0.99761.06 2.957 −0.509 0.99991.44 2.6678 −0.487 0.9954
Table 15. Regression equations, Y = axb, describing the relation-ship of relative 95% range of CVS values obtained with taking‘p’ replicate samples from market samples, carrot and paroleylots.
p a b R2
2 2.3349 −0.513 0.98744 1.4771 −0.507 0.99556 1.187 −0.501 0.9978 1.0135 −0.502 0.9981
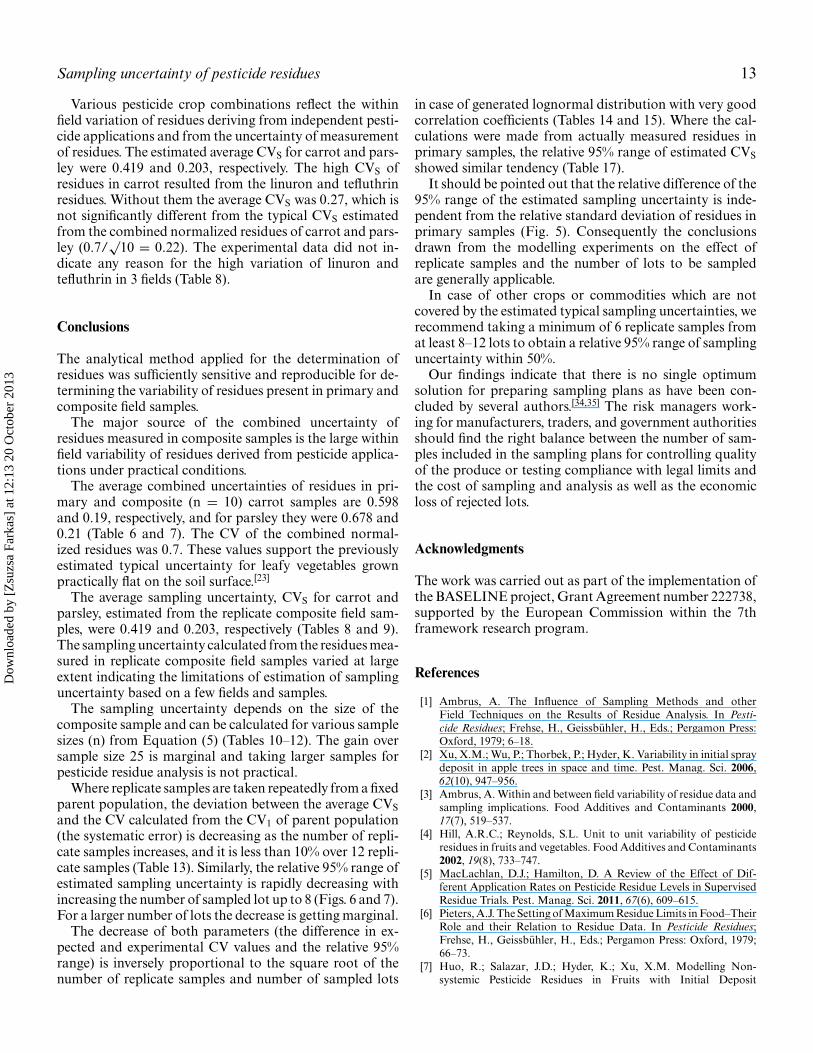
properly represents the typical dispersion of residues in pri-mary samples of medium and large commodities as well asparsley leaves. The relative differences of the 95% range ofestimated CVS values from taking 2, 4, 6 and 8 replicatesamples from up to 20 lots representing the same parentresidue distribution (µ = 1, σ = 0.8) are shown in Figure 6.The shape of the curves is regular, the minor fluctuationsaround the fitted line is attributed to the variation resultedfrom the random sampling and has no practical relevance.The regression equations obtained for 2–8 replicate sam-ples taken from 2, 6, 8, 12, 16 and 20 lots show good fit.Their parameters are summarised in Table 15.
The results obtained with composite samples generatedfrom the residues measured in samples taken from inde-pendent carrot, parsley and marketed lots of apple, bananaand kiwi are shown in Figure 7. The summary statistics ofresidues determined in primary samples taken from mar-keted lots are given in Table 16.
The parameters of the fitted regression lines are sum-marised in Table 17. The tendency of the decrease of rela-tive 95% confidence intervals of CV values in case of realfiled samples was the same as observed with the syntheticdata population (Fig. 6) indicating that the conclusions aregenerally applicable.
Figures 6 and 7 indicate that the relative 95% range ofsampling uncertainty rapidly decreased up to 8 lots espe-cially up to 6 samples per lot. After that the gain is gettingmarginal. The decrease was proportional to the square rootof the number of lots (Table 15).
Table 16. Summary statistics of residues determined in market (primary) samples.
Residues (mg/kg)1
Crop Field Pesticide No. of samples Min Average Max CV
Apple 1 Carbaryl 108 0.256 1.412 3.890 0.50Apple 1 Diphenylamine 108 0.089 0.473 1.820 0.63Apple 1 Thiabendazole 108 0.347 1.021 2.970 0.50Apple 1 Phosalone 100 0.028 0.607 2.701 0.83Apple 1 Chlorpyrifos 110 0.005 0.151 1.352 1.19Apple 1 Triazophos 110 0.005 0.558 2.160 0.97Banana 1 Chlorpyrifos 100 0.003 0.008 0.091 1.18Kiwi 1 Phosmet 100 0.001 0.071 0.427 1.29Apple 2 Carbaryl 95 0.005 0.357 1.900 0.91Apple 2 Phosalone 100 0.079 0.482 1.750 0.55Apple 2 Chlorpyrifos 110 0.005 0.056 0.263 0.78Apple 2 Triazophos 110 0.025 0.330 1.748 1.27Banana 2 Chlorpyrifos 100 0.002 0.009 0.076 0.88Apple 3 Carbaryl 100 0.020 0.152 0.680 0.83Apple 3 Chlorpyrifos 100 0.008 0.085 0.465 1.15Apple 4 Carbaryl 110 0.005 0.084 0.549 1.53Apple 4 Chlorpyrifos 100 0.010 0.061 0.342 0.86Apple 5 Carbaryl 100 0.330 1.055 2.264 0.39Apple 6 Carbaryl 100 0.060 0.503 1.620 0.67Apple 7 Carbaryl 100 0.010 0.977 2.726 0.64
Note: 1Values are rounded.
Dow
nloa
ded
by [
Zsu
zsa
Fark
as]
at 1
2:13
20
Oct
ober
201
3
12 Farkas et al.
Table 17. Regression equations, Y = axb, describing the relation-ship of relative 95% range of CVS values obtained with taking ‘p’replicate samples from market samples, carrot and parsley lots.
p a b R2
market samples 2 2.8422 −0.464 0.99934 1.5201 −0.446 0.99486 1.283 −0.468 0.99668 1.1216 −0.476 0.9991
parsley, carrot 2 2.7248 −0.443 0.99644 1.6557 −0.446 0.99056 1.3197 −0.436 0.99168 1.0905 −0.422 0.9883
0
0.2
0.4
0.6
0.8
1
1.2
1.4
1.6
0 5 10 15 20 25 30 35
Rel
ativ
e di
ffer
ence
of
95%
ran
ge o
f C
V
Number of replicate samples (p)
Individual data sets
CV=0.36 CV=1.44 CV=0.55 CV=0.40 CV=0.25 CV=0.26 CV= 0.18 CV=0.11
y = 2.8277x-0.504
R² = 0.9999
0
0.2
0.4
0.6
0.8
1
1.2
1.4
1.6
0 5 10 15 20 25 30Rel
ativ
e di
ffer
ence
of
95%
ran
ge o
fC
V
Number of relicate samples (p)
Average
Fig. 5. Upper chart: the relative difference of the 95% range ofthe relative standard deviations of samples drawn repeatedly ‘p’times from parent population of residues in primary sampleswith CV1 of 0.11, 0.18, 0.25, 0.26, 0.36, 0.40, 0.55, 1.06 and1.44.Lower chart: Average of relative differences (color figureavailable online).
0.00
0.20
0.40
0.60
0.80
1.00
1.20
1.40
1.60
1.80
2.00
0 2 4 6 8 10 12 14 16 18 20 22
Rel
ativ
e di
ffer
ence
of 9
5% r
ange
of
CV
Number of lots (L) sampled
p=2
p=4
p=6
p=8
Fig. 6. Relationship of relative difference of the 95% range ofestimated relative standard deviations based on ‘p’ number ofreplicate samples of size 10 taken from ‘L’ independent lots rep-resenting the same primary residue distribution (µ = 1 σ = 0.8)(color figure available online).
0
0.5
1
1.5
2
2.5
0 2 4 6 8 10 12 14 16 18 20
Rel
ativ
e di
ffer
ence
of
95%
ran
ge o
f C
V
Number of lots (L) sampled
Parsley, carrot
p2
p4
p6
p8
0
0.5
1
1.5
2
2.5
0 2 4 6 8 10 12 14 16 18 20
Rel
ativ
e di
ffer
ence
of
95%
ran
ge o
fC
V
Number of lots (L) sampled
Market samples
p2
p4
p6
p8
Fig. 7. Relationship of relative difference of the 95% range of esti-mated relative standard deviations based on ‘p’ replicate samplesof size 10 taken from ‘L’ lots of carrot and parsley (upper chart)and market samples (lower chart) (color figure available online).
Dow
nloa
ded
by [
Zsu
zsa
Fark
as]
at 1
2:13
20
Oct
ober
201
3
Sampling uncertainty of pesticide residues 13
Various pesticide crop combinations reflect the withinfield variation of residues deriving from independent pesti-cide applications and from the uncertainty of measurementof residues. The estimated average CVS for carrot and pars-ley were 0.419 and 0.203, respectively. The high CVS ofresidues in carrot resulted from the linuron and tefluthrinresidues. Without them the average CVS was 0.27, which isnot significantly different from the typical CVS estimatedfrom the combined normalized residues of carrot and pars-ley (0.7/
√10 = 0.22). The experimental data did not in-
dicate any reason for the high variation of linuron andtefluthrin in 3 fields (Table 8).
Conclusions
The analytical method applied for the determination ofresidues was sufficiently sensitive and reproducible for de-termining the variability of residues present in primary andcomposite field samples.
The major source of the combined uncertainty ofresidues measured in composite samples is the large withinfield variability of residues derived from pesticide applica-tions under practical conditions.
The average combined uncertainties of residues in pri-mary and composite (n = 10) carrot samples are 0.598and 0.19, respectively, and for parsley they were 0.678 and0.21 (Table 6 and 7). The CV of the combined normal-ized residues was 0.7. These values support the previouslyestimated typical uncertainty for leafy vegetables grownpractically flat on the soil surface.[23]
The average sampling uncertainty, CVS for carrot andparsley, estimated from the replicate composite field sam-ples, were 0.419 and 0.203, respectively (Tables 8 and 9).The sampling uncertainty calculated from the residues mea-sured in replicate composite field samples varied at largeextent indicating the limitations of estimation of samplinguncertainty based on a few fields and samples.
The sampling uncertainty depends on the size of thecomposite sample and can be calculated for various samplesizes (n) from Equation (5) (Tables 10–12). The gain oversample size 25 is marginal and taking larger samples forpesticide residue analysis is not practical.
Where replicate samples are taken repeatedly from a fixedparent population, the deviation between the average CVSand the CV calculated from the CV1 of parent population(the systematic error) is decreasing as the number of repli-cate samples increases, and it is less than 10% over 12 repli-cate samples (Table 13). Similarly, the relative 95% range ofestimated sampling uncertainty is rapidly decreasing withincreasing the number of sampled lot up to 8 (Figs. 6 and 7).For a larger number of lots the decrease is getting marginal.
The decrease of both parameters (the difference in ex-pected and experimental CV values and the relative 95%range) is inversely proportional to the square root of thenumber of replicate samples and number of sampled lots
in case of generated lognormal distribution with very goodcorrelation coefficients (Tables 14 and 15). Where the cal-culations were made from actually measured residues inprimary samples, the relative 95% range of estimated CVSshowed similar tendency (Table 17).
It should be pointed out that the relative difference of the95% range of the estimated sampling uncertainty is inde-pendent from the relative standard deviation of residues inprimary samples (Fig. 5). Consequently the conclusionsdrawn from the modelling experiments on the effect ofreplicate samples and the number of lots to be sampledare generally applicable.
In case of other crops or commodities which are notcovered by the estimated typical sampling uncertainties, werecommend taking a minimum of 6 replicate samples fromat least 8–12 lots to obtain a relative 95% range of samplinguncertainty within 50%.
Our findings indicate that there is no single optimumsolution for preparing sampling plans as have been con-cluded by several authors.[34,35] The risk managers work-ing for manufacturers, traders, and government authoritiesshould find the right balance between the number of sam-ples included in the sampling plans for controlling qualityof the produce or testing compliance with legal limits andthe cost of sampling and analysis as well as the economicloss of rejected lots.
Acknowledgments
The work was carried out as part of the implementation ofthe BASELINE project, Grant Agreement number 222738,supported by the European Commission within the 7thframework research program.
References
[1] Ambrus, A. The Influence of Sampling Methods and otherField Techniques on the Results of Residue Analysis. In Pesti-cide Residues; Frehse, H., Geissbuhler, H., Eds.; Pergamon Press:Oxford, 1979; 6–18.
[2] Xu, X.M.; Wu, P.; Thorbek, P.; Hyder, K. Variability in initial spraydeposit in apple trees in space and time. Pest. Manag. Sci. 2006,62(10), 947–956.
[3] Ambrus, A. Within and between field variability of residue data andsampling implications. Food Additives and Contaminants 2000,17(7), 519–537.
[4] Hill, A.R.C.; Reynolds, S.L. Unit to unit variability of pesticideresidues in fruits and vegetables. Food Additives and Contaminants2002, 19(8), 733–747.
[5] MacLachlan, D.J.; Hamilton, D. A Review of the Effect of Dif-ferent Application Rates on Pesticide Residue Levels in SupervisedResidue Trials. Pest. Manag. Sci. 2011, 67(6), 609–615.
[6] Pieters, A.J. The Setting of Maximum Residue Limits in Food–TheirRole and their Relation to Residue Data. In Pesticide Residues;Frehse, H., Geissbuhler, H., Eds.; Pergamon Press: Oxford, 1979;66–73.
[7] Huo, R.; Salazar, J.D.; Hyder, K.; Xu, X.M. Modelling Non-systemic Pesticide Residues in Fruits with Initial Deposit
Dow
nloa
ded
by [
Zsu
zsa
Fark
as]
at 1
2:13
20
Oct
ober
201
3

14 Farkas et al.
Variability and Weather Effects. Food Additives and Contaminants24(11), 2007, 1257–1267.
[8] Xu, X.M.; Murray, R.A.; Salazar, J.D.; Hyder, K. The Effectsof Temperature, Humidity and Rainfall on Captan Decline onApple Leaves and Fruit in Controlled Environment Conditions.Pest. Manag. Sci. 2008, 64(3), 296–307.
[9] Wolters, A.; Linnemann, V.; van de Zande, J.C.; Vereecken, H. FieldExperiment on Spray Drift: Deposition and Airborne Drift DuringApplication to a Winter Wheat Crop. Sci. Total Environ. 2008,405(1–3), 269–77.
[10] Hall, F.R.; Downer, R.A.; Cooper, J.A.; Ebert, T.A.; Ferree, D.Changes in Spray Retention by Apple Leaves During Growing Sea-son. Hort. Sci. 1997, 32(5), 858–860.
[11] Linders, J.; Mensink, H.; Stephenson, G.; Wauchope, D.; Racke,K. Foliar Interception and Retention Values After Pesticide Ap-plication. A Proposal for Standardized Values for EnvironmentalRisk Assessment (Technical report). Pure Appl. Chem. 2000, 72(11),2199–2218.
[12] MacLachlan, D.J.; Hamilton, D. A New Tool for the Evaluation ofCrop Residue Trial Data (day-zero-plus decline). Food Additives &Contaminants Part A 2010, 27(3), 347–364.
[13] Ganzelmeier, H. Crop Protection Equipment. Magazine of the In-ternational Organization for Standardization 2006, 3(4), 20–23.
[14] Ambrus, A. Estimation of Uncertainty of Sampling for Analy-sis of Pesticides Residues. J. Environ. Sci. Health B 1996, 31(3),435–442.
[15] Harris, C.A.; Davis, T.J. Unit to unit variability of pesticide residuesin celery, plums and kiwi fruit. Pesticides Safety Directorate (nowChemical Regulation Directorate): York, UK, 1998.
[16] Lentza-Rizos, C.; Balokas, A. Residue Levels of Chlorpropham inIndividual Tubers and Composite Samples of Postharvest-TreatedPotatoes. J. Agric. Food Chem. 2001, 49(2), 710–714.
[17] Ambrus, A. Variability of Pesticide Residues in Crop Units. Pest.Manag. Sci. 2006, 62(8), 693–714.
[18] Song, Y.F.; Lu, X.; Ren, F.S. Variability of Pesticide Residues in Veg-etables from the Marketplaces in Jinan City. Agricultural Sciencesin China 2011, 10(10), 1646–1652.
[19] Earl, M.; Kaethner, M.; Uilhein, M. Unit to Unit Variation ofPesticide Residue – Options for Dietary Risk Assessment. FoodAdditives & Contaminants 2000, 17(7), 583–589.
[20] Caldas, E.; Jardim, A.; Ambrus, A.; Souza, L.C. Variability ofOrganophosphoruse Insecticide Residues in Large Size CropsGrown in Commercial Farms in Brazil. Food Additives and Con-taminants 2006, 23(2), 148–158.
[21] FAO. Pesticide residues in food-2002. Report of the 2002 JMPR,FAO Plant Production and Protection Paper 172. Annex 7. Author:Rome. Available at http://www.fao.org/agriculture/crops/core-themes/theme/pests/jmpr/jmpr-rep/en/ (accessed June 2013).
[22] Ambrus, A.; Soboleva, E. Contribution of Sampling to the Vari-ability of Pesticide Residue Data. JAOAC International 2004, 87(6),1368–1379.
[23] Ambrus, A. Estimation of Sampling Uncertainty for Determinationof Pesticide Residues In Plant Commodities. J. Environ. Sci. andHealth 2009, 44(7), 1–13.
[24] Codex Secretariat. 2002. Recommended method of sampling forthe determination of pesticide residues for compliance with MRLs.Codex Secretariat: Rome. Available at www.codexalimentarius.org/input/download/standards/361/CXG 033e.pdf (accessedJune 2013).
[25] European Commission. Commission Directive 2002/63/EC of 11July 2002 Establishing Community Methods of Sampling for theOfficial Control of Pesticide Residues in and on Products of Plantand Animal Origin and Repealing Directive 79/700/EEC. OfficialJournal of the European Communities 2002, 16(7), 30–43.
[26] Ramsey, M.H.; Ellison, S.L.R. Eurachem/EUROLAB/CITAC/Nordtest/AMC Guide: Measurement Uncertainty Arising from Sam-pling: A Guide to Methods and Approaches. Eurachem: Berlin, 2007.
[27] European Committee for Standardization (CEN). Foods of plantorigin—Determination of pesticide residues using GC-MS and/orLC-MS/MS following acetonitrile extraction/partitioning andclean-up by dispersive SPE–QUEChERS–method EN15662. Au-thor: Brussels, Belgium, 2008.
[28] Organisation for Economic Co-operation and Develop-ment (OECD). Guidelines for the Testing of ChemicalsTest No. 509: Crop Field Trial. Author: Paris. Available athttp://masetto.sourceoecd.org/vl=47470697/cl=12/nw=1/rpsv/ij/oecdjournals/1607310x/v1n7/s10/p1 (accessed June 2013).
[29] Horvath, Zs.; Ambrus, A.; Meszaros, L.; Braun, S. Characterisationof Distribution of Pesticide Residues in Crop Units. J. Environ. Sci.Health B 2013, 48(8), 615–625.
[30] Anderson R.L. Practical Statistics for Analytical Chemists; VanNostrand Reinhold Company: New York, 1987; Appendix D12.
[31] Snedecor, G.W.; Cochran, W.G. Statistical Methods, 7th Ed.; TheIowa State University Press: Ames, IA, 1980; 45–50.
[32] International Standard Organization. Agricultural Products–Layout for standard method of sampling from a lot ISO 7002-1.Author: Paris, 1986.
[33] International Standard Organization. Shewhart Control Charts8258, December 1. Author: Paris, 1991.
[34] Lyn, J.A.; Ramsey, M.H.; Coad, D.S.; Damant, A.P.; Wood,R.; Boon, K.A. The Duplicate Method of Uncertainty Estima-tion: Are Eight Targets Enough? Analyst 2007, 132(11), 1147–1152.
[35] Ramsey, M.H.; Lyn, J.; Wood, R. Optimised Uncertainty at Mini-mum Overall Cost to Achieve Fitness-for-purpose in Food Analysis.Analyst 2001, 126(10), 1777–1783.
Dow
nloa
ded
by [
Zsu
zsa
Fark
as]
at 1
2:13
20
Oct
ober
201
3