Financial intermediation and the functioning of capital markets
Upload
khangminh22Category
view
2download
0
�����������������
Citation: Mandipa, Garikai, and
Athenia Bongani Sibindi. 2022.
Financial Performance and Working
Capital Management Practices in the
Retail Sector: Empirical Evidence
from South Africa. Risks 10: 63.
https://doi.org/10.3390/
risks10030063
Academic Editor: Wing-Keung
Wong
Received: 17 November 2021
Accepted: 23 February 2022
Published: 10 March 2022
Publisher’s Note: MDPI stays neutral
with regard to jurisdictional claims in
published maps and institutional affil-
iations.
Copyright: © 2022 by the authors.
Licensee MDPI, Basel, Switzerland.
This article is an open access article
distributed under the terms and
conditions of the Creative Commons
Attribution (CC BY) license (https://
creativecommons.org/licenses/by/
4.0/).
risks
Article
Financial Performance and Working Capital ManagementPractices in the Retail Sector: Empirical Evidence fromSouth AfricaGarikai Mandipa and Athenia Bongani Sibindi *
Department of Finance Risk Management and Banking, School of Economic and Financial Sciences,University of South Africa (UNISA), P.O. Box 392, Pretoria 0003, South Africa; [email protected]* Correspondence: [email protected]; Tel.: +27-(0)-12-429-3757; Fax: +27-(0)-86-569-8848
Abstract: This study examines the relationship between the financial performance and workingcapital management practices of South African retail firms listed on the Johannesburg Stock Exchange.The study sample comprised a panel of 16 South African retail firms for the period 2010–2019. Afixed-effects estimator was employed in the analysis. The working capital management was proxiedby average age of inventory (AAI), average collection period (ACP), average payment period (APP),and cash conversion cycle (CCC), while the financial performance was proxied by net operating profitmargin (NOPM), return on assets (ROA), and return on equity (ROE). The key findings of the studydocumented the following: (1) There is a negative relationship between average collection period andfinancial performance. (2) A negative relationship between average age of inventory and financialperformance measures (NOPM and ROA) was found. (3) The average payment period was foundto be negatively related to return on equity. (4) The cash conversion cycle and net operating profitmargin variables were found to be negatively related. The study concludes that working capitalmanagement practices influenced the financial performance of the South African retail firms. It isrecommended that South African retail firms observe prudent optimal working capital managementpractices, as these influence their financial performance.
Keywords: working capital management; financial performance; retail sector; South Africa; financialsustainability
1. Introduction
The South African economy has seen a structural shift from the primary (mining andmanufacturing) to the tertiary (wholesale and retail trade) sector since the early 1990s, andamong the key sectors are retail and wholesale trade, which keep the economic engine ofSouth Africa moving. In relation to other sectors, the retail sector has been on the rise and,therefore, a critical assessment is of great significance to drive economic growth. The retailand wholesale sectors, specifically, employ an estimated 22% of the national labor force.This positions the retail sector as an important sector in the overall South African economy(Stats SA 2021).
The term “working capital management” refers to the management of current assetsand liabilities. It entails the management of current assets and liabilities in direct proportionto a company’s liquidity and profitability (Deloof 2003; Afrifa et al. 2014).
The management of working capital has a huge impact on financial liquidity and theefficiency of current assets management (CCC). Appropriate levels of liquidity are requiredto ensure that firms can meet their short-term financial obligations. At the same time, man-agers have to ensure that excess cash is not tied up in working capital (Akbar et al. 2021).Liquidity refers to the company’s ability to meet its commitments on time. To put it anotherway, it is the company’s ability to convert current assets into cash so that current liabilities
Risks 2022, 10, 63. https://doi.org/10.3390/risks10030063 https://www.mdpi.com/journal/risks

Risks 2022, 10, 63 2 of 17
can be paid when they are due. A company’s ability to continue operating depends on itsability to maintain liquidity.
Working capital management (WCM) is of great significance, as it affects the profitabil-ity and decisions of a firm, which in turn influence its financial performance. Appropriateand efficient working capital management is a necessary component of the retail business.As a result, to maintain stability and remain competitive, firms must maintain a balancebetween current assets and current liabilities. The objective of a business is to make profit,but it is also critical for management to maintain a healthy level of working capital.
Working capital management, in addition to capital structure, capital budgeting, divi-dends, and the cost of capital, is an important concept in finance management (supportinglong-term financial decisions). Working capital management is a common factor that hasa direct impact on the profitability and liquidity of a firm. An understanding of workingcapital can provide a significant competitive advantage; conversely, inefficient workingcapital management can result in significant losses (Virkala 2015). As a result, it is critical toinvestigate the relationship between working capital management and firm performance.
Kwenda and Matanda (2015) claim that the management of working capital is critical tothe achievement of shareholders’ wealth maximization goals. Working capital managementhas received significant attention in both theoretical and empirical research at the expenseof capital budgeting and capital structure decisions.
Tanveer et al. (2016) state that working capital management is one of the controversialissues in corporate finance. It involves a set of financial decisions that is both difficult andkey to the success of any given firm because it has an influence on return and profitability.Working capital management is highly complicated because it concerns current assets andcurrent liabilities.
One of the key challenges facing financial managers within the corporate sector isto determine how working capital management influences firm performance. Amongthe questions raised by these financial managers are, “Do working capital managementpractices influence firm performance?” and “What is the implication of the variations inthe variables under study (financial performance and working capital management)”?
Despite ample research, there is still a gap owing to the shortfall in factual evidenceto justify the best optimal level of working capital required by firms to influence theirprofitability. A lack of consensus continues to exist as to the optimal level of workingcapital and how it can affect a firm’s profitability.
The empirical research suggests that the direction of the relationship between workingcapital management and financial performance that generates shareholder value remainscontroversial. This study is intended to bridge this knowledge gap by examining therelationship between working capital management and financial performance in the contextof South Africa.
The primary aim of this study is to investigate the nexus between working capitalmanagement practices and the financial performance of South African retail firms listed onthe Johannesburg Stock Exchange (JSE).
This study contributes to knowledge on the relationship between working capitalmanagement and financial performance, as working capital management practices may beimproved to increase financial performance and the long-term viability of firms. A workingcapital strategy should define the amount of money invested in each form of workingcapital asset to implement acceptable operational strategies and identify unsuccessfulparts. The rest of this paper is arranged as follows. Section 2 reviews the related literature.Section 3 describes the research methodology applied in the study. Section 4 presents anddiscusses the empirical findings. Section 5 concludes the paper.

Risks 2022, 10, 63 3 of 17
2. Review of Related Literature2.1. Theoretical Literature
The significance of working capital relates to the impact it has on profitability. Irre-spective of a firm’s size and business nature, efficient working capital management is thekey component that guarantees and ensures sustainability. Preserving adequate workingcapital is not only beneficial for short-term financial needs, but also for the long-termexistence of a business.
Working capital management efficiency is critical in corporate finance to maximizeshareholder wealth. It is a form of short-term resource management that has a signif-icant link with short-term finance and investment decisions. WCM that is effectivehas a significant influence on profitability; this link is essential in business conditions(Akbar et al. 2021).
The concept of working capital has been analyzed in different situations (Chang et al.2019; Zimon and Tarighi 2021; Akbar et al. 2021).
Firm performance is determined by profitability measures. From a financial perfor-mance standpoint, a company can be said to be performing well if it makes greater use ofits assets than its rivals or competitors (Morara and Sibindi 2021, p. 3). Al-Abass (2018,p. 137) states that profitability is made up of two words: profit and ability. Profit refersto the total income or return from a business, while ability refers to the power that isused by the business to earn profit and how efficiently management makes this profitby utilizing all available resources. Among the available resources a company has is theefficient management of working capital to generate positive returns. Profitability is theexcess of revenue over costs, which generates a higher internal rate of return.
Kwenda and Matanda (2015) posit that following efficient working capital manage-ment strategies, managers can utilize reserves of working capital and seek profitable invest-ment opportunities without going to the capital market to issue expensive and high-risksecurities, thereby avoiding the negative signals associated with external securities. In ad-dition, proper working capital management is paramount because it unlocks funds withina company, which is a very cheap approach compared to external financing. By not lookingto the external market to raise funds, therefore, efficient working capital management isimperative for mitigating the risk of insolvency.
Managing working capital is a significant function in the corporate world. Therefore,the emergence of working capital management plays an important role in the finance field,as it is mainly related to investment and financing in the short term (Makori and Jagongo2013). In the framework of working capital management, a financial manager’s aim is tofocus on the short-term operations of the business and to confirm that funds are available tosustain operations. In all business activities, working capital management is a critical com-ponent of financial management. It is primarily concerned with the liquidity componentsof a company’s short-term current assets and current liabilities (Aktas et al. 2015).
According to Ukaegbu (2014), the goal of working capital management is to ensurethat a company can meet its operating expenses while, at the same time, paying its short-term debt when due. Furthermore, to maximize profitability and sustain liquidity levels,working capital management necessitates the management of both current assets andcurrent liabilities.
The purpose of working capital management is to keep track of a firm’s current assetsand current liabilities to strike a balance between profitability and risk that contributespositively to the value of the firm. Firms are required to maintain a certain amount ofworking capital to function effectively and efficiently. For instance, if the level of workingcapital is too low, the firm is vulnerable to an additional risk of insolvency. Excessiveworking capital diminishes firms’ profitability and insufficient working capital jeopardizesfirms’ solvency (Aravind 2016, p. 58).

Risks 2022, 10, 63 4 of 17
2.1.1. Working Capital Management Policy Framework
Mengesha (2014, p. 20) describes “working capital policy as the strategy that providesguidelines for managing current assets such as accounts receivable, inventory and cash,and current liabilities such as accounts payable and accruals.”
The working capital approach can determine the type of financing used to fundvariable and permanent current assets. Fisher’s (1930) separation theorem indicates that acompany should avoid confusion between an “investment in current assets and financingcurrent assets.” This theory has to do with working capital because a company shouldalways separate how much it invests in working capital from how it finances workingcapital (Rehn 2012, p. 6).
Firms choose different policies to support their working capital and, thereby, theiroperations. Nyabuti and Alala (2014) affirm that a firm can adopt either an aggressive ora conservative working capital management policy. The financial managers of any firmshould keep a close eye on working capital levels to keep the cash requirements on theright track. Insufficient attention to working capital investment may result in shortagesof cash.
Irene and Ondigo (2018) allude to the notion that investment policy indicates howmuch a firm has invested in current assets. A large amount of working capital reflectsconservativeness, whereas less investment in current assets symbolizes aggressiveness.
2.1.2. Working Capital Strategies
According to Enqvist et al. (2014), working capital strategies emphasize the liquidityof current assets in order to meet current liabilities. Liquidity is more important because ifa firm’s liquidity is extremely high, it has a significant amount of idle capital to handle, andit must accept the cost of these idle assets.
Louw et al. (2016) argue that the management of working capital varies amongindustries and state, and that it would be more useful to test the association betweenworking capital management and profitability within one specific industry. Investmentin current assets and financing decisions can be approached in three ways: aggressive,conservative, or moderate. For example, a firm with a high volume of sales requires morefinancing in current assets, whereas one with low sales growth requires less financing.
Firms might adopt a high-risk approach by funding current assets with short-termdebt since this provides a low-interest rate. However, the risk associated with short-termdebt is greater than that associated with long-term debt (Dhole et al. 2019). Aggressivefinancing involves financing all temporary current assets, permanent current assets, andsome fixed assets with short-term debt and non-spontaneous debt, and long-term financingis used for remaining fixed assets. If a business maintains a small proportion of its totalassets in the form of current assets or uses a high portion of short-term debt, this couldresult in an aggressive strategy. As a result, this policy will result in increased profitsand a greater risk of the company defaulting. Aggressive strategies are designed to keepcurrent assets low compared to current liabilities. The high level of receivables is becausesales based on trade credit are directed to regular customers and to low credibility (see forinstance; Enqvist et al. 2014; Zimon 2020; Zimon and Tarighi 2021).
According to Kwenda (2017, p. 49), “pursuing an aggressive working capital invest-ment approach promotes firm profitability and implies high liquidity, which also reducesthe firm’s risk ceteris paribus. This working capital investment approach results in a shortCCC and indicates that the firm is receiving payments from its customers quickly, whiledelaying payments to suppliers close to the due date”. Although this approach is cheaper,it is also riskier due to short-term fund fluctuations (interest rates) that may not always beavailable when needed. A firm with an aggressive working capital policy offers customersa short credit term, has less inventory on hand, and has fewer liquid assets (Chen andKieschnick 2018).
In a conservative approach, non-current assets, perpetual current assets, and sometemporary current assets are all funded with long-term debt. The remaining short-term

Risks 2022, 10, 63 5 of 17
assets are financed through short-term debt. This entails keeping a high level of cashon-hand, as well as a low level of customer receivables and supplier debts (Zimon 2020,p. 226). Thus, if a firm follows a conservative working capital strategy, there is plenty ofcash on-hand, plenty of inventory in the warehouses, and all of the payables are current.This viewpoint is buttressed by Zimon and Tarighi (2021), who also contend that theconservative strategy is associated with a high level of liquidity. This approach involveslower risk due to repayments spread over a prolonged period and lower returns. Under thisapproach, the firm is less profitable because of unnecessary liquidity (Besley and Brigham2013, p. 256). The disadvantages of this approach include its higher cost of financing andthe fact that large investment is blocked by temporary working capital.
According to Paramasivan and Subramanian (2009) firms employ a moderate approachby utilizing long-term debt and equity to finance their fixed assets and the main parts oftheir current assets.
2.2. Empirical Literature Review
Deloof (2003) examined the relationship between working capital management andprofitability in a sample of 1009 large Belgian non-financial firms over four years. The studyrevealed an inverse relationship between accounts-receivable days, inventory, accountspayable, and gross income, as measured using the CCC. Therefore, managers can growfirms’ productivity by decreasing the number of accounts-receivable days and inventories.
Following Deloof (2003), another study, carried out by García-Teruel and Martínez-Solano(2007), in Spain, on 8872 small and medium enterprises (SMEs) from 1996 to 2002, revealed thatshortening the CCC improves a firm’s profitability. The results imply that there is a negativeassociation between working capital components and profitability.
Raheman and Nasr (2007) conducted a study to probe the ties between workingmanagement and profitability in 94 Pakistan firms listed on the Karachi Stock Exchangefor the period 1999–2004. The results showed an opposing link between working capitalmanagement variables and firm profitability.
Aktas et al. (2015) analyzed data from US firms from 1982 to 2011 to determine whetherworking capital management enhances value. Their results showed that the existence of anoptimal level of working capital policy and convergence by firms to that optimal level, byeither decreasing or increasing their investment in working capital, improved their stockand operating performance.
A study by Chang et al. (2019), which determined the effects of the 2008 financialcrisis on the working capital management policies of U.S. enterprises, revealed that thecash conversion cycle had no significant effect on the results, showing that a financialcrisis has no effect on the efficiency with which working capital is collected. Firms withrelatively low current and quick ratios, on the other hand, should pay more attention totheir liquidity management strategies or take action prior to the onset of a financial crisis toavoid slipping into a liquidity crisis, which weakens their financial situation and leads tofinancial difficulties.
Garg and Gumbochuma (2015), in their investigation of the relationship betweenworking capital management and profitability in the retail sector from 2004 to 2013, founda negative relationship between working capital management and profitability.
The study conducted on the South African retail sector by Louw et al. (2016) showedthat a strategy to reduce investment in inventory and trade receivables, while increas-ing trade payables, appeared to improve the profitability of South African retail firms.Therefore, an inverse relationship was observed.
An investigation of the effect of working capital management on profitability among69 listed manufacturing firms in South Africa from 2007 to 2016 showed that ACP andAPP were negatively related to profitability. A positive relationship between AAI andprofitability was found (Kasozi 2017).
A study of the relationship between working capital management and the financialperformance of food and beverage firms listed on the JSE in South Africa from 2007 to 2016,

Risks 2022, 10, 63 6 of 17
by Mabandla (2018) documented a constructive association between an aggressive workingcapital management policy and financial performance. Moreover, the study found that theCCC and profitability moved in opposite directions.
A study by Adam et al. (2017) to ascertain the effects of aggressive or conservativecurrent asset investment and financing policies on six manufacturing firms on the GhanaianStock Exchange from 2000 to 2013 disclosed that current asset investment and financingpolicies have highly significant positive effects on returns on shareholders’ equity in thelong run.
Sathyamoorthi et al. (2018) examined the impact of working capital on profitability inretail stores listed on the Botswana Stock Exchange for the period 2012–2016. The studyindicated a non-linear association between working capital and firm profitability by usingROA as a dependent variable and CCC components as independent variables.
Mukaddam and Sibindi (2020) examined the relationship between the financial per-formance and corporate governance practices of South African retail firms. The results oftheir study documented that board size was negatively related to financial performance. Inaddition, the study found that board independence and firm size were positively related tofinancial performance. They reasoned that the relationship between corporate governanceand financial performance is not very strong among retail firms in South Africa.
Akbar et al. (2021) investigated how working capital management influenced theoperating and market risk returns of firms from 12 different industrial segments for a timespan of ten years between 2005–2014 in Pakistan. They found that higher working capitallevels were linked to lower stock price volatility.
3. Data and Methodology3.1. Sample Description and Data Sources
This study seeks to examine the relationship between the financial performance andworking capital management practices of retail firms listed on the Johannesburg StockExchange. The main reason for choosing the retail sector lies in the fact that the sectordepends more on current assets and current liabilities than other sectors, such as mining,agriculture, finance, and manufacturing. The population of the study included all retailcompanies listed on the JSE for a -year consecutive period from 2010 to 2019. The sampleconsisted of only 16 retail firms. To arrive at our final sample, we eliminated firms withfinancial statements covering less than ten years from the study. The criteria were essentialto enable easy comparison with similar research and to allow the use of unbalanced paneldata, which has the advantage of more degrees of freedom and reduced multicollinearityacross variables, according to Gujarati (2003).
The data set comprised 160 observations, based on the financial statements of theSouth African retail firms listed on the JSE for a ten-year period extracted from the Orbisdatabase. The data collected from the financial statements of the retail firms was analyzedusing descriptive statistics, a correlation matrix, and panel regression models.
The financial performances of the firms were measured using profitability ratios as thedependent variables. The dependent variables were measured by ROA, ROE, and NOPMto assess how efficient the South African retail firms were at generating profits. The metricsfor working capital management, which included AAI, ACP, APP, and CCC, were used asindependent variables in the study. The control variables in this study were leverage, firmsize, and current ratio. Leverage is measured as the amount of debt a firm uses to financeassets. It is a measure of a firm’s risk. Firm size is the logarithm of the total assets of anygiven firm. It is assumed that as the company grows, its sales also increase. Current ratio isa liquidity measure that indicates whether a firm has current assets to cover for its short-term financial obligations. It evaluates current assets to its current liabilities. The variablesare defined in Table 1.
Risks 2022, 10, 63 7 of 17
Table 1. Explanation of variables.
Variables Description Measurement
ROA Return on assets Net income ÷ total assets
ROE Return on equity Net income ÷ total equity
NOPM Net operating profit margin EBIT ÷ total revenue
AAI Average age of inventory Cost of goods sold ÷ inventory ×365 days
ACP Average collection period Accounts receivable ÷ net sales × 365
APP Average payment period Accounts payable ÷ cos t of sales × 365
CCC Cash conversion cycle AAI + ACP − APP
SIZE Firm size Logarithm of total assets
LEV Leverage 1 − (equity ÷ total assets)
CR Current ratio Current assets ÷ current liabilities
E Error term Standard error term
I Cross-sectional dimensions Ranging from 1 to 10
T Time-series dimensions Ranging from 1 to 10
B0, β1, β2, β3,β4, β5, β6, β7
Regression coefficients
Source: Researcher’s own compilation.
Panel data techniques were used to control for heterogeneity caused by the retail firms’varying nature, complexity, and size. To ensure that the estimated models were robust andwell specified, diagnostic tests were carried out. These included the Hausman specificationtest to decide whether to apply the FE or the RE model, the multicollinearity test for highintercorrelations among two or more independent variables in a multiple regression model,the Breusch–Pagan Lagrange multiplier (LM) test for the heteroskedasticity in the linearregression model, the applied Chow test to determine whether the pooled effect or FEmodel was the most appropriate to use in estimating panel data, the modified Wald test toestablish whether the residual in the estimated FE model was homoscedastic, and the testfor cross-sectional dependence (CD).
3.2. Model Specification
The models used to test the relationship between financial performances and workingcapital management strategies are as follows:
Model 1: ROA = β0 + β1 AAIit + β2 ACPit + β3 APPit + β4LEVit + β5SIZEit + β6CRit + εit (1)
Model 2: ROE = β0 + β1 AAIit + β2 ACPit + β3 APPit + β4LEVit + β5SIZEit + β6CRit + εit (2)
Model 3: NOPM = β0 + β1 AAIit + β2 ACPit + β3 APPit + β4LEVit + β5SIZEit + β6CRit + εit (3)
3.3. Diagnostic Tests
Several tests were conducted on the pooled OLS, fixed effects, and random effectsmodels. These included the tests for the joint validity of the cross-sectional individualeffects, the Breusch and Pagan (1980, p. 239) LM test for random effects, and the Hausman(1978, p. 1251) specification test for heteroscedasticity.
4. Empirical Results4.1. Descriptive Statistics
Table 2 displays the summary of the descriptive statistics for the variables’ centralmeasures of tendencies, such as the mean, median, standard deviation, and minimum andmaximum values for the sample of retail firms under consideration.

Risks 2022, 10, 63 8 of 17
Table 2. Summary of descriptive statistics.
Variable Mean Median Standard Deviation Minimum Maximum
NOPM 0.0710 0.0634 0.2170 −0.9644 0.6660ROA 0.0863 0.0877 0.1260 −0.5256 0.3312ROE 0.2023 0.2169 0.2777 −1.2907 2.1256CCC 81.82 28.51 117.99 −65.10 611.00ACP 81.32 36.00 112.62 3.00 677.00AAI 38.62 41.36 23.58 0 127.62APP 34.81 33.00 19.40 0 103.00LEV 0.5275 0.5550 0.2252 0.0900 0.9300CR 2.06 1.34 1.45 0.53 6.82
On average, the South African retail firms achieved a CCC of 81.82 days, with min-imum and maximum values ranging from −65.10 days to 611 days, respectively. Thisimplies that there was a high variability in CCC, possibly because of the different creditpolicies of the retail firms.
The results showed that South African retail firms took 49.81 days, on average, tocollect from debtors. This means that the retail firms had to wait for more than a month aftertheir credit sales. The AAI, which measured how long it took to sell the goods recordedby South African retail firms, was, on average, 42.08 days, with 0 minimum days and amaximum of 127.62 days.
The mean value of the APP reported by the South African retail firms was 37.77 days,with a median value of 35.97 days. What stands out is that the mean and median valueswere almost identical, indicating a symmetrical data distribution. The minimum value ofthe APP recorded by South African retail firms was 4 days, yet, on the other hand, 103 dayswas the maximum value recorded.
The average ROA for the South African retail firms listed on the JSE was 8.63 percent,which implies that every rand invested in assets generated R8.63 in earnings. The SouthAfrican retail firms recorded an ROE of 20.23%, on average, which showed efficiency inthe use of shareholders’ capital. Furthermore, the South African retail firms in the currentstudy achieved a NOPM of 7.10% on average.
From these findings, it appears that the ROE achieved by South African retail firms washigher and above both the ROA and the NOPM as profitability measures. This indicatesthat South African firms were using shareholders’ equity effectively and resourcefully togenerate income.
The trends in the retail sector are depicted in Figures 1–3. The average financialperformance of the South African retail firms can be seen from the NOPM, ROA, and ROE.
Risks 2022, 10, x FOR PEER REVIEW 9 of 17
fall in the NOPM was experienced in 2017. This may have been due to a decline in real gross domestic product, which affects the purchasing power of consumers, and which might lead to a decline in revenues. Furthermore, the declining trend continued until 2018. In 2019, there was a slight increase in NOPM.
Figure 1. Trends in net operating profit margin
Figure 2 depicts the trends in the ROA of the South African retail firms for the period under consideration. The figures are given as percentages of ROA. Overall, the ROA was positive during these years, which shows the efficient use of assets to generate revenue. When examining the trends over time, it is evident that from 2010 to 2012, the ROA in-creased dramatically from 5.8% to 13% (the highest ROA recorded during the 10-year pe-riod). This could have been due to the economic growth experienced during this period, which resulted in enhanced sales and, therefore, increased revenues. However, after reaching its peak in 2012, ROA slowed down from 2012 until 2015. Between 2016 and 2018, there was a decline in ROA, which may be attributed to reduced profit levels.
Figure 2. Trends in return on assets.
The trends in ROE for the South African retail firms are presented in Figure 3. It is evident that a positive ROE was achieved over the period under study by the South Afri-can retail firms. There was a steady positive trend in ROE throughout the study period. The positive ROE indicates that the retail firms were efficient at using equity to generate income and grow the shareholder capital invested in the firms. The ROE ranged from 6% to 32%, with the highest recorded in 2017 and the lowest in 2018. Between 2010 and 2011, a rise in ROE from 12.5% to 23% was experienced. In 2012, the ROE for the sector grew by 4%, but slowed down to 22% in 2013 and grew slightly, by 2%, in 2014. During the 2015 fiscal year, the average ROE lowered to 21%. The ROE of 2016 was level with that of 2013, at 22%. The South African retail firms recorded their peak ROE in 2017, at 32%, a significant
Figure 1. Trends in net operating profit margin.

Risks 2022, 10, 63 9 of 17
Risks 2022, 10, x FOR PEER REVIEW 9 of 17
fall in the NOPM was experienced in 2017. This may have been due to a decline in real gross domestic product, which affects the purchasing power of consumers, and which might lead to a decline in revenues. Furthermore, the declining trend continued until 2018. In 2019, there was a slight increase in NOPM.
Figure 1. Trends in net operating profit margin
Figure 2 depicts the trends in the ROA of the South African retail firms for the period under consideration. The figures are given as percentages of ROA. Overall, the ROA was positive during these years, which shows the efficient use of assets to generate revenue. When examining the trends over time, it is evident that from 2010 to 2012, the ROA in-creased dramatically from 5.8% to 13% (the highest ROA recorded during the 10-year pe-riod). This could have been due to the economic growth experienced during this period, which resulted in enhanced sales and, therefore, increased revenues. However, after reaching its peak in 2012, ROA slowed down from 2012 until 2015. Between 2016 and 2018, there was a decline in ROA, which may be attributed to reduced profit levels.
Figure 2. Trends in return on assets.
The trends in ROE for the South African retail firms are presented in Figure 3. It is evident that a positive ROE was achieved over the period under study by the South Afri-can retail firms. There was a steady positive trend in ROE throughout the study period. The positive ROE indicates that the retail firms were efficient at using equity to generate income and grow the shareholder capital invested in the firms. The ROE ranged from 6% to 32%, with the highest recorded in 2017 and the lowest in 2018. Between 2010 and 2011, a rise in ROE from 12.5% to 23% was experienced. In 2012, the ROE for the sector grew by 4%, but slowed down to 22% in 2013 and grew slightly, by 2%, in 2014. During the 2015 fiscal year, the average ROE lowered to 21%. The ROE of 2016 was level with that of 2013, at 22%. The South African retail firms recorded their peak ROE in 2017, at 32%, a significant
Figure 2. Trends in return on assets.
Risks 2022, 10, x FOR PEER REVIEW 10 of 17
increase, of approximately 10%, compared to all the other years. The retail firms’ ROE was significantly lower in 2018, at 6%, the highest drop observed during the study period. A decline in ROE could be because of an increase in debt. In other words, equity is equal to assets minus liabilities; therefore, an increase in debt reduces equity, which is the denomi-nator in ROE. Thereafter, in 2019, an increase in ROE was achieved, with approximately 14% in 2019.
Figure 3. Trends in return on equity.
Leverage indicates the amount of debt applied by a company to finance assets. The trend in leverage is depicted in Figure 4, the least being in 2012 and 2013, at 48%, and the highest being in 2016, at approximately 57%. The figure displays that the South African retail firms’ leverage ratio was more than 50% for the period under review, except in 2012 and 2013, which recorded almost 48%, suggesting that nearly half of the firms’ assets were financed by debt.
Figure 4. Trends in leverage.
The trend shows a steady increase in the use of debt to finance company assets, from 48% in 2013 until it reached its peak, of 57%, in 2016; it then fell to a low of 51% in 2017, before it increased again, to 52%, in 2018. However, the trend was reversed slightly in 2019, although the debt ratio remained above 50%. This could have been because of an increased use of retained earnings to finance the firms’ assets.
Figure 3. Trends in return on equity.
Figure 1 depicts the trends in NOPM for the 10-year consecutive period from 2010to 2019 for South Africa retail firms. The sector reported a positive NOPM from 2010 to2019. In 2010, South African retail firms achieved a 7% NOPM on average. The NOPMwent up from 7% in 2010 to 12% in 2011. As depicted in Figure 1, there was a fluctuation inthe NOPM between 2011 and 2013. This fluctuation ended in 2013; thereafter, a decline wasexperienced in 2014 relative to the three preceding years. This necessitates firms increasingtheir revenue or decreasing the cost of their goods sold. In the two years up to 2015, theNOPM remained constant, close to 7%. Compared to the previous three years, a rapid fallin the NOPM was experienced in 2017. This may have been due to a decline in real grossdomestic product, which affects the purchasing power of consumers, and which might leadto a decline in revenues. Furthermore, the declining trend continued until 2018. In 2019,there was a slight increase in NOPM.
Figure 2 depicts the trends in the ROA of the South African retail firms for the periodunder consideration. The figures are given as percentages of ROA. Overall, the ROA waspositive during these years, which shows the efficient use of assets to generate revenue.When examining the trends over time, it is evident that from 2010 to 2012, the ROAincreased dramatically from 5.8% to 13% (the highest ROA recorded during the 10-yearperiod). This could have been due to the economic growth experienced during this period,which resulted in enhanced sales and, therefore, increased revenues. However, afterreaching its peak in 2012, ROA slowed down from 2012 until 2015. Between 2016 and 2018,there was a decline in ROA, which may be attributed to reduced profit levels.
The trends in ROE for the South African retail firms are presented in Figure 3. It isevident that a positive ROE was achieved over the period under study by the South Africanretail firms. There was a steady positive trend in ROE throughout the study period. The

Risks 2022, 10, 63 10 of 17
positive ROE indicates that the retail firms were efficient at using equity to generate incomeand grow the shareholder capital invested in the firms. The ROE ranged from 6% to 32%,with the highest recorded in 2017 and the lowest in 2018. Between 2010 and 2011, a rise inROE from 12.5% to 23% was experienced. In 2012, the ROE for the sector grew by 4%, butslowed down to 22% in 2013 and grew slightly, by 2%, in 2014. During the 2015 fiscal year,the average ROE lowered to 21%. The ROE of 2016 was level with that of 2013, at 22%. TheSouth African retail firms recorded their peak ROE in 2017, at 32%, a significant increase, ofapproximately 10%, compared to all the other years. The retail firms’ ROE was significantlylower in 2018, at 6%, the highest drop observed during the study period. A decline in ROEcould be because of an increase in debt. In other words, equity is equal to assets minusliabilities; therefore, an increase in debt reduces equity, which is the denominator in ROE.Thereafter, in 2019, an increase in ROE was achieved, with approximately 14% in 2019.
Leverage indicates the amount of debt applied by a company to finance assets. Thetrend in leverage is depicted in Figure 4, the least being in 2012 and 2013, at 48%, and thehighest being in 2016, at approximately 57%. The figure displays that the South Africanretail firms’ leverage ratio was more than 50% for the period under review, except in 2012and 2013, which recorded almost 48%, suggesting that nearly half of the firms’ assets werefinanced by debt.
Risks 2022, 10, x FOR PEER REVIEW 10 of 17
increase, of approximately 10%, compared to all the other years. The retail firms’ ROE was significantly lower in 2018, at 6%, the highest drop observed during the study period. A decline in ROE could be because of an increase in debt. In other words, equity is equal to assets minus liabilities; therefore, an increase in debt reduces equity, which is the denomi-nator in ROE. Thereafter, in 2019, an increase in ROE was achieved, with approximately 14% in 2019.
Figure 3. Trends in return on equity.
Leverage indicates the amount of debt applied by a company to finance assets. The trend in leverage is depicted in Figure 4, the least being in 2012 and 2013, at 48%, and the highest being in 2016, at approximately 57%. The figure displays that the South African retail firms’ leverage ratio was more than 50% for the period under review, except in 2012 and 2013, which recorded almost 48%, suggesting that nearly half of the firms’ assets were financed by debt.
Figure 4. Trends in leverage.
The trend shows a steady increase in the use of debt to finance company assets, from 48% in 2013 until it reached its peak, of 57%, in 2016; it then fell to a low of 51% in 2017, before it increased again, to 52%, in 2018. However, the trend was reversed slightly in 2019, although the debt ratio remained above 50%. This could have been because of an increased use of retained earnings to finance the firms’ assets.
Figure 4. Trends in leverage.
The trend shows a steady increase in the use of debt to finance company assets, from48% in 2013 until it reached its peak, of 57%, in 2016; it then fell to a low of 51% in 2017,before it increased again, to 52%, in 2018. However, the trend was reversed slightly in 2019,although the debt ratio remained above 50%. This could have been because of an increaseduse of retained earnings to finance the firms’ assets.
The movements of the working capital management components over a ten-yearperiod are depicted in Figure 5. The cash conversion cycle (CCC) showed an upward trendfrom 2011–2016; it then started to decline until 2019. The increase in CCC was accompaniedby higher levels of average collection period (ACP) and average age of inventories (AAI)with low average payment periods (APPs) throughout the study period. Thus, it is evidentthat the series exhibited some form of a conservative working capital management strategy.
An aggressive cash conversion cycle strategy comprises the pursuit of shorter ACPand AAI while relying heavily on shorter-term financing from trade payables throughlonger APP. A more conservative CCC strategy, on the other hand, entails holding highvolumes of trade receivables and inventories while relying on short-term credit financing.A conservative CCC strategy is essentially a reflection of the use of long ACP, AAI, andshorter APP.

Risks 2022, 10, 63 11 of 17
Risks 2022, 10, x FOR PEER REVIEW 11 of 17
The movements of the working capital management components over a ten-year pe-riod are depicted in Figure 5. The cash conversion cycle (CCC) showed an upward trend from 2011–2016; it then started to decline until 2019. The increase in CCC was accompa-nied by higher levels of average collection period (ACP) and average age of inventories (AAI) with low average payment periods (APPs) throughout the study period. Thus, it is evident that the series exhibited some form of a conservative working capital management strategy.
Figure 5. Trends in working capital management components.
An aggressive cash conversion cycle strategy comprises the pursuit of shorter ACP and AAI while relying heavily on shorter-term financing from trade payables through longer APP. A more conservative CCC strategy, on the other hand, entails holding high vol-umes of trade receivables and inventories while relying on short-term credit financing. A con-servative CCC strategy is essentially a reflection of the use of long ACP, AAI, and shorter APP.
4.2. Empirical Findings Before estimating the relationship between financial performance and working capi-
tal management, diagnostic tests were performed. The panel regressions were estimated using three models, namely pooled OLS and RE and FE models. The diagnostic tests were performed to choose the preferred model.
The results are presented in Tables 3–6. The regression models employed NOPM, ROA, and ROE as the performance indicators and CCC, AAI, ACP, and APP as the measures for working capital management.
Table 3. Panel regression results with NOPM ratio as the dependent variable.
Dependent Variable Pooled-OLS Random-Effects Fixed-Effects
NOPM NOPM NOPM
ACP −0.0019 ***
(−6.24) −0.0020 ***
(−4.98) −0.0024 ***
(−4.21)
AAI −0.0017 *** (−3.19)
−0.0022 *** (−3.17)
−0.0024 *** (−3.10)
APP −0.0006 (−0.76)
−0.0014 * (−1.65)
−0.0013 (−1.51)
SIZE 0.0169 **
(2.38) 0.0160 (1.51)
0.0007 (0.05)
LEV −0.0480 (−0.44)
0.0575 (0.50)
0.1917 (1.57)
Figure 5. Trends in working capital management components.
4.2. Empirical Findings
Before estimating the relationship between financial performance and working capitalmanagement, diagnostic tests were performed. The panel regressions were estimatedusing three models, namely pooled OLS and RE and FE models. The diagnostic tests wereperformed to choose the preferred model.
The results are presented in Tables 3–6. The regression models employed NOPM, ROA,and ROE as the performance indicators and CCC, AAI, ACP, and APP as the measures forworking capital management.
Table 3. Panel regression results with NOPM ratio as the dependent variable.
Dependent Variable Pooled-OLS Random-Effects Fixed-EffectsNOPM NOPM NOPM
ACP −0.0019 ***(−6.24)
−0.0020 ***(−4.98)
−0.0024 ***(−4.21)
AAI −0.0017 ***(−3.19)
−0.0022 ***(−3.17)
−0.0024 ***(−3.10)
APP −0.0006(−0.76)
−0.0014 *(−1.65)
−0.0013(−1.51)
SIZE 0.0169 **(2.38)
0.0160(1.51)
0.0007(0.05)
LEV −0.0480(−0.44)
0.0575(0.50)
0.1917(1.57)
CR 0.0798 ***(4.10)
0.0561 ***(2.74)
0.0260(1.19)
Constant −0.1524(−1.46)
−0.0946(−0.61)
0.1497(0.70)
Number 140 140 140
Adjusted R2 0.5476 0.5102 0.2450
F-statistic 6.06 ****, **, and *** indicate the 10%, 5%, and 1% level of significance, respectively. Time dummies estimated for the FEand RE models are not reported here. The t-statistics for the pooled and FE models, as well as the z-statistics forthe RE models, are reported in parentheses.

Risks 2022, 10, 63 12 of 17
Table 4. Panel regression results with ROA as the dependent variable.
Dependent Variable Pooled-OLS Random-Effects Fixed-EffectsROA ROA ROA
ACP −0.0002(−0.78)
0.0002(0.69)
−0.0024 ***(−4.21)
AAI 0.0002(0.62)
0.0012 **(2.05)
−0.0024 ***(−3.10)
APP −0.0008(−1.17)
−0.0010(−1.52)
−0.0013(−1.51)
SIZE 0.0247 ***(4.14)
0.0169 *(1.89)
0.0007(0.05)
LEV −0.0141(−0.15
0.0169(0.18)
0.1917(1.57)
CR 0.0431 ***(2.66)
0.0286 *(1.68)
0.0260(1.19)
Constant −0.3331 ***(−3.82)
−0.2540 *(−1.93)
0.1497(0.70)
Number 140 140 140
Adjusted R2 0.3070 0.2239 0.2450
F-statistic 6.06 ****, **, and *** indicate the 10%, 5%, and 1% level of significance, respectively. Time dummies estimated for the FEand RE models are not reported here. The t-statistics for the pooled and FE models, as well as the z-statistics forthe RE models, are reported in parentheses.
Table 5. Panel regression results with ROE as the dependent variable.
Dependent Variable Pooled-OLS Random-Effects Fixed-EffectsROE ROE ROE
ACP −0.0008(−1.45)
−0.0007(−1.45)
−0.0003(−0.27)
AAI −0.0010(−0.90)
0.0010(0.15)
0.0017(1.01)
APP −0.0037 **(−2.29)
−0.0041 **(−2.41)
−0.0042 **(−1.51)
SIZE 0.0452 ***(3.10)
0.0464 **(2.35)
0.0430(1.30)
LEV 0.1708(0.76)
−0.0730(−0.31)
−0.2888(−1.06)
CR 0.0501(1.27)
0.0222(0.52)
0.0168(0.34)
Constant −0.4414 ***(−2.07)
−0.3144(−1.09)
−0.2170(−0.46)
Number 140 140 140
Adjusted R2 0.1412 0.1556 0.0854
F-statistic 1.82 ***** and *** indicate the 5% and 1% level of significance, respectively. Time dummies estimated for the FE and REmodels are not reported here. The t-statistics for the pooled and FE models, as well as the z-statistics for the REmodels, are reported in parentheses.
Risks 2022, 10, 63 13 of 17
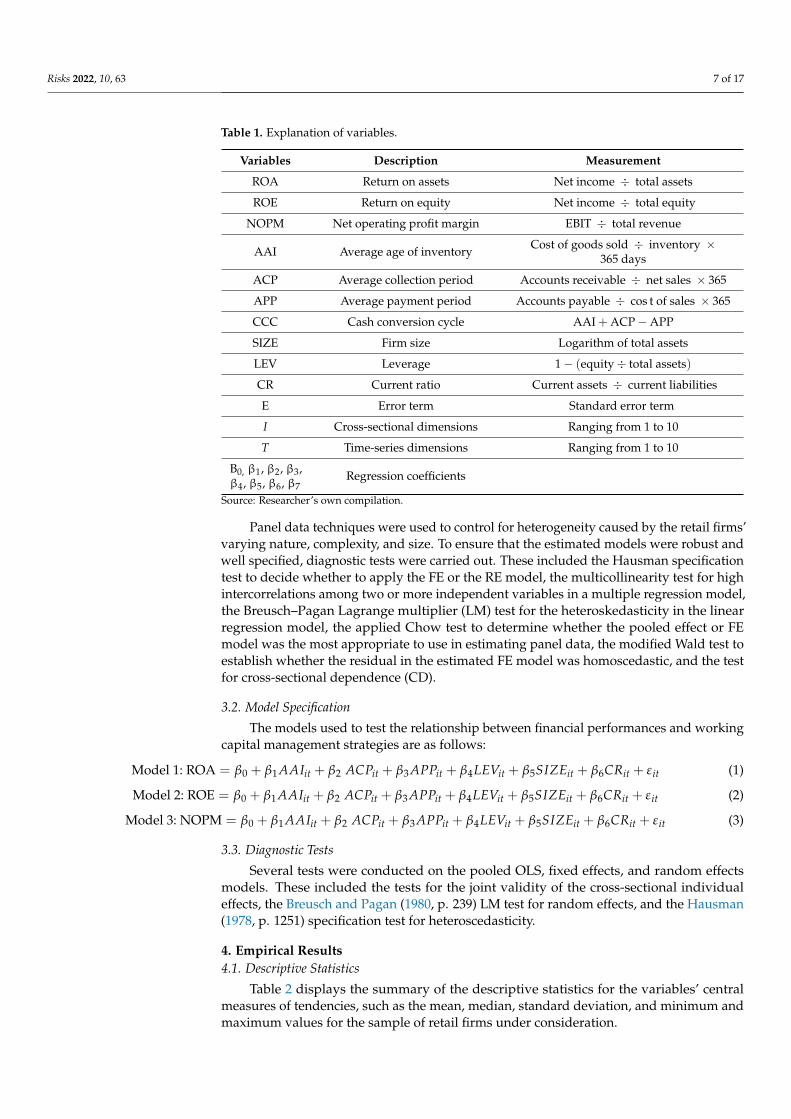
Table 6. Summary of the key results.
Dependent Variables IndependentVariables Coefficient Effect and
Significance
ROA AAI −0.0024 *** Negative ***ACP −0.0024 *** Negative ***APP −0.0013 Negative
ROE AAI 0.0017 PositiveACP −0.0003 NegativeAPP −0.0042 ** Negative **
NOPM AAI −0.0024 *** Negative **ACP −0.0024 *** Negative **APP −0.0013 Negative
** Significant at 5%, and *** significant at 1%.
Table 3 presents the panel regression results with NOPM as the dependent variable. Intesting the relationship between financial performance proxied by NOPM with ACP, it wasestablished that they were inversely related. This finding is consistent with the findingsof Samiloglu and Akgün (2016) who found a significant negative relationship betweenACP and NOPM. This implies that early collection from customers improves a firm’sperformance by providing cash flow to support both operational and financing activities.The FE estimator revealed that a 1% increase in ACP and AAI resulted in a 0.24 percentdecrease in NOPM, which was statistically significant at the 1% level of significance. Thisbolstered the argument that the shorter the ACP and AAI, the higher the asset turnover,and thus the higher the profitability. An increase in AAP, on the other hand, resultedin a decline.
The results are summarized in Table 6. The results from all the regressions indicatethat the average collection period and financial performance had a negative relationshipon the retail firms’ NOPM, ROA, and ROE. A negative relationship between average ageof inventory and financial performance measures (NOPM and ROA) was found. Theaverage payment period was found to be negatively related to return on equity and thecash conversion cycle and the NOPM variables were found to be negatively related.
For ACP and NOPM, it was established that the values were inversely related. Thisfinding is consistent with the findings of Samiloglu and Akgün (2016), who found asignificant negative relationship between ACP and NOPM. This implies that early collectionfrom customers improves a firm’s performance by providing cash flow to support bothoperational and financing activities. The FE estimator revealed that a 1% increase in ACPand AAI resulted in a 0.24 percent decrease in NOPM, which was statistically significant at1% level of significance. This bolstered the argument that the shorter the ACP and AAI, thehigher the asset turnover and, thus, the higher the profitability. An increase in AAP, on theother hand, resulted in a decline in NOPM.
The test results confirmed an inverse relationship between ROA and ACP, which washighly significant at the 1% level of significance. In addition, ROA and AAI were also foundto be negatively related, and the relationship was statistically significant. The researchfindings are aligned with those of Kasozi (2017), Louw et al. (2016), and Mabandla (2018).On the other hand, Yahaya (2016) found that both accounts receivable and inventory weresignificantly and positively related with financial performance.
The regression results suggested an inverse relationship between ROE and APP, whichwas statistically significant at a 5% level of significance. These findings were consistent withKraus and Litzenberger’s (1973) trade-off theory, which states that an increase in accountspayable will increase the risk of bankruptcy and financial distress and, hence, reduces thevalue of a firm.
The results of this study indicated that reducing working capital investment wouldpositively affect the profitability of firms. These findings resonate with those of Louw et al.(2016), who analyzed the working capital management of South African retail firms and

Risks 2022, 10, 63 14 of 17
asserted that a strategy of reducing investment in inventories appears to improve theprofitability of South African retail firms.
The general interpretation of the results shows that a relationship existed betweenworking capital management and the performance of South African retail firms.
It can therefore be inferred that the financial performance of South African retailfirms is a function of AAI. These findings are aligned with the view that reducing thedays in stock holdings improves profitability. Among others, Mehtap (2016), Garg andGumbochuma (2015), and Louw et al. (2016) found an inverse association between AAIand financial performance.
The study found that ACP and financial performance had an inverse relationship.Similar results were also reported by Deloof (2003), Lazaridis and Tryfonidis (2006), andKasozi (2017), who also found a negative relationship. This strand of studies suggests thatfirms can improve their financial performance by decreasing ACP. This can be construedas follows. The less time it takes for customers to settle their outstanding accounts, themore cash is available for other business projects, which increases profitability. However,by contrast, a positive relationship between the accounts collection period and profitabilitywas documented by Yahaya (2016) and Agha (2014), among others.
We examined the relationship between APP and the financial performance of SouthAfrican retail firms. The results showed a negative relationship between APP and financialperformance. An inverse relationship was established by studies such as those of Temtime(2016), Yahaya (2016), and Rezaei and Pourali (2015), among others. On the other hand,studies carried out by Moodley et al. (2017) and Louw et al. (2016) documented a positiveassociation between APP and financial performance. In addition, Achode and Rotich (2016)also found a positive relationship between accounts payable and firm performance.
Firms choose different policies to support their working capital. Nyabuti and Alala(2014) affirm that a firm can adopt either an aggressive or a conservative working capitalmanagement policy. The empirical findings demonstrated the need for an aggressiveworking capital management policy, which requires a minimum level of trade receivablesand inventories. The findings suggested that reducing the components of working capitalmanagement improves firm performance.
5. Conclusions
This paper investigated the nexus between financial performances and working capitalmanagement strategies in retail firms in South Africa. The results documented that workingcapital management strategies have a significant impact on the financial performances ofretail firms. Thus, it can be concluded that the financial performances of the South Africanretail firms were a result of their working capital management components.
It can therefore be concluded that South African firms can improve their financialperformance by optimizing their working capital components, such as AAI, ACP, and APP,as far as possible without risking the loss of customers or suppliers.
The findings of this study contribute to plugging the knowledge gap on the interactionbetween WCM and financial performance within the context of South Africa. This researchalso contributes to a better understanding of the link between working capital managementand financial performance. Working capital management practices will be improved inorder to increase financial performance and the long-term viability of the firm.
The practical implications of this study are that firms’ decision makers should considerthe importance of working capital management strategies to accelerate firm performanceand ensure financial sustainability. The findings of this study documented that workingcapital components affect financial performance to varying degrees and significance levels.As such, the contribution of this study lies in helping investors and managers to understandthat working capital components influence profitability and the risk–return trade-offsinvolved in their investment decisions.

Risks 2022, 10, 63 15 of 17
Firms should invest more in current assets over current liabilities to act as a buffer forunexpected financial commitments. Likewise, firms should ensure that their net workingcapital (current assets minus current liabilities) is always positive.
Despite the existence of several studies on working capital management and financialperformance, it remains an important area warranting further research. This study opensareas for future research in several ways. Firstly, the findings of this study are based onJSE-listed retail firms. Therefore, the results cannot be generalized for firms that are notlisted on the JSE. Future research could also include retail firms that are not listed on the JSE.
Secondly, the sample size comprises only retail firms. Therefore, the results are validfor retail firms. Similar further research should be extended to cover other sectors, such asmanufacturing, mining, agriculture, finance, and industry, in order to form a comparison,since retail firms involve fast-moving consumer goods (FMCG) that require more workingcapital. Moreover, such research could also cover other firm-specific factors that were notaddressed by this study, such as asset tangibility and dividend-paying ability, as well asother factors that could have a bearing on firm liquidity.
Author Contributions: Conceptualization, G.M. and A.B.S.; methodology, G.M. and A.B.S.; software,G.M. and A.B.S.; validation, A.B.S. and G.M.; formal analysis, G.M.; investigation, G.M.; resources,G.M.; data curation, G.M.; writing—original draft preparation, G.M. and A.B.S. writing—review andediting, G.M. and A.B.S.; visualization, G.M.; supervision, A.B.S.; project administration, G.M.; fund-ing acquisition, A.B.S. All authors have read and agreed to the published version of the manuscript.
Funding: The APC was funded by the University of South Africa.
Data Availability Statement: Data available upon request.
Conflicts of Interest: The authors declare no conflict of interest.
ReferencesAchode, Benjamin Malingu, and Gladys Rotich. 2016. Effects of accounts payable as source of financing on performance of listed
manufacturing firms at the Nairobi Securities Exchange. International Journal of Research Studies in Agricultural Sciences 2: 24–32.Adam, Anokye M., Edward Quansah, and Seyram Kawor. 2017. Working capital management policies and returns of listed
manufacturing firms in Ghana. Scientific Annals of Economics and Business 64: 255–69. [CrossRef]Afrifa, Godfred Adjapong, Venancio Tauringana, and Ishmael Tingbani. 2014. Working capital management and performance of listed
SMEs. Journal of Small Business & Entrepreneurship 27: 557–78.Agha, Hasan. 2014. Impact of working capital management on profitability. European Scientific Journal 10: 374–81.Akbar, Ahsan, Minhas Akbar, Marina Nazir, Petra Poulova, and Samrat Ray. 2021. Does Working Capital Management Influence
Operating and Market Risk of Firms? Risks 9: 201. [CrossRef]Aktas, Nihat, Ettore Croci, and Dimitris Petmezas. 2015. Is working capital management value-enhancing? Evidence from firm
performance and investments. Journal of Corporate Finance 30: 98–113. [CrossRef]Al-Abass, Hassan Subhi. 2018. Effect of working capital management on profitability of cement sector listed companies. International
Journal of Academic Research in Accounting, Finance and 125 Management Sciences 8: 137–42. [CrossRef]Aravind, M. 2016. Influence of working capital metrics on profitability: A critical examination on Indian manufacturing sector. Kelaniya
Journal of Management 5: 58–80. [CrossRef]Besley, Scott, and Eugene. F. Brigham. 2013. Principles of Finance. Boston: Cengage Learning.Breusch, Trevor S., and Adrian R. Pagan. 1980. The Lagrange multiplier test and its applications to model specification in econometrics.
The Review of Eonomic Studies 47: 239–53. [CrossRef]Chang, Chong-Chuo, Tai-Yung Kam, Yu-Cheng Chang, and Chen-Chen Liu. 2019. Effects of the 2008 Financial Crisis on the Working
Capital Management Policy of US Enterprises. International Journal of Business and Economics 18: 121–39.Chen, Chongyang, and Robert Kieschnick. 2018. Bank credit and corporate working capital management. Journal of Corporate Finance
48: 579–96. [CrossRef]Deloof, Marc. 2003. Does working capital management affect the profitability of Belgian firms? Journal of Business Finance & Accounting
30: 573–88.Dhole, Sandip, Sagarika Mishra, and Ananda Mohan Pal. 2019. Efficient working capital management, financial constraints, and firm
value: A text-based analysis. Pacific-Basin Finance Journal 58: 101–212. [CrossRef]Enqvist, Julius, Michael Graham, and Jussi Nikkinen. 2014. The impact of working capital management on firm profitability in different
business cycles: Evidence from Finland. Research in International Business and Finance 32: 36–49. [CrossRef]Fisher, Irving. 1930. The Theory of Interest as Determined by Impatience to Spend Income and Opportunity to Invest it. Bulletin of the
American Mathematical Society 36: 783–84.

Risks 2022, 10, 63 16 of 17
García-Teruel, Pedro Juan, and Pedro Martínez-Solano. 2007. Effects of working capital management on SME profitability. InternationalJournal of Managerial Finance 3: 164–77. [CrossRef]
Garg, Ajay. K., and Mr. Innocent Gumbochuma. 2015. Relationship between working capital management and profitability in JSElisted retail sector companies. Investment Management and Financial Innovations 12: 127–35.
Gujarati, Damodar N. 2003. Basic Econometrics. New York: McGraw-Hill, pp. 363–69.Hausman, Jerry A. 1978. Specification tests in econometrics. Econometrica: Journal of the Econometric Society 46: 1251–71. [CrossRef]Irene, Awunya Rose, and Herick Ondigo. 2018. The effect of working capital management policies on financial performance of
commercial and services sector firms listed at the Nairobi Securities Exchange. International Journal of Economics, Commerce andManagement 5: 113–42.
Kasozi, Jason. 2017. The effect of working capital management on profitability: A case of listed manufacturing firms in South Africa.Investment Management and Financial Innovations 14: 336–46. [CrossRef]
Kraus, Alan, and Robert H. Litzenberger. 1973. A state-preference model of optimal financial leverage. The Journal of Finance 28: 911–22.[CrossRef]
Kwenda, Farai. 2017. Working capital investment and firm value relationship: A non-linear perspective. Journal of Insurance andFinancial Management 3: 44–65.
Kwenda, Farai, and Ephraim Matanda. 2015. Working capital management in a liquidity constrained economy: A case of ZimbabweStock Exchange listed firms in the multiple currency era. Public and Municipal Finance 4: 55–65.
Lazaridis, Ioannis, and Dimitrios Tryfonidis. 2006. Relationship between working capital management and profitability of listedcompanies in the Athens Stock Exchange. Journal of Financial Management and Analysis 19: 26–35.
Louw, Elmarie, John Hall, and Leon Brümmer. 2016. Working capital management of South African retail firms. Journal of Economic andFinancial Sciences 9: 545–60. [CrossRef]
Mabandla, Ndonwabile Zimasa. 2018. The Relationship between Working Capital Management and the Financial Performance ofListed Food and Beverage Companies in South Africa. Master’s dissertation, University of South Africa, Pretoria, South Africa.
Makori, Daniel Mogaka, and Ambrose Jagongo. 2013. Working capital management and firm profitability: Empirical evidence frommanufacturing and construction firms listed on Nairobi securities exchange, Kenya. International Journal of Accounting and Taxation1: 1–14.
Mehtap, Öner. 2016. The impact of working capital management on firm profitability: Empirical evidence from Borsa Istanbul. Siyaset,Ekonomi ve Yönetim Arastırmaları Dergisi 4: 63–79.
Mengesha, Wobshet. 2014. Impact of Working Capital Management on Firms’ Performance: The Case of Selected Metal ManufacturingCompanies in Addis Ababa, Ethiopia. Doctoral dissertation, Jimma University, Addis Ababa, Ethiopia.
Moodley, Taryn, Mike Ward, and Chris Muller. 2017. The relationship between the management of payables and the return to investors.South African Journal of Accounting Research 31: 35–43. [CrossRef]
Morara, Kamanda, and Athenia Bongani Sibindi. 2021. Determinants of Financial Performance of Insurance Companies: EmpiricalEvidence Using Kenyan Data. Journal of Risk and Financial Management 14: 566. [CrossRef]
Mukaddam, Shaa’ista, and Athenia Bongani Sibindi. 2020. Corporate governance quality and financial performance of retail firms:Evidence using South African data. Academy of Accounting and Financial Studies Journal 24: 1–15.
Nyabuti, Winnie Mokeira, and Ondiek Benedict Alala. 2014. The relationship between working capital Management policy andfinancial performance of companies quoted at the Nairobi Securities Exchange, Kenya. International Journal of Economics, Financeand Management Sciences 2: 212–19. [CrossRef]
Paramasivan, C., and T. Subramanian. 2009. Financial Management. New Delhi: New Age International (Pty) Ltd.Raheman, Abdul, and Mohamed Nasr. 2007. Working capital management and profitability: Case of Pakistani firms. Review of Business
Research Papers 3: 279–300.Rehn, Erick. 2012. Effects of Working Capital Management on Company Profitability: An Industry-Wise Study of Finnish and Swedish
Public Companies. Master’s thesis, Department of Accounting, Hanken School of Economics, Helsinki, Finland.Rezaei, Marziyeh, and Mohammad Reza Pourali. 2015. The relationship between working capital management components and
profitability: Evidence from Iran. European Online Journal of Natural and Social Sciences: Proceedings 4: 342–51.Samiloglu, Famil, and Ali Ihsan Akgün. 2016. The relationship between working capital management and profitability: Evidence from
Turkey. Business and Economics Research Journal 7: 1–14. [CrossRef]Sathyamoorthi, Christian J., Mogotsinyana Mapharing, and Popo Selinkie. 2018. The impact of working capital management on
profitability: Evidence from the listed retail in Botswana. Applied Finance and Accounting 4: 82–94.Stats SA (Statistics South Africa). 2021. Retail Trade Statistics: First Quarter 2021. Available online: www.statssa.gov.za (accessed on 15
December 2021).Tanveer, Bagh, Muhammad Imran Nazir, Muhammad Asif Khan, Muhammad Atif Khan, and Sadaf Razzaq. 2016. The impact of
working capital management on firms’ financial performance: Evidence from Pakistan. International Journal of Economics andFinancial Issues 6: 1097–105.
Temtime, Zelealem Tadesse. 2016. Relationship between Working Capital Management, Policies, and Profitability of Small Manufactur-ing Firms. Ph.D. dissertation, Walden University, Minneapolis, MN, USA.
Ukaegbu, Ben. 2014. The significance of working capital management in determining firm: Evidence from developing economies inAfrica. Research in International Business and Finance 31: 1–16. [CrossRef]

Risks 2022, 10, 63 17 of 17
Virkala, Ville. 2015. The Effect of Working Capital on Profitability in Computer and Electrical Industry. Master’s thesis, Aalto School ofBusiness, Espoo, Finland.
Yahaya, Adamu. 2016. Effects of working capital management on the financial performance of the pharmaceutical firms in Nigeria.International Journal of Economics, Commerce and Management 4: 349–67.
Zimon, Grzegorz. 2020. Management strategies of working capital in polish services providing companies. WSEAS Transactions onBusiness and Economics 17: 225–30. [CrossRef]
Zimon, Grzegorz, and Hossein Tarighi. 2021. Effects of the COVID-19 global crisis on the working capital management policy:Evidence from Poland. Journal of Risk and Financial Management 14: 169.
Copyright © 2022 FDOKUMEN