“Components of working capital and profitability in Saudi ...
12
“Components of working capital and profitability in Saudi Arabian companies” AUTHORS Abdul Rahman Shaik ARTICLE INFO Abdul Rahman Shaik (2021). Components of working capital and profitability in Saudi Arabian companies. Investment Management and Financial Innovations, 18(3), 52-62. doi:10.21511/imfi.18(3).2021.05 DOI http://dx.doi.org/10.21511/imfi.18(3).2021.05 RELEASED ON Thursday, 05 August 2021 RECEIVED ON Sunday, 04 July 2021 ACCEPTED ON Tuesday, 03 August 2021 LICENSE This work is licensed under a Creative Commons Attribution 4.0 International License JOURNAL "Investment Management and Financial Innovations" ISSN PRINT 1810-4967 ISSN ONLINE 1812-9358 PUBLISHER LLC “Consulting Publishing Company “Business Perspectives” FOUNDER LLC “Consulting Publishing Company “Business Perspectives” NUMBER OF REFERENCES 38 NUMBER OF FIGURES 0 NUMBER OF TABLES 6 © The author(s) 2021. This publication is an open access article. businessperspectives.org
-
Upload
khangminh22 -
Category
Documents
-
view
9 -
download
0
Transcript of “Components of working capital and profitability in Saudi ...

“Components of working capital and profitability in Saudi Arabian companies”
AUTHORS Abdul Rahman Shaik
ARTICLE INFO
Abdul Rahman Shaik (2021). Components of working capital and profitability in
Saudi Arabian companies. Investment Management and Financial Innovations,
18(3), 52-62. doi:10.21511/imfi.18(3).2021.05
DOI http://dx.doi.org/10.21511/imfi.18(3).2021.05
RELEASED ON Thursday, 05 August 2021
RECEIVED ON Sunday, 04 July 2021
ACCEPTED ON Tuesday, 03 August 2021
LICENSE
This work is licensed under a Creative Commons Attribution 4.0 International
License
JOURNAL "Investment Management and Financial Innovations"
ISSN PRINT 1810-4967
ISSN ONLINE 1812-9358
PUBLISHER LLC “Consulting Publishing Company “Business Perspectives”
FOUNDER LLC “Consulting Publishing Company “Business Perspectives”
NUMBER OF REFERENCES
38
NUMBER OF FIGURES
0
NUMBER OF TABLES
6
© The author(s) 2021. This publication is an open access article.
businessperspectives.org

52
Investment Management and Financial Innovations, Volume 18, Issue 3, 2021
http://dx.doi.org/10.21511/imfi.18(3).2021.05
Abstract
The study examines the influence of the cash conversion cycle (one of the components of working capital) on the firm profitability measured in terms of return on equity (ROE), return on assets (ROA), Tobin’s q, and gross operating profit (GROP) in the manufacturing sector of Saudi Arabia. The study selects a sample of 100 companies from nine industrial sectors listed on the Tadawul Stock Exchange starting from 2008 to 2019. A pooled regression is estimated to report the empirical results. The results re-port a positive and significant association between the components of working capital in terms of cash conversion cycle and the firm profitability in terms of ROA, ROE, and Tobin’s q, except for the GROP, where there is a negative and significant relationship. The study reports that the growth in firm performance is associated with supplier’s financing terms and inventory ordering cost. The results also show that larger firms are more profitable than smaller firms. Hence, the current study confirms the formulated hypothesis of having a significant association between the components of working capital and firm profitability.
Abdul Rahman Shaik (Saudi Arabia)
Components of working
capital and profitability
in Saudi Arabian companies
Received on: 4th of July, 2021Accepted on: 3rd of August, 2021Published on: 5th of August, 2021
INTRODUCTION
The functions of finance, such as profit maximization and wealth maximization, are based on three decisions, namely financing de-cisions, investment decisions, and dividend decisions. The liquidity and working capital management is an important component of fi-nancing decisions, where current assets and current liabilities have a significant role to play. Working capital management can also be termed short-term financial management (Ross et al., 2002; Samiloglu & Demirgunes, 2008). Cash is an important element of liquidity and is considered to a large extent a way to measure the performance of a company. The working capital efficiency affects the liquidity and profitability of a firm directly (Raheman & Nasr, 2007; Samiloglu & Demirgunes, 2008). The management of a firm’s working capital might be inaccurate; nevertheless, the firm profitability level is positive due to the motive of profit maximization.
Further, liquidity is considered an important factor determining working capital requirements and exhibits the firms’ ability to gener-ate cash. The traditional liquidity measures, such as the current ratio and acid-test ratio, do not provide sufficient information about oper-ating cash flow, which is significant in analyzing liquidity (Richards & Laughlin, 1980). Therefore, Schilling (1996) and Boer (1999) sug-gested the method of continued liquidity (cash inflows and outflows) through accounts receivable, inventory, and accounts payable, and de-scribed as a significant element in determining the working capital
© Abdul Rahman Shaik, 2021
Abdul Rahman Shaik, Assistant Professor, College of Business Administration, Prince Sattam Bin Abdulaziz University, Saudi Arabia.
This is an Open Access article, distributed under the terms of the Creative Commons Attribution 4.0 International license, which permits unrestricted re-use, distribution, and reproduction in any medium, provided the original work is properly cited.
www.businessperspectives.org
LLC “СPС “Business Perspectives” Hryhorii Skovoroda lane, 10, Sumy, 40022, Ukraine
BUSINESS PERSPECTIVES
JEL Classification L25, L61, L66, M11, M40, M41
Keywords return on assets, return on equity, Tobin’s q, gross operating profit, Tadawul, cash conversion cycle
Conflict of interest statement:
Author(s) reported no conflict of interest
53
Investment Management and Financial Innovations, Volume 18, Issue 3, 2021
http://dx.doi.org/10.21511/imfi.18(3).2021.05
efficiency. The continued liquidity process is termed a cash conversion cycle. This method measures the time taken between purchases of raw materials and the collection of cash from sales. The shorter the period between payment and collection, the lesser the inventory.
The cash conversion cycle is a common measure of working capital management. The longer the cash conversion cycle, the higher the profitability due to enhanced sales, but this might lead to higher invest-ment in working capital in terms of inventory holding costs (Deloof, 2003). Hence, the results reported by different studies demonstrate that the increase in operating performance is possible from a lower cash conversion cycle (Uyar, 2009; Caballero et al., 2012; Lee, 2015; Chang, 2018). Further, the firms with longer cash conversion cycles finance their operating working capital through short-term debt, and firms holding higher short-term debt shall fail during the economic crisis (Duchin et al., 2010; Almeida et al., 2012; Wang, 2019).
1. LITERATURE REVIEW
Korent and Orsag (2018) studied the relationship between working capital management and profit-ability in Croatia’s software companies. Significant effects of working capital management on profita-bility were found and the existence of a quadratic and non-linear association between the ROA and the working capital was evidenced. Similarly, the determinants of working capital without consider-ing control variables shall have a significant posi-tive relationship with profitability, while the result is vice-versa when the control variables are used (Maeenuddin et al., 2020). Yameen et al. (2019) in-vestigated the association of liquidity and profita-bility of pharmaceutical companies listed on BSE measured by ROA. It was found that the ratios of short-term financial position are positively asso-ciated with the profitability measure, while the control ratios are negatively associated. Ilakkiaa and Chakraborty (2017) examined the impact of cash holdings on the cash conversion cycle in the Indian manufacturing industry. Huge balances of cash holdings in the manufacturing firms were found, which are termed poor cash usage.
Jahan (2011) investigated the relationship between cash conversion cycle and profitability and compa-ny size. A negative association was found between profitability measured in terms of ROE and com-pany size measured in terms of sales. Samiloglu and Akgun (2016) examined the association be-tween components of working capital, such as ac-counts receivable, accounts payable, and cash con-version cycle and firm performance. The findings indicated a negative relationship between accounts receivable and firm profitability. Similar studies
by Samiloglu and Demirgunes (2008), Attari and Raza (2012), Ogundipe et al. (2012), and Majeed et al. (2013) were conducted on different kinds of firms and reported a negative relationship be-tween profitability and cash conversion cycle, and a similar kind of relationship was reported with accounts receivable, while a positive relationship was reported with the control variables. Bhutto et al. (2011) studied the association between the cash conversion cycle, a working capital compo-nent, and firm performance. A negative associa-tion was reported between the cash conversion cy-cle and firm performance. It was linked to aggres-sive working capital policies. In another study, the cash conversion cycle is positively associated with firm performance, liquidity, and capital invested, and the small firms actively manage the cash con-version cycle (Ebben & Johnson, 2011). Similarly, Sharma and Kumar (2012) investigated the impact of working capital on the profitability of Indian firms. A positive association was found between the working capital and firm profitability. It was further reported that the cash conversion cycle, an important component of working capital, is pos-itively related to the firm profitability. Moreover, Yazdanfar and Öhman (2014) investigated the im-pact of the cash conversion cycle, an important component of working capital on the profitability of Swedish SMEs, and found a significant relation-ship between them. It was suggested to increase firm profitability by increasing the performance of working capital. Similarly, Tsagem et al. (2017) studied the relationship between cash conversion cycle and firm performance of Nigerian SMEs and found a negative association between cash conver-sion cycle and firm performance, and linked it to low growth opportunities of SMEs.

54
Investment Management and Financial Innovations, Volume 18, Issue 3, 2021
http://dx.doi.org/10.21511/imfi.18(3).2021.05
Similarly, decomposing investment in working capital in the cash conversion cycle leads to growth in shareholders’ value. The reduction of the cash conversion cycle increases profitability and stock prices (Zeidan & Shapir, 2017). Furthermore, the longer the cash conversion cycle, the less capital in terms of short-term assets is employed, ulti-mately leading to a firm’s higher profitability since the cash conversion cycle is part of the working capital requirements of a firm (Ali et al., 2018). In contrast, Ifeoma and Okpalaukeje (2018) reported that the usage of cash and its equivalents should be less in terms of short-term obligations to increase the firm profitability, i.e., the period of the receiva-bles should be less. Moreover, the lesser period in-volved in the cash conversion cycle shall enhance the firm performance by increasing its profits and make a free flow of cash (Gambo & Shuaib, 2016; Al-Abass, 2017).
Further, the volatile structure (strong to weak) of the cash conversion cycle creates difficulties in maintaining the optimum working capital cycle, leading to unbalanced working capital (Konuk & Zeren, 2014). Similarly, Svitlik and Poutnik (2016) studied the association between liquidity, a part of working capital, and a firm profitabili-ty and reported a weak association between them. Moreover, the cash conversion cycle might be in-significant to the firm profitability, as evidenced by the emerging markets (Ozturk & Vergilli, 2018). Dalci et al. (2019) investigated the moderation of company size between profitability and cash con-version cycle and found that the increase in prof-itability was related to the longer cash conversion cycles in terms of bigger firms, while the cash con-version cycle should be less for the medium and small firms. Alsulayhim (2019) studied the influ-ence of working capital management on the profit-ability of non-financial Saudi Arabian companies listed on Tadawul. Multiple regression model and pooled regression were used to estimate the results. A positive association was found between working capital management and firm profitability.
The current study reviewed previous research ex-amining the relationship between the cash conver-sion cycle and the firm profitability. There is a dif-ference of opinion in the reported results, where some researchers found a positive relationship, while most of the researchers found a negative and
weak relationship between the firm profitability and cash conversion cycle. In light of the above discussion, the cash conversion cycle becomes an important factor and a measure of working cap-ital management. Further, no study was found explaining the relationship between the working capital components in terms of cash conversion cycle and firm profitability except for a study by Alsulayhim (2019) examining the relationship be-tween working capital management and profita-bility. Therefore, it becomes significant to examine the relationship between the cash conversion cycle and profitability in the manufacturing sectors of Saudi Arabia. Different associations between the cash conversion cycle (a measurement of working capital) and the firm profitability have been es-tablished. The following are the hypotheses estab-lished by the present study.
H0: There is no significant relationship between
the cash conversion cycle and the firm prof-itability (explained in terms of ROA, ROE, Tobin’s q, and GROP).
H1: There is a significant relationship between
the cash conversion cycle and the firm prof-itability (explained in terms of ROA, ROE, Tobin’s q, and GROP).
2. METHODS
The study examines the impact of the cash con-version cycle on the financial performance of Saudi Arabian non-financial companies listed on Tadawul (The Stock Exchange of Saudi Arabia). The sample consists of 100 companies from 9 in-dustrial and manufacturing sectors, such as cap-ital goods, consumer durables, energy, food and beverages, health care, materials, retailing, util-ities, and transport, starting from 2008 to 2019. Table 1A (Appendix A) reports the details of studied companies regarding their specialization, global industry classification standard (GICS) codes, and market capitalization. The study uses secondary data to examine the impact of the cash conversion cycle on the financial performance of Saudi Arabian companies. The data for depend-ent and independent variables were extracted from the company financial reports available on Tadawul.

55
Investment Management and Financial Innovations, Volume 18, Issue 3, 2021
http://dx.doi.org/10.21511/imfi.18(3).2021.05
2.1. Dependent and independent
variables
The study has considered four financial perfor-mance proxies as dependent variables, such as return on assets (ROA), return on equity (ROE), Tobin’s q (Q Ratio), and gross operating prof-it (GROP). The components of the cash conver-sion cycle, such as days sales outstanding (DSO), days sales in inventory (DSI), and days payables outstanding (DPO), are independent variables. Further, company size is considered a control variable.
Table 1. Dependent and independent variables
No. Proxy Variable Formula
1Return on assets
(ROA)Dependent
Net Income/Total
Assets
2Return on equity
(ROE)Dependent
Net Income/Total
Equity
3 Tobin’s q (Q ratio) DependentTotal Market Value/
Total Asset Value
4Gross operating profit (GROP) Dependent
Gross Profit – Operating Expenses/Sales
5
Days sales
outstanding (DSO)
IndependentAccounts Receivables
x 365/Sales
6 Days sales in
inventory (DSI)Independent
Inventory x 365/Cost of Goods Sold
7
Days payables
outstanding (DPO)
IndependentAccounts Payables x 365/Sales
8 Size Control Log (Sales)
2.2. Empirical model
The study examines the effect of the cash conver-sion cycle on Saudi Arabian companies’ financial performance with the help of correlation analysis and by employing a pooled regression model. The dependent and independent variables used in the regression model are given in Table 1. Further, to test the model’s robustness, the study conducts di-agnostic tests, such as the normality test, hetero-scedasticity test, multicollinearity test, etc. The es-timated pooled regression model is as follows:
, 0 1 . 2 .
3 . 4 . ,,
i t i t i t
i t i t i t
ROA DSO DSI
DPO SIZE
β β β
β β ε
= + + +
+ + + (1)
, 0 1 . 2 .
3 . 4 . ,,
i t i t i t
i t i t i t
ROE DSO DSI
DPO SIZE
β β β
β β ε
= + + +
+ + + (2)
, 0 1 . 2 .
3 . 4 . ,,
i t i t i t
i t i t i t
Q DSO DSI
DPO SIZE
β β β
β β ε
= + + +
+ + + (3)
, 0 1 . 2 .
3 . 4 . ,,
i t i t i t
i t i t i t
GROP DSO DSI
DPO SIZE
β β β
β β ε
= + + +
+ + + (4)
where 0
β is the constant, 1,β
2,β
3β are the co-
efficients of independent variables DSO, DSI, and DPO,
4β is the coefficient of firm size, and ε is
the error term for a company i and time .t To test the fitness of the above-given models, the study shall employ adjusted R2 and F-statistic.
3. RESULTS
The result section reports the descriptive statistics, correlation analysis, and pooled regression results with different models. Table 2 reports the descrip-tive statistics, such as the mean, SD, minimum, and maximum of all the study variables.
Table 2. Descriptive statistics
Variable N MeanStandard
deviation Min Max
ROA 100 0.06453 0.099 –0.678116 1.11709
ROE 100 0.0845 0.2201 –3.51132 1.65685Tobin’s q 100 0.57077 0.249 0.09 1.41857
GROP 100 0.0202 0.974 –8.94368 1.00000
DSO 100 0.9512 0.9816 0.012 9.04606DSI 100 1.3180 1.2499 1.231 9.42399
DPO 100 0.8136 0.8800 1.363 8.73045
SIZE 100 5.7078 1.4981 –2.9425 8.27852
The results show that the mean range of dependent variables, such as ROA, ROE, Tobin’s q, and GROP is between –8.94 and 1.66, and the range of SD is between 0.09 and 0.97. The negative ROA, ROE, and GROP show that some sample Saudi Arabian firms are experiencing losses in some periods. Similarly, the mean range of independent varia-bles, such as DSO, DSI, and DPO, is between 0.012 and 1.23, which shows that the accounts receiva-bles are in average one day with a minimum of less than one day and a maximum of nine days; the average inventory holding period is 1.32 days with a minimum of 1.23 days and a maximum of 9.42 days, and the accounts payable are in average less than one day, with a minimum of 1.36 days and a maximum of 8.73 days. This shows that Saudi

56
Investment Management and Financial Innovations, Volume 18, Issue 3, 2021
http://dx.doi.org/10.21511/imfi.18(3).2021.05
Arabian firms have a shorter cash conversion cycle. The range of SD is between 0.88 and 1.25, with a little dispersion in the DPO data.
Table 3 reports the correlation analysis of depend-ent and independent variables. The result shows a negative correlation between both the study varia-bles, except DSI positively correlated with Tobin’s q and GROP.
Table 4 reports the pooled regression results of mod-els 1 and 2. The result of model 1, where ROE is the dependent variable, shows that the relationship with the elements of the cash conversion cycle is negative and significant at the 1% level, except for DSO, which is insignificant. Further, the results of model 2 show a
negative relationship between ROA and the elements of cash conversion cycle significant at the 1% level. The result shows an inverse relation to profitability.
This shows that companies in the industrial sector of Saudi Arabia have lesser periods in accounts receiva-ble, accounts payable, and inventory, leading to firm profitability. The relationship of firm size with ROE is positive and significant, while ROA is negative and insignificant, which shows that firm size positively affects firm profitability. The results show that the explanatory variables explain 6 and 5% of the prof-itability variation (R2 = 0.06 and 0.05 respectively). The diagnostic results of both the models, such as the F-statistic and variance inflation factor (VIF), con-firm the model’s validity and fitness.
Table 3. Correlation analysis
Variable ROA ROE Tobin’s q GROP DSO DSI DPO SIZE
ROA 1.000 0.775 0.134 0.057 –0.09 –0.07 –0.16 0.02
ROE 0.775 1.000 0.179 0.023 –0.049 –0.069 –0.138 0.149
Tobin’s q 0.134 0.179 1.000 0.286 –0.29 0.159 –0.20 0.20
GROP 0.057 0.023 0.286 1.000 –0.560 0.135 –0.025 0.044
DSO –0.09 –0.049 –0.29 –0.560 1.000 –0.07 0.19 –0.07
DSI –0.07 –0.069 0.159 0.135 –0.07 1.000 0.03 –0.06
DPO –0.16 –0.138 –0.20 –0.025 0.19 0.03 1.000 –0.09
SIZE 0.02 0.149 0.20 0.044 –0.07 –0.06 –0.09 1.000
Table 4. Result of regression analysis
Model 1: ROE
Variable α β t-statistic p-value
CONSTANT 0.043 – 2.29 0.022
DSO –0.012 –1.71* 0.087
DSI –0.012 –4.36*** 0.000
DPO –0.019 –2.46*** 0.013
SIZE 0.015 5.94*** 0.000
R2 0.06
F-statistic 19.65(0.000)VIF 1.05
, 0 1 . 2 . 3 . 4 . ,i t i t i t i t i t i tROA DSO DSI DPO SIZEβ β β β β ε= + + + + +
Model 2: ROA
CONSTANT 0.097 – 6.63 0.000
DSO –0.0087 –3.72*** 0.000
DSI –0.0081 –5.05*** 0.000
DPO –0.0108 –4.21*** 0.000
SIZE –0.000631 –0.29 0.77
R2 0.05
F-statistic 15.84(0.000)VIF 1.05
, 0 1 . 2 . 3 . 4 . ,i t i t i t i t i t i tROA DSO DSI DPO SIZEβ β β β β ε= + + + + +
Note: * means significant at the 10% level, ** means significant at the 5% level, and *** means significant at the 1% level.
57
Investment Management and Financial Innovations, Volume 18, Issue 3, 2021
http://dx.doi.org/10.21511/imfi.18(3).2021.05
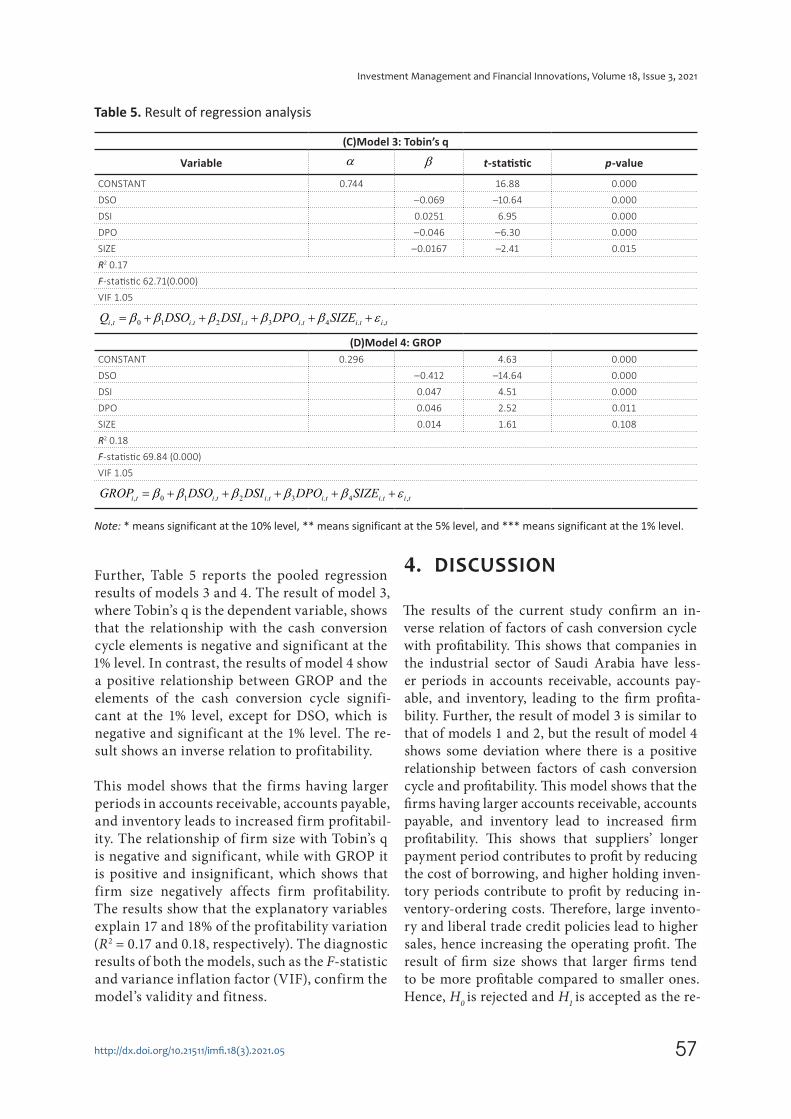
Further, Table 5 reports the pooled regression results of models 3 and 4. The result of model 3, where Tobin’s q is the dependent variable, shows that the relationship with the cash conversion cycle elements is negative and significant at the 1% level. In contrast, the results of model 4 show a positive relationship between GROP and the elements of the cash conversion cycle signifi-cant at the 1% level, except for DSO, which is negative and significant at the 1% level. The re-sult shows an inverse relation to profitability.
This model shows that the firms having larger periods in accounts receivable, accounts payable, and inventory leads to increased firm profitabil-ity. The relationship of firm size with Tobin’s q is negative and significant, while with GROP it is positive and insignificant, which shows that firm size negatively affects firm profitability. The results show that the explanatory variables explain 17 and 18% of the profitability variation (R2 = 0.17 and 0.18, respectively). The diagnostic results of both the models, such as the F-statistic and variance inf lation factor (VIF), confirm the model’s validity and fitness.
4. DISCUSSION
The results of the current study confirm an in-verse relation of factors of cash conversion cycle with profitability. This shows that companies in the industrial sector of Saudi Arabia have less-er periods in accounts receivable, accounts pay-able, and inventory, leading to the firm profita-bility. Further, the result of model 3 is similar to that of models 1 and 2, but the result of model 4 shows some deviation where there is a positive relationship between factors of cash conversion cycle and profitability. This model shows that the firms having larger accounts receivable, accounts payable, and inventory lead to increased firm profitability. This shows that suppliers’ longer payment period contributes to profit by reducing the cost of borrowing, and higher holding inven-tory periods contribute to profit by reducing in-ventory-ordering costs. Therefore, large invento-ry and liberal trade credit policies lead to higher sales, hence increasing the operating profit. The result of firm size shows that larger firms tend to be more profitable compared to smaller ones. Hence, H
0 is rejected and H
1 is accepted as the re-
Table 5. Result of regression analysis
(C)Model 3: Tobin’s q
Variable α β t-statistic p-value
CONSTANT 0.744 16.88 0.000
DSO –0.069 –10.64 0.000
DSI 0.0251 6.95 0.000
DPO –0.046 –6.30 0.000
SIZE –0.0167 –2.41 0.015
R2 0.17
F-statistic 62.71(0.000)
VIF 1.05
, 0 1 . 2 . 3 . 4 . ,i t i t i t i t i t i tQ DSO DSI DPO SIZEβ β β β β ε= + + + + +
(D)Model 4: GROP
CONSTANT 0.296 4.63 0.000
DSO –0.412 –14.64 0.000
DSI 0.047 4.51 0.000
DPO 0.046 2.52 0.011
SIZE 0.014 1.61 0.108
R2 0.18
F-statistic 69.84 (0.000)
VIF 1.05
, 0 1 . 2 . 3 . 4 . ,i t i t i t i t i t i tGROP DSO DSI DPO SIZEβ β β β β ε= + + + + +
Note: * means significant at the 10% level, ** means significant at the 5% level, and *** means significant at the 1% level.

58
Investment Management and Financial Innovations, Volume 18, Issue 3, 2021
http://dx.doi.org/10.21511/imfi.18(3).2021.05
sults confirm a significant relationship between the cash conversion cycle and firm profitability (explained in terms of ROA, ROE, Tobin’s q, and GROP). The results of the current study are con-
sistent with the previous studies of Deloof (2003), Samiloglu and Demirgunes (2008), Bhutto et al. (2011), Jahan (2011), Samiloglu and Akgun (2016), and Tsagen et al. (2017).
CONCLUSION
The study examined the impact of working capital components in terms of cash conversion cycle on the firm profitability (measured in terms of ROA, ROE, Tobin’s q, and GROP) of Saudi Arabian manufacturing companies listed on Tadawul. The study used the financial data of 100 companies over a period of 12 years from 2008 to 2019. A pooled regression model was estimated to report the results. The results of models 1, 2 and 3 report a negative association between the cash conver-sion cycle and the firm profitability in terms of return on equity (ROE), return on assets (ROA), and Tobin’s q, proposing a shorter cash conversion cycle with larger profits. Further, the results of model 4 report a positive association with the firm profitability in terms of gross operating profit (GROP), proposing a longer cash conversion cycle with larger profits. The deviation in the result of GROP might be due to the longer payment period granted by suppliers and holding higher in-ventory that leads to higher sales, hence increasing operating profit. The study results confirm a significant relationship between working capital components (in terms of cash conversion cycle) and the firm profitability. Therefore, the results of the current study show that the manufacturing companies in Saudi Arabia have lesser periods in working capital components leading to the firm profitability. The reported results are useful to academicians in conducting comparative studies of firms’ cash conversion cycle in longitudinal and cross-sectional research methods and the man-agers in the materials, inventory, and sales sections in managing optimum cash conversion cycle. Finally, the study considered the variables of cash conversion cycle and one control variable, and future research should consider other elements of working capital, such as current ratio, current as-sets to total assets, current liability to total assets, and control variables, such as economic growth, inf lation, etc.
AUTHOR CONTRIBUTIONS
Conceptualization: Abdul Rahman Shaik. Data curation: Abdul Rahman Shaik. Formal analysis: Abdul Rahman Shaik. Investigation: Abdul Rahman Shaik. Methodology: Abdul Rahman Shaik. Project administration: Abdul Rahman Shaik. Software: Abdul Rahman Shaik. Supervision: Abdul Rahman Shaik. Validation: Abdul Rahman Shaik. Visualization: Abdul Rahman Shaik. Writing – original draft: Abdul Rahman Shaik. Writing – review & editing: Abdul Rahman Shaik.

59
Investment Management and Financial Innovations, Volume 18, Issue 3, 2021
http://dx.doi.org/10.21511/imfi.18(3).2021.05
REFERENCES
1. Al-Abass, H. S. (2017). Relationship between Cash Conversion Cycle (CCC) with Firm Size and Profitability. International Journal of Academic Research in Accounting, Finance and Management Sciences, 7(4), 296-304. https://doi.org/10.6007/IJARAFMS/v7-i4/3692
2. Ali, B., Ali, M., Shah, S., & Arif, M. (2018). Does cash conversion cycle affect corporate performance? Evidence from manufacturing sector of Pakistan. Research Journal of Finance and Accounting, 9(23), 1-7. Retrieved from https://www.iiste.org/Jour-nals/index.php/RJFA/article/view/45613
3. Almeida, H., Campello, M., Laranjeira, B., & Weisbenner, S. (2012). Corporate debt maturity and the real effects of the 2007 credit crisis (Working Paper 14990). Cambridge, MA: National Bureau of Economic Research. Retrieved from https://www.nber.org/papers/w14990
4. Alsulayhim, N. A. (2019). The relationship between working capital management and profitability. International Business Research, 12(8), 142-152. https://doi.org/10.5539/ibr.v12n8p142
5. Attari, M. A., & Raza, K. (2012). The optimal relationship of cash conversion cycle with firm size and profitability. International Journal of Academic Research in Business and Social Sciences, 2(4), 189-203. Retrieved from https://hrmars.com/papers_submit-ted/9056/the-optimal-relation-ship-of-cash-conversion-cycle-with-firm-size-and-profitability.pdf
6. Bhutto, N. H., Abbas, G., Rehman, M., & Shah, S. M. M. (2011). Relationship of cash conversion cycle with firm size, working capital approaches and firm’s profitability: A case of Pakistani industries. Journal of Engineering and Technology, 1(2), 45-64. Retrieved from https://www.semanticscholar.org/paper/Relationship-of-Cash-Conversion-
Cycle-with-Firm-and-Bhutto-Abbas/91e40c495c891e45aafb9f88319162b8cc6eb615
7. Boer, G. (1999). Managing the cash gap. Journal of Accountancy, 188(4), 27-32.
8. Caballero, B. S., Teruel, P. J., & Solano, M. P. (2012). How does working capital management affect the profitability of Spanish SMEs? Small Business Economics, 39(2), 517-529. http://doi.org/10.1007/s11187-011-9317-8
9. Chang, C. (2018). Cash conversion cycle and corporate performance: Global evidence. International Review of Economics & Finance, 56, 568-581. https://doi.org/10.1016/j.iref.2017.12.014
10. Dalci, I., Tanova, C., Ozyapici, H., & Bein, M. A. (2019). The moderating impact of firm size on the relationship between working capital management and profitability. Prague Economic Papers, 28(3), 296-312. https://doi.org/10.18267/j.pep.681
11. Deloof, M. (2003). Does working capital management affect profitability of Belgian firms? Journal of Business Finance & Accounting, 30(3/4), 573-588. https://doi.org/10.1111/1468-5957.00008
12. Duchin, R., Ozbas, O., & Sensoy, B. (2010). Costly external finance, corporate investment, and the subprime mortgage credit crisis. Journal of Financial Economics, 97(3), 418-435. https://doi.org/10.1016/j.jfineco.2009.12.008
13. Ebben, J. J., & Johnson, A. C. (2011). Cash conversion cycle management in small firms’ relationships with liquidity, invested capital, and firm performance. Journal of small business & entrepreneurship, 24(3), 381-396. Retrieved from http://ir.stthomas.edu/ocbentrpub/40
14. Gambo, J., & Shuaib, A. (2016). Empirical examination of the association of working capital management and firms’ profitability of the listed food and beverages firms in Nigeria. Journal
of Arts, Science & Commerce, 7(1), 12-22. Retrieved from https://www.researchgate.net/publication/307782484_EMPIRI-CAL_EXAMINATION_OF_THE_ASSOCIATION_OF_WORK-ING_CAPITAL_MANAGE-MENT_AND_FIRMS’_PROFIT-ABILITY_OF_THE_LISTED_FOOD_AND_BEVERAGES_FIRMS_IN_NIGERIA
15. Ifeoma, O. H., & Okpalaukeje, V. (2018). Effect of cash to cash cycle on profitability of basicmaterial firms in Nigeria. Journal of Biological Innovations, 7(1), 12-28. Retrieved from https://jbino.com/docs/Issue01_02_2018.pdf
16. Ilakkiaa, S., & Chakraborty, S. (2017). A critical review of empirical findings on impact of cash holdings on cash conversion cycle with respect to Indian to manufacturing firms. Journal of Management and Commerce, 3(2), 25-29. Retrieved from http://www.msruas.ac.in/pdf_files/Publica-tions/MCJournals/August2017/Paper5.pdf
17. Jahan, N. (2011). An empirical investigation of cash conversion cycle of manufacturing firms and its association with firm size and profitability. Bank Parikrama, 36(2&4), 18-32. Retrieved from https://arxiv.org/abs/2005.09482
18. Konuk, F., & Zeren, F. (2014). Is cash conversion cycles optimum in Turkish listed food-beverage firms? Theoretical and Applied Economics, 21(12), 153-164. Retrieved from https://econpapers.repec.org/article/agrjournl/v_3axxi_3ay_3a2014_3ai_3a12(601)_3ap
_3a153-164.htm
19. Korent, D., & Orsag, S. (2018). The impact of working capital management on profitability of Croatian software companies. Zagreb International Review of Economics & Business, 21(1), 47-66. https://doi.org/10.2478/zireb-2018-0007
20. Lee, S. Y. (2015). The relationship between working capital management and profitability: Evidence from Korean shipping

60
Investment Management and Financial Innovations, Volume 18, Issue 3, 2021
http://dx.doi.org/10.21511/imfi.18(3).2021.05
industry. Journal of Navigation
and Port Research, 39(3), 261-266. http://dx.doi.org/10.5394/KINPR.2015.39.3.261
21. Maeenuddin, Yusrini, L., Nassir, A.M., Hafeez, M., Chugtai, M.S., & Hussain, A. (2020). An empirical investigation of working capital management components and its association with firm’s profitability (ROE). Talent Development &
Excellence, 12(3s), 2644-2662. Retrieved from https://www.iratde.com/index.php/jtde/article/view/1119
22. Majeed, S., Makki, M. A. M., Saleem, S., & Aziz, T. (2013). The relationship of cash conversion cycle and profitability of firms: an empirical investigation of Pakistani firms. Journal of
Emerging Issues in Economics,
Finance and Banking, 1(1), 35-51. Retrieved from http://globalbizresearch.org/eco-nomics/images/files/80547_Article_3_13004_31st%20Dec.pdf
23. Ogundipe, S. E., Idowu, A., & Ogundipe, L. O. (2012). Working capital management, firms’ performance and market valuation in Nigeria. International
Journal of Economics and
Management Engineering, 6(1), 124-128. https://doi.org/10.5281/zenodo.1333468
24. Ozturk, M. B., & Vergili, G. (2018). The effects of working capital management on mining firms’ profitability: empirical evidence from an emerging market. In G. Kucukkocaoglu & S. Gokten (Eds.), Financial
Management from an Emerging
Market Perspective (pp. 189-204). http://dx.doi.org/10.5772/intecho-pen.71800
25. Raheman, A., & Nasr, M. (2007). Working capital management and profitability – case of Pakistani firms. International Review of
Business Research Papers, 3(2), 275-296.
26. Richards, V. D., & Laughlin, E. J. (1980). A cash conversion cycle approach to liquidity analysis. Financial Management, 9(1), 32-38. https://doi.org/10.2307/3665310
27. Ross, S., Westerfield, R., & Jaffe, J. (2002). Corporate Finance (6th ed.). New York: McGraw Hill.
28. Samiloglu, F., & Demirgunes, K. (2008). The effect of working capital management on firm profitability: evidence from Turkey. The International Journal of Applied Economics and Finance, 2(1), 44-50. http://dx.doi.org/10.3923/ijaef.2008.44.50
29. Samiloglu, F., & Akgun, A. I. (2016). The relationship between working capital management and profitability: evidence from Turkey. Business and Economics Research Journal, 7(2), 1-14. https://doi.org/10.20409/berj.2016217492
30. Schilling, G. (1996). Working capital’s role in maintaining corporate liquidity. TMA Journal, September/October, 4-7.
31. Sharma, A. K., & Kumar, S. (2011). Effect of working capital management on firm profitability: empirical evidence from India. Global Business Review, 12(1), 159-173. https://doi.org/10.1177/097215091001200110
32. Svitlik, J., & Poutnik, L. (2016). Relationship between liquidity and profitability: Empirical study from the Czech Republic. European Financial and Accounting Journal, 11(3), 7-24. http://dx.doi.org/10.18267/j.efaj.159
33. Tsagem, M. M., Aripin, N., & Ishak, R. (2017). Cash conversion cycle and profitability of Nigerian small and medium-sized entities: an empirical analysis. The International Journal of Banking and Finance, 13(1), 49-69. https://doi.org/10.32890/ijbf2017.13.1.8498
34. Uyar, A. (2009). The relationship of cash conversion cycle with firm size and profitability: An empirical investigation in Turkey. International Research Journal of Finance and Economics, 24, 186-193.
35. Wang, B. (2019). The cash conversion cycle spread. Journal of Financial Economics, 133(2), 472-497. https://doi.org/10.1016/j.jfineco.2019.02.008
36. Yameen, M., Farhan, N. H. S., & Tabash, M. I. (2019). The impact of liquidity firms on firms’ performance: empirical investigation from Indian pharmaceutical companies. Academic Journal of Interdisciplinary Studies, 8(3), 212-220. Retrieved from https://www.richtmann.org/journal/index.php/ajis/article/view/10576
37. Yazdanfar, D., & Öhman, P. (2014). The impact of cash conversion cycle on firm profitability: An empirical study based on Swedish data. International Journal of Managerial Finance, 10(4), 442-452. https://doi.org/10.1108/IJMF-12-2013-0137
38. Zeidan, R., & Shapir, O. M. (2017). Cash conversion cycle and value-enhancing operations: Theory and evidence for a free lunch. Journal of Corporate Finance, 45, 203-219. https://doi.org/10.1016/j.jcorp-fin.2017.04.014

61
Investment Management and Financial Innovations, Volume 18, Issue 3, 2021
http://dx.doi.org/10.21511/imfi.18(3).2021.05
APPENDIX A
Table A1. Companies in the Kingdom of Saudi Arabia according to their specialization, GICS code and market capitalization
Source: The Tadawul Stock Exchange.
No. Name of the company Specialization GICS code Market capitalization (in Million Saudi Riyal)
1 Saudi Ceramic Company Capital Goods 2040 3,1262 Astra Industrial Group Capital Goods 1212 2,212
3 Bawan Company Capital Goods 1302 1,800
4 Saudi Clay Pipes Company Capital Goods 2360 1,782
5 AlBabtain Company Capital Goods 2320 1,381.25
6 Saudi Cable Company Capital Goods 2110 1,180.97
7 Electricity Industries Company Capital Goods 1303 1,098
8 Saudi Industrial Export Company Capital Goods 4140 754.27
9 Saudi Arabian Amiantit Company Capital Goods 2160 713.6010 Middle East Cables Company Capital Goods 2370 700.80
11 Al Omran Industires & Trading Co Capital Goods 4141 694.8012 Thob Al Aseel Company Consumer Durables 4012 2,592
13 Abdullatif Inds. Invest. Company Consumer Durables 2340 1,280.50
14 Fitahi Holding Group Consumer Durables 4180 1,107.70
15 Lazurde Company Consumer Durables 4011 890.10
16 Saudi Industrial Development Co Consumer Durables 2130 610.4017 Herfy Food Services Company Consumer Services 6002 4,340.03
18 Dur Hospitality Company Consumer Services 4010 2,86019 Al Hokair Tourism Group Consumer Services 1820 1,152.80
20 Raydan Food Company Consumer Services 6012 832.50
21 Tourism Enterprise Company Consumer Services 4170 601.9022 The Saudi Arabian Oil company Energy 2222 6,910,00023 National Shipping Company Energy 4030 15,277.50
24 Rabigh Petrochemical Company Energy 2380 12,772.08
25 Aldrees Petroleum Company Energy 4200 4,050
26 Almarai Company Food and Beverages 2280 51,000
27 Savola Group Food and Beverages 2050 20,104.37
28 Saudia Dairy and Foodstuff Co. Food and Beverages 2270 5,102.50
29 Halwani Bros Company Food and Beverages 6001 3,782.97
30 National Agri. Development Co. Food and Beverages 6010 3,186.4131 Saudi Fisheries Company Food and Beverages 6050 2,240
32 Aljouf Agri. Development Co. Food and Beverages 6070 2,19633 Wafrah Industry & Development Co. Food and Beverages 2100 1,304.17
34 Jazan Energy and Development Co. Food and Beverages 6090 1,095
35 Tabuk Agri. Development Co. Food and Beverages 6040 988.9636 Ash-Sharqiyah Development Co. Food and Beverages 6060 868.5037 Al Gassim Investment Holding Co. Food and Beverages 6020 798
38 Dr. Sulaiman Al Habib Med. Group Health Care 4013 41,65039 Mouwasat Medical Services Co. Health Care 4002 13,740
40 Dallah Health Care Company Health Care 4004 4,851
41 Saudi Chemical Company Health Care 2230 2,921.6942 National Medical Care Company Health Care 4005 2,336.6943 AYYAN Investment Company Health Care 2140 1,424.4644 Saudi Basic Industries Corporation Materials 2010 319,800
45 Saudi Arabian Mining Company Materials 1211 63,252.3346 SABIC Agri Nutrients Company Materials 2020 46,366.3047 Yanbu National Petro Company Materials 2290 40,106.2548 Saudi Kayan Petro Company Materials 2350 22,26049 National Petrochemical Company Materials 2002 18,57650 Advanced Petrochemical Company Materials 2330 14,676.67

62
Investment Management and Financial Innovations, Volume 18, Issue 3, 2021
http://dx.doi.org/10.21511/imfi.18(3).2021.05
No. Name of the company Specialization GICS code Market capitalization (in Million Saudi Riyal)
51 Sahara International Petro Company Materials 2310 13.933.27
52 Saudi Industrial Investment Group Materials 2250 12,735
53 Southern Province Cement Company Materials 3050 11,928
54 Saudi Cement Company Materials 3030 9,700.20
55 Qassim Cement Company Materials 3040 7,740
56 Yanbu Cement Company Materials 3060 7,245
57 Yamama Cement Company Materials 3020 6,135.7558 Arabian Cement Company Materials 3010 4,220
59 City Cement Company Materials 3003 3,724
60 Eastern Province Cement Company Materials 3080 3,637.8061 Alujain Holding Corporation Materials 2170 3,556.8862 Najran Cement Company Materials 3002 3,396.6063 Northern Region Cement Company Materials 3004 3,203.20
64 Al Yamamah Steel Inds Company Materials 1304 1,747.52
65 Hail Cement Company Materials 3001 1,644.7266 Ummulqura Cement Company Materials 3005 1,644.5067 Tabuk Cement Company Materials 3090 1,630.8068 Methanol Chemicals Company Materials 2001 1,594.33
69 Aljouf Cement Company Materials 3091 1,590.1670 Saudi Steel Pipe Company Materials 1320 1,405.05
71 The National Company for Glass Materials 2150 1,350.55
72 Zamil Industrial Investment Co. Materials 2240 1,327.20
73 Takween Adv. Industries Company Materials 1201 1,318.6074 Zahrat Al Waha Trading Company Materials 3007 1,311
75 United Wire Factories Company Materials 1301 1,265.3676 Saudi Paper Manufacturing Co. Materials 2300 1,148.1677 Basic Chemical Industries Company Materials 1210 1,078
78 National Metal Manufacturing Co. Materials 2220 1,069.6679 Middle East Paper Company Materials 1202 1,024
80 Al Kathiri Holding Company Materials 3008 958.24
81 National Gypsum Company Materials 2090 942.08
82 Arabian Pipes Company Materials 2200 878.40
83 Nama Chemicals Company Materials 2210 876.1284 Filling & Packing Manufacturing Co. Materials 2180 745.20
85 Jarir Marketing Company Retailing 4190 20,520
86 United Electronics Company Retailing 4003 5,67087 Fawaz Abdulaziz Alhokair Company Retailing 4240 4,095
88 Saudi Company for Hardware Retailing 4008 2,16089 Saudi Automotive Services Co. Retailing 4050 1,938
90 Al Hassan Ghazi Ibrahim Shaker Co. Retailing 1214 1,014.30
91 Saudi Telecom Company Telecommunication 7010 237,60092 Etihad Etisalat Company Telecommunication 7020 22,099
93 Mobile Telecommunication Co. Telecommunication 7030 12,042.98
94 Saudi Ground Services Company Transport 4031 5,574.20
95 Saudi Industrial Services Company Transport 2190 3,088.5696 Saudi Public Transport Company Transport 4040 2,975
97 United International Transport Co. Transport 4260 2,722.25
98 BATIC Invest. & Logistics Co. Transport 4110 1,125
99 Saudi Electricity Company Utilities 5110 87,831.72
100 National Gas and Inds. Company Utilities 2080 2,325
Table A1 (cont.). Companies in the Kingdom of Saudi Arabia according to their specialization, GICS code and market capitalization