saudi arabia uae, saudi arabia using culture as a cohesive force
Upload
khangminh22Category
view
2download
0
Saudi Arabian Oil Co. Oil & Gas Saudi Arabia
19 January 2020
January 18, 2010
US$1.85trn 1.79% US$443mn
Market cap Free float Avg. daily volume
Please see penultimate page for additional important disclosures. Al Rajhi Capital (Al Rajhi) is a foreign broker-dealer unregistered in the USA. Al Rajhi research is prepared by research analysts who are not registered in the USA. Al Rajhi research is distributed in the USA pursuant to Rule 15a-6 of the Securities Exchange Act of 1934 solely by Rosenblatt Securities, an SEC registered and FINRA-member broker-dealer.
Fair price 37.50 +8.4% over current Current price 34.60 as at 16/1/2020
Underweight Neutral Overweight Neutral
Key financial summary
2018 2019E 2020E
Crude oil + condensate deliveries (mmbpd) 10.5 10.0 10.3
Total production (mmboe/d) 13.6 13.0 13.9
Brent price (US$/bbl) 71.9 64.1 61.3
Revenue* (SARbn) 1,335 1,216 1,276
EBITDA (SARbn) 840 741 834
Net profit (SARbn) 416 361 401
Operating cash flow (SARbn) 454 420 454
Capex (SARbn) 132 134 140
FCF (SARbn) 322 286 314
Gearing ratio -9% -1% 16%
ROACE 41% 30% 29%
EPS (SAR) 2.1 1.8 2.0
DPS (SAR) 1.1 1.4 1.5
Payout (%) 52% 78% 75%
Dividend yield (%) 3% 4% 4% Source: Company data, Al Rajhi Capital. * including other income
related to sales. SABIC included in H2 2020
FCF under various scenarios **
6368
7378
8387
9295 97 99 101 103 104
0
20
40
60
80
100
120
40 45 50 55 60 65 70 75 80 85 90 95 100
2020E
FC
F (
US
$b
n)
Brent crude price (US$/b) Source: Al Rajhi Capital. SABIC included from H2 2020.
Saudi Aramco Dividend haven. Initiate at US$2trn With a dividend prioritization of pro-rata US$75bn for 2020-24 to non-
government shareholders, Aramco stock gives the cushion of a bond for the
downside and capital appreciation on the upside. We forecast US$80bn
dividend for 2020 and, based on our analysis, implied dividend yields could
range from 3.6% (based on local market examples) to 4.6% (based on IOC US
peers), arrived by using spreads between dividend and bond yields. This
difference could be mainly explained by the variance in dividend withholding
tax in Saudi and the US, and given that it is a local market listing, the former
could be likely preferred. In the longer term, Aramco gives more stability in
production growth with proven reserves 10.6x closest peers (source: IHS
Markit) and stable cash costs (1/10th its peer avg.; source: IHS Markit). While
financials are sublime, Aramco’s royalty structure implies lower growth
beyond US$70/barrel relative to peers. However, given that such stocks are
held more from a dividend perspective, yields may be the preferred basis for
valuation. While we show the range of valuations in our subsequent sections,
we value the company based on implied dividend yield of ~4% on 2020
dividends, and is in-line with our FCF valuations. We arrive at a fair price of
SAR37.5/share (US$2trn) and initiate coverage with Neutral rating given a
8.4% upside.
Robust metrics: Aramco is the largest oil producer in the world with a market
share of ~10% based on 9.75mmboe/d of oil production (as of Dec 2019; source:
EIA), supplying to strategic markets globally. Its crude exports are well
diversified with top five external customers constituting ~20% of production.
Low sustainable upstream lifting costs (US$2.8/boe in 2018) and ~3%
production growth (medium term as per our estimates) imply sustainability of
strong free cash flows (US$86bn in 2018) and high RoACE (41.1% in 2018; see
appendix for calculations). Based on our estimates, a $1 increase in oil price is
likely to improve cash flow by US$1.5bn. The strategic expansion in its
integrated refining and chemicals downstream business in growth markets
enables the company to increase captive upstream sales. The scale of reserves
(257bnboe) leads to a low annual depletion rate of 1.5%. Near-term expansion is
likely to be mainly driven by commercialization of Jazan and PRefChem
complexes.
Sustainability of dividends: We forecast dividends of US$80bn for 2020 based
on expected 10.3mmbpd crude and condensate deliveries, US$61.3/b Brent,
4mmbpd net refining capacity, and 22.7mmtpa net chemical capacity (excluding
SABIC). Based on this, the earnings payout is 74.8% as per our calculations,
lower than the average for peers. Sustaining capex at 3.7% of sales is low as
compared to peers and is noteworthy in the event of “peak oil” concerns. Besides
this, low gearing gives further ability to increase dividends unlike peers who
have borrowed to pay dividends in the past.
Cost of risk: We believe the cost of risk is overestimated with regard to geo-
political and other industry risks:
Starting with the macro, the Saudi currency is pegged to the US dollar and
hence does not have currency risks as with other emerging economies. We
regard Aramco’s corporate governance standards as excellent and its
comparison with national oil companies is not justified as there is no
interference from the government.
Mazen Al-Sudairi
Head of Research
Tel +966 11 836 5468
Pritish Devassy, CFA
Head of Equity Research
Tel +966 11 836 5464
Existing rating

Saudi Arabian Oil Co. Oil & Gas
19 January 2020
19 May 2019
Disclosures: This document may not be distributed in the United States. Refer to Legend in the penultimate page of this report. Page 2
The cost of equity of all the large Saudi listed firms is around only 11-12% (e.g. SABIC, Al
Rajhi Bank, etc.), where foreign funds own around 10% of the market, vetting such cost of
equity.
With regard to the risk of peak oil, with the lowest cost of oil production and abundant
reserves, in case of a massive correction in global oil demand, the company is likely to still
maintaining or increasing production, in our view.
Lastly, the ability of the company to recover was on display as exhibited during its recovery
post Abqaiq attacks. Even during global crises in the past, the impact on oil supply has only
been 1.5mmbpd on an average (Figure 17).
Valuation summary: To us, valuations have been primarily about estimating the right
premium as we do not see the sustainability of performance or risk factors as a material
concern. Though we show various valuation methods in depth, we use the dividend valuation
method for our fair price.
Dividend yield method based on:
US IOC (International Oil Companies): Although of late dividend yield and bond yield have
widened for peers such as Exxon, historically they have remained broadly tight for majority
of the last 12 months. Based on the average of 2019 spread of dividend yields over bond
yields for Chevron and Exxon, one could arrive at an average of 4.6% dividend yield for
Aramco (Figure 1).
Peers in Saudi: SABIC and SEC (local peers) are trading at dividend yields with much
tighter spreads over their respective bond yields. Based on this, one could arrive at an
average of 3.6% dividend yield for Aramco.
The difference in the above numbers is explained by the variation in withholding tax between
the countries. A foreign investor in Saudi Arabia needs to pay 5% withholding tax as
compared to 30% in the US. Thereby, there could be a lower gross required dividend yield as
compared to US peers such as Exxon assuming no income taxes.
Moreover, considering that we are likely at the bottom of the oil cycle and hence with
possibility of capital gains, there is enough comfort for stock holders to price dividend yield at
even below the 10-year bond, especially when Fed is expected to lower interest rates.
Theoretically, as oil price declines, dividend yield could go lower while the growth component
of the equation (cost of equity = growth + dividend yield) can increase to maintain a constant
cost of equity.
In a nutshell we believe such companies are to be valued unconventionally given the almost
guaranteed safety of dividends. Thus based on this we arrive at a fair price of SAR37.5/share
based on the average, at around 4%, applied on USD80bn dividends for 2020.
Figure 1 Summary of dividend yield methods
75 80 85
Exxon 4.9% 1.5 1.6 1.7
Chevron 4.2% 1.8 1.9 2.0
SABIC 3.6% 2.1 2.2 2.4
SEC 3.7% 2.0 2.2 2.3
Dividends (US$bn)
Implied value for Aramco (US$trn)
IOC
Local market
Implied dividend yield*
Source: Bloomberg, Al Rajhi Capital. * Implied dividend yield is calculated based on the average 2019 spread over 10Y bond.
The DCF method: Using our estimates - WACC at 7.4%, cost of equity at 8.1%, and
terminal growth rate at 2%, average Brent price of ~US$61.0-62.0 (from 2020 to 2021), we
arrive at a valuation of around US$1.9trn. Based on average oil selling prices ranging from
US$60.0/bbl to US$75.0/bbl, we arrive at a valuation of US$1.8–2.1trn. For various
scenarios, please refer to page 15.

Saudi Arabian Oil Co. Oil & Gas
19 January 2020
19 May 2019
Disclosures: This document may not be distributed in the United States. Refer to Legend in the penultimate page of this report. Page 3
Upside and downside factors: Factors that could move our valuation upwards are: higher
than expected oil and gas prices, higher market share gains as weaker competitors exit,
improved macro-economic growth, further captive expansion opportunities, successful value
accretive acquisitions and higher than expected decline in local energy consumption leading
to higher export volumes. Factors that could move our valuation downwards are: lower than
expected oil and gas prices, weak macro growth, higher than expected increase in capex for
expansions, climate change concerns, geo-political tensions, delay in commercialization of
new/expansion projects, impairment of assets and change in policies on royalty and tax
detrimental to minority shareholders.

Saudi Arabian Oil Co. Oil & Gas
19 January 2020
19 May 2019
Disclosures: This document may not be distributed in the United States. Refer to Legend in the penultimate page of this report. Page 4
Key assumptions
Figure 2 Key assumptions
2018 2019E 2020E 2021E 2022E 2023E 2024E 2025E
Crude and condensate deliveries
Local (mmbpd) 3.2 3.1 3.2 3.5 3.6 3.7 3.7 3.7
International (mmbpd) 7.3 6.9 7.1 7.3 7.4 7.5 7.6 7.8
Total crude and condensate deliveries (mmbpd) 10.5 10.0 10.3 10.7 10.9 11.2 11.3 11.4
NGL production (mmboe/d) 1.1 1.1 1.1 1.1 1.1 1.2 1.5 1.6
Gas production (mmboe/d) 1.6 1.6 2.2 2.2 2.4 3.0 3.0 3.0
Total production (mmboe/d)* 13.6 13.0 13.9 14.3 14.8 15.6 16.1 16.2
Average crude selling price (US$/bbl) 70.0 62.6 59.8 60.4 63.5 63.5 63.5 63.5
Brent crude oil price (US$/bbl) 71.9 64.1 61.3 61.9 65.0 65.0 65.0 65.0
Lifting costs assumed (US$/boe) 2.8 2.8 2.8 2.8 2.8 2.8 2.8 2.8
Gross refining capacity (mmbpd) 4.9 5.4 6.8 6.8 6.8 6.8 6.8 6.8
Net refining capacity (mmbpd) 3.1 3.3 4.0 4.0 4.0 4.0 4.0 4.0
Gross chemical capacity (Ex-SABIC) (mmtpa) 33.2 33.2 40.2 40.2 40.2 40.2 40.2 40.2
Net chemical capacity (Ex- SABIC) (mmtpa) 16.8 16.8 22.7 22.7 22.7 22.7 22.7 22.7
Exports revenue
LPG 11.5 9.4 9.2 9.3 10.1 10.4 14.0 14.4
Crude and condensate 189.9 157.2 152.1 157.0 167.9 170.7 173.5 176.4
Refined products 88.6 93.4 89.7 81.2 85.3 85.4 85.5 85.7
Local revenue
Refined products 14.8 15.5 18.5 21.5 22.6 22.6 22.6 22.6
Sweet gas 4.0 3.8 5.3 5.3 5.9 7.2 7.2 7.2
Crude and condensate 0.9 0.9 0.9 0.9 0.9 0.9 0.9 0.9
Adjustments 5.5 8.4 8.4 8.4 8.4 8.4 8.4 8.4
Upstream + Downstream revenues 315.2 288.5 284.1 283.6 301.0 305.5 312.2 315.6
Other income related to sales 40.7 34.3 37.2 40.3 42.7 43.6 44.6 46.6
Total revenues exc. SABIC 355.9 322.8 321.4 323.9 343.7 349.2 356.8 362.2
Total revenues inc. SABIC* 355.9 324.3 340.4 362.2 382.8 389.2 397.6 403.9 Source: Company data, Al Rajhi Capital. * Includes internal gas usage of 0.3mmboe/d (as per our calculations) throughout the forecasted periods. 2018 is company data post which are Al Rajhi Capital’s assumptions. SABIC included in H2 2020.

Saudi Arabian Oil Co. Oil & Gas
19 January 2020
19 May 2019
Disclosures: This document may not be distributed in the United States. Refer to Legend in the penultimate page of this report. Page 5
Snapshot of Saudi Aramco
Figure 3 Revenue split by activity
FY16 FY17 FY18
Exports
Crude oil
Exports volume (mmbbl) 2,826 2,662 2,712
Export realized prices (US$/bbl) 40.7 52.7 70.0
Exports revenue (US$bn) 115.1 140.3 189.9
LPG
Exports volume (mmbbl) 285 285 294
Export realized prices (US$/bbl) 24.7 33.3 39.2
Exports revenue (US$bn) 7.0 9.5 11.5
Refined products (S-Oil, Motiva, ATC and SAOC)
Exports volume (mmbbl) 519 876 1,096
Export realized prices (US$/bbl) 51.3 65.0 80.8
Exports revenue (US$bn) 26.6 57.0 88.6
Total export revenues (US$bn) 148.7 206.8 290.0
Local
Crude oil
Local deliveries (mmbbl) 184 167 152
Local realized prices (US$/bbl) 6.2 6.2 6.2
Local revenue (US$bn) 1.1 1.0 0.9
Sweet gas
Local deliveries (mmbbl) 566 592 598
Local realized prices (US$/boe) 6.4 6.8 6.7
Local revenue (US$bn) 3.6 4.0 4.0
Refined products
Local deliveries (mmbbl) 659 624 570
Local realized prices (US$/bbl) 17.9 18.7 25.9
Local revenue (US$bn) 11.8 11.6 14.8
Total local revenues (US$bn) 16.5 16.6 19.7
Total export and local revenues (US$bn) 165.2 223.4 309.7
Adjustments (US$bn) (30.6) (0.5) 5.5
Total upstream and downstream revenues (US$bn) 134.6 222.9 315.2 Source: Company Data, Al Rajhi Capital. * Adjustments

Saudi Arabian Oil Co. Oil & Gas
19 January 2020
19 May 2019
Disclosures: This document may not be distributed in the United States. Refer to Legend in the penultimate page of this report. Page 6
Figure 4 Peers comparison^
Aramco Inpex ONGC SinopecPetroC
hinaEquinor**
Repsol
Spain
CNOOC
China
ENI
SpainPetrobras
Suncor
EnergyBP UK Exxon Chevron Shell
Total
SARoseneft Average Median
Market and onwership data
Country KSA Japan India China China Norway Spain China Italy Brazil Canada Britain US US Netherlands France Russia - -
Mcap (US$bn)* 1,844 15 22 86 148 68 25 77 56 95 53 133 292 220 235 141 82 - -
EV (US$bn)* 26 38 136 244 80 38 72 76 172 65 190 347 246 312 176 139 - -
Govt. ownership 98.2% 25.4% 88.7% 0.1% 98.3% 76.5% 0.1% 81.0% 55.7% 35.6% 0.7% 0.1% 1.0% 0.8% 0.1% 0.1% 55.3% - -
Reserve and production metrics
Proved reserves (MMBOE) 256,890 3,820 4,648 2,499 20,385 6,175 2,339 4,569 7,153 9,598 4,687 19,945 24,293 12,053 11,373 12,050 44,358 - -
Crude oil % 77.2% 74.5% 56.8% 54.7% 0.4% 47.8% 27.3% 72.2% 49.5% 86.1% 100.0% 57.4% 64.5% 56.3% 47.8% 43.2% 73.7% 57.0% 56.6%
Reserve life 52 25 10 6 14 8 9 10 11 10 18 15 17 11 9 12 21 13 11
Reserve Replacement Ratio 154.0% 210.7% 177.6% 109.9% NA 213.3% 93.9% 125.0% 175.5% 105.0% 64.2% 209.4% 313.0% 136.3% 53.9% 156.8% 130.4% 151.7% 136.3%
Production (MBOE/Day) 13,567 424 1,298 1,237 4,087 2,111 715 1,301 1,851 2,628 732 3,683 3,833 2,930 3,666 2,775 5,795 - -
Revenue and cost metrics
E&P Oil revenue (US$/BOE) 42 57 136 49 50 45 35 59 44 55 54 42 46 48 47 41 35 53 47
F&D costs (US$/BOE) - NA NA NA NA 12 10 13 9 16 29 10 14 12 16 14 6 13 13
EBITDA margin (%) 62.9% 60.5% 16.5% 6.8% 15.8% 37.0% 9.2% 57.3% 22.4% 30.5% 32.2% 10.1% 14.2% 21.0% 13.7% 16.8% 22.5% 24.2% 18.9%
Net margin (%) 31.2% 9.9% 6.8% 2.2% 2.5% 9.6% 4.7% 23.2% 5.4% 7.4% 8.5% 3.1% 7.5% 9.3% 6.0% 6.2% 6.7% 7.4% 6.7%
Capex
Average capex to sales ratio** 10.9% 36.0% 8.4% 3.5% 12.1% 19.6% 5.5% 27.7% 13.5% 15.1% 19.7% 7.2% 7.2% 12.2% 7.4% 10.9% 13.8% 13.7% 12.2%
Dev. capex as a % of total capex** NA NA 35.5% NA 73.1% 71.1% 88.8% 80.0% 85.5% 77.7% 87.3% 66.6% 101.4% 132.0% 68.7% 94.7% 81.7% 80.0%
Valuation metrics
Total debt to assets 7.5% 23.8% 20.6% 9.3% 17.3% 22.9% 22.6% 20.6% 21.9% 38.0% 19.4% 23.3% 10.9% 13.6% 19.2% 20.1% 33.1% 21.0% 20.6%
2020E ROE 34.6% 5.1% 13.0% 8.3% 4.5% 13.3% 9.3% 12.9% 8.0% 10.9% 9.9% 10.4% 7.6% 8.6% 10.4% 10.8% 17.7% 10.0% 10.1%
2020E P/E 17.3x 10.7x 5.0x 8.2x 11.5x 11.7x 7.6x 8.8x 11.8x 10.4x 14.0x 12.1x 19.8x 16.8x 11.2x 10.5x 6.0x 11.0x 11.0x
2020E EV/EBITDA 8.3x 4.0x 3.5x 4.6x 4.7x 3.0x 4.2x 3.4x 3.8x 5.1x 6.2x 4.9x 7.9x 6.0x 5.2x 4.3x 4.3x 4.7x 4.5x
EV to TTM FCF 29.4x 23.2x NA 107.0x 53.7x 14.0x 20.7x NA 15.6x 10.1x 13.6x 25.2x 37.4x 13.4x 10.8x 10.7x NA 27.3x 15.6x
EV/Production (US$/BOE) 371 168 80 301 164 103 145 152 113 179 242 141 248 230 233 173 66 171 166
EV/Proved reserves (US$/BOE) 7 7 8 54 12 13 16 16 11 18 14 10 14 20 27 15 NM 17 14
2020E Dividend Yield 4.3% 2.4% 6.2% 7.5% 4.3% 5.1% 6.9% 5.2% 6.2% 3.6% 3.8% 6.3% 5.0% 4.1% 6.3% 5.4% 6.7% 5.3% 5.3%
Average payout ratio(%)** 58.6% 56.3% 41.9% 110.1% 51.7% 65.7% 90.1% 102.5% 88.7% 0.0% 50.8% 234.0% 67.9% 90.2% 119.0% 84.9% 57.5% 81.9% 76.4% Source: Company Data, Bloomberg, Al Rajhi Capital. *Mcap and EV data as of January 15, 2019. **Considered average of last three years for other companies while used last two years average for Aramco. ^ Data for reserves and production metrics, revenue, and cost metrics are based on 2018 data.

Saudi Arabian Oil Co. Oil & Gas
19 January 2020
19 May 2019
Disclosures: This document may not be distributed in the United States. Refer to Legend in the penultimate page of this report. Page 7
Table of Contents Valuation in depth .............................................................................................................................................................................. 9
Dividend Yield Method ...................................................................................................................................................................... 9
Compared to IOCs............................................................................................................................................................................ 9
Compared to Saudi peers ............................................................................................................................................................... 10
NAV method ................................................................................................................................................................................... 12
DCF Valuation Method ................................................................................................................................................................... 13
Other key valuation questions ........................................................................................................................................................ 14
Scenario analysis ........................................................................................................................................................................... 15
Factors that could move our estimates ......................................................................................................................................... 16
Key FAQ on the company .............................................................................................................................................................. 17
What is the importance of Aramco to global markets? ................................................................................................................... 17
Why do we believe the cost of risk is over-stated? ......................................................................................................................... 17
Why is the comparison with National oil companies not right? ....................................................................................................... 18
What is the distinction between the state and the company? ......................................................................................................... 18
Why does Aramco purchase crude oil and refined products when it already produces 13.6mmboe/d (2018)?.............................. 21
What is the benefit from decline in local energy needs?................................................................................................................. 21
What are Aramco’s selling prices to its own refineries and to domestic firms? ............................................................................... 22
What happens when the government increases the regulated prices? .......................................................................................... 23
Why invest in downstream if the EBITDA from downstream is relatively minor .............................................................................. 23
What is the impact of IFRS 16 adoption? ....................................................................................................................................... 23
Why invest in gas if margins are lower for gas as compared to oil? ............................................................................................... 24
What is the scope for gas exports? ................................................................................................................................................ 24
What is the incremental profit contribution from upcoming projects? ............................................................................................. 24
Comparison with peers ................................................................................................................................................................... 26
Largest hydrocarbon producer globally .......................................................................................................................................... 26
Cheapest production costs enable the company to generate higher margins ................................................................................ 26
Segmental Overview ........................................................................................................................................................................ 28
Upstream ........................................................................................................................................................................................ 28
Downstream ................................................................................................................................................................................... 33
High reserves provide long-term visibility ..................................................................................................................................... 41
Capex ................................................................................................................................................................................................ 46
Upstream capex accounts for the largest share in total capex ....................................................................................................... 46
Industry-leading capex profile ......................................................................................................................................................... 46
Organic capex guidance ................................................................................................................................................................. 46
Lowest upstream lifting and capex per BOE in the industry ........................................................................................................... 47
Balance sheet analysis .................................................................................................................................................................... 48
Royalty and other financial notes ................................................................................................................................................... 50
Environmental, Social, and Governance (ESG) ............................................................................................................................. 53
Environmental ................................................................................................................................................................................ 53

Saudi Arabian Oil Co. Oil & Gas
19 January 2020
19 May 2019
Disclosures: This document may not be distributed in the United States. Refer to Legend in the penultimate page of this report. Page 8
Social .............................................................................................................................................................................................. 54
Governance .................................................................................................................................................................................... 54
Oil market dynamics ........................................................................................................................................................................ 55
Detailed Financial Statements with projections ............................................................................................................................ 59
Appendix ........................................................................................................................................................................................... 62

Saudi Arabian Oil Co. Oil & Gas
19 January 2020
19 May 2019
Disclosures: This document may not be distributed in the United States. Refer to Legend in the penultimate page of this report. Page 9
Valuation in depth
Dividend Yield Method
This method could be important for oil-based investors given that dividend (average payout
for oil peers at 104% in the last 4 years on average – Figure 98 in Appendix) is likely the one
of the key criteria for investing in this sector.
Compared to IOCs
Aramco’s 10Y bond is trading at 3% (as of January 15th, 2020), 80bps higher than Exxon’s
2.2% for its 10Y bond. This implies higher risk perceived by the market as reflected in ratings
of credit agencies. Aramco is rated A1 by Moody’s while Exxon is rated higher at Aaa . Aramco
is rated A by Fitch but Aramco’s Standalone Credit Profile (SCP) is at ‘AA+’ (Oct 19).
Figure 5 Credit ratings
Name Moody's SP Fitch
Aramco A1 NA A
Exxon Aaa AA+ WD
BP A1 A- A
Chevron Corp Aa2 AA WD
Total SA Aa3 A+ AA-
Royal Dutch Shell Aa2 AA- AA-
Rosneft Oil Baa3 BBB- WD
Inpex Corp A2 A- NA
Oil & Natural Gas Corp Ltd Baa1 BBB- NA
China Petroleum & Chemical A1 A+ A+
Petrochina Co NA NA A+
Equinor Aa2 AA- NA
Repsol SA Baa1 BBB BBB
CNOOC Ltd A1 A+ A+
Eni Spa Baa1 A- A-
Petrobras Ba2 BB- BB-
Suncor Energy Baa1 A- NA
SABIC A1 A- A
Saudi Electricity A2 A- A-
Big oil
Others
Saudi companies
Source: Bloomberg, Al Rajhi Capital. As of January 16, 2020
Figure 6 Exxon 10yr bond yield vs. dividend yield and oil prices
0
10
20
30
40
50
60
70
80
90
100
0%
1%
2%
3%
4%
5%
6%
May-1
6
Jul-16
Oct-
16
Dec-1
6
Feb
-17
May-1
7
Jul-17
Sep
-17
No
v-1
7
Feb
-18
Ap
r-18
Jun-1
8
Sep
-18
No
v-1
8
Jan-1
9
Ap
r-19
Jun-1
9
Aug
-19
Oct-
19
Jan-2
0
US
$\b
bl
10yr bond yield Dividend yield Oil Prices (RHS)
Source: Bloomberg, Al Rajhi Capital. As of January 15, 2020

Saudi Arabian Oil Co. Oil & Gas
19 January 2020
19 May 2019
Disclosures: This document may not be distributed in the United States. Refer to Legend in the penultimate page of this report. Page 10
Looking at spreads between 10Y bond yields and dividend yields, we observe that this spread
has widened only in recent months (we believe that dividend estimates are not revised
downward in line with oil prices and hence will narrow back) while trading in a narrow band
previously.
We see the same relationship between bond and dividend yields for Chevron. The average
spread in the past till April 2019 was around 0.1–0.5% and the divergence increased to 1.5–
2.2% recently.
We add the average spread of 2019 dividend yield over bond yield for both Exxon and
Chevron to Aramco’s current 10Y bond yield to arrive at an overall average of 4.6% (range:
4.2% to 4.9%) dividend yield for Aramco.
Figure 7 Chevron 10yr bond yield vs dividend yield and oil prices
0
10
20
30
40
50
60
70
80
90
100
0%
1%
2%
3%
4%
5%
Jul-16
Oct-
16
Dec-1
6
Feb
-17
May-1
7
Jul-17
Sep
-17
Dec-1
7
Feb
-18
Ap
r-18
Jun-1
8
Sep
-18
No
v-1
8
Jan-1
9
Ap
r-19
Jun-1
9
Aug
-19
No
v-1
9
Jan-2
0
US
$\b
bl
10yr bond yield Dividend yield Oil Prices (RHS)
Source: Bloomberg, Al Rajhi Capital. As of January 15, 2020
Compared to Saudi peers
We repeat the exercise for the two companies that are listed on the Saudi stock exchange and
have a bond traded (SEC and SABIC). We observe that there is a lower spread over bond
yields relative to the IOC spread. For example, SABIC’s TTM dividend yield stands at 4.7%
and has a 10-year bond yield of 2.9%. As with the IOCs, the spread has diverged in the recent
months from even negative spreads in the past. We have repeated the same exercise for SEC.
Accordingly, we have arrived at an implied dividend yield of 3.6% for Aramco based on SEC
and SABIC.
Figure 8 Bond and dividend yield spread for SABIC and SEC
-1%
0%
1%
2%
3%
Dec-1
8
Jan-1
9
Feb
-19
Mar-
19
May-1
9
Jun-1
9
Jul-19
Aug
-19
Sep
-19
Oct-
19
No
v-1
9
Dec-1
9
Jan-2
0
SABIC SEC
Source: Bloomberg, Al Rajhi Capital. As of January 15, 2019

Saudi Arabian Oil Co. Oil & Gas
19 January 2020
19 May 2019
Disclosures: This document may not be distributed in the United States. Refer to Legend in the penultimate page of this report. Page 11
Why is the difference?
In our view, the reason for this divergence is the variance in withholding tax for a foreign
investor in Saudi as compared to a foreign investor in the US where the dividend withholding
tax is around 30%. Adjusting for the 25% (30% – 5% WHT), a large part of the difference
between the implied dividend yield diminishes. For local investors, there is no withholding
tax for dividends.
For Aramco, we believe the dividend yield could go even lower than that of the 10Y bond yield
because of various reasons as follows:
i. Capacity of Aramco to increase dividends: As discussed above, the base guidance
for dividends of US$75bn in 2020 is on only 65.6% dividend pay-out ratio as per our
calculations. This implies that Aramco has more potential to increase dividends and hence
there should be lesser dividend risk. Furthermore, Aramco has the ability to lower capex,
and with a total debt to total assets ratio of 7.5% as of 2018, it also has the capacity to
borrow to increase dividends, if required. Companies such as Exxon have been able to
maintain or increase its dividends by increasing debt and lowering capex. As for Aramco’s
capex, the maintenance capex is 3.7% of sales, much lower compared to peers. In fact,
reserves of 257bn boe provide the company capability to cut exploration capex in order to
maintain or increase dividends as and when the situation demands.
ii. Negative spreads in the past: There have been times when dividend yields of Exxon
and Chevron have strayed below the bond yield in the past. This is when oil prices decline
because theoretically, the sum of expected dividend yield + growth potential equals cost of
equity.
In the below section, we show fundamentally what drives dividend yields.
The IOC companies trade at a dividend yield of around 3.8–6.1% currently with an average
dividend yield of 5.3% and a historical median dividend yield of 5.6% YTD. Using the two
extremes as the basis for implied target dividend yield can result in a wide variation. Hence, it
becomes important to arrive at the best possible estimate. As seen from the following figure,
dividend yields range from 3.8% to 6.1% and depend on return metrics RoIC (RoIC=
Operating profit (after tax) / (total debt + total equity – cash and short term investments).
Figure 9 Dividend yield and return metrics
TTM Div. Yield (%) RoIC (%)* Current Yield (%)**
Exxon 4.6 6.7 5.0
Chevron 3.8 8.3 4.1
Total 5.2 5.5 5.4
Shell 6.0 5.0 6.4
BP 6.0 4.0 5.8
Rosneft 6.1 7.1 6.4 Source: Bloomberg, Al Rajhi Capital. * Median for historical 10 yrs on quarterly basis, **As of January 15, 2020
The explanation is that higher RoIC implies higher growth (growth = retention ratio * ROE).
Figure 10 Big Oil producers’ RoIC* vs TTM Dividend yield
4.6, 6.7
3.8, 8.3
5.2, 5.56.0, 5.0
6.0, 4.0
6.1, 7.1
0
1
2
3
4
5
6
7
8
9
3.5 4.0 4.5 5.0 5.5 6.0 6.5
RO
IC (
%)
Dividend yield (%)
BP
Chevron
Exxon
TotalShell
Rosneft
Source: Bloomberg, Al Rajhi Capital. Included Rofneft as the company is the second largest company in terms of production globally. * ROIC: Median for historical 10 yrs on quarterly basis.

Saudi Arabian Oil Co. Oil & Gas
19 January 2020
19 May 2019
Disclosures: This document may not be distributed in the United States. Refer to Legend in the penultimate page of this report. Page 12
Figure 11 RoIC* vs TTM Dividend yield
5.0, 10.6
4.7, 6.7
4.9, 6.7
6.5, 3.45.8, 3.2
3.8, 5.8
6.0, 4.0
3.8, 8.3
4.6, 6.76.1, 5.0
5.2, 5.5
6.1, 7.1
0
2
4
6
8
10
12
3.0 3.5 4.0 4.5 5.0 5.5 6.0 6.5 7.0
RO
IC (
%)
Dividend yield (%)
ONGC
SU
ROSN
RDSA
Total
Petro China
EQNR
BP
CVX
REP
ENI
XOM
Source: Bloomberg, Al Rajhi Capital. * ROIC: Median for historical 10 yrs on quarterly basis
Thus we see that Aramco’s high ROIC of around 44% should command it the lowest dividend
yield among others. Thus with Chevron the lowest at 3.8% Aramco should trade at a yield
much below this.
Note:
We have considered the median historical RoIC for peers to avoid volatility in numbers. If
we are to use the recent RoIC numbers, which is around 5% for say Exxon, then the
premium would have been even more for Aramco.
Please refer Figure 15 for limitation of growth for Aramco as compared to peers such as
Exxon due to the royalty structure.
NAV method
Based on our NAV method, we determine the value of the company using its existing reserve
base. We assume a marginal increase in current production rates till 2025, and then a stable
output over the life of reserves. Furthermore, we assume an average oil price of US$60.0-
64.0/bbl (from 2020-23), upstream lifting costs of US$2.8/boe, and maintenance capex of
around US$2.0/bbl (based on Al Rajhi capital estimate of 3.7% on sales). Using 48% tax, we
derive post-tax free cash flow throughout the reserve life, which implies a US$1.1trn valuation
for its upstream segment. For the downstream segment, we valued the refining and chemical
business using the net refining margin of US$3.0/bbl and US$100.0/tonne, respectively and
arrive at a value of US$53bn and US$27bn respectively (using 12x target multiples). We value
70% stake of SABIC at US$53bn (based on our fair price for SABIC at SAR95/share).
Consequently, we arrive at a market value of US$1.3trn. Based on a range of average selling
prices for oil from US$60.0/bbl to US$75.0/bbl the combined value for Aramco is likely to be
between US$1.2 and US$1.4trn.

Saudi Arabian Oil Co. Oil & Gas
19 January 2020
19 May 2019
Disclosures: This document may not be distributed in the United States. Refer to Legend in the penultimate page of this report. Page 13
Figure 12 NAV model – Base case assumptions
Upstream assumptions Downstream assumptions
Average oil production till 2025 (mmbpd) 10.84 Refining business
Average oil production post 2025 (mmbpd) 11.41 Average net refining margin (US$/bbl) 3.0
Average oil price (US$/bbl)** 63.4 Aramco's 2020E refining capacity (mbpd) 4.0
Implied multiple 12
Reserves (bnboe) 256.9 Implied EV for refining business(US$bn) 53
Lifting costs (US$/boe) 2.8
Royalty from 2020 15% Chemical business
Maintenance capex (US$/boe)* 2.0 2020E chemical net production capacity ('000 tons) 22,700
Tax rate 48% Average net margin (US$/t) 100
Discount rate 10.0% Implied multiple 12
Upstream NPV (US$bn) 1,087 Implied EV for chemical business(US$bn) 27
Combined EV for Aramco (US$bn) 1,221
Combined equity value for Aramco (US$bn) 1,255 Fair value of SABIC*** (US$bn) 53 Source: Company Data, Al Rajhi Capital. * Maintenance capex per boe is calculated based on our expectation of average maintenance capex (roughly 3.7% of sales) and total production throughout the reserve life. ** Average oil price throughout the reserve life. *** Based on our last published target price of SAR 95/share
DCF Valuation Method
For our DCF valuation approach, we use the median Bloomberg consensus estimate for Brent
(~US$61.0-62.0/bbl for 2020-21 and thereafter assume US$65.0/bbl), and apply historical
spreads to calculate the average realized oil price for Aramco. We expect the daily production
volume to decline by ~4.6% in 2019, primarily due to the OPEC production cut agreement
and the impact of the drone attack on its oil fields last year. Post 2020, we expect the
company to increase its daily output at a CAGR of 2.1% over 2020-25E, given the healthy
demand and likely steady oil prices. We have also factored in the revised royalty structure,
effective from Jan 2020. Moreover, we expect the company to continue to incur capital
expenditure of ~US$45bn on an average over 2020-25E. Accordingly, we arrive at a fair value
of US$1.9trn for the company using 2% terminal growth rate and 7.4% WACC (cost of equity:
8.1%). Based on oil price ranging from US$60.0-75.0/bbl, we get a range of US$1.8–2.1trn.
Please see page 15 for scenarios.
Figure 13 DCF valuation method
(In US$bn) 2020E 2021E 2022E 2023E 2024E 2025E
Pre-tax operating profit 207 218 231 234 240 244
Income taxes 98 103 109 111 114 116
Post-tax operating profit 108 115 122 124 126 129
Add: D&A&I 16 20 21 22 23 24
Change in working capital (6) (1) (1) (0) (1) (0)
Less: Capex (62) (39) (41) (42) (43) (43)
Free Cash Flow to Firm* 56 95 101 103 106 110
Discount factor 1.00 0.93 0.87 0.81 0.75 0.70
PV of Free Cash Flows 56 89 87 84 80 77
Sum of present values of FCFs 472
Terminal value as per DCF
Long term growth rate 2%
Free cash flow (t+1) 112
Terminal value 2,085
Present value of terminal value 1,462
Value of the equity
Appraised value of the enterprise 1,935
Add:
Value of associates and non-core assets 11
Less:
Net debt (32)
Minorities (3)
Employees' Termination / Service Benefits (10)
Appraised value of the equity 1,900 Source: Company Data, Al Rajhi Capital. SABIC included in 2H 2020. * Based on our calculations

Saudi Arabian Oil Co. Oil & Gas
19 January 2020
19 May 2019
Disclosures: This document may not be distributed in the United States. Refer to Legend in the penultimate page of this report. Page 14
Other key valuation questions
Why do we not emphasize using EV/Reserves?
For valuation purposes, every company is assumed to be a going concern – that it will
continue to operate forever. For example, a telecom stock even with a license period of only
15 years may be valued with a terminal growth after 5/10 years, even though the license is not
guaranteed after 15 years. In the same way, one could argue that, for oil companies, more
reserves would be acquired or identified so as to maintain the same size of reserves. However,
the size and quality of reserves definitely play a role in understanding the premium for the
company. It also gives a higher degree of confidence about the stability of long-term revenue
and margin forecasts. Based on this method of valuation, we get a market capitalization range
of US$3.6–3.7trn, based on median/average EV/Reserves of 14.0/14.3x of the major IOCs.
There could even be a premium to this multiple for Aramco because of its higher profit per
barrel compared to peers.
Figure 14 EV/Reserves valuation methodology – Base case
Companies Market EV/Reserves Aramco's valuation
Inpex Japan 6.8x Median industry multiples 14.0x
ONGC India 8.2x Aramco's Reserves (Bnbbls) 257
PetroChina China 12.0x Aramco's EV (SARbn) 13,523
Equinor* Norway 12.9x Debt (SARbn)** (173)
Repsol Spain Spain 16.2x Cash and short-term investment (SARbn)** 218
CNOOC China China 15.8x Investment (SARbn)** 42
ENI Spain Italy 10.7x Minority (SARbn)** (11)
Petrobras Brazil 17.9x Pension liabilities (SARbn)** (38)
Suncor Energy Canada 13.8x Equity value (SARbn) 13,561
BP UK Britain 9.5x Equity value (US$bn) 3,616
ExxonMobil United States 14.3x
Chevron United States 20.4x
Shell Netherlands 27.4x
Total France 14.6x
Average 14.3x
Median 14.0x Source: Company data, Bloomberg, Al Rajhi Capital. * Earlier Statoil. ** As of 9M 2019
Why not compare to 30Y bond yield for relative valuation?
We believe that it is an industry practice to compare primarily with 10-year bonds (or 5-year
bonds) given the usual time frame for DCF models, and hence the comparison with 30Y may
not be correct. This is the reason why comparison with lower bond maturity (1/2Y, etc.) is
also not ideal. Moreover, 30Y incurs significant risks of peak oil prices amid other
assumptions that are difficult to capture.
Why EV/EBITDA is not an ideal method to use for valuing the company?
Technically, EV/EBITDA depends on ROIC (as growth depends on ROIC). However because
of the unique royalty structure for Aramco, for oil prices >US$70/bbl, there would be lower
EPS growth than the increase in oil prices (other all things remaining same). The chart in the
next page highlights this deviation. It shows the pretax net income with constant royalty
@15% and with the existing royalty structure. Moreover, when oil prices averaged US$45/b
in 2016, Aramco’s adj. earnings was US$81bn, around 3.6 times the US$22bn of the IOCs.
However, when oil prices surged to US$72/b, Aramco’s earning was US$213bn, only 1.6x the
IOCs at US$131bn. Although there were one-off costs and losses in 2016, in future the growth
in earnings from the increase in oil prices is likely to be more for peers as compared to
Aramco, which implies that the “growth” factor to be considered for Aramco has to be lower.
Moreover, the different scale of RoACE and tax rate difference between Aramco and its peers
make it difficult to find a right EV/EBITDA multiple in our view.

Saudi Arabian Oil Co. Oil & Gas
19 January 2020
19 May 2019
Disclosures: This document may not be distributed in the United States. Refer to Legend in the penultimate page of this report. Page 15
Figure 15 Pre-tax net income per barrel based on different royalty structures
0
10
20
30
40
50
60
70
41
42
44
46
49
51
53
55
57
59
61
63
65
67
69
71
73
75
77
79
81
83
85
87
89
91
93
95
97
99
101
103
105
107
110
Pre
-tax n
et
inco
me p
er
barr
el
(US
$)
Oil prices (US$/bbl)
@15% Royalty rate New royalty rates
Source: Company Data, Al Rajhi Capital
Scenario analysis
Based on various oil prices scenarios, keeping other drivers constant, we get the below range
of FCF and valuations based on NAV and DCF methods.
Figure 16 Scenario analysis - Oil prices
2020 2021 2022 2023 2024 2025 2020 2021 2022 2023 2024 2025
-20% 51.3 51.3 51.3 51.3 51.3 51.3 1,565 -17.6% 1,021 -18.7% 74 81 83 85 88 90
-15% 54.5 54.5 54.5 54.5 54.5 54.5 1,645 -13.4% 1,078 -14.1% 77 86 88 89 92 95
-10% 57.7 57.7 57.7 57.7 57.7 57.7 1,724 -9.2% 1,135 -9.6% 80 90 92 94 96 99
-5% 60.9 60.9 60.9 60.9 60.9 60.9 1,804 -5.1% 1,192 -5.0% 83 94 96 98 101 104
Base 61.3 61.9 65.0 65.0 65.0 65.0 1,900 0.0% 1,255 0.0% 84 95 101 103 106 110
5% 67.3 67.3 67.3 67.3 67.3 67.3 1,964 3.3% 1,307 4.1% 90 102 105 106 109 113
10% 70.5 70.5 70.5 70.5 70.5 70.5 2,043 7.5% 1,364 8.7% 93 107 109 111 114 117
15% 73.7 73.7 73.7 73.7 73.7 73.7 2,098 10.4% 1,407 12.1% 94 109 112 114 117 120
20% 77.0 77.0 77.0 77.0 77.0 77.0 2,142 12.7% 1,444 15.0% 96 112 114 116 119 123
Median consensus - Brent 61.3 61.9 65.0 65.0 65.0 65.0 1,900 0.0% 1,255 0.0% 84 95 101 103 106 110
New
DCF
(US$bn)
Brent oil prices (US$/bbl) FCF (US$bn)%
change
from
New
NAV
(US$bn)
% change
from base
case
Source: Bloomberg, Al Rajhi Capital

Saudi Arabian Oil Co. Oil & Gas
19 January 2020
19 May 2019
Disclosures: This document may not be distributed in the United States. Refer to Legend in the penultimate page of this report. Page 16
Factors that could move our estimates
Upside factors:
Higher than expected oil and gas prices
Higher market share gains as weaker competitors exit
Improved macro-economic growth
Further captive expansion opportunities
Higher than expected decline in local energy consumption leading to higher export
volumes
Faster than expected ramp up of newly commissioned projects
Any favorable change in tax/royalty structure
Completion of value accretive acquisitions
Downside factors:
Lower than expected oil and gas prices
Weaker macro-economic growth
Higher than expected increase in capex for expansions
Climate change concerns
Geo-political tensions
Delay in commercialization of new/expansion projects
Change in policies on royalty and tax detrimental to minority shareholders
Impairment of assets
If KSA were to remove SAR as a pegged currency to US$ in future and the SAR were to
appreciate, the company's SAR-denominated cost of operations might witness a significant
increase, which could affect its operations and financial condition materially
Peak oil scenario: This pertains to the very long term scenario where the total global
demand drops to below Aramco's current level of production.
When the demand for the company's products exceeds its production, Aramco needs to
purchase these products from third parties. Although these purchases are made when it is
cost effective for the company, the total purchase cost would have been higher than its cost
of production. This may affect its cash flows, and thereby likely to bring the valuation
downward.

Saudi Arabian Oil Co. Oil & Gas
19 January 2020
19 May 2019
Disclosures: This document may not be distributed in the United States. Refer to Legend in the penultimate page of this report. Page 17
Key FAQ on the company
What is the importance of Aramco to global markets?
Large fluctuations in oil prices could have repercussions in other asset classes through
cascading effects of oil price (eg. inflation/food prices etc.). The recent attack on Abqaiq saw
global oil prices increasing by more than 14% with impacts witnessed in equity markets
worldwide. Saudi Aramco is the world’s largest oil producer, accounting for ~33% of OPEC
total crude output and ~10% of the total global crude production as of Aug 2019 (source:
EIA). And thus, collective decisions by OPEC (and by virtue of it, Aramco’s production) have
implications on oil prices, globally. Moreover, the company’s excess oil production capacity
enables it to adjust its production output during unexpected shortages from other global
producers, reflecting its importance for balancing global oil markets. The company is the
most profitable hydrocarbon company (US$111bn in 2018 vs. US$23bn for Shell and
US$21bn for Exxon), aided by the lowest cost of production and ample reserves. Accordingly,
the company’s RoACE stood at 41.1% in 2018, significantly higher than major IOCs. Concerns
of peak oil aside, we believe being the core key supplier and part of OPEC, it becomes a
collective global interest to protect Aramco’s interests.
Why do we believe the cost of risk is over-stated?
The cost of risk has often been over estimated in the investor community. Looking at past
data, there have been multiple periods of time where supply had been disrupted in the past,
which are given as follows. However, the average loss in supply has been only 1.5mmbbl/day
on an average. Even after the recent Abqaiq attack, the production recovered very shortly.
Figure 17 OPEC supply capacity disruptions
0
2
4
6
OPEC Embargo 1973-74
Iran Revolution
1978-79
Iran-Iraq War 1980-
81
Iraq Disruption
1982-83
Gulf War (Iraq-Kuwait
1990-91)
Kuwait Fire 2002
Venezuela Strike 2002-
03
Niger-Delta Conf lict
2003
Iraq War 2003
Libya Civil War 2011
Iran Sanctions 2012-15
Libya Unrest
2013-14
mm
bp
d
Source: Aramco, Al Rajhi Capital
We also note that the cost of equity of Saudi’s largest listed peers (based on Bloomberg)
ranges from 7% to 14% with a median cost of equity at around 11%.
Average lost supply of ~1.5mmbpd

Saudi Arabian Oil Co. Oil & Gas
19 January 2020
19 May 2019
Disclosures: This document may not be distributed in the United States. Refer to Legend in the penultimate page of this report. Page 18
Figure 18 Cost of equity* for major oil producers and top Saudi companies
8%9% 9% 9%
11%
12%
7%
8% 8%9% 9% 9%
10%11%11%11%11%
12%12%12%12%12% 12%13%13%13%
0.0%
2.0%
4.0%
6.0%
8.0%
10.0%
12.0%
14.0%
16.0%
Chevro
n
Exxo
n
Shell
To
tal
BP
Ro
sneft
Kin
gd
om
Hld
g
Jarir
SE
C
SA
FC
O
Jab
al O
mar
YA
NS
AB
Mo
bily
SA
BIC
Alm
ara
i
STC
Alin
ma
RIB
L
Alb
ilad
BS
F
AN
B
Al R
ajh
i
Maad
en
SA
BB
SA
MB
A
NC
B
Source: Bloomberg, Al Rajhi Capital. As of October 29, 2019
Why is the comparison with National oil companies not right?
While people skills may be perceived generally less important for commodity-based
companies vis-à-vis technology firms, examples of national oil companies suggest otherwise.
For example, the mismanagement of companies in Latin American state-owned or National
Oil companies (NOCs) such as Petróleos de Venezuela (pdvsa) has resulted in oil production
plunging despite having the largest reserves in the world. Latin American energy companies
account for around 10% of global oil output and 20% of proven reserves and National oil
companies control about 90% of the world’s oil and gas reserves. Other examples are
Petrobras and Pemex where political interference has resulted in mismanagement of
resources and thereby destruction of value. Some media commentary suggests that Aramco
could be valued at par with the NOCs of Venezuela, Peru, Mexico, Brazil, etc. However, when
we look at the management and board of the company, unlike the case of NOCs where the
management are from the general and unrelated fields, Aramco’s management are veterans
working for more than 35 years. The average years served in Aramco by an employee is 20+
(25+years for Saudi nationals). Furthermore, Saudi nationals account 88% of the total
workforce, whereas expats are 12% of the total employees. Around 95% of the senior
management is represented by Saudis. The company also creates an ecosystem of talent
nurturing and grooming.
What is the distinction between the state and the company?
Given that the company falls under the jurisdiction of the Government, it needs to abide by
the Kingdom’s laws. However, the company is distinct from the Government and operates on
a commercial basis, including the investments that are decided at its own discretion. Apart
from royalties and taxes, the Government determines the MSC and production level. MSC
refers to the average maximum number of barrels per day of crude oil that can be produced
for one year during any future planning period, after taking into account all planned capital
expenditure, maintenance, repair, and operating costs, and after being given three months to
make operational adjustments.
Moreover, the law of the Kingdom prohibits directors from sharing company’s confidential
information with the Government, other than at the Annual Meeting in the Government’s
capacity as a shareholder. Saudi Aramco’s Board of Directors includes five directors that are
independent from the company and its shareholders. All Committees are chaired by
independent directors comprising a majority of each of Audit and Compensation
Committees.

Saudi Arabian Oil Co. Oil & Gas
19 January 2020
19 May 2019
Disclosures: This document may not be distributed in the United States. Refer to Legend in the penultimate page of this report. Page 19
Figure 19 Government stake
Title:
Source:
Please fill in the values above to have them entered in your report
25%
60%
100%
0%
20%
40%
60%
80%
100%
120%
1973 1974 1980 Source: Company Data, Al Rajhi Capital
Figure 20 Board of directors of Saudi Aramco
Name DesignationPosition
held sinceMost notable current/previous positions
Amin H.
Nasser
President and
CEOJan-15
• Senior Executive Program at Columbia University in 2002.
• Board of Trustees of the the WEF’s International Business Council (IBC); the MIT Presidential CEO Advisory Board
• Member of the International Advisory Board of the King Fahd University of Petroleum and Minerals
Nabeel A. Al
Mansour
Senior VP,
general
counsel and
corporate
secretary
May-17
• Served as Associate General Counsel from April 2011 to February 2014
• In February 2014 was appointed Executive Director of the Procurement and Supply Chain Management
Organization, responsible for overseeing the corporate supply chain, contracting activities
• Then named as Vice President of that organization in May 2015
HE Yasir
Othman Al-
Rumayyan
Chairman of
Board of
Directors
Jun-16
• Member of the Council of Economic and Development Affairs, and the Governor of the Public Investment Fund
• Advisor to the General Secretariat of the Council of Ministers, the Chairman of the Decision Support Center
• Board member of Saudi Industrial Development Fund.
HE Dr.
Ibrahim A. Al-
Assaf
Board of
DirectorJan-99
• Minister of Foreign Affairs, and a member of the Council of Ministers
• Previously been the Minister of Finance of Saudi Arabia
• Governor of the Islamic Development Bank and serves as a Governor at the International Monetary Fund and Arab
Monetary Fund
HE
Mohammed
A. Al-Jadaan
Board of
DirectorApr-18
• Minister of Finance for Saudi Arabia, Chairman of the Board of Directors of the General Authority of Zakat and Tax
• Chairman of the Fiscal Balance Program Committee, Chairman of the Financial Stability Committee, and
Chairman of the Board of the General Authority of Customs
• Board of Governors of the International Monetary Fund, and the Board of Governors of the World Bank
HE Nabeel
Mohamed Al-
Amudi
Board of
Director-
• Minister of Transport for Saudi Arabia
• Chairman of the Board of Directors of the General Authority of Civil Aviation, Public Transport Authority, Saudi
Ports Authority, Saudi Railways Organization, and Saudi Railways Company
HE
Mohammad
M. Al-Tuwaijri
Board of
DirectorApr-18
• Minister of Economy and Planning for Saudi Arabia
• Chairman of the General Authority for Statistics, and is a member of the Saudi Council of Ministers
• Formerly served as CEO and Head of HSBC’s Global Banking & Markets, Middle East & North Africa (MENA,),
and as Managing Director of JP Morgan Chase Bank, Saudi Arabia
Sir Mark
Moody-Stuart
Board of
DirectorSep-09
• Vice Chairman of the UN Global Compact, and Chairman of the Global Compact Foundation
• Previously served as Managing Director of Royal Dutch Shell, as a Non-Executive Chairman of Anglo American,
and as Director of Accenture
• Formerly served as Non-Executive Director of HSBC Holdings plc, and also served as co-Chairman of the G8
Task Force on Renewable Energy
Mr. Andrew N.
Liveris
Board of
DirectorJul-18
• Board of Directors of IBM Corporation, an Executive Committee Member and past Chairman of the U.S. Business
Council
• Board of Trustees of the King Abdullah University of Science and Technology
• Formerly served as Chairman and CEO of The Dow Chemical Company, and was a member of the Board of
Directors of DowDuPont Inc. and of Citigroup
Mr. Andrew
F.J. Gould
Board of
DirectorJul-13
• Chairman of the International Advisory Board at Boston Consulting Group Center for Energy Impact, and as
Director of BJ Services
• Formerly served as Non-Executive Chairman and Non-Executive Director of BG Group plc, and served as the CEO
and Chairman of Schlumberger Oilfield Services
Ms. Lynn
Laverty
Elsenhans
Board of
DirectorApr-18
• Board of Directors of Baker Hughes, a GE Company, as well as GlaxoSmithKline
• Formerly served as Chairwoman, President, and Chief Executive Officer of Sunoco Inc. and worked for Royal
Dutch Shell
Mr. Peter L.
Cella
Board of
DirectorApr-18
• Board of Directors of ServiceMaster Global Holdings
• Formerly served as President and CEO, Chevron Phillips Chemical Company LP, and as Senior Vice President,
Petrochemicals, North America, BASF Corporation Source: Company Data, Al Rajhi Capital

Saudi Arabian Oil Co. Oil & Gas
19 January 2020
19 May 2019
Disclosures: This document may not be distributed in the United States. Refer to Legend in the penultimate page of this report. Page 20
Figure 21 Corporate management team of Saudi Aramco
Name DesignationPosition
held since
Company
TenureMost notable current/previous positions
Amin H.
Nasser
President and
CEOJan-15 37 Years
• Senior Executive Program at Columbia University in 2002.
• Board of Trustees of the the WEF’s International Business Council (IBC); the MIT Presidential CEO Advisory Board
• Member of the International Advisory Board of the King Fahd University of Petroleum and Minerals
Nabeel A. Al
Mansour
Senior VP,
general
counsel and
corporate
secretary
May-17 30 Years
• Served as Associate General Counsel from April 2011 to February 2014
• In February 2014 was appointed Executive Director of the Procurement and Supply Chain Management
Organization, responsible for overseeing the corporate supply chain, contracting activities
• Then named as Vice President of that organization in May 2015
Mohammed
Y. Al Qahtani
Senior Vice
President –
Upstream
Jan-16 35 Years
• Chairman of the Saudi Aramco Shell Refinery Company (SASREF), the Dhahran Techno Valley Company
Advisory Committee (DTVC), King Salman Energy City Development Company (SPARK), and the University of Hafr
Al-Batin Advisory Committee (UOHB)
• Shareholder Representative of LUKOIL Saudi Arabia Energy Ltd and SINO Saudi Gas Ltd and a Board member of
the Bilateral US-Arab Chamber of Commerce.
• Previously chaired the Board of Directors for the Aramco Services Company (ASC), a fully owned subsidiary in
Houston, Texas..
Abdulaziz M.
Al-Judaimi
Senior vice
president of
Downstream
May-17 35 Years
• Previously served as acting Business Line Head for the business line, vice president, Power Systems
• Chairman of the Board for Motiva Enterprises LLC (Motiva) and Rabigh Refining & Petrochemical Company (Petro
Rabigh); and is the shareholder representative on the Saudi Aramco Total Refining & Petrochemical Company
(SATORP) and the Saudi Electricity Company (SEC) boards
• From April 2004 to June 2006, Al-Judaimi was president & CEO of Aramco Gulf Operations Co. Ltd. in al-Khafji
Ahmad A. Al-
Sa’adi
Senior vice
president,
Technical
Services
Jan-16 38 Years
• Previously, vice president of Pipelines, Distribution, and Terminals
• Previously, president and CEO for Aramco Gulf Operations Company (AGOC), and chairman of the AGOC
Executive Committee
Muhammad
M. Al-Saggaf
Senior vice
president,
Operations
and Business
Services
Jan-14 29 Years
• Previously, President of the King Abdullah Petroleum Studies and Research Center (KAPSARC)
• Previously, chief petroleum engineer, head of upstream research and development, president of the Dhahran
Geoscience Society (DGS), a member of Saudi Aramco’s Corporate Innovation Board, vice-chairman of the Board
of SPE-Saudi Arabia Section, and vice-chairman of the board of directors of the South Rub’ al-Khali (SRAK)
company
Khalid H Al-
Dabbagh
Senior vice
president of
Finance,
Strategy and
Development
Sep-18 35 Years
• Previously, Aramco's financial controller, executive head of Treasury and manager of Business Analysis
Department at Corporate Planning.
• Previous positions he held included manager of Saudi Aramco’s Crude Oil Sales and Marketing; director of Joint
Venture Development and Support; President and CEO of Saudi Petroleum International Inc. in New York; and
General Manager of Saudi Petroleum Limited in Tokyo
• Formerly served as a Board Director with Showa Shell, Fujian Refining and Petrochemical Company, Luberef,
SUMED, and vice chairman of Sinopec SenMei Products Company. Source: Company Data, Al Rajhi Capital

Saudi Arabian Oil Co. Oil & Gas
19 January 2020
19 May 2019
Disclosures: This document may not be distributed in the United States. Refer to Legend in the penultimate page of this report. Page 21
Why does Aramco purchase crude oil and refined products when it already produces 13.6mmboe/d (2018)?
Purchases are being made for use in the company’s downstream operations and to meet
demand for products in the Kingdom when it exceeds the company’s production of the
relevant product. The Company also purchases products from third parties when it is cost
effective. For 2017 and 2018, the company made purchases of SAR188.9bn (US$50.4bn) and
SAR120.4bn, respectively. This 57% increase was primarily attributed to increased purchases
of volumes of crude oil and refined products as well as an increase in the prevailing market
prices for those products. As a percentage of revenue and other income related to sales, the
company’s purchases increased to 14% for 2018 from 12% for 2017. Purchases include both
local and international (eg. purchases made by Motiva) purchases. As per Al Rajhi Capital’s
calculations, in 2018, the company had imported 0.3mmbpd of refined products which was
around SAR33bn (based on an approx. US$80/b price), implying 17% of total purchases as
per our assumptions (This is apart from local refined product purchases which we assume to
be around 0.5mmbpd in 2018). The imports were done mainly to cater to the increased
demand locally for specific grades of oil. These imports were balanced by exports of refined
products (0.5mmbpd; source: company data).
Figure 22 Historical purchase summary
US$bn 2016 2017 2018
Refined products 12.8 24.8 38.7
Crude oil 0.8 6.6 11
Other 0.6 0.7 0.7
Total purchases 14.2 32.1 50.4 Source: Company data, Al Rajhi Capital
The company made purchases of SAR120.4bn and SAR53.2bn for 2017 and 2016,
respectively. This 126% increase was primarily attributable to an increase in purchases of
crude oil and refined products resulting from the consolidation of Motiva into the company’s
financial statements from May 1, 2017, which accounted for SAR48.6bn of purchases by the
company. As a percentage of revenue and other income related to sales, the company’s
purchases increased to 12% for 2017 from 11% for 2016.
Figure 23 2018 export/import of refined product
0.5
-0.3-0.4
-0.3
-0.2
-0.1
0
0.1
0.2
0.3
0.4
0.5
0.6
Export Import
mm
bp
d
2018 Ref ined Product Source: Company data, Al Rajhi Capital
What is the benefit from decline in local energy needs?
As per Sept 2019 OPEC report, there has been a marginal decline of 0.04mmbpd in direct
local crude used which could be because of declining energy needs. This would free up more
crude for exports. Based on an assumed average selling price of US$60/bbl and upstream
lifting cost of US$2.8/boe, it implies a gross profit benefit of US$835mn.

Saudi Arabian Oil Co. Oil & Gas
19 January 2020
19 May 2019
Disclosures: This document may not be distributed in the United States. Refer to Legend in the penultimate page of this report. Page 22
Figure 24 Direct crude oil use YoY change (mbpd)
-175-160
-125
-75
25
100
50
-85-75
-125
40
85
-50
-200
-150
-100
-50
0
50
100
150
Jul-18 Aug-18 Sep-18 Oct-18 Nov-18 Dec-18 Jan-19 Feb-19 Mar-19 Apr-19 May-19 Jun-19 Jul-19
mb
pd
Source: OPEC, Al Rajhi Capital
What are Aramco’s selling prices to its own refineries and to domestic firms?
Aramco’s wholly owned refineries and JVs buy crude at almost the same price as
international firms as per our assumptions. The pricing for refined goods exports and local
sales as well as crude exports and local sales is shown as follows.
Figure 25 Refined products and crude oil prices
51.3
17.9
40.7
6.2
65.0
18.7
52.7
6.2
80.8
25.9
70.0
6.2
-
10.0
20.0
30.0
40.0
50.0
60.0
70.0
80.0
90.0
Exports price* Local price Exports price Local price
Ref ined products Crude oil
US
$/b
bl
2016 2017 2018
Source: Company Data, Al Rajhi Capital. * Export prices of refined products (S-Oil, Motiva, ATC and SAOC
Based on the above chart and our assumptions, the gross refining margins for exports could
be around US$10.8/boe (US$80.8 per boe – US$70.0 per boe), US$13.3/boe, and
US$10.6/boe for 2018, 2017, and 2016, respectively. Please note that these are not standard
definition but for representation purposes only.
The company possesses the exclusive right to sell crude oil and refined products in the
Kingdom. The government mandates that crude oil and certain refined products sold to third
parties in the Kingdom are at regulated prices that are typically lower than the prices at which
the company could otherwise have sold such products. As the regulated prices often have
been lower than the prices at which the company could otherwise have sold such refined
products, prior to 2017, the downstream business incurred losses in its operations.
Effective January 1, 2017, the government implemented an equalization mechanism to
compensate the company for revenue directly foregone as a result of the company’s
compliance with the mandates related to crude oil, kerosene, diesel, heavy fuel oil, and

Saudi Arabian Oil Co. Oil & Gas
19 January 2020
19 May 2019
Disclosures: This document may not be distributed in the United States. Refer to Legend in the penultimate page of this report. Page 23
gasoline. The company records the equalization amount as other income related to sales on
its consolidated statement of income and such amount is subject to income tax. The company
may offset its income taxes payable by the equalization amount in the period in which such
taxes are due. If the income taxes payable to the government are not adequate to offset the
equalization amount, the company may offset any other amounts it owes to the government
against the equalization amount. The offsetting mechanism occurs on a monthly basis when
payments to the government are due. In the event of the equalization price being less than
the regulated price, the difference would be due from the company to the government.
What happens when the government increases the regulated prices?
The government has publicly announced its intention to gradually modify the regulated
prices at which refined products are sold in the Kingdom. The regulated prices will be linked
as a percentage to the reference equalization price of the relevant product and will change
according to fluctuations in global markets. As regulated prices increase, the company
expects that equalization compensation will decrease and that, in turn, the amount of other
income related to sales recorded by the company will decrease, with an offsetting increase in
revenue from product sales.
Gas pricing: Gas sales in the Kingdom are regulated by the government, including Ministry
of Energy, Industry and Mineral Resources (MEIM), which allocates volumes for the sale of
natural gas and NGLs in the Kingdom to domestic customers pursuant to the GSPR. The
price that domestic customers pay for natural gas and ethane is traditionally set by the
Council of Ministers. Effective March 27, 2018, the Council of Ministers empowered MEIM,
in agreement with the Ministry of Finance, to specify the minimum price due to those
licensed to engage in gas investment for the sale of natural gas, ethane, and NGLs, in order to
provide such licencees making gas investments an opportunity to realize a suitable rate of
return for these products in the Kingdom. The Council of Ministers also decided that the
domestic prices for natural gas, ethane, and NGLs (excluding any Government fees or value-
added tax) shall not be lower than this minimum price. If domestic prices are higher than the
minimum price, licencees shall pay the difference to the government. Subsequently, MEIM in
agreement with the Ministry of Finance issued a ministerial decision setting such minimum
price at a level they determined would permit licencees to achieve the commercial return on
existing non-associated gas projects and on future non-associated projects.
Why invest in downstream if the EBITDA from downstream is relatively minor. (US$6.6bn in 2018 as compared to company EBITDA of US$223.9bn)
The company is investing in downstream to protect and increase its upstream revenues.
When the company invests in a downstream company, the upstream also stands to benefit
when the invested entity procures hydrocarbons from upstream segment. Thus this would
mean increasing upstream sales as and when the downstream segment grows. Hence even if
the downstream segment barely breaks even, the company would benefit by means of its high
margin upstream segment. If the downstream company is not consolidated, then even the
additional capital required for downstream expansion is not on Aramco’s balance sheet. Thus
the main motive for Aramco to invest in downstream would be to ensure growth in its
upstream.
What is the impact of IFRS 16 adoption?
IFRS 16 was adopted on 1 Jan 2019 and the main impact was an increase in lease liabilities by
US$7bn. This is calculated based on present value of remaining lease payments.

Saudi Arabian Oil Co. Oil & Gas
19 January 2020
19 May 2019
Disclosures: This document may not be distributed in the United States. Refer to Legend in the penultimate page of this report. Page 24
Why invest in gas if margins are lower for gas as compared to oil?
The below chart explains the strategy of the company. The numbers are all based on our
interpretations and assumptions. Based on 2018 numbers, we see that the gross margin of
crude oil exports (US$67.2/bbl) is likely much more than that of hypothetical gas export
margins (US$14.2/boe) or even refined products (US$10.8/boe). Thus reallocating all gas for
local needs and exporting crude (used locally) would be beneficial to the company.
Figure 26 Indicative gross margin mix of each product*
2018
Avg. realized export sales price 70.0
Cost** 2.8
Margin 67.2
Avg. realized local sales price 6.2
Cost** 2.8
Margin 3.4
Avg. realized export refined products sales price 80.8
Cost** 70.0
Margin 10.8
Price 25.9
Cost 70.0
Margin -44.1
Price 6.7
Cost** 2.8
Margin 3.9
Price 39.2
Cost** 2.8
Margin 36.4
Crude oil export sales margin (US$/bbl)
Crude oil local sales margin (US$/bbl)
Refined products (S-Oil, Motiva, ATC and SAOC) export margin (US$/bbl)
Refined products local margin (US$/bbl)***
Sweet gas sales local margin (US$/bbl)
LPG sales export margin (US$/bbl)
Source: Al Rajhi Capital. * Based on our calculations. ** Assumed upstream lifting costs of US$2.8/boe is equal to US$2.8/bbl across all the products categories. *** Excluding the benefit of price equalization. If we include this benefit, then it would be the same as refined products export margin, i.e. US$10.8/bbl.
What is the scope for gas exports?
As per IHS, gas demand in the Kingdom is expected to grow by 3% . Now, there are major gas
projects coming online and hence the difference between this demand and supply could be
used for gas exports. However the company may have to supply gas to replace liquids usage
within the Kingdom and hence exports may take some time but we see a possibility of gas
exports in the long term.
What is the incremental profit contribution from upcoming projects?
Based on our assumptions that include average oil price US$63.0/barrel, US$10.0/boe
premium for downstream products, and 100% throughput, the incremental net profit
contribution from the projects (shown below) is likely to be around US$12.5bn, over various
periods of time.

Saudi Arabian Oil Co. Oil & Gas
19 January 2020
19 May 2019
Disclosures: This document may not be distributed in the United States. Refer to Legend in the penultimate page of this report. Page 25
Figure 27 Incremental contribution to net income from the upcoming projects based on our estimate
Timeline Ownership Name
Gross refining
capacity
(mmbpd)
Revenue
(US$bn)
Cost
(US$bn)
Royalty
(US$bn)
Other
costs
(US$bn)
Profit
before tax
(US$bn)
Tax
(US$bn)
Profit
after tax
(US$bn)
H2 2020 100% Jazan integrated plant 0.40 10.51 0.41 1.36 1.05 7.69 3.41 4.29
H2 2020 50% Prefchem 0.30 3.94 3.39 0.00 0.39 0.15 0.03 0.12
H2 2020 100% Upstream sales to Prefchem 0.15 3.39 0.15 0.51 0.34 2.39 1.20 1.20
H1 2020 17% Hyundai oil* 0.65 0.20
2023 100% Marjan gas project 0.46 1.34 0.47 0.00 0.13 0.74 0.15 0.59
2020 100% Fadhili gas project 0.46 1.34 0.47 0.00 0.13 0.74 0.15 0.59
2021 100% Haradh gas project 0.20 0.58 0.20 0.00 0.06 0.32 0.06 0.26
2020 62.5% SATORP 0.04 0.66 0.57 0.00 0.07 0.03 0.01 0.02
2020 62.5% YASREF 0.03 0.49 0.42 0.00 0.05 0.02 0.00 0.02
2020 100% Upstream sales to SATORP/YASREF 0.07 1.58 0.07 0.24 0.16 1.12 0.56 0.56
3Q 2019 100% Increased ownership at SASREF 0.31 0.56 0.00 0.00 0.06 0.50 0.24 0.26
2023 100% Crude capacity at Marjan 0.30 6.79 0.31 1.02 0.68 4.79 2.39 2.39
2023 100% Crude capacity at Berri 0.25 5.66 0.26 0.85 0.57 3.99 1.99 1.99
Total 12.49 Source: Al Rajhi Capital. * post acquisition; Note: Incremental contribution does not include Aramco’s proposed deal of 20% stake in Reliance Industries Ltd and Motiva’s recent agreement to acquire 100% ownership interest in Flint Hills Resources Port Arthur, LLC.
What was impact of the recent attacks on Abqaiq and Khurais?
Saudi Aramco’s oil processing plants at Abqaiq and Khurais were attacked on 14 September,
2019, leading to a temporary production suspension of 5.7mn barrels a day of crude oil
(~54% of the Kingdom’s crude oil production; source: company data). However, Saudi
Aramco’s actions included: a) utilizing its crude oil inventory located outside of the Kingdom,
b) increasing output from other facilities, c) stop supplying of crude to its international JVs,
d) substituting grades of crude deliveries, and e) limiting NGL deliveries to selected clients.
Furthermore, given the reduction in gas output, the domestic power plants had also partially
shifted to crude burning. Nonetheless, the company managed to recovered its production to
the earlier level on 25 September, 2019, reflecting a limited impact on its financial
performance.

Saudi Arabian Oil Co. Oil & Gas
19 January 2020
19 May 2019
Disclosures: This document may not be distributed in the United States. Refer to Legend in the penultimate page of this report. Page 26
Comparison with peers
Largest hydrocarbon producer globally
Saudi Aramco produced 13.6mmboe/d in 2018, almost 4.6x of Chevron’s production, 3.7x of
BP’s production, and 3.5x of Exxon’s total output. With a significant spare oil production
capacity of 2.27mmbpd as of August 2019 (source: IEA), the state-oil giant is well positioned
to adjust its production output in case of shortages from other producers globally. This also
provides the company a notable control on the market over other global producers.
Figure 28 Aramco vs. Top IOCs production comparison (2018) Figure 29 Aramco vs. Top IOCs margins comparison (2018)
13.6
5.8
4.1 3.8 3.7 3.7 2.9 2.8
0.0
2.0
4.0
6.0
8.0
10.0
12.0
14.0
16.0
Ara
mco
Ro
sneft
Petr
oC
hin
a
Exxo
nM
ob
il
BP
UK
Shell
Chevro
n
To
tal
mm
bo
e/d
0%
10%
20%
30%
40%
50%
60%
70%
Ara
mco
Ro
sneft
Chevro
n
To
tal
Petr
oC
hin
a
Exxo
nM
ob
il
Shell
BP
UK
EBITDA margin (%) Net margin (%) Source: Company data, Bloomberg, Al Rajhi Capital Source: Company data, Bloomberg, Al Rajhi Capital
Cheapest production costs enable the company to generate higher margins
Saudi Aramco is the most profitable company (US$111bn in 2018) in the world with EBITDA
and net profit margins of 62.9% and 31.2% (margins are calculated based on sales including
other income related to sales in which price equalization is booked), respectively, in 2018, far
higher than its peers (Exxon: 14% EBITDA margins and 7.5% net margins). These high
margins were mainly driven by low upstream production cost compared to its peers (Figure
30).
Figure 30 Full-cycle costs in terms of 2019 dated Brent (US$/bbl)
Source: Aramco prospectus, Al Rajhi Capital
In a nutshell, large-scale production along with lowest upstream production costs enables the
company to generate strong free cash flows, compared to big IOCs. In 2018, Saudi Aramco
generated a free cash flow of ~US$86bn, which was 5x of Exxon and 3x of Shell. Higher free

Saudi Arabian Oil Co. Oil & Gas
19 January 2020
19 May 2019
Disclosures: This document may not be distributed in the United States. Refer to Legend in the penultimate page of this report. Page 27
cash flow generation capability also ensures a higher payout in the form of dividend,
compared to its peers.
Figure 31 Aramco vs. Top IOCs FCF comparison (2018)
-
10
20
30
40
50
60
70
80
90
100
Aramco Shell Chevron ExxonMobil PetroChina Total BP UK Rosnef t
US
$b
n
Source: Company Data, Bloomberg, Al Rajhi Capital

Saudi Arabian Oil Co. Oil & Gas
19 January 2020
19 May 2019
Disclosures: This document may not be distributed in the United States. Refer to Legend in the penultimate page of this report. Page 28
Segmental Overview
Upstream
The company is the world’s leading producer of crude oil and condensate. In 2018, the
company had a total production of 13.6mmboed, including 10.3mmboed of crude oil
(including blended condensate), an additional 0.2mmboed of unblended condensate,
1.1mmboed of NGLs, 8.9bnscfd (1.6mmboed) of natural gas, and ~1.0bnscfd (0.3mmboed) of
ethane. Aramco produces a higher percentage of liquids (86%), which enables the company
to generate higher margins than with the production of gas.
Figure 32 Production break-up – 2018
10.3 0.2
1.1
1.6 0.3 13.6
-
2.0
4.0
6.0
8.0
10.0
12.0
14.0
16.0
Crude oil Condensate NGLs Natural gas Ethane Total
mm
bo
e/d
Crude oil Condensate NGLs Natural gas Ethane Total
Source: Company Data, Al Rajhi Capital. Combined barrel of oil equivalent volume is derived from mmscfd (for natural gas and ethane) by dividing the relevant product production by 5.4 (in the case of natural gas) and 3.33 (in the case of ethane).
Figure 33 Saudi Aramco 2018 crude supply by region
3.0
1.2
1.0
0.9
0.9
0.8
2.6 10.3
-
2.0
4.0
6.0
8.0
10.0
12.0
Saudi Arabia Japan China US South Korea India Other Total
mm
bp
d
Saudi Arabia Japan China US South Korea India Other Total
Source: Company Data, Al Rajhi Capital

Saudi Arabian Oil Co. Oil & Gas
19 January 2020
19 May 2019
Disclosures: This document may not be distributed in the United States. Refer to Legend in the penultimate page of this report. Page 29
Figure 34 2018 Crude Supplied to Captive System
1.3
1.9
0.7
6.4
0
1
2
3
4
5
6
7
8
Outsized Crude Supply to International Ventures
Sole Suppliers of Crude to in-Kingdom JVs
Sole Suppliers of Crude to Wholly-Owned Ref ineries
Exporter of Crude to Largest and Growing Markets
mm
bp
d
Ras TanuraRiyadhYanbu
SATORPYASREFSAMREF
SASREFPetro Rabigh
MotivaS-Oil FREP
SSPCIdemitsu Kosan Co.
75% of total crude export deliveries to China, India, US,
Japan and South Korea
Source: Company Data, Al Rajhi Capital
Figure 35 Aramco's upstream 2018 revenue breakup*
137
15 1
153
189
19
(0)
207
(50)
-
50
100
150
200
250
Crude oil Natural Gas and NGLs Others Total upstream revenues
US
$b
n
2017 2018
Source: Company Data, Al Rajhi Capital. *External revenue only; excludes inter-segmental revenue and other income related to sales
Figure 36 Key upstream financials
2016 2017 2018
Combined daily production (mmboe/d) 13.6 13.2 13.6
Exports (mmboe/d) 7.8 7.5 7.7
Local deliveries (mmboe/d) 5.4 5.5 5.5
Avg. export realized price (US$/bbl) 40.7 52.7 70.0
Avg. local realized price (US$/bbl) 6.2 6.2 6.2
Total upstream revenues (US$bn) 153 207
EBITDA (US$bn) 160 220
Capex (US$bn) 22 27 Source: Company Data, Al Rajhi Capital
Contribution of countries, and its growth – In 2016, 2017, and 2018, customers in
Asia, including the company’s affiliated refineries located in Asia, purchased 69%, 71%, and
71%, respectively, of the company’s crude exports.

Saudi Arabian Oil Co. Oil & Gas
19 January 2020
19 May 2019
Disclosures: This document may not be distributed in the United States. Refer to Legend in the penultimate page of this report. Page 30
Figure 37 Aramco’s crude oil deliveries by destinations Figure 38 Aramco’s 2018 crude oil deliveries by destinations (%)
5.2
1.20.9
0.2
5.1
1.00.8
0.2
5.2
1.00.9
0.2
0
1
2
3
4
5
6
Asia (ex-Kingdom) North America Europe Other
mm
bp
d
2016 2017 2018
Title:
Source:
Please fill in the values above to have them entered in your report
Asia (ex-Kingdom), 71%
North America, 14%
Europe, 12%
Other, 3%
Source: Company Data, Al Rajhi Capital Source: Company Data, Al Rajhi Capital
Maximum sustained capacity
Maximum sustained capacity (MSC) refers to the average number of barrels per day of crude
oil that can be produced for a year after all planned capital expenditure and other operating
expenses. It is such that production at MSC beyond one year would require additional capital
and operating expenses. The company’s MSC remained at 12mmbpd as of 2018. The Ghawar
field remained at the top with a MSC of 3.8mmbpd, followed by Khurais with a MSC of
1.45mmbpd. Moreover, the government has the exclusive power to set the production limits
as well as the MSC to manage the Kingdom’s hydrocarbon resources, as per the
Hydrocarbons Law. Accordingly, the government has the sole discretion to increase or
decrease the MSC at any time based on its sovereign energy security goals.
Future development upstream projects
Aramco has successfully executed many large upstream development projects across its fields
since the mid-1990, demonstrating a solid execution capabilities. Some of most notable
projects, which are currently under development phases and will significantly enhance its
crude oil production and gas processing capabilities, are shown below.
Berri field:
Aramco plans to increase its Arabian light crude capacity by 250mbpd through a new
processing system at the existing Abu Ali gas oil separation plant and new onshore and
offshore wells. The development program includes two drilling islands, 11 offshore
production platforms and 9 onshore drill sites along with one water injection facility. The
field is expected to come on stream in 2023.
Marjan field:
The Marjan development program comprises an integrated development of crude oil,
associated gas and non-associated gas production capacity. Crude oil production capacity at
Marjan will be expanded by 300mbpd while the new Tanajib gas processing facility will have
a gas processing capacity of 2.5bscf/d. The Marjan crude oil capacity increment will be
available at the same time as the Tanajib gas processing facility (with NGL extraction) in
2023.
Fadhili Gas Plant:
The Fadhili Gas plant is expected to add up to 2.0bscf/d and 0.5 bscf/d of gas processing
capacity for the Hasbah-II (offshore) and Khursaniyah (onshore) fields, respectively. This
plant is likely to produce natural gas to the MGS, sulphur and low BTU natural gas to fuel a
cogeneration plant for supplying electricity to the national power grid.

Saudi Arabian Oil Co. Oil & Gas
19 January 2020
19 May 2019
Disclosures: This document may not be distributed in the United States. Refer to Legend in the penultimate page of this report. Page 31
Haradh Gas increment processing facilities and Hawiyah gas plant
This plant will increase the gas processing facilities at the Hawiyah Gas plant to 3.6bcf/d, and
also boost the capacity of the pipeline network transporting gas between the Haradh field and
the Hawiyah plant. The plant is expected to be completed in 2021.
Extensive infrastructure and distribution network
The company’s fields, processing plants and other facilities are connected through an
extensive pipeline network. Through this network, the company can transport its products to
its other facilities for further processing or refining or directly to export terminals. From this
huge network, the East-West pipeline has a capacity of 5.0mbpd of crude oil, which is further
expected to increase to 7.0mbpd by the end of 2019. Aramco’s crude oil processing
infrastructure facilities, which are connected through pipeline, are located and diversified
across the country, as shown below.
Figure 39 The location of Aramco’s crude oil processing infrastructure - 2018
Source: Company data, Al Rajhi Capital
Further, Saudi Arabia is the seventh largest natural gas market in the world and Saudi
Aramco is the primary supplier of the same in the Kingdom. The company’s gas and natural
gas liquid (NLG) infrastructure consists of:
8 gas processing plants
2 NGL recovery straddle plants (1 another plant is currently under construction)
4 NGL fractionation plants
The MGS
Master Gas System (MGS)
To accommodate the growing domestic demand in the Kingdom, the company is expanding
its infrastructure facilities through construction of new plants and Master Gas System (MGS)
network. MGS is a gas gathering, processing and distribution infrastructure network. The
transportation of gas within the Kingdom is controlled by the MGS. The company had
completed the phase I of the MGS network expansion project in January 2018 and raised the
total capacity to 9.6bn scfd. Furthermore, phase II of the expansion project is due to be
completed by 2021, which is expected to raise the total capacity to 12.5bn scfd. After the
completion of phase II, 1600km of pipelines is planned to be added to the current system.
The industrial cities like Yanbu and Jubail are supplied gas through the MGS network; and
Rabigh will be connected with the largest pipeline of 212km, which is to be built in the
coming period. Besides, four other pipelines will connect Manifa to the Khursaniya gas plant

Saudi Arabian Oil Co. Oil & Gas
19 January 2020
19 May 2019
Disclosures: This document may not be distributed in the United States. Refer to Legend in the penultimate page of this report. Page 32
and to Ras al-Zour for gas processing and power production. The company is further
expected to expand its gas reserves through new field discoveries, new reservoir additions
and reassessment of existing fields and reservoirs. The current domestic demand along with
further expansion plans will be beneficial for the company in terms of revenue generation
through efficient distribution of natural gas in one of the largest market globally.
Figure 40 Historical increases in gas processing capacity from 1980 to 2018 and planned increases through 2023 (excluding Shaybah gas processing)
Source: Company data, Al Rajhi Capital. BGP/SGP/UGP - Berri/Shedgum/’Uthmaniyah Gas Plants, HGP Exp – Hawiyah Gas Plant Expansion, FGP – Fadhili Gas Plant, KGP – Khursaniyah Gas Plant, HdGP – Haradh Gas Plant, MDYN – Midyan, HGP – Hawiyah Gas Plant , WGP – Wasit Gas Plant, TGP – Tanajib Gas Plant Gas Plant

Saudi Arabian Oil Co. Oil & Gas
19 January 2020
19 May 2019
Disclosures: This document may not be distributed in the United States. Refer to Legend in the penultimate page of this report. Page 33
Downstream
The downstream segment contributed to around 30% of top-line (including other income
related to sales) in 2018. The downstream segment’s primary activities consist of refining and
petrochemical manufacturing and supply. The downstream segment’s other business
activities include crude oil sales, product distribution, trading and marketing, and power
generation.
The downstream generates lesser margins as compared to the upstream. As per our
estimates, the downstream segment made an EBITDA of US$6.6bn in 2018 as compared to
upstream EBITDA of US$220bn in 2018. On a per barrel basis, as per our calculations, the
EBITDA per barrel was US$46 for upstream and ~US$4 for downstream (refining and
chemical) in 2018. In case of no increase in oil prices, we have forecasted both upstream and
downstream EBITDA margin per barrel to remain stable, after adjusting for royalties.
The company’s strategy is to expand downstream further, which effectively locks in higher
upstream sales. As per our expectations, the company could increase the crude production to
captives from 38% in 2018 to 50% in a few years. As production of local refined products
increases, more oil can be used for exports. The company also plans to continue increasing its
in-Kingdom refining capability and expand its strategically integrated downstream business
in high-growth economies such as China, India, and Southeast Asia, while maintaining its
current participation in material demand centers such as the US and countries that rely on
importing crude oil such as Japan and South Korea. As for chemicals, the company intends to
further integrate its chemicals business with its refining operations, increase its chemicals
production capacity through debottlenecking or new assets, and increase its presence in
developing and new markets to support the company’s long-term growth strategy.
Integration with refining allows the company to capture additional margins, balance refinery
system production, and reduce margin volatility.
Figure 41 Key downstream financials
2016 2017 2018 H1-2019
Gross Throughput (mmbpd) 4.9 4.8 4.7 4.6
Brent Price (US$/bbl) 45.0 55.0 72.0 66.0
Revenue & other income related to sales (US$bn) 38 101.8 138.7 64.6
EBITDA (US$bn) NM 8 6.6 2.4
CAPEX (US$bn) 8.3 9.5 8.7 3.1 Source: Company Data, Al Rajhi Capital
Refining
The company operates its refining business through its wholly owned operations and
affiliated refineries. The net refining capacity has increased from 2.2mn barrels per day in
2010 to 3.1mn barrels per day in 2018. In terms of gross refining capacity, this was 4.9mn
barrels per day in 2018.

Saudi Arabian Oil Co. Oil & Gas
19 January 2020
19 May 2019
Disclosures: This document may not be distributed in the United States. Refer to Legend in the penultimate page of this report. Page 34
Figure 42 Aramco’s refining capacity*
2.4 2.4 2.2 2.2 2.2 2.2 2.4 2.6 3.1 3.1 3.1 3.1 3.14.0
4.0 4.14.0 4.2
4.2 4.14.5
4.9
5.4 5.4 5.4
4.8 4.9
6.8
0
2
4
6
8
10
12
2006 2007 2008 2009 2010 2011 2012 2013 2014 2015 2016 2017 2018 2019/20
mm
bp
d
Net ref ining capacity Gross ref ining capacity
Source: Company Data, Al Rajhi Capital. *PrefChem is expected to be completed in 2020.
Figure 43 Refining capacity as of 2018
Gross Refining
capacity
(mbpd) Ownership
Net
refining
capacity
(mbpd)
Utilization
rate
Throughput
(mbpd)
Domestically Wholly Owned Refined Operations
Ras Tanura 550 100% 550 96% 528
Yanbu 250 100% 250 100% 251
Riyadh 130 100% 130 107% 139
Jazan - likely to be opertional in 2019* - 100% - - -
Jeddah Refinery - closed in Nov 2017 - - - - -
Total wholly owned refining capacity 930 930 99% 918
Domestic Affiliated Operations
SATORP 400 63% 250 105% 418
YASREF 400 63% 250 105% 421
SAMREF 400 50% 200 82% 328
SASREF# 305 50% 153 101% 307
Petro Rabigh 400 38% 150 97% 387
Total domestic affiliated operations 1,905 1,003 98% 1,861
International Refining
Motiva (Port Arthur Refinery) 635 100% 635 103% 654
S-Oil 669 62% 412 98% 657
PRefChem* - 50% - - -
Hyundai oil bank** - 17% - - -
FREP 280 25% 70 63% 176
Idemitsu^ 445 15% 67 96% 429
Total International refining capacity 2,029 1,184 94% 1,916
Total refining capacity 4,864 3,117 96% 4,693 Source: Company Data, Al Rajhi Capital. *Jazan plant is expected to start the production in 2019 while PrefChem refinery is expected to be completed in 2020. Therefore, we did not consider it. **Aramco has completed the acquisition.
# SASREF is now 100% owned by Saudi
Aramco. ^ The Idemetsu Kosan transaction is already complete and Aramco's share has reduced to 7.7%.

Saudi Arabian Oil Co. Oil & Gas
19 January 2020
19 May 2019
Disclosures: This document may not be distributed in the United States. Refer to Legend in the penultimate page of this report. Page 35
Figure 44 Aramco's petroleum products
2017 2018
Consolidated Basis
Diesel 747 762
Gasoline 422 416
Jet fuel / kerosene 145 156
Fuel Oil 345 315
Other 233 235
Total in-Kingdom refinery production 1,891 1,884
Diesel 342 447
Gasoline 212 312
Jet fuel / kerosene 167 194
Fuel Oil 109 97
Other 276 306
Total international Refinery Production 1,106 1,356
Total production - fully consolidated basis 2,998 3,239
Equity basis
Total in-Kingdom refinery production 1,891 1,884
Total international Refinery Production 1,148 1,193
Total Production - equity basis 3,039 3,077
Year Ended 31 December
In mbpd
Source: Company Data, Al Rajhi Capital
The company expects the Jazan integrated petrochemical refinery and the PRefChem
integrated refinery and petrochemicals complex to commence operations by the end of 2019
and 2020, respectively, which will increase the company’s gross refining capacity to 5.6mn
barrels per day and net refining capacity to 3.7mn barrels per day. However, if we are to
include Hyundai oil bank acquisition and Showa Shell’s acquisition of Idemitsu, then the
gross refining capacity is likely to go up to 6.8mbpd and the net refining capacity to 4mbpd
(Hyundai oil bank acquisition is already completed end of 2019).
The company’s strategy is to continue increasing its in-Kingdom refining capability and
expand its strategically integrated downstream business in high-growth economies such as
China, India, and Southeast Asia, while maintaining its current participation in material
demand centers such as the US and countries that rely on importing crude oilsuch as Japan
and South Korea. As for chemicals, the company intends to further integrate its chemicals
business with its refining operations, increase its chemicals production capacity through
debottlenecking or new assets, and increase its presence in developing and new markets to
support the company’s long-term growth strategy. Integration with refining allows the
company to capture additional margins, balance refinery system production, and reduce
margin volatility.
Further integration also supports the production of more complex, higher-value chemicals
and specialty products. Together with this capacity and portfolio growth, the company seeks
to further utilize its marketing capabilities by securing product offtake from its affiliates,
which would allow the company to capture margins at each stage of the hydrocarbon value
chain, from upstream crude production to downstream polymer product sales and
distribution.
What is the incremental profit contribution from the upcoming projects?
Based on our assumptions that include average oil price US$63/barrel, US$10/boe premium
for downstream products, and 100% throughput, the incremental net profit contribution
from the projects (shown below) is likely to be around US$12.5bn .

Saudi Arabian Oil Co. Oil & Gas
19 January 2020
19 May 2019
Disclosures: This document may not be distributed in the United States. Refer to Legend in the penultimate page of this report. Page 36
Figure 45 Incremental contribution to net income from the upcoming projects based on our estimate
Timeline Ownership Name
Gross refining
capacity
(mmbpd)
Revenue
(US$bn)
Cost
(US$bn)
Royalty
(US$bn)
Other
costs
(US$bn)
Profit
before tax
(US$bn)
Tax
(US$bn)
Profit
after tax
(US$bn)
H2 2020 100% Jazan integrated plant 0.40 10.51 0.41 1.36 1.05 7.69 3.41 4.29
H2 2020 50% Prefchem 0.30 3.94 3.39 0.00 0.39 0.15 0.03 0.12
H2 2020 100% Upstream sales to Prefchem 0.15 3.39 0.15 0.51 0.34 2.39 1.20 1.20
H1 2020 17% Hyundai oil* 0.65 0.20
2023 100% Marjan gas project 0.46 1.34 0.47 0.00 0.13 0.74 0.15 0.59
2020 100% Fadhili gas project 0.46 1.34 0.47 0.00 0.13 0.74 0.15 0.59
2021 100% Haradh gas project 0.20 0.58 0.20 0.00 0.06 0.32 0.06 0.26
2020 62.5% SATORP 0.04 0.66 0.57 0.00 0.07 0.03 0.01 0.02
2020 62.5% YASREF 0.03 0.49 0.42 0.00 0.05 0.02 0.00 0.02
2020 100% Upstream sales to SATORP/YASREF 0.07 1.58 0.07 0.24 0.16 1.12 0.56 0.56
3Q 2019 100% Increased ownership at SASREF 0.31 0.56 0.00 0.00 0.06 0.50 0.24 0.26
2023 100% Crude capacity at Marjan 0.30 6.79 0.31 1.02 0.68 4.79 2.39 2.39
2023 100% Crude capacity at Berri 0.25 5.66 0.26 0.85 0.57 3.99 1.99 1.99
Total 12.49 Source: Al Rajhi Capital. * post acquisition; Gas production shown in boe/day. Note: Incremental contribution does not include Aramco’s proposed deal of 20% stake in Reliance Industries Ltd and Motiva’s recent agreement to acquire 100% ownership interest in Flint Hills Resources Port Arthur, LLC.
Chemicals
The company’s chemicals business represents an extension of the hydrocarbon value chain
and strategically complements the company’s refining operations. The company’s growing
operations in chemicals include participation in high-growth chemical markets with demand
from industries such as packaging, automotive, and appliances.
The chemicals business had increased its net chemical production capacity to 16.8mn tons
per year in 2018. The company expects the Jazan integrated petrochemical refinery and the
PRefChem integrated refinery and petrochemicals complex (300,000 barrel per day refinery,
an integrated steam cracker with a capacity to produce 1.3mn tons of ethylene with associated
petchem products) to commence operations by the end of 2019 and 2020, respectively, which
is expected to increase the company’s net chemical production capacity to 22.7mn tons per
year. Aramco expects to provide a significant portion of PRefChem’s crude supply under a
long-term supply agreement. In addition, the other recent investment in the refining
portfolio also includes a residue upgrading and petrochemicals complex project at S-Oil,
which was commissioned in 2018.
As per our rough estimates, chemical demand in terms of oil per day amounts to 0.53mmbpd
and is thereby unlikely to materially change the bottom-line for the company post such
expansion as well. The capex at Jazan refinery and Prefchem amounts to 20% of the existing
capacity, which is another 0.1mmbpd and is not materially significant in our view. Going by
the net margins of chemical companies, the contribution is materially insignificant at the
bottom-line level too. While the capex for Jazan refinery would be in the balance sheet of
Aramco, the expansion at Prefchem would not come in the cash flows for Aramco.

Saudi Arabian Oil Co. Oil & Gas
19 January 2020
19 May 2019
Disclosures: This document may not be distributed in the United States. Refer to Legend in the penultimate page of this report. Page 37
Figure 46 Chemicals production capacity - 2018 (ex-SABIC)
Gross Capacity
('000 tons) Ownership
Net capacity
('000 tons)
Commodity petrochemicals
Ethylene 4,299 44% 1,912
Ethylene - Jazan* - 100% -
Ethylene - PRefChem* - 50% -
Propylene 3,957 50% 1,970
Butadiene 168 25% 42
Paraxylene 4,700 48% 2,275
Benzene 2,376 47% 1,122
Other aromatics 2,533 48% 1,219
Principal polyolefins
Polyethylene 2,985 44% 1,309
Polypropylene 1,773 38% 681
Synthetic rubber and elastomers
Synthetic rubber and elastomers 2,039 94% 1,915
Other chemicals (including polyurethanes):
Intermediates 1,491 51% 765
Derivatives 6,882 51% 3,477 Source: Aramco prospectus, Al Rajhi Capital. * These plants are expected to start production in 2019-20 so we did not consider it.
Expected Purchase of Equity Interest in SABIC
On March 27, 2019, Aramco entered into a purchase agreement with the PIF to acquire PIF’s
70% equity interest in SABIC for a total consideration of $69.1bn. Based on the amended
purchase agreement between the Company and SABIC, the purchase price will be paid in the
form of cash payment equal to 36% of purchase price and 64% in the form of seller loan
(through six separate promissory notes in favor of PIF). Following the proposed acquisition,
SABIC will remain a listed company on Tadawul. The transaction is subject to customary
closing conditions and is expected to complete in the first half of 2020.
SABIC operates in over 50 countries and produces ethylene, ethylene glycol, methanol,
MTBE, polyethylene, and engineering plastics and their derivatives, among other products.
Therefore, this deal is a major step to increase the proportion of petrochemicals production
and to accelerate Aramco’s downstream growth. This deal will further lock the company’s
future revenues and help it to reduce the volatility in the top-line. We believe the full-year
impact of this deal on Aramco would be around US$7.4bn.
Reliance Industries – a large overseas bet
In August 2019, Saudi Aramco inked a non-binding agreement to acquire 20% stake in
Reliance Industries’ oil and chemical business for US$15bn. This deal would be one of
Aramco’s largest investments overseas and will provide a stake in the world’s largest refining
complex located in Jamnagar, India. As per the deal, the company agreed to sell 500mbpd to
Reliance. This deal would also help the company to match its crude production with refining
capacity, which is in-line with its strategy to double the processing capacity to as much as
10mmbpd by 2030. The deal is expected to close by March 2020 and is subject to due
diligence and, regulatory and other approvals. We note that in recent years, company has
increased its investments in Asian refineries to diversify its operations, which will lock its
future revenue and thereby will bring sustainability to the top line.

Saudi Arabian Oil Co. Oil & Gas
19 January 2020
19 May 2019
Disclosures: This document may not be distributed in the United States. Refer to Legend in the penultimate page of this report. Page 38
Figure 47 Equity Chemical Capacity to increase in 2019/20
0.4
55.5
6.3
13.3
14.5
16.8
22.7
0
5
10
15
20
25
1992 2010 2012 2014 2016 2017 2018 2019/20
mm
tpa
Source: Company data, Al Rajhi Capital. * Excluding SABIC and Reliance deals
Lubricant Base Oil Products
Three of the company’s downstream facilities, Luberef, Motiva, and S-Oil, are major
producers of Group I, Group II, and Group III base oils. In 2018, the company sold 4.1mn
tons of base oils. The company has an interchangeable Group II global slate incorporating
Luberef, S-Oil, and Motiva base oil production through two technical programs covering API
and ACEA certification requirements. This allows customers to source base oils, meeting
their existing specifications for finished lubricants from any one of the company’s lubricant
base oil facilities.
Power
As at December 31, 2018, the company’s power business comprised 16 captive power plants
and associated transmission and distribution assets located in the Northern, Central,
Western, and Southern areas of the Kingdom. These assets are primarily designed to provide
electricity and steam to the company’s upstream oil and gas production facilities, gas
processing plants, and wholly owned downstream refineries in a safe, reliable, and profitable
manner. Certain of these power assets are wholly owned by the company and some are owned
by joint ventures in which the company has an ownership interest. The company also enters
into off-take arrangements with independent power producers. In addition, the company
currently owns a 6.9% stake in the Saudi Electricity Company, the Kingdom’s national
electricity utility company, and a 24.81% stake in Marafiq, a domestic utility company that
serves the industrial areas of Jubail and Yanbu’.
Figure 48 Power generation capacity – as of 2018
Power Supply Model Total CapacityOwnership
Interest
Offtake Entitlement /
Contractual Obligation
Wholly Owned by the Company 4,014 megawatts 100% N/A
Joint Ventures 885 megawatts 50%* 885 megawatts
Owned by Third Party Power Producers 1,643 megawatts 0%** 1,643 megawatts Source: Company Data, Al Rajhi Capital. *The power plant will be transferred to the Company in 2037 pursuant to an agreement among the joint venture partners for no further consideration. **The power plant will be transferred to the Company in 2026 pursuant to an agreement among the joint venture partners for no further consideration.
In 2018, the company generated 4,757 megawatts of power, of which 2,470 megawatts of
wheeled power and 1,267 megawatts of spill power were transferred to the national grid. The
company has made recent investments through a joint venture arrangement with Power
Cogeneration Plant Company (PCPC), which brought online a total of 885 megawatts of
capacity to generation facilities at Abqaiq, Hawiyah, and Ras Tanura.

Saudi Arabian Oil Co. Oil & Gas
19 January 2020
19 May 2019
Disclosures: This document may not be distributed in the United States. Refer to Legend in the penultimate page of this report. Page 39
Share of Results from Joint Ventures and Associates
The company had a loss of SAR1,415mn ($377mn) and SAR956mn in its share results from
joint ventures and associates for 2018 and 2017, respectively. The increase in loss was
primarily due to lower earnings from FREP, partially offset by improved financial
performance at Sadara and Petro Rabigh.
The loss in the company’s share of results from joint ventures and associates was SAR956mn
and SAR979mn for 2017 and 2016, respectively. The decrease in loss was primarily due to
improved financial performance at Sadara and Petro Rabigh, partially offset by lower
earnings from Bahri, and Motiva no longer being accounted using the equity method as in
prior periods.
Figure 49 Share of results from JVs and associates
2016 2017 2018
Sadara 65% Saudi Arabia Petrochemical (1.5) (1.3) (1.1)
Petro Rabigh 37.50% Saudi Arabia Refining / Petrochemical 0.0 0.2 0.3
FREP 25% China Refining / Petrochemical 0.7 0.8 0.4
Arlanxeo 50% / 50% / 100% Netherlands Synthetic rubber (0.1) 0.0 0.0
Others 1.6 0.7 0.4
Total (100% basis) 0.8 0.5 (0.0)
Total (Group share) (0.3) (0.3) (0.1)
Nature of activities
Principal place
of business
Equity ownership
2016 / 2017 / 2018Company
Net income (100% basis)
(US$bn)
Source: Company Data, Al Rajhi Capital

Saudi Arabian Oil Co. Oil & Gas
19 January 2020
19 May 2019
Disclosures: This document may not be distributed in the United States. Refer to Legend in the penultimate page of this report. Page 40
Accounting of companies not consolidated
While the upstream and most of the downstream assets are consolidated, the below figures
show the major companies that are accounted for as equity investments.
Figure 50 Summarized Statement of Comprehensive Income of JVs and associates
SARmn Sadara Petro Rabigh FREP Other Total
Revenue 13,114 42,165 29,760 34,725 119,764
Depreciation and Amortization 3,848 2,445 1,373 2,254 9,920
Conventional Interest Income - 296 90 60 446
Interest Expense 2,258 728 368 626 3,980
Income Tax Expense 49 128 638 285 1,100
Net (Loss) Income (4,009) 1,301 1,609 1,028 (71)
Other Comprehensive Income (Loss) 94 (15) (495) (86) (502)
Total Comprehensive Income (Loss) (3,915) 1,286 1,114 942 (573) Source: Company Data, Al Rajhi Capital * Aramco acquired the remaining 50% of equity interest in Arlanxeo on Dec 31, 2018. So this company is not more accounted as equity investment as Aramco’ stake has increased to 100%.
Figure 51 Summarized Balance Sheet of JVs and associates – 2018
SARmn SadaraPetro
RabighFREP Other Total
Current Assets:
Cash and Cash Equivalent 1,384 3,184 4,035 4,189 12,792
Other 7,931 15,904 5,104 6,503 35,442
Total Current Assets 9,315 19,088 9,139 10,692 48,234
Non-Current Assets 72,422 52,178 10,851 42,019 177,470
Current Liabilities:
Financial Liabilities (excluding trade and other payables) 3,525 13,898 656 2,891 20,970
Other 6,105 14,273 2,700 5,850 28,928
Total Current Liabilities 9,630 28,171 3,356 8,741 49,898
Non-Current Liabilities:
Financial Liabilities (excluding trade and other payables) 48,634 33,641 6,806 21,075 110,156
Other 5,280 488 154 1,316 7,238
Total Non-Current Liabilities 53,914 34,129 6,960 22,391 117,394
Net Assets 18,193 8,966 9,674 21,579 58,412
Saudi Aramco Interest 65% 38% 25% 20% - 50.1%
Saudi Aramco Share 11,825 3,362 2,419 5,363 22,969
Elimination of Profit in Inventory 11 (388) - (2) (379)
Fair Value and Other Adjustments (176) (211) - 376 (11)
Investment Balance, December 31 11,660 2,763 2,419 5,737 22,579 Source: Company Data, Al Rajhi Capital. * Aramco acquired the remaining 50% of equity interest in Arlanxeo on Dec 31, 2018. So this company is not more accounted as equity investment as Aramco’ stake has increased to 100%.
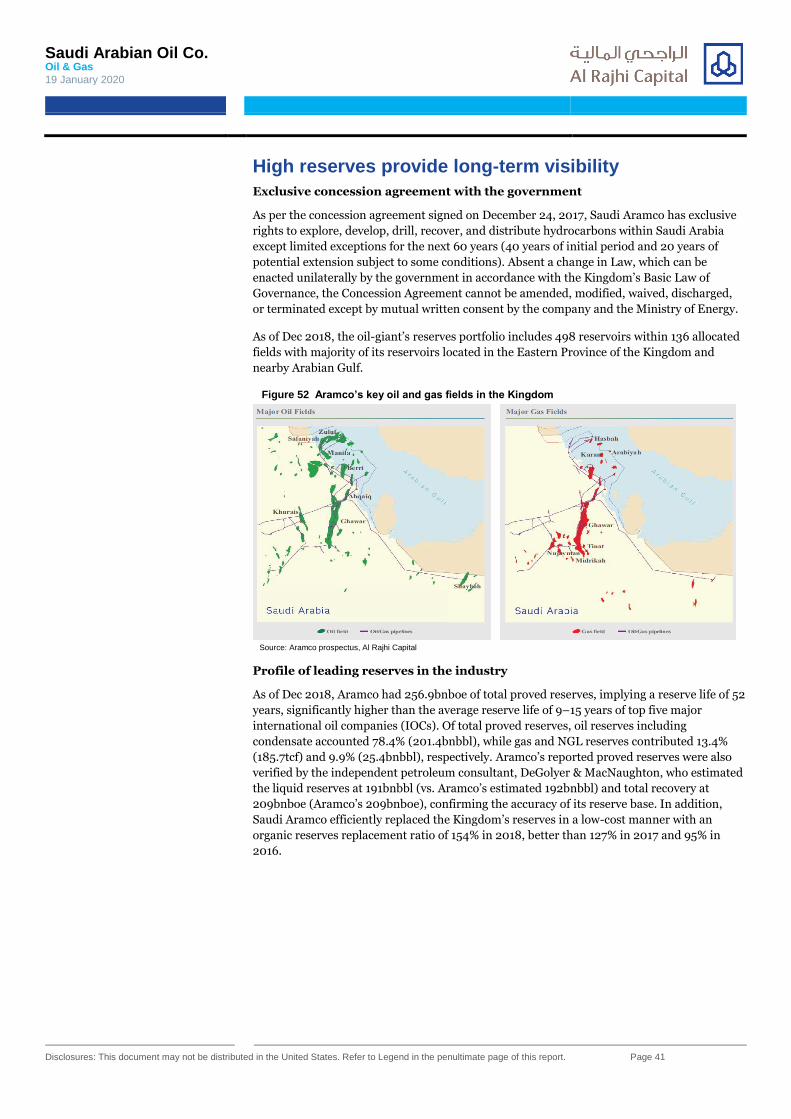
Saudi Arabian Oil Co. Oil & Gas
19 January 2020
19 May 2019
Disclosures: This document may not be distributed in the United States. Refer to Legend in the penultimate page of this report. Page 41
High reserves provide long-term visibility
Exclusive concession agreement with the government
As per the concession agreement signed on December 24, 2017, Saudi Aramco has exclusive
rights to explore, develop, drill, recover, and distribute hydrocarbons within Saudi Arabia
except limited exceptions for the next 60 years (40 years of initial period and 20 years of
potential extension subject to some conditions). Absent a change in Law, which can be
enacted unilaterally by the government in accordance with the Kingdom’s Basic Law of
Governance, the Concession Agreement cannot be amended, modified, waived, discharged,
or terminated except by mutual written consent by the company and the Ministry of Energy.
As of Dec 2018, the oil-giant’s reserves portfolio includes 498 reservoirs within 136 allocated
fields with majority of its reservoirs located in the Eastern Province of the Kingdom and
nearby Arabian Gulf.
Figure 52 Aramco’s key oil and gas fields in the Kingdom
Source: Aramco prospectus, Al Rajhi Capital
Profile of leading reserves in the industry
As of Dec 2018, Aramco had 256.9bnboe of total proved reserves, implying a reserve life of 52
years, significantly higher than the average reserve life of 9–15 years of top five major
international oil companies (IOCs). Of total proved reserves, oil reserves including
condensate accounted 78.4% (201.4bnbbl), while gas and NGL reserves contributed 13.4%
(185.7tcf) and 9.9% (25.4bnbbl), respectively. Aramco’s reported proved reserves were also
verified by the independent petroleum consultant, DeGolyer & MacNaughton, who estimated
the liquid reserves at 191bnbbl (vs. Aramco’s estimated 192bnbbl) and total recovery at
209bnboe (Aramco’s 209bnboe), confirming the accuracy of its reserve base. In addition,
Saudi Aramco efficiently replaced the Kingdom’s reserves in a low-cost manner with an
organic reserves replacement ratio of 154% in 2018, better than 127% in 2017 and 95% in
2016.

Saudi Arabian Oil Co. Oil & Gas
19 January 2020
19 May 2019
Disclosures: This document may not be distributed in the United States. Refer to Legend in the penultimate page of this report. Page 42
Figure 53 Saudi Aramco Stewardship of Kingdom reserves (2017-18)
256.7 4.1
36.9
35.1 332.9
257.3 4.3
38.5
36.1 336.2
-
50.0
100.0
150.0
200.0
250.0
300.0
350.0
400.0
Crude Oil Condensate Natural Gas NGLs 2017 Crude Oil Condensate Natural Gas NGLs 2018
Bn
bo
e
Source: Company Data, Al Rajhi Capital
Figure 54 Material scale company reserve position under concession (2017-18)
201.8 3.0
29.4
26.0 260.2
198.2 3.2
30.1
25.4 256.9
-
50.0
100.0
150.0
200.0
250.0
300.0
Crude Oil Condensate Natural Gas NGLs 2017 Crude Oil Condensate Natural Gas NGLs 2018
Bn
bo
e
Source: Company Data, Al Rajhi Capital
Figure 55 Material scale company reserve position under concession (2017-18)
Figure 56 Proved liquid reserves comparison
Title:
Source:
Please fill in the values above to have them entered in your report
24.3
19.9 12.1
12.1
11.6 80.0
256.9
0
50
100
150
200
250
300
Exxon BP Chevron Total SA Shell Total of 5 IOCsSaudi Aramco
Bn
bo
e
Title:
Source:
Please fill in the values above to have them entered in your report
226.8
45.4
0
50
100
150
200
250
Saudi Aramco Top 5 IOCs
Bn
bb
l
Exxon BP Chevron Total SA Shell
Source: Company Data, Al Rajhi Capital Source: Company Data, Al Rajhi Capital

Saudi Arabian Oil Co. Oil & Gas
19 January 2020
19 May 2019
Disclosures: This document may not be distributed in the United States. Refer to Legend in the penultimate page of this report. Page 43
Figure 57 2018 Oil & Gas Company reserve life (in year) Figure 58 Organic Crude and Condensate reserves replacement ratio
Title:
Source:
Please fill in the values above to have them entered in your report
69 9 10 11 12
14 1517
52
0
10
20
30
40
50
60
Sin
op
ec
Shell
Eq
uin
or
Petr
ob
ras
Chevro
n
To
tal S
A
Petr
oC
hin
a
BP
Exxo
n
Ara
mco
Title:
Source:
Please fill in the values above to have them entered in your report
95%
127%
154%
0%
20%
40%
60%
80%
100%
120%
140%
160%
180%
2016 2018 2018
Source: Company Data, Al Rajhi Capital Source: Company Data, Al Rajhi Capital
Significant scale of reserve addition
The Kingdom has a proven long track record of adding additional original reserves with
42bnbbl (11% growth) of crude and condensate reserves and 81Tcf of gas reserves (64%
growth) since 2007. In fact, over 2016-18, the Kingdom’s total reserve base grew 20bnboe,
which was equal or higher than most of top five IOCs’ reserve as of Dec 2018.
Figure 59 Crude and condensate original reserve growth* Figure 60 Non-associated raw gas original reserves growth*
Title:
Source:
Please fill in the values above to have them entered in your report
340
370
400
430
2007 2008 2009 2010 2011 2012 2013 2014 2015 2016 2017 2018
Bn
bb
l
Title:
Source:
Please fill in the values above to have them entered in your report
100
150
200
250
2007 2008 2009 2010 2011 2012 2013 2014 2015 2016 2017 2018
Tcf
Source: Company Data, Al Rajhi Capital. * Based on Kingdom’s reserves Source: Company Data, Al Rajhi Capital. * Based on Kingdom’s reserves

Saudi Arabian Oil Co. Oil & Gas
19 January 2020
19 May 2019
Disclosures: This document may not be distributed in the United States. Refer to Legend in the penultimate page of this report. Page 44
Figure 61 2016-18 Kingdom reserves additions vs. IOCs Total 2018 Reserves
Title:
Source:
Please fill in the values above to have them entered in your report24
20 20
12 12 12
0
5
10
15
20
25
30
Exxon Saudi Aramco BP Chevron Total SA Shell
Bn
bo
e
Source: Company Data, Al Rajhi Capital
Principal oil fields
The company’s Ghawar field is the world’s largest oil field, with the proved reserves of
58.3bnbbl (82.7% liquids; source: company data). This is followed by Safaniyah field
(34.0bnbbl; 98.9% liquids) and Zuluf (31.3bnbbl; 97.1% liquids). Aramco’s main oil fields are
well connected through a network of integrated facilities, enabling the company to transport
crude to multiple processing plants in the Kingdom.
Figure 62 Liquids Reserves (mmbbl) Figure 63 Principal Oil Fields
48.3
13.620.1
33.7 30.4
80.7
226.8
0
50
100
150
200
250
Ghawar Shaybah Khurais Safaniyah Zuluf Other Total
Bn
bb
l
58.3
14.921.4
34.0 31.3
97.0
256.9
82.7%
91.6%
93.9%
98.9%
97.1%
83.2%
88.3%
70.0%
75.0%
80.0%
85.0%
90.0%
95.0%
100.0%
105.0%
0
50
100
150
200
250
300
Ghawar Shaybah Khurais Safaniyah Zuluf Other Total
Bn
bb
l
Combined Reserves (mmbbl) Liquids Reserves (%) - RHS
Source: Company data, Al Rajhi Capital Source: Company data, Al Rajhi Capital
Principal gas fields
Saudi Armaoc’s crude oil output also contains a liquid rich associated gas, which is scaled to
meet the increased local demand for gas. Below are the company’s key associated and non-
associated gas fields.
Associated gas: Aramco’s key associated gas fields are Ghawar, Khurais, Safaniyah, Zuluf and
Marjan. Of out these fields, Ghawar is the company’s largest producing field of associated
gas.
Non-associated gas: The company’s major non-associated gas fields are located in the
northern and southern (the greater Ghawar area) parts of the Kingdom. The gas fields in the
northern area include Karan (first non-associated offshore gas field, which was discovered in
2006), Arabiyah and Hasbah.

Saudi Arabian Oil Co. Oil & Gas
19 January 2020
19 May 2019
Disclosures: This document may not be distributed in the United States. Refer to Legend in the penultimate page of this report. Page 45
Figure 64 Aramco's natural gas reserves - 2018
Non-associated gas143.2 Tcf
Associated gas 42.5 Tcf
Source: Company data, Al Rajhi Capital
Reserve quality yields higher recovery rates
The company’s majority of oil fields have been producing for many decades with just 1-2%
depletion rate (source: company data). Based on the Kingdom’s reserves, the company’s
depletion rate was ~1.5% as of 2018, which was significantly lower as compared to global
peers (Exxon Mobil: ~5.8% depletion rate), primarily due to its large scale of reserve base.
This reflects that Aramco possesses high reservoir reserve quality, leading to high recovery
rates. This, combined with low water cut, ensures lower operating costs for the company.
Furthermore, as of 2018, around 80% of the Kingdom’s proved crude reserve base has
depleted less than 40% and has a recovery probability of 41–80%, due to high reservoir
quality. This allows big fields to get bigger. For example, Abqaiq’s original reserves increased
over 13.5x since its first production. Also the company is the only one to have sustainable
production of 5 different grades of crude with the additional ability to adapt production
dynamically to maximize value.
Figure 65 Depletion stage of the Kingdom’s crude oil reservoirs Figure 66 Low annual depletion rate
Title:
Source:
Please fill in the values above to have them entered in your report
50%
32%
9%
7% 3% 100%
0%
20%
40%
60%
80%
100%
120%
<20% 20-40% 40-60% 60-80% 80-100% Total
<20% 20-40% 40-60% 60-80% 80-100% Total
1.5%
5.8%
6.7%
8.7% 8.9%
11.1%
0%
2%
4%
6%
8%
10%
12%
Aramco Exxon BP Total SA Chevron Shell
Aramco Exxon BP Total SA Chevron Shell
Source: Company Data, Al Rajhi Capital. As of 2018 Source: Company Data, Al Rajhi Capital. As of 2018

Saudi Arabian Oil Co. Oil & Gas
19 January 2020
19 May 2019
Disclosures: This document may not be distributed in the United States. Refer to Legend in the penultimate page of this report. Page 46
Capex
Upstream capex accounts for the largest share in total capex
Saudi Aramco continued to increase its capital spending over the past few years, given a
healthy recovery in oil prices. Over 2016-18, the total capital expenditure incurred by the
company grew at a CAGR of 12.8%, driven by increased spending for its upstream capex
(+18.6% CAGR), further supported by downstream capex (+2.9% CAGR). While the increase
in upstream capex was mainly attributable to the expansion of the Haradh gas facility and the
construction of the Fadhili gas plant, higher downstream capex was driven by ongoing
construction of Jazan integrated petrochemical refinery, coupled with its investments for an
integrated refinery in its PrefChem JV. In 2018, upstream capex accounted for 73% (66% in
2016) of the total spending, while downstream capex contributed 25% of the total, down from
30% in 2016. In terms of capex by type, the company spent ~US$22bn (~63% of total
spending) for growth and the remaining US$13bn for maintenance of its existing
infrastructure.
Figure 67 Aramco capex by segment - 2016 Figure 68 Aramco capex by segment - 2017 Figure 69 Aramco capex by segment - 2018
Title:
Source:
Please fill in the values above to have them entered in your report
Upstream, 66%
Downstream, 30%
Corporate, 4%
Upstream, 68%
Downstream, 29%
Corporate, 3%
Upstream, 73%
Downstream, 25%
Corporate, 2%
Source: Company Data, Al Rajhi Capital Source: Company Data, Al Rajhi Capital Source: Company Data, Al Rajhi Capital
Industry-leading capex profile
Saudi Aramco’s low cost positions amid large infrastructure and high cash-flow-generating
ability enable it to continue to spend on growth, irrespective of oil prices. The company’s
2018 capex of US$35.1bn was almost more than ~1.5x of Shell’s capex (US$23bn) and ~1.8x
of Exxon’s capex (US$19.6bn). Furthermore, the company has the lowest capex/operating
cash flow ratio (29% in 2018 vs. the range of 43–73% of top 5 IOCs) in the industry, reflecting
its strong capital efficiency and free cash flow generation ability.
Figure 70 Aramco's capex spending ability vs. major peers Figure 71 Aramco's capex/OCF* vs. major peers
35.1
23
19.6
17.1 16.7
13.8
0
5
10
15
20
25
30
35
40
Aramco Shell Exxon Mobil Total SA BP Chevron
US
$b
n
2018 capex
29%
43%45%
54%
69%73%
121
53
3136
25 23
0
20
40
60
80
100
120
140
0%
10%
20%
30%
40%
50%
60%
70%
80%
Aramco Shell Chevron Exxon Total SA BP
US
$b
n
2018 capex / OCF OCF*(RHS)
Source: Company Data, Al Rajhi Capital Source: Company Data, Al Rajhi Capital. *Operating cash flow
Organic capex guidance
Saudi Aramco plans to increase its organic capital spending in the coming years with 2021
capex guided at US$40–45bn (including SABIC post expected completion of acquisition),
higher than the 2018 level of ~US$35bn. However, in case of any unexpected fall in oil prices,

Saudi Arabian Oil Co. Oil & Gas
19 January 2020
19 May 2019
Disclosures: This document may not be distributed in the United States. Refer to Legend in the penultimate page of this report. Page 47
the company has a flexibility to control its capex. In terms of capex allocation, Saudi Aramco
has allocated 75% of total capital budget to the upstream segment (35% liquids and 40% gas),
and the rest to the downstream segment (for the medium term).
Figure 72 Aramco's medium term capex guidance (at mid-point) Figure 73 Medium term capex split
27.6
32.5
35.1 35.1
37.5
42.5
20
25
30
35
40
45
2016 2017 2018 2019E 2020E* 2021E*
US$
bn
Title:
Source:
Please fill in the values above to have them entered in your reportLiquids, 35%
Gas, 40%
Downstream, 25%
Source: Company Data, Al Rajhi Capital. * Including SABIC from H2 2020 Source: Company Data, Al Rajhi Capital
Lowest upstream lifting and capex per BOE in the industry
The company’s upstream uplifting and capex costs per BOE are among the lowest on the
planet, due to the unique nature of Kingdom’s geological formations along with favorable
onshore and offshore environments, and available synergies from large infrastructure and
logistics networks. In 2018, the company’s upstream cost per BOE stood at US$7.6
(US$2.8/BOE lifting cost and US$4.7/BOE capex costs), significantly lower than its peers
(e.g., US$28.7/BOE for Exxon). This enables the company to generate material cash flow
from operations primarily during periods of relatively high crude oil prices, while
maintaining positive cash flow from operations during periods of relatively low crude oil
prices.
Figure 74 Aramco's upstream capex vs. peers – 2018 Figure 75 Aramco's upstream lifting costs vs. peers – 2018
4.7
9.7
11.412.4
13.113.9
14.815.4
17.318.1
0
2
4
6
8
10
12
14
16
18
20
Ara
mco
Shell
Sin
op
ec
Exxo
n M
ob
il
Petr
oB
ras
To
tal S
A
BP
Chevro
n
Petr
oC
hin
a
Eq
uin
or
US$
/bo
e
2.8
8.9
10.5
13 13.2
15.316.3 16.7
21.8
23.2
0
5
10
15
20
25
Ara
mco
Eq
uin
or
Chevro
n
BP
Shell
To
tal S
A
Exxo
n
Petr
oC
hin
a
Sin
op
ec
Petr
oB
ras
US$
/bo
e
Source: Company Data, Al Rajhi Capital Source: Company Data, Al Rajhi Capital

Saudi Arabian Oil Co. Oil & Gas
19 January 2020
19 May 2019
Disclosures: This document may not be distributed in the United States. Refer to Legend in the penultimate page of this report. Page 48
Balance sheet analysis
Saudi Aramco has a sound and flexible balance sheet with a net cash position (cash and cash
equivalents including short-term investments accounted for 14% of total assets as of H1 2019)
and total debt (long term + short-term) to total equity of ~17%. The company has followed a
comprehensive and disciplined approach in allocating capital efficiently while maintaining a
healthy and robust balance sheet.
Lowest debt to assets among peers
Saudi Aramco historically maintained a low financial leverage with total debt to total assets of
7.5% in 2018, far below its peers’ average of ~21%. Post bond issuance in 2019, Aramco’s total
debt grew ~71% to US$46bn in H1 2019 from US$27bn in 2018. Consequently, the
company’s total debt to total assets ratio increased to ~12%, although still below its peers’
average. This, along with a healthy credit rating, provides further headroom for the company
to raise additional debt to fund its future growth capex, if required.
Figure 76 Healthy total debt to total assets ratio Figure 77 Lowest total debt to total assets among peers - 2018
0%
2%
4%
6%
8%
10%
12%
14%
0
5,000
10,000
15,000
20,000
25,000
30,000
35,000
40,000
45,000
50,000
FY16 FY17 FY18 1H19
US
$m
n
Total debt Total debt to total assets (RHS)
Title:
Source:
Please fill in the values above to have them entered in your report
0%
5%
10%
15%
20%
25%
30%
35%
40%
Ara
mco
Exxo
n
Chevro
n
Petr
oC
hin
a
Shell
To
tal S
A
BP
UK
Ro
seneft
Petr
ob
ras
Source: Company Data, Al Rajhi Capital Source: Company Data, Bloomberg, Al Rajhi Capital
Negative cash conversion cycle (CCC)
During the past three financial years, the company’s cash conversion cycle was negative,
which continued to remain the same during H1 2019. This was mainly because of its large
scale of operations including upstream and downstream, which have increased its purchasing
power in the market. However, the increase in the cash conversion days in H1 2019 (Figure
78) was primarily due to decrease in payable days since 2016.
Figure 78 Cash conversion cycle
(70)
(65)
(60)
(55)
(50)
(45)
(40)
(35)
(30)
(25)
(20)
(15)
(10)
(5)
-
-
20
40
60
80
100
120
140
160
180
200
FY16 FY17 FY18 1H19
Inventory conversion period Receivable days Payable days Cash conversion cycle (RHS)
Source: Company Data, Al Rajhi Capital

Saudi Arabian Oil Co. Oil & Gas
19 January 2020
19 May 2019
Disclosures: This document may not be distributed in the United States. Refer to Legend in the penultimate page of this report. Page 49
Improving book value per share
The company’s book value per share has been consistently growing over the past three years,
as evidenced from the figure below. This was primarily due to double-digit growth in retained
earnings aided by higher net income.
Figure 79 Aramco's book value per share
Title:
Source:
Please fill in the values above to have them entered in your report
0%
5%
10%
15%
20%
25%
0.0
0.2
0.4
0.6
0.8
1.0
1.2
1.4
1.6
FY16 FY17 FY18 1H19
US
$ p
er
sh
are
Book value per share y-o-y growth (RHS)
Source: Company Data, Al Rajhi Capital
Strong asset quality
The company is utilizing its assets well with the asset turnover ratio improving to ~1.0x in
2018 from 0.5x in 2016. This improvement was majorly on account of 96% and 35% revenue
growth (including other income related to sales) in 2017 and 2018. However, we observed a
slight decline in H1 2019, which was largely due to the decrease in revenue due to lower
production.
Figure 80 Asset turnover ratio
-
0.2x
0.4x
0.6x
0.8x
1.0x
1.2x
FY16 FY17 FY18 1H19
Source: Company Data, Al Rajhi Capital

Saudi Arabian Oil Co. Oil & Gas
19 January 2020
19 May 2019
Disclosures: This document may not be distributed in the United States. Refer to Legend in the penultimate page of this report. Page 50
Royalty and other financial notes
Royalty on oil
With respect to the company’s production of crude oil and condensates, including those used
by the company in its operations, royalties are calculated based on a progressive scheme
applied to crude oil and condensate production value. Production will be valued based on the
company’s official selling prices. An effective royalty rate will be applied to the production
value and will be based each month on the average daily price quotes for Brent crude for each
day during such a period. The effective royalty rate was determined based on a baseline
marginal rate of 20% applied to the value of production at prices up to $70 per barrel, a
marginal rate of 40% applied to the value of production at prices above $70 per barrel up to
$100 per barrel and a marginal rate of 50% applied to the value of production at prices above
$100 per barrel. However, post 2019, this has been modified as follows:
Figure 81 New royalty structure - effective from Jan 2020
Title:
Source:
Please fill in the values above to have them entered in your report
15%
45%
80%
0%
10%
20%
30%
40%
50%
60%
70%
80%
90%
< U$70 oil price US$70-100 oil price > US$100 oil price
Source: Company Data, Al Rajhi Capital
Royalty on Gas
With respect to the company’s production of natural gas, ethane, and NGLs, excluding those
volumes used by the company for upstream operations and related operations (including
transportation, pipelines, storage and export facilities, fractionation plants, gas and NGLs
plants), royalties are calculated based on a flat royalty rate of 12.5% applied to a factor
established by Ministry of Energy, Industry and Mineral Resources (MEIM). The factor to
which this royalty is applied is US$0.035 per mmBTU for NGLs (propane, butane, and
natural gasoline) and US$0.00 per mmBTU for natural gas (methane) and ethane. This is
subject to the amendment by the minister, taking into account the price that achieves the
targeted internal rate of return set by the minister in coordination with the company.

Saudi Arabian Oil Co. Oil & Gas
19 January 2020
19 May 2019
Disclosures: This document may not be distributed in the United States. Refer to Legend in the penultimate page of this report. Page 51
Income taxes
Effective January 1, 2017, the income tax rate applicable to Saudi Arabian Oil Company
decreased from 85% to 50%. In addition, effective from January 1, 2018, a 20% rate applies
to the taxable income related to the exploration and production of non-associated natural gas
(including gas condensates) as well as the collection, treatment, processing, and
transportation of associated and non-associated natural gas and their liquids, gas
condensates, and other associated elements. Furthermore, under the Kingdom’s Income Tax
Law, Saudi Arabian Oil Company’s interests in in-Kingdom subsidiaries are generally subject
to a 20% tax rate, unless such a subsidiary is engaged in the production of oil and its
associated hydrocarbon products in which case a 50% to 85% multi-tiered structure of
income tax rates applies, except that a 20% rate would apply to such subsidiary’s taxable
income related to certain natural gas activities.
Effective 1 January 2020, the tax rate applicable to the Company’s downstream business will
be the general corporate tax rate of 20% that applies to all similar domestic downstream
companies under the Income Tax Law, rather than the 50% to 85% multi-tiered structure of
income tax rates that applies to domestic oil and hydrocarbons production companies in the
Kingdom, on the condition that the Company consolidate its downstream business under the
control of a separate, wholly owned subsidiary before 31 December 2024. If the Company
does not comply in so consolidating its downstream business by 31 December 2024G, the
Company’s downstream business will be taxed retroactively on an annual basis for such five-
year period in accordance with the higher rate applicable to domestic oil and hydrocarbon
production companies. In such case, the Company will be required to pay the difference in
taxes due to the Government (source: company data).
Selling, Administrative, and General
For the years 2018 and 2017, the company incurred selling, administrative, and general
expenses of SAR31.3bn (US$8.3bn) and SAR29.6bn, respectively. The company incurred
selling, administrative and general expenses of SAR29.6bn and SAR37.1bn for 2017 and
2016, respectively. This 20% decrease was primarily due to a decrease in labor costs due to
the retirement of certain senior employees and reduction in the number of expatriate
employees.
Exploration
For 2018 and 2017, exploration expenses decreased 42% to SAR7.9bn (US$2.1bn) from
SAR13.7bn, respectively. This decrease was primarily due to lower write-offs of dry-hole costs
related to gas exploration activities in 2018. For 2017 and 2016, the company incurred
exploration expenses of SAR13.7bn and SAR11.1bn, respectively. This 24% increase was
primarily attributable to an increase in write-offs of dry-hole costs related to gas exploration
activities.
Research and development
For 2018 and 2017, the company incurred research and development expenses of
SAR2,217mn ($591mn) and SAR1,902mn, respectively. For 2017 and 2016, the company
incurred research and development expenses of SAR1,902mn and SAR1,897mn, respectively.
Depreciation and amortization
For 2018 and 2017, the company recognized depreciation and amortization expenses of
SAR41.3bn ($11.0bn) and SAR36.9bn, respectively. This 12% increase was primarily
attributable to an increase in capitalized costs related to upstream projects that were
completed in 2018. For 2017 and 2016, depreciation and amortization expenses increased to
SAR36.9bn from SAR33.6bn, respectively. This 10% increase was primarily attributable to
the consolidation of Motiva’s results of operations into the company’s financial statements
from May 1, 2017.

Saudi Arabian Oil Co. Oil & Gas
19 January 2020
19 May 2019
Disclosures: This document may not be distributed in the United States. Refer to Legend in the penultimate page of this report. Page 52
Impairments
The company recognized an impairment of SAR13.6bn for the year ended December 31, 2016
primarily due to an assessment that the future recoverable amount of the refinery component
of an under-construction petrochemical facility was less than the carrying value of that asset.
Finance and other income
For 2018 and 2017, the company had finance and other income of SAR3,865mn ($1,030mn)
and SAR1,569mn, respectively. This increase was primarily attributable to an increase in
interest income generated from time deposits and loans receivable. For 2017 and 2016, the
company had finance and other income of SAR1,569mn and SAR1,609mn, respectively.
Finance costs
For 2018 and 2017, the company incurred finance costs of SAR2,959mn ($789mn) and
SAR2,090mn, respectively. This 42% increase was primarily due to the consolidation of
Motiva’s results of operations into the company’s financial statements for the full financial
year as well as increased borrowing costs on certain bank borrowings, including additional
project finance borrowings. For 2017 and 2016, the company incurred finance costs of
SAR2,090mn and SAR1,354mn, respectively. This 54% increase was primarily due to the
consolidation of Motiva’s results of operations into the company’s financial statements from
May 1, 2017 as well as finance costs related to the Sukuk Program and increased borrowing
costs on bank borrowings by SATORP and YASREF.

Saudi Arabian Oil Co. Oil & Gas
19 January 2020
19 May 2019
Disclosures: This document may not be distributed in the United States. Refer to Legend in the penultimate page of this report. Page 53
Environmental, Social, and Governance (ESG)
Environmental
In the wake of climate change concerns across the globe, the demand for hydrocarbon and its
related products may reduce in future, which have resulted in the formation of laws and
regulations, new government policies, and international agreements and treaties with the
primary objective to reduce greenhouse gas (GHG) emissions. The two major causes for this
anticipated reduction in global demand for hydrocarbon are shift to lower carbon intensity
fossil fuels and variety of government actions such as carbon emission cap, carbon taxes,
increased efficiency standards, and incentives for alternative energy sources. This might have
a material adverse effect on the company’s operations and thereby, on its financial condition.
However, the company has followed best practices during extraction. The low per barrel gas
flaring rates along with low water production contribute to low upstream carbon intensity
(10.2kg CO2/boe; source: company data) due to less energy used for fluid separation,
handling, treatment, and reinjection. This has resulted in a lower water oil ratio (WOR) for
the company. Its WOR, per 10 mmbbl/d of oil production, is 3 mmbbl/d of water, which is
significantly lower than the global average of 30 mmbbl/d of water (Figures 82 & 83). This
also ensures lower operating costs for the company when compared to other major IOCs.
Figure 82 Saudi Aramco WOR Vs global average Figure 83 Water production from oil production of 10 mmbpd
Title:
Source:
Please fill in the values above to have them entered in your report
1
33
1
0
0.5
1
1.5
2
2.5
3
3.5
Saudi Aramco Global
Barr
els
Oil Water
10
3
30
0
5
10
15
20
25
30
Oil Production Actual Produced Water -SA WOR
Equivalent Global WOR
mm
bp
d
Oil Water
Source: Company Data, Al Rajhi Capital Source: Company Data, Al Rajhi Capital
The following chart shows the Kingdom’s average carbon intensity compared to other major
hydrocarbon-producing countries according to the August 31, 2018 edition of Science
Magazine.
Figure 84 Carbon intensity as of 2018
Source: Company Data, Al Rajhi Capital

Saudi Arabian Oil Co. Oil & Gas
19 January 2020
19 May 2019
Disclosures: This document may not be distributed in the United States. Refer to Legend in the penultimate page of this report. Page 54
Social
The company accommodates various corporate social responsibility (CSR) projects and
initiatives for the welfare of communities and environment in which it operates. These
projects are Aramco’s own initiatives as well as government directed. The largest CSR project
undertaken by the company was the construction of The King Abdulaziz Center for World
Culture (iThra) in Dhahran, which was opened in late 2017. Furthermore, there are many
other CSR projects that the company had completed in the past and will continue to do in
future in an effort to achieve the Kingdom’s strategic, economic, and social goals and thereby
support Saudi industries to become competitive at an international level. Meanwhile, the
company had adopted a new Corporate Citizenship Policy in 2018 and as per the policy,
future projects will be undertaken with a key focus on four target areas, which are (a)
community economic growth and development, (b) protection of the natural environment,
(c) community economic empowerment, and (d) community-based corporate citizenship
initiatives.
Governance
The company has introduced new corporate governance and compliance policies and is laying
procedures to monitor sanctions and trade restrictions, and to comply with anti-bribery and
corruption practices. The company has further instituted a cyber-security governance
management policy to manage and protect technology and other cyber security programs.
Under these corporate governance policies, the Board of Directors is responsible for the
preparation and presentation of consolidated financial statements in accordance with
International Financial Reporting Standards (IFRS) and pronouncements issued by Saudi
Organization for Certified Public Accountants (SOCPA).

Saudi Arabian Oil Co. Oil & Gas
19 January 2020
19 May 2019
Disclosures: This document may not be distributed in the United States. Refer to Legend in the penultimate page of this report. Page 55
Oil market dynamics
Stable global economic growth continues to aid liquids consumption
Global liquid consumption is likely to grow at a CAGR of 0.6% (as per EIA forecasts) over
2017–30E, supported with healthy and stable global GDP growth (3.0% on an average during
the same period). We believe that the growth in demand is primarily driven by non-OECD
Asia Pacific countries, whose economies are expected to grow at a higher CAGR of 5.5% over
the same period, backed by higher rising per capita income, population growth, and
increased focus toward urbanization. This could also offset the possible lower demand for
liquids, particularly for crude caused by higher usage of alternative fuels and introduction of
new technologies including electric vehicles. However, with the gradual rise in use of natural
gas and alternative fuels, the crude oil share to total energy consumption is likely to decline to
29.9% by 2030E, compared to 32.2% in 2017, although it will still remain the primary energy
source in future.
Figure 85 World liquid consumption
0.0%
0.5%
1.0%
1.5%
2.0%
2.5%
-
20.0
40.0
60.0
80.0
100.0
120.0
2011
2012
2013
2014
2015
2016
2017
2018
2019E
2020E
2021E
2022E
2023E
2024E
2025E
2026E
2027E
2028E
2029E
2030E
mm
bp
d
OECD liquids demand Non_OECD liquids demand Y-o-Y growth (%) - RHS Source: EIA, Al Rajhi Capital
Figure 86 World total energy consumption by fuel Figure 87 World total energy consumption share by fuel
Title:
Source:
Please fill in the values above to have them entered in your report
-
100
200
300
400
500
600
700
800
2011
2012
2013
2014
2015
2016
2017
2018
2019E
2020E
2021E
2022E
2023E
2024E
2025E
2026E
2027E
2028E
2029E
2030E
Qu
adri
llio
n B
TU
Liquids Natural Gas Coal Nuclear Other
Title:
Source:
Please fill in the values above to have them entered in your report
0.0%
20.0%
40.0%
60.0%
80.0%
100.0%
120.0%
2011
2012
2013
2014
2015
2016
2017
2018
2019E
2020E
2021E
2022E
2023E
2024E
2025E
2026E
2027E
2028E
2029E
2030E
Liquids Natural Gas Coal Nuclear Other Source: EIA, Al Rajhi Capital Source: EIA, Al Rajhi Capital

Saudi Arabian Oil Co. Oil & Gas
19 January 2020
19 May 2019
Disclosures: This document may not be distributed in the United States. Refer to Legend in the penultimate page of this report. Page 56
Liquid demand–supply balance. After the oil market witnessed an excess supply
scenario over 2014–16 which triggered the production cut mainly by the OPEC cartel and
thereby lowered crude oil prices, the market reached an equilibrium in 2017 and 2018,
mainly due to the pick-up in demand amid improved economic activity and slowdown in
supply growth. As per EIA, the oil market is likely to remain balance till 2022, aided by
healthy demand growth over the medium term, ensuring firm crude oil prices in the coming
years.
Figure 88 World liquid supply-demand trend Figure 89 Global liquid balance and Brent oil price relationship
85
87
89
91
93
95
97
99
101
2011 2012 2013 2014 2015 2016 2017 2018
mm
bp
d
Global liquids production Global liquids demand
-
20
40
60
80
100
120
(1.00)
(0.50)
-
0.50
1.00
1.50
2.00
2011 2012 2013 2014 2015 2016 2017 2018
US$
/bb
l
mm
bp
d
Supply surplus / (Def icit) Brent Price (RHS)
Source: EIA, Al Rajhi Capital Source: EIA, Bloomberg, Al Rajhi Capital
Global E&P spending. Based on the spending data of major 15 global E&P companies, we
found that the cumulative upstream capex of these companies declined at a CAGR of ~14%
over 2013–17 amid weak oil prices. Despite a recovery in average Brent oil prices (+21.5% y-
o-y) in 2017, global E&P companies continued to lower their spending by ~27%, reflecting
their hesitation to spend aggressively at that time, while the existing fields continued to
deplete. However, capex of these companies rose 15% y-o-y in 2018, given firm oil prices post
strong OPEC production cut compliance and healthy demand growth. We note that despite
volatility in oil prices, upstream investment in the Middle East and the Kingdom has
remained largely unaffected. With the global oil demand likely to continue to improve in the
coming years (2020E: 102.22mmbd vs. 99.93mmbd in 2018), we believe the global E&P
producers will need to accelerate capital spending significantly to meet the anticipated rise in
demand.
Figure 90 Global E&P spending* move in tandem with oil prices
Title:
Source:
Please fill in the values above to have them entered in your report
0.0
20.0
40.0
60.0
80.0
100.0
120.0
-
50
100
150
200
250
300
350
2007 2008 2009 2010 2011 2012 2013 2014 2015 2016 2017 2018
US$
/bb
l
US$
bn
Cumulative E&P Capex Average Brent price (US$/bbl)
Source: EIA, Bloomberg, Al Rajhi Capital. *Based on major 15 E&P companies globally

Saudi Arabian Oil Co. Oil & Gas
19 January 2020
19 May 2019
Disclosures: This document may not be distributed in the United States. Refer to Legend in the penultimate page of this report. Page 57
Demand for refined and chemical products likely to improve. Given a healthy
global economic outlook over the medium term, the global demand for refined products is
likely to grow at a CAGR of 0.8% over 2018–30E, backed by rising demand in Africa (+2.4%
CAGR), the Middle East (+1.6% CAGR), and Asia Pacific (+1.7% CAGR), offsetting a likely
lower demand in North America (-0.6% CAGR). Furthermore, the industry is expected to
witness a geographical shift in global refining operations with the addition of large refineries
in Asia Pacific and the Middle East and the closure of economical and inefficient refineries in
OECD countries (mainly in Europe), due to regularity requirements.
Figure 91 Refined product demand by region
Source: IHS Markit, Al Rajhi Capital
Meanwhile, the demand for chemical products is likely to outpace the consumption growth
for both oil and refined production. For the basic chemical product ethylene, the demand is
likely to grow at a CAGR of 3.3% over 2018–30E. This will mainly be due to higher demand
in China (5.6% CAGR) and North America (3.3% CAGR) over 2018–30E.
Figure 92 Global domestic demand for ethylene by region
Source: IHS Markit, Al Rajhi Capital
In-Kingdom demand for natural gas continues to rise. Saudi Arabia, the seventh
largest gas market globally in 2018, is expected to witness a significant rise in gas
consumption, growing at a CAGR of 3.6% over 2018–30E, above a 1.7% growth for global
natural gas demand (source: Aramco prospectus). The in-Kingdom demand is primarily
attributable to higher demand in domestic power generation, refinery operations, and
industrial sectors.

Saudi Arabian Oil Co. Oil & Gas
19 January 2020
19 May 2019
Disclosures: This document may not be distributed in the United States. Refer to Legend in the penultimate page of this report. Page 58
Figure 93 Domestic natural gas demand by sector
Source: IHS Markit, Al Rajhi Capital. Excluding ethane used as petrochemical feedstock and other NGL demand
Furthermore, the development of non-associated natural gas resources over the past decade
has also notably increased the domestic natural gas production capacity, ensuring sufficient
feedstock availability for the concerned sectors. Consequently, the Kingdom is likely to
increase its natural gas usage in power generation with natural gas-fueled power capacity and
generation increasing at a CAGR of 3.1% and 3.5%, respectively over 2018–30E. Moreover,
the share of natural gas in the total power generation mix is projected to increase from 60.3%
in 2017 to 70.8% by 2030E, while oil’s share may reduce to 19.8% from 39.7%. Accordingly,
the Kingdom would be able to reallocate the crude oil usage for power generation and will be
in a better position to lift its export output further in the coming years.
Figure 94 Expected domestic power capacity growth by fuel
Source: IHS Markit, Al Rajhi Capital. Excluding ethane used as petrochemical feedstock and other NGL demand

Saudi Arabian Oil Co. Oil & Gas
19 January 2020
19 May 2019
Disclosures: This document may not be distributed in the United States. Refer to Legend in the penultimate page of this report. Page 59
Detailed Financial Statements with projections
Figure 95 Income statement (in US$bn)
FY16 FY17 FY18 FY19E FY20E FY21E FY22E FY23E
Revenue 134.6 222.9 315.2 288.2 303.1 321.9 340.1 345.5
Other income related to sales 0.0 40.0 40.7 36.1 37.2 40.3 42.7 43.6
Revenue and other income related to sales 134.6 262.9 355.9 324.3 340.4 362.2 382.8 389.2
Production royalties and excise and other taxes 0.0 (36.4) (55.6) (48.6) (35.3) (37.2) (39.9) (40.7)
Purchases (14.2) (32.1) (50.4) (52.6) (43.5) (33.5) (35.2) (35.2)
Producing and manufacturing (12.9) (17.1) (15.0) (14.9) (26.5) (37.6) (38.7) (39.9)
Selling, administrative and general (9.9) (7.9) (8.3) (8.3) (10.4) (13.3) (13.9) (14.2)
Exploration (3.0) (3.7) (2.1) (1.9) (1.9) (1.9) (2.0) (2.1)
Research and development (0.5) (0.5) (0.6) (0.5) (0.5) (0.5) (0.6) (0.6)
Depreciation and amortization (9.0) (9.8) (11.0) (12.4) (15.7) (20.0) (21.1) (22.2)
Impairments (3.6) (0.1) 0.0 0.0 0.0 0.0 0.0 0.0
Operating costs (53.0) (107.6) (143.0) (139.3) (133.8) (144.1) (151.4) (154.9)
Operating income 81.5 155.4 212.9 185.1 206.6 218.1 231.5 234.3
Share of results of joint ventures and associates (0.3) (0.3) (0.4) (0.3) (0.1) 0.3 0.3 0.4
Finance and other income 0.4 0.4 1.0 2.0 1.9 2.1 2.3 2.7
Finance costs (0.4) (0.6) (0.8) (1.5) (2.1) (2.3) (2.1) (2.8)
Income before income taxes 81.3 155.1 212.8 185.3 206.4 218.2 232.0 234.5
Income taxes (68.1) (79.2) (101.7) (88.9) (98.4) (102.9) (109.3) (110.8)
Net income before minority 13.3 75.9 111.1 96.3 108.0 115.3 122.7 123.7
Non-controlling interests (0.4) (0.4) (0.1) (0.1) (0.8) (1.8) (1.9) (1.9)
Net income available to equity shareholders 12.9 75.5 111.0 96.3 107.0 113.0 120.3 121.2 Source: Company Data, Al Rajhi Capital. SABIC included in H2 2020.

Saudi Arabian Oil Co. Oil & Gas
19 January 2020
19 May 2019
Disclosures: This document may not be distributed in the United States. Refer to Legend in the penultimate page of this report. Page 60
Figure 96 Balance sheet (in US$bn)
FY16 FY17 FY18 FY19E FY20E FY21E FY22E FY23E
Cash and cash equivalents 12.8 21.7 48.8 48.6 27.8 29.6 19.4 20.7
Inventories 5.6 9.1 11.6 12.0 17.9 16.0 16.5 16.8
Trade receivables 17.4 23.2 25.0 23.1 28.8 28.8 30.3 30.8
Due from the Government 0.0 10.4 12.8 12.9 12.9 12.9 12.9 12.9
Other assets and receivables 1.3 1.6 3.7 2.8 4.1 4.1 4.1 4.1
Short-term investments 3.3 1.6 0.1 12.3 14.0 14.0 30.0 46.0
Total current assets 40.5 67.5 102.0 111.7 105.5 105.3 113.3 131.3
Property, plant and equipment 169.4 200.3 233.0 262.7 327.0 344.8 363.6 382.0
Intangible assets 4.2 6.5 7.2 8.5 13.2 14.4 15.7 16.9
Goodwill 0.0 0.0 0.0 0.0 29.8 29.8 29.8 29.8
Investments in joint ventures and associates 11.6 7.3 6.0 6.1 12.8 13.1 13.6 14.0
Deferred income tax assets 17.2 3.6 2.6 3.0 3.2 3.2 3.2 3.2
Other assets and receivables 3.3 3.8 3.5 5.1 6.8 6.8 6.8 6.8
Investments in securities 4.7 5.0 4.6 5.3 6.1 6.1 6.1 6.1
Total non-current assets 210.4 226.5 256.9 290.5 398.8 418.1 438.6 458.7
TOTAL ASSETS 250.9 294.0 359.0 402.3 504.3 523.4 551.9 590.0
Trade and other payables 13.9 16.5 19.3 20.0 26.9 23.7 24.6 25.1
Obligations to the Government:
Income taxes 7.6 15.4 18.6 16.5 16.5 16.5 16.5 16.5
Royalties 2.6 5.4 3.2 3.3 3.3 3.3 3.3 3.3
Borrowings 2.4 2.4 8.0 10.7 12.0 12.0 12.0 12.0
Total current liabilities 26.5 39.7 49.0 50.5 58.7 55.6 56.4 56.9
Borrowings 11.6 18.3 19.0 35.5 46.1 46.1 46.1 46.1
Promissory notes 0.0 0.0 0.0 0.0 33.3 22.2 11.1 11.1
Deferred income tax liabilities 1.6 1.7 6.4 8.9 9.3 9.3 9.3 9.3
Post-employment benefit obligations 12.5 10.2 6.2 10.2 14.7 14.7 14.7 14.7
Provisions 2.5 3.7 4.2 4.4 5.0 5.0 5.0 5.0
Total liabilities 54.8 73.7 84.7 109.5 167.0 152.8 142.6 143.0
Share capital 0.0 0.0 16.0 16.0 16.0 16.0 16.0 16.0
Stated capital 16.0 16.0 0.0 0.0 0.0 0.0 0.0 0.0
Additional paid-in capital 7.2 7.2 7.2 7.2 7.2 7.2 7.2 7.2
Retained earnings:
Unappropriated 168.4 190.7 245.5 264.8 291.8 290.6 327.7 363.6
Appropriated 1.6 1.6 1.6 1.6 1.6 1.6 1.6 1.6
Other reserves 0.0 1.5 0.8 0.2 0.2 33.2 33.2 33.2
193.2 217.0 271.1 289.8 316.8 348.6 385.6 421.6
Non-controlling interests 2.9 3.3 3.1 3.0 20.5 22.0 23.7 25.4
Shareholder’s equity 196.1 220.4 274.2 292.8 337.3 370.6 409.3 447.0
TOTAL EQUITY AND LIABILITIES 250.9 294.0 359.0 402.3 504.3 523.4 551.9 590.0 Source: Company Data, Al Rajhi Capital. Note: We have assumed that SABIC deal will be completed at the end of H1 2020.

Saudi Arabian Oil Co. Oil & Gas
19 January 2020
19 May 2019
Disclosures: This document may not be distributed in the United States. Refer to Legend in the penultimate page of this report. Page 61
Figure 97 Cash flow statement (in US$bn)
FY16 FY17 FY18 FY19E FY20E FY21E FY22E FY23E
Income before income taxes 81.3 155.1 212.8 185.3 206.4 218.2 232.0 234.5
Depreciation and amortization 9.0 9.9 11.0 12.4 15.7 20.0 21.1 22.2
Impairments and provisions 3.9 (0.0) 0.0 0.0 0.0 0.0 0.0 0.0
Exploration and evaluation costs written off 1.8 2.3 0.8 0.6 0.0 0.0 0.0 0.0
Net gain on disposal of property, plant and equipment 0.0 (0.1) 0.0 (0.3) 0.0 0.0 0.0 0.0
Share of results of joint ventures and associates 0.3 0.3 0.4 0.3 0.1 (0.3) (0.3) (0.4)
Finance income 0.0 (0.3) (0.8) (1.6) (1.9) (2.1) (2.3) (2.7)
Finance costs 0.1 0.6 0.8 1.5 2.1 2.3 2.1 2.8
Dividends from investments in securities (0.0) (0.0) (0.0) (0.1) 0.0 0.0 0.0 0.0
(Gain)/loss on remeasurement of investments in
affiliates0.0 0.1 (0.2) 0.0 0.0 0.0 0.0 0.0
Change in fair value of investments through profit or loss 0.0 (0.0) (0.2) (0.1) 0.0 0.0 0.0 0.0
Change in joint ventures and associates inventory profit elimination (0.0) (0.1) 0.0 0.0 0.0 0.0 0.0 0.0
Other (0.1) 0.0 0.4 (0.0) 0.0 0.0 0.0 0.0
Change in working capital
Inventories (1.0) (2.0) (1.7) (0.2) (5.9) 2.0 (0.6) (0.3)
Trade receivables (5.7) (4.8) (1.5) 2.0 (5.7) 0.0 (1.5) (0.5)
Due from the Government 0.0 (10.4) (2.4) 0.1 0.0 0.0 0.0 0.0
Other assets and receivables 0.3 (0.1) (2.0) 1.2 (1.3) 0.0 0.0 0.0
Trade and other payables 2.8 (0.3) 1.4 (0.2) 6.9 (3.2) 0.9 0.5
Royalties payable 1.3 2.8 (2.3) 0.2 0.0 0.0 0.0 0.0
Other changes
Other assets and receivables (0.8) (0.9) (0.3) (2.0) (1.7) 0.0 0.0 0.0
Provisions 0.0 (0.4) (0.1) 0.1 0.6 0.0 0.0 0.0
Post-employment benefit obligations (0.3) (0.3) (0.7) 0.3 4.5 0.0 0.0 0.0
Settlement of income and other taxes (63.7) (62.2) (94.4) (87.6) (98.6) (102.9) (109.3) (110.8)
Net cash provided by operating activities 29.2 89.0 121.0 111.9 121.1 134.1 142.0 145.4
Capital expenditures (27.6) (32.5) (35.1) (35.7) (37.4) (39.0) (41.2) (41.9)
Acquisition of affiliates, net of cash acquired 0.0 (0.3) (2.3) (0.4) (47.4) (0.0) 0.0 0.0
Distributions from joint ventures and associates 0.1 0.2 0.3 0.4 0.1 0.1 0.1 0.1
Investment in Arlanxeo (1.4) 0.0 0.0 0.0 0.0 0.0 0.0 0.0
Additional investment in joint ventures and associates (1.4) (0.9) (0.1) (0.1) (6.9) (0.1) (0.1) (0.2)
Dividends from investments in securities 0.0 0.0 0.0 0.1 0.0 0.0 0.0 0.0
Interest received 0.2 0.3 0.8 1.4 1.9 2.1 2.3 2.7
Net investments in securities (0.2) (0.1) (0.2) (0.2) (0.8) 0.0 0.0 0.0
Net (purchases) maturities of short-term investments (0.9) 1.7 1.6 (12.3) (1.6) 0.0 (16.0) (16.0)
Net cash used in investing activities (31.2) (31.6) (35.0) (46.6) (92.1) (36.9) (55.0) (55.3)
Dividends 0.0 0.0 (58.0) (75.0) (79.5) (81.3) (83.3) (85.3)
Distributions to the Government (3.0) (50.1) 0.0 0.0 0.0 0.0 0.0 0.0
Dividends paid to non-controlling interests (0.1) (0.3) (0.2) (0.0) (0.5) (0.7) (0.7) (0.7)
Interest paid (0.3) (0.5) (0.7) (1.3) (2.1) (2.3) (2.1) (2.8)
Others 0.0 0.0 0.0 0.0 (12.8) 0.0 0.0 0.0
Promissory notes 0.0 0.0 0.0 0.0 44.4 0.0 0.0 0.0
Proceeds from borrowings 4.8 5.4 3.1 13.1 11.8 0.0 0.0 0.0
Repayments of borrowings (0.9) (3.0) (3.0) (2.4) (11.1) (11.1) (11.1) 0.0
Net cash used in financing activities 0.5 (48.5) (58.8) (65.5) (49.7) (95.4) (97.2) (88.8) Source: Company Data, Al Rajhi Capital. SABIC included in H2 2020

Saudi Arabian Oil Co. Oil & Gas
19 January 2020
19 May 2019
Disclosures: This document may not be distributed in the United States. Refer to Legend in the penultimate page of this report. Page 62
APPENDIX
Ras Tanura. The Ras Tanura Refinery is located in the Eastern Province of the Kingdom
and was completed in 1941. Operations began in 1945 with a number of major expansions
and upgrades over the subsequent years creating one of the largest refineries in the Middle
East. The refinery has a gross refining capacity and a net refining capacity of 550,000 barrels
of crude oil and condensate per day. (Source: Aramco prospectus)
Yanbu’. The Yanbu’ Refinery is located in the Kingdom’s western area and was completed in
1983. It has a gross refining capacity and a net refining capacity of 250,000 barrels of crude
oil per day. (Source: Aramco prospectus)
Riyadh. The Riyadh Refinery is located in the Kingdom’s central area and receives its crude
from the East-West pipeline. The refinery has a gross refining capacity and net refining
capacity of 130,000 barrels of crude oil per day. (Source: Aramco prospectus)
Jazan. The Jazan Refinery and Terminal is an integrated refinery and petrochemical project
in the Jazan Province of the Kingdom. Jazan is expected to begin operations at the end of
2019 and be ready for full operations with capacity to process 400,000 barrels of crude oil
per day in the second half of 2020. (Source: Aramco prospectus)
SATORP. SATORP is a joint operation between the Company and Total that owns and
operates the Jubail refining and manufacturing complex located on the east coast of the
Kingdom. The refinery has a gross refining capacity of 400,000 barrels of crude oil per day
and a net refining capacity of 250,000 barrels of crude oil per day. SATORP is planned to
increase its gross refining capacity from 400,000 barrels of crude oil per day to 440,000
barrels of crude oil per day by 2020. (Source: Aramco prospectus)
YASREF. YASREF is a joint operation between the Company and Sinopec that owns and
operates a full conversion refinery located in the Yanbu’ manufacturing complex on the west
coast of the Kingdom, Yanbu’ Industrial City. The Yanbu’ facilities include a complex refinery
with a gross refining capacity of 400,000 barrels of crude oil per day and a net refining
capacity of 250,000 barrels of crude oil per day. YASREF is planned to increase its gross
refining capacity from 400,000 barrels of crude oil per day to 430,000 barrels of crude oil
per day by 2020. (Source: Aramco prospectus)
SAMREF. SAMREF is a joint operation between the Company and ExxonMobil that owns
and operates a refinery located in the Yanbu’ manufacturing complex on the west coast of the
Kingdom. It has a gross refining capacity of 400,000 barrels of crude oil per day and a net
refining capacity of 200,000 barrels of crude oil per day. (Source: Aramco prospectus)
SASREF. SASREF was a joint operation between the Company and Shell that owns and
operates a refinery located in the Jubail manufacturing complex on the east coast of the
Kingdom. On 18 September 2019G, the Company acquired Shell’s 50% interest in SASREF
and subsequently changed the name of SASREF to Saudi Aramco Jubail Refinery Company.
The refinery has a gross refining capacity of 305,000 barrels of crude oil per day. (Source:
Aramco prospectus)
Petro Rabigh. Petro Rabigh owns and operates a highly integrated refining and
petrochemical facility located in Rabigh on the west coast of the Kingdom. The Petro Rabigh
facility has a gross refining capacity of 400,000 barrels of crude oil per day and a net refining
capacity of 150,000 barrels of crude oil per day. Petro Rabigh is a publicly traded company
listed on Tadawul and is 37.5% owned by each of the Company and Sumitomo. (Source:
Aramco prospectus)
Motiva. Motiva’s Port Arthur refinery, located in Port Arthur, Texas, is the largest single site
crude oil refinery in North America, with a gross refining capacity and a net refining capacity
of 635,000 barrels of crude oil per day, 24 distribution terminals with 8.2 mmbbl storage
capacity and access to strategic pipeline systems in the eastern and southeastern regions of
the United States. (Source: Aramco prospectus)

Saudi Arabian Oil Co. Oil & Gas
19 January 2020
19 May 2019
Disclosures: This document may not be distributed in the United States. Refer to Legend in the penultimate page of this report. Page 63
S-Oil. S-Oil’s principal business activity is manufacturing and selling refined, lubricant and
petrochemical products and importing and exporting crude oil products. S-Oil’s Onsan
Refinery in Ulsan, South Korea has a gross capacity of 669,000 barrels of crude oil per day.
S-Oil has a network of more than 2,100 retail service stations to serve end customers. S-Oil is
a publicly traded corporation listed on the Korean stock exchange. (Source: Aramco
prospectus)
FREP. FREP is an international joint venture between the Company, ExxonMobil and Fujian
Petrochemical Company Limited (itself a joint venture between Sinopec and the Fujian
provincial government). FREP is a large-scale refining and petrochemical enterprise located
in Quanzhou, China. It has gross refining capacity of 280,000 barrels per day and a net
refining capacity of 70,000 barrels per day. The refinery processes a mix of Arabian crude oils
to produce high-quality gasoline, diesel and jet fuel. FREP also owns and operates
petrochemical facilities, including an 830,000 tonnes per year paraxylene complex, a 1.1
million tonnes per year ethylene steam cracker with associated polyethylene, polypropylene
and ethylene glycol plants as well as a 300,000 deadweight-tonne crude oil terminal.
(Source: Aramco prospectus)
SSPC. SSPC is the fuels distribution and marketing venture between the Company,
ExxonMobil and Sinopec. SSPC sells wholesale and retail motor gasoline and diesel to
customers in Fujian Province through more than 1,000 service stations and 17 distribution
terminals, seven of which are owned by the joint venture. SSPC has exclusive rights to market
FREP gasoline and diesel products in Fujian Province. (Source: Aramco prospectus)
Idemitsu Kosan. Idemitsu Kosan is a result of a merger between Idemitsu and Showa Shell
Sekiyu and it owns and operates more than 6,400 retail service stations in Japan and has
equity stakes in six refineries in Japan that produce refined products, propylene, benzene and
mixed xylene. Idemitsu Kosan has a net refining capacity of 73,000 barrels per day and a
gross refining capacity of 945,000 barrels per day. Idemitsu Kosan’s sales in Japan are
primarily gasoline, kerosene and automotive lubricants. Its international sales include
aviation fuel as well as marine bunkers and lubricants. (Source: Aramco prospectus)
PRefChem. PRefChem is an integrated refinery and petrochemicals development project
involving multiple parties in Johor, Malaysia, which is adjacent to the regional trading hub of
Singapore. The Company and Petronas are involved in the joint development of PRefChem.
PRefChem is expected to be supported by third party utilities and infrastructure facilities,
including a deep-water oil terminal, an LNG regasification plant, crude and LNG storage and
a cogeneration power plant and is expected to supply feedstock to third party downstream
petrochemical plants. PRefChem is expected to have the capacity to process 300,000 barrels
of crude oil per day and produce Euro 5 gasoline and diesel and other refined products as
well as feedstock for the production of three million tonnes per year of petrochemical
products. The project will provide the Company with long-term placement of 150,000 barrels
per day, with an option for an additional 60,000 barrels per day of Arabian crude and the
offtake rights for 50% of production, including gasoline, diesel, kerosene, olefins, polymers
and glycol. The project is expected to be operational in the second half of 2020. (Source:
Aramco prospectus)
Hyundai Oilbank. Hyundai Oilbank is a private oil refining company in South Korea,
established in 1964. The Daesan Complex, where Hyundai Oilbank’s major facilities are
located, is a fully integrated refining plant with a processing capacity of 650,000 barrels of
crude oil per day. The business portfolio of Hyundai Oilbank and its subsidiaries includes oil
refining, base oil, petrochemicals and a network of service stations. On 15 April 2019, the
Company entered into a purchase agreement to acquire a 17% equity interest in Hyundai
Oilbank from Hyundai Heavy Industries Holdings, for an estimated SAR 4.7 billion with an
option to acquire an additional 2.9% equity interest. The transaction completed by end of
2019. (Source: Aramco prospectus)

Saudi Arabian Oil Co. Oil & Gas
19 January 2020
19 May 2019
Disclosures: This document may not be distributed in the United States. Refer to Legend in the penultimate page of this report. Page 64
The following sets forth a description of the company’s base oil operations.
Luberef. Luberef is an affiliate whose shareholders are the Company and Jadwa Industrial
Investment Company that supplies base oils to major lubricant blenders operating around
the world. Luberef produces high-quality Group I and Group II base oils at an optimised
grade mix from its two production facilities that are strategically located in Jeddah and
Yanbu’. In January 2018, Luberef commissioned new Group II base oils facilities which
increased Luberef’s total base oil production capacity from 0.6 million tonnes per year to 1.2
million tonnes per year. (Source: Aramco prospectus)
Motiva. Motiva supplies Group II and speciality base oils in the Americas and Europe to
major IOCs, such as BP and Shell, and domestic blenders, such as Citgo. Motiva’s base oil
production capacity of 2.0mn tonnes per year produces branded base oils used to
manufacture products conforming to API Engine Oil Licensing System, European
Automobile Manufacturers’ Association, Original Equipment Manufacturers and other
recognised industry standards for automotive and industrial lubricants. (Source: Aramco
prospectus)
S-Oil. S-Oil was founded in 1976 in South Korea. S-Oil’s base oil production capacity is
2.2mn tonnes per year and it manufactures high-quality base oils in a full range of Group I,
Group II and Group III base oil products used by customers around the world. (Source:
Aramco prospectus)
Figure 98 Dividend payout ratio of major oil producers
2014 2015 2016 2017 2018
Exxon 36% 75% 159% 66% 66%
Chevron 41% 174% n/a 88% 57%
Total SA 166% 130% 106% 87% 68%
Shell 80% 724% 335% 121% 66%
BP 188% n/a n/a 234% 87%
Rosneft 25% 35% 36% 50% 28%
Median* 41% 130% 133% 87% 66% Source: Bloomberg, Al Rajhi Capital. * Ex-BP. n/a denotes not applicable

Saudi Arabian Oil Co. Oil & Gas
19 January 2020
19 May 2019
Disclosures: This document may not be distributed in the United States. Refer to Legend in the penultimate page of this report. Page 65
Definitions/Calculations
ROIC = (EBIT - Tax) / (Shareholders’ equity + total borrowings – cash – short-term investments)
Payout ratio = Dividends divided by net profits
RoACE = Calculated as net income before finance costs, net of tax, for a period as a
percentage of average capital employed during that period. Average capital employed is the
average of the Company’s total borrowings plus total equity at the beginning and end of the
applicable period

Saudi Arabian Oil Co. Oil & Gas
19 January 2020
19 May 2019
Disclosures: This document may not be distributed in the United States. Refer to Legend in the penultimate page of this report. Page 66
IMPORTANT DISCLOSURES FOR U.S. PERSONS
This research report was prepared by Al Rajhi Capital (Al Rajhi), a company authorized to engage in securities activities in Saudi Arabia. Al Rajhi is not a registered broker-dealer in the United States and, therefore, is not subject to U.S. rules regarding the preparation of research reports and the independence of research analysts. This research report is provided for distribution to “major U.S. institutional investors” in reliance on the exemption from registration provided by Rule 15a-6 of the U.S. Securities Exchange Act of 1934, as amended (the “Exchange Act”).
Any U.S. recipient of this research report wishing to effect any transaction to buy or sell securities or related financial instruments based on the information provided in this research report should do so only through Rosenblatt Securities Inc, 40 Wall Street 59th Floor, New York NY 10005, a registered broker dealer in the United States. Under no circumstances should any recipient of this research report effect any transaction to buy or sell securities or related financial instruments through Al Rajhi. Rosenblatt Securities Inc. accepts responsibility for the contents of this research report, subject to the terms set out below, to the extent that it is delivered to a U.S. person other than a major U.S. institutional investor.
The analyst whose name appears in this research report is not registered or qualified as a research analyst with the Financial Industry Regulatory Authority (“FINRA”) and may not be an associated person of Rosenblatt Securities Inc. and, therefore, may not be subject to applicable restrictions under FINRA Rules on communications with a subject company, public appearances and trading securities held by a research analyst account.
Ownership and Material Conflicts of Interest Rosenblatt Securities Inc. or its affiliates does not ‘beneficially own,’ as determined in accordance with Section 13(d) of the Exchange Act, 1% or more of any of the equity securities mentioned in the report. Rosenblatt Securities Inc, its affiliates and/or their respective officers, directors or employees may have interests, or long or short positions, and may at any time make purchases or sales as a principal or agent of the securities referred to herein. Rosenblatt Securities Inc. is not aware of any material conflict of interest as of the date of this publication.
Compensation and Investment Banking Activities Rosenblatt Securities Inc. or any affiliate has not managed or co-managed a public offering of securities for the subject company in the past 12 months, nor received compensation for investment banking services from the subject company in the past 12 months, neither does it or any affiliate expect to receive, or intends to seek compensation for investment banking services from the subject company in the next 3 months.
Additional Disclosures This research report is for distribution only under such circumstances as may be permitted by applicable law. This research report has no regard to the specific investment objectives, financial situation or particular needs of any specific recipient, even if sent only to a single recipient. This research report is not guaranteed to be a complete statement or summary of any securities, markets, reports or developments referred to in this research report. Neither Al Rajhi nor any of its directors, officers, employees or agents shall have any liability, however arising, for any error, inaccuracy or incompleteness of fact or opinion in this research report or lack of care in this research report’s preparation or publication, or any losses or damages which may arise from the use of this research report.
Al Rajhi may rely on information barriers, such as “Chinese Walls” to control the flow of information within the areas, units, divisions, groups, or affiliates of Al Rajhi.
Investing in any non-U.S. securities or related financial instruments (including ADRs) discussed in this research report may present certain risks. The securities of non-U.S. issuers may not be registered with, or be subject to the regulations of, the U.S. Securities and Exchange Commission. Information on such non-U.S. securities or related financial instruments may be limited. Foreign companies may not be subject to audit and reporting standards and regulatory requirements comparable to those in effect within the United States.
The value of any investment or income from any securities or related financial instruments discussed in this research report denominated in a currency other than U.S. dollars is subject to exchange rate fluctuations that may have a positive or adverse effect on the value of or income from such securities or related financial instruments.
Past performance is not necessarily a guide to future performance and no representation or warranty, express or implied, is made by Al Rajhi with respect to future performance. Income from investments may fluctuate. The price or value of the investments to which this research report relates, either directly or indirectly, may fall or rise against the interest of investors. Any recommendation or opinion contained in this research report may become outdated as a consequence of changes in the environment in which the issuer of the securities under analysis operates, in addition to changes in the estimates and forecasts, assumptions and valuation methodology used herein.
No part of the content of this research report may be copied, forwarded or duplicated in any form or by any means without the prior consent of Al Rajhi and Al Rajhi accepts no liability whatsoever for the actions of third parties in this respect. This research document has been prepared by Al Rajhi Capital Company (“Al Rajhi Capital”) of Riyadh, Saudi Arabia. It has been prepared for the general use of Al Rajhi Capital’s clients and may not be redistributed, retransmitted or disclosed, in whole or in part, or in any form or manner, wi thout the express written consent of Al Rajhi Capital. Receipt and review of this research document constitute your agreement not to redistribute, retransmit, or disclose to others the contents, opinions, conclusion, or information contained in this document prior to public disclosure of such information by Al Rajhi Capital. The information contained was obtained from various public sources believed to be reliable but we do not guarantee its accuracy. Al Rajhi Capital makes no representations or warranties (express or implied) regarding the data and information provided and Al Rajhi Capital does not represent that the information content of this document is complete, or free from any error, not misleading, or fit for any particular purpose. This research document provides general information only. Neither the information nor any opinion expressed constitutes an offer or an invitation to make an offer, to buy or sell any securities or other investment products related to such securities or investments. It is not intended to provide personal investment advice and it does not take into account the specific investment objectives, financial situation and the particular needs of any specific person who may receive this document.
Investors should seek financial, legal or tax advice regarding the appropriateness of investing in any securities, other investment or investment strategies discussed or recommended in this document and should understand that statements regarding future prospects may not be realized. Investors should note that income from such securities or other investments, if any, may fluctuate and that the price or value of such securities and investments may rise or fall. Fluctuations in exchange rates could have adverse effects on the value of or price of, or income derived from, certain investments. Accordingly, investors may receive back less than originally invested. Al Rajhi Capital or its officers or one or more of its affiliates (including research analysts) may have a financial interest in securities of the issuer(s) or related investments, including long or short positions in securities, warrants, futures, options, derivatives, or other financial instruments. Al Rajhi Capital or its affiliates may from time to time perform investment banking or other services for, solicit investment banking or other business from, any company mentioned in this research document. Al Rajhi Capital, together with its affiliates and employees, shall not be liable for any direct, indirect or consequential loss or damages that may arise, directly or indirectly, from any use of the information contained in this research document.
This research document and any recommendations contained are subject to change without prior notice. Al Rajhi Capital assumes no responsibility to update the information in this research document. Neither the whole nor any part of this research document may be altered, duplicated, transmitted or distributed in any form or by any means. This research document is not directed to, or intended for distribution to or use by, any person or entity who is a citizen or resident of or located in any locality, state, country or other jurisdiction where such distribution, publication, availability or use would be contrary to law or which would subject Al Rajhi Capital or any of its affiliates to any registration or licensing requirement within such jurisdiction.

Saudi Arabian Oil Co. Oil & Gas
19 January 2020
19 May 2019
Disclosures: This document may not be distributed in the United States. Refer to Legend in the penultimate page of this report. Page 67
Disclaimer and additional disclosures for Equity Research Disclaimer
This research document has been prepared by Al Rajhi Capital Company (“Al Rajhi Capital”) of Riyadh, Saudi Arabia. It has been prepared for the general use of Al Rajhi Capital’s clients and may not be redistributed, retransmitted or disclosed, in whole or in part, or in any form or manner, without the express written consent of Al Rajhi Capital. Receipt and review of this research document constitute your agreement not to redistribute, retransmit, or disclose to others the contents, opinions, conclusion, or information contained in this document prior to public disclosure of such information by Al Rajhi Capital. The information contained was obtained from various public sources believed to be reliable but we do not guarantee its accuracy. Al Rajhi Capital makes no representations or warranties (express or implied) regarding the data and information provided and Al Rajhi Capital does not represent that the information content of this document is complete, or free from any error, not misleading, or fit for any particular purpose. This research document provides general information only. Neither the information nor any opinion expressed constitutes an offer or an invitation to make an offer, to buy or sell any securities or other investment products related to such securities or investments. It is not intended to provide personal investment advice and it does not take into account the specific investment objectives, financial situation and the particular needs of any specific person who may receive this document.
Investors should seek financial, legal or tax advice regarding the appropriateness of investing in any securities, other investment or investment strategies discussed or recommended in this document and should understand that statements regarding future prospects may not be realized. Investors should note that income from such securities or other investments, if any, may fluctuate and that the price or value of such securities and investments may rise or fall. Fluctuations in exchange rates could have adverse effects on the value of or price of, or income derived from, certain investments. Accordingly, investors may receive back less than originally invested. Al Rajhi Capital or its officers or one or more of its affiliates (including research analysts) may have a financial interest in securities of the issuer(s) or related investments, including long or short positions in securities, warrants, futures, options, derivatives, or other financial instruments. Al Rajhi Capital or its affiliates may from time to time perform investment banking or other services for, solicit investment banking or other business from, any company mentioned in this research document. Al Rajhi Capital, together with its affiliates and employees, shall not be liable for any direct, indirect or consequential loss or damages that may arise, directly or indirectly, from any use of the information contained in this research document.
This research document and any recommendations contained are subject to change without prior notice. Al Rajhi Capital assumes no responsibility to update the information in this research document. Neither the whole nor any part of this research document may be altered, duplicated, transmitted or distributed in any form or by any means. This research document is not directed to, or intended for distribution to or use by, any person or entity who is a citizen or resident of or located in any locality, state, country or other jurisdiction where such distribution, publication, availability or use would be contrary to law or which would subject Al Rajhi Capital or any of its affiliates to any registration or licensing requirement within such jurisdiction.
THE SAUDI CAPITAL MARKET AUTHORITY AND THE SAUDI STOCK EXCHANGE (TADAWUL) DO NOT TAKE ANY RESPONSIBILITY FOR THE CONTENTS OF THIS DOCUMENT, DO NOT MAKE ANY REPRESENTATIONS AS TO ITS ACCURACY OR COMPLETENESS, AND EXPRESSLY DISCLAIM ANY LIABILITY WHATSOEVER FOR ANY LOSS ARISING FROM, OR INCURRED IN RELIANCE UPON, ANY PART OF THIS DOCUMENT.
IN THE KINGDOM OF SAUDI ARABIA THIS DOCUMENT IS BEING DISTRIBUTED (BY OR WITH THE APPROVAL OF AN AUTHORISED PERSON) ONLY TO, AND IS DIRECTED ONLY AT, SOPHISTICATED INVESTORS AS DEFINED IN ARTICLE 9 OF THE RULES ON THE OFFER OF SECURITIES AND CONTINUING OBLIGATIONS ISSUED BY THE BOARD OF THE SAUDI CAPITAL MARKET AUTHORITY PURSUANT TO RESOLUTION NUMBER 3-123-2017 DATED 9/4/1439H (CORRESPONDING TO 27/12/2017G), AS AMENDED BY RESOLUTION NUMBER 3-45-2018 DATED 07/08/1439H (CORRESPONDING TO 23/04/2018G).
AL RAJHI CAPITAL IS AUTHORISED AND REGULATED BY THE CAPITAL MARKET AUTHORITY (“CMA”) IN THE KINGDOM OF SAUDI ARABIA AND IS RESPONSIBLE FOR DISTRIBUTION OF THIS PRE-DEAL RESEARCH REPORT IN THE KINGDOM. AL RAJHI CAPITAL IS SUBJECT TO RELEVANT CMA RULES AND GUIDANCE AS AN AUTHORISED PERSON, DETAILS OF WHICH CAN BE FOUND ON THE CMA’S WEBSITE AT WWW.CMA.ORG.SA.
Explanation of Al Rajhi Capital’s rating system Al Rajhi Capital uses a three-tier rating system based on absolute upside or downside potential for all stocks under its coverage except financial stocks and those few other companies not compliant with Islamic Shariah law: "Overweight": Our target price is more than 10% above the current share price, and we expect the share price to reach the target on a 12 month time horizon. "Neutral": We expect the share price to settle at a level between 10% below the current share price and 10% above the current share price on a 12 month time horizon. "Underweight": Our target price is more than 10% below the current share price, and we expect the share price to reach the target on a 12 month time horizon. "Target price": We estimate target value per share for every stock we cover. This is normally based on widely accepted methods appropriate to the stock or sector under consideration, e.g. DCF (discounted cash flow) or SoTP (sum of the parts) analysis. “Fair price” : For certain stocks we estimate fair price per share instead of the target price given the method of valuation used Please note that the achievement of any price target may be impeded by general market and economic trends and other external factors, or if a company’s profits or operating performance exceed or fall short of our expectations.
Contact us
Mazen AlSudairi Head of Research Tel : + 966 11 836 5468 Email: [email protected]
Al Rajhi Capital Research Department Head Office, King Fahad Road P.O. Box 5561, Riyadh 11432 Kingdom of Saudi Arabia Email: [email protected] Al Rajhi Capital is licensed by the Saudi Arabian Capital Market Authority, License No. 07068/37.
Copyright © 2022 FDOKUMEN