FIPS Financial Institutions Performance Survey - assets.kpmg
80
275% increase in impaired asset expense 48.32% escalation in total provisions 0.46% dip in net interest income 14 bps decrease in net interest margins 27.57% decrease in NPAT 9.04% rise in operating expenses 2.95% rise in gross lending 61 bps drop in average funding costs FIPS Financial Institutions Performance Survey Banks – Review of 2020
-
Upload
khangminh22 -
Category
Documents
-
view
1 -
download
0
Transcript of FIPS Financial Institutions Performance Survey - assets.kpmg

275%increase in
impaired asset expense
48.32%escalation in
total provisions
0.46%dip in net
interest income
14 bpsdecrease in net interest margins
27.57%decrease in NPAT
9.04%rise in
operating expenses
2.95%rise in
gross lending
61 bpsdrop in average funding costs
FIPS Financial Institutions Performance Survey Banks – Review of 2020

Contents2 The Survey
4 A KPMG view from the editor
6 Industry overview
16 RBNZ Covid-19 timeline
18 Timeline of events
22 Provisioning: Volatility in a Covid-19 world
24 Sector performance
35 Focus on capital
36 Analysis of annual results
44 Major banks: Quarterly analysis
48 What will 2021 bring amid the fierce battle against cyber crime?
50 Pandemic response: Building and maintaining the trust
52 Focus on climate change
56 FMA: Agility, the key to managing Covid-19 and changing regulations
58 NZIER: Improving business confidence supports investment demand
60 NZBA: Delivering in a crisis
62 CoreLogic: Mortgage activity in 2020 – from slump to recovery
66 Massey University: Banking industry review and forecasts
72 Ownership and credit ratings
73 Descriptions of the credit rating grades
74 Definitions
75 Endnotes
77 KPMG’s Financial Services Team
78 Contact us
Current and up to date as at 5 p.m. Friday 19 February 2021

KPMG’s Financial Services team provides focused and practical audit, tax and advisory services to the insurance, retail banking, corporate and investment banking, and investment management sectors.
Our professionals have an in-depth understanding of the key issues facing financial institutions.
Our team is led by senior partners with a wealth of client experience and relationships with many of the market players, regulators and leading industry bodies.

TABLE 1: ENTITY MOVEMENTS1
Who’s out Who’s in
Banks: 26 — Nil — Nil*
* There have been no changes to the bank participants this year.
There have been no changes to the bank participants this year. However, in May 2020, the Reserve Bank of New Zealand (RBNZ) registered Industrial and Commercial Bank of China (ICBC) to operate in New Zealand as a branch, in addition to the subsidiary which has been operating in New Zealand since November 2013. ICBC has a 31 December balance date, therefore their first year of dual results will be included in next year’s survey.
As with all previous FIPS, the information used in compiling our analysis is extracted from publicly available annual reports and disclosure statements for each organisation, with the exception of certain information which is provided directly from the survey participants.
We wish to thank the survey participants for their valued contribution, both for the additional information provided and for the time made available to meet and discuss the industry issues with us.
Massey University continues to be a partner and key contributor to the compilation of this publication, assisting with the data collection, as well as drafting the banks’ profit forecasting section of this survey. We thank them for their continued contribution.
External contributors continue to play a vital role in our publication, providing insight on key issues and developments that we might not otherwise have. We would like to acknowledge the contributors from CoreLogic, Financial Markets Authority (FMA), Massey University, New Zealand Bankers’ Association (NZBA) and New Zealand Institute of Economic Research (NZIER) for their exceptional contribution towards the compilation of this publication.
We have supplemented their external thought leadership commentary with some of KPMG’s own business line thought leadership. We trust you find the content of this survey of interest.
The Survey
The KPMG Financial Institutions Performance Survey (FIPS) report of 2020 represents the 34th year that KPMG has provided in-depth insights into New Zealand’s banking sector. In this 34th edition we present industry commentary and analysis on the performance of the New Zealand registered banks, together with a range of topical articles from other key stakeholders such as industry experts, regulators and our own business leaders.
The survey covers registered bank entities with balance dates between 1 October 2019 and 30 September 2020. As a result, registered banks with the balance date of 31 December have had their 31 December 2019 financial results included in this year’s survey as their most recent results. This includes Bank of China, China Construction Bank, Citibank, Industrial and Commercial Bank of China, JPMorgan Chase Bank, Kookmin Bank, Rabobank and The Hongkong and Shanghai Banking Corporation.
In late 2020 we published and launched our FIPS Non-bank – Review of 2020 publication. This publication can be accessed at the following link: https://home.kpmg/nz/en/home/insights/2020/12/fips-non-bank-2020.html
2 | KPMG | FIPS 2020
© 2021 KPMG, a New Zealand Partnership and a member firm of the KPMG global organisation of independent member firms affiliated with KPMG International Limited, a private English company limited by guarantee. All rights reserved.

FIPS 2020 | KPMG | 3
© 2021 KPMG, a New Zealand Partnership and a member firm of the KPMG global organisation of independent member firms affiliated with KPMG International Limited, a private English company limited by guarantee. All rights reserved.

A KPMG view from the editor
The key themes of previous FIPS Banks Reviews have focused around metrics like the three C’s, Capital, Conduct and Culture along with loan book growth, margin movement, impairments and regulation. These historic themes have been overshadowed in the FIPS Banks – Review of 2020 publication by a new C, Covid-19. The global pandemic has firstly brought into focus our business resilience and, after the initial shock around liquidity, has then given us occasion to pause and reflect on business practices and how we might conduct our business going forward. The historic dominant lens of profit is being replaced with a more balanced approach, involving people, customers and staff and the wider community together with an increasing focus on diversity, climate and cyber issues.
What an extraordinary year 2020 has been, the financial and health implications of a global pandemic on New Zealanders has been unprecedented. Upon the emergence of Covid-19, no one knew exactly what the impact would be, with many forecasting exercises subsequently proven wrong. This can largely be attributed to the Government’s support and our efforts as a country, with New Zealanders being adaptable and resilient as we were asked to ‘go hard, go early’ in our response to the growing pandemic.
Strong government support, widely accessible to many businesses and individuals, allowed the New Zealand economy to withstand and then quickly recover from the initial shock of the pandemic with the country falling into a holding pattern of an almost ‘normal’ way of life. This has been fuelled by ‘bounceback spending’ with some expenditure that would have otherwise occurred overseas. Our new normal, has changed the way we work and do business. Increasingly we are seeing trends that were a necessity during level four lockdown becoming commonplace in the workplace, with many businesses adopting work-from-home friendly business models. The challenges for many, will be allowing for this new way of working without detrimentally impacting culture and ensuring an innovative approach is taken to ensuring workforces receive sufficient technological support while maintaining good security measures and maintaining and developing culture.
John KensingtonPartner – Audit Head of Banking and Finance KPMG
John has been with KPMG’s Financial Services audit team for over 36 years, 23 of these as a partner working with a wide range of financial services audit clients, specialising in banks and finance companies.
John has a wealth of experience in auditing and accounting for banking products and services including treasury, retail offerings, corporate loans and loan provisioning. He is currently KPMG’s Head of Banking and Finance and editor of this publication. John is also Deputy Chairman of the New Zealand Auditing and Assurance Standards Board (NZAuASB) and serves as a board member of the XRB. John is also a fellow of CA ANZ, a member of the Institute of Directors and a Trustee of Breast Cancer Cure.
4 | KPMG | FIPS 2020
© 2021 KPMG, a New Zealand Partnership and a member firm of the KPMG global organisation of independent member firms affiliated with KPMG International Limited, a private English company limited by guarantee. All rights reserved.

The banking sector played a pivotal role in their responsiveness to the different remedial monetary policies rolled out by the Treasury, Ministry of Business, Innovation and Employment (MBIE) and the Reserve Bank of New Zealand (RBNZ). Declining interest rates have been driving the prosperity of many domestic markets through increased spending – the housing market being one of the most notable. Whether this increased domestic spending is sustainable, or whether it will be enough to save many businesses in the aviation and tourism related industries struck by the freeze on international travel will remain to be seen.
The combined efforts of the Government, Inland Revenue (IRD), MBIE, RBNZ and the banks have seen the ‘team of five million’ navigate the first phase of Covid-19 far better than anyone forecast.
The FIPS Banks – Review of 2020 has shown that the banking sector has taken a hit, but remains in a strong position. However, a salutary caution, the results included within the survey are a mix of December 2019, and March, June and September 2020 year-ends, with the earlier balance dates being largely unaffected by Covid-19 and even the later balance date entities only having a maximum of six months of impact. It is likely the 2021 survey may further highlight the impact of Covid-19 on the sector.
While New Zealand has weathered the storm well so far, the same cannot be said for many other countries, some of whom are facing secondary lockdowns; or stricter requirements to curb the spread of the pandemic. This poses real concern for the banking sector going forward, both through the economic effects of lockdowns imposed by our trading partners, but also what another big lockdown in New Zealand would look like were it to occur should the vaccination programme and border restrictions fail to keep the virus from re-emerging significantly within the community.
While the banking sector plays a pivotal role in aiding economic recovery and fostering change to the way in which we do business in New Zealand, it is important that banks continue preparing for other changes to come. The sector, like the economy, has been resilient and rebounded well given the challenges it has faced and has built goodwill with its stakeholders. Once a sector that was criticised by many, this survey would not be complete without acknowledging the roles that banks have played in ‘steadying the ship and holding it on course’ throughout the pandemic to date.
Regulatory change remained a topic of discussion with survey participants.
While the RBNZ has pushed out the deadline for increases in required level of capital to July 2022, other aspects of the 2019 reforms remain due for implementation by 1 July 2021.
Climate-related reporting will be another area of change for banks, as the Government announced mandatory climate-related financial reporting for banks and other financial institutions in September. The major Australian owned banks have an advantage in their opportunity to leverage the work performed over climate-related financial reporting already undertaken by their Australian counterparts.
Other emerging threats include cyber crime, the need to exhibit diversity and inclusion and the continued pressure on conduct and culture aspects.
The lessons learnt from the Covid-19 pandemic, and through our on-going recovery from it, may act as a catalyst for further change. It may now be a good time to bring forward change which may have been in the pipeline over the last ten years, as we individually, as a sector, and a nation look to reset.
FIPS 2020 | KPMG | 5
© 2021 KPMG, a New Zealand Partnership and a member firm of the KPMG global organisation of independent member firms affiliated with KPMG International Limited, a private English company limited by guarantee. All rights reserved.

Industry overview
No review of 2020 can start without using the words unique, unprecedented, unexpected, and unpredictable. Along with the word pivot, these seem to be the most overused words of the last nine to twelve months. Fortunately for New Zealand, ‘better than expected’ has also had heavy usage.
The emergence, spread of and response to Covid-19 has certainly shaped 2020.
As with the non-bank entities we spoke with and reported on at the end of last year2, conversations with the CEOs of New Zealand banks were also dominated by the impacts of Covid-19 on their staff, customers and the country as a whole. Compared to the prior years, the survey themes were much less specific to the banking sector and more applicable to New Zealand as a whole.
As documented in the Quarterly FIPS publications of 20203, the banks were fast to act and worked collaboratively with each other, the Government and the Reserve Bank of New Zealand (RBNZ) to support the economy.
The financial system has to date proved to be strong and the banks resilient. While initial fears were that an economic crisis as a result of the pandemic and accompanying lockdowns would be far worse than the Global Financial Crisis (GFC) of 2007–8, it has not played out that way – in New Zealand at least so far.
The Government’s ‘go hard, go early’ approach to Covid-19 meant that New Zealand’s borders were closed in March 2020 and a national lockdown was implemented. Only ‘essential services’ were permitted to operate and the vast majority of us remained at home, allowed out only for exercise, grocery shopping or medical assistance. Those who could work from home were encouraged to do so, while businesses reliant on face to face contact had to shut down. Banks and other financial institutions were deemed as ‘essential’ which meant that some operated with a small number of staff in the office with the vast majority transitioning to working from home, disaster recovery/business continuity sites or a combination thereof.
The strict lockdown rules were adhered to and we quickly saw the positive impact on the number of Covid-19 cases. After four weeks of a ‘hard’ lockdown, the emphasis was shifted from ‘essential’ to ‘safe’. Businesses who could operate under the strict hygiene and physical distancing rules started to open back up and people could venture further afield. After three weeks, the threat of Covid-19 in the community was deemed low enough for a progressive move down the Alert Level system4 to Level 1 where New Zealand has remained since except for a period in September/October 2020.
The seven weeks of lockdown had a profound impact on our economy, the way we work and do business, and our collective lifestyle choices.
EconomyStarting with the economy, it has been a roller coaster ride. At first, there were dire predictions of a depression from the bank economists, the RBNZ and the Treasury. The economic indicators and measures were all significantly down for the quarter from March to June 2020.
When we went into lockdown, we did not know how long it would last for and what the long-term impact would be. This was symptomatic of the uncertainty that we faced and continue to face in many areas.
The Government quickly implemented relief programmes to support businesses and individuals, but in spite of this a lot of uncertainty remained. What must be said about the various government relief packages is that they were implemented very quickly, were relatively easy to both apply for and receive, and were sufficiently generous to alleviate a lot of the financial and emotional pressure felt by people providing a much needed buffer and some certainty in very uncertain times. These packages provided a much needed level of assistance that has potentially masked the true impact of the lockdowns and allowed the economy to recover and indeed rebound to close to pre-pandemic levels subsequently. These measures have also undoubtedly saved jobs and helped the country through the first chapter of Covid-19.
Initial forecasts were that this economic crisis caused by Covid-19 would be far worse than the GFC. Businesses and individuals alike looked closely at their spending and what could be cut. New Zealanders as a whole are not good at saving money5
and there was initially concern about our financial resilience.
However, as the lockdown measures had the effect of reducing virus transmission and therefore instances of the virus, New Zealand was in a fortunate position to be able to lift the restrictions on businesses and we started spending money! After being locked down, New Zealanders really quickly bounced back into as normal a way of life as possible.
6 | KPMG | FIPS 2020
© 2021 KPMG, a New Zealand Partnership and a member firm of the KPMG global organisation of independent member firms affiliated with KPMG International Limited, a private English company limited by guarantee. All rights reserved.

Businesses were constantly reforecasting what the remainder of 2020 and 2021 might look like and have been constantly getting it wrong. Pent-up demand saw a spending surge once the lockdown restrictions were lifted. Retailers initially advertised discounts and incentives to encourage people to spend but it soon became apparent that these were not needed and actually replenishing stock sold in the bounceback started to become an issue.
Businesses were constantly reforecasting what the remainder of 2020 and 2021 might look like and have been constantly getting it wrong.
With the borders closed, and the lockdown in place, New Zealanders across all socio-economic levels were impacted. Those who would normally spend considerable time overseas found themselves at home with surplus cash which they have generally spent on vehicles and home improvements. Those at the lower end of the scale, either on benefits or lower wages, were in much the same position as before or in some cases slightly better off due to increases in government assistance.
All of us were forced to pause and focus on how we spent money, partly because we were restricted in what we could do during lockdown and partly because we were not as certain of our income. This led to many becoming budget conscious to a level they had not previously.
The quarter ended June 2020 saw the biggest drop in spending in 25 years due to the lockdown period in March, April and May prompting very gloomy economic outlooks. However, there was a surprising rebound in the quarter ended September 2020 with the strongest September quarter rise since 19956.
Strong demand coupled with border closures and restrictions around the world have led to challenges on the supply chain. Many retailers are unable to keep the shelves fully stocked and many items are already pre-sold by the time that they arrive in New Zealand. This is a far cry from the concerns around overstocking seen in June.
New Zealand has been extremely fortunate to revert to an almost ‘normal’ way of life that it is sometimes hard to fathom the enormous impact that the pandemic is continuing to have in the rest of the world. We saw a sharp reminder at the end of August when a community case of Covid-19 emerged in Auckland resulting in a step back up the Alert Levels to Level 3 in Auckland and Level 2 for the rest of the country. In early January, a further scare threatened our freedom when a Managed Isolation/Quarantine facility experienced a series of issues around people released from quarantine. All of this was a stark reminder for us that our circumstances could change incredibly quickly. This was further demonstrated by the speed at which Auckland was moved to Alert Level 3 and the rest of the country to Alert Level 2 following community cases reported on 14 February. The subsequent move down the Alert Levels to Level 2 for Auckland and Level 1 for the rest of the country happened on 18 February was a relief for many businesses.
New Zealand has been extremely fortunate to revert to an almost ‘normal’ way of life.
When restrictions eased for Auckland to join the rest of the country in Level 1 at the beginning of October spending once again increased significantly. Spending in restaurants, cafes, and takeaways was up $79 million (8.8%) when compared to October 2019.
An increase in spending on sporting and recreational goods together with furniture, hardware and electrical goods indicated that people were preparing for a domestic summer break and purchasing outdoor furniture, camping and sporting equipment7. December is a key retail month and 2020 spending was also up when compared to December 2019.
However, this was not such a positive story for those businesses who rely on overseas tourists. Spending on hotels, motels and other accommodation was down 32% compared to December 20198 demonstrating the Kiwi preference for family owned baches and camping and the fact that a portion of our hospitality and accommodation capacity requires foreign tourists to fill it.
However, the real area of concern is whether this level of spending is able to be sustained. While the high house prices and low interest rates are contributing to confidence among homeowners, there are a lot of people for whom the ending of government assistance will have had a huge impact. For some industries such as tourism, aviation and some retail and hospitality businesses there is simply not enough domestic spending available to make up for the hole left by having no international visitors.
The Prime Minister has indicated that the borders will remain closed until 2022. Even with potential ‘travel bubbles’ with Australia and the Pacific Islands (that have already had multiple false starts), this will have a possibly irreparable impact on businesses within those industries mentioned above as well as international education and those sectors requiring seasonal workers such as agriculture and horticulture.
FIPS 2020 | KPMG | 7
© 2021 KPMG, a New Zealand Partnership and a member firm of the KPMG global organisation of independent member firms affiliated with KPMG International Limited, a private English company limited by guarantee. All rights reserved.

$BILLIONS
TERM DEPOSIT RETAIL RATE (RHS)
TERM DEPOSIT BALANCES (LHS)
%
JAN 19 JUL 19 JAN 20 JUL 20 NOV 20SOURCE RESERVE BANK OF NEW ZEALAND STATISTICS:
0.0
0.5
1.0
1.5
2.0
2.5
3.0
3.5
4.0
160
165
170
175
180
185
190
195
200
%
OCR
HOUSING LENDING RETAIL RATE
JAN 19 JUL 19 JAN 20 JUL 20 NOV 20SOURCE RESERVE BANK OF NEW ZEALAND STATISTICS:
0.0
1.0
2.0
3.0
4.0
5.0
6.0
7.0
8.0
9.0
10.0
BUSINESS LENDING RETAIL RATE
TERM DEPOSIT RETAIL RATE
2
3
RETAIL INTEREST RATES ON TERM DEPOSITS VS. TERM DEPOSIT BALANCE
RETAIL INTEREST RATES ON TERM DEPOSITS VS. OCR
$BILLIONS
HOUSING LENDING RETAIL RATE (RHS)
BUSINESS LENDING RETAIL RATE (RHS)
GROSS LOANS ADVANCES LHSAND ( )
%
4.0
5.0
6.0
7.0
8.0
9.0
10.0
440
450
460
470
480
490
500
JAN 19 JUL 19 JAN 20 JUL 20 NOV 20SOURCE RESERVE BANK OF NEW ZEALAND STATISTICS:
1RETAIL INTEREST RATES ON LENDING VS. GROSS LOANS AND ADVANCES
8 | KPMG | FIPS 2020
© 2021 KPMG, a New Zealand Partnership and a member firm of the KPMG global organisation of independent member firms affiliated with KPMG International Limited, a private English company limited by guarantee. All rights reserved.

$BILLIONS
PERSONAL
BUSINESS
HOUSING
SOURCE RESERVE BANK OF NEW ZEALAND STATISTICS:
0
50
100
150
200
250
300
350
400
450
228.9B 241.6B 256.0B 273.6B 292.6B
97.2B103.1B
108.3B115.4B
109.3B10.6B11.3B
11.4B
11.1B8.7B
D 16EC D 17EC D 18EC D 19EC N 20OV
4BANK SECTOR LENDING
SOURCE RESERVE BANK OF NEW ZEALAND STATISTICS:
AGRICULTURE FORESTRY FISHING AND, ,
14% (2019: 14%)MININGMANUFACTURING 2% (2019: 3%)
UTILITIES 1% (2019: 2%)
CONSTRUCTION 1% (2019: 2%)
OTHER COMMERCIAL LENDING 31%
(2019: 31%)
FINANCE INVESTMENT AND,
2% (2019: 2%)INSURANCE
GOVERNMENT AND PUBLIC
3% (2019: 3%)AUTHORITIES
MORTGAGES 43% (2019: 41%)
PERSONAL LOANS 2% (2019: 2%)
5REGISTERED BANKS: SECTORAL ANALYSIS OF CREDIT EXPOSURES AS AT 31 DECEMBER 2020
%
BNZ
ANZ
ASB
KIWIBANK
WESTPAC
AVERAGE OVERNIGHT INTERBANK
CASH RATE
SOURCE AVERAGE OVERNIGHT INTERBANK CASH RATE: :
RESERVE BANK OF NEW ZEALAND STATISTICS
0.0
0.5
1.0
1.5
2.0
2.5
3.5
3.0
MAR 17 SEP 17 MAR 18 SEP 18 MAR 19 SEP 19 MAR 20 SEP 20
6MAJOR BANKS: COST OF FUNDS VS. AVERAGE OVERNIGHT INTERBANK CASH RATE
FIPS 2020 | KPMG | 9
© 2021 KPMG, a New Zealand Partnership and a member firm of the KPMG global organisation of independent member firms affiliated with KPMG International Limited, a private English company limited by guarantee. All rights reserved.

Businesses are also suffering from the inability to hire specialist and experienced staff from overseas. This employment situation is offset slightly by the number of New Zealand residents and citizens continuing to return home and those not leaving. Businesses reliant on seasonal migrant workers are struggling. In addition to challenges with getting the right staff, retail businesses are challenged by the global border restrictions which have resulted in fewer cargo ships unloading in New Zealand which also means fewer cargo ships are being loaded up to take New Zealand goods back to the rest of the world.
What does this all mean for our banks? While we are getting better at dealing with uncertainly, most businesses are playing it safe and banks are seeing little or no growth in their business loan books. However, the mortgage books are growing in this hot housing market. Again, this is in direct contrast to the dire predictions seen last March and April. While the lockdown periods naturally resulted in no new loans being written, June through to October showed steady growth before a significant increase in November. Although the December data is not yet available from the RBNZ, the banks that we spoke to were all expecting another bumper month with the bulk of completions due before Christmas.
• SEE FIGURE 14 – PAGE 29
While lending has increased to first time buyers and investors, by far the bulk of the new lending is to people who already own property. This has been confirmed through our conversations with the banks who have commented on the increased affordability created by the low interest rates as well as those looking for better yields than other traditional investments (see figures 1 and 2).
14
• SEE FIGURE 1 – PAGE 8
• SEE FIGURE 2 – PAGE 8
As we discuss below, the lockdowns saw a huge increase in the number of people working from home necessitating people to consider their living arrangements and the practicality of continuing with this situation longer term. Spending more time at home has encouraged some people to invest more in their own properties, finally getting around to the home improvements that they have been considering for a while. For some, having a better space to work has driven them to purchase a bigger property. Working from home more means commuting less often which opens up locations that are further away from city centre offices.
• SEE FIGURE 15 – PAGE 29
• SEE FIGURE 16 – PAGE 29
Lending to investors has increased by 64% from November 2019 to November 2020. The RBNZ removed the loan-to-value ratio (LVR) restrictions as part of the Covid-19 related measures when it looked like house prices were likely to drop significantly. However, the opposite has occurred and the RBNZ has reinstated the LVR restrictions with effect from March 2021 with tighter restrictions from May 2021.
1
2
15
16
ANZ and ASB have already acted and are limiting their exposure to high LVR loans ahead of the proposed RBNZ rules, requiring investors to have a deposit of 30%9. ANZ subsequently raised its requirement to a 40% deposit10.
New Zealanders coming home are also fuelling the hot housing market with reports of houses being sold sight unseen. The extent to whether or not this is actually happening is debatable, but the anecdotes could be contributing to a sense of missing out therefore encouraging people to purchase11. While the mortgage interest rates are still heading lower, 2.29% is currently the lowest one-year fixed rate being offered. This compares to an average mortgage interest rate of 3.44% in January 202012.
The predictions of negative interest rates that dominated discussions during the second and third quarters of 2020 have now changed. While the RBNZ still expects the banks to be ready to deal with negative interest rates, it seems that this will not be a reality that they will have to implement just yet.
The way we workAs with the non-bank institutions, one of the biggest impacts of 2020 for the banks was the move to working from home. The major banks have always had the ability for some staff to work remotely and encouraged flexible working hours, but 2020 saw a profound shift. There was a mad scramble at the start of lockdown to ensure everyone had the right hardware and access to the banks’ secure networks remotely. This was swiftly dealt with. Staff who could easily work from home transitioned well and some frontline staff traditionally involved in sales were re-allocated to assist with the overwhelming volume of calls that were being received by customers worried about the impact on their financial situation.
10 | KPMG | FIPS 2020
© 2021 KPMG, a New Zealand Partnership and a member firm of the KPMG global organisation of independent member firms affiliated with KPMG International Limited, a private English company limited by guarantee. All rights reserved.

Due to government relief packages and the relatively short duration of our ‘hard’ lockdown period, these customer enquiries returned to near normal levels quite quickly. The banks had to react fast to shutting their branches and diverting their frontline staff to assist customers through other channels.
The major banks all reported a significant increase in the uptake of digital banking, especially in the older demographic, who had previously been reluctant.
The major banks all reported a significant increase in the uptake of digital banking.
While some banks we spoke to had staff that remained in the office all the way through, others had the majority of their workforce working remotely until long after the government restrictions had been lifted.
This was partly due to the design of their workspaces making it hard to implement the physical distancing required under Alert Level 2, and partly due to them having already semi-mobile workforces and disaster recovery/business continuity centres that they could utilise. It was also heavily influenced by the lead from Australian parent companies who remained in a more restrictive environment and the desire of their staff to continue working from home. Also, as banking was categorised as an essential service the banks could not afford for their entire workforces to be compromised by an outbreak affecting their premises or risk becoming a ‘super-spreader’ environment.
We are fortunate in New Zealand to be able to choose whether we return to the office or not. In many parts of the world people have been working remotely since March 2020 with no clear return to the office in sight.
We have the luxury of being able to decide what works best for our businesses, our customers and ourselves and apply it accordingly.
We are fortunate in New Zealand to be able to choose whether we return to the office or not.
Pre-Covid-19, the banks’ focus on flexible working was usually highlighted as part of their diversity and inclusion offerings. To ensure that it was seen as a universal benefit, and not just one for working mums, they promoted it as a normal way of working, but it had to be seen to work for the business, your team as well as yourself.
As businesses have got back to ‘normal’ the major banks have all reported an increase in the number of people wanting to work remotely at least part of the week meaning that the identification of ‘the sweet spot’ is critical. With this increase in people working flexibly, some banks have now prioritised these elements to ensure that the customer needs come first and service is not compromised.
The benefits of working from home have been discussed at length over the past nine months including in the Non-banks FIPS – Review of 2020 published late last year13.
Companies that have felt the most comfortable having staff work remotely are those that have invested in technology that allows seamless access to the organisation’s systems and who are able to measure the productivity of their staff. In 2019 there was a lot of focus on organisations looking into the four-day week. Following the events of 2020, it seems that the ‘hybrid’ working week or 3-2-2 structure of three days in the office, two days at home and two days off is gaining popularity14.
While initially seen as primarily a diversity and inclusion offering, flexible working has become mainstream over the past 12 months. Organisations that were reluctant to introduce it have now seen that it is possible for large parts of their workforce to work more flexibly, including remotely, and that it is a critical part of their employee value proposition. Spending more time at home resulted in many people reassessing their lifestyle and what they found important. For some, the time saved through not commuting was increased time with their family or spending time on their hobby or sport and people are keen to retain these benefits now we are largely ‘back to normal’.
While some people may have felt that flexible working was largely reserved for working mums, many dads are now keen to retain the ability to be around more for their children and ‘share the care’.
With video calls ubiquitous during the lockdown periods, we have all seen way more of our colleagues’ homes and met more family members, including pets, than we expected. While for some people, this has been a welcome way of getting to know team members there are always people who feel uncomfortable sharing for one reason or another. The importance of having empathy and respect for each other has never been so important.
Another aspect to video calls is that meetings can be much more efficient when conducted virtually through Microsoft Teams, Zoom or similar. However, the flip side to this is the potential for a detrimental effect on company culture and interaction. This is where the ‘hybrid’ model comes in; people can focus on tasks at home, but participate in events involving team-building, culture and innovation when they are brought together in the office.
FIPS 2020 | KPMG | 11
© 2021 KPMG, a New Zealand Partnership and a member firm of the KPMG global organisation of independent member firms affiliated with KPMG International Limited, a private English company limited by guarantee. All rights reserved.

The two messages we heard most clearly were that people do not appreciate coming into the office to do something they can just as easily do from home and culture cannot be built or maintained as easily through remote working tools.
One team in a major bank were so motivated to remain working from home for the majority of the time that they worked out how much money they each saved by not going into the office every day. They calculated that they would save an average of $9,000 p.a. through less commuting, not buying lunches or coffees and needing fewer ‘office clothes’; all of these things add up to a significant amount.
The main concern for the banks, like many other businesses, is that having people working remotely a lot of the time will lead to a loss of organisational culture and there is a focus on how to replicate some of the connection points that naturally occur when people are physically in the same space in a virtual environment. While some leaders worry that if employees never actually come into the office that they will become disconnected from their organisation and find it easier to move to another one, others are confident that providing the flexible working benefits desired by their employees will result in greater loyalty.
For all the people who enjoy working remotely and have realised that they do not need to be tied to a particular office location so that they can move further out of the city or to another part of New Zealand, there are others who have found that the lack of personal interaction has reduced the enjoyment that they had from spending time at work with customers and colleagues. It is certainly not a ‘one size fits all’ situation and working in a hybrid environment is going to take some adjustment from both employees and employers.
Like many other businesses, this increase in remote working has seen the banks review their physical footprint as a result of more people wanting to work remotely. 2020 saw a number of branch closures reflecting the reduction in foot traffic from the Covid-19 related lockdowns and associated increase in the number of people using non-face to face banking options. Some banks have already decreased the amount of office space that they occupy and this is likely to continue as leases come up for renewal. One bank we spoke to has invested in technology which has management information dashboards including occupancy rates of buildings, number of virtual logons and types of transactions.
This increase in remote working has seen the banks review their physical footprint.
Utilising this type of data will make it easier to make decisions about how best to invest in creating the environment most conducive to employee engagement and customer satisfaction.
Amid the branch closures of last year, the New Zealand Bankers’ Association (NZBA) pilot for Banking Hubs started in November after being delayed due to the Covid-19 lockdowns. These Banking Hubs provide basic banking services with staff from all five major banks and are located in Twizel, Stoke, Martinborough and Opunake15. The 12-month pilot will give time to assess whether these Banking Hubs are sufficient for the more rural communities of New Zealand to feel supported16. (See the article, ‘NZBA: Delivering in a crisis’ on page 60.)
Cyber security
There were initially challenges for organisations, including the banks, to ensure that all their employees could access their virtual networks as business continuity plans usually only envisaged a maximum of a third of the workforce needing remote access. Along with expanding the available bandwidth, security issues were a key consideration. With more people accessing servers remotely, there is a greater risk of cyber security issues, as well as the need to keep customer data secure when working outside of the normal environment. Whilst internet connectivity is sufficient for many work tasks, there are certain transactions that require access to secure systems. One bank we spoke with advised us that while their staff successfully transitioned to working from home for the most part it was quickly recognised that large transactions were best completed in the secure environment of the office (see the article, ‘What will 2021 bring amid the fierce battle against cyber crime?’ on page 48).
Scammers did not take long before they started to exploit the uncertainty and confusion created by the pandemic and the banks were vocal in their advice to the public about protecting themselves17.
The way we do businessOther words that increased in usage over the course of 2020 were ‘contactless’ and ‘click and collect’. These were critical to many businesses being able to operate under Level 3 restrictions, and we saw a lot of retailers adapt their business models to service their customers from a distance. When Auckland re-entered a Level 3 lockdown at the end of August 2020, there were a lot more businesses that remained open having developed a way to continue under the restrictions including coffee shops, hardware stores and car yards.
12 | KPMG | FIPS 2020
© 2021 KPMG, a New Zealand Partnership and a member firm of the KPMG global organisation of independent member firms affiliated with KPMG International Limited, a private English company limited by guarantee. All rights reserved.

For the banks, this sudden move to digital or online platforms saw an increase in the numbers of customers using their digital channels for remote banking and also increased demand for face to face meetings to be held virtually. Customers were increasingly comfortable discussing their mortgage or investment needs from their own home with an advisor based elsewhere using Teams or Zoom. The banks contributed to helping their customers operate within government restrictions by removing the fees and increasing the transaction limit using Paywave, enabling businesses to take contactless payments providing both businesses and customers with a more hygienic experience. This was initially for a short term and the banks were praised for their quick response to support smaller businesses who potentially found the fees prohibitive.
The popularity of Paywave and the increasing expectation from customers that they can pay using it has led to the retail industry body lobbying the banks to decrease the fees associated with it and for the Government to indicate that they are looking to regulate more in this area18.
Customer centricity
The health and economic impacts of Covid-19 saw an immediate focus on both the health and financial wellbeing of people. The banks responded quickly and empathetically to keep both their staff and customers safe and to assist them where possible.
The health and economic impacts of Covid-19 saw an immediate focus on both the health and financial wellbeing of people.
Many of the banks committed to their staffing levels early on, informing them that there would be no redundancies and that they would be paid regardless of whether their situation meant they were working their usual hours or not.
For their customers, relief packages were quickly designed and implemented, both as a response to government directives and independently. When the first lockdown was implemented, the uncertainty led to many people contacting their bank, unsure of how their financial situation was going to unfold. The Government’s mortgage deferral programme meant that people could take a ‘holiday’ from their mortgage payments for up to six months without it being classed as a default and impacting their credit rating. While this has been a lifeline for some, many opted against it once they better understood the implications to their loan – that it would still accrue interest and this would be added to the loan therefore extending the term. As with the non-bank institutions, the banks reported a much smaller proportion of customers still on some sort of relief measures than expected.
It is crucial now that the desire to do the right thing for their customers does result in the right outcome for the customer.
The banks were among the most trusted brands in New Zealand pre-Covid19 and they certainly acted with empathy and understanding through the initial crisis period playing a crucial role in keeping the economy going and supporting New Zealanders. Banks are often an easy target to criticise but they have certainly proved themselves to be a critical element of the New Zealand economy, navigating the first wave of Covid-19 together with the Government, the Treasury, MBIE, IRD and the RBNZ, and the banks deserve some recognition for that. It is crucial now that the desire to do the right thing for their customers does result in the right outcome for the customer, understanding that sometimes the right answer is not necessarily what the customer is asking for.
(See the article on ‘Pandemic response: Building and maintaining trust’ on page 50.) Unfortunately, it will only take one small incident or problem for all the goodwill that has been built up to be lost.
Innovation
One by-product of the Covid-19 pandemic is that we have all seen that technology changes can be implemented quickly when they need to be. Organisations that planned to roll out Microsoft Teams over a 12-month period managed to cut this down to a matter of weeks if not days and we quickly became proficient at holding virtual meetings. Zoom became ubiquitous both for work related meetings and webinars as well as for lockdown quizzes.
2020 has shown us that things do not have to be done the way that they have always been done and we do have the ability to move fast when we need to. The banks are keen to harness this speed and agility while reviewing their product portfolios, channels and speed to market.
Collective lifestyle choicesThe impact of Covid-19 has caused countries to close their borders and focus much more domestically than they have in the recent past. Here in New Zealand, it has highlighted our reliance on skilled workers from overseas across the whole economy, from seasonal agricultural workers to experienced IT workers. There are also many skilled people who have had to retrain or reset their careers as they found themselves in a sector that was severely impacted. Here at KPMG, we have recently hired two pilots for example.
We are fortunate here in New Zealand that we can currently travel freely around the country and enjoy holidays albeit of the domestic variety.
FIPS 2020 | KPMG | 13
© 2021 KPMG, a New Zealand Partnership and a member firm of the KPMG global organisation of independent member firms affiliated with KPMG International Limited, a private English company limited by guarantee. All rights reserved.

Tourism operators and accommodation providers are having to adapt to domestic rather than international tourist expectations.
We are one of the few countries in the world to still be holding sporting matches with live audiences, sporting events drawing spectators such as the 36th America’s Cup as well as those with a high number of participants such as marathons, music festivals and community events.
The latest scare with community cases in January 2021 has demonstrated the need for us to not get too complacent. It is just too easy to forget that the world is in the midst of a pandemic and that we have many freedoms that other countries can currently only dream of.
Climate change
The lockdown period starkly demonstrated the impact that we are having on our environment and the improvement that is possible with fewer cars on the roads, planes in the air and factories working at full capacity.
The lockdown period starkly demonstrated the impact that we are having on our environment.
Climate change and associated issues were brought to the forefront in 2020 and look set to step up in the foreseeable future. From the RBNZ roundtable discussion featuring Mark Carney to Prime Minister Jacinda Ardern declaring a ‘climate emergency’, there is no abdicating responsibility.
In September 2020, the Government announced its policy to introduce mandatory climate-related financial risk reporting for financial market participants, based on the Task Force on Climate-related Financial Disclosures (TCFD) framework.
The response of the New Zealand banks will be particularly important, given their pivotal role in the economy as well as their exposure of lending portfolios to key sectors such as agriculture, property, etc. which have both physical and transition risk exposure and opportunity.
Banks will need to consider the implications for them, as both good corporate citizens and preparers of TCFD-aligned reporting as well as users of information disclosures to inform that as well as their lending and investment decision-making20. They have also committed to assisting their customers with understanding their own climate changes responsibilities21. (See the article, ‘Focus on climate change’ on page 52.)
Where to next?It looks like the borders will remain closed for much of 202122 (if not beyond), the Government’s relief packages are ending, and the supply chains are still severely impacted. While we have definitely not seen the dire predictions at the outset of the pandemic eventuate, we are not necessarily out of the woods yet. The recent fall in the unemployment rate23 once again demonstrates that ‘things are not as bad as expected’ but we could still see some negative impacts coming though in the next few months. The bounceback has been strong, but is not necessarily sustainable over the long-term as people are not going to continue to buy a new car or renovate their house each year.
We will need to be resilient, much as we have been to date and will need to be prepared to apply that Kiwi ‘number 8 wire’ approach to the changes we face. We are fortunate that we have a financial sector that remains strong and is in a position to help us through the next phase of the pandemic, whatever that may bring.
14 | KPMG | FIPS 2020
© 2021 KPMG, a New Zealand Partnership and a member firm of the KPMG global organisation of independent member firms affiliated with KPMG International Limited, a private English company limited by guarantee. All rights reserved.

© 2021 KPMG, a New Zealand Partnership and a member firm of the KPMG global organisation of independent member firms affiliated with KPMG International Limited, a private English company limited by guarantee. All rights reserved.
FIPS 2020 | KPMG | 15

RBNZ Covid-19 timeline24
9 Mar 2020 The RBNZ warns businesses to be prepared for potential disruptions from Covid-19 and consider their responses.
16 Mar 2020 Start date of increased capital requirements delayed until 1 July 2021 to increase lending supply.
The Official Cash Rate reduced to 0.25% for the next 12 months to provide monetary stimulus in response to Covid-19.
18 Mar 2020 External facing work on multiple regulatory initiatives is delayed for at least six months, and the outsourcing policy transition period is extended by 12 months.
19 Mar 2020 Confirmation issued that RBNZ has adequate cash to feed into the system should Covid-19 impact regular cash operations.
20 Mar 2020 Term Auction Facility (TAF) is introduced, giving banks access to collateralised 12-month term funding, to assist with the smooth function of markets. Other measures include funding in FX swap markets, the USD swap line being re-established, assisting to keep the New Zealand Government Bond market liquid and removing the allocated credit tiers for Exchange Settlement Account System (ESAS) accounts.
23 Mar 2020 The RBNZ announces intention to purchase up to $30 billion of New Zealand Government Bonds on the secondary market over a 12-month period through the Large Scale Asset Programme (LSAP).
24 Mar 2020 Financial support package announcement features a six-month principal and interest payment holiday to help homeowners and businesses affected economically by the impacts of Covid-19. At the same time capital rules are adjusted, with core funding ratios decreasing from 75% to 50%.
The Government and banks also implement a $6.25 billion Business Finance Guarantee Scheme for Small and Medium Medium-sized Enterprises (SMEs) aimed at protecting jobs and supporting the economy through uncertainty.
25 Mar 2020 Financial service functions are deemed essential under Covid-19 Alert Level 4.
30 Mar 2020 Weekly Open Market Operation (OMO) are deployed to provide liquidity for Corporate and Asset-Backed securities, providing another channel for banks to continue corporate funding.
2 Apr 2020 Term Lending Facility (TLF) is introduced to support the Business Finance Guarantee Scheme and promote business lending, by offering funding to banks with low interest rates for up to three years.
The payment of dividends and the redemption of non-CET1 capital instruments is stopped until further notice.
7 Apr 2020 LSAP is expanded to include $3 billion of the Local Government Funding Agency (LGFA) debt, increasing the programme total to $33 billion over 12 months.
19 Apr 2020 Expectations for banks regarding responsibility and good conduct in a time of uncertainty are outlined.
21 Apr 2020 Intention to remove loan-to-value ratio (LVR) restrictions announced to ensure borrowers and lenders were not unduly impacted by the mortgage deferral scheme.
24 Apr 2020 Guidance issued for Financial Services providers for operating under Covid-19 Alert Level 3.
30 Apr 2020 LVR restrictions are removed for 12 months.
4 May 2020 Operational details of TLF are announced, offering three-year fixed rate lending with the rate equivalent to the OCR at 0.25% available until 29 October 2020. The low interest rates are expected to be passed onto borrowers.
12 May 2020 Covid-19 Alert Level 2 guidance issued.
16 | KPMG | FIPS 2020
© 2021 KPMG, a New Zealand Partnership and a member firm of the KPMG global organisation of independent member firms affiliated with KPMG International Limited, a private English company limited by guarantee. All rights reserved.

RBNZ Covid-19 timeline24
13 May 2020 LSAP further expanded to a potential $60 billion with the introduction of New Zealand Government Inflation Indexed Bonds, which is aimed at continuing the reduction of borrowing costs.
24 Jun 2020 Monetary Policy Committee (MPC) agrees to continue with LSAP for the foreseeable future.
14 Jul 2020 Results of the Credit Conditions Survey for June 2020 are released, capturing changes post-lockdown from the March 2020 survey.
12 Aug 2020 LSAP is expanded to $100 billion, to further lower retail interest rates and achieve its remit. Additional monetary instruments will also remain in active preparation to be deployed if necessary.
17 Aug 2020 The Mortgage Deferral Scheme is extended to 31 March from 27 September, allowing banks to continue to help any customers in need without impacting their credit scores.
20 Aug 2020 The TLF offer is extended until 1 February 2021, with the term increased from three to five years.
The RBNZ’s balance sheet has doubled since January to approximately $60 billion, as a result of its support to the economy in response to Covid-19, and is likely to remain high for the foreseeable future.
24 Aug 2020 Banks and Non-Bank Deposit Takers (NBDTs) are granted an exception to operate under Covid-19 Alert Level 3.
17 Sep 2020 Outcomes from a Covid-19 stress test of New Zealand banks in March is released and concludes that banks could successfully draw on their existing capital buffers and continue lending to support lending in the economy during a severe economic downturn.
23 Sep 2020 MPC agrees to continue with LSAP up to $100 billion.
11 Nov 2020 Announcement of a Funding for Lending Programme (FLP) to commence in December to reduce banks’ funding costs and lower interest rates, with the intention of assisting in meeting remits.
Announcement that required increases in bank capital have been further delayed until 2022. This is to allow banks continued capital headroom to respond to the economic impact of Covid-19 and support the financial recovery. Dividend restrictions to remain until at least 31 March 2021.
25 Nov 2020 Intention to reinstate LVR restrictions is signalled.
8 Dec 2020 Requests for views on a proposal to reinstate LVR restrictions on high-risk lending with effect from March 2021.
9 Feb 2021 The RBNZ announces LVR restrictions to be re-instated from 1 March 2021. Banks will be restricted to a maximum of 20% of new lending to owner-occupiers at LVRs of over 80% and 5% of new lending to investors at LVRs over 70%.
From 1 May 2021, the restriction for new lending to investors will increase to a maximum of 5% of new lending at LVRs over 60%.
FIPS 2020 | KPMG | 17
© 2021 KPMG, a New Zealand Partnership and a member firm of the KPMG global organisation of independent member firms affiliated with KPMG International Limited, a private English company limited by guarantee. All rights reserved.

• Jan. 2020• 29th
The RBNZ’s figures show record levels of mortgage lending, up by $1.2 billion during December 2019 compared to December 2018.
• Feb. 2020• 12th
BNZ announces a drought assistance package for Northland farmers who are in need, featuring increased overdraft approvals and deferral of scheduled principal repayments.
• 28thKiwibank, Inland Revenue, Accident Compensation Corporation cease the use of cheques.
New Zealand records its first case of Covid-19.
• Mar. 2020• 3rd
ANZ Investments is named Overall New Zealand Fund Manager of the Year at the 2020 Morningstar awards.
• 5thHeartland Bank launches trial of online home loan origination, offering leading mortgage rates to attract borrowers.
• 9thHeartland Bank states focus on diversity and gender equality, looking at broader senior management. They have a Strategic Management Group comprised of 55% women assisting to drive this change.
• 16thKiwibank reduces its floating home loan rate passing on the full OCR cut of 0.75%.
• 19thNew Zealand’s borders close to all but New Zealanders and permanent residents.
• 21stThe Government introduces a 4-tiered Alert Level system to assist New Zealand deal with the impact of Covid-19.
• 23rdNew Zealand moves to Alert Level 3.
• 25thNew Zealand moves to Alert Level 4.
• 29thNew Zealand records its first Covid-19 related death.
• Apr. 2020• 3rd
Rabobank’s Rural Confidence Survey shows confidence in New Zealand’s rural sector is down, but expects that the sector will have a crucial role in the economic and social recovery from Covid-19.
• 7thBNZ announces that they will be extending their ‘No Interest Loan Support Scheme’ with Good Shepherd NZ, by making $5 million worth of individual loans of up to $1,500 available to support families financially impacted by Covid-19.
• 19thThe Council of Financial Regulators state their expectations of responsible behaviour to banks and encourages them to continue lending, but provide affordable long-term customer-focused solutions.
• 27thNew Zealand moves to Alert Level 3.
• May 2020• 8th
Mortgage Wars – Kiwibank announces their first loan below 3%, offering a 2.99% fixed interest rate for one year effective from May 11.
• 12thMortgage Wars – ANZ and ASB follow Kiwibank, offering 2.99% interest rates.
• 13thNew Zealand moves to Alert Level 2.
Timeline of events24
Note that items regarding the RBNZ’s Covid-19 response have been excluded from this timeline, and instead collated in a single timeline on page 16. Events in blue relate to Covid announcements from the New Zealand Government.
© 2021 KPMG, a New Zealand Partnership and a member firm of the KPMG global organisation of independent member firms affiliated with KPMG International Limited, a private English company limited by guarantee. All rights reserved.
18 | KPMG | FIPS 2020
https://www.rnz.co.nz/news/business/410569/kiwibank-checks-out-last-day-for-customers-to-use-cheques
https://www.rnz.co.nz/news/business/410569/kiwibank-checks-out-last-day-for-customers-to-use-cheques
https://www.rnz.co.nz/news/business/410569/kiwibank-checks-out-last-day-for-customers-to-use-cheques

• 18thBNZ launches a categorisation and money tracking feature in its app to provide spending insights to customers.
ASB receives certification from Toitu Envirocare for achieving neutral carbon operations.
The Industrial and Commercial Bank of China is registered as a bank in New Zealand to operate as a branch.
• 20thReports show that KiwiSaver investors transferred $1.4 billion to cash and conservative funds in March, while total funds under management fell $4.5 billion.
• 22ndMortgage Wars – Kiwibank continues to reduce mortgage interest rates, launching a one-year home loan at 2.65%, challenging ASB’s 2.69%.
• Jun. 2020• 3rd
Westpac New Zealand launches interest-free ‘Warm Up’ loan scheme for loans of up to $10,000, enabling customers to make their homes warmer and healthier.
• 8thNew Zealand moves to Alert Level 1.
• 11thKiwibank decreases variable lending rates by 1% to reduce the pricing gap between fixed and floating rates, resulting in interest savings of $20 million for over 35,000 customers.
• 16thThe Co-operative Bank stops offering cash withdrawals and large coin deposit services in branches.
• Jul. 2020• 6th
ASB launches the ASB Business Hub, a free service to provide support for Small and Medium-sized Enterprises (SMEs) providing advice and tools on how to develop and optimise businesses.
• 23rdKiwibank launches a digital platform, Fast Capital, which can link with Xero or MYOB to obtain businesses financial information and speeds up the lending decision making process through automation.
• 27thBNZ receives Living Wage accreditation, for providing wages of $22.15 or more per hour to all employees, regular contractors and suppliers who also pay their people a living wage. The achievement marks the banking industry becoming the first fully living wage accredited industry in New Zealand.
• 29thHeartland Bank wins the Canstar’s Bank of the Year – Savings Award for the third year in a row. The award recognises Heartland for providing the strongest combination of savings products and services.
• Aug. 2020• 3rd
Westpac launches a new merchant fee pricing structure aimed at reducing costs for of contactless transactions for those SMEs with lower levels of transactions.
• 4thBNZ also reduces the cost of making PayWave payments for SMEs.
• 12thDue to new cases of Covid-19 in the community, Auckland region moves to Alert Level 3 and the rest of New Zealand moves to Alert Level 2.
• 21stANZ announces that they will match up to $500,000 of donations to Cancer Society’s Daffodil Day fundraiser in response to the disruption of Covid-19 on normal donations.
• 30thAuckland region moves to Alert Level 2 to join the rest of New Zealand but has additional restrictions on gatherings.
© 2021 KPMG, a New Zealand Partnership and a member firm of the KPMG global organisation of independent member firms affiliated with KPMG International Limited, a private English company limited by guarantee. All rights reserved.
FIPS 2020 | KPMG | 19

• Sep. 2020• 11th
TSB Good Stuff awarded grants totalling $250,000 to nine winning ideas to kick-start projects that benefit communities.
• 15thHeartland Bank announces a strategy for the growth of te reo and tikanga Māori to acknowledge Māori culture within the workplace and the financial sector.
• 21stAll of New Zealand except the Auckland region moves to Alert Level 1.
• 23rdRabobank increases their forecasted farmgate milk price by 40 cents for the 2020/2021 season, but maintains a cautious view of recovery in the global dairy market.
The extra restrictions on gatherings are removed for the Auckland region.
• 24thKiwibank reaches settlement with the Commerce Commission, agreeing to pay $5.2 million to 48,000 borrowers in relation to the failure of robust loan variation disclosure policies, procedures and systems.
• Oct. 2020• 1st
The FMA’s KiwiSaver Annual Report found KiwiSaver growth continued despite economic uncertainty from Covid-19, and total managed funds have increased 8.7% to $62 billion.
• 7thAuckland region moves to join the rest of New Zealand in Alert Level 1.
• 12thASB secures Eden Park naming rights and pledges to grant these to help promote New Zealand small businesses.
Mortgage Wars – Heartland Bank is the first to offer a sub-2% home loan: 1.99% one-year fixed.
• 20thANZ announces that they will stop buying and selling foreign cash.
Westpac announces their strategic shift to start offering banking services for Afterpay customers.
• 27thThe RBNZ’s figures show monthly mortgage lending increased to over $7.3 billion in September, setting a record high.
• Nov. 2020• 12th
ASB reinstates loan-to-value ratio (LVR) restrictions for investors to 30% due to rapid growth in the lending market and increased investor demand at an unsustainable level.
ANZ launches a flood assistance package for businesses affected by flooding in the Hawke’s Bay.
• 17thThe RBNZ launches a consultation regarding the implementation of the changes announced as a result of its Capital Review in December 2019.
• 19thBNZ announces that it is set to close 38 branches by June 2021 due to the pandemic accelerating trends towards digital services.
• Dec. 2020• 2nd
The Commerce Commission has warned BNZ after the bank reported 15 potential breaches of the Credit Contracts and Consumer Finance Act for failure to provide timely and accurate information to borrowers. BNZ has refunded more than $1 million to affected borrowers.
© 2021 KPMG, a New Zealand Partnership and a member firm of the KPMG global organisation of independent member firms affiliated with KPMG International Limited, a private English company limited by guarantee. All rights reserved.
20 | KPMG | FIPS 2020

• 15thANZ goes a step further than the other major banks, imposing a 40% deposit requirement for residential property investors.
• Jan. 2021• 8th
The Banking Ombudsman has required several banks to repay their customers that have been the victims of fraud, declaring that the banks failed to act on ’red flags’.
• 11thThe RBNZ responds to a breach of a third-party filesharing system used to store and share sensitive information, stating that the breach is contained.
• 19thKiwibank announces that it will be investing more in tikanga Māori, in order to better align their bank with te ao Māori within the bank and within their customer base.
• 22ndMortgage wars – All major banks reduce one-year interest rate offering to 2.29%, with Westpac the first to move.
• Feb. 2021• 10th
ASB posts a 4% rise in interim profit.
• 14thDue to new cases of Covid-19 in the community, Auckland region moves to Alert Level 3 and the rest of New Zealand moves to Alert Level 2.
• 16thWestpac economist warns of a ‘technical recession’ for next six months.
REINZ data shows that both Auckland house prices and sales dropped in January but could be largely due to seasonal demands.
• 18thAuckland region moves to Alert Level 2 and the rest of New Zealand moves to Alert Level 1.
© 2021 KPMG, a New Zealand Partnership and a member firm of the KPMG global organisation of independent member firms affiliated with KPMG International Limited, a private English company limited by guarantee. All rights reserved.
FIPS 2020 | KPMG | 21

Provisioning: Volatility in a Covid-19 world
The impact of Covid-19Based on the latest RBNZ Bank Financial Strength Dashboard data for the period ended 30 September 2020, the first three quarters of 2020 saw a significant increase in the level of impaired asset expenses for the New Zealand banking industry as a whole.
When comparing the cumulative results in 2020 against the same quarters in 2019, we observed that the total impaired asset expenses has increased by approximately four times. This has largely been as result of the effects of the pandemic being included in the bank sector modelling and management being cautious when attempting to quantify the unknown.
• SEE FIGURE 7 – PAGE 23
• SEE FIGURE 8 – PAGE 23
However, the RBNZ’s Financial Stability Report in November 2020 indicates that the quantum of non-performing loans has only increased modestly especially when compared to peaks seen in the Global Financial Crisis period.
The banks generally use provisioning models that were built using data largely from a benign environment and apply simplistic statistical approaches (e.g. regression) to derive links between changes in economic conditions and historical customer behaviour. In addition, the diverse economic forecasts used in determining the forward-looking provisions has resulted in varied provisioning outcomes. These simplistic approaches are unlikely to perform as intended across a ‘shock’ environment such as Covid-19 since these models
7
8
were not built for such conditions. They also do not consider the effects of active government intervention which has played a significant part in limiting the level of defaults.
There is a presumption that banks should consider enhancing or recalibrating their existing provision models to incorporate latest internal losses and economic data to better understand the link between both information. However, in the New Zealand environment this might prove to be a challenge since we are experiencing a unique situation where the active government intervention may be masking the true impacts or reactions of the economic indicators against typical customer behaviour in a crisis.
Given the interlinkages with the global economy, the development and roll-out of vaccines, recurring lockdowns in other countries and the more recent supply chains issues, these impairment models should be reassessed more regularly to ensure they reflect the most current economic outlook and capture the credit risk indicators that are expected to emerge for their exposures.
Some economists are also estimating that New Zealand’s economy has returned to a pre-Covid level when considering the current state of domestic demand and the general economic activity. With the housing market significantly overheating and the alarming rise of house prices, it is believed that interest rates may increase sooner rather than later to placate the situation. The prominence of the government support throughout the pandemic and the resilience of the New Zealand economy may have significantly dampened the expected loan delinquencies in the forthcoming periods compared to initial bank predictions. At this juncture, due to this combination of factors, the possibility of provision write-backs may not sound so foreign anymore.
Rajesh MegchianiPartner – Risk Consulting KPMG
Rajesh leads the team at KPMG that provides financial risk management advice. Rajesh’s team advises clients on prudential regulations, market risk, credit risk and liquidity risk.
Dhayaparan RamanSenior Manager – Risk Consulting KPMG
Dhayaparan is a quantitative risk consultant with valuable experience in provisioning and credit risk models, statistical analyses tools, and financial services’ prudential guidelines.
22 | KPMG | FIPS 2020
© 2021 KPMG, a New Zealand Partnership and a member firm of the KPMG global organisation of independent member firms affiliated with KPMG International Limited, a private English company limited by guarantee. All rights reserved.

$MILLIONS %
0
TOTAL PROVISION GROSS IMPAIRED/
( )AND PAST DUE ASSETS RHS
SPECIFIC PROVISION GROSS IMPAIRED/
( )AND PAST DUE ASSETS RHS
GROSS IMPAIRED ASSETS LHS( )
PAST DUE ASSETS LHS( )
1,000
2,000
3,000
4,000
5,000
6,000
7,000
0
20
40
60
80
100
120
140
2009 2010 2011 2012 2013 2014 2015 2016 2017 2018 2019 2020
8REGISTERED BANKS: GROSS IMPAIRED AND PAST DUE ASSETS
%
IMPAIRED ASSET EXPENSE/
AVERAGE GROSS LOANS AND ADVANCES
NET LOAN WRITE OFFS/
AVERAGE GROSS LOANS AND ADVANCES
TOTAL PROVISIONS FOR DOUBTFUL DEBT/
GROSS LOANS AND ADVANCES
0.0
0.2
0.4
0.6
0.8
1.0
1.2
2009 2010 2011 2012 2013 2014 2015 2016 2017 2018 2019 2020
7REGISTERED BANKS: IMPAIRED ASSET EXPENSE TO GROSS LOANS AND ADVANCES
%
AGRICULTURE
CONSUMER
HOUSING
BUSINESS
SOURCE RESERVE BANK OF NEW ZEALAND STATISTICS:
-1 .05
-5.0
0.0
5.0
10.0
15.0
2009 2010 2011 2012 2013 2014 2015 2016 2017 2018 2019
-10.0
2020
9 REGISTERED BANKS: LENDING GROWTH BY SECTOR
FIPS 2020 | KPMG | 23
© 2021 KPMG, a New Zealand Partnership and a member firm of the KPMG global organisation of independent member firms affiliated with KPMG International Limited, a private English company limited by guarantee. All rights reserved.

Sector performance
MOVEMENT IN NET PROFIT AFTER TAX10
$MILLION
OPERATINGEXPENSES
NETINTERESTINCOME
NON-INTERESTINCOME
IMPAIREDASSET
EXPENSES
TAXEXPENSE
2019 NETPROFIT
AFTER TAX
2020 NETPROFIT
AFTER TAX
0
1,000
2,000
3,000
4,000
5,000
6,000
7,000
Consistent with previous surveys, our analysis of bank performance is performed over the top-level entity’s consolidated results. For dual registered banks with a local bank and branch structure, the New Zealand banking group level results are used. Results only include operations within the banking group, any operations within wider groups, but outside the registered banking group, such as the Kiwibank and Heartland structures, have not been included.
Industrial and Commercial Bank of China (ICBC) registered as a branch in 2020. As it has a 31 December balance date, the first set of results for the combined New Zealand group have not yet been released, and therefore, the entity’s group results will not be reported until the 2021 survey.
A number of reclassifications have been made to prior year figures for both Heartland and Rabobank. The survey figures have been updated to reflect the changes to the comparative figures for these banks. In addition, a few additional adjustments have been made to few comparative figures for other banks where the change was considered necessary, although these are abnormalities and not material.
Net profit after taxThe New Zealand banking sector has had a challenging year in 2020, with net profit after tax (NPAT) down 27.57% ($1.58 billion) from 2019, to $4.14 billion (see figure 10). This is the largest decrease captured by the survey in the past ten years and highlights the effect of Covid-19 on the banking sector. Covid-19 has had a more immediate effect on bank’s NPAT than the likes of the Global Financial Crisis (GFC), where the sector reported decreases of 1.2% (2007), 0.1% (2008) and 98.8% (2009).
• SEE FIGURE 10 – PAGE 24
The impact of Covid-19 affected banks differently depending on the year-ends of the individual participants. Notably five of the eight banks with December 2019 year-ends achieved increases in NPAT, resulting in a combined increase of 8.66% ($21.82 million).
10
MUFG Bank (MUFG) has a March year-end and is the only survey participant of the 12 banks with March to September year-ends to report an increase in NPAT, having achieved a growth of 18.52% ($4.75 million). When we look at the March and September quarters we see a 29.24% ($1.60 billion) combined decrease in profits. This illustrates how Covid-19 has specifically impacted the March to September quarters. It also probably foreshadows that the profit impact could continue into next year as even the September quarter balance dates in the survey have only had six months of Covid-19 impact.
The significant growth in impaired asset expense of $1.08 billion (275.20%) was the key driver to the decrease in NPAT, although the decline was also impacted by the increase in operating expenses (excluding amortisation) of $486.24 million (9.04%). At the top line, revenue streams also decreased, further contributing to the negative NPAT result, with net interest income down 0.46% ($50.26 million), and non-interest income having dropped 14.50% ($453.63 million).
24 | KPMG | FIPS 2020
© 2021 KPMG, a New Zealand Partnership and a member firm of the KPMG global organisation of independent member firms affiliated with KPMG International Limited, a private English company limited by guarantee. All rights reserved.
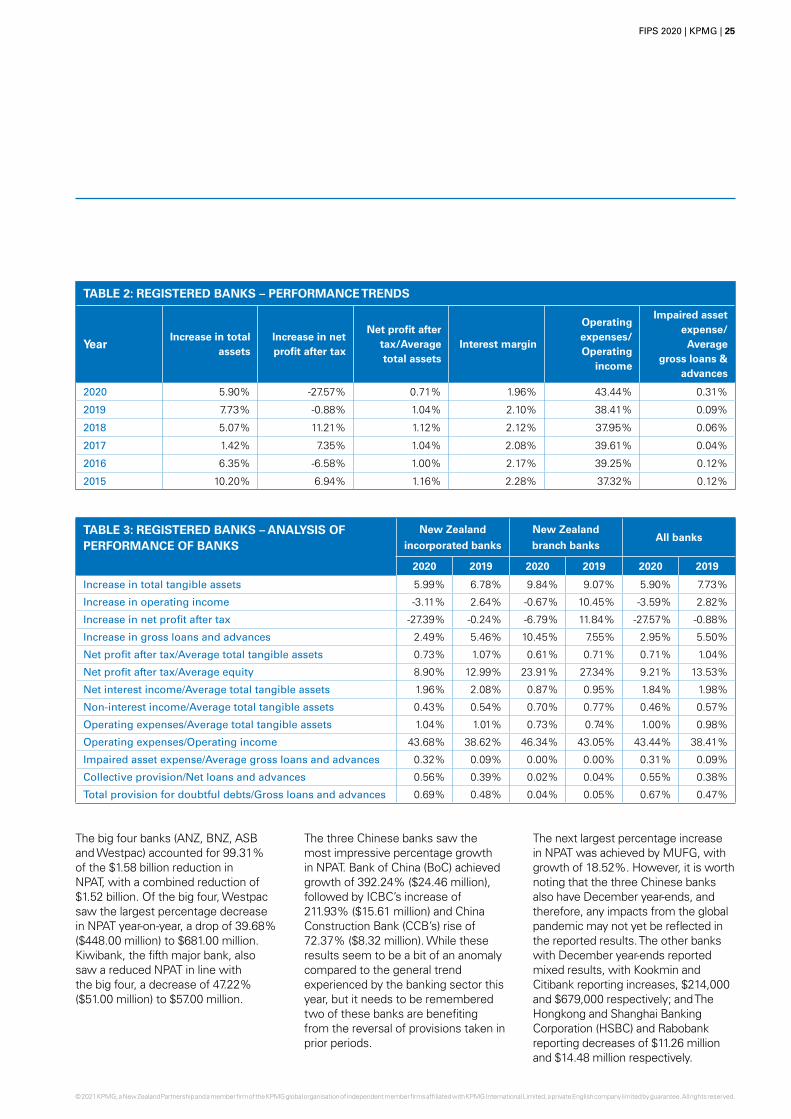
TABLE 2: REGISTERED BANKS – PERFORMANCE TRENDS
YearIncrease in total
assetsIncrease in net profit after tax
Net profit after tax/Average total assets
Interest margin
Operating expenses/Operating
income
Impaired asset expense/
Average gross loans &
advances
2020 5.90% -27.57% 0.71% 1.96% 43.44% 0.31%
2019 7.73% -0.88% 1.04% 2.10% 38.41% 0.09%
2018 5.07% 11.21% 1.12% 2.12% 37.95% 0.06%
2017 1.42% 7.35% 1.04% 2.08% 39.61% 0.04%
2016 6.35% -6.58% 1.00% 2.17% 39.25% 0.12%
2015 10.20% 6.94% 1.16% 2.28% 37.32% 0.12%
TABLE 3: REGISTERED BANKS – ANALYSIS OF PERFORMANCE OF BANKS
New Zealand
incorporated banks
New Zealand
branch banksAll banks
2020 2019 2020 2019 2020 2019
Increase in total tangible assets 5.99% 6.78% 9.84% 9.07% 5.90% 7.73%
Increase in operating income -3.11% 2.64% -0.67% 10.45% -3.59% 2.82%
Increase in net profit after tax -27.39% -0.24% -6.79% 11.84% -27.57% -0.88%
Increase in gross loans and advances 2.49% 5.46% 10.45% 7.55% 2.95% 5.50%
Net profit after tax/Average total tangible assets 0.73% 1.07% 0.61% 0.71% 0.71% 1.04%
Net profit after tax/Average equity 8.90% 12.99% 23.91% 27.34% 9.21% 13.53%
Net interest income/Average total tangible assets 1.96% 2.08% 0.87% 0.95% 1.84% 1.98%
Non-interest income/Average total tangible assets 0.43% 0.54% 0.70% 0.77% 0.46% 0.57%
Operating expenses/Average total tangible assets 1.04% 1.01% 0.73% 0.74% 1.00% 0.98%
Operating expenses/Operating income 43.68% 38.62% 46.34% 43.05% 43.44% 38.41%
Impaired asset expense/Average gross loans and advances 0.32% 0.09% 0.00% 0.00% 0.31% 0.09%
Collective provision/Net loans and advances 0.56% 0.39% 0.02% 0.04% 0.55% 0.38%
Total provision for doubtful debts/Gross loans and advances 0.69% 0.48% 0.04% 0.05% 0.67% 0.47%
The big four banks (ANZ, BNZ, ASB and Westpac) accounted for 99.31% of the $1.58 billion reduction in NPAT, with a combined reduction of $1.52 billion. Of the big four, Westpac saw the largest percentage decrease in NPAT year-on-year, a drop of 39.68% ($448.00 million) to $681.00 million. Kiwibank, the fifth major bank, also saw a reduced NPAT in line with the big four, a decrease of 47.22% ($51.00 million) to $57.00 million.
The three Chinese banks saw the most impressive percentage growth in NPAT. Bank of China (BoC) achieved growth of 392.24% ($24.46 million), followed by ICBC’s increase of 211.93% ($15.61 million) and China Construction Bank (CCB’s) rise of 72.37% ($8.32 million). While these results seem to be a bit of an anomaly compared to the general trend experienced by the banking sector this year, but it needs to be remembered two of these banks are benefiting from the reversal of provisions taken in prior periods.
The next largest percentage increase in NPAT was achieved by MUFG, with growth of 18.52%. However, it is worth noting that the three Chinese banks also have December year-ends, and therefore, any impacts from the global pandemic may not yet be reflected in the reported results. The other banks with December year-ends reported mixed results, with Kookmin and Citibank reporting increases, $214,000 and $679,000 respectively; and The Hongkong and Shanghai Banking Corporation (HSBC) and Rabobank reporting decreases of $11.26 million and $14.48 million respectively.
FIPS 2020 | KPMG | 25
© 2021 KPMG, a New Zealand Partnership and a member firm of the KPMG global organisation of independent member firms affiliated with KPMG International Limited, a private English company limited by guarantee. All rights reserved.

Overall, 14 of the 20 survey participants saw a decrease in their NPAT, and of the six participants that achieved an increase in NPAT (BoC, CCB, Citibank, ICBC, Kookmin, MUFG), Citibank was the only bank not headquartered in Asia.
As figure 10 illustrates, the financial performance of the survey participants can be summarised as follows:
— net interest income decreased by $50.26 million (0.46%) to $10.83 billion;
— non-interest income fell by $453.63 million (14.50%) to $2.68 billion;
— operating expenses (including amortisation) increased by $470.75 million (8.20%) to $6.21 billion;
— impaired asset expense surged by $1.08 billion (275.20%) to $1.47 billion;
— tax expense declined by $506.16 million (23.45%) to $1.65 billion.
Net interest marginThe net interest margin (NIM) fell 14 basis points (bps) from 2.10% to 1.96% across the banking sector in 2020, with net interest income only seeing a slight dip of 0.46% ($50.26 million) to $10.83 billion. Conversely, interest earning assets saw a proportionally larger increase of 6.70% ($35.82 billion), with all but three of the banks surveyed achieving an increase of interest earning assets in 2020. Combined, this resulted in the decline of NIM. See table 4.
Of the four survey participants that reported an increase in NIM, Heartland had the largest upward movement of 52 bps to 4.66%, and remains with the highest NIM of all survey participants. This movement was due to a 9.65% ($16.64 million) increase in net interest income with only a 4.50% ($178.51 million) increase in interest earning assets. The other three banks, Bank of Baroda (BoB), JPMorgan Chase (JPM) and Kookmin, recorded increases in NIM with December or March year-ends, and therefore have not yet been significantly impacted by the lowered Official Cash Rate (OCR). Meanwhile, while Bank of India (BoI) suffered the largest deterioration in NIM with a reduction of 52 bps to 3.31% from 3.83% in 2019, it still retains the second highest NIM of the banking sector group.
TABLE 4: MOVEMENT IN INTEREST MARGIN 2020 2019 Movement
Entity25 % % (bps)
Australia and New Zealand Banking Group Limited – ANZ New Zealand 2.02% 2.14% -12
Bank of Baroda (New Zealand) Limited 2.69% 2.66% 3
Bank of China New Zealand Banking Group 1.39% 1.57% -18
Bank of India (New Zealand) Limited 3.31% 3.83% -52
Bank of New Zealand 2.07% 2.16% -9
China Construction Bank Corporation New Zealand Banking Group 1.30% 1.52% -22
Citibank, N.A. New Zealand Branch and Associated Banking Group 0.69% 0.92% -23
Commonwealth Bank of Australia New Zealand Operations 1.90% 2.01% -11
Heartland Bank Limited 4.66% 4.14% 52
Industrial and Commercial Bank of China (New Zealand) Limited 1.57% 1.93% -36
JPMorgan Chase Bank, N.A., New Zealand Banking Group 0.85% 0.73% 12
Kiwibank Limited 1.94% 2.11% -17
Kookmin Bank Auckland Branch 1.86% 1.79% 7
MUFG Bank, Ltd., Auckland Branch 0.50% 0.51% -1
Coöperatieve Rabobank U.A. New Zealand Banking Group 2.14% 2.35% -21
Southland Building Society 2.51% 2.56% -5
The Co-operative Bank Limited 2.19% 2.35% -16
The Hongkong and Shanghai Banking Corporation Limited, New Zealand Banking Group 1.28% 1.38% -10
TSB Bank Limited 1.80% 1.83% -3
Westpac Banking Corporation – New Zealand Banking Group 1.88% 2.12% -24
Sector average 1.96% 2.10% -14
26 | KPMG | FIPS 2020
© 2021 KPMG, a New Zealand Partnership and a member firm of the KPMG global organisation of independent member firms affiliated with KPMG International Limited, a private English company limited by guarantee. All rights reserved.

This was driven by a 20.71% ($0.75 million) reduction in net interest income, with a smaller decrease in interest earning assets of 3.28% ($2.88 million). This reduction was caused, in part, by the bank being in a holding pattern while its parent decided its future in New Zealand.
All five of the major banks reported a decrease in NIM, and Westpac saw the largest decrease in NIM of 24 bps to 1.88% to become the lowest NIM of the major banks. BNZ maintained the highest NIM of the major banks in 2020 with 2.07%, with the smallest decline of the major banks, down just 9 bps from last year. Interestingly, Westpac was the only major bank that experienced more than a slight decrease in net interest income, with a 5.26% ($0.11 billion) decline. This resulted in a relatively flat combined movement in net interest income for the major banks of 0.71% ($69.00 million), while faster growth in interest-earning assets saw an increase of 6.37% ($30.41 billion) which caused the reductions seen in NIM.
Only three survey participants saw decreases in interest earning assets, Citibank, BoI and BoB were down by 20.10% ($430.10 million), 3.28% ($2.88 million) and 1.07% ($1.32 million) respectively. Meanwhile, BoC continues to make its mark in the New Zealand market with the largest percentage increase in interest earning assets of all the banks, a rise of 68.36% ($1.53 billion) to $3.76 billion. However, their net interest income did not increase in line with their assets, resulting in a decrease in NIM of 18 bps to 1.39%.
JPM also saw significant growth in interest earning assets, a bounce back from a substantial decrease in 2019, with growth of 55.63% ($699.37 million) to reach $1.96 billion of interest earning assets. They were able to increase their net interest income largely in line with their assets, a growth of 51.78% ($4.66 million), and thus driving an NIM increase of 12 bps to 0.85%.
• SEE FIGURE 11 – PAGE 28
Non-interest incomeNon-interest income has declined by 14.50% ($453.63 million) overall, with 14 of the 20 survey participants having reported decreases in their non-interest income. The six banks that saw increases in their non-interest income had December or March balance dates, with the exception of Kiwibank’s June balance date.
The big four banks reported a combined drop in non-interest income of $494.00 million (17.41%); this was driven by the combination of a few factors. All four of the big banks had decreases in fee income during the year. The majority also had non-interest income from profits on the sale of investments or discontinued operations included in their 2019 results that have not occurred in the current year. The movement could be partially attributable to the impacts of Covid-19, but it is likely that a portion is a result of historically implemented changes from the conduct and culture findings in both New Zealand and Australia impacting the results for a full year.
11
BNZ had a decline in non-interest income of 23.19%, the largest percentage decline of the major banks and the overall banking sector. Of the major banks, Kiwibank was the only bank to see growth in their non-interest income, with an increase of 5.38% to $98.00 million.
Rabobank saw the second largest percentage increase of all banks, reporting growth in their non-interest income of 115.97% ($31.83 million) from a negative $27.44 million to a positive $4.38 million, attributable to a rise in net operating lease income of $31.83 million. CCB achieved the largest percentage rise in non-interest income of 841.92% ($9.90 million) to $11.08 million, driven by increased gains on derivatives, unrealised gains on financial assets and liabilities, as well as an increase in fee income.
Total assets and gross loans and advancesTotal assets for the banking sector saw continued growth of 5.90% to $604.37 billion in 2020, albeit at a slower rate than the 7.73% increase in 2019. This result illustrates the sturdy performance of the sector in a volatile and unpredictable economy and the steady stream of funds into the banks as a flight to quality occurred. The sector in turn has been cautious and grown other assets (cash and short-term deposits) at this time. The Government has pulled many levers to support the public’s financial wellbeing and to enable the banks to continue lending, with lower lending interest rates enabling more affordable servicing of debt. Of the 20 banks surveyed in total, 18 have reported an increase in total assets this year.
TABLE 5: REGISTERED BANKS – NON-PERFORMING LOANS 2017 2018 2019 2020
Past due assets/Gross loans and advances 0.14% 0.13% 0.17% 0.29%
Gross impaired assets/Gross loans and advances 0.33% 0.37% 0.38% 0.45%
Total 0.47% 0.50% 0.55% 0.74%
FIPS 2020 | KPMG | 27
© 2021 KPMG, a New Zealand Partnership and a member firm of the KPMG global organisation of independent member firms affiliated with KPMG International Limited, a private English company limited by guarantee. All rights reserved.

$BILLIONS %
OPERATING EXPENSES/
( )OPERATING INCOME RHS
OPERATING EXPENSES
( ) ( )EXCLUDES ABNORMAL LHS
37
38
39
40
41
42
43
44
45
4.00
4.25
4.50
4.75
5.00
5.25
5.50
5.75
6.00
2011 2012 2013 2014 2015 2016 2017 2018 2019 2020
REGISTERED BANKS: OPERATING EXPENSES VS. OPERATING EXPENSES OVER OPERATING INCOME
13
%
RETURN ON ASSETS RHS( )
RETURN ON EQUITY LHS( )
GROWTH IN GROSS LOANS
ADVANCES LHS
AND
( )
0
2
4
6
8
10
12
14
16
18
0.0
0.2
0.4
0.6
0.8
1.0
1.2
1.4
1.6
1.8
%
2011 2012 2013 2014 2015 2016 2017 2018 2019 2020
12GROWTH IN GROSS LOANS & ADVANCES VS. RETURN ON ASSETS & RETURN ON EQUITY
$MILLIONS %
100,000
200,000
300,000
400,000
500,000
700,000
1. 07
1.90
2.00
2.10
2.20
2.30
2.40
0
INTEREST MARGIN RHS( )
TOTAL ASSETS LHS( )
600,000
2011 2012 2013 2014 2015 2016 2017 2018 2019 2020
1.80
11REGISTERED BANKS: TOTAL ASSETS VS. INTEREST MARGIN
28 | KPMG | FIPS 2020
© 2021 KPMG, a New Zealand Partnership and a member firm of the KPMG global organisation of independent member firms affiliated with KPMG International Limited, a private English company limited by guarantee. All rights reserved.

TOTAL MONTHLY MORTGAGE LENDING
SOURCE RESERVE BANK OF NEW ZEALAND STATISTICS:
0
1,000
2,000
3,000
4,000
5,000
6,000
7,000
8,000
9,000
10,000
JAN 19 MAR 19 MAY 19 JUL 19 SEP 19 NOV 19 JAN 20 MAR 20 MAY 20 JUL 20 SEP 20 NOV 20
$MILLIONS
15
TOTAL MONTHLY MORTGAGE LENDING
%
0 28
30
32
34
36
38
5,000
10,000
15,000
20,000
25,000
PROPORTION OF NEW LENDING INTEREST
ONLY – INVESTOR (%) (RHS)
PRINCIPAL AND INTEREST (LHS)
INTEREST ONLY (INCLUDING REVOLVING
CREDIT) (LHS)
SOURCE RESERVE BANK OF NEW ZEALAND STATISTICS:
$MILLIONS
SEP 18 DEC 18 MAR 19 JUN 19 SEP 19 DEC 19 MAR 20 JUN 20 SEP 20
16
18
20
22
24
26
SOURCE RESERVE BANK OF NEW ZEALAND STATISTICS:
INVESTOR LENDING (%) (RHS)
BUSINESS PURPOSES (LHS)
INVESTOR (LHS)
OTHER OWNER OCCUPIER (LHS)
FIRST HOME BUYER (LHS)
%
0
5,000
10,000
15,000
20,000
25,000
$MILLIONS
SEP 18 DEC 18 MAR 19 JUN 19 SEP 19 DEC 19 MAR 20 JUN 20 SEP 20
NEW MORTGAGE LENDING BY PAYMENT TYPE
NEW MORTGAGE LENDING BY BORROWER TYPE
16
14
FIPS 2020 | KPMG | 29
© 2021 KPMG, a New Zealand Partnership and a member firm of the KPMG global organisation of independent member firms affiliated with KPMG International Limited, a private English company limited by guarantee. All rights reserved.

The five major banks account for 89.46% of the total assets in the banking sector, and have contributed $28.58 billion towards the overall growth, although this is a decrease from the 89.73% of total assets reported in 2019. Kiwibank experienced the largest percentage growth of the major banks at 12.21% to $2.78 billion, double the proportion of the next largest increase made by Westpac at 6.06% ($6.43 billion). Of the non-major banks, BoC reported the largest percentage increase in total assets up 59.70% to $3.65 billion, surpassing their strong growth of 37.26% in 2019. MUFG reported the next highest growth of 21.03% ($1.13 billion), while Citibank experienced the opposite with a 20.90% ($432.18 million) decline in total assets, the largest decrease of all the survey participants.
• SEE FIGURE 4 – PAGE 9
Gross loans and advances (GLA) for the banking sector grew by 2.95% ($13.65 billion), compared with the previous years’ growth rate of 5.37% ($23.57 billion). Four of the five major banks increased their loan books, resulting in a combined growth rate of 2.20% ($9.19 billion), while the smaller banks collectively grew by 9.13% ($4.46 billion).
• SEE FIGURE 9 – PAGE 23
Of the five major banks who dominate the lending market, Kiwibank achieved the largest percentage growth with an increase of 8.91% or $1.83 billion.
4
9
In contrast, ANZ reported a decline of 0.06% ($84.00 million), and BNZ saw only 0.41% growth ($361.00 million), possibly suggesting that both banks have chosen to keep their lending flat. Of the non-major banks, BoC saw the largest rate of growth in their loan book of 62.9% ($1.21 billion), followed closely by JPM, who achieved an increase of 62.61% ($134.48 million). Meanwhile, four banks decreased their GLA, with Citibank’s loan book down by 23.45% ($141.46 million) and BoI’s reduced by 22.04% ($16.62 million), the largest decline in the banking sector.
• SEE FIGURE 7 – PAGE 23
Despite the larger loan book growth, non-major banks have only experienced marginal growth in overall market share, due to the major bank’s dominance over the banking sector. The smaller banks have increased their collective share of the GLA in the sector from 9.58% to 10.24%, while the major banks have seen a slight shift in market share in the opposite direction, down to 89.76% from 90.42% in 2019.
ANZ saw the largest change in market share of all the survey participants, down 85 bps from 2019; however, it remains the largest bank by a considerable margin with 28.04% of the total market share. BNZ has also maintained their position as the second largest bank, despite a considerable decrease in market share of 47 bps to 18.68%. Westpac managed to take up some market share from ANZ and BNZ, having achieved the largest growth of 32 bps to 18.66% market share.
7
Rabobank maintained its leading market share position as the largest non-major bank, and gained an additional 16 bps to reach a market share of 2.91%. BoC achieved the largest growth of all non-major banks, an increase of 24 bps to 0.66%, while Citibank experienced the largest share decline of the non-major banks, down 3 bps to 0.10%.
Funding costsFor the fourth consecutive year, the banking sector has achieved new record low funding costs, as interest rates continue to drop. Funding costs has been calculated as interest expense over average interest-bearing liabilities and has decreased by 61 bps to just 1.98% for the banking sector.
Of the 20 survey participants, 18 achieved decreases of their funding costs during 2020, while BoB and Rabobank were the only banks to experience increases, up by 8 bps (to 2.81%) and just 1 bp (to 2.20%) respectively. Conversely, BNZ and ANZ achieved the largest reductions in funding costs; each dropped 78 bps to 1.74% and 1.73% respectively. This reflects the cuts to the OCR made by the Reserve Bank of New Zealand (RBNZ) and the resulting low interest rate environment.
• SEE FIGURE 6 – PAGE 9
JPM has maintained its position as the bank with the lowest funding rates, at just 1.12% (a 36 bps decrease). Meanwhile BoC, who had the highest funding costs in 2019, has dropped down 68 bps to 2.90%, leaving BoI with the highest funding costs of 3.46% after a 7 bps dip from 2019.
6
30 | KPMG | FIPS 2020
© 2021 KPMG, a New Zealand Partnership and a member firm of the KPMG global organisation of independent member firms affiliated with KPMG International Limited, a private English company limited by guarantee. All rights reserved.

The banks have managed to maintain relatively flat interest-bearing liabilities, with a rise of only 4.03% ($18.71 million), compared to a significant drop in interest expense of 19.91% ($2.33 billion) to $9.38 billion. These movements show that the decline in funding costs is primarily driven by decreased interest expenses. The majority of the decrease can be attributed to the five major banks, who have achieved a combined decline of $2.32 billion or 22.15%, accounting for 99.60% of the overall $2.33 billion decrease.
The largest percentage decrease in interest expense was reported by Citibank, down 28.90% ($8.68 million), followed by ANZ, with a 28.30% ($0.93 billion) decline and BNZ, down 27.98% ($0.60 billion). On the reverse, BoC saw the most significant growth of the six banks that reported an increase in interest expense, with an increase of 24.95% ($15.12 million).
The large majority of banks seem to have benefitted from the actions of the RBNZ, with billions of dollars being shed off interest expenses across the banking sector while increasing interest bearing liabilities. Earlier in the year the RBNZ Governor floated the possibility of negative interest rates and with it the possibility of further reductions to the OCR, and while that subject has cooled a little and there remains few indicators of increases in sight, it is likely that 2021 will bring another record low year of funding costs.
Asset qualityAsset quality for the banking sector appears to have had a dramatic decrease in 2020 due to the 275.20% ($1.08 billion) increase in impaired asset expense to a total of $1.47 billion.
However, the movement reflects a rise in provisions and the industry’s models concerns regarding an increased risk of future defaults following Covid-19 lockdowns and the expected worsening of economic conditions. The worsening has not to date been as extreme as forecast. The seven banks that reported a decrease in their impaired asset expense all had balance dates of 31 March 2020 or earlier. Many survey participants have commented that the increase in impaired asset expense and provisions reported by the banking sector may not provide a true reflection of the actual experience of all survey participants to date with actual past dues and arrears remaining at all time low levels. However, the impaired asset expense may have been much greater during this time had it not been for the Government’s support offered – i.e. the wage subsidy in particular. This probably shows that the models did not and could not account for the level of support provided as nothing of that nature had ever been seen before.
• SEE FIGURE 8 – PAGE 23
The major banks saw some of the highest increases in impaired asset expenses in monetary and percentage change terms, contributing a combined $1.06 billion (330.53%) of the $1.08 billion (275.20%) increase. Westpac’s impaired asset expense increased by a whopping 3,300.00%, or $330.00 million, from a $10.00 million recovery in 2019. The next largest percentage increase was Kiwibank’s rise of 325.00% ($39.00 million), closely followed by ANZ’s 305.05% growth of $302.00 million. BNZ had the largest reported amount in 2019 at $114.00 million, and despite a 163.16% increase, now has the lowest impaired asset expense of the big four banks.
8
ANZ’s percentage growth in impairment expense of 305.05% has surpassed BNZ and it has taken the lead with the highest impaired asset expense in 2020 at $401.00 million.
One of the key comments made by many survey participants is that models, being forward looking, are driving large provisions when loaded with negative forecast data, ahead of the impact showing up in the ‘live’ book. This indicates that the ‘live’ book is not bearing out the full seriousness of the model forecasting, yet …
As with NPAT, banks with different year-ends have reflected different stages of the impact of Covid-19. The eight banks with December year-ends (before Covid-19 had reached New Zealand), reported a combined decrease of 113.05% ($31.49 million), while the six banks with March year-ends saw impaired asset expenses increase by 181.58% ($42.09 million). The five major banks and Heartland who have June and September year-ends saw the largest increases, with a combined rise of 313.22% ($1.07 billion), reflecting the ongoing impacts of Covid-19. It is worth noting that at most the September balance dates realistically only include six months of Covid-19’s impact.
Some 13 of the 20 survey participants saw increases in total provisions as a percentage of GLA, with an overall rise of 20 bps to 0.67%, attributable to sharp increases in both specific and general provisions. Specific provisioning increased by 43.81% ($181.74 million) to $596.55 million, with notable increases from all of the big four Australian-owned banks. Westpac stood out with the biggest percentage increase of the four, with an increase of 160.71% ($45.00 million); however, they had the lowest specific provisions of the four in 2019 leading into the pandemic.
FIPS 2020 | KPMG | 31
© 2021 KPMG, a New Zealand Partnership and a member firm of the KPMG global organisation of independent member firms affiliated with KPMG International Limited, a private English company limited by guarantee. All rights reserved.

BNZ had the highest increase in specific provisioning, with a $80.00 million increase to $237.00 million.
Collective provisioning increased 49.39% ($861.66 million) to a total of $2.61 billion for the banking sector as a whole, with only two survey participants having reported decreases. All of the major banks saw significantly rises in their collective provisions, with a combined increase of $806.00 million (51.08%). Westpac had the most noticeable increase in collective provisioning of 82.25% ($241.00 million), while Kiwibank had the largest percentage increase of all the banks at 127.03% ($47.00 million) to $84.00 million.
Taking a closer look at the smaller banks, TSB recorded the largest percentage increase in specific provisioning, an increase of 2,276.05% ($9.22 million) from $405,000 to $9.62 million. On the opposite side of the spectrum, BoC decreased their specific provisioning by 81.24% to $3.68 million, with the movement being driven by a $15.93 million reversal of previous impairment losses. ICBC had a similar reduction, a major drop of 80.02% ($16.00 million) to $4.00 million, for similar reasons, but it is also worth noting that both banks have a December year-end and would have completed their financial statements before the impact of Covid-19 was apparent.
The two Indian banks recorded the biggest percentage increase in collective provisions; BoI increased by 117.86% ($330,000), and BoB rose 101.90% ($215,000). HSBC and Kookmin were the only banks to report decreases in their collective provisioning, down 46.49% ($1.64 million) and 14.85% ($53,000) respectively, although both have December year-ends and their financial results will not yet reflect the full impacts of the Covid-19 related lockdowns.
Of the 12 survey participants that have reported past due assets, there was a combined increase of 81.70% ($629.66 million) across the banking sector, to a total of $1.40 billion in 2020. All five major banks reported increases in their past due assets, with Westpac recording the largest increase of 203.54% ($230.00 million) to $343.00 million, consistent with their significant increases in provisioning. Westpac was closely followed by ASB, who saw an increase of 172.63% ($164.00 million) in past due assets to $259.00 million. The large increases in past due assets illustrate the impact that the pandemic has had on borrowers’ ability to make loan payments. Of the seven remaining banks that report past due assets, five experienced decreases and had December or March year-ends.
TSB, with a March year end saw the largest reduction in past due assets of $4.69 million (74.23%), while Heartland with a June year-end saw the largest increase of 33.32% ($14.81 million).
What is clear from the provisioning exercise(s) conducted at the banks is that:
1. no one really was able to predict the exact outcome of the early stages of the pandemic;
2. some of the predictions around the extent and timing of any bounce back were similarly hard to assess;
3. the models were not designed for the volatility we have seen;
4. we really do not know if we have seen the full impact yet or when we will; and
5. a further lockdown could cause further shocks to the modelling.
Operating expensesThis year’s results show a significant increase to the cost to income ratio (CIR), up 503 bps to 43.44% from 38.41% in 2019, this is on the back of a 46 bps increase last year. The increase is largely due to a surge in operating expenses, which rose by 9.04% to $5.87 billion, and is further worsened by the decrease in operating income of 3.59% to 13.51 billion.
TABLE 6: MAJOR BANKS – PERSONNEL COST
Entity26
2020 2019
Employee numbers
Personnel cost
$Million
Cost/average
employees $000's
Employee numbers
Personnel cost
$Million
Cost/average
employees $000's
ANZ 6,937 989 141 7,114 922 127
ASB 5,320 630 119 5,229 552 108
BNZ 4,720 574 124 4,503 521 113
Kiwibank 1,720 187 114 1,550 161 106
Westpac 4,355 544 129 4,105 523 127
32 | KPMG | FIPS 2020
© 2021 KPMG, a New Zealand Partnership and a member firm of the KPMG global organisation of independent member firms affiliated with KPMG International Limited, a private English company limited by guarantee. All rights reserved.

The decrease in operating income of $0.50 billion is primarily driven by the decline in non-interest income of $0.45 billion (14.50%), while the majority of the increase in operating expenses is attributable to personnel expense increasing by $267.55 million (9.02%).
• SEE FIGURE 13 – PAGE 28
Of the major banks, Kiwibank experienced the most significant rise, having increased their CIR by 763 bps to 72.69%, the highest of the major banks and second highest of all of the survey participants. Kiwibank’s result was due to higher operating expenses which were up 14.86% to $52.00 million without a proportionate growth in operating income. The increase was driven by a rise in impaired asset expense of 325.00% ($39.00 million) as well as personnel expense having risen by 16.15% ($26.00 million).
CCB saw the largest reduction in their CIR, dropping a significant 1,065 bps (from 47.10% to 36.45%), largely driven by a rise in operating income of 38.52% to $46.92 million. In contrast, BoI saw the largest increase in its CIR, a massive rise of 2,828 bps from 71.21% to 99.49%, a level significantly higher than any other survey participant. The increase was driven by significant reductions in operating income of 20.21%, caused by a decrease in interest income of $1.07 million; and amplified by an 11.48% increase in operating expenses largely caused by a 179.66% increase in impaired asset expense.
Of the major banks, ASB saw the second largest increase in operating expenses, a growth of 14.84% which resulted in a $137.00 million increase in expenditure, behind Kiwibank who experienced a 14.86% ($52.00 million) rise.
13
All five major banks experienced increases in their operating expenses, with some of this additional cost potentially attributable to setting up staff to work from home and the impact of regulatory compliance. JPM saw the greatest increase in operating expenses, rising 19.45% to $15.11 million, closely followed by Heartland’s increase of 19.23% to $86.33 million.
Only two of the 20 banks surveyed achieved decreases in their operating expenses (excluding amortisation), being Citibank and The Co-operative Bank, who reduced their operating expenses by 6.73% ($1.37 million) and 1.60% ($0.94 million) respectively.
Personnel expenses rose by 9.02% ($267.55 million), and was a key driver for the increase in operating expenses (excluding amortisation), attributable for half of the increase witnessed. The major banks all saw increases in personnel expenses, up by a combined $245.00 million (9.15%), with some of this cost likely attributable to increasing compliance staff numbers. Of all the survey participants, CCB, BoB and Kookmin saw the largest increases in personnel expenses, rising by 25.33% ($2.50 million), 23.23% ($328,000) and 21.69% ($310,000) respectively. The increase is likely due to a rise in headcount. Following from the previous period, JPM again saw the largest decrease in staff expense, down 21.46% to $1.06 million. BoI was the only other bank to report a decrease in personnel expenditure, down 11.66% to $1.05 million, due to decreased staff numbers.
Return on equity/Return on assetsThe banking sector has reported a considerable decline in its return on equity (ROE) ratio of 432 bps to 9.21%, reaching the lowest ROE that the survey has seen in over a decade.
The combination of the decrease in NPAT of 27.57% ($1.58 billion) and the increase in total equity of 6.59% ($2.87 billion) saw the decay of what had been a few years of strong growth in banks’ ROE. This movement is likely also influenced by the RBNZ ceasing the payment of dividends in April due to the economic uncertainty arising from Covid-19, and requiring banks to retain any profits that they produced during the period27.
HSBC saw the largest reduction in ROE of all the survey participants, with a 3,978 bps decline to 161.10%, but still has the highest ROE of the banks by a significant margin. Kookmin also had a notable decrease of 1,887 bps to 76.63%; however, it maintained the second highest ROE after HSBC, which is still a great deal higher than any of the remaining banks. BoC, on the other hand, saw a significant increase in ROE of 1,025 bps to 13.13%, driven by its significant increase in profits from the previous year. It is worth noting that these banks have December year-ends, and were likely able to distribute dividends before April.
All five major banks experienced sizable reductions in ROE. Westpac experienced the largest reduction of 556 bps to a ROE of 7.69%, followed closely by ANZ’s decrease of 527 bps to 10.04%. Due to ANZ’s large decrease, ASB now holds the highest ROE among the major banks at 11.10% after a lesser decline of 399 bps.
Out of the 19 survey participants that report ROE, 17 banks had an increase in total equity in 2020. Kookmin saw the largest percentage increase in total equity of 41.35% ($1.90 million) to $6.50 million. Only two banks, HSBC and Heartland, saw decreases in total equity of 7.04% ($1.82 million) and 1.05% ($6.35 million) respectively.
FIPS 2020 | KPMG | 33
© 2021 KPMG, a New Zealand Partnership and a member firm of the KPMG global organisation of independent member firms affiliated with KPMG International Limited, a private English company limited by guarantee. All rights reserved.

Of the major banks, ANZ saw both the largest percentage increase and dollar increase, up 11.20% ($1.41 billion) from last year to $14.01 billion, while ASB remained flat with just a 0.73% ($58.00 million) rise. The increase in total equity shows the amplified level of caution that the banks have taken in 2020 to ensure that they are prepared in the case of a major economic downturn.
The return on assets (ROA) ratio for the banking sector decreased by 33 bps in 2020 to 0.71%, again mirroring the witnessed decrease in NPAT, while total tangible assets have increased at 5.90% ($33.65 billion), driving the decrease in ROA. Only four banks achieved increases in their ROA, and each of these has a December year-end. BoC saw the largest increase of 71 bps to 1.03%, followed closely by ICBC’s 65 bps increase to 1.04%. Meanwhile, BoI recorded the largest decrease, with a 69 bps decline to 0.29%, the third lowest ROA of the banks.
All five of the major banks saw a reduction in their ROA, and Westpac experienced the largest decline in ROA of 50 bps to 0.62%. ASB has held the highest ROA of the major banks at 0.80%, having slid just 36 bps.
• SEE FIGURE 12 – PAGE 28
Funds under managementThe combined funds under management (FUM) for the major banks has increased from the previous year by 4.58% ($3.55 billion). The rate of growth has slowed compared to the 11.85% ($8.21 billion) increase reported in 2019. It is likely that this slowing is primarily due to the impacts of Covid-19, prompting New Zealanders to move $1.4 billion to
12
low risk KiwiSaver funds in March, and potentially ensuring loses by missing the market recovery29.
BNZ was the only major bank to have reported a decrease in FUM for the period, experiencing a 5.47% reduction to $7.78 billion, while ASB maintained the highest percentage growth, with their FUM up by 12.45% ($2.05 billion) over the year. Kiwibank achieved the second highest percentage increase of 6.06% to $4.44 billion and remains the lowest of the major banks due to KiwiWealth also managing funds within the Kiwi Group Holdings. ANZ maintains the highest level of FUM of the major banks, at $35.22 billion (up 3.16%), accounting for 43.47% of the major banks FUM (see table 7).
Capital adequacy ratioThe majority of the 20 survey participants reported increases in their capital adequacy ratio for 2020, while eight reported decreases. Increases were reported by all of the big four banks as they work towards meeting their higher capital bank requirements, despite the extension provided. Due to the impacts of Covid-19, the RBNZ extended the start date of the implementation period, to allow banks headroom to respond to the effects of the pandemic and support economic recovery30.
Ten of the survey participants reported increases in their Tier 1 capital ratio, but only three of the big four banks
reported increases while ANZ’s Tier 1 ratio remained flat at 13.20% year-on-year. Of the remaining banks that reported increases, BoI reported the largest Tier 1 ratio movement, an 800 bps rise to 79.00%. Of the nine banks that reported decreased Tier 1 ratios, BoB experienced the greatest decline, down 520 bps to 64.70%. Despite the large bps movements, BoB has maintained the second highest Tier 1 ratio, while BoI remains the highest, although there is still a massive gap between BoI, BoB and the next bank.
The RBNZ’s latest stress test commenced in March and was based on the economic outlook early on during the pandemic, to highlight the difficulties banks faced when presented with the shocks of Covid-19. However, the results showed that the banking system has a good level of resilience and remains in a good position to maintain lending to support the economy without falling below minimum capital requirements. One does wonder how much of this is due to the Government’s stimulus packages that supported the economy. Only in the event of a very severe, but low likelihood scenario, would the banks be expected to fall below the minimum regulatory capital requirements without mitigating actions, such as capital injections.
TABLE 7: MAJOR BANKS – FUNDS MANAGEMENT ACTIVITIES
Entity26 2020 $Million
2019 $Million
Movement
ANZ 35,223 34,145 3.16%
ASB 18,500 16,452 12.45%
BNZ 7,359 7,785 -5.47%
Kiwibank28 4,707 4,438 6.06%
Westpac 15,246 14,668 3.94%
Total 81,035 77,488 4.58%
34 | KPMG | FIPS 2020
© 2021 KPMG, a New Zealand Partnership and a member firm of the KPMG global organisation of independent member firms affiliated with KPMG International Limited, a private English company limited by guarantee. All rights reserved.

The imminent changes to capital adequacy requirementsIn December 2019, the Reserve Bank of New Zealand (RBNZ) reached final decisions from their Capital Review, also entitled the ‘2019 reforms’. As part of the enactment of the 2019 reforms, the RBNZ is consulting with the banks on the ‘exposure draft’ of revised documents from the Banking Supervision Handbook. The RBNZ intends to make final decisions and publish the finalised set of the capital requirements before 1 July 2021. In assisting the banks to further cushion the economic uncertainty and other increased priorities internally, the RBNZ had delayed the increase in the prudential capital buffer for banks until July 2022. However, other aspects of the 2019 reforms are due to be implemented from 1 July 2021.
One of the fundamental reasons for the new capital requirements is aimed at making the banking system safer and resilient to endure economic volatility. There is a current muted suggestion from some parts of the banking sector that the banks are already holding sufficient capital given that we have recently gone through a pandemic (potentially a 1 in 200-year event) and they did not experience significant shifts in their capital ratios. While the stability of bank capital ratios is a fact, it is important to remember that government intervention and the restriction on profit distribution over the period actually caused a capital ratio increase. The impact of the assistance programme is sitting on the Government’s balance sheet, and together with the restrictions on profit distribution, has flowed to the capital ratio. We may not yet have seen the full impact of the Covid-19 pandemic. Therefore, the question as to whether there is still a need to implement these increases to the capital requirements is an interesting one.
From the stress tests that the RBNZ carried out in September 2020, the RBNZ is clearly of the view that the banks are currently well positioned
to continue lending to support the economy, albeit with significant levels of government intervention in the economy. In the most severe scenario they modelled (1 in 200-year event), bank capital levels would fall below the minimum requirements which they point to as demonstrating that the increase in the level of capital requirements is still necessary.
Currently, the planned changes to the capital adequacy requirements are here to stay, albeit over a revised timeframe.
In addition, the most recent consultation also seeks feedback on some new policy decisions as a result of the Capital Review. These policy decisions include:
— changes to restrictions on distributions;
— supervisory actions in response to any buffer breaches;
— inclusion of term sheets outlining qualifying financial instruments; and
— proposed replacement to the non-objection process.
Separately, the Banking Supervision Handbook has also been renamed to the Banking Prudential Requirements (BPR) to better reflect its intended purpose. Some of the changes include an overall restructure of the document with some minor changes and clarifications of the existing standards. Whilst the intention of the update is meant to be minor and to reduce ambiguity, the changes in some of the new text may bring new meaning and provoke new interpretations of the standard. Banks will need to consider how these changes could affect their current interpretation of the standards and if there are other downstream effects relating to their current obligations register and associated processes. It is also recommended that the banks review the latest consultation and provide feedback, especially in circumstances where more details or clarifications are still required. The responses on these consultations are due 31 March 2021.
Focus on capital
Rajesh MegchianiPartner – Risk Consulting KPMG
Rajesh leads the team at KPMG that provides financial risk management advice. Rajesh’s team advises clients on prudential regulations, market risk, credit risk and liquidity risk.
Dhayaparan RamanSenior Manager – Risk Consulting KPMG
Dhayaparan is a quantitative risk consultant with valuable experience in provisioning and credit risk models, statistical analyses tools, and financial services’ prudential guidelines.
FIPS 2020 | KPMG | 35
© 2021 KPMG, a New Zealand Partnership and a member firm of the KPMG global organisation of independent member firms affiliated with KPMG International Limited, a private English company limited by guarantee. All rights reserved.

36 | KPMG | FIPS 2020
© 2021 KPMG, a New Zealand Partnership and a member firm of the KPMG global organisation of independent member firms affiliated with KPMG International Limited, a private English company limited by guarantee. All rights reserved.
Analysis of financial statements Size & strength measures Growth measures
Entity25
Location of head office
Balance date
Survey year
Rank by total assets
Total assets*$Million
Net assets$Million
Total capital adequacy
ratio %
Tier 1 capital adequacy
ratio %
Net loans and advances
$Million
Customer deposits$Million
Number of employees
Number of branches
Number of owned ATMs
Increase in net profit after tax
%
Increase in underlying
profit%
Increase in total assets
%
Australia and New Zealand Banking Group Limited – ANZ New Zealand
Wellington30-Sep-2020 2020 1 177,005 10,928 16.40 13.20 133,572 120,863 6,937 141 548 (26.79) (23.98) 5.83 30-Sep-2019 2019 1 167,256 9,363 15.30 13.20 133,665 109,107 7,114 164 576 (8.11) (9.45) 5.74
Bank of Baroda (New Zealand) Limited Auckland31-Mar-2020 2020 19 132 49 64.70 64.70 100 80 20 3 3 (1.55) (11.01) 5.28 31-Mar-2019 2019 19 125 48 69.90 69.90 101 75 20 3 3 (20.73) (13.24) 8.09
Bank of China New Zealand Banking Group Auckland31-Dec-2019 2020 12 3,651 249 15.51 13.02 3,138 529 92 1 - 392.24 394.52 59.70 31-Dec-2018 2019 14 2,286 218 14.16 11.99 1,909 355 66 1 - 1,000.00 407.22 37.26
Bank of India (New Zealand) Limited Auckland31-Mar-2020 2020 20 86 55 79.00 79.00 59 13 9 2 - (73.52) (73.55) (2.95)31-Mar-2019 2019 20 89 55 71.00 71.00 75 13 11 3 - 15.54 15.39 (13.40)
Bank of New Zealand Auckland30-Sep-2020 2020 4 112,295 8,642 14.91 13.17 88,822 67,580 4,720 145 639 (25.44) (23.01) 2.93 30-Sep-2019 2019 2 109,097 7,918 13.90 12.30 88,541 63,065 4,503 153 657 (0.68) 7.94 9.49
China Construction Bank Corporation New Zealand Banking Group
Auckland31-Dec-2019 2020 13 3,066 234 17.30 14.50 2,312 312 65 - - 72.37 71.85 18.98 31-Dec-2018 2019 13 2,577 216 16.23 13.92 1,937 235 61 - - 10.08 10.56 41.10
Citibank, N.A. New Zealand Branch and Associated Banking Group
Auckland31-Dec-2019 2020 17 1,719 187 15.66 14.26 462 1,058 27 1 - 4.16 4.63 (20.09)31-Dec-2018 2019 15 2,151 186 15.59 14.17 603 1,083 27 1 - (9.31) (9.75) 5.20
Commonwealth Bank of Australia New Zealand Operations
Auckland30-Jun-2020 2020 2 113,179 7,705 17.50 13.90 93,771 69,102 5,320 109 267 (26.46) (23.86) 6.02 30-Jun-2019 2019 3 106,752 7,609 15.50 12.70 90,760 61,908 5,229 120 455 6.65 6.87 5.68
Heartland Bank Limited Auckland30-Jun-2020 2020 11 4,285 567 12.67 12.67 3,712 3,269 402 4 - (11.13) (7.52) 4.15 30-Jun-2019 2019 11 4,114 574 13.49 13.49 3,643 3,154 439 4 - 1.16 (1.66) (7.57)
Industrial and Commercial Bank of China (New Zealand) Limited
Auckland31-Dec-2019 2020 15 2,282 257 15.90 13.32 1,726 815 65 1 - 211.93 210.27 6.82 31-Dec-2018 2019 16 2,136 234 18.19 14.21 1,701 636 62 1 - 714.26 352.47 28.51
JPMorgan Chase Bank, N.A., New Zealand Banking Group
Wellington31-Dec-2019 2020 16 2,004 - 16.90 16.30 349 234 9 - - (15.89) (8.58) 10.99 31-Dec-2018 2019 17 1,806 (0) 15.90 15.50 215 201 9 - - 63.83 63.61 14.82
Kiwibank Limited Wellington30-Jun-2020 2020 5 25,510 1,570 12.60 12.60 22,306 20,433 1,720 193 221 (47.22) (43.18) 12.21 30-Jun-2019 2019 5 22,734 1,549 14.50 13.70 20,480 18,230 1,550 219 221 (6.09) (1.68) 9.75
Kookmin Bank Auckland Branch Auckland31-Dec-2019 2020 18 493 6 15.85 14.68 317 229 14 1 - 5.30 4.05 10.12 31-Dec-2018 2019 18 448 5 15.52 14.33 296 212 13 1 - 15.08 14.17 5.29
MUFG Bank, Ltd., Auckland Branch Auckland31-Mar-2020 2020 9 6,516 222 14.43 12.29 5,182 1,063 17 1 - 18.52 19.94 21.03 31-Mar-2019 2019 9 5,383 189 14.42 12.46 4,691 705 17 1 - 18.78 21.08 32.69
Coöperatieve Rabobank U.A. New Zealand Banking Group
Wellington31-Dec-2019 2020 6 16,756 2,020 25.20 18.80 13,843 5,475 385 32 - (10.04) (12.23) 3.70 31-Dec-2018 2019 6 16,158 1,890 26.60 19.50 12,716 4,706 343 32 - 9.08 9.07 5.81
Southland Building Society Invercargill31-Mar-2020 2020 10 4,930 320 13.80 11.10 4,191 3,513 540 16 - (39.16) (47.13) 3.95 31-Mar-2019 2019 10 4,742 313 14.18 11.41 4,006 3,381 524 16 - 15.58 15.90 6.63
The Co-operative Bank Limited Wellington31-Mar-2020 2020 14 2,980 202 16.30 14.00 2,570 2,405 331 31 - (29.91) (18.38) 6.95 31-Mar-2019 2019 12 2,786 198 17.10 14.60 2,466 2,321 324 33 - (8.67) (3.65) 5.98
The Hongkong and Shanghai Banking Corporation Limited, New Zealand Banking Group
Auckland31-Dec-2019 2020 8 6,628 10 21.00 18.80 4,659 3,538 226 1 - (21.89) (21.84) 10.17 31-Dec-2018 2019 8 6,016 12 19.80 17.80 4,128 3,059 227 1 - 9.15 8.75 (5.86)
TSB Bank LimitedNew
Plymouth
31-Mar-2020 2020 7 8,179 680 14.32 14.32 6,165 7,421 486 25 43 (31.58) (31.22) 4.61 31-Mar-2019 2019 7 7,819 653 14.57 14.57 5,820 7,093 483 26 40 (13.17) (11.83) 5.43
Westpac Banking Corporation – New Zealand Banking Group
Auckland30-Sep-2020 2020 3 112,671 8,520 16.40 13.20 88,888 70,974 4,355 143 495 (39.68) (36.87) 6.06 30-Sep-2019 2019 4 106,237 8,132 15.60 12.80 84,919 64,464 4,105 155 513 1.07 1.07 10.51
Banking sector total 2020 604,367 42,424 n/a n/a 476,143 378,903 25,740 850 2,216 (27.57) (25.13) 5.90 2019 570,713 39,362 n/a n/a 462,673 344,001 25,127 934 2,465 (0.88) 0.48 7.73
* Total Assets = Total Assets - Goodwill - Other Intangiblesn/a = not applicable
Analysis of annual results

FIPS 2020 | KPMG | 37
© 2021 KPMG, a New Zealand Partnership and a member firm of the KPMG global organisation of independent member firms affiliated with KPMG International Limited, a private English company limited by guarantee. All rights reserved.
Analysis of financial statements Size & strength measures Growth measures
Entity25
Location of head office
Balance date
Survey year
Rank by total assets
Total assets*$Million
Net assets$Million
Total capital adequacy
ratio %
Tier 1 capital adequacy
ratio %
Net loans and advances
$Million
Customer deposits$Million
Number of employees
Number of branches
Number of owned ATMs
Increase in net profit after tax
%
Increase in underlying
profit%
Increase in total assets
%
Australia and New Zealand Banking Group Limited – ANZ New Zealand
Wellington30-Sep-2020 2020 1 177,005 10,928 16.40 13.20 133,572 120,863 6,937 141 548 (26.79) (23.98) 5.83 30-Sep-2019 2019 1 167,256 9,363 15.30 13.20 133,665 109,107 7,114 164 576 (8.11) (9.45) 5.74
Bank of Baroda (New Zealand) Limited Auckland31-Mar-2020 2020 19 132 49 64.70 64.70 100 80 20 3 3 (1.55) (11.01) 5.28 31-Mar-2019 2019 19 125 48 69.90 69.90 101 75 20 3 3 (20.73) (13.24) 8.09
Bank of China New Zealand Banking Group Auckland31-Dec-2019 2020 12 3,651 249 15.51 13.02 3,138 529 92 1 - 392.24 394.52 59.70 31-Dec-2018 2019 14 2,286 218 14.16 11.99 1,909 355 66 1 - 1,000.00 407.22 37.26
Bank of India (New Zealand) Limited Auckland31-Mar-2020 2020 20 86 55 79.00 79.00 59 13 9 2 - (73.52) (73.55) (2.95)31-Mar-2019 2019 20 89 55 71.00 71.00 75 13 11 3 - 15.54 15.39 (13.40)
Bank of New Zealand Auckland30-Sep-2020 2020 4 112,295 8,642 14.91 13.17 88,822 67,580 4,720 145 639 (25.44) (23.01) 2.93 30-Sep-2019 2019 2 109,097 7,918 13.90 12.30 88,541 63,065 4,503 153 657 (0.68) 7.94 9.49
China Construction Bank Corporation New Zealand Banking Group
Auckland31-Dec-2019 2020 13 3,066 234 17.30 14.50 2,312 312 65 - - 72.37 71.85 18.98 31-Dec-2018 2019 13 2,577 216 16.23 13.92 1,937 235 61 - - 10.08 10.56 41.10
Citibank, N.A. New Zealand Branch and Associated Banking Group
Auckland31-Dec-2019 2020 17 1,719 187 15.66 14.26 462 1,058 27 1 - 4.16 4.63 (20.09)31-Dec-2018 2019 15 2,151 186 15.59 14.17 603 1,083 27 1 - (9.31) (9.75) 5.20
Commonwealth Bank of Australia New Zealand Operations
Auckland30-Jun-2020 2020 2 113,179 7,705 17.50 13.90 93,771 69,102 5,320 109 267 (26.46) (23.86) 6.02 30-Jun-2019 2019 3 106,752 7,609 15.50 12.70 90,760 61,908 5,229 120 455 6.65 6.87 5.68
Heartland Bank Limited Auckland30-Jun-2020 2020 11 4,285 567 12.67 12.67 3,712 3,269 402 4 - (11.13) (7.52) 4.15 30-Jun-2019 2019 11 4,114 574 13.49 13.49 3,643 3,154 439 4 - 1.16 (1.66) (7.57)
Industrial and Commercial Bank of China (New Zealand) Limited
Auckland31-Dec-2019 2020 15 2,282 257 15.90 13.32 1,726 815 65 1 - 211.93 210.27 6.82 31-Dec-2018 2019 16 2,136 234 18.19 14.21 1,701 636 62 1 - 714.26 352.47 28.51
JPMorgan Chase Bank, N.A., New Zealand Banking Group
Wellington31-Dec-2019 2020 16 2,004 - 16.90 16.30 349 234 9 - - (15.89) (8.58) 10.99 31-Dec-2018 2019 17 1,806 (0) 15.90 15.50 215 201 9 - - 63.83 63.61 14.82
Kiwibank Limited Wellington30-Jun-2020 2020 5 25,510 1,570 12.60 12.60 22,306 20,433 1,720 193 221 (47.22) (43.18) 12.21 30-Jun-2019 2019 5 22,734 1,549 14.50 13.70 20,480 18,230 1,550 219 221 (6.09) (1.68) 9.75
Kookmin Bank Auckland Branch Auckland31-Dec-2019 2020 18 493 6 15.85 14.68 317 229 14 1 - 5.30 4.05 10.12 31-Dec-2018 2019 18 448 5 15.52 14.33 296 212 13 1 - 15.08 14.17 5.29
MUFG Bank, Ltd., Auckland Branch Auckland31-Mar-2020 2020 9 6,516 222 14.43 12.29 5,182 1,063 17 1 - 18.52 19.94 21.03 31-Mar-2019 2019 9 5,383 189 14.42 12.46 4,691 705 17 1 - 18.78 21.08 32.69
Coöperatieve Rabobank U.A. New Zealand Banking Group
Wellington31-Dec-2019 2020 6 16,756 2,020 25.20 18.80 13,843 5,475 385 32 - (10.04) (12.23) 3.70 31-Dec-2018 2019 6 16,158 1,890 26.60 19.50 12,716 4,706 343 32 - 9.08 9.07 5.81
Southland Building Society Invercargill31-Mar-2020 2020 10 4,930 320 13.80 11.10 4,191 3,513 540 16 - (39.16) (47.13) 3.95 31-Mar-2019 2019 10 4,742 313 14.18 11.41 4,006 3,381 524 16 - 15.58 15.90 6.63
The Co-operative Bank Limited Wellington31-Mar-2020 2020 14 2,980 202 16.30 14.00 2,570 2,405 331 31 - (29.91) (18.38) 6.95 31-Mar-2019 2019 12 2,786 198 17.10 14.60 2,466 2,321 324 33 - (8.67) (3.65) 5.98
The Hongkong and Shanghai Banking Corporation Limited, New Zealand Banking Group
Auckland31-Dec-2019 2020 8 6,628 10 21.00 18.80 4,659 3,538 226 1 - (21.89) (21.84) 10.17 31-Dec-2018 2019 8 6,016 12 19.80 17.80 4,128 3,059 227 1 - 9.15 8.75 (5.86)
TSB Bank LimitedNew
Plymouth
31-Mar-2020 2020 7 8,179 680 14.32 14.32 6,165 7,421 486 25 43 (31.58) (31.22) 4.61 31-Mar-2019 2019 7 7,819 653 14.57 14.57 5,820 7,093 483 26 40 (13.17) (11.83) 5.43
Westpac Banking Corporation – New Zealand Banking Group
Auckland30-Sep-2020 2020 3 112,671 8,520 16.40 13.20 88,888 70,974 4,355 143 495 (39.68) (36.87) 6.06 30-Sep-2019 2019 4 106,237 8,132 15.60 12.80 84,919 64,464 4,105 155 513 1.07 1.07 10.51
Banking sector total 2020 604,367 42,424 n/a n/a 476,143 378,903 25,740 850 2,216 (27.57) (25.13) 5.90 2019 570,713 39,362 n/a n/a 462,673 344,001 25,127 934 2,465 (0.88) 0.48 7.73
* Total Assets = Total Assets - Goodwill - Other Intangiblesn/a = not applicable

38 | KPMG | FIPS 2020
© 2021 KPMG, a New Zealand Partnership and a member firm of the KPMG global organisation of independent member firms affiliated with KPMG International Limited, a private English company limited by guarantee. All rights reserved.
Analysis of financial statements Credit quality measures Profitability measures Efficiency measures
Entity25 Survey year
Impaired asset
expense $Million
Past due assets
$Million
Gross impaired
assets $Million
Individual provision
for doubtful
debts/Gross
impaired assets
%
Collective provision/Net loans
and advances
%
Total provision
for doubtful
debts/Gross
loans and advances
%
Impaired asset
expense/Average
gross loans and advances
%
Total operating
income$Million
Net interest
income/Average
total assets
%
Interest margin
%
Interest spread
%
Non-interest
income/Average
total assets
%
Net profit
after tax$Million
Net profit after tax/
Average equity
%
Net profit after tax/
Average total
assets%
Underlying profit
$Million
Underlying profit/
Average total
assets%
Operating expenses*/
Average total
assets%
Operating expenses*/
Operating income
%
Australia and New Zealand Banking Group Limited – ANZ New Zealand
2020 401 525 363 29.48 0.44 0.52 0.30 4,020 1.88 2.02 1.75 0.46 1,336 10.04 0.78 1,893 1.10 1.00 42.94 2019 99 334 287 34.15 0.30 0.37 0.08 4,198 1.99 2.14 1.80 0.59 1,825 15.31 1.12 2,490 1.53 0.99 38.33
Bank of Baroda (New Zealand) Limited2020 0 - - n/a 0.43 0.43 0.22 4 2.56 2.69 1.51 0.89 1 1.84 0.69 1 0.94 2.34 67.73 2019 0 - - n/a 0.21 0.21 0.01 4 2.60 2.66 1.47 1.02 1 1.90 0.75 1 1.13 2.49 68.68
Bank of China New Zealand Banking Group2020 (14) - 8 46.37 0.28 0.40 (0.55) 49 1.40 1.39 1.01 0.26 31 13.13 1.03 43 1.45 0.68 40.94 2019 13 - 33 59.81 0.39 1.40 0.76 39 1.55 1.57 1.10 0.42 6 2.88 0.32 9 0.44 0.88 44.72
Bank of India (New Zealand) Limited2020 (0) - 2 - 1.04 1.04 (0.49) 3 3.26 3.31 1.07 0.51 0 0.45 0.29 0 0.40 3.76 99.49 2019 (0) - - n/a 0.37 0.37 (0.14) 4 3.76 3.83 1.75 0.56 1 1.73 0.98 1 1.37 3.08 71.21
Bank of New Zealand2020 300 175 600 39.50 0.76 1.02 0.34 2,539 1.88 2.07 1.85 0.41 762 9.19 0.69 1,245 1.12 0.90 39.15 2019 114 146 653 24.04 0.56 0.74 0.13 2,656 1.97 2.16 1.88 0.57 1,022 13.35 0.98 1,617 1.55 0.89 34.83
China Construction Bank Corporation New Zealand Banking Group
2020 2 - - n/a 0.36 0.36 0.10 47 1.27 1.30 1.12 0.39 20 8.81 0.70 28 0.98 0.61 36.45 2019 2 - - n/a 0.31 0.31 0.10 34 1.48 1.52 1.29 0.05 12 5.45 0.52 16 0.73 0.72 47.10
Citibank, N.A. New Zealand Branch and Associated Banking Group
2020 0 - - n/a - - 0.02 43 0.69 0.69 0.57 1.52 17 9.12 0.88 24 1.23 0.98 44.25 2019 0 - - n/a - - 0.03 43 0.92 0.92 0.77 1.14 16 8.60 0.78 23 1.08 0.97 47.03
Commonwealth Bank of Australia New Zealand Operations
2020 310 259 406 33.25 0.54 0.68 0.34 2,685 1.86 1.90 1.59 0.58 884 11.10 0.80 1,315 1.20 0.96 39.48 2019 106 95 370 18.65 0.38 0.46 0.12 2,756 1.96 2.01 1.67 0.69 1,202 15.09 1.16 1,727 1.66 0.89 33.49
Heartland Bank Limited2020 29 59 25 21.49 1.55 1.69 0.80 203 4.50 4.66 4.28 0.33 61 10.11 1.45 87 2.08 2.06 42.55 2019 21 44 26 29.77 1.39 1.60 0.54 187 4.03 4.14 3.75 0.35 68 10.78 1.59 94 2.20 1.69 38.67
Industrial and Commercial Bank of China (New Zealand) Limited
2020 (15) - 8 47.04 0.48 0.71 (0.86) 36 1.56 1.57 1.20 0.06 23 9.36 1.04 32 1.45 0.85 52.35 2019 11 0 35 56.49 0.39 1.55 0.71 38 1.91 1.93 1.57 0.09 7 3.95 0.39 10 0.54 0.90 44.93
JPMorgan Chase Bank, N.A., New Zealand Banking Group
2020 - - - n/a - - - 30 0.72 0.85 0.83 0.83 9 n/a 0.48 14 0.76 0.79 51.16 2019 - 1 - n/a - - - 28 0.53 0.73 0.72 1.15 11 n/a 0.65 16 0.93 0.75 44.50
Kiwibank Limited2020 51 19 2 100.00 0.38 0.39 0.24 553 1.89 1.94 1.53 0.41 57 3.66 0.24 100 0.41 1.67 72.69 2019 12 13 5 60.00 0.18 0.20 0.06 538 2.05 2.11 1.64 0.43 108 7.11 0.50 176 0.81 1.61 65.06
Kookmin Bank Auckland Branch2020 (0) - - n/a 0.10 0.10 (0.02) 10 1.84 1.86 1.86 0.26 4 76.63 0.90 6 1.26 0.86 40.73 2019 (0) - - n/a 0.12 0.12 (0.01) 9 1.78 1.79 1.77 0.34 4 95.50 0.92 6 1.30 0.82 38.85
MUFG Bank, Ltd., Auckland Branch2020 (0) - - n/a - - (0.00) 50 0.48 0.50 0.46 0.36 30 14.79 0.51 39 0.66 0.19 22.13 2019 0 - - n/a - - 0.00 43 0.50 0.51 0.45 0.42 26 14.51 0.54 33 0.69 0.23 24.68
Coöperatieve Rabobank U.A. New Zealand Banking Group
2020 23 1 534 3.05 0.27 0.38 0.17 353 2.12 2.14 1.88 0.03 130 6.64 0.79 182 1.11 0.90 41.77 2019 2 1 259 3.31 0.24 0.30 0.02 337 2.32 2.35 2.10 (0.17) 144 7.96 0.92 208 1.32 0.81 37.65
Southland Building Society2020 37 12 2 54.18 1.21 1.23 0.90 154 2.46 2.51 2.23 0.73 19 5.71 0.39 22 0.46 1.97 61.59 2019 15 11 4 53.94 0.68 0.73 0.39 153 2.52 2.56 2.35 0.80 31 9.90 0.67 42 0.92 2.07 62.20
The Co-operative Bank Limited2020 8 6 7 16.62 0.43 0.47 0.32 81 2.15 2.19 1.82 0.65 7 3.35 0.23 15 0.51 2.00 71.52 2019 4 6 3 18.62 0.23 0.25 0.15 81 2.33 2.35 1.97 0.65 10 5.05 0.35 18 0.67 2.17 72.94
The Hongkong and Shanghai Banking Corporation Limited, New Zealand Banking Group
2020 - 0 16 10.60 0.04 0.08 - 128 1.26 1.28 1.22 0.76 40 161.10 0.64 56 0.89 1.13 55.85 2019 - - 5 18.41 0.09 0.11 - 138 1.37 1.38 1.31 0.85 51 200.88 0.83 72 1.16 1.05 47.57
TSB Bank Limited2020 20 2 18 54.56 0.62 0.77 0.34 164 1.78 1.80 1.48 0.27 31 4.62 0.39 45 0.56 1.24 60.46 2019 4 6 4 10.62 0.48 0.49 0.08 162 1.81 1.83 1.48 0.31 45 7.11 0.59 65 0.85 1.22 57.22
Westpac Banking Corporation – New Zealand Banking Group
2020 320 343 137 53.28 0.60 0.68 0.37 2,353 1.73 1.88 1.53 0.42 681 7.69 0.62 1,017 0.93 0.93 43.18 2019 (10) 113 69 40.58 0.35 0.38 (0.01) 2,560 1.97 2.12 1.71 0.56 1,129 13.25 1.12 1,611 1.59 0.95 37.46
Banking sector total2020 1,473 1,400 2,127 28.05 0.55 0.67 0.31 13,505 1.84 1.96 1.68 0.46 4,142 9.21 0.71 6,165 1.05 1.00 43.44 2019 393 771 1,752 23.67 0.38 0.47 0.09 14,008 1.98 2.10 1.76 0.57 5,719 13.53 1.04 8,235 1.50 0.98 38.41
* Operating Expenses = Total Expenses - Interest Expense - Loan Write Offs and Bad Debts - Abnormal Expenses. n/a = not applicable
Analysis of annual results

FIPS 2020 | KPMG | 39
© 2021 KPMG, a New Zealand Partnership and a member firm of the KPMG global organisation of independent member firms affiliated with KPMG International Limited, a private English company limited by guarantee. All rights reserved.
Analysis of financial statements Credit quality measures Profitability measures Efficiency measures
Entity25 Survey year
Impaired asset
expense $Million
Past due assets
$Million
Gross impaired
assets $Million
Individual provision
for doubtful
debts/Gross
impaired assets
%
Collective provision/Net loans
and advances
%
Total provision
for doubtful
debts/Gross
loans and advances
%
Impaired asset
expense/Average
gross loans and advances
%
Total operating
income$Million
Net interest
income/Average
total assets
%
Interest margin
%
Interest spread
%
Non-interest
income/Average
total assets
%
Net profit
after tax$Million
Net profit after tax/
Average equity
%
Net profit after tax/
Average total
assets%
Underlying profit
$Million
Underlying profit/
Average total
assets%
Operating expenses*/
Average total
assets%
Operating expenses*/
Operating income
%
Australia and New Zealand Banking Group Limited – ANZ New Zealand
2020 401 525 363 29.48 0.44 0.52 0.30 4,020 1.88 2.02 1.75 0.46 1,336 10.04 0.78 1,893 1.10 1.00 42.94 2019 99 334 287 34.15 0.30 0.37 0.08 4,198 1.99 2.14 1.80 0.59 1,825 15.31 1.12 2,490 1.53 0.99 38.33
Bank of Baroda (New Zealand) Limited2020 0 - - n/a 0.43 0.43 0.22 4 2.56 2.69 1.51 0.89 1 1.84 0.69 1 0.94 2.34 67.73 2019 0 - - n/a 0.21 0.21 0.01 4 2.60 2.66 1.47 1.02 1 1.90 0.75 1 1.13 2.49 68.68
Bank of China New Zealand Banking Group2020 (14) - 8 46.37 0.28 0.40 (0.55) 49 1.40 1.39 1.01 0.26 31 13.13 1.03 43 1.45 0.68 40.94 2019 13 - 33 59.81 0.39 1.40 0.76 39 1.55 1.57 1.10 0.42 6 2.88 0.32 9 0.44 0.88 44.72
Bank of India (New Zealand) Limited2020 (0) - 2 - 1.04 1.04 (0.49) 3 3.26 3.31 1.07 0.51 0 0.45 0.29 0 0.40 3.76 99.49 2019 (0) - - n/a 0.37 0.37 (0.14) 4 3.76 3.83 1.75 0.56 1 1.73 0.98 1 1.37 3.08 71.21
Bank of New Zealand2020 300 175 600 39.50 0.76 1.02 0.34 2,539 1.88 2.07 1.85 0.41 762 9.19 0.69 1,245 1.12 0.90 39.15 2019 114 146 653 24.04 0.56 0.74 0.13 2,656 1.97 2.16 1.88 0.57 1,022 13.35 0.98 1,617 1.55 0.89 34.83
China Construction Bank Corporation New Zealand Banking Group
2020 2 - - n/a 0.36 0.36 0.10 47 1.27 1.30 1.12 0.39 20 8.81 0.70 28 0.98 0.61 36.45 2019 2 - - n/a 0.31 0.31 0.10 34 1.48 1.52 1.29 0.05 12 5.45 0.52 16 0.73 0.72 47.10
Citibank, N.A. New Zealand Branch and Associated Banking Group
2020 0 - - n/a - - 0.02 43 0.69 0.69 0.57 1.52 17 9.12 0.88 24 1.23 0.98 44.25 2019 0 - - n/a - - 0.03 43 0.92 0.92 0.77 1.14 16 8.60 0.78 23 1.08 0.97 47.03
Commonwealth Bank of Australia New Zealand Operations
2020 310 259 406 33.25 0.54 0.68 0.34 2,685 1.86 1.90 1.59 0.58 884 11.10 0.80 1,315 1.20 0.96 39.48 2019 106 95 370 18.65 0.38 0.46 0.12 2,756 1.96 2.01 1.67 0.69 1,202 15.09 1.16 1,727 1.66 0.89 33.49
Heartland Bank Limited2020 29 59 25 21.49 1.55 1.69 0.80 203 4.50 4.66 4.28 0.33 61 10.11 1.45 87 2.08 2.06 42.55 2019 21 44 26 29.77 1.39 1.60 0.54 187 4.03 4.14 3.75 0.35 68 10.78 1.59 94 2.20 1.69 38.67
Industrial and Commercial Bank of China (New Zealand) Limited
2020 (15) - 8 47.04 0.48 0.71 (0.86) 36 1.56 1.57 1.20 0.06 23 9.36 1.04 32 1.45 0.85 52.35 2019 11 0 35 56.49 0.39 1.55 0.71 38 1.91 1.93 1.57 0.09 7 3.95 0.39 10 0.54 0.90 44.93
JPMorgan Chase Bank, N.A., New Zealand Banking Group
2020 - - - n/a - - - 30 0.72 0.85 0.83 0.83 9 n/a 0.48 14 0.76 0.79 51.16 2019 - 1 - n/a - - - 28 0.53 0.73 0.72 1.15 11 n/a 0.65 16 0.93 0.75 44.50
Kiwibank Limited2020 51 19 2 100.00 0.38 0.39 0.24 553 1.89 1.94 1.53 0.41 57 3.66 0.24 100 0.41 1.67 72.69 2019 12 13 5 60.00 0.18 0.20 0.06 538 2.05 2.11 1.64 0.43 108 7.11 0.50 176 0.81 1.61 65.06
Kookmin Bank Auckland Branch2020 (0) - - n/a 0.10 0.10 (0.02) 10 1.84 1.86 1.86 0.26 4 76.63 0.90 6 1.26 0.86 40.73 2019 (0) - - n/a 0.12 0.12 (0.01) 9 1.78 1.79 1.77 0.34 4 95.50 0.92 6 1.30 0.82 38.85
MUFG Bank, Ltd., Auckland Branch2020 (0) - - n/a - - (0.00) 50 0.48 0.50 0.46 0.36 30 14.79 0.51 39 0.66 0.19 22.13 2019 0 - - n/a - - 0.00 43 0.50 0.51 0.45 0.42 26 14.51 0.54 33 0.69 0.23 24.68
Coöperatieve Rabobank U.A. New Zealand Banking Group
2020 23 1 534 3.05 0.27 0.38 0.17 353 2.12 2.14 1.88 0.03 130 6.64 0.79 182 1.11 0.90 41.77 2019 2 1 259 3.31 0.24 0.30 0.02 337 2.32 2.35 2.10 (0.17) 144 7.96 0.92 208 1.32 0.81 37.65
Southland Building Society2020 37 12 2 54.18 1.21 1.23 0.90 154 2.46 2.51 2.23 0.73 19 5.71 0.39 22 0.46 1.97 61.59 2019 15 11 4 53.94 0.68 0.73 0.39 153 2.52 2.56 2.35 0.80 31 9.90 0.67 42 0.92 2.07 62.20
The Co-operative Bank Limited2020 8 6 7 16.62 0.43 0.47 0.32 81 2.15 2.19 1.82 0.65 7 3.35 0.23 15 0.51 2.00 71.52 2019 4 6 3 18.62 0.23 0.25 0.15 81 2.33 2.35 1.97 0.65 10 5.05 0.35 18 0.67 2.17 72.94
The Hongkong and Shanghai Banking Corporation Limited, New Zealand Banking Group
2020 - 0 16 10.60 0.04 0.08 - 128 1.26 1.28 1.22 0.76 40 161.10 0.64 56 0.89 1.13 55.85 2019 - - 5 18.41 0.09 0.11 - 138 1.37 1.38 1.31 0.85 51 200.88 0.83 72 1.16 1.05 47.57
TSB Bank Limited2020 20 2 18 54.56 0.62 0.77 0.34 164 1.78 1.80 1.48 0.27 31 4.62 0.39 45 0.56 1.24 60.46 2019 4 6 4 10.62 0.48 0.49 0.08 162 1.81 1.83 1.48 0.31 45 7.11 0.59 65 0.85 1.22 57.22
Westpac Banking Corporation – New Zealand Banking Group
2020 320 343 137 53.28 0.60 0.68 0.37 2,353 1.73 1.88 1.53 0.42 681 7.69 0.62 1,017 0.93 0.93 43.18 2019 (10) 113 69 40.58 0.35 0.38 (0.01) 2,560 1.97 2.12 1.71 0.56 1,129 13.25 1.12 1,611 1.59 0.95 37.46
Banking sector total2020 1,473 1,400 2,127 28.05 0.55 0.67 0.31 13,505 1.84 1.96 1.68 0.46 4,142 9.21 0.71 6,165 1.05 1.00 43.44 2019 393 771 1,752 23.67 0.38 0.47 0.09 14,008 1.98 2.10 1.76 0.57 5,719 13.53 1.04 8,235 1.50 0.98 38.41
* Operating Expenses = Total Expenses - Interest Expense - Loan Write Offs and Bad Debts - Abnormal Expenses. n/a = not applicable

40 | KPMG | FIPS 2020
© 2021 KPMG, a New Zealand Partnership and a member firm of the KPMG global organisation of independent member firms affiliated with KPMG International Limited, a private English company limited by guarantee. All rights reserved.
Analysis of annual results
Balance sheet breakdown Assets ($Million) Liabilities ($Million) Equity* ($Million)
Entity25
Bal
ance
dat
e
Cas
h o
n h
and
, mo
ney
at
call
and
bal
ance
s w
ith
oth
er b
anks
Trad
ing
, inv
estm
ent
secu
riti
es,
inve
stm
ents
in s
ub
sid
iari
es
and
inve
stm
ent
pro
per
ties
Der
ivat
ive
fin
anci
al
inst
rum
ents
Loan
s an
d a
dva
nce
s (l
ess
pro
visi
on
s)
Bal
ance
s w
ith
rel
ated
par
ties
Fixe
d a
sset
s
Inta
ng
ible
s
Oth
er a
sset
s
Tota
l ass
ets
Cu
sto
mer
dep
osi
ts
Bal
ance
s w
ith
oth
er b
anks
and
mo
ney
mar
ket
dep
osi
ts
Deb
t se
curi
ties
Der
ivat
ive
fin
anci
al
inst
rum
ents
Bal
ance
s w
ith
rel
ated
par
ties
Su
bo
rdin
ated
deb
t
Oth
er li
abili
ties
Tota
l lia
bili
ties
Sh
are
cap
ital
– o
rdin
ary
shar
es
Hea
d o
ffice
acc
ou
nt
Oth
er e
qu
ity/
cash
flow
hed
ge r
eser
ves
Ret
ain
ed e
arn
ing
s
Tota
l eq
uit
y
2020
Australia and New Zealand Banking Group Limited – ANZ New Zealand
30-Sep 9,854 22,690 6,849 132,984 3,121 590 3,092 907 180,087 120,863 4,785 25,528 5,375 6,159 1,512 1,855 166,077 11,044 11 118 2,837 14,010
Bank of Baroda (New Zealand) Limited 31-Mar 29 - - 100 0 2 - 1 132 80 - - - 1 - 3 83 40 - - 9 49
Bank of China New Zealand Banking Group 31-Dec 366 119 7 3,129 - 7 0 22 3,651 529 688 604 12 1,534 - 35 3,402 223 (1) 0 27 249
Bank of India (New Zealand) Limited 31-Mar 27 - - 58 0 1 - 0 86 13 - - - 17 - 1 31 50 - - 5 55
Bank of New Zealand 30-Sep 4,715 10,814 6,140 88,149 1,053 423 229 787 112,310 67,580 2,820 23,773 4,711 3,303 549 917 103,653 4,056 - 108 4,493 8,657
China Construction Bank Corporation New Zealand Banking Group
31-Dec 385 202 54 2,304 117 2 0 3 3,066 312 432 976 35 1,067 - 10 2,832 199 7 (0) 29 234
Citibank, N.A. New Zealand Branch and Associated Banking Group
31-Dec 778 427 - 462 40 0 - 12 1,719 1,058 16 - - 450 - 9 1,533 - 34 (0) 153 187
Commonwealth Bank of Australia New Zealand Operations
30-Jun 4,101 10,703 1,221 93,266 2,634 452 463 624 113,464 69,102 1,177 22,631 244 4,163 7,009 1,148 105,474 3,167 2,887 (72) 2,008 7,990
Heartland Bank Limited 30-Jun 105 399 17 3,654 1 28 57 52 4,315 3,269 - 359 17 8 - 65 3,718 553 - (3) 46 597
Industrial and Commercial Bank of China (New Zealand) Limited
31-Dec 334 183 4 1,718 23 8 0 12 2,282 815 0 709 4 466 - 31 2,024 234 - 24 - 257
JPMorgan Chase Bank, N.A., New Zealand Banking Group
31-Dec 140 1,423 - 349 44 0 - 47 2,004 234 - 479 0 1,235 - 57 2,004 - - - - -
Kiwibank Limited 30-Jun 597 1,895 434 22,222 77 144 60 81 25,510 20,433 317 2,229 400 171 150 240 23,940 737 - (20) 853 1,570
Kookmin Bank Auckland Branch 31-Dec 7 - - 317 164 5 - 0 493 229 89 - - 164 - 4 487 - 6 - - 6
MUFG Bank, Ltd., Auckland Branch 31-Mar 453 597 78 5,182 184 2 - 20 6,516 1,063 - - 68 5,127 - 36 6,294 - 83 3 136 222
Coöperatieve Rabobank U.A. New Zealand Banking Group
31-Dec 421 757 19 13,806 1,652 12 1 88 16,756 5,475 - 2,205 26 7,000 - 30 14,736 551 319 2 1,147 2,020
Southland Building Society 31-Mar 143 533 9 4,140 6 44 12 56 4,942 3,513 541 337 44 - 104 73 4,610 - - (13) 345 331
The Co-operative Bank Limited 31-Mar 341 9 9 2,559 - 36 12 15 2,980 2,405 - 305 23 - - 44 2,777 - - (1) 204 202
The Hongkong and Shanghai Banking Corporation Limited, New Zealand Banking Group
31-Dec 686 542 2 4,657 714 3 16 22 6,642 3,538 348 925 82 1,680 - 44 6,618 - 21 3 - 24
TSB Bank Limited 31-Mar 233 1,742 14 6,127 - 34 15 15 8,179 7,421 - - 18 - - 61 7,499 10 - 10 660 680
Westpac Banking Corporation – New Zealand Banking Group
30-Sep 4,885 9,245 5,660 88,354 2,713 398 696 1,245 113,196 70,974 508 18,795 5,417 2,560 3,220 2,677 104,151 143 2,378 (12) 6,536 9,045
Banking sector total 28,598 62,278 20,517 473,537 12,544 2,192 4,653 4,009 608,329 378,903 11,721 99,855 16,477 35,106 12,544 7,338 561,943 21,007 5,746 145 19,488 46,386
* In previous years the column Convertible debentures/perpetual preference shares has been included under the equity header; however, this has been removed as no entities have balances for these equity types in the current or previous year.

FIPS 2020 | KPMG | 41
© 2021 KPMG, a New Zealand Partnership and a member firm of the KPMG global organisation of independent member firms affiliated with KPMG International Limited, a private English company limited by guarantee. All rights reserved.
Balance sheet breakdown Assets ($Million) Liabilities ($Million) Equity* ($Million)
Entity25
Bal
ance
dat
e
Cas
h o
n h
and
, mo
ney
at
call
and
bal
ance
s w
ith
oth
er b
anks
Trad
ing
, inv
estm
ent
secu
riti
es,
inve
stm
ents
in s
ub
sid
iari
es
and
inve
stm
ent
pro
per
ties
Der
ivat
ive
fin
anci
al
inst
rum
ents
Loan
s an
d a
dva
nce
s (l
ess
pro
visi
on
s)
Bal
ance
s w
ith
rel
ated
par
ties
Fixe
d a
sset
s
Inta
ng
ible
s
Oth
er a
sset
s
Tota
l ass
ets
Cu
sto
mer
dep
osi
ts
Bal
ance
s w
ith
oth
er b
anks
and
mo
ney
mar
ket
dep
osi
ts
Deb
t se
curi
ties
Der
ivat
ive
fin
anci
al
inst
rum
ents
Bal
ance
s w
ith
rel
ated
par
ties
Su
bo
rdin
ated
deb
t
Oth
er li
abili
ties
Tota
l lia
bili
ties
Sh
are
cap
ital
– o
rdin
ary
shar
es
Hea
d o
ffice
acc
ou
nt
Oth
er e
qu
ity/
cash
flow
hed
ge r
eser
ves
Ret
ain
ed e
arn
ing
s
Tota
l eq
uit
y
2020
Australia and New Zealand Banking Group Limited – ANZ New Zealand
30-Sep 9,854 22,690 6,849 132,984 3,121 590 3,092 907 180,087 120,863 4,785 25,528 5,375 6,159 1,512 1,855 166,077 11,044 11 118 2,837 14,010
Bank of Baroda (New Zealand) Limited 31-Mar 29 - - 100 0 2 - 1 132 80 - - - 1 - 3 83 40 - - 9 49
Bank of China New Zealand Banking Group 31-Dec 366 119 7 3,129 - 7 0 22 3,651 529 688 604 12 1,534 - 35 3,402 223 (1) 0 27 249
Bank of India (New Zealand) Limited 31-Mar 27 - - 58 0 1 - 0 86 13 - - - 17 - 1 31 50 - - 5 55
Bank of New Zealand 30-Sep 4,715 10,814 6,140 88,149 1,053 423 229 787 112,310 67,580 2,820 23,773 4,711 3,303 549 917 103,653 4,056 - 108 4,493 8,657
China Construction Bank Corporation New Zealand Banking Group
31-Dec 385 202 54 2,304 117 2 0 3 3,066 312 432 976 35 1,067 - 10 2,832 199 7 (0) 29 234
Citibank, N.A. New Zealand Branch and Associated Banking Group
31-Dec 778 427 - 462 40 0 - 12 1,719 1,058 16 - - 450 - 9 1,533 - 34 (0) 153 187
Commonwealth Bank of Australia New Zealand Operations
30-Jun 4,101 10,703 1,221 93,266 2,634 452 463 624 113,464 69,102 1,177 22,631 244 4,163 7,009 1,148 105,474 3,167 2,887 (72) 2,008 7,990
Heartland Bank Limited 30-Jun 105 399 17 3,654 1 28 57 52 4,315 3,269 - 359 17 8 - 65 3,718 553 - (3) 46 597
Industrial and Commercial Bank of China (New Zealand) Limited
31-Dec 334 183 4 1,718 23 8 0 12 2,282 815 0 709 4 466 - 31 2,024 234 - 24 - 257
JPMorgan Chase Bank, N.A., New Zealand Banking Group
31-Dec 140 1,423 - 349 44 0 - 47 2,004 234 - 479 0 1,235 - 57 2,004 - - - - -
Kiwibank Limited 30-Jun 597 1,895 434 22,222 77 144 60 81 25,510 20,433 317 2,229 400 171 150 240 23,940 737 - (20) 853 1,570
Kookmin Bank Auckland Branch 31-Dec 7 - - 317 164 5 - 0 493 229 89 - - 164 - 4 487 - 6 - - 6
MUFG Bank, Ltd., Auckland Branch 31-Mar 453 597 78 5,182 184 2 - 20 6,516 1,063 - - 68 5,127 - 36 6,294 - 83 3 136 222
Coöperatieve Rabobank U.A. New Zealand Banking Group
31-Dec 421 757 19 13,806 1,652 12 1 88 16,756 5,475 - 2,205 26 7,000 - 30 14,736 551 319 2 1,147 2,020
Southland Building Society 31-Mar 143 533 9 4,140 6 44 12 56 4,942 3,513 541 337 44 - 104 73 4,610 - - (13) 345 331
The Co-operative Bank Limited 31-Mar 341 9 9 2,559 - 36 12 15 2,980 2,405 - 305 23 - - 44 2,777 - - (1) 204 202
The Hongkong and Shanghai Banking Corporation Limited, New Zealand Banking Group
31-Dec 686 542 2 4,657 714 3 16 22 6,642 3,538 348 925 82 1,680 - 44 6,618 - 21 3 - 24
TSB Bank Limited 31-Mar 233 1,742 14 6,127 - 34 15 15 8,179 7,421 - - 18 - - 61 7,499 10 - 10 660 680
Westpac Banking Corporation – New Zealand Banking Group
30-Sep 4,885 9,245 5,660 88,354 2,713 398 696 1,245 113,196 70,974 508 18,795 5,417 2,560 3,220 2,677 104,151 143 2,378 (12) 6,536 9,045
Banking sector total 28,598 62,278 20,517 473,537 12,544 2,192 4,653 4,009 608,329 378,903 11,721 99,855 16,477 35,106 12,544 7,338 561,943 21,007 5,746 145 19,488 46,386
* In previous years the column Convertible debentures/perpetual preference shares has been included under the equity header; however, this has been removed as no entities have balances for these equity types in the current or previous year.

42 | KPMG | FIPS 2020
© 2021 KPMG, a New Zealand Partnership and a member firm of the KPMG global organisation of independent member firms affiliated with KPMG International Limited, a private English company limited by guarantee. All rights reserved.
Analysis of annual results
Balance sheet breakdown Assets ($Million) Liabilities ($Million) Equity* ($Million)
Entity25
Bal
ance
dat
e
Cas
h o
n h
and
, mo
ney
at
call
and
bal
ance
s w
ith
oth
er b
anks
Trad
ing
, inv
estm
ent
secu
riti
es,
inve
stm
ents
in s
ub
sid
iari
es
and
inve
stm
ent
pro
per
ties
Der
ivat
ive
fin
anci
al
inst
rum
ents
Loan
s an
d a
dva
nce
s (l
ess
pro
visi
on
s)
Bal
ance
s w
ith
rel
ated
par
ties
Fixe
d a
sset
s
Inta
ng
ible
s
Oth
er a
sset
s
Tota
l ass
ets
Cu
sto
mer
dep
osi
ts
Bal
ance
s w
ith
oth
er b
anks
and
mo
ney
mar
ket
dep
osi
ts
Deb
t se
curi
ties
Der
ivat
ive
fin
anci
al
inst
rum
ents
Bal
ance
s w
ith
rel
ated
par
ties
Su
bo
rdin
ated
deb
t
Oth
er li
abili
ties
Tota
l lia
bili
ties
Sh
are
cap
ital
– o
rdin
ary
shar
es
Hea
d o
ffice
acc
ou
nt
Oth
er e
qu
ity/
cash
flow
hed
ge r
eser
ves
Ret
ain
ed e
arn
ing
s
Tota
l eq
uit
y
2019
Australia and New Zealand Banking Group Limited – ANZ New Zealand
30-Sep 3,992 15,969 7,733 133,264 5,212 335 3,276 711 170,492 109,107 2,736 27,840 6,266 8,725 1,525 1,694 157,893 11,044 11 21 1,523 12,599
Bank of Baroda (New Zealand) Limited 31-Mar 19 - - 101 5 0 - 0 125 75 - - - 1 - 1 77 40 - - 8 48
Bank of China New Zealand Banking Group** 31-Dec 221 135 2 1,902 - 3 - 24 2,286 355 518 580 2 591 - 23 2,068 223 (1) (0) (4) 218
Bank of India (New Zealand) Limited 31-Mar 17 - - 75 (4) 1 - 0 89 13 - - - 20 - 0 34 50 - - 5 55
Bank of New Zealand 30-Sep 4,174 7,267 7,616 88,041 615 177 293 929 109,112 63,065 1,833 26,024 6,106 2,238 548 1,365 101,179 4,056 - 99 3,778 7,933
China Construction Bank Corporation New Zealand Banking Group
31-Dec 352 188 68 1,931 35 1 0 2 2,577 235 337 690 7 1,084 - 7 2,361 199 0 (0) 17 216
Citibank, N.A. New Zealand Branch and Associated Banking Group
31-Dec 792 609 - 603 140 0 - 7 2,151 1,083 6 - - 866 - 10 1,965 - 34 0 152 186
Commonwealth Bank of Australia New Zealand Operations
30-Jun 2,933 8,685 1,005 90,413 2,853 197 478 511 107,075 61,908 788 24,133 358 4,307 6,836 813 99,143 667 2,887 (108) 4,486 7,932
Heartland Bank Limited** 30-Jun 39 355 14 3,592 25 10 57 52 4,144 3,154 - 345 11 3 - 27 3,540 553 - (1) 51 603
Industrial and Commercial Bank of China (New Zealand) Limited
31-Dec 302 111 1 1,694 10 0 - 17 2,136 636 0 598 1 640 - 27 1,902 234 - 1 - 234
JPMorgan Chase Bank, N.A., New Zealand Banking Group
31-Dec 179 867 0 215 251 - 1 293 1,806 201 - 723 - 358 - 524 1,806 - - - - -
Kiwibank Limited 30-Jun 492 1,176 358 20,443 85 51 74 55 22,734 18,230 126 2,078 343 19 253 136 21,185 737 - (11) 823 1,549
Kookmin Bank Auckland Branch 31-Dec 7 - - 295 146 0 - 0 448 212 30 - - 200 - 1 443 - 5 - - 5
MUFG Bank, Ltd., Auckland Branch 31-Mar 419 154 29 4,691 78 0 - 12 5,383 705 - - 14 4,457 - 19 5,194 - 83 0 106 189
Coöperatieve Rabobank U.A. New Zealand Banking Group**
31-Dec 422 647 19 12,686 2,320 3 0 61 16,158 4,706 - 3,116 15 6,411 - 21 14,268 551 291 2 1,047 1,890
Southland Building Society 31-Mar 139 547 5 3,979 5 21 12 46 4,755 3,381 539 298 30 - 132 49 4,429 - - (5) 331 325
The Co-operative Bank Limited 31-Mar 277 8 6 2,461 - 9 12 13 2,786 2,321 - 234 16 - - 18 2,588 - - (0) 198 198
The Hongkong and Shanghai Banking Corporation Limited, New Zealand Banking Group
31-Dec 537 422 13 4,124 892 1 15 26 6,030 3,059 229 690 35 1,938 - 54 6,004 - 23 3 - 26
TSB Bank Limited 31-Mar 149 1,828 7 5,792 - 28 9 7 7,819 7,093 - - 12 - - 61 7,166 10 - 11 632 653
Westpac Banking Corporation – New Zealand Banking Group
30-Sep 2,419 9,340 6,257 84,626 2,367 137 685 931 106,762 64,464 623 18,988 5,825 2,892 3,185 2,128 98,105 143 2,289 (69) 6,294 8,657
Banking sector total 17,881 48,308 23,134 460,928 15,035 974 4,911 3,697 574,869 344,001 7,763 106,337 19,041 34,752 12,479 6,978 531,351 18,507 5,621 (58) 19,447 43,517
* In previous years the column Convertible debentures/perpetual preference shares has been included under the equity header; however, this has been removed as no entities have balances for these equity types in the current or previous year.
** Certain comparative figures have been restated by the bank in their latest financial statements and the restated numbers are reflected here.

FIPS 2020 | KPMG | 43
© 2021 KPMG, a New Zealand Partnership and a member firm of the KPMG global organisation of independent member firms affiliated with KPMG International Limited, a private English company limited by guarantee. All rights reserved.
Balance sheet breakdown Assets ($Million) Liabilities ($Million) Equity* ($Million)
Entity25
Bal
ance
dat
e
Cas
h o
n h
and
, mo
ney
at
call
and
bal
ance
s w
ith
oth
er b
anks
Trad
ing
, inv
estm
ent
secu
riti
es,
inve
stm
ents
in s
ub
sid
iari
es
and
inve
stm
ent
pro
per
ties
Der
ivat
ive
fin
anci
al
inst
rum
ents
Loan
s an
d a
dva
nce
s (l
ess
pro
visi
on
s)
Bal
ance
s w
ith
rel
ated
par
ties
Fixe
d a
sset
s
Inta
ng
ible
s
Oth
er a
sset
s
Tota
l ass
ets
Cu
sto
mer
dep
osi
ts
Bal
ance
s w
ith
oth
er b
anks
and
mo
ney
mar
ket
dep
osi
ts
Deb
t se
curi
ties
Der
ivat
ive
fin
anci
al
inst
rum
ents
Bal
ance
s w
ith
rel
ated
par
ties
Su
bo
rdin
ated
deb
t
Oth
er li
abili
ties
Tota
l lia
bili
ties
Sh
are
cap
ital
– o
rdin
ary
shar
es
Hea
d o
ffice
acc
ou
nt
Oth
er e
qu
ity/
cash
flow
hed
ge r
eser
ves
Ret
ain
ed e
arn
ing
s
Tota
l eq
uit
y
2019
Australia and New Zealand Banking Group Limited – ANZ New Zealand
30-Sep 3,992 15,969 7,733 133,264 5,212 335 3,276 711 170,492 109,107 2,736 27,840 6,266 8,725 1,525 1,694 157,893 11,044 11 21 1,523 12,599
Bank of Baroda (New Zealand) Limited 31-Mar 19 - - 101 5 0 - 0 125 75 - - - 1 - 1 77 40 - - 8 48
Bank of China New Zealand Banking Group** 31-Dec 221 135 2 1,902 - 3 - 24 2,286 355 518 580 2 591 - 23 2,068 223 (1) (0) (4) 218
Bank of India (New Zealand) Limited 31-Mar 17 - - 75 (4) 1 - 0 89 13 - - - 20 - 0 34 50 - - 5 55
Bank of New Zealand 30-Sep 4,174 7,267 7,616 88,041 615 177 293 929 109,112 63,065 1,833 26,024 6,106 2,238 548 1,365 101,179 4,056 - 99 3,778 7,933
China Construction Bank Corporation New Zealand Banking Group
31-Dec 352 188 68 1,931 35 1 0 2 2,577 235 337 690 7 1,084 - 7 2,361 199 0 (0) 17 216
Citibank, N.A. New Zealand Branch and Associated Banking Group
31-Dec 792 609 - 603 140 0 - 7 2,151 1,083 6 - - 866 - 10 1,965 - 34 0 152 186
Commonwealth Bank of Australia New Zealand Operations
30-Jun 2,933 8,685 1,005 90,413 2,853 197 478 511 107,075 61,908 788 24,133 358 4,307 6,836 813 99,143 667 2,887 (108) 4,486 7,932
Heartland Bank Limited** 30-Jun 39 355 14 3,592 25 10 57 52 4,144 3,154 - 345 11 3 - 27 3,540 553 - (1) 51 603
Industrial and Commercial Bank of China (New Zealand) Limited
31-Dec 302 111 1 1,694 10 0 - 17 2,136 636 0 598 1 640 - 27 1,902 234 - 1 - 234
JPMorgan Chase Bank, N.A., New Zealand Banking Group
31-Dec 179 867 0 215 251 - 1 293 1,806 201 - 723 - 358 - 524 1,806 - - - - -
Kiwibank Limited 30-Jun 492 1,176 358 20,443 85 51 74 55 22,734 18,230 126 2,078 343 19 253 136 21,185 737 - (11) 823 1,549
Kookmin Bank Auckland Branch 31-Dec 7 - - 295 146 0 - 0 448 212 30 - - 200 - 1 443 - 5 - - 5
MUFG Bank, Ltd., Auckland Branch 31-Mar 419 154 29 4,691 78 0 - 12 5,383 705 - - 14 4,457 - 19 5,194 - 83 0 106 189
Coöperatieve Rabobank U.A. New Zealand Banking Group**
31-Dec 422 647 19 12,686 2,320 3 0 61 16,158 4,706 - 3,116 15 6,411 - 21 14,268 551 291 2 1,047 1,890
Southland Building Society 31-Mar 139 547 5 3,979 5 21 12 46 4,755 3,381 539 298 30 - 132 49 4,429 - - (5) 331 325
The Co-operative Bank Limited 31-Mar 277 8 6 2,461 - 9 12 13 2,786 2,321 - 234 16 - - 18 2,588 - - (0) 198 198
The Hongkong and Shanghai Banking Corporation Limited, New Zealand Banking Group
31-Dec 537 422 13 4,124 892 1 15 26 6,030 3,059 229 690 35 1,938 - 54 6,004 - 23 3 - 26
TSB Bank Limited 31-Mar 149 1,828 7 5,792 - 28 9 7 7,819 7,093 - - 12 - - 61 7,166 10 - 11 632 653
Westpac Banking Corporation – New Zealand Banking Group
30-Sep 2,419 9,340 6,257 84,626 2,367 137 685 931 106,762 64,464 623 18,988 5,825 2,892 3,185 2,128 98,105 143 2,289 (69) 6,294 8,657
Banking sector total 17,881 48,308 23,134 460,928 15,035 974 4,911 3,697 574,869 344,001 7,763 106,337 19,041 34,752 12,479 6,978 531,351 18,507 5,621 (58) 19,447 43,517
* In previous years the column Convertible debentures/perpetual preference shares has been included under the equity header; however, this has been removed as no entities have balances for these equity types in the current or previous year.
** Certain comparative figures have been restated by the bank in their latest financial statements and the restated numbers are reflected here.

Major banks: Quarterly analysis
Entity26Size & strength measures
EntityProfitability measures
31 Dec 18 31 Mar 19 30 Jun 19 30 Sep 19 31 Dec 19 31 Mar 20 30 Jun 20 30 Sep 20 31 Dec 18 31 Mar 19 30 Jun 19 30 Sep 19 31 Dec 19 31 Mar 20 30 Jun 20 30 Sep 20
Total assets31 ($Million) Interest margin (%)
ANZ 164,698 164,952 166,292 170,492 170,385 183,424 181,688 180,087 ANZ 2.20 2.20 2.20 2.00 2.10 2.10 1.90 1.90ASB 103,157 105,388 107,075 111,167 109,464 116,042 113,464 115,064 ASB 2.00 2.00 2.00 1.90 1.90 2.00 1.80 1.80BNZ 102,536 103,758 105,313 109,111 108,289 118,501 114,452 112,310 BNZ 2.20 2.20 2.10 2.10 2.10 2.10 2.00 2.00Heartland 4,018 4,054 4,139 4,206 4,262 4,315 4,315 4,288 Heartland 4.30 4.70 4.50 4.60 4.50 4.60 4.60 4.50Kiwibank 22,040 22,514 22,734 23,584 24,086 25,249 25,510 26,645 Kiwibank 2.10 2.00 2.10 2.00 1.90 2.00 1.90 1.90SBS 4,660 4,755 4,791 4,863 4,948 4,942 4,836 4,842 SBS 2.50 2.50 2.50 2.50 2.50 2.50 2.40 2.40TSB 7,733 7,819 7,920 8,075 8,130 8,179 8,332 8,575 TSB 1.90 1.80 1.80 1.80 1.80 1.80 1.60 1.70Co-op 2,786 2,786 2,855 2,927 2,948 2,980 3,008 3,048 Co-op 2.30 2.30 2.20 2.20 2.20 2.20 2.20 2.20Westpac 98,537 100,180 101,464 106,762 107,111 120,525 114,223 113,187 Westpac 2.30 2.10 2.10 1.80 1.90 1.90 1.70 1.80Total 510,164 516,204 522,582 541,187 539,622 584,157 569,827 568,047
Increase in gross loans and advances (%) Non-interest income/Total tangible assets (%)
ANZ 1.04 1.33 0.77 0.35 0.92 0.98 -0.02 -1.92 ANZ 0.46 0.52 0.67 0.68 0.31 0.85 0.33 0.29ASB 1.76 1.68 0.91 1.40 0.83 1.03 0.09 2.41 ASB 0.71 0.78 0.64 0.67 0.57 0.53 0.51 0.58BNZ 1.46 1.35 1.56 1.07 0.41 1.41 -1.36 -0.30 BNZ 0.36 0.67 0.79 0.45 0.30 0.65 0.40 0.35Heartland -14.95 0.68 2.94 0.88 1.82 1.23 -2.03 -0.62 Heartland 0.23 0.32 0.44 0.42 0.38 0.32 0.38 0.28Kiwibank 2.93 2.85 2.89 1.63 3.57 1.91 1.51 3.06 Kiwibank 0.91 0.74 0.83 0.86 0.90 0.92 0.53 0.63SBS 2.20 1.11 1.24 1.05 1.63 0.58 -1.36 -0.36 SBS 0.92 0.81 0.75 0.78 0.82 0.70 0.68 0.74TSB 1.88 2.40 3.77 2.72 -0.33 -0.16 -0.28 0.58 TSB 0.33 0.30 0.27 0.29 0.29 0.25 0.22 0.22Co-op 2.17 1.04 0.77 0.98 1.08 1.32 -0.31 1.14 Co-op 0.69 0.56 0.71 0.66 0.71 0.50 0.67 0.69Westpac 0.68 1.34 0.79 1.75 1.68 1.80 -0.29 1.47 Westpac 0.43 0.69 0.59 0.70 0.37 0.59 0.32 0.35Average 1.16 1.48 1.13 1.10 1.07 1.27 -0.28 0.31 Average 0.50 0.64 0.67 0.63 0.41 0.68 0.39 0.39
Capital adequacy (%) Impaired asset expense/Average gross loans and advances (%)
ANZ32 15.20 14.60 13.50 13.60 13.60 13.90 14.00 14.40 ANZ 0.04 0.06 0.07 0.13 0.05 0.64 0.23 0.27
ASB32 14.80 14.30 14.00 13.50 14.20 13.60 14.00 14.20 ASB 0.16 0.14 0.14 0.05 0.04 0.65 0.59 0.15
BNZ 13.30 13.60 13.70 13.90 14.40 14.10 14.60 14.90 BNZ 0.06 0.13 0.12 0.18 0.14 0.53 0.46 0.31Heartland 13.30 13.10 13.50 12.90 12.60 12.90 12.70 13.40 Heartland 0.79 0.45 0.38 0.50 0.47 0.69 1.48 0.05Kiwibank 15.30 14.90 14.50 13.50 13.20 13.00 12.60 12.30 Kiwibank 0.07 0.08 0.08 0.03 0.06 0.28 0.56 0.03SBS 14.10 14.20 14.30 14.20 14.20 13.80 14.30 14.90 SBS 0.38 0.40 0.29 0.35 0.48 2.44 0.39 0.09TSB 14.80 14.60 14.50 14.60 14.60 14.30 14.90 15.10 TSB -0.16 0.36 -0.06 0.05 0.03 1.29 -0.01 -0.05Co-op 17.20 17.10 16.60 16.70 16.40 16.30 16.90 16.90 Co-op 0.13 0.16 0.13 0.03 0.10 1.03 0.12 0.09
Westpac32 16.90 16.50 16.70 15.90 15.90 15.90 16.60 17.10 Westpac 0.03 0.04 -0.03 -0.08 0.10 0.87 0.54 -0.04
Average 0.08 0.10 0.08 0.08 0.08 0.67 0.44 0.17
Net profit ($Million) Operating expenses/Operating income (%)
ANZ 456 473 504 392 367 422 327 220 ANZ 38.14 35.23 34.29 45.63 44.88 33.93 43.97 54.60 ASB 292 329 282 310 252 192 130 270 ASB 35.22 33.58 37.72 35.89 43.48 38.09 49.46 38.55 BNZ 253 296 313 160 238 129 187 209 BNZ 40.42 35.66 35.47 61.11 40.38 58.00 41.97 41.65 Heartland 13 18 20 18 17 17 9 21 Heartland 47.60 39.96 40.16 42.77 45.02 40.78 48.39 40.28 Kiwibank 30 25 20 25 27 17 -12 24 Kiwibank 71.71 74.33 78.57 78.13 79.01 75.76 91.00 78.94 SBS 8 6 8 8 6 -4 8 10 SBS 62.97 65.97 62.14 64.21 65.58 56.07 59.78 59.36 TSB 13 5 14 13 12 -8 9 12 TSB 60.63 69.31 54.14 54.46 60.00 80.68 66.31 60.76 Co-op 3 1 2 2 3 -1 3 4 Co-op 76.33 87.88 80.00 82.09 75.48 75.77 74.52 74.65 Westpac 266 300 284 280 203 132 107 238 Westpac 39.89 37.45 39.91 41.82 47.07 42.68 50.79 44.14 Total 1,335 1,455 1,447 1,207 1,125 896 770 1,008 Average 40.91 38.27 39.21 47.89 46.61 44.25 48.95 47.85
44 | KPMG | FIPS 2020
© 2021 KPMG, a New Zealand Partnership and a member firm of the KPMG global organisation of independent member firms affiliated with KPMG International Limited, a private English company limited by guarantee. All rights reserved.

Entity26Size & strength measures
EntityProfitability measures
31 Dec 18 31 Mar 19 30 Jun 19 30 Sep 19 31 Dec 19 31 Mar 20 30 Jun 20 30 Sep 20 31 Dec 18 31 Mar 19 30 Jun 19 30 Sep 19 31 Dec 19 31 Mar 20 30 Jun 20 30 Sep 20
Total assets31 ($Million) Interest margin (%)
ANZ 164,698 164,952 166,292 170,492 170,385 183,424 181,688 180,087 ANZ 2.20 2.20 2.20 2.00 2.10 2.10 1.90 1.90ASB 103,157 105,388 107,075 111,167 109,464 116,042 113,464 115,064 ASB 2.00 2.00 2.00 1.90 1.90 2.00 1.80 1.80BNZ 102,536 103,758 105,313 109,111 108,289 118,501 114,452 112,310 BNZ 2.20 2.20 2.10 2.10 2.10 2.10 2.00 2.00Heartland 4,018 4,054 4,139 4,206 4,262 4,315 4,315 4,288 Heartland 4.30 4.70 4.50 4.60 4.50 4.60 4.60 4.50Kiwibank 22,040 22,514 22,734 23,584 24,086 25,249 25,510 26,645 Kiwibank 2.10 2.00 2.10 2.00 1.90 2.00 1.90 1.90SBS 4,660 4,755 4,791 4,863 4,948 4,942 4,836 4,842 SBS 2.50 2.50 2.50 2.50 2.50 2.50 2.40 2.40TSB 7,733 7,819 7,920 8,075 8,130 8,179 8,332 8,575 TSB 1.90 1.80 1.80 1.80 1.80 1.80 1.60 1.70Co-op 2,786 2,786 2,855 2,927 2,948 2,980 3,008 3,048 Co-op 2.30 2.30 2.20 2.20 2.20 2.20 2.20 2.20Westpac 98,537 100,180 101,464 106,762 107,111 120,525 114,223 113,187 Westpac 2.30 2.10 2.10 1.80 1.90 1.90 1.70 1.80Total 510,164 516,204 522,582 541,187 539,622 584,157 569,827 568,047
Increase in gross loans and advances (%) Non-interest income/Total tangible assets (%)
ANZ 1.04 1.33 0.77 0.35 0.92 0.98 -0.02 -1.92 ANZ 0.46 0.52 0.67 0.68 0.31 0.85 0.33 0.29ASB 1.76 1.68 0.91 1.40 0.83 1.03 0.09 2.41 ASB 0.71 0.78 0.64 0.67 0.57 0.53 0.51 0.58BNZ 1.46 1.35 1.56 1.07 0.41 1.41 -1.36 -0.30 BNZ 0.36 0.67 0.79 0.45 0.30 0.65 0.40 0.35Heartland -14.95 0.68 2.94 0.88 1.82 1.23 -2.03 -0.62 Heartland 0.23 0.32 0.44 0.42 0.38 0.32 0.38 0.28Kiwibank 2.93 2.85 2.89 1.63 3.57 1.91 1.51 3.06 Kiwibank 0.91 0.74 0.83 0.86 0.90 0.92 0.53 0.63SBS 2.20 1.11 1.24 1.05 1.63 0.58 -1.36 -0.36 SBS 0.92 0.81 0.75 0.78 0.82 0.70 0.68 0.74TSB 1.88 2.40 3.77 2.72 -0.33 -0.16 -0.28 0.58 TSB 0.33 0.30 0.27 0.29 0.29 0.25 0.22 0.22Co-op 2.17 1.04 0.77 0.98 1.08 1.32 -0.31 1.14 Co-op 0.69 0.56 0.71 0.66 0.71 0.50 0.67 0.69Westpac 0.68 1.34 0.79 1.75 1.68 1.80 -0.29 1.47 Westpac 0.43 0.69 0.59 0.70 0.37 0.59 0.32 0.35Average 1.16 1.48 1.13 1.10 1.07 1.27 -0.28 0.31 Average 0.50 0.64 0.67 0.63 0.41 0.68 0.39 0.39
Capital adequacy (%) Impaired asset expense/Average gross loans and advances (%)
ANZ32 15.20 14.60 13.50 13.60 13.60 13.90 14.00 14.40 ANZ 0.04 0.06 0.07 0.13 0.05 0.64 0.23 0.27
ASB32 14.80 14.30 14.00 13.50 14.20 13.60 14.00 14.20 ASB 0.16 0.14 0.14 0.05 0.04 0.65 0.59 0.15
BNZ 13.30 13.60 13.70 13.90 14.40 14.10 14.60 14.90 BNZ 0.06 0.13 0.12 0.18 0.14 0.53 0.46 0.31Heartland 13.30 13.10 13.50 12.90 12.60 12.90 12.70 13.40 Heartland 0.79 0.45 0.38 0.50 0.47 0.69 1.48 0.05Kiwibank 15.30 14.90 14.50 13.50 13.20 13.00 12.60 12.30 Kiwibank 0.07 0.08 0.08 0.03 0.06 0.28 0.56 0.03SBS 14.10 14.20 14.30 14.20 14.20 13.80 14.30 14.90 SBS 0.38 0.40 0.29 0.35 0.48 2.44 0.39 0.09TSB 14.80 14.60 14.50 14.60 14.60 14.30 14.90 15.10 TSB -0.16 0.36 -0.06 0.05 0.03 1.29 -0.01 -0.05Co-op 17.20 17.10 16.60 16.70 16.40 16.30 16.90 16.90 Co-op 0.13 0.16 0.13 0.03 0.10 1.03 0.12 0.09
Westpac32 16.90 16.50 16.70 15.90 15.90 15.90 16.60 17.10 Westpac 0.03 0.04 -0.03 -0.08 0.10 0.87 0.54 -0.04
Average 0.08 0.10 0.08 0.08 0.08 0.67 0.44 0.17
Net profit ($Million) Operating expenses/Operating income (%)
ANZ 456 473 504 392 367 422 327 220 ANZ 38.14 35.23 34.29 45.63 44.88 33.93 43.97 54.60 ASB 292 329 282 310 252 192 130 270 ASB 35.22 33.58 37.72 35.89 43.48 38.09 49.46 38.55 BNZ 253 296 313 160 238 129 187 209 BNZ 40.42 35.66 35.47 61.11 40.38 58.00 41.97 41.65 Heartland 13 18 20 18 17 17 9 21 Heartland 47.60 39.96 40.16 42.77 45.02 40.78 48.39 40.28 Kiwibank 30 25 20 25 27 17 -12 24 Kiwibank 71.71 74.33 78.57 78.13 79.01 75.76 91.00 78.94 SBS 8 6 8 8 6 -4 8 10 SBS 62.97 65.97 62.14 64.21 65.58 56.07 59.78 59.36 TSB 13 5 14 13 12 -8 9 12 TSB 60.63 69.31 54.14 54.46 60.00 80.68 66.31 60.76 Co-op 3 1 2 2 3 -1 3 4 Co-op 76.33 87.88 80.00 82.09 75.48 75.77 74.52 74.65 Westpac 266 300 284 280 203 132 107 238 Westpac 39.89 37.45 39.91 41.82 47.07 42.68 50.79 44.14 Total 1,335 1,455 1,447 1,207 1,125 896 770 1,008 Average 40.91 38.27 39.21 47.89 46.61 44.25 48.95 47.85
FIPS 2020 | KPMG | 45
© 2021 KPMG, a New Zealand Partnership and a member firm of the KPMG global organisation of independent member firms affiliated with KPMG International Limited, a private English company limited by guarantee. All rights reserved.

%
ASB
ANZ
BNZ
KIWIBANK
WESTPAC
4.00
-3.00
-1.00
0.00
1.00
2.00
3.00
DEC 18 MAR 19 JUN 19 SEP 19 DEC 19 MAR 20 JUN 20 SEP 20
-2.00
SOURCE RBNZ BANK FINANCIAL STRENGTH DASHBOARD:
%
ASB
ANZ
BNZ
KIWIBANK
WESTPAC
2.40
1.60
1.70
1.80
1.90
2.00
2.10
2.20
2.30
DEC 18 MAR 19 JUN 19 SEP 19 DEC 19 MAR 20 JUN 20 SEP 20SOURCE RBNZ BANK FINANCIAL STRENGTH DASHBOARD:
18 MAJOR BANKS: INTEREST MARGIN (QUARTERLY)
19MAJOR BANKS: INCREASE IN GROSS LOANS AND ADVANCES (QUARTERLY)
$MILLION
600
ASB
ANZ
BNZ
KIWIBANK
WESTPAC
-100
0
100
200
300
400
500
DEC 18 MAR 19 JUN 19 SEP 19 DEC 19 MAR 20 JUN 20 SEP 20SOURCE RBNZ BANK FINANCIAL STRENGTH DASHBOARD:
17 MAJOR BANKS: NET PROFIT (QUARTERLY)
46 | KPMG | FIPS 2020
© 2021 KPMG, a New Zealand Partnership and a member firm of the KPMG global organisation of independent member firms affiliated with KPMG International Limited, a private English company limited by guarantee. All rights reserved.

ASB
ANZ
BNZ
KIWIBANK
WESTPAC
-0.20
0.00
0.20
0.40
0.60
0.80
1.00
%
DEC 18 MAR 19 JUN 19 SEP 19 DEC 19 MAR 20 JUN 20 SEP 20SOURCE RBNZ BANK FINANCIAL STRENGTH DASHBOARD:
%
0
20
40
60
80
100
DEC 18 MAR 19 JUN 19 SEP 19 DEC 19 MAR 20 JUN 20 SEP 20SOURCE RBNZ BANK FINANCIAL STRENGTH DASHBOARD:
ASB
ANZ
BNZ
KIWIBANK
WESTPAC
21MAJOR BANKS: OPERATING EXPENSES/OPERATING INCOME (QUARTERLY)
22MAJOR BANKS: IMPAIRED ASSET EXPENSE/AVERAGE GROSS LOANS AND ADVANCES (QUARTERLY)
%
0.00
0.20
0.40
0.60
0.80
1.00
1.20
ASB
ANZ
BNZ
KIWIBANK
WESTPAC
DEC 18 MAR 19 JUN 19 SEP 19 DEC 19 MAR 20 JUN 20 SEP 20SOURCE RBNZ BANK FINANCIAL STRENGTH DASHBOARD:
20MAJOR BANKS: NON-INTEREST INCOME/ TOTAL ASSETS (QUARTERLY)
FIPS 2020 | KPMG | 47
© 2021 KPMG, a New Zealand Partnership and a member firm of the KPMG global organisation of independent member firms affiliated with KPMG International Limited, a private English company limited by guarantee. All rights reserved.

What will 2021 bring amid the fierce battle against cyber crime?
Philip WhitmorePartner – Cyber Security Services KPMG
Philip is a Partner in our Cyber Security Services practice with over 25 years’ hands-on experience helping organisations manage their cyber security risks. He has worked extensively in the financial services sector, including with a range of banks.
As the world reels under Covid-19’s sudden and profound disruption – and nations wonder who and what to depend on for solutions as uncertainty prevails – maintaining trust in businesses and in technology will be crucial in the year ahead.
We’ve debated the evils of fake news and control over social media, worried about the privacy implications of tracing apps, watched conspiracy theories over 5G proliferate, and agonised over the national security of our technology supply chains.
Underlying each of these debates is the notion of trust – a theme that in 2021 will continue to dominate public sentiment everywhere as people look for leadership, comfort and reassurance of better days to come. Public trust will no doubt be tested along the way, particularly as the threat of costly organised cyber crime attacks continue playing on our fears and arousing doubts.
With New Zealand financial institutions increasingly being targeted by cyber-criminals, never has it been more important to ensure that our cyber-resiliency is robust. The likes of the NZX distributed denial-of-service attack, along with the recent breaches at the Reserve Bank of New Zealand (RBNZ) and Staircase Financial Management, should be a wakeup call to us all.
Ransomware – the cost is becoming intolerableOrganised cyber-crime groups continue to find ransomware all too lucrative to ignore, particularly as the pandemic undermines global economic stability.
As a result, there are three ongoing threats that New Zealand businesses need to anticipate and prepare for:
1. The rise in ransom demands, which have soared from four or five-figure sums into millions of dollars.
2. The dramatic rise in the cost of remediation amid the proliferation of remote working arrangements, with criminals increasingly targeting the infrastructures that support today’s distributed workforce.
3. Double extortion, in which criminal groups have begun blackmailing firms with the threat of auctioning or publicising stolen data.
Organisations typically find themselves torn between the reputational risk of ‘financing’ organised crime by complying with demands and fulfilling their fiduciary duty to protect shareholder interests. More often than not, unfortunately, businesses are paying up in order to maintain operations and avoid potentially catastrophic results.
Regulation comes our wayNew Zealand has minimal regulation with regards to cyber security, and this has no doubt contributed to the majority of New Zealand organisations being relatively immature when it comes to cyber security. Regulators are increasingly watching this space, particularly given the increasing volume of significant cyber-attacks New Zealand organisations have experienced over the last two years.
As a result, in October 2020 the RBNZ released draft guidance on what regulated entities should consider when managing cyber security. While the guidance is not particularly onerous and draws upon existing good practices, many financial services organisations will currently struggle to meet a range of aspects within the guidance.
48 | KPMG | FIPS 2020
© 2021 KPMG, a New Zealand Partnership and a member firm of the KPMG global organisation of independent member firms affiliated with KPMG International Limited, a private English company limited by guarantee. All rights reserved.

Rather than waiting for the draft guidance to be finalised, organisations should be measuring the effectiveness of their cyber-resilience against the guidelines now so that they can start to plan how they will go about closing the gaps.
Global cyberspace suspicions and tensions are on the riseTensions arising over the diversity of ideological views concerning governance of cyber-space have been evident among nations for years. In 2020, we saw more government interventions aimed at localising cloud services amid national security and privacy fears, plus controls over social media channels or steps to limit dependence on foreign, and allegedly untrustworthy, technology. Covid-19 has only exacerbated these tensions, with nervous nations increasingly accusing each other of cyber espionage and interference in their internal affairs. In 2021, we can expect nations to exert increasing control over ‘their’ cyberspace ecosystems, despite little international consensus and the potential for many cyber-crime flashpoints.
To meet increasingly complex and extra-territorial privacy regulations and national security requirements, global firms will be driven to localise how they process and handle data. In return, they will be increasingly vocal about the divergence of national approaches.
Head in the cloudsCovid-19 has demanded pragmatism in the battle to secure today’s rapidly evolving information technology (IT) environments. Suddenly organisations had to worry about effectively managing hundreds of staff working from home and an aggressive shift to the cloud. This will see the focus for security in 2021 evolving from securing corporate IT boundaries to a broader view of enterprise security.
The timescale for many cloud-migration projects has collapsed from years to mere months in the race to meet fast-changing business needs. Hyperscale cloud providers are increasingly dominant and intently focused on security, making 2021 the year in which organisations are forced to truly understand what security in the cloud really means. For some businesses, the shift in business models has been particularly abrupt, raising concerns about criminals targeting new vulnerabilities amid the wave of new or quickly scaled online platforms.
Don’t forget about peopleAmid the convergence of technology-related security concerns, the impact of today’s troubling environment on people cannot go unrecognised. Work patterns have quickly changed for many employees, while others have found themselves suddenly unemployed. Organisations will understandably be cautious about rehiring and may choose to permanently reshape their workforce models.
At the same time, people have found new ways of working and perhaps have had the time and space to consider their future employment options. Employers are worried about employee loyalty in these volatile times, while employees are worried about the loyalty of their employers. As a result of today’s uniquely turbulent workforce conditions, concerns over insider threats and fraud are quickly growing.
The best organisations will reassuringly engage their teams and support them in securing their homes, families and workplaces in the new workforce environment – while others may drift into increasingly draconian corporate surveillance of a potentially disgruntled cadre.
Time to change how we manage cyber security riskAlthough New Zealand organisations are taking cyber security more seriously than ever before, and increasing the amount they invest in managing cyber security risk, we continue to have low maturity and the number of incidents grow. It’s time to change how we approach cyber security.
It often comes down to risk management. Most financial institutions have a framework for managing enterprise risk, yet cyber risk is usually still treated differently from other risks; and that is a mistake. Every organisation needs a framework for managing cyber security risk, and this should be integrated into the organisation’s existing enterprise risk framework. The key to this is making it part of the mainstream risk management practices of an organisation, not simply a one or two-line item in the risk register based on some commentary from IT.
The average time for a New Zealand organisation to identify that it has been breached is over a year.
How quickly an organisation can identify and close down a cyber incident is crucial to success as well. We need to be able to identify a potential cyber incident within minutes of it happening, yet the average time for a New Zealand organisation to identify that it has been breached is over a year. The focus needs to change from trying to build bigger and bigger walls to keep the cyber-criminals out, to a broader view of risk management, including ensuring we have effective people, processes and technology to detect and respond to a cyber-attack.
With no let-up in sight from cyber-criminals and the risks continuing to grow, there is no better time than now to ensuring your organisation is cyber resilient.
FIPS 2020 | KPMG | 49
© 2021 KPMG, a New Zealand Partnership and a member firm of the KPMG global organisation of independent member firms affiliated with KPMG International Limited, a private English company limited by guarantee. All rights reserved.

Pandemic response: Building and maintaining the trust
Adele WallaceDirector – Advisory KPMG
Adele is a Director in KPMG’s Auckland practice specialising in conduct risk. Adele brings valuable insight and a rich range of experience in approaches to conduct risk across banking and general insurance through her extensive work in the regulatory practice at KPMG UK and her previous roles in the industry.
The banks have been quick to step up and offer support to customers impacted by Covid-19, both as directed by the regulators, but also of their own volition. It is undeniable that they have done a great job at creating good customer outcomes for impacted mortgagees and struggling businesses, but they need to ensure that they maintain this momentum as we continue to recover from the economic impact of lockdowns.
Many organisations have risk management plans for a range of situations, the banks being no exception, but how many would have or could have predicted a global pandemic and the way it has fundamentally affected people’s everyday lives. Covid-19 has created a range of challenging circumstances for customers, with many people feeling anxious and uncertain. The banks have responded quickly and thoughtfully to these circumstances, with a customer-centric approach, by:
— offering full mortgage deferrals or interest only payments;
— providing overdraft extensions with an interest free period;
— introducing free overdraft facilities for those who did not previously have one;
— moving branch staff into the call centres to help deal with the number of inquiries; and
— reducing interest rates on the back of lower funding costs.
These actions demonstrate that the banks have picked up on the concerned feelings of the public and made positive customer outcomes a key priority during such a turbulent time. They do deserve a pat on the back for their efforts, as without them, a lot of people could have been hit a much harder than what they were. As a result, the banks have built up a lot of public and regulator trust in a relatively short amount of time. It is now up to them to ensure that they continue to do the right thing.
The banks have built up a lot of public and regulator trust in a relatively short amount of time.
We seem to be on the mend from the impact of the lockdowns in New Zealand, but this is not a static situation and things will move again when the borders are reopened, not to mention the potential risk of another outbreak. Creating good customer outcomes is also an evolving process, as what customers need will change over time. This means the banks cannot sit back and take their foot off the pedal, instead they must work to maintain and preserve the trust that they have built or risk losing it once again.
The banks cannot sit back and take their foot off the pedal
To illustrate changing customer needs, we can use the interest free overdraft facility as an example. A small business that was given an interest free overdraft facility by their bank uses it to pay a bill in April while they were unable to operate due to lockdown restrictions. At the time, the interest free overdraft facility was the best outcome for this customer as it allowed them to pay their bill and continue to operate after lockdown.
50 | KPMG | FIPS 2020
© 2021 KPMG, a New Zealand Partnership and a member firm of the KPMG global organisation of independent member firms affiliated with KPMG International Limited, a private English company limited by guarantee. All rights reserved.

However, months later the interest free period is ending, and the business is still in the red, unable to get back to the green without an injection of cash. What was originally a great customer outcome has now turned into a poor customer outcome, as the business is trapped in the overdraft cycle and is being charged interest on the amount. To ensure the customer continues to receive positive outcomes, the banks need to work out how they can support the customer to get back to where they were and take the steps to make this happen or risk looking like they have exploited vulnerable customers.
To ensure the customer continues to receive positive outcomes, the banks need to work out how they can support the customer to get back to where they were and take the steps to make this happen or risk looking like they have exploited vulnerable customers.
Over the last few years banks’ names have been dragged through the dirt for poor conduct, but they have really stepped up in 2020, taking a key role in supporting the New Zealand economy, and built some goodwill as a result. However, a number of banks also suspended a lot of their quality assurance work due to the lack of staff, leaving a potential risk that there could be undetected issues regarding conduct during this time. If poor conduct during a time when so many were vulnerable was uncovered, any trust built would be destroyed, and reputations would be eroded if it was not managed appropriately.
To maintain the goodwill and trust built this year, working out how good customer outcomes can be integrated into business as usual will be a crucial element going forward. Banks will also need to recognise that good outcomes will differ for each customer, and a ‘one size fits all’ approach will not generate the best and most sustainable results.
Some things for banks to consider include:
— Are customers being told how much their repayment holiday has cost long term?
— Are further extensions needed and if so, what impact does it have for the customer and the bank?
— For those who are continuing to struggle, do they need a mortgage restructure or would supporting them through a mortgage resale be better for them over the longer term?
— Are customers in overdraft being supported to come back into the green?
— How are staff being prepared to deal with these situations?
FIPS 2020 | KPMG | 51
© 2021 KPMG, a New Zealand Partnership and a member firm of the KPMG global organisation of independent member firms affiliated with KPMG International Limited, a private English company limited by guarantee. All rights reserved.

Focus on climate change
Justine SeftonAssociate Director – Sustainable Value KPMG
Justine is a climate change and sustainability specialist with 20 years’ experience across public and private sectors, in New Zealand and internationally – as a lawyer, policy and regulatory adviser, UNFCCC negotiator, consultant and responsible investment/ESG senior analyst. Justine’s experience working on these issues from multiple stakeholder perspectives and interests enables her to genuinely bridge policy and investment worlds.
Late last year, the Government declared a ’climate emergency‘ together with many countries around the world and in response to the continued advocacy of the New Zealand public,33 essentially repledging its commitment to tackling climate change as a priority.
Following in the wake of this, on 31 January 2021, the Climate Change Commission34 (CCC) released its draft advice to the Government on meeting New Zealand’s 2050 domestic emissions reduction targets set under the ‘Zero Carbon Act’35 and making a fair contribution to global mitigation efforts in line with the Paris Climate Agreement goal of limiting the temperature increase to 1.5 degrees Celsius.36 The CCC urges the Government to pick up the pace on climate change, warning that New Zealand will not meet its targets without immediate and decisive action.
The CCC urges the Government to pick up the pace on climate change.
Climate Change Commission’s draft advice to the Government The CCC draft advice proposes the first three emissions budgets for New Zealand, out to 2035, and makes strategic policy recommendations on how these budgets could be achieved – intended to inform the development of a national Emissions Reduction Plan by the Government for release later this year.
The emissions budgets comprise an annual average reduction of from 2018 levels of carbon emissions of 2% each year between 2022 and 2025, 17% reduction each year between 2025 and 2030 and 36% each year between 2030 and 2035. There is also a breakdown of that this looks like by greenhouse gas category (biogenic emissions versus other greenhouse gas types) and by sector37.
The CCC advises that these budgets would need to be met primarily through reducing carbon emissions here in New Zealand, and by reducing actual emissions at source rather than relying on forestry offsetting. This would require action across all sectors of the economy.
Priority areas for action include:
— a rapid shift to electric vehicles as well as electrification and use of low-carbon fuels for non-road transport, and developing an integrated national transport network including changes to urban design and freight movement;
— phasing out fossil fuels and increasing use of renewable energy, low-emissions technologies and energy efficiency across power generation, industrial processes and buildings;
— moving towards a circular economy and methane capture from landfill;
— improving farm practices (including reducing stock numbers) and developing an integrated land strategy that includes water, biodiversity and climate change; and
— planting more native trees to provide a long-term carbon sink.
52 | KPMG | FIPS 2020
© 2021 KPMG, a New Zealand Partnership and a member firm of the KPMG global organisation of independent member firms affiliated with KPMG International Limited, a private English company limited by guarantee. All rights reserved.

The CCC concludes that this is all achievable using current technology and behavioural change, and at a lower cost than was previously estimated. It also highlights the significant economic opportunities and other benefits it would create. It calls for the development of an Equitable Transition Strategy to address support affected industries, regions and communities.
The CCC concludes that this is all achievable using current technology and behavioural change, and at a lower cost than was previously estimated.
Among measures to support this transition, the CCC recommends:
— changes to the Emissions Trading Scheme, to align the scheme with its proposed emissions budgets, drive domestic emissions cuts, and encourage native over exotic afforestation. This includes adjustments to unit volumes and price control settings and to forestry incentives, review of industrial allocation policy and enabling voluntary offsetting. This is expected to influence the future carbon price trajectory.
— implementation of the Government’s policy on mandatory climate-related financial risk disclosure (see below) and exploring the creation of a similar regime that covers public entities at the national and local level as well as evaluating the potential benefits of this mandatory disclosure by financial institutions of the emissions enabled by loans over a specified threshold.
— ensuring Government’s policy and investment decisions are net-zero compatible, and encouraging local government and the private sector to do the same, including through:
– the use of shadow carbon pricing in analysis;
– alignment of post-Covid-19 economic stimulus spending and the Infrastructure Commission’s investment framework with climate goals;
– developing plans to mobilise private sector finance for low-emissions and climate-resilient investments; and
– potential incentives for businesses to retire emissions-intensive assets early.
The CCC found New Zealand’s first Nationally Determined Contribution (NDC)38 under the Paris Climate Agreement to be incompatible with a 1.5 degrees Celsius pathway and recommended it be strengthened, with the purchase of international offsets as necessary to meet it and supplement domestic action determined through the national emissions budgets and plans.
The CCC found New Zealand’s first NDC under the Paris Climate Agreement to be incompatible with a 1.5 degrees Celsius pathway and recommended it be strengthened.
The CCC’s draft advice is open for consultation until 14 March with final advice due by the end of May. There are wide-ranging implications for banks to consider across strategy, products and portfolios, operations and culture, stakeholder engagement, advocacy and disclosure.
Mandatory climate related-risk reporting for the sectorLast year, the Government announced plans to introduce a mandatory climate-related financial risk reporting regime, based on the recommendations of the Task Force on Climate-related Financial Disclosures (TCFD) framework, on a ‘comply or explain’ basis. This will be executed through amendments to the Financial Markets Conduct Act 2013.
The requirements will apply to listed issuers and to registered banks, licensed insurers and managers of registered investment schemes that meet certain thresholds. They will need to make annual disclosures – as part of their financial reporting – on their governance of, exposure to and strategy for managing material climate change-related physical and transition risks and opportunities.
If implementing legislation is approved by Parliament (which seems likely), reporting entities could be required to make their first disclosures in 2023. The External Reporting Board has started work on development of the necessary reporting standards – as part of its broader ‘Extended External Reporting’ remit – with third-party assurance of disclosures anticipated in the future. The Ministry for the Environment is leading the development of guidance for scenario analysis, which is likely to be one of the more challenging areas for reporting entities. There will be consultation processes for both. The Financial Markets Authority will be responsible for oversight and enforcement of the new regime to ensure compliance and quality disclosures.
FIPS 2020 | KPMG | 53
© 2021 KPMG, a New Zealand Partnership and a member firm of the KPMG global organisation of independent member firms affiliated with KPMG International Limited, a private English company limited by guarantee. All rights reserved.

The response of New Zealand’s banking sector will be pivotal, given its role in the economy and its exposure of lending portfolios to property and agriculture in particular (with both sectors carrying significant physical and transition risk and opportunity).
The response of New Zealand’s banking sector will be pivotal, given its role in the economy.
Where they are not doing so already, banks should be preparing now for the new regime and considering the implications as both preparers and users of TCFD-aligned disclosures. They will need to embed any consideration of climate-related factors into lending, investment and procurement decision-making, and identify what information they will need from customers and suppliers. They may also wish to offer support and incentives to their customers and suppliers to improve risk management, increase resilience and contribute to climate solutions.
New Zealand’s progress towards ESG reportingBased on a recent KPMG Global Survey on Sustainability Reporting 39 Overall, New Zealand organisations have progressed slowly towards improving quality of reporting over the last three years, with many only now beginning their journeys towards robust Environmental, Social and Corporate Governance (ESG) disclosure. Levels of reporting within New Zealand are noticeably behind those of global organisations and our major trading partners. While an increase in ESG reporting is promising it would best be combined with a drive towards quality reporting; on an international scale this is increasingly being achieved through organisations acquiring independent assurance over significant non-financial disclosures.
Across all sectors, 74% of New Zealand organisations report on sustainability performance, with only 28% of this ESG information receiving independent assurance. These findings indicate New Zealand’s uptake of ESG is lagging behind global levels, with 80% of organisations reporting and 49% of reported information receiving independent assurance. Of the New Zealand based early ESG adopters, 23% have utilised the TCFD framework.
While the sector’s performance is promising compared to the global average, a clear gap is observable between Kiwi financial institutions and our Australian counterparts.
Currently financial institutions in New Zealand outperform global ESG trends in acknowledgement of climate change related risks, reporting of carbon reduction targets, adoption of science-based targets and adoption of TCFD recommendations. While the sector’s performance is promising compared to the global average, a clear gap is observable between Kiwi financial institutions and our Australian counterparts, with 60% of New Zealand’s financial institutions reporting on ESG compared to 100% across the Tasman. It is of interest to note that 43% of Australian sector entities receive independent assurance over this information while no New Zealand entities receive independent assurance40. Those local entities in the sector with Australian parents are lifting the New Zealand sector performance average with the opportunity to leverage off the great work undertaken by our neighbours.
54 | KPMG | FIPS 2020
© 2021 KPMG, a New Zealand Partnership and a member firm of the KPMG global organisation of independent member firms affiliated with KPMG International Limited, a private English company limited by guarantee. All rights reserved.

FIPS 2020 | KPMG | 55
© 2021 KPMG, a New Zealand Partnership and a member firm of the KPMG global organisation of independent member firms affiliated with KPMG International Limited, a private English company limited by guarantee. All rights reserved.

Clare BolingfordDirector of Banking and Insurance Financial Markets Authority
Clare leads coordination and market engagement at the Financial Markets Authority (FMA) for the expected conduct licensing regime of banks and insurers. Clare previously worked for the Financial Conduct Authority in the UK for almost 20 years, most recently as Head of Cross-Cutting Policy and Head of Supervision for Retail Banking Groups. She also spent two years at the UK Treasury, leading capital markets and prudential policy.
In the past 12 months the banking industry and regulators faced new challenges in responding to Covid-19. While New Zealand finds itself in a special position globally, the pandemic constantly reminds us that we cannot be complacent. Similarly, the financial services sector cannot be complacent about the lessons of Covid-19, which showed why focusing on customer needs and outcomes need to be front of mind.
Working with the Council of Financial Regulators, the FMA re-focused priorities to ensure that the financial sector was supported in responding to the challenges related to the pandemic.
These impacts are ongoing and we will continue to support the industry through the months ahead, as everyone adapts to the changing economic and regulatory environment.
Impact of CovidIn a year dominated by Covid-19, we reprioritised activities to ensure market participants were able to focus on their customer needs at a time where many banks experienced business disruption and significantly higher volumes of customer interactions.
The FMA responded to Covid-19 by looking for ways to ease regulatory burdens, while still ensuring protection for investors and customers.
The FMA responded to Covid-19 by looking for ways to ease regulatory burdens, while still ensuring protection for investors and customers.
We published guidance for market participants, and information for KiwiSaver members and other investors facing market volatility.
KiwiSaver experienced its first year of negative returns – putting the spotlight on fees – and fund switching increased 54% when compared with the previous year, with $1.5 billion flowing from balanced and growth funds to conservative and cash investments. We reminded providers that they should be considering generic financial advice to members so that they understood the implications and risks involved with switching funds at a time of high market volatility. We were pleased to see many providers stepped up to the task, supporting members and helping them to maintain a long-term view for their nest egg.
KiwiSaver experienced its first year of negative returns.
We also responded to scams exploiting Covid-19 by increasing consumer outreach.
Conduct expectations – maintaining momentumFollowing the joint FMA and Reserve Bank of New Zealand (RBNZ) Conduct and Culture reports, we asked banks to maintain the momentum of the actions taken to date and ensure good practices are being embedded within their business. Themes and findings from this ongoing work are being used to inform our regular monitoring.
FMA: Agility, the key to managing Covid-19 and changing regulations
56 | KPMG | FIPS 2020
© 2021 KPMG, a New Zealand Partnership and a member firm of the KPMG global organisation of independent member firms affiliated with KPMG International Limited, a private English company limited by guarantee. All rights reserved.

We asked banks to maintain the momentum of the actions taken to date and ensure good practices are being embedded within their business.
We are looking for banks to do more to show us what incremental and long-lasting impacts are being made over time, and for them to demonstrate to their Boards the value of their action plans.
We have seen some entities embedding their conduct and culture programmes into their business models and everyday activities, so that it becomes a sustainable and core part of their business, rather than a special project with a finite end date – this is what we expect to see in all banks.
We acknowledge that responding to Covid-19 has required significant effort from banks and, for some, this has impacted their progress in implementing their conduct and culture plans.
The issue of how market participants treat customers whose personal circumstances may increase their vulnerability gained prominence over the last year in light of Covid-19. We were pleased to see some positive steps by banks in this area.
We published our expectations for how firms should develop and operate the key aspects of their vulnerability policies and processes, to ensure customers have their needs met in a way that is appropriate for their individual circumstances.
Regulatory changePreparing for the Financial Services Legislation Amendment Act was a key focus for the FMA during 2020. This new regime, deferred until 15 March, will bring significant changes to the way financial advice can be provided in New Zealand.
We have undertaken a programme of significant engagement with those who will need to be licensed under the new regime.
The Financial Markets (Conduct of Institutions) Bill is continuing through the legislative process. If passed, it will give the FMA a greater remit to regulate the conduct of banks, insurers and non-bank deposit takers.
For banks and insurers who have successfully embedded good conduct risk management and can demonstrate the positive impact on customer outcomes, this law change will formalise the work that has already been done.
We will be engaging with banks, insurers and non-bank deposit takers early in the process of implementing this new conduct regime to understand any questions and concerns, and to share insights and learnings about conduct risks specific to each sector. We will also be working closely with the Reserve Bank and other regulators.
Turning to KiwiSaver, we received strong engagement from the industry on our proposed guidance for fees. We are considering the feedback and will release our final guidance in due course. We will also be supporting the KiwiSaver default provider review, including the new requirements for carbon and fossil fuel assets and associated disclosure obligations.
Future focusLooking ahead, in 2021 we will maintain our emphasis on all market participants prioritising customers’ interests and ensuring that all are treated fairly.
We are closely monitoring investor behaviour and emerging risks, particularly the search for yield in a low interest rate environment. We are aware that many consumers are shifting money from conservative investments like term deposits into higher risk investments, such as shares, which has been made even easier by digital investing platforms.
The FMA is supporting New Zealand’s transition to an integrated financial system, which is focused on broader capital issues than just financial performance. To that end, we issued industry guidance on green, socially responsible, and other such investments in late 2020. There is burgeoning growth of these investments across the globe, with increased appetite from Kiwi investors and issuers. We will be closely monitoring for any concerns about issuers ‘greenwashing’.
We will also concentrate on preparing for and implementing new regulation, as well as building on our understanding of new sectors that we are being entrusted to regulate. We will continue working closely with other regulators to coordinate the range of regulatory change that is impacting all firms in the financial services arena.
Increased reliance on digital or electronic banking channels is likely to expose banks to new types of risks and vulnerabilities, which will need to be managed. The FMA will be monitoring these cyber security risks and those arising from new technology and increased digitisation.
While the year ahead will continue to present challenges in managing uncertainty, we remain confident that the industry will focus on building more resilient businesses that prioritise good conduct.
FIPS 2020 | KPMG | 57
© 2021 KPMG, a New Zealand Partnership and a member firm of the KPMG global organisation of independent member firms affiliated with KPMG International Limited, a private English company limited by guarantee. All rights reserved.

Christina LeungPrincipal Economist and Head of Auckland Business, Head of Membership Services NZIER
Christina Leung is a Principal Economist at the New Zealand Institute of Economic Research (NZIER), where she heads up Membership Services and the Auckland practice. As Head of Membership Services, Christina looks after NZIER’s economic forecasts and analysis of the NZIER Quarterly Survey of Business Opinion.
Christina has over 16 years’ experience working in the public and private sectors, having worked at the Reserve Bank of New Zealand and ASB Bank prior to joining NZIER.
Christina holds a Bachelor of Commerce with first class honours in Economics from the University of Auckland and has been a Chartered Financial Analyst (CFA) since 2010. She has also been a Board Director of CFA NZ since 2019.
The New Zealand economy has proven to be more resilient than most had expected. Economic activity rebounded strongly across many areas as New Zealand moved down the Alert Levels, supported by the unprecedented amount of stimulus from the Government and the Reserve Bank. For businesses, the combination of reduced uncertainty with the decisive outcome of the general election and improving demand has underpinned a recovery in business confidence, and made businesses feel more positive about investment.
The latest NZIER Quarterly Survey of Business Opinion (QSBO) shows businesses are once again looking towards investment in buildings, which is supporting the stronger pipeline of construction. The QSBO measure of architects’ activity in their office shows an increase in the pipeline across residential, commercial and Government construction. With construction demand rebounding strongly over the second half of 2020 there are signs of capacity pressures re-emerging in the building sector. These pockets of capacity pressures in the economy should drive a lift in underlying inflation.
• SEE FIGURE 23 – PAGE 5923
However, banks’ continued caution about lending towards the corporate sector and for commercial property presents some headwinds to commercial construction, despite improving appetite for investment amongst businesses. The RBNZ Credit Conditions Survey shows a mismatch between credit demand and supply. Although demand for borrowing in the residential and corporate space picked up over the second half of 2020, banks were cautious about lending across the sectors.
The RBNZ Credit Conditions Survey shows a mismatch between credit demand and supply.
The introduction by the Reserve Bank in early December 2020 of its Funding for Lending Programme (FLP) offering banks up to $28 billion of three-year funding at the Official Cash Rate (currently 0.25%) should alleviate some caution amongst banks towards lending. The FLP allows banks to borrow up to 6% of their outstanding loans to households and businesses, which would provide more certainty for banks about its ability to access cheap funding. Banks can then pass onto its customers in the form of lower borrowing costs and easier access to credit. This should encourage spending and investment amongst households and businesses.
The FLP is one of an unprecedented programme of stimulus measures from the central bank and government to support the New Zealand economy as it navigates the recovery through the Covid-19 outbreak. Other stimulus measures include decreases in the OCR, introducing the Large Scale Asset Purchase Programme (LSAP) to increase liquidity in the economy to support increased Government spending on infrastructure and welfare.
NZIER: Improving business confidence supports investment demand
58 | KPMG | FIPS 2020
© 2021 KPMG, a New Zealand Partnership and a member firm of the KPMG global organisation of independent member firms affiliated with KPMG International Limited, a private English company limited by guarantee. All rights reserved.

The FLP is one of an unprecedented programme of stimulus measures from the central bank and government to support the New Zealand economy.
New Zealand economic activity has rebounded in response to these measures. In particular, housing market activity surged as record low mortgage rates encouraged investment in housing. The increase in house sales has in turn supported retail spending, although the increase in spending in recent months has yet to make up for the reduced spending experienced over the lockdown period. Barring the effects of continued border restrictions which has had an uneven impact on the economy, activity in New Zealand has largely returned to normal given our relative success in containing further outbreaks. We expect continued low interest rates and Government spending will support a further recovery in the economy over the coming years, as households and businesses feel more confident about spending and investment.
NET % OF ARCHITECT FIRMS
GOVERNMENT
HOUSING
COMMERCIAL
SOURCE NZIER:
-80
-40
-20
0
20
40
80
2008 2010 2012 2014
60
-60
2016 2018 2020
23ARCHITECTS WHO EXPECT AN INCREASE IN CONSTRUCTION PIPELINE
FIPS 2020 | KPMG | 59
© 2021 KPMG, a New Zealand Partnership and a member firm of the KPMG global organisation of independent member firms affiliated with KPMG International Limited, a private English company limited by guarantee. All rights reserved.

NZBA: Delivering in a crisis
To describe 2020 as a memorable year might be the understatement of the century. 2020 made an indelible impression on most of us because of many things, including a conclusion to Brexit negotiations, an end to the Trump presidency, and our own general election which returned the government with an unprecedented majority in the MMP era. Above all else, we experienced the Covid-19 global pandemic that caused huge human loss and suffering and rocked economies the world over, and continues to do so.
We have never seen such a global reaction to a pandemic as we have with Covid-19. New Zealand’s response, in the face of significant uncertainty at the beginning of the health crisis, is now widely acknowledged as among the world’s best. We closed our borders for the first time ever and had a comprehensive lockdown early on. These actions set us up with a solid foundation to respond to later community outbreaks.
Roger BeaumontChief Executive New Zealand Bankers’ Association
The New Zealand Bankers’ Association (NZBA) is the voice of the banking industry. Roger leads NZBA’s commitment to support a strong and stable banking system that benefits New Zealand households, businesses and the economy.
Roger joined NZBA in January 2019. Prior to this role, Roger spent seven years in executive leadership roles in the banking industry in New Zealand and Australia. The earlier part of his career was predominantly in the broadcast and digital media industry.
Supporting financially affected customers Our banks played a role as part of the ‘team of five million’ coordinated response. Working with the Government, the Reserve Bank of New Zealand, and credit reporting agencies, banks moved quickly to offer loan repayment deferrals and reduced loan repayments for customers financially affected by the pandemic. That provided immediate relief for many. Around $70 billion in household and business loans had all repayments deferred or reduced. Most of those loans are now back to normal repayments, thanks to the ‘NZ Inc’ response to the pandemic and consequently better-than-expected economic conditions.
At the same time, banks pro-actively contacted business customers to ensure that they had access to credit and other support. In addition to reduced loan repayments and full deferrals, that included restructuring and consolidating loans, and providing short-term funding. Banks also supported the Government’s Business Finance Guarantee Scheme.
The pandemic also hastened trends in banking that were already happening.
With most bank branches closed during the lockdowns, the pandemic also hastened trends in banking that were already happening. While many people already enjoy the convenience of banking via the internet and on their smart phones, the pandemic encouraged others to go digital out of necessity. Banks helped those customers make the move to digital banking. They also supported older customers with dedicated prioritised phone lines to help them speak to someone about their banking needs.
60 | KPMG | FIPS 2020
© 2021 KPMG, a New Zealand Partnership and a member firm of the KPMG global organisation of independent member firms affiliated with KPMG International Limited, a private English company limited by guarantee. All rights reserved.

Trialling regional Banking HubsIn late 2020, we launched a year-long trial of regional Banking Hubs to test demand for basic banking services in regional communities where bank branches are no longer viable due to lack of customer demand. The trial, which is available to customers of ANZ, ASB, BNZ, Kiwibank, TSB, and Westpac, is running in Twizel, Martinborough, Stoke and Opunake. Three of the sites have community partners who are hosting the Hubs and providing staff services.
The Banking Hubs are based around a Smart ATM that provides for cash deposits (notes and coins) and withdrawals. Online banking is available on tablets at specially designed kiosks, and there are also direct phone lines to banks for personalised service, with staff on site to assist. Hub staff are not able to provide financial advice or assist with individual bank products such as home loans, but can help direct customers to phone or internet banking.
If the trials are successful, and they meet community demand, these Banking Hubs could form the basis of future banking services in small communities.
Other industry initiativesIn addition to providing support to households and businesses financially affected by Covid-19, and rolling out the Banking Hubs trial, the banking industry also delivered a number of other initiatives. They included becoming the first ‘Living Wage’ accredited industry in Aotearoa. That meant 1,800 employees and contractors, including security guards and cleaners, moving onto the living wage and gaining greater economic independence for themselves and their families. All of our 17 member banks, and NZBA itself, have been fully accredited.
Last year, all of our banks also committed to paying suppliers of goods and services within two weeks. The banking industry understands how important prompt payments are to the viability of many businesses. That was especially the case during the early impact of Covid-19. This initiative complemented other banking support for business, as well the broader economic recovery.
We also launched guidelines to help bank staff serve customer needs. They build on the banking industry’s work following the Bank Conduct and Culture Review in 2018. They also reflect the Financial Markets Authority’s expectation that banks will serve customer needs. These initiatives are all about making sure we continue to do the right thing by our customers.
The guidelines outline how banks will:
— treat their customers fairly;
— recognise and prioritise customer interests;
— give customers clear, concise and effective information;
— design and provide products that meet customer needs;
— provide good customer care; and
— identify, fix and learn from their mistakes.
These guidelines for serving customer needs flow from the Code of Banking Practice, and sit alongside our guidelines to help banks meet the needs of older and disabled customers, which we reviewed in 2019.
The Code of Banking Practice sets out at a high level what customers can expect from their bank. The Banking Ombudsman often refers to the Code when considering complaints and disputes between banks and customers.
To make the Code more accessible, we translated the Code into six other commonly used languages – te reo Māori, Samoan, Tongan, simplified Chinese, Hindi and Korean.
NZBA’s member banks who lend on rural properties also entered a funding agreement with the Rural Support Trusts to offer support for farmers struggling with farm debt. The Farm Business Advice Support Fund, managed by Rural Support Trusts, pays up to $6,000 to qualifying farmers for financial or business advice from an independent consultant. Under the agreement, the Rural Support Trusts pay half and the farmer’s bank pays half.
The banking industry was pleased to contribute to the recovery, not only by supporting financially affected households and businesses, but also by delivering several other initiatives to make banking better in a year of crisis.
Continuing to contribute to the recoveryWe won’t forget 2020 for a while. We were hit with a wave of new experiences including lockdowns, staying in our ‘bubbles’, closed borders, social distancing, contact tracing and having to work from home. At first, there was intense uncertainty, both socially and economically. By the end of the year, we had come through better than expected as a country. The banking industry was pleased to contribute to the recovery, not only by supporting financially affected households and businesses, but also by delivering several other initiatives to make banking better in a year of crisis. In 2021 we will bed in that work and continue to support the recovery.
FIPS 2020 | KPMG | 61
© 2021 KPMG, a New Zealand Partnership and a member firm of the KPMG global organisation of independent member firms affiliated with KPMG International Limited, a private English company limited by guarantee. All rights reserved.

It was a year of extremes for residential mortgage lending activity in 2020, with new lows plumbed over April and May; but record levels of activity were being seen by the end of the year. Indeed, the rise in activity over the second half of 2020 was so strong that it far outweighed the lockdown-related hiatus, and left the value of mortgage lending by the banks up by almost 10% for the calendar year. However, the sharp growth in lending to investors has raised the political pressure in the property market, and there may be more regulatory changes to come for the sector in 2021.
Kelvin is a Senior Property Economist at CoreLogic and has a wealth of experience after spending more than 15 years working largely in private sector economic consultancies in both New Zealand and the UK. Kelvin applies macroeconomic trends and data to the property market, both residential and commercial, to provide key insights and tell a compelling story.
CoreLogic: Mortgage activity in 2020 – from slump to recovery
Lending activity slumped then soared …Starting with a look at the actual data for last year, lending activity got off to a solid start in terms of mortgage lending flows, with the Reserve Bank of New Zealand’s (RBNZ’s) figures showing year-on-year increases from January to March; but then lockdown hit very hard. Across April and May, the combined lending flows for those two months were only $7.1 billion – for context, the total for March on its own was $6.2 billion.
At that time, of course, the banks were also dealing with many other issues and had little choice but to look inwards and focus on existing customers rather than trying to win new business. Indeed, the introduction of the mortgage payment deferral scheme, as well as huge numbers of requests for extensions to loan durations and/or a switch to interest-only payments, kept the banks very busy.
New lending volumes … soared to more than $9 billion in November, the busiest single month for at least 7–8 years.
However, as we emerged from lockdown – and despite some pessimistic forecasts for the economy and property market – sentiment started to improve and house buyers returned very quickly. New lending volumes topped $6 billion each during July and August, $7 billion in September and October, and soared to more than $9 billion in November, the busiest single month for at least 7–8 years.
Kelvin DavidsonSenior Property Economist CoreLogic
62 | KPMG | FIPS 2020
© 2021 KPMG, a New Zealand Partnership and a member firm of the KPMG global organisation of independent member firms affiliated with KPMG International Limited, a private English company limited by guarantee. All rights reserved.

… but credit standards remained highHowever, the strong rebound in lending volumes did not come at the expense of credit quality. Indeed, even though the loan-to-value ratio (LVR) speed limits had been removed by the RBNZ on 1 May, most borrowers still found that they needed a 20% deposit, while their income and expenses continued to be scrutinised closely. In addition, serviceability interest rates were often still applied at levels in excess of 6%.
Meanwhile, although the leniency shown by the banks distorted the figures during lockdown, interest-only lending has also remained well contained generally, at around 25% of the total borrowing. For context, for banks in mid-2016, the share of interest-only lending was above 40%.
It is also important to note that a large proportion of New Zealand’s mortgages are on fixed rates. This helps support the country’s general financial stability by giving households time to adjust their spending were they to be faced with the prospect of a higher interest rate when it becomes time to refinance (not that higher interest rates look especially likely anytime soon).
Indeed, with 45% of existing mortgages held by owner occupiers with a fixed rate of up to one year and another 18% by investors on the same duration, this proportion accounts for nearly two-thirds of all debt in this bracket.
• SEE FIGURE 24 – PAGE 63
Mortgage deferrals are being successfully ‘exited’ but rampant investor activity is getting political …Another positive development towards the end of 2020 was the speed at which mortgages were returning to some kind of repayment schedule or, in other words, the deferral was ending. By late May, the RBNZ’s figures showed more than $22 billion of mortgages had been granted a deferral – that was roughly 8% of all mortgages. By December, however, that figure had fallen to less than $3 billion, with little evidence that the end of those deferrals had caused too much pain.
24
By late May, the RBNZ’s figures showed more than $22 billion of mortgages had been granted a deferral.
However, the rebound for mortgage lending has had other consequences. Indeed, the surge in lending to investors (especially those that have less than a 30% deposit) has quickly ramped up the political pressure in the property market, with fears now starting to grow that strong price increases (11% in 2020 on the CoreLogic House Price Index) will reduce housing affordability dramatically and shut out growing numbers of would-be first home buyers (FHBs).
The rebound for mortgage lending has had other consequences.
%
INVESTORS
OWNER OCCUPIERS
SOURCE RESERVE BANK OF NEW ZEALAND:
0
10
20
30
40
50
FLOATING FIXED < 1YEAR FIXED > 1YEAR
24SHARE OF EXISTING MORTGAGE DEBT IN EACH CATEGORY
FIPS 2020 | KPMG | 63
© 2021 KPMG, a New Zealand Partnership and a member firm of the KPMG global organisation of independent member firms affiliated with KPMG International Limited, a private English company limited by guarantee. All rights reserved.

… and hence more regulation is on the wayThat is certainly a legitimate concern and indeed our measures of affordability show that it currently takes an average of more than 8.5 years to save a typical house deposit, above the previous average of 7.5 years and is far in excess of a cyclical low of 6.5 in 2011–12.
We should also note that, while many would-be FHBs are finding it hard to get on the property ladder, others are managing to get over the line. Our Buyer Classification series shows that, as a whole, the market share of purchases for FHBs in 2020 was 24%, which was a record high (see figure 25). Growing numbers of these FHB purchases are supported by KiwiSaver withdrawals.
• SEE FIGURE 25 – PAGE 6425
With the politics having heated up and affordability pressures re-emerging, it looks likely that regulation will be a key feature of the lending/property market in 2021. We have already seen the RBNZ move to reinstate the LVR speed limits from 1 March, and there is surely a growing chance that a 40% deposit requirement for investors could be officially mandated later in the year (ANZ has already done so).
With the politics having heated up and affordability pressures re-emerging, it looks likely that regulation will be a key feature of the lending/property market in 2021.
An extension to the current five-year hold period for the Brightline Test could be on the cards and the RBNZ has also requested the ability to use debt to income ratio caps if and when they deem it necessary.
0
NEWTO MARKET
RE-ENTRY
OTHER
MULTIPLE PROPERTY OWNER CASH
2005
%
15
30
35
20
10
5
25
2008 2011 2014 2017 2020
FIRST HOME BUYER
MULTIPLE PROPERTY OWNER MORTGAGE
MOVER
30%
22%
11%
5%4%3%
5%5%
2%
12%
27%25%
24%
25%
SOURCE: CORELOGIC
25SHARE OF PROPERTY PURCHASES BY EACH GROUP
Cautious optimism for the year aheadOverall, there are many moving parts and a Covid-19 relapse could of course change everything. For now, however, the year ahead looks set to be another solid one for mortgage lenders, and certainly there will not be any shortage of money to lend – given the ongoing asset purchase (QE) programme by the RBNZ, the Funding for Lending Programme, and of course the further delays to extra bank capital requirements (for now, not until mid-2022).
Borrower demand should also remain relatively strong, given that the worst fears about unemployment have now faded. Indeed, if anything, a lack of listings and/or supply could cap property market sales and mortgage lending activity this year, rather than weak demand. After all, many would-be movers are sitting tight (therefore not listing their own property), and few investors are actually selling to make their next purchase while first home buyers obviously sell nothing either. All these factors amount to further restraints on listings volumes.
64 | KPMG | FIPS 2020
© 2021 KPMG, a New Zealand Partnership and a member firm of the KPMG global organisation of independent member firms affiliated with KPMG International Limited, a private English company limited by guarantee. All rights reserved.

FIPS 2020 | KPMG | 65
© 2021 KPMG, a New Zealand Partnership and a member firm of the KPMG global organisation of independent member firms affiliated with KPMG International Limited, a private English company limited by guarantee. All rights reserved.

Dr Christoph SchumacherProfessor of Innovation and Economics Massey University
Professor Christoph Schumacher joined Massey University in 2003. He is Professor of Innovation and Economics at the university and Director of the Knowledge Exchange Hub. Christoph holds under and post-graduate degrees in Engineering and International Business as well as a PhD in Economics (game theory). He also completed a course in Big Data Analytics at the Massachusetts Institute of Technology (USA).
Christoph is the co-creator of GDPLive (gdplive.net) and the New Zealand Shared Prosperity Index (sharedprosperity.co.nz). His work has been published in international journals such as the Journal of Health Economics, Applied Economics, the European Journal of Marketing, the Journal of Industrial Economics and Economics Letters.
Our economy, like every economy in the world, was sent into a dive by the Covid-19 induced lockdown and during the quarter ended June 2020, our Gross Domestic Product (GDP) fell by a record 12.2%. However, immediately following the largest decline in the history of our country, we experienced the largest quarterly GDP increase on record. In Q3 2020, our economy grew by 14.0%, an increase which left us with a manageable annual growth rate of -2.2%.
BackgroundIn this regular FIPS feature, I normally assess the impact of macroeconomic and regulatory events on the banking sector. Specifically, I analyse and forecast the key performance measures of the sector, namely before-tax profit, lending volume, net interest margins (NIM – the difference between interest income and interest expense, expressed as a percentage of lending), and the credit loss rate (CLR – the provision for credit impairment, expressed as a percentage of lending). This year, I will spend less time
comparing my 2020 forecast with the actual figures as no forecasting model in the world could have predicted what unfolded during the year. Instead, I will talk a bit more about key indicators that economists use to check if an economy is on a recovery trajectory.
A brief look at the 2020 key banking performance indicators shows that the banking sector managed the Covid-19-induced lockdown reasonably well. Lending figures increased from $543 billion in Q3 2019 to $577 billion in Q3 2020. Quarterly profits, however, dropped by 34% in the six-month period from $1.70 billion in Q4, 2019 to $1.13 billion in Q2, 2020. There were signs of recovery as quarterly profits increased in Q3, 2020 to $1.56 billion with an expected year-end result of $1.60 billion. Overall, the rolling annual total from Q4, 2019 to Q3, 2020 was $5.7 billion, down by 28% (or $2.2 billion) compared to the same period in the previous year. The drop in profits is partly due to reduced interest income and an increase in operating expenses. As a result of the Covid-19 crisis, CLR increased from a very low 0.07% (Q4, 2019) to 0.27% (Q3, 2020) as customers were struggling to meet payments or payments were deferred. The NIM also dropped from 1.99% (Q4, 2019) to 1.85% in Q3, 2020), thus negatively impacting profit.
A brief look at the 2020 key banking performance indicators shows that the banking sector managed the Covid-19-induced lockdown reasonably well.
The road aheadLet us now look at the road ahead. The latest GDP figures show that the New Zealand economy has bounced back from the initial lockdown-induced shock. While this trend is a positive sign, the future outlook is still uncertain.
“No amount of sophistication is going to allay the fact that all of your knowledge is about the past and all your decisions are about the future.” Former GE Executive Ian Wilson
Massey University: Banking industry review and forecasts
66 | KPMG | FIPS 2020
© 2021 KPMG, a New Zealand Partnership and a member firm of the KPMG global organisation of independent member firms affiliated with KPMG International Limited, a private English company limited by guarantee. All rights reserved.

To get a feeling for this uncertainty, I examine some of the economic leading and lagging indicators (leading indicators are used to predict future growth; lagging indicators confirm underlying patterns that are already in process).
The New Zealand economy has bounced back from the initial lockdown-induced shock… the future outlook is still uncertain.
The key leading indicators are consumer spending, manufacturing and service activity, building consents, house prices, and stock market movements. Consumer spending is high. Activity in retail, accommodation, and restaurants rose by a record 42.8% in the June quarter; and current retail sales volume figures show that this trend continued into Q3 (retail alone shows a growth of 28% from Q2 levels). In turn, high consumer spending has increased activity in the manufacturing sector. The rapid recovery is thought to be supported by the wage subsidies, pent-up demand and the fact that more Kiwis have been holidaying in New Zealand rather than abroad.
The recovery in the service sector, however, seems to be taking longer. In November, the Performance of Services Index (PSI) fell from 50.9 to 47.7, an amount which is below its historical average of 54.0.
In September 2020, new dwelling building consents nationally rose 3.5%, compared to those in the previous year.
Also, the monthly value of building consents issued in Auckland exceeded $1 billion, an amount which was an historic high.
In Q3, construction rose 52.4%; manufacturing rose 17.2%; and electricity, gas, water, and waste services 5.6%, signalling a recovery in the goods-producing industries. This is confirmed by the Performance of Manufacturing Index (PMI) which dropped slightly in October, but increased in November from 52.3 to 55.2. A value above 50 signals expansion and the current value is above the long-term average of 53.2.
Much to the surprise of most, house prices in New Zealand have roared ahead in 2020, rising 20% from the previous year. In fact, the rate of growth has been so strong that the Government asked the central bank to consider adding house price stability in their remit, on top of the existing price stability and employment.
This step might influence the RBNZ’s intention to move interest rates into negative territory later this year.
The stock market also recovered quickly. After suffering a precipitous fall at the end of March, the New Zealand share market has rebounded strongly,
due to the NZX 50 reaching a historic high of 12855.02 in November of 2020 and is still growing.
The New Zealand share market has rebounded strongly.
In addition to GDP, two important lagging indicators are unemployment and the consumer price index (CPI). The unemployment rate rose from 4.0% to 5.3% in Q3. While this quarterly jump is the biggest on record, it is a long way shy of the 8% that Treasury was forecasting earlier in the year.
This good result has been attributed to the $13.9 billion in Covid-19-relief wage subsidies and the sharp drop off in immigration due to the border closures. However, unemployment tends to climb after recessions have technically passed and most commentators expect unemployment to increase to between 6.5% and 7.5% in 2021.
Inflation is still low and has been running behind the RBNZ target even before the pandemic hit. According to Statistics New Zealand, the CPI grew 1.4% in the year to September 2020. The growth for the quarter was 0.7% after a fall of 0.5% in the June quarter. Food and housing were the biggest contributors to price growth.
TABLE 8: LIST OF MACRO-ECONOMIC INDICATORS
Macro variable Description Units Source
gdp Gross Domestic Product (expenditure based) $mn, nominal index RBNZbankbill90 90-day bank bills rate %, annualised RBNZgovbond10y 10-year government bond yield %, annualised RBNZunemployed Number of registered unemployed Number RBNZavgqhouseloancount Average number of home loans approved Number RBNZestpop Estimated population of New Zealand Thousands Statistics NZcpindx Consumer Price Index Index level RBNZhousepricendx REINZ house price index Index level REINZweeklyearnings Weekly earnings $, nominal Statistics NZnzstocksndx New Zealand all stocks index Index level NZSE
FIPS 2020 | KPMG | 67
© 2021 KPMG, a New Zealand Partnership and a member firm of the KPMG global organisation of independent member firms affiliated with KPMG International Limited, a private English company limited by guarantee. All rights reserved.

The expectation is for inflation to remain weak during 2021 which, in combination with higher unemployment, could slow down growth.
Overall, the key economic indicators suggest that our economy is recovering from the Covid-19 lockdown. Consumer spending and manufacturing activity are high, but increasing unemployment could mean that recovery could extend into 2022. With this in mind, let us now look at the expected movements of the identified banking key performance measures in 2021 and 2022.
For the forecast (Q4 2019 to Q4 2022), I use a combination of macroeconomic variables and time-series analysis. The model uses a collection of past values of our drivers, a vector of time series, to predict future values. Specifically, I employ a vector autoregressive model (VAR) as it enables me to investigate how the interaction between the variables changes the forecast (see figure 26). Macroeconomic indicators are not explicitly used in the VAR model as the impact of these indicators is already factored into past values of the performance drivers (see table 8 on page 67. The results of my analysis are displayed in table 9 on page 69.
• SEE FIGURE 26 – PAGE 6826
LendingThe quarterly lending volume increased in Q1, 2020 by nearly 6% and remained at $580 billion in Q2, 2020. We then saw a slight drop in Q3, 2020, and expect a further drop in Q4, 2020 due to market uncertainty and bank caution. As the economy recovers, I expect lending volumes to grow at a similar rate to pre-Covid-19 conditions, reaching the $600 billion mark by the end of 2021. This positive outlook is supported by the Government’s launch of the ‘Funding for Lending Programme’ (FLP) which essentially provides cheap funding to banks to lower retail interest rates further.
• SEE FIGURE 27 – PAGE 7027
NIMInterest margins dropped slightly during Q2 and Q3, 2020 due to an increase in interest expense (for example, lockdown adjustments and pending new capital requirements). The major banks, however, now have access to cheaper funding than before, and the start of the RBNZ’s strict new capital rules have been pushed back to July 2022. This suggests that NIM could return to pre-Covid-19 levels of around 1.95% to 1.97% during 2021, but could slightly decrease in 2022 when the new rules have come into effect.
• SEE FIGURE 28 – PAGE 7028
Macro-economy
Unemployment–
Inflation–
Interest rates–
Industry drivers
Lending–
Net interest–
margin
Credit loss–
rate
Industry
profit or loss
– Net interest
income
Provision for–
impairment
charges
Competition
Influences
industry dynamics
Regulation
Determine
constraints within
which entities
have to operate
26 FORECASTING APPROACH
68 | KPMG | FIPS 2020
© 2021 KPMG, a New Zealand Partnership and a member firm of the KPMG global organisation of independent member firms affiliated with KPMG International Limited, a private English company limited by guarantee. All rights reserved.

Credit loss rateCLR increased after the lockdown from 0.07% (Q3, 2019) to 0.27% (Q3, 2020) as businesses and households struggled to meet repayments. The RBNZ also decided in Q2 to suspend loan-to-value ratio (LVR) restrictions for 12 months. Overall loan defaults seem to be lower than anticipated and I expect CLR to fall again during 2021 and 2022.
Given the current uncertainty and lagged effects on the economy, I believe that a CLR of close to zero will not happen in the next two years; however, the RBNZ plans to reinstate LVR restrictions and the generally conservative risk attitude of the New Zealand banking sector suggests that CLR could reach a low of around 0.15%.
• SEE FIGURE 29 – PAGE 7029
ProfitBanking profits fell significantly in Q2, 2020, but already started to recover during Q3. Given that our key economic indicators are moving in the right direction (except unemployment levels which are not surprising after the lockdown shock to the system) and rising lending volumes, the profit outlook is positive. The FLP should enable banks to keep margins at pre-Covid-19 levels even if we enter a negative interest rate environment. Lending expenses may increase over the next few years and we might see some unexpected loan defaults, but I expect quarterly banking profits to grow gradually from $1.56 billion in Q3, 2020 to around $1.72 billion by the beginning of 2022. This value is lower than the prediction from a year ago ($2.17 billion), but given the impact of Covid-19 on the national and global economy, the banking sector seems to be weathering the storm well.
• SEE FIGURE 30 – PAGE 7030
ForecastsTo produce an economic forecast in the current environment is difficult. The main issue is that forecasting models use past values to predict the future, never-before-seen events are near impossible to predict. To account for unforeseen events, models can be an ensemble of components that are very good when nothing unexpected happens and components that are better at dealing with surprises. Such ensemble models, however, become less accurate when too much weight is given to outliers. To avoid this trade-off, I could present different scenarios such as no second lockdown, second wave with full lockdown, and vaccination with partial border opening, among others.
The main issue is that forecasting models use past values to predict the future, never-before-seen events are near impossible to predict.
TABLE 9: FORECASTING RESULTS VAR
VAR industry driver 2020 Q1 2020 Q2 2020 Q3 2020 Q4 2021 Q1 2021 Q2 2021 Q3 2021 Q4 2022 Q1 2022 Q2 2022 Q3 2022 Q4
Actual Actual Actual Forecast Forecast Forecast Forecast Forecast Forecast Forecast Forecast Forecast
Lending ($Billion)
Upper CI 584 596 607 618 629 640 651 662 673Forecast 580 580 577 574 581 589 596 604 612 620 628 635Lower CI 564 566 570 575 579 584 590 595 600
Net Interest Margin (%)
Upper CI 2.09% 2.10% 2.10% 2.10% 2.09% 2.09% 2.08% 2.07% 2.06%Forecast 1.98% 1.82% 1.85% 1.97% 1.98% 1.97% 1.97% 1.96% 1.95% 1.94% 1.93% 1.92%Lower CI 1.86% 1.86% 1.85% 1.84% 1.83% 1.82% 1.81% 1.80% 1.80%
Credit Loss Rate (%)
Upper CI 0.37% 0.37% 0.32% 0.31% 0.27% 0.27% 0.27% 0.27% 0.27%Forecast 0.18% 0.25% 0.27% 0.25% 0.25% 0.20% 0.19% 0.15% 0.15% 0.15% 0.15% 0.15%Lower CI 0.13% 0.13% 0.08% 0.07% 0.03% 0.03% 0.03% 0.03% 0.03%
Profit Before Tax ($Billion)*
Upper CI 1.83 1.88 1.93 1.97 2.00 2.03 2.05 2.07 2.09Forecast 1.31 1.13 1.56 1.60 1.63 1.67 1.69 1.72 1.74 1.76 1.78 1.80Lower CI 1.37 1.38 1.40 1.41 1.43 1.45 1.47 1.49 1.51
* Forecasts for profit before-tax will seem less than in the forecasts of previous publications due to the fact that the figures are not annualised.
FIPS 2020 | KPMG | 69
© 2021 KPMG, a New Zealand Partnership and a member firm of the KPMG global organisation of independent member firms affiliated with KPMG International Limited, a private English company limited by guarantee. All rights reserved.

$BILLION
0.0
0.5
1.0
1.5
2.0
2.5
PROFIT BEFORETAX FORECAST( )
PROFIT BEFORETAX ACTUAL( )
UPPER CONFIDENCE INTERVAL95%
LOWER CONFIDENCE INTERVAL95%
2010 2011 2012 2013 2014 2015 2016 2017 2018 2019 2020 2021 2022
LENDING FORECAST( )
LENDING ACTUAL( )
UPPER CONFIDENCE INTERVAL95%
LOWER CONFIDENCE INTERVAL95%
0
100
200
300
400
500
600
700
$BILLION
2010 2011 2012 2013 2014 2015 2016 2017 2018 2019 2020 2021 2022
%
NET INTEREST MARGIN FORECAST( )
NET INTEREST MARGIN ACTUAL( )
0.0
0.5
1.0
1.5
2.0
2.5
UPPER CONFIDENCE INTERVAL95%
LOWER CONFIDENCE INTERVAL95%
2010 2011 2012 2013 2014 2015 2016 2017 2018 2019 2020 2021 2022
%
CREDIT LOSS RATE FORECAST( )
CREDIT LOSS RATE ACTUAL( )
UPPER CONFIDENCE INTERVAL95%
LOWER CONFIDENCE INTERVAL95%
-1.5
-1.0
-0.5
0.0
0.5
1.0
1.5
2.0
2010 2011 2012 2013 2014 2015 2016 2017 2018 2019 2020 2021 2022
30
27
28
29
VAR PROFIT BEFORE TAX
VAR INDUSTRY LENDING
VAR INDUSTRY NET INTEREST MARGIN
VAR CREDIT LOSS RATE
70 | KPMG | FIPS 2020
© 2021 KPMG, a New Zealand Partnership and a member firm of the KPMG global organisation of independent member firms affiliated with KPMG International Limited, a private English company limited by guarantee. All rights reserved.

Scenario modelling does feel a little like saying that ‘since anything is possible, just take your pick’. However, I am a positive person and my forecast assumes that there is no second lockdown and that the New Zealand economy will continue on the current recovery trajectory.
To conclude, 2020 was a difficult year for most of us. For some industries such as tourism, education, and hospitality, the current situation was and still is threatening. For other sectors, such as construction or retail, it brought about a new wave of activity.
The banking sector sits somewhere in between; it suffered losses, but is recovering. If there is no second lockdown, then the banking sector should continue on its growth trajectory even if we find ourselves in a negative interest rate environment.
© 2021 KPMG, a New Zealand Partnership and a member firm of the KPMG global organisation of independent member firms affiliated with KPMG International Limited, a private English company limited by guarantee. All rights reserved.
FIPS 2020 | KPMG | 71

Long-term credit rating
Registered banks Ultimate shareholding % Standard & Poor’s Moody’s Fitch Ratings
ANZ Bank New Zealand LimitedAustralia and New Zealand Banking Group Limited
100 AA- Negative A1 Stable A+ Negative
ASB Bank Limited Commonwealth Bank of Australia
100 AA- Negative A1 Stable A+ Negative
Australia and New Zealand Banking Group Limited – ANZ New Zealand41
Australia and New Zealand Banking Group Limited
100 AA- Negative Aa3 Stable A+ Negative
Bank of Baroda (New Zealand) Limited42*
Bank of Baroda (India) 100 Ba1 Negative BBB- Negative
Bank of China (New Zealand) Limited Bank of China Limited (China) 100 A Stable A1 Stable
Bank of China New Zealand Banking Group43*
Bank of China Limited (China) 100 A Stable A1 Stable A Stable
Bank of India (New Zealand) Limited44*
Bank of India (India) 100 BB+ Stable Rating has been
withdrawnBBB- Negative
Bank of New Zealand National Australia Bank Limited 100 AA- Negative A1 Stable A+ Negative
China Construction Bank (New Zealand) Limited
China Construction Bank Corporation
100 No rating this year A1 Stable A Stable
China Construction Bank Corporation New Zealand Banking Group45*
China Construction Bank Corporation
100 A Stable A1 Stable A Stable
Citibank, N.A. New Zealand Branch and Associated Banking Group46 Citigroup Inc. 100 A+ Stable Aa3 Stable A+ Negative
Commonwealth Bank of Australia New Zealand Operations47
Commonwealth Bank of Australia
100 AA- Negative Aa3 Stable A+ Negative
Heartland Bank LimitedVarious investment/nominee companies; various private shareholders
100 BBB Stable
Industrial and Commercial Bank of China (New Zealand) Limited48
Industrial and Commercial Bank of China Limited (China)
100 A Stable A1 Stable A Stable
Industrial and Commercial Bank of China Limited – Auckland Branch49
Industrial and Commercial Bank of China Limited (China)
100 A Stable A1 Stable A Stable
JPMorgan Chase Bank, N.A., New Zealand Banking Group50 JPMorgan Chase & Co. 100 A+ Stable Aa2 Stable AA- Negative
Kiwibank Limited Various51 A Stable A1 Stable AA- Positive
Kookmin Bank Auckland Branch52 KB Financial Group Inc. 100 A+ Stable Aa3 Stable A Negative
MUFG Bank, Ltd., Auckland Branch53 Mitsubishi UFJ Financial Group, Inc.
100 A Stable A1 Stable A- Stable
Coöperatieve Rabobank U.A. New Zealand Banking Group54 Coöperatieve Rabobank U.A. 100 A+ Negative Aa3 Stable A+ Negative
Rabobank New Zealand Limited Coöperatieve Rabobank U.A. 100 A Negative
Southland Building Society Mutual 100 BBB Negative
The Co-operative Bank Limited Mutual 100 BBB Negative
The Hongkong and Shanghai Banking Corporation Limited, New Zealand Banking Group55
HSBC Holdings plc 100 AA- Stable Aa3 Negative AA- Negative
TSB Bank Limited TSB Community Trust 100 A- Negative
Westpac Banking Corporation – New Zealand Banking Group56 Westpac Banking Corporation 100 AA- Negative Aa3 Stable A+ Negative
Westpac New Zealand Limited Westpac Banking Corporation 100 AA- Negative A1 Stable A+ Negative
* No Long-term credit rating, or no outlook for the rating, Long-term deposit has been used in place of Long-term debt.
Ownership and credit ratings As at 31 January 2021
72 | KPMG | FIPS 2020
© 2021 KPMG, a New Zealand Partnership and a member firm of the KPMG global organisation of independent member firms affiliated with KPMG International Limited, a private English company limited by guarantee. All rights reserved.

FIPS 2020 | KPMG | 73
© 2021 KPMG, a New Zealand Partnership and a member firm of the KPMG global organisation of independent member firms affiliated with KPMG International Limited, a private English company limited by guarantee. All rights reserved.
Long-term credit
rating grades
assigned by Standard
& Poor’s (S&P’s)
Description of the steps in the S&P’s credit rating grades for the rating of the long-term senior
unsecured obligations payable in New Zealand, in New Zealand dollars.
AAA Extremely strong capacity to meet financial commitments. Highest rating.
AA Very strong capacity to meet financial commitments.
A Strong capacity to meet financial commitments, but somewhat susceptible to adverse economic conditions and changes in circumstances and economic conditions.
BBB Adequate capacity to meet financial commitments, but more subject to adverse economic conditions.
BB Less vulnerable in the near-term, but faces major ongoing uncertainties to adverse business, financial and economic conditions to meet its financial commitments.
B More vulnerable to adverse business, financial and economic conditions, but currently has the capacity to meet financial commitments.
CCC Currently vulnerable and dependent on favourable business, financial and economic conditions to meet financial commitments.
CC Currently highly vulnerable. Default has not yet occurred but is expected to be a virtual certainty.
Plus (+) or Minus (-) The ratings AA to CCC may be modified by the addition of a plus (+) or minus (-) sign to show relative standing within the major rating categories.
BB, B, CCC, and CC Borrowers rated BB, B, CCC and CC are regarded as having significant speculative characteristics. BB indicates the least degree of speculation and CC the highest. While such borrowers will likely have some quality and protective characteristics, these may be outweighed by large uncertainties or major exposures to adverse conditions.
Assigned by Moody’s Investors Service
Moody’s Investors Service appends numerical modifiers 1, 2 and 3 in each generic rating classification from Aa through Caa. The modifier 1 indicates that the obligation ranks in the higher end of its generic category, the modifier 2 indicates a mid-range ranking and the modifier 3 indicates the lower end of that generic category.
Assigned by Fitch Ratings
Fitch Ratings applies ‘investment grade’ rates ‘AAA’ to ‘BBB’ to indicate relatively low to moderate credit risk, while for those in the ‘speculative’ or ‘non-investment grade’ categories which have either signalled a higher level of credit risk or that a default has already occurred, Fitch Ratings applies a ‘BB’ to ‘D’ rating. The modifiers ‘+’ or ‘-’ may be appended to a rating to denote relative status within the major rating categories. Credit ratings express risk in relative rank order, which is to say they are ordinal measures of credit risk and not predictive of a specific frequency of default or loss.
Descriptions of the credit rating grades

74 | KPMG | FIPS 2020
© 2021 KPMG, a New Zealand Partnership and a member firm of the KPMG global organisation of independent member firms affiliated with KPMG International Limited, a private English company limited by guarantee. All rights reserved.
Definitions
Terms and ratios used
in this survey
Definitions used in this survey
Gross impaired assetsIncludes all impaired assets, restructured assets, and assets acquired through the enforcement of security, but excludes past due assets.
Gross loans and advances
Includes loans and advances, lease receivables (net of unearned income) and accrued interest receivable (where identifiable), but excludes amounts due from banks, marketable securities, loans to related parties, sundry debtors and prepayments.
Gross revenue Includes gross interest income, gross operating lease and net other income.
Impaired asset expense
The charge to the Profit and Loss Account for bad debts and provisions for doubtful debts in relation to gross loans and advances. This is net of recoveries (where identifiable).
Interest bearing liabilities
Customer deposits (including accrued interest payable where identifiable), balances with banks, debt securities, subordinated debt and balances with related parties.
Interest earning assetsCash on hand, money on call and balances with banks, trading and investment securities, net loans and advances (including accrued interest receivable where identifiable), leased assets net of depreciation and balances with related parties.
Interest expense Includes all forms of interest or returns paid on debt instruments.
Interest spreadDifference between the average interest rate on average interest earning assets, and the average interest rate on average interest bearing liabilities.
Net assets Total assets less total liabilities.
Net interest income Interest income (including net income from acting as a lessor) less interest expense.
Net interest margin Net interest income divided by average interest earning assets.
Net loans and advances
Loans and advances, net of provision for doubtful debts.
Operating expenseIncludes all expenses charged to arrive at net profit before tax (excluding interest expense, impaired asset expense, subvention payments, direct expense related to other income (where identifiable), depreciation of leased assets where a lessor, and amortisation of goodwill and other intangibles (including software)).
Operating incomeNet interest income, net operating lease income and net other income (where direct expense related to other income is identifiable).
Past due assetsIncludes any asset which has not been operated by the counterparty within its key terms for 90 days and which is not an impaired or restructured asset.
Provision for doubtful debts
Includes both collective and individual provisions for bad and doubtful debts.
Total assets Excludes goodwill assets (unless specifically defined).
Ultimate shareholding Identifies the ultimate holding company rather than any intermediate holding companies.
Underlying profitOperating income less operating expense and impaired asset expense. Items of a non-recurring nature, unrelated to the ongoing operations of the entity, are excluded.

1. Our analysis of registered banks is from the view of the top geographic entity in New Zealand for each banking group and comprises 20 entities. The following entities hold a separate registered bank licence for a subsidiary and a branch and are included as a combined entity within top level banking groups for the purposes of our analysis: ANZ Bank New Zealand Limited, ASB Bank Limited, Bank of China (New Zealand) Limited, China Construction Bank (New Zealand) Limited, Rabobank New Zealand Limited and Westpac New Zealand Limited.
2. https://assets.kpmg/content/dam/kpmg/nz/pdf/2020/12/fips-non-banks-2020.pdf
3. https://home.kpmg/nz/en/home/insights/2016/02/financial-institution-performance-survey.html
4. https://covid19.govt.nz/alert-system/about-the-alert-system/5. https://www.nzherald.co.nz/business/kiwis-among-worlds-
worst-savers/NVW2SOOTM6NO4DPE5KF3ZCZJLM/6. https://www.stats.govt.nz/news/retail-sales-recover-in-the-
september-2020-quarter7. https://www.stats.govt.nz/news/kiwis-wine-and-dine-in-october8. https://www.stats.govt.nz/news/christmas-period-boosts-
domestic-card-spending9. https://www.tvnz.co.nz/one-news/new-zealand/anz-joins-asb-in-
requiring-property-investors-stump-up-30-deposit-instead-2010. https://www.newshub.co.nz/home/money/2020/12/anz-now-
wants-40-percent-deposits-from-property-investors.html11. https://www.oneroof.co.nz/news/hordes-of-expats-buying-sight-
unseen-the-spread-of-a-new-house-price-myth-3872112. https://www.interest.co.nz/charts/interest-rates/mortgage-rates13. https://assets.kpmg/content/dam/kpmg/nz/pdf/2020/12/fips-non-
banks-2020.pdf14. https://www.bbc.com/worklife/article/20210113-whats-the-best-
plan-for-a-radical-new-workday15. https://www.nzba.org.nz/consumer-information/regional-
banking-hubs/regional-banking-hubs-pilot/16. https://www.stuff.co.nz/timaru-herald/news/124064804/bank-
closure-irks-waimate-district-councillors17. https://www.westpac.co.nz/rednews/business/how-
to-avoid-financial-scams-during-covid-19-pandemic/; https://www.nzherald.co.nz/nz/covid-19-coronavirus-scammers-prey-on-vulnerable-during-virus-crisis/VROCDLDYVMWA4K4Z4QIL7XI6WU/
18. https://www.rnz.co.nz/news/covid-19/432568/govt-looks-to-regulate-contactless-payment-fees-for-retailers
19. https://www.reptrak.com/news/air-new-zealand-earns-highest-reputation-rating-in-reptrak-apacs-study-of/
20. https://www.nbr.co.nz/story/transparency-and-decarbonisation-go-hand-and-hand
21. http://community.scoop.co.nz/2020/12/bnz-targets-10-billion-sustainable-finance-and-sme-partnerships-to-reduce-carbon-emissions/
22. https://www.nzherald.co.nz/nz/covid-19-coronavirus-jacinda-ardern-new-zealands-borders-likely-to-remain-closed-to-most-of-the-world-all-year/3OMNHUCIOJI3KGXCLCWRVWK32Y/
23. https://www.stats.govt.nz/indicators/unemployment-rate?gclid=Cj0KCQiAgomBBhDXARIsAFNyUqNLPVKHA6m7XlvDzlHZ6oVE_rDO_5Su9_7aCNGTJKBoaqegMdw4VwUaAgoTEALw_wcB
24. The related articles are hyperlinked to provide the reader with the ability to access the respective news releases.
25. This data represents the top New Zealand level banking-licenced entity and is referred to using the name as per the entities respective disclosure statements.
26. This data represents the top New Zealand level banking-licenced entity and is referred to using the brand in common usage, and as per the RBNZ Bank Financial Strength Dashboard. ANZ represents Australia and New Zealand Banking Group Limited – ANZ New Zealand; ASB represents Commonwealth Bank of Australia New Zealand Operations; Heartland represents Heartland Bank Limited; SBS represents Southland Building Society (trading as ‘SBS Bank’); TSB represents TSB Bank Limited; Co-op represents The Co-operative Bank Limited; and Westpac represents Westpac Banking Corporation – New Zealand Banking Group.
27. https://www.rbnz.govt.nz/news/2020/04/longer-term-funding-to-support-business-lending
28. Kiwibank’s FUM only includes funds managed by entities in the Kiwibank Banking Group. Kiwibank Banking Group is part of Kiwi Group Holdings, which also has FUM in KiwiWealth. KiwiWealth’s FUM was included in the FUM presented in the 2018 publication but is no longer included, as this balance was not disclosed in KiwiWealth Management Limited’s 2019 financial statements.
29. https://www.nzherald.co.nz/business/panicked-kiwisavers-moved-14-billion-at-peak-of-market-meltdown/USU6G3JKGJOFPZHKNWB3MPGVYY/
30. https://www.rbnz.govt.nz/news/2020/11/reserve-bank-launches-consultation-to-implement-capital-review-changes
31. Total Assets = Total Assets - Intangible Assets.32. The capital adequacy ratios reported are for the local bank.33. https://www.labour.org.nz/news-climate-emergency34. https://www.climatecommission.govt.nz/35. The Government has committed to: reaching net-zero
emissions of all greenhouse gases except biogenic methane by 2050; and reducing biogenic methane emissions by between 24-47% by 2050. https://www.mfe.govt.nz/climate-change/zero-carbon-amendment-act
36. https://www.climatecommission.govt.nz/get-involved/our-advice-and-evidence/
37. Further emissions budgets will be set ten years in advance of the start of the emissions budget period.
38. 35% below 2005 levels by 2030. 39. https://home.kpmg/nz/en/home/media/press-releases/2020/12/
survey-of-sustainability-reporting-2020.html40. https://assets.kpmg/content/dam/kpmg/nz/pdf/2020/12/the-time-
has-come-nz.pdf41. Rating of Parent, Australia and New Zealand Banking Group
Limited (Australia) – S&P’s, Moody’s and Fitch.
42. Rating of Parent, Bank of Baroda (India) – Moody’s.
EndnotesFIPS 2020 | KPMG | 75
© 2021 KPMG, a New Zealand Partnership and a member firm of the KPMG global organisation of independent member firms affiliated with KPMG International Limited, a private English company limited by guarantee. All rights reserved.

43. Rating of Parent, Bank of China Limited (China) – S&P’s, Moody’s and Fitch.
44. Rating of Parent, Bank of India (India) – Moody’s and Fitch.
45. Rating of Parent, China Construction Bank Corporation (China) – S&P’s, Moody’s and Fitch.
46. Rating of Parent, Citibank N.A. (United States) – S&P’s, Moody’s and Fitch.
47. Rating of Parent, Commonwealth Bank of Australia (Australia) – S&P’s, Moody’s and Fitch.
48. Rating of Parent, Industrial and Commercial Bank of China Limited (China) – Fitch.
49. Rating of Parent, Industrial and Commercial Bank of China Limited (China).
50. Rating of Parent, JPMorgan Chase Bank N.A. (United States) – S&P’s, Moody’s and Fitch.
51. Kiwi Group Holdings (KGH) 53% owned by New Zealand Post, 25% owned by NZ Super Fund, and 22% owned by Accident Compensation Corporation (ACC). All of which are state-owned enterprises.
52. Rating of Parent, Kookmin Bank (South Korea) – S&P’s, Moody’s and Fitch.
53. Rating of Parent, MUFG Bank, Ltd (Japan) – S&P’s, Moody’s and Fitch.
54. Rating of Parent, Coöperatieve Rabobank U.A. (Netherlands) – S&P’s and Fitch.
55. Rating of Parent, The Hongkong and Shanghai Banking Corporation Limited (Hong Kong) – S&P’s and Fitch.
56. Rating of Parent, Westpac Banking Corporation (Australia) – S&P’s, Moody’s and Fitch.
76 | KPMG | FIPS 2020
© 2021 KPMG, a New Zealand Partnership and a member firm of the KPMG global organisation of independent member firms affiliated with KPMG International Limited, a private English company limited by guarantee. All rights reserved.

KPMG’s Financial Services Team
Matthew PrichardExecutive Chairman+64 (09) 367 [email protected]
Godfrey BoyceChief Executive Officer+64 (04) 816 [email protected]
Graeme EdwardsNational Managing Partner – Audit+64 (04) 816 [email protected]
Jack CarrollNational Managing Partner – Advisory+64 (04) 816 [email protected]
Ross McKinleyNational Managing Partner – Tax+64 (09) 367 [email protected]
Kay BaldockNational Managing Partner – Brand & Growth+64 (09) 367 [email protected]
Jamie MunroNational Industry Leader, Financial Services+64 (09) 367 [email protected]
Brent ManningPartner – Audit+64 (04) 816 [email protected]
Malcolm BrucePrincipal – Risk Consulting+64 (09) 367 [email protected]
Gary IvoryPartner – Corporate Finance+64 (09) 367 [email protected]
Ceri HorwillPartner – Risk Consulting+64 (09) 367 [email protected]
Rajesh MegchianiPartner – Risk Consulting+64 (09) 363 [email protected]
Simon WilkinsPartner – Sustainable Value+64 (09) 363 [email protected]
James DowlePartner – Management Consulting+64 (04) 816 [email protected]
John KensingtonHead of Banking and Finance+64 (09) 367 [email protected]
FIPS 2020 | KPMG | 77
© 2021 KPMG, a New Zealand Partnership and a member firm of the KPMG global organisation of independent member firms affiliated with KPMG International Limited, a private English company limited by guarantee. All rights reserved.

© 2021 KPMG, a New Zealand Partnership and a member firm of the KPMG global organisation of independent member firms affiliated with KPMG International Limited, a private English company limited by guarantee. All rights reserved.
The information contained herein is of a general nature and is not intended to address the circumstances of any particular individual or entity. Although we endeavour to provide accurate and timely information, there can be no guarantee that such information is accurate as of the date it is received or that it will continue to be accurate in the future. No one should act on such information without appropriate professional advice after a thorough examination of the particular situation.
kpmg.com/nz
ISSN 0113-4655
Contact us
Visit our Financial Services website
ChristchurchThe Terrace, Level 5 79 Cashel Street PO Box 1739 Tel: (03) 363 5600 Fax: (03) 363 5629
Timaru24 The Terrace PO Box 526 Tel: (03) 683 1870 Fax: (03) 686 9062
Ashburton151 Burnett Street PO Box 564 Tel: (03) 307 6355 Fax: (03) 307 6358
AucklandKPMG Centre 18 Viaduct Harbour Avenue PO Box 1584 Tel: (09) 367 5800 Fax: (09) 367 5875
HamiltonKPMG Centre 85 Alexandra Street PO Box 929 Tel: (07) 858 6500 Fax: (07) 858 6501
TaurangaLevel 2 247 Cameron Road PO Box 110 Tel: (07) 578 5179 Fax: (07) 578 2555
Wellington10 Customhouse Quay PO Box 996 Tel: (04) 816 4500 Fax: (04) 816 4600