effect of backflush accounting on financial performance of ...
23
EFFECT OF BACKFLUSH ACCOUNTING ON FINANCIAL PERFORMANCE OF QUOTED FOOD AND BEVERAGE FIRMS IN NIGERIA Amahalu Nestor Ndubuisi (PhD) Department of Accountancy Nnamdi Azikiwe University Awka, Anambra State nn.amahalu@unizik.edu.ng Nweze Chike Leonard Department of Accountancy Nnamdi Azikiwe University Awka, Anambra State [email protected] Obi Juliet Chinyere Department of Accountancy University of Nigeria, Nsukka Enugu Campus, Enugu State [email protected] Corresponding Author: Amahalu Nestor Ndubuisi ; E-mail: nn.amahalu@unizik.edu.ng ABSTRACT The aim of this study is to determine the effect of backflush accounting on financial performance with particular reference to food and beverage firms. This study therefore, examines the effect of Backflush accounting on financial performance of food and beverage firms quoted on Nigeria Stock Exchange from 2010 to 31 st December 2015. The research design employed in this study is the ex-post facto research. An ex-post facto research determines the cause-effect relationship among variables. Only secondary data was used in this study. Three hypotheses were formulated and tested in the course of this study. The Statistical tools used to test the hypotheses were coefficient of correlation and ordinary least square regression with the aid of STATA 13 statistical software. The study revealed that backflush accounting has a positive and statistically significant effect on ROA, ROE, and EPS of food and beverage firms quoted on the floor of Nigerian Stock Exchange at 5% level of significance. The researchers recommend among others that manufacturing firms should try to enforce the use of emerging new trends in management accounting practice even though it might not be cost effective in terms of staff training and cost of acquiring the technology, but the benefits outweighs the costs in the long run. Keywords: Backflush Accounting, Financial Performance, Just-in-Time EPH - International Journal of Business & Management Science ISSN: 2208-2190 Volume-3 | Issue-3 | March,2017 | Paper-3 58
-
Upload
khangminh22 -
Category
Documents
-
view
1 -
download
0
Transcript of effect of backflush accounting on financial performance of ...
EFFECT OF BACKFLUSH ACCOUNTING ON FINANCIAL PERFORMANCE OF QUOTED FOOD AND BEVERAGE FIRMS IN NIGERIA
Amahalu Nestor Ndubuisi (PhD) Department of Accountancy
Nnamdi Azikiwe University
Awka, Anambra State
Nweze Chike Leonard
Department of Accountancy
Nnamdi Azikiwe University
Awka, Anambra State
Obi Juliet Chinyere
Department of Accountancy
University of Nigeria, Nsukka
Enugu Campus, Enugu State
Corresponding Author: Amahalu Nestor Ndubuisi ; E-mail: [email protected]
ABSTRACT
The aim of this study is to determine the effect of backflush accounting on
financial performance with particular reference to food and beverage firms. This study therefore, examines the effect of Backflush accounting on financial performance of food and beverage firms quoted on Nigeria Stock
Exchange from 2010 to 31st December 2015. The research design employed in this study is the ex-post facto research. An ex-post facto
research determines the cause-effect relationship among variables. Only secondary data was used in this study. Three hypotheses were formulated and tested in the course of this study. The Statistical tools used to test the
hypotheses were coefficient of correlation and ordinary least square regression with the aid of STATA 13 statistical software. The study
revealed that backflush accounting has a positive and statistically significant effect on ROA, ROE, and EPS of food and beverage firms quoted on the floor of Nigerian Stock Exchange at 5% level of significance. The
researchers recommend among others that manufacturing firms should try to enforce the use of emerging new trends in management accounting practice even though it might not be cost effective in terms of staff training
and cost of acquiring the technology, but the benefits outweighs the costs in the long run.
Keywords: Backflush Accounting, Financial Performance, Just-in-Time
EPH - International Journal of Business & Management Science ISSN: 2208-2190
Volume-3 | Issue-3 | March,2017 | Paper-3 58
Background of the Study
Accounting has been in existence from the primitive era till date and it will
continue to exist. It has been, of course always with us and there is no
responsible business entity can overlook it. The new thing that each
business organizations will continue to envisage is the methods and
procedures each of them have decided to adopt in the collection and
gathering of data and information thereon (Hub 2014).
According to Freedman (1998) as cited in Wikipedia 2014, the fundamentals
of Management Accounting have not changed over the past 100 years,
changes in manufacturing and production processes have pushed
management accounting to update its practices. Integration of technological
advances into the accounting department has made it easier and less
expensive for small-business owners to make data-driven decisions about
their companies. Understanding how Management Accounting has been
updated in the modern era can help you leverage technology to improve your
business.
In line with the above, the traditional management accounting systems have
been found to be inadequate as basis for evaluating performance in
companies that have adopted the Advance manufacturing technology. This
view is supported by Kaplan (1996) as cited in Lucey 2003 when he said
that “traditional management accounting produces simply the wrong
measures. They move the Company in the wrong direction, reward managers
for damaging the business and provide no incentive for improvement. The
best we can do is to switch them off, just stop doing them!”
Sharmnihope (2013) states that Backflush costing and accounting is a
technique of costing, associated with JIT production system that applies
cost to the output of a process. Cost do not mirror the flow of products
through the production process, but are attached to output produced on the
assumption that such backflushed costs are a realistic measure of the
actual costs incurred. It must be made crystal clear that we have different
costs for different purposes and consequently accountants do not prepare
EPH - International Journal of Business & Management Science ISSN: 2208-2190
Volume-3 | Issue-3 | March,2017 | Paper-3 59
cost figures for the sake of doing so unless they know what management
intends to do with such figures. The cost figures that will be useful to
management in deciding on long-term pricing strategy will be different from
the ones for short-term pricing especially when the firm is operating at
below capacity.
Statement of Problem
The information system that provides both financial and non-financial
information relating to the cost of acquiring or using the resources of the
organization is a long standing and inevitable part and parcel of every
business.
Kaplan [1984 in Tabitha & Ogungbade, 2016] posits that cost accounting
practice in the late 19th century did not include the allocation of fixed costs
to products or to periods but rather, the practice of measuring and
allocating overhead costs to products was started by scientific management.
However, some of the early techniques now referred to as traditional
techniques such as Standard Costing, Absorption Costing and Marginal
Costing have been heavily criticized of loss of relevance.
The criticism of “relevance loss” of accounting information due to the usage
of traditional techniques has given birth to new cost accounting techniques
such as Activity Based Costing, Target Costing, Life Cycle Costing, Just in
Time System, Back flush Accounting and Throughput Accounting among
others. Since the arrival of the new cost and management accounting
techniques, it is worthwhile to know the extent at which the new techniques
are being used and also to ascertain if the conventional techniques are still
in vogue despite the criticisms.
Backflush accounting which is connected with the aim of responding to the
requirements of JIT production system has been made in response to the
advances and innovations of production. In reality Companies are still
finding it difficult to cope with the modern costing systems due to
cumbersome calculations, delay in tracking the costs, lack of technological
advancement knowledge, inefficient labour cost system and lack of
understanding of the relevance of the use of the modern trend in the costing
EPH - International Journal of Business & Management Science ISSN: 2208-2190
Volume-3 | Issue-3 | March,2017 | Paper-3 60
system especially the backflush accounting system. The modern
management accounting techniques have been seen to have the following
advantages namely speed, accuracy, improved quality, reduction in cost per
unit, reduced labour cost et cetera.
Objective of Study
The general objective of this study is to determine the effect of backflush
accounting on financial performance.
The specific objectives of this study are:
(1) To ascertain how backflush accounting, proxy by inventory
turnover affects Return on Assets (ROA) of quoted food and
beverage firms in Nigeria.
(2) To determine how backflush accounting, proxy by inventory
turnover affects Return on Equity (ROE) of quoted food and
beverage firms in Nigeria
(3) To evaluate backflush accounting, proxy by inventory turnover
affects Earnings per share(EPS) of quoted food and beverage firms
in Nigeria
RESEARCH HYPOTHESES
The following Null hypotheses are formulated:
Ho1 : Backflush accounting, proxy by inventory turnover has no significant
effect on ROA of quoted food and beverage firms in Nigeria
Ho2 : Backflush accounting, proxy by inventory turnover has no significant
effect on ROE of quoted food and beverage firms in Nigeria
Ho3 : Backflush accounting, proxy by inventory turnover has no significant
effect on EPS of quoted food and beverage firms in Nigeria
CONCEPTUAL REVIEW
EPH - International Journal of Business & Management Science ISSN: 2208-2190
Volume-3 | Issue-3 | March,2017 | Paper-3 61
Backflush Accounting
Backflush costing has been made in response to the advances and
innovations of production. The approach that is called backflush accounting
has been developed in response to the requirements of Just-in-time
manufacturing environment, Amir and Mohammed (2014). The salient point
to note about backflush costing and accounting is that, there is no
continuous tracking system. Backflush costing also known as delayed or
post deduct costing is one of the simplest methods of cost accumulation that
is used by organizations that have adopted the JIT system.
According to CIMA (1991), backflush accounting has been defined as an
accounting system which is focused on the output of an organization and
then works are returned to inventory and cost of sales based on the
characteristics of the cost.
The Traditional accounting system uses the successive tracking that is,
accounting methods paced with the physical sequence of purchasing and
manufacturing. Delayed term is related to its creation because backflush
accounting delays costing of inventories to sales time and finally cost
returns through accounting system. Backflush accounting removes the need
to separate the work-in-progress account (Omah & Okolie, 2013)
However, the JIT is not just a technique or techniques for accumulating cost
and has broader philosophy that focuses on continuous simplification and
reduction of loss and waste in all levels of the institutions activities and one
of the goals of this system is zero ending inventories. The new costing
system which is connected with the aim of responding to the requirements
of JIT production system is called backflush costing.
Inventory Turnover
According to Harvey (2012), inventory turnover is a measure of how often
the company sells and replaces its inventory. It is the ratio of annual cost of
sales to the latest inventory. One can also interpret the ratio as the time to
which inventory is held. For example a ratio of 26 implies that inventory is
held, on average, for two weeks (365 days in a year divided by inventory
EPH - International Journal of Business & Management Science ISSN: 2208-2190
Volume-3 | Issue-3 | March,2017 | Paper-3 62
turnover ratio of 26 equals 14 days per 2 weeks average inventory holding
period). It is best to use this ratio to compare companies within an industry
(high turnover is a good sign) because there are huge differences in this ratio
across industries. According to Farlex (2012), it is a measure indicating the
number of times a firm sells and replaces its inventory during a given period
and calculated by dividing the cost of goods sold by the average inventory
level. A relatively low inventory turnover may indicate ineffective inventory
management (that is, carrying too large an inventory) or carrying out-of-date
inventory to avoid writing off inventory losses against income. A high
inventory turnover is generally desirable.
According to Winston (2015), a company’s inventory turnover ratio refers to
how quickly goods enter and leave storage at the business. It is most often
used in relation to companies that deal in perishable goods, such as
foodstuffs or high demand retail items. It is easy to calculate in theory but it
is not always easy to interpret. Balle (2015), when discussing turnover in
relation to inventory, posted that it is a reference to how quickly the
company is pulling in product sales. To determine inventory turnover, you
need to keep close track of the movement of stock into and out of the
business. After analysing your inventory figures, you will discover that the
inventory rate is a key factor used to determine how well the business is
performing
Return on Assets
Return on Assets (ROA) is an indicator of how profitable a company is
relative to its total assets. ROA gives an idea as to efficient management is at
using its assets to generate earnings. ROA is calculated by dividing a
company’s annual earnings by its total assets, ROA is displayed as a
percentage. The ROA formula is a straight forward calculation, and its
component parts are easily located on a company’s financial statements.
The ROA ratio often called the return on total assets is a profitability ratio
that measures the Net Income produced by total assets during a period by
comparing Net Income to the average total assets. ROA is an indicator of
how a business manages existing assets when generating earnings. If ROA is
EPH - International Journal of Business & Management Science ISSN: 2208-2190
Volume-3 | Issue-3 | March,2017 | Paper-3 63
low, the management may be inefficient while a high ROA figure shows the
business is running smoothly and efficiently (Madura 2015).
According to Shopify (2014), Management will look closely at the ROA figure
at year end. If the ROA is high, it is a good sign that the business is making
the best from what it already has in assets. Combing the ROA with the
metric, return on investment may show that further investment is
worthwhile and that the business is capable of using new investment
efficiently. Examining a low ROA is vital for the efficient running of a
business. If the ROA is consistently low it may show that either
management are not making enough use of existing assets or that assets
within the business are of no longer any use.
Falling ROA is always a problem but investors and analyst should bear in mind
that the ROA does not account for outstanding liabilities and may indicate a higher
profit level than actually derived (Bank of Ghana, 2015).
Therefore, ROA is considered as an effective way of measuring the efficiency
of manufacturers, but can be suspect when measuring service companies or
companies whose main assets are people (Bloomsbury, 2009).
Return on Equity (ROE)
This is the amount of Net Income returned as a percentage of shareholders
equity. ROE measures a corporation’s profitability by revealing how much
profit a company generates with the money shareholders have invested.
Fool (2009) opined that ROE encompasses the pillars of corporate
management – profitability, assets management and financial leverage. By
seeing how well the executive team balances these components, investors
can not only get an excellent sense of whether they will receive a decent
return on equity but can also access management’s ability to get the job
done. ROE is calculated by taking a year’s worth of earnings and dividing
them by the average shareholders’ equity for that year.
The earnings number can come directly from the consolidated statement of
earnings in the company’s most recent annual filling with the Security and
Exchange Commission (SEC). The shareholder’s equity number is located on
the financial statement position; simply the different between total assets
EPH - International Journal of Business & Management Science ISSN: 2208-2190
Volume-3 | Issue-3 | March,2017 | Paper-3 64

and total liabilities, shareholder’s equity is an accounting convention that
represents the assets that the business has generated. It is assumed that
assets without corresponding liabilities are the direct creation of the
shareholder’s capital that got the business started in the first place. The
usual way investors will see shareholder’s equity displayed is as book value
– the amount of shareholder’s equity per share, or the accounting book
value of the business beyond its market value or intrinsic economic value
(Madura2015). A business that creates a lot of shareholder’s equity is a
sound investment, because the original investors will be repaid with the
proceeds that come from the business operations. Businesses that generate
high returns relative to their shareholder’s equity pay their shareholders
handsomely and create substantial assets for every naira invested.
These businesses are typically self-funding and require no additional debt or
equity investments. To quickly gauge whether a company is an asset creator
or a cash consumer, look at the ROE it generates. By relating the earnings
to the shareholder’s equity, an investor can quickly see how much cash
comes from existing assets (Madura 2015).
Earnings per Share:
Earnings per share (EPS) this is the portion of a company’s profit allocated
to each outstanding share of common stock. EPS serves as an indicator of a
company’s profitability. A company’s profit divided by its number of common
outstanding shares. If a company’s earning is #2m in one year, had two
million common shares of stock outstanding. Its earnings would be #1 per
share. In calculating EPS, the company often uses a weighted average of
shares outstanding over the reporting term (Investopedia 2016).
According to fool (2009), earnings can cause stock prices to rise and when
they do, investors make money. If a company has high earnings per share it
means, it has more money available to either reinvest in the business or
distribute to stockholders in the form of dividend payments. In either
scenario, the investors win.
EPH - International Journal of Business & Management Science ISSN: 2208-2190
Volume-3 | Issue-3 | March,2017 | Paper-3 65

Use of Financial Report to Measure Financial Performance of
Companies
The financial statements of companies provide a wealth of information that
can be used in a variety of ways. Accurate, timely financial statement accrue
benefits to both the firm that records them as well as outside parties who
may be looking forward to do business with the company.
The financial performance of companies is made known to other interested
parties through its report of financial statements. Financial reporting is seen
as a composite process of recognition, measurements, presentation and
disclosure of transaction and events using corporate financial statement.
Financial reports are so essential that they are needed for various uses such
as management decisions, investment decision et cetera (Ezeani 2012). The
main objective of financial reports is to provide information concerning the
financial position, performance and each cash flow of a business
organization which is useful for users to make economic decision. It also
gives a view of the stewardship and accountability of management.
These financial reports are prepared to meet the needs of the common user
(Akindele, 2012).
Accounting and financial reporting provides some vital information for
economic management at micro and macro levels (BPP 2012). A credible and
high quality accounting financial reporting process will support investment
and thereby leading to economic development.
Backflush Accounting in a JIT Environment
The backflush accounting in a JIT environment, delays the recording of
costs until after the events have taken place, some or all journal entries
related to the production cycle are eliminated such as work-in-progress. The
system then focuses on the production of finished goods, and makes journal
entries using either standard or normal costing. The completion of finished
goods then triggers journal entries from direct materials and conversion
costs to the finished goods.
The concept of backflush costing is often associated with a just-in-time or
JIT operations. With this approach, one of the goals is to keep the inventory
EPH - International Journal of Business & Management Science ISSN: 2208-2190
Volume-3 | Issue-3 | March,2017 | Paper-3 66
of raw materials as low as possible. Thus orders for raw materials are
scheduled so that the goods arrive just before the production commences.
By the time the invoicing for the materials is received, and the products are
sold at a rate that covers the expenses. All relevant postings in the
company’s accounting books are made at that point, thus keeping the books
balanced and factual, but without the need to make multiple postings all
through the production process.
Backflush costing is appropriate for organizations trying to keep inventories
to the very minimum. In such circumstances, the recording of every little
increase in inventory value, as each nut and bolt is added, is simply an
expensive and non-value-added activity that should be eliminated.
Backflush costing is a strategy that involves delaying the costing process
until the production of goods or services is completed. Once the production
cycle is finished, the costs are then applied to the operation, making it
possible to determine the costs associated with manufacturing the products
and to set the sale price accordingly. One of the benefits of this strategy is
that there is no need to closely track costs as they occur, thus simplify the
accounting process while the production process is in progress.
THEORITICAL REVIEW
This study is anchored on the following theories:
Contingency Theory
Contingency theory is an approach to the study of organizational behavior in
which explanations are given as to how contingent factors such as
technology, culture and the external environment influence the design and
function of organizations. The essence of contingency theory is that best
practices depend on the contingencies of the situation. Contingency theory
is often called the “it all depends” theory, because when you ask a
contingency theorist for an answer, the typical response is that it all
depends. The term contingency as used in contingency theory is similar to
its use in direct practice. A contingency is a relationship between two
EPH - International Journal of Business & Management Science ISSN: 2208-2190
Volume-3 | Issue-3 | March,2017 | Paper-3 67
phenomena. If one phenomenon exists, then a conclusion can be drawn
about another phenomenon.
Contingency theory is a behavioral theory that claims that there is no single
best way to design organizational structures. The best way of organizing, for
example, a company is however, contingent upon the internal and external
situation of the company.
The contingency approach to organizational design tailors the design of the
company to the sources of environmental uncertainties faced by the
organization. The point is to design an organizational structure that can
handle uncertainties in the environment effectively and efficiently.
Theory of Constraints (TOC)
TOC (Theory of Constraints) advocates strongly exclusions of any capacity
costs from products. Three factors, which are throughput, operating expense
and inventory, play important roles. TOC measures profit= throughput−
operating expenses. Also throughput measures the difference between
revenues and cost of raw materials. In the TOC, capacity cost should be
used to create customer value. If all the company resources are not matched
with the throughput the company creates, inefficient use of the capacity in
various business processes can mean low or nonexistent profits. In that
meaning, TOC may target its profit as added value.
TOC is a methodology for identifying the most important limiting factor (that
is, constraints) that stands in the way of achieving a goal and then
systematically improving that constraint until it is no longer the limiting
factor.
METHODOLOGY
Research Design
This study is concerned with the effect of backflush accounting on financial
performance with a focus on food and beverage firms quoted on Nigeria
Stock Exchange from 2010 to 31st December 2015. The research design
employed in this study is the ex-post facto research design. An Ex-post
EPH - International Journal of Business & Management Science ISSN: 2208-2190
Volume-3 | Issue-3 | March,2017 | Paper-3 68
Facto research determines the cause-effect relationship among variables.
Ex-post Facto seeks to find out the factors that are associated with certain
occurrence, conditions, events or behaviours by analyzing past events or
already existing data for possible casual factors Kothari and Garg (2014).
Population of the Study
The population of this study comprises twenty (20) food and beverage firms
listed on the Nigeria Stock Exchange from 2010-2015 and published in the
Nigeria Stock Exchange website (See Appendix A).
Sample Size and Sampling Method
Non-probability method was adopted to determine the sample size. This
research adopted judgmental sampling technique because of the availability
of annual financial statements. Based on this reason, Eleven (11) food and
beverage firms were selected amongst the food and beverage firms listed on
Nigeria stock Exchange (see Appendix A & B). The eleven (11) quoted food
and beverage firms represent the sample size for this study, for a six (6) year
period spanning from 2010-2015. The six (6) years period is chosen in order
to have a fairly, reasonably, reliable and up-to-date available financial data.
Source of Data
This study made use of secondary data basically. The data were sourced
from publication of the Nigeria Stock Exchange (NSE) and the annual report
and accounts of the quoted food and beverage firms as well as their
respective notes to the accounts.
RESEARCH VARIABLES
Independent Variables
The independent variable in this study is Backflush Accounting which is
proxy by Inventory Turnover (INVT).
i. Inventory Turnover (INVT)
This is the number of times inventory is turned over in a year.
EPH - International Journal of Business & Management Science ISSN: 2208-2190
Volume-3 | Issue-3 | March,2017 | Paper-3 69
The formula is:
INVT = Cost of goods sold
Average Inventory
DEPENDENT VARIABLES
The dependent variable is profitability, which is measured by the following
driver variables:
i. Return on Asset (ROA)
ROA is an indicator of how profitable a company is in relation to its total
assets. It gives an idea as to how efficient the management uses assets to
generate earnings. In fact, using this ratio, we can evaluate firm
performance and it reflects the degree of efficiency in employing assets to
obtain profit
ROA = Net Profit after Tax x 100 Total Assets 1
ii. Return on equity (ROE)
It measures organization’s profitability by revealing how a company
generates profit with the money shareholders have invested.
ROE = Net income / Shareholder’s equity
iii. Earnings per Share (EPS)
EPS is the portion of a company’s profit allocated to each outstanding
shares of common stock. EPS serve as an indicator of a company’s
profitability.
EPS = Net Income – Dividends on Preferred stock
Average outstanding shares
Control Variables
EPH - International Journal of Business & Management Science ISSN: 2208-2190
Volume-3 | Issue-3 | March,2017 | Paper-3 70

The following control variables were used in this study:
i. Total Asset (TA): this is measured with the natural log of total
assets
ii. Total Sales (TS): this is measured with the natural log of total
sales
Method of Data Analysis
The analysis of data for this study was done based on the data collected
from publications of the Nigerian Stock Exchange (NSE) and the annual
report and accounts of the selected quoted food and beverage firms.
Inferential statistics of the hypotheses were carried out with the aid of
STATA 13 statistical software, using coefficient of correlation which is a good
measure of relationship between two variables, tells us about the strength of
relationship and the direction of relationship as well. Ordinary Least Square
Regression analysis was used for the study. Regression analysis predicts the
value of a variable based on the value of the other variables and explains the
impact or effect of changes in the values of the variables.
Model Specification
To conduct the investigation that ascertains the relevance of backflush
accounting to company’s performance.
The model for this study takes the following form:
Y = βo + β1X1 + β2X2+ µ
Where:
Y = Performance (Dependent Variable)
X = Backflush Accounting (Explanatory/Independent Variable)
β0 = Constant term (Intercept)
β = Coefficient of backflush accounting
µ = Error term (Stochastic Term)
Explicitly, the equation can be defined as:
Performance = ƒ (backflush accounting) + µ
EPH - International Journal of Business & Management Science ISSN: 2208-2190
Volume-3 | Issue-3 | March,2017 | Paper-3 71
Representing other equations with the variables of the construct, hence the
equations below are formulated:
ROAίt = β0 + β1INVTίt + β2TAίt + β3TSίt + µίt - - (1)
ROEίt = β0 + β1INVTίt + β2TAίt + β3TSίt + µίt - - (2)
EPSίt = β0 + β1INVTίt + β2TAίt + β3TSίt + µίt - - (3)
Legend:
β0 = Constant term (intercepts)
βίt = Coefficients to be estimated for firm ί in period t
µίt = Error term/Stochastic term
TEST OF HYPOTHESES AND ANALYSES OF DATA
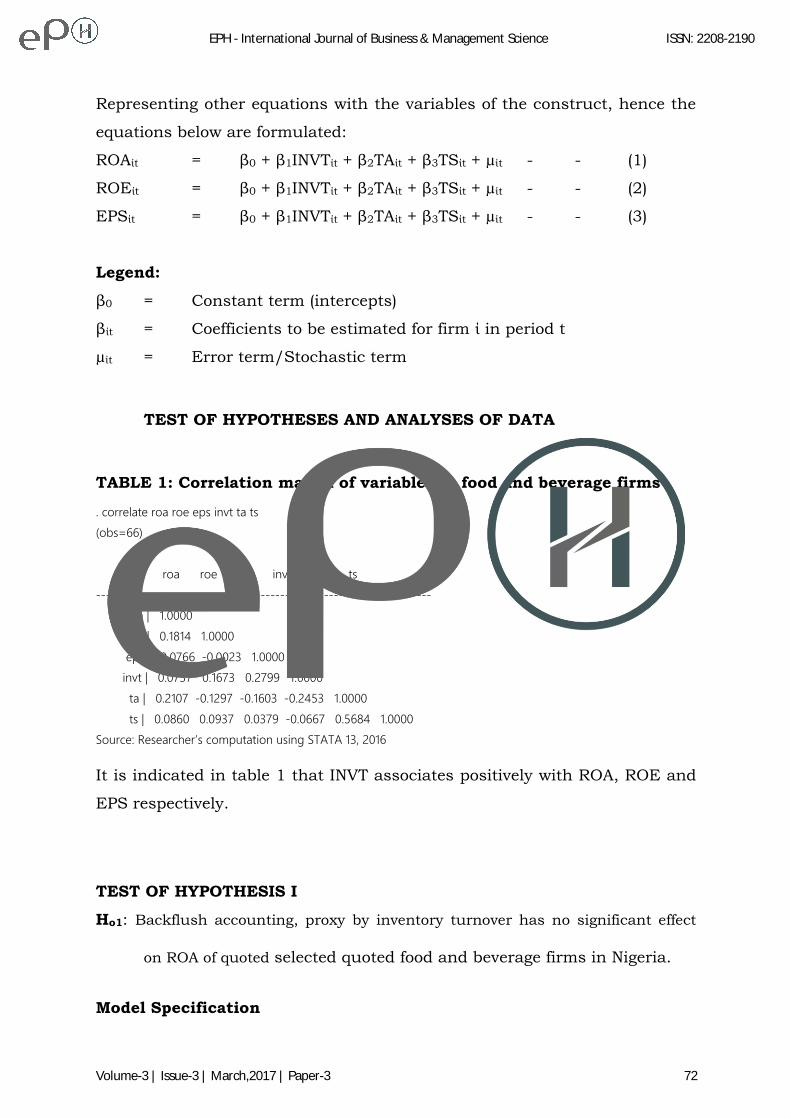
TABLE 1: Correlation matrix of variables in food and beverage firms
. correlate roa roe eps invt ta ts
(obs=66)
| roa roe eps invt ta ts
-------------+------------------------------------------------------
roa | 1.0000
roe | 0.1814 1.0000
eps | 0.0766 -0.0023 1.0000
invt | 0.0737 0.1673 0.2799 1.0000
ta | 0.2107 -0.1297 -0.1603 -0.2453 1.0000
ts | 0.0860 0.0937 0.0379 -0.0667 0.5684 1.0000
Source: Researcher’s computation using STATA 13, 2016
It is indicated in table 1 that INVT associates positively with ROA, ROE and
EPS respectively.
TEST OF HYPOTHESIS I
Ho1: Backflush accounting, proxy by inventory turnover has no significant effect
on ROA of quoted selected quoted food and beverage firms in Nigeria.
Model Specification
EPH - International Journal of Business & Management Science ISSN: 2208-2190
Volume-3 | Issue-3 | March,2017 | Paper-3 72
ROAίt = β0 + β1INVTίt + β2TAίt + β3TSίt + µίt - - (1)
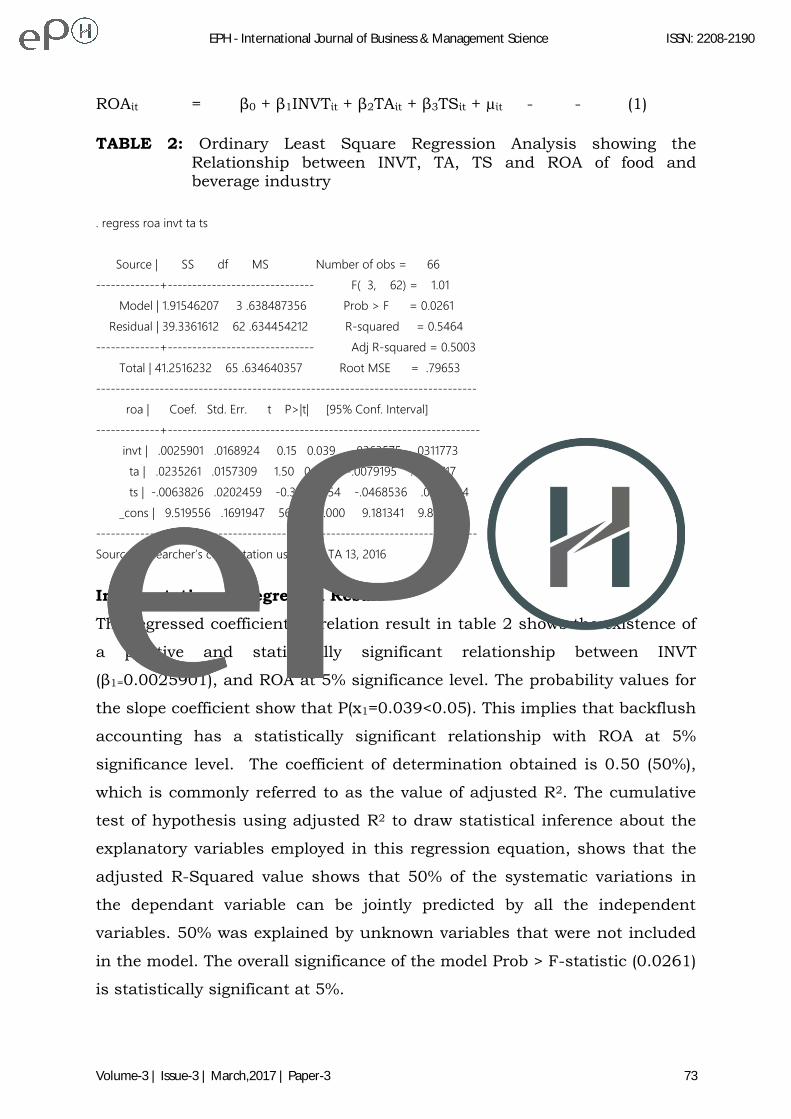
TABLE 2: Ordinary Least Square Regression Analysis showing the
Relationship between INVT, TA, TS and ROA of food and beverage industry
. regress roa invt ta ts
Source | SS df MS Number of obs = 66
-------------+------------------------------ F( 3, 62) = 1.01
Model | 1.91546207 3 .638487356 Prob > F = 0.0261
Residual | 39.3361612 62 .634454212 R-squared = 0.5464
-------------+------------------------------ Adj R-squared = 0.5003
Total | 41.2516232 65 .634640357 Root MSE = .79653
------------------------------------------------------------------------------
roa | Coef. Std. Err. t P>|t| [95% Conf. Interval]
-------------+----------------------------------------------------------------
invt | .0025901 .0168924 0.15 0.039 -.0363575 .0311773
ta | .0235261 .0157309 1.50 0.040 -.0079195 .0549717
ts | -.0063826 .0202459 -0.32 0.754 -.0468536 .0340884
_cons | 9.519556 .1691947 56.26 0.000 9.181341 9.857772
------------------------------------------------------------------------------
Source: Researcher’s computation using STATA 13, 2016
Interpretation of Regressed Result
The regressed coefficient correlation result in table 2 shows the existence of
a positive and statistically significant relationship between INVT
(β1=0.0025901), and ROA at 5% significance level. The probability values for
the slope coefficient show that P(x1=0.039<0.05). This implies that backflush
accounting has a statistically significant relationship with ROA at 5%
significance level. The coefficient of determination obtained is 0.50 (50%),
which is commonly referred to as the value of adjusted R2. The cumulative
test of hypothesis using adjusted R2 to draw statistical inference about the
explanatory variables employed in this regression equation, shows that the
adjusted R-Squared value shows that 50% of the systematic variations in
the dependant variable can be jointly predicted by all the independent
variables. 50% was explained by unknown variables that were not included
in the model. The overall significance of the model Prob > F-statistic (0.0261)
is statistically significant at 5%.
EPH - International Journal of Business & Management Science ISSN: 2208-2190
Volume-3 | Issue-3 | March,2017 | Paper-3 73
Model Specification
ROA = 9.519556 + 0.0025901INVT
The implication is that for there to be a unit increase in ROA, there must be
0.0025901 multiplying effect of INVT
Decision Rule:
Accept the null hypothesis, if the P-value of the test is greater than 0.05.
Otherwise reject.
Decision:
The P-value of the test (Prob > F = 0.0261) is less than 0.05. In view of the
rule of thumb, H1 will be accepted and H0 rejected.
Conclusion:
It would be concluded that Backflush accounting (Proxy by inventory turnover)
has a positive and statistically significant effect on ROA of food and beverage
firms quoted on the floor of Nigerian Stock Exchange at 5% level of
significance.
TEST OF HYPOTHESIS II
H02: Backflush accounting, proxy by inventory turnover has no significant effect
on ROE of quoted selected quoted food and beverage firms in Nigeria.
Model Specification
ROEίt = β0 + β1INVTίt + β2TAίt + β3TSίt + µίt - - (2)
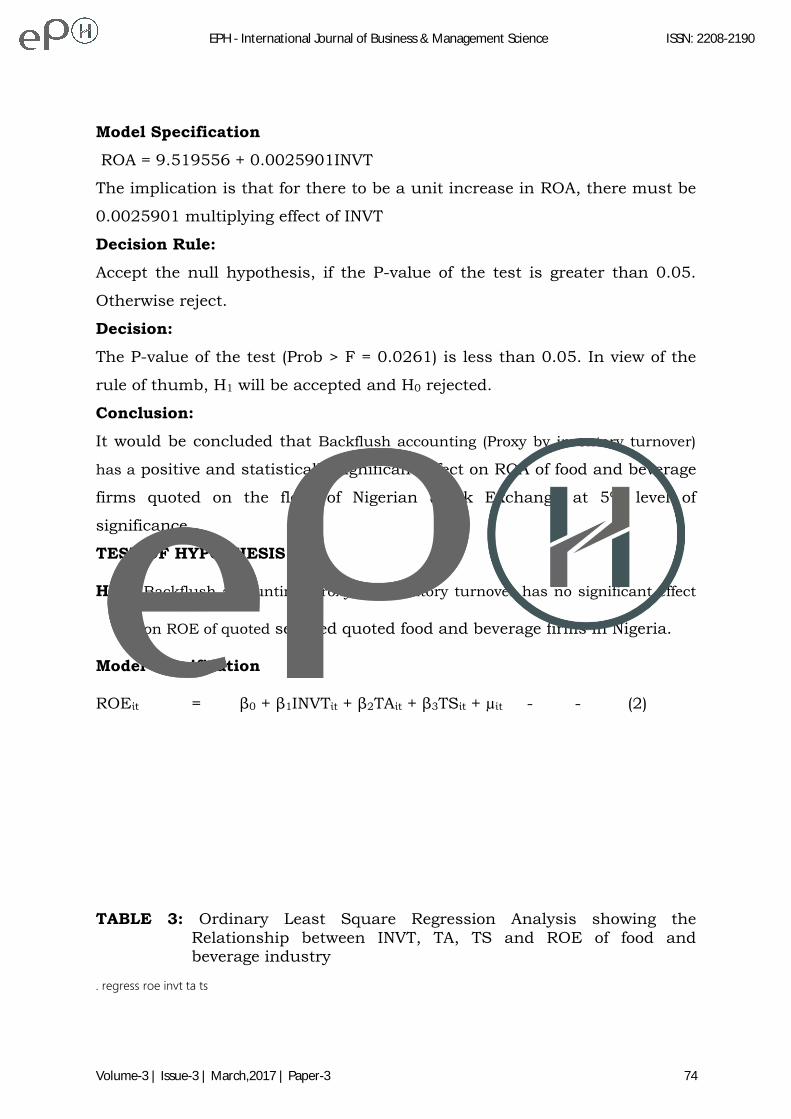
TABLE 3: Ordinary Least Square Regression Analysis showing the
Relationship between INVT, TA, TS and ROE of food and beverage industry
. regress roe invt ta ts
EPH - International Journal of Business & Management Science ISSN: 2208-2190
Volume-3 | Issue-3 | March,2017 | Paper-3 74
Source | SS df MS Number of obs = 66
-------------+------------------------------ F( 3, 62) = 1.63
Model | 1.48401463 3 .494671542 Prob > F = 0.0017
Residual | 18.8228178 62 .303593836 R-squared = 0.6731
-------------+------------------------------ Adj R-squared = 0.6282
Total | 20.3068325 65 .312412807 Root MSE = .55099
------------------------------------------------------------------------------
roe | Coef. Std. Err. t P>|t| [95% Conf. Interval]
-------------+----------------------------------------------------------------
invt | .0116274 .0116852 1.00 0.024 -.0117311 .0349859
ta | -.0164205 .0108818 -1.51 0.136 -.0381728 .0053319
ts | .0219498 .014005 1.57 0.122 -.0060458 .0499454
_cons | 8.374538 .1170397 71.55 0.000 8.140579 8.608497
------------------------------------------------------------------------------
Source: Researcher’s computation using STATA 13, 2016
Interpretation
The adjusted R-squared value shows that 63% of the systematic variations
in the dependent variable can be jointly predicted by all the independent
variables. And 37% was explained by unknown variables that were not
included in the model. The overall significance of the model Prob > F-
statistic (0.0017) is statistically significant at 5%.
The regression equation is:
ROE = 8.374538 + 0.0116274INVT
The implication is that, for there to be a unit increase in ROE there will be
0.0116274 multiplying effect of INVT.
Decision Rule:
Accept H0 if the P-value of the test is greater than 0.05, otherwise reject.
Decision:
Since there exist a positive and statistically significant level of 5% between
INVT and ROE. Then H1 will be accepted and Ho rejected.
Conclusion:
Based on the empirical observation above, INVT positively and significantly
relate with ROE of food and beverage firms at 5% level of significance.
EPH - International Journal of Business & Management Science ISSN: 2208-2190
Volume-3 | Issue-3 | March,2017 | Paper-3 75
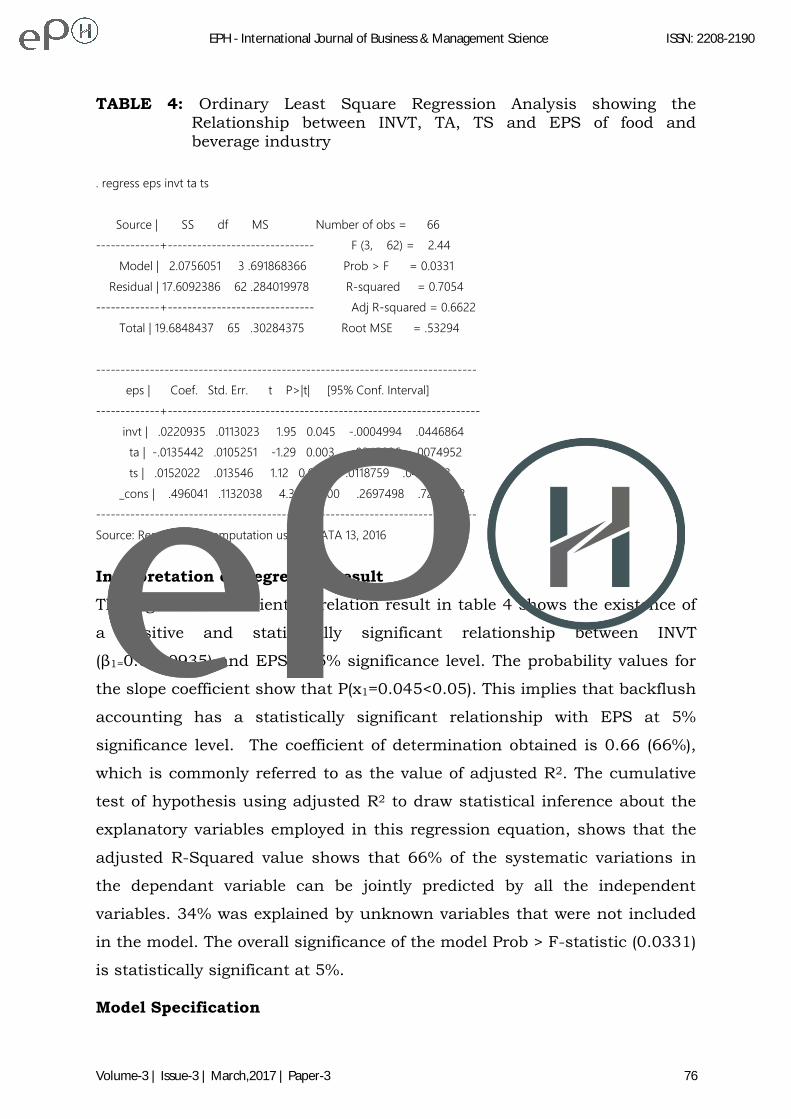
TABLE 4: Ordinary Least Square Regression Analysis showing the Relationship between INVT, TA, TS and EPS of food and
beverage industry
. regress eps invt ta ts
Source | SS df MS Number of obs = 66
-------------+------------------------------ F (3, 62) = 2.44
Model | 2.0756051 3 .691868366 Prob > F = 0.0331
Residual | 17.6092386 62 .284019978 R-squared = 0.7054
-------------+------------------------------ Adj R-squared = 0.6622
Total | 19.6848437 65 .30284375 Root MSE = .53294
------------------------------------------------------------------------------
eps | Coef. Std. Err. t P>|t| [95% Conf. Interval]
-------------+----------------------------------------------------------------
invt | .0220935 .0113023 1.95 0.045 -.0004994 .0446864
ta | -.0135442 .0105251 -1.29 0.003 -.0345836 .0074952
ts | .0152022 .013546 1.12 0.066 -.0118759 .0422803
_cons | .496041 .1132038 4.38 0.000 .2697498 .7223322
------------------------------------------------------------------------------
Source: Researcher’s computation using STATA 13, 2016
Interpretation of Regressed Result
The regressed coefficient correlation result in table 4 shows the existence of
a positive and statistically significant relationship between INVT
(β1=0.0220935) and EPS at 5% significance level. The probability values for
the slope coefficient show that P(x1=0.045<0.05). This implies that backflush
accounting has a statistically significant relationship with EPS at 5%
significance level. The coefficient of determination obtained is 0.66 (66%),
which is commonly referred to as the value of adjusted R2. The cumulative
test of hypothesis using adjusted R2 to draw statistical inference about the
explanatory variables employed in this regression equation, shows that the
adjusted R-Squared value shows that 66% of the systematic variations in
the dependant variable can be jointly predicted by all the independent
variables. 34% was explained by unknown variables that were not included
in the model. The overall significance of the model Prob > F-statistic (0.0331)
is statistically significant at 5%.
Model Specification
EPH - International Journal of Business & Management Science ISSN: 2208-2190
Volume-3 | Issue-3 | March,2017 | Paper-3 76
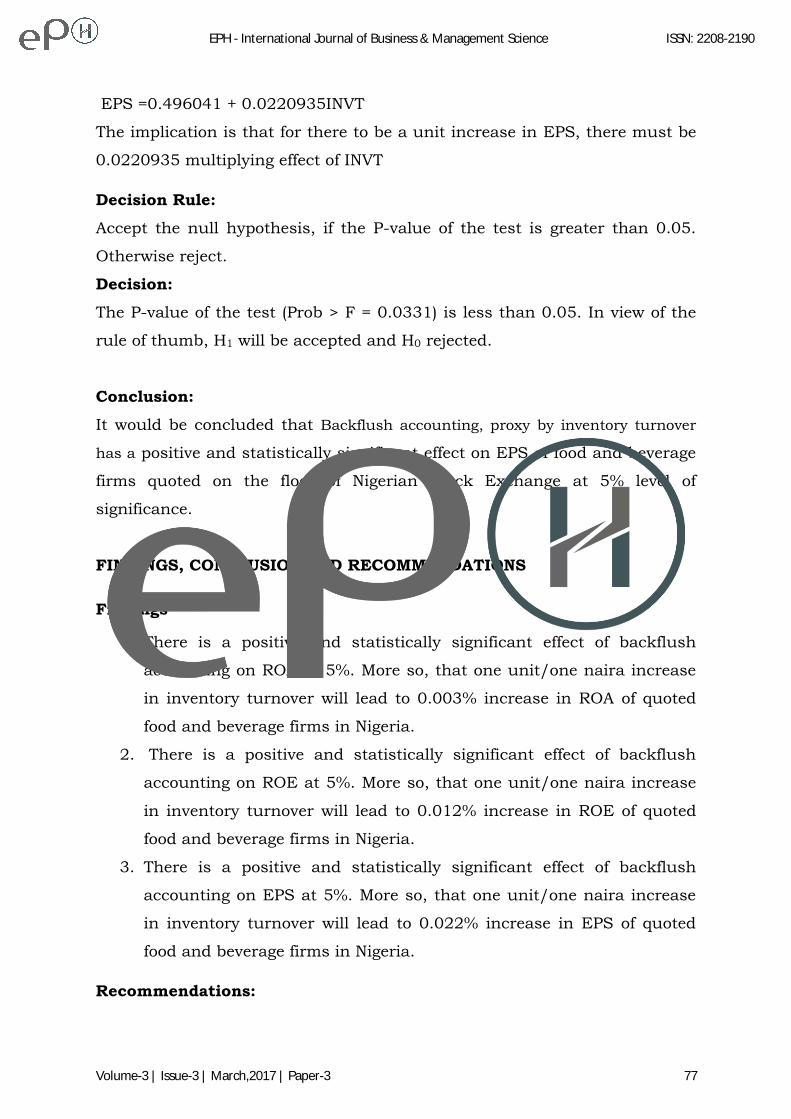
EPS =0.496041 + 0.0220935INVT
The implication is that for there to be a unit increase in EPS, there must be
0.0220935 multiplying effect of INVT
Decision Rule:
Accept the null hypothesis, if the P-value of the test is greater than 0.05.
Otherwise reject.
Decision:
The P-value of the test (Prob > F = 0.0331) is less than 0.05. In view of the
rule of thumb, H1 will be accepted and H0 rejected.
Conclusion:
It would be concluded that Backflush accounting, proxy by inventory turnover
has a positive and statistically significant effect on EPS of food and beverage
firms quoted on the floor of Nigerian Stock Exchange at 5% level of
significance.
FINDINGS, CONCLUSION AND RECOMMENDATIONS
Findings
1. There is a positive and statistically significant effect of backflush
accounting on ROA at 5%. More so, that one unit/one naira increase
in inventory turnover will lead to 0.003% increase in ROA of quoted
food and beverage firms in Nigeria.
2. There is a positive and statistically significant effect of backflush
accounting on ROE at 5%. More so, that one unit/one naira increase
in inventory turnover will lead to 0.012% increase in ROE of quoted
food and beverage firms in Nigeria.
3. There is a positive and statistically significant effect of backflush
accounting on EPS at 5%. More so, that one unit/one naira increase
in inventory turnover will lead to 0.022% increase in EPS of quoted
food and beverage firms in Nigeria.
Recommendations:
EPH - International Journal of Business & Management Science ISSN: 2208-2190
Volume-3 | Issue-3 | March,2017 | Paper-3 77

Based on the research findings, the following recommendations are proffered
to address the research problem.
1) Since backflush accounting has a positive and significant effect on ROA
then business environment should endeavour to imbibe the philosophy of
backflush accounting which has enormous merits in inventory control.
2) Since backflush accounting has a positive and significant effect on ROE,
then c ompanies should use the costing techniques that are most
suitable for their environment to increase their level of profitability.
3) Since back flush accounting has a positive and significant effect on EPS,
companies should invest in knowledge capital and information technology
to maximise shareholders’ wealth.
REFERENCES
Abu Hashish, K.(2003). The role of published accounting information in predicting stock
prices: an applied study on listed corporations on Amman stock Exchange. Al Bass’er
Magazine/University, Amman issue 2, 2003.
Akindele, A .(2012). The impact of international financial reporting standards on financial
statements. Journal of business Economics, 2, 98 - 104
Asika N.(1991). Research methodology in the behavioural science, Lagos, Longman Nigeria
Fatah A.M .(2013). An empirical study of the use of cost accounting in Libyan agricultural
firms. Thesis submitted to Othman.Yeop Abdullah Graduate School of Business,
University Utara, Malaysia.
Graves A. & Ward Yvonne .(2004). A new cost management and accounting approach for
lean enterprises. Paper presented at the Irish Academy of Management Annual
conference, Trinity, College, Dublin 3-43.
Guerreiro R, Cornacchione E.B & Soutes D (2012), External disclosure and management
accounting artefacts. international journal of business and commerce 1(9), 16-37.
Irina Berzkalne and Elvira Zelgalve .(2014). Return on equity and company characteristics:
an empirical study of industries in Letvia. The 8th International Days of Statistics and
Economics, Prague, September 11 – 13, 2014
Joan Woodward .(1958). Management & Technology, H.M Stationery office.
EPH - International Journal of Business & Management Science ISSN: 2208-2190
Volume-3 | Issue-3 | March,2017 | Paper-3 78
Kabajeh, Nuaimat & Dahmash.(2012). International Journal of Humanities and Social
Science 2 (11), June 2012
Lawrence P.R & Lorsch J.R .(1967). Organization and management, Boston Graduate
School of business administration Harvard University.
Mbawuni J. & Anerty A.R. (2014). Exploring Management Accounting Practices in
emerging telecommunication market in Ghana, Accounting and Finance Research
3(4), 1-5
Omah I. & Okolie J.U .(2013). Spare parts management: an inventory control through just-in-
time (jit) philosophy, International Journal of Advanced Research in Management
and Social Sciences 2(2), 1-14
Omolehinwa E.O .(1999). Coping with cost accounting, Published by Pumark Nigeria Ltd,
Ikeja.
Onyeizugbe C. U .(2013). Practical guide to research methodology in management.
Ramezani and Mahdloo .(2014). Academic Journal of Research in Business and Accounting.
Sharminhoque .(2013). What is backflush costing.
Tabitha N. & Ogungbade O.I (2016), Cost Accounting Techniques adopted by manufacturing
and service industry within the last decade. International Journal of Advance
Management and Economics, 5(1), 48-61.
Ukessays.com .(2003). Explain the term Backflush Accounting
Uyar A. (2010). Cost and Management Accounting practices. A survey of manufacturing
Companies. Eurasian Journal of business and Economics,. 3, 113-125.
APPENDIX A
Population of the Study:
Food and Beverage Companies Quoted on the Nigeria Stock Exchange:
1. Nestle foods Nigeria Plc
2. Pepsico Inc.
3. Coco-Cola Company
4. Archer Daniels Midland Company
EPH - International Journal of Business & Management Science ISSN: 2208-2190
Volume-3 | Issue-3 | March,2017 | Paper-3 79
5. Cargill Company
6. Unilever
7. Sabmiller Plc
8. Conagra foods Inc.
9. Royal Friesland Campina
10. Arla foods Company
11. Seven-up bottling
12. Dangote flour
13. Flour mills of Nigeria Plc
14. Honeywell flour mills
15. P.S Mandrides Plc
16. Multi-trex integrated foods Plc
17. National Salt Company of Nigeria Plc
18. Union Dicon Salt Plc
19. UTC Nigeria Plc
20. Cadbury Nigeria Plc
APPENDIX B
Selected sample size of the study:
1. Seven-up bottling Company Plc
2. Dangote flour mills Plc
3. Flour mills Nigeria Plc
4. Honeywell flour mills Plc
5. P.S Mandrides Plc
6. Multi-Trex Integrated foods Plc
7. National Salt Company of Nigeria Plc
8. Union Dicon Salt Plc
9. UTC Nigeria Plc
10. Cadbury Nigeria Plc
11. Nestle Nigeria Plc
EPH - International Journal of Business & Management Science ISSN: 2208-2190
Volume-3 | Issue-3 | March,2017 | Paper-3 80