Accounting Information Systems: The Challenge of the Real-Time Reporting
Upload
khangminh22Category
view
0download
0
Corporate Financial Accounting and ReportingTim Sutton
second edition
second edition
Corporate Financial Accounting and Reporting
Corp
ora
te Fin
an
cial A
ccou
ntin
g
an
dRep
ortin
g
Tim Sutton
Tim
Su
tton
The aim of Corporate Financial Accounting and Reporting is to help current and future managersgain a thorough understanding of companies’ published financial reports. The book takes an
international perspective: international accounting practices are described and illustratedthroughout the text. The new edition has been thoroughly revised and updated to incorporate
changes in International Accounting Standards.
The text is divided into three parts: the first part covers the foundations of accounting andintroduces students to the main financial statements, the second part looks at thecomponents of financial statements in more depth while the third part explores howinvestors analyse financial statements.
Key features:
• Comprehensive coverage: includes some topics which do not usually appear in introductory texts and explains others in more detail than is customary.
• Clarity: the book is suitable for a range of students from around the world and has been extensively class tested in Europe.
• International approach: covers the most common accounting practices in the financial statements of both European and non-European companies as well as relevant EU and IAS requirements.
New to second edition:
• Thoroughly revised to incorporate changes in IAS.
• Legal, tax and regulatory frameworks have all been updated.
• Boxed material is included which broadens the discussion in the text and also introduces students to ideas from recent academic research.
• Includes a downloadable Instructor's Manual which is available to lecturers on the website at www.booksites.net/sutton
Corporate Financial Accounting and Reporting is designed for international MBAprogrammes and specialist postgraduate programmes in international business/finance
in Europe. It can also be used in international business programmes at the undergraduatelevel.
About the author:
Tim Sutton is visiting Professor of Accounting at IESE Business School in Barcelona. He hasheld teaching appointments in European and North American business schools, including
Kellogg in the USA and Insead in France. A chartered accountant, he has UK undergraduate andpostgraduate degrees and a doctorate from the USA. His teaching experience has been across
undergraduate, postgraduate and executive development programmes and he has publishedresearch in leading academic journals.
an imprint of
www.pearson-books.com
second edition

Corporate FinancialAccounting and Reporting
CFA_A01.qxd 11/6/03 2:06 PM Page i

We work with leading authors to develop the strongest educational materials in business and finance, bringing cutting-edge thinking and best learning practice to a global market.
Under a range of well-known imprints, including Financial Times Prentice Hall, we craft high quality print and electronic publications which help readers to understand and apply their content, whether studying or at work.
To find out more about the complete range of our publishing please visit us on the World Wide Web at:www.pearsoned.co.uk
CFA_A01.qxd 11/6/03 2:06 PM Page ii

Corporate FinancialAccounting and ReportingSecond Edition
Tim Sutton
CFA_A01.qxd 11/6/03 2:06 PM Page iii

Pearson Education Limited
Edinburgh GateHarlow Essex CM20 2JEEngland
and Associated Companies throughout the world
Visit us on the World Wide Web at:www.pearsoned.co.uk
First published 2000Second edition published 2004
© Financial Times Management 2000© Pearson Education Limited 2004
The right of Timothy G. Sutton to be identified as author of this work has been asserted by him in accordance with the Copyright, Designs, and Patents Act 1988.
All rights reserved. No part of this publication may be reproduced, stored ina retrieval system, or transmitted in any form or by any means, electronic,mechanical, photocopying, recording or otherwise, without either the priorwritten permission of the publisher or a licence permitting restricted copyingin the United Kingdom issued by the Copyright Licensing Agency Ltd,90 Tottenham Court Road, London W1T 4LP.
ISBN 0 273 67620-2
British Library Cataloguing-in-Publication DataA catalogue record for this book is available from the British Library.
10 9 8 7 6 5 4 3 2 108 07 06 05 04
Typeset in 10/12pt Minion by 35Printed and bound by Bell & Bain Limited, Glasgow
The publisher’s policy is to use paper manufactured from sustainable forests.
CFA_A01.qxd 11/6/03 2:06 PM Page iv

Contents
Key profitability ratios 51Summary 56Problem assignments 56
4 Accounting records: structure and terminology 64
Introduction 64The general ledger and ledger accounts 65The format of a ledger account 66The journal and the journal entry 69The trial balance 71The recording process: from transaction to
trial balance 73Accounting record-keeping in European
companies 80Summary 84Problem assignments 84
5 Accrual adjustments and financial statement preparation 90
Introduction 90The accrual basis of accounting 91Accrual adjustments 94Error adjustments 98Closing entries 99The recording process: from trial balance to
financial statements 101The role of the contra account 110Dividends: the distribution of profits 112The extraordinary items fallacy 113Summary 114Problem assignments 115
6 The annual report and accounts 122
Introduction 122Overview 123Management’s report to shareholders 124Alternative balance sheet and income
statement formats 125The income statement fallacy 131
List of boxes ixPreface xiAbbreviations xivPublisher’s acknowledgements xvii
1 Financial accounting: an overview 1
Introduction 1What is financial accounting? 2Overview of the company and its activities 2What are the accounts? 3What is an accounting entity? 4Who are the users of financial accounts? 5The aim – and desirable qualities – of accounts 6The long arm of accounting 8The structure of the book 9
PART 1Foundations
2 The balance sheet: a financial picture of the firm 13
Introduction 13The purpose of a balance sheet 14The components of the balance sheet 15The balance sheet and transactions 17Balance sheet presentation 22The balance sheet and financial ratios 26Valuation fallacy 28Summary 29Problem assignments 31
3 The income statement 36
Introduction 36The purpose of the income statement 37The format of the income statement 37The link between income statement and
balance sheet 38The effect of transactions 40The fallacy of profit and cash flow equivalence 46Income statement presentation 48
CFA_A01.qxd 11/6/03 2:06 PM Page v

Appendix 8.1: Sum-of-years’-digits and units-of-production depreciation 223
Appendix 8.2: Investment property 224Problem assignments 226
9 Inventories 235
Introduction 235Inventory records: perpetual and
periodic systems 236The capitalisation decision 238Flow of product costs: retailer and
manufacturer 239Inventories at historical cost 243Lower of cost or market rule 248Inventories at replacement cost 250Valuation of inventories: rules and custom 253Financial statement presentation and analysis 255Summary 259Appendix 9.1: Variable costing 260Problem assignments 262
10 Recognition of revenue and valuation of receivables 271
Introduction 271
Section 1: Core issues 272Revenue recognition revisited 272Credit sales: terms and methods of payment 276Receivables valuation 277Bad and doubtful debts 280Sales returns and allowances 284
Section 2: Specialised topics 285Long-term contracts 285Transfer of receivables 290Long-term receivables 295
Section 3: Revenues, receivables and financial statement analysis 298
Summary 301Problem assignments 302
11 Liabilities, on and off balance sheet 310
Introduction 310
Section 1: General issues 311Definition, recognition and measurement 311Problem areas 312
Section 2: Long-term debt 318Economic and legal background 318Initial recognition and measurement 319
vi CONTENTS
Notes to the accounts 132Governance statement and auditors’ report 134EU disclosure and audit requirements 136The cash flow statement 137Popular financial ratios among investors 146Differences in UK/US accounting terms
in financial reports 147Summary 148Appendix 6.1: The EU’s company law
harmonisation programme 149Problem assignments 151
PART 2The house of accounting
7 Key conceptual issues in financialaccounting 163
Introduction 163Accounting policies and their origins 164Fundamental accounting principles 169The ‘conceptual framework’:
a new agenda for accounting 170A recognition test for assets and liabilities 172Measurement of assets and liabilities 173Recognition and measurement
controversies 177Capital maintenance and the measurement
unit in accounts 177Summary 183Appendix 7.1: An overview of the IASB and
its predecessor, the IASC 183Appendix 7.2: Present value concepts –
an introduction 186Problem assignments 190
8 Fixed assets, tangible and intangible 196
Introduction 196
Section 1: Tangible assets 197The capitalisation decision 197The depreciation decision 199Repairs and improvements 205Retirement 205The valuation decision 207
Section 2: Intangible assets 211
Section 3: Fixed assets and financial statement analysis 220
Summary 222
CFA_A01.qxd 11/6/03 2:06 PM Page vi

Determining the periodic cost of debt 322Derecognition 327Accounting for debt: international practice 328
Section 3: Leasing 329Types of lease 329Lessee accounting 330
Section 4: Liabilities and financial statement analysis 335
Summary 342Appendix 11.1: Leasing–lessor accounting 343Problem assignments 347
12 Shareholders’ equity 357
Introduction 357
Section 1: Core issues 358Different forms of business organisation 358Share capital 359Accounting for share issues and profit
appropriation 363
Section 2: Specialised topics 371Purchase of own shares 371Convertible securities and warrants 374State aid to companies 377
Section 3: Shareholders’ equity and financial statement analysis 379
Summary 384Problem assignments 385
13 Financial investments 394
Introduction 394Types of financial investment 395Recognition and measurement 397Fair value accounting under IAS 400Derivatives and hedge accounting 408Disclosure and analysis of financial
investments 413Summary 417Problem assignments 417
14 Equity accounting and consolidations 425
Introduction 425
Section 1: Core issues 426Equity method of accounting 426Consolidation accounting: the basic
structure 431Fair value adjustments and goodwill 435
Consolidation and acquisition accounting under IAS 439
Section 2: Specialised topics 441Minority interests 441Joint ventures 446Divesting a business 447
Section 3: Consolidated accounts and financial analysis 449
Summary 453Problem assignments 454
15 Transactions and operations in foreign currencies 465
Introduction 465Accounting for transactions in
foreign currencies 466Accounting for foreign operations 471Financial statement disclosures and
analysis 480Summary 484Problem assignments 485
16 Employment costs 491
Introduction 491
Section 1: General issues 492Types of employee benefit 492Accounting for employee benefits:
an overview 492
Section 2: Specialised topics 498Pension benefits 498Employee share options 509
Section 3: Employment costs and financial analysis 514
Summary 519Problem assignments 520
17 Accounting for corporate income taxes 529
Introduction 529
Section 1: Core issues 530Taxes on companies 530Taxation of corporate income:
general framework 530The cost of income taxes: recognition issues 535International accounting rules and practice 544
Section 2: Deferred tax accounting: extensions 545Deferred tax assets 545
CONTENTS vii
CFA_A01.qxd 11/6/03 2:06 PM Page vii

viii CONTENTS
Trend and cross-section analyses of financial data 608
The investor’s financial ratio toolkit 612Profitability, risk and cash flow analysis
illustrated 621Residual income 629
Summary 631Appendix 19.1: Market efficiency and its
implications 632Appendix 19.2: Carlsberg Group: annual
accounts and key ratios for 2001 634Problem assignments 639
20 Financial statement analysis:extensions 650
Introduction 650
Section 1: Problem areas in financial statement analysis 651Major changes in operating activities 651Accounting changes 652Intercompany differences in accounting
policies 657Diversified operations 663Interim reporting 667
Section 2: Accounting manipulation and its detection 672
Summary 679Appendix 20.1: Earnings per share 680Problem assignments 685
Glossary 695Suggestions for further reading 707Index 709
Tax effects of revaluation and consolidation 549Measurement issues 550
Section 3: Corporate income taxes and financial analysis 552
Summary 557Problem assignments 558
PART 3Perspectives
18 The cash flow statement revisited 569
Introduction 569
Section 1: Cash flow analysis: benefits to investors 570Overview 570Assessing risk 572Measuring performance 574Forecasting 576Detecting earnings manipulation 577
Section 2: Specialised topics 579Constructing a cash flow statement from
balance sheet data 579Presentation of cash flows 583
Summary 591Problem assignments 592
19 Financial statement analysis: basic framework 603
Introduction 603Understanding the company and its
environment 604
CFA_A01.qxd 11/6/03 2:06 PM Page viii

2.1 The ecobalance 30
3.1 The value added statement 54
4.1 Luca Pacioli, double-entry bookkeeping and capitalism 81
5.1 The accrual basis and government accounts 93
7.1 Legal tradition, investor protection and company financing 167
7.2 Deprival value 175
8.1 Non-financial indicators: making intangibles tangible 218
9.1 The US LIFO puzzle 254
10.1 Securitising receivables 292
10.2 Revenue games 300
11.1 Financial leverage: international differences 341
12.1 Corporate ownership and control: international perspectives 362
12.2 Valuing companies using book value and residual income 383
13.1 Fair value accounting and banks: stock market lessons 416
14.1 Merger accounting 442
15.1 Adoption of the euro: accounting implications 466
16.1 ‘Economic consequences’ of accounting standards 513
17.1 Fair valuation of deferred tax assets and liabilities 553
18.1 Using cash flow data to detect earnings manipulation 578
20.1 Accounting conservatism: international differences in earnings timeliness 661
20.2 Corporate governance and financial reporting 675
List of boxes
CFA_A01.qxd 11/6/03 2:06 PM Page ix

CFA_A01.qxd 11/6/03 2:06 PM Page x

l Purpose and structure of the book
This book is an introductory financial accounting textbook. It is designed for use in businessadministration courses at undergraduate and graduate levels which are offered by European uni-versities and business schools.
The book is directed at future managers and finance professionals. The aim is to help themunderstand and interpret the accounts which companies issue each year. The structure of thebook reflects this goal. It has three parts following the introductory chapter:
l Part 1 ‘Foundations’ (Chapters 2–6) introduces the main financial statements and the termsin them. It also shows where the numbers in them come from. It explains briefly the processby which transactions are recorded and summarised in financial statements. Certain account-ing fallacies are exposed.
l Part 2 ‘The House of Accounting’ (Chapters 7–17) considers in more depth the componentsof the financial statements: the assets and liabilities that appear on the balance sheet; the revenues and expenses, gains and losses that constitute the income statement. It shows howthe accounting policies a company follows affect the numbers in the statements – and thus the financial ratios derived from them.
l How investors analyse financial statements is the subject matter of Part 3 ‘Perspectives’(Chapters 18–20). Widely used measures of performance such as earnings and cash flow areexplored at length.
l Focus of the book
Those using this book are likely to be a diverse group of people. They come from many differentcountries – and not just within Europe. Although English may not be their first language, theirEnglish-language skills are high. What they share in common is an international outlook.
The book caters to their needs in various ways. Its approach to the subject matter is open. Forexample, the chapters in the second part describe and illustrate the most common accountingpractices that managers will encounter in the financial statements of larger companies, bothEuropean and non-European.
In many cases, these practices are the result of national laws. For companies in EuropeanUnion (EU) member states, such laws are heavily influenced by EU directives. Additionally, an increasing number of larger companies, within and outside Europe, follow internationalaccounting standards (IAS) when preparing consolidated accounts. Thus most chapters in thesecond part contain a section summarising the relevant EU and IAS requirements. The bookdoes not set down the accounting rules that apply in each European country, although unusualnational practices are mentioned.
For obvious reasons, the book has an Anglo-Saxon flavour. Given an international readership,this is not a disadvantage. As we’ve noted, many larger European companies base their consolid-ated accounts on IAS. These standards have Anglo-Saxon roots. Some European multinationals
Preface
CFA_A01.qxd 11/6/03 2:06 PM Page xi

have adopted US accounting standards. In many cases these are similar to IAS. Significant dif-ferences between US and international standards are pointed out in the text.
The accounting practices described and illustrated are general in nature. They apply to com-panies in all industries. The book does not discuss accounting practices that are industry-specific.
l Distinctive featuresThe book has distinctive features. Among them are the following:
l Comprehensive coverage. Included in the book are some topics – such as accounting for pen-sion costs and foreign operations – which do not usually appear in introductory texts. Othertopics like consolidation accounting and financial statement analysis are dealt with at greaterlength than is customary. As a result, the book can be used in an elective course on, say, corporate financial reporting as well as in a core financial accounting course.
Moreover, it can serve as a reference book. Many students retain their accounting text-books after their studies have finished for this reason. Because of its coverage and other features – such as easy-to-follow examples in each chapter and an extensive glossary – thebook is well suited for this role.
l Modular design. Instructors have different preferences as to the topics covered in an intro-ductory course and the order in which they are discussed. The book’s design allows for this.In Part 2, each chapter is largely self-contained and an instructor can discuss topics in a dif-ferent order from that presented. Moreover, Chapters 18 (on cash flow analysis) and 19 (onfinancial statement analysis) from Part 3 of the book can be scheduled for inclusion at anystage after the introductory material (Chapters 1–6) has been covered.
In Parts 2 and 3 of the book, the chapters themselves are, in most cases, modular in con-struction. In some, ‘core issues’ are distinguished from ‘specialised topics’. In others, thechapter is broken up into separate, ‘stand-alone’ sections. This gives instructors additionalflexibility when drawing up a syllabus.
l Clarity. The book has been designed with a non-Anglophone audience in mind. It has beenextensively tested in a major European business school where the majority of students are notnative English speakers.
l How to use the bookAn accounting textbook is not like a consumer appliance. There is no need for ‘instructions foruse’. But students and instructors may find helpful some suggestions as to how to use it.
For students who have never opened an accounting book before, the secrets to mastering the material are patience and perseverance. Do not be in a hurry. Spend time on the examples inthe text. Work through the numbers in them. Make sure you understand how the accountingtransaction or event illustrated is recorded. As befits its name, accounting requires only simplemathematical (counting) skills. The logic behind ‘double entry’ (the recording of all accountingevents twice – both the source of the resource flow and its destination) may take time to grasp –but is satisfying (and unforgettable) when it is. More troubling, perhaps, is the terminology.Some terms in everyday use, such as ‘depreciation’, have a different meaning in an accountingcontext.
Instructors have different concerns. Chief of these is the fit of text to course. The modulardesign of the book and the range of topics covered both help here. For example, in an intro-ductory course of approximately 30 hours of class time, the following topics can be covered:‘Foundations’ (Chapters 2–6); conceptual issues (7); and the ‘core’ sections of Chapters 8 to 14.Revisiting the cash flow statement (Chapter 18) is a helpful way of concluding the course andreviewing the material covered.
xii PREFACE
CFA_A01.qxd 11/6/03 2:06 PM Page xii

A second course on corporate financial reporting (of similar length) is likely to focus on morespecialised topics. Examples are: leasing (Chapter 11); business combinations (Chapter 14); foreign operations (Chapter 15); pension costs (Chapter 16); and deferred tax accounting(Chapter 17). It can also serve to illustrate how investors use numbers in published accounts,drawing on material in Chapters 18–20.
An Instructor’s Manual is available to instructors who adopt the text. It contains solutions tothe end-of-chapter problem assignments and additional practice problems (with solutions).
Suggestions do not flow one way. Users of a book can make them too. If you have ideas abouthow the book can be improved, please send them to me. All constructive suggestions are appre-ciated and will be acknowledged.
l Second editionMuch has changed in the financial landscape since the first edition was published. The first threeyears of the millennium (2000–2002) saw sharp falls in share values after the bull market of the1990s. In some cases investors’ losses could be traced to misleading company accounting or fraud:examples are Enron and WorldCom in North America and Daewoo in Asia. These scandals, inturn, prompted regulatory changes – witness the US’s Sarbanes-Oxley Act. At the same time,moves to broaden world capital markets and lower companies’ capital costs continued apace. Anew international accounting standards-setting body, the IASB, was established. The EuropeanCommission announced that by 2005 all listed EU companies must prepare their accountsaccording to international accounting standards.
I have tried to capture the accounting fall-out from these events in the second edition. Otherchanges are more mundane, though no less important. Besides updating the text, examples andproblem assignments, I have taken the opportunity to revise some of the chapters to make theexposition clearer. Regulatory changes have also prompted a major rewriting of two of them (11 and 13) to incorporate new international accounting and disclosure rules on financial instru-ments. An innovation in this edition is the inclusion of boxed material in many chapters. Theirpurpose is to broaden and enliven the discussion in the chapter. In some cases, I summariseinteresting empirical research in accounting and related disciplines. In others, I illustrate finan-cial accounting’s ‘long arm’ – its influence in other fields such as environmental reporting, government budgeting and corporate governance. Apart from this, the structure of the book isunchanged.
Acknowledgements
Every author has debts – and not just monetary ones. Some of mine are of long standing. Amongthe creditors are Gerry Mueller who introduced international accounting to me and many othersat the University of Washington, and Larry Revsine of Northwestern University whose teachingskills are legendary. I am indebted to faculty at IESE Business School, the University ofMaastricht, and the Cass Business School of City University for their comments and feedback onthe first edition. Special thanks are also due to the librarians of IESE Business School and theICAEW in London for their assistance. The most numerous of my creditors are former IESE students who patiently endured the ambiguities and errors of the text before (and after) the firstedition saw the light of day. The book is dedicated to them.
PREFACE xiii
CFA_A01.qxd 11/6/03 2:06 PM Page xiii

A assetABS asset-backed securityABV accrued benefit valuation
(pension costing method)AC absorption costingAFS available-for-saleAG Austrian/German public limited
(liability) companyAMEX American Stock ExchangeA/R account receivableA/S Danish public limited (liability)
companyASB Accountings Standards Board (UK)AT assets turnoverBB beginning balanceBI beginning inventoryBV book valueBVCAP book value of capitalBVE book value of equityC$ Canadian dollarC & A capitalising and amortising (costs)CA contra-assetCAD Canadian dollarcapex capital expenditureCC (1) completed contract
(method of revenue recognition)(2) cost of capital
CEO chief executive officerCFO chief financial officerCFS cash flow statementCIP contracts in progressCL contra-liabilityCOGAFS cost of goods available for saleCOGS cost of goods soldCOS cost of salesCPP current purchasing powerCR current ratioCr. creditCV current valueD debtD&A depreciation and amortisation
DB (1) declining balance (method of depreciation)(2) defined benefit (type of pension plan)
DC defined contribution (type of pension plan)
DIV dividendsDKr Danish kroneDM DeutschemarkDr. debitDTA (1) deferred tax asset
(2) deferred tax accountingDTL deferred tax liabilityDVFA/SG Institute of Financial Analysts
(German)E equityEB ending balanceEBIT earnings before interest and taxEbitda earnings before interest, tax,
depreciation and amortisationEC European CommissionEDI electronic data interchangeEEIG European economic interest
groupingEI ending inventoryEMH efficient market hypothesisEMU European monetary unionEP exercise priceEPS earnings per shareESO employee share optionEU European UnionEUR euroEV enterprise valueEVA economic value addedFA financial assetFASB Financial Accounting Standards Board
(USA)FCC fixed charge coverage (ratio)FCM financial capital maintenanceFG finished goodsFIFO first in, first out
Abbreviations
CFA_A01.qxd 11/6/03 2:06 PM Page xiv

FL financial liabilityFTE full-time equivalentFV fair valueGAAP generally accepted accounting
principlesGBP Great Britain poundGDP gross domestic productGNP gross national productHC historical costsHFT held-for-tradingHTM held-to-maturityIAS International Accounting StandardsIASB International Accounting Standards
BoardIASC International Accounting Standards
CommitteeIC Interpretations CommitteeIE immediate expensing (costs)IFRS International Financial Reporting
StandardIOSCO International Organisation of
Securities CommissionsIPO initial public offeringIRR internal rate of returnIT Information technologyIWO immediate write-offJPY Japanese yenL liabilityLBO leveraged buyoutLIBOR London interbank offered rate LIFO last in, first outLOCOM lower of cost or marketLTD long-term debtM&S materials and suppliesMD&A Management’s Discussion and
Analysis (USA)MI minority interestMP market priceMV market valueMVE market value of equityN/R note receivableNA net assetsNBC net borrowing costNBV net book valueNETFLEV net financial leverageNFE net financial expenseNFI non-financial indicatorNOA net operating assetsNOK Norwegian kroneNOPAT net operating profit after tax
NRV net realisable valueNV Dutch public limited (liability) companyNYSE New York Stock ExchangeOA operating assetOCF operating cash flowOE owners’ equityOL operating liabilityOWC operating working capitalP&E property and equipmentP/B price/bookP/E price/earningsPB provisional balancePBV projected benefit valuation
(pension costing method)PC (1) parent company
(2) personal computerPCM physical capital maintenancePLC public limited (liability) company
(UK/Ireland)PM profit marginPOC percentage of completion
(method of revenue recognition)POS potential ordinary sharesPPE property, plant and equipmentPSC past service costPV present valuePVA present value of annuityR&D research and developmentRC replacement costRI residual incomeRM raw materialsROA return on assetsROCE return on capital employedROE return on equityROFA return on financial assetsRONOA return on net operating assetsROOA return on operating assetsRT receivables turnoverSA (1) French/Spanish public limited
(liability) company(2) selling and administrative(expenses)
SAR share appreciation rightsSE (1) shareholders’ equity
(2) societas europeaSEC Securities and Exchange Commission
(USA)SFAS Statement of Financial Accounting
Standards (USA)SFr Swiss francs
ABBREVIATIONS xv
CFA_A01.qxd 11/6/03 2:06 PM Page xv

SGA selling, general and administrative(expenses)
SI specific identificationSKr Swedish kronaSL straight line (method of depreciation)SME small and medium-sized enterpriseSoYD sum-of-years’ digits
(methods of depreciation)SpA Italian public limited (liability)
companySPE special purpose entitySTD short-term debtTD temporary differences (tax)TIE times interest earned
TMT telecoms, media and technology(industries)
TPA taxes payable accountingUHG/L unrealised holding gains/lossesUoP units of production
(method of depreciation)USD US dollarVAT value added taxVC variable costingWAAE weighted average accumulated
expendituresWAC weighted average costWACC weighted average cost of capitalWIP work-in-progress
xvi ABBREVIATIONS
CFA_A01.qxd 11/6/03 2:06 PM Page xvi

We are grateful to the following for permission to reproduce copyright material:
Exhibit 6.4 from Barco, Annual Report and Accounts 2001, Barco NV; Exhibit 6.21 from OMVGroup, Annual Report and Accounts 2000, reproduced with permission from OMVAktiengesellschaft, any further reproduction with prior permission of OMV Aktiengesellschaftonly; Exhibit 8.9 from Henkel Group, Annual Report 2001, Henkel KGaA; Exhibit 9.17 from BP Amoco, Annual Report and Accounts 2001, BP plc; Exhibit 9.18 from General MotorsCorporation, Annual Report and Accounts 2001, General Motors Corporation; Exhibits 10.9from Benetton Group, Annual Report 2001, Benetton Group; Exhibit 11.5 from BG Group,Annual Report and Accounts 2001, BG Group plc; Exhibit 11.8 from LVMH Group, AnnualAccounts 2001, LVMH; Exhibit 12.4 from BMW Group, Annual Report and Accounts 2001, BMWGroup; Exhibit 12.7 from PSA Peugeot Citroën, Annual Report and Accounts 2001, PSA PeugeotCitroën; Exhibit 13.5 from Novartis Group, Annual Report and Accounts 2001, Novartis Group;Exhibit 13.6 from Microsoft Inc., Annual Report and Accounts 2002, copyright MicrosoftCorporation, reproduced with permission of Microsoft Corporation; Exhibit 13.7 from AllianzGroup, Annual Accounts 2001 and Interim Report for 6 months to June 2002, AllianzAktiengesellschaft; Exhibit 14.17 from BT, Circular to Shareholders, September 2001, BT Groupplc; Exhibit 15.4 from SCA Group, Annual Report 2001, Svenska Cellulosa Aktiebolaget SCA;Exhibit 16.5 from Roche Group, Annual Report and Accounts 2001, Roche Holding Ltd; Exhibit16.8 from Toray Industries, Annual Report and Accounts for year to March 31, 2002, TorayIndustries, Inc.; Box 18.1 Figure from Causes and consequences of earnings manipulation: Ananalysis of firms subject to enforcement actions by the SEC in Contemporary AccountingResearch, 13(1), Canadian Academic Accounting Association (Dechow, P.M., Sloan, R.G. andSweeney, A.P. 1996); Exhibit 18.2 adapted from Financial Reporting and Statement Analysis: A Strategic Perspective, 3rd Edition, reprinted by permission of South-Western, a division of Thomson Learning (Stickney, C. 1996); Exhibit 19.1 adapted from Competitive Strategy:Techniques for Analyzing Industries and Competitors, adapted with permission of The Free Press,a Division of Simon & Schuster Adult Publishing Group (Porter, M.E. 1980); Exhibit 19.2 fromCanadean Beverage Market Research, Canadean Ltd; Appendix 19.2 from Carlsberg Group’sfinancial statements for 2001, Carlsberg A/S; Exhibit 19.3 from Statistical Handbook, BrewingPublications Ltd (British Beer and Pub Association 2002), and Demographic Yearbook, UnitedNations (UN, various); Exhibit 19.4 from Carlsberg Group, Report and Accounts 2001, CarlsbergGroup A/S; Exhibit 19.5 from Carlsberg A/S, Report and Accounts 2001, Carlsberg Group A/S,and Heineken NV, Annual Report and Accounts 2001, Heineken NV; Exhibit 19.17 from KaoCorporation, Annual Report 2002, Kao Corporation; Exhibit 19.21 from Deutsche Telekom,Annual Report and Accounts 2001, Deutsche Telekom AG; Exhibit 20.1 from Xstrata Group,Annual Report 2001, Xstrata plc; Exhibit 20.4 from Benetton Group, Annual Report and Accounts2001, Benetton Group; Exhibit 20.8 from MyTravel Group plc, Annual Report and Accounts2001, MyTravel Group plc; Exhibit 20.11 from Smith & Nephew plc, Annual Report and Accounts2001, Smith & Nephew plc; Exhibit 20.13 from Nestlé, Management Report 2001, Nestlé S.A.
In some instances we have been unable to trace the owners of copyright material, and wewould appreciate any information that would enable us to do so.
Publisher’s acknowledgements
CFA_A01.qxd 11/6/03 2:06 PM Page xvii

CFA_A01.qxd 11/6/03 2:06 PM Page xviii

Financial accounting: an overview
INTRODUCTIONShining a light on company accounts‘Fair value’ accounting for all financial assets and liabilities is on itsway. Banks and companies hate the idea.(The Economist, 18 August 2001)
Amazon is all grown up, except for its accountingJeff Bezos [Amazon CEO] will get more credit if he drops pro formafrom his routine.(BusinessWeek, 5–12 August 2002)
Headlines like these are common in today’s financial press. They serve toremind us how important it is for business people to have a sound grasp of thefundamentals of financial accounting. The aim of this book is to supply thatknowledge.
This chapter sets the scene for the rest of the book. We start by answeringcertain basic questions. What is financial accounting? What are the accountswhich managers must know how to interpret? What is the entity beingaccounted for? And who are the users of the accounts or, to put it another way,whom do the accounts serve?
Published accounts are, by definition, in the public domain: investors, cred-itors, employees, government agencies and public interest groups all consultthem. Each of these groups has different information needs. How can one setof accounts serve so many different users? We assume – as do preparers ofcompany accounts – that investors are the main users and that they consult theaccounts for help in their investment decisions. This raises additional issues –what, for investors, are the characteristics of ‘useful financial information’?which characteristics are considered the most important? – which we addressin this chapter.
Accounting’s influence is felt beyond the investment community. As weillustrate in the penultimate section, it is present in many aspects of economicand social life – in the details of contracts between lenders and borrowers aswell as in ‘macro’ issues such as economic development and pension policy.We’ll come across other examples of accounting’s long arm later in the book.
The chapter concludes with a guide to the book’s chapters and a key to helpthe reader understand the numbers in them.
11
l What is financialaccounting?
l Overview of thecompany and itsactivities
l What are theaccounts?
l What is anaccounting entity?
l Who are the users offinancial accounts?
l The aim – anddesirable qualities –of accounts
l The long arm ofaccounting
l The structure of thebook
In this chapter
CFA_C01.qxd 11/6/03 2:09 PM Page 1

2 CORPORATE FINANCIAL ACCOUNTING AND REPORTING
What is financial accounting?
Financial accounting is the process of summarising financial data taken from an organisation’saccounting records and publishing it in the form of annual (or more frequent) reports for the benefitof people outside the organisation.
Two ideas are of key importance in this definition. First, financial data are taken from theaccounting records and summarised in the form of financial statements. The maintenance ofaccounting records, for example the recording of financial transactions in the books of account,is known as bookkeeping. The setting-up of accounting records and the devising of new struc-tures of records (now increasingly computerised) to provide timely, reliable information at lowcost are referred to as accounting systems design. Both systems design and bookkeeping tasksare often carried out or supervised by accountants. Both are essential to, but are different from,financial accounting.
Second, financial reports are published and issued to outsiders. Accountants also produce financial reports for use by an organisation’s managers – to help them plan and control its activities. This process is known as management accounting. The job of producing financialreports for external use falls to the financial accountant, for internal use to the managementaccountant.
The published annual accounts issued by larger companies in the European Union (EU) –and by publicly quoted companies in the USA – are audited. Managers are responsible forpreparing the company’s financial statements. However, the owners (and others) use them toevaluate managers’ performance. To protect the public from a potential conflict of interest onthe part of managers, larger EU companies must have their accounts checked by an independentexpert, the external auditor. The process of examination and verification of an organisation’saccounts, accounting records and record-keeping system is known generally as auditing.
Organisations, especially larger ones, employ their own experts to carry out internal audits oftheir accounting systems. Such audits help an organisation to safeguard its resources and assistthe external auditor in his or her duties: they are not required by EU law.
Overview of the company and its activities
We focus in this book on the financial accounting of a particular class of organisation, namelyprofit-seeking companies. Before outlining the accounting documents produced by a companyand the purposes they serve, it’s helpful to keep in mind the activities of a typical firm and theirinterrelations.
Consider the case of an entrepreneur who has a new business idea. She sets up a company (abusiness with its own legal identity), invests her own money in it and persuades others to con-tribute capital to it too. The company invests some of the capital in long-term resources – forexample, it acquires buildings and equipment and purchases licences and patents. It then beginsoperations. It recruits staff, purchases materials and services (again, with the capital it has raised)and, using the long-term assets acquired, produces goods and services for sale. If the business issuccessful, the operations generate profits which are used to reward the providers of capital – inthe form of interest and dividend payments – and to expand the business. The interrelation ofthe financing, investing and operating activities of the firm is illustrated in Exhibit 1.1.
For successful firms, the resource flow cycle is continuous. As Exhibit 1.1 makes clear, someof the profits from the firm’s operations are ploughed back into the business. If internal fundsare insufficient to pay for new long-term assets, additional capital is raised from owners andlenders (e.g. banks).
CFA_C01.qxd 11/6/03 2:09 PM Page 2

CHAPTER 1 • FINANCIAL ACCOUNTING: AN OVERVIEW 3
The activities of the firm: financing, investment and operationsExhibit 1.1
What are the accounts?
The term ‘the accounts’ has two meanings for managers. It can refer to the summary financialstatements which are produced for internal and external use on a periodic basis. It’s also used todescribe the collection of accounting records in which transactions are recorded and from whichfinancial statements are prepared. We use the term mostly in its first sense in this book. Whenreferring to summary financial statements, we shall concentrate on the (published) annualaccounts, since these are the most comprehensive set of periodic accounts companies producefor outsiders.
The annual accounts comprise, at a minimum, a balance sheet, an income statement (orprofit and loss account) and accompanying notes to the accounts, together with the auditor’sreport on the accounts. The balance sheet lists in summary form a company’s resources (assets)and claims to them (liabilities and shareholders’ equity). It provides readers of the accounts withinformation about the company’s financial condition on a particular day (usually the last day ofthe financial year).
Readers of accounts also want to know how the company has performed over the financialyear. In particular, they want to know how and by how much its resources increased or decreasedin this period as a result of its operations. For this information, they turn to the income statement which shows the company’s revenues and expenses for the year. Revenues are theincreases, expenses the decreases, in its net resources which arise largely from its operating activities. Profit (synonyms: income, earnings) is the excess of revenues over expenses. It is awidely used indicator of a company’s performance in a period. Investors relate profit to someother figure in the accounts – to the previous period’s profit, to the number of shares outstand-ing (earnings per share), or to the company’s assets or capital (rate of return on investment) –to increase its utility as a performance measure.
Companies often include other statements in their annual accounts. One of the most usefulis the cash flow statement which, as its name suggests, summarises the flows of cash into andout of the company during the financial year. In many European countries this is now a requiredpart of the annual accounts of publicly quoted companies.
CFA_C01.qxd 11/6/03 2:09 PM Page 3

4 CORPORATE FINANCIAL ACCOUNTING AND REPORTING
Relating these three financial statements to the resource flow cycle in Exhibit 1.1, only thecash flow statement records flows – specifically, cash flows – with respect to the three activitiesshown. The income statement is also a ‘flow’ statement but it focuses largely on flows arisingfrom the operating activities of the firm. The balance sheet, by contrast, is a ‘stock’ statement. Itshows the capital the firm has raised, the investments it has made and its trading position (e.g.its inventories and cash) – all in terms of the balances in these accounts on a given day. However,it does cover all three activities.
The notes to the accounts serve several purposes. They provide more detail on items in thebalance sheet, income statement and cash flow statement. They also inform the reader about theaccounting policies the managers of the company have followed when preparing its accounts.
Companies publish financial information in addition to the annual accounts. For example,publicly quoted companies are required by stock exchange rules to produce interim accountseither half-yearly or quarterly, depending on the stock exchange.
What is an accounting entity?
Published accounts must relate to some entity. What is it? For the purposes of this book, anaccounting entity is a company or group of companies under common control. This is a narrowdefinition. The term ‘accounting entity’ can also embrace the business activities of an individualtrader or of a partnership. Charitable organisations, government agencies and co-operatives areaccounting entities, too. We limit our study to companies for two reasons. First, organisations likecharities and government agencies have different accounting and reporting practices. Second, inmany countries sole traders and partnerships are not required to publish accounts. However, theideas in this book apply to not-for-profit organisations and unincorporated businesses whichadopt corporate accounting practices.
An accounting entity is not necessarily the same as a legal entity. For example, in most coun-tries a group of companies under common control is not a legal entity (although each indivi-dual company in the group is). It is, however, an accounting entity: it must prepare consolidatedaccounts. In contrast, the business activities of a sole trader or a partnership constitute anaccounting entity even though, in law, the private and business activities of the trader or activepartner cannot be separated. For example, the liability of such individuals for the debts of theirbusiness is unlimited, whereas in the case of most companies, the liability of the owners (theshareholders) is limited to the share capital for which they have subscribed.
Even with our narrow definition of accounting entity, there are practical problems applyingit. How is control defined? Must the dominant company own a majority of the voting shares ofthe dominated company? Or can control be demonstrated in other ways, for example by meansof contractual arrangements? There are other issues. For example, many companies in Europeand elsewhere have set up funded pension plans for their employees. Under the scheme, companycash is transferred to a pension fund which invests it on a long-term basis to meet future pensionpayments to retired employees. Should the pension fund be considered a separate accountingentity or is it really part of the company? We address these issues in the course of the book.
There are, in law, various types of company. The two most common in the European Unionare the public and the private (limited liability) company. A public company differs from a pri-vate company in two important respects. First, it usually has a larger capital base because the lawsets a higher minimum capital requirement for public companies. Second, there are usually norestrictions on the transfer of shares of a public company. Private companies can and do imposesuch restrictions. An EU company signals whether it is public or private by the abbreviation – orextension – attached to its name. This varies by country: for example, public companies in Franceand Spain carry the extension SA, in Austria and Germany AG, and in Ireland and the UK PLC.
CFA_C01.qxd 11/6/03 2:09 PM Page 4

CHAPTER 1 • FINANCIAL ACCOUNTING: AN OVERVIEW 5
Users of corporate financial accountsExhibit 1.2
A full listing of extensions – for non-European as well as European companies – can be foundon the website www.corporateinformation.com.
Note that companies whose shares are listed on a stock exchange are public companies in thelegal sense. A private company cannot be a quoted company. Stock exchanges impose high min-imum capital requirements and usually outlaw restrictions on the transfer of shares.1
Who are the users of financial accounts?
The principal users of a company’s published annual accounts are investors. ‘Investors’ is a broadterm. When the president of a company writes an open letter to shareholders in the managementreport which accompanies the annual accounts, he or she is addressing not just existing ownersof the company’s shares but also the investment community at large.
There are other users of annual accounts, as Exhibit 1.2 shows.Users are as varied as society itself. Banks and other creditors consult the accounts to check
on the financial health of prospective borrowers. Unions use them in formulating wage claims.Tax authorities refer to them when calculating a company’s income tax liability. When publicinterest groups campaign for corporate action on social and environmental issues, they often cite(high) profit figures – taken from the accounts – to justify their demands.
Since there are different user groups, why are there not different versions of the annualaccounts to meet the specific information needs of each group? Multiple accounts are rejectedon cost-benefit grounds. It’s argued that by meeting the needs of investors, who are the primaryusers and the most demanding, the accounts will be comprehensive enough to serve the needs ofother user groups. Moreover, the management report which accompanies the annual accountsoften contains supplementary information – for example, on the health and safety of employeesor on the company’s environmental activities – which is of interest to other groups.
Governments acknowledge the public interest in annual accounts by regulating their formatand content. For example, member states in the EU require all companies, public and private, to
CFA_C01.qxd 11/6/03 2:09 PM Page 5

6 CORPORATE FINANCIAL ACCOUNTING AND REPORTING
publish annual accounts, even if in abridged form. Additional disclosure burdens are placed onlarger EU companies, private as well as public.
Government regulation of accounts is controversial. Supporters claim that investors as well as other user groups benefit from it. Standardising the form and content of accounts makes iteasier for investors to compare the financial performance of different companies in the sameindustry in one country. This enables them to allocate investment resources more efficiently.The European Commission extended the argument to cross-border comparisons of companies.Making accounting and reporting practices similar across member states should improve theallocation of capital within the whole European Union, it asserts.
Those opposed to regulation take a different line. Companies compete for funds. They try to raise money at the lowest cost. Information reduces uncertainty and, as a result, the rate of return investors seek on the capital they supply. Thus it is in a company’s interest, anti-interventionists maintain, to furnish investors with the information they demand. Opponents of accounting regulation have had limited success so far. But the debate illustrates an importantpoint. Arguments on accounting matters are not always technical: they can enter the politicalarena as well.
The aim – and desirable qualities – of accounts
What is the aim of financial accounts? This appears to be a philosophical question – but, in fact,the answer has important implications for the way financial statements are prepared. The gen-erally accepted view today is that the main objective of published accounts is to provide financialinformation that users of accounts will find helpful in making economic decisions.2 This begs thequestion: what types of information do users find helpful in making such decisions?
Consider the process by which an investment decision is made. (We focus on investmentdecisions because, as argued earlier, investors use published accounts more than any othergroup.) An investor wants to allocate resources among various investment opportunities. Arational investor will choose those which offer the highest return for a given level of risk. Returnis measured by the amount and timing of future cash flows expected from an investment, riskby the expected variability of those cash flows. Thus the investor needs information which willhelp him or her estimate the amount, timing and variability of future cash flows associated withan investment.
The (annual) accounts provide such information, it is claimed. The balance sheet helps theinvestor assess a company’s financial strength and the income statement its financial perform-ance. The cash flow statement offers additional clues about the company’s ability to survive.(Even profitable companies can founder because of the cash flow strains of rapid expansion.)Armed with this picture of the company’s financial past, an investor can better predict the cashflows it is likely to generate in the future.
This view of the objective of published accounts – the decision-usefulness view – has not goneunchallenged. Some people maintain that accounting is a control device and the main purposeof accounts is to monitor and influence behaviour. According to this ‘monitoring’ view, ownerswant to know whether the managers to whom they have entrusted their capital have invested itwisely. Creditors want to know whether owners have taken actions such as paying high dividendsthat have depleted the assets of the firm and threatened its ability to repay its debts. Existingaccounts provide this information because they show owners and creditors what has happenedto the firm in the past. Investors, however, want forward-looking information – information abouta firm’s new products and investment plans, for example – and they will not find it in conven-tional accounts, according to this view.3 In later chapters, we see how this difference in viewpointcan have major practical consequences, especially in the valuation of assets and liabilities.
CFA_C01.qxd 11/6/03 2:09 PM Page 6

There is less disagreement about the desirable characteristics of financial information. Forinformation to be useful, whether for investment decisions or for monitoring of managers, itshould be:
1 Understandable. Financial reports are not designed for the benefit of experts alone. Theyshould be accessible to the non-professional investor who is informed on business and eco-nomic matters and willing to spend time analysing them.
2 Relevant. Information is relevant if it has the potential to affect a user’s beliefs: to confirm hisbeliefs about the past, or to shape his beliefs about the future. Relevant information is usuallytimely: delay reduces its utility.
3 Reliable. Information is considered reliable if it gives a faithful picture of what has occurred,if it’s comprehensive (nothing material has been left out of the picture), and if it’s verifiable(the contents of the picture can be checked against independent sources of information).
Reliable information is neutral. Information loses its neutrality if it favours one user groupat the expense of another. For example, the intentional understatement of assets results inbiased information: creditors may benefit but investors suffer. Notice the inclusion of ‘inten-tional’. Preparers of accounts are encouraged to be prudent in the way they account for assets(and liabilities). This may lead to a conservative valuation of assets – but not their deliberateunderstatement.
It must be neutral in another way. It must ‘tell it how it is’. Thus smoothing a firm’s income(reducing its inherent variability by accounting devices) can also result in biased information.
4 Comparable. Assessing a company’s performance requires investors and others to make com-parisons – with the performance of the company’s competitors and with its own performancein previous periods. To make valid comparisons, they need information which is consistentacross firms and over time.
5 There is one general test which useful financial information must meet. Gathering and pub-lishing it must be economically justifiable. Only if the benefits from the information exceedthe costs of obtaining it should it be collected and disseminated.
The above is a (partial) list of the characteristics of useful information on which all can agree.It is when we come to operationalise these ideas that disagreement arises. For example, peopledisagree about the ranking of the various properties of useful information. Relevance and reli-ability are often cited as the most important, with neutrality, comparability and other charac-teristics being, in effect, related to these two (e.g. neutrality and reliability; comparability and relevance). But what if relevance and reliability are in conflict? Consider the case where, in orderto obtain information quickly, a user may have to accept that it is tentative: there is a trade-offbetween timeliness (relevance) and completeness (reliability). Which should take precedence?Agreement on the answer to this question could have far-reaching consequences. Those whoconsider decision-usefulness the main aim of accounts rank relevance ahead of reliability. Thosewho emphasise the monitoring role of accounts put reliability before relevance.
Accounting fallacy no. 1: ‘Published accounts, when accompanied by an unqualifiedauditor’s report, give an accurate picture of the firm.’
Novice investors arrive at this opinion usually on the strength of two observations. First, they seethat the balance sheet of every company balances, no matter what its size. Second, they are struckby the fact that the values of items in the accounts – assets, liabilities, revenues, expenses – are stated,if not to the actual euro, dollar or yen, then to the nearest thousand, even in very large companies.
Neither observation provides evidence that the accounts are accurate. The two sides of a com-pany’s balance sheet balance because of the way it records each accounting transaction or event.We illustrate this point at length in the following chapter.
CHAPTER 1 • FINANCIAL ACCOUNTING: AN OVERVIEW 7
CFA_C01.qxd 11/6/03 2:09 PM Page 7

8 CORPORATE FINANCIAL ACCOUNTING AND REPORTING
The precision of the monetary amounts assigned to items in the accounts is not an inherentcharacteristic of accounts and is misleading. Published accounts rest on estimates, a fact which israrely highlighted and of which readers of accounts are often ignorant. For example, manage-ment have to estimate the expected economic lives of buildings and equipment in order to deter-mine the depreciation charge for the year. They must estimate what proportion of amountsowed by customers (receivables) will prove uncollectible and which inventory items will provedifficult to sell – and adjust the accounts accordingly.
Because a company’s accounts are prepared on the assumption that the company will con-tinue in business – known in the business world as the going concern assumption, judgementsabout the future have to be incorporated in the current period’s financial statements. Thus management must make provision against current revenues for future (estimated) warrantycosts associated with this period’s sales. They must make provision for future (estimated) pen-sion payments arising from employees’ service in the current period.
One of the characteristics of useful financial information we identified was reliability. Notethat we deliberately did not specify accuracy as a component of reliable information. In view ofthe pervasive use of estimates in the accounts, this is too much to expect.
The long arm of accounting
Accounting pervades business life. It is not surprising that it is described as the language of business. A good understanding of where the numbers in financial statements come from andwhat they tell us about the company is essential, therefore, for anyone pursuing a business career.
The way accounting is woven into the fabric of business life can be seen in its role in legal con-tracts. In many companies, the employment contract promises the employee a bonus in additionto his or her regular salary. The bonus is based on the company’s reported profit in the year. Thereason for linking pay to profit is to motivate employees and encourage them to think and actlike company owners. Accounting numbers also appear in debt contracts – usually with the aimof constraining the borrowing company’s behaviour. Thus the borrowing company may berequired to maintain minimum levels of working capital or shareholders’ equity or a ratio suchas profit-to-interest payments. The terms ‘profit’, ‘working capital’, ‘shareholders’ equity’ areusually not defined in the contract. (Fear not: we discuss these terms in later chapters.) Instead,the contracting parties rely on the numbers in the company’s financial statements. The way thesenumbers are calculated – and any changes in their calculation for regulatory or other reasons –can have important economic consequences. For example, if the borrowing company’s reportedprofit-to-interest ratio falls below the specified minimum, the company may be in breach of the debt contract. The lender may then impose tougher terms on the company (e.g. a higherinterest rate) or, worse, demand immediate repayment of its loan.
The impact of accounting on the business world is not confined to contracts, however.Investors appraise a company’s published accounts along with its products, management andbusiness strategy. If it has ‘transparent’ accounts and makes full financial disclosure, it is easierfor investors to evaluate the company, investment risks are reduced and investors demand alower return. This has broader economic consequences. Rajan and Zingales, two University ofChicago economists, found that industries that are more dependent on external finance growfaster (than other industries) in countries with high-quality corporate accounting. The reasonfor this is that they can raise capital more cheaply. Rajan and Zingales illustrate their findingswith two industries, tobacco and pharmaceuticals (pharma), in three countries, Malaysia, SouthKorea and Chile. Tobacco requires little external finance (companies generate more than enoughcash internally to finance expenditures on plant and equipment), whereas pharma requires lots.
CFA_C01.qxd 11/6/03 2:09 PM Page 8

CHAPTER 1 • FINANCIAL ACCOUNTING: AN OVERVIEW 9
Malaysia, South Korea and Chile were at a similar stage of development in the 1980s: all weremoderate-income, fast-growing countries. Malaysia’s financial markets – as measured by itsaccounting disclosures and other aspects of corporate governance – were the most developed,followed by South Korea and then Chile. Rajan and Zingales found that Malaysia’s pharmaindustry grew at a 4% higher annual rate than its tobacco industry in the 1980s, while in SouthKorea the margin of advantage was only 3%. By contrast, Chile’s pharma industry grew at a 2.5%lower rate than tobacco in that decade.4
Accounting’s reach extends beyond contracts and corporate governance. It can unsettle governments. A vivid example of this occurred in the UK in 2002. Early that year many UK com-panies announced they were closing their pension schemes to new employees and, in some cases,to existing employees as well. One reason management gave for their decision was the proposedintroduction of a new UK accounting rule which would force a company to value its pensionfund assets and liabilities at current value and show the resulting surplus or deficit on its ownbalance sheet. Most UK pension funds invest a large proportion of their assets in equities. As aresult of the sharp fall in world stock markets in 2000 and 2001, many companies’ pension fundsmoved from a surplus to a deficit in these years. Management argued that reflecting pensionfund volatility on the balance sheet in the way the accounting rule proposed would increase the perceived riskiness of the company and raise its cost of capital. The companies’ decision tomodify their pension schemes, though understandable, alarmed trade unions and the govern-ment. Trade unions saw the changes as a disguised pay cut. The government was concerned thatthe changes would lead to less private pension provision and greater demand for state-fundedbenefits in the future. As a result, the finance ministry put discreet pressure on the (private) rule-making body to amend its pension accounting rules.5
War, declared Talleyrand, the nineteenth century French statesman, is too important to beleft to the generals. Is accounting too important to be left to the accountants? The above ex-amples suggest it is. If so, this is added incentive for business students who do not aspire to beaccountants to study it.
The structure of the book
The book has three parts. In Part 1, which covers Chapters 2 to 6, we describe and illustrate thecore of financial accounting. We learn how the two principal financial statements, the balancesheet and income statement, are constructed and what they tell us (Chapters 2 and 3). Wedescribe the main accounting records and outline the way firms keep them: this helps explainkey accounting terms managers use (Chapter 4). We discover what are the essential features ofaccrual-based accounting, the method of accounting used by most companies (Chapter 5). Andwe find out what financial information the typical European company discloses in its annualreport and how it presents it (Chapter 6). This chapter also contains an overview of the cash flowstatement, the third main financial statement.
In Part 2, we examine the way companies account for and report the various types of asset andliability identified in Part 1. We start by providing a framework for the discussion. Accountantsare faced with two central questions: when should an asset (or liability) be recognised in theaccounts? and how should it be valued? We describe the recognition criteria and valuation methods European companies currently follow in their accounts (Chapter 7) and we illustratethem in our later discussion of particular assets and liabilities (Chapters 8–17).
Making the most of all the financial data companies publish is our goal in Part 3. We try to show how an understanding of where the accounting numbers come from and how they arecalculated can sharpen our skills – in interpreting the cash flow statement (Chapter 18) andanalysing actual financial statements (Chapters 19 and 20).
CFA_C01.qxd 11/6/03 2:09 PM Page 9

10 CORPORATE FINANCIAL ACCOUNTING AND REPORTING
Throughout the book we illustrate European accounting and reporting practice by means ofexamples. To avoid national bias, we do not usually specify a unit of currency in the examples.In those cases where clarity demands that a unit of currency be specified, we use the euro. Whenpresenting financial data, we follow the conventions used in English-language accounts:
l summed amounts are shown at the foot of a column of numbers;l commas are used to indicate thousands, periods to indicate decimals; l a billion is a thousand million, thus 2,435.7 million reads: 2 billion, 435 million and 700 thou-
sand units of currency.
We use certain terms frequently in the book. Defining them here may help you. Countriesthat have signed the Treaty of Rome (1957) (and subsequent amending treaties) are memberstates of the European Union (EU). An EU company is a company incorporated under the lawsof an EU member state. A European company is one incorporated under the laws of anyEuropean country. The terms ‘company’ and ‘firm’ are used interchangeably.
Notes to Chapter 1
1 Beware: the terminology can be confusing here. In the financial press, companies whose shares arequoted on a stock exchange are often referred to as ‘public companies’; however, a large, unquoted com-pany can be, in legal terms, a public company.
2 International Accounting Standards Board, Framework for the Preparation and Presentation of FinancialStatements.
3 For a summary of this view, see Watts, R. and Zimmerman, J. (1986), Positive Accounting Theory,Englewood Cliffs, NJ: Prentice Hall, chapter 8.
4 Rajan, R. and Zingales, L. (1998), Financial dependence and growth, American Economic Review, 88(3):559–586.
5 Peel, M. and Shrimsley, R. (2002), Darling [UK finance minister] presses for rethink of controversialpensions rule, Financial Times, 3 March. Note that the pensions rule was not the only reason firms gavefor changing their pension schemes. Other factors cited were minimum funding requirements, em-ployees’ longer life expectancy, and lower expected investment returns.
CFA_C01.qxd 11/6/03 2:09 PM Page 10

Foundations
PART 1PART 1
CFA_C02.qxd 11/6/03 2:12 PM Page 11

CFA_C02.qxd 11/6/03 2:12 PM Page 12

The balance sheet: a financial picture of the firm
INTRODUCTIONIn this chapter we introduce the balance sheet, one of the three principal finan-cial statements issued by companies. The other two major financial statements– the income statement and the cash flow statement – are introduced inChapters 3 and 6 respectively.
We begin our study of the balance sheet by asking what it is and what purpose it serves. We then look at the main components – assets, liabilities andowners’ equity – of a balance sheet and provide accounting definitions forthem. An example follows, in which we see how the balance sheet of a companychanges over time as a result of transactions between the firm and others. Next,we present the actual balance sheet of a large company and illustrate the wayassets and liabilities are classified. We end the chapter by discussing a popularmisconception about what the numbers in the balance sheet really mean.
22
l Purpose
l Components
l Effect of transactions
l Presentation
l Balance sheet ratios
l Valuation fallacy
In this chapter
CFA_C02.qxd 11/6/03 2:12 PM Page 13

14 PART 1 • FOUNDATIONS
The purpose of a balance sheet
The balance sheet of a company – or of any organisation or individual – gives a listing of its resourcesand of its sources of capital, as of a particular day.
Company ABALANCE SHEET
at 31 December year xx
RESOURCES SOURCES OF CAPITAL
With this statement, financial statement users have a picture of the company – in two dimen-sions. They can see the composition of the resources under the firm’s command. By examiningthe ‘sources of capital’ section, they can see how those resources have been financed.
The resources of a firm are described in the balance sheet as assets. Examples of typical cor-porate assets are buildings and equipment, goods held for sale (i.e. inventory) and cash. Thesources of capital used to finance the assets are known as equities. They consist of the interestsof creditors and owners. By supplying capital to the firm, creditors and owners have a stake in(or equity in) its assets.
The interests of creditors, such as banks and suppliers of goods or services, are of fixed dura-tion. We shall refer to their interests as liabilities. Thus the liabilities of the firm are the amountsit owes to its creditors. The interests of owners are of indefinite duration. We describe them asowners’ equity.
In a balance sheet, the assets of the firm are equal to the interests (equities) of creditors andowners in them.
Company ABALANCE SHEET
at 31 December year xx
RESOURCES = SOURCES OF CAPITAL
ASSETS = EQUITIES
Liabilities Owners’ equity(interests of (interests ofcreditors) owners)
There are two important features of the balance sheet which should be stressed at this stage. First,it is a statement of the balances of the firm’s assets and equities on a particular day. Since the firmengages in business activities every working day, the balances of its individual assets and liabil-ities are likely to change as frequently. Hence it should specify the date on which its balance sheetis prepared.
Second, assets and equities are not equal by chance or good management: they are equal bydefinition. Recall that equities are the interests of creditors and owners in the firm’s assets. Thinkof such interests as claims. A company’s assets cannot go unclaimed. Creditors usually have a
CFA_C02.qxd 11/6/03 2:12 PM Page 14

CHAPTER 2 • THE BALANCE SHEET: A FINANCIAL PICTURE OF THE FIRM 15
prior claim to the firm’s assets. From a legal standpoint, their interests precede those of the firm’sowners. Should a firm go out of business, then any proceeds from the disposal of its assets willbe used first to satisfy the claims of its creditors. Any remaining assets belong to its owners. Thisis why owners are said to have a residual interest in (or residual claim to) their company’s assets.
Company ABALANCE SHEET
at 31 December year xx
ASSETS– LIABILITIES . . . (Prior) claims of creditors
OWNERS’ EQUITY . . . (Residual) claims of owners
The components of the balance sheet
Assets then are the resources of the company. Creditors and owners provide the capital neces-sary to acquire them. But what constitutes an asset? What characteristics must a resource havefor it to be considered an asset of the firm? Similarly, what makes an obligation an accountingliability?
l AssetsConsider assets first. An accounting asset usually has the following three characteristics:
1 it is expected to provide future economic benefits to the firm;2 it is owned or controlled by the firm; and3 the firm acquired it as a result of a past transaction or event.1
Let’s explore this definition further. An asset yields future economic benefits if the companyreceives cash – or avoids paying cash – in future. (Cash itself is always considered an asset.) Thusan amount owed by a customer, described in the balance sheet as an ‘account receivable’, is anasset because the company expects to receive cash at a later date. Similarly, goods held for resale(known as ‘inventory’) are assets, assuming they can be sold and cash received. Buildings andplant generate cash indirectly. For example, equipment is used to produce the goods (or services)which themselves generate cash. A prepayment of, say, rent on a building is also an asset sincethe company occupying the building enjoys use of it during the rent term.
Assessing whether an investment today will yield benefits tomorrow is an essential task ofmanagement. It is not always an easy one and companies err on the side of caution. Thus if it isdifficult to show that the benefits from an expenditure will extend beyond the current financialyear or if the benefits themselves are highly uncertain, then no asset is recognised. This is whyexpenditures on basic research are rarely recorded as assets.
Ownership by the company is another feature of virtually all resources that are consideredaccounting assets. In this respect, the technical usage of the term ‘asset’ differs from its everydayone. Clearly, the employees of a company are one of its most important resources but, since itdoes not own them, they cannot be treated as an accounting asset. However, the right to use aresource, which may carry with it the same economic benefits as ownership, can be recorded asan accounting asset in some circumstances. For example, if a company leases a computer for aperiod equal to the computer’s economic life, then in many countries the computer can betreated as its asset even though it doesn’t own it.
Notice that in all the examples given so far, a past transaction has been assumed. This is thethird common characteristic of accounting assets. A firm buys equipment in exchange for cash
CFA_C02.qxd 11/6/03 2:12 PM Page 15

(or a promise to pay cash later). It records an asset, ‘equipment’, when the transaction has takenplace.
This requirement prevents certain resources – for example, the goodwill a company has builtup over the years from its own efforts – from being classified as accounting assets. Only if a firmbuys a business or collection of assets from another and pays a premium over its market valuecan it record the premium as an asset, ‘goodwill (on acquisition)’.
In the above examples, the transaction involves an exchange. Resources are swapped betweentwo parties. However, sometimes a firm acquires a benefit without making a sacrifice. For ex-ample, charitable organisations receive gifts of land, buildings or shares of companies. Wheresuch gifts meet the other conditions for asset recognition (future economic benefits, ownership),they should be recorded as accounting assets.
l Liabilities
We turn now to accounting liabilities. Legally, a liability is an obligation of one entity to delivermoney, goods or services to another. This definition embraces many accounting liabilities. An accountpayable, for example, represents an obligation to pay cash to a supplier. Note that the obligationmay be expressed in goods or services rather than cash. British Airways reports an item ‘Sales in advance of carriage’ in the liability section of its balance sheet. This represents the airline’sobligation at the balance sheet date to provide travel services to customers in the future.
However, the legal and accounting definitions of liability do not always coincide. Accountantsusually insist that for an accounting liability to exist, the firm must have a present obligation. Acommitment is not an accounting liability unless it is irrevocable. For example, a companyplaces an order with a supplier for goods to be delivered in the future. At the time of the order,neither cash nor goods have changed hands. Only promises – to supply goods on the one hand,to pay for them on the other – have been exchanged. A legal liability may exist for both partiesbut in normal circumstances neither side recognises an accounting one. This occurs only whenone party executes its part of the contract. Continuing our example, when the supplier deliversthe goods contracted for, it has fulfilled its part of the agreement. The customer then has a pre-sent obligation. It recognises a liability ‘Account payable (to company X)’ on its balance sheet.
The exact amount of the accounting liability need not be known in advance. For example, a carmanufacturer does not know at the time of sale of one of its products how much it will have topay for repair costs while the vehicle is under warranty. It can estimate these repair costs, how-ever. It records an estimated liability for them when the vehicle is sold.
We now have the essential features of an accounting liability:
1 it is a present obligation of the firm to another party;2 it arises from a past transaction or event;3 to settle the obligation, the firm must give up assets of a known or estimated amount.2
l Owners’ equity
You will remember we described the owners’ interest as a residual one. It is the differencebetween accounting assets and accounting liabilities. It consists of two elements: contributedcapital and earned capital. ‘Contributed capital’ represents the investments made by the ownerswhen the firm is founded and when later it calls for new capital for expansion or to repay debts.‘Earned capital’ represents the accumulated profits of the firm which have been reinvested in thebusiness and not distributed as dividends to owners.
For most companies, assets exceed liabilities and the owners’ residual interest is positive. Theowners’ equity can be negative, however. This is usually a temporary situation. When a company’s
16 PART 1 • FOUNDATIONS
CFA_C02.qxd 11/6/03 2:12 PM Page 16

CHAPTER 2 • THE BALANCE SHEET: A FINANCIAL PICTURE OF THE FIRM 17
liabilities exceed its assets, the company is technically insolvent. The balance sheet indicates it isunable to pay all its debts. If this is in fact the case, the company is bankrupt. One outcome isthat the company will cease trading and its assets will be sold to meet creditors’ claims. If, how-ever, its assets generate sufficient cash flow to pay its debts when they fall due, its creditors willusually allow it to continue trading.
The balance sheet and transactions
The amounts shown against individual assets and equities are the result of a continuous record-keeping process, not of a calculation made once a year on the balance sheet date.
During a financial period many transactions occur which affect a firm’s assets, liabilities andowners’ equity, and thus its balance sheet. To ensure that these transactions are properlyrecorded, the firm sets up an account for each type of asset (A), liability (L) and owners’ equity(OE). As a transaction takes place, it is recorded and the accounts updated. The balance in anaccount on any particular day captures the effect of all the transactions which have beenrecorded in it, from the date the account was first established up to that time.
Transactions, therefore, cause the balances in individual A, L and OE accounts to change – toincrease or decrease. However, they do not upset the equation (strictly, the identity) underlyingthe balance sheet:
A == L ++ OE
How is this achieved? The explanation is simple. Each transaction affects at least two accounts. Theeffect of a transaction on the left-hand side of the balance sheet equation is always the same as itseffect on the right-hand side.
The combinations of A, L and OE accounts affected are many. Here are some of those affect-ing two types of accounts only. A transaction can result in:
1 an increase in one asset, a decrease in another asset;2 an increase in one liability, a decrease in another liability;3 an increase in one owner’s equity account, a decrease in another owner’s equity account;4 an increase in an asset, an increase in a liability;5 an increase in an asset, an increase in an owner’s equity account;6 an increase in a liability, a decrease in an owner’s equity account;
and so forth. More than two accounts can be affected. For example, a transaction can result inan increase in one asset, a decrease in another asset and an increase in a liability. No matter howmany accounts are affected, the transaction itself must balance. The change to the asset side of thebalance sheet must be equal to the change to the equity side. In this way, the balance sheet iden-tity is preserved after each transaction.
We now illustrate the effect of transactions on the balance sheet. The example that followsconcerns the establishment of a new company. In this chapter we illustrate the accounting effectsof transactions the company enters into before it starts operations. (In the next chapter we focuson the transactions that occur during its first month of operations.) We first describe the trans-actions during the company’s first week and, in Exhibits 2.1 and 2.2, show the effect of each onthe individual balance sheet accounts. We then prepare a balance sheet at the end of the first week.
IllustrationGeorgie Sand and Fred Chopin decide to move to Mallorca for health reasons. Shortly after theirarrival in December, they open a shop selling stationery and other writing materials. The fol-lowing events occur during the week prior to the shop’s opening on 8 January year 1.
CFA_C02.qxd 11/6/03 2:12 PM Page 17

1 On 2 January, they complete the necessary legal steps to form a company, to be called ‘Sun, Cand Sand’, and invest 20,000 of their own funds in the new business.
2 The next day, the company leases shop premises for three months. The rent for the periodwhich amounts to 6,000 is paid in cash that day.
3 On 4 January, equipment is bought for 10,000 cash. It includes shop fixtures, a cash registerand a new shop sign. The equipment is expected to have a life of several years.
4 That same day, the company borrows 12,000 from a bank for a three-month period.5 On 5 January, the company buys merchandise for 35,000 of which 24,000 is acquired on
credit and 11,000 for cash. 6 Defective merchandise costing 5,000 is returned to a supplier for full credit on 6 January. The
company has not yet paid the supplier for the goods.7 On 7 January, the company finds it has surplus shop fixtures costing 1,000 and exchanges
them for merchandise of similar value with a neighbouring shop.
On 8 January, Sun, C and Sand Company opens its doors for business. We consider first the balance sheet impact of transactions 1 to 4.
1 Initial investmentOn 2 January, Sand and Chopin invest 20,000 of their own funds in a new company, Sun, C andSand.
Financial statement impact (amounts in 000):
Assets = Liabilities + Owners’ equity+20 = +20
Cash Contributed capital
The company’s cash increases by 20,000 (A+); the claims of its owners increase by the sameamount (OE+). As a result of the investment, Sand’s and Chopin’s own assets go down by, andthe company’s increase by, 20,000. Note that the corporate entity, Sun, C and Sand, is legally dis-tinct from its owners. What we record above is the effect of the transaction on the company’saccounts.
2 Lease of shop premisesOn 3 January, the company pays 6,000 in cash for the three-month lease of a shop.
Financial statement impact (amounts in 000):
Assets = Liabilities + Owners’ equityPrepaid rent +6Cash −6
Net effect 0 = 0 0
The company acquires, for 6,000, the right to use shop space for three months. The prepaymentof rent represents an accounting asset to the company because it will receive economic bene-fits beyond the current period. This transaction involves the exchange of one asset for another(Cash −; Prepaid rent +).
3 Purchase of equipmentOn 4 January, the company pays 10,000 in cash for shop equipment.
18 PART 1 • FOUNDATIONS
CFA_C02.qxd 11/6/03 2:12 PM Page 18

Financial statement impact (amounts in 000):
Assets = Liabilities + Owners’ equityEquipment +10Cash −10
Net effect 0 = 0 0
Again, the company acquires an accounting asset, since the equipment is expected to provideeconomic benefits for several years. As in 2, this transaction involves the exchange of one assetfor another (Equipment +; Cash −).
4 Bank loanAlso on 4 January, the company borrows 12,000 from a bank for three months.
Financial statement impact (amounts in 000):
Assets = Liabilities + Owners’ equity+12 = +12
Cash Bank loan
By obtaining a loan from a bank, the company’s cash balance increases (A+) and so, too, do theclaims of creditors to the company’s assets (L+). Note that, in this case, the bank’s claim of12,000 covers all the company’s assets: it is not a claim to a particular asset.
Exhibit 2.1 shows the effect on Sun, C and Sand’s accounts of transactions 1 to 4 individuallyand cumulatively.
CHAPTER 2 • THE BALANCE SHEET: A FINANCIAL PICTURE OF THE FIRM 19
Sun, C and Sand CompanyTransactions between 2 and 4 January
Transaction (amounts in 000)
(1) (2) (3) (4)Account Initial Shop Equipment Bank Balancetitle investment rental purchase loan at 4/1
Assets Cash +20 −6 −10 +12 16 Prepaid rent +6 6 Shop equipment +10 10
Total assets +20 0 0 +12 32
LiabilitiesBank loan +12 12Owners’ equityContributed capital +20 20
Total liabilities and owners’ equity +20 0 0 +12 32
Effect of transactions on the balance sheetExhibit 2.1
CFA_C02.qxd 11/6/03 2:12 PM Page 19

We now consider the effect on the company’s balance sheet of the three transactions thatoccur between 5 and 7 January.
5 Purchase of inventoryOn 5 January, the company buys merchandise for 35,000, of which 24,000 is acquired on creditand the balance of 11,000 for cash.
Financial statement impact (amounts in 000):
Assets = Liabilities + Owners’ equity+24 = +24
Net effect of: Account payableInventory +35 Cash −11
The company acquires an asset, inventory, in part with cash and in part on account. (‘Onaccount’ or ‘on credit’ is the phrase used to indicate that the buyer has bought goods or servicesunder deferred payment terms offered by the seller.) By allowing the company to delay payment,the supplier has provided it with capital. Since this capital has to be repaid – within 30–45 days,depending on the credit terms – it is a liability of the company. Note that, in this case, more thantwo accounts are affected and yet the transaction balances:
Inventory +, Cash − = +24,000 = Account payable +
6 Return of goodsOn 6 January, the company returns defective goods costing 5,000 to a supplier and is reimbursedin full.
Financial statement impact (amounts in 000):
Assets = Liabilities + Owners’ equity–5 = –5
Inventory Account payable
By returning goods it has not yet paid for, the company reduces its inventory (Inventory –) andthe amount it owes its supplier (Account payable –). Both asset and liability accounts decreaseby the cost of the goods returned, 5,000.
7 Exchange of equipment for inventoryOn 7 January, the company exchanges surplus equipment costing 1,000 for merchandise of thesame value.
Financial statement impact (amounts in 000):
Assets = Liabilities + Owners’ equityInventory +1Equipment −1
Net effect 0 = 0 0
An exchange of one asset for another need not always involve cash. In this case, the inventorythe company acquires (A+) is paid for with equipment (A−).
Exhibit 2.2 shows the effect on Sun, C and Sand’s accounts of transactions 5 to 7. The balancein each of the accounts at the close of 7 January is also given.
20 PART 1 • FOUNDATIONS
CFA_C02.qxd 11/6/03 2:12 PM Page 20

Observe that the change in assets is equal to the change in equities for each transaction. Thusin transactions 2 and 7 the net change in assets and in equities is zero since one asset is exchangedfor another. In transaction 5, the net increase in assets is 24,000 (the increase in inventory of35,000 less the cash payment of 11,000 to the supplier of the merchandise) which is matched bya similar increase in liabilities (the balance of 24,000 still owing to the supplier).
Since each transaction balances, we can draw up a balance sheet after any one of the transac-tions. It will reflect all accounting events up to that time. You can see this in Exhibits 2.1 and 2.2where the balances in the accounts at the end of 4 and 7 January are shown.
Exhibit 2.2 also illustrates the continuous nature of balance sheet accounts. Drawing up a bal-ance sheet does not signal the close of asset and equity accounts. It simply indicates a reckoningof the state of those accounts at a particular time. The balance at the end of one period (e.g. thatending on 4 January) becomes the balance at the start of the next (that starting on 5 January).As new transactions are recorded (on 5 January), they alter the initial balance and create a new one.
The list of account balances at 7 January is presented as a formal balance sheet in Exhibit 2.3.The format of the balance sheet in Exhibit 2.3 is similar to that used by US companies and by
many non-US companies in the English-language version of their annual accounts. However,other balance sheet formats are permitted. We discuss the various ways companies present theirfinancial statements, both balance sheets and income statements, in Chapter 6.
CHAPTER 2 • THE BALANCE SHEET: A FINANCIAL PICTURE OF THE FIRM 21
Sun, C and Sand CompanyTransactions between 5 and 7 January
Transaction (amounts in 000)
(5) (6) (7)Purchase Return Inventory
Account Balance of of for Balancetitle at 4/1 inventory goods equipment at 7/1
AssetsCash 16 −11 5Merchandise
inventory 0 +35 −5 +1 31Prepaid rent 6 6Shop equipment 10 −1 9
Total assets 32 +24 −5 0 51
Liabilities Bank loan 12 12Account payable 0 +24 −5 19Owners’ equity Contributed capital 20 20
Total liabilities andowners’ equity 32 +24 −5 0 51
Effect of transactions on the balance sheetExhibit 2.2
CFA_C02.qxd 11/6/03 2:12 PM Page 21

22 PART 1 • FOUNDATIONS
Sun, C and Sand CompanyBALANCE SHEET
at 7 January year 1(amounts in 000)
Current assets Current liabilitiesCash 5 Bank loan 12Merchandise inventory 31 Account payable 19Prepaid rent 6 31
42Fixed assets Owners’ equityShop equipment 9 Contributed capital 20
Total assets 51 Total equities 51
Exhibit 2.3
Balance sheet presentation
Now that we’ve defined what accountants mean by ‘asset’ and ‘liability’ and seen how transac-tions give rise to them, we look at an actual balance sheet to find out how a typical Europeancompany presents them. Exhibit 2.4 shows the consolidated balance sheet of a major Europeansupermarket group, BestPrice Stores. Do not worry if you do not understand all the terms in it.We explain the main items in this section; the remaining ones will be discussed in later chapters.All that we’re doing at this stage is setting out the basic structure of a balance sheet. What followsapplies to all corporate balance sheets, European and non-European.
Note: We discuss BestPrice Stores as if it were a real company; it is not. BestPrice’s accounts,extracts from its company report and discussions about its business activities (presented here,and later in chapters 3 and 6) together present an illustrative model of a large European retailgroup, and have been designed to depict many common aspects of such a business.
l Meaning of ‘consolidated’The first noteworthy feature is the statement’s title. The balance sheet illustrated is the consolidated balance sheet at the end of x2 and, for comparative purposes, that of end-x1.(Companies have to provide comparative figures for the previous year on the face of the balance sheet.) This means that the balance sheets of the parent company BestPrice Stores S.A. and its subsidiary companies (those over which it has management control, usually represented by a majority shareholding) have been combined. For example, the amount ofa1,533mn. shown against ‘inventories’ is the sum of the inventories of the parent company andthose of its subsidiary companies. BestPrice lists its principal subsidiaries in the notes to the x2 accounts.
l Classification of assets and liabilitiesTake a closer look at BestPrice’s assets and liabilities. You’ll notice that BestPrice distinguishesbetween those that are current and those that are long-term (or fixed in the case of assets).Classifying assets and liabilities in this way is common among retailing and industrial com-panies. One reason is to help investors gauge the liquidity of a firm’s assets and the maturity ofits debts.
CFA_C02.qxd 11/6/03 2:12 PM Page 22

l Current assetsCurrent assets are of two types. The first is the asset which arises from operations and which thefirm expects to consume or convert into cash within its operating cycle. Examples are inventoriesand trade receivables (amounts owed by customers). For a retailing company like BestPrice,inventories consist largely of merchandise (goods awaiting sale). For a manufacturing company,inventories include raw materials, work in progress (products in the course of manufacture)and finished goods. In many countries, prepayments (of operating costs such as rent) andaccrued income (for example, interest earned on customers’ debts but not received by the balance sheet date) are classified as current assets, too.
CHAPTER 2 • THE BALANCE SHEET: A FINANCIAL PICTURE OF THE FIRM 23
BestPrice StoresCONSOLIDATED BALANCE SHEETS
at end December x2 and x1(amounts in A millions)
Assets x2 x1
Current assetsCash 658 507Marketable securities 708 528Trade and other receivables 1,249 1,022Inventories 1,533 1,358Prepayments and accrued income 160 112
Total current assets 4,308 3,527
Fixed assetsProperty, plant and equipment 3,313 3,156Long-term financial investments 1,084 946Intangible assets 3,306 3,250
Total fixed assets 7,703 7,352
Total assets 12,011 10,879
Shareholders’ equity and liabilities
Current liabilitiesShort-term debt and current portion of long-term debt 874 1,545Trade and other payables 2,694 2,608Accrued expenses and deferred income 1,134 1,038
Total current liabilities 4,702 5,191
Long-term liabilitiesLong-term debt 3,315 2,379Provisions for contingencies and charges 207 232Other long-term liabilities 44 3
Total long-term liabilities 3,566 2,614
Minority interests 556 502
Shareholders’ equityShare capital 135 126Reserves and retained earnings 2,749 2,194Net income for the year 303 252
Total shareholders’ equity 3,187 2,572
Total shareholders’ equity and liabilities 12,011 10,879
Exhibit 2.4
CFA_C02.qxd 11/6/03 2:12 PM Page 23

The second type is the asset held for trading purposes or for the short term. Examples are cashand marketable securities. The latter are usually securities the firm owns and which it plans tosell within one year of the balance sheet date.
l Fixed assetsFixed assets (or non-current assets) also fall into two types. One is the asset the firm plans to useon a continuing basis in its operations. Examples are property, plant and equipment (alsoknown as ‘tangible fixed assets’), and purchased patents, trademarks and goodwill (known asintangible assets). The other type is the financial asset which will not mature – or which the firmdoesn’t plan to sell – within the coming financial year. Examples are long-term loans to cus-tomers, investments in the shares of other companies (sometimes described as long-term finan-cial investments) and the prepayment of future income taxes (‘deferred tax asset’). BestPriceStores has both types of fixed asset on its x2 consolidated balance sheet.
Note that an asset can be current in one context but fixed in another. The new and used carson display in a motor dealer’s forecourt are its inventory. Company-owned cars used by its salesrepresentatives are its fixed assets. Remember: to an accountant, ‘fixed’ does not mean immobile!
l Current and long-term liabilitiesLiabilities are classified on the basis of their maturity. Current liabilities are obligations whichthe company will have to settle – through the payment of cash or the supply of goods or services– within one year of the balance sheet date (or the operating cycle, if longer). They includeamounts payable to suppliers (trade payables), to banks and other lenders (short-term debt)and to governments (taxes payable). All non-current liabilities are grouped under long-term liabilities.
Sometimes an obligation exists even though there is no formal evidence of it in the form ofan invoice or debt contract. For example, a firm consumes gas, water and electricity but has not received invoices from suppliers by the balance sheet date. Such liabilities, if current, may be described as accrued expenses. Similarly, estimated long-term liabilities – for example, forfuture pensions payable to retired employees – are reported separately as provisions. Again,there are examples of both types of liability in BestPrice’s x2 consolidated balance sheet.
l Minority interestsIn preparing a consolidated balance sheet, the parent company – BestPrice Stores S.A., forexample – combines all the assets and all the liabilities of its subsidiary companies with its own.The reason is that as a majority shareholder it controls the subsidiaries and their resources andaccess to capital. But what if it doesn’t own 100% of the shares of every subsidiary?
In this event, the equities side of the consolidated balance sheet contains a separate item, min-ority interests. In European company balance sheets, it is usually shown next to ‘shareholders’equity’. It indicates the interests of minority shareholders in the net assets of those (consolidated)subsidiary companies which the parent company does not own outright. The example in Exhibit 2.5makes this clearer.
Parent company P has two subsidiaries S1 and S2. It owns 100% of S1’s shares but only 80%of S2’s shares. In its consolidated accounts, it combines 100% of S2’s assets, as well as 100% ofS1’s, with its own. It does the same with S1 and S2’s liabilities. It shows as ‘Minority interest’(MI) the 20% of S2’s owners’ equity – and thus net assets (OE = A − L) – it does not own.
Outside shareholders have a stake in the net assets of BestPrice’s subsidiaries that amounts toa556 million at the end of x2. Note that these minority interests are not a liability of the BestPrice
24 PART 1 • FOUNDATIONS
CFA_C02.qxd 11/6/03 2:12 PM Page 24

group. They are part of the ‘group equity’ of BestPrice which includes the interests of both par-ent company (BestPrice Stores S.A.) and outside shareholders.
l Shareholders’ equityThe owners of public companies such as BestPrice are usually described as shareholders becausetheir ownership interest is evidenced by shares. Thus the term shareholders’ equity replaces‘owners’ equity’ in the balance sheet. Note that in a consolidated balance sheet, ‘shareholders’equity’ is the equity of the parent company’s shareholders.
As we saw earlier, shareholders’ equity has two components. Part represents capital contrib-uted by individuals and organisations (e.g. other companies, pension funds, charitable founda-tions). The company seeks new capital from investors – to invest in new projects, for example – and issues shares to them in exchange for cash. If the company is a publicly quoted company,investors can sell their shares to others at a later date: such share trading has no effect on thecompany’s contributed capital. More generally, changes in the market value of a company’sshares have no effect on its reported contributed capital (although its ability to raise new capitalwill be affected).
Most of the owners’ capital in a firm, however, has been earned by it through profitable operations. As we shall see in the next chapter, a firm increases its shareholders’ equity (and itsnet assets) by operating profitably. Part of the profits are usually distributed in the form of dividends. The rest is retained and reinvested in the business. Accumulated retained earningsconstitute the earned (and reinvested) capital of the firm.
Like most companies, BestPrice does not show contributed capital in one figure. The amountshown against Share capital is the nominal value of the shares it has issued (i.e. number of shares issued (and paid up) times the nominal value per share). However, at the issue date, thecompany received the market value of the shares, which was more than their nominal value. The
CHAPTER 2 • THE BALANCE SHEET: A FINANCIAL PICTURE OF THE FIRM 25
Minority interest in subsidiary’s net assets: illustrationExhibit 2.5
CFA_C02.qxd 11/6/03 2:12 PM Page 25

26 PART 1 • FOUNDATIONS
difference – between market value (at the issue date) and nominal value – is known as share premium (or additional paid-in capital). BestPrice includes share premium in its reserves. Thusthe caption ‘Reserves and retained earnings’ contains both contributed and earned capital.
In common with many other Continental European companies, BestPrice distinguishes, onthe face of the balance sheet, profits earned in the current year (Net income for the year) fromprofits of previous years which it has retained in the business (included in ‘Reserves and retainedearnings’). Note that the ‘net income for the year’ figure is ‘before appropriation’, that is, beforeBestPrice’s shareholders have decided in their annual general meeting (scheduled for x3) howmuch of the company’s x2 profit should be distributed as dividend. The portion not distributedwill be included in ‘retained earnings’ on its end-x3 balance sheet.
We summarise the main components of contributed and earned capital below:
Shareholders’ equity
Share capital* Reserves
Share premium** Retained earnings
‘Contributed capital’ ‘Earned capital’
* Shares issued × Nominal value (per share)** Shares issued × (Market price at issue – Nominal value)
The balance sheet and financial ratios
Financial ratios help us interpret financial statements better. By relating certain numbers to others within the financial statements and constructing ratios from them, we gain insight into a company’s performance and financial condition which the numbers alone will not yield us. In this and succeeding chapters we describe the major ratios which are used in the analysis offinancial statements. We defer discussion of the techniques of financial statement analysis untilChapter 19.
We start by considering two widely used balance sheet ratios, the current ratio and the debt-equity ratio. To illustrate their construction, we use BestPrice’s end-x2 and end-x1 consolidatedbalance sheets. A condensed version is set out in Exhibit 2.6.
The current ratio tells us the extent to which a company’s short-term assets cover its short-termliabilities. More precisely, it indicates how many euros (or dollars or yen) of current assets afirm has at the balance sheet date to pay each euro of current liabilities:
Current ratio =
BestPrice’s current ratio was less than one at the end of both x1 and x2. The ratio improvedsignificantly between the two balance sheet dates, largely as a result of the decline in short-termdebt:
End x2 End x1BestPrice group’s = (B) = 4,308 3,527current ratio (D) 4,702 5,191
= 0.92 : 1 0.68 : 1
Current assets
Current liabilities
CFA_C02.qxd 11/6/03 2:12 PM Page 26

The current ratio is a simple but informative measure of a firm’s liquidity, that is to say itsability to pay its short-term debts when they fall due. Most firms report a current ratio greaterthan one. At the end of x1, BestPrice had only 68 cents of current assets to pay each euro of current liabilities. Supermarket chains like BestPrice can support a current ratio of less than onewithout suffering liquidity problems. Many of their sales are for cash but their purchases –which consist mostly of merchandise – are on account. Moreover, they carry relatively smallinventories because of the short shelf-life of much of their merchandise.
An alternative guide to a firm’s liquidity position is its working capital. This is calculated bysubtracting current liabilities from current assets on the balance sheet date:
Current assets − Current liabilities = Working capital
Most firms have positive working capital: their current assets exceed their current liabilities.Supermarket chains like BestPrice often have negative working capital for the reasons givenabove.
Another balance sheet ratio you will encounter frequently is the debt–equity ratio. It relatesthe capital provided by a company’s financial creditors to that provided by its owners.
Debt–equity ratio ==
‘Net debt’ is defined as short-term plus long-term interest-bearing liabilities, less cash and mar-ketable securities. (Strictly, only cash in excess of operating needs should be deducted but thisnumber isn’t usually disclosed so analysts subtract all cash and cash equivalents.) ‘Shareholders’equity’ represents the company’s share capital and reserves (including retained earnings). In acorporate group, it is the equity of both the parent company’s shareholders and minority share-holders in its subsidiaries.
Net debt
Shareholders equity
’
CHAPTER 2 • THE BALANCE SHEET: A FINANCIAL PICTURE OF THE FIRM 27
BestPrice StoresCONDENSED BALANCE SHEETS
at end x2 and x1(amounts in A millions)
Shareholders’ equityAssets x2 x1 and liabilities x2 x1
Cash and marketable Short-term debt (C) 874 1,545securities (A) 1,366 1,035 Other current liabilities 3,828 3,646
Other fixed assets 2,942 2,492 Total current liabilities (D) 4,702 5,191Total current assets (B) 4,308 3,527
Long-term debt (E) 3,315 2,379Other long-term liabilities 251 235Total long-term liabilities 3,566 2,614
Shareholders’ equity 3,187 2,572Minority interests 556 502
Fixed assets 7,703 7,352 Group equity (F) 3,743 3,074
Total shareholders’ equityTotal assets 12,011 10,879 and liabilities 12,011 10,879
Exhibit 2.6
CFA_C02.qxd 11/6/03 2:12 PM Page 27

28 PART 1 • FOUNDATIONS
BestPrice’s relative indebtedness declined between end-x1 and end-x2. Its net debt fell from94% to 75% of group equity during x2.
End x2 End x1
BestPrice group’s debt–equity ratio = =
In percentage terms 75.4% 94%
The improvement in BestPrice’s debt–equity ratio is attributable to the increase in group equitywhich increased by a670 million between end-x1 and end-x2. Inspection of the accounts indic-ates that the company issued new shares in x2 to finance expansion of the business. The shareswere issued at a price much in excess of their nominal value. BestPrice includes this share pre-mium in ‘Reserves’. It’s likely that the share issue benefited the group’s cash balances, too: ‘cashand marketable securities’ rose by a330 million in x2. The balance sheet also reveals thatBestPrice changed the composition of its debt that year. As we’ve already noted, current debt fell– from a1,545 million to a874 million – but long-term debt rose almost a1 billion to a3,315 mil-lion between the start and end of x2.
Financial statement users calculate the debt–equity ratio to assess a company’s financial risk.Remember that shareholders have a residual interest in the firm’s assets: the claims of creditorsmust be satisfied first. If the firm encounters financial problems, creditors’ claims may absorb allof its assets and shareholders are left with nothing. Thus the more a firm relies on debt to financeits activities, then, other things being equal, the greater is the risk of financial loss to shareholders.
The debt–equity ratio is often described as a measure of financial leverage. By supplement-ing equity with debt, a firm increases or ‘levers up’ the capital available to it without diluting theownership interests of existing shareholders.
The current ratio is not the only way of assessing a firm’s liquidity. Nor is the debt–equityratio the only measure of financial leverage. Moreover, there are alternative versions of theseratios. For example, some analysts relate a firm’s net debt to its financial capital (net debt +group equity) rather than the equity provided by the group’s shareholders. The important pointis that, no matter how a liquidity or leverage ratio is formulated, it should be calculated consistentlyover time and across firms.
Valuation fallacy
Accounting fallacy no. 2: ‘The balance sheet indicates the current value of the firm’s assets.From it we can derive the current value of the firm.’
Many people who know little about how a balance sheet is constructed would agree with theabove statement. At first sight, it seems reasonable. If a balance sheet is a statement of a company’sresources, as we claimed at the beginning of this chapter, then surely all its resources should beshown. If monetary amounts are given against individual assets and liabilities, then is it not fairto assume that they represent current values? After all, an individual drawing up a personal bal-ance sheet will automatically record assets (investments, property, car) and liabilities (mortgage,bank loan) at current market values.
The traditional corporate balance sheet in an annual report is not like an individual’s balancesheet. It is not a statement of net worth – for two main reasons. First, most companies state theirphysical assets (i.e. buildings, equipment, inventory) at cost of acquisition or production. Thesehistorical costs will correspond to current values in limited circumstances only. They are mostlikely to do so when the asset is acquired. They will continue to be equivalent only if prices do
2,8893,074
2,8233,743
(C) + (E) (A)(F)
−
CFA_C02.qxd 11/6/03 2:12 PM Page 28

CHAPTER 2 • THE BALANCE SHEET: A FINANCIAL PICTURE OF THE FIRM 29
not change. In the past, prices of most physical assets have risen because of inflation. Use of his-torical costs has resulted in the values of these assets being understated.
Second, even if current prices were used to value all assets and liabilities, the book value of thefirm – derived from the values of its reported assets and liabilities – would not equal its marketvalue. The main reason for this is that the accounting definition of an asset is narrow. The skillsof a company’s employees, the reputation of its products, the abilities of its management, theseare some of the ‘assets’ of the firm which are not usually captured on its published balance sheetbut which help to determine its market value.
If the balance sheet is not a statement of value (not even the value of accounting assets andliabilities), how do we interpret it? It is useful to think of the historical costs (HC) of assets asrepresenting minimum values. A key assumption underlying HC-based financial statements isthat a company is a going concern, that is to say its survival in the foreseeable future is not indoubt. As a result, it should be able, at a minimum, to recover through profitable operations thecost of the inputs used. Historical costs represent those minimum recoverable costs.
Of course, there may be circumstances when historical costs fail this test. For example, eco-nomic conditions may have caused the value of assets such as plant or inventory to fall perman-ently below acquisition cost. In this case, only these lower market values may be recoverable and the assets affected must be written down below cost to market value. Where the company’svery survival is at risk, liquidation values may be a better guide to amounts recoverable from dis-posal of its assets. Thus the guiding principle behind the valuation convention in the traditionalbalance sheet is a conservative one: to state assets at no more than the minimum amount thecompany expects to receive from their sale or use.
What we have outlined in this chapter is the typical balance sheet of today. It is currentlyunder attack. Some critics argue that by omitting important resources of the firm and by record-ing physical assets at historical cost, it does not provide relevant information to users of finan-cial statements. We consider in later chapters the reforms to the balance sheet these critics haveproposed. Others are more radical. They want additional statements – in balance sheet form –that will provide information about a company’s social and environmental resources and obliga-tions (see Box 2.1).
Summary
Here are the key ideas that we introduced in this chapter.
l The balance sheet of a company is a statement of its assets, and the claims of its creditors andowners to those assets, on a particular day.
l Most assets listed on a company’s balance sheet share three characteristics: – they are expected to provide future economic benefits to the company; – they are owned or controlled by it; and – they were acquired as a result of a past transaction or event.
l The claims of creditors are known as liabilities. Most liabilities listed on a company’s balancesheet also have three characteristics in common: – they are present obligations of the firm to outside parties;– they arise from a past transaction or event; and– to settle such obligations, the firm must give up assets of a known or estimated amount.
l The claims of owners are residual claims to the company’s assets after those of creditors havebeen satisfied. The claims of a company’s owners are known as owners’ (or shareholders’)equity. Owners’ equity usually has two components: the capital contributed by the ownersand the capital earned by the company on their behalf and reinvested in it.
CFA_C02.qxd 11/6/03 2:12 PM Page 29

The ecobalanceBOX2.1
Organisations are devising new types of balance sheet. In addition to the traditional financialone described in the chapter, you’ll encounter human resource, environmental and social balance sheets. Common to all of them are the following two features: first, a listing of those things that are the focus of the balance sheet (in the case of the traditional balance sheet,the organisation’s accounting assets) and second, a balancing – of resources and claims onresources, of sources and uses of capital, or of inputs and outputs.
These two features – a listing and a balancing – can be seen in the ecobalance. Researchersat the IÖW (Institut für Ökologische Wirtschaftsforschung) in Berlin developed the ecobal-ance concept in the 1980s, building on the ecological accounting work of Müller-Wenk in the1970s. The aim of the ecobalance is to show the inputs into – and outputs from – a produc-tion process over a period. The ecobalance lists the various inputs (materials, energy, water,air) and the outputs (products, solid waste, waste heat, waste water, air emissions) usually inphysical units (kg, m2, megawatt-hours). By definition, all inputs become outputs, either ofsaleable product or waste/emissions. Note that the balancing here is of flows rather than ofstocks as in the traditional financial balance sheet.
Kunert AG, a German hosiery manufacturer, is a pioneer of environmental accounting inEurope. Set out below is its summary group ecobalance for 1996.
Kunert Group SUMMARY ECOBALANCE
for 1996
Input 1996 Output 1996Raw materials (kg) 2,992,878 Hosiery (kg) 4,432,403Ancillary material (kg) 1,325,893 Outer wear (kg) 339,823Semi and finished goods (kg) 1,954,433
Transport packaging (kg) 735,196Dyes (kg) 60,310 Product packaging (kg) 1,808,171Chemicals (kg) 1,071,012
Special waste (kg) 83,687Product packaging (kg) 1,824,532 Waste for recycling (kg) 1,472,896Product applications (kg) 85,553 Waste for disposal (kg) 171,040
Energy (MWh) 101,635 Waste heat (MWh) not recorded
Water (m2) 373,620 Waste water (m2) 284,662Heavy metals (kg) 30
Air (m2) not recorded NOx (kg) 52,159SOx (kg) 192,029CO2 (kg) 30,837,598
Source: Kunert AG Umweltbericht 1995/96
Interestingly, Kunert’s ecobalance is incomplete. Air inputs and waste heat output were notfully quantified in 1996. This is not surprising in view of the scale of the analysis (nine sites areinvolved) and the difficulty in measuring certain inputs and outputs accurately. Kunert’s man-agement adopted an incremental approach when they began the ecobalance exercise in the1990s. They focused first on those areas such as materials and packaging where reductions inuse would yield large environmental benefits and also offer cost savings.3
CFA_C02.qxd 11/6/03 2:12 PM Page 30

CHAPTER 2 • THE BALANCE SHEET: A FINANCIAL PICTURE OF THE FIRM 31
l A balance sheet must always balance. Claims to assets can never be more or less than the assetsthemselves. Every transaction balances, too. Any change in assets is matched by a change inequities.
l Transactions shape the balance sheet. They cause individual asset, liability and owners’ equity accounts to increase or decrease. The balance in a balance sheet account represents the cumulative movement in that asset, liability or owners’ equity account up to a particular time.
l The conventional balance sheet is not intended to be a statement of the firm’s current value.Key resources are excluded from it. Moreover, the assets which are reported are usually statedat historical cost or at a valuation which, like historical cost, is intended to indicate the min-imum amount expected to be recovered from the asset’s sale or use.
Problem assignments
P2.1 Balance sheet equation illustrated
In the course of a commentary on property prices, wealth and perceptions of wealth, a columnistmade the following statements in a newspaper article:
In spite of their great tumble, the Reichmann brothers [the principal shareholders in the failed propertycompany, Olympia and York] are perceived as being richer than me, so, therefore, they are richer. Thismeans that they still have far more chance of squeezing $100m out of a friendly banker than I do, and,although by that act they would become $100m poorer (still more debts), the world would think of themas $100m richer.
Suppose you borrow $10,000. Are you $10,000 poorer as a result of this transaction? Discuss.
P2.2 Nature of the balance sheet
The recent annual accounts of a famous European football club reveal that at the end of its financialyear the club had total debts of A66 million, of which A45 million were current. Its total assets at thatdate were A104 million but only A15 million of these were current.
An official of the club is quoted as follows:
We need to set the record straight here. Although it’s true the reported debt is A66 million, the realdebt is only around A48 million, given that in the near future we expect cash inflows of A18 million. It’s very easy to quote numbers but you have to know how to read the small print in order to interpretthem.
Comment on the official’s statement. Is the club’s true debt at year-end ‘only around A48 million’?
P2.3 Identifying transactions
Set out below are the balances in Holmes Company’s asset and equity accounts at the end of each day in a nine-day period. You’ll notice that two or more of the account balances change each day. Identify for each day the transaction which occurred (there was only one), based on themovement in the balance sheet accounts from the previous day. For example, by comparing the balances at the close of 1 June with those at the close of 31 May, we see that the company borrowed 6,000 in cash from its bank on 1 June. (No transactions occurred during the weekend of 3–4 June.)
CFA_C02.qxd 11/6/03 2:12 PM Page 31

Balances at the close of . . .31/5 1/6 2/6 5/6 6/6 7/6 8/6 9/6
Holmes Company(amounts in 000)AssetsCash 2 8 6 3 3 3 13 5Accounts receivable 24 24 24 24 24 24 14 14Inventories 15 15 22 22 22 20 20 20Prepaid rent 3 3 3 6 6 6 6 6Property and equipment 10 10 10 10 14 14 14 14
Total 54 60 65 65 69 67 67 59
Shareholders’ equity and liabilitiesAccounts payable 20 20 25 25 25 23 23 15Bank loans 7 13 13 13 13 13 13 13Shareholders’ equity 27 27 27 27 31 31 31 31
Total 54 60 65 65 69 67 67 59
P2.4 Recording transactions IDick Dewy decides to start a road haulage business. He forms a company, Greenwood TransportCompany, on 1 June year 1. Set out below are the transactions the company enters into in its firstweek of operations.
1 Dewy and associates invest 40,000 of cash in the company on 1 June.2 The company buys a truck for 20,000 in cash on 2 June.3 The same day it purchases with cash one year’s insurance on the vehicle for 1,200.4 On 5 June, it rents an office for three months and pays in cash 1,500 to the landlord.5 It purchases on credit office equipment costing 600 and supplies costing 200 on 6 June.6 The following day it returns faulty office equipment costing 100 to a supplier for full credit.7 On 8 June, it pays to suppliers 500 of the 700 balance outstanding.8 That same day, it invests, in short-term interest-bearing securities, 5,000 of cash which is surplus
to its immediate operating needs.
Required
(a) Record the above transactions on a worksheet similar to that in Exhibits 2.1 and 2.2.
(b) Draw up a balance sheet for Greenwood Transport Company at the close of 8 June year 1.
Check figures:Total assets at 8/6 40,200Cash at 8/6 11,800
P2.5 Recording transactions IIPeerless Company is formed on 1 September x1. A distributor of TV and video equipment, it spe-cialises in the sale of widescreen, high-definition televisions. It enters into the following transactionsin September.
1 On 1 September, the firm issues 3,000 shares for 45,000 cash.2 It leases shop premises for one year from 1 October. The rental payments are structured as follows:
– a fixed monthly charge of 2,000; and– a variable charge of 1.5% of monthly sales.It pays three months of the fixed charge in advance on 5 September. (It will not make any variablerental payments until October when sales begin.)
32 PART 1 • FOUNDATIONS
CFA_C02.qxd 11/6/03 2:12 PM Page 32

3 It acquires shop fittings on 5 September. The bill for the fittings is 14,000 but the supplier gives adiscount of 1,000 since the firm makes a full payment on 10 September.
4 It purchases merchandise (televisions for resale) on account at a cost of 38,000 on 15 September.5 It receives a cheque of 800 from a customer on 20 September as a deposit on an order for a top-
of-the-line television set. The contract price is 4,000.6 The labour costs of installing the fittings in 3 are 6,000 and are paid in cash on 25 September.7 The company hires two employees who will begin work in the shop on 1 October. It makes a cash
advance of 300 to one of the employees on 27 September.8 It purchases office equipment costing 7,400 on 30 September. It pays a deposit of 2,000 in cash
on that date and agrees to pay the balance within 30 days.9 Peerless’s lawyer submits a bill amounting to 9,000 for legal services in connection with the
formation of the firm. The company gives her 600 shares in payment.
Required
(a) Record the above transactions on a worksheet similar to that in Exhibits 2.1 and 2.2.
(b) Prepare a balance sheet for Peerless Company at the close of 30 September, prior to the open-ing of the company’s first shop on 1 October.
Check figures:Cash at 30/9 18,500Total assets at 30/9 98,200
P2.6 Drawing up a balance sheet
Goliath Motors (name disguised) is a large manufacturer of cars in Europe. Listed below are accountbalances taken from the group’s 20x2 balance sheet. All amounts are in A million.
Trade and other receivables 36,133Short-term debt 24,035Intangible assets 5,277Share capital ?Inventories 7,956Minority interests in subsidiaries’ net assets 42Long-term debt 10,200Prepayments and deferred charges 1,443Trade payables 5,644Property, plant and equipment 17,388Cash and marketable securities 6,316Reserves 18,326Provisions and other long-term liabilities 19,265Long-term financial investments 3,199Other current liabilities 5,157Leasing and rental assets 5,827
Required
Draw up a balance sheet for the Goliath Motors group at 31 December 20x2, showing current andfixed assets, current and long-term liabilities and shareholders’ equity. (‘Leasing and rental assets’comprise Goliath vehicles which the group leases or rents out to companies or individuals. Decidehow these should be presented in Goliath’s balance sheet.)
Check figure:Total assets 83,539
CHAPTER 2 • THE BALANCE SHEET: A FINANCIAL PICTURE OF THE FIRM 33
CFA_C02.qxd 11/6/03 2:12 PM Page 33

34 PART 1 • FOUNDATIONS
France TelecomCONSOLIDATED BALANCE SHEETS (CONDENSED)
at 31 December 1999, 2000 and 2001(amounts in A million)
31 December2001 2000 1999
ASSETSCurrent assetsCash and marketable securities 4,081 2,256 2,635Trade and other receivables 10,285 8,783 6,884Inventories 900 1,216 621Prepayments and other current assets 7,755 6,391 3,353
23,021 18,646 13,493
Fixed assetsIntangible assets 53,152 52,338 2,131Property, plant and equipment 31,728 34,623 28,964Long-term financial investments 12,152 20,724 6,739Other long-term assets 7,305 3,254 2,728
104,337 110,939 40,562Total assets 127,358 129,585 54,055
LIABILITIES AND SHAREHOLDERS’ EQUITYCurrent liabilitiesShort-term debt 12,961 32,707 5,030Trade and other payables 15,890 15,347 9,538Other current liabilities 6,113 10,571 2,800
34,964 58,625 17,368Long-term liabilitiesLong-term debt 54,543 30,547 12,233Pension plan and other long-term liabilities 8,663 5,220 4,182
63,206 35,767 16,415
Minority interest 8,101 2,036 1,369Shareholders’ equityShare capital 4,615 4,615 4,098Additional paid-in capital 24,228 24,228 6,629Retained earnings 5,526 2,807 5,408Net income (loss) for the year (8,280) 3,660 2,768Own shares (5,002) (2,153) –
21,087 33,157 18,903Total liabilities and shareholders’ equity 127,358 129,585 54,055
Exhibit 2.7
(Source: France Telecom SA, Annual Report and Accounts 2001.)
P2.7 Comparison of balance sheet dataFrance Telecom, the dominant fixed line and wireless telecommunications company in France, expandedits international operations in 2000. In August it acquired UK-based Orange plc and combined itswireless business with that of Orange to form a pan-European group with 30 million subscribers. Italso made investments in Internet-related businesses and data communications companies outsideFrance in the same year. The condensed balance sheets in Exhibit 2.7 are taken from its 2001 English-language annual report.
CFA_C02.qxd 11/6/03 2:12 PM Page 34

CHAPTER 2 • THE BALANCE SHEET: A FINANCIAL PICTURE OF THE FIRM 35
Required
(a) Calculate France Telecom’s current ratio and debt–equity ratio at 31 December 1999 and 2001.Is France Telecom better able to pay its current liabilities at the end of 2001 than at the end of1999? Has its financial leverage increased between these two dates?
(b) Examine the three balance sheets in Exhibit 2.7 more closely. Why have the current and debt–equity ratios changed between end-1999 and end-2001?
Notes to Chapter 2
1 International Accounting Standards Board, Framework for the Preparation of Financial Statements, para. 49(a).
2 IASB, Framework, para. 49(b).3 Rainer Rauberger and Bernd Wagner give a fuller description of the ecobalance and Kunert’s experience
using it – see their article ‘Ecobalance analysis as a managerial tool at Kunert AG’ in Bennett, M. andJames, P. (eds) (1999), Sustainable Measures, Sheffield: Greenleaf Publishing. Since 1997, Kunert haspublished an abbreviated environmental report, with only extracts from the full ecobalance for the year.
CFA_C02.qxd 11/6/03 2:12 PM Page 35

The income statement
INTRODUCTIONIn this chapter we turn our attention to the income statement. We first askwhat purpose it serves. This leads us to consider its structure and to define keyterms in it – revenue, expense and profit. Through these definitions we see thelink between the income statement and the balance sheet. An example followswhich reinforces this idea. It shows how transactions which yield profit to thefirm also increase its net assets.
Revenues often get mistaken for receipts and expenses are muddled withexpenditures. The confusing of income statement numbers with cash flows isanother popular accounting fallacy which we expose. In the final section welook at a published income statement, explain some of the more commonterms in it, and describe and illustrate key profitability ratios.
33
l Purpose
l Format
l Link with balancesheet
l Effect of transactions
l Fallacy of profit andcash flow equivalence
l Presentation
l Key profitabilityratios
In this chapter
CFA_C03.qxd 11/6/03 2:16 PM Page 36

CHAPTER 3 • THE INCOME STATEMENT 37
The purpose of the income statement
An income statement shows the performance of an enterprise over a period of time. In the case of aprofit-seeking company, it reveals the profit or loss generated by the company and how thatprofit or loss arose. In the case of a non-profit-seeking organisation, for example a charitableinstitution, it shows the surplus or deficit arising from the organisation’s activities.
Profit-seeking companies which are publicly owned measure their performance at regularintervals – usually yearly, but often half-yearly or quarterly as well – and publish the results. Thisis very important. Modern corporations have long, in many cases legally indefinite, lives.Investors want progress reports at predetermined intervals, in the form of an income statement,to determine whether the company is earning a profit on their investment. They are not pre-pared to wait until the company’s dissolution to find out whether the capital they invested hasgrown or not. Notice that by demanding periodic reports investors can also monitor better themanagers they have appointed to operate the business for them.
Periodic monitoring of corporate performance serves other purposes. It helps investors makeresource allocation decisions. By comparing the profitability of company A with that of com-pany B, investors discover which one has generated a higher return on the capital invested in it. This influences where they direct their investment funds. Although past profitability is notnecessarily a good guide to future profitability, it nonetheless provides useful information forinvestment decisions.
The format of the income statement
An income statement has a very simple form. It shows, for a particular period (a year, a month),the output of the company and the inputs used to achieve that output. The difference between theoutput and the related inputs is the profit (or loss) which the company has earned (sustained)in the period.
How do we measure ‘output’? There are two approaches in use in Europe. One way, and themost popular, is to define output in terms of sales. This is the approach used by all retailing companies and most manufacturing companies. The other way is to define output in terms ofproduction. This is the approach employed by many German manufacturing companies. The difference in approach does not affect the calculation of income, however. To keep the discussionsimple at this stage, we will concentrate on the first approach (output = sales) and discuss the second (output = production) in a later chapter.
A sales-based income statement measures the firm’s accomplishments in a period in terms ofthe revenues it obtains from goods or services sold to customers. Revenue from a sale is usuallyrecognised in the accounts when goods have been delivered to a customer or a service has been performed.
Sales are only part of the performance of the firm. There is little point in selling goods or services at a loss. To find out whether a sale is profitable, we need to know the costs of the goodor service sold. These costs cover production, marketing, distribution and administrative activities. They represent the effort the company made to obtain the sale. By deducting the costsincurred in generating a sale from the revenues from it, we can determine whether it yielded a profitor a loss.
The costs that relate to a period’s sales are known as expenses. They are recorded in the incomestatement either at the time the revenues are recognised or in the same financial period. Thus anincome statement can be summarised as follows:
CFA_C03.qxd 11/6/03 2:16 PM Page 37

38 PART 1 • FOUNDATIONS
OWNERS’ EQUITY = ASSETS – LIABILITIES
1 Jan year xx SHARE CAPITAL1/1 + RETAINED PROFITS1/1 = NET ASSETS1/1(NA)
During year xx = INCREASE IN NA= DECREASE IN NA
–DIVIDEND = DECREASE IN NA
31 Dec year xx SHARE CAPITAL31/12 + RETAINED PROFITS31/12 = NET ASSETS31/12
Incomestatementfor yr xx
REVENUES– EXPENSES
+PROFIT(–LOSS)
Company ASTATEMENT OF INCOME
for the financial year xx
ACCOMPLISHMENTS → REVENUES FROM SALESless EFFORTS → – EXPENSESequalsPERFORMANCE → PROFIT (or LOSS)
If revenues exceed expenses, the company reports a profit for the period. If expenses exceed revenues, it reports a loss.
For the profit or loss figure to be a useful indicator of the firm’s performance, it is importantthat outputs and inputs are related. Deducting year 2 costs from year 1 revenues yields a mean-ingless measure of year 1 – and of year 2 – performance. By deducting only year 1 costs from year1 revenues, the firm matches its expenses with its revenues. The resulting income number betterreflects the value it has created (or destroyed) that year.
The link between income statement and balance sheet
When a company reports a profit (or loss), it is not only its income statement that is affected. Thebalance sheet changes, too. Recall the balance sheet equation in its net asset form: A − L = OE.The net profit reported by a company (net, that is, of interest and taxes) belongs to its owners.The amount of their capital in the company increases as a consequence. If OE increases, then, fora balance to be maintained, (A − L) must also increase. Similarly, if a firm reports a loss, bothowners’ equity and net assets must decrease. The link between income statement and balancesheet is set out below.
As can be seen from the table, revenues and expenses have balance sheet consequences. Whenrevenues from a sale are recognised in the accounts, reported owners’ equity and net assetsincrease. When an expense is recorded, owners’ equity and net assets decrease.
CFA_C03.qxd 11/6/03 2:16 PM Page 38

How are revenues/expenses and retained profits linked? We assume, for simplicity, a temporaryaccount, ‘Profit/loss for the year’. During the year, a company records revenues and expenses inthis account. At year-end, it determines the annual profit or loss and transfers the balance to abalance sheet account, ‘Retained profits’. Profits are accumulated and distributed (as dividend)through this account.
Examples make clearer the link between income statement and balance sheet. Four transac-tions, taken from one firm’s accounts, are set out below. We show the impact of each on thefirm’s income statement and balance sheet.
OE = A − L
1 A firm sells goods on credit +2,000 = +2,000for 2,000 P/L for yr Accounts
(Sales revenue) receivable
2 The goods sold cost the −1,200 = −1,200firm 1,200 P/L for yr Inventory
(Cost of goods sold )
3 It incurs wage costs of −500 = − (+500)500 but its staff have P/L for yr Wages not yet been paid (Wage expense) payable
4 It earns rental income of +800 = − (−800)800 from a tenant who P/L for yr Unearnedpaid in advance (Rent revenue) revenue
In 1, the sale of goods on credit increases owners’ equity (sales revenue) and assets (accountsreceivable), since customers now owe the firm 2,000. (If the goods had been sold for cash,another asset account, Cash, would have increased.)
The goods sold in 1 are shipped out of the company’s warehouse to the customer. Thus in 2,a reduction in inventory is recorded and the related production cost of the sale (cost of goodssold) is recognised as an expense.
An expense can give rise to an increase in a liability rather than be the result of a reduction inan asset. In 3, the cost of wages earned during the period the sales were generated is treated as anexpense of that period. Since the wages are unpaid, the firm’s liabilities increase and hence its netassets decrease.
The firm’s liabilities are also affected in example 4. The rent received in advance is a liabilityof the firm, since it is under a contractual obligation to provide space for the tenant. The firmrecognises rental revenue, as the rental period elapses and the obligation is satisfied. As a result,its liabilities fall and both net assets and owners’ equity increase.
We can generalise from these examples. A revenue increases net assets. Net assets increaseeither because an asset increases (e.g. accounts receivable rise) or because a liability decreases(e.g. unearned rent revenue falls). An expense decreases net assets. Net assets decrease eitherbecause an asset decreases (e.g. a reduction in inventory) or because a liability increases (e.g. an increase in wages payable). It follows that profit, being an excess of revenues over expenses,results in an increase in net assets. When a loss is reported (expenses exceed revenues), net assetsdecrease.
Usually a retail or manufacturing firm’s annual profit or loss comes mostly from its opera-tions. It is likely to report other sources of profit or loss, however. It may receive income frominvestments in the form of interest or dividends. If it has borrowed money from a bank, it incursinterest charges on the loan. Other activities may also affect its reported profit. For example,should it sell a fixed asset at a price greater (less) than the book value, it will record a gain (loss)
CHAPTER 3 • THE INCOME STATEMENT 39
CFA_C03.qxd 11/6/03 2:16 PM Page 39

40 PART 1 • FOUNDATIONS
Effect of transactions on financial statementsExhibit 3.1
Sun, C and Sand CompanyTransactions 9 and 10 in January year 1
Transaction (amounts in 000)
(9(a)) (9(b)) (10) BalanceAccount Balance Sale of Cost of Payments after title 8/1/x1 goods goods sold to suppliers event 10
Assets
Cash 5 +40 –14 31 Accounts receivable 0 +10 10 Inventory 31 –30 1 Prepaid rent 6 6 Equipment 9 9
Total assets 51 +50 –30 –14 57
Liabilities
Bank loan 12 12 Accounts payable 19 –14 5
Owners’ equity
Contributed capital 20 20 Profit/loss in January 0 +50 –30 20
Sales Cost of revenue goods sold
Total liabilities and owners’ equity 51 +50 –30 –14 57
Note: The employment of the (part-time) employee (event 8) has no impact on Sun, C and Sand’s accounts on thedate of hiring.
on disposal. In each of these cases, the revenue, expense, gain or loss is accompanied by an inflowor outflow of net assets. Operations, investing and financing are a firm’s ordinary activities. Wedefine ordinary profit or loss for a period as the increase or decrease in a firm’s net assets arising fromoperations and other activities incidental to them.
The effect of transactions
We return now to the company, Sun, C and Sand, whose initial activities we analysed in the lastchapter. The transactions and events we consider here are those that occur between 8 January,the date it begins trading, and 31 January. They illustrate, among other things, the key featuresof revenues: the firm’s accomplishments, mainly from operating activities, which lead to an
CFA_C03.qxd 11/6/03 2:16 PM Page 40

inflow of net assets, and expenses; the costs incurred in generating the revenues, which result inan outflow of net assets.
We look at the effect of each transaction on the accounts, alone and cumulatively, using the same worksheet format we employed in the previous chapter. The transaction worksheet isdisplayed in Exhibits 3.1, 3.2 and 3.3. An income statement and balance sheet similar to thosethe company would prepare at the end of January are set out in Exhibit 3.4.
Illustration
Georgie and Fred’s saga continues. Sun, C and Sand opens its doors to the public on 8 January.During the remainder of January, the following financial events occur.
8 The company hires a student on 9 January on a part-time basis. He starts work on 10 January.His salary is 1,600 a month.
Financial statement impact: On 9 January, none.
At the time the student is hired, there is no effect on the accounts. On the contract date, onlypromises have been exchanged – his promise to perform services in exchange for the company’spromise to make payment for them. An exchange of promises is not usually recognised in finan-cial accounts.
9 Between 8 and 31 January, the company sells, for 50,000, goods that cost it 30,000; 40,000 ofthe goods are sold for cash, the balance of 10,000 on credit.
Financial statement impact (amounts in 000):
9(a) Sale of merchandise
Assets = Liabilities + Owners’ equity+40 +10 = +50Cash Accounts P/L in January
receivable (Sales revenue)
9(b) Cost of merchandise sold
Assets = Liabilities + Owners’ equity–30 = –30
Inventory P/L in January (Cost of goods sold )
When the sales are made, Sun, C and Sand records an increase in its owners’ equity (to highlightits results in January, we call the temporary account ‘Profit/Loss in January’) and a correspond-ing increase in its assets (‘Accounts receivable’ and ‘Cash’). Since it knows the cost of the mer-chandise sold at the time of sale, it records the expense then – as a decrease in owners’ equity(again, using the ‘P/L in January’ account) and a decrease in assets (‘Inventory’). In practice,individual income statement accounts (e.g. ‘Sales revenue’, ‘Cost of goods sold’) are establishedto permit the various types of revenue and expense to be identified.
CHAPTER 3 • THE INCOME STATEMENT 41
CFA_C03.qxd 11/6/03 2:16 PM Page 41

10 During this period Sun, C and Sand makes payments of 14,000 to suppliers for merchandisepurchased on credit on 5 January.
Financial statement impact (amounts in 000):
Assets = Liabilities + Owners’ equity–14 –14
Cash Accounts payable
This transaction does not affect the firm’s income statement. No revenues have been earned norexpenses incurred. The payment of cash to suppliers reduces an asset and a liability.
42 PART 1 • FOUNDATIONS
Effect of transactions on financial statementsExhibit 3.2
Sun, C and Sand CompanyTransactions 11 to 13 in January year 1
Transaction (amounts in 000)
(11) (12) (13) Balances Cash Wages Cost Balances
Account after from earned by of after title event 10 customers employee utilities event 13
Assets
Cash 31 +6 −1 −0.35 35.65 Accounts receivable 10 −6 4 Inventory 1 1 Prepaid rent 6 6 Equipment 9 9
Total assets 57 0 −1 –0.35 55.65
Liabilities
Bank loan 12 12 Accounts payable 5 5 Wages payable 0 +0.1 0.1
Owners’ equity
Contributed capital 20 20 Profit/loss in January 20 −1.1 −0.35 18.55
Wage Utilitiesexpense expense
Total liabilities and owners’ equity 57 0 –1 –0.35 55.65
CFA_C03.qxd 11/6/03 2:16 PM Page 42

11 Of the 10,000 owed by customers, the company collects 6,000 in cash.
Financial statement impact (amounts in 000):
Assets = Liabilities + Owners’ equity+6 –6 = 0 0
Cash Accountsreceivable
As with transaction 10, the company’s income statement is not affected. The credit sale hasalready been recorded (transaction 9(a)). With the receipt of cash from credit customers, theamount owed to the company diminishes. One asset (Accounts receivable) is exchanged foranother (Cash).
12 The employee is paid 1,000 in cash in January. On 31 January, the firm owes him 100 forwages earned but not paid during the last few days of the month.
Financial statement impact (amounts in 000):
Assets = Liabilities + Owners’ equity–1 = +0.1 –1.1
Cash Wages payable P/L in January(Wage expense)
The cost of the services the employee performs for the company in January is 1,100. The com-pany records the cost as ‘wage expense’. It does not pay the whole of this amount in January,however. The wages earned but not paid (100) represent an obligation of the company: hencethe increase in a liability account, ‘Wages payable’. As a result, wage payments in February willinclude unpaid January wages as well as wages earned in February.
13 The cost of utilities (e.g. electricity, gas, water) for January totals 350. This amount is paid incash in the month.
Financial statement impact (amounts in 000):
Assets = Liabilities + Owners’ equity–0.35 = –0.35Cash P/L in January
(Utilities expense)
The cost of the utilities consumed in January is an expense (‘Utilities expense’) and thus a reduction in owners’ equity that month. The services are all paid for in cash in January: hencethe corresponding reduction in an asset, ‘Cash’. What the company has done here is to com-press two transactions into one. In reality, utility ‘assets’ (electricity, gas, water) have been purchased – in the same way that equipment is purchased. However, such assets (unlike equip-ment) cannot be stored. They are consumed immediately. Since acquisition and consumption ofa utility ‘asset’ occur almost simultaneously, the company records only the expense and not theasset.
CHAPTER 3 • THE INCOME STATEMENT 43
CFA_C03.qxd 11/6/03 2:16 PM Page 43

14 The company pays the first month’s interest on the 12,000 bank loan on 31 January. Theannual interest rate is 10%.
Financial statement impact (amounts in 000):
Assets = Liabilities + Owners’ equity–0.1 = –0.1Cash P/L in January
(Interest expense)
Interest expense, the cost of using the capital provided by the bank, is time-based. Given a 10% annual interest rate and approximately one month’s use of the 12,000 loan, the cost is 100((10% × 1/12) × 12,000). Since the interest is paid in January, the reduction in owners’ equity is matched by a reduction in cash.
44 PART 1 • FOUNDATIONS
Effect of transactions on financial statementsExhibit 3.3
Sun, C and Sand CompanyTransactions 14 to 16 in January year 1
Transaction (amounts in 000)
(14) (15) (16) Balances Interest Use of
Account after on bank shop Use of Balancetitle event 13 loan space equipment at 31/1
Assets
Cash 35.65 –0.1 35.55Accounts receivable 4 4 Inventory 1 1 Prepaid rent 6 –2 4 Equipment 9 –0.25 8.75
Total assets 55.65 –0.1 –2 –0.25 53.3
Liabilities
Bank loan 12 12 Accounts payable 5 5 Wages payable 0.1 0.1
Owners’ equity
Contributed capital 20 20 Profit/loss in January 18.55 –0.1 –2 –0.25 16.2
Interest Rent Depreciation expense expense expense
Total liabilities and owners’ equity 55.65 –0.1 –2 –0.25 53.3
CFA_C03.qxd 11/6/03 2:16 PM Page 44

15 By the end of January, the company has had one month’s use of the shop space which itrented on 3 January for three months at 6,000.
16 Also by that date, the company has enjoyed one month’s services of the shop equipment. Theequipment (the balance remaining after the exchange of surplus equipment for inventory) costs9,000, has a three-year economic life and is expected to have no scrap value.
Financial statement impact (amounts in 000):
15 Use of shop spaceAssets = Liabilities + Owners’ equity
–2 = –2Prepaid rent P/L in January
(Rent expense)
16 Use of equipmentAssets = Liabilities + Owners’ equity–0.25 –0.25
Equipment P/L in January(Depreciation expense)
In each case, the company acquires an asset in early January and consumes part of its services inthe month. Assets (‘Prepaid rent’ and ‘Equipment’) and owners’ equity are reduced. Both assetsare valued at their historical cost. The company assumes it will use up the benefits from eachasset at a constant rate each period. Thus each asset is amortised on a straight-line basis. Rentexpense in January is 2,000, one-third of the amount paid for the right to use the shop space (1/3× 6,000). The equipment has a three-year life. Depreciation expense in January is therefore 250,one thirty-sixth of the amount paid for the equipment (1/36 × 9,000).
Items 15 and 16 are updating entries. The company has consumed part of the services of twoassets – prepaid rent and equipment – during January. It must adjust its accounts during or atthe end of the month to reflect this. Such updating entries are examples of ‘accrual adjustments’and are an essential feature of accrual-based accounts. We look more closely at such adjustmentsin Chapter 5.
We can now draw up an income statement and balance sheet for Sun, C and Sand Companycovering its first month’s operations. These are set out in Exhibit 3.4.
To construct Sun, C and Sand Company’s January income statement in Exhibit 3.4, we con-sult the row titled ‘Profit/loss in January’ in Exhibits 3.1–3.3. This is the balance sheet accountwhich contains details, by transaction, of the company’s revenues and expenses in that month.We classify the revenues and expenses – in this case, by their nature – and list them in the incomestatement. The net amount of profit in January, the ‘bottom line’ of 16,200, appears as part of‘Owners’ equity’ on the company’s end-January balance sheet.
With our example, we have illustrated the link between the income statement and balance sheetdescribed earlier. In Sun, C and Sand’s case, the company has net assets of 20,000 at the close of 7 January. As a result of its trading and financial activities, it recognises revenues of 50,000 andexpenses of 33,800 between 8 January and 31 January, a net profit of 16,200 in the month. At thesame time, it records changes in its assets and liabilities which lead to an increase of 16,200 in itsnet assets during this period. Thus its net assets at 31 January stand at 36,200. The increase in netassets is illustrated in Exhibit 3.5.
Note that profitable operations are not the only source of increases in net assets. If Georgieand Fred contributed more capital to the company, this would cause its net assets to rise.
CHAPTER 3 • THE INCOME STATEMENT 45
CFA_C03.qxd 11/6/03 2:16 PM Page 45

46 PART 1 • FOUNDATIONS
The fallacy of profit and cash flow equivalence
Accounting fallacy no. 3: ‘Revenues show the cash received by the company and expenses show the cash paid out by the company in a financial period. It follows that the net profit or loss figure in the income statement indicates the company’s net cash inflow or outflow duringthat period.’
Many people view the income statement incorrectly as a statement of cash flows. A major reason for confusing income with cash flow lies in the terms ‘revenue’ and ‘expense’. In popularspeech, ‘revenue’ is often equated with ‘receipt of cash’ and ‘expense’ is considered a synonymfor ‘expenditure’. But the terms ‘revenue’ and ‘expense’ in technical use have no necessary con-nection with cash flows. As we have seen, revenues (expenses) result in an inflow (outflow) ofnet assets, of which cash is only a part.
To see the distinction between revenue and receipt more clearly, let’s look again at our example. In January, Sun, C and Sand sells merchandise of 50,000 to customers. These sales arean indicator – and a widely used one – of the firm’s operating accomplishment. The companytherefore reports revenues of 50,000. It receives 46,000 of cash with respect to these sales in
Sun, C and Sand CompanyFINANCIAL STATEMENTS
for January year 1(amounts in 000)
Statement of incomefor period 8 January to 31 January year 1
Revenue from sales 50Less Expenses:
Cost of goods sold 30Rent expense 2Wage expense 1.1Utilities expense 0.35Depreciation expense 0.25Interest expense 0.10
Total expenses –33.8Profit for the period 16.2
Balance sheet at 31 January year 1
Current assets Current liabilitiesCash 35.55 Bank loan 12Accounts receivable 4 Accounts payable 5Inventory 1 Wages payable 0.1Prepaid rent 4 Total 17.1
Total 44.55
Fixed assets Owners’ equityShop equipment, net of depreciation 8.75 Contributed capital 20
Profit in January 16.2Total 36.2
Total liabilities Total assets 53.3 and owners’ equity 53.3
Exhibit 3.4
CFA_C03.qxd 11/6/03 2:16 PM Page 46

January. Thus receipts fall short of revenues by 4,000. Since January is the first month of trad-ing, this is the balance in ‘Accounts receivable’ at the end of the month.
Net assets (A − L) = Owners’ equity
Accounts Profitreceivable Cash in January
Transaction9(a) +10,000 +40,000 = +50,000
(Sales revenue)11 −6,000 +6,000 = 0Net effect by 31/1/yr 1 +4,000 +46,000 = +50,000
When the company recognises revenue from sales, net assets increase by 50,000. Ignoring thecost of the sales (and other expenses), net assets continue to be higher by that amount at the endof January, even though the composition of the 50,000 has changed – and will continue tochange – as credit customers pay off their debts.
A similar picture emerges when we consider the expenses reported by Sun, C and Sand inJanuary. In two cases – rent and depreciation – the outlays of cash for the lease of shop space andfor the purchase of equipment exceed the charges for rent and depreciation in the income state-ment. Since the lease term and the life of the equipment both extend beyond January, it wouldbe misleading to treat all of the expenditures on these items as part of the effort necessary to gen-erate January revenues. Rent and depreciation expenses therefore reflect only one month’s useof the underlying assets.
By the same token, the logical measure of matched effort with respect to the goods sold inJanuary is the cost of the items sold. It is not the cost of the inventory purchased nor the pay-ment made in January for merchandise.
CHAPTER 3 • THE INCOME STATEMENT 47
Sun, C and Sand CompanyIncrease in net assets between 8 and 31 January
Exhibit 3.5
OE = A – L
Contributed capital + Retained profits = Net assets
At 7/1 yr 1 (Exhibit 2.3) 20,000 + 0 = 20,000
= +50,000(Increase)
Between 8/1 and 31/1 = –33,800(Decrease)
At 31/1 yr 1 (Exhibit 3.4) 20,000 + 16,200 = 36,200
Incomestatement
for January
Revenues 50,000
Expenses –33,800
Profit 16,200
CFA_C03.qxd 11/6/03 2:16 PM Page 47

48 PART 1 • FOUNDATIONS
Sun, C and Sand CompanySTATEMENT OF CASH FLOWS
from 8 January to 31 January year 1(amounts in 000)
Receipts from: Cash sales 40Collections of amounts owed by credit customers 6Total inflows of cash 46
Less: Expenditures on:Merchandise inventory purchased on credit 14Wages 1Utilities 0.35Interest on bank loan 0.1
Total outflows of cash –15.45Net cash inflow in period 30.55Cash balance on 7 January 5Cash balance on 31 January 35.55
Exhibit 3.6
Remuneration of the part-time employee provides a further example of how expense andexpenditure can diverge. The wage expense of 1,100 represents the cost of the services theemployee renders the company during January. This would be so even if none of this amountwas paid to him in January. In fact, wage payments – the company’s expenditure – amount to1,000. The difference of 100 represents the company’s liability to him at the month’s end.
Sometimes expense and expenditure coincide (as can revenue and receipt). Sun, C and SandCompany consumes 350 of utilities in January: this is its utilities expense that month. Interest onits 12,000 bank loan accrues day by day: the cost in January amounts to 100. In each case, theamount recognised as expense in January is paid by the month’s end.
To highlight the difference between profit and cash flow, we set out, in Exhibit 3.6, a cash flow statement for Sun, C and Sand for the period from 8 January, when operations began, to 31 January.
Notice how the cash flow statement ignores events which have no cash flow impact. Theabove statement ignores rent, for example, because Sun, C and Sand made no rent paymentsbetween 8 and 31 January. Similarly, it ignores 4,000 of January sales because cash for them wasnot received that month.
On the other hand, the cash flow statement highlights events such as the issuance of newshares or outlays on new plant which have a delayed and often multi-period effect on a firm’soperations. Net cash flows can fluctuate markedly from period to period depending on the timing of such major cash events. It’s for these reasons that cash flow is not considered a usefulbarometer of a company’s operating performance.
Income statement presentation
Sun, C and Sand’s January income statement is short and straightforward; the published incomestatements of large public companies are often long and complex. We illustrate the differentways in which income data are presented in practice – and the meanings of common incomestatement terms – using BestPrice’s x2 consolidated income statement. This is set out in Exhibit 3.7.(You’ll recall from Chapter 2 that BestPrice Stores is a European supermarket group.)
CFA_C03.qxd 11/6/03 2:16 PM Page 48

l Meaning of ‘consolidated’
The title declares that this is a consolidated income statement. It brings together the revenuesand expenses of the parent company, BestPrice Stores S.A., and those of all the subsidiaries overwhich it has management control. In accordance with EU law, BestPrice presents comparativefigures for the previous financial year, x2, alongside the x1 figures.
Note that BestPrice combines all the revenues and expenses of the subsidiaries it controls,even where it owns less than 100% (but more than 50%) of the shares of these companies. Toensure that the ‘Net income’ number reflects only the profit attributable to parent companyshareholders, BestPrice deducts from group profits (‘Income after tax’) the after-tax profits ofsubsidiary companies which are attributable to outside shareholders. These profits – a51 millionin x2 – are described as ‘Minority interests’.
l Multiple-step and single-step analysis of profit
BestPrice shows not one but five profit numbers on the face of its x2 income statement. This isan example of a multiple-step income statement. Moving down the statement – with each suc-ceeding step – the profit number becomes more inclusive. Thus only merchandise costs (i.e. costof sales) are deducted in calculating ‘gross profit’ while merchandise and other operating costs(i.e. selling, general and administrative expenses) are deducted in calculating ‘operating profit’.‘Exceptional charges’ are shown with operating expenses because in this case they are operatingin nature. (According to the notes to the accounts, BestPrice incurred exceptional restructuringcharges of a26 million in x2 arising from the integration of a retailing business acquired during
CHAPTER 3 • THE INCOME STATEMENT 49
BestPrice StoresCONSOLIDATED INCOME STATEMENTS
for x2 and x1(amounts in A millions)
Year to 31 December x2 x1
Net sales 17,587 15,258Cost of sales –13,707 –11,990Gross profit 3,880 3,268Selling expenses –2,629 –2,258General and administrative expenses –583 –511Exceptional charges –26 –Operating profit 642 499Investment income 37 51Interest expense, net –121 –101Income before tax 558 449Income tax expense –203 –157Income after tax 355 292Minority interests –51 –40Net income 304 252
Weighted average number of sharesoutstanding (x 1,000) 73,103.8 66,436.4
Earnings per share A4.16 A3.79
Exhibit 3.7
CFA_C03.qxd 11/6/03 2:16 PM Page 49

50 PART 1 • FOUNDATIONS
the year.) The income before tax figure is more inclusive yet. It is arrived at after combining theincome effects of operating and financial activities. The latter include investment income (forexample, dividends received), interest expense and interest income. The most inclusive groupprofit number is income after tax: tax expense reflects the tax impact of all the group’s revenuesand expenses recorded in earlier steps.
Under the alternative single-step income statement, net earnings is arrived at in one step. The company groups all expenses together. If it has more than one type of revenue, these too are combined. Total expenses are then deducted from total revenues to arrive at one incomenumber.
The advantage of the multiple-step income statement is that it allows investors to see moreclearly the burden of each type of cost. Moreover, as we will see in a later section, differentincome numbers are used in different profitability ratios.
l Classification of expensesBestPrice groups costs by functional activity. For example, all the costs of inputs (materials,labour, depreciation of equipment, etc.) used by the sales department are shown against ‘Sellingexpenses’ while those used by administrative departments are shown against ‘General andadministrative expenses’. In a retail company like BestPrice, ‘Cost of sales’ represents simply thecost of the merchandise sold. In a manufacturing company, however, ‘Cost of sales’ includes allthe production costs relating to the goods sold in the period.
An alternative approach is to classify expenses by their nature. Where a natural format is used,separate figures are given for each major input, e.g. materials, labour (wage expense), equipment(depreciation) and so forth. Sun, C and Sand’s January year 1 income statement shown inExhibit 3.4 illustrates the natural format.
The natural format is widely used in Europe. US companies, however, must use the functionalformat. We look at both formats in greater detail in Chapter 6.
l Income statement terminologySome income statement terms in English-language accounts present special problems. Somewords have a similar meaning – for example, income, earnings, profit – but cannot be used interchangeably in every context. For example, although we can apply the term ‘profit’ to onetransaction or many, ‘earnings’ is usually only used to describe the (successful) results of all of afirm’s activities over a period.
The terms ‘gain’ and ‘loss’ warrant additional explanation. They can be used in various con-texts. Perhaps the most common usage is to describe the net effect of a transaction which is not partof the normal operating activities of the firm. For example, suppose BestPrice sells a building. Thecompany is not in the business of selling buildings: this is not part of its normal operations. Thusit does not show the cash proceeds as part of sales revenue, nor the cost (more precisely, the bookvalue) of the building as part of ‘Cost of sales’. Instead, the transaction is reported net. Any difference between the sale amount and the asset’s book value is described as ‘Gain (or loss) ondisposal of fixed asset’ and, if material, is shown separately on a multiple-step income statementas part of operating profit (or loss).
Gain and loss are also used in connection with both changes in the values of assets and liabil-ities and the effects of ‘windfalls’. Thus if some of BestPrice inventory is damaged or spoilt, thereduction in value is recorded as ‘loss from inventory write-down’. If merchandise disappearsfrom the shelves and cannot be traced (one possible reason is theft), BestPrice records a ‘lossfrom inventory shrinkage’. If such losses are small, they are absorbed within ‘Cost of sales’ onthe income statement.
CFA_C03.qxd 11/6/03 2:16 PM Page 50

CHAPTER 3 • THE INCOME STATEMENT 51
BestPrice StoresCondensed x2 consolidated accounts
(amounts in A millions)
Consolidated income statement for x2Net sales (A) 17,587Gross profit (B) 3,880Operating profit (C) 642Net income (D) 304
Consolidated balance sheet End x2 End x1Total assets 12,011 10,879
Average total assets (E) 11,445Liabilities and minority interests 8,824 8,307Shareholders’ equity 3,187 2,572Total equities 12,011 10,879
Average shareholders’ equity (F) 2,880
Exhibit 3.8
A postscript on the term ‘net’ in the income statement: when applied to corporate earnings,it means ‘after deduction of corporate income taxes’; when applied to sales, it means ‘after deduc-tion of value added (and similar) taxes, customs duties and sales discounts’. In broad terms, ‘netsales’ indicates the cash the company expects to receive and retain from sales transactions.
Key profitability ratios
At the outset of this chapter we noted that financial statement users turn to the income state-ment to learn about the performance of the company in past periods. Most income statement-related ratios are designed to help them in this task. We describe four such ratios in this chapterand introduce additional ones in later chapters. To illustrate the four ratios, we use BestPrice’sx2 consolidated accounts, a condensed version of which is given in Exhibit 3.8.
l Profit-to-sales ratioThe profit-to-sales ratio shows how many cents of profit are earned on each euro of sales. It is alsoknown as the (rate of) return on sales or – the term we use often in this book – the profit mar-gin ratio. It can be calculated using various measures of profit, e.g. gross profit, operating results,net earnings. We give below two examples, the gross profit- and net income-to-sales ratios, andillustrate both with numbers from BestPrice x2 consolidated income statement:
In x2 BestPrice made a profit of 22.1 cents on every euro of sales at the check-out. However, sell-ing, administrative and financial costs – as well as the government’s income tax take – ate uparound 20 of those 22.1 cents.
Net incomeNet sales
(D)(A)
( ) ,
( ) . %× = = × =100304
17 587100 1 73
Gross profitNet sales
(B)(A)
( ) ,,
( ) . %× = = × =1003 880
17 587100 22 1
CFA_C03.qxd 11/6/03 2:16 PM Page 51

BestPrice’s x2 ratios provide striking illustration of both the strength and weakness of theprofit margin ratio as a performance measure. First, the strength: the ratio provides insight into afirm’s cost structure. The disparity between BestPrice’s gross and net profit margins tells us howimportant non-merchandise costs are in BestPrice’s cost structure. By comparing individualtypes of cost with sales – over time for the same firm and in one time period across firms in thesame industry – we gain a better understanding of why margins change over time and why theydiffer across firms.
l Rate of return on shareholders’ equity
Now the weakness: the profit margin ratio is inadequate as a complete measure of profitabilitybecause it takes no account of how much capital is used in the business. Shareholders want to knowwhat is the return on the investment they have made in an enterprise. (Profit represents a posit-ive return; a loss a negative return.) We measure this return by relating the profit attributable tothe firm’s owners to the owners’ capital, both contributed and earned, which the enterprise hashad use of during a period. We call this the rate of return on shareholders’ equity or, simply,the return on equity (ROE).
Return on equity (ROE) ==
The return on equity shows the profit the company generates in a period on the capital invested init by its owners.
From Exhibit 3.8 we see that the capital at BestPrice’s command in x2 that belongs to share-holders is a2,880 million. (This is an average figure. We have approximated it by taking a sim-ple average of the start- and end-year stockholders’ equity figures.) Using the same net incomefigure we used in the net income-to-sales ratio calculation, we can now compute BestPrice’s x2ROE as follows:
Return on equity of BestPrice’s shareholders = (× 100) = 10.6%
BestPrice’s shareholders did not earn a healthy return on their investment in x2. In fact, it’s quitelikely that the ROE of around 10% that year fell short of the minimum return they were seekingon such an investment. This minimum return is, in effect, the cost of equity capital to BestPrice.For most large supermarket chains, the cost of equity capital was in the 10–15% range in theearly 2000s.1
l Assets turnover
The profit margin ratio and ROE are not the only corporate performance indicators thatinvestors (and managers) monitor. They also check the efficiency with which a company uses itsassets. A widely used measure of asset efficiency is the turnover rate (or total activity ratio), thenumber of times in the year the company ‘turns over’ its assets. It’s computed as follows:
Assets turnover rate ==
The higher the turnover rate, the more sales each euro of assets generates. Assuming the margin oneach sale is positive, it’s easy to see how, by raising its turnover rate, a company can boost itsoverall profits.
Net sales
Average total assets
( )( )
,
DF
=304
2 880
Net profit (to shareholders)
Average shareholders’ equity 100 ×
52 PART 1 • FOUNDATIONS
CFA_C03.qxd 11/6/03 2:16 PM Page 52

We set out below the calculation of BestPrice’s assets turnover in x2 using data from Exhibit 3.8. We assume the average assets controlled by the group in x2 are a simple average of start- end-x2 figures.
Assets turnover in x2 = = 1.54 times
BestPrice turned over its assets at a modest rate in x2. It generated around 1.5 euros of annualsales from each euro of assets that year. Most European supermarket chains do better.
l Rate of return on assets
The rate of return on assets (or return on assets (ROA)) is another measure of profitability. It shows the profit the company generates in a period on the total assets employed by it. By con-trast, ROE focuses on the return on net assets, that is those assets financed by the firm’s owners(A – L = OE).
ROA links both the profit margin ratio and the assets turnover rate in one ratio:
Return on assets (ROA) ==
Operating profit ×× Assets turnover==margin ratio rate
== ××
We compute below BestPrice’s ROA for x2. The group’s average total assets in x2 are a11,445million (Exhibit 3.8). Dividing BestPrice’s operating profit (a642 million) by its average totalassets yields a ROA for x2 of 5.6%:
BestPrice’s return on assets in x2 = (× 100) = 5.6%
BestPrice’s substandard return on assets is the result of both low margins and slow assetsturnover:
Operating profit × Assets turnoverReturn on assets =
margin ratio rate
BestPrice’s x2 ROA = (× 100) ×
= 3.59% × 1.54 times = 5.5%
Each euro of assets yielded BestPrice operating profit of around five and a half cents on averagein x2. Note that, at 10.6%, BestPrice’s ROE is well above its x2 ROA. A major reason for this isthe company’s successful use of leverage. Much of its capital comes from its suppliers. Trade payables represent over 20% of its end-x2 equities. These are liabilities that carry no explicitinterest charge. We explore this and related issues in a later chapter on financial statement analysis.2
The four profitability ratios we’ve looked at in this chapter are summarised in Exhibit 3.9.
17 587
11 445
,
,
632
17 587,
(C)(E)
,
=642
11445
Net sales
Average total assets
Operating profit
Net sales
Operating profit
Average total assets
(A)(E)
,,
=17 58711445
CHAPTER 3 • THE INCOME STATEMENT 53
CFA_C03.qxd 11/6/03 2:16 PM Page 53

54 PART 1 • FOUNDATIONS
The value added statementBOX3.1
The value added statement (VAS) and the income statement are alternative ways of portray-ing a firm’s performance. In practice, the numbers in the former are derived from those in thelatter. This can be easily demonstrated. Define retained profits (RP) as follows:
S −− PGS −− W −− DEP −− I −− T −− DIV == RP (1)
where: S = salesPGS = purchased goods and servicesW = wages and salariesDEP = depreciationI = interest chargesT = taxDIV = dividends paid to shareholders
l Profitability and wealth creationThe income numbers used in the above profitability ratios have a financial focus. Net incomeshows the returns flowing to shareholders; operating profit the returns flowing to shareholdersand lenders. In effect, the income numbers reflect the wealth the firm has created for financialcapital providers.
Economists favour a broader measure of wealth creation. They calculate a firm’s value added.This is the difference between a company’s output (i.e. its sales) and the inputs of materials andservices it has purchased. Under this view, a company creates wealth by turning inputs into highervalued output. Some companies publish a supplementary ‘value added statement’ in their annualreport. The statement shows both the source of value added by the company in a period and itsdistribution – to employees and government as well as shareholders and creditors (see Box 3.1).
Ratio Calculation Purpose
Profit margin ratio Shows the return on each euro of sales.
Assets turnover (rate)Measures efficiency with which firm usesits assets.
Return on equityShows the return on each euro of capitalinvested by owners.
Return on assetsShows the return on each euro of assetsemployed by firm.
* Profit can be gross, operating or net.
** Net profit = after-tax profit attributable to (parent company) shareholders.
Operating profitAverage total assets
Net profit**Average shareholders’ equity
Net salesAverage total assets
Profit*Net sales
Key profitability ratios: method of calculation and purposeExhibit 3.9
CFA_C03.qxd 11/6/03 2:16 PM Page 54

CHAPTER 3 • THE INCOME STATEMENT 55
STATEMENT OF VALUE ADDED AND ITS DISTRIBUTION
In Singapore $m Year to 31 March 2001
Revenue 9,951− Purchase of goods and services −5,366
Value added by Group 4,585Investment and other non-operating income 595
Total value added available for distribution 5,180Applied as follows:To employees (salaries and other staff costs) 2,093To government (corporate income taxes) 317To suppliers of capital
Dividends 321Interest on borrowings 38Minority interests 38
Retained for future capital requirementsDepreciation 1,145Retained profits 1,228
5,180
There is no legal requirement on companies to publish a VAS. Why, then, do firms likeSingapore Airlines do it? One reason is that showing corporate performance in this way ismore understandable to employees. Some managers believe it even contributes to betterlabour relations. The statement views employees, capital providers and government as equalbeneficiaries of the wealth created by a firm. It is not surprising that the VAS enjoyed a surgein popularity in Europe in the late 1970s when corporate profitability was damaged by oil-price-induced inflation and labour relations deteriorated as managements resisted union-backed demands for wage increases. Interest waned in the 1990s but the rise of the SEEAR(social, environmental and ethical accounting and reporting) movement in recent years maywell bring about a revival in the popularity of the VAS.
Box 3.1 continued
Equation (1) can be rearranged to yield value added – and its distribution:
S −− PGS == W ++ [I ++ DIV] ++ T ++ [DEP ++ RP] (2)
The left-hand side of equation (2) shows the source of value added, namely sales less purchasedinputs. The right-hand side of equation (2) shows how value added has been distributed – toemployees (wages and salaries), providers of financial capital (interest and dividends), gov-ernment (tax) – with the undistributed portion reinvested in the business (depreciation andretained profits).3
A VAS usually has a structure similar to that in equation (2). The example below is takenfrom Singapore Airlines’ annual report for 2000/01. It has been condensed.
CFA_C03.qxd 11/6/03 2:16 PM Page 55

56 PART 1 • FOUNDATIONS
Note that, in practice, the value added statement is easy for companies to prepare since, to alarge extent, it involves simply recasting the income statement.
Summary
What are the main lessons we can draw from our examination of the income statement?First, its purpose. Investors and other users study the income statement to assess the per-
formance of an enterprise in a particular time period. With information from this and othersources, they can make better resource allocation decisions – whether to invest funds, how muchcredit to extend, where to pitch a wage claim. Thus the corporate income statement serves animportant economic role in our society.
Second, its construction. Performance is measured by comparing a company’s operatingaccomplishments with the efforts it makes to achieve them. Operating accomplishments areindicated by the firm’s output in the form of its production or sales during a period. The inputsused to generate the production or sales are the related efforts. Revenue and expense are theterms used to give financial expression to the firm’s operating accomplishments and its‘matched’ efforts. If, over a period, revenues are greater than expenses, the company reports aprofit; if less, it reports a loss.
Third, the inextricable link between the income statement and the balance sheet. When rev-enues are recognised, net assets increase. When expenses are recognised, net assets decrease. If,over a period, total revenues exceed total expenses and a profit is reported, the resulting increasein owners’ capital is mirrored in an overall increase in net assets.
Finally, the distinction between income and cash flow. Revenues are not necessarily inflowsof cash (receipts); nor are expenses necessarily outflows of cash (expenditures). They may be butthey need not be. Revenues (expenses) lead to an inflow (outflow) of net assets. Thus they canalter non-cash assets and liabilities. Hence the income statement is not equivalent to a statementof cash flows.
Problem assignments
P3.1 Recording transactions I
After gaining experience of the cloth trade in France, Francesco Datini returns to his native Tuscanyin x3 and opens his own wholesale cloth business in Prato, specialising in fine imported materials.From his business records, you learn the following facts about operations in January, the first monthof operations.
1 Datini and associates set up a company, Datini SpA, and invest 25,000 in it.2 The company rents a warehouse with offices at the start of January, paying 14,400 for six months
rent in advance.3 The company purchases equipment costing 15,000 for the warehouse and offices. It makes a
20% cash downpayment and agrees to pay the balance in 60 days.4 The company buys 20,000 of merchandise on credit.5 It sells cloth costing 15,000 for 25,000. All of the sales are on account, save for 2,000 which are
for cash.6 Company employees earn salaries of 2,500 in January; 200 is unpaid at month-end.
CFA_C03.qxd 11/6/03 2:16 PM Page 56

7 A (credit) customer returns and receives full credit for cloth with a sale price of 1,000 which was shipped in error. The gross margin on the merchandise is the same as the average on themonth’s sales (see 5).
8 Other operating expenses in the month amount to 600, which are all paid in cash.9 Equipment depreciation of 100 is recognised. So, too, is rent for the month (see 2).
10 The company’s profits are taxed at 30%. None of the liability has been paid by the end of January.
Required
(a) Record the above transactions on a worksheet similar to that used in Exhibits 3.1–3.3.
(b) Prepare an income statement for January and a balance sheet at 31 January for the company.
Check figure:Total assets, 31/1/x3 61,200
P3.2 Identifying transactionsSet out below are the balances in Poirot SA’s asset and equity accounts after each of eight account-ing transactions or events in the week beginning 12 June. You’ll notice that two or more of theaccount balances change with each transaction. Identify each transaction or event, based on themovement in the account balances. Transactions 1 and 2 are related.
Balance Balances after transaction/eventPoirot SA at 12/6 1 2 3 4 5 6 7(amounts in 000)
AssetsCash 5 10 10 19 13 13 13 18Accounts receivable 14 21 21 21 21 21 21 16Inventories 20 20 12 12 12 12 12 12Prepaid rent 6 6 6 6 6 6 5 5Property and equipment 14 14 14 10 10 10 10 10Total 59 71 63 68 62 62 61 61
Shareholders’ equity andliabilities
Accounts payable 15 15 15 15 9 9 9 9Wages payable 0 0 0 0 0 2 2 2Bank loan 13 13 13 13 13 13 13 13Share capital 31 31 31 31 31 31 31 31P/L for period 0 12 4 9 9 7 6 6Total 59 71 63 68 62 62 61 61
P3.3 Recording transactions II Dick Dewy forms a company, Greenwood Transport plc, on 1 June. During the first week of itsexistence, it invests in the assets necessary to begin operations as a haulage company. Its balancesheet on 8 June is set out below:
CHAPTER 3 • THE INCOME STATEMENT 57
CFA_C03.qxd 11/6/03 2:16 PM Page 57

Greenwood Transport plcBalance sheet at 8 June year 1
Assets Equities
Current assets Current liabilities
Cash 11,800 Accounts payable 200Short-term securities 5,000Office supplies 200Prepaid insurance
(for one year) 1,200Prepaid rent
(for three months) 1,50019,700
Fixed assets Shareholders’ equityTruck 20,000Office equipment 500 Share capital 40,000
20,500Total 40,200 Total 40,200
The company makes its first shipments on 9 June. The following is a summary of the transactions andevents that occur between 9 June and the end of the month.
1 Revenues from haulage of goods in June amount to 3,500, of which 500 represents cash busi-ness and the balance is undertaken on the company’s normal credit terms (in this case, unpaidamounts are due within 30 days of invoice date).
2 Fuel costs during June total 300, all paid in cash.3 When Dewy bought the truck, the dealer agreed to provide free servicing, valued at 240, in the
first six months. No service work was performed in June. (Dewy obtains fuel and servicing workfrom separate suppliers.)
4 The company buys a further 50 of supplies on credit. The cost of the supplies on hand at the endof the month is 150.
5 Wages earned by company staff in June total 1,800. By the end of June, the company has paid2,000 of wages, including 200 of advance wages to staff who’ll be on vacation in early July.
6 By month-end, customers have paid 1,000 of the 3,000 they owe to the company.7 At the end of June, the company recognises depreciation of 300 on the truck. (Depreciation on
the office equipment is very small and is considered immaterial to the monthly accounts.)8 At the same time, it recognises one month’s use of rented office space and one month’s benefit
from insurance coverage on the truck.9 Short-term securities yield 50 of interest revenue, all of which is received in cash.
10 Income tax on company profits in June is expected to be 150. None of this estimated liability hasbeen paid by the end of the month.
Required
(a) Record the relevant transactions and events in 1 to 10 on a worksheet similar to that used inExhibits 3.1–3.3.
(b) Prepare accounts (income statement and balance sheet) for the month of June for GreenwoodTransport plc.
Check figure:Total assets, 30/6/yr 1 40,700
58 PART 1 • FOUNDATIONS
CFA_C03.qxd 11/6/03 2:16 PM Page 58

P3.4 Financial statement relationshipsKey figures have been taken from the x8 accounts of three separate companies. They are given belowunder columns 1, 2 and 3. The accounts, however, are incomplete. Fill in the blanks which are letter-coded. (Amounts are in millions.)
Company1 2 3
Total liabilities, end x8 50 (E) 30Expenses in x8 (A) 65 90Total owners’ equity, start x8 60 40 (I)Total assets, end x8 (B) 70 (J)Revenues in x8 95 (F) 100Capital contributed by owners in x8 0 15 10Total liabilities, start x8 (C) 10 (K)Total owners’ equity, end x8 (D) 50 85Profit or loss in x8 20 (G) (L)Total assets, start x8 100 (H) 120
P3.5 Recording transactions IIIPeerless Company is a distributor of wide-screen, high-definition television sets and related equip-ment. The company was formed in September x1 and its balance sheet just prior to the start of trad-ing is as follows:
Peerless CompanyBalance sheet at 30/9/x1
Current assets Current liabilities
Cash 18,500 Accounts payable 43,400Advance to employee 300 Deposit from customer 800Inventory 38,000 44,200Prepaid rent(for three months) 6,000
62,800
Fixed assets Shareholders’ equity
Shop fittings 19,000 Share capital 54,000Office equipment 7,400Organisation costs 9,000Total assets 98,200 Total equities 98,200
The company’s first retail outlet opened its doors for business on 1 October. The company’s trans-actions in October are summarised below.
1 TVs and videos are sold for 40,000 (euros), 22,000 on account, the balance for cash. Cash salesinclude delivery of the TV set to the customer who paid a deposit of 800 in September. The costof items sold is 20,000.
2 The company collects 7,000 of amounts owed by customers.3 It pays 34,000 to suppliers for inventory and office equipment it purchased on account in
September.4 The company has two employees. Each earns a salary of 1,000 in the month. Because of the 300
advance to one of them in September, salary payments in October are only 1,700.
CHAPTER 3 • THE INCOME STATEMENT 59
CFA_C03.qxd 11/6/03 2:16 PM Page 59

5 Rent expense is recognised. Rent consists of a monthly fixed charge of 2,000 and a variablecharge of 1.5% of sales revenue. The rent prepayment at end-September represents three monthsof the fixed charge which was paid in advance in late September. The variable charge is to be paidin cash.
6 The company recognises depreciation of 200 on the shop fittings and 100 on the office equipment.(The shop fittings are expected to have a 71/2-year life and salvage value of 1,000; the office equip-ment a six-year life and salvage value of 200. The straight-line method of depreciation is used. Theassets are depreciated from the start of October when operations begin.)
7 Organisation costs are amortised at the rate of 100 a month.8 The income tax rate is 40%. No tax is paid in October.
Required
(a) Record the above transactions and events in 1 to 8 on a worksheet similar to that used in Exhibits 3.1–3.3.
(b) Prepare for the benefit of the company’s management an income statement for October and abalance sheet at 31 October x1.
Check figure:Total assets at 31/10/x1 78,400
P3.6 Deriving financial data and calculating ratios
(1) Profit and profit margin data
The following income figures have been taken from Mitica Company’s accounts for year 7. (Amountsare in millions.)
Income tax expense 1.8 Administration expense 9.3Distribution expense 6.9 Revenues from sales 162.5Interest income 0.9 Interest expense 1.0Cost of goods sold 140.7 Dividends paid 4.6
Required
A venture capital company, Croesus International, is thinking of investing in the company. It asks youto calculate, for year 7, Mitica Company’s:
(a) operating profit;
(b) net profit or loss;
(c) gross profit-to-sales ratio (in percentage terms).
(2) Balance sheet figures and profitability ratios
You are then given the following balances, also taken from Mitica Company’s year 7 accounts.(Amounts are in millions.)
Cash 11.4 Provisions for liabilities 4.0Accounts payable 32.5 Share capital 10.8Retained profits 36.9 Accounts receivable 41.6Long-term investments 3.1 Long-term debt 6.8Inventories 26.9 Property, plant and equipment 43.0Short-term bank loan 3.2 Other current liabilities 17.6Share premium 14.2
60 PART 1 • FOUNDATIONS
CFA_C03.qxd 11/6/03 2:16 PM Page 60

Required
Croesus International now asks you to calculate Mitica Company’s:
(a) end-year 7 current assets;
(b) end-year 7 fixed assets;
(c) end-year 7 shareholders’ equity;
(d) return on assets for year 7 in percentage terms (use end-year 7 assets in the denominator).
Check figure:End-year 7 total assets 126.0
P3.7 Constructing an income statement
Banting Corporation (name disguised) is a major international pharmaceutical company. Listed beloware items and amounts taken from the company’s consolidated accounts for the year to 31 December20x2. All amounts are in millions of US dollars. (Note that not all items listed are drawn from theincome statement.)
Financial income, net of financial expense 147Share premium 1,026Cost of goods sold 2,392Licence fees and other operating income 347Trade receivables 1,553Research and development costs 1,588Sales revenue 9,510Investment income 20Employee costs payable 430Provision for deferred tax 543Sales and distribution costs 2,886Administration expenses 746Corporate income tax 866Work-in-progress 1,072
Required
(a) Prepare a multiple-step income statement for Banting Corporation for calendar year 20x2, show-ing separately gross profit, operating profit, profit before tax and net profit.
(b) Comment on Banting Corporation’s cost structure in 20x2. What is unusual about it?
Check figure:(a) Net profit 1,546
P3.8 Basic profitability ratiosGrupo Inditex is a fast-growing Spanish-owned clothing retailer. Its leading store brand is Zara but itowns several other well-known chains – Massimo Dutti, Pull & Bear, Bershka, Stradivarius. At the endof 2001, the group had almost 1,300 stores in 39 countries. Inditex launched an initial public offeringof its shares in May 2001. By the end of the financial year (31 January 2002), the share price had risen45% above the issue price and the company’s market capitalisation was A13.8 billion.
Set out in Exhibit 3.10 are income statements and balance sheets condensed from those reportedin the group’s 2000 and 2001 accounts.
CHAPTER 3 • THE INCOME STATEMENT 61
CFA_C03.qxd 11/6/03 2:16 PM Page 61

62 PART 1 • FOUNDATIONS
Required
(a) Calculate the following ratios for Grupo Inditex in 2001 (year to 31 January 2002):(i) gross profit-to-sales ratio;(ii) net profit-to-sales ratio;(iii) assets turnover;(iv) return on assets;(v) return on equity.
(b) Grupo Inditex reported improved performance in 2001 on the following measures of profitability:profit margin ratio, ROA and ROE. However, the scale of improvement differed across the variousmeasures. For example, ROA was 19.6%, and ROE 25.1%, in 2000 (year to 31 January 2001).From the information in Exhibit 3.10, identify one or more reasons why the increase in ROA rosefaster than the increase in ROE between 2000 and 2001.
Grupo InditexCONDENSED INCOME STATEMENTS AND BALANCE SHEETS
from 2001 and 2000 consolidated accounts(amounts in A million)
Consolidated income statement for year to 31 January: 2002 2001
Net sales 3,249.8 2,614.7Cost of sales –1,563.1 –1,277.0
Gross profit 1,686.7 1,337.7Other operating expenses –1,169.2 –957.8
Operating income 517.5 379.9Net financial expense –21.3 –13.7Exceptional items –1.1 +2.6
Profit before tax 495.1 368.8Taxes –149.9 –106.9
Profit after tax 345.2 261.9Minority interests –4.8 –2.7
Net profit 340.4 259.2
Consolidated balance sheet at 31 January 2002 2001 2000
AssetsCurrent assets 853.7 600.3 481.9Fixed assets 1,751.3 1,507.3 1,291.0
Total assets 2,605.0 2,107.6 1,772.9
Liabilities and shareholders’ equityCurrent liabilities 834.2 670.3 551.7Long-term liabilities 263.5 255.1 313.9Minority interests 21.1 11.3 14.1Shareholders’ equity 1,486.2 1,170.9 893.2
Total liabilities and shareholders’ equity 2,605.0 2,107.6 1,772.9
Exhibit 3.10
(Source: Grupo Inditex, Annual Report and Accounts 2000 and 2001.)
CFA_C03.qxd 11/6/03 2:16 PM Page 62

CHAPTER 3 • THE INCOME STATEMENT 63
Notes to Chapter 3
1 The cost of a firm’s equity capital depends in part on investors’ assessment of the risk of investing in thefirm. Standard finance textbooks show how to estimate this risk and derive equity capital’s cost.
2 The ROA calculation shown here is simplified. In practice, many analysts compute the numerator, oper-ating profit, on an after-tax basis since tax is a cost that a company making operating profits will bear.In addition, to make the denominator consistent with the numerator, analysts define it as ‘net operatingassets’ (i.e. operating assets less operating liabilities) since this is the capital that generates operatingprofits. We show in Chapter 19 (on financial statement analysis) how ROA is calculated under this moreprecise approach.
3 Equation (2) shows ‘gross’ value added. An alternative is to present value added ‘net’, that is afterdeducting depreciation, on the grounds that the fixed assets that are the source of depreciation are them-selves a purchased input. For a fuller discussion of this and other issues relating to the VAS, see Morley,M. (1979), The value added statement in Britain, The Accounting Review, 54(3): 618–629.
CFA_C03.qxd 11/6/03 2:16 PM Page 63

Accounting records: structure and terminology
INTRODUCTIONAccounting record-keeping is the theme of this chapter. In the previous twochapters, we used a worksheet to illustrate the effect of transactions on, first,balance sheet accounts and, then, income statement accounts. In practice,companies do not use a worksheet. Instead, they have developed over manyyears a ledger-based record-keeping system which is less cumbersome and hasbuilt-in checks to guard against error.
In the next two chapters, we’ll outline this system. In this chapter, we follow the record-keeping path from source documents through the journaland ledger to the trial balance; in Chapter 5, from trial balance to the actualfinancial statements. On the way we introduce accounting terms and expres-sions which are in everyday use in the business world and which we’llencounter often later in the book. We illustrate both the mechanics and theterminology of a ledger-based system by means of an example.
The manner of recording transactions, be it on a worksheet or in journalsand ledgers, doesn’t alter the basis of accounting. Both worksheet and ledger-based systems are double-entry accounting systems: all transactions arerecorded twice. Many small businesses, however, use a single-entry accountingsystem, which we describe briefly in the last section of the chapter.
44
l General ledger andledger accounts
l Format of ledgeraccount
l Journal and journalentry
l Trial balance
l Recording process:transaction to trialbalance
l Accountingrecord-keeping inEuropean companies
In this chapter
CFA_C04.qxd 11/6/03 2:18 PM Page 64

CHAPTER 4 • ACCOUNTING RECORDS: STRUCTURE AND TERMINOLOGY 65
The form of the account: worksheet and general ledger contrastedExhibit 4.1
The general ledger and ledger accounts
The problem with the worksheet approach to recording transactions is that, for most companies,it cannot cope with either the variety or the number of transactions to be processed. Accountingrecords have been invented to overcome both difficulties. We look at each in turn.
The more varied the activities of the company, the larger are the number of accounts needed.An account, you’ll recall, is a record which brings together, in monetary terms, all the transactionsand events which affect a particular asset, liability or category of owners’ equity. In our worksheet,each account is represented by a row. For a company where the number of accounts may wellnumber in the hundreds, use of a worksheet with one row per account is not realistic, certainlyin the absence of a computerised system. Accountants devised a system appropriate to the man-ual records then available. They assigned a separate document to each account.
What form did the document take? In essence, it was the page of a blank book. A company setup a ledger, a book specially designed to receive accounting information. One or more pages ofthe ledger were assigned to each account. The term ledger is still used. A company’s generalledger is the collection of its account documents (or ledger accounts), be they in the form ofpages of a book, cards or, most common today, computer files. Exhibit 4.1 contrasts the accountform in the worksheet and the general ledger.
The general ledger is a special kind of book. First, it’s expandable. As the company embarkson new activities, it may well have to establish new accounts – insert new pages in the book – toreflect a broader set of assets and liabilities. Moreover, new types of asset and liability arise as aresult of changes in business practice. Fifty years ago, the leasing of equipment in Europe wasrare. Twenty years ago, brand names were not considered accounting assets. Companies havecreated new ledger accounts in which to record transactions in leased assets, lease liabilities andbrand names.
Second, the ledger contains a detailed referencing system. Every company has a chart ofaccounts in which each type of asset, liability and owners’ equity is given a code number. Whenit initially records a transaction, it uses the code numbers to refer to the accounts affected. An
CFA_C04.qxd 11/6/03 2:18 PM Page 65

66 PART 1 • FOUNDATIONS
Group 1 Basic financing10. Capital11. Reserves...
Group 2 Fixed assets...22. Tangible fixed assets
220. Land and natural resources221. Buildings...
Group 5 Financial accounts...57. Treasury...
572. Banks . . . . , sight accounts, domestic...
Account codes: extract from Spanish National Chart of AccountsExhibit 4.2
extract from the Spanish national chart of accounts is set out in Exhibit 4.2. Thus, a Spanish firmthat buys land for cash uses codes 220 and 572 to record the increase in land and decrease in cashrespectively.
National charts of accounts are common in Continental Europe, especially in countriesinfluenced by French accounting practice. The aim is to standardise the accounting for and pre-sentation of financial transactions. This allows the government to compile statistics on the cor-porate sector that have a high degree of internal consistency. In some countries (e.g. Belgium,France), use of the chart and its coding system is mandatory. The chart and coding system arecontained in a national accounting plan that also lays down how companies are to value assetsand liabilities and present them in the financial statements. Other countries are more flexible.For example, Spanish companies must follow the valuation and presentation rules in thenational accounting plan but need not follow the coding system laid out in it. Where there is nonational accounting plan (e.g. north European countries, USA), individual companies devisetheir own charts of accounts.
Advocates of uniform account codes claim that since transactions are treated in the same way,firms’ accounts are likely to be more comparable. Opponents argue that a national code is lessflexible than a company-specific one which can be modified as the company’s environment –and the types of transactions it enters into – change. However, all agree on the merits of accountcoding. It makes it easier for management to record transactions and to trace them through theaccounting system. As a result, they can find and correct errors more quickly.
The format of a ledger account
All ledger accounts have a two-column format. Increases to the account are recorded in one col-umn, decreases in the other. It is a convention that increases in asset accounts are recorded in theleft-hand column. Similarly, by convention, increases in equity accounts (owners’ equity and liab-ilities) are recorded in the right-hand column. Thus decreases in asset accounts are shown in theright-hand column and decreases in equity accounts are shown in the left-hand column. Thesepoints are made pictorially in Exhibit 4.3.
CFA_C04.qxd 11/6/03 2:18 PM Page 66

CHAPTER 4 • ACCOUNTING RECORDS: STRUCTURE AND TERMINOLOGY 67
Notice how ledger accounts have a T format. It’s for this reason that they’re often referred toas T accounts.
Why record movements in equity accounts in the opposite way from movements in assetaccounts? Consider the balance sheet more closely. For it to balance, the balances on all ‘left-side’accounts (assets) must agree in total with the balances on all ‘right-side’ accounts (equities).Assigning asset increases to the left side of the ledger account and equity increases to the rightside ensures that assets carry a left-side balance and equities a right-side one. If the left-side/right-side equality is observed in each accounting transaction, then the sum of the asset balances should equal the sum of the equity balances. The link between account balances andbalance sheet is illustrated in Exhibit 4.4.
Balance sheet equation Assets (A) = Equities (L + OE)
Examples of Cash Bank loan Share capitalbalancesheet + − − + − +accounts
Format of balance sheet accountsExhibit 4.3
Link between account balances and balance sheetExhibit 4.4
CFA_C04.qxd 11/6/03 2:18 PM Page 67

68 PART 1 • FOUNDATIONS
Balance sheet, Owners’ equityowners’ equity (e.g. Retained profits)account:
− +
Examples Cost of sales Sales revenueof incomestatement − Corrections, +accounts: Expense is adjustments and Revenue is
decrease in OE closing entries increase in OE
Format of income statement accountsExhibit 4.5
The same convention applies to income statement accounts. You’ll recall from Chapter 3 thatwe showed Sun, C and Sand’s revenues and expenses in January as part of its ‘Profit or loss inJanuary’ account. The ledger system allows us to set up separate ledger accounts for each type of revenue and expense, rather than group them all in one account. Revenues being increases inowners’ equity are recorded in the right-hand column of the specific revenue account; expenses beingdecreases in owners’ equity are recorded in the left-hand column of the specific expense account.Exhibit 4.5 illustrates this. (The left-hand (right-hand) column of the revenue (expense) accountis used only for corrections, adjustments and closing entries.)
l Debit and credit: accounting shorthand
Accountants and managers use shorthand to indicate the left-hand side and right-hand side ofT accounts. In English, the term debit is used to indicate the left-hand side of a ledger account,credit to indicate the right-hand side. The abbreviations used are Dr. and Cr.1 The terms applyequally to asset and equity accounts:
Inventory Wages payable(Asset) (Liability)
Dr. Cr. Dr. Cr.(+) (−) (−) (+)
Thus the purchase of merchandise, an increase in the firm’s assets, is recorded as a debit toInventory. When wages earned are finally paid, a liability is reduced: the Wages payable accountis debited. (The terms ‘debit’ and ‘credit’ are very flexible: they can be used as noun, verb oradjective.)
Here’s a useful tip regarding the commercial usage of debit and credit. Should you refer toyour account when in correspondence with your bank, remember the account referred to is theone in its books. For example, the sum you ask your bank to ‘credit to your account’ is an addi-tion to its liability, ‘Customer deposits’, even though in your books it’s an addition to one ofyour assets, ‘Cash at bank’.
CFA_C04.qxd 11/6/03 2:18 PM Page 68

CHAPTER 4 • ACCOUNTING RECORDS: STRUCTURE AND TERMINOLOGY 69
The role of the journal in accounting recordsExhibit 4.6
Document Journal Ledger...
Journal (page) 45
Ledger Debit CreditDate Accounts ref. amount amount
Sales 8 May Accountsinvoice receivable,
customer A 430 5,000Revenuefrom sale 700 5,000
Customer Cash 572 3,000cheque Accounts
receivable,customer B 430 3,000
. . . .. . . .. . . .
430: Accounts receivable
Date Ref. Dr. Date Ref. Cr.
1/5 Balance xx
. . . . . .. . . . . .. . . . . .
8/5 J45 5,0008/5 J45 3,000
. . . . . .. . . . . .. . . . . .
Note:The ledger account ‘Accounts receivable’ is a master account. The sale to A and the cash receivedfrom B must also be recorded in the individual accounts the firm maintains for A and B. In this way,the firm knows the amount owed by each customer as well as the total receivables due.
...
The journal and the journal entry
We’ve seen how use of separate records for individual asset and equity accounts overcomes theproblem of the variety of such accounts. We turn now to the problem of the number of transac-tions and see what measures accountants take to deal with it.
Most companies have to record thousands of transactions each year. In some companies, thetransactions number in the millions. To keep track of individual transactions and reduce the riskof error, companies maintain a record of all transactions as they occur. The titles used for thisrecord – daybook, journal, ‘diario’ – underline the point that entries are made to it daily.
What does the journal look like? Exhibit 4.6 contains a specimen page from a journal used ina manual accounting system.
CFA_C04.qxd 11/6/03 2:18 PM Page 69

70 PART 1 • FOUNDATIONS
Two transactions are illustrated: the sale, on account, of goods priced at 5,000 to customer Aon 8 May; and the receipt, the same day, of 3,000 of cash from customer B with respect to a pre-vious credit sale. Observe that each transaction is recorded chronologically. Each entry containsdetails of the date of the transaction, the accounts affected and their code numbers, and the effectof the transaction on those accounts, by amount and direction (increase or decrease, using theDr./Cr. shorthand).
The key element within the journal is the individual journal entry. In fact, many managerswhen discussing the effect of a transaction on the accounts will usually do so in journal entryterms. A journal entry has the following format:
Date Account(s) debited Amount(s) debitedAccount(s) credited Amount(s) credited
Description of the transaction . . .
Although, in practice, entries to journals are more abbreviated (e.g. accounts may be referred toby code number only), they contain essentially the same information.
Note two fundamental features of every journal entry in a double-entry system. First, at leasttwo accounts are affected. Second, the amounts debited must equal the amounts credited, whetheron an individual entry basis or after grouping together many transactions of a similar type (e.g.the total of the day’s sales). Both features are also present when we use a worksheet approach toanalyse transactions. They’re necessary for the balance sheet to balance.
Consider the journal entry for the following purchase transaction. Kaufmann Company pur-chases 20,000 of merchandise from Venedor Company on 12 February year 7. It makes an ini-tial cash payment of 8,000 that day and agrees to pay the balance within 30 days. Kaufmannrecords the transaction in journal entry form as follows:
Dr. Cr.12/2/year 7Dr. Merchandise inventory (300) 20,000
Cr. Cash (572) 8,000Cr. Accounts payable, Venedor (400) 12,000
To record the purchase of 20,000 of merchandise fromVenedor, 8,000 in cash, 12,000 on credit
The journal entry states the date of the transaction, the accounts affected (including their codenumbers), and the amounts and direction (Dr./Cr.) by which they have changed. The explana-tion of the transaction is optional.
Use of a journal has several advantages. First, it reduces the incidence of error. Transactions are recorded with a minimum of delay. This means they are less likely to be overlooked or misrecorded. Another advantage is the easier tracking of transactions. Note how they are ref-erenced both in the journal and in the ledger. Exhibit 4.6 illustrates this. As a result, it is easierto follow the trail of transactions, whether from ledger account back to source document or fromsource document forward to ledger account. Errors, if they do arise, can be spotted morequickly.
A company using a manual-based accounting system may keep more than one journal. It mayestablish a separate journal for a particular type of transaction (e.g. sales, purchases, cashreceipts, cash payments).
The replacement of manual by computer-based accounting systems has changed the form ofrecord-keeping but not its substance. A computer file in which accounting transactions arerecorded as they occur is in effect a journal.
CFA_C04.qxd 11/6/03 2:18 PM Page 70

CHAPTER 4 • ACCOUNTING RECORDS: STRUCTURE AND TERMINOLOGY 71
l The journal and ledger accountsIn our example in Exhibit 4.6, we record the sale and cash receipt transactions in both the jour-nal and the relevant ledger accounts at the same time. This is what effectively takes place in acomputer-based system. A company codes each transaction so that, as details of the transactionare entered in the system, the ledger accounts are automatically updated. In a manual system,however, the ledger accounts are summary documents. The firm records individual transactionsin a journal and transfers totals – for example, of sales and cash receipts – to the relevant ledgeraccounts at periodic (e.g. weekly) intervals.
The trial balance
We’ve shown how transactions are first recorded in the journal and then posted to ledgeraccounts. We now examine the final step that’s taken, namely the drawing up of a trial balance,before financial statements are prepared.
The trial balance is a listing of the balances in all the general ledger accounts as of a particularday. To find the balance in a ledger account on a given day, the entries in the debit (left-handside) column are added and compared with the summed entries in the credit (right-hand side)column. Where the difference is a net debit balance (as with asset and expense accounts), thisamount is carried to the debit column of the trial balance. Similarly, net credit balances (fromliability, revenue and other capital accounts) are taken to the credit column of the trial balance.The layout of a typical trial balance is given in Exhibit 4.7.
Why do companies construct a trial balance at the end of the financial period? Why don’t theyprepare the income statement and balance sheet directly from the ledger accounts? The main
Trial balance at 31 December year 1
Debit Creditbalances balances
Ledger accounts:
Cash xxx...Inventory xxx...Equipment xxx...Accounts payable xxx...Share capital xxx...Sales revenue xxxCost of sales xxx...Utilities expense xxx...
Totals XXX XXX
The format of the trial balanceExhibit 4.7
CFA_C04.qxd 11/6/03 2:18 PM Page 71

72 PART 1 • FOUNDATIONS
The recording processExhibit 4.8
reason can be found in the name given to this listing of balances. It’s a trial balance. It providesa test of the accuracy of the company’s record-keeping. If one transaction alone – out of thethousands or possibly millions the company processes – does not balance, then the totals in thedebit and credit columns will not agree and the trial balance will not balance. Of course . . .
if the totals agree,this is no guaranteethe books are error-free.
(Sorry. The rhyme was unintended.) A transaction may have been misclassified (for example, anexpense account rather than an asset account is debited) or even totally omitted.
A company guards itself against record-keeping errors in several ways. First, it designs itsaccounting system so that there are built-in safeguards against certain kinds of error. For ex-ample, a retailer checks its till records against cash balances, cheques and credit card slips at leastdaily. A firm that sells goods or services on credit maintains a separate record of transactions –sales, returns and cash collected – for each customer. (This is known as the (subsidiary) salesledger.) The sum of the individual account receivable balances in the sales ledger is checked peri-odically against the overall account receivable balance in the general ledger. Second, comput-erised systems eliminate arithmetic error – although they do not prevent error at the point ofdata entry. Third, the accounting records of independent organisations with which the companydoes business (for example, statements from its bank and suppliers) are also used to check theaccuracy of its own records.2
Exhibit 4.8 summarises the major steps in the record-keeping process, from source documentto the drawing up of the trial balance.
CFA_C04.qxd 11/6/03 2:18 PM Page 72

CHAPTER 4 • ACCOUNTING RECORDS: STRUCTURE AND TERMINOLOGY 73
Out of Babel CompanyBalance sheet at 31 December year 1
(amounts in 000)
Assets Liabilities and shareholders’ equity
Current assets Current liabilitiesCash 11Accounts receivable 6 Accounts payable 2Supplies inventory 1Prepaid rent 8
26
Fixed assets Shareholders’ equityEquipment at cost 10 Share capital 30– Year 1 depreciation −2 Profit in year 1 2Equipment, net 8 32
Total liabilities andTotal assets 34 shareholders’ equity 34
Exhibit 4.9
The recording process: from transaction to trial balance
We now illustrate the points raised so far in this chapter. We use journal entries to record typ-ical transactions of a period in the ledger accounts of a fictitious company. At the end of theperiod, we transfer the balances in the ledger accounts to the company’s trial balance.
Sam Beckett and Carrie Blixen open a language school for business executives in mainlandEurope in year 1. They incorporate the school but have difficulty choosing a name for the com-pany. Putting hope before experience, they call it ‘Out of Babel’. The balance sheet which thecompany issues at the end of its first year of operations is set out in Exhibit 4.9.
The balances in the ledger accounts at the end of year 1, from which the balance sheet at 31 December has been prepared, are also the balances at the start of year 2. The company’s ledger accounts with their opening year 2 balances are shown in T account form in Exhibit 4.10.
The transactions the company records in its accounts in year 2 are described in summaryform below. We show the journal entry corresponding to each of the transactions and then postthe amounts to the ledger accounts (Exhibits 4.10–4.12).
CFA_C04.qxd 11/6/03 2:18 PM Page 73

1 The company decides to expand its facilities. Before buying new equipment, it issues newshares to investors in mid-year 2 for 10,000 in cash and borrows 15,000 from a bank. The loanis for one year and interest at a 12% annual rate is payable when the loan matures.
Journal entry (1)Dr. Cash (Asset +) 25,000
Cr. Share capital (Owners’ equity +) 10,000Cr. Bank loan (Liabilities +) 15,000
DiscussionThe company raises cash (debit to ‘Cash’) by issuing shares (an increase in owners’ equity, hencethe credit to ‘Share capital’) and by borrowing money (an increase in a liability, hence the creditto a new account, ‘Bank loan’). (The amounts are posted to the ledger accounts using the refer-ence (1). All later entries are referenced in this way.)
2 The company invests the cash raised in (1) in new equipment costing 25,000.
Journal entry (2)Dr. Equipment (A+) 25,000
Cr. Cash (A−) 25,000
DiscussionThe company buys equipment for cash. The increase in one asset – the debit to ‘Equipment’ – ismatched by a decrease in another – the credit to ‘Cash’.
3 The company earns 80,000 in fee revenues from short language courses during the year.Companies which sponsor students (35,000 of revenues) are granted a credit period of 30 daysbefore payment is due. Non-sponsored students (45,000 of revenues) pay in cash when register-ing for the course.
Journal entry (3)Dr. Accounts receivable (A+) 35,000Dr. Cash (A+) 45,000
Cr. Revenue from tuition fees (OE+) 80,000
DiscussionThe company earns fee revenues which it recognises in its accounts. Revenues represent anincrease in owners’ equity: hence the credit to the income statement account, ‘Revenue fromtuition fees’. They also represent an inflow of net assets. In this case, the company receives cashand claims to cash: hence the debits to ‘Cash’ and ‘Accounts receivable’.
74 PART 1 • FOUNDATIONS
CFA_C04.qxd 11/6/03 2:18 PM Page 74

Exhibit 4.10
CHAPTER 4 • ACCOUNTING RECORDS: STRUCTURE AND TERMINOLOGY 75
Out of Babel CompanyLEDGER ACCOUNTS
Recording of journal entries (1) to (3)(all amounts in 000)
Assets Liabilities Owners’ equity
Cash Accounts payable Share capital
Dr. Cr. Dr. Cr. Dr. Cr.1/1 11 1/1 2 1/1 30(1) 25 (2) 25 (1) 10(3) 45
Bank loan Profit in year 1
Dr. Cr. Dr. Cr.(1) 15 1/1 2
Accounts receivable
Dr. Cr.1/1 6(3) 35
Supplies inventory
Dr. Cr.1/1 1
Prepaid rent
Dr. Cr.1/1 8
Equipment (net)
Dr. Cr.1/1 8(2) 25
Income statement account
Revenue from fees
Dr. Cr.(3) 80
CFA_C04.qxd 11/6/03 2:18 PM Page 75

4 The company buys 6,000 of supplies on account during year 2.
Journal entry (4)Dr. Supplies inventory (A+) 6,000
Cr. Accounts payable (L+) 6,000
DiscussionBy purchasing supplies, the company acquires an asset: hence the debit to ‘Supplies inventory’.Because the goods are bought on account, the company has a liability to the supplier: hence thecredit to ‘Accounts payable’.
5 The company receives 32,000 from other companies in payment of amounts owing for theiremployees’ tuition fees. Of this amount 6,000 relates to year 1 fees and 26,000 to year 2 fees.
Journal entry (5)Dr. Cash (A+) 32,000
Cr. Accounts receivable (A−) 32,000
DiscussionThe company receives cash in settlement of customers’ debts. An increase in one asset – the debitto ‘Cash’ – is matched by a decrease in another – the credit to ‘Accounts receivable’.
6 The company pays 5,000 to suppliers in payment of amounts owing for supplies purchased.Of this amount 2,000 is in payment of year 1 credit purchases and 3,000 in payment of year 2credit purchases.
Journal entry (6)Dr. Accounts payable (L−) 5,000
Cr. Cash (A−) 5,000
DiscussionThe company pays cash in settlement of its debts. The decrease in an asset – the credit to ‘Cash’– is equal to the decrease in a liability – the debit to ‘Accounts payable’.
7 Payments by the company for salaries in year 2 amount to 47,000. Salaries are paid monthlyand the final payment date is 24 December.
Journal entry (7)Dr. Salary expense (OE−) 47,000
Cr. Cash (A−) 47,000
DiscussionThe company recognises an expense for the cost of employees’ services in the period. Expensesrepresent a decrease in owners’ equity: hence the debit to ‘Salary expense’. They also representan outflow of net assets. In this case, ‘Cash’ decreases and the account is credited.
76 PART 1 • FOUNDATIONS
CFA_C04.qxd 11/6/03 2:18 PM Page 76

CHAPTER 4 • ACCOUNTING RECORDS: STRUCTURE AND TERMINOLOGY 77
Exhibit 4.11 Out of Babel CompanyLEDGER ACCOUNTS
Recording of journal entries (4) to (7)(all amounts in 000)
Assets Liabilities Owners’ equity
Cash Accounts payable Share capital
Dr. Cr. Dr. Cr. Dr. Cr.1/1 11 1/1 2 1/1 30(1) 25 (2) 25 (6) 5 (4) 6 (1) 10(3) 45 (6) 5(5) 32 (7) 47
Bank loan Profit in year 1
Dr. Cr. Dr. Cr.(1) 15 1/1 2
Accounts receivable
Dr. Cr.1/1 6(3) 35 (5) 32
Supplies inventory
Dr. Cr.1/1 1(4) 6
Prepaid rent
Dr. Cr.1/1 8
Equipment (net)
Dr. Cr.1/1 8(2) 25
Income statement account
Revenue from fees
Dr. Cr.(3) 80
Salary expense
Dr. Cr.(7) 47
CFA_C04.qxd 11/6/03 2:18 PM Page 77

8 The costs of telephone, electricity and water total 7,000 in year 2 and all bills are paid by thecompany by year-end.
Journal entry (8)Dr. Utilities expense (OE−) 7,000
Cr. Cash (A−) 7,000
DiscussionThis journal entry summarises utilities-related transactions in year 2. It is similar to (7). Thesame reasoning applies.
9 In September, the company launches a nine-month three-term language course, to run fromOctober year 2 to the end of June year 3. Students have the option of paying for the whole coursein advance at a discounted price. The new course and the special payment terms are popular. Thecompany receives 18,000 by early October as advance payment for the course.
Journal entry (9)Dr. Cash (A+) 18,000
Cr. Unearned fee revenue (L+) 18,000
DiscussionThe company receives cash for services it promises to perform in the future. ‘Cash’ is debited. Aliability, the obligation to provide tuition services, is incurred: hence the credit to ‘Unearned feerevenue’.
10 At the beginning of November, the company invests 24,000 in short-term securities. This iscash which is surplus to its operating needs. The securities bear interest at an annual rate of 10%.Interest is receivable on maturity on 1 May year 3.
Journal entry (10)Dr. Short-term investment (A+) 24,000
Cr. Cash (A−) 24,000
DiscussionThe company acquires one asset with another. The increase in (debit to) ‘Short-term investment’is offset by a decrease in (credit to) ‘Cash’.
78 PART 1 • FOUNDATIONS
CFA_C04.qxd 11/6/03 2:18 PM Page 78

CHAPTER 4 • ACCOUNTING RECORDS: STRUCTURE AND TERMINOLOGY 79
Exhibit 4.12 Out of Babel CompanyLEDGER ACCOUNTS
Recording of journal entries (8) to (10)and calculation of provisional balances
(all amounts in 000)
Assets Liabilities Owners’ equity
Cash Accounts payable Share capital
Dr. Cr. Dr. Cr. Dr. Cr.1/1 11 1/1 2 1/1 30(1) 25 (2) 25 (6) 5 (4) 6 (1) 10(3) 45 (6) 5 31/12 3 31/12 40(5) 32 (7) 47(9) 18 (8) 7 Bank loan Profit in year 1
(10) 2431/12 23 Dr. Cr. Dr. Cr.
(1) 15 1/1 2Short-term investment 31/12 15 31/12 2
Dr. Cr.(10) 24 Unearned fee revenue31/12 24
Dr. Cr.(9) 18
Accounts receivable 31/12 18
Dr. Cr.1/1 6(3) 35 (5) 3231/12 9
Supplies inventory
Dr. Cr.1/1 1(4) 631/12 7
Prepaid rent
Dr. Cr.1/1 831/12 8
Equipment (net)
Dr. Cr.1/1 8(2) 2531/12 33
Income statement accounts
Revenue from fees
Dr. Cr.(3) 8031/12 80
Salary expense
Dr. Cr.(7) 4731/12 47
Utilities expense
Dr. Cr.(8) 731/12 7
CFA_C04.qxd 11/6/03 2:18 PM Page 79

80 PART 1 • FOUNDATIONS
Out of Babel CompanyINITIAL TRIAL BALANCEat 31 December year 2
(all amounts in 000)
Debit Creditbalances balances
From balance sheet accounts:Cash 23Short-term investment 24Accounts receivable 9Supplies inventory 7Prepaid rent 8Equipment 33Bank loan 15Accounts payable 3Unearned fee revenue 18Share capital 40Profit in year 1 2
From income statement accounts:Revenue from fees 80Salaries expense 47Utilities expense 7
Totals 158 158
Exhibit 4.13
Exhibit 4.12 also shows the first step towards constructing the company’s year 2 accounts. Thedebit and credit columns of each ledger account are totalled and a provisional balance in eachaccount determined. The balances are then transferred to an initial trial balance, shown inExhibit 4.13. Happily for us, the sum of the debit balances in the trial balance agrees with thesum of the credit balances, so one source of error – the omission of part of a journal entry – hasbeen avoided.
This is only the first step. Before financial statements can be drawn up for year 2, we have toadjust the company’s accounts for the effect of ‘accounting events’ on its income and net assets.Accounting events give rise to revenues and expenses – and changes in assets and liabilities –which do not involve exchanges with parties outside the firm. Such adjustments to the accountsare known as accrual adjustments. We discuss how and when they are recorded in a company’sbooks in the next chapter.
Accounting record-keeping in European companies
The double-entry system described in this chapter has been the dominant method of account-ing record-keeping in large companies in Europe and elsewhere for at least 100 years (seeBox 4.1). However, it’s not the only method currently in use. The types of records European com-panies keep are largely a function of the scale and complexity of their operations. Governmentregulations also play a part.
CFA_C04.qxd 11/6/03 2:18 PM Page 80

l Small companies and single-entry accounting systemsLarge and medium-sized companies use a double-entry system. They find that, despite its cost,such a system enables them to control their operations better. The alternative, a single-entry sys-tem, is only used by very small businesses, where transactions are few in number and most ofthem involve the receipt or payment of cash. The principal accounting record under a single-entry system is the cash book. The cash book is so designed that receipts and payments can bebroken down by type. Exhibit 4.14 shows in outline the payments page of the cash book of asmall service company.
A company can still prepare an income statement and balance sheet if it uses a single-entrysystem. At periodic intervals, say once a year, it takes an inventory (i.e. a count) of all its assetsand liabilities. To calculate the year’s sales revenue and cost of sales, it adjusts operating receiptsand payments for the change in accounts receivable, accounts payable and inventory over theyear. Other income and expenses are derived in the same way.
For example, suppose Elbegast Company wishes to prepare an income statement for year 9.It recorded cash receipts of 15,000 that year – from cash sales and from collections of its small
CHAPTER 4 • ACCOUNTING RECORDS: STRUCTURE AND TERMINOLOGY 81
Luca Pacioli, double-entry bookkeeping and capitalismBOX4.1
The origins of the double-entry system of bookkeeping are a mystery. Surviving account booksof merchants in Florence, Genoa and Venice show that double-entry records were in use inthese cities by the early fourteenth century. However, the first full exposition of the double-entry system did not appear until 1494 with the publication in Venice of Luca Pacioli’s Summade Arithmetica, Geometria, Proportioni et Proportionalita. Pacioli was a mathematician, and asthe title suggests, Summa is in large part a mathematical treatise. However, in keeping with thespirit of the place and age – this was Renaissance Italy – Pacioli included in the book a sectionon commercial bookkeeping that contains the essential features of the double-entry system aswe know it today. It’s for this reason that he is known as the ‘father of modern accounting’.3
The double-entry system began to be used at the same time that capitalism, in its mercant-ile, pre-industrial form, took hold. During this phase of capitalism (1300–1750), merchantsinvested capital in goods, sold them for cash and then reinvested the proceeds in more goods.Since manufacturing was not factory-based, there was little investment in plant. Some eco-nomic historians – Werner Sombart is the best known – have argued that the double-entry sys-tem played a pivotal role in western Europe’s capitalist development in this era. They claimedit provided accurate, timely information about an enterprise’s profits and capital and thusmade possible the more efficient allocation of resources.
The evidence does not support this theory, however. Although Pacioli’s ideas were dissem-inated through texts on bookkeeping that appeared in Italy, Flanders, France, Germany andEngland in the first half of the sixteenth century, adoption of the double-entry system waspatchy. From the accounting records of the sixteenth, seventeenth and eighteenth centuriesthat survive, it appears that many business ventures in Europe (and North America) continuedto use a single-entry system. At that time, the capitalist was both owner and manager, his busi-ness was small in scale and he could judge its profitability from observation and changes in hiscash balance. The double-entry system only became popular in the nineteenth century duringthe industrial phase of capitalism when the size and complexity of business operationsincreased and the advantages of double entry – above all, its ability to process large numbersof transactions in an orderly way – began to be appreciated.4
CFA_C04.qxd 11/6/03 2:18 PM Page 81

number of accounts receivable. At 31 December year 8, a listing of unpaid customer invoicesrevealed an accounts receivable balance of 300. A similar exercise on 31 December year 9 revealsa balance of 800. Revenues from year 9 sales are therefore 15,500, as calculated below:
Sales revenue = Cash sales and + Increase in receipts from accounts receivablecredit customers (− Decrease in A/R)
= 15,000 + 500
The increase in receivables between the start and end of year 9 indicates that the company’s salesexceeded its cash receipts that year. If Elbegast’s receivables balance had declined, the decreasewould have been subtracted from cash receipts to arrive at sales revenues.
Using the same logic, expenses can be derived from operating expenditures. Calculating aretailing company’s cost of sales requires a further step. First, purchases of merchandise onaccount are derived from the movement in accounts payable:
Purchases on account = Cash payments to suppliers + Increase in accounts payablegranting credit (− Decrease in A/P)
Then the change in inventory over the year combined with purchase data yields the ‘cost of sales’figure:
Cost of sales = Purchases on account – Increase in inventory (and for cash) (+ Decrease in inventory)
We illustrate these accounting adjustments with data from our Elbegast Company. Assumethat it’s a retailer and buys all its merchandise on account. It recorded cash payments to sup-pliers (in its single-entry accounts) of 10,000 in year 9. At 31 December year 8, a listing of unpaidsupplier invoices showed an accounts payable balance of 900. A year later, unpaid supplierinvoices total 1,200. Elbegast carries out an inventory count at the end of each year. At end-year9, the company has merchandise costing 1,000 in inventory, up from 800 a year earlier. With thisinformation, management can derive Elbegast’s cost of sales for year 9.
82 PART 1 • FOUNDATIONS
Single-entry accounting system: cash payment record illustratedExhibit 4.14
CASH PAYMENTS
Analysis of expenditure Control
Date Ref. total Salaries* Supplies Utilities . . . Other**
...21/5 813 750 50 700 . . .23/5 814 115 115 28/5 815 1,300 1,300 . . . .. . . .. . . .
* May be further analysed, e.g. income tax withheld, social security deductions, net pay.** For irregular payments such as capital expenditures. Description is usually provided, e.g.
700 Office equipment.
CFA_C04.qxd 11/6/03 2:18 PM Page 82

Purchases on account = Payments + Increase in to suppliers accounts payable
= 10,000 + 300 = 10,300
Cost of sales = Purchases on account − Increase in(and for cash) inventory
= 10,300 − 200 = 10,100
The company’s cost of sales of 10,100 in year 9 is computed by adjusting cash payments to suppliers for the changes in accounts payable and merchandise inventory over the year. Notethat an increase in inventory indicates the company purchased more than it sold and is thereforesubtracted from the purchases figure to arrive at cost of sales.
l Computerisation of accounting recordsComputerisation of accounting records is now widespread. Software packages are available foreven the smallest business. The record-keeping framework, in particular the use of general andsubsidiary ledgers, is the same for both manual and computer-based systems.
Major advantages of computer-based records are the low marginal costs of storing informa-tion and the speed with which it can be accessed. Fast retrieval of data has led companies to pro-duce reports more frequently and in shorter time. The case of Cisco Systems, the US networkingequipment group, illustrates just how rapidly an efficient computerised system can yield informa-tion about a company’s operations. Cisco produces daily sales and profit reports – by region,product line, salesperson – for top management. It can also draw up group financial statementswithin a day of the end of the financial quarter.5
Companies have used low information storage costs to expand data gathering beyond thatrequired for accounting purposes. Consider the receivables ledger. A firm can store and retrievequickly not just general data about a customer’s account – recent credit sales and cash received– but also the content of each sales invoice. Details of which goods a customer has bought andwhen can then be used by other departments (e.g. the marketing department). What begins asan accounting information system becomes a general one.
The information exchanged between companies has also been computerised. Companies areabandoning paper documents and communicating with each other electronically. This processis known as ‘electronic data interchange’ – or EDI. Initially, EDI took place on proprietary networks owned by large IT companies. Increasingly, however, companies exchange data via theInternet. Among the early users of EDI were car manufacturers, pharmaceutical companies andlarge retailers. They order goods from suppliers – often on a ‘just-in-time’ basis – and receiveshipping and invoice information from them, all electronically. EDI offers several advantagesover paper documentation: faster information flows, fewer errors and – once the set-up costshave been recovered – lower bookkeeping costs. Storage and interest costs should also fall asinventories are reduced. Companies also employ EDI to convey non-financial information suchas sales volume forecasts and future sales promotions.
Some companies that use EDI ‘self-bill’, that is, they pay suppliers on the basis of informationin their own accounting system, rather than wait for receipt of an invoice. Commentators wonder whether EDI will lead eventually to the sharing of accounting systems. If a supplier canaccept self-billing by a customer, why should they not set up a common ledger account?
l Government regulation in EuropeEuropean companies are required by national law to maintain certain business records. One reasonis to enable the tax authorities to verify the information in a company’s financial statements and
CHAPTER 4 • ACCOUNTING RECORDS: STRUCTURE AND TERMINOLOGY 83
CFA_C04.qxd 11/6/03 2:18 PM Page 83

84 PART 1 • FOUNDATIONS
tax declarations. This applies to payroll taxes and value added tax as well as corporate incometaxes. In most EU member states, companies must keep key documents on file for at least sixyears and, in some (e.g. France, Germany), for up to ten years.
For the most part, the record-keeping burden imposed by governments is not onerous. Rarelyare companies required to keep more records than they would keep voluntarily as part of aneffective internal control system. The Dutch Civil Code, for example, requires companies tomaintain ‘proper books of account’. The Code does not specify which books must be maintained:the only stipulation is that they should be sufficient to produce the annual accounts required bylaw. French law is more specific. The required accounting records are a journal, general ledgerand a book of balances (similar to a trial balance).
Summary
Accounting record-keeping systems differ markedly across firms. A company’s size, the com-plexity of its business and the degree of computerisation of its records, these are some of the factors affecting the way it keeps track of its financial activities.
There are certain features which are common to double-entry record-keeping systems, however:
1 Companies operating such a system keep a chronological record of financial transactions asthey occur. This record, especially in its manual form, is referred to as a journal.
2 Financial transactions and accounting events are also recorded in a ledger. Each ledgeraccount contains a summary record of all the accounting transactions and events affecting aparticular asset, liability or category of shareholders’ equity. The aggregate of a company’sledger accounts is known as the general ledger.
3 Before a company prepares financial statements for a period, it constructs a trial balance. Thisis a listing of the balances in the ledger accounts. It acts as a check on the accuracy of the com-pany’s record-keeping process.
Managers and accountants employ certain terms when referring to the recording of transactionsin the journal and the posting of amounts to the ledger accounts. Debit (Dr.) is the term usedfor the left-hand side of an account; credit (Cr.) is the term used for the right-hand side. An entryto the left-hand side of the account signifies an increase (decrease) in an asset (equity). The debitand credit amounts for each entry to the journal (journal entry) must balance if the accounts forthe period are to balance.
Problem assignments
P4.1 Meaning of debit and creditThe Minister of Finance of Euroland announces the introduction of a 20% research and development(R&D) tax credit for all Euroland-based companies. Under the scheme, a company will receive a 20 cent reduction in its annual corporate income tax liability for every euro it spends on ‘qualifying’R&D in the year.
Required
(a) Show in outline the journal entries a (profitable) company makes to record:(i) its income tax liability for the year, without the R&D tax credit;(ii) the impact of the R&D tax credit on its income tax liability.
CFA_C04.qxd 11/6/03 2:18 PM Page 84

(b) A manager asks you: ‘How can a tax credit reduce our company’s tax liability? Credits representincreases in equities – therefore a tax credit should mean an increase in the tax we owe. Does thegovernment use the terms “debit” and “credit” in the opposite sense to the way we use them?’Explain the reason for the term ‘tax credit’ in this context.
P4.2 Record-keeping in community bartering schemesCommunity bartering schemes maintain books of account even though money is not used as amedium of exchange. People join such schemes out of conviction (they believe such schemes fostera sense of community) or out of necessity (they are unemployed and short of money). The FinancialTimes describes how one such scheme called ‘Lets’ (Local Exchange and Trading System) operatesin the UK.
To start up a Lets a group of people produce a directory of services offered. Each item is priced accord-ing to the local unit. In some schemes the unit is linked to an hourly standard. The beak (an example ofa local unit) is worth 10 minutes of labour.
Members of the schemes are given cheque books and a central record keeper debits or credits theiraccounts after each transaction.
(Rich, M. (1994), ‘How to barter a massage for didgeridoo expertise’, Financial Times, 27 August 1994)
Members of a Lets are encouraged to run up debts (‘go into debit’ is the phrase used). A co-ordinatorof a local scheme remarks to the Financial Times:
It is the people with large credits and no debits who let the system down. If people do a lot of work forother people but cannot think of anything they want, it creates a lot of people with large negative bal-ances who then become disinclined to trade.
(Ibid.)
Required
(a) Assume that a community bartering scheme has two members, A and B. B performs services forA. Show in outline how the scheme’s bookkeeper records this transaction – in the general ledgerand in the subsidiary ledger (i.e. the individual members’ accounts). Confirm that, by running upa debt, A has a debit balance.
(b) Comment on the coordinator’s observation that the people who let the system down are thosewith large credits and no debits. How can a community bartering scheme overcome this problem?
P4.3 Recording transactions by journal entries ICarmen opens a tabaquería in Seville in September. She records her initial investment of 10,000 inthe business as follows:
Cash Capital, Carmen
Dr. Cr. Dr. Cr.(1) 10,000 (1) 10,000
She asks your help in setting up additional accounts and recording the following transactions inSeptember:
2 The bank lends the company 7,500 at 8% annual interest.3 The tabaquería pays 4,800 in advance to the owner of the property for a six-month lease of the
shop space.4 It buys 12,000 of merchandise, 4,000 for cash, the rest on account.5 1,000 of the goods purchased on account are received spoilt and have to be discarded. The sup-
plier issues the company a credit note for this amount. (Remember: from the supplier’s point ofview, Carmen’s tabaquería is a debtor.)
6 The tabaquería sells merchandise costing 9,000 at an average mark-up on cost of two-thirds(66.67%), all for cash.
CHAPTER 4 • ACCOUNTING RECORDS: STRUCTURE AND TERMINOLOGY 85
CFA_C04.qxd 11/6/03 2:18 PM Page 85

7 It pays 6,000 of the amount owing to suppliers.8 Friends and well-wishers provide free advertising services (e.g. printing and distributing of
leaflets) which Carmen reckons would have cost the company 500.9 Her one assistant has earned one month’s salary of 1,500. Only two-thirds of this is paid by the
end of September.10 One month’s interest on the bank loan is paid.
Required
(a) Set up the accounts Carmen’s tabaquería must establish, based on the transactions listed above.
(b) Prepare the journal entries to record the transactions in September.
(c) Post the entries to the accounts.
P4.4 Journal entries, ledger posting and trial balanceAs we discovered in this chapter, Sam Beckett and Carrie Blixen have established a language schoolin mainland Europe. Listed below is a summary of the financial transactions and events that tookplace in year 1, the first year of the school’s operation.
1 The Out of Babel Company was formed in early January year 1. Beckett, Blixen and associatesinvested 30,000 in it.
2 The company leased premises for five years. It paid two years’ rent totalling 16,000 in advance inJanuary.
3 In the same month the company spent 10,000 in cash to acquire equipment for a language laboratory.
4 During the year 300 students enrolled at the school. They attended, on average, ten sessions at aper-session charge of 20. Of the total fees of 60,000, 40% came from students sponsored byorganisations which were billed for the tuition provided. The other 60% of students paid cash foreach session attended.
5 The company hired two language teachers during the year. Total salary payments in the yearamounted to 40,000. All year 1 teaching services were paid for by year-end.
6 The company bought supplies costing 4,000 on credit.7 Utility and miscellaneous expenses amounted to 5,000 in year 1. All were paid in cash by
31 December.8 Of the 24,000 owing to the company for sponsored students’ tuition, all but 6,000 was collected
by year-end.9 The company paid suppliers 2,000 of the amount it owed them.
Required
(a) Prepare journal entries to record each of the above transactions.
(b) Post the entries to the ledger accounts.
(c) Draw up a trial balance at 31 December year 1.
(d) Compare your trial balance with the end-year 1 balance sheet in Exhibit 4.9. What can you deduceabout the use of supplies in year 1 and the expected life of the equipment, from the comparison?
Check figure:(c) Total debit balances 92,000
P4.5 Derivation of revenues and expenses IAlain (‘Al’) Addin runs a shop in Brussels, specialising in the sale of handmade lamps from the Orient.He comes to you early in year 6 with the following balance sheets and extracts from his cash book.Addin wants to find out the annual income for year 5 from the shop’s activities and to determine theincome tax which will have to be paid (at the rate of 40%) on year 5 profits.
86 PART 1 • FOUNDATIONS
CFA_C04.qxd 11/6/03 2:18 PM Page 86

Balance sheets at start and end of year 5(amounts in 000)
1/1 31/12(provisional)
AssetsCash 15 26Accounts receivable 10 15Merchandise inventory 55 57Equipment, net of depreciation 25 27
Total assets 105 125
EquitiesAccounts payable for merchandise 14 19Share capital 60 60Retained profit 31 46
Total equities 105 125
(The 31 December balance sheet is provisional because the income tax liability for the year has notbeen established.)
Extracts from year 5 cash book (amounts in 000)
Cash sales +81Collections from credit customers +65Payments to suppliers of lamps −70Cash purchases of equipment −7Salaries and other operating outlays −58
There were no disposals of equipment in year 5. No taxes have yet been paid.
Required
Compute each of the following for year 5:
(a) revenue from credit sales;
(b) cost of lamps purchased (all purchased on account);
(c) cost of lamps sold;
(d) depreciation expense;
(e) before-tax profit;
(f) tax expense and liability for the year.
Check figure:Net profit 9
P4.6 Derivation of revenues and expenses II‘Rollers’ is a shop selling bicycles, skateboards, and rollerblades. Its balance sheets at the beginningand end of the first quarter of x7 are shown in Exhibit 4.15.
The owner of Rollers wants you to prepare an income statement for quarter 1, x7 (i.e. the threemonths to 31/3/x7). You ask to see the cash records. Unfortunately, there was a flood in the shop inMarch and, as a result, the cash records are incomplete. You find the following cash information(amounts are in thousands):
CHAPTER 4 • ACCOUNTING RECORDS: STRUCTURE AND TERMINOLOGY 87
CFA_C04.qxd 11/6/03 2:18 PM Page 87

Cash receipts Cash paymentsCash sales 94 Suppliers of merchandise 90Cash collected from credit sales 80 Salaries paid 52
Other expenses (including tax) 9Suppliers of equipment ?
The company made payments to suppliers of equipment but the total figure is lost. There are no othercash receipts or payments in the year.
Required
Compute each of the following for quarter 1, x7:
(a) sales revenue;
(b) cost of goods sold;
(c) salary expense;
(d) depreciation expense.
Check figures:Gross profit 72Net profit 8
P4.7 Recording transactions by journal entries IIRefer to P3.1. Set out in the problem are details of Datini SpA’s transactions in January x3.
Required
(a) Set up ledger accounts for Datini’s wholesale business.
(b) Prepare journal entries to record the transactions of the company in January x3.
(c) Post the amounts to the ledger accounts.
(Note: the balances in the accounts at the end of January should agree with the balances in the work-sheet you prepared for P3.1.)
88 PART 1 • FOUNDATIONS
Rollers CompanyBalance sheet at start- and end-quarter 1, x7
(amounts in 000)
Quarter 1, x7 Quarter 1, x7Start End Start End
Current assets Current liabilitiesCash 11 10 Accounts payable, Accounts receivable 63 56 merchandise suppliers 83 101Merchandise inventory 168 181 Salaries payable 14 6
242 247 97 107
Fixed assets Shareholders’ equityShop and equipment, Share capital 270 270
net of depreciation 240 253 Retained profits 115 123385 393
Total liabilities andTotal assets 482 500 shareholders’ equity 482 500
Exhibit 4.15
CFA_C04.qxd 11/6/03 2:18 PM Page 88

CHAPTER 4 • ACCOUNTING RECORDS: STRUCTURE AND TERMINOLOGY 89
P4.8 Errors in recording transactionsCharlie Cheeryble of Cheeryble Brothers and Company called Tim Linkinwater, the company controller,into his office one day. ‘This fellow, Nickleby, we’ve hired recently as an accountant – does he knowhis stuff? I’ve been looking through the journal and have come across some entries he’s made thatdon’t look quite right to me. Here, take a look.’ The following are the entries Cheeryble has circledwith his pen.
1 Dr. Cash 500Cr. Sales revenue 500
500 cash received from Customer B in settlement of her account.
2 Dr. Cost of sales 1,400Cr. Account payable, X 1,400
Purchase of merchandise on account at a cost of 1,400.
3 Dr. Bank loan 11,200Cr. Cash 11,200
Payment of 10,000 principal, together with total annual interest of 1,200, on maturity of a one-yearloan.
4 Dr. Bad debt expense 300Cr. Cash 300
Write-off of 300 balance of unpaid account of bankrupt customer H.
5 Dr. Account payable, X 200Cr. Gain on return of goods 200
Return of defective goods costing 200 to supplier, who gives full credit for them. Cheeryble has not yet paid for them.
6 Dr. Wage expense 250Cr. Wages payable 250
250 promised by Cheeryble to family of sick worker.
Required
Help Tim Linkinwater. What is the entry that he must make in each case in order to correct any errorof Nickleby’s?
Notes to Chapter 4
1 Dr. is the abbreviation for ‘debitor’ (later shortened to ‘debtor’) and Cr. ‘creditor’. For merchants andbanking houses that were the first users of double-entry bookkeeping, receivables or ‘debtors’ (i.e.amounts owing by customers) were their principal asset. Showing debit balances on the left-hand sideof a ledger account is a convention that’s not observed everywhere. It’s customary among family busi-nesses in some parts of India to reverse the presentation and show debit balances (and by extension,asset balances on the balance sheet) on the right-hand side.
2 A company faces a trade-off when designing its accounting system. The more detailed the system, thelower the incidence of error (and the risk of fraud) but the more costly it is to run. These issues are dis-cussed at length in textbooks dealing exclusively with accounting system design.
3 Hatfield, H.R. (1950), An historical defence of bookkeeping, in Baxter, W.T. (ed.), Studies in Accounting,London: Sweet & Maxwell, p. 1.
4 Edwards, J.R. (1989), A History of Financial Accounting, London: Routledge, chapters 5 and 6.5 Taylor, R. (1999), Mind of the money tracker, Financial Times, 12 April. Cisco’s much lauded informa-
tion system did not give management advance warning of a build-up in inventories as sales slowed inthe winter of 2001, however. The company was forced to write down its stocks by $2.2 billion in Aprilthat year to reflect their lower market value.
CFA_C04.qxd 11/6/03 2:18 PM Page 89

Accrual adjustments andfinancial statement preparation
INTRODUCTIONThis is the second of two chapters dealing with the accounting cycle. In the lastchapter we looked at the accounting records within a double-entry system. In this chapter we focus on the final stages of the record-keeping process: the adjustments to the initial trial balance, the closing of income statementaccounts and the preparation of the income statement and balance sheet.
Adjustments are made to the initial trial balance to remove errors and toupdate the accounts for certain events which have an economic impact on thecompany in the period. We call the latter accrual adjustments. They are anessential part of accrual-based accounts. We start the chapter by remindingourselves of the key elements of accrual accounting.
We discuss several other topics in this chapter. We introduce a new type ofaccount, the contra (or offset) account, and show how and why it is used. Wealso take our first look at the accounting for dividends. A cash dividend is adistribution of profit – and corporate assets – to the owners of a company.Lastly, in the fourth of our ‘accounting fallacy’ series, we define the terms‘ordinary’ and ‘extraordinary’ as they are used in an accounting context and showwhy investors value ordinary profits more highly than extraordinary ones.
55
l Accrual basis ofaccounting
l Accrual adjustments
l Error adjustments
l Closing entries
l Recording process:trial balance tofinancialstatements
l Role of the contraaccount
l Dividends: thedistribution of profits
l Extraordinary itemsfallacy
In this chapter
CFA_C05.qxd 11/6/03 2:20 PM Page 90

CHAPTER 5 • ACCRUAL ADJUSTMENTS AND FINANCIAL STATEMENT PREPARATION 91
The accrual basis of accounting
The method of accounting we have outlined in the last three chapters is known as the accrualbasis of accounting. It’s the method of accounting most widely used by large and medium-sizedcompanies in Europe and elsewhere.
What is the aim of the accrual basis of accounting? It is simply this. A company’s financialstatements should reflect all transactions and events which have an economic impact on the firm in theperiod. A transaction or event can have an economic impact even when there has been no flowof cash to or from the firm. Thus ‘accrual basis’ means the recognition of the accounting effect of atransaction or event when it occurs – which may not be the same as when cash is received or paid.1
The accrual basis rests on two guidelines or ‘principles’: the revenue realisation principle andthe matching principle. The first governs the recognition of revenues, the second the recognitionof expenses.
According to the revenue realisation principle, a company recognises revenue only when theearning process is complete.2 Since this principle is concerned with the timing of revenues, it issometimes called the timing principle. The decision to recognise revenue is of crucial import-ance under the accrual basis because it also determines when the company recognises profit (orloss) on its operating activities. Under the matching principle, at the time the company recognisesrevenue, it recognises in the income statement the costs of generating that revenue. These matchedcosts are described as ‘expenses’. Revenue and expense recognition together determine howmuch profit a company reports in a period.
l Revenue recognitionIdentifying when the earning process is complete can be difficult. Consider the operating cycleof a typical manufacturing company. It consists usually of five stages. The company:
1 buys raw materials;2 transforms them into products by the addition of labour and capital;3 stores the finished products;4 delivers them to the customer; and5 receives cash for them, part of which it then reinvests in more materials.
Most of the value of the product is added during production (stage 2). Why then do most manufacturing companies delay recognition of revenue until delivery (stage 4)?
Accountants insist that a company should recognise revenue – from the sale of goods or rendering of services – only when certain conditions are met. Under international accountingstandards, these conditions are:
l The company is expected to receive economic benefits from the transaction.l It can measure reliably the revenues from the transaction and the related costs.
And, in the case of the sale of goods:
l It has transferred the significant risks and rewards of ownership to the buyer.
CFA_C05.qxd 11/6/03 2:20 PM Page 91

When these conditions are met, the earning process is considered complete.Manufacturing companies usually choose delivery (stage 4) as the revenue recognition point
because this is the earliest time when all three conditions are met. For most firms, even for thosethat manufacture to order, the risks of ownership are not transferred at the production stage.Note that some risks may still remain even after the firm has delivered the goods – for example,the risk of costs it may incur under a warranty agreement with the buyer – but they are usuallysmall and can be quantified.
In some industries where goods or services are supplied under a long-term contract (e.g.major projects in the construction industry), companies may recognise revenue during the courseof the production (stage 2). When such a contract is signed, the company knows the customerand the contract price. Assuming future costs are estimable, it can determine, with reasonableaccuracy, the profits earned at each stage of the contract. Thus it can recognise revenue and profiton a pro rata basis over the contract’s life.
A company may delay revenue recognition until it receives cash from the customer (stage 5).Suppose a company that invests in and trades real estate sells land to a property developer andagrees to be paid for it out of the proceeds of the development. The risk of non-payment may behigh and not quantifiable. As a result, at the time of delivery of the land significant risks remainwith the real estate company and it should not recognise revenue then.
We illustrate the effect on the accounts of these alternative recognition points in a later chapter.In this chapter, however, we assume that firms recognise revenue at the point of delivery (or performance, in the case of services).
l Expense recognition
When a company recognises revenue, it recognises as expenses the costs incurred in generatingthe revenue. How strictly is this matching principle applied? Do companies try to determine howmuch of, say, labour, depreciation or interest costs are attributable to individual sales? Theanswer is that matching is, in many instances, approximate.
Manufacturing companies do attempt to match production costs with units sold. We’ll see ina later chapter how they do this. However, their non-production costs (e.g. selling, administra-tion, financing) are rarely matched with revenue on a product basis. Instead, they’re matched ona time basis.
Selling costs (e.g. the salaries, equipment depreciation and utilities costs of the sales depart-ment) are charged to the income statement in the period they are incurred. The justification is thatthe efforts of the sales department help generate all the sales in a financial period and the benefitsof a more precise matching – on a product basis – are less than the costs of data collection andanalysis associated with it.
Practice in other industries varies. Retail and wholesale companies follow manufacturers in matching the cost of merchandise with each unit sold while other costs are charged againstrevenues on a periodic basis. In some sectors (e.g. banking), key sources of both revenue (e.g.interest revenue) and expense (interest expense) accrue on a time basis so that matching occursimplicitly.
Expenses are not always matched. Sometimes they are anticipated. For example, companiesprovide for expected future costs such as environmental liabilities. They also make provision for possible overstatement of assets: examples are adjustments to receivables for ‘doubtful’ debts and to inventories for slow-moving items. The underlying principle in these cases is thatof prudence. Under this principle, an expense is recognised as soon as a liability is incurred or apotential loss is sustained. Note that if prudence and the matching principle conflict, prudenceusually takes precedence.
92 PART 1 • FOUNDATIONS
CFA_C05.qxd 11/6/03 2:20 PM Page 92

CHAPTER 5 • ACCRUAL ADJUSTMENTS AND FINANCIAL STATEMENT PREPARATION 93
l Advantages of accrual basisInvestors use accounting numbers in deciding whether to invest in (or disinvest from) a com-pany. Such a decision involves valuing the company and valuation in turn requires investors tomake predictions about the company’s future cash flows. Empirical evidence indicates that anaccrual-based number, current earnings, generally provides more accurate predictions of futurecash flows than current cash flows.3 Why is this? The two accrual accounting principles – the revenue realisation and matching principles – are largely responsible for the better predictiveperformance of earnings. Cash-based accounting lacks such a framework. Current inflows ofcash are a poor predictor of future inflows because they may relate to economic events that havealready taken place (e.g. credit sales of an earlier period) or that have yet to occur (e.g. goods orservices to be supplied in a later period).
Accrual-based financial statements also encourage the improved allocation of resources. Byidentifying and recording an organisation’s assets, management can better determine the cost ofusing them. This should lead to more efficient use of the assets themselves (see Box 5.1).
The accrual basis and government accountsBOX5.1
Traditional government accounts are cash-based. They show receipts and expenditures only.Moreover, no distinction is made between capital and revenue expenditures. Outlays on bridgesand bureaucrats’ salaries are accounted for in the same way. A consequence of this is that thegovernment has no record of the resources it owns. This means that government departmentsthat use fixed assets such as motor vehicles and buildings are not aware of their cost (exceptfor their purchase price in the year of acquisition) and may use them inefficiently. In addition,certain government obligations are not recognised. One example is the liability for state pensions.These are accounted for on a pay-as-you-go basis. By not recording the liability today, the government risks underestimating payments it will have to make in the future to settle it.
Recently, governments have discovered the merits of accrual-based accounting. NewZealand led the way when its government adopted the ‘resource basis of accounting’ – theterm used in government circles for the accrual basis – in the 1980s. New Zealand made several important innovations. First, government accountants there distinguished ‘workingassets’ from Crown assets. Working assets are assets used by government departments or agencies in order to provide services to citizens (e.g. schools, hospitals, roads). Crown assetsare state-owned assets that have cultural value such as works of art, national monuments andnational parks. The second innovation was to attribute working assets to individual govern-ment departments and charge the departments for their use by means of depreciation andinterest charges. Since government departments had to pay these charges out of their budgets,they began to use the assets more efficiently, selling some they didn’t need and replacing others with less costly alternatives.
Other governments have followed New Zealand’s example and published accrual-basedbalance sheets. Few have yet introduced resource-based budgeting, however. Moreover, thereis continuing disagreement about what should be included as assets and liabilities in govern-ment accounts – and how to measure them. For example, are teachers’ salaries an expense of theyear – or does the outlay represent an investment because it yields benefits (a more productiveworkforce) in the future? How should land used by the army for training purposes be valued?At cost? Replacement value? Alternative use value? Governments face problems implementingthe accrual basis similar to those that companies encounter.
CFA_C05.qxd 11/6/03 2:20 PM Page 93

94 PART 1 • FOUNDATIONS
Accrual-based numbers have limitations, however. It may not be possible to implement therevenue realisation and matching principles as formulated. As we’ve seen, some costs cannot be matched on a product basis for practical reasons. Furthermore, accrual-based numbers rely on estimates made by management – estimates of the lives of depreciable assets or the collectibility of receivables, for example – and management may make inaccurate or misleadingestimates.
Accrual adjustments
It’s not just transactions which give rise to revenues and expenses under accrual accounting.Events occur which have an economic impact on the firm but which do not involve an exchangewith an individual or firm. Recall from Chapter 3 that the costs of generating Sun, C and Sand’sJanuary revenues include the use of shop space (rent expense) and equipment (depreciationexpense) in the month. In both cases, there is no transaction during January that signals the useof the asset. Similarly, revenue can be earned on interest-bearing investments even though, during the period, no cash is received.
By recording the effect of events such as the using up of assets, we adjust the accounts. Theassociated journal entries are therefore known as adjusting entries. Adjustments can be made as frequently as the company wishes – weekly or even daily if the informational benefits from up-to-date accounts exceed the marginal bookkeeping costs. It’s usual, however, to recordaccrual adjustments when the accounts are prepared at the end of a financial period, be it amonth, quarter or year. We follow this practice in this chapter.
Adjusting entries are of two types. First, there are those adjustments which reflect the passageof time. Then there are adjustments which reflect the expiry of an asset or liability. We look ateach type in turn.
l Passage-of-time adjustmentsConsider, for example, the cost of borrowed money. Interest on debt outstanding is usually paidat regular intervals – monthly, half-yearly or yearly. However, the cost of borrowing does notarise only when interest is paid. It is incurred (and the liability mounts up) day by day. Interestexpense, therefore, should not be recorded by the borrower only when interest is paid. It shouldbe recognised, along with the liability for unpaid interest, as time passes.
A similar process occurs in the books of the lender. Interest on a loan is received at regularintervals. But interest is earned on a daily basis. Thus the lender should recognise interest revenueand the accompanying asset, accrued interest receivable, with the passage of time.
Passage-of-time adjustments
Expense → Liability
Revenue → Asset
In both cases, the impetus for the adjustment comes from the need to recognise revenue orexpense. Recognition of a revenue or expense leads to recognition of a related asset or liability.
The following example illustrates the accrual process. On 31 October year 5, Verleiher AGlends Emprunteuse SA 15,000 for one year at an interest rate of 12%. Interest will be received
CFA_C05.qxd 11/6/03 2:20 PM Page 94

at the time of loan repayment. Verleiher’s financial year ends on 31 December. It makes the following entries in year 5:
31 October year 5Dr. Short-term investment (or loan receivable) (A+) 15,000
Cr. Cash (A−) 15,000To record a one-year loan to Emprunteuse SA at a 12% interest rate.
31 December year 5 (adjusting entry)Dr. Accrued interest receivable (A+) 300
Cr. Interest revenue (OE+) 300To record interest earned in the two months to 31 December year 5 (2/12 × (12% × 15,000)).
The adjusting entry on 31 December reflects the event, the earning of interest, that has occurredbetween 1 November and 31 December. If monthly accounts are prepared, an adjusting entrywill be made at the end of each month to recognise interest earned at the rate of 150/month. (We assume, for ease of calculation, a 30-day month, 360-day year.)
What happens in year 6? Assuming adjusting entries are not made monthly during year 6,Verleiher will record, on 31 October, the earning of interest in the first ten months and the collection of cash from Emprunteuse, as follows:
31 October year 6Dr. Cash (A+) 1,800
Cr. Interest revenue (OE+) 1,500Cr. Accrued interest receivable (A−) 300
To record interest earned in the ten months to 31 October year 6 and the receipt of oneyear’s interest on the Emprunteuse loan.
Dr. Cash (A+) 15,000Cr. Short-term investment (A−) 15,000
To record the collection of the principal on the Emprunteuse loan.
Notice that, although Verleiher collects one year’s interest of 1,800 on 31 October year 6, the com-pany earns only ten months’ interest in year 6. Under the accrual basis, the accounts reflect theeconomic impact of the loan each period: interest of 300 earned in year 5, interest of 1,500 earnedin year 6. The year’s interest collected on 31 October year 6 includes the three months’ accruedinterest at the end of year 5 – hence the credit to (reduction of ) ‘Accrued interest receivable’.
Let’s summarise. If, for the borrower, the date of interest payment does not coincide with the end of the financial period, it must make an adjustment to reflect the interest expense andliability that have accrued from the last payment date to the current balance sheet date. Similaradjustments must also be made for other time-based expenses (e.g. salaries and wages). Lendersmust also record an adjusting entry for interest earned between the last receipt date and theircurrent balance sheet date.
l Expiry-of-asset/liability adjustments
As we saw with the Sun, C and Sand Company, a firm can acquire resources which yield benefitsover several financial periods. These resources can be tangible fixed assets like equipment or services paid for in advance like prepaid rent.
How do such assets ‘expire’? Think of equipment or prepaid rent as a bundle of services. Overthe course of the asset’s useful life the company owning it will consume all these services in order
CHAPTER 5 • ACCRUAL ADJUSTMENTS AND FINANCIAL STATEMENT PREPARATION 95
CFA_C05.qxd 11/6/03 2:20 PM Page 95

96 PART 1 • FOUNDATIONS
to generate revenues. What a company records as expense in a period reflects management’sassessment of the portion of the asset’s total expected services which are consumed that period.Of course, the bundle of services has to be valued. Let’s assume it’s valued at the asset’s his-torical cost. Thus, if management reckon the company uses up, in the first year, 40% of the services from a piece of equipment and the cost of that equipment is 10,000, the depreciationexpense is 4,000 that year. The 4,000 is, in effect, the expired cost of the equipment in its first year.
Liabilities can expire, too. This occurs when a company fulfils an obligation it has incurred toprovide goods or services to customers. As the liability is satisfied – through the delivery of goodsor performance of services – revenue is earned and should be recognised in the company’saccounts.
Expiry-of-asset/liability adjustments
Asset → Expense
Liability → Revenue
A change in a balance sheet account provides the spur for this type of adjustment. Expiry of anasset or liability results in the recognition of an expense or revenue.
Again, an example helps make these ideas more concrete. In April year 8, Dueño SA rents a building to Tenant plc for one year. Tenant pays Dueño 24,000 in advance. The lease com-mences on 1 May. Dueño’s financial year ends on 31 December. Dueño records the cash receivedas follows:
30 April year 8Dr. Cash (A+) 24,000
Cr. Unearned rental revenue (L+) 24,000To record the advance receipt from Tenant of one year’s rent.
Note that no revenue is recognised by Dueño in April. By accepting the advance payment, Dueñohas incurred a liability in that month – to supply Tenant with a service, the use of a building, forone year from 1 May. As it performs this service each month, it fulfils part of its obligation andcan recognise rental revenue of 2,000. Unearned revenue becomes earned.
31 May year 8 (and monthly to 30/4/year 9) (adjusting entry)Dr. Unearned rental revenue (L−) 2,000
Cr. Rental revenue (OE+) 2,000To record the earning of one month’s revenue on Tenant’s lease.
If Dueño prepares financial statements only once a year and has a calendar year-end, then itwould make just one adjusting entry in year 8. This would reflect the earning of eight months’rental revenue to 31 December:
31 December year 8 (adjusting entry)Dr. Unearned rental revenue (L−) 16,000
Cr. Rental revenue (OE+) 16,000
Whether Dueño makes adjusting entries monthly or only at the end of its financial year, theeffect on its income statement is the same – revenue of 16,000 is recognised in year 8 and 8,000in year 9.
CFA_C05.qxd 11/6/03 2:20 PM Page 96

CHAPTER 5 • ACCRUAL ADJUSTMENTS AND FINANCIAL STATEMENT PREPARATION 97
Companies can use an alternative method of recording expiry adjustments, especially forassets and liabilities with short lives. They record the initial cash outlay (or receipt) as an expense(revenue) and adjust the expense (revenue) account at the financial statement date for the unexpired portion of the asset (liability). In the case of Dueño – and assuming only one adjust-ing entry is made at 31 December – the entries in year 8 would be:
30 April year 8Dr. Cash (A+) 24,000
Cr. Rental revenue (OE+) 24,000
31 December year 8 (adjusting entry)Dr. Rental revenue (OE−) 8,000
Cr. Unearned rental revenue (L+) 8,000To record as a liability the one-third of rent received but not yet earned.
Note that the effect on Dueño’s year 8 and year 9 financial statements is still the same. The com-pany recognises revenue of 16,000 in year 8 and 8,000 in year 9 with respect to this lease. Itrecords a current liability in its year 8 balance sheet for ‘deferred’ revenue.
One small but revealing point: the transactions and events that Dueño records are alsorecorded by Tenant – but from the point of view of the user of the building space rather than its supplier. The journal entries in Tenant’s books are the mirror image of those recorded byDueño. Dueño’s liability ‘Unearned rental revenue’ is Tenant’s asset ‘Prepaid rent’. As Dueño’sliability expires, so too does Tenant’s asset. Both make adjusting entries to recognise in one caserental revenue, in the other rental expense.
Dueño SA Tenant plc(amounts in 000) (amounts in 000)
[Dr.] [Cr.] [Dr.] [Cr.]
30 April year 8Cash 24 Prepaid rent 24
Unearned revenue 24 Cash 24
Adjusting entry at 31 December year 8Unearned revenue 16 Rent expense 16
Rental revenue 16 Prepaid rent 16
30 April year 9Unearned revenue 8 Rent expense 8
Rental revenue 8 Prepaid rent 8
In sum, passage-of-time and expiry-of-asset/liability adjustments are essential if a company’saccounts are to be accrual-based. They ensure that all revenues earned and all expenses incurredin a period are captured on the income statement. At the same time, the balance sheet is updated– and on a consistent basis. It shows assets and liabilities – accrued or unexpired – accounted for on the same basis as at previous balance sheet dates. The result is that, subject to the some-what restrictive assumptions companies make when recognising and valuing certain assets andliabilities (a topic we’ll explore in a later chapter), the financial statements reflect all events withan economic impact in the period.
CFA_C05.qxd 11/6/03 2:20 PM Page 97

98 PART 1 • FOUNDATIONS
Error adjustments
At the same time that accrual adjustments are being recorded, the trial balance is also being corrected for any errors in the accounts that have come to light.
Despite the best endeavours of accountants, errors can arise. Sometimes they are easy to see– for example, the trial balance does not balance – although it may be difficult to find the sourceof the error. There are occasions when they’re not easy to spot (e.g. self-balancing errors). Howcompanies identify accounting errors is not pursued here as it lies outside the scope of this book.Our concern is with the effect of errors on the accounts.
Errors in financial statements fall into two types. The first occurs within one financial statement, the within-statement error. It usually represents a misclassification of an asset or liability (for example, a short-term investment reported as a long-term one) or of a revenue orexpense (for example, a production cost classified as distribution expense). Although neither the ‘profit for the year’ nor the total asset figure is misstated, components of both these figures will be. For example, misclassification of production cost as distribution expense resultsin the overstatement of gross profit. This may convey a misleading signal about productprofitability.
The second – and more common – type of error is the between-statement error. It involvesboth the income statement and the balance sheet. Totals (e.g. profit for the year, total assets) aswell as components of the financial statements are misstated. For example, the failure to recordaccrued interest on debt leads to the overstatement of net income (through the understatementof interest expense) and net assets (through the understatement of a liability, accrued interestpayable).
Some between-statement errors are permanent: charging an expense against a contributedcapital account may go unnoticed throughout the company’s existence. Many such errors, how-ever, are self-correcting. In the case of short-term accruals, the error is likely to correct itself in the following period.
Consider this example. A company with a 31 December year-end borrows 100,000 on 1 Augustyear 1 for one year at an annual rate of 12%. It pays interest at the time of principal repay-ment on 31 July year 2. Exhibit 5.1 shows the effect on its year 1 and year 2 balance sheets of (1) accruing and (2) failing to accrue interest in year 1.
Failure to record interest expense in year 1 results in an overstatement of the company’s year1 profit and an understatement of its end-year 1 liabilities. When it pays interest in year 2 andrecognises a full year’s expense of 12,000, its income statement that year bears a double burden.By the same token, its net assets decrease in year 2 by more than they would have done if it hadrecorded the accrual correctly in year 1 (12,000 instead of the correct figure of 7,000). Over thetwo years together, however, the effect on its owners’ equity and net assets is the same, whetherit accrues interest in year 1 or not.
The self-correcting nature of many accounting errors should not make us complacent.Sometimes, as with misrecording of depreciation on long-lived assets, it may take many years forthe error to be corrected. More importantly, such errors in periodic financial statements can distort trends in company earnings and assets. They may undermine intercompany comparisonsof profitability and financial strength. As a result, they render financial statements less useful to investors.
CFA_C05.qxd 11/6/03 2:20 PM Page 98

CHAPTER 5 • ACCRUAL ADJUSTMENTS AND FINANCIAL STATEMENT PREPARATION 99
(1) Accrual of interest (2) No accrual of interest(amounts in 000) (amounts in 000)
OWNERS’ OWNERS’NET ASSETS = EQUITY NET ASSETS = EQUITY
Accrued Accruedinterest Interest interest Interest
Cash payable expense Cash payable expenseYear 131/12 − (+5) = −5 0 = 0
Year 231/7 −12 − (−5) = −7 −12 0 = −12
Combinedeffect, years −12 0 = −12 −12 0 = −121 and 2
Illustration of self-correcting error: failure to accrue interest on debtExhibit 5.1
Closing entries
With the trial balance updated by accrual adjustments and corrected for errors, we can now draw up the income statement and balance sheet for the period. At the end of its financial year,however, a company will take a further step: it will close its income statement accounts for the year.The overall profit or loss for the year is established and the end-of-year balance sheet can be prepared.
Why, at year-end, are income statement accounts closed but balance sheet accounts are not?The reason lies in the nature of the two types of account. From income statement accounts, welearn about a company’s performance during a particular financial year. We do not want eventsof, say, year 4 to be confused with those of year 3 or year 5. To ensure separation, revenue andexpense accounts are treated as temporary in nature. In effect, they are dated. Thus, at the endof its year 4 financial year, a company closes the year 4 revenue and expense accounts; at the startof year 5, it opens new accounts, that is year 5 revenue and expense accounts.
By contrast, balance sheet accounts tell us the state of the company on a particular day. Theprocess of updating the balances in asset and equity accounts for new transactions and eventscontinues each day for as long as the company is in existence. Since balances can be determinedeach and every day, the balance sheet accounts are permanent in nature.
The income statement accounts are closed to a balance sheet account. In Chapter 3, we calledthis owners’ equity account, ‘Profit or loss in the year’. The closing entries are straightforward.We take the totals in each of the revenue and gain accounts (e.g. sales revenue, interest revenue,gain on sale of buildings) to the owners’ equity account by debiting the revenue and gainaccounts and crediting ‘Profit or loss in the year’.
Similarly, we transfer the totals in each of the expense and loss accounts (e.g. cost of sales,depreciation expense, loss on disposal of investment) to ‘Profit or loss in the year’ by creditingthe income statement accounts and debiting the balance sheet account.
CFA_C05.qxd 11/6/03 2:20 PM Page 99

100 PART 1 • FOUNDATIONS
IllustrationLa Cenerentola, a company in the home cleaning business, has only two income statementaccounts, revenues from services and salaries expense. Revenues are 6,000 a month; salariesare 5,000 a month. At the end of year 1, the company makes the following closing entries.
Journal entriesDr. Cr.
31 Dec. Service revenues 72,000Profit or loss in year 1 72,000
Profit or loss in year 1 60,000Salaries expense 60,000
Ledger accountsOWNERS’ EQUITY
Salaries expense Service revenues
Dr. Cr. Dr. Cr.Jan. 5,000 To: To: Jan. 6,000
: : P/L P/L : :: : in in : :: : yr 1 60,000 yr 1 72,000 : :
Dec. 5,000 Dec. 6,000
Profit or loss in year 1
Dr. Cr.From: From:Salaries Serviceexpense 60,000 revenues 72,000
Balance,31/12/yr 1 12,000
As a result of closing the ‘Service revenues’ and ‘Salaries expense’ accounts, the companyfinds that it has made a profit of 12,000 in year 1 – represented by a credit balance of thatamount in the ‘Profit or loss in year 1’ account.
Closing of income statement accounts: journal entries and effect on ledger accountsExhibit 5.2
If total revenues and gains exceed total expenses and losses in the year, the balance sheetaccount, now shortened to ‘Profit in the year’, will have a credit balance. If revenues and gainsare less than expenses and losses, it will have a debit balance, a reduction in owners’ equity, andwill be reported in the balance sheet as ‘Loss in the year’. Exhibit 5.2 shows the procedure forclosing income statement accounts in both journal entry and T account form.
CFA_C05.qxd 11/6/03 2:20 PM Page 100

CHAPTER 5 • ACCRUAL ADJUSTMENTS AND FINANCIAL STATEMENT PREPARATION 101
Out of Babel CompanyInitial trial balance
at 31 December year 2(all amounts in 000)
Debit Creditbalances balances
From balance sheet accounts:Cash 23Short-term investment 24Accounts receivable 9Supplies inventory 7Prepaid rent 8Equipment 33Bank loan 15Accounts payable 3Unearned fee revenue 18Share capital 40Profit in year 1 2
From year 2 income statement accounts:Revenue from fees 80Salaries expense 47Utilities expense 7
Totals 158 158
Exhibit 5.3
The recording process: from trial balance to financial statements
It’s time to return to our mythical language school, Out of Babel Company. In Chapter 4, wetook leave of the company after having drawn up the initial trial balance at 31 December year 2,which is set out again in Exhibit 5.3 below.
The company’s ledger accounts – with their provisional balances at 31 December year 2, asshown in Exhibit 4.12 – are reproduced in Exhibit 5.4.
Inspection of the accounts in the trial balance reveals that adjustments must be made toreflect the passage of time and the partial expiry of certain assets and liabilities. Taking theaccounts in the order listed in the trial balance, we’ll
l explain the adjustments required;l show by journal entry which accounts are affected and by how much; and l post the adjustments to the ledger accounts, as set out in Exhibits 5.4 and 5.5.
The income statement accounts are then closed (Exhibit 5.6), the final trial balance for year 2drawn up (Exhibit 5.7), and financial statements for year 2 prepared (Exhibit 5.8). Let battlecommence!
CFA_C05.qxd 11/6/03 2:20 PM Page 101

l Adjustments to the accounts of Out of Babel Company
A1 Interest earnedInterest on the 24,000 of short-term securities the company acquires in early November year 2accrues at an annual rate of 10% or 200 a month. Since the company will not receive any interest until the investment matures at the end of April year 3, it records the interest earned inNovember and December as a receivable.
Journal entry (A1)Dr. Accrued interest receivable (A+) 400
Cr. Interest revenue (OE+) 400
A2 Supplies consumedAs a result of an inventory count on 31 December, the company discovers that only 3,000 of the 7,000 of supplies purchased remain in stock. Assuming no losses from theft or wastage, thismeans the company has consumed 4,000 of supplies. It records an expense of this amount in year 2:
Journal entry (A2)Dr. Supplies expense (OE−) 4,000
Cr. Supplies inventory (A−) 4,000
A3 Rent expenseThe company paid 16,000 for two years’ rent of its premises at the start of year 1. Half of theasset, ‘Prepaid rent’, expired in year 1. The company makes an adjustment at the end of year 2to record the expiry of the remaining half.
Journal entry (A3)Dr. Rent expense (OE−) 8,000
Cr. Prepaid rent (A−) 8,000
A4 Depreciation of equipmentThe company recognises a second year’s depreciation of 2,000 on the equipment it purchased(for 10,000) in year 1. In addition, it recognises depreciation on the equipment it bought for 25,000 in year 2. We assume this equipment also has an expected life of 5 years and the services from it will be the same each year. Since it was purchased in mid-year, only half a year’sdepreciation is charged in year 2. Thus total depreciation expense recognised in year 2 amountsto 4,500 (2,000 + (1/2 × 5,000)).
Journal entry (A4)Dr. Depreciation expense (OE−) 4,500
Cr. Equipment (A−) 4,500
The total cost of the two assets is 35,000. Accumulated depreciation charged to the end of year 2is 6,500. Thus at 31 December year 2, the equipment has a net book value of 28,500, the balanceshown in the equipment account then.
Exhibit 5.4 shows the posting of adjustments A1–A4 to Out of Babel’s ledger accounts.
102 PART 1 • FOUNDATIONS
CFA_C05.qxd 11/6/03 2:20 PM Page 102

CHAPTER 5 • ACCRUAL ADJUSTMENTS AND FINANCIAL STATEMENT PREPARATION 103
Exhibit 5.4 Out of Babel CompanyRecording of adjustments A1 to A4
at the end of year 2(all amounts in 000)
Assets Liabilities Owners’ equity
Cash Bank loan Share capital
PB 23 PB 15 PB 40
Accrued interestreceivable Accounts payable Profit in year 1
(A1) 0.4 PB 3 PB 2
Short-terminvestment Unearned fee revenue
PB 24 PB 18
Accounts receivable Year 2 incomestatement accounts
PB 9Revenue from fees
Supplies inventory PB 80
PB 7 (A2) 4
Salaries expense Interest revenuePrepaid rent
PB 47 (A1) 0.4PB 8 (A3) 8
Utilities expenseEquipment (net)
PB 7PB 33 (A4) 4.5
Supplies expense Depreciation expense
(A2) 4 (A4) 4.5
Rent expense
(A3) 8
Note: PB = Provisional balance at 31 December year 2.
CFA_C05.qxd 11/6/03 2:20 PM Page 103

A5 Interest incurredThe company borrowed 15,000 from the bank for one year on 1 July year 2. By 31 December, ithas had six months’ use of the money. The loan bears interest at an annual rate of 12%, payableon maturity. The company has incurred an expense and a liability (for unpaid interest) of 900by the end of year 2 (a monthly rate of 1% on 15,000 for six months).
Journal entry (A5)Dr. Interest expense (OE−) 900
Cr. Accrued interest payable (L+) 900
A6 Tuition fees earnedIn early October year 2, the company received in advance 18,000 of tuition fees for its nine-month language course. By the end of December, the company had earned one-third of the fees– and 6,000 of the 18,000 liability recognised in October has expired.
Journal entry (A6)Dr. Unearned fee revenue (L−) 6,000
Cr. Revenues from fees (OE+) 6,000
A7 Salary costs incurredThe last salary payment date in year 2 was 24 December. The company’s financial year does notend until 31 December. Given that employees earn salaries in the final week of the year, the com-pany must accrue the cost of the services they perform in that period. Its normal monthly wagebill is approximately 4,000. Assuming a four-week month, the company has to recognise anexpense and liability of 1,000 for salaries earned but not paid in the last week of year 2.
Journal entry (A7)Dr. Salaries expense (OE−) 1,000
Cr. Accrued salaries payable (L+) 1,000
Exhibit 5.5 shows the posting of adjustments A5–A7 to the company’s ledger accounts.
104 PART 1 • FOUNDATIONS
CFA_C05.qxd 11/6/03 2:20 PM Page 104

CHAPTER 5 • ACCRUAL ADJUSTMENTS AND FINANCIAL STATEMENT PREPARATION 105
Exhibit 5.5 Out of Babel CompanyRecording of adjustments A5 to A7
at the end of year 2(all amounts in 000)
Assets Liabilities Owners’ equity
Cash Bank loan Share capital
PB 23 PB 15 PB 40
Accrued interestreceivable Accounts payable Profit in year 1
(A1) 0.4 PB 3 PB 2
Short-term Unearned fee revenueinvestment
(A6) 6 PB 18PB 24
Accrued interestpayable
Accounts receivable Year 2 income(A5) 0.9 statement accounts
PB 9Accrued salaries Revenue from fees
payableSupplies inventory PB 80
(A7) 1 (A6) 6PB 7 (A2) 4
Prepaid rent Salaries expense Interest revenue
PB 8 (A3) 8 PB 47 (A1) 0.4(A7) 1
Equipment (net) Utilities expense
PB 33 (A4) 4.5 PB 7
Supplies expense Depreciation expense
(A2) 4 (A4) 4.5
Rent expense Interest expense
(A3) 8 (A5) 0.9
Note: PB = Provisional balance at 31 December year 2.
CFA_C05.qxd 11/6/03 2:20 PM Page 105

Note that the adjustments the company makes at the end of year 2 include all four types ofadjustment we identified earlier. The charges for depreciation, rent and supplies are examples ofthe consumption of an asset. The revenue earned on the tuition fees paid in advance is an exam-ple of the (partial) fulfilment of an obligation. The accrual of interest and salaries incurred aswell as the accrual of interest earned illustrate the effect of the passage of time on both liabilitiesand assets.
Assuming the company’s accounts are judged to be error-free, no further adjustments arenecessary. Given that this is the end of its financial year, the next steps are, first, to determine theadjusted ending balances in the ledger accounts and, next, to close the revenue and expense accounts.
The first step is straightforward. Each account’s adjusted ending balance is calculated byupdating the provisional balance for the accrual adjustments of the period. The second steprequires a new balance sheet account to be set up to which income statement accounts can beclosed. The company titles it ‘Profit or loss in year 2’. The company closes year 2 revenue andexpense accounts to this account in order to arrive at the profit or loss for the year. The closingentries are set out below.
Closing of year 2 revenue accounts at 31 December (C1)Dr. Revenue from tuition fees 86,000Dr. Interest revenue 400
Cr. Profit or loss in year 2 86,400(balance sheet account)
Closing of year 2 expense accounts at 31 December (C2)Dr. Profit or loss in year 2 72,400
(balance sheet account)Cr. Salary expense 48,000Cr. Utilities expense 7,000Cr. Depreciation expense 4,500Cr. Supplies expense 4,000Cr. Rent expense 8,000Cr. Interest expense 900
Exhibit 5.6 shows the calculation of the adjusted ending balances at the end of year 2 and theposting of the closing entries to the company’s ledger accounts.
The journal entries presented above are summary entries. Entries can be made to close indi-vidual revenue and expense accounts separately. Whichever method is used, the total of each rev-enue or expense account for the year is computed and transferred to ‘Profit or loss in the year’.
There are two important consequences of closure. First, the balance in each of the revenueand expense accounts is now zero. As a result, when Out of Babel Company records year 3 revenues and expenses, it will do so in new accounts. It will not mix year 3 results with those ofyear 2.
Second, the balance in the ‘Profit or loss in the year’ account indicates whether the companyhas made a profit or loss. In our example, the company’s revenues in year 2 exceed its expensesthat year. The credit balance of 14,000 in the ‘Profit or loss in year 2’ account indicates the profitwhich the company reports in its year 2 accounts.
106 PART 1 • FOUNDATIONS
CFA_C05.qxd 11/6/03 2:20 PM Page 106

CHAPTER 5 • ACCRUAL ADJUSTMENTS AND FINANCIAL STATEMENT PREPARATION 107
Exhibit 5.6 Out of Babel CompanyClosing income statement accounts and
computing ending balances at 31/12/year 2(all amounts in 000)
Assets Liabilities Owners’ equity
Cash Bank loan Share capital
EB 23 EB 15 EB 40
Short-term investment Accounts payable Profit in year 1
EB 24 EB 3 EB 2
Accrued interest receivable Unearned fee revenue Profit/loss in year 2
(A1) 0.4 (A6) 6 PB 18 (C2) 72.4 (C1) 86.4EB 0.4 EB 12 EB 14
Accrued interest Accounts receivable payable
Year 2 incomeEB 9 (A5) 0.9statement accountsEB 0.9
Accrued salaries Revenue from feesSupplies inventory payable
PB 80PB 7 (A2) 4 (A7) 1 (A6) 6 EB 3 EB 1 (C1) 86 EB 86
Prepaid rent Salaries expense Interest revenue
PB 8 (A3) 8 PB 47 (A1) 0.4EB 0 (A7) 1 (C1) 0.4 EB 0.4
EB 48 (C2) 48
Equipment (net) Utilities expense
PB 33 (A4) 4.5 EB 7 (C2) 7EB 28.5
Supplies expense Depreciation expense
(A2) 4 (A4) 4.5EB 4 (C2) 4 EB 4.5 (C2) 4.5
Rent expense Interest expense
(A3) 8 (A5) 0.9EB 8 (C2) 8 EB 0.9 (C2) 0.9
Notes: PB = Provisional balance at 31 December year 2.EB = (Adjusted) ending balance at 31 December year 2.
CFA_C05.qxd 11/6/03 2:20 PM Page 107

With the ending balances determined and income statement accounts closed, a final trial balance can be drawn up prior to preparing the company’s year 2 financial statements. We showin Exhibit 5.7 the final (or post-closing) trial balance and the link via adjusting and closing
108 PART 1 • FOUNDATIONS
Exhibit 5.7 Out of Babel CompanyEffect of adjusting and closing entries
on the trial balance at 31/12/year 2(all amounts in 000)
Initial Finaltrial Adjusting Closing trial
Account balance entries entries balance
Dr. Cr. Dr. Cr. Dr. Cr. Dr. Cr.
Cash 23 23Short-term
investment 24 24Accrued interest
receivable (A1) 0.4 0.4Accounts
receivable 9 9Supplies
inventory 7 (A2) 4 3Prepaid rent 8 (A3) 8 0Equipment 33 (A4) 4.5 28.5Bank loan 15 15Accrued interest
payable (A5) 0.9 0.9Accounts
payable 3 3Unearned fee
revenue 18 (A6) 6 12Accrued salaries
payable (A7) 1 1Share capital 40 40Profit in
year 1 2 2Profit/loss
in year 2 (C2) 72.4 (C1) 86.4 14
Fee revenue 80 (A6) 6 (C1) 86 0Interest revenue (A1) 0.4 (C1) 0.4 0Salaries expense 47 (A7) 1 (C2) 48 0Utilities expense 7 (C2) 7 0Depreciation expense (A4) 4.5 (C2) 4.5 0Supplies expense (A2) 4 (C2) 4 0Rent expense (A3) 8 (C2) 8 0Interest expense (A5) 0.9 (C2) 0.9 0
Totals 158 158 24.8 24.8 158.8 158.8 87.9 87.9
CFA_C05.qxd 11/6/03 2:20 PM Page 108

entries between it and the initial trial balance. An additional intermediate trial balance (e.g. afteradjustments have been made but before closing entries have been posted) can be drawn up toensure the adjusting entries have been correctly recorded.
Exhibit 5.8 contains the company’s income statement for year 2 and its balance sheet at 31 December year 2. Certain accounts have been combined to simplify presentation. For example, ‘Short-term investment’ includes accrued interest receivable on the investment.‘Retained earnings’ comprises the profits earned (and retained) by the company in both years 1 and 2.
CHAPTER 5 • ACCRUAL ADJUSTMENTS AND FINANCIAL STATEMENT PREPARATION 109
Out of Babel CompanyAnnual accounts for year 2
(all amounts in 000)
Income statement for year 2(1 January to 31 December)
Revenue from fees 86Operating expenses:Salaries 48Rent of premises 8Utilities 7Depreciation of equipment 4.5Supplies 4Less: Operating expenses −71.5Operating profit 14.5Interest expense 0.9Less: Interest revenue −0.4Less: Interest expense, net −0.5Profit for the year (before tax) 14.0
Balance sheetat 31 December year 2
Current assets Current liabilitiesCash 23 Bank loan (includingShort-term investment accrued interest) 15.9
(incl. accrued interest) 24.4 Accounts payable 3Accounts receivable 9 Fees received in advance 12Supplies inventory 3 Accrued salaries payable 1Total current assets 59.4 Total current liabilities 31.9
Fixed assets Shareholders’ equityEquipment at cost 35 Share capital 40Less: Accumulated Retained earnings 16
depreciation −6.5Total shareholders’ equity 56
Equipment, net 28.5
Total liabilities andTotal assets 87.9 shareholders’ equity 87.9
Exhibit 5.8
CFA_C05.qxd 11/6/03 2:20 PM Page 109

110 PART 1 • FOUNDATIONS
The role of the contra account
The presentation of ‘equipment’ in the balance sheet displayed in Exhibit 5.8 differs from itstreatment in the ledger accounts in Exhibits 5.4 to 5.6. In the ledger, we show the consumptionof the equipment (depreciation) as a direct reduction of the equipment account, in the same waythat we record consumption of prepaid rent and supplies. In practice, however, a separate recordis maintained for accumulated depreciation charges. It is known as a contra account (or offsetaccount).
A company employs a contra account when, for information reasons, it wishes to record (downward)adjustments to the value of an asset or liability separately. Consider the case of depreciable fixedassets. Managers and investors want to be able to distinguish any changes in the holdings of suchassets – through acquisitions and disposals – from the effects of wear and tear or obsolescenceon them.
In the case of depreciable fixed assets, the method chosen is to accumulate in a separate balance sheet account the depreciation charges on a particular fixed asset. Thus, instead of peri-odic depreciation charges on equipment being credited to the equipment account itself, they are credited to an account ‘Accumulated Depreciation – Equipment’ which offsets (is ‘contra’ to)the equipment account. (In their published accounts, companies group fixed assets and relatedaccumulated depreciation charges by category – e.g. buildings, equipment, vehicles – to simplifypresentation.)
Using the facts in our example, we set out in Exhibit 5.9 first the journal entries and then theeffect on the ledger accounts of both the ‘net’ approach (the method used up to now) and themore widely used ‘contra’ approach.
The contra account ‘Accumulated depreciation’ behaves like an equity account: increases in the account are recorded on the right-hand side (as credits), decreases on the left-hand side (asdebits). This is true of all contra-asset accounts. (By the same token, entries to contra-liabilityaccounts are recorded in the same manner as entries to asset accounts.)
The accumulated depreciation account is debited when the related asset is retired (i.e. sold or scrapped): then all accumulated depreciation on the asset disposed of must be removed from the account. For example, suppose that at the start of year 3 the equipment purchased in year 1is sold for its (depreciated) book amount of 6,000. The disposal will be entered in the journal asfollows (amounts in 000):
Net approach Contra approachDr. Cash (A+) 6
Dr. Cash (A+) 6Dr. Accumulated
Cr. Equipment (A–) 6 depreciation (CA–) 4 Cr. Equipment at
cost (A–) 10
Under the contra approach, the balance in the equipment account represents the cost of theasset throughout the holding period (assuming the asset is not revalued or written down). Thuswhen the company retires the asset, the equipment account is credited for its cost. Since theaccumulated depreciation account is debited for the total depreciation charged on this asset(4,000, or two years at 2,000 a year), the net effect is to reduce fixed assets by the net book value(6,000) of the asset disposed of. Thus the net and contra approaches have the same overallimpact on the accounts.
CFA_C05.qxd 11/6/03 2:20 PM Page 110

CHAPTER 5 • ACCRUAL ADJUSTMENTS AND FINANCIAL STATEMENT PREPARATION 111
FactsOut of Babel acquires for cash equipment costing 10 in year 1 (event 1) and 25 in year 2 (event 3). Depreciation expense is 2 in year 1 (event 2) and 4.5 in year 2 (event 4). (All amountsare in 000.)
Journal entries
Event Net approach Contra approachDr. Cr. Dr. Cr.
(1) Equipment (A+) 10 Equipment (A+) 10Cash (A−) 10 Cash (A−) 10
(2) Depreciation Depreciationexpense (OE−) 2 expense (OE−) 2
Equipment (A−) 2 Accumulateddepreciation (CA+) 2
(3) Equipment (A+) 25 Equipment (A+) 25Cash (A−) 25 Cash (A−) 25
(4) Depreciation Depreciationexpense (OE−) 4.5 expense (OE−) 4.5
Equipment (A−) 4.5 Accumulateddepreciation (CA+) 4.5
Note: CA = contra-asset.
T accounts – for equipment and related accounts
Net approach Contra approachEquipment, Accumulated
Equipment, net at cost depreciation
+ − + − − +Duringyear 1 (1) 10 (2) 2 (1) 10 (2) 2
Balance,end-year 1 8 10 2
Duringyear 2 (3) 25 (4) 4.5 (3) 25 (4) 4.5
Balance,end-year 2 28.5 35 6.5
Equipment, net 28.5
Accounting for depreciation: net and contra approaches contrastedExhibit 5.9
CFA_C05.qxd 11/6/03 2:20 PM Page 111

112 PART 1 • FOUNDATIONS
Dividends: the distribution of profits
The income number not only indicates how well the company has performed in the financialperiod under view: it also provides essential information to the board of directors when theyconsider what dividend should be paid to shareholders.
A dividend is normally a distribution of profit. The firm’s accumulated profits are its earnedcapital. Until profit has been determined, neither the directors who recommend the amount of the dividend nor the shareholders who, in general meeting, approve it can know whether the proposed dividend represents a distribution of earned capital or a return of contributed capital.
Consider the position of Out of Babel Company in year 2. Suppose that, as directors, SamBeckett and Carrie Blixen propose that the company pay a dividend of 14,000 to shareholders inyear 2. Until the financial statements have been prepared and the profit earned in year 2 has beendetermined, it is possible that a dividend of this magnitude would result in a return of part ofthe company’s contributed capital of 40,000.
From a legal and accounting standpoint, a dividend is an appropriation (allocation) of profit andnot an expense incurred in arriving at it. The company decides, at the annual general meeting of shareholders, how the profit for the year is to be allocated: how much must be set aside toreserves by law; how much will be retained in the business; and how much will be distributed to shareholders. From this perspective, the dividend is a discretionary payment to shareholders.Of course, in economic terms, a dividend represents, along with capital gains, the return a shareholder expects on his or her investment in the same way that interest is the return on thedebtholder’s investment. In this light, both dividends and interest are costs of doing business.But whereas the cost of debt capital is treated by accountants as an expense, the cost of equitycapital is never treated this way. There is no such thing as ‘dividend expense’.
The accounting for cash dividends reflects this. The dividend is charged against the profit for the year – or profits retained from previous years if the current year’s profit is insufficient (or the firm makes a loss). For example, suppose Out of Babel Company decides to distribute,as cash dividend, all of its year 2 profit, it will make the following entry at the date of paymentin, say, March year 3:
March year 3Dr. Profit in year 2 (OE−) 14,000
Cr. Cash (A−) 14,000
(In practice, a firm may record the dividend in a temporary owners’ equity account (‘Dividendin year xx’), which it closes to the balance sheet account ‘Profit/loss in year xx’ at year-end.)
A company can also distribute profits earned (and retained) in prior years. For example, Outof Babel can declare a year 2 dividend of up to 16,000, the total of its year 1 and year 2 reportedprofits, assuming the company’s statutes permit it.
March year 3Dr. Profit in year 2 (OE−) 14,000Dr. Profit in year 1 (OE−) 2,000
Cr. Cash (A−) 16,000
Companies following Anglo-Saxon accounting practice do not distinguish between profitsearned in the current year and profits brought forward from previous years. Both are combinedin one account ‘Retained earnings’, as we saw in Exhibit 5.8. In this case, the above journal entrywould read:
CFA_C05.qxd 11/6/03 2:20 PM Page 112

CHAPTER 5 • ACCRUAL ADJUSTMENTS AND FINANCIAL STATEMENT PREPARATION 113
March year 3Dr. Retained earnings (OE−) 16,000
Cr. Cash (A−) 16,000
l Dividends: the effect on corporate assets
Notice the credit side of the above journal entries. With the exception of a share dividend whereshareholders receive additional shares of the company in place of cash, a dividend represents adistribution of cash (or other corporate assets). That cash has alternative uses. It can be used torepay debt or to finance investments in plant and equipment. Thus a company may restrict theamount of its profits it pays out as dividends (its payout ratio) if management reckon – andshareholders agree – that there are other, more profitable ways of employing the cash.4
The restriction on profit – and cash – distribution may be externally imposed. In many Europeancountries, the government requires all public companies to transfer a percentage (usually 5%) of their annual profit to a legal reserve until a specified minimum balance in the reserve has been reached. Covenants in loan agreements may also place restrictions on the annual dividenda company can declare. Both measures are designed to protect the interests of creditors. Oncecorporate assets have been distributed to shareholders, they are no longer available to meet creditors’ claims.
We look more closely at the accounting for dividends – and alternative ways of distributingcorporate cash to shareholders – in a later chapter.
The extraordinary items fallacy
Accounting fallacy no. 4: ‘Extraordinary profits are more important than ordinary ones.’
In everyday speech, ‘extraordinary’ suggests something special. When an individual is referred toas ‘extraordinary’, we think of the person as being above the ordinary, rather than simply out ofthe ordinary. However, in accounting the term has a narrower meaning.
In Chapter 3, we defined a firm’s ordinary profit or loss as the profit or loss arising from its operations and other activities incidental to them. Thus the firm’s operations and relatedactivities (e.g. financing, investing) are its ‘ordinary activities’. It follows that extraordinary profitsor losses result from events that are distinct from the firm’s ordinary activities. Moreover, such eventsoccur infrequently and irregularly. For example, the loss which a company sustains when it sells afixed asset at an amount less than its book value is ordinary; the loss arising from earthquakedamage to its plant in southern France is extraordinary.
Investors prize recurring or ‘permanent’ profits. They estimate a company’s value by referenceto its current – and expected future – recurring profits. The most important source of recur-ring profit is the profit from its continuing operations which are part of its ordinary activities.Extraordinary profits, by definition, occur infrequently and irregularly. Investors view them astemporary and attach a lower value to them. Thus, for investors, extraordinary profits are lessimportant than ordinary ones.
The layout of the income statement reflects the relative importance of the various types ofprofit and loss. Although companies use different income statement formats (we illustrate theones found in EU and US company accounts in the next chapter), in most cases the incomestatement has the general structure shown in Exhibit 5.10.
The results of the firm’s operating activities (operating profit/loss) head the statement. Shownnext are income from investments (the result of investing activities) and interest income or expense(the net effect of financing activities). (The order here may be reversed: interest income/expense
CFA_C05.qxd 11/6/03 2:20 PM Page 113

114 PART 1 • FOUNDATIONS
Type of activity Income statement caption
Ordinary activities:
Operations Operating profit/loss
Investing + Investment incomeFinancing +/− Interest income/expense Other ordinary activities +/− Other gains/losses (e.g. gain or loss on sale
of fixed asset)
Profit/loss before tax
Tax cost of profits − Tax expense(Tax benefit of losses + Tax credit)
Total ordinary activities Net profit/loss from ordinary activities*Extraordinary events or transactions +/− Extraordinary gains/losses, net of tax
Ordinary and extraordinary activities Net profit/loss after extraordinary gains/losses
* In a consolidated income statement, this figure is shown after deducting ‘minority interests’ (outside shareholders’ share of the net profits/losses of subsidiaries).
General structure of income statementExhibit 5.10
may precede investment income.) ‘Other gains and losses’ are sometimes described as ‘exceptionalitems’ – to distinguish them from ‘extraordinary items’. Exceptional items are unusual or occurirregularly – but not both. They are treated as part of the firm’s ordinary activities.5
‘Net profit/loss from ordinary activities’ is a key number in the income statement. It’s used inprofitability ratios such as return on equity. It is sometimes referred to as ‘the bottom line’.Extraordinary gains and losses are shown beneath this figure – or ‘below the line’, as financialjournalists like to put it. Because the bottom line profit or loss is an after-tax figure, extra-ordinary gains and losses must be shown net of their associated tax cost or benefit.
The income statement is becoming more detailed. For example, under new internationalrules, companies must split the operating result between profits or losses from continuing operations and those from operations discontinued in the year. In some countries this is alreadyrequired under national rules. More confusingly, another recent innovation is the supplement-ary income statement, in which a company records certain gains and losses which otherwise it would book directly to its reserves in the balance sheet. We illustrate this statement in the next chapter.
Summary
In this chapter we completed the journey we began in Chapter 4. The accrual basis of accounting rests on timing and matching ‘principles’ or guidelines which
determine when revenues and expenses – and thus profit – are recognised.To prepare accrual-based accounts, a company makes accrual adjustments to the initial trial
balance at the end of a financial period. These adjustments capture accounting events such as the effect on the accounts of the passage of time and the expiry of assets and liabilities during the period. In addition, the company adjusts the trial balance for any errors it uncovers in theaccounts.
CFA_C05.qxd 11/6/03 2:20 PM Page 114

CHAPTER 5 • ACCRUAL ADJUSTMENTS AND FINANCIAL STATEMENT PREPARATION 115
At the end of the financial year, once it has updated the accounts and corrected any errors, itcloses the income statement accounts. This ensures that the profit or loss it reports is the resultof revenues and expenses arising in that year alone.
The record-keeping cycle, from source document to end-of-year financial statements, can besummarised as follows:
Source Trial Adjusting Financial document → Journal → Ledger → balance → and closing → statements
entries
We introduced a new type of account, the contra account. A company sets up a contraaccount when, for information reasons, it wants to record separately adjustments to the value of an asset or liability. We use the example of depreciation to illustrate how a contra accountworks.
We also looked at the accounting treatment of cash dividends. Two interesting points emergefrom the discussion. First, a dividend is, from a legal and accounting standpoint, a distributionof profit, not an expense incurred in arriving at it. Second, a cash dividend results in a reductionof corporate assets as well as owners’ capital. Thus creditors as well as shareholders are affectedby the company’s dividend decision. And the company’s own cash operating needs will influenceits payout policy.
Finally, we exposed the extraordinary items fallacy. A firm’s extraordinary activities are, froman accounting perspective, unusual and non-recurring. By contrast, its ordinary activities, inparticular its continuing operations, are the main source of its recurring profits and the basis ofits market value. Thus investors attach more importance to the profits arising from its ordinarythan its extraordinary activities.
Problem assignments
P5.1 Accrual adjustments and accounting recordsGovernments at local and national level are examining new ways of charging motorists directly forroad use. One proposal is based on an automatic vehicle identification (AVI) system. A device is fittedto a car’s windscreen which enables a radio signal from a roadside beacon to identify the car as it’smoving.
A problem for governments is how to collect the toll from the user of the vehicle in an efficient way.An individual may well drive cars other than the one(s) he or she owns. Two alternatives have beenproposed. The first is a ‘smart card’. An individual can get into any car, insert his smart card into adevice connected to the AVI and have the bill for road use charged to his account. He then settles hisaccount monthly or quarterly.
The second alternative is the prepaid card. The card entitles the buyer to a specified number of‘road use units’. It works in the same way as the smart card except that charges for road use arededucted directly while the card is in radio contact with the AVI. (As The Economist (7 August 1993)points out, one advantage of the prepaid card is that it is more private. There is no record of where aparticular driver has been and when.)
Required
Consider the accounting implications of the two charging methods for the company collecting theroad tolls. What are the balance sheet and income statement accounts it must set up in its books?Show the entries for road use and payment (not necessarily in that order) under the two methods.
CFA_C05.qxd 11/6/03 2:20 PM Page 115

P5.2 Accrual accounting and debt paymentsIn the 1990s, some of Poland’s fastest growing companies were former foreign trade organisa-tions (FTOs) which turned themselves into conglomerates. Keeping control of the finances of theirsubsidiaries proved a difficult task for top management. The chairman of one FTO/conglomerate,Universal, told The Economist (5 August 1995) that a subsidiary was able to show a profit in a periodonly because it skipped debt payments.
Required
Is the chairman’s statement (as reported) correct? What is the effect on a firm’s accounts if it fails tomake scheduled debt payments?
P5.3 Accrual adjustments I‘Autovalet’ is a successful chain of car cleaning centres. Some of the centres are owned by the com-pany while others operate under a franchise arrangement – where Autovalet is the franchisor and theproprietor of the centre is the franchisee. During x5 Autovalet enters into the following transactions.The company’s financial year ends on 31 December.
1 On 31 May, Autovalet loans 75,000 to a franchisee for two years at an annual interest rate of 8%.Under the agreement, the franchisee is to pay interest every six months and to repay the principalof 75,000 on 31 May x7.
2 Autovalet buys supplies costing 11,000 during the year. It has supplies costing 2,000 in inventoryat the end of x5. The year before (end x4), it had supplies costing 3,000 in inventory.
3 Autovalet receives 360,000 of advance fees from franchisees on 1 September x5, covering servicesit will render them in the year to 31 August x6. The services consist mainly of advertising and pro-moting the Autovalet brand and will be provided evenly over the year. The equivalent sum it receivedon 1 September x4, was 336,000.
4 As a result of expansion, Autovalet has to rent additional office space for its staff in x5. On 1 Marchx5, it enters into a contract with the owner of the office building and pays 135,000 for three years’rent in advance.
Required
Compute the following amounts Autovalet reports in its annual accounts for x5:
(a) interest income;
(b) supplies expense;
(c) unearned franchise fee revenue at 31 December;
(d) rent expense.
P5.4 Accrual adjustments IIWe learned about Sun, C and Sand in Chapters 2 and 3. The company’s balance sheet on 31 Januaryyear 1 – the end of its first month of operations – is set out in Exhibit 5.11.
Fred Chopin and Georgie Sand opened a bottle of Cava to celebrate the success of their store in January. February, by contrast, was a disaster. Unseasonably cool, wet weather kept the winter visitors away. Here’s what happened to the business that month:
1 The company made no sales of goods in February. Moreover, the customer who owed 4,000 atthe end of January also experienced business problems. After lengthy negotiations the customersigned a six-month note agreeing to pay, at the end of July, the principal of the note plus accruedinterest. Interest is to accrue from 1 February at the rate of 1.5% a month.
2 In desperation, Georgie started a monthly magazine for resident foreigners like herself. Remember-ing the Cava, she decided to call it ‘Grapevine’. The annual subscription was 24, payable in advance.Five hundred subscriptions were sold in February. The first issue came out at the end of February.
116 PART 1 • FOUNDATIONS
CFA_C05.qxd 11/6/03 2:20 PM Page 116

3 The magazine generated 750 of advertising revenue in February (although Sun, C and Sandreceived no cash from advertisers that month).
4 The costs of printing and distributing the magazine were 3/copy, all paid in cash during the month.5 Utility costs paid in February were 350, the same as in January.6 Payments in February to the part-time employee (whose duties now included writing a gossip col-
umn, Sotto voce, in the magazine) were 1,200, including 100 of unpaid January wages. In view ofhis additional duties, the wages earned by him in February were 1,350.
7 Despite the company’s operating difficulties, the amount owing to suppliers at 31 January waspaid in February. So too was February’s interest on the 10% bank loan.
8 Adjustments were made in the accounts for the use of shop space and equipment in the month.There were no other transactions or accounting events in February.
Required
(a) Prepare journal entries to record the above.
(b) Post the entries to ledger accounts.
(c) What is the company’s profit or loss in February?
Check figure: Cumulative profit at 28 February year 1 12,460
P5.5 Financial statement relationships
By coincidence, three separate companies report the same summary balance sheet at the end of year 4.
Assets = Liabilities + Shareholders’ equity105,000 = 50,000 + 55,000
CHAPTER 5 • ACCRUAL ADJUSTMENTS AND FINANCIAL STATEMENT PREPARATION 117
Sun, C and Sand CompanyBalance sheet at 31 January year 1
Current assets Current liabilitiesCash 35,550 Bank loan 12,000Accounts receivable 4,000 Accounts payable 5,000Inventory 1,000 Accrued wages payable 100Prepaid rent 4,000 Total 17,100
Total 44,550
Fixed assets Shareholders’ equity Shop equipment 9,000 Contributed capital 20,000Less: Accumulated Profit in January 16,200
depreciation –250 Total 36,200Net book value 8,750
Total liabilitiesTotal assets 53,300 and shareholders’ equity 53,300
Notes (see also Chapter 3):Equipment: Purchased early January; has expected useful life of three years.Prepaid rent: Three months’ rent of 6,000 paid at start of January.
Exhibit 5.11
CFA_C05.qxd 11/6/03 2:20 PM Page 117

Shareholders’ equity comprises share capital and retained earnings. End-year retained earnings areequal to start-year retained earnings adjusted for the profit/loss and dividend in the year:
REend = REstart +/− P/L − DIV
In other respects the accounts of the three companies diverge. Key figures have been taken fromtheir year 5 accounts. They are given below under columns 1, 2 and 3. As you can see, the accountsare incomplete.
Company(1) (2) (3)
Share capital, end year 5 25 (F) (K)Revenues in year 5 125 (G) 114Liabilities, end year 5 (A) 51 53Expenses in year 5 115 115 112Retained earnings, end year 4 (B) (H) (L)Assets, end year 5 110 (I) 111Dividend in year 5 (C) 2 3Share capital, end year 4 (D) 11 (M)Retained earnings, end year 5 36 39 42New investment by owners in year 5 0 (J) (N)Shareholders’ equity, end year 5 (E) 53 (P)
Required
Fill in the blanks which are letter-coded. (Amounts are in 000.)
P5.6 Effect of errors on the accountsIt’s early in x3. You are examining the financial records of Les Gaulois Company with a view to makingan (amicable) bid for the company. You discover that the company, formed in x1, has made the followingerrors in x1, perhaps because of its preoccupation with hostile manoeuvres by Les Romains Company.
In each case, determine the effect of the error on reported profit in x1 and x2 and on retained earn-ings at the end of x1 and x2, and indicate which other balance sheet accounts, if any, were in errorat the end of x1 and x2. Use the following notation: U (understated); O (overstated); NE (no effect).The solution to item 1 is given as an example (the ‘asterix’ is optional).
1 The company failed to accrue interest revenue in x1 on a loan it made to another company. Itreceives the interest (and the principal) in x2.
*InterestU O U NE receivable U NE
2 Employees earned salaries in x1 which the company did not record until x2 when the salaries werepaid.
3 The company purchased and received goods at the end of x1 but failed to make accounting entriesto record the (credit) purchase and receipt until January x2.
4 It neglected to record annual depreciation on equipment in x1. The annual depreciation charge inx2 was correctly recorded.
5 In x1 customers made payments of 2,000 in advance for Les Gaulois products. Of this, only 500worth of goods were shipped in that year (and the balance in x2). The company reported all 2,000as revenues of x1. (Cost of sales was correctly recorded in both years.)
6 The company purchased 1,200 of office supplies in x1 and recorded all of it as an expense of thatyear. A physical count of supplies revealed inventory of 700 and 100 at the end of x1 and x2respectively. There were no purchases of supplies in x2.
Other balance sheet accountsend-x end-x1 2
Retained earningsend-x end-x1 2
Profitx x1 2
118 PART 1 • FOUNDATIONS
CFA_C05.qxd 11/6/03 2:20 PM Page 118

P5.7 Derivation of balance sheetPoseidon Company specialises in the leasing of holiday apartments with boating facilities in theGreek islands. It has asked for your help. It’s January year 3, and there’s been a serious fire in itsadministrative offices. Many records have been destroyed. The company wants you to recon-struct the balance sheet at 31 December year 2. The balance sheet at the start of year 2 is avail-able, cash records for year 2 have escaped the fire and a copy of the year 2 income statement hasbeen discovered in the briefcase belonging to the managing director’s husband. Informationfrom these three items is set out in Exhibit 5.12.
CHAPTER 5 • ACCRUAL ADJUSTMENTS AND FINANCIAL STATEMENT PREPARATION 119
Poseidon CompanyExtracts from year 2 accounts
(amounts in 000)
Balance sheet at 1 January year 2
Assets EquitiesCash and short-term Rentals received in advance 24
investments 32 Utilities payable 3Property 828 Income tax payable 4Less: Accumulated Current liabilities 31
depreciation –192 Long-term loan 560636
Share capital 40Retained earnings 37Shareholders’ equity 77
Total assets 668 Total equities 668
Extracts from year 2 cash account
Cash receipts Cash paymentsDividend paid 4
Holiday rentals received 93 Salaries paid 12Interest received 2 Utilities paid 10Increase in long-term loan 50 Interest paid 48
Purchase of property 75Total receipts 145 Total payments 149
Income statement for year 2
Depreciation expense 14 Revenue from holiday rentals 96Salaries expense 13 Interest income from short-termUtilities expense 9 investments 3Interest expense 51Income tax expense 6
93Net profit 6
99 99
Exhibit 5.12
CFA_C05.qxd 11/6/03 2:20 PM Page 119

Required
Reconstruct Poseidon’s balance sheet at 31 December year 2.
Check figure:Total assets, 31/12/year 2 726
P5.8 Cash-based and accrual-based accounts comparedDaedalus runs a small airline. He keeps his records on a cash basis. Learning that you are a masterof the basics of accrual accounting (MBAA), he asks you to show him how the following items shouldbe accounted for on an accrual basis, assuming updating entries are made once a year at year-end.The company has a 31 December year-end.
1 The company rented an aircraft for two years on 31 March x8. Daedalus recorded the 1.68 millionrental payment for the two years as follows:
31 March x8Dr. Rent expense 1,680,000
Cr. Cash 1,680,000
He made no further entries with respect to the rental.
2 The company received 200,000 from ticket sales in December x8. Ten per cent of the receipts wereadvance payments by customers for flights to be taken in January x9. Daedalus made the follow-ing entry in December:
December x8Dr. Cash 200,000
Cr. Sales revenue 200,000
3 Some of the airline’s staff are paid weekly. Their last pay day in x8 was Friday, 27 December.Daedalus made the following entry for the weekly payroll on that date.
27 December x8Dr. Wage expense 2,800
Cr. Cash 2,800
The next payroll payment date is Friday, 3 January x9. (Ignore holidays and assume a seven-daywork week.)
4 The company invests 100,000 in short-term government securities on 1 September x8. When thesecurities mature on 1 March x9, the company will receive 104,500. Daedalus recorded the fol-lowing entry on 1 September.
1 September x8Dr. Short-term investment 100,000
Cr. Cash 100,000
He made no further entry in the company’s books in x8, since no cash was received that year.(Assume each month has 30 days.)
Required
For each of the four items above, show the entries that need to be made to convert the company’sx8 accounts to an accrual basis.
120 PART 1 • FOUNDATIONS
CFA_C05.qxd 11/6/03 2:20 PM Page 120

CHAPTER 5 • ACCRUAL ADJUSTMENTS AND FINANCIAL STATEMENT PREPARATION 121
Notes to Chapter 5
1 In practice, not all events are accounted for when they occur. For example, firms face restrictions onwhen they can recognise increases in the values of certain assets.
2 When a company sells an asset for more (less) than it paid for it, it realises a gain (loss), that is it con-verts the gain or loss into cash (or its equivalent). ‘Realisation’ has a broader meaning in the context ofrevenue recognition: it implies the securing of measurable economic benefits.
3 Using data from 1960 to 1989, a US researcher found that over various reporting intervals (quarterly,annual, four-yearly), US companies’ stock market returns were more closely associated with earningsthan cash flows (Dechow, P. (1994), Accounting earnings and cash flows as measures of firm perfor-mance: the role of accounting accruals, Journal of Accounting and Economics, 18: 3–42).
4 Dividend policy is a complex area. In addition to considering financial and strategic implications, firmsmust also weigh up the tax effect of dividend income on shareholders. Finance textbooks contain a fulltreatment of this subject.
5 Look out for differences in terminology across countries. Items described as extraordinary may, in fact,be merely exceptional and should be included in ordinary profits.
CFA_C05.qxd 11/6/03 2:20 PM Page 121

The annual report andaccounts
INTRODUCTIONIn previous chapters we described the purpose and form of the two key finan-cial statements, the balance sheet and the income statement, and showed howthey are prepared from accounting records. The aim of this chapter is to put acompany’s published financial statements in their usual context, the context ofthe annual report and accounts.
We review the contents of the annual report and accounts of a typical largeEuropean company and emphasise the parts of greatest interest to investors.These include, in addition to the financial statements, management’s report to shareholders, the notes to the accounts, the governance statement and theauditors’ report. We point out a common misconception about the incomestatement, the fifth in our accounting fallacy series.
We illustrate the different formats of balance sheet and income statement tobe found in company accounts. EU law specifies the formats EU member statesmay permit or require firms to use. We provide a brief guide to the EU’s com-pany law harmonisation initiative in an appendix.
We introduce the third major financial statement, the statement of cashflows, explaining its form and function. (The discussion is short. We devote awhole chapter to the topic later.)
Finally, since the annual accounts are an important source of informationfor those buying and selling the securities of quoted public companies, wedescribe certain earnings- and dividend-based financial ratios which are widelyused by stock market investors.
Note that the annual report and accounts are a part – albeit a very import-ant part – of a quoted company’s continuous ‘dialogue’ with investors. Quotedfirms communicate with investors in other ways during the financial year – forexample, through publication of interim accounts and announcements of significant changes to the company.
66
l Overview
l Management’s reportto shareholders
l Alternative balancesheet and incomestatement formats
l Income statementfallacy
l Notes to the accounts
l Governancestatement andauditors’ report
l EU disclosure andaudit requirements
l The cash flowstatement
l Popular financialratios amonginvestors
l Differences in UK/US accountingterminology
l Appendix: The EU’s company lawharmonisationprogramme
In this chapter
CFA_C06.qxd 11/6/03 2:22 PM Page 122

CHAPTER 6 • THE ANNUAL REPORT AND ACCOUNTS 123
Overview
As the name suggests, the annual report and accounts contains two parts. The annual accountscomprise the financial statements and explanatory notes, and the auditors’ report on them. Theannual report which normally precedes the accounts is more varied in format. It usually contains:
1 a review of the company’s activities over the past year and of its prospects for current andfuture ones; and
2 a discussion and analysis of the accounts.
Both the accounts and the report are prepared by management and are addressed to share-holders. Together these represent management’s ‘scorecard’ for the year. In addition, the annualreport contains other information and reports (e.g. the directors’ report or the report of thesupervisory board) which the company is legally obliged to publish.
The law influences the content of the annual report and accounts. Consider the case of EUfirms. They must present the balance sheet and income statement according to a prescribed for-mat. The annual accounts of all but small companies must be audited. The content of the annualreport is also regulated. For example, a company must disclose any important events – examplesare the acquisition or disposal of a subsidiary – that occur between its financial year-end and thedate the accounts are signed. The report need not be audited but the auditor should ensure thatit is consistent with the accounts. These requirements are summarised in Exhibit 6.1.
The disclosure and audit requirements are laid down in the EU’s 4th Directive.1 They are minimum requirements. Member states are free to demand additional disclosures. The Direc-tive imposes less onerous requirements on smaller companies. We summarise these later in thechapter.
Other industrialised countries lay down similar disclosure and audit requirements. For example, publicly quoted companies in the USA must submit to the Securities and ExchangeCommission (SEC) audited annual accounts which include a review by management of the company’s activities over the year.
EU law also requires companies to make copies of their annual report and accounts availableto the public (at a price no greater than administrative cost). When written, the law assumed this
Minimum disclosures Audit requirement
Annual report l Review of past year’s operationsand financial position
l Information on: None– post-balance-sheet events (but auditor should– likely future development check consistency– R&D activities with annual accounts)– purchase of own shares
Annual accounts l Balance sheetYes
l Income statement (for medium-sized
l Notes to the accountsand large firms only)
Annual report and accounts: EU disclosure and audit requirementsExhibit 6.1
(Source: Fourth Company Law Directive 78/660/EEC.)
CFA_C06.qxd 11/6/03 2:22 PM Page 123

124 PART 1 • FOUNDATIONS
would be a paper document. However, in order to disseminate the information more widely,many quoted companies in the EU and elsewhere now file the annual report and accounts ontheir corporate website as well.2
Management’s report to shareholdersManagement’s report to shareholders comprises the largest part of a company’s annual reportand accounts. It’s also the most colourful part, since unlike the accounts section it carries glossypictures or even specially commissioned artwork illustrating company products, happy customers,contented staff and, increasingly, broader themes of current interest such as the environment.The reader is left with the impression that the accounts themselves are of secondary importance.They are relegated to the end of the document, often with a different typeface and sometimesprinted separately on poorer quality paper.
BestPrice’s x2 report and accounts share many of these characteristics. The managementreport runs to 40 pages. It’s liberally sprinkled with pictures of smiling customers and ‘associates’(employees). By contrast, the 30 pages of financial statements and accompanying notes are con-signed to the back of the document and are printed with a smaller typeface. The report andaccounts are also available on the company’s website. They are simply a reproduction of theprinted version, but readers are able to download the document by section so they need not beaware of the ordering of the material in the report.
Besides its promotional role, the management report is also a source of information about thecompany. Investors gain valuable insights from a well-written one. BestPrice’s x2 managementreport is a good example. Each of the various parts of the report sheds light on different aspectsof the company.
l The chairman’s letter to shareholders. In addition to summarising the financial results for theyear, the chairman of BestPrice’s board of directors sets out in an introduction to the reportthe major strategic decisions the company has taken during the year. Important ones in x2were the decision to expand its operations in emerging markets – BestPrice opened new storesin Asia and Latin America during the year – and the development of new lines of business inEurope, in particular, in-store banking and other financial services.
l Review of operations. BestPrice’s management review developments in each of the company’smarkets (Western and Central Europe, South East Asia, and Latin America) in the year. These include acquisitions and disposals, new joint ventures, and new retailing concepts (e.g.internet-based home delivery service, smaller store formats in city centres and at petrol stations). The company discloses sales and operating results by market. In the case of sales, ithighlights ‘organic’ sales growth (i.e. excluding the effect of new businesses acquired in theyear). For its retail operations it gives information about sales, sales area and sales per squarefoot – a key performance indicator in the retail sector – by company within each country forboth x1 and x2.
BestPrice has one main line of business, retailing. When a company has more than one, it usually structures its review of operations by product or industry rather than by market.
l Financial review. BestPrice’s management provide more detail about the financial perform-ance, especially the earnings, of operations in each of the company’s markets. They also usethis section to link the operating review with the annual accounts. They refer back to eventsdescribed in the operating review – for example, new store openings, the raising of new equitycapital via a share offering, the devaluation of the Argentine peso – to explain key numbers in the accounts.
Investors may also learn about a company’s financing policies from this section. Somecompanies – but not BestPrice – disclose a target debt–equity ratio.
CFA_C06.qxd 11/6/03 2:22 PM Page 124

CHAPTER 6 • THE ANNUAL REPORT AND ACCOUNTS 125
l Outlook for current year (x3). BestPrice’s management outline the company’s prospects for x3and provide sales and operating profit margin forecasts for the year. They give little cash flowinformation, however: for example, they do not indicate how much the company expects to spend on fixed assets in x3. There is also a separate section in the report dealing withsignificant post-balance sheet events (i.e. events that occurred after 31 December x2 but beforethe publication of the x2 report). For example, BestPrice made an acquisition of another retailgroup in January x3. Investors find information about such events useful in developing theirown earnings forecasts.
The management reports of other large companies have a similar structure. However, thequality of the analysis in them varies considerably. One reason is the conflict of interest thatmanagement face: the report they write is a commentary on their own performance as managers.It is not surprising, therefore, if they emphasise the company’s achievements in the year anddownplay its failings.
In recent years, management reports have improved, thanks to the efforts of regulatory agen-cies. For example, publicly quoted firms in the USA have to include, in annual information filedwith the SEC, a section in which management discuss and analyse the company’s financial con-dition and operating results for the past three years. This is known as the MD&A (Management’sDiscussion and Analysis). The SEC has issued guidelines as to the content of the MD&A. ManyUS firms reproduce the MD&A in their annual report to shareholders. The UK’s AccountingStandards Board has also issued guidelines to help UK listed firms prepare the ‘operating andfinancial review’ section of the management report.
Alternative balance sheet and income statement formats
Under EU law, the annual accounts comprise a balance sheet, income statement, explanatorynotes and, for larger companies, an auditors’ report. Comparative figures from the previous yearmust be given for all items in the balance sheet and income statement. As mentioned earlier,these are minimum requirements. In some EU member states, firms must publish a cash flowstatement (or equivalent) as part of the annual accounts.
Although balance sheets and income statements are in principle the same across all countries,their formats differ. We describe below the formats found in EU company accounts and contrastthem with those used by US and other large international firms.
l Format of balance sheetLook back at BestPrice’s end-x2 balance sheets in Chapter 2 (Exhibit 2.4). It is laid out inaccount format. Where the balance sheet is presented on one page, assets head the page. On a two-page layout, assets are shown on the left, equities on the right. The focus of attention is the entity’s financial position. Thus, whether a one- or two-page layout is used, all equities aregrouped together.
The assets are listed in descending order of liquidity, with the most liquid assets, current assets,at the top of the asset column and fixed assets at the bottom. In a similar but more approximateway, equities are listed in descending order of maturity: liabilities with the shortest maturity headthe equities’ column while shareholders’ equity (equity with an indefinite life) is shown last. UScompanies present their balance sheets in this way. Many non-US multinationals like BestPriceStores adopt the US format because US investors are the largest national group of users of theirEnglish-language accounts.
The EU’s 4th Directive permits two balance sheet formats: the account format and the state-ment format. The EU’s account format is similar to a US-style balance sheet (e.g. assets first/on
CFA_C06.qxd 11/6/03 2:22 PM Page 125

Note that both formats contain the same information. A balance sheet can easily be convertedfrom one basis to another. The asset side of an account-format balance sheet consists of items (1)and (2) above, while the equities side consists of items (8), (6) and (3).
The account format is the one most companies in continental Europe employ in their original-language balance sheets. Custom and law are responsible. In Spain, for example, under the 1989law implementing the EU’s 4th (and 7th) Directive companies must use this format. The state-ment format is popular only in Ireland and the UK.
Exhibit 6.4 illustrates the EU version of an account-format balance sheet. It shows the 2001consolidated balance sheet of the Barco group, a Belgian manufacturer of visual display, imag-ing and projection equipment. In common with other Belgian companies, it provides detailedinformation on the face of the balance sheet. By contrast, the balance sheet of BestPrice Stores(see Exhibit 2.4) contains summary information only. BestPrice publishes detailed informationin the notes to the accounts. Thus Barco breaks down its ‘stocks’ (inventories) figure on the face of the balance sheet; BestPrice provides this detail in the notes. These are two contrasting(and acceptable) ways of meeting EU disclosure requirements. (Note that Barco has a full rangeof manufacturing inventories (VII.A.1–3 and B) but, since it is not a retailer, no merchandiseinventories (VII.A.4 represents ‘goods for resale’).)
126 PART 1 • FOUNDATIONS
Assets Equities
Fixed assets Shareholders’ equity
Long-term liabilities and provisions
Current assets Current liabilities
EU balance sheet: account formatExhibit 6.2
(1) Fixed assets(2) + Current assets(3) − Current liabilities(4) Net current assets [(2) − (3)](5) Total assets – current liabilities [(1) + (4)](6) − Long-term liabilities and provisions(7) Net assets [(5) − (6)]
(8) Shareholders’ equity [ = (7)]
EU balance sheet: statement formatExhibit 6.3
the left) save that it’s upside down. Assets are listed in ascending order of liquidity and equitiesin ascending order of maturity. The format is summarised in Exhibit 6.2.
The Directive also permits the use of the statement format. In this format, the focus of interest is the position of the owners (in equation terms, A – L = OE). Assets and equities are listedvertically, with assets shown first, followed by liabilities and then shareholders’ interests. Theasset section is so arranged that the company’s working capital (‘net current assets’) is high-lighted, as Exhibit 6.3 demonstrates.
CFA_C06.qxd 11/6/03 2:22 PM Page 126

CHAPTER 6 • THE ANNUAL REPORT AND ACCOUNTS 127
In t
hous
and
s of
eur
os20
01
FIX
ED
AS
SE
TS
224,
737
II.In
tang
ible
fixe
d a
sset
s50
,946
III.
Co
nso
lidat
ion
diff
eren
ces
42,9
74IV
.T
ang
ible
fixe
d a
sset
s11
6,45
7A
.La
nd a
nd b
uild
ings
62,4
27B
.P
lant
, m
achi
nery
and
eq
uip
men
t34
,764
C.
Offi
ce f
urni
ture
and
veh
icle
s13
,052
D.
Leas
ing
and
oth
er s
imila
r rig
hts
177
E.
Oth
er t
angi
ble
fixe
d a
sset
s2,
466
F.A
sset
s un
der
con
stru
ctio
n an
d a
dva
nce
pay
men
ts3,
571
V.
Fina
ncia
l fixe
d a
sset
s14
,360
B.
Com
pan
ies
acco
unte
d f
or b
y th
e eq
uity
met
hod
7,02
31.
Sha
res
2,02
32.
Am
ount
s re
ceiv
able
5,00
0C
.O
ther
ent
erp
rises
7,33
71.
Sha
res
4,04
32.
Am
ount
s re
ceiv
able
and
cas
h gu
aran
tees
3,29
4
CU
RR
EN
T A
SS
ET
S53
0,43
8V
I.A
mo
unts
rec
eiva
ble
aft
er o
ne y
ear
463
A.
Trad
e d
ebto
rs22
7B
.O
ther
am
ount
s re
ceiv
able
236
VII.
Sto
cks
and
co
ntra
cts
in p
rog
ress
157,
078
A.
Sto
cks
149,
134
1.R
aw m
ater
ials
73,9
252.
Wor
k in
pro
cess
36,1
533.
Fini
shed
goo
ds
39,0
56B
.C
ontr
acts
in p
rogr
ess
7,94
5V
III.
Am
oun
ts r
ecei
vab
le w
ithi
n o
ne y
ear
259,
565
A.
Trad
e d
ebto
rs22
0,90
3B
.O
ther
am
ount
s re
ceiv
able
38,6
62IX
.In
vest
men
ts54
,789
X.
Cas
h at
ban
k an
d in
han
d51
,921
XI.
Def
erre
d c
harg
es a
nd a
ccru
ed in
com
e6,
667
TO
TA
L A
SS
ET
S75
5,22
0
Bar
co c
onso
lidat
ed b
alan
ce s
heet
(aft
er a
ppro
pria
tion
) at
31 D
ecem
ber
2001
: acc
ount
form
atEx
hibi
t 6.4
2001
SH
AR
EH
OLD
ER
S’ E
QU
ITY
352,
339
I.C
apit
al53
,065
A.
Issu
ed c
apita
l53
,065
II.S
hare
pre
miu
m a
cco
unt
120,
471
IV.
Res
erve
s16
8,24
1V
I.T
rans
lati
on
diff
eren
ces
7,62
9V
II.In
vest
men
t g
rant
s2,
933
MIN
OR
ITY
IN
TE
RE
ST
S (
VIII
)88
2
PR
OV
ISIO
NS
AN
D D
EFE
RR
ED
TA
XE
S60
,850
IX.
A. P
rovi
sio
ns f
or
liab
iliti
es a
nd c
harg
es51
,930
1.P
ensi
ons
and
sim
ilar
oblig
atio
ns3,
791
2.Ta
xes
260
3.M
ajor
rep
airs
and
mai
nten
ance
2,63
84.
Oth
er li
abili
ties
and
cha
rges
45,2
41B
. Def
erre
d t
axes
and
late
nt t
axat
ion
8,92
1
CR
ED
ITO
RS
341,
148
X.
Am
oun
ts p
ayab
le a
fter
one
yea
r16
,833
A.
Fina
ncia
l deb
ts15
,548
2.B
ond
s12
,354
3.Lo
ng-t
erm
leas
es a
nd s
imila
r ob
ligat
ions
202
4.C
red
it in
stitu
tions
2,96
75.
Oth
er lo
ans
25D
.O
ther
am
ount
s p
ayab
le1,
285
XI.
Am
oun
ts p
ayab
le w
ithi
n o
ne y
ear
290,
707
A.
Cur
rent
por
tion
of a
mou
nts
pay
able
aft
er o
ne y
ear
1,73
5B
.Fi
nanc
ial d
ebts
(1. C
red
it in
stitu
tions
)77
,629
C.
Trad
e d
ebts
76,2
961.
Sup
plie
rs75
,345
2.B
ills
of e
xcha
nge
pay
able
951
D.
Ad
vanc
es r
ecei
ved
on
cont
ract
s in
pro
gres
s29
,946
E.
Taxe
s, r
emun
erat
ion
and
soc
ial s
ecur
ity72
,258
1.Ta
xes
32,8
312.
Rem
uner
atio
n an
d s
ocia
l sec
urity
39,4
27F.
Oth
er a
mou
nts
pay
able
32,8
42X
11.
Acc
rued
cha
rges
and
def
erre
d in
com
e33
,609
TO
TA
L LI
AB
ILIT
IES
AN
D S
HA
RE
HO
LDE
RS
’ EQ
UIT
Y75
5,22
0
(Sou
rce:
Bar
co,
Ann
ual R
epor
t an
d A
ccou
nts
2001
. C
omp
arat
ive
figur
es f
or 2
000
have
bee
n om
itted
. R
epro
duc
ed b
y p
erm
issi
on o
f B
arco
NV
.)
CFA_C06.qxd 11/6/03 2:22 PM Page 127

Under the natural basis, expenses are reported by their type or nature. In practice, only the costsof key inputs – materials, labour and depreciation – are shown separately. Firms rarely breakdown these input costs by department. Thus the reader cannot find out from the financial statements the labour costs incurred in, say, the production department. Exhibit 6.6 shows the format of an income statement under the natural basis.
Note that this is the income statement of a retailing company. The natural-basis income state-ment of a manufacturing company is more complex and is illustrated in a later chapter.
The operating and net profit figures should be the same under both the functional and naturalbases. Accrual-based operating costs are the same in total under the two bases: they are simplyclassified differently. Thus the cost of sales figure of a retail company (item 2, Exhibit 6.5) incorporates both the cost of purchased merchandise (but not services) and the variation in merchandise inventories (item 3 (part) and item 2 (part), Exhibit 6.6).
128 PART 1 • FOUNDATIONS
(1) Revenue from sales(2) Cost of sales(3) Gross profit or loss [(1) − (2)](4) Selling and distribution expense(5) Administration expense(6) Other operating income(7) Operating profit or loss [(3) − (4) − (5) + (6)](8) Investment income(9) Financial expense, net
(interest expense less interest income)(10) Income tax
(expense or credit)(11) Net profit or loss on ordinary activities
[ = (1) − (2) − (4) − (5) + (6) + (8) −/+ (9) −/+ (10)](12) Extraordinary gain or loss, net of tax(13) Net profit or loss for the year [(11) +/− (12)]
Income statement: functional basis/vertical layoutExhibit 6.5
l Format of income statement The 4th Directive offers EU countries four different formats for the corporate income statement.The key difference concerns the classification of expenses: expenses can be classified on either afunctional or a natural basis within either a vertical or horizontal layout.
Expense classificationYou’ll recall that under the functional basis, expenses are grouped by department or functionalactivity. Thus the merchandise (or, for manufacturing companies, the production) costs ofgoods sold are shown under ‘cost of sales’, all the costs of the sales and marketing departmentsunder ‘distribution expense’, and the costs of head office and other administrative departmentsunder ‘administration expense’.
The EU version of the functional income statement is summarised in Exhibit 6.5. BestPrice’sx2 consolidated income statement, shown in Exhibit 3.7, is an example of this format.
CFA_C06.qxd 11/6/03 2:22 PM Page 128

A simple example illustrates this. Assume Snug, a hardware store, holds merchandise costing2,000 at the beginning of April. It purchases goods for 10,000 and sells goods costing 9,000 for16,000 in the month. Inventories therefore increase by 1,000. Its only other costs are the salaryof a sales person (1,500) and depreciation of shop fittings (500). Its April operating profit is 5,000under either basis of expense classification, as Exhibit 6.7 makes clear.
Which basis of expense classification do investors prefer? Each method has its champions.Supporters of the natural basis claim that the cost information provided is more reliable andcomparable across firms. Even firms in the same industry can define a function such as produc-tion or marketing differently. Supporters of the functional basis argue that it yields informationthat is more relevant to investors. For example, gross profit and marketing expenses are keyfigures which investors like to monitor.
In fact, in countries where companies can choose how to classify expenses, many select thenatural basis in order to avoid disclosing sensitive information. It’s impossible to determine thegross profit of a manufacturing firm under this basis, because materials, labour and overheads
CHAPTER 6 • THE ANNUAL REPORT AND ACCOUNTS 129
(1) Revenue from sales(2) Increase/decrease in inventories(3) Costs of purchased merchandise and services(4) Personnel costs(5) Depreciation (and asset writedowns)(6) Other operating costs(7) Other operating income(8) Operating profit or loss
[= (1) +/− (2) − (3) − (4) − (5) − (6) + (7)](9) Investment income
(10) Financial expense, net (see Exhibit 6.5)(11) Income tax (see Exhibit 6.5)(12) Net profit or loss on ordinary activities(13) Extraordinary gain or loss, net of tax(14) Net profit or loss for the year
Income statement (retailing company): natural basis/vertical layoutExhibit 6.6
SnugOperating statement for April
(in 000)
Functional basis Natural basisRevenue from sales 16 Revenue from sales 16Cost of sales –9 Increase in inventories +1
Cost of merchandise bought –10Gross profit 7 Personnel costs –1.5Distribution and Depreciation –0.5administration expense –2Operating profit 5 Operating profit 5
Comparison of expense classification basesExhibit 6.7
CFA_C06.qxd 11/6/03 2:22 PM Page 129

130 PART 1 • FOUNDATIONS
Debit Credit
Costs of purchased Revenue from salesmerchandise and services
Decrease in inventories [or Increase in inventories]Personnel costsDepreciationOther operating costs Other operating income
Investment incomeInterest expense Interest incomeIncome tax expense
Net profit on ordinary activitiesExtraordinary charges/losses Extraordinary income/gains
Net profit for the year
Income statement (retailing company): horizontal layout/natural basisExhibit 6.8
EU and international practiceIncome statement presentation differs widely in the EU. Some countries such as Belgium, Italy,Portugal and Spain require firms to classify expenses by nature. In countries where both naturaland functional bases are permitted (e.g. Germany, UK), there has been a shift towards use of thefunctional basis in recent years, especially in the English-language accounts of larger companies.One reason is the influence of international investors whose proportionate stake in EU-quotedfirms has been growing. These investors are accustomed to US-style income statements: all UScompanies classify expenses by function.
As for the layout of the income statement, there’s less diversity of practice. The vertical layoutis the most widely used, certainly in the English-language income statements of large European
are not broken down into production and non-production categories. As a result, competitorshave difficulty estimating the profitability of a company’s manufacturing operations and calcu-lating the amount it spends on marketing its products.
Layout of income statementThe outline income statements shown in Exhibits 6.5 and 6.6 have a vertical layout. The firm’srevenues and expenses are presented in a single column, starting with those from its operatingactivities. In the alternative horizontal layout found in EU company accounts, revenues andexpenses are shown in separate columns. Expenses being debits are in the left-hand column, revenues being credits in the right-hand one – just like a T account, in fact. As in the vertical layout, operating revenues and expenses head the statement. Exhibit 6.8 shows in outline an EUincome statement in horizontal layout.
Note that net profit is shown in the left-hand column. In effect, it is the amount that balancesthe debit and credit entries to that point. For this reason, a loss-making firm reports a net lossand any related tax credit in the right-hand column.
CFA_C06.qxd 11/6/03 2:22 PM Page 130

CHAPTER 6 • THE ANNUAL REPORT AND ACCOUNTS 131
companies, since this is the layout best understood by international investors. Spain, however,requires its firms to use the horizontal layout – but even here, larger quoted companies usuallyprovide supplementary ‘analytical’ income statements (i.e. vertical layout, functional basis ofexpense classification) for the benefit of investors.
The income statement fallacy
Accounting fallacy no. 5: ‘All items of income appear on the income statement.’
In Chapter 3 we said that a firm’s ordinary profit is the increase in its net assets arising fromoperations and activities incidental to them. In Chapter 5 we extended the definition of profit to include extraordinary items. We now summarise that definition. Profit (or loss) is the overallchange in net assets (NA) in the year, excluding the effects of dividends (DIV) and changes in sharecapital. Thus, for year t :
Profitt (or losst) == (NAt −− NAt−−1) −− Capital increaset ++ DIVt
(++ Capital decreaset )
Profit defined in this way is known as comprehensive income (or clean surplus).Is the ‘bottom line’ net profit figure in Exhibits 6.5, 6.6 and 6.8 equal to comprehensive
income? In practice, no. Companies do not report the whole of the comprehensive income onthe income statement. The main reason is the legal requirement that revenues and gains shouldbe realised before they can be reported on the income statement. It is argued that, on grounds ofprudence, the profit number in the income statement should be limited to the amount that canbe distributed to shareholders as a cash dividend. Unrealised revenues and gains are, in this view,not distributable.
As a result, gains from the revaluation of fixed assets – a practice permitted in some EU coun-tries – are not reported on the income statement at the time of revaluation because they are notrealised then. (The gains are only realised when the revalued asset is sold or consumed.) Thereare other types of gain and loss – certain foreign exchange gains and losses, for example – whichfor technical reasons are not recorded on the income statement when they arise. We encountermore examples of non-income statement gains and losses in later chapters.
Where do these non-income statement gains (or losses) go? The usual practice is for firms totake them directly to reserves in the balance sheet. For example, a surplus arising on the revalu-ation of a fixed asset such as property is credited to a revaluation reserve account. This is a non-distributable reserve and is therefore shown separately from retained earnings.
It is sometimes hard to calculate a company’s comprehensive income for the year. Not allfirms disclose the movement in the components of shareholders’ equity over the year. Moreover,the amount of non-income statement gains and losses is increasing as new accounting rules are introduced which extend the use of current valuations in the accounts. For these reasons,accounting regulators have concluded that the existing financial statements should be extended.A firm following international accounting standards can extend the statements in one of twoways. It can include a formal ‘statement of changes in shareholders’ equity’ in the annualaccounts. With information about the changes in retained earnings and other reserves, anyonereading the accounts can derive the firm’s comprehensive income. Alternatively, the firm canattach a ‘statement of recognised gains and losses’ to the income statement. This combines the‘bottom line’ of the income statement (i.e. net profit) and non-income statement gains andlosses to give the firm’s total recognised gains (or losses) in the year. This is equivalent to com-prehensive income. Exhibit 6.9 shows how this statement is linked to the income statement andbalance sheet.
CFA_C06.qxd 11/6/03 2:22 PM Page 131

Notes to the accounts
The notes provide vital information to help the reader improve his or her understanding of acompany’s accounts. In fact, in an exposé of the creative accounting practices of UK companiesin the 1990s, the author, a financial analyst, advises investors to read annual reports from theback – by starting with the notes.3
The notes help investors in several ways. First, they put flesh on skeletal information in thefinancial statements. They contain details which it is inconvenient or impossible to disclose onthe face of the balance sheet or income statement. BestPrice, for example, gives in the notes to its x2 accounts a breakdown of the long-term debt of a3,315 million shown on its end-x2 balance sheet. Part of the note on long-term debt is shown in Exhibit 6.10.
With information in this footnote we can estimate the x3 interest charges on BestPrice’s long-term debt, since we are given the interest rate and amount of each category of long-term debt. Inaddition, BestPrice discloses how much of the end-x2 total debt is repayable in each of the followingfive years. All this information is useful in estimating the company’s future profits and cash flows.
Second, the notes give us information about the accounting methods the company has usedand any estimates or assumptions it has made in deriving the numbers in the accounts. Finan-cial statements are not uniform. In preparing accrual-based accounts, a company has to make estimates – for example, about the lives of its fixed assets and the amount of its trade debts which it reckons will be uncollectible. Estimates differ across companies. In addition, there aredifferent methods of accounting for certain assets and liabilities, as we’ll see in later chapters. Inmany cases, accounting methods are prescribed – by law or accounting standards. In some cases,a company is allowed to choose which method to adopt. The note to the accounts in which acompany’s accounting policies (its accounting methods and estimates) are disclosed is thereforeof major interest to financial statement users.
132 PART 1 • FOUNDATIONS
Statement of recognised gains and losses: form and links to other financial statements
Exhibit 6.9
Income statement...Net profit for year xx
Statement of recognised gains and lossesRevaluation gains/(losses) xx/(xx)Net profit for year xxTotal recognised gains in the year xx
Balance sheet, end-year...Shareholders’ equity:
Share capital xxRevaluation reserve xxRetained earnings xxTotal xx...
CFA_C06.qxd 11/6/03 2:22 PM Page 132

Exhibit 6.11 contains an extract from the ‘accounting policies’ note to the 2001 English-language accounts of Carrefour, a leading French retailer. It describes how the group values itsfixed assets and the method it uses to depreciate them. The estimated lives of the main classes offixed asset are also disclosed.4
Investors often review the accounting policies of firms in the same industry before com-paring their financial results. Differences in profitability may be attributable to differences inaccounting methods or estimates. For example, Carrefour depreciates its buildings more rapidlythan BestPrice – over 20 years against BestPrice’s 33 years. This may reflect differences in themarket segments the two firms are in: Carrefour operates hypermarkets which have simplerstructures and shorter expected lives. Tax rules may also be responsible: Carrefour’s depreciationrates may be a legacy of the rates allowed under French tax law. Whichever is the explanation,investors must be aware of the likely impact on Carrefour – higher building depreciation charges,lower book value of property – when comparing the two firms’ profitability and leverage.
CHAPTER 6 • THE ANNUAL REPORT AND ACCOUNTS 133
GrossLoan details proceeds Term x2 x1
Fixed rate6% bonds, due December x2 500 4 years – 5004.5% bonds, due August x6 400 6 years 400 4005.75% bonds, due May x5 450 5 years 450 4505.5% bonds, due April x9 400 7 years 400 –5.5% bonds, due April x9 200 7 years 200 –5.5% bonds, due April x9 350 7 years 350 –
Floating rateEUR bonds, average 4.3%, due October x4 500 3 years 500 500EUR bonds, average 4.1%, due June x3 200 2 years 200 200
Other loans, average 4.6% 1,279 1,0413,779 3,091
Current portion of long-term debt –464 –712Long-term debt 3,315 2,379
BestPrice: extract from note on long-term debt in x2 accounts (amounts in Amn)Exhibit 6.10
Property and equipment
Land, constructions and equipment are valued at their original cost price. Depreciation iscalculated according to the straight-line method based on average life, i.e.:
l Constructions:– buildings ................................................................................................................ 20 years– land ........................................................................................................................ 10 years– parking lots .......................................................................................................... 62/3 years
l Equipment, fittings and fixtures .............................................................. 62/3 years to 8 years
l Other property, plant and equipment ........................................................ 4 years to 10 years
Carrefour: note on accounting policies for (owned) fixed assetsExhibit 6.11
(Source: Carrefour, Annual Report and Accounts 2001.)
CFA_C06.qxd 11/6/03 2:22 PM Page 133

134 PART 1 • FOUNDATIONS
Third, the notes contain additional information which helps investors interpret the numbersin the financial statements and make more reliable projections from them. Here are some examples:
l Segmental data. Larger diversified companies provide a breakdown of sales, profit and,increasingly, assets, by both industry and geographical area. These disclosures help explainpast changes in a firm’s aggregate sales (and earnings) and make possible more accurate fore-casts of its future performance.
l Post-balance sheet events. A firm should give details of events such as the acquisition or dis-posal of a business, a disaster (e.g. fire, flood) or a discovery (e.g. oil strike) which are likelyto have a major impact on the business and which occur after the balance sheet date butbefore the accounts are released. Such events affect investors’ estimates of a company’s futuresales, earnings and cash flow. (EU firms may give this information in the management reportrather than the notes to the accounts.)
l Contingencies and commitments. Investors want to know – again for forecasting purposes – ifthe company has any major potential liabilities at the balance sheet date (contingencies) orany contractual agreements which involve large future cash outlays (commitments). Underexisting rules, these are unlikely to appear on the face of the published balance sheet orincome statement.
l Related party transactions. These can include any type of transaction – from purchase of goodsto loans – with individuals (e.g. directors) or companies (e.g. associated companies) withwhich the firm is linked. The extent and nature of such transactions interest investors. Arethey undertaken at arm’s length? What risks does the firm bear as a result?
All larger EU firms provide at least some information in each of these areas, thanks to the 4thDirective. But except in the case of firms quoted on the major international stock exchanges,which have more extensive disclosure rules, the information is often scanty.
Governance statement and auditors’ report
With the exception of family-run firms, shareholders do not usually get involved in the day-to-day running of the companies in which they invest. Instead, they appoint managers for this task.This creates a dilemma. Managers want the freedom to manage – to run the company withouthaving to get approval for every decision they take – but shareholders want to prevent managersfrom misusing or even stealing their capital.
Over the years, shareholders have found ways to protect their investments in management-run companies. The law helps them. Company law in all countries gives outside shareholderscertain rights – for example, to appoint directors, receive periodic financial statements and voteon major business decisions in general meeting. We look at shareholder rights in more depth inlater chapters. In this section we draw attention to two features of published financial statementsthat illustrate those rights in action. They are the corporate governance statement provided bydirectors and the auditors’ report.
l Corporate governance statementAn effective board of directors is a vital governance mechanism. It is the voice of shareholders(and, in companies with employee-elected directors, of staff, too). The board appoints the com-pany’s top managers and holds them to account for their actions. In recent years, many stockexchanges have introduced governance regulations for listed companies. In some cases, thesetake the form of a ‘comply-or-explain’ code of conduct (i.e. directors must state, in the annualreport, the reasons for not complying with any of the code’s provisions).
CFA_C06.qxd 11/6/03 2:22 PM Page 134

The directors provide in the annual report a statement of corporate governance. The state-ment gives background information about the board and how it functions and sets out itsresponsibilities, especially with regard to the company’s internal financial controls. For example,more than half of BestPrice’s board consist of independent directors (i.e. directors who have no executive role and no business or family ties to executive directors or other managers). These independent directors serve on special committees of the board that are responsible forappointing new directors (nominations committee), setting their pay (remuneration committee)and liaising with the firm’s auditors (audit committee). BestPrice also gives information aboutindividual directors’ pay – in total and by type (salary, bonuses, pension benefits, share options)– in this section of the report.
l Auditors’ reportAnother key protection for investors is the right to receive audited financial statements annually.In an external audit, independent accountants examine the financial statements of a company(and the record-keeping system from which the numbers in them are drawn) and express anopinion on them. The 4th Directive requires that all but very small EU companies must havetheir annual accounts audited by an individual or organisation authorised under national law.Unlike in the USA, the EU’s audit requirement covers unquoted as well as quoted companies (solong as they meet certain size tests).
The auditors’ report accompanies the annual accounts. It is addressed to the company’sshareholders. The report on BestPrice’s x2 accounts is set out in Exhibit 6.12.
CHAPTER 6 • THE ANNUAL REPORT AND ACCOUNTS 135
Auditors’ report
IntroductionWe have audited the financial statements of BestPrice Stores S.A. for the year endedDecember 31, x2. These financial statements are the responsibility of the company’smanagement. Our responsibility is to express an opinion on these financial statements basedon our audit.
ScopeWe conducted our audit in accordance with auditing standards generally accepted inEuroland. Those standards require that we plan and perform the audit to obtain reasonableassurance about whether the financial statements are free of material misstatement. An auditincludes examining, on a test basis, evidence supporting the amounts and disclosures in thefinancial statements. An audit also includes assessing the accounting principles used andsignificant estimates made by management, as well as evaluating the overall financialstatements presentation. We believe that our audit provides a reasonable basis for our opinion.
OpinionIn our opinion, the consolidated financial statements of BestPrice Stores S.A. give a true and fair view of the consolidated financial position of the company as of December 31, x2 and of the consolidated results of operations for the year then ended, in accordance withInternational Accounting Standards, and comply with the financial reporting requirements ofthe Euroland Civil Code.
Tick, Foot & Sample, Certified AccountantsEurocity, March 28, x3
BestPrice Stores: report of the auditors on the x2 accountsExhibit 6.12
CFA_C06.qxd 11/6/03 2:22 PM Page 135

136 PART 1 • FOUNDATIONS
The wording of BestPrice’s auditors’ report follows that set out in international auditing stand-ards. (Auditors following national standards use different wording but the structure of the reportis the same.) There are two sections of the report to which investors pay close attention. The firstindicates the scope of the audit, that is to say, which items have been audited and by whom. BestPrice’sauditors state explicitly that they have audited the x2 financial statements of the parent company(BestPrice Stores S.A.). Since they make no reference to other auditors’ work, we can infer thatthey audited those of BestPrice’s subsidiaries as well. ‘Financial statements’ here include thenotes to the accounts. We should not assume, however, that supplementary financial informationshown outside the accounts has been audited. The auditors may also state which auditing stand-ards have been followed. Usually, as in BestPrice’s case, they are national standards.
The second, the opinion paragraph, contains the auditors’ judgement on the items audited.European countries, both within and outside the EU, usually require auditors to state whetherthe accounts comply with national legislation. The ‘compliance audit’ has been the traditionalform of audit in most of continental Europe. (Scandinavian countries go further. In Finland andSweden, the auditors must decide whether or not to recommend that the accounts be approvedby shareholders and the directors be relieved of further responsibility for them for the financialperiod just ended.)
In the Netherlands and Anglo-Saxon countries, auditors have long been concerned with theintegrity of the numbers in the published financial statements as well as their compliance withthe law. The EU has adopted this point of view. The 4th Directive requires a company’s auditorsto state whether the accounts for the period ‘give a true and fair view’ of its profit for the yearand its state of affairs at year-end.
What is meant by ‘give a true and fair view’? The phrase has not been defined but a widelyheld view is that accounts which, according to auditors, meet this test ‘reflect the underlyingcommercial reality’ of the company and its business. Note that compliance with the law andaccounting rules does not guarantee the accounts will give a true and fair view. Commercialpractices change constantly; laws and rules are modified only periodically. Moreover, laws andrules are not omniscient: they cannot anticipate every unusual commercial event. For these reasons, the 4th Directive and international accounting standards contain a ‘true and fair viewoverride’. This states that, in exceptional cases, a company can override a provision of the 4thDirective (or an international accounting standard) and apply an accounting policy that is notgenerally accepted if, only by so doing, will its accounts give a true and fair view.5
The auditors may qualify their (good) opinion of the accounts, withhold it or issue an adverseopinion. They may take issue with management’s accounting treatment of a particular asset orliability. If they consider it a minor point, they will simply draw attention to it in their report. If it has a material impact on the accounts, they may give an adverse opinion on them. Theywithhold their opinion when they are unable to obtain the information they need – perhapsbecause of a breakdown in the company’s record-keeping system.
One final point: a company’s managers, not its auditors, are responsible for the preparationof its financial statements. The introduction to BestPrice’s auditors’ report reminds share-holders of this fact. Statements by auditors – and managers – of their respective responsibilitiesare an increasingly common sight in the accounts of international companies. Such statements,though they do little more than express the long-standing legal duties of both parties, are aresponse to investor criticism of the way many companies are governed.
EU disclosure and audit requirements
Disclosure and audit requirements for small and medium-sized companies in EU member statesare less onerous than those for large companies. Most of the companies enjoying this concessionare private.
CFA_C06.qxd 11/6/03 2:22 PM Page 136

CHAPTER 6 • THE ANNUAL REPORT AND ACCOUNTS 137
Under the 4th Directive, small companies are only required to publish an abridged balancesheet and abridged notes to it. An abridged balance sheet need only contain totals by type of assetand equity. Using Barco’s balance sheet (Exhibit 6.4) as a guide, a small company must disclosethe information shown against the roman numerals (I, II, III, . . . ) only. It need not publish anincome statement. An annual report is not required: nor, too, is an audit.
Under the same Directive, medium-sized companies are required to publish an abridged balance sheet, abridged income statement and abridged notes to them. A medium-sized com-pany is allowed to begin the income statement with the gross profit (or loss) figure. Informationabout turnover, its total amount and its breakdown (by product line and geographical area) neednot be disclosed. An annual report and audit are mandatory.
The Directive defines size on the basis of three criteria – net turnover (operating revenues, net of sales rebates and sales-related taxes), ‘balance sheet total’ (i.e. total assets) and averagenumber of employees in the year. To qualify as small or medium-sized, a company must notexceed the upper limits of two of the three criteria for that size category in two successive years:6
Upper limits for size category of firm
Size Balance sheet Average numbercategory Net turnover total of employees
(A m) (A m)Small 7.3 3.65 50Medium-sized 29.2 14.6 250
The upper limits for net turnover and balance sheet total are revised every five years to allowfor the effects of inflation. Remember that these are minimum disclosure requirements. EUmember states can and do impose more stringent ones.
The cash flow statement
l Background
The third major corporate financial statement is the statement of cash flows. The purpose of the statement is to show where the cash flowing into a company has come from and how it hasbeen used. In fact when first conceived it was known as the ‘where from? where to?’ statement.7
The term ‘cash’ has a broad meaning in this context. It usually covers both cash and cashequivalents, that is to say, cash invested in short-term highly liquid investments. Sometimes cashis a net figure: amounts borrowed under a bank overdraft facility may be deducted.
EU companies are not required under the 4th Directive to publish a cash flow statement. Insome EU countries (e.g. Spain, UK) and elsewhere (e.g. Canada, USA), publication is mandatory,however. Companies in other countries that prepare their accounts according to internationalaccounting standards are also required to publish the statement as part of their accounts. Inthese cases, the statement is audited. An alternative practice is to include the (unaudited) statement in the annual report. Some stock exchanges require its publication as a condition oflisting a company’s securities on the exchange.
Our task in this chapter is to show in outline how the statement is prepared and to try to interpret the numbers in it. (We look at the statement in more depth in a later chapter.)Preparing a cash flow statement involves three steps. First, overall cash flow, the ‘bottom line’ ofthe statement, must be calculated. Cash flow is the change in cash and cash equivalents over theperiod. Next, the reasons for the change in cash and cash equivalents are identified. Cash inflowsand outflows are usually classified according to the activity to which they relate – operating,
CFA_C06.qxd 11/6/03 2:22 PM Page 137

investing and financing. Finally, the operating cash flows are recast into the form in which themajority of companies currently present this information.
We illustrate these steps using Out of Babel Company, the language school whose year 2financial statements we derived in Chapters 4 and 5. The company’s income statement and start-and end-year balance sheets are reproduced in Exhibit 6.13.
l Calculating ‘cash flow’The simplest approach to calculating cash flow is to use information in the cash ledger account– or cash and short-term investments accounts, where ‘cash’ is defined more broadly.
138 PART 1 • FOUNDATIONS
Out of Babel CompanyAnnual accounts for year 2
(amounts in 000)
Income statement for year 2
Revenue from fees 86Less: Operating expensesSalaries 48Rent of premises 8Utilities 7Depreciation of equipment 4.5Supplies 4
–71.5Operating profit 14.5
Less: Financial expense, netInterest expense 0.9Interest revenue –0.4
–0.5Profit for the year (before tax) 14.0
Balance sheets at 31 December year 2 and year 1
Year 2 Year 1 Year 2 Year 1Current assets Current liabilitiesCash 23 11 Bank loan 15 0Short-term investment 24 0 Accrued interest payable 0.9 0Accrued interest receivable 0.4 0 Accounts payable 3 2Accounts receivable 9 6 Fees received in advance 12 0Supplies inventory 3 1 Accrued salaries payable 1 0Prepaid rent 0 8 Total current liabilities 31.9 2
Total current assets 59.4 26
Fixed assets Shareholders’ equityEquipment at cost 35 10 Share capital 40 30Accumulated depreciation –6.5 –2 Retained earnings 16 2
Equipment, net 28.5 8 Total shareholders’ equity 56 32Total liabilities and
Total assets 87.9 34 shareholders’ equity 87.9 34
Exhibit 6.13
(Source: Exhibits 4.9 and 5.8.)
CFA_C06.qxd 11/6/03 2:22 PM Page 138

l Classifying cash flows by activityUsing the information in the ledger accounts in Exhibit 6.14 we can draw up a cash flow statement.8 Although there are various ways of classifying a firm’s cash flows – the simplest is tosplit them into ‘sources’ and ‘uses’ of cash – the standard approach is to classify them by activ-ity. The cash flow statement highlights three types. The sale of goods and services – and relatedtrading costs – are a firm’s operating activities. The purchase and disposal of fixed assets are its investing activities. The issuance of debt or equity securities – and their retirement or repurchase – are its financing activities.
The year 2 cash flow statement of Out of Babel Company is shown in activity form in Exhibit 6.15.
What does the activity-based cash flow statement tell us about Out of Babel? The companygenerated a healthy cash flow from operations in year 2. The tuition fees received exceeded oper-ating outlays (on salaries, supplies and utilities) by 36,000. This was more than sufficient tofinance its investment in equipment in the year (25,000) (and, incidentally, to renew the 8,000 ayear lease on its premises, for which payment is due at the start of year 3). The external capitalraised – by bank loan (15,000) and share issue (10,000) – suggests the company is planning tomake larger investments in year 3.
CHAPTER 6 • THE ANNUAL REPORT AND ACCOUNTS 139
Out of Babel CompanyCash and Short-term investment: Ledger accounts year 2
(amounts in 000)
Cash
Dr. Cr.Balance, 1/1/year 2 11 (1) Issue of shares 10 (2) Equipment purchase 25
Bank loan 15 (6) Payment for supplies 5(3) Fees in cash 45 (7) Payment of salaries 47(5) Collection of debts 32 (8) Payment for utilities 7(9) Fees received in advance 18 (10) To Short-term investment 24
Balance, 31/12/year 2 23
Short-term investment
Dr. Cr.Balance, 1/1/year 2 0 (10) From Cash 24
Balance, 31/12/year 2 24
Exhibit 6.14
(Source: Exhibit 4.12.)
Out of Babel begins year 2 with a cash balance of 11,000. At year-end, the company has cashof 23,000 and a short-term investment of 24,000. (We treat the short-term investment as part ofcash since we know that the company invests, on a short-term basis, cash which is surplus to itsoperating needs.) The company therefore increases its cash and cash equivalents by 36,000 inyear 2. This represents its cash flow for the year. The movement in the ‘Cash’ and ‘Short-terminvestment’ accounts in year 2 is shown in Exhibit 6.14.
CFA_C06.qxd 11/6/03 2:22 PM Page 139

l Cash flows from operations: the indirect approachPresentation of operating cash flow in published financial statements is regrettably not asstraightforward as the direct approach illustrated in Exhibit 6.15. In practice, companies showoperating cash flow, not as the difference between operating receipts and payments but as thesum of reported profit and ‘accruals’. Accruals here are operating revenues and expenses whichin part or in whole have no cash flow impact in the period. Presenting operating cash flow in thisway is known as the indirect approach.
The calculation of operating cash flow under the indirect approach proceeds as follows:
l Take the (post-tax) profit figure from the income statement.l Adjust it for revenues and expenses, gains and losses, which have no impact on the company’s
operating cash flow. (The most common example is depreciation. The depreciation chargeinvolves no cash outlay. That occurred when the building or equipment was bought.)
l Finally, make a further set of adjustments to convert revenues and expenses, the componentsof profit, into operating receipts and expenditures. How? Adjust the profit figure for changes inoperating working capital accounts, such as inventories and accounts payable.
140 PART 1 • FOUNDATIONS
Out of Babel Company Cash flow statement for year 2: direct approach
(amounts in 000)Operating activitiesTuition fees received [(3) + (5) + (9)]* 95Less: Payments for supplies, salaries and utilities
[(6) + (7) + (8)] –59Cash inflow from operating activities 36
Investing activitiesPurchase of equipment (2) –25Cash outflow on investing activities –25
Financing activitiesBank loan (1) 15Issuance of shares (1) 10Cash inflow from financing activities +25
Net increase in cash 36Cash and cash equivalents, 1/1/year 2 11
Cash and cash equivalents, 31/12/year 2 47
End-year balance comprises:Cash in hand and at bank 23Short-term investment 24
Total 47
* References are to cash account entries (see Exhibit 6.14).
Exhibit 6.15
CFA_C06.qxd 11/6/03 2:22 PM Page 140

Notice that increases in current assets (and decreases in current liabilities) reduce cash.Similarly, increases in current liabilities (and decreases in current assets) increase cash. Why is this?Think of current operating assets as investments and current operating liabilities as capital. An investment uses corporate cash; new capital provides cash for the company.
CHAPTER 6 • THE ANNUAL REPORT AND ACCOUNTS 141
Out of Babel Company Year 2 change in non-cash working capital accounts
(amounts in 000)
31 December Effect ofyear 1 year 2 Change change on cash
Current assets (excl. cash and short-term investment)
Accounts receivable 6 9 +3 −3Accrued interest receivable 0 0.4 +0.4 −0.4Supplies inventory 1 3 +2 −2Prepaid rent 8 0 −8 +8
Current liabilities (excl. bank loan)Accounts payable 2 3 +1 +1Accrued interest payable 0 0.9 +0.9 +0.9Fees received in advance 0 12 +12 +12Accrued salaries payable 0 1 +1 +1
Total effect on cash +17.5
Exhibit 6.16
Strictly, further adjustments should be made. Income received from investments should bereclassified as an investing inflow, interest and dividend payments as a financing outflow. And,as a consequence, tax payments (or refunds) should be apportioned among operating, investingand financing cash flows. In practice, many companies classify interest and dividends received,interest paid and tax paid (or refunded) as operating flows to make clearer the link with netprofit. Dividend payments, however, are usually shown as a financing outflow. This is the practicefollowed in this chapter.
We illustrate the indirect approach using Out of Babel Company’s accounts for year 2. We first calculate the change in non-cash working capital accounts between end-year 1 and end-year 2. Exhibit 6.16 shows the movement in the balances of individual current assets and liabilities between the start and end of year 2.
CFA_C06.qxd 11/6/03 2:22 PM Page 141

The company’s cash flow statement for year 2 is shown in indirect form in Exhibit 6.17.Compare Exhibits 6.15 and 6.17. The operating activity section differs in format between
the direct and indirect approaches. However, the ‘cash inflow from operating activities’ figure is the same (in this case, 36,000), despite the convoluted way of calculating it under the indirectapproach. Adjusting the accrual-based income number for non-cash revenues and expenses andfor the movement in operating working capital is equivalent to deducting operating outlays fromoperating receipts. The investing and financing activity sections of the statement are identicalunder the two approaches.
A simple example will help to demonstrate the equivalence of the two layouts. Consider the tuition fees of 95,000 the company receives in cash in year 2. Exhibit 6.18 shows how thatnumber can be obtained either from the cash account (the direct approach) or from the tuitionfee revenue and related working capital accounts (the indirect approach).
The link between accrual-based expenses and operating expenditures can be demonstrated ina similar manner.
142 PART 1 • FOUNDATIONS
Out of Babel Company Cash flow statement for year 2: indirect approach
(amounts in 000)Operating activitiesProfit for year 14Add back expenses/deduct revenues not involving cash:
+ Depreciation +4.5Adjust for changes in non-cash working capital:
– Increase in accounts receivable –3– Increase in accrued interest receivable –0.4– Increase in supplies inventory –2+ Decrease in prepaid rent +8+ Increase in accounts payable +1+ Increase in accrued interest payable +0.9+ Increase in fees received in advance +12+ Increase in accrued salaries payable +1
+17.5Cash inflow from operating activities 36
Investing activitiesPurchase of equipment –25Cash outflow on investing activities –25
Financing activitiesBank loan +15Issuance of shares +10Cash inflow from financing activities +25
Net increase in cash 36Cash and cash equivalents, 1/1/year 2 11
Cash and cash equivalents, 31/12/year 2 47
Exhibit 6.17
(Sources: Exhibit 5.8 for ‘profit for year’ and depreciation, and Exhibits 6.15 and 6.16.)
CFA_C06.qxd 11/6/03 2:22 PM Page 142

l Analysing the cash flow statement: an illustrationIn earlier chapters we looked at the income statement and balance sheet of the European super-market chain, BestPrice Stores. The cash flow statement in its x2 accounts is set out in Exhibit 6.19.
BestPrice follows majority practice. It presents cash flows by activity and uses the indirectapproach to calculate operating cash flow.
CHAPTER 6 • THE ANNUAL REPORT AND ACCOUNTS 143
Out of Babel CompanyCalculation of tuition fee receipts by direct and indirect approaches
(all amounts in 000)Direct approach
Cash
Dr. Cr.. .. .. .(3) Fees in cash 45 (5) Collection
of debts 32 Fees received 95 (9) Fees in
advance 18 . .. .. .
Indirect approachRevenues from fees (OE)
Dr. Cr.(3) Fees earned 80(A6) End-year
adjustment 686 Fee revenue 86
Accounts receivable (A)
Dr. Cr.
Balance, 1/1/year 2 6 (5) Fees Increase(3) Fees on credit 35 received 32 in
accountsBalance, receivable –331/12/year 2 9
Unearned fee revenue (L)
Dr. Cr.Balance, 1/1/year 2 0 Increase
(A6) Fees earned 6 (9) Fees in advance 18 in unearnedfee
Balance, revenue +1231/12/year 2 12
Fees received 95
Exhibit 6.18
CFA_C06.qxd 11/6/03 2:22 PM Page 143

BestPrice’s statement is similar to those of other companies in another respect – the apparentjumble of items within each cash flow activity. Unlike the income statement, the cash flow statementdoes not have an easily understandable structure. There is no equivalent to ‘operating revenues’which provides an anchor for the analysis of the income statement. How then do investors makesense of the cash flow statement? Here is an approach they use – and you may find helpful.
l Start with operating cash flow (OCF). This is a key number in the statement. Operations arethe company’s motor and usually the main source of its cash inflows. Is OCF positive? If yes,is it greater than profit for the year? The OCF of a mature company usually exceeds profitowing to depreciation and other non-cash expenses. For a fast-growing firm, however, OCF
144 PART 1 • FOUNDATIONS
BestPrice StoresConsolidated cash flow statements for x2 and x1
(amounts in A millions)Year to 31 December x2 x1
Cash flows from operating activitiesIncome after tax 355 292Adjustments for:Depreciation, amortisation and changes in provisions +376 +317Deferred taxes +30 −3Gains on disposal of fixed assets −16 −27Other adjustments −12 −44
733 535Changes in operating working capital:Inventories −188 −84Receivables −466 −240Payables +379 +328
Net cash inflow from operating activities 458 539
Cash flows from investing activitiesPurchases of tangible and intangible fixed assets −689 −701Disposals of tangible and intangible fixed assets +84 +53Purchases of long-term financial investments −184 −78Disposals of long-term financial investments +39 +69Acquisitions of businesses, net −53 −502
Net cash outflow on investing activities −803 −1,159
Cash flows from financing activitiesDividends paid −136 −115Proceeds from issuance of shares for cash +622 −Additions to debt +1,980 +1,426Retirements of debt –1,806 −610
Net cash inflow from financing activities +660 +701
Impact of exchange rate fluctuations +2 +35
Net change in cash and cash equivalents +317 +116
Cash and cash equivalents at start of year 825 709
Cash and cash equivalents at end of year 1,142 825
Exhibit 6.19
CFA_C06.qxd 11/6/03 2:22 PM Page 144

CHAPTER 6 • THE ANNUAL REPORT AND ACCOUNTS 145
is likely to be low or even negative because of its large investment in operating working capital. Note that negative operating cash flow is not necessarily a sign of poor health. Fast-growing firms have a big appetite for cash – payments for inputs to be manufactured and soldnext period exceed the receipts for goods sold in this and previous periods – even when theiroperations are highly profitable.
BestPrice’s OCF exceeds the group’s after-tax income in both x1 and x2. This is largelythanks to non-cash charges (‘depreciation, amortisation and changes in provisions’). Thechanges in operating working capital had little overall impact on OCF in x1 (the increases inpayables offset the increases in inventories and receivables) but decreased it by a275 million inx2 (because inventories and receivables grew at a faster rate than payables). As a result, OCFfell by 15% between x1 and x2 (from a539 million to a458 million) even though after-taxincome rose by over 20% during this period.
l Compare OCF with dividends and net capital expenditures (purchases less disposals of tangible and intangible fixed assets) in the period. A profitable, mature firm is likely, over thebusiness cycle, to finance regular cash dividends and capital expenditures out of OCF. It haspositive ‘free cash flow’. A fast-growing or loss-making firm cannot finance both outlaysinternally. It has negative free cash flow.9
BestPrice’s free cash flow was negative in x1 and x2. The company invested heavily in tangible and intangible fixed assets in both years. In fact, net capital expenditures (i.e. net of disposals) exceeded OCF even before taking account of dividend payments (which rose in line with profits).
l Determine the effect of the company’s positive or negative free cash flow on its invest-ments and finances. Suppose it has surplus funds. How does it use them? Is it expanding (byacquiring other firms)? Is it returning capital to creditors (repayment of long-term debt) andowners (special dividends, share repurchase)? Suppose it has negative free cash flow. Howdoes it finance the shortfall? Is it selling financial investments? Is it raising new capital?
The analysis can be extended. Suppose the company makes a major acquisition whichrequires external financing. Which type of capital does it choose – debt or equity?
BestPrice’s investing outlays in x1 and x2 were swollen by acquisitions of businesses (in x1)and purchases of shareholdings in other companies (in x2). To finance these outlays – and thenegative free cash flows in both years, the company resorted to outside finance. It relied on borrowings in x1 but turned to its shareholders for funds in x2. New equity and borrowings in x2 covered the cash flow shortfall of a481 million and bolstered the company’s cash balancesas well. BestPrice’s cash flows in x1 and x2 are summarised below:
(In B million) x2 x1
Operating cash flow 458 539Capital expenditures, net* −605 −648Dividends paid −136 −115
‘Free cash flow’ −283 –224Acquisitions of business, net −53 −502Net purchases of long-term financial investments −145 −9
–481 −735Issuance of shares for cash +622 −Borrowings (net of debt repayments) +174 +816Impact of exchange rate fluctuations +2 +35
Net increase in cash and cash equivalents** +317 +116
* Purchases less disposals of tangible and intangible fixed assets** The company defines cash and cash equivalents as cash + marketable securities –
short-term bank loans.
CFA_C06.qxd 11/6/03 2:22 PM Page 145

The simple framework shown above can be used to analyse the cash flows of all non-financialinstitutions. We return to the subject of cash flow analysis and examine it in greater depth in alater chapter.
Popular financial ratios among investorsEuropean companies often disclose financial ratios in the annual report voluntarily, usually inmanagement’s report to shareholders or as part of the ‘financial highlights’ of the year. The ratiospresented vary from company to company: measures of profitability, liquidity and leverage likethose described in Chapters 2 and 3 are the most popular.
l Earnings per shareOne ratio which many large European quoted companies publish is earnings per share (EPS). Itshows the company’s profit for the period on a per-share basis. More precisely, it is:
Note the calculation of the numerator. In consolidated accounts, it is the profit or loss attributableto the parent company’s ordinary shareholders. Thus group income attributable to subsidiarycompanies’ outside shareholders (‘minority interests’) is excluded; so too are dividends earnedby preference shareholders.
Controversy surrounds the purpose of the ratio. Should EPS show profits attributable to existing shares only – or to existing and likely future shares as well? Consider the effect of dilutivesecurities on EPS. These are securities such as convertible bonds and share options which, whenconverted or exercised in the future, may increase the number of outstanding shares relative toreported earnings. This reduces (dilutes) EPS. Should the current EPS figure reflect the impactof such future dilution? Under new international rules, quoted companies are required to dis-close actual EPS (‘basic EPS’) and, if potential dilution is material, a hypothetical EPS number(‘diluted EPS’). We discuss the calculation of EPS in more detail in a later chapter.
For quoted companies, EPS is an important statistic. It’s often cited in the annual report – alongwith sales, operating profits and dividends. Some firms set a minimum annual percentage growthin EPS as a financial target. Its influence is greater still because it’s employed in other key ratios.One of these is the price/earnings ratio (P/E ratio or multiple):
The ratio is unusual in that it combines market and accounting data. It tells potential investors howmany years it will take them to recover, through corporate earnings, an investment made in a com-pany at today’s market price, assuming those earnings remain at current levels. Thus a P/E ratio of12 indicates that the investment recovery period is 12 years at the firm’s current level of earnings.
Of course, earnings are not expected to remain at current levels. Investors expect them togrow. The faster the expected rate of growth of earnings, the higher the price investors will payfor them. Thus the P/E ratio is an indicator of a company’s growth prospects, as perceived by themarket. (Not all shares with high P/E multiples are ‘growth stocks’. A company recovering froma period of low profits can also enjoy a high P/E ratio.)
P/E ratios can change daily, as the market price of a company’s shares fluctuates. The impactof earnings changes is felt less frequently. The EPS figure is updated each quarter or half-year,depending on how frequently the company publishes interim accounts. It’s based on the earn-ings over the immediate previous 12 months (the four most recent quarters or two most recenthalf-years).
P/E ratioCurrent market price per ordinary share
Most recent 12 months EPS
’ =
EPSAfter tax profit or loss in period attributable to ordinary shareholders
Weighted average ordinary shares outstanding during period
,
=
-
146 PART 1 • FOUNDATIONS
CFA_C06.qxd 11/6/03 2:22 PM Page 146

CHAPTER 6 • THE ANNUAL REPORT AND ACCOUNTS 147
Analysts often estimate prospective P/E ratios. A prospective P/E ratio relates a firm’s currentshare price to (the analyst’s) forecast of its earnings for the current financial year. Since the shareprice is itself forward-looking (it’s the discounted value of the firm’s expected future earnings),analysts argue this version of the P/E ratio is a better guide to market sentiment about a company’sfuture performance.
l Dividend coverAs we’ve seen, a company’s directors propose, and shareholders approve, the distribution of itsprofits. The dividend is expressed as an amount per share (hereafter DIV). Investors monitor afirm’s dividend cover, which is calculated as follows:
The ratio shows the number of times current earnings cover dividend payments.Dividend cover can be less than one. An uncovered dividend indicates that the company
draws on past years’ retained profits to meet the dividend. Many companies try to ensure thatthe dividend (for a given investment in ordinary shares) grows steadily over time. Only in timesof economic difficulty will a company cut its dividend. Dividend cover is therefore an indicatorof investment risk.
The reciprocal of dividend cover is the payout ratio (DIV/EPS). You will find both termsemployed in annual reports and the financial press.
l Accounting and market rates of returnA postscript to our discussion of stock market-oriented financial ratios: the rates of return dis-cussed in Chapter 3, ROE (return on equity) and ROA (return on assets), are accounting ratesof return. Investors in publicly quoted companies use an additional performance measure. Theycalculate, for each company, the market return on the capital they have invested. The marketrate of return in a period is the sum of:
l the per-share dividend paid by the firm in the period; andl the change (increase or decrease) in the share’s market price between the start and end of the period;
all deflated by the share’s start-of-period market price. Thus for period t:
where the dividend (DIV) is received at the end of the period.A firm’s ROE and market rate of return will not be the same, except by coincidence. They
measure different things. ROE (and ROA) measure past performance, using accounting num-bers. The market rate of return incorporates, through the change in the share price, the changein the market’s expectations about the company’s future prospects.
Differences in UK/US accounting terms in financial reports
It’s said of the UK and the USA that they are two nations divided by a common language. Investorsare reminded of this saying when reading English-language accounts. To minimise confusion, we’veused American terminology up to now. Exhibit 6.20 gives the British equivalent of key account-ing terms in order to help you ‘translate’ accounts from British English.
Market rate of returnDIV (P P )
P1
1
==++ −− −−
−−
t t t
t
Dividendcover
EPS
DIV
Per share earnings in periodattributable to ordinary shareholders
Per share cash dividend paid proposedto ordinary shareholders in period
/
= =
-
-
CFA_C06.qxd 11/6/03 2:22 PM Page 147

148 PART 1 • FOUNDATIONS
We’ll continue to use American terminology because you are more likely to find it in theEnglish-language financial reports of European companies. However, in certain circumstances –for example, when discussing shareholders’ equity in EU company accounts – we employ BritishEnglish terms because of their legal significance.
Summary
We turn from core to context in this chapter. In previous chapters, we focused on how a com-pany constructs its balance sheet and income statement. In this chapter, we look more broadly atthe corporate annual report of which these financial statements form a part.
We first outlined the contents of the annual report and accounts of a typical (large) EU company. We then discussed key sections in them, in particular management’s report to share-holders, the main financial statements and their format, the notes and the auditors’ report, usingBestPrice’s x2 annual report and accounts as an example. Here are some key points from our discussion:
l The management report is of great help to investors. They can check whether management’sexplanation of the company’s results is consistent with the numbers in the annual accounts. Thereport also contains information investors use in forecasting its future profits and cash flows.
l The balance sheets of EU companies do not share the same format, nor do their income statements. Yet the accounting is not affected. A company’s total assets and net profit are stillthe same, whichever format is used. If it classifies expenses by nature, however, it may not bepossible to calculate its gross profit.
l Not all items of income are in the income statement. Some like unrealised gains go direct toreserves in the balance sheet. Companies following international accounting standards now
American English (AE) British English (BE)Balance sheet
Account receivable Trade debtorInventory Stock
Account payable Trade creditor
Stockholders’ (or Shareholders’ fundsshareholders’) equity (or Capital and reserves)
(shares of ) Common stock Ordinary shares(shares of ) Preferred stock Preference sharesAdditional paid-in capital Share premium accountRetained earnings Profit and loss account
Income statement (AE)/Profit and loss account (BE)Operating revenue Turnover(i.e. from sales of goods and services)Interest income Interest receivableInterest expense Interest payable
Financial analysisLeverage Gearing
Differences in accounting terminology: American and British EnglishExhibit 6.20
CFA_C06.qxd 11/6/03 2:22 PM Page 148

APPENDIX
6.1
include a new statement within the accounts which shows the company’s comprehensiveincome in the period or allows investors to compute it more easily.
l Management prepare the accounts; auditors express an opinion on them. From an investor’sstandpoint, what matters is the auditors’ judgement as to the picture those accounts convey– do they give a ‘true and fair view’ of the company’s financial results and condition for thatperiod.
Next, we introduced a third financial statement, the cash flow statement, which many EUcompanies include in their annual accounts. This is not yet a legal requirement in all EU coun-tries. We showed how the statement is usually presented and illustrated an approach commonlyused by investors when interpreting the numbers in it.
We described certain financial ratios which are widely cited in the financial press and oftendisclosed in the annual report. The most important is earnings per share. It’s used alone as a per-formance measure and, in combination with the company’s share price (via the P/E ratio), as anindicator of the company’s expected growth prospects. We concluded the chapter with a list ofaccounting terms where the British version differs from the American one used in this book.
The EU’s company law harmonisation programme
The European Union is a federation of European countries, 15 in number as of 2003, that havesigned the Treaty of Rome (1957) and amending treaties.10 Its aim, in broad terms, is to fostereconomic and political union within Europe.
The main political institutions of the Union are the Commission, the Parliament, the Councilof Ministers, and the Court of Justice. Each is involved in legislative programmes such as company law harmonisation. The European Commission proposes new laws (it has otherresponsibilities and powers). Parliament debates them, amending or, in some cases, rejectingthem. The Council – which brings together national ministers in charge of each policy area –decides them. The Court of Justice plays a key role in the enforcement of EU law. The majorityof its rulings concern the non-implementation or incorrect implementation of directives by member states.
What form does EU law take? The Treaty of Rome specifies three types of instrument theCouncil of Ministers can use to establish law in member states. They are:
1 Directives. A directive specifies the result to be achieved by legislation. National authorities candecide how it is implemented. It applies only to the member state(s) addressed. Company lawdirectives implemented to date are addressed to all member states.
2 Regulations. A regulation applies directly in all member states. It does not require national legislation.
3 Decisions. A decision also applies directly – but only to the entity addressed. This may be amember state, a company or even an individual.
The Council can also make recommendations (and issue opinions). These have influence but nolegal force.
The Council has issued various directives to promote the harmonisation of company lawwithin the Community. It’s argued that such harmonisation is essential if goods, services, labourand capital are to move freely among member states. For example, companies may be reluctantto supply goods and services to firms in other member states if they cannot obtain financialinformation about them. Company law directives cover the following matters:
CHAPTER 6 • THE ANNUAL REPORT AND ACCOUNTS 149
CFA_C06.qxd 11/6/03 2:22 PM Page 149

150 PART 1 • FOUNDATIONS
l disclosure of constitutional information about the firm, e.g. its charter and by-laws (1stDirective, 1968);
l minimum requirements for the formation and continuing operation of public companies(2nd Directive, 1977);
l mergers and demergers of public companies within member states (3rd Directive, 1978, and6th Directive, 1982);
l format and content of annual accounts (4th Directive, 1978). Separate directives have beenissued dealing with the accounts of banks and other financial institutions (1986) and of insur-ance companies (1991);
l consolidated accounts (7th Directive, 1982);l qualification of auditors (8th Directive, 1984);l disclosure requirements for branches of companies (11th Directive, 1988); l establishment of single shareholder companies (12th Directive, 1988).
Directives have been drafted (but not yet adopted) on the structure and management of publiccompanies (5th), on cross-border mergers (10th) and on public offers (i.e. takeover bids) (13th).
The 4th and 7th Directives are known as the ‘accounting directives’. They apply to all limitedliability companies within the EU. Because companies in some member states sought to avoid the requirements of the accounting directives – for example, by forming a partnership ofwhich one or more of the partners is a limited liability company – the Commission extendedtheir reach in 1990. They now cover partnerships, limited partnerships and unlimited companiesas well.
The Commission has long believed that the EU needs a single large securities market to allow firms to raise debt and equity capital at lower cost. One of the steps needed to create such a market, in its view, is greater comparability of financial statements, so that investors cancompare companies’ financial results and condition more easily and allocate their capital moreefficiently. To this end it drafted a regulation requiring that by 2005 all listed EU firms pre-pare consolidated accounts according to international accounting standards (IAS). In 2001 itamended the 4th and 7th Directives (and those relating to banks’ and insurance companies’accounts) to bring their valuation rules in line with IAS.
There are two other EU initiatives which may have a significant effect on the legal form of European business organisation in the future. Since 1989, small and medium-sized enter-prises (SMEs) from different member states can set up a form of partnership called a ‘Europeaneconomic interest grouping’ (EEIG). The aim is to make it easier for SMEs to pursue joint activities such as research and development projects across borders. An EEIG is a new entity. It’s incorporated directly into EU law, although it’s governed by the laws of the member statesin which it is registered and operates. It has full legal capacity, i.e. it can enter into contracts in its own name but, as a form of partnership, profits are taxed in the hands of its corporatemembers.
In addition, the Council of Ministers approved in 2001 a regulation permitting the establish-ment of a European company (Societas Europea, or SE). The regulation allows firms from different member states to create a corporate vehicle – by merger, setting up a joint subsidiaryor forming a holding company – to pursue cross-border ventures. The advantage of an SE, it’s claimed, is that it overcomes the problems associated with national legal entities for such ventures. National law has limited territorial reach and this can make disputes among corporateshareholders from different member states difficult and costly to resolve.
CFA_C06.qxd 11/6/03 2:22 PM Page 150

CHAPTER 6 • THE ANNUAL REPORT AND ACCOUNTS 151
Problem assignments
P6.1 Earnings, cash flow and dividends(1) The following item appeared in the financial section of a European newspaper:
Cash flow behind rise at KerryKERRY GROUP, the west of Ireland-based meat, dairy and food ingredients company, achieved a28 per cent increase in pre-tax profits to I£13.6 m (£12.8 m) for the six months to June 30. . . .
The profits increase was largely due to strong cash flow of I£29 m and lower interest rates in theUS, UK and Ireland, where Kerry has a geographically even spread of business. . . .
Required
Comment on the above news item. Under what circumstances does an increase in cash flow lead toan increase in profits?
(2) In an article on Tele-Communications Inc. (TCI), a major US cable-TV company, a business news-paper drew attention to the company’s high operating cash flow and the way it is employed:
Like many cable firms, TCI ploughs that cash back into the business instead of paying dividends: ithas not made a profit [in the past four years].
Required
(a) What is the likely reason that TCI has a high operating cash flow but reports losses?
(b) The newspaper states that TCI could have paid a dividend but chose to ‘plough that cash backinto the business’. Under what circumstances can a loss-making company pay a dividend?
CFA_C06.qxd 11/6/03 2:22 PM Page 151

P6.2 Income statement format and terminologyOMV Group is one of Austria’s largest listed companies and a leading European oil and gas group.The English-language version of its 2000 consolidated income statement is set out in Exhibit 6.21.
Required
Find or derive the following income numbers for the OMV Group in 2000. If the number cannot bederived, explain why.
(a) Gross profit.
(b) Operating profit.
(c) Net profit of the group.
(d) Net profit attributable to the parent company’s shareholders.
(Hint: Items 4 and 5 on the income statement can be considered adjustments to operating expenses.)
152 PART 1 • FOUNDATIONS
In B000 2000
1. Sales, including petroleum excise tax 9,218,4542. Petroleum excise tax (1,763,986)3. Subtotal of items 1 to 2 (Net sales) 7,454,4684. Changes in inventories of finished products, work in progress
and services not yet invoiced 6,9075. Other own work capitalised 19,0786. Other operating income 86,3727. Cost of material and services (5,623,733)
8a. Personnel expenses (409,695)8b. Expenses for severance payments and pensions (177,550)9. Depreciation and amortisation (320,063)
10. Other operating expenses (545,291)11. Subtotal of items 3 to 10 (Earnings before interest and tax) 490,49312. Income from investments 16,73713. Income from other securities and loans shown under financial assets 15,87014. Other interest and similar income 37,52415. Income from the disposal and write-up of financial assets
and securities held as current assets 1,98916. Expenses arising from financial investments and
securities held as current assets (8,864)17. Interest and similar expenses (101,013)18. Subtotal of items 12 to 17 (Financial items) (37,757)19. Income from ordinary activities 452,73620. Taxes on income (130,174)21. Net income for the year 322,56222. Allocation to revenue reserve (205,010)23. Minority interests (1,448)24. Income brought forward 525. Unappropriated income 116,109
OMV Group: consolidated statement of income for 2000Exhibit 6.21
(Source: OMV Group, Annual Report and Accounts 2000. Reproduced by permission of OMV Aktiengesellschaft.)
CFA_C06.qxd 11/6/03 2:22 PM Page 152

P6.3 Balance sheet format and terminologySet out below is the consolidated balance sheet at 23 February 2002 of Tesco plc, a large UK retailer:
£m
Fixed assetsIntangible assets 154Tangible assets 11,032Investments 317
11,503
Current assetsStocks 929Debtors (of which 81 due after more than one year) 454Investments 225Cash at bank and in hand 445
2,053Creditors falling due within one year (4,809)Net current liabilities (2,756)Total assets less current liabilities 8,747
Creditors falling due after more than one year (2,741)Provisions for liabilities and charges (440)Net assets 5,566
Capital and reservesCalled up share capital 350Share premium account 2,004Other reserves 40Profit and loss account 3,136Equity shareholders’ funds 5,530Minority interests 36Total capital employed 5,566
Required
You want to compare Tesco’s balance sheet with that of a large non-UK retailer which uses a US-styleformat and US terminology in the English-language version of its annual accounts. To do so, you haveto make certain adjustments to the format and wording of Tesco’s balance sheet. As part of this exer-cise, determine the following balances at 23 February 2002:
(a) total assets;
(b) working capital;
(c) equity attributable to parent company’s shareholders;
(d) retained earnings.
P6.4 Identifying operating, investing and financing cash flows
Van Baerle Company, a seed and bulb producer, is famous for its tulips, especially the almost blackvariety, Tulipa ‘A. Dumas’.
The company wants to prepare a cash flow statement for x9 and asks you to calculate the keynumbers in it. It gives you a summary of the company’s cash account for the year. This is shown inExhibit 6.22.
CHAPTER 6 • THE ANNUAL REPORT AND ACCOUNTS 153
CFA_C06.qxd 11/6/03 2:22 PM Page 153

154 PART 1 • FOUNDATIONS
Required
Calculate the following totals for x9:
(a) after-tax operating cash flow;
(b) investing cash flow;
(c) financing cash flow.
P6.5 Construction of simple cash flow statementSonne AG is a magazine publisher and distributor. Set out in Exhibit 6.23 are the company’s balancesheets at the start and end of year 7, together with its income statement for year 7.
A summary of the company’s ledger account, Cash, is presented below. The amounts are also inthousands.
Cash
Dr. Cr.
Balance, 1/1/year 7 37 Purchase of buildings and equipment 49Sale of land 14 Purchase of investments 3Collection of debts from credit Payments for paper and other inventories 185
customers 58 Payments for rent 12Long-term loan 50 Payments of dividends 8Receipts from new subscriptions 98 Tax payments 7Cash sales of magazines 80 Other operating outlays 16
Interest payments 6
Balance, 31/12/year 7 51
Van Baerle CompanyCash account: transactions in x9
(amounts in 000)
Cash
Balance, 1/1/x9 32 Salaries paid 124
Disposal of building 37 Dividends paid 4Increase in long-term debt 181 Payments to suppliers of goodsReceipts from customers 432 and services 204Disposal of long-term investment 11 Short-term debt repaid 39Issue of new shares 135 Corporate income taxes paid 16
Purchase of equipment 406Payment of rent 18
Balance, 31/12/x9 17
Exhibit 6.22
CFA_C06.qxd 11/6/03 2:22 PM Page 154

CHAPTER 6 • THE ANNUAL REPORT AND ACCOUNTS 155
Sonne AGSummary accounts for year 7
(amounts in 000)
Balance sheet at 31 December
year 6 year 7 year 6 year 7Fixed assets Shareholders’ equityLand 26 20 Share capital 75 75Building and equipment 53 102 Retained profits 38 45Less: Accumulated 113 120
depreciation –29 –41 Long-term liabilities 0 5024 61 113 170
Investments 25 2875 109 Current liabilities
Accounts payable, paperCurrent assets suppliers 53 59Inventories 54 65 Taxes payable 4 7Accounts receivable 9 11 Unearned subscriptionPrepaid rent 5 8 revenues 10 8Cash 37 51 67 74
105 135Total assets 180 244 Total equities 180 244
Income statement for year 7Revenues from: cash sales 80
credit sales 60subscription sales 100
Total revenues 240Less: Cost of sales –180
Gross profit 60Less: Operating expenses
Rent on leased asset –9Depreciation on buildings and equipment –12Other operating expense –16Gain on sale of land +8
–29Operating profit 31
Interest expense –6Profit before tax 25
Income taxes –10Net profit 15
Exhibit 6.23
CFA_C06.qxd 11/6/03 2:22 PM Page 155

Required
(a) Explain the change in each of Sonne’s balance sheet accounts between the start and end of year7, using information from the year 7 income statement and the movement in the cash account during the year. For example:
156 PART 1 • FOUNDATIONS
(b) Prepare a cash flow statement for Sonne for year 7, showing separately cash flows from operating,investing and financing activities. Calculate its cash flow from operations by the direct approach.Classify interest payments and tax payments as operating outflows and dividend payments asfinancing outflows.
(c) Calculate Sonne’s year 7 cash flow from operations using the indirect approach.
(d) What does the cash flow statement tell us about Sonne’s activities in year 7?
Check figure:(c) Cash flow from operations 10
P6.6 Understanding cash flow terminology‘MetroModa is getting to be as laid back as its clothes. Operating working capital soared by over A200million in x1, absorbing cash needed for expansion and contributing to negative free cash flow that year.The company has a great product line. If only its financial management were in the same league . . .’
MetroModa, a specialist designer and manufacturer of ‘smart casual’ clothes, is enjoying rapid growth,thanks to the movement towards less formal attire in the office. However, the company has attractedcriticism among professional investors for its poor working capital management and high financialleverage.
This criticism attracts the notice of the company’s non-executive directors. One of them saw theabove comment in the Green Eye Shade column of the Business News, a prominent weekly newspaper,shortly after the company released its x1 results. He contacts the chief financial officer of the com-pany and asks some questions (see below). The CFO is busy negotiating several acquisitions at present and, knowing your financial analysis skills, she asks you to deal with them. Extracts fromMetroModa’s x1 accounts are given in Exhibit 6.24.
Required
Answer the following questions raised by the non-executive director, using information inMetroModa’s x1 accounts.
(a) ‘How can working capital have increased by over A200 million in x1? By my calculations, workingcapital was A150 million at the end of x0 and A322 million at the end of x1. That’s an increase ofonly a172 million – a big increase, to be sure, but less than the figure quoted in Business News.’
(b) ‘What is “free cash flow”? It’s not stated anywhere on the cash flow statement. Is it the same as“net increase in cash”? If so, this is a positive, not a negative, figure.’
(c) ‘Is the figure for depreciation in the cash flow statement correct? According to the balance sheet,depreciation was A786 million in x1. I assume that’s the number that should be in the cash flow state-ment. It can’t be the change in depreciation between end-x0 and end-x1. That’s only A136 million.’
Gain/lossLand Cash on asset disposal
BB 26Sale 6 Sale of Gain on(at cost) land 14 land sale 8
. .. .. .
EB 20
.........
CFA_C06.qxd 11/6/03 2:22 PM Page 156

CHAPTER 6 • THE ANNUAL REPORT AND ACCOUNTS 157
MetroModa SAExtracts from x1 accounts
(amounts in A million)
Balance sheet at 31 December
x1 x0 x1 x0
Current assets Current liabilitiesCash and marketable securities 122 110 Accounts payable 211 170Accounts receivable 243 140 Accrued expenses 51 55Inventories 348 200 Taxes payable 33 25Prepaid expenses 57 50 Bank loans 153 100
770 500 448 350
Fixed assets Long-term loans 430 300Property, plant and equipment 1,819 1,600Less: Accumulated depreciation –786 –650 Shareholders’ equity
1,033 950 Contributed capital 200 200Retained profits 725 600
925 800
Total liabilitiesTotal assets 1,803 1,450 and shareholders’ equity 1,803 1,450
Cash flow statement for x1Operating activitiesNet profit 175Depreciation 150Changes in operating working capital:
Accounts receivable –103Inventories –148Prepaid expenses –7Accounts payable 41Accrued expenses –4Taxes payable 8
Net cash inflow from operations 112
Investing activitiesPurchase of plant and equipment –240Sale of property 7Net cash outflow on investing activities –233
Financing activitiesIncrease in bank loans 53Increase in long-term loans 130Dividends paid –50Net cash inflow from financing activities 133
Net increase in cash 12Cash and marketable securities, start-x1 110Cash and marketable securities, end-x1 122
Exhibit 6.24
CFA_C06.qxd 11/6/03 2:22 PM Page 157

P6.7 Ratios in the financial pressNewspapers such as the Financial Times and the Wall Street Journal publish share price and dividenddata for quoted companies every day. Set out below are data for three large international retailers.The companies have their headquarters in France, UK and USA respectively. Although the businessstrategy each pursues is slightly different, investors benchmark each company’s performance againstthe others’. The share price and market capitalisation figures are taken from the 29 April 2002 editionof the Financial Times.
Share price Mkt cap. (closing) (in million) Yield, gross P/E ratio
Carrefour A49.52 A35,216 1.1 29.1Tesco £2.63 £18,214 2.1 21.8Wal-Mart $55.80 $248,378 0.5 37.4
Notes:(i) Mkt cap.: Shares outstanding × share price
(ii) Yield, gross:
Required
(a) Estimate Carrefour’s net income (in euros) in the latest 12 months (to end-March 2002).
(b) Calculate the dividend cover (or its reciprocal, the payout ratio) as of end-April 2002 for each ofthe three companies.
(c) Wal-Mart’s P/E ratio in April 2002 is much higher than that of the other two companies. Suggestpossible reasons for this.
Check figure:(b) Wal-Mart: Dividend cover 5.3 times
Notes to Chapter 6
1 The full title is ‘Fourth Company Law Directive’. The appendix to the chapter lists the directivesalready implemented under the EU’s company law harmonisation programme.
2 Documents filed with the SEC are now available on the SEC’s EDGAR website. These documentsinclude quarterly and annual reports, prospectuses and reports recording occurrence of ‘material’events. The filing requirements apply to all companies, non-US as well as US, whose securities arelisted on a recognised US stock exchange.
3 Smith, T. (1996), Accounting for Growth, 2nd edition, London: Random House, chapter 19.4 The ‘land’ that Carrefour depreciates represents the premium (over alternative use value) that the
company has paid to acquire a site for retail development. Land itself is not usually depreciated.5 Both the 4th Directive and international accounting standards require firms that invoke the ‘true and
fair view override’ to explain the reasons for departing from 4th Directive (IAS) requirements and tostate the effect of the departure on their accounts (4th Directive, Art. 2 (4) and (5); IAS 1, Presentationof Financial Statements, para. 13). For an interesting discussion of the ‘true and fair view’ concept in aEuropean context, see The European Accounting Review (1997), 6(4): 673–730.
Note that the phrase found in US-style audit reports, namely ‘present fairly in accordance with gen-erally accepted accounting principles (GAAP)’, is similar in intent to the European wording. However,there is no ‘present fairly override’: US firms must follow US GAAP in all circumstances.
6 The upper limits for net turnover and balance sheet total apply from July 2003 (EU Council Directive2003/38/EC).
Per-share dividend (before withholding tax)Share price
× 100
158 PART 1 • FOUNDATIONS
CFA_C06.qxd 11/6/03 2:22 PM Page 158

7 In some European countries, companies include in their accounts a statement showing sources anduses of funds rather than cash. ‘Funds’ in this context means working capital and is a less liquid measure of resource flow than cash. We illustrate the funds flow statement when we revisit the cashflow statement in Chapter 18.
8 Note that most investors and analysts are unable to use this approach since they don’t have access tothe company’s ledger accounts. In this case, they must derive an approximate cash flow statementusing balance sheet and income statement data.
9 There is no agreed definition of ‘free cash flow’. All versions contain at least two elements: operatingcash flow or equivalent (i.e. profit plus depreciation and amortisation) less capital expenditures in thesame period. We look again at this concept in Chapter 18.
10 As of 2003, the member states are: Belgium, France, Germany, Italy, Luxembourg, Netherlands(founder members); Denmark, Ireland, UK (joined in 1973); Greece (1981); Portugal and Spain(1986); Austria, Finland, and Sweden (1995). Countries due to join the EU in 2004 are: Cyprus, theCzech Republic, Estonia, Hungary, Latvia, Lithuania, Malta, Poland, Slovenia and the Slovak Republic.
CHAPTER 6 • THE ANNUAL REPORT AND ACCOUNTS 159
CFA_C06.qxd 11/6/03 2:22 PM Page 159

CFA_C06.qxd 11/6/03 2:22 PM Page 160

The house of accounting
PART 2PART 2
CFA_C07.qxd 11/6/03 2:23 PM Page 161

CFA_C07.qxd 11/6/03 2:23 PM Page 162

Key conceptual issues infinancial accounting
INTRODUCTIONLet’s take stock of where we are. In the previous chapters, we learned about thefoundations of the accounting ‘building’. We identified the main financialstatements: we discovered what purpose each statement serves and how it’sconstructed. We found out where the numbers in the statements come fromby following the accounting cycle from transaction through to trial balance.These foundations are common to all companies.
Our task now is to explore the building, floor by floor. This involves exam-ining each category of asset and equity to see what particular accounting andreporting problems each gives rise to. The notes to the accounts are of greathelp here. They tell us the accounting policies the firm follows, that is, how it has accounted for various types of transactions. Policies are, in some cases,the result of management decisions and are company-specific. In many cases,however, they are dictated by accounting standards and corporate law and applyto all firms. We aim to shed light on firms’ accounting policies – what theymean, what effect they have on the financial statements – in Chapters 8 to 17.
Before exploration of the building begins, we need to know more about itsstructure. This is the aim of this chapter. We discover at the outset that the fin-ancial statements of all companies rest on certain general ‘principles’: the goingconcern assumption, consistency, prudence, the accruals concept. These affect,directly or indirectly, each firm’s accounting policies. Today these principles areconsidered insufficient. They leave unanswered important questions such as:
l What should be the objectives of financial reporting?l What are desirable characteristics of information in financial statements? l How should key elements such as assets and liabilities be defined? When
should they be recognised? How should they be valued? And what’s theimpact of valuation on profit?
Accounting standard-setters have completed a major project to tackle thesequestions. The project’s goal was to provide a ‘conceptual framework’ foraccounting – a plan of the accounting building, if you like – which would guidestandard-setters and corporate management and thus influence the form andcontent of firms’ accounting policies in the future. We raised some of the issuesin this conceptual framework in earlier chapters. We explore others in this one. Inparticular, we investigate the various ways assets and liabilities can be valued andthe effect of different valuation methods on the calculation of corporate income.
77
l Accounting policiesand their origins
l Fundamentalaccounting principles
l Accounting’sconceptualframework
l A recognition test forassets and liabilities
l Measurement ofassets and liabilities
l Recognition andmeasurementcontroversies
l Capital maintenanceand themeasurement unit inaccounts
l Appendix 7.1: Anoverview of the IASBand its predecessor,the IASC
l Appendix 7.2: Presentvalue concepts – anintroduction
In this chapter
CFA_C07.qxd 11/6/03 2:23 PM Page 163

164 PART 2 • THE HOUSE OF ACCOUNTING
Accounting policies and their origins
Companies draw up their annual accounts according to a set of accounting policies. As we sawin the last chapter, each firm sets down its accounting policies in the notes to its accounts.Accounting policies comprise the methods a company uses to account for specific types of transactions or events – for example, the method of costing its inventory – and the estimates itmust make, given that events this period are affected by uncertain events in future periods. Forexample, a company’s annual depreciation charge is determined in part by managers’ estimatesof the useful lives of its fixed assets. Management are responsible for making accounting estim-ates. What about accounting methods? Who or what decides them?
Accounting methods are the result of:
l corporate and tax law;l accounting standards issued by national and international standard-setting bodies;l custom; andl professional and management judgement.
We see examples of each of these factors in the accounting policies disclosed by Eni, Italy’s lead-ing oil and gas company. Exhibit 7.1 contains extracts from the notes on accounting policies inEni’s 2001 English-language consolidated financial statements.
l Corporate law. Eni consolidates the financial statements of all companies in which it directlyor indirectly holds a majority of the voting rights or which it otherwise controls. (Insignificantsubsidiaries and those about to be sold have not been consolidated.) This is consistent withthe EU’s 7th Company Law Directive which has been incorporated into Italian law. Similarly,fixed assets have been revalued as required by Italian monetary revaluation laws.
l International accounting standards. Eni follows IAS in the absence of applicable Italianaccounting rules. Thus it prepares the cash flow statement in line with IAS 7. (Note that, from2005, IAS will supersede national accounting rules for EU listed companies like Eni.)
l Business custom. Eni recognises revenue from the sale of products when ownership is trans-ferred. This usually occurs when the customer takes delivery of them. As we saw in Chapter5, recognising revenue at the time of delivery is a long-standing practice.
l Management judgement. Management must decide how the services provided by depreciablefixed assets are likely to be consumed. Eni considers they will be consumed evenly over theassets’ lives, since it uses the straight-line method of depreciation.
l Historical background
Eni is an Italian company. To the extent that company law and business custom affect itsaccounting policies, it is Italian law and Italian custom. Does this mean that, to understand acompany’s accounts, investors must be familiar with the legal system and business customs ofthe company’s home country?
The answer is a qualified no. Many features of accrual accounting are universal. Moreover, in the EU, company law directives have removed or narrowed accounting differences betweenmember states. In addition, certain accounting practices are common to countries with a sim-ilar legal and economic history. Only a few aspects of a firm’s accounts are unique to its homecountry.
Consider the accounting and reporting practices of European and North American com-panies, for example. In the past, there were marked differences between the practices of ‘Anglo-Saxon’ and those of ‘Continental European’ firms. Within Europe, Ireland, the Netherlands
CFA_C07.qxd 11/6/03 2:23 PM Page 164

and the UK form the Anglo-Saxon group and Belgium, France, Germany, Italy and Spain are theprincipal members of the Continental European group. (From an accounting perspective, mostwestern European countries belong to the Continental European group. Danish accountingpractice, however, shows strong Anglo-Saxon influence.) A brief overview of the two differentaccounting traditions follows.1
Continental European accounting traditionIn Continental European countries, government has been the main influence on corporatefinancial accounting. Firms’ published accounts reflect more the interests and concerns of government agencies (e.g. the tax authorities, the ministry of economic planning) and creditorsthan those of equity investors.
CHAPTER 7 • KEY CONCEPTUAL ISSUES IN FINANCIAL ACCOUNTING 165
2) Summary of significant accounting and reporting policies
Basis of presentationThe consolidated financial statements of Eni have been prepared in accordance with Eni’sgroup accounting policies which are in accordance with accounting principles prescribed byItalian law and supplemented by the accounting principles issued by the Consiglio Nazionaledei Dottori Commercialisti e dei Ragioneri or, in the absence thereof and if applicable, theInternational Accounting Standards Committee. . . .
Principles of consolidationThe consolidated financial statements include the statutory accounts of Eni SpA and all Italian and foreign companies controlled by Eni SpA, directly or indirectly, either by holding the majority of the voting rights or sufficient votes to enable it to exercise control at ordinaryshareholders’ meetings. . . ....
Fixed assetsFixed assets are stated at cost as adjusted by revaluations in accordance with various Italianlaws: revaluations are included in the consolidated shareholders’ equity. . . .
Depreciation of fixed assets, except on those related to exploration and production activities,is computed on the revalued cost, using the straight-line method by applying depreciationrates that are based on the estimated remaining lives of the fixed assets....
Recognition of revenues and costsRevenues from sales of products are recognised upon transfer of title. Revenues from servicesare recognised when the services have been provided. . . ....
Statements of cash flowsThe cash flow statements are prepared in accordance with International AccountingStandards, using the indirect method....
Eni: extracts from notes to consolidated 2001 financial statementsExhibit 7.1
(Source: Eni SpA, Annual Report 2001.)
CFA_C07.qxd 11/6/03 2:23 PM Page 165

Why is this? A major reason is the ownership of firms and its effect on the way they financetheir activities. In the past, most firms in these countries were either family- or state-owned.They financed growth from reinvested profits or with debt. Because outside shareholders playeda small role in company financing, there was little demand for investor-oriented information.
Another reason is the legal system in these countries. A code law tradition prevails. Laws areframed according to a code, a set of general principles, formulated by the legislature. This meansthat only government (through its legislative branch) can initiate law.
What were the consequences for corporate accounting?
l First, the government prescribed the format of accounts and the valuation rules to be used intheir preparation. In some countries the government drew up a national chart of accountswhich firms had to use for record-keeping purposes. The tax authorities reinforced this. Theyinsisted on ‘uniform reporting’, that is a firm’s taxable profit should be the same as the profitfigure shown in its published accounts.
l Second, published accounts revealed a creditor bias. The balance sheet was considered the keyfinancial statement. Assets were conservatively valued and provisions for future liabilitiesencouraged. Mandatory appropriations of profit to legal reserves restricted firms’ ability todistribute profits to shareholders. Firms were not required to publish consolidated accountsor disclose per-share earnings, information that equity investors value.
Anglo-Saxon accounting tradition
In Anglo-Saxon countries, the form and content of published accounts owe more to the initiat-ives of management, the accounting profession and the stock exchange than to government.
The main reason is, as before, the ownership of firms and its effect on corporate financing.Legal innovations (e.g. the joint-stock company, limited liability) and active financial markets –originally in commodities and insurance, later in stocks – enabled firms to raise equity capitalcheaply. In time, ownership became diffuse as founder-owners sold their holdings to outsideshareholders. The latter demanded audited accounts and greater disclosure.
Another factor in England, Ireland and Wales (and, outside Europe, the USA and BritishCommonwealth countries) is the legal system. These countries have a common law tradition.Courts as well as the legislature shape the law. Judges consult precedent and custom when fram-ing their decisions. Thus good accounting practice influenced judges’ decisions and was incor-porated later into company law. (The impact of the legal system on corporate ownership andfinancing is explored in Box 7.1.)
In what ways did these factors affect accounting practice in Anglo-Saxon countries?
l First, published accounts were varied in format and content. For example, initially there wasno standard layout to the balance sheet or income statement. Historical cost accounting wasnot universal: for example, some Dutch firms valued fixed assets at replacement cost.
l Second, many accounting innovations introduced by firms – consolidated accounts, expensesclassified by function, interim reports – were geared to the needs of equity investors.
l Third, the tax authorities had minor influence over the preparation of accounts. They per-mitted ‘separate reporting’: a firm did not have to follow the tax code in determining its pub-lished profits.
l Lastly, the accounting profession became large and influential. By requiring firms to havetheir accounts independently audited, the British government encouraged the growth of anaccounting profession and British accountants later exported their skills to other English-speaking countries. To aid its members, the profession in each country drew up guidelines forthe preparation and audit of accounts. These formed the basis of accounting and audit ‘stand-ards’ which later acquired stock exchange and government backing.
166 PART 2 • THE HOUSE OF ACCOUNTING
CFA_C07.qxd 11/6/03 2:23 PM Page 166

CHAPTER 7 • KEY CONCEPTUAL ISSUES IN FINANCIAL ACCOUNTING 167
Legal tradition, investor protection and company financingBOX7.1
Recent empirical work confirms that countries with a common law tradition have more devel-oped equity markets and that companies in these countries have broader share ownership thanthose in code law countries. A major Harvard-based study of 49 countries found that commonlaw countries on average had more firms and more initial public offerings of equity per headof population than code law countries in 1994. The value of shareholdings held by ‘outside’shareholders as a proportion of gross national product (GNP) was also higher in common lawcountries that year.2
Why is this? The economists conducting these studies (La Porta, Lopez-de-Silanes, Shleifer,Vishny) argue that outside investors, that is, creditors and shareholders who neither have a con-trolling stake in the company nor are managers, have stronger legal rights in common lawcountries. Laws in these countries enable them to challenge ‘insiders’ (i.e. managers and con-trolling shareholders) who attempt to misappropriate the company’s assets, for example bydiverting them to other companies they control. As a result, outside investors are willing to investin companies they don’t control (and demand a lower return for doing so). In turn, existingcontrolling shareholders (e.g. entrepreneurs who have built up their own businesses) are willingto become outside investors – by reducing or disposing of their stakes in their own companiesand investing in other firms – knowing that there’s less risk of their assets being misappropriated.
La Porta et al. provide persuasive evidence that outside investors are better protected incommon law countries. In the case of equity investors, they identify six measures of share-holder protection and they construct an ‘antidirector rights index’ based on them. The indexis formed by adding one when each of the following holds:
1 Shareholders can mail their proxy vote to the firm rather than have to show up in personor send an authorised representative to the shareholders’ meeting: this makes it easier forthem to cast their votes.
2 Shareholders are not required to deposit their shares several days prior to a shareholders’meeting: this means they’re not prevented from selling the shares during this period.
3 The law allows cumulative voting for directors or proportional representation of minority(i.e. outside) shareholders on the board.
4 There are legal mechanisms to protect minority shareholders from oppression by directors.Minority shareholders can challenge directors’ decisions in the courts or force the companyto repurchase their shares in certain circumstances (e.g. mergers or asset sales).
5 Shareholders have a pre-emptive right to buy new issues of shares. This means insiders can’tdilute the interests of minority shareholders by issuing shares to selected investors atfavourable prices.
6 The percentage of share capital needed to call an extraordinary shareholders’ meeting is low(La Porta et al. set the cut-off at 10% in their studies), thereby making it easier for minor-ity shareholders to challenge management.
La Porta et al. classify 49 countries by legal tradition. The 18 countries with a common lawtradition have an average antidirector rights index score of 4 (out of 6), whereas the 31 coun-tries with a code law tradition have an average score of 2.42.3
What role does accounting play here? La Porta et al. argue that strong legal rights are of little value if enforcement mechanisms are weak. To exercise their rights, outside investors rely not only on efficient and ‘clean’ courts but also on full and fair disclosure of financialinformation. La Porta et al. find that, based on their 1990 annual reports, companies in com-mon law countries disclose more financial information than their code law counterparts.4
CFA_C07.qxd 11/6/03 2:23 PM Page 167

Non-European countries can be incorporated in this simple framework. Other English-
speaking countries (e.g. the USA) and countries which, in the past, have been in the US or UKsphere of influence (e.g. Israel, British Commonwealth countries), usually follow Anglo-Saxonaccounting. Countries whose commercial and legal systems have been influenced by those ofContinental European countries (e.g. Japan, Francophone countries in Africa) have, in the main,adopted their corporate accounting practices, too. Exhibit 7.2 summarises the main factors whichare responsible for the differences between Continental European and Anglo-Saxon accounting.
In recent years, accounting practices in Continental European countries have moved closer tothose found in Anglo-Saxon countries. Several forces are at work.
l EU company law directives have narrowed differences within Europe. Anglo-Saxon countrieswithin the EU have adopted standard formats for the balance sheet and income statement.Continental European countries have accepted that a company’s accounts must give a ‘trueand fair view’ of its financial position and its profit or loss in the period.
l The influence of international accounting standards is increasing. As mentioned earlier, all listedcompanies in the EU must prepare their consolidated accounts according to IAS from 2005.(Member states have the option to impose a similar requirement on unlisted companies andindividual company accounts.) Even before this EU regulation was announced, many of thelarger companies in Continental European countries had switched to international or USstandards – or were reconciling key numbers such as net profit and shareholders’ equity tothem – in order to gain access to international capital markets. IAS have Anglo-Saxon roots.However, they are less prescriptive (and, for Europeans, more acceptable politically) than USstandards.
l Accountants in public practice have grown in number and wield more influence in ContinentalEuropean countries. EU law is partly responsible: we’ve seen already that the accounting direct-ives require larger EU companies, private and public, to have their annual accounts audited.The big international public accounting firms have taken a large share of this new market,especially in southern European countries, and brought Anglo-Saxon accounting and audit-ing practices with them.
In addition, accounting rules in Continental European countries – whether in the tax code orin the accounting plan – have not kept pace with best practice in financial reporting. For example,they were silent on how pension costs, deferred income taxes and environmental liabilities shouldbe accounted for. Accountants have stepped into the breach. They have formed new private-sector associations (e.g. the Spanish Accounting and Business Administration Association, theNorwegian Accounting Standards Board) to draw up accounting standards and to lobby gov-ernments on accounting issues – in the same way that their counterparts in the UK and USA do.
168 PART 2 • THE HOUSE OF ACCOUNTING
Continental EuropeanFactor countries Anglo-Saxon countries
Corporate ownership Concentrated: state- Diffuse – through publicowned or family-owned share offerings
Taxation Uniformity of Separate tax/book incometax and book income calculation
Legal tradition Code law Common law (most English-speaking countries)
Continental European vs Anglo-Saxon accounting: main factors responsible fordifferences
Exhibit 7.2
CFA_C07.qxd 11/6/03 2:23 PM Page 168

CHAPTER 7 • KEY CONCEPTUAL ISSUES IN FINANCIAL ACCOUNTING 169
In later chapters we emphasise the accounting practices that unite European firms rather thanthose that divide them. For this reason we focus on EU directives and international accountingstandards. We describe and illustrate unusual national practices if they are likely to have a materialimpact on a firm’s accounts.5 In the remaining sections of this chapter, we review the account-ing framework that underlies international standards and the EU’s accounting directives.
Fundamental accounting principles
‘Principle’ is an overused term in accounting. It can refer to a norm or assumption that under-lies the accrual basis of accounting. This is the sense we use it in this chapter. It’s also found inthe phrase ‘generally accepted accounting principles’ or GAAP. This is a US term. It refers to theset of accounting methods in general use in that country, including the accounting rules laiddown by the US standard-setting body, the FASB.
The accounting policies a firm follows rest on certain fundamental principles. They are:
l The going concern assumption. The financial statements are prepared – and assets and liabilit-ies are valued – on the assumption that the company is able to continue trading for the fore-seeable future. This means that it is expected to recover its investment in fixed assets throughnormal operations and sell its inventory in the same way.
l Consistency. The company applies the accounting policies it has adopted on a consistent basis.Like transactions and events are accounted for in the same way from one period to the next.This increases users’ confidence in a firm’s accounts and allows them to make interperiodcomparisons.
l Prudence. The financial statements are prepared on a prudent basis. More specifically, profitsare only recognised in the income statement when they are ‘realised’ or ‘realisable’, that iswhen cash or claims to cash are received. In addition, prudence requires liabilities and poten-tial losses to be provided for as soon as they arise.
l The accruals concept. A company recognises revenues and expenses in the period they occur.This may not coincide with the date of cash receipt or payment. The ‘matching principle’ isan illustration of the accruals concept at work: the expense of a sale (cost of goods sold) isrecognised in the same period as the revenue from it. Note that if prudence and the accrualsconcept conflict, prudence usually takes precedence.
These are the most important of the general principles set down in the EU’s 4th Directive(Art. 31.1).6 A company can depart from them ‘in exceptional circumstances’ but it must statethe reason for, and the effect of, the departure (Art. 31.2). Interestingly, principles similar to thesewere in force in all EU member states prior to the issuance of the 4th Directive. They form thebedrock of international accounting standards, too.7
How did these principles arise? Although they are set down in commercial and tax codes inmany countries, their origins are found in long-accepted business practice. Consider the timingof revenue recognition under accrual accounting. The practice of recognising revenue at the time of delivery – the dominant practice in the case of goods – took hold for legal and practical reasons. Legal title is usually transferred when the buyer receives the goods. In addition, ship-ment prompts changes to the seller’s books: a shipping note and invoice are issued and theinventory records are adjusted, too. To recognise sales revenue at that time minimises the number of entries the seller must make to its records.
Accountants derived a general principle from this specific practice. The general principle isthat revenues are recognised in the income statement when they have been earned. We saw inChapter 5 how this principle is given substance in practice, in particular what conditions mustbe met before the earning process is considered complete (i.e. measurable economic benefits to
CFA_C07.qxd 11/6/03 2:23 PM Page 169

170 PART 2 • THE HOUSE OF ACCOUNTING
seller, risks and rewards of ownership transferred to buyer). The revenue recognition principleis an important one – in fact, it’s a key component of the accruals concept.
Once a rationale for revenue recognition was established, it could then be applied to new situ-ations. With the growth of the service sector in the past 30 to 40 years, there are many of these.Take the case of the initial fee a franchisor charges each new franchisee. To the extent that itrelates to tangible assets (for example, special equipment the franchisee must use), the franchisorcan recognise it as revenue when it delivers the assets. If it’s a charge for future services, the fran-chisor should defer recognition until it performs them. The reasons for the initial fee affect whenrevenue is considered ‘earned’ and can be recognised. In each case, the franchisor is implicitlyapplying fundamental accounting principles when deciding how to account for the initial fee.
l Problems with fundamental accounting principlesThe fundamental principles listed above have had, and continue to have, a powerful influenceon accounting practice. For example, legislators and rule-making bodies cite prudence as ajustification for valuing physical assets at historical cost (in most countries, the dominant basisof valuation). Until an asset such as property or inventory has been sold, any gain from anincrease in its value has not been realised. It is therefore imprudent to recognise the gain asprofit, they argue.
Thirty years ago, people began to question whether these principles provided an adequateconceptual basis for accounting. Important questions had been ignored. For example, whatshould be the objectives of financial statements? What are the key elements in those statements,when should they be recognised, and how should they be valued? Meanwhile, the business worldwas changing fast. Economic growth brought new products and industries, new methods offinancing and expanding stock markets. Unfortunately, it was accompanied by inflation. As aresult, answers to basic questions such as: what is an asset? how should it be valued? became morepressing. The old structure of financial accounting was found wanting. A new one was called for.
The ‘conceptual framework’: a new agenda for accounting
When the FASB, the current US accounting standard-setting body, was established in 1973, oneof its first tasks was to begin constructing a ‘conceptual framework’ for financial accounting andreporting. Since then, the IASB and rule-making bodies in other countries have undertaken sim-ilar ventures. In the FASB’s case, the project lasted over ten years and provoked considerablecontroversy.
The idea behind the conceptual framework is simple and can be best understood by analogy.We’ve talked already of the ‘accounting building’. A building is constructed according to a plan.Among other things, the plan sets out the shape and form of the building and ensures that, froma design standpoint, the structure is sound and internally consistent.
In principle, a conceptual framework is financial accounting’s architectural plan. It sets theshape and form of the accounting building by giving answers to key questions such as: what arethe objectives of financial statements? what are the qualities of ‘useful’ information? It providesguidance for accounting standard-setters. They try to ensure new standards are consistent withit. They cite it in support of their decisions – to outlaw ‘inferior’ accounting methods and todecree the use of ‘superior’ ones.
One difference between an architect’s plan and accounting’s conceptual framework is that theconceptual framework was drawn up after work on the accounting building had been proceed-ing for many years. As a result, it’s not clear what the framework is intended to be: a redesign ofthe financial accounting building, or, as some critics claim, a plan which allows the existingbuilding to be modified and extended but avoids fundamental alteration.
CFA_C07.qxd 11/6/03 2:23 PM Page 170

l Conceptual framework: main componentsWe now take a closer look at a particular conceptual framework, that of the IASB. Exhibit 7.3summarises the main issues as the IASB sees them and its position on each.8 The IASB’s frame-work is similar to that of other standard-setting bodies. (An overview of the IASB and its pre-decessor, the IASC is given in Appendix 7.1.)
CHAPTER 7 • KEY CONCEPTUAL ISSUES IN FINANCIAL ACCOUNTING 171
Issues IASB’s position summarised
What are the objectives To provide information about a firm that is useful to a wide rangeof financial statements? of people making economic decisions. ‘Useful information’ is
information on a company’s financial position, performance and liquidity.
What are the characteristics Four main characteristics are identified:of ‘useful financial – understandability;information’? – relevance;
– reliability;– comparability.
What are the main elements The main elements are: asset, liability, equity (of owners),of financial statements? income and expense. ‘Income’ includes revenue and gain;
‘Expense’ includes loss.
How are they defined? Asset – resource controlled by a firm as a result of past eventsand from which economic benefits are expected to flow infuture.
Liability – present obligation of a firm arising from past events,settlement of which is expected to result in a future outflow of resources.
Other elements are defined in terms of these two.
What are the criteria for Criteria for recognising elements (i.e. incorporating them in financialrecognising them? statements) are:
– it’s probable that future economic benefits associated with the item will flow to/from the firm; and
– item has cost or value that can be measured reliably.
How should assets and IASB lists four valuation bases now in use but does not favour liabilities be valued? one over the others:
– historical cost;– current cost;– realisable (settlement) value;– present value.
Which type of capital IASB identifies two capital maintenance objectives but expressesshould a firm seek no preference.to maintain? – financial capital maintenance, in nominal monetary units or
units of constant purchasing power;– physical capital maintenance.
A conceptual framework for financial accounting: issues and the position of the IASBExhibit 7.3
(Source: IASB, Framework for the Preparation and Presentation of Financial Statements.)
CFA_C07.qxd 11/6/03 2:23 PM Page 171

172 PART 2 • THE HOUSE OF ACCOUNTING
Accounting assets/liabilities: subset of a firm’s resources/obligationsExhibit 7.4
We discussed some of these issues at length in earlier chapters. The IASB’s position on themprovokes little comment today. ‘Usefulness for economic decision-making’ is widely accepted asthe main objective of financial statements. (However, as we saw in Chapter 1, there’s a minorityview which holds that the objective should be more restrictive: to provide owners and creditorswith financial information that lets them monitor managers’ past actions.) There’s generalagreement that accounts should be understandable, relevant, reliable and comparable. These areconsidered to be desirable characteristics of financial information (see Chapter 1).9
More questionable are the definitions of the elements of financial statements. Recall that owners’ equity and income statement items are all defined in terms of assets and liabilities(Chapters 2 and 3). Critics argue that the balance sheet focus of the definitions is at odds withthe way investors use financial statements. For them, the income statement is the most import-ant statement as it provides more useful information for earnings and cash flow prediction.
Moreover, the definitions of asset and liability are too narrow, it’s claimed. They appear toexclude certain deferred costs from assets and certain accrued costs from liabilities. For example,it’s doubtful whether the legal and related costs of setting up a firm – an asset according to theEU’s 4th Directive – can be considered a ‘resource . . . from which future economic benefits areexpected to flow’. Again, not all the provisions shown as liabilities in European company balancesheets represent ‘present obligations’ that will cause a future outflow of resources.
The views of the IASB (and other rule-making bodies) on recognition and valuation also arousecontroversy. As we haven’t addressed these issues before and they’ll colour our discussion ofassets and liabilities in future chapters, we devote much of the rest of this chapter to exploring them.
A recognition test for assets and liabilities
Recognition, in an accounting context, means inclusion on the face of a primary financial statement(balance sheet, income statement, cash flow statement). Not all items that meet the definition ofasset or liability appear on the balance sheet. A firm’s accounting assets (liabilities) can be viewedas a subset of its resources (obligations). Exhibit 7.4 shows this pictorially.
To be included on the balance sheet, assets and liabilities must pass a recognition test.According to the IASB, the test has two parts:
l It must be probable that the item gives rise to future economic benefits which flow to the firm(assets) or future economic costs which flow from the firm (liabilities).
l The cost or value of the item can be measured reliably.
CFA_C07.qxd 11/6/03 2:23 PM Page 172

CHAPTER 7 • KEY CONCEPTUAL ISSUES IN FINANCIAL ACCOUNTING 173
An asset or liability is not recognised on the balance sheet if it fails either part of this test. Forexample, company A guarantees certain borrowings of B, a travel firm specialising in tour holi-days in the Middle East. In 2000, when the guarantee was given, B’s financial position was sound.In the aftermath of the terrorist attacks in the USA in September 2001 and growing tensions inIsrael and adjacent occupied territories, demand for the firm’s products slumps. B’s financesdeteriorate and it declares bankruptcy in 2002. In its 2000 accounts, A reports no liability withrespect to the guarantee since it is not probable then that it will have to pay B’s debts. (It maydisclose a contingent liability in the notes to its accounts, however.) It may report a liability inits end-2001 balance sheet – this depends on its judgement of B’s financial position and futurecash flows – but it will definitely report a liability at the end of 2002 since by then the recogni-tion test is met.
Sometimes it is difficult to measure the cost (or value) of an asset or liability reliably. This islikely to be the case with internally developed intangibles such as brands or customer lists. TheIASB has concluded that because it’s difficult to distinguish outlays on these items from thoseincurred in developing the business as a whole, they fail the measurement part of the test andcannot be recognised as accounting assets.
The same recognition criteria apply to revenues and expenses – and thus profit. Recall thatrevenues are inflows – and expenses outflows – of net assets arising from a firm’s operations oractivities incidental to them.
The recognition criteria are a screening device. They prevent ‘soft’ assets and revenues (softwith respect to existence or amount) from appearing in the accounts. However, they are flexible.Management and auditors must judge the probability of future costs and benefits and the reli-ability of valuation.
The way in which the IASB defines assets and liabilities and the recognition criteria it laysdown give standard-setters flexibility, too. For example, the definitions and the recognition testhave been drafted so as to cover virtually all existing accounting assets. But they are loose enoughthat in future they may allow companies to recognise as assets resources which hitherto havebeen excluded from the balance sheet (e.g. assets leased under short-term contracts).
Measurement of assets and liabilities
l Alternative valuation basesOnce a company decides to recognise an asset or liability, it is then faced with the problem ofmeasuring it. There are two measurement issues. One issue is how the boundaries of the asset orliability are determined. For example, if a company constructs a building for its own use, whatcosts should it capitalise in the fixed asset account? The other – which we address in this section– is how the asset or liability is valued. (We deal with the first issue in later chapters when westudy the accounting problems associated with individual assets and liabilities.)
Up to now, we have assumed that assets and liabilities can be valued in one of two ways – athistorical cost (HC) or at current value (CV) (also known as fair value). At the time an asset isacquired or an obligation incurred, HC and CV should be identical. Thereafter, cost and valuediverge as the prices of goods and services change and interest rates fluctuate.
Current value, however, is an ambiguous term. It can be estimated by calculating any of thefollowing:
l The cost today of acquiring a similar asset or the cash that would be obtained if the same obliga-tion were incurred today. (Note that as interest rates rise (fall), the same debt terms will com-mand less (more) cash.) This version of current value is better known, for assets at least, asreplacement cost (RC). (The IASB prefers the term current cost.)
CFA_C07.qxd 11/6/03 2:23 PM Page 173

l The proceeds from disposing of the asset or the amount required to settle the liability today. Thiscan be determined by finding the current market value (MV) – realisable value in the case ofan asset and settlement value in the case of a liability. Disposal (or settlement) is assumed tooccur in the normal course of business and without duress.
l The discounted value today of the expected cash flows to or from the company which areattributable to the asset or liability. This is also known as the present value (PV) of the asset orliability. (Appendix 7.2 contains an explanation of how the present value of a stream ofexpected cash flows is derived.)
Each of the above may yield a different estimate of current value. The reason lies largely inimperfections in the markets for assets and liabilities. Custom-built machinery, for example, isexpected to generate healthy cash flows – it has a high ‘value in use’ – and is costly to replace butits realisable value may be low because of its specialised nature. Box 7.2 outlines the approach a company should use to determine the current value of an asset or liability when the value estimates under the three bases differ.
l Effect of alternative valuation bases on profit
The impact of alternative valuation bases goes beyond the balance sheet. A different asset (or liability) value may result in a different profit figure.
An example demonstrates this. Charon is a Greek ferry operator. At the start of year 1, heinvests 30,000 in a new venture, Charon Chauffeuring. With that sum the company buys a largecar in order to drive dignitaries around Athens and, as Mr Charon puts it, ‘to and from the Styx’.The car has an expected economic life of four years and its disposal value then is expected to beminimal. Charon expects annual revenues from chauffeuring to be 50,000 and annual outlays onfuel, wages, insurance and taxes to be 40,540, an annual net cash flow of 9,460.
On 2 January, the purchase date, the car’s historical cost, replacement cost and market valueare, by definition, 30,000. Using a 10% discount rate, the present value of the expected annualnet cash flows from the chauffeuring service is approximately 30,000 (9,460 × 3.17, the end-yearannuity factor for four years at 10%). Thus its balance sheet on 2 January is the same under allfour valuation bases. It is shown in Exhibit 7.5.
Consider now the situation at the end of year 1. The company’s year 1 revenues and expenditures are in line with its forecasts at the start of the year. There are no other receipts orpayments during the year so its end-year cash balance is 9,460. The company’s only other assetis the car. It has no liabilities.
The value of the car at 31 December differs, depending on which valuation method the company uses.
l Under HC accounting, the net book value of the car is 22,500. The car’s services are expectedto be consumed evenly over the four years of its expected life. Annual HC depreciation istherefore 7,500 (30,000/4).
174 PART 2 • THE HOUSE OF ACCOUNTING
Charon ChauffeuringBalance sheet at 2 January year 1
under HC, RC, MV and PV valuation bases
Fixed asset 30,000 Owner’s equity 30,000
Exhibit 7.5
CFA_C07.qxd 11/6/03 2:23 PM Page 174

l We learn that the same model costs 32,000 new at the end of year 1. Given the vehicle’s four-year life, this means the replacement cost of a similar one-year-old car is 24,000. RCdepreciation is 8,000 (32,000/4) at end-year 1 values.
l We discover from an authoritative guide to second-hand car prices that the disposal value of an equivalent 1-year-old car is 21,500. The decline in the car’s market value in year 1 istherefore 8,500.
l With expectations about business unchanged from 1 January forecasts, the present value ofexpected net cash flows in the remaining three years is 23,530 (9,460 × 2.487, the end-yearannuity factor for 3 years at 10%). Thus the reduction in the present value of these cash flowsis 6,470 (30,000 − 23,530).
CHAPTER 7 • KEY CONCEPTUAL ISSUES IN FINANCIAL ACCOUNTING 175
Deprival valueBOX7.2
How should a company choose among the three bases – replacement cost (RC), market value(MV), or present value (PV) – when determining the current value of an asset or liability? Apopular approach is to try to determine the ‘value to the company’ of each asset and liability.One economist has defined this for assets as follows:
The value of a property to its owner is identical in amount with the adverse value of the entire loss,direct and indirect, that the owner might expect to suffer if he were deprived of the property.10
Using the same approach, the value of a liability to the debtor company is the gain it wouldenjoy if it were relieved of the liability.
The next step is to operationalise deprival value. Consider the case of an asset where RC, MVand PV differ. The most likely situation is PV > RC > MV: the value of an asset in use exceedsits replacement cost which in turn exceeds its sale value. In this case, the asset’s deprival valueis its replacement cost. Because PV > RC, it’s worthwhile for the company to buy a new assetif it’s deprived of the old – but the maximum loss it sustains is the cost of the replacement. In fact, whenever PV or MV (or both) exceeds RC, the deprival value is replacement cost. (If MV > RC, the company should buy and then immediately sell the asset!) In these cases, itpays to replace the asset and the loss the company sustains is the cost of the replacement.
What if replacement cost exceeds present value and market value? In these cases, replace-ment is not worthwhile. Then the value of the asset to the firm – what it would lose from beingdeprived of the asset – is the higher of the asset’s present value and market value.11
These ideas are summarised below. Note that ‘recoverable amount’ is, by definition, thehigher of PV and MV. As we’ll discover in a later chapter, a company forced to write down afixed asset below cost because it’s impaired must value it at recoverable amount under IAS.
CFA_C07.qxd 11/6/03 2:23 PM Page 175

Exhibit 7.6 shows Charon Chauffeuring’s annual accounts for year 1 under the four valuationbases.
Choice of valuation method affects the income statement as well as the balance sheet. Noticethe different charges for depreciation under the four methods in Charon Chauffeuring’s year 1accounts. In addition, under replacement cost accounting, the company records the cost savingin year 1 – from buying the car a year earlier at a lower price – as a ‘holding gain’. The differ-ences in reported profit also appear as differences in end-year owner’s equity.
l Valuation methods: IASB’s and EU’s positionThe IASB expresses no preference for any of the valuation methods (or ‘measurement methods’)illustrated in Exhibit 7.6. It merely notes that historical cost is the most widely-used method andthat companies often use more than one valuation method in their accounts. The IASB’s ownstandards are partly responsible for this diversity. The accounting standard on financial instru-ments requires firms to carry certain financial assets and liabilities at fair value (i.e. market value)
176 PART 2 • THE HOUSE OF ACCOUNTING
Charon ChauffeuringAnnual accounts for year 1
under HC, RC, MV and PV valuation bases(all amounts in 000)
Historical Replacement Market Presentcost cost value value
Income statement for year 1Revenues from chauffeuring 50 50 50 50Expenses of fuel, wages, etc. –40.54 –40.54 –40.54 –40.54Depreciation or value diminution* –7.5 –8 –8.5 –6.47Holding gain** – 2 – –Profit in year 1 1.96 3.46 0.96 2.99
Balance sheet at 31/12/year 1Fixed asset – at valuation or
depreciated cost 22.5 24 21.5 23.53Cash 9.46 9.46 9.46 9.46
Total assets 31.96 33.46 30.96 32.99
Owner’s equity:At 1 January 30 30 30 30Profit in year 1 1.96 3.46 0.96 2.99At 31 December 31.96 33.46 30.96 32.99
* Depreciation/value diminution is calculated as follows:
HC: 25% × historical cost of 30.
RC: 25% × 31/12/year 1 replacement cost of 32.
MV: Difference between market values at 2/1 and 31/12.
PV: Difference between present values at 2/1 and 31/12.
** By buying the car on 1 January, Charon saved 2 on what he would have spent by delaying purchase until
31 December, i.e. 30 against 32. This cost saving is known as a holding gain.
Exhibit 7.6
CFA_C07.qxd 11/6/03 2:23 PM Page 176

CHAPTER 7 • KEY CONCEPTUAL ISSUES IN FINANCIAL ACCOUNTING 177
in the balance sheet. Other standards allow firms to revalue tangible and purchased intangiblefixed assets.
The EU’s accounting directives are similarly permissive. Although the EU’s 4th Directiverequires assets to be valued at historical cost (specifically, ‘purchase price or production cost’(Art. 32)), it gives member states the right to sanction other valuation methods. According toArticle 33, member states can allow companies to:
(a) value tangible fixed assets and inventories at RC;(b) revalue tangible and financial fixed assets; and (c) use methods ‘designed to take account of inflation’.
Use of market values and present values is permitted under method (b). Method (c) allows firmsto make adjustments to all accounts, in both balance sheet and income statement, for changes ingeneral prices. The accounting directives were amended in 2001 to allow EU companies to carrycertain financial assets and liabilities at fair value. This brings the directives into line with IAS.
In practice, historical cost is still the dominant valuation method in Europe (and elsewhere).Many member states do not take advantage of the alternative methods the 4th Directive allows.As of 2003 fair value accounting for investments is widespread only in North America. We lookmore closely at how specific categories of asset and liability are valued in later chapters.
Recognition and measurement controversies
The IASB has come under fire over its conceptual framework project, especially the criteria it laysdown for recognising assets and liabilities and its position on how they should be valued.
Despite the apparent flexibility of the recognition test, the effect in practice is to make itdifficult for certain key resources to be recognised as accounting assets. Critics argue that mostinternally developed intangibles that are marketing-related (e.g. brand names, publishing titles)are likely to fail the second part of the test (absence of a reliable cost figure). In addition, someresearch and development spending, in particular outlays on basic research, fail the first part ofthe test (probability of future economic benefits) as well. Given that, for many companies, inter-nally developed intangibles represent a growing proportion of corporate resources, failure toaccount for them undermines the utility of company balance sheets, according to this view.
As for measurement, the charge is that the IASB’s seeming neutrality on this issue is a smoke-screen. Because of the way the IASB defines assets and liabilities in its conceptual framework (i.e.as inflows and outflows of future economic benefits), use of current values is encouraged, criticsclaim. And they point to new accounting rules – such as the use of fair values to value certainfinancial assets and liabilities and the inclusion of a present value calculation in valuing impairedfixed assets – as evidence that the IASB favours current value methods of measurement. Sincecurrent values are not always based on actual market transactions, they may be less reliable thanthe historical cost figures they replace. Critics fear that investors will then lose confidence in thereported numbers in financial statements and the resulting uncertainty will drive up firms’ cap-ital costs.
Capital maintenance and the measurement unit in accounts
One further issue in the IASB’s conceptual framework concerns the type of capital a firm shouldseek to maintain. This is important. Profit represents the return on the capital invested in a business.A firm cannot be said to have made a profit during a period if it has not maintained the capital withwhich it started the period. The IASB identifies three ways of defining invested capital:
CFA_C07.qxd 11/6/03 2:23 PM Page 177

l financial capital measured in nominal monetary units;l financial capital measured in units of constant purchasing power; andl physical capital.
We review here the differences between financial and physical capital and explain the concept of‘units of constant purchasing power’.
Capital can be defined as:
l the investment (initial contribution plus reinvested profits) made in the firm by its owners; orl the productive capacity of the firm.
The first is known as financial capital, the second as physical capital. The two versions of capital can result in quite different profit figures.
Financial capital maintenance
Consider Charon Chauffeuring. Charon invested 30,000 in the business. This is the firm’s finan-cial capital at the start of year 1. Charon Chauffeuring generates a profit in year 1 if Charon’sequity at the end of the year, after adjusting for any further capital contributions or distributions,is greater than 30,000. The excess over 30,000 is the amount the company can distribute as dividend without impairing Charon’s investment. (Any distribution above that amount is areturn of his capital.)
Where financial capital maintenance (FCM) is the firm’s objective, the profit it reportsdepends in part on the way it values its assets and liabilities. Look again at Exhibit 7.6. Each oneof the profit figures is consistent with FCM. So long as the company applies consistently the valuation method adopted and restricts any dividend to the profit reported, Charon’s invest-ment will be preserved. Thus, if it values assets at HC and restricts the year 1 dividend to 1,960,Charon’s end-year equity in the business, valued at HC, will be 30,000, the amount he initiallycontributed. (Of course, different profit figures and dividend payments will result in differentend-year cash balances.)
Physical capital maintenance
The company’s physical capital at the start of year 1 is the car it purchased new on that date. Tomaintain its physical capital, the company must have, at year-end, either a similar car (i.e. onewith the same productive capacity) or the resources equivalent to the cost of one. We know thatthe replacement cost of the same model is 32,000 at the end of year 1. Thus Charon’s net assetsmust not fall below 32,000 at the end of year 1.
Where the firm’s objective is to maintain its physical capital (PCM), it must value its assets andliabilities at replacement cost. It must also exclude from distributable profit any holding gains orlosses that have arisen in the year. For example, when an asset’s value increases relative to its historical cost, the firm gains from holding it. However, if it must replace the asset, it cannot distribute the holding gain as dividend without impairing its physical capital. Thus under PCM,holding gains and losses are not part of distributable profit of the period.
Charon Chauffeuring’s circumstances in year 1 demonstrate this. Its year 1 financial state-ments under PCM are summarised in Exhibit 7.7.
At 31 December, the company’s assets – the sum of its cash and the car at net replacementcost – are 33,460. They exceed the replacement cost of a similar car by 1,460 (33,460 – 32,000).This is also the amount by which the company’s current revenues (50,000) exceed its currentcosts in the year (48,540). By excluding the holding gain of 2,000 from year 1 distributable profitand thus limiting any dividend to 1,460, Charon ensures that the company retains in the busi-ness the equivalent of the productive capacity (the car) it began the year with.
178 PART 2 • THE HOUSE OF ACCOUNTING
CFA_C07.qxd 11/6/03 2:23 PM Page 178

l Nominal currency or constant purchasing power unitsIn the last section we saw how a company, to maintain its capital, may – and, in the case of physical capital maintenance, must – take account of changes in the prices of specific assets and liabilities. Replacement cost, market value, and present value are alternative ways of measuring the changes in those prices. However, we said nothing about the effect of changes in general prices on a company’s accounts. For example, in drawing up the year 1 balance sheetand income statement of Charon Chauffeuring, we use the nominal currency (e.g. the euro) asthe measurement unit. By so doing, we assume that there is no change in general prices inGreece in year 1.
In practice, general prices do change: in most countries they rise year by year. As a result, a given nominal amount of currency buys fewer goods and services in the current year than itdid in a prior one. Its purchasing power falls. This undermines its role as a measurement unit. It becomes impossible for a financial statement user to disentangle the effect of inflation on acompany’s accounts and to discover whether the firm has maintained its capital (financial orphysical) in real terms.
To overcome this problem, a measurement unit is needed whose purchasing power is constant over time. Accountants have invented the constant purchasing power unit. The way itworks is quite simple. First, a company (or the government on behalf of all companies) decideson a date on which it will measure its accounts in constant purchasing power (CPP) terms. It isknown as the measurement date. The measurement date can be the end of the current financialyear or some earlier date (e.g. 1 January 2000). Then the company adjusts its accounts for thechange in purchasing power of the currency between the dates of the transactions and eventsunderlying its nominal currency accounts and the measurement date. The adjusted financialstatements are then stated in terms of the purchasing power of the currency on the measure-ment date.
CHAPTER 7 • KEY CONCEPTUAL ISSUES IN FINANCIAL ACCOUNTING 179
Charon ChauffeuringAnnual accounts for year 1
under PCM objective(amounts in 000)
Income statement for year 1Operating revenues 50Operating expenses at current cost(fuel, wages, depreciation) –48.54
Profit for year 1.46
Balance sheet at end-year 1Fixed asset, at RC 32 Owner’s equity:– Year 1 depreciation –8 At 1 January 30Fixed asset, net 24 Holding gain 2Cash 9.46 Profit for year 1.46
Total assets 33.46 Total equities 33.46
Exhibit 7.7
CFA_C07.qxd 11/6/03 2:23 PM Page 179

Historical cost/CPP-based accountsWe illustrate historical cost/CPP-based accounts with a simple example. Elysian Fields, a prop-erty investment company, is founded on 1 January x6 with equity capital of 60. It borrows 40 onthat date and invests its total cash of 100 in land. At the end of the year, it sells, for 120 in cash,part of the land costing 80. In nominal currency terms, it records a profit of 40 in that year.However, general prices rose 10% in x6. What is the company’s profit in inflation-adjustedterms? How much can it distribute as dividend and preserve the owners’ initial investment inreal terms?
Exhibit 7.8 shows Elysian Fields’ x6 accounts in nominal terms and restated on a CPP basis.The company chooses 31 December x6 as the measurement date for its CPP-based accounts. Theaccounts are simplified: interest on debt, administrative expenses and taxes are ignored.
180 PART 2 • THE HOUSE OF ACCOUNTING
FactsElysian Fields is founded on 1 January x6 with total capital of 100, of which 60 is equity and 40 debt. It invests 100 in land. At the end of x6, it sells, for 120 cash, land costing 80.Administrative expenses, interest and taxes are ignored. General prices rise 10% in x6.Constant purchasing power (CPP) accounts assume 31/12/x6 measurement date.
Financial statements for x6
In nominal In CPPcurrency Adjustment1 units
Income statement for x6Revenue 120 – 120Cost of land sold −80 110/100 −88
Profit 40 32Purchasing power gain from holding debt2 +4
Profit including purchasing power gain 36
Balance sheet at 31/12/x6Land 20 110/100 22Cash 120 – 120
Total assets 140 142
Owners’ equity:Initial investment 60 110/100 66Profit in x6 40 (see above) 36
100 102Debt 40 – 40
Total equities 140 142
Notes:1. Assume general price level index stands at 100 on 1/1 and 110 on 31/12. No CPP
adjustment is made to revenues since the land is sold at year-end. No CPP adjustment is madeto cash or debt since the measurement date is 31/12/x6.
2. The company holds net debt throughout x6 while prices rise 10%. The cash required to pay off the debt has less purchasing power at year-end. In CPP terms, the company enjoys a gain of 4 (10% × 40).
Elysian Fields: x6 accounts on HC/CPP basisExhibit 7.8
CFA_C07.qxd 11/6/03 2:23 PM Page 180

The nature and timing of transactions and events determine the CPP adjustments a firm mustmake to its nominal accounts. Elysian Fields makes no adjustment to revenues in x6 since it sellsland at the end of the year. The cost of the land sold must be adjusted, however. The general priceindex has increased by 10% since the date of purchase so the cash of 80 used to buy that parcelof land on 1 January x6 has purchasing power of 88 at 31 December x6.
The new item, ‘Purchasing power gain’, warrants explanation. If a company holds cash orother monetary assets during a period of general price increase, it suffers a loss in purchasingpower because a given nominal amount of cash buys fewer goods at the end of the period thanat the start. On the other hand, if it holds debt or other monetary liabilities during that period,it enjoys a gain in purchasing power: to repay the debt it gives up cash which has less buyingpower at the end of the period than at the beginning. In our example, Elysian Fields enjoys a pur-chasing power gain in x6 because it holds debt throughout the year when prices are rising. (Itreceives cash from the sale of land only at the end of x6.)
In drawing up a balance sheet in CPP units, firms distinguish between monetary and non-monetary items. Monetary items consist of those assets and liabilities where the cash to be receivedor paid is contractually fixed. (Cash is, of course, a monetary asset.) Where the measurement date is the balance sheet date, no CPP adjustments to monetary items are necessary. ElysianFields’ cash of 120 commands purchasing power of that amount at the end of x6. Similarly, the nominal amount of the company’s debt (40) reflects the purchasing power it would give up to repay it at that date. Non-monetary items must be adjusted, however. The currency’s purchasing power has declined by 10% since the company raised equity of 60 from its share-holders and bought the land (of 20) it still holds. In CPP terms, these balances should be 66 and22 respectively.
We can look at the CPP-based accounts in another way. The currency of 60 invested inElysian Fields by its owners at the start of x6 can purchase 66 of goods and services in end-x6purchasing power terms. Any increase in the net assets of the firm (capital contributions and distributions excepted) above the 6 needed to preserve the purchasing power of the owners’investment is profit. The company’s net assets at the end of x6 are, in fact, 102 in historicalcost/CPP terms (142 less 40). Thus it reports CPP profits of 36 (102 – 66) that year. This is themaximum amount it can distribute without impairing the purchasing power of the owners’ initial investment.
Current value/CPP-based accountsIn our example, we assume that Elysian Fields values its land at historical cost. However, it coulduse a current value basis and still seek to maintain the financial capital of its owners in real terms.The resulting accounts are then current value/CPP-based accounts.
For example, suppose that between the date the company buys the land (1/1/x6) and the dateit sells it (31/12/x6) land prices increase 25%. Thus the replacement cost of the land sold is 100(80 × 1.25) and that of the land still held at the end of the year is 25 (20 × 1.25). Exhibit 7.9 showsElysian Fields’ x6 accounts prepared on a RC/CPP basis.
Elysian Fields’ RC/CPP profit of 39 in x6 is 3 greater than its HC/CPP profit (36: see Exhibit7.8) because it takes into income the real holding gain on the land still held at year-end (25 − 22).The company could distribute that gain and the owners’ financial investment – 66 in end-x6purchasing power terms – would still be preserved.
Exhibit 7.9 illustrates a key point: the way a company values its assets is quite separate fromits choice of measurement unit. The former captures specific price changes, the latter general pricechanges. Specific and general prices may move in different directions. It’s quite possible for thereplacement costs of a firm’s inventories and plant to decline while prices in general are rising.(This has been the experience of the electronics industry in the last two decades.) Currentvalue/CPP-based accounts capture both types of price movement.
CHAPTER 7 • KEY CONCEPTUAL ISSUES IN FINANCIAL ACCOUNTING 181
CFA_C07.qxd 11/6/03 2:23 PM Page 181

182 PART 2 • THE HOUSE OF ACCOUNTING
FactsAs for Exhibit 7.8. In addition, land prices increase 25% during x6.
Financial statements for x6
Income statement for x6Revenue from land sale 120Current cost of land sold −100
Current cost profit 20Gain on holding land during x6:
Nominal gain (100 × 25%) 25Less: Inflation element (100 × 10%) −10Real holding gain +15
Purchasing power gain from holding debt (Exhibit 7.8) +4Replacement cost/CPP profit 39
Balance sheet at 31/12/x6Owners’ equity:
Land (20 × 1.25) 25 Initial investment (restated atCPP amount) 66
Profit in x6 39105
Cash 120 Debt 40Total assets 145 Total equities 145
Elysian Fields: x6 accounts on replacement cost/CPP basisExhibit 7.9
l Capital maintenance objective and measurement unit: accounting practice in EuropeEU company law directives make no explicit reference to financial or physical capital main-tenance as a corporate objective. Implicitly, financial capital maintenance is the objective – inEurope and elsewhere – since historical cost (proceeds) is the principal basis of valuing assets(liabilities) in all countries.
An EU member state can permit firms to present CPP-based accounts since this is a method‘designed to take account of inflation’ (4th Directive, Art. 33). In practice, EU firms (and thosein other low-inflation countries) use the nominal currency as the measurement unit in theiraccounts. It’s a different story in high-inflation economies. ‘Indexation’ of accounts – whichusually involves making CPP adjustments to HC- or RC-based accounts – has been common inLatin American countries with a history of high inflation. International accounting standardsrequire firms in a hyperinflationary economy to restate their accounts on a CPP basis.12
Subtle changes to this long-standing accounting model are occurring, however. New interna-tional accounting standards are altering the way firms implement the financial capital mainten-ance objective. Hitherto, where asset revaluations were permitted, any surplus on revaluationwas taken directly to a reserve account in the balance sheet. Prudence, one of the fundamentalaccounting principles we discussed earlier, precludes the recognition of unrealised holding gainsin income. Under fair value accounting which companies following IAS must use to value certainfinancial assets and liabilities (and may use to value properties held as investments), unrealisedholding gains have to be reported in the income statement in certain circumstances. The EU’s
CFA_C07.qxd 11/6/03 2:23 PM Page 182

CHAPTER 7 • KEY CONCEPTUAL ISSUES IN FINANCIAL ACCOUNTING 183
APPENDIX
7.1
accounting directives have been modified to allow for this. However, the prudence principle stillapplies when other types of asset are revalued.
Summary
Management must make accounting decisions when they prepare their company’s financialstatements for publication. They must decide the firm’s accounting policies – the methods to beused and estimates to be made when accounting for the many different types of transaction andevent – and state them in the notes to the accounts. For some transactions, only one accountingmethod can be used; for others, management has a choice.
Accounting methods have many sources: company and tax law, accounting standards, cus-tom, professional and management judgement. Underpinning the set of accounting methods in current use are four main ‘principles’ which have been distilled from accepted accountingpractice. These are: the going concern assumption, consistency, prudence and the accruals concept.Management and auditors refer to these principles whenever they seek a solution to a newaccounting problem.
In recent years, investors have campaigned for an improvement in the quality of corporatefinancial reports. In response, the IASB and other regulators launched a new programme: toissue tougher accounting standards which specify the method firms must use to account for aparticular transaction and the disclosures it must make. (We explore these new standards indepth in later chapters.) To guide them in this task, regulators first set down a conceptual frame-work of accounting. This states that:
l Providing useful information to investors is the main objective of financial reporting.l Understandability, relevance, reliability and comparability are the principal qualities of useful
information.l Assets (resources controlled by the firm) and liabilities (obligations to transfer such resources) are
the key elements of financial statements. Other elements such as owners’ equity and incomestatement items can be defined in terms of these key elements.
l Assets and liabilities should be recognised in financial statements only if it is probable that aresource or obligation exists and it can be measured reliably.
Unresolved are two key issues: how should assets and liabilities be valued? and – given that thefirm aims to maintain its capital (income is, after all, the return on capital) – what type of cap-ital should it seek to maintain? Although various valuation bases are in current use, most assetsand liabilities are carried in the balance sheet at historical amounts. Maintenance of the owners’financial capital rather than the company’s productive capacity is the objective – usually implicit– of management. However, in measuring financial capital, firms rarely adjust for changes in thepurchasing power of the currency, except in high-inflation economies.
An overview of the IASB and its predecessor, the IASC
The International Accounting Standards Board (IASB) was set up in 2001. It replaces theInternational Accounting Standards Committee which was established in 1973. The goals of theBoard and the Committee are the same: to improve and, at the same time, harmonise account-ing and reporting practices worldwide through the issuance of accounting standards.
CFA_C07.qxd 11/6/03 2:23 PM Page 183

l Structure of IASB
The IASB is responsible for developing new international accounting standards. The standard-setting structure is designed to ensure the Board is both independent and expert. Board mem-bers are chosen largely for their technical expertise. Twelve of the fourteen work full-time at theBoard. The Board is supported by technical staff and advised by an international council. It isalso assisted by an Interpretations Committee (IC), a body of twelve experts chaired usually bya Board member or senior member of the technical staff, that provides guidance on how to applyor interpret existing accounting standards.
Board (and IC) members are appointed by an international foundation. The foundation isalso responsible for fund-raising. Trustees of the foundation are chosen to ensure diversity ofgeographical and professional background. A trustee cannot be a Board or IC member.
The IASB and IC follow accepted due process procedures. Meetings are open to the public.Exposure drafts of standards (and interpretations) are published and comments are invited frominterested parties. When a new standard is issued, the Board publishes an explanation of its decisions.
l The IASC’s achievements and the challenge for the IASB
The decision in 1973 to set up an agency, the IASC, to produce global accounting rules was a private initiative. (It still is – hence the need for fund-raising.) At that time, internationalinvestors and financial institutions were concerned about the variation in the quality of financialaccounting and reporting across countries. It made capital allocation more difficult and costly –and this raised the cost of capital for firms.
In its first 15–20 years, the IASC made little impact. Few companies used IAS either in theirprimary accounts or in supplementary statements. As standards became more numerous andrigorous, however, support for them in the investment and political communities grew. In 1995,IOSCO, the organisation representing international securities’ regulators, agreed to accept IAS-based financial statements submitted by companies seeking cross-border listings of their securities– on condition that the IASC developed a tougher set of standards. International standardsreceived a further fillip in 2000 when the European Commission decided to require all listed EUcompanies (estimated at 6,700 that year) to file consolidated accounts according to IAS from2005. This was a major coup for the IASC: only 275 EU companies were using IAS in 2000. Thefinal hurdle, not yet achieved, is SEC acceptance of the equivalence of IAS-based and US GAAP-based financial statements: then non-US companies with securities listed on a US stock exchangeneed prepare only one set of consolidated accounts.
The IASC issued 41 standards (and 24 interpretations) in its 28-year existence. The 34 standards – or IAS – in force in mid-2002 are listed in Exhibit 7.10. It also published a con-ceptual framework of financial accounting, Framework for the Preparation and Presentation ofFinancial Statements, to assist it in developing new standards.
Despite its achievements, the IASC faced considerable criticism, especially from the NorthAmerican investment community. It was accused of having poor governance, many of its stand-ards were allegedly lax, and its efforts to enforce its standards were ineffective. The structure ofthe IASB, the IASC’s successor, is designed to overcome the first criticism. Note especially theseparation of fund-raising from standard-setting activities. The new agency plans to address thesecond criticism by revising existing standards and introducing new ones. (These will be knownas International Financial Reporting Standards, or IFRS.) Topics on the initial agenda include:business combinations, consolidation, leases, reporting business performance and share-basedcompensation.
184 PART 2 • THE HOUSE OF ACCOUNTING
CFA_C07.qxd 11/6/03 2:23 PM Page 184

CHAPTER 7 • KEY CONCEPTUAL ISSUES IN FINANCIAL ACCOUNTING 185
IAS no.* Title
1 Presentation of Financial Statements2 Inventories7 Cash Flow Statements8 Net Profit or Loss for the Period, Fundamental Errors and Changes in
Accounting Policies10 Events After the Balance Sheet Date11 Construction Contracts12 Income Taxes14 Segment Reporting 15 Information Reflecting the Effects of Changing Prices16 Property, Plant and Equipment17 Leases18 Revenue19 Employee Benefits20 Accounting for Government Grants and Disclosure of Government Assistance21 The Effects of Changes in Foreign Exchange Rates 22 Business Combinations23 Borrowing Costs24 Related Party Disclosures26 Accounting and Reporting by Retirement Benefit Plans27 Consolidated Financial Statements and Accounting for Investments in
Subsidiaries28 Accounting for Investments in Associates29 Financial Reporting in Hyperinflationary Economies30 Disclosures in the Financial Statements of Banks and Similar Financial
Institutions31 Financial Reporting of Interests in Joint Ventures32 Financial Instruments: Disclosure and Presentation33 Earnings Per Share34 Interim Financial Reporting35 Discontinuing Operations36 Impairment of Assets37 Provisions, Contingent Liabilities and Contingent Assets38 Intangible Assets39 Financial Instruments: Recognition and Measurement40 Investment Property41 Agriculture
* Seven standards (3, 4, 5, 6, 9, 13 and 25) have been superseded.
International Accounting Standards issued as of June 2002Exhibit 7.10
The third criticism is more difficult for the IASB to deal with. Accounting standard-settingagencies do not usually have policing powers. These rest with separate bodies (e.g. the SEC in theUSA, the Financial Services Authority in the UK). There is recent evidence that some companieshave applied international standards incorrectly and have not observed all IAS disclosurerequirements.13 This may be due in part to company financial officers and auditors not beingfamiliar with international standards. A more likely explanation is the absence of an agencyenforcing international standards: national financial regulators or stock exchanges may have toassume this role.
CFA_C07.qxd 11/6/03 2:23 PM Page 185

186 PART 2 • THE HOUSE OF ACCOUNTING
APPENDIX
7.2 Present value concepts – an introduction
The aim of this appendix is to explain briefly the concept of present value and to illustrate its ap-plication in financial accounting. A more detailed presentation can be found in a finance textbook.
You are familiar with the old saying: ‘A euro (or dollar, yen, peso, etc.) today is worth morethan a euro tomorrow’. The reason is simple. A euro can be invested today and by tomorrow itwill be worth today’s euro plus the interest earned in the intervening period. Given an interestrate of r in a period and an investment of C, the future value, F, of that investment at the end ofthe period will be:
F == C (1 ++ r)
With positive interest rates, F is clearly greater than C. The future value of a euro invested todayis expected to be greater than its present value.
There is another side to this coin. An investor will pay less than one euro today for an invest-ment that is expected to yield one euro tomorrow. Using our notation:
C == F ××
If F is the amount expected in the future, the investor will only pay C, the fraction 1/(1 + r) of F,today in order to secure that return.
An example will help here. Suppose Marianne, a Dijon mustard supplier, has a customer,John Bull, an English producer of roast beef dinners, who is experiencing financial difficulties.Bull offers to pay 20,000, the current balance on his account, in one year’s time. If Mariannereceives that money now, she can invest it, say at 10%, for that period. How much is Bull’s offerworth to Marianne? The answer is:
C = 20,000 ×
= 20,000 × 0.9091
= 18,182
The 20,000 in one year’s time is clearly worth less than 20,000 received today. In fact, the presentvalue of that future sum is only 18,182, given the current annual interest rate of 10%.
The logic can be extended. A euro tomorrow is worth more than a euro received the day aftertomorrow. Suppose Bull’s financial condition deteriorates. He asks Marianne for a two-yearextension to pay the debt of 20,000. This means Marianne will forgo two years’ interest on thissum. We can express the present value of this future sum as:
C == F ××
If the interest rate on a two-year investment (of 20,000) is still 10% a year, the present value ofJohn Bull’s proposed payment terms is:
20,000 ×
= 20,000 × 0.8264
= 16,528
1
1 0 1 2( . )+
1
(1 )++ r 2
1
1 0 1( . )+
1
(1 )++ r
CFA_C07.qxd 11/6/03 2:23 PM Page 186

The manager of Marianne’s credit department reckons that a two-year extension is too generous and suggests Bull repay half the 20,000 in one year’s time and the balance at the end ofthe second year. Would Marianne be better off under her manager’s proposal or under Bull’s?The present value of the credit manager’s proposed payment terms is:
= (10,000 × 0.9091) + (10,000 × 0.8264)
= 17,355
(We assume a 10% interest rate can be earned each year.)Not surprisingly, the manager’s suggestion is more advantageous to Marianne. This is because
the 10,000 received at the end of year 1 can be reinvested then, yielding an expected 1,000(10,000 × 10%) at the end of year 2. When discounted to today, this is equivalent to 826 (1,000× 0.8264), the difference (after rounding) between the present values of the two proposals(17,355 − 16,528).
We introduced a new term, ‘discounted’, in the last paragraph. The procedure of finding thepresent value of future cash inflows or outflows is referred to as discounting. The interest rateon investment opportunities forgone, which is used in present value calculations, is often knownas the discount rate. And the multiples applied to future cash sums – in our example, 0.9091 and0.8264 (or, more generally, (1 + r)–1, (1 + r)–2, . . . (1 + r)–n) – are described as discount factors.
Discounting is the obverse of compounding. Where compound interest rather than simpleinterest is in force, interest is earned or incurred on prior interest as well as the principal of theinvestment or debt. Similarly, discount factors reflect interest forgone not just on the principalbut also on the prior interest.
Over long time periods, the effect of ‘lost interest on interest’ can be substantial. Suppose acompany issues ten-year bonds which pay no interest. (Such bonds are known as ‘zero couponbonds’.) The purchaser of a bond receives on the maturity of the bond (at the end of ten years)1,000, the par value of the bond. How much would an investor pay for one such bond, assumingthat, at the time of issuance, the market rate of interest for bonds of equivalent risk is 12% a year?
To answer this question, we need to find the present value of a future sum, 1,000, where thediscount factor, 1/(1 + r)n, is based on an interest rate r of 12% and a period n of ten years. Theinvestor should pay no more than 322 for the bond:
1,000 × = 1,000 × 0.322
= 322
The 1,000 the investor receives on the bond’s maturity will exactly compensate her for the lossof interest (compounded annually) on her 322 in the intervening ten years.
l Use of present value tablesHow do we obtain discount factors in practice? After all, computing 1/(1 + 0.12)10 by hand is atime-consuming and error-prone exercise, though many hand calculators and computer spread-sheet packages contain present value computational routines. Present value tables are presentedin Exhibit 7.11 for the benefit of those who don’t have access to other sources. They’re also ofhelp to the calculator- and computer-blessed, because they provide a way of checking calculations.
A short explanation of the tables follows. Table 1 presents discount factors. It shows the presentvalue of one unit of currency (euro, dollar, yen, etc.) received or paid in the future, for a range
1
1 0 12 10( . )+
10 0001
1 0 110 000
1
1 0 1 2,
( . ) ,
( . )×
+
+ ×+
CHAPTER 7 • KEY CONCEPTUAL ISSUES IN FINANCIAL ACCOUNTING 187
CFA_C07.qxd 11/6/03 2:23 PM Page 187

188 PART 2 • THE HOUSE OF ACCOUNTING
Table 1 Present value (PV) of 1 euro (or other currency unit)Discount rate
1% 1.5% 2% 2.5% 3% 4% 5% 6% 7% 8% 9% 10% 12% 15% 20%Periods
1 0.990 0.985 0.980 0.976 0.971 0.962 0.952 0.943 0.935 0.926 0.917 0.909 0.893 0.870 0.8332 0.980 0.971 0.961 0.952 0.943 0.925 0.907 0.890 0.873 0.857 0.842 0.826 0.797 0.756 0.6943 0.971 0.956 0.942 0.929 0.915 0.889 0.864 0.840 0.816 0.794 0.772 0.751 0.712 0.658 0.5794 0.961 0.942 0.924 0.906 0.888 0.855 0.823 0.792 0.763 0.735 0.708 0.683 0.636 0.572 0.4825 0.951 0.928 0.906 0.884 0.863 0.822 0.784 0.747 0.713 0.681 0.650 0.621 0.567 0.497 0.402
6 0.942 0.915 0.888 0.862 0.837 0.790 0.746 0.705 0.666 0.630 0.596 0.564 0.507 0.432 0.3357 0.933 0.901 0.871 0.841 0.813 0.760 0.711 0.665 0.623 0.583 0.547 0.513 0.452 0.376 0.2798 0.923 0.888 0.853 0.821 0.789 0.731 0.677 0.627 0.582 0.540 0.502 0.467 0.404 0.327 0.2339 0.914 0.875 0.837 0.801 0.766 0.703 0.645 0.592 0.544 0.500 0.460 0.424 0.361 0.284 0.194
10 0.905 0.862 0.820 0.781 0.744 0.676 0.614 0.558 0.508 0.463 0.422 0.386 0.322 0.247 0.162
11 0.896 0.849 0.804 0.762 0.722 0.650 0.585 0.527 0.475 0.429 0.388 0.350 0.287 0.215 0.13512 0.887 0.836 0.788 0.744 0.701 0.625 0.557 0.497 0.444 0.397 0.356 0.319 0.257 0.187 0.11213 0.879 0.824 0.773 0.725 0.681 0.601 0.530 0.469 0.415 0.368 0.326 0.290 0.229 0.163 0.09314 0.870 0.812 0.758 0.708 0.661 0.577 0.505 0.442 0.388 0.340 0.299 0.263 0.205 0.141 0.07815 0.861 0.800 0.743 0.690 0.642 0.555 0.481 0.417 0.362 0.315 0.275 0.239 0.183 0.123 0.065
16 0.853 0.788 0.728 0.674 0.623 0.534 0.458 0.394 0.339 0.292 0.252 0.218 0.163 0.107 0.05417 0.844 0.776 0.714 0.657 0.605 0.513 0.436 0.371 0.317 0.270 0.231 0.198 0.146 0.093 0.04518 0.836 0.765 0.700 0.641 0.587 0.494 0.416 0.350 0.296 0.250 0.212 0.180 0.130 0.081 0.03819 0.828 0.754 0.686 0.626 0.570 0.475 0.396 0.331 0.277 0.232 0.194 0.164 0.116 0.070 0.03120 0.820 0.742 0.673 0.610 0.554 0.456 0.377 0.312 0.258 0.215 0.178 0.149 0.104 0.061 0.026
25 0.780 0.689 0.610 0.539 0.478 0.375 0.295 0.233 0.184 0.146 0.116 0.092 0.059 0.030 0.01130 0.742 0.640 0.552 0.477 0.412 0.308 0.231 0.174 0.131 0.099 0.075 0.057 0.033 0.015 0.00440 0.672 0.551 0.453 0.372 0.307 0.208 0.142 0.097 0.067 0.046 0.032 0.022 0.011 0.004 0.00150 0.608 0.475 0.372 0.291 0.228 0.141 0.087 0.054 0.034 0.021 0.013 0.009 0.003 <.001 <.001
Table 2 Present value of an annuity (PVA) of 1 euro (or other currency unit) in arrears*Discount rate
1% 1.5% 2% 2.5% 3% 4% 5% 6% 7% 8% 9% 10% 12% 15% 20%Payments
1 0.990 0.985 0.980 0.976 0.971 0.962 0.952 0.943 0.935 0.926 0.917 0.909 0.893 0.870 0.8332 1.970 1.956 1.942 1.927 1.913 1.886 1.859 1.833 1.808 1.783 1.759 1.736 1.690 1.626 1.5283 2.941 2.912 2.884 2.856 2.829 2.775 2.723 2.673 2.624 2.577 2.531 2.487 2.402 2.283 2.1064 3.902 3.854 3.808 3.762 3.717 3.630 3.546 3.465 3.387 3.312 3.240 3.170 3.037 2.855 2.5895 4.853 4.783 4.713 4.646 4.580 4.452 4.329 4.212 4.100 3.993 3.890 3.791 3.605 3.352 2.991
6 5.795 5.697 5.601 5.508 5.417 5.242 5.076 4.917 4.767 4.623 4.486 4.355 4.111 3.785 3.3267 6.728 6.598 6.472 6.350 6.230 6.002 5.786 5.582 5.389 5.206 5.033 4.868 4.564 4.160 3.6058 7.652 7.486 7.325 7.170 7.020 6.733 6.463 6.210 5.971 5.747 5.535 5.335 4.968 4.487 3.8379 8.566 8.361 8.162 7.971 7.786 7.435 7.108 6.802 6.515 6.247 5.995 5.759 5.328 4.772 4.031
10 9.471 9.222 8.983 8.752 8.530 8.111 7.722 7.360 7.024 6.710 6.418 6.145 5.650 5.019 4.192
11 10.368 10.071 9.787 9.514 9.253 8.760 8.306 7.887 7.499 7.139 6.805 6.495 5.938 5.234 4.32712 11.255 10.908 10.575 10.258 9.954 9.385 8.863 8.384 7.943 7.536 7.161 6.814 6.194 5.421 4.43913 12.134 11.732 11.348 10.983 10.635 9.986 9.394 8.853 8.358 7.904 7.487 7.103 6.424 5.583 4.53314 13.004 12.543 12.106 11.691 11.296 10.563 9.899 9.295 8.745 8.244 7.786 7.367 6.628 5.724 4.61115 13.865 13.343 12.849 12.381 11.938 11.118 10.380 9.712 9.108 8.559 8.061 7.606 6.811 5.847 4.675
16 14.718 14.131 13.578 13.055 12.561 11.652 10.838 10.106 9.447 8.851 8.313 7.824 6.974 5.954 4.73017 15.562 14.908 14.292 13.712 13.166 12.166 11.274 10.477 9.763 9.122 8.543 8.022 7.120 6.047 4.77518 16.398 15.673 14.992 14.353 13.754 12.659 11.690 10.828 10.059 9.372 8.756 8.201 7.250 6.128 4.81219 17.226 16.426 15.678 14.979 14.324 13.134 12.085 11.158 10.336 9.604 8.950 8.365 7.366 6.198 4.84420 18.046 17.169 16.351 15.589 14.877 13.590 12.462 11.470 10.594 9.818 9.129 8.514 7.469 6.259 4.870
25 22.020 20.720 19.525 18.424 17.413 15.623 14.094 12.783 11.654 10.675 9.822 9.077 7.843 6.464 4.94830 25.808 24.016 22.396 20.932 19.600 17.292 15.372 13.765 12.409 11.258 10.274 9.427 8.055 6.566 4.97940 32.835 29.916 27.355 25.104 23.115 19.793 17.159 15.046 13.332 11.925 10.757 9.779 8.244 6.642 4.99750 39.196 35.000 31.424 28.364 25.730 21.482 18.256 15.762 13.801 12.233 10.962 9.915 8.305 6.661 4.999
* To calculate the present value of an annuity in advance, find the annuity in arrears for one less payment and add 1.
Present value tablesExhibit 7.11
CFA_C07.qxd 11/6/03 2:23 PM Page 188

of periods n and interest rates r. To determine the discount factor where n = ten years and r = 12%, find the intersection of row n = 10 and column r = 12%. The discount factor roundedto three decimal places is 0.322.
Table 2 presents annuity factors. This table can be used when a constant sum is expected tobe received (or paid) each period for n periods. The formula for the annuity factor:
is simply the difference between the factor for an annuity received in perpetuity from today (1/r)and that for an annuity to be received n periods hence and discounted back to today:
Table 2 has a direct relationship to Table 1. You’ll notice that the annuity factors are equival-ent to the discount factors for a particular r accumulated up to period n. We can see this fromthe example of John Bull, the slow-paying debtor. Remember the proposal of Marianne’s manager– that Bull pay 10,000 at the end of each of the next two years? Originally we used discount factors to find the present values of these cash flows:
(10,000 × 0.9091) + (10,000 × 0.8264) = 17,355
Using the annuity factor table, we find the annuity factor for n = 2 and r = 10% which is 1.736.Thus the present value of this two-year stream of constant cash flows is:
10,000 × 1.736 = 17,360
In effect, the annuity factor in this case is the sum of the two discount factors for n = 1 and n = 2.(The difference is due to rounding to three instead of four decimal places.) The annuity factortable is particularly useful where we need to determine the present value of constant amountswhich are to be received or paid over long periods (e.g. interest on long-term fixed-rate debt).
l Timing of cash flows
The factors shown in Tables 1 and 2 are derived under the assumption that the cash flows to bediscounted occur at the end of the period. This raises two issues. First, what is meant by a‘period’? Second, what discounting procedure should be used if cash flows occur other than atthe end of the period?
A period can be a year or a fraction of it. If the latter, the discount rate r must be adjusted sothat it’s based on the same interval of time. For example, if interest on long-term debt is paid semi-annually at a 12% nominal annual rate, this is equivalent to compounding at a 6% rate every sixmonths or 12.36% [{(1.06)2 − 1} × 100] compounded annually. Generalising from this, a nominalinterest rate of r% a year compounded m times a year is equivalent to an annually compoundedrate of [{(1 + [r/m])m − 1} × 100]. It follows that, where the interest rate is compounded m timesa year, the discount factor for period n is:
We can use the tables to handle different compounding multiples m. For example, if we wishto find the present value of a ten-year stream of semi-annual interest payments on a ten-year12% bond issued at par value of 100, we go to the intersection of the 20 period row and the 6%(12%/2) column of Table 2 to obtain the annuity factor (in this case 11.470) to apply to the con-stant semi-annual interest payment.
1
(1 [ / ])++ r m mn
1
1
(1 )r r n××
++
1
1
(1 )r r r n−−
++
CHAPTER 7 • KEY CONCEPTUAL ISSUES IN FINANCIAL ACCOUNTING 189
CFA_C07.qxd 11/6/03 2:23 PM Page 189

190 PART 2 • THE HOUSE OF ACCOUNTING
End-of-period discount factors are widely used, even when strictly they are not appropriate.The error from employing end-of-period factors when the cash flows occur during the period islikely to be small, especially in relation to the potential error from mis-estimating future cashflows. There are two circumstances when companies abandon end-of-period discount factors:first, when it is known that cash will be received or paid at the start of the period; second, wherecash flows are expected to occur continuously (and evenly) over the period.
The first case is easy to accommodate. The start of period n is equivalent to the end of periodn − 1. Where n = 1, the cash flows occur at time zero, i.e. today, and the discount factor is 1.0.Tables 1 and 2 can be adapted easily, too. For Table 1, simply add 1 to the numbering of the rows.Thus the factors shown against the ‘n = 5’ row in Table 1 are equivalent to ‘n = 6’ when cash flowsoccur at the start of the period. As we’ve seen, where n = 1, the discount factor for all r is 1.0. Asfor Table 2, to determine the annuity factor for n payments when cash flows occur at the start ofthe period, find the annuity factor for n − 1 payments in Table 2 and add 1.0 to it.
Where cash flows are expected to be continuous and even, discount and annuity factors basedon a continuous compounding assumption should be used. Consult a finance text for moredetails. We shall assume cash flows occur only at the start or end of periods in this book.
Problem assignments
P7.1 Unusual events: accounting treatmentConsider the following events. How do you think each should be accounted for in the light of theIASB’s conceptual framework described in the chapter?
(a) A company buys 1,000 national lottery tickets at 1 euro each. (To win, a punter must choose six correct numbers between 0 and 90.) There is no secondary market for lottery tickets.
(b) An oil company is unsure how and when it should account for future field abandonment costs. Ithas just installed a production platform to develop a large oil field it has discovered in the BalticSea. Under environmental regulations governing oil production in these waters, it must removeand dismantle the platform at the end of the field’s economic life in 20 years’ time. The companyreckons it can estimate the dismantlement and other abandonment costs reasonably accurately.
(c) A quoted company pays an annual bonus to senior managers, based on its profit performance inthe year. To save cash, it decides to pay the bonus in the form of new shares – which in the cur-rent year involves the distribution of 100,000 shares. At the date of the award, it recognises com-pensation expense at the nominal value of the shares issued. Each share’s nominal value is fiveeuros. Its market value at this time is 20 euros.
P7.2 Accounting for pre-contract costsAmey is a UK-based support services group. It provides a range of services – from IT support to prop-erty maintenance – for public sector and private sector organisations that have decided to outsourcethese activities. According to the chief executive, 2001 was a good year. Group revenues increased19% to £786 million. The company had an 80% bid success rate, winning contracts with a total valueof £1,890 million that year. However, 2002 saw it competing for major London Underground mod-ernisation contracts and there were doubts whether it could maintain this bid success rate.
The company changed the way it accounted for pre-contract costs in its 2001 accounts. Until then,it had capitalised as an asset (under ‘deferred charges’) the costs incurred in bidding for new con-tracts where it was reasonably certain it would recover the costs. (Evidence of ‘reasonable certainty’
CFA_C07.qxd 11/6/03 2:23 PM Page 190

was a cost indemnity or the company’s appointment as preferred bidder.) Capitalised costs wereamortised against income arising on the related contracts. The new policy is to expense immediatelyall pre-contract costs unless reimbursement is assured.
The effect of the change in policy on the group’s 2001 accounts was significant. Profit before taxwas reduced by £28.5 million. Together with other accounting changes introduced at the same time,this turned a £15 million profit into a loss (before tax) of £18.2 million.
Amey’s management justified the change in policy on the grounds that it was consistent with pro-posed UK accounting guidelines on the topic. However, the draft rules only required companies toexpense immediately pre-contract costs that did not meet specified cost recovery tests. Moreover,Amey’s competitors did not change their accounting policies in 2001 and continued to capitalise cer-tain pre-contract costs. An analyst commented at the time:
‘Amey has interpreted [the draft rules] very prudently indeed, more so than any other company has con-templated before.’
Required
(a) Under what circumstances should pre-contract costs be recorded as an asset in your view?
(b) Why do you think Amey changed its accounting policy on pre-contract costs in 2001?
P7.3 Effect of alternative valuation bases on accountsOn 1 January x1, Exprés Company, a distributor of ultra-fast (‘Josep’) coffee-making machines, has30 in stock with a unit historical cost (and current value) of 2,500 (units of local currency). The com-pany’s balance sheet on that date is as follows:
Inventory 75,000 Shareholders’ equity 75,000
The company sells, for cash, 20 machines at 4,000 each at the end of December x1. It has no otherrevenues or expenses that year.
Because of the strong demand for the Josep coffee-making machines, the manufacturer increasesthe price to distributors by 20% to 3,000 at end-x1.
Required
Draw up Exprés Company’s x1 income statement and end-x1 balance sheet, assuming it values thecoffee-making machines at:
(a) historical cost;
(b) replacement cost.
Assume any holding gains arising under (b) are included in profit for the year.
Check figure:(b) Total assets 110,000
P7.4 Effect of alternative capital maintenance objectives on accountsAssume the same facts as in P7.3. In addition, general prices increase by 10% between the start andend of x1.
Required
(1) Draw up Exprés Company’s x1 accounts assuming it uses, as the measurement unit, the pur-chasing power of the currency at the end of x1 and it values its coffee-making machines at:(a) historical cost;(b) replacement cost.
(2) What is the maximum amount of x1 profit that the company can distribute as dividend on 1 January x2, and still maintain:
CHAPTER 7 • KEY CONCEPTUAL ISSUES IN FINANCIAL ACCOUNTING 191
CFA_C07.qxd 11/6/03 2:23 PM Page 191

(a) its financial capital in nominal currency?(b) its financial capital in end-x1 purchasing power terms, assuming:
(i) it values inventory at HC?(ii) it values inventory at RC?
(c) its physical capital in nominal currency?
Check figure:(2)(b)(ii) 27,500
P7.5 CPP accounting: purchasing power gains and losses
Exprés Company decides to finance part of its assets with debt. Assume its start-x1 balance sheet isas follows:
Inventory 75,000 Shareholders’ equity 50,000Debt 25,000
Total assets 75,000 Total equities 75,000
The annual interest rate on the debt is 15%. Interest is paid in cash at year-end. All other facts arethe same as in P7.3 and P7.4, i.e. start-x1 inventory comprises 30 machines at 2,500 each, 20 aresold at end-x1 – each for 4,000 cash – when the replacement cost is 3,000, and general pricesincrease 10% in x1.
Required
Draw up Exprés Company’s x1 accounts, assuming it uses the end-x1 purchasing power of the cur-rency and it values the coffee-making machines at:
(a) historical cost;
(b) replacement cost.
Check figure:Profit for year: (a) 23,750; (b) 26,250
P7.6 Long-term debt: impact of alternative valuation bases
On 1 January x1, Sylvie Company borrows A750,000 for five years at a fixed interest rate of 6% fromOld Goriot Bank. Under the terms of the agreement, it pays interest of A45,000 on 31 December eachyear between x1 and x5 and repays the principal of A750,000 on 31 December x5.
During x1, market interest rates fall. By end-x1, when Sylvie Company prepares its accounts forthe year, the interest rate on debt of equivalent maturity and risk is 5%. As a result, the current valueof the loan at 31 December x1 (after payment of interest for the year) is A776,595. (This is the presentvalue, as of 31/12/x1, of future loan payments discounted at 5%.)
Required
(a) Show the impact of the A750,000 loan on Sylvie Company’s x1 income statement and end-x1 balance sheet, assuming the debt is valued at:(i) historical cost;(ii) current value.
(b) Suppose the current market interest rate remains at 5% in x2. What is the impact of the A750,000loan on Sylvie Company’s x2 income statement and end-x2 balance sheet, assuming the debt isvalued at current value? The current value of the loan at 31 December x2 is A770,424.
192 PART 2 • THE HOUSE OF ACCOUNTING
CFA_C07.qxd 11/6/03 2:23 PM Page 192

P7.7 Effect of falling prices on corporate financial statements
General prices can decrease as well as increase. The most notable example of a country that hasexperienced falling prices in recent years is Japan. After rising slightly between 1990 and 1994, generalprices – as measured by the GDP deflator – declined by 2.3% between 1994 and 1999. They fell by1.5% in 1999 alone.
A decline in the general price level undermines reported numbers in company accounts. The effectis the opposite of that of rising prices. Set out below are summary 1999 financial statements for JapanInc. – the combined income statements and balance sheets of some 2.5 million non-financial com-panies in Japan, before adjustment for changing prices. (Amounts are in billions of yen.)
Japan Inc.Summary 1999 accounts
Income statement for yearSales 1,383,464Cost of sales (including depreciation of 41,690) −1,076,441Sales and general management costs −277,753
Operating profits 29,270Financial and other non-operating income +19,432Financial and other non-operating expenses −21,778
Recurring profits 26,924Special profits and losses −14,281
Profit before tax 12,643Corporate income tax and inhabitant tax −10,475
Net profit 2,168
Balance sheet, end-yearAssets 1999 1998 Liabilities and capital 1999 1998Cash and deposits 134,657 133,415 Bills and accounts payable 182,315 204,494Bills and accounts receivable 224,076 225,886 Short-term borrowings 180,978 189,511Inventories 115,793 134,470 Other current liabilities 171,655 182,466Other current assets 113,599 138,097 Current liabilities 534,948 576,471
Current assets 588,125 631,868Long-term borrowings 322,518 369,046
Tangible fixed assets, net 495,943 498,514 Other long-term liabilities 140,212 114,711[of which: Land 170,314 162,374] Long-term liabilities 462,730 483,757Intangibles 15,158 17,923Investments and other 183,039 161,954 Share capital 81,482 78,131
Fixed assets 694,140 678,391 Share premium 47,594 42,581Revenue reserves 157,903 131,606
Deferred charges 2,650 2,540 Special legal reserve 257 253Capital and reserves 287,236 252,571
Total assets 1,284,915 1,312,799 Total liabilities and capital 1,284,914 1,312,799
Source: Statistics Bureau, Government of Japan, Statistical Yearbook 2002, Table 5-11.
Required
Assess the impact of the decline in general prices on Japan Inc’s reported 1999 income. What is thelikely effect of the decline – in directional terms (i.e. + or −) – on (a) operating profits and (b) recurringprofits that year, assuming HC/CPP accounting? Give reasons for your answers.
CHAPTER 7 • KEY CONCEPTUAL ISSUES IN FINANCIAL ACCOUNTING 193
CFA_C07.qxd 11/6/03 2:23 PM Page 193

194 PART 2 • THE HOUSE OF ACCOUNTING
P7.8 Valuation using present value methods*
(1) Valuation of bonds at issuance
Company X raises A20 million in cash by issuing five-year 5% bonds to investors on 2 January x1.(Bonds are interest-bearing securities with, in most cases, a stated maturity date.) The company willpay interest annually in the amount of 1 million euros at the end of each of the five years x1 to x5.The principal of the bonds (A20 million) will be paid in full on 31 December x5.
Required
What is the present value of the bonds, at time of issuance, if the market rate of interest for bonds ofequivalent risk at that date is:
(a) 5%?
(b) 6%?
(2) Valuation of leased equipment and effect on accounts
Company Y is considering leasing computer equipment. The annual lease payment is A100,000 whichthe company must pay at the start of each year of the lease contract. The term of the lease is fouryears, which is also the expected economic life of the equipment. If the company buys the equipmentwith debt, the annual cost of borrowing will be 8%.
Required
(a) What is the present value of the lease payments under this contract?
(b) Assume the present value of the lease payments represents the market value of the computerequipment at the date the lease contract is signed (and the first payment is made). If Company Yis viewed as the economic owner of the computer equipment (because it will enjoy the economicbenefits the equipment is expected to provide), how do you think Company Y should report thelease in its financial statements at the contract date?
(3) Calculation of pension contribution
Company Z wants to set up a pension scheme for its current president that will give her (and her surviving spouse) an annual income of A250,000 for 20 years, starting when she retires in five years’time. She will receive her pension at the end of each year. To ensure there are sufficient assets avail-able to meet these payments, the company plans to make annual contributions to its pension fundover the next five years. Assume the annual discount rate used by the pension fund to discount its liabilities and the expected annual rate of return on fund investments are both 6%.
Required
(a) How much should the company contribute each year to the fund during the president’s remain-ing working life? Assume the annual contribution is made at the end of the year.
(b) How do you think the company and the pension fund should record the annual contribution to thefund?
* Problem draws on material in Appendix 7.2.
CFA_C07.qxd 11/6/03 2:23 PM Page 194

Notes to Chapter 7
1 The discussion in this section owes much to work by Nobes (see Nobes, C. (1992), InternationalClassification of Financial Reporting, London: Routledge). The best known early attempt to classifyaccounting regimes was made by Mueller (see Mueller, G. (1967), International Accounting, NewYork: Macmillan).
2 La Porta, R., Lopez-de-Silanes, F., Shleifer, A. and Vishny, R. (1998), Law and finance, Journal ofPolitical Economy, 106: 1113–1155. In a separate study, the authors found that debt markets were alsolarger and broader in common law countries (see La Porta, R., Lopez-de-Silanes, F., Shleifer, A. andVishny, R. (1997), Legal determinants of external finance, Journal of Finance, 52: 1131–1150).
3 La Porta et al. derive an antidirector rights index separately for French code law, German code law andScandinavian code law countries (ibid. (1998), table 2, pp. 1130–1131). I have combined the indexscores for all code law countries here.
4 To construct the disclosure index, the authors examined annual reports for inclusion or omission of90 items covering general information, income statement, balance sheet, cash/funds flow statement,accounting standards, stock data and special items. The average score for common law countries is69.6, that for code law countries 56.9 (ibid. (1998), pp. 1142–1143).
5 There are now many English-language sources of information on national accounting practice within Europe. Among the most up-to-date are: Roberts, C., Weetman, P. and Gordon, P. (2001), International Financial Accounting, 2nd edition, London: FT/Prentice Hall; Alexander, D. andArcher, S. (eds) (2001), European Accounting Guide, 4th edition, New York: Aspen Law & Business;Ordelheide, D. and KPMG (eds) (2001), Transnational Accounting, 2nd edition, Basingstoke: Palgrave;and the tax and business guides of the major international public accounting firms.
6 The directive mentions two other general ‘principles’. The components of individual assets and liab-ilities must be valued separately. And the beginning balance sheet of a period should agree with theending balance sheet of the previous period.
7 In addition to the going concern assumption, the accruals concept and consistency, the IASB includesmateriality (‘Each material item should be presented separately in the financial statements’) and off-setting (‘Assets and liabilities should not be offset [unless permitted or required by an IAS]’) amongthe ‘overall considerations’ that should underlie financial statements (IAS 1: Presentation of FinancialStatements).
8 The IASB’s position is set out in full in its Framework for the Preparation and Presentation of FinancialStatements. (In fact, the Framework was drawn up by the IASB’s predecessor, the IASC.) One issue notaddressed in the Framework is the meaning of ‘entity’, in accounting. We know from our discussionof sole proprietorships and corporate groups in Chapter 1 that an accounting entity is not neces-sarily the same as a legal entity. We investigate this issue further in a later chapter on consolidationaccounting.
9 Relevance and reliability are considered the two most important characteristics of useful informationand the IASB explores the accounting dimensions of each. For example, materiality and relevance arelinked. ‘Information is material if its omission or misstatement could influence the economic de-cisions’ of financial statement users (IASB, Framework, para. 30). Thus information must be materialto be relevant. Similarly, reliability is linked to another hallowed concept in accounting, ‘substanceover form’. The IASB argues that only when accounts reflect the economic substance of transactionsdo they ‘faithfully represent’ events. Faithful representation, along with neutrality and completeness,are key aspects of reliable information.
10 Bonbright, J.C. (1937), Valuation of Property, Charlottesville, VA: Michie, p. 71.11 Report of the Inflation Accounting Committee (Chairman: F.E.P. Sandilands) (1975), Inflation
Accounting, London: HMSO, pp. 57–60.12 IASB, IAS 29: Financial Reporting in Hyperinflationary Economies. One indicator of a hyperinflationary
economy, according to the IASB, is a cumulative three-year inflation rate that approaches, or exceeds,100%.
13 Cairns, D. (2000), The International Accounting Standards Survey 2000. The Survey is updated annually:see www.cairns.co.uk.
CHAPTER 7 • KEY CONCEPTUAL ISSUES IN FINANCIAL ACCOUNTING 195
CFA_C07.qxd 11/6/03 2:23 PM Page 195

Fixed assets, tangible andintangible
INTRODUCTIONAccounting for, and reporting of, tangible and intangible fixed assets is thesubject of this chapter. (The accounting for financial fixed assets is covered in later chapters.) Tangible and intangible fixed assets are resources of the firmwhich are expected to generate future benefits indirectly: they are used to producethe goods or services which themselves generate cash.
Fixed assets with physical substance – land, buildings, equipment – arereferred to as ‘tangible assets’. Non-monetary assets without physical sub-stance – purchased patents, trademarks, licences – are described as ‘intangibleassets’. To keep the terminology simple, we shall often refer to tangible andintangible fixed assets collectively as fixed assets.
In section 1 of the chapter we consider the accounting for tangible assets atthe three stages of their existence: formation, working life and retirement. Acompany must make accounting decisions when a fixed asset is ‘born’ andduring its life. These decisions concern the costs to include as part of the asset(the capitalisation decision), the method and period of amortisation (thedepreciation decision), and the basis of valuing the asset during its economiclife (the valuation decision). We illustrate the effect of each of these decisionson a firm’s accounts. We also describe the way it accounts for fixed asset disposals.
The above decisions concern the measurement of fixed assets. A companymust first decide whether an ‘investment’ has created a fixed asset. This raisesdefinition and recognition issues. They lie at the heart of the controversy overthe accounting for intangibles such as goodwill, brands and research anddevelopment costs. We look at the accounting problems created by outlays onintangibles in section 2 of the chapter.
Firms following international accounting standards must make extensivedisclosures about their fixed assets. In section 3 of the chapter, we learn whatinformation IAS require firms to make and discover how investors use it whenanalysing a company’s accounts.
88
SECTION 1Tangible assets
l Capitalisationdecision
l Depreciation decision
l Repairs andimprovements
l Retirement
l Valuation decision
SECTION 2 Intangible assets
SECTION 3 Fixed assets andfinancial statementanalysis
l Appendix 8.1: Sum-of-years’ digits and units-of-productiondepreciation
l Appendix 8.2:Investment property
In this chapter
CFA_C08.qxd 11/6/03 2:25 PM Page 196

CHAPTER 8 • FIXED ASSETS, TANGIBLE AND INTANGIBLE 197
SECTION
1 Tangible assets
The capitalisation decision
A company recognises an item of property, plant or equipment as an accounting asset using thesame criteria we set out in Chapter 7. It expects to obtain economic benefits from the asset infuture periods and the asset’s cost or value can be measured reliably. For items of low value, liketools or dies, management must decide whether to treat them singly or to group them whenapplying the criteria.
Property, plant and equipment are valued initially at cost. But what is ‘cost’? Companies fol-low the general principle that cost should include the purchase price and ‘any directly attributablecosts of bringing the asset to working condition for its intended use’.1
An example shows how this general principle is applied. Quixote, an electricity-generatingcompany, decides to construct a windmill of advanced design to generate electricity in a remotearea of Spain. It incurs the following costs in acquiring land and installing the windmill:
Purchase price of land 10,000Cost of razing old buildings on land, net of salvage value 15,000
Cost of windmill, including transport to and assembly at site 1,000,000Cost of initial tests, including salaries of technicians involved 48,000One year’s insurance premium, of which one tenth relates to test period 20,000
The cost of the land is recorded at 25,000. Site clearance costs of 15,000 should be capitalised,since the land cannot be put to its intended use without incurring such costs.
Under international accounting rules, the cost of the windmill is recorded at 1,050,000. Thecosts of testing the equipment (48,000), including the relevant share of the insurance premium(2,000), should be capitalised, since, again, these outlays are necessary before the windmill canbe brought into service.
Companies follow the same general principle when constructing their own plant and build-ings. Included in the cost of a self-constructed asset are direct costs, such as materials and labour,and indirect costs which are allocated to it. Examples of such indirect costs are depreciation onequipment used in making the asset and the cost of management time spent supervising its construction.
There are grey areas, however. Take financing costs as an example. How should a companytreat the cost of debt incurred to finance the asset’s construction? Is it part of the cost of financ-ing the business as a whole and thus expensed in the period incurred? Or is the cost of borrow-ing no different from other indirect costs which have to be incurred for the asset to be usable?And if the latter, should not a company that relies on equity capital to finance the asset’s con-struction be allowed to charge an imputed cost of equity to the asset?
Opinion, at present, is divided – and practice reflects this.
l Under the 4th Directive, EU member states can permit firms to capitalise borrowing costsincurred to finance production of fixed assets. Interest capitalisation is not a common prac-tice in Europe except in certain industries (e.g. construction).
l Under IAS, companies can either expense all borrowing costs immediately (‘benchmark’treatment) or capitalise those borrowing costs incurred to finance the acquisition, construc-tion or production of a ‘qualifying’ asset (allowed alternative treatment). (A qualifying asset
CFA_C08.qxd 11/6/03 2:25 PM Page 197

is one that ‘necessarily takes a substantial period of time to get ready for its intended use or sale’. It can be a building, manufacturing plant or long-production-cycle inventory.2)Whichever policy is adopted must be applied consistently.
l US GAAP requires interest capitalisation in those cases where IAS permit it.
No country permits the capitalisation of imputed equity costs. Thus the complaint remains thatown-constructed assets which are equity-financed and those which are debt-financed may betreated inconsistently.
In the event a company elects to capitalise borrowing costs, how does it determine capitalisedinterest in a period? IAS apply an ‘opportunity cost’ approach. A company should capitalise
198 PART 2 • THE HOUSE OF ACCOUNTING
FactsQuixote makes the following payments on the windmill during year 1: 210,000 on 1 March;390,000 on 1 June; 320,000 on 1 October; and 130,000 on 31 December. The total cost of thewindmill is 1,050,000. It enters service on 1 January year 2. Quixote’s total debt outstandingduring year 1 is 2,000,000. The average annual interest rate on the debt is 6%.
Calculation of windmill’s capitalised interest costTo calculate the interest costs to be capitalised, first calculate the weighted averageaccumulated expenditures (WAAE) on the asset during the construction period. The windmill’sWAAE is 482,500.
Weighted averageExpenditure accumulated
Date Expenditures weight* expenditures1 March year 1 210,000 10/12 175,0001 June 390,000 7/12 227,5001 October 320,000 3/12 80,00031 December 130,000 – –
1,050,000 482,500
* Months between date of expenditure and date interest capitalisation ceases (31 December),divided by 12.
Next, determine the cost of financing the WAAE. WAAE are financed first by specificborrowings and the balance by general borrowings. The total cost of these borrowings isavoidable interest. Interest capitalised is the lower of (a) avoidable interest and (b) actualinterest costs incurred in the capitalisation period. Quixote has not raised debt to finance thewindmill specifically. All its borrowings are general. Thus interest capitalised is 28,950, theavoidable interest.
Capitalisation period Avoidable interest Actual interest incurred
1 March–31 December year 1 28,950 100,000(482,500 × 6%) (2,000,000 × 6% × 10/12)
(The expenditure figure of 482,500 is computed after weighting expenditures during the 10-month capitalisation period so the interest rate itself is not adjusted.)
Balance sheet presentationThe cost of the windmill is recorded as 1,078,950 (1,050,000 + 28,950) in Quixote’s balancesheet at 31 December year 1.
Capitalisation of borrowing costs: illustrationExhibit 8.1
CFA_C08.qxd 11/6/03 2:25 PM Page 198

CHAPTER 8 • FIXED ASSETS, TANGIBLE AND INTANGIBLE 199
those borrowing costs that would have been avoided if expenditures on the qualifying asset hadnot been made. Exhibit 8.1 illustrates how this approach works in practice, using Quixote’swindmill acquisition as an example.
Based on the numbers in the example, the interest Quixote would have avoided if the wind-mill had not been acquired is 28,950. This is the product of the average interest rate on the com-pany’s debt (6%) and the average accumulated expenditures on the windmill during thecapitalisation period (482,500). The revised cost of the windmill is thus 1,078,950 which is thesum of the acquisition cost (1,050,000) and the capitalised interest (28,950).
Note that interest is only capitalised while the asset is being made ready for use (or sale). Whenit is ready, capitalisation ceases and all interest costs after this date are expensed as incurred.
The depreciation decisionOnce a company begins to use a fixed asset (strictly, when the asset becomes available for use),it must decide how to depreciate the asset. Assets such as buildings, machinery and equipmenthave limited useful lives, at the end of which the economic benefits they provide the firm are allconsumed. Regardless of how such an asset is valued, its carrying amount (or net book value)is reduced as the firm uses the asset and consumes the benefits. The firm records the reductionas ‘depreciation expense’ in its income statement. In this way, reported profit reflects the cost offixed asset inputs used to generate revenues in the period.3
‘Amortisation’ is a synonym for depreciation. It is usually applied only to intangible fixedassets. The term ‘depletion’ refers to the using up of exhaustible natural resources such asoilfields and copper mines.
l Asset lifeWhen calculating depreciation, management’s first task is to estimate an asset’s useful life. To dothis, they have to consider the effects of future changes in economic conditions and technologyand, in the case of tangible fixed assets, the effects of physical wear and tear. Note that the usefullife of a fixed asset to a company may well be less than its economic or physical life. For example,a commercial aircraft may have utility to a charter airline even after its useful life to a scheduledcarrier has ended.
Not all fixed assets are depreciated. For example, a firm will not depreciate land if it considersits useful life to be indefinite.
l Depreciation methodManagers must decide on a systematic method of allocating an asset’s cost or value over its useful life.They determine the method of depreciation at the outset of the asset’s life and then apply it consistently. Strictly, the method should reflect when the firm expects to consume the asset’sbenefits. Thus, if proportionately more of the asset’s benefits will be enjoyed in the earlier yearsof its life, it makes sense to charge more depreciation in the early years and less in the later years.
In practice, other factors, such as ease of calculation, likely impact on profits and, in uniformreporting countries, tax considerations, influence management’s choice of depreciation method.Nonetheless, systematic methods are always used. This is important. They make it more difficultfor management to adjust depreciation expense in the light of operating conditions. Manipulat-ing profit by altering the periodic depreciation charge was a favourite ploy in the early days ofcorporate accounting.
Several systematic methods of depreciation are in use in Europe. Two popular ones are thestraight-line method and the declining-balance method. We explain and illustrate both below.
CFA_C08.qxd 11/6/03 2:25 PM Page 199

Two other methods, namely the sum-of-years’-digits and units-of-production methods, aredescribed in Appendix 8.1.
Straight-line method (SL method) Under the SL method, the depreciation charge is a constant amount each period. It is an appropri-ate method when an asset’s economic benefits are expected to be consumed evenly over its life.
The SL depreciation charge is computed by applying a predetermined, fixed percentage to theasset’s depreciable amount. The depreciation percentage (or rate) is based on the asset’s expecteduseful life:
SL depreciation rate ==
The depreciable amount is the asset’s cost less the expected end-of-life salvage value. Salvagevalue (or residual value) is not depreciated because the company expects to recover this portionof the asset’s cost. Thus the SL depreciation charge on equipment costing 12,000 with anexpected four-year life and estimated salvage value of 2,000 is 2,500:
SL depreciation charge == [12,000 −− 2,000] ×× 25%Cost Salvage Depreciation
value rate== 2,500
Declining-balance method (DB method)
Under the DB method, the depreciation charge is a decreasing amount each period. The DB methodis an example of a reducing charge method. In North America it’s described as an acceleratedmethod. A reducing charge method is appropriate when the economic benefits from an asset areexpected to be concentrated in the early years of its life.
The DB depreciation charge is computed by applying a predetermined, fixed percentage to thestart-of-year carrying amount of the asset. (In the first year, the percentage is usually applied tothe asset’s cost.) The percentage should be that rate which ensures that the asset is written downto its expected salvage value at the end of its useful life. In practice, the declining-balance depre-ciation rate is calculated as a multiple of the straight-line rate. Thus the ‘double declining-balance’ rate for an asset with a ten-year life is 20%. In short:
DB depreciation charge == Start-of-period carrying amount ×× DB depreciation rate
Since over the asset’s life depreciation accumulates while the cost remains unchanged, an asset’scarrying amount diminishes over time. As a result, the depreciation charge also diminishes eachperiod in absolute terms.
Exhibit 8.2 charts the effect of the SL and DB methods on both the annual depreciation chargeand the carrying amount of a typical asset. The asset is valued at cost and is expected to have nosalvage value at the end of its useful life.
Note that under the DB method an asset’s NBV – and thus the depreciation charge – declinesby a decreasing amount each period.
l Depreciation methods illustrated
We now illustrate these two methods. Quixote buys a Rocinante van for use by its windmill-based personnel. The van cost the company 10,000 and is expected to have a useful life of fiveyears. The straight-line depreciation rate is therefore 20%. The depreciation rate used in the
1
Asset’s expected useful life 100××
200 PART 2 • THE HOUSE OF ACCOUNTING
CFA_C08.qxd 11/6/03 2:25 PM Page 200

declining-balance calculation is set at double the straight-line rate or 40%. The van’s salvagevalue at the end of five years is expected to be minimal and can be ignored in the depreciationcalculation.
Exhibit 8.3 shows the yearly depreciation charges and end-year net book value figures for theRocinante van, which Quixote would report under the two depreciation methods. The companymeasures the asset at (depreciated) cost.
Under the SL method, the annual depreciation charged on the van each year is 2,000 (10,000(the depreciable amount) × 20%).
Under the DB method, the depreciation charge is a function of the van’s net book value whichdeclines over its life. For example, at the start of year 2, the van’s net book value (NBV) is 6,000,the asset’s cost of 10,000 less year 1 depreciation of 4,000. The DB rate of 40% is then applied tothis NBV to give a year 2 depreciation charge of 2,400 (40% × 6,000). By the start of year 3, thevan’s NBV is 3,600 (the asset’s cost less depreciation in years 1 and 2) which in turn yields a year3 depreciation charge of 1,440 (40% × 3,600).
Notice that in year 4, the company switches from the declining-balance to the straight-linemethod. This is a common practice in some continental European countries when the SL depre-ciation charge, calculated from the date of change, is higher than the DB charge for the year. Inyear 4, the DB charge is 864 (40% × 2,160); the SL charge that year (calculated from the start ofyear 4) is 1,080 (50% × 2,160). Switching to SL depreciation avoids a large depreciation chargein the year of disposal, which would occur under the DB method when the remaining book valueis written off.
The choice of depreciation method does not affect the type of accounting records kept nor theentries to them. For example, the entry to record depreciation in year 3 under the two methodsis as follows (amounts in 000):
Depreciation method
SL DB Dr. Depreciation expense (OE−) 2.0 1.44
Cr. Accumulated depreciation (CA+) 2.0 1.44
CHAPTER 8 • FIXED ASSETS, TANGIBLE AND INTANGIBLE 201
Straight-line vs declining-balance methods: effect on depreciation charge and net book value of typical fixed asset
Exhibit 8.2
CFA_C08.qxd 11/6/03 2:25 PM Page 201

l Practical aspects of depreciation calculationDepreciation calculations are not as exact or as time-consuming as they appear at first sight.Rather than estimating expected life on an individual asset basis, a company often determinesthe average expected life for each class of fixed asset – for example, industrial buildings, motorvehicles, office equipment – using industry data and its own past experience.
Companies can and do use different depreciation methods for different types of asset. This islogical since assets differ in the pattern of benefits they yield. However, depreciation methodsmust be consistently applied over time. Management should justify any change in depreciation:for example, they should explain why the new policy is preferable to the old.
202 PART 2 • THE HOUSE OF ACCOUNTING
FactsQuixote buys a Rocinante van for 10. It has an expected useful life of five years and expectedresidual value of zero.
Annual depreciation charge and net book value (NBV)
SL method DB methodDepreciation Net book Depreciation Net book
expense value expense value
Acquisition 10 10Year 1 depreciation 2 –2 4 –4End-year 1 NBV 8 6Year 2 depreciation 2 –2 2.4 –2.4End-year 2 NBV 6 3.6Year 3 depreciation 2 –2 1.44 –1.44End-year 3 NBV 4 2.16Year 4 depreciation 2 –2 1.08* –1.08End-year 4 NBV 2 1.08Year 5 depreciation 2 –2 1.08* –1.08End-year 5 NBV 0 0
Calculations
Straight-line (SL) method:l Five-year life implies depreciation rate of 20% a year.l Annual depreciation is 2 (20% × 10).
Declining-balance (DB) method:l Depreciation rate is assumed to be double the SL rate.l Apply rate to start-of-year NBV.l Thus, year 2 depreciation is: 40% × 6 = 2.4
* It is common practice in Continental European countries to switch from the DB method to the SLmethod when the SL depreciation charge – calculated from that date – exceeds that under the DBmethod. Year 4 is the first year in which the SL charge is greater than the DB charge (because theSL rate is greater than the DB rate) – hence the switch to the SL method that year:
DB method SL methodDepreciation: year 2 2.4 1.5 (6.0 × 25%)
year 3 1.44 1.2 (3.6 × 33%)year 4 0.86 (2.16 × 40%) 1.08 (2.16 × 50%)
Straight-line (SL) and declining-balance (DB) depreciation methods: illustration(amounts in 000)
Exhibit 8.3
CFA_C08.qxd 11/6/03 2:25 PM Page 202

Companies usually bring assets into service during the financial year rather than at the start. How is depreciation expense calculated in these cases? The most logical approach is tocharge depreciation for the part of the financial year an asset is in service. Assume Quixote prepares annual accounts on a calendar year basis. If the company acquires the Rocinante vanon 15 September year 1, the van is in service for only 3.5 months in that year. Given that it depre-ciates such assets on a double declining-balance basis (in this case, 40%), it charges depreciationof only 1,167 in year 1 ((10,000 × 40%) × 3.5/12). The asset’s net book value at the end of year 1is 8,833 (10,000 – 1,167) and the depreciation charge in year 2 is 3,533 (8,833 × 40%). Quixotecharges the balance of the depreciable amount at the end of year 5 as depreciation in year 6. Notethat other, simpler methods (such as charging half a year’s depreciation in the financial year theasset enters service, irrespective of when in the year it does so) are also used.
l Depreciation and residual values
If a company expects to sell a fixed asset at the end of its useful life for more than a nominal sum,then, under international rules, the expected residual value should be deducted from the asset’scost in calculating the amount to be depreciated. The expected residual value is the net proceedsfrom disposal (that is, net of any estimated disposal costs), as estimated at the date of the asset’sacquisition.4
In practice, companies base depreciable amount on the asset’s cost if residual value isexpected to be immaterial. Tax authorities in Europe rarely take account of it in determining taxdepreciation.5
l Depreciation and cash flow
Depreciation is a non-cash expense. It has no direct effect on a company’s cash flow. ConsiderQuixote. Suppose it forecasts profit before tax of 2 million in year 9. This forecast is based onexpected (cash) revenues of 10 million and expected expenses of 8 million of which the onlynon-cash expense is depreciation of 500,000. As a result of a change in depreciation method,actual depreciation in year 9 is 750,000. Other things being equal, Quixote’s year 9 pre-tax profitwill fall to 1.75 million but its operating cash flow (ignoring working capital changes) will beunchanged at 2.5 million.
Quixote: Year 9 profit and cash flow before tax (in m)
Forecast Actual
Revenues 10 10Expenses: Cash-based 7.5 7.5
Depreciation 0.5 0.75−8 −8.25
Profit before tax 2 1.75
+ Depreciation +0.5 +0.75Operating cash flow before tax 2.5 2.5
Depreciation has an indirect effect on corporate cash flow – through its impact on taxes. If acompany can increase its depreciation charge for tax purposes in a period, it lowers its taxableincome and thus the income taxes it pays that period. Continuing with our Quixote example,assume the company’s taxable income in year 9 is equal to its profit before tax that year and thetax rate is 40%.
CHAPTER 8 • FIXED ASSETS, TANGIBLE AND INTANGIBLE 203
CFA_C08.qxd 11/6/03 2:25 PM Page 203

Quixote: Year 9 profit and cash flow after tax (in m)
Forecast Actual
ProfitProfit before tax 2 1.75Less: Income tax at 40% −0.8 −0.7Profit after tax 1.2 1.05
Operating cash flowOCF before tax 2.5 2.5Less: income tax paid −0.8 −0.7OCF after tax 1.7 1.8
Higher depreciation of 250,000 reduces Quixote’s after-tax profits by 150,000 (250,000 ×(1 − tax rate)). But it lowers the tax the company pays in year 9 by 100,000 and thus raises itsafter-tax operating cash flow from 1.7 million to 1.8 million that year.
Quixote’s tax bill is not permanently lowered. Under HC accounting, higher depreciation inthe current period means lower depreciation in future periods. Thus the company postponesrather than avoids tax of 100,000. Of course, in present value terms, the company benefits fromthe tax deferral.
Up to now we have assumed that the depreciation a company reports on its tax return (taxdepreciation) is the same as the depreciation it charges in its published accounts (book depre-ciation). This is rarely the case in separate reporting countries. Governments and companieshave different goals when determining depreciation policy. A government may allow firms todepreciate certain types of asset at a rapid rate for tax purposes so that they can lower their after-tax cost of investment. Management, however, estimate asset lives with the aim that the accountsportray fairly (‘give a true and fair view of ’) the results and position of the firm. In separatereporting countries, a change by a firm in its book depreciation is unlikely to affect its tax depre-ciation and thus will have no impact on its after-tax cash flow.
In sum, a change in book depreciation always affects reported profits. It only affects cash flow iftax and book depreciation are linked. In this case, the effect on cash flow is the opposite of the effecton profits. We return to this topic in a later chapter when we discuss the accounting for incometaxes.
l Depreciation of fixed assets: EU practiceEmpirical evidence indicates that the SL method is the most popular depreciation method inEurope and elsewhere. In a survey of listed and unlisted EU companies in the 1990s, over 90%of those that reported property in their accounts – and almost 90% of those reporting plant andmachinery – used the SL method. (This does not mean that only 10% of firms use other methods.In some countries, firms use both SL and DB methods for different types of equipment.)6
One obvious reason for the SL method’s popularity is its simplicity and ease of calculation.Moreover, when a company’s fixed asset base is growing and asset prices are rising, the SL methodresults in a lower aggregate depreciation charge and the company reports higher profits. In thepast, this is more likely to have influenced managers in separate reporting countries. Higherprofits mean higher pay – whether directly via profit-related bonuses or indirectly via the pre-mium they command as ‘successful’ managers. However, higher profits from this source have no effect on a firm’s tax liability (since tax depreciation and thus taxable income are computeddifferently from the book numbers).
By contrast, we should expect to find reducing charge methods more popular in those uniform reporting countries which permit their use for tax purposes. Empirical evidence bears
204 PART 2 • THE HOUSE OF ACCOUNTING
CFA_C08.qxd 11/6/03 2:25 PM Page 204

CHAPTER 8 • FIXED ASSETS, TANGIBLE AND INTANGIBLE 205
this out. For example, France and Germany come from a uniform reporting tradition, theNetherlands and the UK from a separate reporting one. French and German companies can optto use the declining balance method to depreciate plant and machinery for tax purposes. In thesurvey mentioned above, over two-thirds of German companies and almost half of French firmsdisclosing plant and machinery in their balance sheets reported using the DB method for sometypes of equipment whereas none of the equivalent Dutch and UK companies reported using it.7
Repairs and improvements
Sums are often spent on a building or machine during its life. How should such outlays be ac-counted for? Under IAS, expenditures which raise the performance of an asset beyond its initiallevel are treated as improvements. Improvements are capitalised and depreciated over the asset’sremaining useful life. Examples of improvements are expenditures that extend an asset’s useful life,increase its capacity, raise substantially the quality of its output or reduce substantially its oper-ating costs. If the expenditure maintains rather than adds to the benefits expected from the assetinitially then the costs are treated as repairs. Repairs are expensed in the period they’re incurred.
Consider the case of Quixote’s windmill. It costs 1,078,950 and enters service at the start of year 2. Suppose Quixote spends a further 228,700 on it in late year 2 in order to extend its useful life from three to five years. The expenditure improves the asset’s performance and istherefore capitalised. Quixote must also revise the annual depreciation charge, starting in year 3.In year 2, it charged SL depreciation of 359,650 against revenues. Depreciation in year 3 (andsubsequent years) is now reduced to 237,000. The calculation is shown below (all amounts inthousands):
Windmill Accumulated Net bookat cost depreciation value
Cost, at 1/1/year 2 1,078.95 1,078.95Year 2 depreciation (1,078.95/3 years) 359.65 −359.65End-year 2 improvement 228.7 +228.7Balance, end-year 2 1,307.65 359.65 948Year 3 depreciation (948/4 remaining years) 237 −237Balance, end-year 3 1,307.65 596.65 711
The revised depreciation charge is calculated by allocating the windmill’s net book value(948,000) at the end of year 2 over the remaining four years of its life.
Retirement
A company retires a fixed asset when it is economically advantageous for it to do so. This datemay not coincide with the disposal date forecast at the time of acquisition. Changes in economicconditions or the level of usage may result in a company selling a fixed asset earlier (or later) thanplanned. If the company foresees this, it should write off the asset at a faster (slower) rate. Pastfinancial statements are not restated: only future depreciation charges are modified.
There are occasions when an asset may continue to be used after it’s fully depreciated. In thisevent, the company no longer charges depreciation since the asset’s cost has been fully recovered.It does not adjust prior years’ financial statements if it can show that the calculation of depreci-ation in those years was made in good faith. Managers can only be expected to use informationcurrently available when estimating assets’ useful lives.
CFA_C08.qxd 11/6/03 2:25 PM Page 205

The accounting for a fixed asset’s retirement is straightforward. We learned earlier that, at thetime of disposal, the balances in the asset and accumulated depreciation accounts relating to theasset sold must be removed. In addition, the company records a gain (loss) in its income state-ment if the asset’s disposal value is greater (less) than its net book value at that date. ConsiderQuixote’s Rocinante van. The company decides to retire it at the end of the fourth year of its lifefor economic reasons. It sells the van for 1,500. The van’s net book value then is 2,000 under theSL method. A ‘loss on disposal’ of 500 is recorded, since the cash received from the sale is lessthan the net book value of the asset by that amount:
Dr. Accumulated depreciation, van (CA−) 8,000Dr. Cash (A+) 1,500Dr. Loss on disposal of fixed asset (OE−) 500
Cr. Van, at cost (A−) 10,000
The result of this entry is that the balances in the ledger accounts, with respect to both the vanand the accumulated depreciation on it, are eliminated. Exhibit 8.4 illustrates this.
206 PART 2 • THE HOUSE OF ACCOUNTING
FactsQuixote buys Rocinante van for 10,000 at start of year 1. The van has an estimated life of fiveyears and an expected salvage value of zero. Quixote depreciates the van on a straight-linebasis.
Quixote sells the van for 1,500 at the end of year 4 when its net book value stands at 2,000.
Ledger accountsVan, at cost Cash
Balance, Balance,start 4 10 start 4 xx
Disposal 10 �
Balance Sale of end 4 0 van 1.5
�
Balance,end 4 xx
Accumulated depreciation, van Loss on sale
Balance,start 4 6 Disposal
of van 0.5Depreciationin year 4 2 To
� P/L forDisposal 8 year 4 xx
Balance,end 4 0
Retirement of Rocinante van at end-year 4 – extracts from Quixote’s ledger accounts(amounts in 000)
Exhibit 8.4
CFA_C08.qxd 11/6/03 2:25 PM Page 206

CHAPTER 8 • FIXED ASSETS, TANGIBLE AND INTANGIBLE 207
If Quixote had sold the van for 2,500 at the end of year 4, it would have recorded a ‘gain ondisposal’ of 500 (the excess of cash proceeds over net book value).
Think about the nature of this entry for a moment. Quixote is not worse off as a result ofreporting the loss on disposal. Nor would it have been better off if it had reported a gain. A gainor loss arises because of errors in the calculation of depreciation charges in previous periods.Rather than reopen previous periods’ accounts, a company corrects the error when it retires theasset and records the correction as a gain or loss then.
The valuation decision
The main accounting adjustment to a fixed asset during its life is depreciation. But it’s not the only one. A company may make other adjustments to an asset’s carrying amount. In somecountries, firms can write up their tangible fixed assets when the market values of those assetsincrease. In all countries, firms must write down fixed assets whose values are impaired. We consider each case in turn.
l Increase in value during holding period
Consider first the case where a fixed asset’s current value is greater than its depreciated cost.Under historical cost accounting, the increase in value is not recognised in the accounts, except in rarecircumstances. (One such circumstance is when a company’s assets are purchased by another ina takeover and the ‘purchase’ method is used to account for the acquisition. We describe the purchase method in a later chapter on intercorporate investments.)
Under current value accounting, however, the increase in value of fixed assets is recognised in theaccounts. The company restates the asset to its current value and takes the surplus on revaluationto a non-distributable reserve. It calculates depreciation on the basis of the asset’s current valuefrom the date of revaluation.
Quixote’s Rocinante van can provide us with the vehicle (forgive the pun) to illustrate thesepoints. Assume that at the start of year 3 the price of a new Rocinante van increases to 12,000. Bythen, 40% of the van’s estimated five-year service life has expired. (We assume SL consumptionof the van’s benefits.) The replacement cost (RC) of an equivalent van with three years’ life re-maining is therefore 7,200 (12,000 − (40% × 12,000)). Quixote adjusts both asset and accumu-lated depreciation accounts on a proportionate basis: the asset account by 20% to reflect the RCof a new van (12,000); the accumulated depreciation account by 20% (from 4,000 to 4,800) toreflect two years of use, where the services consumed are valued at RC.8 It credits the net increaseof 1,200 in the carrying value of the van – from 6,000 to 7,200 – to a revaluation reserve account.
Start year 3Dr. Van, at replacement cost (A+) 2,000
Cr. Accumulated depreciation (CA+) 800Cr. Revaluation reserve (OE+) 1,200
The annual depreciation charge in year 3 is 2,400, one-fifth of the van’s start-year 3 RC of 12,000.If there is no further change in the van’s RC, this will be the depreciation charge in years 4 and5 as well.9
Exhibit 8.5 shows the movement in Quixote’s asset and equity accounts in year 3 as a resultof the revaluation and depreciation of its van.
The (net) surplus on revaluation of 1,200 is an unrealised holding gain. Under 4th Directiverules and IAS, holding gains on revaluation of fixed assets cannot enter the calculation of profit and
CFA_C08.qxd 11/6/03 2:25 PM Page 207

be distributed as dividend until they are realised. The revaluation reserve is therefore a non-distributable reserve.
A surplus on revaluation is realised when the underlying asset is sold. It’s also considered realisedwhen the benefits from the asset are consumed. Thus as a fixed asset is depreciated, the excess ofRC over HC depreciation in the year (400 in the case of the Rocinante van) is a realised holdinggain. Quixote has the option, therefore, of transferring the realised gain with respect to annualdepreciation to distributable profits at the end of year 3 (and of years 4 and 5 also).
End-year 3Dr. Revaluation reserve (OE−) 400
Cr. Retained profits (OE+) 400
Note that the realised holding gain is credited directly to a balance sheet account. Internationalrules prohibit firms from passing it through the income statement.
l Decrease in value during holding periodWe turn now to the situation where a fixed asset declines in value. Traditionally, under HCaccounting, a company would write down a fixed asset only if fair value fell below carryingamount and management judged the decline to be permanent. In this case the asset is said to beimpaired.
The accounting for asset impairments has long been considered unsatisfactory. The oldaccounting rules were vague and open to abuse. Investors often had the uneasy feeling that assetwrite-downs were recorded when it was advantageous for the company (or, more particularly,
208 PART 2 • THE HOUSE OF ACCOUNTING
Van, at (replacement) cost Revaluation reserve
Balance, Balance,start 3 10 start 3 0
Revaluation 2 Revaluation 1.2
Balance, Balance,end 3 12 end 3 1.2
Accumulated depreciation, van Year 3 depreciation expense
Balance,start 3 4
ToRevaluation 0.8 ‘P/L
forYear 3 Year 3 year 3’ 2.4depreciation 2.4 depreciation 2.4
Balance,end 3 7.2
Revaluation and subsequent depreciation of the Rocinante van in year 3 – extractsfrom Quixote’s ledger accounts (amounts in 000)
Exhibit 8.5
CFA_C08.qxd 11/6/03 2:25 PM Page 208

the management) to do so rather than when the impairment of the asset had taken place. Therewas evidence that in some countries a company was more likely to write down fixed assets whenits profits were already low or losses had been incurred. In such years, earnings are said to ‘takea bath’. Since investors expected results to be poor, management, often newly installed, took theopportunity to lower the book value of the firm’s fixed assets and described the charge againstprofits as the cost of ‘corporate restructuring’. In subsequent years, profits benefited from alower depreciation charge and the new management took credit for the profit ‘improvement’.
A recent international accounting standard restricts management’s discretion over the timingand size of asset write-downs.10 The key features of the standard are as follows:
l Annual impairment review of fixed assets. Companies must check all their fixed assets each yearto find out if any have been impaired. An asset is impaired if its recoverable amount is below itscarrying amount.
l Definition of recoverable amount. The standard defines an asset’s recoverable amount as thehigher of its net selling price and its value in use. ‘Net selling price’ is simply market value in anarm’s length transaction, net of disposal costs. ‘Value in use’ is the present value of estimatedfuture cash flows from the asset’s continued use by the company (and its ultimate disposal).The standard gives guidance as to the calculation of net selling price and value in use. Notethat both must be below carrying amount for an asset to be impaired.11
l Immediate recognition of impairment losses. Impairment loss is the excess of an asset’s carry-ing amount over its recoverable amount. It must be recognised as an expense on the incomestatement immediately. Impairment losses are accumulated either in the ‘Accumulateddepreciation’ account or in a separate contra-asset account in the balance sheet.
We illustrate the accounting for asset impairments using our Quixote example. Assume a changein local economic conditions late in year 2 leads to a reduction in the demand for electricity fromQuixote’s windmill. You’ll recall that the windmill entered service at the start of year 2, cost1,078,950 and has an expected life of three years. The windmill’s net book value at the end of year2 is 719,300.
Management estimate that the windmill’s value in use (based on estimated future discountedcash flows) is 400,000 at the end of year 2. This is also its recoverable amount since managementestimate the net selling price is only 250,000. As the windmill’s recoverable amount (400,000) isless than its carrying amount (719,300), Quixote has sustained an impairment loss of 319,300.The loss is recognised in the year 2 income statement as follows:
End-year 2Dr. Loss from windmill write-down (OE−) 319,300
Cr. Accumulated impairment losses (CA+) 319,300
The asset’s revised carrying amount is now 400,000, the difference between its cost(1,078,950) and the sum of its accumulated depreciation (359,650) and impairment losses(319,300). Quixote must reduce the depreciation charge in year 3 – from 359,650 to 200,000(400,000/2) – to take account of the windmill’s lower depreciable amount.
What if an asset’s recoverable amount increases in a later period owing to, say, higherexpected cash flows or a higher net selling price? Under the new international standard, a com-pany records the reversal of the impairment loss as a ‘write-back’ and recognises it as income.There is a cap on such write-backs, however. The new carrying amount of the asset cannot beincreased above what it would have been in the absence of earlier impairment losses.
Accounting for asset impairments under current value accounting is similar to that under HCaccounting. Annual revaluations include an impairment review. Recoverable amount is definedin the same way. Decreases in current value are recognised immediately. The main difference
CHAPTER 8 • FIXED ASSETS, TANGIBLE AND INTANGIBLE 209
CFA_C08.qxd 11/6/03 2:25 PM Page 209

concerns the accounting treatment of the value decrease. Where the decrease represents a reversalof a previous increase, the write-down is charged against the already established revaluation reserve.Once the revaluation reserve is exhausted, any further write-downs must be charged againstprofit, as occurs under HC accounting.
l Valuation of fixed assets: EU and international practiceAlthough the 4th Directive lays down that fixed assets must be valued at purchase price or pro-duction cost, it gives member states the power to permit or require companies to value suchassets on another basis. As we saw in Chapter 7, the Directive mentions three alternative bases:
1 replacement cost;2 a valuation; or3 cost adjusted for changes in the general price level.
IAS designate (depreciated) historical cost as the ‘benchmark’ method of valuing tangible fixedassets. However, an allowed alternative method is to carry them at a revalued amount. This iscarefully defined. It’s the fair value at the revaluation date less subsequent accumulated depreci-ation (and impairment). Revaluations must be carried out regularly so that the asset’s carryingamount does not differ materially from its fair value at the balance sheet date.12
Companies refer to suppliers’ current price lists or industry-specific price indices to estimatereplacement cost. They use professionally qualified experts to provide valuations of assets. Insome countries, valuation by the company’s directors is permitted. In most cases, experts (ordirectors) estimate an asset’s value on the basis of its market value in its existing use.
EU countries differ in their response to the 4th Directive’s concession. They fall into one ofthree groups.
1 Prohibitionist. Commitment to HC accounting is strong. Upward valuations of fixed assets arenot permitted except in rare circumstances. Germany is the principal ‘prohibitionist’.
2 Liberal. Companies are free to state some or all tangible fixed assets at RC or at a valuation.Denmark, Ireland, the Netherlands and the UK belong to this group. There are no tax con-sequences from revaluation, since in these countries the calculation of taxable income is separate from that of book income.
3 Dirigist. The government requires – or, through the tax system, encourages – companies toupdate the values of their fixed assets in the balance sheet. The adjustment is usually based ongovernment-specified index numbers. It occurs infrequently: for example, 13 years elapsedbefore the Spanish government introduced the latest voluntary revaluation (actualización debalances) in 1996. Where revaluations are compulsory, any surplus arising is usually taxexempt. Under Italy’s 1991 compulsory revaluation, the surplus was taxed (at 16%) but, off-setting this, the increased depreciation charges were tax deductible immediately.
Belgium, France, Greece and Portugal – in addition to Spain and Italy – have mandatednationwide revaluations in the past. Belgian and French companies are free to revalue eachyear: they do not do so because, unless the revaluation is an official one, any surplus on revalu-ation is taxable as income.
Most non-EU countries can be classified in the same three groups. For example, Canada, Japanand the USA support the prohibitionist line. Many Commonwealth countries (e.g. Australia,India, Singapore) permit revaluations of fixed assets. China and Russia display dirigist tendencies:asset revaluations, when permitted, must be in accordance with government decrees. Countriesthat in the past had (Mexico), or currently have (Turkey), a high rate of inflation require com-panies to use constant purchasing power adjustments to update the carrying amounts of theirfixed assets.
210 PART 2 • THE HOUSE OF ACCOUNTING
CFA_C08.qxd 11/6/03 2:25 PM Page 210

CHAPTER 8 • FIXED ASSETS, TANGIBLE AND INTANGIBLE 211
SECTION
2
Evidence from surveys of EU company accounts indicates that revaluation of fixed assets iscommon among firms in countries with a history of legal restatement (e.g. France, Italy, Spain).As for ‘liberal’ EU countries, UK firms appear keen to revalue property but not plant. More sur-prisingly, revaluation is a minority practice among Dutch firms, despite long acceptance of currentvalue accounting in the Netherlands.
l Fixed assets at RC or valuation: rationaleWhy do companies voluntarily revalue their fixed assets? One reason is that management con-sider that the accounts provide more up-to-date and therefore more relevant information whenassets are stated at current values. The impact of inflation on asset values is especially marked forassets with long or indefinite lives, such as buildings and land, in high-inflation countries. Thisexplains, in part, the popularity of property revaluations in the UK where inflation in the pasthas been higher than in, say, the Netherlands, another ‘liberal’ country.
It’s not just the balance sheet which is made more relevant. Supporters of current value methods argue that the income statement is more useful, too. Under current value accounting,the current costs of inputs – and that includes depreciation – are matched against current rev-enues. As a result, the operating profit figure provides a more accurate measure of the company’sperformance, so supporters maintain. Under HC accounting, the historical costs of inputs arematched against current revenues. As we saw in Chapter 7, the HC profit figure fails to distin-guish gains from holding assets from the profit from operating them.
A second reason is that revaluation can improve the way a company looks. Consider the effectof an upward valuation of fixed assets on the accounts. Total assets as well as shareholders’ equityare greater by the surplus on revaluation. As a result, the company appears stronger: its reportedfinancial leverage falls.
If the assets revalued are depreciable, there is an income statement price to be paid. (There isno cash benefit because, as already mentioned, in countries where revaluation is voluntary, theadditional depreciation is usually not tax deductible.) Higher asset values spell higher depreci-ation charges and thus lower reported profits. One attraction of revaluing property – but notplant and equipment – is that the income statement ‘cost’ is slight: land is rarely depreciated andthe depreciation charge on a building is usually small in relation to its cost or value, owing to itslong life. (Companies that hold property as an investment and follow IAS do not depreciate it ifthey opt to carry it at current market value in the balance sheet. Appendix 8.2 summarises theinternational accounting standard on investment property.)
Can a company use revaluations selectively to give itself a balance sheet ‘facelift’?International accounting rules try to prevent this. If it chooses this alternative, a firm mustrevalue an entire class of assets and carry out revaluations regularly so that asset values are up todate. Since asset values can decrease as well as increase – witness the fall in property values inLondon, Paris and Tokyo in the early 1990s – it is difficult, if not impossible, for a firm to ear-mark only value-increasing assets for revaluation.
Intangible assets
Intangible assets are long-term assets used in a company’s business which have no physical substance and are not financial in nature. In many cases the benefits which they yield have acommon source. They flow from rights which a company owns or controls, for example, rightsover:
CFA_C08.qxd 11/6/03 2:25 PM Page 211

l an invention or discovery (patent); l the expression of ideas (copyright); orl a commercial name or symbol (trademark).
These rights usually have a contractual basis and are therefore verifiable. Not all intangibles sharethis characteristic, however. An important exception is purchased goodwill. We identify othersin this section.
In many respects, the accounting for intangibles is similar to that for their tangible cousins.
l A company records an intangible asset, on acquisition, at cost.l It amortises the asset over its estimated useful life (which, for contractually based intangibles,
may be shorter than its legal life). l It writes down the asset’s carrying amount (net book value) to its recoverable amount when
the asset is impaired and the recoverable amount is below carrying amount.l On disposing of the asset, it compares the asset’s carrying and disposal amounts and records
a gain or loss.
The accounting rules for intangibles are tougher, however. Recognition criteria are moredemanding and measurement rules more restrictive. To understand why, we look at certainexpenditures made by firms and outline the arguments for and against capitalising them asintangible assets.
l Intangibles: the recognition debateConsider the following three situations. A consumer products company incurs heavy advertisingand promotional costs to launch a new product. A photocopier manufacturer spends large sumstraining its customer service personnel in copier maintenance. A pharmaceutical firm under-takes an expensive research effort to discover new drug compounds. How should the outlays onadvertising, training and research in these three cases be accounted for?
One school of thought argues that such outlays meet the definition of an asset. They are expectedto yield future economic benefits. Why else would a firm make them? They should therefore becapitalised as intangible fixed assets and then amortised over their expected useful lives.
For example, suppose Quixote spends 200,000 in year 1 on development of a new design ofwindmill. Outlays cover the costs of researchers’ salaries as well as materials and equipmentspecific to the project. If Quixote capitalises the expenditure and amortises it over four years, theentries are:
Year 1Dr. Development costs (A+) 200,000
Cr. Accrued payroll (L+), Cash (A−), etc. 200,000To record outlays of 200,000 on windmill development as an intangible asset.
Years 2–5Dr. Development expense (OE−) 50,000
Cr. Development costs (A−) 50,000To record one year’s amortisation of the ‘Development costs’ asset.
Another school of thought maintains that advertising, training and non-contractual researchand development (R&D) should not be considered accounting assets. First, it is often hard toisolate the benefits from outlays on these activities. For example, other factors besides advertis-ing outlays – for example, the firm’s overall marketing efforts and its reputation – contribute tothe success of an advertising campaign. Second, the firm may not be able to appropriate the
212 PART 2 • THE HOUSE OF ACCOUNTING
CFA_C08.qxd 11/6/03 2:25 PM Page 212

benefits from these expenditures. Employees gain skills from in-company training which theytake with them to other jobs. Finally, the benefits may be highly uncertain. As a result, cost is anunreliable guide to value. For a purchased patent, the market price in an arm’s length transac-tion provides an objective measure of the patent’s value. For a patent developed internally as aresult of a company’s own R&D efforts, no such external check is available.
How would the accounting look, assuming immediate write-off of costs? Consider Quixote’soutlays on new windmill development. If it expenses development costs as it incurs them, theentries it makes in year 1 are, in sum:
Year 1Dr. Development expense (OE−) 200,000
Cr. Accrued payroll (L+), Cash (A−), etc. 200,000To record outlays of 200,000 on windmill development as an expense of the year.
It will make no entries in years 2 to 5 with respect to its year 1 development outlays.
l Accounting for intangibles: international rulesIn recent years, accounting regulators have tried to resolve the debate over recognition of intan-gibles by issuing a new accounting standard on the topic. We summarise its key features below.13
l Intangibles must be identifiable. Intangible assets are ‘non-monetary assets without physicalsubstance’ which a company holds in order to produce goods and services. In addition to theusual characteristics of an asset (i.e. controlled by the firm; expected to yield future benefits),an intangible must also be ‘identifiable’. Clearly, intangibles containing transferable legalrights (patents, trademarks, licences) are identifiable. But so, too, are intangibles where averifiable value can be assigned to them at the date of acquisition (e.g. purchased goodwill).
l Probable future benefits must be demonstrable. The recognition criteria for intangibles are similar in form to those for other assets. The expected future benefits to the company fromcontrolling the asset must be probable. Intangibles are measured at cost initially and the costmeasure must be reliable. However, the criteria for internally generated intangibles are moredemanding. These intangibles must pass a ‘demonstration test’. A firm must demonstratehow an internally generated intangible will increase the flow of probable future benefits. Itmust also demonstrate the ability and means to exploit those benefits.
As with recognition criteria, the measurement rules for intangibles have much in commonwith those for tangibles. For example, the initial cost of an intangible includes the costs neces-sary to create, produce or prepare it for its intended use. Subsequent to acquisition, intangiblesare carried in the balance sheet at amortised cost. But, once again, the rules are tougher:
l A ceiling on estimated useful life. The maximum useful life of an intangible is assumed to be 20 years – unless the firm can provide evidence the asset’s life is longer.
l Valuations must be market-based. Fair value accounting is permitted as an alternative to amortised cost – but only if there is an active market in that type of intangible.
These are the major differences between tangible and intangible asset accounting. (There areadditional, minor differences in measurement rules.) Why are recognition criteria and measure-ment rules more stringent for intangibles? The reason lies in their nature. It’s hard for a firm, letalone an auditor, to verify the existence and amount of an intangible if there’s no legal contractor other external evidence to support it.
For firms following international accounting standards, the new rules are likely to reduce theamount of costs capitalised under ‘Intangible assets’ on their balance sheets. Consider the effectof the standard on the following types of expenditure.
CHAPTER 8 • FIXED ASSETS, TANGIBLE AND INTANGIBLE 213
CFA_C08.qxd 11/6/03 2:25 PM Page 213

Training costsThe costs incurred by the firm to train its staff must be expensed as incurred. The firm does notcontrol the benefits from this expenditure. Staff are free to leave the firm and take their new skillswith them. (Note that this accounting treatment follows from the definition of an asset given inthe conceptual framework (see Chapter 7). The new standard simply reinforces this point.)
Research and development costsThe IASB distinguishes ‘research’ from ‘development’ activity. It defines work undertaken to gainnew scientific or technical knowledge as ‘research’. The application of such knowledge to the planor design of new products or processes is considered ‘development’.
The new standard requires research costs to be expensed as incurred. They fail a recognitioncriterion: in the IASB’s view, a firm can never demonstrate that expected future benefits fromsuch outlays are probable.
Development costs, by contrast, can be capitalised in some circumstances. Consider a project– for, say, a new computer software product – which is in the development phase. In this case, anintangible is identifiable. Assume the project has reached a critical juncture: management judgethe new product to be both technically feasible and commercially viable and the firm can financedevelopment through to the product’s launch. Thus the demonstration test is met. From thispoint, development costs can be capitalised (up to the launch date). Development costs prior to thispoint should have been expensed and IAS do not allow costs already expensed to be reinstatedand capitalised.
GoodwillGoodwill is the excess of the total value of a business entity over the fair values of the individual,identifiable assets (less liabilities) on its balance sheet. Firms generate goodwill internally – in theform of resources such as employee skills, product reputation, customer loyalty – as a result ofsuccessful business operations. They can acquire goodwill, too. If a company buys part or all ofthe (net) assets of another and the purchase price exceeds the fair value of those net assets, thepremium is described as ‘purchased goodwill’. In both cases, we can think of goodwill as repres-enting the present value of future above-normal returns (or economic rents) which the assets incombination are expected to generate.
Internally-generated goodwill cannot be recognised as an asset in the accounts. This has longbeen accounting practice and the new international standard reaffirms it. The main reasons arethat the asset is not identifiable and its cost cannot be measured reliably.
By contrast, the accounting for purchased goodwill is less clear-cut. Capitalisation (and amort-isation) is the benchmark practice under the EU’s 7th Directive. US accounting rules require it.However, in some countries it is customary for firms to write off purchased goodwill immedi-ately against reserves. This practice, permitted under the EU’s 7th Directive, is on the decline.Countries where the practice was once common (e.g. Netherlands, UK) now ban it.
The accounting effect of the two approaches – capitalisation versus immediate write-off – atthe time of asset purchase is contrasted below:
Capitalisation Immediate write-offDr. Assets* xx Dr. Assets* xxDr. Goodwill (A+) xx Dr. Reserves (OE−) xx
Cr. Cash xx Cr. Cash xx
* ‘Assets’ include identifiable assets (e.g. property, plant, inventory, receivables). If the acquirer firm takesover identifiable liabilities (loans, payables, provisions), it credits the accounts affected at the purchasedate.
214 PART 2 • THE HOUSE OF ACCOUNTING
CFA_C08.qxd 11/6/03 2:25 PM Page 214

Immediate write-off has a balance sheet cost: assets and shareholders’ equity are smaller andthus financial leverage is greater. (These balance sheet effects are still evident in the accounts offirms that have recently abandoned the practice.) However, there is an income statement benefitas goodwill amortisation charges are avoided.
International accounting standards ban the immediate write-off of goodwill. Purchasedgoodwill must be recognised initially as an intangible asset. A transaction has occurred which, inthe IASB’s view, allows a company to identify an asset and measure its cost reliably. Note that it is not possible for the firm to verify the value of purchased goodwill. There’s no market for this type of asset. If the firm pays more than the assets are worth, the overpayment is capturedin the carrying amount of goodwill. However, international measurement rules for intan-gibles (mandatory amortisation, annual impairment reviews) should limit the risk of goodwilloverstatement.14
Brands and related costs
In its simplest form, a brand is the registered trademark of a particular product. Examples arePerrier bottled water and the EVA financial performance measure. For accounting purposes, theterm refers not just to the name of a product but also other resources dedicated to supporting it(e.g. logo, product-specific advertising, product-specific distribution channels). The term is usedloosely in other contexts. For example, companies whose name enjoys worldwide recognition –for example, Coca-Cola, Mercedes-Benz, Microsoft – are said to be brands.
Controversy over the accounting for brands first arose in the 1980s. In that decade, some con-sumer goods firms were acquired by other companies at a large premium to the fair value of their net assets. Examples are Guinness’s purchase of Distillers (Scotch whisky producer) andLVMH’s acquisition of Parfums Christian Dior. Instead of accounting for the whole premium asgoodwill, the acquirer companies estimated the values of the acquiree’s major brands – usingdiscounted cash flow or earnings multiple techniques – and created a new intangible asset‘Acquired brands’. These brand values were then included with the fair values of other identi-fiable assets acquired. As a result, the amount of the purchase price assigned to goodwill wasreduced:
Goodwill == Purchase price −− Fair value of net assets acquired including brands
Acquirer firms justify this accounting treatment on the grounds that brands are an important– if not the most important – resource of most consumer goods companies. For example, in1996 when LVMH (Louis Vuitton Moët Hennessy) acquired majority control of Loewe, theleading Spanish leather and textile goods producer, it assigned 73% of the a168 million invest-ment to the Loewe brand. To deny accounting recognition of this resource would be to misleadinvestors, it’s claimed.
Another reason, rarely acknowledged publicly by acquirer firms, is the reporting benefit fromthis accounting treatment. There is no income statement cost from brand recognition becausebrand assets are not usually amortised. Management claim that the large marketing outlays theymake each year to promote individual brands maintain or even enhance their value and thus thebrands have an indefinite life. Moreover, for those firms that write off goodwill immediately,brand recognition reduces the amount of the goodwill write-off and thus the damage this inflictsto their balance sheets.
The international accounting standard on intangible assets makes recognition of brand assetsharder. The standard states explicitly that the cost of developing brands internally – for example,the advertising and promotion costs incurred on them – must be expensed as incurred. TheIASB argues that such expenditures benefit the business as a whole and thus the cost of internallydeveloped brands cannot be measured reliably. In addition, these expenditures may not pass the
CHAPTER 8 • FIXED ASSETS, TANGIBLE AND INTANGIBLE 215
CFA_C08.qxd 11/6/03 2:25 PM Page 215

demonstration test. A company will have difficulty showing how advertising increases the inflowof future benefits. Lever (of Unilever) famously remarked that one half of all advertising iswasted: the problem is to know which half.
Under international rules, brands acquired in a separate transaction – for example, Bacardi-Martini’s purchase of certain Scotch whisky and gin brands from Diageo in 1998 – can be recognised as an intangible asset. In this case, all the conditions for asset recognition are met.Where brands are acquired with other assets – for example, in a business combination, theyshould only be recognised as a separate intangible asset if their cost can be measured reliably.This is a difficult test to pass. There is no active market for brands and it is often hard to attributecorporate cash flows specifically to them. If a brand’s cost cannot be measured reliably, then thebrand is viewed as part of purchased goodwill and accounted for as such.
Intangibles: the accounting controversy continues
The international accounting standard on intangibles is relatively recent – it came into force in1999 – and it’s still too soon to judge its impact on company accounts. Supporters hope it willlead to greater harmonisation of accounting practice in this area and make it easier for investorsto compare the financial statements of companies in different countries.
Critics are less sanguine. In their view, the standard takes too cautious an approach to therecognition of certain internally generated intangibles such as R&D. As a result, importantresources do not appear on company balance sheets. This leads to misstatement of profits – andprofitability – and undermines comparisons of returns on capital across firms. These argumentsare developed more fully below.
A notable feature of recent decades is the growth in spending on knowledge-based activities.These are defined as R&D, software and higher education. Investment in knowledge-based activ-ities by OECD countries – comprising 30 of the world’s richest countries – increased on averageby 3.4% a year in the 1990s. By contrast, investment in tangible fixed assets grew by only 2.2% ayear on average over the same period.15 Much of the expenditure on knowledge-related activitiesis expensed as incurred under current accounting rules. As a result, investments by companiesin these activities – though growing as a proportion of their total investments – are often notrecorded as assets on their balance sheets.
Companies would not undertake investments in knowledge-based activities if they did notexpect them to yield future economic benefits. The stock market shares management’s expecta-tions. A recent US study estimates that the benefits from R&D investment accrue over five tonine years and the internal rate of return on investment in R&D ranges from 15% in the machin-ery and computer hardware sector to 28% in the chemicals and pharmaceuticals sector.16 Thisindicates that the stock market implicitly capitalises R&D expenditures and applies differentamortisation rates depending on the industry source of the R&D.
Accountants’ conservatism in recognising R&D investment as an asset biases accounting measures of profitability. In fast-growing companies, ROA and ROE are likely to be understated.Companies may even report losses because of the immediate expensing of the costs of intan-gibles (e.g. start-up companies in high-technology industries). By contrast, when companies aremature and sales are growing slowly, reported ROA and ROE may be overstated. In this case,intangible costs expensed immediately approximate the amortisation of capitalised intangibles:thus profit is little different under the two alternatives. However, assets and shareholders’ equityare lower under immediate expensing (because of the earlier write-off of intangibles), leading toROA and ROE overstatement.
An example illustrates this. Consider Quixote’s efforts to develop a new windmill. Suppose it projects development costs of 200,000 a year for at least the next five years. Exhibit 8.6 con-trasts the effect on Quixote’s forecast accounts of the alternative treatments of (a) immediately
216 PART 2 • THE HOUSE OF ACCOUNTING
CFA_C08.qxd 11/6/03 2:25 PM Page 216

expensing (IE) and (b) capitalising and amortising (C&A) these costs. (A four-year amortisationperiod is assumed.)
Quixote’s income statement and balance sheet suffer when it expenses R&D costs immedi-ately. Year 1 profit and net assets are 150,000 less than the figures reported under the C&Amethod. In subsequent years the difference in profit shrinks as annual amortisation under C&Aincreases. By year 4, profit is the same under the two accounting methods. However, reportednet assets under IE continue to be less – by the amount of the R&D asset (unamortised R&Dcosts) on the C&A balance sheet. In our example, this amount is 300,000 at the end of year 4 and,given our assumptions, remains at this level in year 5.
The impact of the two accounting methods on Quixote’s reported profitability is revealing.Profitability under IE is lower initially (years 1–3) because of higher R&D expense. Once theexpense (and profit) figures are the same under the two methods (years 4 and 5), profitability ishigher under IE because of the smaller asset base.
The Quixote example also shows how current accounting rules on intangibles can underminecomparisons of profitability. If two R&D intensive companies, one mature, the other young,earn similar economic returns on investment, the mature company will report higher accountingreturns – and may find it easier to attract capital as a result.
CHAPTER 8 • FIXED ASSETS, TANGIBLE AND INTANGIBLE 217
FactsQuixote spends 200 a year on the development of a new windmill design. Because of thenature of the expenditure, it can either capitalise or expense it immediately. Under the firstalternative, the asset is amortised over four years.
Assume that Quixote has net assets of 3,000 at the start of year 1. Forecast pre-R&D annualprofit – 500 in year 1 – is expected to grow by 50 each year for the next five years. Taxes areignored. Dividends are assumed to be zero.
Profitability is defined as: Profit/End-year net assets.
Alternative accounting treatmentsYear
1 2 3 4 5(a) Immediate expensingProfit excluding R&D 500 550 600 650 700R&D expense –200 –200 –200 –200 –200Profit 300 350 400 450 500
Net assets 3,300 3,650 4,050 4,500 5,000
Profitability 9.1% 9.6% 9.9% 10% 10%
(b) Capitalisation and amortisationProfit excluding R&D 500 550 600 650 700R&D expense –50 –100 –150 –200 –200Profit 450 450 450 450 500
R&D costs, net 150 250 300 300 300Other net assets 3,300 3,650 4,050 4,500 5,000Net assets 3,450 3,900 4,350 4,800 5,300
Profitability 13% 11.5% 10.3% 9.4% 9.4%
Development costs: alternative accounting treatments and effect on incomestatement, balance sheet and profitability (amounts in 000)
Exhibit 8.6
CFA_C08.qxd 11/6/03 2:25 PM Page 217

The critics of the IASB’s approach to intangibles accounting have a powerful case. We wouldexpect, therefore, that companies would capitalise expenditures on intangibles in those situ-ations where they were allowed to. This rarely occurs, however. One reason is that investors aresuspicious of firms that capitalise intangibles. They believe capitalisation gives managementgreater scope to manipulate earnings – through altering capitalisation and amortisation policies– and they may well demand a higher return to compensate them for the additional risk frominvesting in a ‘capitaliser’. As a result, even where firms can capitalise expenditures on a specificcategory of intangible, they rarely do so. For example, few pharmaceutical companies that haveadopted international standards capitalise product development costs, although this is per-mitted under IAS. Like other large US computer software companies, Microsoft expenses allsoftware development costs as incurred, even though US accounting rules allow it to capitalisedevelopment costs incurred after it has established technological feasibility of a new softwareproduct.
How do investors overcome the problems associated with the existing accounting for intan-gibles? Some construct pro forma financial statements and account for intangibles such as R&Dcosts as if they had been capitalised and amortised ab initio. (For these investors, it’s not cap-italisation in itself they object to but who oversees it.) Another approach is to devise non-financial indicators (NFIs) of performance covering, for example, innovation, product qualityand customer satisfaction and use them to supplement traditional financial measures of per-formance. NFIs may better explain changes in the market values of intangible-rich companiesthan financial indicators of performance (see Box 8.1).
218 PART 2 • THE HOUSE OF ACCOUNTING
Non-financial indicators: making intangibles tangibleBOX8.1
Non-financial indicators (NFIs) are measures of corporate performance that, as the name suggests, rely wholly or partly on non-financial data. NFIs come in many forms. Some shedlight on how efficiently a company uses fixed assets or labour (e.g. hotel occupancy rate,annual steel production per employee): these are productivity measures. Others focus oninnovation and product quality. For example, investors may monitor a pharmaceutical company’s patent filings or check surveys of customer satisfaction on a range of products from banking services to cars. NFIs are usually industry-specific, as the above examplesdemonstrate.
Empirical evidence suggests investors are likely to find NFIs particularly helpful whenappraising companies that are rich in intangibles. In these cases, traditional financial state-ments may be misleading: expenditures on intangibles are expensed as incurred and profitsand net assets of growing companies are understated. A study by Amir and Lev of 14 USmobile phone companies in the early 1990s illustrates this point well. They found thatalthough these companies were, on average, loss-making, their market capitalisation toreported net assets (or ‘market-to-book’ ratio) was much higher than that of other New YorkStock Exchange (NYSE) firms. They also found that selling, general and administrative (SGA)expenses and depreciation and amortisation (D&A) expenses of these companies were muchhigher than those of NYSE firms during this period. Table 1 below contrasts earnings yields,market-to-book ratios and SGA and D&A expense ratios of the 14 mobile phone companiesand NYSE firms during the four years 1990–1993.17
CFA_C08.qxd 11/6/03 2:25 PM Page 218

CHAPTER 8 • FIXED ASSETS, TANGIBLE AND INTANGIBLE 219
Table 1 Selected median financial ratios for 14 mobile phone companies and NYSE firms, 1990–1993
1993 1992 1991 1990
EPS/Price (%) Mobile phone companies −1.6 −4.0 −3.5 −0.4NYSE firms 4.6 5.1 5.0 7.2
Mkt-to-book Mobile phone companies 12.3 6.6 9.3 11.2NYSE firms 2.1 1.8 1.7 1.4
SGA/Sales (%) Mobile phone companies 42.1 46.1 52.7 46.4NYSE firms 20.1 20.2 20.2 19.5
D&A/PPE (%) Mobile phone companies 15.4 15.2 15.7 12.8NYSE firms 6.8 6.8 6.9 6.9
The mobile phone companies in Amir and Lev’s sample had SGA expense ratios of 42–53%between 1990 and 1993, over twice the level of NYSE firms. D&A as a proportion of property,plant and equipment (PPE) was over 15% in 1993, again more than twice the level of NYSEfirms. Amir and Lev argue that part of these expenses represent investments and are viewed assuch by investors. SGA expenses include customer acquisition costs. D&A comprise mostlyamortisation of intangibles such as licences and goodwill. Mobile phone companies reportinghigh expenses in these areas were expanding, acquiring new licences, buying businesses andtaking on new customers. In a regression of their sample companies’ market value (more precisely, the market-to-book ratio) on earnings (pre-SGA and D&A), SGA expenses andD&A expenses, Amir and Lev found that the SGA and D&A variables had significant positivecoefficients, consistent with these costs being viewed as value-creating investments by thestock market. By contrast, the coefficient for the earnings variable was not significant.
To overcome the deficiencies of traditional financial statements, investors often turn toNFIs. Those used to evaluate the performance of mobile phone companies include averagerevenue per user, churn rate, and costs of acquiring and retaining subscribers. Where mobilephone operators are awarded licences for defined geographic areas, as was the case in the USAin the 1980s, the population in the licence areas (POPS) and the penetration rate (ratio of subscribers to POPS) are additional NFIs investors monitor. POPS is a measure of a mobilephone company’s growth potential while the penetration rate is an indicator of its operatingperformance. Only these two NFIs were available to Amir and Lev on a quarterly basis for theirsample of mobile phone companies in the 1984–93 period. They found that in quarterlyregressions of share price on financial and non-financial indicators, POPS and penetration rate both had statistically significant positive coefficients. The financial variables they used (net assets per share and EPS) were only statistically significant in combination with the non-financial indicators.
An extension of Amir and Lev’s work is to use NFIs to value specific intangibles such asbrands. Investors face problems doing this, however. Companies often don’t publish NFIinformation. When they do, the NFI data can’t be compared across firms because of measure-ment differences. There have been calls in the investment community for companies to standardise the calculation of widely used NFIs and disclose them in their published financialreports.18
Box 8.1 continued
CFA_C08.qxd 11/6/03 2:25 PM Page 219

220 PART 2 • THE HOUSE OF ACCOUNTING
SECTION
3 Fixed assets and financial statement analysis
l DisclosureCompanies following international accounting standards provide extensive information abouttheir fixed assets in the annual accounts. They disclose, under ‘Accounting Policies’, the basis (orbases) of valuing fixed assets, the estimated lives of the different classes of tangible fixed asset andthe depreciation methods used. In addition, they are required to disclose the movement in thecarrying amounts of tangible and intangible fixed assets over the year. Investors find this useful.They cannot tell from knowledge of beginning and ending balances alone whether, for example,a small net increase represents a small addition to fixed assets or the offsetting of large additionsand large disposals.
Mining and petroleum companies usually disclose supplementary information about theirnatural resource properties. Under conventional accounting, such firms do not recognise intheir accounts new ore bodies or petroleum reserves they discover. They only show as assets thecosts incurred in developing them (and, in some cases, in exploring for them). They also capit-alise the cost of properties purchased. Since accountants have not yet found an acceptable wayof incorporating discovery values into corporate accounts, some stock exchanges now insist thatlisted firms in the oil and gas industry provide information about the size and location of theirreserves and the reasons for changes in them during the year.
l Fixed asset utilisationFixed asset information is used in analyses of asset efficiency. Recall from Chapter 3 that aprofitability measure such as return on assets is the product of two elements, profit margin andassets turnover. A company’s profitability is thus affected by the rate at which it turns over itsassets in the year. We can explore the changes in a company’s assets turnover over time (or thedifferences in asset turnover across firms) by breaking it down by type of asset, in particular byfixed assets, inventories and receivables.
Fixed assets turnover is usually computed as:
Fixed assets turnover ==
The higher the ratio, the more sales each unit of fixed assets generates and thus, other thingsbeing equal, the more intensively the company is using its buildings, plant and capitalised intangibles. (Intangible fixed assets are not always included in the calculation of fixed assetsturnover.)
Note that the ratio is sensitive to the business cycle. In a recession, fixed assets turnover islikely to fall as sales remain static or decline and management are reluctant to cut productioncapacity in case the company’s post-recession recovery is hindered. In periods of rapid economicgrowth, the ratio will rise as capacity utilisation increases and companies squeeze more sales outof existing plant and equipment.
l Average age and life of tangible fixed assetsDepreciation data shed light on the age of a company’s fixed assets and its policy on assetreplacement. The plant and equipment of a newly formed company are young: accumulated
(Net) sales revenues in year
Average tangible and intangible fixed assets, at net book value
CFA_C08.qxd 11/6/03 2:25 PM Page 220

depreciation is a small proportion of asset cost. Similarly, an established firm that invests heavilyin new equipment reports a lower ratio of accumulated depreciation to asset cost than a com-petitor that replaces assets more slowly.
We can estimate the average age and life of a company’s fixed assets directly. Assume for themoment that it uses straight-line depreciation and that price changes are small so that costapproximates current value. Then the average age of its depreciable fixed assets (at year-end) is:
Average age (in years) ==
The average life of such assets is:
Average life (in years) ==
We can compute average age and life by class of fixed assets (buildings, plant, vehicles, officeequipment) if the company breaks down the cost, depreciation and accumulated depreciationfigures in this way.
The above calculations of average age and life are only approximate. They are sensitive to largeincreases or decreases during the year in the firm’s fixed asset base. They are also sensitive to therate of inflation and the depreciation method used. For example, when prices are rising but thefirm values its fixed assets at HC, the average age of its assets is understated: older, lower-valuedassets carry greater weight in the numerator (accumulated depreciation) than in the denomin-ator (depreciation expense).
l Fixed asset ratios and accounting policy differences
When comparing companies’ fixed assets turnover, age and life, it is advisable to check theiraccounting policies beforehand. We saw earlier that differences can arise in the three main areasof fixed asset accounting.
l Capitalisation. Firms differ with respect to the costs they capitalise as part of tangible fixedassets. Examples are plant set-up costs (e.g. French companies may show them separately asa ‘deferred charge’) and interest on asset construction.
l Depreciation/amortisation. Differences in depreciation policy are a major reason for lack ofinternational comparability of financial statements. Companies in countries with a uniformreporting tradition tend to depreciate tangible fixed assets faster. Tax rules allow them to useaccelerated methods and/or to be conservative in their estimates of asset lives. The result isthat, relative to sales, depreciation charges are higher and book values of fixed assets are lower.The effect of the latter is to raise fixed assets turnover.
l Valuation. Valuation differences can also undermine interfirm comparability. Recall thatcompany accounts in France, Italy and Spain contain fixed assets at indexed amounts. SomeDutch companies record fixed assets at RC. Many UK companies state property assets at a valuation. In each case, the firms affected report lower fixed assets turnover than their HC-based rivals.
Differences in capitalisation, depreciation and valuation create problems for investors whenthey make cross-border comparisons of profitability. One solution is to use a ‘cash earnings’number in profitability calculations. (Cash earnings is simply profit before deducting non-cashcharges such as depreciation and amortisation.) Such adjustments are not usually necessarywhen making within-country comparisons of firms’ profitability or when observing trends in acompany’s profitability over time.
Gross cost of depreciable assets at end year
Depreciation expense for the year
-
Accumulated depreciation, end year balance
Depreciation expense for the year
-
CHAPTER 8 • FIXED ASSETS, TANGIBLE AND INTANGIBLE 221
CFA_C08.qxd 11/6/03 2:25 PM Page 221

222 PART 2 • THE HOUSE OF ACCOUNTING
l Warning signalsA company has scope, through its accounting policies on fixed assets, to flatter its ‘bottom line’.Investors are mindful of this, especially when reviewing the accounts of companies from sep-arate reporting countries. Among the techniques in this area that firms use to raise short-termprofits are:
l Extending the boundaries of capitalisation. A firm may alter slightly its measurement rules andcapitalise more costs. For example, the notes in last year’s accounts may state that interest iscapitalised on own-constructed assets ‘up to the date an asset is completed’ whereas in thisyear’s they state that interest is capitalised ‘up to the date it is put into service’. The companyshould flag such changes if they have a material impact on the accounts. Nonetheless, it is wiseto compare the phrasing of the fixed asset note in successive years’ accounts, as the changemay have a delayed impact on profits.
l Changing the method of depreciation. A firm with a fast-growing asset base may switch froman accelerated to a straight-line method to lower the annual depreciation charge. Once again,it should flag such a change and show the impact on the current year’s accounts, if material.19
l Lengthening assets’ expected useful lives. Amortising an asset over a longer period lowers theperiodic charge. Firms do not always highlight the change in the accounts. Instead, they maydisguise it by making the change within a broad asset category (e.g. plant and equipment withestimated lives of 10–20 years). As a check, investors calculate the average life of a firm’s fixedassets (i.e. gross cost divided by the annual depreciation charge) over several years: if thefigure is rising, especially in comparison with that of rival firms, they view it as a warning signal.
Note that a change in the accounting for fixed assets that increases short-term profits is notevidence, in itself, of profit manipulation. A firm may have a bona fide reason for making thechange. For example, a slower than expected rate of technological change justifies extending theuseful life of a class of assets. Thus more than one alarm bell must sound before investors conclude that management are manipulating profits.
Summary
As with other assets, tangible and intangible fixed assets are expected to provide future benefitsto the firm. The benefits are mostly indirect. They arise from the use of the asset in the produc-tion of the goods a firm sells and the services it performs.
All costs incurred to bring a fixed asset to ‘working condition for its intended use’ are capit-alised. So too are costs incurred to enhance its productive capacity. In some countries, the cost ofborrowing to finance the asset’s construction in-house can be capitalised as well.
Depreciation is the systematic allocation of the asset’s cost or value over its useful life.Depreciation has no direct effect on corporate cash flow. There are various permitted methodsof depreciation. Relative to the widely used straight-line method, accelerated methods such asthe declining balance and sum-of-years’-digits methods lower profits and assets when intro-duced – but only continue to do so, if the asset base is expanding. Accelerated methods, if per-mitted for tax purposes, can postpone taxes and thus indirectly improve cash flow.
Some EU countries permit the revaluation of tangible fixed assets. Any surplus on revaluationis usually taken direct to reserves and is not distributable until the asset is depreciated or sold.Upward revaluation strengthens reported balance sheet ratios by increasing assets but depressesprofitability for the same reason – and, in the case of depreciable assets, by lowering incomethrough higher depreciation charges.
CFA_C08.qxd 11/6/03 2:25 PM Page 222

CHAPTER 8 • FIXED ASSETS, TANGIBLE AND INTANGIBLE 223
APPENDIX
8.1
In the majority of European countries, tangible and intangible fixed assets are stated at(depreciated) cost. Under international accounting rules management must assess each periodthe amount recoverable from a fixed asset’s use or sale. When the asset is impaired, it must bewritten down to the lower recoverable amount. Management now have less scope for manipu-lating income through altering the timing and magnitude of asset write-downs.
Internally generated intangibles such as employee skills, product design and brand namesform a growing proportion of a firm’s total resources. Accountants are reluctant to recognisethem as assets because the future benefits they provide are uncertain or not appropriable by thefirm. Some investors prepare their own pro forma financial statements for intangible-rich com-panies in which expenditures on key intangibles are capitalised rather than expensed as incurred.
Given the importance of tangible fixed assets to many firms, investors monitor carefully keystatistics about them, such as their expected useful lives, age and productivity.
Sum-of-years’-digits and units-of-production depreciation
We described two popular methods of depreciation in section 1 of the chapter: the straight-lineand declining-balance methods. Two other systematic methods which you may encounter inpublished accounts are the sum-of-years’-digits method and the units-of-production method.
l Sum-of-years’-digits (SoYD) method
The SoYD depreciation rate is calculated by relating the remaining life of an asset to its initialexpected life. The asset’s initial expected life is expressed in digits and the digits are then summed:
SoYD depreciation rate ==
The SoYD depreciation charge is the SoYD rate times the asset’s depreciable amount:
SoYD depreciation SoYD depreciation charge in year t
== [Cost −− Salvage value] ××rate in year t
Thus for an asset with a four-year expected life, the denominator of the SoYD depreciation rateis 10 (the sum of the digits of the asset’s life: 4 + 3 + 2 + 1). The fraction applied to the depre-ciable amount in the first year, with four years remaining, is 4/10; in the second year, with threeyears remaining, 3/10; and so forth.
The SoYD method is a reducing charge (or ‘accelerated’) method of depreciation. One advant-age it offers over the rival declining-balance method is ease of calculation. However, this is nowa minor consideration in today’s computer age.
l Units-of-production (UoP) method
Under the UoP method, the depreciation charge is a function of the asset’s output or usage in theperiod. The depreciation rate is the ratio of the asset’s output (or usage) in a period to its totalexpected output (or usage):
UoP depreciation rate for year t == Output (usage) in year
Total expected output (usage)
t
Number of remaining years of asset’s life
Asset’s initial expected life, expressed in digits and summed
CFA_C08.qxd 11/6/03 2:25 PM Page 223

224 PART 2 • THE HOUSE OF ACCOUNTING
APPENDIX
8.2
The rate is applied to the asset’s depreciable amount to give the depreciation charge for the period:
UoP depreciation UoP depreciationcharge in year t
== [Cost −− Salvage value] ××rate in year t
This method results in a depreciation charge which fluctuates with output or asset use. It isfavoured where an asset’s useful life is conditioned more by physical usage than by economic ortechnological change. It’s widely used by companies in natural resource industries to depreciateexploration and on-site production equipment.
l IllustrationExhibit 8.7 illustrates the SoYD and UoP depreciation methods. It shows the calculation ofannual depreciation and end-year net book value for Quixote’s Rocinante van which we intro-duced in Section 1 of the chapter. The Rocinante van, you’ll recall, cost 10,000 and has a five-year expected life and zero residual value. To calculate UoP depreciation, we need to know itsexpected and actual usage as well. Quixote reckons it will cover 150,000 km during its five-yearlife. Actual kilometres driven in each of the five years are: 45,000 in year 1; 30,000 in year 2;22,500 in year 3; 37,500 in year 4; and 10,000 in year 5; a total of 145,000 km.
Given Rocinante’s initial expected life of five years, the denominator of the SoYD depreci-ation rate in all years is 15. The depreciation rate in the first year, with five years’ life remaining,is 33% (5/15). The numerator – and the depreciation rate – declines as the remaining years oflife diminish. Thus in year 4, with two years’ life remaining, the SoYD depreciation rate is 13.3%(2/15).
Under the UoP method, the depreciation rate varies with production each period. In this case,production is measured by kilometres driven. For example, in year 2, the van covered 30,000kilometres. The van is expected to cover 150,000 kilometres over its useful life. Thus one-fifth ofthe van’s total expected services were consumed that year and the depreciation charge is 2,000.In practice, an asset’s actual total output rarely corresponds with expectations and an adjustmentmust be made in the final period, as in the Rocinante van’s case.
Investment property
A company may hold property as an investment rather than for its own use. It expects the landand/or building to yield a return in the form of rental income and capital appreciation. In thepast, differences in accounting practice made it difficult for investors to compare the perform-ance and condition of companies with significant investment property assets. Their task is noweasier as a result of a new IAS on the topic.
The standard includes familiar recognition and measurement rules. As with other types ofproperty, an investment property is recognised as a (fixed) asset when it is probable it will yieldfuture economic benefits to the company owning or controlling it and its cost can be measuredreliably. It should be measured initially at cost but thereafter it can be measured at either depre-ciated cost or fair value. A property’s fair value is usually its market value as of the balance sheetdate. A company must choose one of these two valuation bases and apply it consistently acrossall its investment properties. If it chooses depreciated cost as the valuation basis, it must disclosethe fair value of investment properties in the notes to the accounts.20
The innovation in the accounting standard lies in how fair value accounting is applied. A com-pany must recognise in the income statement any gain or loss arising from a change in the fair valueof investment property.21 This contrasts with the accounting treatment of unrealised holding gains
CFA_C08.qxd 11/6/03 2:25 PM Page 224

and losses (UHG/L) on revalued fixed assets that are used in a company’s business. As we saw inthe chapter, these gains and losses are taken to a revaluation reserve in the balance sheet andunrealised holding losses (and their reversal) are recognised in the income statement only whenthe revaluation reserve is exhausted.
As a result of this and other international standards, there are different measurement rulesdepending on whether property is held as inventory, as an investment or for the company’s ownuse. These differences are summarised in diagrammatic form below:
CHAPTER 8 • FIXED ASSETS, TANGIBLE AND INTANGIBLE 225
FactsQuixote buys a Rocinante van for 10. It has an expected useful life of five years and expectedresidual value of zero.
Annual depreciation charge and net book value (NBV)
SoYD method UoP methodDepreciation Net book Depreciation Net book
expense value expense value
Acquisition 10 10Year 1 depreciation 3.33 –3.33 3 –3End-year 1 NBV 6.67 7Year 2 depreciation 2.67 –2.67 2 –2End-year 2 NBV 4 5Year 3 depreciation 2 –2 1.5 –1.5End-year 3 NBV 2 3.5Year 4 depreciation 1.33 –1.33 2.5 –2.5End-year 4 NBV 0.67 1.0Year 5 depreciation 0.67 –0.67 1.0* –1.0End-year 5 NBV 0 0
Calculations
SoYD method:l With five-year life, denominator of SoYD rate is 15 (5 + 4 + 3 + 2 + 1).l Depreciation rates by year are:
Year 1 33% (5/15)2 26.7% (4/15)3 20% (3/15)4 13.3% (2/15)5 6.7% (1/15)
UoP method:l ‘Production’ is assumed to be ‘number of kilometres driven’.l Van will cover 150,000 km over its expected life.l Depreciation rates by year are:
Year 1 30% (45,000 km/150,000 km)2 20% (30,000 /150,000)3 15% (22,500 /150,000)4 25% (37,500 /150,000)5 * Remaining balance charged as depreciation. Total actual usage rarely
corresponds with expected usage.
Sum-of-years’-digits and units-of-production depreciation methods: illustration(currency amounts in 000)
Exhibit 8.7
CFA_C08.qxd 11/6/03 2:25 PM Page 225

226 PART 2 • THE HOUSE OF ACCOUNTING
Note that the reason for holding property can change – and this too can give rise to an un-realised holding gain or loss. For example, if a company decides to hold a property as an invest-ment that was previously held for sale – and the investment is to be carried at fair value, thetransfer from inventory to investment is treated as equivalent to a sale. Any UHG/L at the dateof transfer is recognised in income.
Real estate companies have been most affected by this accounting standard. For example,those in the UK and many Commonwealth countries have traditionally carried properties atmarket value – but the revaluations have not always been annual and unrealised holding gainsand losses have usually been taken directly to a shareholders’ equity account (‘revaluationreserve’) in the balance sheet.
Problem assignments
P8.1 Fixed asset measurement: which costs to capitalise?Diafoirus, Purgon and Argan (two established doctors, one newly qualified) run a health clinic, LesMédecins Imaginaires (MI). Their practice is expanding and they decide to move the clinic’s opera-tions to larger premises.
The building they acquire is 15 years old and in need of modernisation. It cost 200,000 to build and the seller carries it in its books at depreciated cost of 80,000. MI pay 250,000 for it. Legal costsassociated with the purchase are 6,000. MI obtain a ten-year 7% loan of 150,000 from their bank tofinance the purchase.
The building requires extensive alterations. Before moving in, MI spend 50,000 on these altera-tions. They create new office space by altering internal walls and fitting partitions. They lower the ceilings of many of the rooms in order to house cable for medical and computer equipment. The altera-tion work takes two months. At the same time, they replace the air-conditioning system at a cost of 20,000. Toinette, MI’s office manager, who spends half her time supervising the alteration work,receives an annual salary of 42,000.
Within a month of moving in, MI receive an annual property tax assessment of 3,000 and vandalssmash some windows on the ground floor of the building. The cost of replacing the glass, 2,500, iscovered by insurance but MI decide to fit external roller blinds to all the windows at a cost of 12,000in order to reduce the risk of further damage and to improve the security of the building.
CFA_C08.qxd 11/6/03 2:25 PM Page 226

Required
MI record fixed assets at (historical) cost. In your opinion, which of the above costs should be capitalised and why?
P8.2 Introduction to depreciation methodsThe Tivoli Company has just opened a pizza restaurant in Copenhagen. The restaurant contains a new pizza oven which cost 110,000 to buy and install. The oven has an expected life of ten years. Theexpected residual value is minimal and can be ignored.
You have been asked to illustrate the effect of different methods of depreciating the pizza oven onthe company’s income statement and balance sheet.
Required
Calculate the depreciation charge on the oven and its end-year carrying amount for years 1, 2 and 5under the following methods of depreciation:
(a) the straight-line (SL) method;
(b) the declining-balance (DB) method. (The DB rate is assumed to be 150% of the SL rate);
(c)* the sum-of-years’ digits (SoYD) method. (A formula for finding the denominator of the SoYD ratequickly is: [n(n + 1)/2], where n is the initial expected life (in years) of the asset);
(d)* the units-of-production (UoP) method. (Total expected output of the oven over ten years is600,000 standard-size pizzas. Forecast output in each of years 1 to 5 is: 30,000; 48,000; 66,000;78,000; and 84,000 pizzas respectively.)
* (c) and (d) are based on material in Appendix 8.1.
P8.3 Depreciation: alternative methods and change in estimated useful lifeEarly in January x1, Ionian Airlines purchases a new wide-bodied aircraft for its short- and medium-haul routes in Europe. The aircraft cost 30 million. It has an expected useful life of 15 years and anestimated residual value of 3 million (in x1 values).
Ionian is pleased with its purchase. The aircraft proves to be more reliable and have lower operat-ing costs than expected. At the start of x5, Ionian extends the estimated life by three years. However,it does not change its estimate of the aircraft’s residual value.
Ionian encounters financial difficulties in x6 as a result of increased competition following the entryof low-cost airlines into its markets. It sells the aircraft for 18 million in late December x6. Ionian’sfinancial year ends on 31 December.
Required
(a) Assume Ionian uses the SL method of depreciation. Calculate the depreciation that Ionian chargeseach year on this aircraft between x1 and x6. What is the gain or loss on disposal it recognises inits x6 accounts?
(b) Assume Ionian uses the DB method of depreciation. It sets the DB rate at 150% of the SL rate butignores estimated residual values in determining the annual DB charge. Recalculate the annualdepreciation Ionian charges on this aircraft between x1 and x6 and the gain or loss on disposal atthe end of x6.
Some companies switch to SL depreciation when the SL charge, calculated on the basis of theremaining depreciable amount, exceeds the DB charge. If Ionian follows this practice, will it switchover to SL depreciation before it sells the aircraft in x6 and, if so, when?
(c) While reviewing the published accounts of Alpair, another European regional airline, you noticethat it owns aircraft of a similar type but depreciates them over 12 years. Suggest reasons whythe two airlines assume a different useful life for the same class of aircraft.
Check figure:(a) Annual depreciation x5 − x6 1.414 million
CHAPTER 8 • FIXED ASSETS, TANGIBLE AND INTANGIBLE 227
CFA_C08.qxd 11/6/03 2:25 PM Page 227

P8.4 Depreciation, profits and cash flowSensing that the business world would profit from closer acquaintance with his fables, Aesop decidesto launch a management consulting firm. It begins trading on 1 January year 1 with cash and capitalof 100 and immediately acquires, for cash, office equipment costing 75. Trading is all cash-based:year 1 revenues are expected to be 200 and year 1 expenses (other than depreciation) 150. No divid-end will be paid to shareholders that year.
The equipment has an expected useful life of five years. The company can depreciate the equip-ment using either straight-line or accelerated depreciation. Under the SL method, annual depreciationis 15. Under the accelerated method, depreciation is 30 in the first year (and 18, 11, 8 and 8 in theremaining four years).
The company’s choice has tax consequences, however. Under the country’s tax code, it must usethe same depreciation method to calculate its income tax liability as it uses in its published accounts.Its tax position in year 1 is uncertain. It may be able to avoid tax altogether. At the other extreme, itmay have to pay it at the full rate of 40%.
Required
(a) Aesop asks Leopard, a new employee, to investigate the effects of different depreciation and taxassumptions on the company and to draw up projected year 1 accounts using the framework inExhibit 8.8.
The two depreciation alternatives are the SL method and the accelerated method. The two taxassumptions are tax rates of zero and 40% respectively. Help Leopard complete the exhibit.
(b) After preparing the projected accounts, Leopard reckons the numbers all tell the same story. Thecompany should select the SL depreciation method because reported profit is higher under thismethod at tax rates of zero and 40% and, as far as he can see, at all tax rates in between. Do youagree with his conclusion?
P8.5 Economist’s view of depreciationMilton Keynes is puzzled by the accountant’s calculation of depreciation. As an economist, he viewsdepreciation as the decline in an asset’s market value over a period. If an active market for an assetdoes not exist, market value can be approximated by the present value of the expected cash flowsthe asset will generate. In this case, depreciation is the fall in the present value of those cash flows.
‘For example,’ says Milton, ‘suppose an asset has a three year life and is expected to generatecash flows of 100 at the end of each year. Assuming a 10% discount rate and no salvage value, theasset has a value now of 248.7. Annual depreciation is then the decline in the discounted amount ofthose cash flows over the year. I estimate annual depreciation for this asset for years 1 to 3 as follows:
Expected Present value Depreciationcash flows (at 10%) in year
Now 248.7End-year 1 100 173.6 75.1 (year 1)End-year 2 100 90.9 82.7 (year 2)End-year 3 100 0 90.9 (year 3)
‘Simple, isn’t it? And, unlike many economic ideas, so easy for the business man or woman tounderstand!’
Required
Comment on Milton’s method of calculating depreciation. It is known as the ‘annuity method’. Whatare the key differences between this method and the methods (e.g. straight-line, declining-balance)which companies normally use? Why do you think Milton’s method is rarely used by companies intheir published accounts – or by tax authorities in determining a company’s taxable income?
228 PART 2 • THE HOUSE OF ACCOUNTING
CFA_C08.qxd 11/6/03 2:25 PM Page 228

P8.6 Extracting fixed asset information from the accountsHenkel is a German-owned manufacturer of personal care and household products. Among its best-known international brands are Loctite adhesives, Fa cosmetics and Persil and Dixan laundry deter-gents. In 2001, Henkel sold its Cognis chemical business and its stake in the Henkel–Ecolab industrialand institutional hygiene joint venture in order to focus production and marketing efforts on itsbranded products.
Henkel draws up its financial statements according to IAS. It provides in the notes to the consolid-ated accounts a schedule showing the movement in fixed assets (including financial fixed assets) during the year. The schedule for 2001 is set out in Exhibit 8.9. All amounts are in A million.
Required
(a) What is the carrying amount of Henkel Group’s tangible fixed assets at 31 December 2001?
(b) (i) Henkel reports in a separate note that it made a gain of 98 from the disposal of fixed assetsin 2001. (This figure excludes the gains from disposal of its Cognis business and its stake inthe Henkel–Ecolab joint venture.) Calculate the sale value of the fixed assets disposed of in2001.
(ii) Henkel reports as an investing inflow in the 2001 consolidated cash flow statement ‘proceedsfrom disposal of fixed assets’ of 182. (Again, this amount does not include the proceeds fromthe sale of the Cognis and Henkel–Ecolab investments.) Why is this figure not the same asyour answer to (b)(i)?
CHAPTER 8 • FIXED ASSETS, TANGIBLE AND INTANGIBLE 229
AesopYear 1 accounts
Depreciation methodStraight-line Accelerated
(1) (2) (1) (2)Tax rate 0% 40% 0% 40%
Income statement for year 1Revenues 200 200 200 200Expenses:
Depreciation . . . . . . . . . . . .Other –150 –150 –150 –150
Profit before tax . . . . . . . . . . . .Income tax . . . . . . . . . . . .Net profit . . . . . . . . . . . .
Balance sheet, end-year 1AssetsFixed assets 75 75 75 75Less: Accumulated depreciation . . . . . . . . . . . .Fixed assets, at NBV . . . . . . . . . . . .Cash . . . . . . . . . . . .Total assets . . . . . . . . . . . .
Shareholders’ equityShare capital 100 100 100 100Retained profit . . . . . . . . . . . .Total equities . . . . . . . . . . . .
Effect of depreciation method on the accounts under different tax regimesExhibit 8.8
CFA_C08.qxd 11/6/03 2:25 PM Page 229

(c) In preparing the consolidated accounts, Henkel’s management must translate into euros the finan-cial statements of subsidiaries located outside the eurozone, before combining them with those ofthe company’s eurozone subsidiaries. In most cases, it translates all assets and liabilities – includingfixed assets – at the exchange rate prevailing on the balance sheet date. If, as is likely, exchangerates between the subsidiary’s currency and the euro change between the start of the year (or thedate of asset acquisition/disposal during the year) and the end of the year, exchange gains and lossesarise. These are reported as a ‘translation difference’ in the ‘Changes in fixed assets’ schedule.
From inspection of the translation differences reported in Exhibit 8.9, did the euro strengthen orweaken overall against the currencies of Henkel’s foreign subsidiaries? Give reasons for your answer.
P8.7 Revaluation and impairment of fixed assetsGarter Inns is a hotel chain with small but fast-growing international operations. Early in x2 it buys ahotel in Thailand for cash. The fair value of the hotel building then is 50. (All amounts are in millionsof euros.) Garter Inns depreciates hotel buildings on a straight-line basis over 25 years and assumesa zero residual value. The following events occur over the five years to end-x6:
1 Professional valuers carry out a valuation of all Garter Inns hotels at the end of x2. These externalvaluations usually occur every three years. The valuers estimate the current market value of theThai hotel building at 54.
2 There is an economic crisis in Asia in x4. Hotel occupancy rates fall sharply. Garter’s managementcarry out an impairment review at the end of x4 (after recording depreciation for the year). Theyestimate the value of the Thai building in its existing use to be 30. But developers express interestin the property for conversion to mixed office and residential use and their net offer price is 33.
230 PART 2 • THE HOUSE OF ACCOUNTING
Property,Intangible plant and Financial
assets equipment assets Total
CostAt January 1, 2001 3,687 7,386 925 11,998Changes in the group* −145 −2,944 −12 −3,101Additions 40 534 731 1,305Disposals 382 275 49 706Reclassifications 3 −2 −1 –Translation differences 66 49 34 149
At December 31, 2001 3,269 4,748 1,628 9,645
Accumulated depreciationAt January 1, 2001 1,085 4,615 3 5,703Changes in the group* −44 −1,961 1 −2,004Write-ups – 2 – 2Depreciation and amortization 512 481 2 995Disposals 371 226 – 597Reclassifications – – – –Translation differences 42 18 – 60
At December 31, 2001 1,224 2,925 6 4,155
Fixed assets (net) at December 31, 2001 2,045 1,823 1,622 5,490
* Disposal of Cognis chemical business and stake in Henkel–Ecolab joint venture.
Henkel Group: changes in fixed assets schedule for 2001 (extract)Exhibit 8.9
(Source: Henkel Group, Annual Report 2001. Reproduced by permission of Henkel KGaA.)
CFA_C08.qxd 11/6/03 2:25 PM Page 230

3 Economic conditions are still difficult at the end of x5 when the triennial valuation of Garter’s prop-erties occurs. No revaluation of the Thai hotel occurs then.
4 The Asian economy rebounds in x6. Management carry out an impairment review at the end of x6(after recording depreciation for the year) and estimate the Thai building’s recoverable amount at42 then.
Garter Inns prepares its accounts according to international accounting standards.
Required
(a) Assume Garter Inns measures its land and buildings at depreciated cost. Show the effect on thecompany’s accounts of:(i) the purchase of the Thai hotel building in x2;(ii) the changes in its carrying amount each year over the five years to end-x6.
Use journal entries or the balance sheet equation.
(b) Assume Garter Inns measures its land and buildings at revalued amounts. It carries buildings inits accounts at their net amount (i.e. it does not show accumulated depreciation separately). Showthe effect on the company’s accounts of the changes in the carrying amount of the Thai hotelbuilding each year over the five years to end-x6.
Check figures:Loss (in x4) from asset write-down(recognised in income statement): (a) 11; (b) 10.5
P8.8 Intangible assets: the recognition controversySnapHappy is a Canadian mail-order film developer. Although the photo developing business inCanada is growing slowly, SnapHappy has reported large increases in sales and earnings in recentyears. Sales jumped from C$46m in x0 to C$118m in x6. Net profit rose even faster – from C$2.9mto C$11m over the same period. The stock market thinks the company has a great future. In early x7the company was valued at C$350m – three times x6 sales and 26 times estimated x7 earnings.
What is the secret of SnapHappy’s success? Many investors (and management) attribute it to the company’s marketing flair. Rather than compete on price, the company focuses on service. Thefollowing are some of the company’s innovations:
l Customers are offered a set of slides and a set of prints from the same roll of film.l They also receive a ‘picture index’, showing miniphotos of every picture on the roll. l A replacement roll of film is included with every development order.
As a result, customers accept prices 60% above those of discount film developers and the companyreports a 40% gross margin.
Some investors have doubts. They take issue with the company’s accounting practices.SnapHappy capitalises the costs of its direct mailings to prospective customers and amortises themover three years. This is a questionable practice since SnapHappy’s marketing innovations are easyto copy and retaining customers is difficult. The company’s end-x6 balance sheet has C$15m of mar-keting costs under ‘fixed assets’. If it expensed all marketing costs as incurred, x6 earnings wouldhave been C$7.5m instead of the C$11m reported.
SnapHappy counters that the company’s accounting is prudent. Marketing costs are amortised atan accelerated rate – 55% in the first year, 29% in the second, 16% in the third. These figures are basedon 15 years’ experience of customer purchasing behaviour. And the company is still innovating. Itslatest service is to provide a photo finishing service for customers with digital cameras. They can sendimages over the Internet using a personal computer and the resulting prints are then returned to themby post.
Required
Consider SnapHappy’s policy of accounting for direct mailing costs to prospective customers. Howdo you think these costs should be accounted for? Give reasons for your decision.
CHAPTER 8 • FIXED ASSETS, TANGIBLE AND INTANGIBLE 231
CFA_C08.qxd 11/6/03 2:25 PM Page 231

232 PART 2 • THE HOUSE OF ACCOUNTING
Helius SoftwareSummarised income statements and balance sheets
for the six years, x2–x7(amounts in 000)
x2 x3 x4 x5 x6 x7Income statementOperating revenues 308 425 649 1,070 1,767 2,340– Amortisation of
development costs –20 –32 –31 –47 –72 –174– Other operating
expenses –246 –324 –507 –857 –1,425 –1,973Operating profit 42 69 111 166 270 193Net profit 29 31 52 90 221 164
Balance sheet, end-yearCapitalised software 145 200 290 425 780 1,530Less: Accumulated
amortisation –38 –70 –101 –148 –220 –394Capitalised software
at net book value 107 130 189 277 560 1,136Property and equipment 95 131 120 175 341 1,946Working capital 2 6 95 233 935 950
Capital employed 204 267 404 685 1,836 4,032
Shareholders’ equity 119 170 227 650 1,672 1,842Long-term debt 85 97 177 35 164 2,190
Long-term capital 204 267 404 685 1,836 4,032
Exhibit 8.10
P8.9 Intangible assets: from capitalisation to write-offHelius Software is a fast-growing company specialising in environmental management software.Helius capitalises certain software development costs – in particular the costs of improving or extend-ing existing software products – and amortises them over a 3–5 year period. Management are firmsupporters of capitalisation. They maintain that the development costs they capitalise meet thedefinition of an asset and fulfil asset recognition criteria. They also claim that, if they had expensedsuch costs, the firm would not have grown as fast as it has. Raising capital, especially debt capital,would have been more difficult since the firm’s asset base would have been smaller.
Helius was founded in x1. Summary accounts for the six years from x2 to x7 are set out in Exhibit 8.10.
Required
(a) You discover that Helius’s competitors write off all software development costs as incurred. Whatwould Helius’s operating profit and capital employed (fixed assets plus working capital) have beenin the five years x3 to x7 if the firm had followed a similar policy of immediate write-off of devel-opment costs? Assume the change in accounting method has no effect on the income taxes thecompany pays.
(b) In the light of your answer to (a), suggest another reason why Helius’s management favour capitalisation.
Check figure:(a) Operating profit, x5 78
CFA_C08.qxd 11/6/03 2:25 PM Page 232

CHAPTER 8 • FIXED ASSETS, TANGIBLE AND INTANGIBLE 233
Notes to Chapter 8
1 International Accounting Standards Board, IAS 16: Property, Plant and Equipment, para. 16. Therequirements of the 4th Directive are similar (Art. 35(2) and (3)).
2 International Accounting Standards Board, IAS 23: Borrowing Costs. See also the 4th Directive, Art. 35(4).
3 Depreciation may form part of the cost of another asset rather than being expensed in the periodincurred. We illustrate this in the following chapter on inventories.
4 This means that the firm should estimate the residual value using prices ruling at the time of the asset’spurchase.
5 Many firms ignore salvage value when computing the depreciable amount under the DB method. Thisis because the actual depreciation rate they use is inaccurate. The DB rate should be the rate whichensures that the asset’s NBV declines to expected salvage value by the end of its life. This rate can bedetermined exactly as
(1 − )
where n is the asset’s estimated useful life, s is its salvage value and c is its acquisition cost. Since thisformula can result in a different depreciation rate for each asset, it’s rarely used in practice.
6 Fédération des Experts Comptables Européens (1993), 1992 FEE Analysis of European Accounting andDisclosure Practices, London: Routledge, tables 6.9 and 6.15.
7 Ibid., table 6.9.8 IAS also allow firms to eliminate the existing accumulated depreciation balance against the cost of the
asset and revalue the net amount.9 Notice that Quixote’s income statement bears the higher depreciation expense of 2,400 from year 3
only. The adjustment to RC depreciation for years 1 and 2 (800 total) is taken to the balance sheet: thecredit to revaluation reserves is the net increase in replacement cost of 1,200, not the gross increase of 2,000. An alternative, more conservative approach is to charge the additional depreciation for prior years – known as backlog depreciation – to the income statement which, of course, depressesprofits.
10 International Accounting Standards Board, IAS 36: Impairment of Assets. The standard covers certaininvestments (e.g. investments in associated companies and joint ventures) as well as tangible andintangible fixed assets.
11 It may not be possible to estimate the recoverable amount of an asset in isolation (e.g. because of itsinterdependence with other assets). In this event, the firm applies the impairment test to the asset’s‘cash-generating unit’ (i.e. the group of assets of which it is a part).
12 IAS 16, op. cit. See also 4th Directive, Art. 33(1).13 International Accounting Standards Board, IAS 38: Intangible Assets.14 In 2002, the IASB issued a draft standard on business combinations that, if implemented, would elim-
inate mandatory amortisation of goodwill but would require companies to test the goodwill asset forimpairment each year.
15 Organisation for Economic Cooperation and Development (2001), Science Technology and IndustryScoreboard of Indicators 2001: Towards a Knowledge-based Economy, Paris: OECD.
16 Lev, B. and Sougiannis, T. (1996), The capitalization, amortization, and value-relevance of R&D,Journal of Accounting and Economics, 21: 107–138.
17 Amir, E. and Lev. B. (1996), Value-relevance of non-financial information: the wireless communica-tions industry, Journal of Accounting and Economics, 22: 3–30.
18 Some managers are in favour of standardising the calculation of NFIs. A widely used indicator in theretail sector is ‘like-for-like’ (or ‘organic’) sales, a figure that removes the contribution of new storeopenings to reported total sales. Carlos Criado-Perez, then chief executive of Safeway, a large UKsupermarket chain, criticised London analysts for misrepresenting the company’s trading performancein the first half of 2002. He argued that rivals Sainsbury and Tesco had inflated their like-for-like salesnumbers in the same period by including extra selling space they’d installed in existing stores (Voyle,S. (2002), Safeway chief launches attack on City analysts, Financial Times, 1 November).
s cn
/
CFA_C08.qxd 11/6/03 2:25 PM Page 233

19 Some firms pursue a more subtle strategy. They switch to the units-of-production (UoP) method forcertain types of asset. Investors are suspicious of this method (except in the natural resources industrywhere it’s an accepted practice). The reason is that the company may overestimate total production orusage during the asset’s useful life – thereby inflating the denominator of the depreciation factor andreducing the annual charge. Moreover, the UoP depreciation charge is conveniently low in periods oflow activity – which are usually periods of low profits, too.
20 International Accounting Standards Board, IAS 40: Investment Property.21 IAS 40, para. 28. Under the fair value approach, the property is accounted for in the same way as cer-
tain financial investments. We discuss the accounting for financial investments in Chapter 13.
234 PART 2 • THE HOUSE OF ACCOUNTING
CFA_C08.qxd 11/6/03 2:25 PM Page 234

Inventories
INTRODUCTIONIn this chapter, we examine the accounting for and reporting of inventories.For retailing companies, inventories consist largely of goods held for resale.For manufacturing companies, inventories include materials to be useddirectly and indirectly in production (‘raw materials and consumables’), com-pleted products ready for sale (‘finished goods’) and products which are still inthe course of manufacture (‘work in progress’). They are an important asset ofretailing and manufacturing companies: for example, inventories make up10–20% of the total assets of most manufacturing companies.
The central issue companies face when reporting inventories is how to meas-ure them. Specifically, companies must decide:
l which costs to include in inventories; andl how to value them.
Manufacturing firms usually capitalise all production costs – including production overheads – when determining the cost of work in progress andfinished goods. We explain and illustrate this method of costing which is knownas absorption costing. (An alternative method, variable costing, is used by aminority of companies. We describe it in the appendix to this chapter.)
Most European (and all US) companies value their inventories at historicalcost (HC), that is the cost of purchase or production. Some, however, valuethem at replacement cost. We illustrate both valuation methods. HC valuationis not straightforward. Purchase and production costs change over time. Mostfirms make an assumption about the way these changing costs flow throughinventory to sales: on a first-in, first-out (FIFO) basis, on a last-in, first-out(LIFO) basis, or a weighted-average basis. We explain these various cost-flowassumptions and show the impact of each on corporate income and cash. Wealso describe an end-of-period valuation adjustment – writing down inventoriesto their lower market value – which most firms using HC apply.
Investors monitor inventories closely. We explain a key ratio, inventoryturnover, which they employ to do this. They also calculate firms’ cost-to-salesratios. Because European firms classify costs differently, some by function,others by nature, intercompany comparison may not be possible. We lookonce again at the two ways of classifying costs, this time in a manufacturingcontext.
99
l Inventory records:perpetual andperiodic systems
l The capitalisationdecision
l Flow of product costs for retailer and manufacturer
l Inventories athistorical cost
l Lower of cost ormarket rule
l Inventories atreplacement cost
l Valuation ofinventories: rules and custom
l Financial statementpresentation andanalysis
l Appendix: Variable costing
In this chapter
CFA_C09.qxd 11/7/03 2:11 PM Page 235

236 PART 2 • THE HOUSE OF ACCOUNTING
We begin the chapter, however, on a bookkeeping note. We outline the two principal wayscompanies maintain their inventory records. These are known as the periodic and the per-petual systems of record-keeping. How a company keeps its inventory records can affect thetypes of cost included in inventories and thus the way they are measured.
Inventory records: perpetual and periodic systems
A company can maintain its inventory records in one of two ways. Under the ‘perpetual system’,it enters all movements of inventory, both inflows and outflows. It updates its records on a continu-ous basis. Thus it can determine, at any time, the amounts consumed or sold by consulting itsrecords. Under the ‘periodic system’, it records only additions to inventory. To find the amountsconsumed or sold in a period, it must count (and value) the inventory at the start and end of theperiod. Thus it updates its records only periodically.
A simple example shows how the two systems operate in practice. Gretel and Hansel bothmake a device known as a ‘witchit’, an important component in certain food processing equip-ment. Witchits are made from steel and other materials. Consider the way each of them accountsfor movements in steel inventory.
Gretel updates her steel inventory records on a continuous basis (perpetual system). Heraccounts show steel costing 25,000 in stock at 31 December year 4. During year 5, she records thepurchase of steel costing 35,000 and the use of 40,000 worth in witchit manufacture. Thus herrecords show end-year 5 steel inventory with a book value of 20,000.
By contrast, Hansel updates his inventory records only at the end of each year (periodic system). He begins year 5 with steel holdings of 10,000, this being the cost of the steel in stockwhich was counted on 31 December year 4. He acquires steel for 55,000 during year 5. A countby Hansel at 31 December year 5 shows his steel holdings to be 20,000 in cost terms. These detailsare summarised in T account form in Exhibit 9.1.
From Exhibit 9.1 we see that under the periodic system there is an unknown quantity whichhas to be derived. It is the cost of inventory used (or, in the case of a retailing company, sold) inthe period. This can only be derived accurately by counting the inventory on hand at the end ofthe period, costing it and deducting the amount from the cost of inventory available for use (orsale). In Hansel’s case:
Inventory counted and costed at end-year 4 10,000+ Inventory purchased +55,000
Cost of inventory available for use 65,000− Inventory counted and costed at end-year 5 −20,000
Cost of inventory used in year 5 45,000
By contrast, Gretel can consult her (perpetual) inventory records at any time to discover theamount and cost of steel used in previous periods and currently on hand.
The perpetual system of record-keeping offers managers several advantages. First, it providesthem with up-to-date information about inventory movements and inventory levels. By contrast,under the periodic system, management must resort to frequent stock counts to obtain similarinformation (although, if there is a stable relationship between material inputs and output of finalproduct, it can estimate material usage from sales data).
Second, when supplemented by stock counts, it yields information – about inventory ‘shrinkage’– which a periodic system does not normally supply. Companies using a perpetual system alsocount their inventories at regular intervals. A stock count provides a check on the accuracy of a
CFA_C09.qxd 11/7/03 2:11 PM Page 236

CHAPTER 9 • INVENTORIES 237
Gretel and HanselSummarised inventory accounts
(all are currency amounts and in 000)
Gretel Hansel(Perpetual system) (Periodic system)
Inventory (steel) Inventory (steel)
Balance, Balance,1/1/yr 5 25 Used in 1/1/yr 5 10 Used in
witchit 40 witchit xPurchases 35 manufacture Purchases 55 manufacture
Balance, Balance,31/12/yr 5 20 31/12/yr 5 20
x = cost of inventory used in year.= beginning balance
+ purchases of inventory− ending balance
= 45
Perpetual and periodic systems: inventory accounts contrasted Exhibit 9.1
company’s records and can indicate to management the incidence and scale of unexpecteddecreases in inventory. Shrinkage can be the result of deterioration, damage or theft. Once itsexistence is known, management can investigate the reasons for it.
For example, suppose an end-year 5 stock count at both companies indicates the closing balance has a cost of 18,000. Under his periodic system, Hansel records the cost of steel used at 47,000 (10 + 55 − 18) instead of 45,000. However, Gretel’s perpetual system reveals a dis-crepancy between the records and physical inventory levels. Assuming the records themselves are not in error, the unexpected decrease of 2,000 cannot be attributed to normal usage. This will prompt Gretel to investigate the reason for the unexplained variation. Under a periodic system, the inventory records cannot provide such a signal. As a result, stock controls are weaker.
There are other accounting implications, in particular for the costing of finished goods.Consider what happens to the 2,000 of shrinkage. Under a periodic system, it is treated as partof the cost of material used in the manufacture of witchits. As such, it enters into the cost offinished units and is charged to the income statement – as part of ‘cost of sales’ – only when thoseunits are sold. Under a perpetual system, the amount is not capitalised since it provides no futurebenefit: instead, it is written off as a loss in the period when it’s identified.
A perpetual record-keeping system does have one disadvantage. It’s more costly to operatethan a periodic system. Where inventories are of low value or change little over the period, thecosts of running a perpetual system may outweigh the benefits from the additional informationit provides. Note that a firm can employ both systems – for different types of inventory – withinthe same plant.
CFA_C09.qxd 11/7/03 2:11 PM Page 237

238 PART 2 • THE HOUSE OF ACCOUNTING
BALANCE SHEET INCOME STATEMENT(functional basis)
Sales revenuePRODUCT COSTS lessProduction: Expensed
Materials 5 Costs when Cost ofLabour 6 salesOverhead* 7 capitalised goods sold
Gross profitless
PERIOD COSTSSelling costs 5 Expensed as Selling,Distribution costs 6 distribution andAdministrative costs 7 incurred administrative
expenses
Operating profit
* Examples: foreman’s salary; plant maintenance; plant depreciation; factory utility costs.
Inventory
Absorption costing: impact of product and period costs on accountsExhibit 9.2
The capitalisation decision
Companies with material holdings of inventory face the question: which costs should be treatedas part of inventory and capitalised? We had a foretaste of this in the previous section when con-sidering the ‘cost’ of shrinkage. Firms in Europe and elsewhere follow a long-standing principleaccepted worldwide. All costs are capitalised which are incurred in order to bring the inventories to‘their present location and condition’.1
For retailing and wholesaling companies, this means that, in addition to the purchase price,any specific, non-reclaimable duties (such as import tariffs) are capitalised. So, too, is the cost ofshipping the goods into the store or warehouse. (Freight-out costs, however, are treated as dis-tribution costs and are expensed in the period incurred.)
For manufacturing companies, the principle is more ambiguous. Clearly, the raw materials –and the production labour incurred to convert them into saleable product – are inputs necessaryto bring inventories of finished goods to their completed state. But how should a companyaccount for costs which are not directly associated with the manufacture of each unit of prod-uct? Such costs are often described as ‘overhead costs’ or simply ‘overheads’.
Overheads cover a wide range of costs. They include production-related costs such as plantdepreciation, plant maintenance and the costs of utilities and insurance associated with the factory. They also extend to selling, distribution and administrative costs. Firms distinguishbetween production and non-production overheads. The salary of a foreman is considered aproduction overhead. That of a senior manager with production and administrative responsib-ilities is in part a production overhead and in part an administrative overhead. Strictly, the costof her salary should be apportioned between the two, based (this is one obvious allocation basis)on the time she spends on each of the two types of duties.
The distinction between production and non-production overheads is an important one inpractice. The method of costing products used by most manufacturing companies is absorption
CFA_C09.qxd 11/7/03 2:11 PM Page 238

CHAPTER 9 • INVENTORIES 239
costing. Under this method, a firm capitalises all production costs – material, labour and overheads– when determining the cost of manufactured inventory in its published accounts. All other costs arecharged to the income statement in the period when they’re incurred. (We show how it’s appliedin a later section.) Costs capitalised in inventory are known as product costs. Non-capitalised costs– those charged to the income statement immediately – are known as period costs. Exhibit 9.2summarises the various types of product and period cost under absorption costing and theimpact of both on the accounts.
The practice of capitalising production costs and expensing immediately all non-productioncosts is of long standing. The justification is that only production costs add value directly to the product. There are also practical reasons for limiting capitalisation to production costs. Thelink between selling or administrative costs and individual products is often hard to show. Inaddition, there is less risk of valuing inventories above their fair value in the balance sheet since clearly their book values are lower than they would be if non-production costs were capitalised.
Firms following international accounting standards must use absorption costing.2 An altern-ative method of costing which is used by some firms in their internal accounts is variable costing. Under this method, only production costs directly attributable to the product’s manufacture(mainly production materials and labour) are capitalised and shown as the cost of inventory. Otherproduction costs (and all non-production costs) are expensed in the period incurred. It yieldslower inventory values than absorption costing but it allows readers of accounts to see moreclearly the link between sales and profits. We illustrate this method in the appendix.
Flow of product costs: retailer and manufacturer
How do manufacturing companies record production costs? It’s helpful to contrast the waysproduct costs flow through the manufacturer’s and the retailer’s inventory accounts. We lookfirst at the retailer and then the manufacturer.
l Flow of retailer’s costsRecall for a moment the essential features of a retailer’s operations. He buys goods, stores them and later sells them. The goods themselves are not (intentionally) physically altered during the period between purchase and sale. The accounting mirrors the physical movement of thegoods.
1 During the period of storage, the costs of the goods are held in a balance sheet account, ‘merchandise inventory’.
2 At the time of sale (perpetual system) or at the end of the financial period when the inventoryis counted (periodic system), the costs of the goods sold are removed from inventory andtransferred to the income statement. They are recorded as an expense (‘Cost of goods sold’)and matched against the revenues generated by the sale.
The flow of product costs for the retailer (or wholesaler) is charted in Exhibit 9.3.
l Flow of manufacturer’s costsNow consider the operations of a manufacturer. She buys raw materials and employs people andequipment to convert those materials into a product which is then sold. Under absorption cost-ing, she records in inventory the costs of converting the materials to finished product. Thusinventoried costs consist of:
CFA_C09.qxd 11/7/03 2:11 PM Page 239

l raw materials (sometimes known as direct materials);l direct production labour; and l production overhead (i.e. plant depreciation, factory utility costs, plant maintenance, foreman’s
salary and other indirect labour costs of production).
There are various ways in which the manufacturer can record the production costs in herbooks. Exhibit 9.4 illustrates one approach which is common where production is by job orbatch. The accounting assumes continuous updating of inventory records (perpetual system).
For this manufacturing company, product costs flow as follows:
1 Materials when purchased are stored in an inventory account ‘Raw materials inventory’(RM).
2 When production begins, the costs of the materials used are transferred from RM to anotherinventory account, ‘Work-in-progress inventory’ (WIP).
3 The production costs of converting the materials into saleable product, namely the costs ofdirect labour and production overhead, are recorded in WIP as they’re incurred. In effect,these conversion costs are capitalised (made into an asset).
4 When a unit of product is completed, the production costs attached to it are transferred fromWIP to a third inventory account, ‘Finished goods inventory’ (FG), and stored there until theitem is sold.
5 When the product is sold, its costs are transferred from the balance sheet (‘Finished goodsinventory’) to the income statement (‘Cost of goods sold’). The manufacturer, like theretailer, recognises revenue from the sale and matches against it the (production) cost of the item sold.
Thus while a good is being made or, once made, is in store awaiting sale, its production costs areviewed as an asset of the firm (Inventory). When it is sold, the firm gives up the asset (in exchangefor cash or a claim to cash). As revenue from the sale is recognised, the cost of the relinquished assetis recorded as an expense (Cost of goods sold).
240 PART 2 • THE HOUSE OF ACCOUNTING
BALANCE SHEET INCOME STATEMENT
PurchaseActivity and storage Sale of goods
of goodsSALES REVENUE
less
Cost ofFlow of costs merchandise
purchased
equalsGROSS PROFIT
�
Accounting Dr. Merchandise inventory (A+) Dr. COGS (OE−)Cr. A/P or Cash Cr. Merchandise
(L+) (A−) inventory (A−)
COST OFGOODS SOLD
MERCHANDISEINVENTORY
Flow of product costs in a retailing companyExhibit 9.3
CFA_C09.qxd 11/7/03 2:11 PM Page 240

l Absorption costing illustratedWe can follow the flow of costs – from purchase of raw materials to sale of finished goods – inGretel’s accounts for year 5. Assume Gretel begins the year with net assets of a125,000, of whicha25,000 represent the cost of raw materials inventory. The key year 5 production facts are thatGretel:
l starts manufacture of 8,000 witchits,l completes 7,000, andl sells 6,000 (for a16 each).
Each witchit requires a5 of materials, a2 of labour, and a4 of overhead. The 1,000 witchits inend-year 5 WIP inventory need no further materials but are half-complete with respect to labourand overhead.
The events in Gretel’s production-to-sale cycle in year 5 are described below and referencedby number to the worksheet in Exhibit 9.5.
[1] Gretel buys a35,000 worth of raw materials in year 5 . . .[2] and issues materials costing a40,000 for the 8,000 units on which production starts in year
5 (8,000 units × a5).[3] Gretel incurs production labour costs of a15,000 [(7,000 units × a2) + (1,000 units × 0.5 ×
a2)] . . .[4] and production overhead of a30,000 [(7,000 units × a4) + (1,000 units × 0.5 × a4)]. [5] Gretel completes the 7,000 witchits at a unit cost of a11 (5 of materials, 2 of labour and 4 of
overhead) and transfers the costs (a77,000) to finished goods inventory.[6] The company records the a66,000 cost of the units sold (6,000 at a11) . . .[7] when it recognises the revenue of a96,000 (6,000 units at a16) from those sales.
At year-end, 1,000 witchits are ‘in progress’, half-complete with respect to labour and overhead.Their unit cost is a8 (5 of materials, 1 of labour and 2 of overhead). In addition, 1,000 finishedwitchits with a unit cost of a11 await sale.
CHAPTER 9 • INVENTORIES 241
Flow of product costs in a manufacturing companyExhibit 9.4
CFA_C09.qxd 11/7/03 2:11 PM Page 241

We show in Exhibit 9.6 how these events affect Gretel Company’s ledger accounts. The journal entries recording, for example, direct labour and plant depreciation costs have the fol-lowing form:
Dr. WIP inventory (A+) xxCr. Wages payable (L+) xx
Dr. WIP inventory (A+) xxCr. Accumulated depreciation (CA+) xx
Notice how the production costs incurred in year 5 are accounted for. They are capitalised(i.e. made into an asset) in a balance sheet account ‘WIP inventory’. Gretel Company does notrecord production wage and depreciation costs in income statement accounts, ‘wage expense’and ‘depreciation expense’.3 Only when the witchits are sold are the capitalised labour and otherproduction costs expensed – through the ‘Cost of goods sold’ account. This may well occur inthe financial period after the costs were incurred. For example, the 8,000 euros of materials,labour and overhead in WIP inventory at the end of year 5 were incurred that year but will notbe expensed until the 1,000 witchits to which they relate are sold – in year 6 or possibly later.
l Inventory record-keeping of manufacturing firmsInventory systems differ across industries. Industries where production flow is rapid and work-in-progress is minimal dispense with a perpetual system to track the costs of a product duringproduction. All production labour and overhead are charged to a ‘production expense’ account.End-of-period inventory is determined by a count and an adjustment is then made to both theproduction expense and inventory accounts.
Inventory systems also change over time. For example, many companies now require ‘just-in-time’ delivery of materials to their production centres. In this case, a separate raw materialinventory serves no purpose. Instead, material costs are charged directly to work-in-progress (orproduction expense). Again, an end-of-period count is made to adjust expense and inventoryaccounts.
242 PART 2 • THE HOUSE OF ACCOUNTING
Production cost flows under absorption costing: transaction analysis formatExhibit 9.5
Gretel Company
InventoryOther net Shareholders’
Amounts in B000 RM WIP FG assets equity
Balance,1/1/year 5 25 0 0 100 125[1] RM purchased +35 −35[2] RM used −40 +40[3] Production labour
costs incurred +15 −15[4] Production overhead
costs incurred +30 −30[5] Units completed −77 +77[6] Cost of sales −66 −66[7] Sales revenue +96 +96
Balance, 31/12/year 5 20 8 11 116 155
CFA_C09.qxd 11/7/03 2:11 PM Page 242

CHAPTER 9 • INVENTORIES 243
Production costs flows under absorption costing: ledger account entriesExhibit 9.6
Inventories at historical cost
Up to now we’ve assumed that the unit costs of inventories, be they goods for resale or goodsunder production, are constant. In Gretel’s case, for example, the manufacturing cost of a witchitis a11 a unit throughout year 5. In reality, even when overall inflation is negligible, the costs of purchased merchandise and production inputs change over time. How does the manufac-turer determine the cost of units produced and the retailer the cost of units sold in these circumstances?
Companies that follow the HC convention use one of two approaches to determining cost.The first, and less common, is known as the specific identification (SI) approach. Where invent-ories are not interchangeable (e.g. the ‘one-of-a-kind’ piece of furniture, the unique piece of jewellery) or where they’re project-specific, merchandise or production costs are identified witha particular good or project.
In other cases, however, specific identification of costs with goods is impractical and, as weshow later, can lead to profit manipulation. As a result, most companies follow the secondapproach. They make an assumption about the way costs flow through inventories. Three cost-flowassumptions are in general use. Companies can assume that:
1 the first costs to flow in are the first costs to flow out (the FIFO cost-flow assumption); 2 the last costs to flow in are the first costs to flow out (the LIFO cost-flow assumption); or 3 the costs which flow out are a weighted average of the costs that flow in (the weighted average
cost-flow assumption).
CFA_C09.qxd 11/7/03 2:11 PM Page 243

Each of these cost-flow formulas offers a systematic way of assigning costs to products, onethat’s easy to implement and less prone to manipulation than the SI approach. Note that in prin-ciple the cost flow assumed does not have to correspond to the physical flow of goods. A foodretailer, for example, may use weighted-average cost when valuing goods in inventory, eventhough, to minimise losses from spoilage, the company follows a ‘first-in, first-out’ policy ofinventory management.
l Cost-flow assumptions: FIFO, weighted average and LIFO
An example will help illustrate the way the three cost-flow assumptions work and the effect ofeach on a company’s accounts. We’ll inject some realism in the example by assuming prices ofgoods are rising, a phenomenon which has occurred continuously in most countries over thepast 20 years.
Jack Falstaff is a London wine merchant. He imports and sells sherris-sack through his whole-sale business. Sherris-sack is a Spanish fortified wine which is finding growing favour among the‘taverna’ crowd in the city.
He has two casks of sherris-sack in inventory at the start of x1. Each cost him 30. During thefirst half of the year, he buys three casks: one in February for 35, the second in April for 40 andthe third in June for 45. He sells two casks of wine (for 75 each) during the second half of x1.
Falstaff wants to know what the costs are of the two casks sold in x1 and of the three casksremaining in inventory at 31 December. Exhibit 9.7 shows that these costs differ, depending onthe cost-flow assumption – FIFO, weighted average or LIFO – the company makes when valu-ing inventory.
Each cost-flow assumption assigns production or merchandise costs to the income statement(cost of goods sold) or balance sheet (inventory), using a simple, unchanging formula. UnderFIFO, the earliest costs (the first costs in) are assigned to the units sold (the first goods out), while themost recent costs are assigned to the units remaining in inventory. In Falstaff ’s case, the earliestcosts assignable to the two casks sold are those of beginning inventory (2 casks at 30). The casksin ending inventory are valued at 120, the costs associated with the February, April and June pur-chases (35, 40 and 45 respectively).
Under the weighted average cost assumption, an average cost is computed, based on the costs ofthe goods or merchandise available for sale (or use). Merchandise available for sale comprises itemsin beginning inventory and items purchased for resale. The weighted average cost (WAC) perunit is calculated as:
WAC/unit ==
We use total costs and total units available in the calculation of unit WAC. The number of unitsin the beginning inventory and in each purchase act as weights in determining weighted averagecost. The resulting WAC is applied to both units sold and units in ending inventory. In Falstaff ’scase, the total costs of casks available are 180 ( (2 casks @ 30) + (1 @ 35) + (1 @ 40) + (1 @ 45) )and the WAC per cask is 36. Thus the unit cost of the casks in beginning inventory carries double the weight of each of the Falstaff ’s purchases during x1.
LIFO reverses the FIFO cost-flow assumption. Under LIFO, the most recent costs are assignedto the units sold; the earliest costs are assigned to the units remaining in inventory. For Falstaff, thecosts assignable to the two casks sold are – going from most recent to next most recent – that ofthe June purchase (1 cask at 45) and then that of the April purchase (1 at 40). The costs assignedto the three casks in ending inventory are those of the February purchase (1 at 35) and begin-ning inventory (2 at 30) – 95 in total.
Total costs of units available (for sale)
Number of units available (for sale)
244 PART 2 • THE HOUSE OF ACCOUNTING
CFA_C09.qxd 11/7/03 2:11 PM Page 244

CHAPTER 9 • INVENTORIES 245
Falstaff’s sherris-sack: costs of sales and ending inventory in x1, under FIFO, WACand LIFO cost-flow assumptions
Exhibit 9.7
CFA_C09.qxd 11/7/03 2:11 PM Page 245

The flow of Falstaff ’s sherris-sack costs – to sales and ending inventory – under the threeassumptions is also shown in T account form below:
Sherris-sack inventory, assuming:
FIFO WAC LIFO
BI 60 BI 60 BI 60(2@30) Buy 120 Buy 120 Buy 120(1@35; 1@40;1@45)
COGS 60 COGS 72 COGS 85(2@30) (2@36) (1@45;
1@40)
EI 120 EI 108 EI 95(1@35; (3@36) (2@30; 1@40; 1@35)1@45)
Notice that, in our example, the cost of goods sold (COGS) and the cost of ending inventory(EI) sum to 180 in all three cases. This is not a coincidence. The cost of purchases is by definitionthe same (120) under all three cost-flow assumptions. Since the book value of beginning invent-ory (BI) is assumed to be the same across the alternatives in our example, it follows the cost ofgoods available for sale must be identical and hence the sum of the costs of sales and endinginventory will be equal, too:
Beginning inventory Cost of goods sold++ == Cost of goods available for sale == ++
Purchases Ending inventory
Even though, in practice, the book value of beginning inventory and thus the cost of goods avail-able for sale (COGAFS) will differ across the three cost-flow assumptions, the relationshipsshown above still hold. For any given COGAFS, a cost-flow assumption which assigns more of suchcosts to cost of goods sold will assign less of them to ending inventory.
l Effect of cost-flow assumption on income
When the costs of merchandise or production inputs are changing, the cost flow assumed bymanagement affects corporate income and, the tax code permitting, corporate cash flow. We candeduce from Exhibit 9.7 the direction of the link between price changes and income. When costsare rising (and, an important proviso, inventory levels are constant or increasing), use of FIFO willlead to higher reported profits and higher book values for inventory than those reported under theWAC or LIFO assumptions. The difference will be greatest between FIFO and LIFO, withreported profits and inventory values under WAC at levels between the two.
The way the three cost-flow assumptions work provides the clue to these results. Under FIFO,‘old’ costs are assigned to units sold – hence the lower cost of goods sold figure – while ‘new’costs are captured in ending inventory. The lower cost of sales leads to higher reported profits.The reverse occurs under LIFO. Under WAC, the unit cost assigned to both inventory and costof goods sold is a (weighted) average of the ‘old’ and ‘new’ costs. Of course, when prices are
246 PART 2 • THE HOUSE OF ACCOUNTING
CFA_C09.qxd 11/7/03 2:11 PM Page 246

falling, we should observe the opposite result: reported profits and inventory values will be lowerunder FIFO.
Falstaff ’s figures for x1 confirm these findings. Exhibit 9.8 shows the gross profit, before andafter tax, on his sherris-sack line, under the three cost-flow assumptions. Falstaff sold two casksof wine in x1 at a per-cask price of 75. A tax rate of 30% is assumed.
Falstaff ’s gross profit under FIFO is higher than that under WAC or LIFO in x1. We can gen-eralise from Exhibit 9.8. In periods of rising prices (and constant/rising inventory levels), FIFOyields higher reported profit and, as a result, higher reported tax expense than the WAC andLIFO alternatives.
l Effect of cost-flow assumption on cash flowChoice of cost-flow assumption has no effect on before-tax corporate cash flow: it will affect after-taxcash flow, if the tax code permits the use of alternative cost-flow assumptions. A switch from, say,FIFO to LIFO does not change the retailer’s purchase costs or the manufacturer’s outlays on pro-duction inputs. It does change the calculation of reported profit, as we have seen. In this case,the lower profit translates into a lower tax charge, assuming the new cost-flow assumption,LIFO, is accepted by the tax authorities. Given an unchanged before-tax cash flow and lower taxpayments, the switch from FIFO to LIFO results in higher after-tax cash flows.
This is evident from Falstaff’s x1 cash flow statement for its sherris-sack line summarised inExhibit 9.9. We assume for simplicity that all transactions are cash-based.
Falstaff ’s tax payments under FIFO are greater in x1 – and its after-tax cash flows lower thatyear – than those under LIFO. Thus use of LIFO in inflationary periods can result in lower reportedprofits but, tax authorities willing, higher cash flows than prevail under FIFO or WAC. By the same
CHAPTER 9 • INVENTORIES 247
FIFO WAC LIFO
Sales revenue (2 casks at 75) 150 150 150Less: Cost of goods sold (Exhibit 9.7) 60 72 85Gross profit (before tax) 90 78 65Less: Income tax at 30% 27 23.4 19.5Gross profit (after tax) 63 54.6 45.5
Falstaff’s sherris-sack: x1 gross profit, before- and after-tax, under FIFO, WAC andLIFO cost-flow assumptions
Exhibit 9.8
FIFO WAC LIFO
Receipts from sales 150 150 150Less: Payments for casks
purchased in February,April and June* 120 120 120
Before-tax cash flow 30 30 30Less: Income tax (Exhibit 9.8) 27 23.4 19.5After-tax cash flow 3 6.6 10.5
* The beginning inventory was paid for in an earlier period.
Falstaff’s sherris-sack: x1 cash flow, under FIFO WAC and LIFO cost-flowassumptions
Exhibit 9.9
CFA_C09.qxd 11/7/03 2:11 PM Page 247

248 PART 2 • THE HOUSE OF ACCOUNTING
token, when prices are falling, corporate income will be higher and after-tax cash flows lowerunder LIFO than under the alternative cost-flow assumptions.
These results only hold when inventory levels are constant or rising. When inventory levelsfall, ‘old’ costs which, under LIFO, are ‘preserved’ in inventory are released into the incomestatement. As a consequence, the cost of goods sold is lower and income higher: higher than ifinventory levels had been maintained – and higher, possibly, than income reported under FIFOor WAC. At this point, taxes hitherto postponed become payable. Note that any tax benefits fromthe adoption of LIFO stem from the (present value) effect of tax deferral. The company’s tax bill isnot permanently reduced.
l Flaws in HC-based inventory costing methodsEach of the HC cost-flow assumptions can be criticised for misstating reported income and thevalue of inventories. FIFO, it is argued, overstates income in inflationary periods since the cost ofsales figure is based on ‘old’ costs. LIFO, on the other hand, understates the value of inventories:‘new’ costs are channelled to the income statement and thus the balance sheet becomes therepository of ‘old’ costs. WAC accounts suffer from both faults, but to a lesser degree.
LIFO and WAC are susceptible to profit manipulation. In both cases, profit can be affected bythe timing of inventory purchases. For example, suppose Falstaff decides to buy another cask ofwine (at, say, 45). By bringing forward the purchase date from early x2 to late x1, he can raisecost of goods sold and lower profits in x1, assuming the company determines the costs of sales andending inventory on a periodic (end-of-year) basis.
How does this happen? The cost of the December x1 purchase is included in periodic-basedcost of sales, even though the cost is incurred after the last sale. As a result, the x1 LIFO cost ofsales increases to 90 (2 casks at 45) and the x1 WAC cost of sales to 75 (2 casks × (225/6)).Falstaff ’s x1 FIFO profit is unaffected by the above purchasing strategy. FIFO cost of sales isbased on the earliest costs which don’t alter as a result of an additional purchase at year-end.
Specific identification (SI) of costs with goods is not a satisfactory alternative to a cost-flowassumption. Where products are interchangeable and large in number, identifying costs withindividual items makes record-keeping unnecessarily expensive. Where products are inter-changeable and few in number, the method is still unsatisfactory because of the potential forprofit manipulation.
Suppose Falstaff uses the SI method to determine the cost of sales and the book value ofinventory. Assuming the casks of sherris-sack are interchangeable, he can choose to draw the twocasks he sells in x1 from the five available in such a way as to report any one of several (before-tax)gross profit figures between 65 and 90. Moreover, even if the casks he draws from stores in x1exhibit a recognised physical flow, e.g. FIFO, he is not bound, under the SI method, to follow thatpattern of usage in later periods. By contrast, a cost-flow assumption such as FIFO, once adopted, mustbe adhered to in subsequent periods. The company’s auditors draw attention in their report to anychange in cost-flow assumption – on the grounds that the company has not applied accountingpolicies consistently. They require it to disclose the effects of the change on its accounts, if material.
In a later section, we describe an alternative method of valuing inventories, the replacementcost method, which avoids the flaws of HC-based methods.
Lower of cost or market rule
Inventories may decline in value. Supply may exceed demand, perhaps because of a change incompetitive conditions in the industry. An advance in technology may render a product or processobsolete. In consumer goods industries, changes in fashion or taste can lead to a fall in demand
CFA_C09.qxd 11/7/03 2:11 PM Page 248

for a product. Goods may be damaged. In each case, the manufacturer or retailer is forced to markdown the price of the goods in order to sell them. Note that materials and work-in-progress maybe affected as much as finished goods.
What are the accounting implications? A company that values its inventories at historical costusually applies an impairment test to them on the balance sheet date. The test is known as the‘lower of cost or market’ – or LOCOM – rule. IAS define ‘market’ as net realisable value (NRV),that is, the amount the inventories are expected to realise in the normal course of business, net offuture costs necessary to complete and sell them. Assume the carrying amount of a company’sinventories is their cost of purchase (or production), as determined using specific identificationor a cost-flow assumption like FIFO. If, at the end of a financial period (i.e. year, quarter), theNRV of its inventories falls below cost, it’s doubtful whether the company can recover its invest-ment under current market conditions and so it should write the inventories down to NRV andrecognise the unrealised loss in its income statement immediately. The inventories’ NRVbecomes the new carrying amount when applying the LOCOM rule at the end of the next period(assuming the goods remain unsold).
We illustrate the operation of the LOCOM rule using Jack Falstaff ’s sherris-sack line. Supposeas a result of a change in consumer tastes the demand for sherris-sack falls away in late x1 andFalstaff estimates that the NRV of each cask is only 35 at year-end. Assume, too, that FIFO is thecost-flow assumption Falstaff uses in his HC-based accounts. Inspection of Exhibit 9.7 showsthat, of the three casks in ending inventory, two must be written down to market value. The caskpurchased in June must be written down by 10 (45 − 35) and the one purchased in April by 5(40 − 35). The total write-down at the end of x1 can be recorded as follows:
December x1Dr. Loss from inventory write-down (OE−) 15
Cr. Valuation allowance, inventories (CA+) 15
In a functional-based income statement the loss is usually absorbed in ‘Cost of goods sold’. If,however, it is material, it is reported separately as an exceptional loss.
As for the credit entry, the asset itself can be written down (i.e. Cr. Inventories) or, as in thejournal entry above, a contra-asset account can be established. When the goods are sold, boththe inventory and valuation allowance accounts are adjusted. For example, suppose Falstaff sellsthe three remaining casks for 42 each in x2. He will make the following entries:
x2Dr. Accounts receivable/Cash (A+) 126
Cr. Sales revenue (OE+) 126(3 casks at 42)
Dr. Cost of goods sold (OE−) 105Dr. Valuation allowance, inventories (CA−) 15
Cr. Inventories (A−) 120
Falstaff charges COGS for the carrying amount of the units sold (3 at 35) but reduces invent-ories by the original cost of those units (1 each at 35, 40, and 45).
One advantage of recording the valuation adjustment in a separate account is that the com-pany retains a record of the costs of its inventories. This is useful if the market value of written-down inventory recovers. In this event, the write-down is reversed to the extent of the recovery– but not above ‘cost’. The company increases the carrying amount of inventory (directly or byreducing the valuation allowance) and recognises the benefit in income (e.g. via lower COGS).If it takes the write-down to the inventory account directly, it may have difficulty determiningwhether a subsequent write-up breaches ‘cost’.
CHAPTER 9 • INVENTORIES 249
CFA_C09.qxd 11/7/03 2:11 PM Page 249

250 PART 2 • THE HOUSE OF ACCOUNTING
The LOCOM rule is in keeping with a long-standing practice in accounting: that currentassets should not be carried in the balance sheet above their fair value. Defenders of LOCOMclaim it is a control device since it puts bounds on management. By having to reveal unrealisedlosses, managers have less incentive to take risky actions to overturn the losses but which maymake them larger. Note that the rule is not applied restrictively. For example, if the market valueof materials falls below cost but that of the final product is not expected to do so (i.e. the man-ufacturer expects to recover the cost of materials), it is not required to write them down, so longas the quantities it holds are not abnormally high.
Nonetheless, the rule has its critics. They argue it is one-sided. Investors, they maintain, wantto know the fair value of inventory when it’s above cost as well as when it’s below. They wantinformation about unrealised holding gains as well as losses. A valuation method which providesthis information is the replacement cost method, the subject of the next section.
Inventories at replacement cost
We’ve already identified some of the weaknesses of historical cost methods of valuing inventory:they may misstate the cost of sales or of inventories (or both) and they open the door to manip-ulation of both numbers.
Valuing inventories at current value avoids the distortions of HC valuation. By chargingagainst revenues (which are by definition current) the current cost of the goods sold, like ismatched with like. The income number is then a more trustworthy indicator of corporate performance. By valuing inventories at their current worth, the balance sheet provides a morerealistic picture of the company’s assets. Stating inventories at current value is more costly thanusing an HC cost-flow assumption, however. At low rates of inflation, the higher costs of col-lecting and verifying current value data may outweigh the informational benefits to investorsand managers.
Although there are various methods of determining the current value of inventories, we dis-cuss only the replacement cost (RC) method in this chapter. It’s the only current value methodof valuing inventory which the EU permits. We show how HC accounts are adjusted to an RCbasis and how investors interpret RC data.
l Determining replacement cost of inventoryUnder the RC method, a company charges against revenues the replacement cost of the goodssold and values inventories in the balance sheet at their replacement cost. Replacement cost canbe determined in various ways. Suppliers’ price lists provide one source of information.Companies also employ external or internally developed index numbers to restate the historicalcosts of work-in-progress or finished goods inventories to current reproduction cost.
Falstaff uses information from his sherris-sack suppliers to determine the replacement cost ofcasks sold and in inventory. Let’s assume that, in the second half of x1, the RC per cask is 47.When the two casks are sold, the cost of the sales is recorded as 94. As a result, Falstaff reports abefore-tax gross profit of 56 on this product line in x1.
Sales revenue (2 casks × 75) 150Cost of goods sold, at RC (2 × 47) 94Gross profit, at RC 56
Assuming no change in RC, the three casks in ending inventory are also valued at 47 each or 141in total.
CFA_C09.qxd 11/7/03 2:11 PM Page 250

l Mechanics of RC accounting for inventories
How does a company like Falstaff incorporate RC valuations in its accounts? One way is torevalue inventory to RC at periodic intervals, for example monthly or at the time of each sale.For example, at the start of the second half of x1, Falstaff has five casks available for sale, at a totalhistorical cost of 180 (Exhibit 9.7). At the time the two casks are sold, he can revalue the fivecasks in inventory to their RC of 47 a cask. The carrying amount of inventory is now 235, result-ing in a surplus on revaluation of 55 (235 – 180). This amount is credited to a non-distributablereserve:
(1) Dr. Inventory, sherris-sack (A+) 55Cr. Revaluation reserve (OE+) 55
When the two casks are sold, Falstaff records the expense and the reduction in inventory at thecasks’ replacement cost (i.e. 2 units at 47).
(2) Dr. Cost of goods sold (OE−) 94Cr. Inventory, sherris-sack (A−) 94
This yields a post-sale balance in inventory of 141 (3 casks at 47), as can be seen in the inventoryledger account below.
Inventory, sherris-sack
Balance, 1/1/×1 60(2 casks at 30 each)
February purchase 35April purchase 40June purchase 45
(2) Cost of goods sold 94(1) Revaluation 55 (2 casks at 47 each)
(235(RC) – 180(HC))
Balance, 31/12/x1 141(3 casks at 47 each)
The excess of the RC cost of goods sold over the HC cost of goods sold represents the realisedholding gains on inventory. (An alternative term is (realised) inventory profits.) If the RC costof goods sold is less than HC cost of goods sold, the company realises a holding loss. Holdinggains or losses on items that remain in inventory are unrealised. According to 4th Directive rules,only inventory holding gains that have been realised are distributable.
Suppose Falstaff wants to distribute holding gains realised on the sale of the two casks in x1.Assuming the HC of the casks sold is 36 a cask (WAC assumption: see Exhibit 9.7), the realisedholding gains in x1 total 22 (2 casks × (47 − 36)). Falstaff can transfer this amount from non-distributable to distributable reserves:
(3) Dr. Revaluation reserve (OE−) 22Cr. Retained profits (OE+) 22
Note this transfer is unlikely to have any tax effect in practice. Countries that permit RC valu-ation of inventories calculate taxable income independently of book income.
CHAPTER 9 • INVENTORIES 251
CFA_C09.qxd 11/7/03 2:11 PM Page 251

After (optional) entry (3), there is a balance in Falstaff ’s revaluation reserve of 33. It repres-ents the unrealised holding gains on the three casks in ending inventory (3 casks × (47 − 36)).The movement in ‘Revaluation reserve’ is shown below. (We assume that the RC and HC of thecasks in beginning inventory are the same: hence the zero balance in revaluation reserve at1/1/x1.)
Revaluation reserve, inventory
Balance, 1/1/x1 0(1) Revaluation 55
(3) Realised holding gains 22
Balance, 31/12/x1 33
We show the effect of entries (1) to (3) on Falstaff ’s x1 accounts in balance sheet equation formin Exhibit 9.10.
Under HC accounting, realised holding gains and losses are automatically included in profit.In fact, they are incorporated in HC cost of goods sold. One advantage of gathering RC infor-mation on inventories is that, by separating ‘old’ from ‘new’ (i.e. current) costs, the magnitudeof realised inventory holding gains or losses in total HC profits is revealed. In Exhibit 9.11, theHC (WAC) gross profit of Falstaff ’s sherris-sack line in x1 is broken down into its current profitand holding gain components.
252 PART 2 • THE HOUSE OF ACCOUNTING
Net assets = Shareholders’ equityRevaluation Retained
Inventory Other reserve profits
Balance, 7/x1 (partial) 180 . . . 0 . . .
(1) Revaluation +55 = +55
Sales revenue +150 # +56(2) COGS −94 $ = (Gross profit)
(3) Realised holding gain 0 = −22 +22
Balance, end-x1 (partial) 141 . . . 33 . . .
Falstaff’s sherris-sack: effect on x1 accounts of accounting for inventory at RCExhibit 9.10
Sales revenue 150Less: Cost of sales at RC −94
Gross profit, at RC 56Plus: Realised holding gains +22
HC (WAC) gross profit before tax (Exhibit 9.8) 78
Falstaff’s sherris-sack: HC (WAC) income statement for x1 with disclosure ofrealised holding gains
Exhibit 9.11
CFA_C09.qxd 11/7/03 2:11 PM Page 252

CHAPTER 9 • INVENTORIES 253
In this case, over a quarter of Falstaff ’s x1 HC gross profits are attributable to savings in pur-chase costs from buying sherris-sack when prices were low. This information can be useful toinvestors (and Falstaff himself) when evaluating the performance of the company’s managers.
Valuation of inventories: rules and custom
l EU and IAS requirementsCompanies following IAS must measure inventories at the lower of cost or market. The 4thDirective imposes a similar requirement on EU companies. Under IAS, a cost-flow assumptionmust be used where items are not ordinarily interchangeable or set aside for specific projects.FIFO and WAC are the benchmark cost-flow assumptions; LIFO is an allowed alternative. The4th Directive allows the use of FIFO, WAC or LIFO wherever items to be valued are ‘fungible’:this includes certain financial investments as well as inventories. The Directive also gives mem-ber states the power to permit or require firms to value inventories at RC instead of HC. IAS aresilent on this issue: the applicable standard deals with inventories in an HC system only. As forthe ‘market’ term in LOCOM, we’ve already seen that IAS define this as net realisable value.Normally the LOCOM rule is applied on an item-by-item basis but the standard permits invent-ory items with similar purposes or end uses to be grouped when the test is carried out.
l Country and industry practiceMost companies value inventories at LOCOM. Japan is the exception: according to a 1990s sur-vey, only one-quarter of Japanese firms test inventories for impairment. FIFO and WAC are themost commonly used cost-flow assumptions, certainly in Europe.4 LIFO is popular in the USAthanks mainly to tax rules (see Box 9.1).
The IAS definition of ‘market’ in the LOCOM test, namely NRV, is widely observed.However, there are interesting national nuances. In the USA and some Asian countries, ‘market’is defined as replacement or reproduction cost, subject to upper and lower limits based on NRV.
Although ‘liberal’ EU countries such as the Netherlands and the UK allow inventories to bevalued at RC, few companies in these countries use this valuation basis now as EU inflation is solow. In countries with a history of high inflation, valuing inventories at RC is permitted underIAS rules – and may be required under national rules (e.g. in Mexico).
In addition to national differences in inventory valuation, there are specialised industry practices. Those in agriculture, mining and retailing are of long standing and are accepted byaccounting regulators.
l Agriculture and mining. Agricultural produce and mineral ores are usually valued at net real-isable value at the point of harvest or extraction. This applies not only when the produce hasbeen sold under a forward contract but more generally when there is an active commoditymarket and minimal risk of the produce or ore being unsaleable.
l Retailing. Retailers often value their inventories at expected sales value less normal gross mar-gin. (The gross margin deduction is adjusted if the sale price is marked down.) The ‘retailmethod’ is usually applied on a departmental basis because stock within a department tendsto have a similar shelf life and carry similar gross margin ratios.
Note that in all three industries, the valuation basis used is, in effect, market value adjusted foreither selling costs or gross margin. A recent international standard on agriculture extends theNRV basis of inventory valuation to ‘biological assets’, defined as living animals (e.g. cattle) orplants (e.g. orchards).5
CFA_C09.qxd 11/7/03 2:11 PM Page 253

The US LIFO puzzleBOX9.1
Valuing inventories on a LIFO basis is a minority practice worldwide. One reason is that theLIFO cost-flow assumption is not acceptable for tax purposes in many countries. An excep-tion is the USA. What makes US accounting unusual is that a company can only use LIFO fortax purposes if it uses the method in its published accounts. Inventory valuation is one of thefew areas in US accounting where tax and book treatment are not separated.
LIFO has been permitted for US tax purposes since the 1940s. In the low inflation 1950s and1960s few companies costed their inventories on the LIFO assumption. A sample of large firmsin 1970 revealed that only 25% used LIFO for any of their inventories and even fewer (10%)used it for more than 50% of them. LIFO’s popularity rose sharply in the 1970s as inflationsurged in the aftermath of the oil price shocks of 1973 and 1979. The chart below compares onan annual basis between 1969 and 2000 the percentage change in the US producer price indexwith the percentage of companies – from a sample of 600 large US firms – that use LIFO formore than 50% of their inventories.6
Note that the rate of LIFO usage remained high even after inflation fell in the 1980s and1990s. Once a firm has adopted LIFO, it usually has an incentive to continue using it. LIFOpostpones US firms’ tax liabilities: it doesn’t reduce them permanently. Switching back to FIFO(or WAC) carries a tax penalty since the postponed liabilities then become payable.
As we saw in the chapter, when prices rise (and inventories are growing), LIFO lowers incometax payments, resulting in higher after-tax cash flows and more wealth for shareholders. Why,then, didn’t more US firms switch to LIFO when inflation rose steeply in the 1970s? Variousexplanations have been advanced. First, tax benefits from switching may have been small ornon-existent because the firm’s input prices were declining, it had unused tax losses, or itsinventory levels fluctuated markedly thereby increasing the risk of liquidating old LIFO invent-ory layers. Second, LIFO bookkeeping costs are high and fixed: this places a proportionatelygreater burden on small companies and may have discouraged them from switching. Third,LIFO weakens key balance sheet ratios (lower reported inventories and retained earningsreduce the current ratio and lift the debt–equity ratio) so firms that were financially strainedavoided LIFO to reduce the risk of breaching debt covenants. Although US researchers findevidence to support all three hypotheses, they are unable to explain fully the reluctance of manyUS firms to embrace LIFO.7 Other factors – inertia, management’s fixation on reported earningsrather than cash flows – may also have played a part. The US LIFO puzzle remains unsolved.
CFA_C09.qxd 11/7/03 2:11 PM Page 254

CHAPTER 9 • INVENTORIES 255
Financial statement presentation and analysis
l General disclosures in annual accountsCompanies following IAS must break down their inventories by type – for example, raw mater-ials, supplies, work-in-progress, finished goods and merchandise. (The 4th Directive requiressimilar disclosures by larger EU companies.) This breakdown can be revealing. For example,firms with a long production cycle are likely to report high work-in-progress relative to sales.
IAS require firms to state how they measure inventories, including which cost-flow assump-tion they use. If a company values inventories at LIFO, it must disclose the difference betweenthis value and the LOCOM amount under FIFO or WAC. If a firm has preserved old costs ininventory and costs are rising, the LIFO value of its inventory may well be materially less thanthe LIFO or WAC value.
l Classification of costs by manufacturing companiesAs we saw in Chapter 6, companies usually classify costs either by function or by nature. Whatdoes this mean for manufacturing companies? In a functional income statement, manufacturingcosts are captured in the ‘Cost of goods sold’ figure. Non-manufacturing costs are broken downfurther – into, for example, sales, administration, research and development. Where costs areclassified by nature, they are shown by type of input, e.g. materials, labour, depreciation. Thesecosts are not assigned to functional areas. Thus ‘personnel costs’ in a natural income statementinclude both manufacturing and non-manufacturing labour costs incurred. Because of adjust-ments made for costs capitalised in inventories (and fixed assets), operating profit (and all subsequent profit figures) should be the same under the two bases of cost classification.
This last point is best demonstrated by an example. Flute, a musical instrument maker,reports the following inventory balances at the start and end of x4 (all amounts are in a000).
Start-x4 End-x4
Materials and supplies (M&S) 4 8Work-in-progress (WIP) 7 5Finished goods (FG) 6 14
Total 17 27
The company buys 33 of materials and supplies in the year and uses 24 in production and 5 insales and administration. It incurs 31 of payroll costs, 12 on production and 19 on sales andadministration. Depreciation and other overheads amount to 25, of which 14 relate to productionand 11 to sales and administration. The company sells instruments for 100 in x4. Exhibit 9.12shows the flow of costs through Flute’s ledger accounts and the presentation of the company’soperating results for x4 under both expense classification approaches.
Under the natural basis, a company reports all operating costs it incurs in a period on the faceof its income statement. This is in contrast to the functional basis, where production costs(COGS) are matched against revenues on a product rather than on a time basis. But the basis ofexpense classification does not change the method of costing. A firm classifying costs by naturestill capitalises the production costs of incomplete and unsold goods in WIP and FG inventories.To avoid miscounting these production costs, it includes in its income statement an adjustmentfor the change in the book values of WIP and FG inventories over the period. If the book valuesof such inventories increase, the increase is subtracted from operating costs incurred; if they decrease,the decrease is added to operating costs. In Flute’s case, WIP and FG inventories amount to 13 atthe start of x4 (7 + 6) and 19 at the end (5 + 14), a net increase of 6. Therefore, production of
CFA_C09.qxd 11/7/03 2:11 PM Page 255

256 PART 2 • THE HOUSE OF ACCOUNTING
Cla
ssify
ing
a m
anuf
actu
ring
com
pany
’s c
osts
by
natu
re o
r by
func
tion
: ill
ustr
atio
nEx
hibi
t 9.1
2
CFA_C09.qxd 11/7/03 2:11 PM Page 256

instruments exceeds sales by 6 in x4. To match costs with revenues, Flute deducts the net increasein WIP and FG inventories from total operating costs of 85 and the resulting figure, 79, is theamount of total operating expenses in x4.
Firms sometimes link the change in inventories to revenues rather than costs. They describethe adjusted figure as ‘output’ or ‘operating performance’. Exhibit 9.13 shows the 2001 con-solidated income statement of the Bosch Group, a large (and privately owned) German autocomponents supplier. Bosch reports total operating performance of a34,200 million in 2001.Operating performance is equal to sales plus the increase (less the decrease) in WIP and FGinventories plus other capitalised costs. This number is hard to interpret since sales are recordedat market prices while inventories, and changes in them, are recorded at cost.
Note that Bosch’s operating performance figure includes not only the change in inventoriesbut also ‘other capitalized costs’. A note to the consolidated accounts, summarised below, givesmore details of both items:
(million euro) 2001 2000Change in finished goods and work-in-progress inventories −164 161Other capitalized costs 335 208
171 369
What are ‘Other capitalized costs’? Bosch constructs new plant and equipment each year for itsown use. It incurs costs – of materials, labour (including management time) and overheads –which total a335 million in 2001. These costs do not belong on the income statement – they donot relate to goods sold in the period – and hence they are transferred to fixed asset accounts.
CHAPTER 9 • INVENTORIES 257
Bosch GroupCONSOLIDATED STATEMENT OF INCOME FOR 2001
(million euro) 2001 2000
Sales 34,029 31,556Changes in finished goods and work-in-progress
inventories and other capitalized costs 171 369
Total operating performance 34,200 31,925Other operating income 2,195 2,046Cost of materials −16,284 −15,428Personnel costs −9,959 −8,950Depreciation and amortization of intangible and
tangible fixed assets −2,502 −2,250Other operating expenses −6,419 −6,078Net income from investments 155 83Amortization of financial investments and securities
included with current assets −101 −72Interest income, net of expenses 126 138
Income from ordinary business activities 1,411 1,414Taxes on income −761 −34
Net income for the year 650 1,380
(Source: Bosch Group, Annual Report and Accounts 2001. Robert Bosch GmbH.)
Exhibit 9.13
CFA_C09.qxd 11/7/03 2:11 PM Page 257

The alternative way of presenting the natural income statement makes clearer the transfer byBosch of costs to fixed asset accounts (and from inventory) in 2001:
B millionSales 34,029Less:Operating costs* 35,164– Changes in FG/WIP inventories and other capitalized costs −171
−34,993Other operating income 2,195
Operating profit 1,231Net income from investments 155
...Income from ordinary business activities (before tax) 1,411...
* Comprising costs of materials and personnel, depreciation and other operating expenses.
l Expense classification: EU and US companiesClassifying expenses by nature is a common practice among EU companies. However, the func-tional basis is increasingly popular among larger international firms. US companies, on the otherhand, classify expenses only by function. Historical differences in the use of, and audience for,corporate accounts are largely responsible. In many EU member states, the tax authorities, gov-ernment statisticians and other official agencies – historically, the dominant external users ofaccounts in these countries – have long insisted that companies classify expenses by nature. Andsome still do (e.g. Italy, Spain). By contrast, the US Securities and Exchange Commissionrequires listed companies to provide a breakdown of expenses by function, on the grounds thatinvestors – the key external users of accounts in the USA – find income statements prepared onthis basis easier to understand.
IAS permit either method of expense classification. However, if a firm classifies expenses byfunction, it must disclose the amounts of staff costs and depreciation and amortisation expensein the period. The IASB claims investors find this information useful when predicting a firm’sfuture cash flows.
l Financial statement analysisInvestors monitor inventories to gauge both general economic trends – traditionally an economicdownturn is accompanied by a rise in inventory levels relative to output – and the efficiency withwhich individual companies use this asset.
The principal inventory-specific ratio they employ is the inventory turnover rate or stock turn.This ratio is similar in form to other asset turnover ratios. It is normally computed by dividingannual sales revenue (or cost of goods sold) by the average level of inventories held during theyear.8 In the absence of more detailed information, the average holding is usually estimated by tak-ing the simple average of start- and end-year inventories:9
Inventory turnover rate ==
As the name implies, the ratio shows how many times in a year the company turns over its invent-ories. The rate of turnover of inventory differs across industries – it’s clearly much faster for afood retailer than a manufacturer of process plant – but changes in the ratio are often morerevealing than its level. A drop in the turnover rate often accompanies a fall in sales (or even adecline in their rate of growth), as production fails to adjust quickly to lower demand. A rise in
Sales revenue (or Cost of goods sold) in year
Average inventories in year
258 PART 2 • THE HOUSE OF ACCOUNTING
CFA_C09.qxd 11/7/03 2:11 PM Page 258

CHAPTER 9 • INVENTORIES 259
the ratio may signal a revival of demand. It’s for this reason that economists monitor sectoralinventory-to-sales ratios when preparing economic forecasts.
Note that at the individual company level a change in the ratio can arise for one of severalother reasons. Deliberate overstatement of ending inventories by management in order to boostreported profits causes the turnover rate to fall. But so too does a build-up in inventories inadvance of expected sales growth. Recent changes in inventory management have disturbed his-torical relationships between inventories and sales. For example, introduction of just-in-timemethods in purchasing and production have raised turnover rates to a higher level. Thusinvestors need to look behind the ratio, at the changes in underlying inventories and sales, tounderstand the reasons for changes in it.
How inventories are measured can affect all ratios and comparisons made from them.Consider the case of manufacturing firms in the same industry when prices of inputs are rising(and inventory levels are constant or rising). Those firms using the FIFO cost-flow assumptionor valuing inventories at RC will report stronger balance sheet ratios (higher current ratio, lowerdebt ratios) than their rivals using LIFO. Firms using FIFO (but not firms using RC) will alsoenjoy higher reported margins. Thus it’s wise to check firms’ accounting policies on inventoriesbefore comparing their financial performance and strength. We’ve noted already that thoseusing LIFO must disclose the FIFO cost (strictly, the current cost) of their ending inventories.Likewise, firms valuing inventories at RC are expected to provide HC-based numbers as well.
Summary
Two questions dominate our discussion of inventories. The first is: which costs do companies treatas part of the cost of inventory? The second is: how do firms value their inventory?
Firms are required to capitalise all costs they incur to bring the inventory to its ‘present loca-tion and condition’. For manufacturing companies, this means that production costs – the costsof materials, labour and usually all overheads related to a product’s manufacture – are capitalisedas part of the cost of inventory. This method of costing is known as absorption costing. Underthe alternative method, variable costing, only variable manufacturing costs are capitalised. Inboth cases, certain production costs are not charged to the income statement as they’re incurred.They are stored in inventory accounts (first, work-in-progress, then finished goods) andexpensed only when the products to which they attach are sold.
Most firms value their inventories at the actual (historical) cost of purchase or production.Since actual costs change over time, firms usually assume costs flow through inventory in a par-ticular pattern: on a first-in, first-out (FIFO); last-in, first-out (LIFO); or weighted average(WAC) basis. In periods of rising prices (and constant or rising inventory levels), reportedprofits are higher under FIFO than under WAC or LIFO because a higher proportion of older,lower costs are captured in the cost of sales. After-tax cash flows are lower under FIFO, if thesame cost-flow assumption is used for tax and book purposes. Whichever flow of costs isassumed, firms sailing under the HC flag usually observe the LOCOM rule: they write downinventories to their net realisable value when the latter falls below cost.
Some firms value inventories at replacement cost. Others disclose the replacement cost ofgoods sold. Disclosing the current cost of goods sold and in inventory allows investors to separ-ate the gains or losses a firm makes from holding goods, both realised and unrealised, from theincome earned from producing and trading them. Under LOCOM, only unrealised holdinglosses are reported.
Investors calculate the inventory turnover rate to monitor the efficiency with which a firmmanages its inventories. This and other financial ratios are sensitive to the method(s) the firmuses to value them. Interfirm comparisons are also made more difficult by the alternativeapproaches – natural and functional – to expense classification.
CFA_C09.qxd 11/7/03 2:11 PM Page 259

260 PART 2 • THE HOUSE OF ACCOUNTING
APPENDIX
9.1 Variable costing
As mentioned in the chapter, manufacturing companies in some European countries establishthe costs of work-in-progress and finished goods using variable costing rather than absorptioncosting. Under variable costing (VC), only production costs which vary in proportion to output arecapitalised and included in the cost of inventory. Fixed production costs are expensed in the periodthey’re incurred rather than allocated to products as occurs under absorption costing (AC).10
We can use our Gretel example to show how VC works and to contrast its impact on theaccounts with that of AC. Recall that in year 5 Gretel produces more witchits than she sells. Shestarts manufacture of 8,000, completes 7,000, and sells 6,000 units. Per-unit material and labourcosts are a5 and a2 respectively. We assume the production overheads of a30,000 are fixed butunder AC these are allocated to witchits at the rate of a4 per finished unit. Exhibit 9.14 showsthe calculation of Gretel’s year 5 profit (at the production stage) under VC and AC.
FactsDuring year 5 Gretel starts manufacture of 8,000 witchits, completes 7,000 and sells 6,000.There are no WIP or FG inventories at the start of year 5. The witchit sale price is A16 and theproduction costs are:
l materials (M) A5/unitl labour (L) A2/unitl (fixed) overhead (O) A30,000 in total
Gretel Company(Partial) income statement for year 5 (in A000)
Variable costing Absorption costingSales (6,000 × A16) 96 Sales 96
Start WIP and FG inventory 0 Start WIP and FG inventory 0Variable production Total production costs incurred: costs incurred:M + L (Exhibit 9.5) +55 M + L + O (Exhibit 9.5) +85– End WIP/FG inventory −13 – End WIP/FG inventory −19Variable COGS −42 COGS −66Fixed production costs −30Profit (at production stage) 24 Gross profit 30
Cost of ending inventory
Variable costing Absorption costingM L M L O
WIP: 1,000 × (5 + 1*) 6 WIP: 1,000 × (5 + 1* + 2*) 8FG: 1,000 × (5 + 2) 7 FG: 1,000 × (5 + 2 + 4) 11
Total 13 Total 19
* WIP is half complete with respect to labour and overhead.
Variable and absorption costing contrasted: production exceeds salesExhibit 9.14
CFA_C09.qxd 11/7/03 2:11 PM Page 260

Gretel reports profit of a30,000 under AC but only a24,000 under VC. Why the a6,000 dif-ference? The reason is simple. Under VC, all fixed production costs of year 5 (a30,000) areexpensed in the year. Under AC, a6,000 of these costs are capitalised in inventories. They are theoverheads assigned to the 1,000 units still in progress (note that WIPAC is a2,000 greater thanWIPVC) and to the 1,000 units completed but not sold (FGAC is a4,000 greater than FGVC).Because Gretel produces more witchits than she sells in year 5, overhead costs of b6,000 get capturedin ending WIP and FG inventories and escape the income statement that year. As a result, its year5 profits – and its ending WIP and FG inventories – are a6,000 greater under AC.
Suppose in year 6 Gretel sells more witchits than she produces. She completes the 1,000 unitsin WIP, starts and completes 6,000, and sells these 7,000 and the 1,000 in FG inventory. Thewitchit’s sale price and production costs are assumed to be the same as in year 5. Exhibit 9.15shows the calculation of Gretel’s year 6 profit (at the production stage) under VC and AC.
In year 6, when sales exceed production, Gretel reports profits of a42,000 under VC, a6,000higher than under AC. The reason is that, under AC, fixed production costs of that amountwhich were inventoried in year 5 are expensed in year 6 when Gretel sells the witchits to whichthey are attached.
CHAPTER 9 • INVENTORIES 261
FactsGretel produces and sells witchits in year 6 as follows:
WIP FG TotalBeginning inventory (units) 1,000 1,000 2,000Production 6,000Sales 8,000Ending inventory 0 0 0
The witchit sale price and production costs are the same as in year 5 (see Exhibit 9.14).
Gretel Company(Partial) income statement for year 6 (in A000)
Variable costing Absorption costingSales (8,000 × A16) 128 Sales 128
Start WIP/FG inventory Start WIP/FG inventory (Exhibit 9.14) 13 (Exhibit 9.14) 19Variable production Total productioncosts incurred 431 costs incurred 732
– End WIP/FG inventory 0 – End WIP/FG inventory 0Variable COGS −56 COGS −92Fixed production costs −30
Profit (at production stage) 42 Gross profit 36
Notes: Production costs incurred in year 6Materials 6,000 units × A5 30Labour 1,000 units in WIP × A1 #
6,000 units × A2 $ 131. Variable production costs incurred 43
Overheads (fixed production costs) 302. Total production costs incurred 73
Variable and absorption costing contrasted: sales exceed productionExhibit 9.15
CFA_C09.qxd 11/7/03 2:11 PM Page 261

262 PART 2 • THE HOUSE OF ACCOUNTING
We can generalise from this example. Profits reported under VC are a function of the level ofsales; they are not influenced by the level of production. Thus the increase in profits of a18,000between years 5 and 6 under VC – from a24,000 to a42,000 – is the result of Gretel selling 2,000more witchits at a contribution of a9 a unit. (Contribution is defined as sale price (in this case,a16) less unit variable cost (material and labour, totalling a7).)
Profits reported under AC are a function of both the production rate and sales. A company withstable sales can increase its profits under AC by raising its production rate. By so doing, it divertspart of the year’s fixed production costs from the income statement (COGS) to the balance sheet(WIP and FG inventory). (Of course, this is not a viable long-term strategy. The company mustfinance the extra production and will incur higher inventory carrying costs.)
The main advantage of VC over AC is the clearer signal it sends the reader of financial statements about the source of change in a company’s profits. Without the detailed informationwe had access to in Gretel’s case, it is hard to disentangle the effects of production and sales oncorporate profits. However, VC suffers as a costing method. It yields unit values for inventoryitems which, in most cases, are severely understated because they include only variable produc-tion costs. It is largely for this reason that many regulatory agencies forbid its use in publishedaccounts.
l Variable costing and financial statement analysis
Although absorption costing is the method of costing used by most manufacturing firms worldwide (and is required under international accounting standards), its use is not universal.Some EU companies continue to favour VC (it is permitted under the 4th Directive) and, until recently, it was popular with Scandinavian firms. Many firms use VC in their internalaccounts.
Some investors try to adjust the financial statements of firms using VC to an AC basis. This is not an easy task. To do it, they must estimate the proportion of fixed costs in the company’sproduction cost structure. Note that in most cases the adjustment will have a greater impact on the balance sheet than the income statement. For a company experiencing little change in itsinventory levels (i.e. sales and production are roughly in balance), VC profits approximate ACprofits. However, even in this case, inventories (and retained profits) under VC are understated,relative to those under AC, because the company has expensed fixed production costs earlier.
Problem assignments
P9.1 Manufacturer’s income statement: alternative expense classificationNarcissus makes mirrors. N asks for your help in preparing an income statement for the third quarterof x2, using the information below. The company is short-staffed and N is preoccupied with qualityinspection.
Quarter 3, x2In B000 Start End
Raw materials 13 9Work-in-progress 22 15Finished mirrors 21 34
CFA_C09.qxd 11/7/03 2:11 PM Page 262

During quarter 3, x2Production Sales and admin.department departments
Materials purchased 50 –Supplies purchased and used – 2Salaries and employee benefits 46 28Depreciation 23 11Utilities and other overheads 8 4
The company sells 25,000 mirrors at a unit price of A8. The corporate income tax rate is 30%.
Required
(a) Calculate Narcissus Company’s gross profit for quarter 3, x2.
(b) Draw up an income statement for Narcissus Company for the third quarter of x2. Assume thecompany classifies expenses:(i) by function; and(ii) by nature.
Check figure:Cost of goods sold A125,000
P9.2 Costs of sales and inventory under absorption costing‘I don’t know whether this product line is profitable or not. We’re selling the Bauhaus line of bus pas-senger shelters for A900 each but our accounting records don’t tell us what the unit cost is. Can youwork this out for us?’
UrbanFurniture Company is a small firm that specialises in the fabrication and assembly of ‘streetfurniture’ (shelters, kiosks, pavilions, seats) and playground equipment. Amparo, the manager incharge of the street furniture division, asks you to determine the unit cost of the Bauhaus line of shelter (see below) and the costs of shelters installed in x5 and being made at year-end.
CHAPTER 9 • INVENTORIES 263
She gives you the following information about the Bauhaus bus passenger shelter. The product linewas introduced during x5. Sales have been brisk, due in part to the growth in bus usage as a resultof the deregulation of scheduled bus services in the country. Forty units were fabricated and installedin the year and work had been started on a further six units. Amparo estimates that the units inprogress at year-end are, on average, two-thirds complete with respect to materials and one-halfcomplete with respect to fabrication labour and overhead. There are no shelters finished and await-ing installation at year-end.
According to UrbanFurniture’s records, the company purchased materials (sheet and tubular steel,acrylic panels, plastic seating, lighting) for this new product line at a cost of A12,800 in x5. The recordsalso show that the cost of materials is A275 per shelter. To fabricate each shelter requires 20 hours
CFA_C09.qxd 11/7/03 2:11 PM Page 263

of labour and the average hourly labour cost is A12. Fabrication overheads (such as depreciation andutilities) on this product line totalled A3,870 in x5. As for the costs of installing the 40 units (i.e. trans-port, site preparation, and assembly of shelters), these amounted to A2,880 for labour and A2,520 foroverhead.
Required
Calculate the costs of the Bauhaus shelters installed in x5 and of the inventory – both materials andwork-in-progress – with respect to these shelters at end-x5. What is the gross profit margin ratio onthe Bauhaus line in x5?
P9.3 Production costs and income statement presentationPirelli SpA is a large Italian tyre and cable manufacturer. Exhibit 9.16 shows part of the company’s2001 consolidated income statement (in the English-language version).
264 PART 2 • THE HOUSE OF ACCOUNTING
Pirelli SpAConsolidated 2001 income statement (extract)
(amounts in A million)
2001(A) Production value
Revenues from sales and services 7,509,220Changes in inventories of work-in-process, semi-finished and
finished products (99,559)Changes in contract work-in-progress (37,988)Increase in property, plant and equipment 16,313Other revenues and income:
(a) Miscellaneous 193,770(b) Government grants 7,516
Total production value 7,589,272
(B) Production costsRaw materials, supplies and goods for resale (3,822,787)Service expenses (1,181,035)Lease and rent expenses (80,077)Personnel (1,501,738)Amortization, depreciation and write-downs:(a) Amortization of intangible assets (46,571)(b) Depreciation of property, plant and equipment (324,062)(d) Write-downs of receivables included in current assets and
cash and banks (77,174)Changes in inventories of raw materials, supplies and goods for resale (6,511)Other accruals (30,521)Other operating expenses (223,881)
Total production costs (7,294,357)
Difference between production value and production costs 294,915. .. .. .
(Source: Pirelli SpA, Annual Report and Accounts 2001.)
Exhibit 9.16
CFA_C09.qxd 11/7/03 2:11 PM Page 264

Required
(a) Did the group’s inventories of work in process, semifinished and finished products increase ordecrease in 2001? By how much?
(b) What is the meaning of ‘Raw materials, supplies and goods for resale’ under ‘Production costs’?Is it the cost of purchases? Or is it the cost of items consumed and sold? Give evidence for youranswer.
(c) Under ‘Production value’, Pirelli shows the item ‘Increase in property, plant and equipment’. What is this? What would happen to profit (before tax) in 2001 if this item were not in the incomestatement?
(d) Pirelli describes a line item as ‘Difference between production value and production costs’. Whatis the more usual name for this?
P9.4 Sensitivity of income to production levels under absorption costing*Hansel has devised a more advanced (wicked?) witchit, to be known as a ‘widget’. His company plansproduction of this product for the coming year (year 1). Sales are expected to be 20,000 units at aprice of 20/unit. Material and labour costs are production-related and variable: combined, they’reforecast to be 10/unit. Production overhead costs are all fixed and are estimated at 100,000 in total.There are no widget-related inventories at the start of year 1. All units started will be completed in theyear. The company continues to use absorption costing when costing products.
Required
(a) Hansel asks you to calculate expected gross profit on the new widget line if:(i) production is set equal to sales of 20,000 units; and(ii) production is set at 25,000 units, 5,000 higher than sales.
(b) Why is expected gross profit under (a) (ii) greater than expected gross profit under (a)(i)? Is thecompany better off by producing more units than it expects to sell?
(c) Hansel looks ahead to year 2. Suppose production strategy (a) (ii) is followed in year 1 (i.e. pro-duction of 25,000 widgets exceeds sales by 5,000 units) but in year 2, sales show no growth (theyremain at 20,000 units) so production is cut to 15,000 units to clear stocks. There’s no change insale price, unit costs or total production overhead.
Calculate the widget line’s expected gross profit in year 2. Why is it different from the expectedgross profit figures you calculated under (a) (i) and (a) (ii)?
Check figures:(a) (ii) Expected gross profit 120,000(c) Expected gross profit in year 2 80,000
* Problem assignment draws on material in the appendix to this chapter.
P9.5 Costs of sales and inventory under alternative cost-flow assumptionsNaiad distributes equipment for yachts and small boats. It decides to stock the EauK, a new type ofdesalinator that uses the boat’s own motion through the sea to operate the device. The following tableshows the company’s purchases of EauK units in the second quarter of x4.
April 5 at A2,340 eachMay 5 at A2,100June 6 at A2,050
Naiad sells 12 EauK units in this quarter. It calculates the cost of sales on a periodic basis at the endof the quarter.
CHAPTER 9 • INVENTORIES 265
CFA_C09.qxd 11/7/03 2:11 PM Page 265

Required
(a) Compute the costs of second quarter sales and of units in inventory at end-June x4, under FIFO,WAC and LIFO cost-flow assumptions.
(b) Assume the company uses the WAC cost-flow assumption. A consultant urges Naiad to purchaseadditional units of the desalinator before the end of the second quarter. He argues that the extrapurchases will reduce the risk of stock-outs in the busy third quarter and, in addition, will increasesecond quarter profits.
Recalculate WAC cost of sales in the second quarter, assuming the company buys an extrafour units of EauK in late June at a unit price of A2,050 (making purchases of 10 units in themonth). Why is cost of sales lower than under the WAC case in (a)? Is the company better off purchasing the additional four units at end-quarter 2?
Check figure:(b) Unit average cost A2,135
P9.6 Effect of cost-flow assumptions on income and taxThe Svejk Company is a wholesaler of beer tankards. The table below shows the company’s pur-chases and sales of its (1 litre) Pilsener Special tankard.
BalancePurchases Sales in inventory
31/12/x5 500 at 4/tankardDuring x6:February 300 at 5April 600 at 7July 700 at 5.5August 800 at 7.5October 500 at 6
Total 1,500 1,400
31/12/x6 600 at ?
Required
(a) Calculate the x6 gross profit and end-x6 inventory for this product line under FIFO, LIFO and WACcost-flow assumptions. Assume the company uses a perpetual system to keep track of inventoryquantities and values. Compare the results. Which method yields the highest gross profit andwhy?
(b) Assume all three methods are permitted for tax purposes. Would Svejk’s income tax liability for x6be greater or less if it used LIFO rather than FIFO – and by how much? Assume a 40% tax rate.
(c) On investigating Svejk’s accounting systems, you discover that it uses a perpetual inventory system to keep track of inventory quantities but uses a periodic system to establish the costs of tankards sold during the year. (Under the periodic system, COGS is calculated at year-end:thus purchases made (and other costs incurred) after the last sale date are included in the COGScalculation.)
Recalculate the x6 gross profit for the Pilsener Special product line under FIFO, LIFO and WACcost-flow assumptions. Compare the resulting gross profit figures with those you calculated in (a).Why does gross profit differ between (a) and (c) under LIFO and WAC? Under what circumstanceswould you expect a company to choose the system outlined in (c)?
Check figures:(a) WAC gross profit 3,375(c) LIFO gross profit 2,350
266 PART 2 • THE HOUSE OF ACCOUNTING
CFA_C09.qxd 11/7/03 2:11 PM Page 266

P9.7 Effect of LOCOM rule on incomeRefer to P9.6. As a result of European Commission health warnings, demand for large beer tankardsfalls sharply. Svejk estimates their net realisable value (that is, sale price, net of selling costs) is 5/unitin December x6.
Required
(a) What is the effect of the above events on Svejk’s x6 gross profit if the company values inventory(i) at FIFO cost; (ii) at the lower of FIFO cost or market?
(b) Svejk sells the remaining tankards in x7 for 6/unit. It makes no further purchases in x7. What is thegross profit it reports on this product line in x7 under (i) FIFO cost; (ii) LOCOM? Looking at Svejk’sx6 and x7 results under the two valuation assumptions, what conclusions can we draw about theimpact of the LOCOM rule on company accounts?
P9.8 Valuing inventory at replacement costRefer to P9.6. Svejk is considering whether to change the basis of valuation of its inventory from his-torical cost to replacement cost (RC). Assume that, at the time of the April x6 sale, the tankard’s RCis 5; at the time of the August sale, it’s 5.5; and at year-end, it has risen again to 6.5.
Required
(a) Calculate the x6 gross profit for the Pilsener Special tankard on an RC basis. What is the effecton Svejk Company’s end-x6 balance sheet of valuing its tankard inventory at RC rather than atFIFO HC?
(b) Determine the holding gains which Svejk realised in x6 as a result of purchasing tankards whenthe price was low. Assume that in determining the historical cost of inventory sold, Svejk assumesa FIFO flow of costs.
Check figure:(a) RC cost of sales 7,400
P9.9 RC information in HC accountsBP Amoco, a large Anglo-American oil company, is the result of a merger between BP and Amocothat took effect at the end of 1998. Financial statements for 1997 and prior years were restated as ifthe two companies had been united then. In 2000, the group acquired ARCO, a US oil company. Thiswas accounted for as an acquisition and prior years’ accounts were not restated.
BP Amoco provides replacement cost information in its historical cost accounts. Exhibit 9.17 contains summary income statement and operating data that have been taken from the notes to thecompany’s 2001 consolidated accounts.
Required
(a) What can we learn about BP Amoco’s operations between 1997 and 2001 from the stock hold-ing gains and losses it reports in those years?
(b) BP Amoco is not the only major oil company to publish RC data in its accounts. Oil companiesare not required to do so by law or accounting standards. Why do you think they voluntarily pro-vide this information?
CHAPTER 9 • INVENTORIES 267
CFA_C09.qxd 11/7/03 2:11 PM Page 267

P9.10 Converting LIFO-based accounts to a FIFO basisGeneral Motors (GM) is the largest vehicle producer in North America. It is also a leading provider offinancial services. Set out below are key numbers from its 2001 accounts relating to its industrialactivities (‘Automotive, communications services, and other operations’). Amounts are in US$ million.
2001 2000
Net sales 151,491 160,627Gross profit 15,871 22,324
End-2001 End-2000
Current assets 37,063 41,147(of which: Inventories 10,034 10,945)Total assets 323,969 303,100
Current liabilities 56,346 55,740Total liabilities 126,171 116,704
268 PART 2 • THE HOUSE OF ACCOUNTING
BP Amoco plcGroup income statement and operating data for calendar years 1997–2001
1997 1998 1999 2000 2001
Income statement (condensed) (in $m)
Group turnover 91,760 68,304 83,566 148,062 174,218
Replacement cost operating profit 10,683 6,521 8,894 17,756 16,135Exceptional items 128 850 (2,280) 220 535
RC profit before interest and tax 10,811 7,371 6,614 17,976 16,670Stockholding gains (losses) (939) (1,391) 1,728 728 (1,900)
HC profit before interest and tax 9,872 5,980 8,342 18,704 14,770Interest expense 1,035 1,177 1,316 1,770 1,670
Profit before taxation 8,837 4,803 7,026 16,934 13,100Taxation 3,013 1,520 1,880 4,972 5,017
Profit after taxation 5,824 3,283 5,146 11,962 8,083Minority shareholders’ interest 151 63 138 92 73
Profit for the year 5,673 3,220 5,008 11,870 8,010
Operating dataCrude oil and liquids production (000 bbl/day) 1,930 2,049 2,061 1,928 1,931Natural gas production (m ft3/day) 5,858 5,808 6,067 7,609 8,632Total production (000 boe*/day) 2,940 3,050 3,107 3,240 3,419
* boe = barrel (bbl) of oil equivalent
Average realisations 1996BP crude oil and liquids price ($/bbl) 19.5 18.3 12.1 16.7 26.6 22.5Henry Hub gas price ($/000 ft3) 2.6 2.6 2.2 2.3 3.9 4.3
(Source: BP Amoco, Annual Report and Accounts 2001. Reproduced by permission of BP plc.)
Exhibit 9.17
CFA_C09.qxd 11/7/03 2:11 PM Page 268

CHAPTER 9 • INVENTORIES 269
General Motors CorporationExtract from 2001 accounts
Note 6 Inventories
Inventories included the following for Automotive, Communications Services, and OtherOperations (dollars in millions):
December 31 2001 2000
Productive material, work in process, and supplies $ 5,069 $ 5,544Finished product, service parts, etc 6,779 7,257
Total inventories at FIFO 11,848 12,801Less: LIFO allowance 1,814 1,856
Total inventories (less allowances) $10,034 $10,945
Inventories are stated generally at cost, which is not in excess of market. The cost ofapproximately 90% of U.S. inventories is determined by the last-in, first-out (LIFO) method.Generally, the cost of all other inventories is determined by either the first-in, first-out (FIFO) oraverage cost methods.
(Source: General Motors Corporation, Annual Report and Accounts 2001. Reproduced by permission of General MotorsCorporation.)
Exhibit 9.18
You wish to compare GM’s financial performance with that of other major car producers. You dis-cover that although car companies value inventories in different ways, most provide FIFO informationin the notes to the accounts. You decide therefore to convert key GM numbers to a FIFO basis.Exhibit 9.18 contains the note on inventories taken from GM’s 2001 accounts.
Required
(a) Calculate GM’s inventory turnover rate (cost of sales/average inventories), current ratio and grossprofit margin ratio in 2001, using the unadjusted numbers in GM’s accounts.
(b) Adjust GM’s inventory and gross profit figures to a FIFO basis, using the information in Exhibit9.18. Recalculate the ratios in (a). Contrast the unadjusted and adjusted ratios. Why is inventoryturnover lower but the gross profit margin ratio barely changed under the FIFO basis?
Notes to Chapter 9
1 International Accounting Standards Board, IAS 2: Inventories, para. 7.2 IAS 2, op. cit. Under international rules, borrowing costs can be treated as a production overhead and
capitalised, subject to two conditions. First, production of the good or service requires a substantialperiod of time (examples are the ageing of whisky and the construction of property for sale). Second,the company’s borrowing costs are lower if production doesn’t take place (IAS 23: Borrowing Costs).
3 In practice, companies collect costs such as depreciation and wages in a temporary account (e.g.Depreciation, Payroll) and then distribute them to production (WIP inventory) and non-productiondepartments (Selling expense, Administrative expense).
4 Fédération des Experts Comptables Européens (1993), 1992 FEE Analysis of European Accounting andDisclosure Practices, London: Routledge, chapter 6.
5 International Accounting Standards Board, IAS 41: Agriculture. The standard uses the phrase ‘fairvalue less estimated point-of-sale costs’ instead of ‘net realisable value’.
CFA_C09.qxd 11/7/03 2:11 PM Page 269

6 American Institute of Certified Public Accountants (1970–2001), Accounting Trends and Techniques,24th–55th editions, New York: AICPA. The sample of 600 large quoted US firms – and the industrycomposition of the sample – changes over time as firms drop out owing to mergers, takeovers andbankruptcy, and are replaced by others of comparable size but, in many cases, from a different sector.
7 Cushing, B.E. and LeClere, M.J. (1992), Evidence on the determinants of inventory accounting policychoice, The Accounting Review, 67: 355–366.
8 Using cost of goods sold in the numerator is preferred since both numerator and denominator (aver-age inventories) are then stated on the same basis: cost. If a company classifies expenses by nature,however, the COGS figure may not be available and sales revenue must be used.
9 Using start- and end-year figures may overstate inventory turnover if a company chooses its financialyear-end at a time when its inventories are low (e.g. at the end of its major selling season).
10 Variable costing is also known as ‘direct costing’. Direct costs are those which can be traced directly toproducts. Each of Gretel’s witchits, for example, requires a specific quantity of steel and a specificamount of labour time in its manufacture: the costs of the steel and the production labour are directcosts of the witchit. (Costs which cannot be traced in this way and which must be assigned to productsby means of an allocation mechanism – examples are depreciation, repairs, insurance, supervisorylabour – are ‘indirect’ costs.) At one time, direct production costs were all variable. Nowadays, the pro-duction labour costs of many firms do not vary in direct proportion to output. Nonetheless, the syn-onym lives on.
270 PART 2 • THE HOUSE OF ACCOUNTING
CFA_C09.qxd 11/7/03 2:11 PM Page 270

Recognition of revenue andvaluation of receivables
INTRODUCTIONSales and receivables are linked. When a company sells goods or services onaccount and recognises revenue, its receivables increase. In this chapter, wereturn to the issue of revenue recognition we first discussed in Chapter 5 and,in addition, we look at how receivables are valued in the balance sheet.
Revenues are gross inflows of economic benefits. Most companies reckonthey can be sure of these benefits and can measure them reliably only whenthey deliver goods to customers or perform services for them. As a result, thisis the point in the operating cycle when most companies recognise revenue.But some manufacturing and construction companies recognise revenuebefore delivery – and some, more rarely, after. And service companies oftenhave problems in practice determining when services have been performed.We begin section 1 of the chapter by exploring these issues and showing theimpact of alternative recognition dates on a company’s accounts.
Trade receivables arise because companies extend credit to customers. Acompany faces problems measuring its receivable asset. Receivables are valuedinitially at cost. But what is a receivable’s cost when the invoice amountincludes taxes and the company offers discounts? Subsequently, the amount atwhich the company carries a receivable on its books should be reduced if itexceeds realisable value, that is the amount the company expects to collect incash from the customer. How do companies estimate realisable value in thiscase? We consider in the remainder of section 1 the effects of value added tax,cash discounts, bad debts and sales returns on the valuation of receivables.
We turn to more specialised topics in section 2. We discuss the accountingfor long-term contracts and contrast the financial statement effects of twowidely used methods of recognising revenue from them, the percentage-of-completion and completed contract methods. The remaining two topics con-cern receivables. Cash-constrained firms sell receivables to a third party beforethe debts mature. Cash-rich firms, on the other hand, offer long-term credit tocustomers at below-market interest rates. Each situation gives rise to account-ing problems. We explain current international standards in these areas.
In section 3 of the chapter we consider what investors look for when review-ing a company’s revenue and receivables figures. We describe a key ratio,receivables turnover, which links credit sales and receivables and which, inadjusted form, shows how many days a firm’s customers take to pay their bills.
1010
SECTION 1Core issues
l Revenue recognition revisited
l Credit sales: termsand methods ofpayment
l Receivables valuation
l Bad and doubtful debts
l Sales returns andallowances
SECTION 2Specialised topics
l Long-term contracts
l Transfer ofreceivables
l Long-termreceivables
SECTION 3Revenues, receivablesand financial statementanalysis
In this chapter
CFA_C10.qxd 11/6/03 2:36 PM Page 271

272 PART 2 • THE HOUSE OF ACCOUNTING
SECTION
1 Core issues
Revenue recognition revisited
l GeneralA company generates revenue from selling goods or performing services. It also earns revenue –in the form of interest, royalties and dividends – when others pay for the use of its assets. In eachcase, what occurs – and this is the definition of revenue – is a ‘gross inflow of economic benefits’to the company arising from its ordinary activities. Note that the company only records as rev-enue inflows received (or receivable) on its own account. Amounts collected on behalf of othersare not revenues. Thus value added taxes are excluded from revenue. Similarly, a company actingas an agent shows as revenue only the commissions it earns – not the gross amount collected onbehalf of the principal.
At what point does a company recognise revenue? Accounting regulators have laid down cer-tain conditions that must be met before it can do so. The key ones for the sale of goods are:
l it’s probable that economic benefits associated with the transaction will flow to the company;l the amount of revenue – and related costs – can be measured reliably; andl the company has transferred to the buyer the significant risks and rewards of ownership.1
These revenue recognition conditions are general. They apply in all industries. In some cases,however, there is uncertainty about whether one or more of the conditions is met.
Consider, for example, the transfer of ownership risks and rewards. Often it is clear when therisks have not been transferred. For example, where goods are sold on consignment, the seller/consignor should not recognise revenue until the consignee has sold the goods to a third party,since, until then, the seller is still the owner of the goods.
Sometimes we need to look more closely at the sale contract. Suppose the buyer has the rightto return the goods. In this case, the seller still retains some ownership risk. What matters thenis how large is the risk retained. For example, the risk to a retailer that accepts returned mer-chandise and offers to refund dissatisfied customers is usually small: in this case it recognises revenue at the point of sale and establishes a provision for estimated returns. But if a companysells goods on approval, then, under international accounting standards, it should recognise rev-enue only when the buyer has accepted the goods and the time period for rejection has passed.2
In most cases, a company transfers the main risks and rewards of ownership when legal titlepasses to the buyer. This usually occurs when the goods are delivered to the buyer. It’s for thisreason that delivery is the point in the operating cycle when most companies that sell goodsrecognise revenue. But note that there are circumstances when recognition of revenue can occurbefore the delivery date or be delayed until after it. An agricultural producer must measure itsproduce (e.g. milk, corn, grapes) at fair value net of estimated point-of-sale costs at the time ofharvest.3 This is equivalent to recognising revenue on completion of production. Accountingregulators claim there are active markets for most types of agricultural produce and thus fairvalue, a more relevant measure of value than historical cost in this case, can be easily establishedat the harvest date. By contrast, a landowner selling land to a property developer under extendedpayment terms faces a different environment. Suppose that payments are structured so that, inessence, the developer pays for the land out of the proceeds of development. In this case, it wouldbe prudent of the landowner to recognise revenue from the land sale only as it receives eachinstalment of cash.
CFA_C10.qxd 11/6/03 2:36 PM Page 272

The following example contrasts the financial statement effects of recognising revenue atthree different dates: completion of production, delivery, and cash receipt. Beatrix makes pots.The McGregor, one of her favourite lines, costs a12 each to produce and sells for a20. In year 1, sheproduces 600 units, delivers 550 to customers, and collects a9,000 cash from them. Exhibit 10.1shows the effect on Beatrix’s year 1 income and net assets under each of the three revenue recog-nition points. (To keep the example simple, we assume no beginning inventories – and onlyfinished goods in ending inventory. All production costs are paid in cash and there are no sell-ing costs.)
Earlier recognition of revenue results in higher profits and net assets so long as products areprofitable and output is expanding. Bringing forward recognition of revenue – from delivery toproduction – increases Beatrix’s year 1 profit and end-year 1 net assets by a400, the product ofunits in inventory (50) and the excess of sales price over cost (a8). By contrast, postponement of revenue recognition – from delivery to cash collection – lowers the profits and net assets ofprofitable firms. In Beatrix’s case, profit deferred on uncollected credit sales in year 1 is a800(100 units × a8). The key word here is ‘deferred’. Delaying (advancing) the revenue recognitiondate doesn’t permanently lower (raise) profits. It simply alters their timing.
CHAPTER 10 • RECOGNITION OF REVENUE AND VALUATION OF RECEIVABLES 273
FactsBeatrix makes the McGregor line of earthenware pots at a (cash) cost of A12/unit and sellsthem for A20/unit. All sales are on account. Key operating data for year 1 are as follows:
Production 600 unitsDelivery 550 unitsCash collected from credit customers A9,000
There are no inventories at start-year 1 and only finished goods inventories at end-year 1.
Recognising revenue on production, delivery and cash collection: impact on accounts
Revenue recognised on: Completion Cash of production Delivery collection
Units 600 550 450
Effect on Beatrix’s year 1 profitRevenues A12,000 A11,000 A9,000Matched costs 7,200 6,600 5,400
Gross profit A4,800 A4,400 A3,600
Effect on Beatrix’s net assets (and owners’ equity), at end-year 1Finished goods inventory (50 units) A1,000* A600 A600Accounts receivable (100 units) 2,000 2,000 1,200**Cash*** 1,800 1,800 1,800
Total A4,800 A4,400 A3,600
* Inventory at fair value (50 units at A20)** A/R at cost (100 units at A12). Profit is excluded because cash has not yet been collected.
*** Cash collected (A9,000) less production costs (A7,200 [600 units × A12] ).
Revenue: financial statement impact of alternative recognition pointsExhibit 10.1
CFA_C10.qxd 11/6/03 2:36 PM Page 273

l Revenues from servicesA company that supplies a service recognises revenue when it performs it. The conditions forrevenue recognition are similar to those for goods. The company must show there’s a stronglikelihood it will receive economic benefits from the transaction and it can measure the revenueand related costs reliably. The third test – the transfer of ownership risks and rewards – does notapply to service transactions. Instead, accounting regulators impose a different test. Where acompany performs services under a contract over more than one financial period, it shouldrecognise revenue based on the stage of completion of the contract at the balance sheet date.4
This assumes the company can make reliable estimates of both the outcome of the contract andits progress. If it can’t, the company should recognise revenue only to the extent that contractcosts are recoverable.
An example illustrates how the percentage-of-completion method, as it’s known, is appliedin practice. Delphi Consulting is awarded a contract to carry out a strategic study for theEuropean Commission. The contract has a value of a600,000 which the EC will pay on comple-tion. Expected contract costs are a500,000: these will be paid as they are incurred. Delphi expectsto complete 30% of the contract in year 1, 50% in year 2 and the balance in year 3. These per-centages are based on the costs Delphi expects to incur each year. The contract turns out asexpected. Exhibit 10.2 shows the effect of the contract on the company’s income and balancesheet in each of the three years.
The contract revenue and profit Delphi recognises in its income statement reflects the workdone in the year. Thus in year 1 Delphi recognises as revenue 30% of the contract’s value – or
274 PART 2 • THE HOUSE OF ACCOUNTING
FactsThe European Commission awards Delphi Consulting a three-year contract at a value ofA600,000 (to be received in cash on completion). Expected contract costs are A500,000: allcosts are paid in cash as they’re incurred. Delphi expects to complete 30% of the contract byend-year 1 and 80% by end-year 2. The stage of completion is based on costs incurred(relative to total expected costs).
Percentage-of-completion method: expected effect on Delphi’s accounts(currency amounts in A000)
Year 1 Year 2 Year 3
Expected % completed 30 80 100
Expected effect on profitContract revenues 180 300 120Contract expenses −150 −250 −100
Contract profit 30 50 20
[Cumulative contract profit 30 80 100]
Expected effect on end-year net assetsOn contract Receiptcompletion of cash
Contract in progress (at fair value) +180 +480 +600 0Cash −150 −400 −500 +100
Total +30 +80 +100 +100
Recognising revenues from services: the percentage-of-completion methodExhibit 10.2
CFA_C10.qxd 11/6/03 2:36 PM Page 274

CHAPTER 10 • RECOGNITION OF REVENUE AND VALUATION OF RECEIVABLES 275
a180,000 – since this is the proportion of the contract completed that year. As the cost of thiswork is a150,000, Delphi recognises profit on the contract of a30,000. Delphi’s balance sheetshows the uncompleted contract at fair value (i.e. cost plus recognised profits). This is recordedas ‘Contract in progress’, an inventory account. Note how by the end of year 2, Delphi’s net assetshave increased by a80,000, the excess of the contract’s inventory value (a480,000) over cumulat-ive cash outlays on it (a400,000). This is also the cumulative profit on the contract at that date.
Our Delphi example is simple. Long-term contracts are more complicated in practice. Contractsrarely go according to plan. Actual contract costs – and work done each period – differ from expecta-tions. In addition, customers make progress payments rather than pay only when the contract iscompleted. We illustrate the accounting for these features of long-term contracts in section 2.
l Problem areas
Revenues can give rise to recognition and measurement problems for a wide range of com-panies. Sometimes the problems are industry-specific. For example, when should an insurancecompany recognise revenue from an insurance premium? How should a film production com-pany account for revenues and expenses from film production and distribution? We focus hereon general issues. Nonetheless, the principles derived can help answer revenue questions inspecific industries like insurance and film production.
A company may provide both goods and services in one transaction. For example, a retailersells audio equipment which carries an extended warranty. How does it account for a compositetransaction like this? The recommended approach in these circumstances is to split the transac-tion into its component parts and account for each separately. Thus the retailer should estimatethe fair value of the goods without the extended warranty and recognise revenue from this partof the transaction at the time of sale. The fair value of the extended warranty is estimated separ-ately and recognised, usually on a time basis, over the term of the warranty. The difficulty inpractice is in determining the fair values of the components of the transaction. Published pricesmay mislead because the retailer may cut the price of the equipment in the hope of recoupingthe lower profit margin by signing up the customer to a higher margin warranty contract.
The revenue figure needs to be adjusted whenever a vendor supplies a range of products orservices and cross-subsidisation occurs. Consider the case of the franchisor. It usually charges anew franchisee an initial fee to cover the costs of staff training, advertising and other start-up services. It may also supply goods or services – for example, pizza dough to franchised pizzarestaurants – in the early years of the franchise contract at a price below market. In this event, itshould defer part of the initial franchise fee (equal to the value of the subsidy) and recognise itas revenue when it supplies the subsidised goods or services to the franchisee.
Revenue recognition problems can also arise when a company swaps goods and services withanother. Where the goods or services swapped are similar in nature, neither party should recog-nise revenue since there’s no additional inflow of economic benefits. For example, a Europeanoil company arranges an oil swap with an American competitor: it supplies crude oil to its com-petitor’s refinery in Europe and, in return, receives crude oil for its US West Coast refinery fromthe American company. Both parties avoid shipment costs. The transaction is an exchange ofinventory. Any difference in the value of the oil exchanged is settled in cash.
If the goods or services exchanged are dissimilar in nature, however, revenue is recognised.Thus a mining company that barters, say, bauxite for equipment recognises revenue from thesale of bauxite.
Dr. Equipment (A+) xxCr. Revenue from sale of bauxite (OE+) xx
Dr. Cost of bauxite sold (OE−) xxCr. Inventory (A−) xx
CFA_C10.qxd 11/6/03 2:36 PM Page 275

276 PART 2 • THE HOUSE OF ACCOUNTING
Barter is common where the costs of using money as the medium of exchange are high (e.g.the mining company’s operations are in a country with multiple foreign exchange rates). Themining company measures the revenue at the fair value of the consideration received (in thiscase, the equipment). If, however, the fair value of the equipment can’t be measured reliably, itshould use the fair value of the goods given up (i.e. the bauxite) as the basis for measuring boththe revenue and the equipment received in exchange.
l Revenue recognition: international practice
Companies that sell goods usually recognise revenue at the point of delivery. Earlier recognitionof revenue is rare. In agriculture and in some natural resource industries, revenue is recognisedon completion of production where the fair value of the agricultural produce or commodity can be measured reliably. Delaying recognition until after delivery is also unusual, except in tax accounts. The tax authorities in many countries allow firms to defer recognition of rev-enue (and profit) on instalment sales until cash is received. For the taxpaying company, theadvantage is clear. Tax is postponed until the company has collected the cash from customers to pay it.
As for companies providing services, the nature of the service determines the timing of rev-enue recognition. Where the service consists of one transaction (e.g. a loan placement, a theatreperformance), the usual practice is for the provider to recognise revenue when the transactiontakes place. Where the service consists of a series of transactions or is time-related (e.g. coursetuition, a loan commitment facility), practice varies. IAS favour a percentage-of-completion ortime-apportioned basis of revenue recognition – and the popularity of this method is growing,even in countries with a uniform reporting tradition that hitherto have delayed recognition ofrevenue until contract completion. (We contrast the percentage-of-completion and completed-contract methods in section 2.) However, the percentage-of-completion method should comewith a health warning: there is a risk that the service provider may ‘front-load’ revenue andprofits by claiming that it performs services earlier than is in fact the case.
Credit sales: terms and methods of payment
For most manufacturing companies and increasingly for many retailing companies too, it iscommon to grant customers a period of credit before they have to pay their debts. A firm setscredit terms (a credit limit and a credit period), which may vary with the perceived riskiness ofthe customer. However, there is a growing tendency to standardise the credit period within anindustry. In some industries, the period is stated cryptically as ‘net monthly’: this is usually inter-preted as one month after the end of the month in which the invoice is received.
There are country differences, too. The European Commission surveyed firms in EU memberstates in 1996 and found that, among the larger states, French and Italian companies offer alonger credit period than those in Germany and the UK:
Contractual Days accountscredit period are overdue
(average) (average)
Germany 23 11UK 31 18France 48 10Italy 65 22
CFA_C10.qxd 11/6/03 2:36 PM Page 276

CHAPTER 10 • RECOGNITION OF REVENUE AND VALUATION OF RECEIVABLES 277
Notice that in all the above countries customers on average exceed the permitted credit period.In fact, the Commission found that the overdue period in the EU (plus Norway) was on average15 days in 1996.5
Some companies offer cash discounts for early payment. An example is ‘1/10, net 30’ (1%cash discount for payment within 10 days; otherwise, the invoiced amount within 30 days). Wereview the accounting for cash discounts in the next section. Companies may charge interest onoverdue accounts. In August 2000, the European Commission issued a directive which gives allfirms in the EU a legal right to interest on overdue debts.6
The terms of sale discussed above refer to sales on open account. Such a sale involves anunwritten contract in which the purchaser agrees to pay the seller the net amount stated on theinvoice within the credit period granted. Sales can also be made by draft, using a promissorynote or a bill of exchange. In this case, purchaser and seller are parties to a written agreement inwhich the sum owing, the date of payment and other conditions (for example, the date fromwhich interest is charged and the rate of interest) are explicitly stated. Drafts and the accountingfor them are discussed in section 2 of this chapter.
Some companies sell their receivables before the due date. A company may discount a bill (ornote) it holds before the maturity date. It presents the bill to its bank and receives funds at a dis-count to the bill’s maturity value. A firm may sell its trade accounts receivable en bloc to a factoror, in special cases (e.g. credit card receivables), it may be able to securitise them.
A factor offers several services to client companies. It will take over part or all of a client’s creditmanagement tasks – assessing credit risk, setting credit limits for individual customers, managingthe sales ledger – for a fee (which may range between 0.75% and 3% of sales). It can collect customers’debts directly. And it will make a cash advance equivalent to a high percentage (80–85%) of a clientcompany’s outstanding debts at an interest rate little higher than the company’s usual bank bor-rowing rate. A client can select one or more of these services. Factoring is popular among smallerfirms in industries where there are many suppliers and many customers (e.g. shoe, textile, carpetand toy manufacturing). Credit card companies offer, in effect, a factoring service to retailers. Inboth cases, the factor enjoys economies of scale in credit risk assessment and debt collection.7
Trade debts may be sold with recourse. This means that in the event that the debtor does notpay the amount owing when due, the factor can demand payment from (has recourse to) theseller of the receivables. Likewise, bills and notes may be discounted with recourse. We discussthe accounting implications of this in section 2 of this chapter.
Offering credit to customers brings risks as well as rewards. Sales and profits are likely toincrease but some customers will default on their debts. The loss the company sustains is, at thelimit, the sale price of the good or service. Not surprisingly, firms take various measures to reducethe incidence and thus the cost of bad debts:
l assessing potential customers’ credit risk and setting credit terms accordingly;l monitoring carefully credit actually taken and chasing overdue accounts;l using specialist services for risks that are hard to assess (e.g. obtaining letters of credit from
small export customers); andl buying insurance to protect against non-payment of certain types of debt.
Despite these precautions some debts are never collected. Later in this section we describe andillustrate the various ways firms account for bad debts.
Receivables valuation
When accounting for receivables, companies face measurement as well as recognition prob-lems. We’ve already seen that when a company recognises a trade receivable depends on when
CFA_C10.qxd 11/6/03 2:36 PM Page 277

it recognises revenue. Once the receivable is recognised, it must then be valued. First, the com-pany must decide at what amount it should record the receivable initially. For example, how shouldit account for any cash discount it offers a customer who pays early? Second, it must decide whatadjustments it should make to the receivable if it is impaired. For example, what should it do if collection of the receivable becomes doubtful?
The 4th Directive offers no specific guidance on these issues. International accounting standards do. The main IAS valuation rules for receivables are summarised below. They reflect current best practice.
l State receivables at cost. ‘Cost’ is the fair value of the consideration given. In the case of tradereceivables, this is the invoiced amount of the goods or services supplied (i.e. net of trade andquantity discounts given at the time of invoicing).
l Measure long-term receivables at the present value of the future cash receipts specified in thecontract. The discount rate should be the market rate of interest for a similar loan at the dateof the contract.
l Write down a receivable to its recoverable amount when it’s probable the contractualamounts can’t be collected when due. Recognise the loss (or bad debt expense) in incomeimmediately. ‘Recoverable amount’ is the total of revised future cash flows. In the case oflong-term receivables, the cash flows are discounted.8
We now show how firms put these principles into effect.
l Value added tax
The cost of a receivable includes any taxes borne on the sale of goods and services and which theseller collects on behalf of the government. It therefore includes value added tax (VAT) andexcise duties. VAT is an indirect tax, similar to a sales tax, which is levied by all EU memberstates. Any business that carries out an economic activity (production, trading, supply of ser-vices) must charge VAT on the (taxable) goods and services it supplies (known as ‘output tax’).However, it can recover VAT charged on the goods and services it purchases (‘input tax’). Theamount it pays to the government each tax period is the net of its output and input taxes. VATis thus a tax on the value a firm adds in its operations.
How does VAT affect the reporting of credit (and cash) sales? The company recognises as rev-enue the sale of goods or supply of services net of VAT. The invoice the customer receives – andthus the amount he or she must pay – includes VAT. The difference is recorded by the firm as aVAT liability. Customs and excise duties are treated the same way. For example, suppose retailerY sells a computer to customer Z on account at a price excluding VAT of 1,000. The VAT rate is15%. Y records the sale as follows:
Dr. Account receivable, Z (A+) 1,150Cr. Revenue from sale (OE+) 1,000Cr. VAT payable (L+) 150
Y’s net VAT liability is less than 150. It can recover any VAT included in the price it pays forthe computer. Assume the ex-factory price of the computer, net of VAT, is 600 and the VAT rateis 15%. Y records the purchase from manufacturer X as follows:
Dr. Inventory (A+) 600(later: Cost of sales (OE−))
Dr. VAT receivable (A+) 90Cr. Account payable, X (L+) 690
278 PART 2 • THE HOUSE OF ACCOUNTING
CFA_C10.qxd 11/6/03 2:36 PM Page 278

Thus Y’s net VAT liability with respect to the purchase and sale of the computer is 60 (150 − 90).As with any tax, the devil lies in the detail – of which there is much, given the differences in
the way VAT is administered across the European Union. For example, in most member statesthere are different rates of VAT for different types of goods and services. Certain goods such asfood, books and pharmaceutical supplies attract a reduced rate of VAT in many states. Exportsare zero-rated (i.e. carry a VAT rate of 0%). It is possible, therefore, for a firm to report a netVAT receivable: the VAT reclaimable on its inputs exceeds the VAT charged on its output.9
l Cash discounts
Where a supplier offers a customer a cash discount for early payment, it is common practice forthe supplier not to recognise the discount unless the customer pays within the discount period.Initially, the supplier reports revenue and receivable gross. If the customer takes the discountand pays early, the cost to the supplier is recorded as an expense (or as a deduction from salesrevenue). Similarly, the customer is also likely to record the purchase and the payable at the grossamount and recognise as income the benefit from any cash discount when it’s taken. This isknown as the gross method of accounting for cash discounts. Note that in most EU countries,discounts for early payment are excluded from the VAT calculation.
To illustrate, suppose Buddenbrook sells goods costing 80,000 to Hagenstroem for 100,000and offers a 1.5% discount if payment is made within ten days of the invoice date. Hagenstroemtakes advantage of the discount, in view of the high opportunity cost of forgoing it.10 Under thegross method, Buddenbrook records the sale of goods and the recognition of the discount as follows. (To keep the numbers simple, VAT is ignored. Currency amounts are in thousands.)
Buddenbrook (Supplier) Hagenstroem (Customer)
Sale of goods Purchase of goodsDr. Cr. Dr. Cr.
Account receivable (A+) 100 Inventory (A+) 100Sales revenue (OE+) 100 Account payable (L+) 100.0
Cost of sales (OE–) 80Inventory (A–) 80
Receipt of cash within ten days Payment of cash within ten days
Cash (A+) 98.5 Account payable (L−) 100Sales discount1 (OE−) 1.5 Cash (A−) 98.5
Account receivable (A−) 100 Purchase discount2 (OE+) 1.5
1 Shown as expense or deduction from revenue.2 Shown as income or deduction from related expense.
Both Buddenbrook and Hagenstroem record the transaction initially at the gross amount of100,000. Neither recognises the discount – an expense to the former, income to the latter – ifHagenstroem does not settle his debt within ten days.
An alternative, less widely used method – but one which results in an initial receivable valuecloser to the realisable amount – is known as the net method. The supplier records the sale andreceivable at the amount net of discount (e.g. 98,500 in the above example) and treats any cashdiscount forfeited by the customer as income. Similarly, the customer can also (independently)use this method: in this case, the purchase is recorded at the net amount and, should paymentnot be made within the discount period, the lost discount (1,500 in our example) is shown as an
CHAPTER 10 • RECOGNITION OF REVENUE AND VALUATION OF RECEIVABLES 279
CFA_C10.qxd 11/6/03 2:36 PM Page 279

280 PART 2 • THE HOUSE OF ACCOUNTING
expense. One advantage of the net method is that it highlights the benefit (to the supplier) andthe cost (to the customer) of forfeited discounts.
If a supplier grants a customer a volume rebate (for example, a percentage reduction in thenormal unit price when the number of items a customer orders in a specified period exceeds astated level), it adjusts the customer’s account only when the volume level is exceeded. Itacknowledges the rebate either by adjusting the current invoice or by issuing a credit note. VATmust also be adjusted.
Bad and doubtful debts
Not all receivables are converted into cash. A customer may go bankrupt. From the standpointof an unsecured creditor (which is the unfortunate fate of most suppliers of goods and services),amounts owed by a bankrupt customer are likely to be partially or wholly unrecoverable. Debtsmay prove uncollectible for other reasons. For example, a customer may dispute an invoice andthe legal and administrative costs to the seller of pursuing its claim exceed the debt outstanding.When debts are considered uncollectible, they are described as ‘bad’.
l Direct write-off and allowance methodsThere are two general ways in which a company can account for its bad debts. It can write themoff when management decide they are not collectible. We call this the direct write-off method.Alternatively, it can estimate each period the percentage of debts which it reckons will proveuncollectible and make a provision in the accounts for them. We call this the allowance method.
Let’s illustrate these two methods. Ragueneau is a poet and a pâtissier. Although a master ofhis trade – he has been called the ‘Apollo of the kitchen’ – his business skills do not match hisculinary ones. In particular, credit management is weak. Some customers are slow to pay; somedo not pay at all (at least, not in cash – a few try to pay for their pastries with poems).
Ragueneau records credit sales of 3.2 million in year 1, his first year of operations. At the endof the year, he estimates that 5% of the receivables balance of 400,000 is likely to prove uncol-lectible. In year 2 his company collects 380,000 of the end-year 1 receivables balance and writesoff the remaining debts of 20,000 as bad. The accounting entries Ragueneau makes in years 1 and2 under the two methods are as follows (amounts in 000):
(a) Direct write-off method (b) Allowance method
End-year 1Dr. Cr.
Bad debt expense (OE−) 20No entry Allowance for bad debts (CA+) 20
To record the cost of estimated bad debts and make allowance for them
During year 2Dr. Cr. Dr. Cr.
Bad debt expense (OE−) 20 Allowance for bad debts (CA−) 20Accounts receivable (A−) 20 Accounts receivable (A−) 20
To record the cost of bad To record the write-off of baddebts at the time of write-off debts previously allowed for
CFA_C10.qxd 11/6/03 2:36 PM Page 280

Under the direct write-off method, the cost to the firm of uncollectible accounts (‘Bad debtexpense’) is recognised only when management have judged particular debts ‘bad’ and author-ised their write-off. In Ragueneau’s case, this decision is taken in year 2. The write-offs are madedirect to the specific customer accounts in ‘Accounts receivable’.
Under the allowance method, uncollectible accounts are estimated – during or at the end ofthe financial period. (At this stage they are ‘doubtful’ accounts.) The cost to the firm of suchaccounts is recognised in the period when the estimate is made – year 1 in our example. Becausethe firm cannot identify which accounts will prove uncollectible at that date, it cannot credit‘Accounts receivable’ directly since this would involve adjusting individual customer accounts.Thus the adjustment is recorded in a contra-asset account, ‘Allowance for bad debts’ (or‘Allowance for doubtful accounts’).
When the firm identifies actual bad debts, it adjusts individual customer accounts – by crediting ‘Accounts receivable’ – and utilises the allowance. In Ragueneau’s case, this occurs inyear 2. Note that under the allowance method, the entry to write off bad debts has no incomestatement impact.
The allowance method is the preferred method of accounting for bad debts. It ensures that the carrying amount of receivables is reduced by the amount of estimated uncollectible accounts and isthus closer to their realisable value. For example, at the end of year 1, Ragueneau reports netreceivables of 400,000 under the direct write-off method and 380,000 under the allowancemethod. The latter figure better reflects the cash which will be collected from this asset.
In our example, the allowance for bad debts at the close of year 1 (20,000) is the same as thedebts actually written off in year 2. In reality, estimated and actual bad debts rarely correspondexactly. Where a difference occurs, management usually adjust the bad debt expense figure in the period the difference is discovered. If, for example, only 18,000, not 20,000, of Ragueneau’syear 1 receivables prove uncollectible, the expense in year 2 is reduced by the 2,000 overestimate.The company does not restate its year 1 accounts since they reflect the information available toit at the time. In practice, the adjustments are usually small, especially for an established com-pany, since it can draw on its past experience to refine its bad debt estimates.
l Estimating the bad debt allowance
The percentage-of-receivables method
How do companies determine the allowance for bad debts? Most companies use a balance sheetapproach. A simple method is to apply a percentage to the end-year receivables balance, as weshowed in our example. The percentage itself will vary depending on trading conditions, beinghigher, for example, during an economic recession and its aftermath.
Ageing analysis
A more complicated, but potentially more accurate, method is to analyse the end-period receiv-ables balance by the length of time accounts are outstanding. A different percentage is thenapplied to each ‘age’ category of receivable. The older the debt, the higher is the percentageapplied. The percentages are derived from the company’s past experience. Assume Ragueneauperforms an ageing analysis of his company’s receivables balance of 400,000 at the end of year 1.Its normal credit period is 30 days from the invoice date. The breakdown of its end-year 1 receiv-ables, together with the percentage it applies to each age category of receivable, is set out inExhibit 10.3.
By applying a predetermined percentage to each age category of end-year 1 receivables,Ragueneau estimates his firm needs an allowance for bad debts of 19,000 (after rounding). As aresult, net receivables reported in its end-year 1 balance sheet are 381,000.
CHAPTER 10 • RECOGNITION OF REVENUE AND VALUATION OF RECEIVABLES 281
CFA_C10.qxd 11/6/03 2:36 PM Page 281

An ageing analysis offers management informational benefits. They can identify which cus-tomers are slow payers. They can even distinguish habitual slow-payers from the more riskygroup of customers whose payment record has deteriorated sharply. They can then use the information to take action – for example, to chase slow payers, lower credit limits for high-riskcustomers or, more generally, alter the company’s credit terms.
l Calculating bad debt expense under the allowance methodUnder balance sheet methods of determining the allowance for bad debts, the cost of bad debtsrecorded in the income statement is a derived number. Bad debt expense under these methods is equivalent to the net write-offs in the period (write-offs less recoveries of bad debts previously written off ), adjusted for the change in the estimated required allowance between the start and endof the period.
We use our Ragueneau example to illustrate the calculation. Assume that in year 2 the com-pany writes off bad debts of 20,000 but recovers a previously written-off debt of 2,000 fromCyrano, a loyal but impoverished customer.
Write-offs of bad debtsDr. Allowance for bad debts (CA−) 20,000
Cr. Accounts receivable (A−) 20,000
Recovery of bad debtDr. Account receivable, Cyrano (A+) 2,000
Cr. Allowance for bad debts (CA+) 2,000Dr. Cash (A+) 2,000
Cr. Account receivable, Cyrano (A−) 2,000
(Cyrano’s debt is first reinstated before the cash collected is recorded. In this way, Ragueneau’smanagement can distinguish, at the individual customer level, bad debts recovered from those
282 PART 2 • THE HOUSE OF ACCOUNTING
Due Number of days past due(within 30 daysof invoice date) 1–30 31–60 over 60 Total
Receivables,31/12/year 1 (A) 170 160 50 20 400
Percentage (B)expected to beuncollectible 0.6% 1.8% 10% 50%
Allowance required, end-year 1(A) × (B) 1.02 2.88 5 10 18.9
Ragueneau Company: ageing analysis of end-year 1 receivables (currency amounts in 000)
Exhibit 10.3
CFA_C10.qxd 11/6/03 2:36 PM Page 282

CHAPTER 10 • RECOGNITION OF REVENUE AND VALUATION OF RECEIVABLES 283
unrecovered. This information will prove valuable when they review the company’s credit pol-icy towards individual customers at a later date.11)
We discover from Ragueneau’s books that its end-year 2 gross receivables are 450,000, upfrom 400,000 at the end of year 1. An ageing analysis indicates that the company needs a bad debtallowance of 24,000 at end-year 2, an increase of 5,000 over the allowance established at the endof year 1. As a result, the company recognises bad debt expense of 23,000. The calculation andjournal entry are shown below:
Net write-offs in the year (20,000 − 2,000) 18,000Increase in required allowance (24,000 − 19,000) +5,000
Year 2 bad debt expense 23,000
Dr. Bad debt expense (OE−) 23,000Cr. Allowance for bad debts (CA+) 23,000
The bad debt expense figure can also be derived from the ‘Allowance for bad debts’ contra-assetaccount, shown in ledger account format below.
Allowance for bad debts (CA)
Dr.(–) Cr.(+)
(Required) Balance,1/1/year 2 19,000
Bad debts written off in year 2 20,000 Recovery of Cyrano’s debt 2,000
Year 2 expense (derived) 23,000
(Required) Balance, 31/12/year 2 24,000
Ragueneau shows the accounts receivable balance at its net amount (i.e. net of the allowancefor bad debts) in its end-year balance sheet:
At 31 DecemberYear 2 Year 1
Accounts receivable, gross 450,000 400,000Less: Allowance for bad debts −24,000 −19,000Accounts receivable, net 426,000 381,000
Some companies determine bad debt expense using income statement data. On the basis ofpast experience, a firm estimates what proportion of its credit sales will prove uncollectible and,at the time of sale, records an expense and an allowance based on that percentage. Bad debtexpense calculated in this way is provisional, however. At the end of the financial period, the firmshould correct the provisional expense figure using the findings of its ageing analysis – and otherdata such as actual write-offs and recoveries in the period.
l Accounting for bad debts: international practiceHow firms account for bad debts is not well documented. We do know that in uniform report-ing countries the national tax code influences corporate accounting in this area. Companies may
CFA_C10.qxd 11/6/03 2:36 PM Page 283

284 PART 2 • THE HOUSE OF ACCOUNTING
be required to distinguish, for tax purposes, specific from general bad debts. A tax deduction isusually available for losses arising from debts written off in the period. However, some countriesrestrict the tax deduction a company can claim for general bad debts. For example, the generalbad debt deduction that Italian companies can claim in their annual tax return is limited to 0.5%of gross end-year receivables. In many countries (e.g. France, Mexico, Singapore, UK, USA), ageneral provision for bad debts is not tax deductible.
Note that tax authorities in Europe usually take no account of a firm’s provision for bad debtsin assessing VAT. The taxable amount for VAT purposes is the cost or purchase price of the goodor service. Only when the supplier writes off a customer’s debt on the grounds that the amountis uncollectible, is it entitled to a VAT refund.
Sales returns and allowances
Companies adjust revenues (and, in the case of credit sales, receivables too) for sales returns andsales allowances. In the case of a sale return, the supplier permits a customer to return mer-chandise if it is defective, unsuitable or, in the case of a customer who is a retailer, unsaleable. Itthen cancels the amount owing on the goods (or grants the customer a refund). In the case of asale allowance, it grants the customer an allowance, for example a voucher to be used againstfuture purchases, in place of returning the goods.
Where returns or allowances are sizeable in relation to sales, a prudent company provides for them at the time of sale. The accounting is similar to that for bad debts. Take the case of atoy manufacturer which may have to accept unsold stock from retailers in the post-Christmas season. At the time of sale, the company records the amount of the estimated returns as a deduction from revenues. At the same time, it provides for future returns by means of a contra-asset account, ‘Allowance for sales returns’. This is usually shown as an adjustment to its receivables.
Dr. (Estimated) sales returns (OE−) xxCr. Allowance for sales returns (CA+) xx
When the company accepts returned toys from a retailer, the provision is used and the retailer’s debt to the company is reduced. (In the case of cash sales – or credit sales fully paid for – a refund is given.)
Dr. Allowance for sales returns (CA−) xxCr. Account receivable, retailer X (A−) xx
(or Cash)
If the returned goods are resaleable, the toy manufacturer will also adjust its ‘inventory’ and ‘costof sales’ accounts.
Many companies, however, do not provide for estimated sales returns and allowances – forpractical reasons. In contrast to bad debts, it’s hard to estimate the amount of returns andallowances – or their nature (i.e. can the goods be resold? is rework necessary?). Moreover,except in certain industries, the amounts involved are not material. Thus firms account for suchitems as they occur, even though this can result in mismatching of cost (e.g. sales return) andrevenue.
Whichever method of accounting a company uses – the direct or the allowance method – itreports sales revenues net of returns and allowances.
CFA_C10.qxd 11/6/03 2:36 PM Page 284

CHAPTER 10 • RECOGNITION OF REVENUE AND VALUATION OF RECEIVABLES 285
SECTION
2 Specialised topics
Long-term contracts
In certain industries (e.g. construction, aerospace), a company produces an asset or assets (e.g.a bridge, an oil refinery, military aircraft) under contract to a customer. Contracts come in twoforms. Under a fixed-price contract, the contractor accepts a fixed contract price (in total or perunit of output). In some cases, cost escalation clauses permit an increase in the price if specifiedcosts increase. Under a cost-plus contract, the client reimburses the contractor for costsincurred and pays a mark-up (which may be a percentage of contract costs or a fixed fee). Thecosts to be reimbursed are carefully defined in the contract.
If the term of the contract covers more than one accounting period, the issue arises: whenshould the contractor recognise revenue? Firms in the service sector that win long-term con-tracts (e.g. architects, management consultants) face a similar question. Note this accountingissue applies to both fixed price and cost-plus contracts.
l Methods of recognising revenue on long-term contractsThere are two main ways that a contractor can account for revenue from a long-term contract:the percentage-of-completion method and the completed contract method. We use an examplefrom section 1 to illustrate both methods. Delphi Consulting, you’ll recall, is awarded a fixed-price contract to carry out a strategic study for the European Commission (EC). The impact ofeach method on Delphi’s accounts is outlined below.
1 Percentage-of-completion (POC) method. Delphi recognises as revenue each period a portionof the contract’s value, based on the work done on it during the period. Delphi calculates thison an incremental basis. Thus if it reckons it has completed 30% of the work on the contractby the end of the first year and 80% by the end of the second, it recognises revenue equal to30% of the contract’s value in the first year and 50% (80% – 30%) in the second year. ‘Workdone’ can be estimated using a physical measure (e.g. Delphi consultants’ time on the job) ora monetary one (e.g. contract costs incurred for work performed). Delphi matches againstcontract revenue the costs incurred to generate that revenue.
2 Completed-contract (CC) method. Delphi waits until the contract is completed before recog-nising revenue. In the first two years, it stores costs incurred on the EC contract in an invent-ory account, ‘Contract in progress’. When it completes the contract in year 3, it recognises the total contract revenue and matches against it all the stored costs relating to the contract.Thus it records no revenue or expense with respect to this contract in years 1 and 2 when thecontract is in progress.
l Income statement impactWe now put flesh on Delphi’s EC contract to see what effect each method has on its accounts. (Toillustrate better the operation of the POC method, the example here is more complex than thatin Exhibit 10.2.) Assume the value of the contract is 600,000 – based on 6,000 expected manhoursat a billing rate of 100/hour. The billing rate includes profit as well as labour and contract-relatedoverheads. Initially, Delphi estimates contract costs at 500,000. It revises them upwards to520,000 early in year 2: this proves to be the contract’s actual cost. Exhibit 10.4 sets out the costs
CFA_C10.qxd 11/6/03 2:36 PM Page 285

incurred in each of years 1–3 and shows the calculation of revenue and profit by year under thetwo revenue recognition methods.Exhibit 10.4Exhibit 10.4
In the case of profitable contracts, the POC method results in the earlier recognition of rev-enue and profit. This can be seen in Exhibit 10.4. Under the POC method Delphi recognisesprofit of 30,000 in each of years 1 and 2 and 20,000 in year 3. Under the CC method it recognisesno profit in the first two years. Instead, the whole profit of 80,000 is recognised in year 3 whenthe contract is completed. (For loss-making contracts, the accounting under the two methods issimilar: in each case the loss must be recognised in full as soon as it arises.)
Safeguards are built into the calculation of periodic revenue and profit under the POC methodto prevent a firm from overstating profit in a contract’s early years. For example, contract delaysand future increases in cost are incorporated immediately into the calculation of current profit.Consider our example. Under its original estimate, Delphi expected to have completed 80%((150,000 + 250,000)/500,000) of the contract by the end of year 2. Because of higher spendingand a shift in work to year 3, only 75% of the contract is completed by the end of that year. As aresult, Delphi must revise down its year 2 profit – from the original estimate of 50,000 ((80% ×100,000) – (30% × 100,000)) to the reported figure of 30,000 ((75% × 80,000) – (30% × 100,000)).
Moreover, a firm cannot boost profits by simply bringing forward contract spending. In calculating the percentage of a contract completed, the emphasis is on the work done, specifically:
286 PART 2 • THE HOUSE OF ACCOUNTING
FactsThe European Commission awards Delphi Consulting, a management consulting company, a three-year contract. The value of the contract is 600. At the outset, Delphi estimates totalcontract costs will be 500. It revises these upward at the end of year 2 to 520 and this is thecontract’s actual cost. Costs incurred by year, originally estimated and revised, are:
Year1 2 3 Total
Estimated, at start of year 1 150 250 100 500Revised (start-year 2) and actual 150 240 130 520
Costs incurred reflect work done in the year.
Calculation of contract revenue and profit by year
(a) Percentage-of-completion method
(i) Cumulative costs incurred 150 390 520(ii) Total expected costs 500 520 520(iii) % completed by end-year ((i)/(ii)) 30% 75% 100%(iv) % completed during year 30% 45% 25%
Contract revenue ((iv) × 600) 180 270 150 600Contract expense 150 240 130 520Profit on contract 30 30 20 80
(b) Completed contract method
Contract revenue 0 0 600 600Contract expense 0 0 520 520Profit on contract 0 0 80 80
Long-term contracts: illustration of income statement impact under (a) percentage-of-completion method and (b) completed contract method (amounts in 000)
Exhibit 10.4
CFA_C10.qxd 11/6/03 2:36 PM Page 286

rather than on the outlays made. For example, buying materials does not raise the percentage ofthe contract completed. This occurs only when the materials are used. In our example, weassume for simplicity that the costs Delphi incurs on the EC contract represent work done on it.
The CC method is clearly more conservative than the POC method. A contractor using theCC method recognises revenue and earnings on a profitable contract at a later date. However, ifits business is growing slowly and the profitability of its contract portfolio is stable, there may belittle difference in the total annual profit it reports under the two methods. In these circum-stances, revenues and profit recognised on completed contracts are similar in total to revenuesand profit recognised on contracts in progress.
l Balance sheet impactSo far we have looked at the income statement effects of the two methods. What is the impact ofeach on the balance sheet? Simply stated, a company that uses the POC method and whose con-tracts are profitable reports higher assets and retained profits than if it had used the CC method. Thisis because it recognises revenue at an earlier date.
We demonstrate this using our Delphi example. Consider the accounting entries it makeswith respect to the EC contract. Note that the cash outflows and inflows it records are commonto both revenue recognition methods (all amounts are in thousands):
l Delphi records the costs incurred on the contract (materials, labour, overhead) in an invent-ory account, ‘Contracts in progress (CIP), at cost’, during the year. These amount to 150, 240and 130 in years 1, 2 and 3 respectively. We assume all are paid in cash.
Year 1 Year 2 Year 3Dr. Cr. Dr. Cr. Dr. Cr.
POC and CC methodsCIP, at cost (A+) 150 240 130
Cash (A−) 150 240 130
l It bills the Commission for – and the Commission makes payments of – 100, 200 and 300 in each of the three years. Note that the billing terms are set down in the contract. The amount and timing of the bills do not necessarily correspond to costs incurred (or revenuerecognised).
Year 1 Year 2 Year 3Dr. Cr. Dr. Cr. Dr. Cr.
POC and CC methodsBillingAccounts receivable (A+) 100 200 300
Progress billings (CA+) 100 200 300Cash receiptCash (A+) 100 200 300
Accounts receivable (A−) 100 200 300
‘Progress billings’ are accumulated in a contra-asset account. Usually they are offset againstthe (cumulative) ‘Contract in progress’ account and the net amount is shown as an asset (orliability, if billings exceed the CIP balance). Note that, in practice, a contract is likely to havea positive receivable balance since there is a delay between billing and cash receipt.
Work done on the contract to date
Total past work done and future work required on the contract
CHAPTER 10 • RECOGNITION OF REVENUE AND VALUATION OF RECEIVABLES 287
CFA_C10.qxd 11/6/03 2:36 PM Page 287

Delphi’s balance sheet differs between the POC and CC methods solely because of the timing ofrevenue recognition.
l Under the POC method, Delphi recognises revenue during the course of the contract. Itrecords the revenue recognised in an asset account – we call it ‘CIP, at fair value’ – and, at thesame time, removes the related costs from the ‘CIP, at cost’ account.12 The revenue andexpense figures are taken from Exhibit 10.4. When the contract is completed, the balances in‘Progress billings’ and ‘CIP, at fair value’ with respect to this contract are eliminated.
Year 1 Year 2 Year 3Dr. Cr. Dr. Cr. Dr. Cr.
POC methodCIP, at fair value (A+) 180 270 150
Contract revenue (OE+) 180 270 150
Contract expense (OE−) 150 240 130CIP, at cost (A−) 150 240 130
End-yearDr. Cr.
Progress billings (CA−) 600CIP, at fair value (A−) 600
l Under the CC method, Delphi recognises revenue only when the contract is completed at theend of year 3. At that point, the costs stored in ‘CIP, at cost’ expire and, assuming all work hasbeen billed, the balance in the ‘Progress billings’ account (which should equal the contract’svalue) is eliminated.
End-year 3Dr. Cr.
CC methodProgress billings (CA−) 600
Contract revenue (OE+) 600Contract expense (OE−) 520
CIP, at cost (A−) 520
Exhibit 10.5 shows the effect of the EC contract on Delphi’s end-year balance sheets for years1, 2 and 3 under both the POC and CC methods. Remember that the balance sheet shows thecumulative effect of the contract. For example, the balance in the ‘CIP, at fair value’ account atthe end of year 2 (namely, 450) represents the cumulative costs incurred (390) plus the profitsrecognised in years 1 and 2 (60).
Our example assumes a contractor has one contract. What if it has a large contract portfoliogiving it stable revenues and profits? In this case, choice of revenue recognition method still affectsits balance sheet. If it opts for the CC method in place of the POC method, it reports lower assetsand retained earnings since no profits are recognised on the contracts currently in progress.
Note that both methods have the same impact on a firm’s (pre-tax) cash flows. Delphi’s ECcontract illustrates this. We assume all contract costs are paid in cash as incurred and theCommission makes progress payments of 100, 200 and 300 at the end of each of the three years.As a result, Delphi experiences a net outflow of 50 and 40 in years 1 and 2 and a net inflow of170 in year 3, irrespective of the revenue recognition method it uses. The yearly net outflow orinflow is the difference between the cash payments on the contract and the cash received fromthe Commission.
288 PART 2 • THE HOUSE OF ACCOUNTING
CFA_C10.qxd 11/6/03 2:36 PM Page 288

FactsThe value of Delphi’s three-year contract with the European Commission is 600. At the outset,Delphi estimates total contract costs will be 500. It revises these upward at the start of year 2to 520. Actual costs incurred each year are: year 1 – 150; year 2 – 240; year 3 – 130. All arepaid in cash. Delphi bills the Commission – and the Commission makes payments of – 100,200 and 300 in years 1, 2 and 3 respectively. Profits on contract recognised under POCmethod are: year 1 – 180; year 2 – 270; year 3 – 150.
Balance sheet impact under revenue recognition methods:
End-year1 2 3
(a) Percentage-of-completion methodCash –50 –90 80Contract in progress, at fair value 180 450Less: Progress billings –100 –300
80 150 0*Cumulative effect on net assets(and retained profits) 30 60 80
(b) Completed contract methodCash –50 –90 80Contract in progress, at cost 150 390Less: Progress billings –100 –300
50 90 0**Cumulative effect on net assets(and retained profits) 0 0 80
* Net effect. ‘CIP, at fair value’ and ‘Progress billings’ are both 600 at date contract is completed.** Balances in ‘CIP, at cost’ (520) and ‘Progress billings’ (600) are both eliminated when contract is
completed and revenue is recognised at end of year 3.
Long-term contracts: illustration of balance sheet impact under (a) percentage-of-completion method and (b) completed contract method (amounts in 000)
Exhibit 10.5
l Accounting for long-term contracts: international practiceThere has long been a marked difference in the way companies account for long-term contracts.In countries where Anglo-Saxon accounting is the norm, ‘percentage-of-completion’ is thedominant method. Profit on individual contracts is recognised earlier but there is no tax cost –in the form of earlier tax payments – as the tax authorities determine a firm’s taxable incomeaccording to their own rules. By contrast, companies in most continental European countries,where a uniform reporting tradition prevails, have traditionally used the CC method in order topostpone tax payments (or because the law requires it). Accounting practice in these countriesis changing, however, in response to new national and international accounting rules.
Companies following international standards must account for long-term construction andservice contracts by the POC method so long as the outcome of the contract can be estimated reliably. As with the sale of goods, this occurs when:
l it is likely the rewards from the contract will flow to the company; andl contract revenues and costs can be measured reliably.13
CHAPTER 10 • RECOGNITION OF REVENUE AND VALUATION OF RECEIVABLES 289
CFA_C10.qxd 11/6/03 2:36 PM Page 289

290 PART 2 • THE HOUSE OF ACCOUNTING
When a contract’s outcome cannot be estimated reliably, the contractor should apply amodified version of the POC method. It should:
l distinguish costs that are likely to be recoverable from those that are not;l recognise revenues in the amount of recoverable costs incurred; andl recognise all contract costs as expenses in the period they are incurred.
At the point in the contract’s life when the contractor can estimate the outcome reliably, itshould apply the POC method in unmodified form.
We illustrate this ‘recoverable cost’ modification using our Delphi example. Assume that,because of cost uncertainties, Delphi feels unable to estimate the total profit on the EC contractat the end of year 1. Moreover, it has doubts about whether 10 of the 150 costs incurred that yearare recoverable (amounts are in thousands). Assume, too, that by the end of year 2 when cumu-lative costs incurred are 390, Delphi feels confident that the 10 of costs will be recoverable, thecontract is 75% complete and contract profits will be 80. Contract revenues and expenses recog-nised in years 1–3 are as follows (amounts are in thousands):
Year1 2 3 Total
Contract revenues 140 310* 150 600Contract expenses (costs incurred) 150 240 130 520Profit/(loss) on contract (10) 70 20 80
* [ (75% × 600) − 140]
Thus while cost uncertainties exist, Delphi recognises no profit on the contract – in fact, itrecognises a loss in year 1 because costs incurred exceed its estimate then of recoverable costs.When, in year 2, the uncertainties are removed, it recognises profit on a percentage-completedbasis. Cumulative profits recognised at the end of year 2 (60) are the same as if it had applied thestandard POC method from the outset.
The CC method is no longer an acceptable method under international accounting standards.Use of the POC method (in its standard and modified forms) is set to grow in Europe and else-where but in countries where national accounting rules override international ones, the CCmethod will endure.
Transfer of receivables
A company that supplies goods or services on account can raise cash from the resulting receiv-ables before its customers pay their debts. There are various ways it can do so. It can pledge orassign receivables, that is, use them as collateral for a loan. (Assignment is a more formalisedprocedure than pledging: the lender investigates the receivables portfolio and selects the bestcredit risks as collateral.) Alternatively, it can sell them – either on an individual basis or en bloc.The discounting of a bill of exchange is an example of the sale of an individual receivable. Oneof the services offered by a factor (usually an arm of a bank or a specialist finance company) isthe provision of short-term finance through the purchase of a block of receivables.
The distinction between pledging/assigning and factoring carries over into accounting. Wherea company pledges or assigns its receivables as security for a loan, they remain on its balancesheet – it is still the owner – but it discloses in the notes to the accounts their use as collateral.Where a company discounts a bill or factors receivables, the accounting is less clear cut. If the
CFA_C10.qxd 11/6/03 2:36 PM Page 290

company gives up all the significant risks and rewards of ownership, the transfer is clearly anasset sale. In many cases, however, the company retains certain risks. Suppose, for example, ithas the right to reacquire the receivables at a predetermined price that is more than their fairvalue at the reacquisition date. How should it account for the initial transfer? Is it a sale – or adisguised loan, with the receivables acting as security?
(a) Transfer of receivables as sale (b) Transfer of receivables as loan
Dr. Cr. Dr. Cr.Cash (A+) xx Cash (A+) xx
Financial asset (A−) xx Loan (L+) xx
Note that a company has an incentive to structure a transfer of assets as a sale in order toreduce reported debt. A transfer that is in substance a loan but is accounted for as an asset saleis a form of off-balance-sheet financing.
Under new international accounting rules, a company must ‘derecognise’ a financial asset (i.e.record it as a sale) only when it surrenders control of the contractual rights contained in theasset.14 Usually this is evident from the terms of the contract. For example, if, at the time of trans-fer, a company agrees to repurchase the asset in the future on terms that give the transferee a lender’s return on the cash exchanged for the asset, it clearly has not surrendered control.Sometimes, however, there’s room for debate. For example, what if the company transfersreceivables with recourse, that is, it agrees to reimburse the factor for some or all of the uncol-lectible accounts? Accounting regulators argue that, in this case (and assuming other conditionsare met), the company has handed over control of the asset but has assumed a financial liabilityin respect of the recourse obligation. It reports as a gain or loss in the income statement the dif-ference between the cash received and the carrying amount of the receivables plus the value of therecourse obligation.
We illustrate below the accounting for factoring of receivables and discounting of bills andhighlight the treatment of recourse obligations.
l Factoring of receivables
We return to our Ragueneau example. Ragueneau has gross accounts receivable of 450,000 atend-year 2. Given the strained finances of his business, he decides to raise cash by selling them.A factor, Lise Asset Finance, agrees to pay 370,000 for a large group of them with a face value of390,000, on condition that Ragueneau reimburses it for bad debts up to a limit of 20,000.(Ragueneau’s end-year 2 accounts show an allowance for bad debts of 24,000.) Lise will chargea fee of 2.5% plus interest at 10% on the average time to maturity of the receivables (estimatedat 30 days). Ragueneau records the factoring of the receivables as an asset sale:
Dr. Cash (A+) 370,000Dr. Factoring fee (OE−) (390,000 × 2.5%) 9,750Dr. Interest expense (OE−) (390,000 × 0.10 × 30/360) 3,250Dr. Loss on sale of receivables (OE−) 7,000
Cr. Accounts receivable (A−) 390,000
and at the same time recognises an estimated liability with respect to the recourse obligation:
Dr. Allowance for bad debts (CA−) 20,000Cr. Recourse obligation (L+) 20,000
CHAPTER 10 • RECOGNITION OF REVENUE AND VALUATION OF RECEIVABLES 291
CFA_C10.qxd 11/6/03 2:36 PM Page 291

292 PART 2 • THE HOUSE OF ACCOUNTING
A company may be able to remove receivables from its balance sheet by securitising them.Securitisation is simply the issue of claims on the cash flows of a financial asset. The claims arerepresented by securities such as shares and bonds. (These securities are often known as asset-backed securities, or ABS.) Traditionally, trade receivables, mortgages, loans and leases werethe principal assets securitised. Recent offerings have been more innovative: they includerental income from student accommodation and season ticket sales of major football clubs.The feature all these assets share is a relatively stable and predictable stream of cash flows.
How does a company securitise a financial asset like trade receivables? The first step is forit to set up a special purpose entity (SPE) or trust. The SPE (or trust) issues securities to thirdparties and uses the cash to purchase a pool of receivables from the company. It then servicesthe securities – for example, paying interest and principal on debt securities – with the cash itcollects from the company’s credit customers.
Why do companies securitise their financial assets? The main advantage is lower financingcosts. Note that the alternatives are either selling the assets to one investor or borrowing usingthe assets as collateral. Securitisation gives many investors the opportunity to participate in thefinancing and, at the same time, allows them to diversify their investments. As a result, theydemand a lower return. Another advantage is that it lightens the balance sheet. Low-yieldingassets are sold off and the cash from them is deployed more productively. This benefits banksin particular since, under existing capital adequacy rules, they’re required to support theirprincipal asset (loans) with expensive risk capital. SPEs are usually highly leveraged – the stab-ility and predictability of their cash inflows allows this – so securitisation can take debt as wellas assets off the company’s balance sheet.
International accounting rules require companies to account for securitised assets in thesame way as other financial asset transfers. The securitisation is recorded as a sale only if thetransferor loses control of the contractual rights that comprise the asset. Sometimes part of the asset is retained – for example, a bank may retain the right to service the loans securitised– and in this case, the carrying amount of the asset (loans) is allocated between the part soldand the part retained, based on their relative fair values at the date of sale. Note that the trans-feror must not control the SPE. If it does, the accounting benefits of securitisation – removingassets (and debt) from the balance sheet – no longer apply since the SPE’s accounts would thenbe consolidated with those of the company.
Enron, the US energy company that collapsed in 2001, made extensive use of SPEs to secur-itise its assets. Under US accounting rules then in force, it was able to remove the assets (andthe related debt) from its balance sheet even though in effect it controlled the SPEs.
Securitising receivablesBOX10.1
CFA_C10.qxd 11/6/03 2:36 PM Page 292

CHAPTER 10 • RECOGNITION OF REVENUE AND VALUATION OF RECEIVABLES 293
When a factored debt is deemed uncollectible, Ragueneau reimburses the factor and the liab-ility is reduced (Dr. Recourse obligation, Cr. Cash). If the liability proves to be an overestimate(i.e. bad debts on the factored receivables are less than 20,000), Ragueneau recognises a gain inthe amount of the residual liability.
Our example is simplified. A company factoring its receivables may well bear other costsbesides the factor’s fee and interest charges. Examples of such costs are sales returns and salesdiscounts. To cover them, the factor may hold back 5% or so of the invoice amount of the receiv-ables, charge the costs against the monies retained, and pay the balance to the company when allthe factored receivables have been collected.
Note that if Ragueneau transfers the receivables without recourse, the credit in the abovejournal entry is to ‘Bad debt expense’ rather than ‘Recourse obligation’. In this case, the factorbears the cost of bad debts. Ragueneau writes back that part of the previously established provi-sion for bad debts (Dr. Allowance, Cr. Bad debt expense) that relates to the receivables sold toLise Asset Finance.
An alternative to factoring that’s available to larger companies is to securitise receivables. Box 10.1 outlines how and why firms securitise financial assets.
l Discounting of billsA bill of exchange (or draft) represents an order to pay, drawn up by a supplier of goods or services instructing the customer to pay specified amounts on specified dates to either the selleror a third party (e.g. the seller’s bank).15 A bill signed (accepted) by the customer is known as an‘acceptance’. A sale evidenced by a bill of exchange offers the seller two advantages over a sale onopen account: greater legal security and, since the bill is negotiable, greater liquidity. Bills arewidely used in international trade.
A bill can be discounted (sold) before maturity. The holder – either the original supplier orsomeone to whom he has transferred the bill, usually for consideration, by endorsing it – pre-sents the bill to his bank and receives funds at a discount to the bill’s maturity value. Exhibit 10.6summarises the key events that occur during the life of a typical bill.
Companies account for bills in the same way as trade debts on open account. When a bill is issued in exchange for goods, it is stated initially at cost. Interest accrues from the issue date, usually on a simple rather than a compound basis. If the bill is impaired (i.e. part of the amounts owing is uncollectable), the holder of the bill writes it down to the recoverable amount.
Discounting of bills may give rise to accounting problems. If a supplier discounts a bill, herecords the transfer as a sale on the grounds that he has relinquished control of the asset. If thebill is discounted with recourse, the supplier accounts for it in the same way but, in addition,recognises a liability with respect to the recourse obligation. For example, suppose that on 1 May, Louis accepts a three-month bill for 20,000 presented by Ragueneau for food and winehe has supplied at a recent banquet. The bill carries an interest rate of 0.5% a month. On 1 July,Ragueneau discounts the bill at Crédit Hollandais: the discount rate is 0.625% a month. The discount rate on similar ‘no recourse’ bills is 0.75% a month. (Assume for simplicity a 30-daymonth, 360-day year.) The cash proceeds from the sale and the carrying amount of the bill inRagueneau’s books at 1 July are calculated as follows:
Cash proceeds from discounting of billMaturity value: 20,000 + [3 × (20,000 × 0.5%)] 20,300
(face value) (3 months’ interest)Less: Discount [1 month × (20,000 × 0.625%)] –125
20,175
CFA_C10.qxd 11/6/03 2:36 PM Page 293
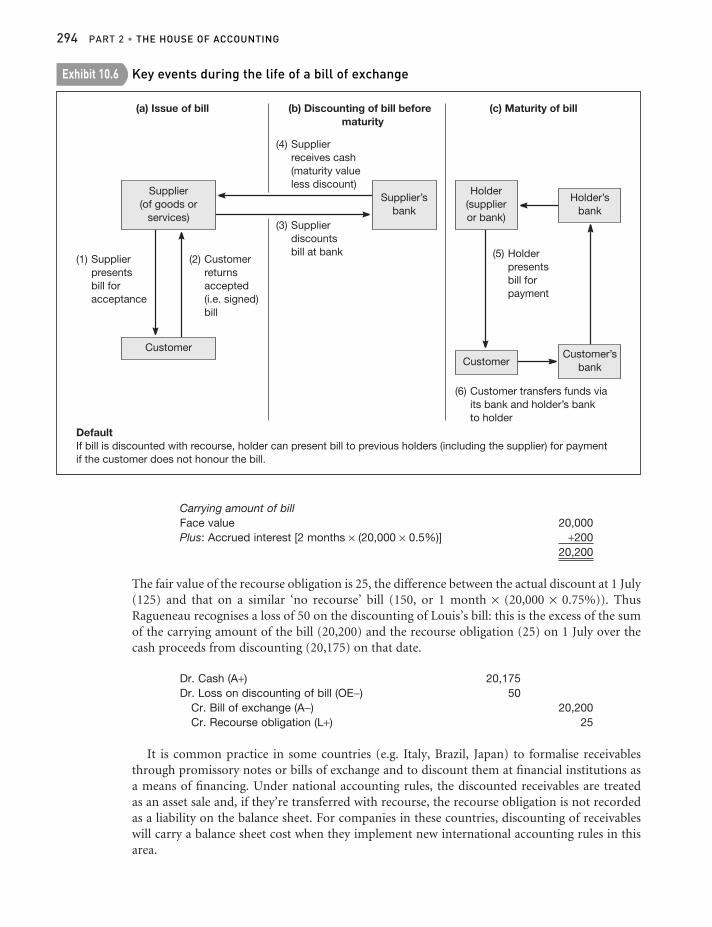
Carrying amount of billFace value 20,000Plus: Accrued interest [2 months × (20,000 × 0.5%)] +200
20,200
The fair value of the recourse obligation is 25, the difference between the actual discount at 1 July(125) and that on a similar ‘no recourse’ bill (150, or 1 month × (20,000 × 0.75%)). ThusRagueneau recognises a loss of 50 on the discounting of Louis’s bill: this is the excess of the sumof the carrying amount of the bill (20,200) and the recourse obligation (25) on 1 July over thecash proceeds from discounting (20,175) on that date.
Dr. Cash (A+) 20,175Dr. Loss on discounting of bill (OE−) 50
Cr. Bill of exchange (A−) 20,200Cr. Recourse obligation (L+) 25
It is common practice in some countries (e.g. Italy, Brazil, Japan) to formalise receivablesthrough promissory notes or bills of exchange and to discount them at financial institutions asa means of financing. Under national accounting rules, the discounted receivables are treated as an asset sale and, if they’re transferred with recourse, the recourse obligation is not recordedas a liability on the balance sheet. For companies in these countries, discounting of receivableswill carry a balance sheet cost when they implement new international accounting rules in thisarea.
294 PART 2 • THE HOUSE OF ACCOUNTING
Key events during the life of a bill of exchangeExhibit 10.6
CFA_C10.qxd 11/6/03 2:36 PM Page 294

CHAPTER 10 • RECOGNITION OF REVENUE AND VALUATION OF RECEIVABLES 295
Long-term receivables
A supplier of goods or services may grant a customer an extended period of credit. If the payment period stretches over more than one year, it’s customary for the supplier to state thereceivable at the present value of future scheduled receipts. (The customer records the payablein the same way.) The discount rate that the supplier uses to find the present value of futurereceipts is the market rate of interest prevailing at the date the sale transaction takes place. Sincereceivables are accounted for at (historical) cost, this rate should be used throughout the creditperiod. The ‘market rate’ is the rate of interest applicable to financial instruments of similar riskand maturity.
If, under the terms of sale, an interest rate is specified and the rate is equivalent to the marketrate, the accounting for the receivable is straightforward. The face and present values of thereceivable are the same and the interest income the supplier recognises each period is equal tothe interest it receives in cash. For example, suppose that Jacques Perron sells equipment to LiègeMines for 550,000. It agrees to defer collection for two years and, in exchange, Liège Mines willpay interest each year at 8%, the market rate of interest at the date of sale. Perron records the saleand the receivable at 550,000 and in each of the following two years he receives – and recognisesas income – interest of 44,000.
At date of saleDr. Note receivable, Liège Mines (A+) 550,000
Cr. Revenue from equipment sale (OE+) 550,000(Dr. Cost of equipment sold (OE−) xxx
Cr. Inventory (A−) xxx)
Each year, during the two-year credit periodDr. Accrued interest receivable (later, Cash) (A+) 44,000
Cr. Interest income (OE+) 44,000
On collection dateDr. Cash (A+) 550,000
Cr. Note receivable, Liège Mines (A−) 550,000
Perron computes interest income at 8%, the rate specified in the contract, even though thecurrent market rate of interest during the two years is a rate other than 8%. (The term ‘Notereceivable’ is used in place of ‘Account receivable’ where the sale contract is supported by a formal agreement specifying the amount and timing of future payments.)
l Measuring receivables carrying below-market interest rate
Consider now the case where the supplier offers a customer highly attractive financing terms onthe long-term receivable. Suppose it specifies in the sale contract a below-market interest rate –or no interest at all. For example, car manufacturers sometimes offer customers 0% financing asa sale promotion device. When this occurs, the face value of the receivable is no longer equal tothe present value of future scheduled receipts discounted at the historical market rate of inter-est. How does the supplier measure the receivable (and the sale revenue) in these circumstances?
The new international accounting standard on financial instruments (IAS 39) supports long-standing practice in this area. Recall the basic measurement rule: a receivable (or other financialasset) should be measured initially at cost and cost is equal to the fair value of the considerationgiven for it. If fair value isn’t readily determinable – because, for example, product specifications
CFA_C10.qxd 11/6/03 2:36 PM Page 295

(and credit terms) differ from one customer to another, the supplier measures the receivable bydiscounting future cash receipts at an imputed market interest rate.
We return to our Jacques Perron example. Suppose that, in response to its customer’s request,Perron changes slightly the equipment’s specifications and financing terms. Under the new deal,Liège Mines will pay 600,000 two years after the sale date plus interest at only 3% a year. Thecompany accepts the revised offer. Perron estimates the market rate of interest on such financ-ing is 8%. The fair value of the deal based on the new financing terms is 546,500. This amountis derived by discounting at 8% interest received at end-year 1 and interest and principal receivedat end-year 2. This is the only way of readily determining fair value in this case.
[18,000 × PV (8%, 1 period)] + [618,000 × PV (8%, 2 periods)] = 546,500
Perron measures the revenue from the sale and the initial receivable at this amount. (The cost ofequipment sold and reduction in inventory are recognised at the same time.)
Dr. Note receivable, Liège Mines (A+) 546,500Cr. Revenue from equipment sale (OE+) 546,500
Alternatively, the note can be stated at its face amount (600,000) and the difference betweenthe face and present values (53,500) recorded in a contra-asset account, ‘Discount on notereceivable’:
Dr. Note receivable, Liège Mines (A+) 600,000Cr. Discount on note receivable (CA+) 53,500Cr. Revenue from equipment sale (OE+) 546,500
In this case, Perron still shows the note receivable on the balance sheet at the net amount of546,500. (We ignore VAT here.)
To calculate annual interest income, Perron applies the historical market rate of interest of 8% to the start-of-year carrying amount of the receivable. Exhibit 10.7 shows the calculationof interest income in years 1 and 2.
In year 1, Perron recognises interest income of 43,720 (8% of the start-of-year carryingamount of the receivable) but receives in cash only 18,000 (3% of the receivable’s face value).
296 PART 2 • THE HOUSE OF ACCOUNTING
FactsPerron sells equipment to Liège Mines at start-year 1. Liège Mines is to pay Perron 600,000two years after sale date plus annual interest (on 600,000) at 3%. Market interest rate on suchfinancing is 8% a year. Present value of note receivable (N/R) at start-year 1 is 546,500.
Perron: calculation of interest income and end-year receivable
(A) (B) (C) (D) (E)N/R, Interest Interest Increase N/R,
start-year income received in N/R end-year(A) × 8% 600,000 × 3% (B) − (C) (A) + (D)
Year 1 546,500 43,720 18,000 25,720 572,220Year 2 572,220 45,780 18,000 27,780 600,000
(rounding)
Imputed interest on note receivable: illustrationExhibit 10.7
CFA_C10.qxd 11/6/03 2:36 PM Page 296

The difference between the interest income recognised and the interest received in cash isrecorded as an increase in the receivable (or, under the alternative presentation, as a reductionin the ‘discount’ contra-asset). By the end of year 2, the carrying amount of the receivable inPerron’s books is 600,000, the face value of the bill.
These are the mechanics. What is the conceptual basis for this accounting? Think of the ‘dis-count’ contra-asset as unearned interest income. With the passage of time, the unearned interestbecomes earned and is recognised within interest income: 25,720 in year 1 and 27,780 in year 2.Perron could bring the unearned interest into income in a different way – on a straight-linebasis, for example. The advantage of the ‘interest method’ is that the interest income Perronreports each period reflects the market rate of interest for this form of financing (i.e. 8%) at thetime the receivable arose.
Using the information in Exhibit 10.7, we reconstruct the journal entries Perron makes torecord interest earned and received in years 1 and 2 and the receipt of principal at the end of year 2:
End-year 1Dr. Cash (A+) 18,000Dr. Note receivable, Liège Mines (A+) 25,720
(or: Discount on N/R (CA−))Cr. Interest income (OE+) 43,720
End-year 2Dr. Cash 18,000Dr. Note receivable, Liège Mines 27,780
(or: Discount on N/R)Cr. Interest income 45,780
Dr. Cash (A+) 600,000Cr. Note receivable, Liège Mines (A−) 600,000
l Impairment of long-term receivablesWhat if a long-term receivable is impaired? For example, suppose a customer experiences finan-cial difficulties and the supplier/creditor no longer feels reasonably assured of collecting theamounts owing when due. In this event, the accounting is clear. The supplier/creditor normallyreduces the carrying amount of the receivable to its recoverable amount and recognises thereduction in that period’s income. It determines the recoverable amount in the same way asbefore – by calculating the present value of revised scheduled receipts (which are likely to besmaller and/or later than under the original contract).
What makes the accounting for impaired receivables unusual is the way they are measured.IAS require that, in calculating present value, the discount rate used should be the rate appliedinitially when the receivable was first recognised, i.e. the historical market rate. This is likely tobe less than the market rate at the time of impairment. Usually, a debtor forced to restructure itsdebt because of financial difficulties pays a higher interest rate to compensate lenders for thegreater credit risk they bear. Thus the accounting loss a supplier recognises on writing down anote receivable is likely to be less than the economic loss it sustains. Accounting regulators arguethat use of a current market rate implies fair value accounting and this is not consistent with theway receivables (and other financial assets carried at cost) are measured. It is also worth notingthat the most receivables-intensive companies and the ones most likely to suffer receivablesimpairment are banks (loans are a bank’s receivables) and they lobbied hard against use of a cur-rent market rate to value their troubled loans.
CHAPTER 10 • RECOGNITION OF REVENUE AND VALUATION OF RECEIVABLES 297
CFA_C10.qxd 11/6/03 2:36 PM Page 297
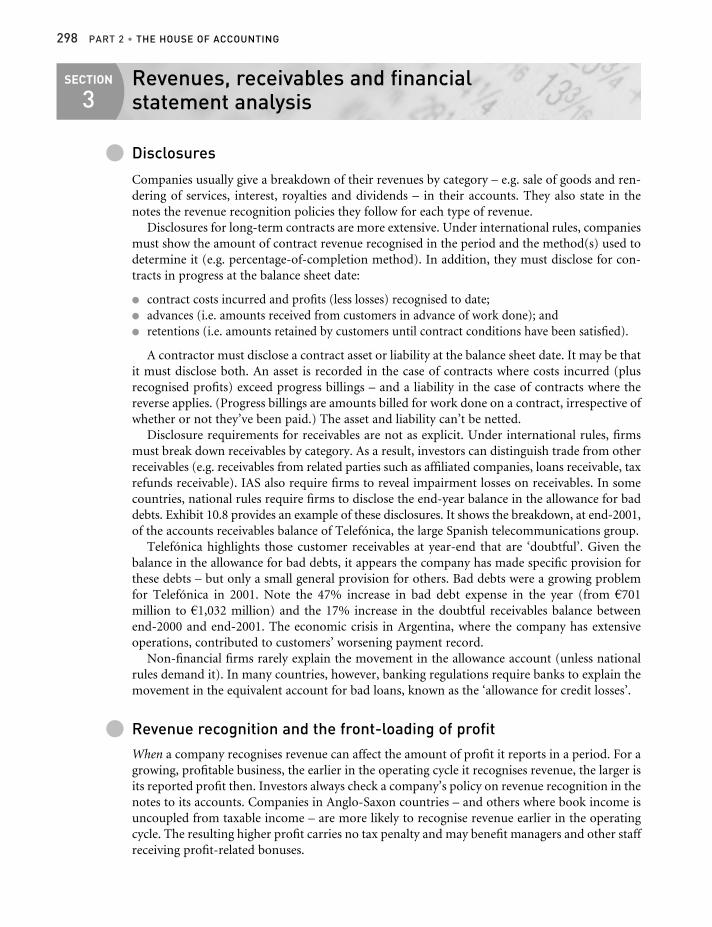
298 PART 2 • THE HOUSE OF ACCOUNTING
SECTION
3Revenues, receivables and financial statement analysis
l Disclosures
Companies usually give a breakdown of their revenues by category – e.g. sale of goods and ren-dering of services, interest, royalties and dividends – in their accounts. They also state in thenotes the revenue recognition policies they follow for each type of revenue.
Disclosures for long-term contracts are more extensive. Under international rules, companiesmust show the amount of contract revenue recognised in the period and the method(s) used todetermine it (e.g. percentage-of-completion method). In addition, they must disclose for con-tracts in progress at the balance sheet date:
l contract costs incurred and profits (less losses) recognised to date;l advances (i.e. amounts received from customers in advance of work done); andl retentions (i.e. amounts retained by customers until contract conditions have been satisfied).
A contractor must disclose a contract asset or liability at the balance sheet date. It may be thatit must disclose both. An asset is recorded in the case of contracts where costs incurred (plusrecognised profits) exceed progress billings – and a liability in the case of contracts where thereverse applies. (Progress billings are amounts billed for work done on a contract, irrespective ofwhether or not they’ve been paid.) The asset and liability can’t be netted.
Disclosure requirements for receivables are not as explicit. Under international rules, firmsmust break down receivables by category. As a result, investors can distinguish trade from otherreceivables (e.g. receivables from related parties such as affiliated companies, loans receivable, taxrefunds receivable). IAS also require firms to reveal impairment losses on receivables. In somecountries, national rules require firms to disclose the end-year balance in the allowance for baddebts. Exhibit 10.8 provides an example of these disclosures. It shows the breakdown, at end-2001,of the accounts receivables balance of Telefónica, the large Spanish telecommunications group.
Telefónica highlights those customer receivables at year-end that are ‘doubtful’. Given thebalance in the allowance for bad debts, it appears the company has made specific provision forthese debts – but only a small general provision for others. Bad debts were a growing problemfor Telefónica in 2001. Note the 47% increase in bad debt expense in the year (from a701 million to a1,032 million) and the 17% increase in the doubtful receivables balance betweenend-2000 and end-2001. The economic crisis in Argentina, where the company has extensiveoperations, contributed to customers’ worsening payment record.
Non-financial firms rarely explain the movement in the allowance account (unless nationalrules demand it). In many countries, however, banking regulations require banks to explain themovement in the equivalent account for bad loans, known as the ‘allowance for credit losses’.
l Revenue recognition and the front-loading of profitWhen a company recognises revenue can affect the amount of profit it reports in a period. For agrowing, profitable business, the earlier in the operating cycle it recognises revenue, the larger isits reported profit then. Investors always check a company’s policy on revenue recognition in thenotes to its accounts. Companies in Anglo-Saxon countries – and others where book income isuncoupled from taxable income – are more likely to recognise revenue earlier in the operatingcycle. The resulting higher profit carries no tax penalty and may benefit managers and other staffreceiving profit-related bonuses.
CFA_C10.qxd 11/6/03 2:36 PM Page 298

Because of the link between revenue and profit, firms in separate reporting countries aretempted to exploit it. Investors watch out for the practice of ‘front-loading’ – stealing revenuesfrom a future period in order to boost revenues (and profits) in the current one. Box 10.2 describesother ways in which firms inflate their current revenues.
How can investors tell when managers are playing this game? Receivables provide a clue. If afirm’s receivables grow at a faster rate than its credit sales in a period – and there are no con-vincing business explanations for the divergence (e.g. new product lines with different creditterms or loosening of credit terms on existing lines), this suggests that the firm has changed theway it recognises or measures revenues.
l Receivables turnoverAs we’ve already seen, investors and managers assess the efficiency with which a company usesits resources by monitoring the rate at which it turns over its assets in a period. In the case ofreceivables, the turnover rate is usually expressed in a more readily interpretable form as theaverage credit period taken by customers. We set out both versions of the ratio in this section.
To compute the receivables turnover, credit sales in the year are divided by the average levelof accounts receivable outstanding during the year:
Receivables turnover (in year) ==Annual credit sales, net
Average net accounts receivable
CHAPTER 10 • RECOGNITION OF REVENUE AND VALUATION OF RECEIVABLES 299
Note 10. Customer receivables
The detail of the balances of this caption as of December 31, 2001 and 2000, is as follows:
Balance at Balance atMillions of euros 12/31/01 12/31/00
Services billedCustomer receivables billed 3,005.49 3,688.67Doubtful customer receivables 1,606.11 1,340.97Other receivables 47.16 46.09
4,658.76 5,075.73Unbilled services 2,124.48 1,903.33
6,783.24 6,979.06Allowance for bad debts (1,692.89) (1,449.76)Total 5,090.35 5,529.30
The ‘Unbilled services’ account includes the connection, monthly and metered service charges not yet billed by the Group operators. This amount arises because these companies’subscriber billing schedules do not coincide with December 31.
The balance of the public-sector customer receivables in the countries in which the Group operates amounted to A410.16 million as of December 31, 2001 (A486.29 million as of December 31, 2000).
In 2001 provisions amounting to A1,032.62 million (A701.09 million in 2000) were recorded inthis connection.
Telefónica Group: extract from notes to accounts, 2001Exhibit 10.8
(Source: Telefónica Group, Annual Accounts 2001.)
CFA_C10.qxd 11/6/03 2:36 PM Page 299

300 PART 2 • THE HOUSE OF ACCOUNTING
Revenue gamesBOX10.2
According to the FASB, the US accounting regulator, revenue recognition is the most commonissue in cases of fraudulent accounting and accounting restatements in the USA. Anecdotalevidence based on news stories in the international business press suggests that revenues are amajor source of creative accounting in other countries, too.
Revenue misstatement usually takes one of two forms – recording revenues early or over-stating them. (We consider only non-fraudulent accounting here: in fraudulent cases, revenuesare fabricated.) Premature recognition is a problem in both the manufacturing and the servicesectors. In the case of goods, it usually arises because companies bring forward the deliverydate artificially – or recognise revenue before delivery. A US maker of household appliances,provides an example of this. It achieved notoriety in the 1990s for its policy of ‘bill and hold’.Under the policy, a retailer agreed to buy the appliances subject to later delivery and pay-ment. The company recognised revenue on the contract date and stored the goods in a ware-house until the retailer called for them. This accounting policy came to light in 1998 and thecompany was forced to restate its 1996 and 1997 results. (It later filed for bankruptcy protec-tion in 2001.)
In the case of services, long-term contracts are often the reason for early recognition of revenue. The supplier books revenue in full when a service contract is signed or the customermakes non-refundable payments, even though it has continuing obligations under the con-tract. Instances of premature revenue recognition have increased in recent years because of thegrowth of outsourcing. Companies (and governments) now contract out many activities pre-viously performed in-house and these contracts often extend over several accounting periods.
Revenue misstatement can also be traced to aggressive measurement practices. The dotcombubble of 1999–2000 produced some interesting examples. Priceline, an Internet company thatoffered discounted airline tickets and hotel rooms, reported as revenues the gross amount ofthe booking (e.g. the price of the hotel room or airline ticket) even though most of the cashwent to the hotel or airline. By contrast, travel agencies report as revenue only their commissionon the booking. Priceline claimed that, unlike a travel agent, it assumed the risks of owningthe ticket/hotel booking, even if for a short period, and its commission was not fixed. (TheSEC accepted this argument.) Promotional discounts offer another means of revenueinflation. For example, an online flower service offers all customers an electronic coupon thatcuts 20% off the a25 posted price of a floral bouquet. What is the revenue from a sale, a25 (andmarketing expenses of a5) or a20? Note that, in both examples, operating profit (or, morelikely, loss) is not affected.
Why do companies misstate revenues in these ways? ‘Channel stuffing’ (i.e. pushing goodsonto distributors) and ‘bill and hold’ practices can often be traced to sales-based compensa-tion schemes. Divisional managers are awarded bonuses based on meeting sales targets. Topmanagement stretches the targets to encourage ‘outperformance’. Top managers themselveshave an economic interest in raising sales. Higher revenues usually result in higher profits andtheir wealth is linked either directly (via profit-related bonuses) or indirectly (e.g. value ofshare options, market earnings power) to the level and rate of increase of their company’sprofits. For start-up companies that make losses and have negative cash flows, the link betweenrevenues and management wealth is more direct. These companies cannot be valued on thebasis of current earnings or cash flows. A practice common in the dotcom bubble years was touse a price/revenue multiple to value them. To the extent that top management believe theirfirms are valued in this way, they have an incentive to boost reported revenues, even if there isno impact on the bottom line.
CFA_C10.qxd 11/6/03 2:36 PM Page 300

CHAPTER 10 • RECOGNITION OF REVENUE AND VALUATION OF RECEIVABLES 301
By dividing the resulting turnover figure into the number of days in the year, the average time(in days) a firm’s customers take to pay their accounts can be computed:
Average credit period taken by customers (in days) ==
This version of the receivables turnover ratio is sometimes known as (the number of) days’ salesin receivables.
The above ratios are used to assess how long it takes a firm to collect cash from customers towhom it has granted credit. Obviously, for cash sales collection occurs at the time of sale. Thus thenumerator of the receivables turnover ratio should be based on credit sales only. Moreover, thegross amount of credit sales is usually greater than the cash actually received and retained: thus inthe ratio, credit sales (and receivables) should be shown net of VAT, duties, discounts and returns.For similar reasons, numerator and denominator should be adjusted for estimated bad debts.
As with all ratios, care should be taken when interpreting a company’s receivables turnoverrate. ‘Average receivables’ is usually a simple average of start- and end-year figures. If a companychooses its year-end at that point in the year when cash is normally high and non-cash workingcapital low, its receivables turnover will appear high.
There can be many reasons for changes in the turnover rate over time. For example, a reductionin the credit period (and thus a faster turnover rate) may indicate tighter credit management. Itcan also be the consequence of the firm factoring part of its receivables.
Summary
A company recognises revenue – from selling a good or performing a service – when it expectsthe transaction will bring it economic benefits and it can measure them reliably. In the case ofgoods, this usually occurs at the point of delivery, since the risks (and rewards) of ownership aretransferred to the buyer then. An exception is when goods are produced under long-term contractand the profit on the contract can be estimated with a reasonable degree of accuracy. In thisevent, the preferred approach is for the firm to recognise revenue during production on the basisof work completed (percentage-of-completion method). Revenues from services should be recog-nised in the same way, that is, by reference to the stage of completion of the service transaction.
A company records a trade receivable when it recognises revenue from a credit sale. Receiv-ables are stated in the balance sheet at realisable value. For short-term receivables, realisablevalue is the invoice amount of the receivable. For long-term receivables, it is the present value offuture scheduled payments by the customer, discounted at the market rate of interest on equi-valent loans when the receivable arose.
Realisable value falls if receivables are uncollectible. A company must write down its receiv-ables to their recoverable amount when they’re impaired in this way. The usual procedure is tomake a provision for bad debts on an estimated basis and write off actual bad debts against theprovision (allowance method). Where a long-term receivable is impaired, the company writesdown the carrying amount to the present value of the revised scheduled payments – using theoriginal discount rate – and recognises a loss.
Receivables transferred before maturity, whether factored or discounted, are recognised as asale only if the transferor has relinquished control over the asset. Otherwise, the transfer isaccounted for as a borrowing, with the receivables acting as security for the loan.
Investors monitor revenues and receivables closely. Aggressive revenue recognition practicescan lead to the ‘front-loading’ of profit. Careful monitoring of receivables can help unmask ‘hollow’ revenues. Where this occurs, a firm’s receivables grow faster than its revenues and itsreceivables turnover falls.
365
Receivables turnover
CFA_C10.qxd 11/6/03 2:36 PM Page 301

302 PART 2 • THE HOUSE OF ACCOUNTING
Problem assignments
P10.1 Recognising revenue: innovative practices
New revenue recognition practices emerge as companies seek to adapt traditional methods to newcircumstances. The following are examples of new practice.
(a) A van hire company acquires a large number of vans for use in its business. The supplier gives ita discount in view of the number of vehicles purchased. The van hire company reports the bulkvehicle discount as revenue. In the year to 30 April 2001, revenue from bulk purchase discountsrepresents 48.8 million of the company’s total revenues of 310.6 million.
(b) A biotechnology company undertakes substantial research to discover new drug compounds. Tohelp finance its research efforts, it enters into drug delivery agreements with major pharmaceut-ical companies. In addition, it licenses to other drugs companies products and technology that ithas developed in-house.
The drug delivery and licensing agreements result in substantial licensing income. Where theamounts received are non-refundable or the potential risk of repayment is remote, the companyrecognises income from licensing on the date the contract takes effect. Where the licensingincome is receivable in stages, the company defers part of the licensing income until conditionsspecified in the contract have been met.
(c) Newtel is a recently established telecoms company that markets itself as an alternative carrier toexisting national telecoms companies such as AT&T, Deutsche Telekom and NTT. It has investedheavily to build a ‘backbone’ network to carry Internet traffic which is growing rapidly. In order togive customers global communications cover, it leases capacity on other companies’ networkswhere there are gaps in its own. (These leases are known as IRUs or indefeasible rights of use.) Itpays for the long-term leases through reciprocal arrangements in which other carriers leasecapacity on its network to fill gaps in their networks. Although the exchanges are referred to as‘swaps’ in the business press, Newtel insists that they are separate transactions since each saleor purchase is priced individually and evaluated separately.
Newtel records capacity leased out as a sale and books the whole revenue from the long-termlease at the date of the contract. Other carriers account for Newtel’s lease of capacity on their net-works in the same way.
Required
Is the method of revenue recognition used in each of the above situations acceptable in your opinion? Explain why (or why not). If the method is unacceptable, how should the company accountfor the transaction?
P10.2 Revenue and profit recognition: the film industry
In addition to its theme parks in the USA, Europe and Japan, the Walt Disney Company is a majorproducer of feature films and television programmes. It follows industry practice when recognisingrevenue and profit from film production and distribution. Its accounting policies concerning film pro-duction and distribution are set out below; they’re taken from the notes to its 2001 accounts.
Revenue recognition Revenues from the theatrical distribution of motion pictures are recognized whenmotion pictures are exhibited. . . . Revenues from the licensing of feature films and television program-ming are recorded when the material is available for telecasting by the licensee and when certain otherconditions are met. [ . . . ]
CFA_C10.qxd 11/6/03 2:36 PM Page 302

Film and television costs Film and television production and participation costs are expensed based onthe ratio of the current period’s gross revenues to estimated total gross revenues from all sources on anindividual production basis. . . . Estimates of total gross revenues can change significantly due to a vari-ety of factors, including the level of market acceptance of film and television products, advertising ratesand subscriber fees. Accordingly, revenue estimates are reviewed periodically and amortization isadjusted, if necessary.
Required
Comment on the way Disney (and other film companies) calculate periodic expense when determin-ing the profit from the distribution and licensing of films. What are the risks to investors from theaccounting methods used?
P10.3 Alternative revenue recognition pointsThe Tell Company manufactures a novel apple-shaped archery target. Each archery target costs A6to produce and A1 to sell. The selling costs are period costs and are incurred (and recognised) whentargets are delivered to retailers. Tell sells them at a price of A10 each. All sales are on account. Dataon production, delivery and cash collection in the first and second years of the company’s existenceare summarised below:
Year 1 Year 2Units produced 10,000 8,500Units delivered 8,000 9,500Cash collected A75,000 A87,000
Required
Calculate revenues, expenses (production and selling expenses) and operating profit in years 1 and2, assuming Tell recognises revenue:
(a) when units are produced;
(b) when units are delivered;
(c) when cash is collected.
P10.4 Revenue recognition issues in a dotcom companyESoccer is an Internet-based media company serving soccer enthusiasts worldwide since its found-ing four years earlier in x1. It provides up-to-the-minute information on the soccer world (teams, play-ers, games etc.) in audio and video form and sells soccer-related merchandise and memorabilia.
The company generates revenue from four main sources: advertising, e-commerce, content licens-ing and membership services. ESoccer charges advertisers for displaying advertisements on its web-sites. It sells soccer-related products and services (e-commerce). It licenses its content (e.g. soccernews, feature articles) to third parties. Finally, for members of its ESoccerClub schemes, it offersbonus points for viewing pages and making purchases and, for additional fees, the opportunity to par-ticipate in contests with cash prizes.
The company reported total revenues of A30 million in x5, a 100% increase on the x4 figure.Operating losses were A28 million that year, up from A19 million in x4.
Part A Advertising revenues
According to the company’s statement of accounting policies, ‘advertising revenue is recognised inthe period the advertisement is displayed, provided that no significant company obligations remainand collection of the resulting receivable is probable’. Company obligations typically include guaran-tees of a minimum number of ‘impressions’, or times that an advertisement is viewed by users of thecompany’s websites.
CHAPTER 10 • RECOGNITION OF REVENUE AND VALUATION OF RECEIVABLES 303
CFA_C10.qxd 11/6/03 2:36 PM Page 303

Required
Suppose that ESoccer bills an advertiser A100,000 at the start of the fourth quarter of x5, based on acertain number of impressions being delivered by end-x5. Only 85% of the impressions are deliveredby year-end, however. Assuming the number of impressions delivered is above the guaranteed min-imum and the advertiser has not yet paid the bill, show the effect on ESoccer’s accounts of:
(a) the initial billing; and
(b) the end-year adjustment ESoccer makes to its x5 accounts.
How would your answers to (a) and (b) differ if the guaranteed minimum number of impressions wasequivalent, in billing terms, to A90,000?
Part B Membership scheme and bonus points
The company launched a points scheme in x5 for members of its ESoccerClub. Members of the clubcan earn points – from registering as members, spending time on the company’s websites and making purchases. For example, members can earn 10 points for every A1 spent at the company’sonline store. They can then spend the points on further purchases or on special soccer-related eventspromoted by the company. For every 100 points earned, a member can save A1 on his or her nextpurchase at the company’s online store. When making purchases, a member has the choice of usingpoints or allowing them to accumulate. Points expire two years after they are earned. The companyrecognises the cost of points earned when members use them. It makes a year-end adjustment in itsaccounts for the estimated cost of the change in unused points over the year.
Required
Prepare the accounting entries ESoccer makes to record the following events in December x5.
(a) Members purchase merchandise for cash from ESoccer’s online store. The goods have a marketvalue – before discounts – of A500,000 and cost the company A400,000. Members use 2 millionpreviously earned points when paying for the goods.
(b) According to the company’s records, there are 20 million unused points at end-December x5. Thecompany estimates that 16 million of these points will be used before the expiry date. Since thepoints scheme only began in x5, the company has not yet recognised any cost of unused pointsin its accounts.
Part C Barter transactions
ESoccer exchanges advertising space – and content – on its web pages for advertisements on otherwebsites as well as on TV and radio. According to the notes to the company’s x5 accounts, bartertransactions accounted for 17% of total revenues in x5 and slightly higher proportions in x4 and x3.The revenues are stated at the fair value of the services (e.g. advertising space) that ESoccer receivesin exchange.
Required
(a) What would be the effect on the company’s x5 income statement if it were not permitted to recognise barter transactions in its published x5 accounts? State any assumptions you’ve madein answering this question.
(b) Barter transactions are common among media companies. For traditional media firms, barterdeals are usually no more than 5% of sales. Among some start-ups, however, barter may rep-resent half of revenues and even for established Internet companies like ESoccer, the proportioncan reach 15–20%. Some investors claim that counting barter deals as revenue is fraudulentaccounting. Why are investors suspicious of web-based barter transactions?
304 PART 2 • THE HOUSE OF ACCOUNTING
CFA_C10.qxd 11/6/03 2:36 PM Page 304

P10.5 Recognising revenue on long-term contracts IThe Stevin Company has just won a major land reclamation contract from the Dutch government. Thevalue of the contract is A800 million and the work is expected to take four years. The expected con-tract cost is A550 million. Stevin recognises revenue on long-term contracts on a percentage-of-completion basis.
Required
(a) Stevin estimates that the percentage of the total work that will be completed each year is as follows:
Year 1 Year 2 Year 3 Year 418% 28% 32% 22%
Estimate the profit or loss the company will recognise on the contract in each of years 1–4.
(b) Year 1 outcomes are as forecast. However, during year 2, Stevin encounters major difficulties withthe contract. The estimated cost rises to A700 million. Only 40% of the contract work will be doneby end-year 2 and 75% by end-year 3. Stevin still reckons it can complete the whole of the con-tract by the end of year 4.
The time is mid-year 2. Revise the estimates of contract revenue and profit for years 2–4.
Check figure:(b) Cumulative profit, end-year 3 A75m
P10.6 Recognising revenue on long-term contracts II*Early in x4 Hephaestus Construction Company was awarded a three-year contract by the French andSpanish governments to build a road tunnel through the Pyrenees. The value of the contract was5,100. (All amounts are in millions of euros.) The tunnel was completed on schedule by late x6.Information about costs incurred, billings made and payments received is set out below:
(In millions) x4 x5 x6
Cumulative costs incurred 1,000 2,520 4,100Costs to be incurred (estimated at year-end) 3,000 1,680 –Progress billings in year 1,000 1,500 2,600Progress payments received in year 900 1,400 2,000
Required
(a) Compute the profit or loss Hephaestus recognises on the contract each year in x4, x5 and x6 under:(i) the percentage-of-completion (POC) method (assume ‘costs incurred’ approximate work
completed);(ii) the completed contract method.
(b) Show the effect of this contract on the company’s x4–x6 balance sheets under each revenuerecognition method. Assume all costs incurred are paid in cash in the year.
Check figure:(b) Cumulative profit on contract,
end-x5, POC method 540
* Problem assignment draws on material in section 2 of this chapter.
P10.7 Calculation of bad debt expenseHarpagon is known to be a miser. One of his great worries is the customers to whom he extends credit.He’s concerned that they will take advantage of his credit terms of ‘net 30 days’ (which he describesas ‘generous’) and delay payment to the very end of the period or even beyond it.
CHAPTER 10 • RECOGNITION OF REVENUE AND VALUATION OF RECEIVABLES 305
CFA_C10.qxd 11/6/03 2:36 PM Page 305

The balance sheet of Harpagon’s company shows the following balances at the end of x7 (allamounts are in euros):
End x7Accounts receivable, gross 410,000Less: Allowance for bad debts (22,000)Accounts receivable, net 388,000
During x8, the company makes cash sales of 1.8 million and credit sales of 3 million. It collects 2.85million from credit customers. It writes off 30,000 of bad debts (these relate to both x7 and x8 sales).
At the end of x8, Harpagon carries out an ageing analysis of receivables. The results are as follows:
Numbers of days past dueTotal Current 1–30 31–60 >60
Percentage of x8 receivables 100 45 35 12 8Percentage expected to be uncollectible 0.5 1.5 10 40
Required
(a) Calculate the following for the company:(i) gross accounts receivable at end-x8;(ii) allowance for bad debts at end-x8 (round to nearest 000);(iii) bad debt expense recognised in x8.
(b) How would your calculations in (a) differ if the company recovered, at the end of x8, 3,000 of thebad debts written off earlier in the year?
Check figure:(a) (iii) 35,000
P10.8 Accounts receivable data in published accountsBenetton is a large Italian clothing manufacturer and retailer. Accounts receivable are a significantasset, amounting to a third of the group’s total reported assets of A2.82 billion at the end of 2001. Theend-year receivables figures for 2000 and 2001 are analysed below. They are taken from the group’s2001 balance sheet and are shown net of the allowance for bad debts.
At 31 December(In B000) 2001 2000Accounts receivableTrade receivables 849,504 815,319Due from subsidiaries, associated companies
and the parent company 2,782 5,850Other receivables 94,677 116,368Total accounts receivable 946,963 937,537
Benetton provides additional information on its receivables in a note to its accounts (Note 5) repro-duced in Exhibit 10.9.
Required
(a) Benetton gives information about the allowance for bad debts (‘doubtful accounts’) in Note 5 to its2001 accounts. What is the charge the company made for bad debts in its 2001 income statement?
(b) Benetton reports the following sales in 2000 and 2001.
(In B000) 2001 2000Revenues from sales and services 2,097,613 2,018,112
Benetton’s year-end trade receivables appear high in relation to sales in both 2000 and 2001. Why?
(c) Suggest a reason for the large VAT receivable at year-end.
306 PART 2 • THE HOUSE OF ACCOUNTING
CFA_C10.qxd 11/6/03 2:36 PM Page 306

CHAPTER 10 • RECOGNITION OF REVENUE AND VALUATION OF RECEIVABLES 307
P10.9 Accounting for long-term receivables*
Mobile phone operators in Europe were financially stretched in the early 2000s as a result of largepayments on third-generation (3G) licences and the cost of establishing 3G networks. Many asked for– and received – favourable financing terms from telecom equipment makers such as Nokia andMotorola.
In one such deal with a face value of A500 million, Mapletel provides vendor financing on the saleof equipment to Eco, a Spanish mobile phone operator. Under the terms of the contract, Eco receivesthe equipment in the final quarter of 2003. It pays for the equipment in two equal instalments of A250 million at the end of 2004 and 2005. Interest accrues from 1 January 2004 at the rate of 2% a year and is payable on 31 December 2004 and 2005 on the balance outstanding in the previous 12 months. The market rate of interest on loans of equivalent risk and maturity is 6% a year.
Required
(a) How should Mapletel account for the Eco equipment sale and financing? Show, via journal entriesor the balance sheet equation, the effect of the contract on Mapletel’s accounts at the time of salein late 2003 and at the end of 2004 and 2005?
Note 5 Accounts receivable
Trade receivables. As of December 31, 2001, trade receivables, net of the allowance fordoubtful accounts, amount to 849,504 (815,319 as of December 31, 2000), of which 209,012are in foreign currency. Of currency hedging transactions, valued at year-end exchange rates,125,803 refer to accounts receivable and 74,138 to orders from customers.
Trade receivables also include 46,287 (90,321 as of December 31, 2000) of bank receiptsand notes deposited with financial institutions.
The allowance for doubtful accounts as of December 31, 2001 amounts to 67,326 (62,836 as of December 31, 2000). 17,149 of this reserve was used during the year. A prudent assessment of the specific and generic risks associated with receivablesoutstanding at year-end has resulted in an additional provision of 23,051 to take account ofthe aging of certain balances and the difficult economic conditions in a number of markets.
Due from subsidiaries, associated companies and the parent company. Accounts receivablefrom subsidiary companies, amounting to 2,739, are financial receivables, while those fromassociated companies (41) and the parent company (2) are trade receivables.
Other receivables. These mainly include:
l VAT recoverable from the tax authorities of 17,851 (18,943 as of December 31, 2000), of which 987 is due beyond 12 months;
l Tax credits of 7,837 (9,191 as of December 31, 2000), of which 313 is due beyond 12 months;
l Other amounts due from tax authorities of 36,382 (33,201 as of December 31, 2000), ofwhich 409 is due beyond 12 months. The item includes 32,240 of net deferred tax assets;
l Accounts receivable from disposals of fixed assets of 3,878 (3,567 as of December 31,2000), of which 174 is due beyond 12 months.
The remaining amount relates to advances to agents and receivables from funded projects.
Benetton Group: extract from notes to 2001 accounts (amounts in A000)Exhibit 10.9
(Source: Benetton Group, Annual Report 2001. Reproduced by permission of Benetton Group.)
CFA_C10.qxd 11/6/03 2:36 PM Page 307

308 PART 2 • THE HOUSE OF ACCOUNTING
(b) Eco experiences liquidity problems in 2004. At the end of the year, Mapletel agrees to defer col-lection of the annual instalments by one year – to end 2005 and 2006, respectively. Interest con-tinues to accrue at the rate of 2% a year and is payable at the end of each year of the revisedagreement (2004–06) on the balance outstanding in the previous 12 months. To secure equivalentfinancing, Eco would have to pay 12% a year. What is the effect of the receivable restructuring onMapletel’s 2004 accounts? Assume Eco has paid 2004 interest (of 10) to Mapletel by the end of2004.
* Problem assignment draws on material in section 2 of this chapter.
Notes to Chapter 10
1 International Accounting Standards Board, IAS 18: Revenue.2 It is standard practice in many countries for a company to specify in the contract of sale that it retains
title to the goods until the buyer has paid for them. This makes it easier for it to recover the goods inthe event the buyer defaults on its debts. A ‘retention of title’ clause does not mean that the sellerretains significant ownership risks and should not affect when it recognises revenue.
3 International Accounting Standards Board, IAS 41: Agriculture.4 IAS 18: Revenue, op. cit.5 European Commission (1997), Communication from the Commission: Report on late payments in
commercial transactions, Official Journal C216, 17 July, pp. 10–24.6 European Commission (2000), Directive 2000/35/EC on combating late payment in commercial
transactions, Official Journal L200, 8 August, pp. 35–38. Under the Directive, interest is to accrue from30 days after the invoice date (or goods receipt date, if later), unless the contract specifies an altern-ative date. The interest rate is a penalty rate of seven percentage points above the European CentralBank refinancing rate (or the equivalent national rate in countries outside the eurozone).
7 Mian, S. and Smith, C.W. (1994), Extending trade credit and financial receivables, Journal of AppliedCorporate Finance, Summer: 75–84.
8 International Accounting Standards Board, IAS 39: Financial Instruments: Recognition andMeasurement.
9 Foreign trade gives rise to special problems. For imports from non-EU countries, the importer bearsthe cost of VAT (and customs duties). The customs office will not release goods until VAT and dutieshave been paid. The EU abolished customs controls within the EU when the single market was intro-duced in 1993, so ‘imports’ from EU states can no longer be taxed in this way. Nonetheless, the destina-tion principle still applies to intra-Union trade. Exports to other EU states continue to be zero-rated.As for imports from member states, the purchaser now declares and pays VAT on them, at the localrate. This self-assessed VAT can then be recovered as input tax. The intention is that, whether goodsand services are acquired locally or from other EU states, they bear the same VAT rate.
10 The opportunity cost in this case is almost 32% on an annual basis. Hagenstroem saves 1.5 on everypurchase costing 100 by paying 20 days early (10 days rather than 30 days after the invoice date). Thisis a return of 1.523% (1.5/98.5) in a 20-day period. The annual return is 31.76% (1.0152318.25), giventhat there are 18.25 periods of 20 days in a year (365/20) and the periodic return is compounded.
11 Recoveries can be credited to a separate income statement account (e.g. ‘Gain from recovery of baddebts written off ’). In this case, recorded bad debt expense is 25,000. Note, however, that the netimpact is still a reduction of 23,000 in before-tax profit.
12 The asset account ‘CIP, at fair value’ carries other titles – for example, ‘Contract costs incurred andrecognised profits to date’.
13 International Accounting Standards Board, IAS 11: Construction Contracts. Contract revenues covernot only amounts initially agreed in the contract but also variations in contract work (e.g. changes inspecification or design), claims made by the contractor and incentive payments (when the contractormeets or exceeds specified performance standards), so long as these additional amounts are likely to result in revenues and can be estimated reliably. Contract costs include direct costs (e.g. labour,materials), indirect costs that are related to contracts in general (e.g. overheads such as insurance and
CFA_C10.qxd 11/6/03 2:36 PM Page 308

payroll processing costs) and any other costs specifically chargeable to the customer under the termsof the contract.
14 IAS 39, op. cit. As each instalment is received, the supplier determines the sale and interest com-ponents and recognises the revenue from each separately. We ignore interest here, to keep our example simple.
15 The terminology can be confusing. In essence, a bill or draft involves three parties: the first (the‘drawer’) instructs a second (the ‘drawee’) to pay a third (the ‘payee’). The drawer is the initiator ofthe bill: he or she can be either seller or customer. For example, a cheque is a form of bill, initiated bythe customer: he or she, as drawer, instructs his or her bank (the drawee) to pay the seller of the goodsor services (the payee) the sum stated on the cheque.
Sometimes the instrument contains a promise rather than an order. In a promissory note, the cus-tomer promises to make specified payments on specified dates to the supplier. Like bills of exchange,promissory notes can be discounted.
CHAPTER 10 • RECOGNITION OF REVENUE AND VALUATION OF RECEIVABLES 309
CFA_C10.qxd 11/6/03 2:36 PM Page 309

Liabilities, on and off balance sheet
INTRODUCTIONIn this chapter we study the accounting for and reporting of liabilities.Liabilities are a source of capital for companies. They differ from equity cap-ital in that they are of fixed term. A common feature of all liabilities is that thedebtor must, at some future date, transfer resources – cash or goods or services– to the creditor to settle the debt. Because of the breadth of the subject, weadopt a selective approach here. We review the general features of all liabilitiesand examine in more depth the accounting for long-term debt and lease commitments.
Section 1 of the chapter deals with general issues. We return to the concep-tual framework described in Chapter 7 and recall how a liability is defined,when it’s recognised and how it’s measured. This framework applies to estim-ated as well as firm liabilities. Not everyone accepts it, however. We discussbriefly four areas of continuing controversy: provisions, off-balance-sheetdebt, financial commitments and measurement of non-monetary liabilities.
In section 2 of the chapter we explore in greater depth the accounting forlong-term debt. The key question we address here is a measurement one: whatis the cost of debt? The question is particularly important when a companyissues debt at a discount (or premium) to its face value.
Leasing – and, in particular, the accounting for lease commitments by thelessee – is the subject matter of section 3 of the chapter. (We consider the topicfrom the lessor’s angle in an appendix to the chapter.) We distinguish twotypes of lease – the operating and the finance lease – and illustrate the account-ing for each.
Presentation and disclosure also matter. In section 4 of the chapter we lookat the way a company presents liabilities on the face of its balance sheet andindicate what additional information about long-term debt and leases aninvestor can expect to obtain from the notes. We also describe certain balancesheet and income statement ratios investors employ to assess a firm’s financialleverage.
1111
SECTION 1General issues
l Definition,recognition andmeasurement
l Problem areas
SECTION 2Long-term debt
l Economic and legalbackground
l Initial recognition andmeasurement
l Determining theperiodic cost of debt
l Derecognition
l Accounting for debt:international practice
SECTION 3Leasing
l Types of lease
l Lessee accounting
SECTION 4Liabilities and financialstatement analysis
l Appendix: Leasing –lessor accounting
In this chapter
CFA_C11.qxd 11/6/03 3:06 PM Page 310

CHAPTER 11 • LIABILITIES, ON AND OFF BALANCE SHEET 311
SECTION
1 General issues
Definition, recognition and measurement
l Definition of liabilityThere are many types of accounting liability. Some are contractual (e.g. amounts owed to sup-pliers); others are non-contractual (e.g. amounts owed to government agencies for taxes). Someare for known amounts (e.g. a bank loan); others are estimated (e.g. a provision for pensionbenefits). However, all share the following elements: in all cases, the company:
l has a present obligation . . .l arising from a past transaction or event . . .l that is expected to result in an outflow of economic resources to settle it.1
An accounting liability is an obligation, that is ‘a duty or responsibility to act in a certainway’.2 As we saw in an earlier chapter, an obligation need not be legally enforceable: it can arisefrom custom. A company that has a policy – but no contractual commitment – to give awardsto long-serving employees has a constructive liability and should provide for the future cost ofawards as employees earn them.
A future commitment is not a present obligation. When a customer places an order with asupplier, each party makes a commitment: the supplier to furnish the goods and the customerto pay for them. As one side carries out its promise, the other records an accounting liability. Ondelivery of the goods, the customer records the amount owing to the supplier as an accountpayable. Should the goods be paid for in advance, the supplier records the payment as deferredrevenue. The delivery of goods or the advance payment is the past event which gives rise to thepresent obligation.
Normally, a company settles a liability by paying cash or providing goods or services toanother party. These are the ‘economic resources’ it gives up. But settlement can take otherforms. A company can swap debt for equity or new debt. And a debtor in financial difficultiesmay find its liability extinguished by a kindly creditor that waives its rights. In this case, althoughthe debtor expected to transfer resources, the creditor’s action means it avoids doing so.
l Recognition and measurementAn obligation may meet the definition of an accounting liability but not be recognised by thedebtor. Recall that, under IAS, a company should record an obligation as a liability on its bal-ance sheet if two conditions are met. These are:
1 it’s probable that resources will flow out of the company; and2 the resource outflow can be estimated reliably.
‘Probable’ is defined as ‘more likely than not’. If one or both conditions are not met, recognitionis not required.
The way a liability is measured differs according to its nature. A monetary liability – one whichis settled in money, such as a loan or account payable – is measured by the amount of cash thedebtor is contracted to pay to settle it. A non-monetary liability – examples are a prepaid airlineticket or rent received in advance – is usually recorded at the amount of cash received for the goods
CFA_C11.qxd 11/6/03 3:06 PM Page 311

312 PART 2 • THE HOUSE OF ACCOUNTING
or services the debtor is contracted to supply in future. If the liability is long-term and involvesscheduled payments of fixed amount, then it is usually stated at the present value of the scheduledpayments. Under HC accounting, the rate used to discount future payments is the yield on thedebt when it was incurred, that is the interest rate that equates the present value of future pay-ments to the cash the debtor receives initially.
l Contingent liability
A contingent liability is a possible obligation. Its existence depends on the occurrence (or non-occurrence) of future events that aren’t fully under the control of the company.3 Examples ofcontingent liabilities are a legal action against the company and a debt guarantee it gives to anaffiliated company. In both cases there is a past event – the initiating of legal proceedings by theplaintiff, the giving of the guarantee – but whether the company has an obligation depends on afuture event – an adverse legal opinion or court decision, the bankruptcy of the affiliate – that itcan’t control.
So long as a liability is contingent, it’s not recognised in the financial statements. Instead,information about it, in particular its nature and amount, is usually disclosed in the notes to theaccounts. If and when the obligation becomes probable – and assuming it’s measurable, then thecompany recognises a liability. Thus a company that receives an adverse legal opinion on a law-suit it’s defending makes the following entry:
Dr. Loss arising from legal claim (OE−) xxCr. Provision for legal claims (L+) xx
The provision represents management’s best estimate of the payments the company will have tomake to settle the legal action (Dr. Provision (L−), Cr. Cash (A−)).
In practice, legal claims against a company present management with an accounting dilemma.Information about them is of value to potential investors. However, management do not wishto publish any details which could prejudice the company’s financial position. Thus althoughthey are willing to disclose the amount of a claim in the notes (assuming it is material), they may be reluctant to show separately the amount of any provision made in the accounts sinceother parties to the lawsuit may use this information against the company. There is a risk, therefore, that management may delay recognising a liability for a legal claim in the company’saccounts by claiming that one or both of the recognition criteria are not met by the balance sheet date.
Problem areas
The accounting framework for liabilities given above – which is based on IAS – is not universallyaccepted. Controversy persists. Accountants and managers disagree about what liabilities are,when they should be recognised and how they should be measured. We illustrate these disagree-ments below.
l Provisions
What is a provision? There are two competing definitions – we’ll call them the balance sheet viewand the income statement view.4
CFA_C11.qxd 11/6/03 3:06 PM Page 312

Balance sheet view
Under the balance sheet view, a provision is an estimated liability.5 It shares the same char-acteristics as a firm liability with the exception that the amount or timing of the obligation isuncertain. In some cases the identity of the creditor is not known when the provision is established.
An example of an estimated liability is the provision a company makes for future costs aris-ing under a warranty agreement. Consider the case of Dukas Company, a household appliancemanufacturer which offers a one-year warranty against certain types of fault in its ‘Sorcerer’ elec-tric brooms. Past experience (with apprentices) indicates that it’s probable that claims will arise.Moreover, the amount of the claims can be estimated with reasonable accuracy, based on theaverage claims-to-sales ratio in the past. Thus, even though the exact amount and timing of theobligation are not known, the two conditions for liability recognition are met.
Suppose Dukas estimates in year 1 that the costs of warranty claims amount to approximately1.25% of sales. During year 1, it accrues this expected cost, probably on a monthly basis.Assuming its year 1 sales are 8 million, it records a total charge for warranty costs of 100,000 inyear 1:
Dr. Warranty expense (OE−) 100,000Cr. Provision for warranty costs (L+) 100,000
Repairs made to brooms under warranty in year 1 amount to 55,000 and are charged againstthe provision as incurred.
Dr. Provision for warranty costs (L−) 55,000Cr. Cash (A−) 55,000
At the end of year 1, the company reviews the balance (of 45,000) in the provision account to determine if it is sufficient to meet expected warranty claims in year 2 on year 1 sales. The provision is adjusted if the balance is considered under- or overstated.
Income statement view
Many managers and accountants reckon that the balance sheet view of provisions is too restrict-ive. They argue that, in addition to providing for estimated liabilities, a company should alsoprovide for other business costs that it has incurred in generating revenues of the period. Theyclaim this is a long-standing business practice that can be defended on matching grounds. Underthis income statement view, a provision represents accrued costs. Consider, for example, plantmaintenance. It is customary for a firm to accrue the expected costs of such work (by debitingrepair expense and crediting a provision for repair work), even if actual repairs are not carriedout until a later period for scheduling reasons.
Many EU companies apply this version of provision in their accounts. Under the 4thDirective, EU member states can allow firms to create provisions for costs ‘which have their origin in the (current) financial year’ but which are uncertain as to amount and timing (Art. 20). Moreover, the legal and tax regimes in some EU countries encourage firms to estab-lish generous provisions for uncertain costs. For example, German companies have traditionallyprepared their financial statements with creditors’ interests foremost. They are required by lawto provide for ‘all probable risks’. The resulting charges against income reduce their taxableprofits (and thus their income tax liability) and the profits available for distribution to theirshareholders.
CHAPTER 11 • LIABILITIES, ON AND OFF BALANCE SHEET 313
CFA_C11.qxd 11/6/03 3:06 PM Page 313

IASB position
The IASB supports the balance sheet view of provisions. In its view, a provision is an estimatedliability. In order to be recorded in the accounts, it must pass the definition and recognition testsof a liability. In measuring the provision, a company should use the ‘best estimate’ – at the bal-ance sheet date – of the outlay necessary to settle the obligation. In the case of long-term provi-sions (e.g. for dismantling nuclear power stations or clean-up of contaminated sites), estimatesof future outlays can incorporate expected technological advances and the liability should bemeasured at present value.
The voluntary adoption of IAS by many Continental European companies in recent years hasrevealed the extent to which reported provisions in their national GAAP accounts compriseaccrued costs. For example, BMW, the car and motorcycle producer, reported a near-doublingof start-2001 shareholders’ equity – from a4,896 million to a9,432 million – as a result of switching from German to international accounting standards in 2001. Almost 15% (a673 mil-lion) of this increase is attributable to the ‘derecognition and different measurement of otherprovisions’.6
Restructuring provisions
In principle, a restructuring provision is an estimated liability. When a firm restructures its operations because it is making low profits or even losses, it takes certain steps – for example, thedismissal of employees and the closing down of factories – which are likely to result in future liabilities (redundancy payments, plant closure costs). For reasons of prudence, management set up a provision for such costs when the restructuring decision is taken.
In recent years, firms have been accused of using restructuring provisions to manipulate theirincome. A favourite ploy of a firm embarking on a restructuring is to bring forward future oper-ating costs and include them in the restructuring provision. The provision is often combinedwith other actions such as large asset write-downs. As a result, the firm reports a smaller profit(or even losses) in the year of restructuring but larger ones in following years. The tactic is oftenemployed by new management just after they’ve been appointed. It’s also used by an acquirerfirm as a way of depressing an acquiree firm’s net assets at the time of takeover and therebyboosting its post-acquisition profits.
Accounting regulators are keen to prevent misuse of restructuring provisions. According to IAS, for a restructuring provision to qualify as a (constructive) liability, a firm must have a detailed, formal restructuring plan, indicating the businesses and employees affected, likelycosts and timescale. In addition, the firm must have either announced the plan publicly orstarted implementing it. Only direct expenditures arising from the restructuring can be pro-vided for.7
l Hidden and disguised debt
Companies like debt as a source of external capital. It has several advantages. First, it is flexible:a company can structure the debt’s duration and repayment terms to suit its needs. Second,interest is tax-deductible. Third, existing owners’ voting power is not diluted. However, debtcarries a penalty. It increases a company’s financial risk and thus the return owners demand. As a result, firms with high financial leverage have an incentive to conceal the extent of theirindebtedness by raising debt but not reporting it as such on the balance sheet.
Hidden or disguised financing involves the raising of cash. A heavily-indebted firm may seekto disguise borrowing by presenting it as an issue of equity (a), a sale of existing assets (b), or a forward sale of assets (c). Or it may raise the debt through a non-consolidated affiliated
314 PART 2 • THE HOUSE OF ACCOUNTING
CFA_C11.qxd 11/6/03 3:06 PM Page 314

CHAPTER 11 • LIABILITIES, ON AND OFF BALANCE SHEET 315
company, in which case the debt is hidden: neither the cash nor the debt appears on its balancesheet (d).
Shareholders’Assets == Liabilities ++
equity
DeferredCash Other revenue Debt
(a) + = +(b) + −(c) + = +(d) NE NE
Cash Debt+ +
(NE = No effect)
l Issue of quasi-equity. The 1980s saw the launch of many new financial products which, theinventors claim, need not be classified as long-term debt but can be shown in or near share-holders’ equity. Some are debt with equity characteristics (e.g. the perpetual bond). Others are equity with debt characteristics (e.g. preference shares redeemable at the option of theholder).
l Sale of existing assets with recourse. A company sells marketable assets such as receivables,inventories of finished goods or investments in shares and bonds in order to raise cash.However, it retains an economic interest in the assets. Under the ‘sale’ agreement, it must –or may be required to – repurchase the assets and recompense the buyer for holding andfinancing costs. In this case, the transaction is, in substance, a loan by the asset ‘buyer’ to the‘seller’.
l Forward sale of assets. These are known as ‘prepay’ transactions. A bank pays cash up front inexchange for the delivery of a commodity such as natural gas or oil at a future date. The sup-plier records the advance payment as ‘deferred revenue’. This is an operating liability and isnot considered ‘debt’ in financial leverage calculations. A Senate investigative committee dis-covered in 2002 that leading US banks had offered prepay transactions to energy companiessuch as Enron, Occidental Petroleum and Ocean Energy in the late 1990s.
l Unconsolidated debt. A company with non-consolidated subsidiaries or associates has addi-tional scope for raising debt off balance sheet. An investor company records such investmentsin its balance sheet at its share of the net assets of the investee (or at cost). It does not com-bine the investee’s liabilities (or assets) with its own. If the investee company raises cash bymeans of debt, its cash and debt increase but its net assets do not change. For the investor com-pany, the carrying amount of its investment is unchanged but the cash it can control (and itsreal financial leverage) have increased.
Accounting regulators are trying to stop companies using the above techniques to hide or dis-guise debt. First, they have tightened the definition of a liability. According to IAS, a companyhas a financial liability if it has ‘a contractual obligation to deliver cash or another financial asset’to another party.8 Second, they have limited the ability of companies to record asset transfers assales. A company can recognise a transfer of inventory as a sale only if certain revenue recogni-tion criteria are met. One of those criteria is that ‘the significant risks and rewards of ownership’have been transferred to the buyer.9 Similarly, a transfer of a financial asset like receivables can
CFA_C11.qxd 11/6/03 3:06 PM Page 315

316 PART 2 • THE HOUSE OF ACCOUNTING
only be considered a sale if the transferor surrenders control of the contractual rights containedin the asset. A company has not given up control of – and cannot derecognise – a financial assetif, for example, it retains the right to repurchase the asset on favourable terms or it’s obligatedto repurchase the asset on terms that ensure the ‘buyer’ a fair return on its investment.10 Third,they have restricted the circumstances in which an investor company can avoid consolidating aninvestee. For example, consolidation is now required whenever one company controls another.Control can exist even in the absence of majority ownership.11
l Commitments, including lease commitmentsAccording to the definition of a liability we gave earlier, a commitment is not an accounting liab-ility. Accountants argue that, at the time two parties enter into a commitment (e.g. by signing acontract for the supply of goods), no economic benefits have flowed from one to the other. Thereis no present obligation.
Some lease commitments are recognised as liabilities, however. What is a lease? It is a contractfor the use of a fixed asset. One party (the lessee) rents property or equipment from another (thelessor) for a stipulated period. The lessee agrees to make specified payments to the lessor inreturn for unhindered use of the asset during that time.
In many countries, companies account for a ‘finance lease’ in the same way as an asset purchased with debt. A finance lease is one where substantially all of the risks and rewards associ-ated with ownership have been transferred from lessor to lessee. It is usually a long-term, non-cancellable lease that runs for most, if not all, of an asset’s economic life. At the time such a lease contract is signed, the lessee capitalises the lease: it records a fixed asset and a long-termliability on its books. The lessor, although still the legal owner of the asset, recognises the saleof an asset and a long-term receivable at this date. We show the balance sheet effect of the transaction in simplified terms below:
Lessee Lessor
Assets Assets
Buildings and equipment –xx
:Fixed asset under lease +xx Lease receivable +xx
Equities Equities
Profit in year (gain/loss on sale) +/–xx
Lease liability +xx
During the lease term, the lessee makes payments according to the contract. As a result, itslease liability is reduced; so, too, is the lessor’s receivable. At the same time, both recognise thecost of the asset’s financing: part of each lease payment is shown as interest expense in the lessee’sincome statement and interest income in the lessor’s. (Hence the name ‘finance lease’.) In addi-tion, the lessee, as economic owner, depreciates the asset. The balance sheet impact of theseevents is summarised below:
......
...
...
...
...
...
...
CFA_C11.qxd 11/6/03 3:06 PM Page 316

CHAPTER 11 • LIABILITIES, ON AND OFF BALANCE SHEET 317
Lessee Lessor
Assets Assets
Fixed asset under lease –xx Lease receivable –xx
Cash –xx Cash +xx
Equities Equities
Profit in year (depreciation and –xx Profit in year (interest income) +xxinterest expense)
Lease liability –xx
All other lease commitments are viewed, for accounting purposes, as ‘operating leases’. In thiscase, the asset under lease remains on the lessor’s books: the lessor is considered both economicand legal owner. It recognises rental income as rent is earned – and depreciation as the asset isconsumed. The lessee reports neither asset nor liability on its books. It recognises rental expenseas it uses the asset.
Accounting for commitments is controversial. Some investors and analysts think lesseesshould capitalise more of their leases. They argue that it is too easy for a lessee to circumventaccounting rules and account for de facto finance leases as operating leases. Such leases do notappear on the lessee’s balance sheet. They are a form of off-balance-sheet financing.
Others go further and advocate the capitalisation of other types of commitment. At present,a company that enters into a long-term lease (involving the use of an asset) recognises a liability(and an asset) while one that enters into a long-term commitment to purchase goods or servicesdoes not. In the latter case, the most the purchaser must do is disclose the nature and amount ofthe commitment in the notes to its accounts. The danger is that the long-term purchase com-mitment, like the operating lease, may become a vehicle for off-balance-sheet financing.
We discuss the accounting for leases in greater depth in section 3 of this chapter and in theappendix.
l Measurement problemsLiabilities, like assets, cause measurement problems. Consider the case of the liability to providegoods or services. How should this non-monetary liability be measured? One school of thought– we’ll call it the ‘cost’ view – argues that the liability should be measured at the cost of providingthe good or service. Thus a magazine publisher who accepts a new annual subscription to one ofits monthly magazines – for, say, a120 – should measure the initial liability at the cost of pro-viding the magazines during the subscription period (say, a90) Any difference between thisamount and the cash received in advance for the annual subscription can be recognised as rev-enue immediately because it’s already earned.
Dr. Cash (A+) 120Cr. Unearned revenue from magazine subscription (L+) 90Cr. Revenue from magazine subscription (OE+) 30
The magazine publisher will then reduce the liability – and recognise revenue – at the rate ofa7.50/month as it delivers the magazine to the subscriber.
...
...
...
...
...
...
...
CFA_C11.qxd 11/6/03 3:06 PM Page 317

318 PART 2 • THE HOUSE OF ACCOUNTING
SECTION
2
The alternative school of thought – the ‘fair value’ view – maintains that non-monetary liabilities should be valued at the fair value of the goods or services provided. In the case of ourexample, the magazine publisher should measure the initial liability at a120, the price of theannual subscription. This is also the cash it receives in advance.
Dr. Cash (A+) 120Cr. Unearned revenue from magazine subscription (L+) 120
As it delivers the magazine to the subscriber, it recognises revenue – and reduces its liability – atthe rate of a10/month, the fair value of each month’s issue.
Accounting regulators favour the fair value view on theoretical and practical grounds. Fairvalue represents the least amount that the company would have to pay to settle a non-monetaryobligation – or transfer it to a third party. Thus if the publisher couldn’t meet its obligation tosupply the magazine, it would have to either reimburse the subscriber or find another companyto perform the service. The minimum price it would pay would be the fair value of the unfulfilledcontract. There are also practical grounds for measuring non-monetary liabilities at fair value.The alternative, cost, is hard to determine. Which cost figure should be used – incremental cost? full production cost? full production and selling cost? Companies would end up using dif-ferent cost measures and this would undermine the comparability of financial statements, it’sclaimed.12
Long-term debt
Economic and legal background
For many companies, short-term and long-term borrowings are a major source of finance. Acompany issues debt in order to reduce its cost of capital and to safeguard existing shareholders’interests, among other reasons.
Debt is usually less costly than equity and more flexible. Interest is the cost of debt; dividendsa cost of equity. In most countries in Europe and elsewhere, interest is tax-deductible; by con-trast, dividends are not. In these countries debt is a lower-cost source of finance on an after-taxbasis. Moreover, companies may need external capital for a short period only. A company witha seasonal pattern of sales, for example, will find it cheaper to borrow than to issue new sharesto cover a cash shortfall within the year.
Corporate debt also has advantages for the owners of a firm. Debtholders have no votingrights. Thus, by borrowing funds, a company can raise additional capital without the ownershipstake of existing shareholders being diluted. Moreover, debt has a disciplining function, especiallyin mature firms that generate large, stable cash flows. By requiring that the firm’s investments befinanced with debt rather than equity, owners ensure that managers evaluate new projects care-fully since the cash flows from them must be sufficient to meet scheduled debt payments.
Debt carries risks, however. Debt payments such as interest are contractually fixed. They arenot postponable. Owners – and managers – pay a heavy price if the company is unable to makedebt payments when due. Owners may lose most, if not all, of their investment and managerstheir jobs. This may influence managers’ investment decisions, especially in highly leveragedfirms. Managers in these firms may forgo profitable but risky investments to reduce the likeli-hood of the company defaulting on its debts.13
CFA_C11.qxd 11/6/03 3:06 PM Page 318

CHAPTER 11 • LIABILITIES, ON AND OFF BALANCE SHEET 319
Debt takes many forms. Companies borrow direct from banks by means of loans and over-drafts. Companies also issue debt securities to investors. There are different forms of debt security:we refer to them collectively as bonds.
Bonds are partitioned debt. Each bond represents a fraction of the total sum borrowed. Debtpackaged in this way is more attractive to investors: they can spread their risk by allocating theircapital across different bonds and can trade them in the secondary market. As a result, a com-pany can secure better terms (e.g. a lower interest rate) when it raises debt capital.
In economic terms, a bond is like a share: it’s a claim on the future cash flows of the firm. Itdiffers from a share in the nature of the claim. A bond is a debt claim. It usually has a fixed term:the bondholder must be repaid in full by the maturity date. A company is in default – and at riskof legal action by bondholders – if it fails to pay interest or principal when due. By contrast, ashare is an ownership claim. It usually has an indefinite life. Shareholders cannot seek legalredress if the company does not pay a dividend (but they may sell their shares or seek to changethe management).
A bond also differs from a share in its ranking. On liquidation of a company, amounts owingto bondholders (and other creditors) must be paid first; shareholders receive the residue of thecompany’s liquidated assets. Bonds themselves have a pecking order: senior debt ranks beforesubordinated debt in the queue for the borrower’s assets and is judged less risky (carries a lowerinterest rate) as a result.
Whatever the form of the debt, lender and borrower must agree its terms. The contract willspecify the following:
l the amount borrowed (the principal): for bonds, this is simply the product of the number ofbonds issued and their face value (the amount stated on the face of the bond certificate). Theprincipal is usually the amount the borrower must repay on the debt’s maturity; it is not necessarily equal to the cash the borrower receives from the lender initially;
l the life (the term) of the debt: the contract states the date or dates the debt must be repaid(maturity dates);
l the interest (if any) to be paid each period: interest may be fixed or variable (in the case offloating-rate debt). For fixed-rate debt, the coupon rate is the annual interest paymentdivided by the principal;
l the dates on which interest payments are due;l the security the borrower must offer the lender (e.g. corporate assets or personal guarantees
of the owners);l the restrictions on future borrowing (e.g. maximum debt ratios not to be exceeded and
minimum working capital ratios to be maintained).
Bond and loan agreements may contain other provisions: examples are a call provision (theterms under which the company issuing the bonds can ‘call’ them, that is require the holders tosell their bonds back to the company), and a sinking fund requirement (the transfer of cash toa segregated account to finance the repayment of principal). There may also be a conversionoption: in this case, bondholders have the right to convert their bonds into shares at a specifiedconversion rate within a specified period.
Initial recognition and measurement
The accounting issues surrounding long-term debt (or debt, for short) are similar to those fordepreciable fixed assets. Management must decide how to account for debt at ‘birth’ (when thecompany incurs the liability), during its life and on ‘death’ (when the liability is extinguished).In the following sections we set out current accounting practice at each of these stages of debt’s
CFA_C11.qxd 11/6/03 3:06 PM Page 319

existence. We assume companies measure debt at cost, that is, they do not account for changesin its market value during its life.
Debt is a form of financial liability. A financial liability contains a contractual obligation onone party to deliver cash (or another financial asset) to another. Note that this obligation is acontractual one. Thus a company recognises debt as a liability when the contract with the lendertakes effect and the company has the legal right to receive the cash. It measures the debt initiallyat the amount of cash received. This is the debt’s cost (and fair value) at that date.14
l Issue of bonds at parWe illustrate these recognition and measurement principles with an example. (The example isframed in terms of bonds but the concepts apply to all forms of long-term debt.) In early Januaryx1, Lopakhin Company buys some land (including a cherry orchard) from RanevskayaCompany. It issues 4,000 bonds to finance the development of a tourist project (summer cot-tages with river frontage) on the land. The bonds have a face value of a1,000 each. They carry afixed coupon rate of 6%, payable annually, and mature at the end of x5. They are issued at par.Thus Lopakhin receives a1,000 for each bond – or a4,000,000 in total. (We ignore issuance costsfor the moment.) It recognises a liability for a4 million on the date the bonds are issued:
Issuance in January x1Dr. Cash (A+) A4,000,000
Cr. Bonds payable (L+) A4,000,000
The company gives summary details of the bonds either on the face of the balance sheet or, moreusually, in the notes to the accounts. The description it uses – ‘a4 million 6% bonds dueDecember x5’ – captures the essential features of the bonds: their face value, coupon rate andterm (five years).
l Issue of bonds at a discountCompanies do not always issue fixed-rate bonds at par. Recall that the coupon – stated in thebond contract – determines the interest bondholders receive in cash each year. If the market rateof interest on similar debt is greater than the coupon rate at the date of issue, an investor willoffer a price less than the bond’s face value because the interest stream is less than that on othercompanies’ bonds. In this case, the bonds are issued at a discount. The amount by which thecash paid by investors falls short of the bonds’ face value is known as the bond discount on issue.
Suppose that, when Lopakhin issues five-year 6% bonds, investors can earn a 10% return onbonds of similar risk and maturity. They will not pay face value (of a1,000) for a Lopakhin bond.A rational investor will pay no more than a848.5 for it. To find this price, the investor determinesthe cash flows offered by each Lopakhin bond and discounts them at the prevailing market interest rate of 10%:
Cash flow Discount Presentper bond factor value
Annual interest payment for five years A60 3.791 A227.46Principal repaid at end of fifth year A1,000 0.621 A621.00
A848.46
The present value of a848.5 (rounded) is the maximum price an investor is prepared to payLopakhin for one of its bonds at the date of issue. Since this price is less than face value, thebonds are issued at a discount. The initial discount is a151.5 on each a1,000 bond.
320 PART 2 • THE HOUSE OF ACCOUNTING
CFA_C11.qxd 11/6/03 3:06 PM Page 320

Note that investors express bond prices in percentage terms. Lopakhin’s bonds are issued at84.85% of their face value – so their price is 84.85%, or 84.85 for short.
How does Lopakhin record these bonds issued at a discount? Recall the general rule: fin-ancial liabilities are measured initially at the cash amount received. Lopakhin receives a3,394,000at the date of issue (4,000 bonds × a848.5/bond), so the entry it makes then is in substance as follows:
Issuance in January x1 (‘Bonds payable’ shown net)Dr. Cash (A+) A3,394,000
Cr. Bonds payable (L+) A3,394,000
In practice, Lopakhin would account separately for the bond discount. It would record the facevalue of the bonds (a4 million) in a ‘Bonds payable’ account – this is its legal liability – and thedifference between the face value and issuance price (a606,000) in a ‘Bond discount’ account.The bond discount is a contra-liability account (CL).
Issuance in January x1 (‘Bonds payable’ shown gross)Dr. Cash (A+) A3,394,000Dr. Bond discount (CL+) 606,000
Cr. Bonds payable (L+) A4,000,000
Note that, under this alternative version, the bonds are shown on the balance sheet net of the discount. Were Lopakhin to prepare a balance sheet immediately after the bond issue, it wouldreport a liability of a3,394,000. Recording ‘bonds payable’ at the net amount simplifies theaccounting so we’ll use this approach in our examples.
l Issue of bonds at a premiumIf the market rate of interest is less than the coupon rate at the date of the bonds’ issue, aninvestor is willing to pay more than the bond’s face value because the interest stream is greaterthan that on other bonds. In this case, the bonds are issued at a premium. The amount by whichthe cash paid by investors exceeds the bonds’ face value is known as the bond premium on issue.For example, suppose that, when Lopakhin issues five-year 6% bonds, investors can earn only5% on bonds of similar risk and maturity. In this case, they are willing to pay a1,043.70 for eacha1,000 bond. (This is the rounded sum of the present values, discounted at 5%, of interest payments over five years (a60 × 4.329) and of the principal in the fifth year (a1,000 × 0.784).)Lopakhin records the issue of the 4,000 bonds at the issue price of a1,043.70 as follows:
Issuance in January x1Dr. Cash (A+) A4,174,800
Cr. Bonds payable (L+) A4,174,800
The premium on issue is a174,800. As with bond discount, this can be accounted for separately,in which case ‘Bonds payable’ will be recorded at their face value of a4 million.
Why would a company issue bonds at a price other than face value? There may be technicalreasons: market rates may move after the date the coupon is set. Sometimes the issuing companydeliberately sets the coupon low. Suppose it finances an investment project with debt and theproject is expected to generate low cash flows initially and high cash flows in later years. It maybe advantageous for the issuer to structure debt payments so that they too are low in the earlyyears and higher later.
CHAPTER 11 • LIABILITIES, ON AND OFF BALANCE SHEET 321
CFA_C11.qxd 11/6/03 3:06 PM Page 321

322 PART 2 • THE HOUSE OF ACCOUNTING
Determining the periodic cost of debt
Companies that raise capital by means of long-term loans or bond issues face an accountingproblem: how to determine the periodic cost of the debt – interest expense – over its term. Weassume in the following discussion that interest, once computed, is expensed immediately.However, the accounting described below applies equally to interest that is capitalised.
When debt carries a fixed interest rate and its face value and fair value at date of issue (i.e. cashreceived) are the same, determining periodic cost is straightforward. The interest charge eachyear is simply the product of the stated interest rate on the debt and its face value. The interestis accrued over the year on a time basis. Thus if Lopakhin Company issues a4 million of five-year6% bonds at par in early January x1, it will accrue interest of a240,000 (6% × a4 million) duringeach of the years x1 through x5 and pay it at year-end. The first year’s entries are:
Interest accrual during x1Dr. Interest expense (OE−) A240,000
Cr. Accrued interest payable (L+) A240,000
Interest payment at end-December x1Dr. Accrued interest payable (L−) A240,000
Cr. Cash (A−) a240,000
The accounting for floating-rate debt is similar. In this case, the interest rate is linked to a refer-ence rate such as the local interbank offered rate. At regular intervals (say, every three months),the interest rate is adjusted for changes in the reference rate. The borrowing company calculatesinterest expense (and payment) for the following three months by applying the new rate to theface value of the debt.
l Lifetime cost of debt
Determining the periodic cost of debt is more complicated when bonds are issued at a discountor premium. The discount (premium) represents a cost (benefit) to the borrower. It’s part of thetotal cost of the debt and should be reflected in interest expense. The question is: how? Underaccrual accounting, the discount or premium is spread – or ‘amortised’ – over the life of the debtrather than recognised in the period the debt is redeemed – in the same way that tangible fixedassets are depreciated over their useful lives.
The first step in calculating amortisation is to work out the lifetime cost of the debt. This issimply the difference between the cash the company receives as a result of the borrowing and thescheduled payments it must make over the term of the loan or bonds. In the case of Lopakhin’sfive-year 6% bonds issued at a price of 84.85, the lifetime cost is a1,806,000.
In January x1, Lopakhin receives in cash +3,394,000Between x1 and x5, it makes cash payments totalling −5,200,000
[4,000,000 + (5 × 240,000)]Principal Interest
Lifetime cost of 6% five-year bonds −1,806,000
The payments comprise interest of a240,000 a year – or a1,200,000 in total – and the principalof a4 million which is paid when the bonds mature in December x5.
CFA_C11.qxd 11/6/03 3:06 PM Page 322

l Straight-line method of amortisation
The next step is to allocate the lifetime cost over the term of the debt to arrive at the interestcharge each period. Failure to amortise gives a misleading picture of the debt’s annual cost. Forexample, consider how Lopakhin would record the cost of its 6% five-year bonds if it accountedfor them on a cash basis.
(Amounts in B000) Yearx1 x2 x3 x4 x5 Total
Interest expense 240 240 240 240 846 1,806
Under the cash basis, the bond discount of a606,000 is only expensed in x5 when the bondsmature. As a result, the cost of debt is understated – and profits overstated – in years x1–x4whereas the reverse is true in x5. The carrying amount of the bonds is also understated until thedate of redemption.
Profit and liability misstatement are avoided if the accrual basis is used and the lifetime costis amortised over the debt’s term. The simplest method of amortisation is the straight-line (SL)method: each period bears an equal share of the debt’s lifetime cost. Applying this to Lopakhin’sfive-year 6% bonds yields an annual interest charge of a361,200.
(Amounts in B000) Yearx1 x2 x3 x4 x5 Total
Interest payments 240 240 240 240 240 1,200Amortisation of bond discount 121.2 121.2 121.2 121.2 121.2 606
Interest expense (A) 361.2 361.2 361.2 361.2 361.2 1,806
Carrying amount of bonds, start-yr (B) 3,394 3,515.2 3,636.4 3,757.6 3,878.8Cost of debt (A)/(B), as % 10.6 10.3 9.9 9.6 9.3
Since interest payments on the bonds are the same each year, the initial discount is also amort-ised on a SL basis. The carrying amount of the bonds increases each year by a121,200, the annualamortisation of the discount. (By the end of x5, the carrying amount will be a4 million, thematurity value of the bonds.)
The SL method, although simple to apply, has a major flaw according to accounting regulators.Reported interest expense doesn’t reflect the historical cost of the debt, that is, the interest rateon debt of similar risk and maturity at the time of issue. For example, Lopakhin’s five-year 6%bonds were priced to give investors a return of 10% over the debt’s lifetime. But reported interestexpense of a361,200 is not equal to 10% of the start-of-year carrying amount of the bonds in x1– nor is it in any other year.
l Interest method of amortisation
The method of amortisation favoured by accounting regulators is the interest method.15 Thismethod ensures, by design, that the interest expense the borrower reports each period reflectsthe market rate of interest on equivalent debt at the time it signed the debt contract. Here’s howit works – in three easy steps:
1 Find the internal rate of return (IRR) that equates the present value (at contract date) ofscheduled debt payments to the cash received by the borrower. This rate is also known as the‘level yield to maturity’ or ‘effective interest rate’.
CHAPTER 11 • LIABILITIES, ON AND OFF BALANCE SHEET 323
CFA_C11.qxd 11/6/03 3:06 PM Page 323

2 Apply the IRR to the start-of-period carrying amount of the debt (initial carrying amount inthe first period) to give the interest expense for the period. The difference between interestexpense and interest paid is the discount or premium amortised in the period.
3 Adjust the carrying amount of the bonds for the discount or premium amortised. Amortiseddiscount (premium) is added to (subtracted from) the start-of-period carrying amount. Theadjusted figure is the carrying amount at the start of the following period.
Steps 2 and 3 are then repeated until the bonds mature or are retired.Are your eyes glazing over? Once again, we call Lopakhin’s bonds to our aid. Exhibit 11.1
shows the calculation of interest expense and discount amortisation under the interest methodfor each of the five years of the bonds’ life.
We already know that the bonds’ IRR is 10%. Each year Lopakhin applies this rate to thebonds’ start-of-year carrying amount (‘net liability’) to determine the annual interest charge.The difference between interest expense and interest paid (a240,000) is the discount amortisedin the year – and this is the amount by which the bonds’ carrying amount increases between thestart and end of the year. Note that the carrying amount is always the present value of futurepayments discounted at the initial IRR. For example, at the start of x3, the present value of theremaining scheduled payments is a3,602,700:
324 PART 2 • THE HOUSE OF ACCOUNTING
Cost of debt: interest method illustratedExhibit 11.1
FactsEarly in x1, Lopakhin Company issues A4 million five-year 6% bonds and receives A3,394,000in cash. The bonds pay interest annually and yield 10% to maturity. The company uses theinterest method to determine the annual cost and the carrying amount of the bonds. Amountsare in A000.
Calculation of annual interest expense and end-year carrying amount of bonds
x1 x2 x3 x4 x5(1) Net liability, start-year 3,394 3,493.4 3,602.7 3,723 3,855.3
(2) Interest expense: 10% × (1) 339.4 349.3 360.3 372.3 384.7*
(3) Interest paid: 6% × 4,000 240 240 240 240 240
(4) Discount amortised: (2) − (3) 99.4 109.3 120.3 132.3 144.7
(5) Net liability, end-year: (1) + (4) 3,493.4 3,602.7 3,723 3,855.3 4,000
* Rounded.
CFA_C11.qxd 11/6/03 3:06 PM Page 324

[A240,000 × PVA(10%, 3 payments) ] + [A4,000,000 × PV(10%, 3 periods) ] = A3,602,700
This is also the start-x3 carrying amount of the bonds according to the amortisation table inExhibit 11.1. By end-x5, the initial discount (of a606,000) is fully amortised and the bonds’ carrying amount is a4 million. Lopakhin is obligated to repay this sum to bondholders when the bonds mature in December x5.
The interest method, like the SL method, ensures that the lifetime cost of debt is fully amort-ised. Where bonds are issued at a discount, interest expense increases in absolute terms eachperiod since a constant interest rate is applied to a growing liability. Lopakhin’s 6% bonds illus-trate this.
(Amounts in B000) Yearx1 x2 x3 x4 x5 Total
Interest payments 240 240 240 240 240 1,200Amortisation of bond discount 99.4 109.3 120.2 132.3 144.7 606
Interest expense 339.4 349.3 360.2 372.3 384.7 1,806
By contrast, where bonds are issued at a premium, the liability declines as the premium is amort-ised, resulting in a decreasing interest charge each period.
l Financial statement impact of interest methodWe’ve seen already how bonds issued at a discount affect a company’s accounts at the time ofissue. We turn now to the accounting impact of such bonds over their life. Exhibit 11.2 showsthe pre-tax effect of the 6% bond issue on Lopakhin’s accounts for x1 through x5 using a work-sheet approach.
CHAPTER 11 • LIABILITIES, ON AND OFF BALANCE SHEET 325
FactsEarly in x1, Lopakhin Company issues A4 million five-year 6% bonds and receives A3,394,000in cash. The bonds pay interest annually and have a yield to maturity of 10%. The companyuses the interest method to determine the annual cost and carrying amount of the bonds.Amounts are in A000.
Financial statement impact of bonds
Net effectIssuance Redemption over
Jan x1 x1 x2 x3 x4 x5 Dec x5 5 yearsAssetsCash +3,394 −240 −240 −240 −240 −240 −4,000 −1,806
Total +3,394 −240 −240 −240 −240 −240 −4,000
EquitiesLiabilitiesBonds payable, net +3,394 +99.4 +109.3 +120.2 +132.3 +144.7 −4,000 0Shareholders’ equityProfit for the year −339.4 −349.3 −360.2 −372.3 −384.7 −1,806[Interest expense]
+3,394 −240 −240 −240 −240 −240 −4,000
Interest method: financial statement impact illustratedExhibit 11.2
CFA_C11.qxd 11/6/03 3:06 PM Page 325

Lopakhin’s cash balance declines by a240,000 each year as interest is paid. However, theimpact on profit – via interest expense – is greater by the amount of the discount amortised inthe year. This is evident from the journal entries Lopakhin makes to record interest expense andpayment each year. Here are specimen entries for x2.
Interest accrual during x2Dr. Interest expense (OE−) A349,300
Cr. Accrued interest payable (L+) A240,000Cr. Bonds payable (L+) 109,300
Interest payment at end-December x2Dr. Accrued interest payable (L−) A240,000
Cr. Cash (A−) A240,000
In our example, we’ve assumed that Lopakhin accounts for the bonds on a net basis. In practice, the company would record ‘Bonds payable’ at their face value (i.e. a4 million) and(unamortised) ‘Bond discount’ in a separate contra-liability account. In this case, the credit fora109,300 in the above entry would be to ‘Bond discount’, thereby reducing the contra-liability.Amortisation results in a zero balance in this account by the date the bonds mature. Full balancesheet presentation of the bonds illustrates this:
Issuance End year(In B000) Jan x1 x1 x2 x3 x4 x5Bonds payable, at face value 4,000 4,000 4,000 4,000 4,000 4,000Less:Unamortised discount −606 −506.6 −397.3 −277 −144.7 0Bonds payable, net of discount 3,394 3,493.4 3,602.7 3,723 3,855.3 4,000
One final point. Over debt’s lifetime, the impact, pre-tax, on cash and income should be the same.Lopakhin’s 6% bonds demonstrate this. We can see from Exhibit 11.2 that Lopakhin’s cash bal-ance is lower by a1,806,000 after the bonds’ redemption in x5. The company’s cumulative profitsare also lower by this amount. Of course, these calculations ignore the benefits – in cash andprofit terms – which Lopakhin enjoys from the property investment financed by the bonds.
l Other applications of interest methodThe interest method can be used to amortise other types of financing cost. Debt issuance costsis one. For example, suppose that Lopakhin incurs costs of a100,000 when issuing the 6% bondsand thus the cash it receives in January x1 is a3.294 million, not a3.394 million. This increasesthe effective interest rate on the bonds to 10.74%, as can be seen by solving for x in the follow-ing equation:
(A240,000 × PVA (x%, 5 payments)) + (A4,000,000 × PV (x%, 5 periods)) = A3,294,000Annual Principalinterest
Lopakhin records the issuance of the bonds in January x1 as follows:
Issuance of bonds in x1Dr. Cash (A+) A3,294,000
Cr. Bonds payable (L+) A3,294,000
326 PART 2 • THE HOUSE OF ACCOUNTING
CFA_C11.qxd 11/6/03 3:06 PM Page 326

CHAPTER 11 • LIABILITIES, ON AND OFF BALANCE SHEET 327
In effect, Lopakhin accounts for the issuance costs by increasing the initial discount froma606,000 to a706,000. By applying the effective interest rate of 10.74% to the start-of-year carrying amount, Lopakhin amortises the a100,000 issuance costs over the five-year term of the debt through the annual interest charge. The following journal entry summarises interestexpense, interest paid and discount amortised in x1. The figures are rounded:
Interest expense and payment in x1Dr. Interest expense (OE−) A353,800
(10.74% × 3,294,000)Cr. Bonds payable (L+) A113,800Cr. Cash (A−) 240,000
Approximately a14,400 of the x1 interest charge represents amortisation of issuance costs.There are other kinds of bonds where the interest method can be used to calculate periodic
cost. Zero coupon bonds are bonds which pay no interest. They are an unusual example of adebt security issued at a discount: annual interest expense is equal to discount amortised in theyear. Stepped interest bonds (i.e. where scheduled interest payments increase over the debtterm) and bonds with a stated redemption premium are two further examples. In both cases,the effective interest rate at time of issuance is greater than the (initial) coupon rate.
The interest method has found other applications. Companies that invest in debt securitiesand plan to hold them to maturity usually account for them at amortised cost. In this case, thedifference between the purchase price and face value of the securities is usually amortised by theinterest method. The accounting is the mirror image of that used by the issuer of the debt secur-ities. The interest method is also used to determine the financing charge contained in the peri-odic payments of a finance lease, as we’ll discover in section 3 of the chapter.
Derecognition
A company removes a financial liability from its balance sheet when the obligation is discharged,cancelled or expires.16 For most financial liabilities, there is no uncertainty about when a finan-cial liability is settled. The company that has purchased goods on account removes the payablefrom its accounts when it pays the supplier; the borrower clears a debt off its books when itrepays the lender. So it is with Lopakhin and its 6% bonds. When the bonds mature in Decemberx5, it records the repayment of the a4 million principal as follows:
Redemption of bonds in December x5Dr. Bonds payable (L−) A4,000,000
Cr. Cash (A−) A4,000,000
Note that the entry is the same whether or not Lopakhin’s bonds are issued at par. If bonds areissued at a discount, the discount is fully amortised by the end of their life and the carryingamount of the bonds is equal to their face value then.
l Early retirement of debt
Accounting for retirement of debt is not always straightforward, however. Consider the case ofthe borrower that decides to retire debt early – by, say, replacing the debt with equity or by usingsurplus cash. Where the debt is in the form of bonds, the borrower can do this by buying themback (through negotiation with bondholders or purchases in the secondary market) or by
CFA_C11.qxd 11/6/03 3:06 PM Page 327

328 PART 2 • THE HOUSE OF ACCOUNTING
calling them if the bond contract allows. The fair value of fixed-rate debt will not be the same asits carrying amount if the market rate of interest at this early retirement date is different fromthe effective interest rate on the debt. If market rates have risen (fallen) since the issue date, fairvalue will be less (greater) than carrying amount. The borrower will recognise a ‘gain (or loss)on early retirement of debt’ for the difference.17 Note that the impact on the income statement ofsettling a liability early is the opposite to that of disposing of an asset: where the liability’s fair valueis greater than its carrying amount, the company records a loss.
An example best illustrates this point. Recall that at the start of x1 Lopakhin issues five-year6% bonds at an effective interest rate of 10%. Suppose market interest rates fall in x1 and x2 andby the end of x2 the interest rate on bonds similar to Lopakhin’s is only 8%. Early in x3,Lopakhin decides to buy back all 4,000 bonds.
The cost to Lopakhin of redeeming the bonds (i.e. their fair value) in January x3 exceeds theirvalue on the company’s books then. The bonds’ fair value is a3,794,500, the present value (inJanuary x3) of scheduled debt payments over the remaining three years, discounted at 8%:
[A240,000 × PVA(8%, 3 payments)] + [A4,000,000 × PV(8%, 3 periods)] = A3,794,500Annual Principalinterest
Assuming the company uses the interest method of amortisation, the carrying amount of thebonds at that date is a3,602,700 (see Exhibit 11.1). Thus Lopakhin recognises an accounting lossof a191,800. (We ignore transaction costs incurred in repurchasing the bonds.) The rise in thebonds’ market value results in a holding loss that, under historical cost accounting, is realised –and thus recognised in the income statement – only when they’re retired.
January x3Fair value of 6% bonds A3,794,500Carrying amount −3,602,700
Loss on early retirement A191,800
Lopakhin records the repurchase of the bonds as follows:
Repurchase in January x3 (‘Bonds payable’ shown net)Dr. Bonds payable (L−) A3,602,700Dr. Loss on early retirement of bonds (OE−) 191,800
Cr. Cash (A−) A3,794,500
If, on repurchase, market rates of interest are higher than those prevailing when the debt wasissued, the borrower records a gain on early retirement.
Think carefully about the nature of this gain or loss. Does Lopakhin suffer an economic lossby retiring its high-cost bonds when interest rates fall? Surely it would be better off replacing10% debt with 8% debt? In fact, if taxes and transaction costs are ignored, the company is neither better nor worse off by replacing the debt. Over the five-year term of the original debtcontract, the cost will be 10% regardless of the refinancing terms: in this case the effective inter-est rate on the new debt is lower but annual interest payments are higher.18
Accounting for debt: international practice
Most companies measure long-term debt at amortised cost. Thus bonds payable are shown on thebalance sheet net of unamortised discount (or including unamortised premium). However, EUrules permit – and national rules in some countries (Belgium, Spain) require – firms to report
CFA_C11.qxd 11/6/03 3:06 PM Page 328

CHAPTER 11 • LIABILITIES, ON AND OFF BALANCE SHEET 329
SECTION
3
on the balance sheet the amounts for which they’re legally liable. In this case, bonds payable areshown at their maturity value and any initial discount (premium) is shown as a deferred charge(deferred income). We contrast the two presentations below, using our Lopakhin example.
Lopakhin Company: Extracts from January x1 balance sheet (in B000)
(a) Debt at legal liability
Assets Liabilities and shareholders’ equity. .. .. .
Deferred charge (Bond discount) 606 Long-term liabilities 4,000. .. .. .
(b) Debt at amortised cost
Assets Liabilities and shareholders’ equity. .. .. .
Long-term liabilities 3,394...
The practice of reporting debt at its maturity value will decline in Europe after 2005 when IASbecome mandatory for listed EU companies.
Debt discount or premium is always amortised, regardless of the way it’s presented on the bal-ance sheet. For example, the 4th Directive requires EU companies to amortise the discount by a‘reasonable amount’ each year and write it off completely by the date the debt is repaid (Art. 41).The Directive does not specify the method of amortisation, however. The interest methodappears to be the dominant practice among listed companies, in Europe and elsewhere. It’srequired under US and international rules. The straight-line method is acceptable only when theamount of the initial discount or premium is small and the interest charge is not materially dif-ferent from that reported under the interest method.
The gain or loss arising from the early retirement of debt is usually shown as a component offinancial income or expense. However, companies following US GAAP must report any materialgain or loss as an extraordinary item.
Leasing
Types of lease
A lease is a contract under which the owner of a fixed asset (the lessor) grants another (the lessee)the right to use the asset for a specified period at a specified rental. Assets leased are usually tangibleand can range from office equipment to buildings.
From the user’s standpoint, leasing has advantages over the alternative, asset purchase.
1 It offers flexibility: the lease period can vary from days to years. Some airlines make heavy useof short-term aircraft leases: they can adjust their capacity quickly to changes in demand forair travel.
CFA_C11.qxd 11/6/03 3:06 PM Page 329

330 PART 2 • THE HOUSE OF ACCOUNTING
2 It lowers risk: for assets subject to rapid technological change, leasing on a short-term basisallows the user to avoid being locked into outdated technology.
3 The lessee’s initial cash outlays are reduced. The lessee needs cash to cover only the first leasepayment, not the whole cost of the asset. Moreover, it receives 100% financing of the asset.The lessor provides a loan as well as an asset. Each lease payment includes both a capitalcharge for the asset and a financing charge.
4 Lastly, a lease can yield tax benefits. A lessor with large taxable income shares with the lesseethe benefits of the tax depreciation and investment incentives it receives as owner. Thesebenefits are passed on in the form of lower lease payments. The lessee’s own taxable incomemay be too low for it to utilise tax benefits if it buys the asset.
Leases can be divided into two main types, operating leases and finance leases. An operatinglease is a rental agreement. It has a short duration and cancellation penalties are small. A financelease (capital lease) is akin to a purchase contract with debt financing. The lessor expects torecover the cost of the asset – and be recompensed for financing it – over the lease term. Thusthe lease runs for years, often for the economic life of the asset. It may contain a purchase option.Cancellation results in heavy penalties.
In practice, the dividing line between the two types of lease is not always clear-cut. The keytest – and the one accountants apply – is whether the lessee faces the same risks and rewards asan owner. If the answer is yes, the lease is judged to be a finance lease.
Lessee accounting
From an accounting perspective, the distinction between operating and finance leases is important because, under international rules, the two types of lease are accounted for differently.
An operating lease is viewed as a commitment: the lessee recognises neither liability nor assetwhen it signs the lease contract. The asset under lease remains on the lessor’s books (and isdepreciated there). Lease payments are accounted for as rent: they’re recorded by the lessor asincome when earned and by the lessee as an expense when the cost is incurred.
A finance lease is considered to be the equivalent of a purchase of a fixed asset by instalment.In this case, the lessee records a fixed asset and long-term liability on its books when the leasecontract is signed. It charges the costs of the asset (depreciation) and of the liability (interestexpense) to its income statement each period. Meanwhile, the lessor, though still the legal owner,records the sale of the asset under lease and its replacement by a (long-term) receivable, onwhich interest is earned.
In this section we illustrate the two treatments from the lessee’s perspective. (Accounting bythe lessor is illustrated in the appendix.) Consider the case of Jupiter Bus Company. On 1 January year 1, it decides to lease a bus from the manufacturer, Offenbach, for its MountOlympus to Hades run. Here are details about the bus and the lease agreement:
l The fair value of the bus on 1 January is 309,250. It has a three-year economic life. Its expectedresidual value is zero. It is depreciated on a straight-line basis.
l Annual lease payments of 120,000 are payable at the end of each year. (Normally, paymentsare made at the start of the lease period. Our assumption simplifies Jupiter’s bookkeeping.)The payments do not include maintenance and insurance costs which are covered by a separatecontract.
l The interest rate implicit in the annual lease payments is 8%. (Solving [120,000 × PVA3x% =
309,250] yields x = 8.)
CFA_C11.qxd 11/6/03 3:06 PM Page 330

l Accounting for operating leases
How would Jupiter account for the lease if it were an operating lease? We assume the benefitsfrom the lease are spread evenly over the three years: thus the cost of the lease each year (rentexpense) is equal to the annual payment. The summary journal entry each year is as follows:
31 December year 1 (and years 2 and 3)Dr. Rent expense (OE−) 120,000
Cr. Cash (A−) 120,000
It makes no other entries. It records no liability at 1 January year 1, even though it is con-tractually bound to make payments to Offenbach for the following three years.
l Accounting for finance leases
Consider now the case where the lease is accounted for as a finance lease. On 1 January year 1,the date of signing the lease, Jupiter records a fixed asset and a liability of 309,250, which is boththe fair value of the leased asset and the present value of its lease payment obligations:
Shareholders’Assets == Liabilities ++ equityLeased Leaseasset liability
1 January year 1 +309,250 = +309,250
Jupiter reports the leased vehicle as a fixed asset on its balance sheet. The lease liability isequivalent, in economic terms, to a loan from Offenbach to Jupiter. If Jupiter were to draw up abalance sheet on 1 January, it would show the principal portion, 95,260, of the first payment of120,000 as a current liability and the balance, 213,990, as a long-term liability. (This can be seenfrom the ‘Lease liability’ column in Exhibit 11.3.)
During each of the three years 1 to 3, Jupiter recognises in its income statement the amortisa-tion of the asset and the cost of Offenbach’s loan (interest expense).19 The asset’s life is, in thiscase, equal to the lease term (three years). Amortisation is on a straight-line basis. Thus theannual amortisation Jupiter records is 103,083 (309,250/3).
The cost of the implicit loan is calculated using the interest method. To determine annualinterest expense, Jupiter applies the discount rate implicit in the lease (in this case 8%) to thestart-of-year carrying amount of the liability. In year 1, the interest charge is 24,740 (309,250 ×8%). This may be accrued during the year or recognised at the time of the first annual lease pay-ment of 120,000. The balance of that payment (95,260) represents part repayment of the leaseliability. The entries Jupiter makes in year 1 in connection with the Offenbach lease are sum-marised below:
Amortisation of asset in year 1Dr. Amortisation expense (OE−) 103,083
Cr. Accumulated amortisation,leased asset (CA+) 103,083
Annual lease payment at end-year 1Dr. Interest expense (OE−) 24,740Dr. Lease liability (L−) 95,260
Cr. Cash (A−) 120,000
CHAPTER 11 • LIABILITIES, ON AND OFF BALANCE SHEET 331
CFA_C11.qxd 11/6/03 3:06 PM Page 331

The carrying amount of the lease liability at the end of year 1 is 213,990, the initial liability(309,250) less the repayment of principal in year 1 (95,260). This is the basis for calculatinginterest expense in year 2.20
Exhibit 11.3 sets out the effect of the finance lease on Jupiter’s accounts in each of years 1 to3, using the balance sheet equation. A table at the bottom of the exhibit shows the calculation ofannual interest expense and the end-year balance in the lease liability account.
332 PART 2 • THE HOUSE OF ACCOUNTING
Shareholders’Assets == Liabilities ++ equity
Leased Lease Profitasset Cash liability for year
Balance,start year 1 309,250 309,250
During year 1Amortisation –103,083 = –103,083of asset (Amortisation
expense)Lease payment –120,000 = –95,260 –24,740(and recognition (Interestof interest) expense)End 1 balance 206,167 213,990
During year 2Amortisation –103,083 = –103,083Lease payment –120,000 = –102,881 –17,119End 2 balance 103,084 111,109
During year 3Amortisation –103,084 = –103,084Lease payment –120,000 = –111,109 –8,891End 3 balance 0 0
Effect of lease on cash and SE, years 1–3 –360,000 –360,000
Calculation of interest expense and end-year liability(1) (2) (3) (4) (5)
Lease Lease Interest Reduction in End-yearliability payment expense liability liability
Year at 1/1 at 31/12 8% × (1) (2) – (3) (1) – (4)
1 309,250 120,000 24,740 95,260 213,9902 213,990 120,000 17,119 102,881 111,1093 111,109 120,000 8,891* 111,109 0
* Rounded.
Calculation of annual amortisation expense
Amortisable cost of leased vehicleEconomic life (in years)
,
,= =309250
3103083
Jupiter Company (lessee): financial statement impact of finance leaseExhibit 11.3
......
...
......
...
CFA_C11.qxd 11/6/03 3:06 PM Page 332

The total cost of the lease – in terms of amortisation and interest charges – is 360,000, thesame as the total lease payments. Of course, the exhibit ignores the benefits which the leased busyields Jupiter. (Rumour has it that the Mount Olympus to Hades route is a lucrative one.)
l Financial statement impactThe difference in impact of the two methods on a lessee’s income is, in most cases, small.Initially, and also when the use of leasing is increasing, lease capitalisation (as the finance leasemethod is known) leads to lower income, because amortisation and interest charges combinedexceed the rental charge. However, over time the interest charge diminishes and in later periodsthe total annual expense is likely to be less under lease capitalisation.
Exhibit 11.4 contrasts the impact of the two leasing methods on Jupiter’s pre-tax income, byyear and in total. Notice that the expenses recognised over the three years total 360,000 in eachcase. This is because we assume both Offenbach and Jupiter use the same discount rate,Offenbach to determine the annual lease payment and Jupiter to determine the cost of the loan.What is also evident from Exhibit 11.4 is that the choice of method affects the timing of expenserecognition. As a general rule, a lessee’s expenses in the early years of a lease are likely to behigher under a finance than an operating lease – assuming operating lease charges are constanteach period and the leased asset under a finance lease is amortised on an SL basis.
It’s the balance sheet impact of lease capitalisation which causes lessee companies most concern. Under the finance lease method, an additional asset and liability are created. Since theliability is interest-bearing, the result is an increase in reported financial leverage. Consider JupiterCompany’s position. Assume that, on 1 January year 1, before signing the lease contract withOffenbach, its shareholders’ equity and debt are 2 million and 1 million respectively, giving adebt–equity ratio of 0.5:1. By the end of the day (and ignoring other events and transactions),the ratio rises to 0.57:1 (1.309/2.309) if Jupiter capitalises the lease.
Notice that the lessee’s (pre-tax) cash flows are the same under both the operating and thefinance lease methods.
CHAPTER 11 • LIABILITIES, ON AND OFF BALANCE SHEET 333
Year Operating lease Finance lease
1 Rent expense 120,000 Amortisation expense 103,083Interest expense 24,740
127,823
2 Rent expense 120,000 Amortisation expense 103,083Interest expense 17,119
120,202
3 Rent expense 120,000 Amortisation expense 103,084Interest expense 8,891
111,975
Total 360,000 Total 360,000
Jupiter Company (lessee): income statement impact of leased asset under operatingand finance lease methods
Exhibit 11.4
CFA_C11.qxd 11/6/03 3:06 PM Page 333

l Lease capitalisation under IASCompanies cannot choose between the operating and finance lease methods. National and inter-national rules state explicitly when a lessee should capitalise a lease. For example, IAS state: ‘Alease is classified as a finance lease if it transfers substantially all the risks and rewards incident toownership.’21
Under what circumstances are ‘substantially all the risks and rewards’ considered transferred?The international accounting standard offers the following examples (US rules in this area whichmany international companies follow are more specific and are given in parentheses):
1 Ownership of the asset is transferred to the lessee by the end of the lease term.2 The lease contains a ‘bargain-purchase’ option, i.e. the lessee has the right to buy the asset at the
end of the lease and the price is so advantageous that the lessee is expected to exercise theoption.
3 The lease term covers the major part (USA: 75% or more) of the asset’s economic life.4 The present value of the lease payments at the start of the lease is greater than or equal to sub-
stantially all (USA: 90%) of the fair value of the asset. 5 The leased asset is of a specialised nature and can only be used (in its existing form) by the lessee.22
Under condition 1, the lease is, in form, the purchase of an asset by instalments. Under con-ditions 2 to 4, it is, in substance, an instalment purchase, since the lessor expects to recoup most,if not all, of its investment during the lease term. If any one of these conditions is met, the lesseemust recognise a leased asset and lease liability in its accounts.
National and international regulators define carefully the terms used in the accounting rulesfor leases. Here are the international standard’s definitions of the more important ones:
l Lease term. This includes not just the initial lease period but also any renewal term if the lesseehas the option to renew and is likely to exercise that option (e.g. because the lease payments inthe renewal term are low).
l Lease payments. These include the minimum annual payments (excluding service costs andtaxes) and any residual value which is guaranteed by the lessee or a related party. If the lease con-tains a bargain-purchase option, lease payments include the amount of the option in place ofthe guaranteed residual value.
l Initial valuation of leased asset and lease liability under finance lease. At the start of the lease,the lessee should measure the leased asset and lease liability at the fair value of the asset or, iflower, at the present value of the lease payments.
l Amortisation period of asset under finance lease. If it’s likely ownership will transfer to the lesseeat the end of the lease term, the lessee should amortise the asset over its useful life. If the lessoris likely to retain ownership, the amortisation period should be the shorter of useful life or thelease term. Note that, because land has an indefinite life, a lease of land always fails condition3 and is treated as an operating lease.
l Discount rate (in PV and interest expense calculations). This should be the interest rateimplicit in the lease (from the standpoint of the lessor). If the lessee does not know this rate– and it may well not, given that it is unaware of both the unguaranteed residual value thelessor expects and the lessor’s tax position – it should use its incremental borrowing rate (fordebt of similar risk and maturity).
Regulators introduced capitalisation tests – and the accompanying definitions – becauselessee companies were reluctant to capitalise finance leases on a voluntary basis. Even now, manylessee companies structure their leases in order to avoid capitalisation and its impact on reportedleverage. The IASB is so concerned about the extent of avoidance that it plans to draft new rulesthat will extend capitalisation to a broader set of leases.
334 PART 2 • THE HOUSE OF ACCOUNTING
CFA_C11.qxd 11/6/03 3:06 PM Page 334

CHAPTER 11 • LIABILITIES, ON AND OFF BALANCE SHEET 335
SECTION
4
l Sale-and-leaseback agreementsAccounting rules have been introduced to cover new types of leasing products. One of the mostpopular is the sale-and-leaseback agreement. This enables a company (the seller-lessee) to raisecash by selling a major asset such as land or commercial property while retaining use of it.
Sale-and-leaseback arrangement
Sale ofasset
Seller-lessee Purchaser-lessor Asset leased back to seller
As with ordinary leases, the key issue is: is the lessee (still) the economic owner of the asset?If the ‘leaseback’ is judged to be a finance lease, the answer is yes: the seller-lessee has, in effect,borrowed funds against the asset. As a result, under international rules any gain on disposal ofthe asset is considered unrealised at the time of sale. Instead, the seller-lessee defers and spreadsthe gain over the lease term.
l Lessee accounting: international practiceCapitalisation of finance leases has long been mandatory in countries with an Anglo-Saxonaccounting tradition (e.g. UK, USA, Commonwealth countries). In countries with a ContinentalEuropean accounting tradition, the distinction between operating and finance leases is relativelynew: until recently all leases in these countries were accounted for as rentals. This is still the wayFrench and Italian companies account for leases in their individual (i.e. non-consolidated)accounts.
Despite growing acceptance that finance leases should be capitalised, accounting practice isstill not harmonised in this area. For example, national rules lay down different capitalisationcriteria. Many follow international and US rules and lay down ownership transfer and invest-ment recovery tests (i.e. present value of lease payments approximates fair value of leased asset).A Japanese company, however, must capitalise only those leases where it gains – or is likely togain – ownership of the asset (i.e. those containing a transfer-of-title clause or a bargain purchaseoption). It may – but is not required to – capitalise other types of finance lease.
Liabilities and financial statement analysis
l Financial statement presentationVirtually all companies, in Europe and elsewhere, distinguish current from non-current liabil-ities, either on the face of the balance sheet or in the notes to the accounts. Current liabilities arethose that are expected to be paid or settled within one year of the balance sheet date. Includedwithin them is the current portion of long-term liabilities. If, however, the company intends torefinance the debt on a long-term basis and there is evidence (e.g. a refinancing agreement) thatit is able to do so, it can classify the current portion as long-term.23 Given information about cur-rent assets as well as current liabilities, investors can better assess the ability of the firm to meetits short-term debts.
CFA_C11.qxd 11/6/03 3:06 PM Page 335

Companies also distinguish creditors from provisions on their balance sheets. In principle,this is a useful distinction: payments to creditors are more certain in terms of both amount andtiming. However, as we’ve seen, certain provisions shown on the equity side of the balance sheetmay not represent an estimated liability but simply expenses accrued in the period. Moreover, afirm may use provisions for income-smoothing purposes. Investors are better able to identify theestimated liabilities among provisions if the firm gives a breakdown of provisions by type (e.g.restructuring, environmental costs, employee benefits). IAS require firms to provide this break-down – and to show the movement in each type of provision over the year. With this informa-tion, investors can better gauge whether a firm is using provisions to smooth income (i.e.increasing provisions in fat years and reducing them in lean ones).
Since contingent liabilities are not recognised in the accounts, investors must consult thenotes for information about them. IAS require firms to give summary information about eachclass of contingent liability. For example, a firm will disclose for each major lawsuit the plain-tiff ’s name, the nature and amount of the claim, and a brief history of the legal proceedings todate. Disclosure of a contingent liability isn’t required if management reckon the likelihood ofthe firm making future payments to settle it is remote.24
l Disclosures and long-term debtInvestors want to know not just the amount of financial liabilities but also when they’re due andhow much it costs to service them. The information EU companies are required to disclose ondebt payment is limited. Under the 4th Directive, larger firms must state in the notes theamounts due and payable more than five years after the balance sheet date (Art. 43(6)). Using thisand other information in the accounts (e.g. current/non-current liabilities), an investor candetermine the following:
l debt payable within one year of . . .l debt payable between two and five years of . . .l debt payable more than five years after . . .
the balance sheet date. Larger firms must also state the amount of debt which is secured and thenature and form of the security.
IAS are more demanding. Companies following international standards must disclose, byclass of financial liability, information about the ‘significant terms and conditions that may affectthe amount, timing, and certainty of future cash flows’. As a result, such firms now provide keydetails of major debt issues such as face value, coupon rate, currency, maturity date and – whereapplicable – sinking fund payments or call dates. To help investors assess interest rate risk, IASrequire firms to disclose the effective interest rate (for fixed-rate debt) and repricing dates (forfloating-rate debt). And they must also disclose the fair values of their financial liabilities (andassets) by class, so long as it is practicable to do so.25
There is also a growing trend among quoted companies – in response to stock exchange regu-lations as well as accounting standards – to explain in the annual accounts the financial risks they are bearing and the steps they have taken to reduce or contain them. An example of suchdisclosure can be found in the published accounts of BG Group, a medium-sized integrated gascompany with headquarters in London but most of its assets outside the UK. BG’s net borrow-ings rose almost 50% in 2001 – from £360m to £538m – to finance a heavy capital expenditureprogramme but the group’s debt-to-capital ratio was still a modest 13% at end-2001. In thenotes to its 2001 accounts, BG discloses the types of its borrowings, their maturity profile andcurrency and interest rate composition, and summary information on all its financial instru-ments (e.g. the fair values of financial liabilities and assets, notional principal amounts of derivat-ives). Extracts from the relevant notes are set out in Exhibit 11.5.
336 PART 2 • THE HOUSE OF ACCOUNTING
CFA_C11.qxd 11/6/03 3:06 PM Page 336

(Source: BG Group, Annual Report and Accounts 2001. Reproduced by permission of BG Group plc.)
Note 16 Borrowings
2001 2000Amounts falling due After After
Within more than Within more thanone year one year one year one year
£m £m £m £mOther loans – commercial paper 12 – 118 –
– bonds 113 379 57 178Bank loans and overdrafts 216 84 146 55Bills of exchange payable 152 – – –Gross borrowings 493 463 321 233
Note 17 Currency and interest rate composition of the Group’s borrowings
The following tables analyse the currency and interest rate composition of the Group’s gross borrowings of£956m (2000 £554m) and net borrowings of £538m (2000 £360m) before and after taking swaps into account.Net borrowings comprise gross borrowings less current asset investments and cash at bank and in hand.
Currency compositionGross borrowings Net borrowings
% after taking % before taking % after taking % before taking swaps into account swaps into account swaps into account swaps into account2001 2000 2001 2000 2001 2000 2001 2000
Currency:Sterling – 4 37 4 (12) (30) (53) (30)US dollars 86 88 47 79 96 126 28 111Euros – – 7 11 – (5) 13 13Other 14 8 9 6 16 9 6 6
Interest rate compositionGross borrowings Net borrowings
% after taking % before taking % after taking % before taking swaps into account swaps into account swaps into account swaps into account2001 2000 2001 2000 2001 2000 2001 2000
Basis:Fixed rate 65 84 83 86 41 77 74 79Floating rate 35 16 17 14 59 23 26 21
The effective interest rates as at 31 December 2001 were between 2% and 19% (2000 5% and 17%). Theinterest rates on those Group borrowings which are at floating rates are determined mainly by the prevailingLIBOR (London Interbank Offered Rate) for the relevant currency and maturity at the time of determinationplus or minus an agreed margin.
Currency and interest rate composition (after the effect of swaps)Fixed rate Fixed rate
weighted average weighted average Fixed Floating 2001 2000period interest rate borrowings borrowings Total Totalyears % £m £m £m £m
Currency:Sterling – – – – – 21US dollars 1.1 6.1 609 209 818 490Brazilian reals – – – 126 126 30Indian rupees 1.2 12.3 12 – 12 13Gross borrowings 621 335 956 554
For the purposes of the above tables, debt with a maturity within one year, such as commercial paper, bills ofexchange and other money market borrowings, has been treated as fixed rate. Borrowings falling due aftermore than one year of £463m (2000 £233m) (after currency and interest rate swaps) can be analysed as fixedrate 47% (2000 69%) and floating interest rate 53% (2000 31%).
Debt disclosures: extracts from notes to BG Group’s accounts, 2001Exhibit 11.5
CFA_C11.qxd 11/6/03 3:06 PM Page 337

338 PART 2 • THE HOUSE OF ACCOUNTING
BG uses derivative instruments such as swap agreements and forward exchange contracts tohedge its exposure to interest rate and exchange rate movements. From the disclosures in Exhibit11.5, it is evident that BG swapped fixed-rate for floating-rate debt and sterling for US dollardebt in 2001. Management state in the operating and financial review that the group has largedollar-denominated assets and conducts much of its business in that currency. Dollar debt – andthe associated payments – act as a natural hedge for these dollar inflows. As a UK company, BG can secure better terms raising debt in its home currency and then swapping the sterling debt into dollars. The swap into floating-rate debt suggests management expected interest ratesto fall.
BG makes other helpful debt-related disclosures in the 2001 report not shown in Exhibit 11.5.Three stand out. First, BG reveals the credit ratings given by the main credit rating agencies –Moody’s, Standard & Poor’s and Fitch – to its borrowing entities. These ratings influence theinterest rate a company pays on its debt. Investors find a change in rating especially informative:it signals an improvement or deterioration in the company’s debt-servicing ability and hasimplications for profit and cash flow forecasts. Second, BG reports its share of the net borrow-ings of joint ventures with other companies. This is a large figure (around £600m) and, giventhat BG accounts for investments in these ventures on a net basis, is not included in its consol-idated debt. Investors are concerned about the level of joint-venture debt: the larger such debt,the greater is a company’s effective leverage. (In BG’s case, the risk is less since the debt is non-recourse.) Third, BG discloses the amounts of its unutilised borrowing facilities. They are extensive(around US$3 billion). Investors view untapped lines of credit as an indicator of the company’sdebt capacity – and of its ability to move quickly if new investment opportunities arise.
l Disclosure of lease commitmentsUnder international rules, companies are required to indicate the fixed assets under lease and therelated lease liabilities. In addition, they have to show the minimum payments they’re commit-ted to make under both long-term finance and non-cancellable operating leases (a) within oneyear; (b) between one and five years; and (c) more than five years of the balance sheet date.26
Companies following US GAAP provide payment data by year for the five years following thebalance sheet date for all non-cancellable leases.
Information about future lease payments is of double benefit to investors. It helps themimprove their forecasts of a company’s cash flows. Moreover, they can estimate, on an approx-imate basis, the present value of a firm’s (non-cancellable) operating lease commitments andincorporate the capitalised amount in their leverage calculations.
l Financial leverageA firm must give up assets, usually cash, to settle its liabilities. As a result, the more liabilities acompany has relative to its assets (i.e. the greater its financial leverage or gearing), the morerisky it’s perceived to be. There’s then a greater chance that the company will be insolvent, thatis, unable to pay its debts when they are due. If the company is liquidated, shareholders may failto recover their investment.
Analysts employ various measures to assess a firm’s financial risk. We look first at asset-basedratios and then at ratios based on earnings. Companies may account for the same type of liabil-ity in different ways. Thus financial statement users must be able to make adjustments to thenumbers in the accounts to render the liability figures more comparable.
Asset-based debt ratiosThe most widely used balance sheet measure of leverage is the debt–equity ratio. We defined itin Chapter 2 as the ratio of net debt to group equity:
CFA_C11.qxd 11/6/03 3:06 PM Page 338

Debt–equity ratio ==
‘Net debt’ is short- and long-term interest-bearing liabilities less liquid assets (e.g. cash and marketable securities) surplus to operating requirements. (In practice, analysts deduct all liquidassets since it’s difficult to separate out the non-operating portion.) It’s quite common for com-panies to borrow and carry large liquid assets at the same time. For example, a firm may borrowin a foreign currency to hedge its foreign assets but maintain large cash balances – say, to financecorporate acquisitions – in its domestic currency. ‘Group equity’ is the sum of shareholders’equity (i.e. the equity of parent company shareholders) and minority interests (the equity of out-side shareholders in subsidiary companies).
Investors calculate balance sheet leverage in other ways. A popular ratio is the debt-to-capital ratio:
Debt-to-capital ratio ==
‘Capital’ as defined here is equal to net operating assets (operating assets less operating liabilities).27
So the ratio tells us what proportion of the firm’s net operating assets is financed with debt.A broader gauge of balance sheet leverage is the liabilities–assets ratio. In this case, total
operating and financial liabilities are divided by total assets. This is a useful measure of leveragewhere a company treats operating liabilities as a source of finance (e.g. suppliers’ credits in thecase of retailers and customer deposits in the case of banks).
Balance sheet leverage ratios may be inverted. In this form, they indicate the degree of pro-tection a firm’s assets afford its creditors. Consider the inverse of the liabilities–assets ratio: totalassets/total liabilities. The creditor can see from this by how much assets can decline from theirpresent level before liabilities are ‘uncovered’ by assets. The greater the cover, the greater is the‘margin of safety’ for creditors.
Industry conditions affect the margin of safety creditors seek. Companies in industries withrelatively stable cash flows – because of a low income elasticity of demand for their products(food retailing) or because of regulation (electric utilities) – can carry relatively high debt ratioswithout alarming creditors.
Traditionally, investors have calculated balance sheet leverage using book values of debt andequity. Many financial analysts argue that this understates a firm’s debt capacity – especially ifthe firm is in a knowledge-based industry – since key resources are not recognised as (intan-gible) assets on its balance sheet. They prefer using market values when calculating debt ratios.One version is the debt-to-capitalisation ratio:
Debt-to-capitalisation ratio ==
The market value of a firm’s equity is the product of the current price of its ordinary (common)shares and the number of shares outstanding. If the market (or fair) value of debt or minorityinterests is not known, analysts use book value instead.
The debt-to-capitalisation ratio has yet to find favour with creditors. Leverage calculations inloan covenants still tend to be expressed in book value terms. One reason may be that when afirm gets into financial difficulties, its market value – and thus the value of its intangibles –shrinks rapidly. If the firm is liquidated, it is its tangible and tradeable assets which provide mostof the cash to settle creditors’ claims.
A note of warning before you compare debt ratios across firms and over time. Check the wayassets and liabilities are calculated in company accounts. Companies may define liabilities (orassets) differently. We have already seen how provisions may inflate the reported liabilities ofsome European companies. Companies may also have different recognition and measurement
Net debt (at market value)
Shareholders’ equity (at MV) Minority interests (at MV)++
Net debt
Net debt Group equity++
Net debt
Group equity
CHAPTER 11 • LIABILITIES, ON AND OFF BALANCE SHEET 339
CFA_C11.qxd 11/6/03 3:06 PM Page 339

policies, too. Adjusting company financial statements for national accounting differences revealssurprising variation in cross-border financial leverage, as Box 11.1 shows. The reasons for thevariation in leverage are not well understood yet.
Earnings-based debt ratiosHealthy companies service their debt from earnings rather than asset disposals. Investors there-fore check to see whether and by how much a company’s operating earnings cover its financialfixed charges. The ratio they commonly use is the interest cover. It’s also known as the timesinterest earned ratio. In its basic form it shows earnings (pre-interest and pre-tax) expressed asa multiple of interest expense.
Interest cover ==
‘Interest expense’ can be a net figure, i.e. net of interest income. It’s customary to calculate interestexpense in this way where a company carries large balances of cash and other interest-bearingfinancial assets.
A firm operating at break-even (i.e. making zero pre-tax profit) has an interest cover of 1: itmakes profits just sufficient to meet interest charges. Loan agreements often set a minimumcover (as well as a maximum debt–equity ratio). Healthy companies usually have an interestcover of at least 2.
To make valid comparisons of interest cover across firms and over time, earnings and inter-est expense must be calculated consistently. In addition to general adjustments to earnings toeliminate differences in accounting policies (on depreciation, inventory costing, etc.), investorsoften make two specific adjustments. These are designed to broaden the ratio to cover all (finan-cial) fixed charges. First, they estimate the interest element in lease and other rental paymentsand add it to both numerator and denominator. In addition, they include in the denominatorinterest charges that have been capitalised in the year. (As a capitalised cost, it is not chargedagainst earnings and thus the numerator, which represents adjusted earnings, is not affected.)
The resulting fixed charge coverage ratio is calculated as follows:
Fixed charge coverage ratio ==
Notice that we’ve moved away from a pure earnings-based ratio. The denominator of the fixedcharge coverage ratio is, in essence, the interest paid in the year. Some investors go further anddefine the coverage ratio solely in cash-flow terms. We look at the use of cash-flow-based ratiosto assess financial risk in a later chapter.
Concealed debt: warning signalsCompanies with high reported leverage may try to conceal the extent of their indebtedness. Wesaw earlier in the chapter how firms do this. They issue quasi-equity (debt masquerading asequity). They ‘sell’ assets with recourse. They borrow through unconsolidated subsidiaries. Andthey lease fixed assets long-term using operating leases.
How can debt disguised in these ways be unmasked? The simple answer is: check a firm’saccounts, especially the notes, carefully. We give some examples below.
l Issue of quasi-equity. Check the balance sheet. Are there any preference shares – or other shareswith debt characteristics – outstanding? If so, find out from the notes what the repaymentterms are. Redeemable preference shares, where redemption is not under the control of theissuing firm, are effectively debt securities.
Netprofit
Incometax expense
Interestexpense
Interest portionof rental costs
Interest expense Capitalised interest Interest portion of rental costs
++ ++ ++
++++
Net profit Income tax expense Interest expense
Interest expense
++ ++
340 PART 2 • THE HOUSE OF ACCOUNTING
CFA_C11.qxd 11/6/03 3:06 PM Page 340

Financial leverage: international differencesBOX11.1
Are there international differences in corporate financial leverage, and if so, why? Economistshave long believed that leverage is higher in countries with a large banking sector (e.g. France,Germany, Japan) and lower in countries with large stock markets (e.g. Canada, UK, USA). Theevidence doesn’t support this, however. Instead, the data suggest that other factors are at play.
Rajan and Zingales calculated various balance sheet and income statement leverage ratiosfor firms in seven large countries in 1991.28 In their study, they compute the ratios twice – first,using reported numbers (unadjusted ratios) and then after making adjustments for certain keyaccounting differences across countries (adjusted ratios). The adjustments to shareholders’equity are:
1 Add deferred income taxes. In 1991 these were mostly long-term undiscounted liabilities,which analysts judged to be small in present value terms.
2 Deduct intangibles (including goodwill). Capitalisation criteria for R&D differed acrosscountries. Moreover, treatment of goodwill differed: UK companies wrote it off againstreserves while North American and Japanese companies capitalised it.
3 Add other provisions. In countries with a Continental European accounting tradition, theseconsisted largely of accrued costs in 1991.
Rajan and Zingales also use net rather than gross debt in the adjusted ratio calculations. Thechart below shows the unadjusted and adjusted versions of one of Rajan and Zingales’ ratios –average debt to capital (at book values) – for all non-financial firms in G7 countries that pub-lished consolidated accounts in 1991.
The adjustments reduce leverage in all seven countries, in four cases significantly (FranceGermany, Japan, UK). However, after adjustment, the ratio is similar in five of the seven coun-tries (0.33–0.39). Only in Germany (a bank-oriented country) and the UK (a stock market-oriented country) is it much lower (0.18 and 0.16 respectively). Why? Rajan and Zingalessuggest institutional differences – such as the tax code, bankruptcy law and restrictions on hostile takeovers – are responsible for cross-country differences in leverage. Differences increditor rights are especially significant. Bankruptcy law is more creditor-friendly in Germanyand the UK than in the other five countries. For example, only Germany and the UK allowsecured creditors to try to collect their debts (by, for example, seizing their collateral) after thecompany files for bankruptcy. Moreover, in the UK, managers of the debtor company areautomatically replaced at the time of liquidation. These important creditor rights effectivelyraise the cost of debt for the company’s insiders (i.e. managers and controlling shareholders)and help explain why financial leverage is lower in Germany and the UK.29
CFA_C11.qxd 11/6/03 3:06 PM Page 341

342 PART 2 • THE HOUSE OF ACCOUNTING
l Unconsolidated debt. Check the financial fixed assets (or ‘investments’) note, together with thelisting of the firm’s subsidiaries and associates. Does the firm have any large investments inassociated companies or joint ventures? More unusually, does it have any significant uncon-solidated subsidiaries? It should provide in the notes to the accounts a summary balance sheetand income statement for each major affiliate or joint venture.
l Leased assets. Consult the ‘commitments’ note. If the firm has entered into lease contracts,whether of a finance or of an operating nature, it is committed to making lease payments infuture years and these should be disclosed, if material.
This is not a complete list. Debt can be disguised in other ways. For example, a firm may enterinto a long-term purchase agreement with a supplier in which the agreement contains a ‘take-or-pay’ clause. It may guarantee the debt of a third party (e.g. a key supplier). Long-termpurchase agreements are commitments; guarantees are contingent liabilities. Thus the commit-ments and contingencies notes should be studied carefully. The financial effects of these andother hidden liabilities can then be estimated and incorporated into leverage ratios.
SummaryWe surveyed general issues concerning liabilities in section 1 of the chapter. Liabilities come inmany forms but the accounting for them has a common framework. In all cases, the debtor hasan obligation to another, as a result of a past transaction, and expects to sacrifice resources (cash,goods or services) in the future to settle it. The debtor recognises the obligation, whether knownor estimated, on the face of the balance sheet so long as the sacrifice is both probable and meas-urable. Liabilities like assets are usually valued at historical cost, that is the cost – in cash, goodsor services – of settling the liability at the time it was incurred.
The above framework is not always honoured. Firms include items in the liabilities section of the balance sheet that aren’t present obligations (e.g. certain accrued costs) and exclude items which are (e.g. liabilities disguised as equity or asset sales). Moreover, many people ques-tion the framework. At present, financial commitments (other than certain lease commitments)are not considered accounting liabilities. Changes in the market value of a liability are not usu-ally recognised.
We explored in section 2 of the chapter the accounting problems that arise when firms raiselong-term debt capital. The cash a firm issuing debt securities receives at the time of issuancemay be less than the amount it must repay on maturity. This initial discount increases the lifetime cost of the debt. Rather than recognising it in one period, the firm amortises it – by theSL or interest method – over the debt term through a higher interest charge. We showed howthese ideas can be applied to other types of debt and debt-related costs.
Firms often choose to lease rather than buy fixed assets. We discussed lessee accounting insection 3 of the chapter (and lessor accounting in the appendix). Where the lessee is consideredthe economic owner of the asset under lease, the transaction is accounted for as an instalmentpurchase. The lessee recognises a fixed asset and a long-term liability when the lease contract issigned. It amortises the asset over the lease term and recognises as interest expense the cost ofthe implicit loan.
Accounting for long-term debt and leases in Europe is in a state of flux. National rules differand international standards are not yet widely observed. Under pressure from investors, quotedfirms are disclosing more information, in particular, the market values of their financial liabil-ities and the interest rate, currency and other risks associated with them. We summarised IAS disclosure requirements in section 4 of the chapter. To assess a firm’s ability to service its debts,investors supplement asset-based leverage ratios with income-based ones. We described bothtypes of ratio in section 4 of the chapter and pointed out their strengths and weaknesses.
CFA_C11.qxd 11/6/03 3:06 PM Page 342

CHAPTER 11 • LIABILITIES, ON AND OFF BALANCE SHEET 343
APPENDIX
11.1 Leasing–lessor accounting
Leasing is a profitable activity for the owner as well as the user of an asset. For the manufacturer,it can help promote sales. For example, a long-term lease can be marketed as a cheaper alternat-ive to outright purchase. Financial institutions act as lessors, too. They buy assets from the manufacturer and then lease them on to users. (If the lessor-bank borrows funds to finance the purchase of the asset, the lease is known as a leveraged lease.) Leasing is often preferable tothe alternative, a loan to the user to finance the asset’s purchase. First, the lessor-bank has greatersecurity for its loan: it, not the user, owns title to the asset. Second, it can take advantage of thetax benefits (tax depreciation and credits) available to owners and reduce its tax bill.
The distinction between operating and finance leases we identified in the chapter has account-ing implications for lessors, too. In the case of an operating lease, the asset remains on the lessor’sbooks. It records each period the rental income earned and the depreciation of the asset. With afinance (or capital) lease, however, the lessor disposes of the asset and records a lease receivable,the counterpart to the lease liability recognised by the lessee.
If the lessor is a manufacturer or distributor, the finance lease is known as a sales-type lease.The transfer is viewed as a sale and the lessor recognises, at the time of the contract, a profit (orloss) based on the difference between the ‘sale’ price (fair value) of the asset and its cost.
If the lessor is a financial institution, the finance lease is known as a direct financing lease. Noprofit or loss arises on the transfer of the asset to the lessee, because its fair value is equivalent toits cost to the lessor-bank. It is the loan element in the lease transaction which provides the lessor-bank with a return (in the form of interest) on its investment.
l Accounting for sales-type leasesWe look first at the accounting for sales-type leases. You’ll recall from our discussion of lesseeaccounting that Jupiter, a bus company, leases a bus from Offenbach, the manufacturer. Hereare the main details of the bus and the lease:
l The fair value of the bus at the start of the lease is 309,250. The cost of manufacture is 225,000.The bus has a three-year life and its expected residual value is zero. Offenbach depreciatesfixed assets on a straight-line basis.
l The lease has a three-year term. Jupiter must make a payment of 120,000 to Offenbach at theend of each year. The implicit interest rate in the lease is 8%.
Offenbach accounts for the lease in the same way as an instalment sale. At the start of thelease, it recognises revenue from the ‘sale’ of the bus and records an increase in its receivables.At the same time, it recognises the cost of the sale and records a reduction in its inventory. Thejournal entries are summarised below:
‘Sale’ of bus on 1/1/year 1Dr. Lease payments receivable (A+) 309,250
Cr. Sales revenue (OE+) 309,250Dr. Cost of sales (OE−) 225,000
Cr. Finished goods inventory (A−) 225,000
For balance sheet classification purposes, the lease payments receivable should be split into itscurrent (95,260) and long-term (213,990) components.30
Offenbach recognises profit on the sale of 84,250 on 1 January year 1. It also earns interest onthe outstanding lease receivable over the term of the lease contract. A lessor uses the interest
CFA_C11.qxd 11/6/03 3:06 PM Page 343

method to calculate interest income. It applies the interest rate implicit in the lease to the start-of-period receivable. Using this method, Offenbach recognises interest income of 24,740 in year 1(309,250 × 8%). The entries Offenbach makes to record the receipt of the year 1 lease paymentand to recognise interest earned that year are summarised below:31
Cash receipt & interest earned in year 1Dr. Cash (A+) 120,000
Cr. Lease payments receivable (A−) 95,260Cr. Interest income (OE+) 24,740
With each lease payment received, the receivable outstanding falls and so, too, does the interestOffenbach earns in the following period. Exhibit 11.6 shows the effect of the Jupiter sales-typelease on Offenbach’s accounts in years 1 to 3.
At the end of year 3, all instalments have been paid and the balance in ‘Lease payments receiv-able’ is zero. As a result of the lease transaction, Offenbach’s assets and retained profits are135,000 higher at the end of the three years.
344 PART 2 • THE HOUSE OF ACCOUNTING
Assets EquitiesLease payments Profit
Inventory receivable Cash for year
‘Sale’ of bus +309,250 = +309,250on 1/1/year 1 (Sales revenue)
–225,000 = –225,000(Cost of sales)
Lease payment –95,260 +120,000 = +24,740received, yr 1 (Interest
income)Balance, end 1 213,990Lease payment –102,881 +120,000 = +17,119received, yr 2
Balance, end 2 111,109Lease payment –111,109 +120,000 = +8,891received, yr 3
Balance, end 3 0
Effect of lease on accounts, years 1–3 –225,000 +360,000 = +135,000
Calculation of interest income and end-year receivable
(1) (2) (3) (4) (5)Lease payments Lease Interest Reduction in End-year
receivable payment income receivable receivableYear at 1/1 at 31/12 8% × (1) (2) – (3) (1) – (4)
1 309,250 120,000 24,740 95,260 213,9902 213,990 120,000 17,119 102,881 111,1093 111,109 120,000 8,891* 111,109 0
* Rounded.
Offenbach Company (lessor): financial statement impact of sales-type leaseExhibit 11.6
...
...
...
...
...
...
CFA_C11.qxd 11/6/03 3:06 PM Page 344

l Financial statement impactClassifying a lease as a sales-type (finance) lease rather than an operating lease usually increasesthe lessor’s reported income in the first year of the lease term. The reason is that the lessor reportsa profit on the sale of the asset at the start of the lease. Such front-loading of income makes fin-ance lease treatment popular among lessors. (This assumes there are no adverse tax consequences.In some countries, tax rules are kind to lessors. Income tax is levied only when lease paymentsare received, irrespective of whether the lease is accounted for as an operating or a finance lease.)
Our Offenbach example illustrates the potential size of the income benefit of a sales-type leasein the first year. Exhibit 11.7 contrasts the impact of the Jupiter lease on Offenbach’s incomestatement in years 1 to 3, assuming the lease is treated as an operating lease (column A) and asa sales-type lease (column B).
If the lease is an operating one (column A), Offenbach reports income (before tax) of 45,000a year. This comprises rental revenue from the bus (120,000 a year) less depreciation which,assuming a manufacturing cost of 225,000, a three-year life and SL depreciation, amounts to75,000 a year. If the lease is a sales-type lease (column B), Offenbach reports income (before tax)of almost 109,000 in year 1 and only 17,000 and 9,000 in years 2 and 3 respectively. Year 1income is 80% of the three-year total of 135,000. Note that the difference in accounting treat-ment affects the timing of income from the lease but not its total amount.
The balance sheet impact of a sales-type lease is less dramatic. The lessor simply reports theexchange of one asset (inventory or property) for another (receivable). In addition, its share-holders’ equity changes by the amount of profit or loss recognised on the sale. This in turn willaffect its debt–equity ratio but the effect on reported leverage is likely to be minor compared
CHAPTER 11 • LIABILITIES, ON AND OFF BALANCE SHEET 345
(A) Operating lease (B) Sales-type lease
Year 1 Year 1Rental revenue 120,000* Profit on sale 84,250– Depreciation –75,000** Interest income 24,740
Income (net) 45,000 Income 108,990
Year 2Rental revenue # Year 2– Depreciation $ 45,000 Interest income 17,119
Year 3Rental revenue # Year 3– Depreciation $ 45,000 Interest income 8,891
Total income (net) 135,000 Total income 135,000
* Journal entry:Dr. Cash (A+) 120,000
Cr. Rental revenue (OE+) 120,000
** Calculation assumes:Cost of manufacture to Offenbach: 225,000Depreciation: SL method; 3 year life; zero residual value.
Offenbach Company (lessor): income statement impact of leased asset, assuminglease is: (A) operating lease; (B) sales-type lease
Exhibit 11.7
CFA_C11.qxd 11/6/03 3:06 PM Page 345
to the effect on profitability. Note that the lessor’s pre-tax cash flow is identical under bothaccounting treatments.
l Accounting for direct financing leasesIf a bank acquires the bus from Offenbach (at fair value) and then leases it to Jupiter, the lease,if capitalised, is a direct financing lease. In effect, the bank provides a loan to Jupiter for theasset’s purchase. The bank’s accounting reflects this. It records a loan (lease receivable) on whichit earns interest. (Offenbach recognises profit on the sale of the bus to the bank.)
Lease capitalisation is likely to lead to earlier recognition of income by the bank but the effectis less marked than with a sales-type lease. Consider the Jupiter lease. Assuming the bank calcu-lates interest income as a constant percentage of the start-of-period receivable (as illustrated inExhibit 11.7), it reports interest income of 24,740 in year 1 under a direct financing lease againstrental revenue, net of depreciation, of 16,917 in the same year under an operating lease. (Rentrevenue is still 120,000 but depreciation (of 103,083) is based on the bus’s fair value of 309,250.)Note that banks in some countries must structure leases of assets to third parties as financeleases because they are prohibited from carrying tangible fixed assets – other than those for theirown use – on the balance sheet.
l Lessor accounting under IAS
International accounting standards require lessors and lessees to apply the same tests. A lease isclassified as a finance lease by the lessor only if ‘substantially all the risks and rewards incident toownership’ are transferred to the lessee. In practice, this means that not only must the lease meetat least one of the capitalisation conditions given in section 3 of the chapter but also, in the caseof sales-type leases, the lessor should apply the usual revenue recognition criteria. Thus the lessorshould not recognise revenue and, by extension, profit on the sale if, for example, doubts existabout whether the lessee can make the lease payments when they are due. In this case, it shouldclassify the lease as an operating one and recognise revenue when cash is received.
Lessors and lessees define key terms such as lease payment and lease term in the same way,too. However, the lessor’s receivable may be different from the lessee’s payable. First, lessor andlessee may use different discount rates. Recall that the lessee must use its incremental borrowingrate if it does not know the rate used by the lessor to set lease payments (the implicit interestrate). Second, the lessor includes in its receivable (and sales revenue) calculation any unguaran-teed residual value, that is, cash it expects to receive on disposing of the asset at the end of itslife but which has not been underwritten by the lessee.
A manufacturer or distributor wishing to front-load its reported income is tempted to struc-ture its leases so that they are in form sales-type leases. In the past, some lessors, in the USA andmore recently in the UK, have abused the rules in this way. One tell-tale sign of lease mis-classification is a rapid growth of a lessor’s sales and profits without a concomitant increase inits cash flow. The increase in sales is matched by an increase in the lessor’s receivables. By con-trast, lessors in countries with a uniform reporting tradition will choose, if they can, to structuretheir leases as operating leases. In this way, they defer tax payments as well as income.
One final point. Although lessor and lessee usually classify a lease symmetrically for account-ing purposes, there is no requirement for them to do so. Indeed, some investment banks, in promotional material, offer to structure a lease in such a way that it is a finance lease for themanufacturer-lessor and an (off-balance-sheet) operating lease for the customer-lessee. Theconsequence is that the asset under lease disappears from both the lessor’s and the lessee’s bal-ance sheet!
346 PART 2 • THE HOUSE OF ACCOUNTING
CFA_C11.qxd 11/6/03 3:06 PM Page 346

CHAPTER 11 • LIABILITIES, ON AND OFF BALANCE SHEET 347
Problem assignments
P11.1 The nature of accounting liabilitiesIn some cases, it is not clear whether a company has an accounting liability and, if it has, how itshould be measured. Consider the following (independent) situations.
(1) Self-insurance
A retail chain has traditionally purchased insurance cover from an insurance company to meet claims,by customers and staff, for personal injury in company stores. In view of the size of the annual pre-miums paid and the absence of claims in recent years, the company is considering insuring itself. Thechief executive officer (CEO) has suggested the company set up a provision for injury claims alongthe following lines:
Dr. Insurance expense (OE−) xxCr. Provision for injury claims (L+) xx
When claims are submitted and accepted, the company would then charge the amount against theprovision (Dr. Provision; Cr. Cash).
Required
The controller has doubts about whether the above accounting treatment is acceptable. Advise her.
(2) Post-employment compensation
The date is end-March x5. As a result of a boardroom clash, the board of directors of a pharmaceut-ical company dismissed the CEO earlier in the month. Under the terms of his contract, the ex-CEO isentitled to receive his annual salary of 900,000 until June x8. However, the contract also states that the payments may cease – at the company’s option – if he accepts employment from anotherpharmaceutical company during this period. The ex-CEO is well-regarded in the industry. Under hisleadership, the company’s share price has doubled in the last three years.
The company’s financial year runs to 30 June. Therefore, the total salary payments the ex-CEOmight receive, subsequent to his dismissal, could be 3 million:
Financial year x4/x5 300,000 (1/3 × 900,000)x5/x6 900,000x6/x7 900,000x7/x8 900,000
The controller believes the company has a liability and expense of 3 million in March x5. The board,however, would prefer not to record a liability of that amount then. They feel the company shouldrecognise an expense (of 75,000) each month only when a salary payment is made.
Required
How should the company account for the ex-CEO’s post-employment compensation?
(3) Lawsuit
In x2 a law firm launches legal action against Sonia, a manufacturer of mobile phones, seeking sub-stantial damages on behalf of customers who, it’s claimed, have developed brain tumours as a resultof radiation emitted by the company’s phones. Sonia contests the claim. Lawyers acting for the com-pany advise management that, because scientists have not yet established a link between mobilephone use and incidence of brain tumours, the company will probably win the case.
CFA_C11.qxd 11/6/03 3:06 PM Page 347

348 PART 2 • THE HOUSE OF ACCOUNTING
Required
(a) How should Sonia report the lawsuit in its x2 accounts? (Assume the size of the plaintiffs’ claimis material to its accounts.)
(b) Consider the following scenario. The year is x3 and the case is still in progress. Damaging newscientific evidence has emerged. Sonia’s lawyers put the probability of the company winning thecase at only 40%. They recommend the company seek an out-of-court settlement. However,management are fearful that a settlement could encourage a rash of lawsuits from other cus-tomers and this would have severe financial consequences for the firm and its shareholders. Theydecide to continue contesting the suit. How should Sonia report the lawsuit in its x3 accounts?
P11.2 The nature of accounting liabilities IIAltran Technologies is a fast-growing French R&D consulting firm. In x1 its revenues soared to A1.3billion, a 40% increase on the x0 figure, and it maintained its operating profit margin ratio at a healthy18%. However, its share price fell 65% during the second quarter of x2 as doubts emerged about itsaccounting policies. Some analysts accuse the company of understating its liabilities, a charge whichmanagement vigorously deny.
The main area of controversy surrounds Altran’s treatment of acquisitions. The company hasgrown rapidly by acquiring smaller consultancies in other countries – it bought 28 businesses in x1alone – in order to increase market share. In most cases it pays for the acquired business with cash:part is paid when the contract is signed and part is deferred and linked to the increase in the acquisi-tion’s annual earnings over the following five years. The total price paid is usually twice the initial payment. Altran does not recognise the ‘earn-out payments’ as a liability until the acquired companyhas generated the increase in profits. ‘It’s impossible to quantify these earn-out payments in advance,so they shouldn’t be held as debts,’ argues Michel Friedlander, the company’s chief executive.
Altran paid A78 million in earn-out payments in x1. Analysts claim the company’s end-x1 indebted-ness including estimated earn-out payments was A956 million rather than the A337 million reported inthe x1 balance sheet. This gives a debt–equity ratio of over 240% which puts the company’s bondsin the ‘junk’ category, according to analysts.
Required
How should Altran account for future estimated earn-out payments at the balance sheet date, in yourview? Give the reason(s) for your decision.
P11.3 Frequent-flier miles: accounting issuesThree Englishmen, George, Harris and J., are flying to Canada on a Kingston Airlines flight to enjoy aboating holiday in Northern Ontario. They’re travelling for free, using the frequent-flier miles they’veaccumulated (at the rate of one mile earned for each mile flown) with the airline. Somewhere over theAtlantic Ocean, the conversation turns to frequent-flier programmes and J., being a curious fellow,wonders how Kingston accounts for the miles he and other programme members have earned.
George: It’s simple: they record a liability. The liability is the product of (1) the free miles earned and(2) their cost. I expect they measure the cost on an ‘opportunity cost’ basis. For example, in ourcase the opportunity cost is the revenue Kingston forgoes from a fare-paying customer wishing tofly from London to Toronto.
J.: Surely not the full fare. After all, look around you. The plane is half-empty. The airline isn’t turningaway full-fare customers to allow us to fly. It would make more sense to measure the liability on anincremental cost basis – the additional costs the airline incurs when a frequent flier occupies oneof those empty seats.
Harris: You’re both forgetting something. Not all miles earned are redeemed. I read the other day thatat the end of 2001 frequent fliers had accumulated almost 8 trillion unused miles. So Kingston
CFA_C11.qxd 11/6/03 3:06 PM Page 348

needs to apply a probability factor – the probability of the frequent flier redeeming the miles earned– to J.’s cost figure. This makes the actual liability so small the airline can forget about it for all prac-tical purposes.
George: But miles don’t expire – unless they’re not used within three years of being earned. Airlinescan’t ignore those unredeemed miles you mention. It was easy to get free seats on this flight butyou can’t get them on the popular routes.
J.: That’s Harris’s point, isn’t it? The reason there are so many unredeemed miles is that frequent flierscan’t get the flights they want. In fact, once capacity starts filling up on a particular route, the air-line usually restricts the number of free seats available. But I don’t agree the liability can be ignored.The 8 trillion figure is an industry total. Some airlines may have a high redemption rate.
Harris: Perhaps – but that doesn’t mean they have a legal liability. Look at the small print of Kingston’sfrequent-flier programme. ‘The accumulation of mileage credits does not entitle members to anyvested rights. . . . In accumulating mileage, members may not rely on the continued availability ofany award.’ That’s pretty clear, I reckon. Kingston can cancel its programme tomorrow and themiles we’ve earned but not used are worthless. Where is Kingston’s ‘obligation to transferresources to a third party’ then? I wouldn’t be surprised if the airline accounts for the cost of airmiles as and when they’re used rather than accrue a liability.
Required
How do you think an airline like Kingston should account for frequent-flier miles and other travelawards? Does the company have a liability as the awards are earned and, if so, how should it meas-ure it?
P11.4 Bonds: terminology and basic accountingOn 1 January x3, Ajax Steel Company issues, at a price of 101, A150 million of 6% bonds due 31 December x7. Interest is payable annually. Ajax Steel values the bonds in the balance sheet atamortised cost and uses the straight-line method to amortise any initial discount or premium. Thecompany’s financial year ends on 31 December.
Required
(a) What is: (i) the term of the bonds?(ii) the coupon rate?(iii) the amount Ajax Steel must pay bondholders when the bonds mature?
(b) Show the effect on Ajax Steel’s accounts of:(i) the issuance of the bonds (ignore issuance costs);(ii) the recognition of interest expense in x3 and the payment of interest on 31 December x3.Use journal entries or the balance sheet equation.
(c) When Ajax Steel issued the 6% bonds, was the market interest rate on debt of similar risk andmaturity higher or lower than the coupon rate on Ajax’s bonds? Explain.
P11.5 Early retirement of bondsRefer to P11.4. Ajax Steel issued A150 million of 6% bonds on 1 January x3 at a price of 101. Twoyears later, on 1 January x5, Ajax decides to retire the bonds. The company has a large cash balanceand management decide to use part of it to reduce the company’s debt. At this time, the market inter-est rate is 7.15% and Ajax’s 6% bonds trade at a price of 97.
Required
(a) What is the market value of Ajax’s 6% bonds on 1 January x5?
CHAPTER 11 • LIABILITIES, ON AND OFF BALANCE SHEET 349
CFA_C11.qxd 11/6/03 3:06 PM Page 349

(b) Assume Ajax Steel is able to buy back all the bonds at their market value on that day. Show theeffect of the repurchase on the company’s accounts. Use journal entries or the balance sheetequation. Ignore transaction costs.
Check figure:(b) Carrying amount A150.9 million
P11.6 Interest method of amortisationOn 1 January x2, Dorrit Company issues A5 million of 2.5% bonds, due 31 December x5. They arepriced at 91.14 to yield 5% to maturity. Dorrit amortises any initial discount (or premium) by the inter-est method and reports the bonds on the balance sheet at amortised cost. The company’s financialyear ends on 31 December. Interest is payable annually.
Required
(a) How much cash does Dorrit receive from the sale of the bonds?
(b) What is the total lifetime cost of the bonds to Dorrit over the four years to 31 December x5?
(c) What is the interest expense Dorrit reports in its income statement for x2 and for x3 with respectto the bonds?
(d) What is the carrying amount of the bonds in Dorrit’s balance sheet at the end of x2 and at the endof x3?
Check figure:(c) Discount amortised in x2 A102,850
P11.7 Debt instruments: deriving information from published accountsAt end-2001, Roche, the Swiss pharmaceutical company, had total bonds payable of SFr14 billion out of total borrowings of SFr18 billion. Unusually, each of the bond issues bore a name – e.g. ‘Sumo’yen exchangeable bonds, ‘Bullet’ Swiss franc bonds – and was packaged so as to appeal to a par-ticular investor group, marketing innovations introduced by Roche’s finance director, Henri Meier, inthe 1990s.
The company discloses information about each of the outstanding bond issues in the notes to its2001 accounts. Details of three, including their Swiss franc carrying values at end-2000 and end-2001, are given below. Roche uses the interest method to amortise the cost of the bonds.
Effective interest rate 2001 2000Swiss franc bonds‘Rodeo’ 1.75% due 2008, principal 1 billion Swiss francs 2.83% 933 923US dollar bonds‘Bull Spread’ 3.5% due 2001, principal 1 billion US dollars 5.13% – 1,610Zero coupon US dollar exchangeable notes‘LYONS V’ due 2021, principal 2.051 billion US dollars 4.18% 1,544 –
Roche provides the following additional information about the ‘Bull Spread’ and ‘LYONS V’ bonds:
Repayment of ‘Bull Spread’ US dollar bondsOn the due date of 18 May 2001 the Group repaid the principal amount of 1 billion US dollars of the 3.5%US dollar bonds originally issued in 1991. The resulting cash outflow was 1,734 million Swiss francs.
Issue of ‘LYONS V’ US dollar notes exchangeable into non-voting equity securitiesOn 25 July 2001 the Group issued zero coupon US dollar exchangeable notes due 25 July 2021 with aprincipal amount of 2,051 million US dollars. The notes are exchangeable into non-voting equity secur-ities, at any time prior to maturity.
350 PART 2 • THE HOUSE OF ACCOUNTING
CFA_C11.qxd 11/6/03 3:06 PM Page 350

Net proceeds from the issue were 980 million US dollars (1,689 million Swiss francs). These have beeninitially allocated as 3,535 million Swiss francs of debt, 1,978 million Swiss francs of unamortised dis-count, 86 million Swiss francs of equity (in respect of the conversion option embedded in the bonds) and46 million Swiss francs of deferred tax liability.(Source: Roche Group, Annual Report and Accounts 2001.)
According to the accounts, the exchange rate between the US dollar and Swiss franc was US$1 :SFr1.68 at end-2001 and US$1 : SFr1.64 at end-2000. The average exchange rate in 2001 was US$1: SFr1.69.
Required
(a) What is the interest expense Roche incurs on the ‘Rodeo’ bonds in 2001? What is the interestpayable on them that year? (Assume interest is payable annually.)
(b) What is the gain or loss, if any, that Roche recognises on the repayment of the ‘Bull Spread’bonds? Note that gains and losses from exchange rate changes are recorded separately fromgains and losses on (early) retirement of bonds.
(c) Estimate the interest expense – in Swiss francs or US dollars – that Roche incurs on the ‘LYONSV’ notes in 2001. Show how Roche derives the end-2001 carrying amount of SFr1,544 million.
(d) Roche has made several large issues of zero coupon exchangeable notes in recent years. Why doyou think it has chosen to issue debt in this form?
P11.8 Accounting for lease by lessee
Dogberry Security Services wins a five-year contract in late x1 to provide routine police services toMessina’s municipal government. Rather than buy all the equipment it needs, it decides to lease some of it. Polease, a vehicle dealer, offers to lease to Dogberry an armoured van for the transport of prisoners. The van has a fair value of 39,925 and is expected to yield economic benefits evenly over its five-year life. Under the terms of the proposed lease, Dogberry will pay Polease 10,000 at the end of each of the five years which indicates an implicit interest rate in the lease of 8% (39,925/10,000 = 3.9925 = PVA (8%, 5 payments)). At the end of the lease term, Dogberry will returnthe vehicle to Polease. There is no transfer-of-title clause or bargain purchase option in the lease contract.
Dogberry’s management are concerned about the financial implications of Polease’s offer. Theyask you to determine the financial statement impact of the lease under two assumptions – that it’sclassified as (i) an operating lease and (ii) a finance lease. Dogberry plans to sign the lease contracton 1/1/x2. The company has a 31 December financial year-end.
Required
(a) What is the effect of the lease on Dogberry’s accounts at the start of x2 when the contract issigned if the lease is: (i) an operating lease? (ii) a finance lease?
(b) How should Dogberry account for the lease in its x2 and x3 accounts (income statement and end-year balance sheet) if the lease is: (i) an operating lease?(ii) a finance lease?
(c) Is the lease an operating lease or a finance lease under IAS? Give reasons for your answer.
Check figure:(b) (ii) Interest expense, x3 2,650
CHAPTER 11 • LIABILITIES, ON AND OFF BALANCE SHEET 351
CFA_C11.qxd 11/6/03 3:06 PM Page 351

P11.9 Accounting for lease by lessorRefer to P11.8. Consider the proposed lease of the van from the point of view of Polease, the lessor.The van cost Polease 32,000. Its estimated residual value at the end of the five years is zero. The com-pany has a 31 December financial year-end.
Required
(a) What is the effect of the lease on Polease’s accounts at the start of x2 when the contract is signedif the lease is:(i) an operating lease?(ii) a sales-type lease?
(b) How should Polease account for the lease in its x2 and x3 accounts (income statement and end-year balance sheet) if the lease is:(i) an operating lease?(ii) a sales-type lease?
(c) Assume now that Polease estimates the van – which Dogberry is to hand back at the end of thefive-year lease term – will have a residual value of 4,000 then. The residual value is not guaranteedby either Dogberry or a third party. (The annual lease payment remains at 10,000. The van’s initialfair value is still 39,925.)
Explain in general terms how this additional information alters your answers to (a) and (b) above?(You need not make any fresh calculations.)
P11.10 Debt, lease commitments, and financial statement analysis
The French group, LVMH, produces and distributes a range of branded luxury goods such as LouisVuitton leather and luggage goods, Christian Dior perfumes, Moët & Chandon champagne andHennessy cognac. It also owns a chain of airport duty-free shops through which it sells some of itsown merchandise (as well as that of other companies). Its 2001 sales and pre-tax income were A12.2and A0.7 billion respectively. Exhibit 11.8 contains a condensed end-2001 balance sheet for the groupas well as details of its lease commitments taken from note 28 of its 2001 accounts.
Required
(a) In the financial review accompanying the 2001 accounts, management state that net debtincreased from A7.4 billion at end-2000 to A8.3 billion a year later.(i) Using information from the condensed balance sheet in Exhibit 11.8, show how these num-
bers are derived.(ii) What is the group’s debt–equity ratio at the end of 2001?
(b) What is the lease liability LVMH reports on its 2001 balance sheet? (The liability is included in‘Long-term debt’.) In the note on tangible fixed assets, LVMH discloses that assets acquired orfinanced under capital leases amount to A249 million (at net book value) at end-2001. Why doesthis number differ from the lease liability LVMH reports on that date?
(c) Many analysts argue that minimum payments under non-cancellable operating leases and similarcontracts are no different in substance than required payments under debt agreements.(i) If this reasoning were applied to LVMH’s accounts, estimate by how much the group’s end-
2001 net debt would increase. (Hint: Assume that the group will make annual operating leasepayments of A195 million for four years after 2006 and annual concession fees of A58 millionin 2007 and 2008, all the payments are made at year-end and the rate used to discount themis 6%.)
(ii) Would capitalisation of operating lease and concession fee payments have a significantimpact on the group’s end-2001 debt–equity ratio?
352 PART 2 • THE HOUSE OF ACCOUNTING
CFA_C11.qxd 11/6/03 3:06 PM Page 352

CHAPTER 11 • LIABILITIES, ON AND OFF BALANCE SHEET 353
Condensed balance sheet at 31 December 2001(in B billions)
2001 2000 2001 2000Fixed assets Shareholders’ equityTangible 4.2 3.4 Capital and reserves 6.9 7.0Intangible: Goodwill 3.5 3.8
Brands and other 4.3 3.4 Minority interests 1.8 1.5Financial 2.3 2.4
Total 14.3 13.0 Long-term liabilitiesLong-term debt (LTD) 5.7 3.8
Current assets Provisions and other 1.4 1.3Inventories 3.7 3.4 Total 7.1 5.1Trade accounts receivable 1.5 1.6Prepaid expenses and other 1.9 1.9 Current liabilitiesTreasury shares* 1.0 1.3 Short-term debt and current Cash and short-term portion of LTD 4.0 5.6investments 1.4 2.0 Accounts payable and accrued
Total 9.5 10.2 expenses 4.0 4.0Total 8.0 9.6
Total liabilities and Total assets 23.8 23.2 shareholders’ equity 23.8 23.2
* LVMH shares purchased and held by the company
Note 28 Lease commitments
At December 31, 2001, a total number of 1,501 stores were used by the group worldwide, particularly forFashion and Leather Goods and Selective Retailing business groups.
In a large number of countries, rentals for these stores are contingent on payment of minimum amounts,especially when the leases include revenue-indexed rent clauses; this is particularly valid in cases whereairport concession fees are paid. In addition, the leases may also include non-adjustable minimum terms. [. . .]
At December 31, 2001, the breakdown of future non-cancellable commitments arising from thesearrangements is as follows:
In B millions Operating leases Concession fees Capital leases
2002 287 278 992003 243 257 312004 226 185 112005 213 152 92006 187 53 92007 and subsequent years 781 116 33
Total minimum lease commitments 1,937 1,041 192Less amounts representing interest – – (14)
Present value of minimum lease commitments 1,937 1,041 178
LVMH Group: extracts from 2001 accountsExhibit 11.8
(Source: LVMH Group, Annual Accounts 2001. Reproduced by permission of LVMH.)
CFA_C11.qxd 11/6/03 3:06 PM Page 353

354 PART 2 • THE HOUSE OF ACCOUNTING
Notes to Chapter 11
1 International Accounting Standards Board, Framework for the Preparation and Presentation ofFinancial Statements, para. 49. Note that this definition excludes balance sheet accounts which havecredit balances but which are not part of shareholders’ equity.
2 Framework, para. 60.3 International Accounting Standards Board, IAS 37: Provisions, Contingent Liabilities and Contingent
Assets. Contingent assets share the same features as contingent liabilities. In this case, it’s the resourcethat is ‘possible’. The resource is not recognised as an asset unless and until the firm can demonstratethat the future inflow of economic benefits is ‘virtually certain’ as well as measurable.
4 English terminology is confusing. Adjustments to asset values are also referred to as provisions (e.g.provision for bad debts, provision for inventory obsolescence).
5 An obligation for goods or services received but not yet invoiced by the supplier is also an estimatedliability. This is usually described as an ‘accrual’ rather than a provision.
6 BMW Group, Annual Report and Accounts 2001, note 7. The other major reasons for the a4.5 billionincrease in BMW’s shareholders’ equity under IAS are: capitalisation of development costs, absorptioncosting of inventory (in place of variable costing), and use of SL method of depreciation of plant andequipment (in place of accelerated methods).
7 IAS 37, paras 72, 80. By announcing the plan or starting to implement it, the company raises expecta-tions among customers, employees, and suppliers that it will carry out the restructuring – hence theconstructive nature of the liability.
8 International Accounting Standards Board, IAS 32: Financial Instruments: Disclosure and Presentation,para. 5.
9 International Accounting Standards Board, IAS 18: Revenue, para. 14.10 International Accounting Standards Board, IAS 39: Financial Instruments: Recognition and
Measurement, paras 35, 38.11 International Accounting Standards Board, IAS 27: Consolidated Financial Statements and Accounting
for Investments in Subsidiaries, paras 7, 12.12 IAS 37, paras 36, 37. The arguments for the ‘fair value’ view are set out more fully in Foster, J.M. and
Upton, W. (2001), The case for initially measuring liabilities at fair value, in Understanding the Issues,Vol. 2, Series 1, Stamford, CT: FASB.
13 For a fuller but non-technical discussion of the reasons for corporate borrowing, see Barclay, M.J. andSmith, C.W. (1999), The capital structure puzzle: another look at the evidence, Journal of AppliedCorporate Finance, 12(1): 8–20.
14 Note that bonds may be issued between interest payment dates. In this case, the price the companypays includes accrued interest. A company issuing bonds at par records the issue as follows:
Dr. Cash (A+) xxCr. Bonds payable (L+) xxCr. Accrued interest payable (L+) xx
On the first interest payment date, bondholders receive a full period’s interest payment but the com-pany recognises interest expense only for the period from the issuance date to the interest paymentdate.
15 The interest method is also known as the ‘actuarial method’.16 A debtor discharges a liability by paying it. Under IAS, it isn’t released from its obligation by paying
a third party in place of the creditor, unless there’s a legal release. (‘In-substance defeasance’ is not per-mitted under IAS.) A creditor may cancel a debt if the debtor is in financial difficulties and is unableto pay. Where one party guarantees the debt of another for a limited period, its liability expires whenthe guarantee does.
17 A gain or loss can arise on floating-rate debt if it is retired early. With such debt, the interest rate isreset at the start of each new interest period. If the market rate of interest changes between that dateand the date the debt is retired, the market value and carrying amount will differ.
CFA_C11.qxd 11/6/03 3:06 PM Page 354

CHAPTER 11 • LIABILITIES, ON AND OFF BALANCE SHEET 355
18 The revised pattern of cash flows over five years, if Lopakhin replaces the 6% bonds with 8% (three-year) bonds at the start of x3 is as follows (amounts in a000):
StartEnd
x1 x1 x2 x3 x4 x5Interest payments – −240 −240 −303.56 −303.56 −303.56Principal payments 6% bonds +3,394 –3,794.5
8% bonds +3,794.5 −3,794.50Total payments +3,394 −240 −240 −303.56 −303.56 −4,098.06
The rate of return which equates the present value of the inflow at start x1 with the present value ofthe outflows of interest and principal at the end of each of the five years x1–x5 is 10%, the effectiveinterest rate on the original 6% bonds.
19 A leased asset is ‘amortised’ rather than ‘depreciated’ since what is being used up is an intangible, thelessee’s right to use a fixed asset. (In fact, Spanish companies must show assets under lease as intan-gible assets.)
20 Note that the carrying amount is equal to the present value of future lease payments, discounted at the implicit interest rate of 8%. Thus lease liabilities are measured in the same way as long-term debtcarried at amortised cost.
21 International Accounting Standards Board, IAS 17: Accounting for Leases, para. 3.22 IAS 17, para. 8. This is not a comprehensive list. The standard describes other situations where a lease
should be classified as a finance lease. A common feature is that the risks and rewards associated withownership are passed to the lessee.
23 International Accounting Standards Board, IAS 1: Presentation of Financial Statements, para. 63.24 IAS 37, para. 86. The standard permits a company to avoid disclosure in the ‘extremely rare’ case that
publishing the information could ‘seriously prejudice’ it in a dispute with other parties (para. 92).25 IAS 32, paras 47, 56, 77. Where the company has a number of debt instruments, the standard recom-
mends that it tabulates their maturities, grouping them into current (within one year of the balancesheet date), medium-term (between two and five years) and long-term (more than five years).Companies are also encouraged to indicate the sensitivity of their annual interest charges to a 1%change in market interest rates.
26 IAS 17, para. 23. IAS-based disclosure rules for long-term debt apply equally to finance leases since alease liability is a financial liability.
27 The balance sheet equation can be presented as follows:
Operating assets + Financial assets = Operating liabilities + Financial liabilities + Shareholders’ equity
Operating assets consist of plant and equipment, inventories, and trade receivables and financial assetscash and short-term investments. Similarly, operating liabilities comprise trade payables and accruedexpenses and financial liabilities debt. Rearranging the above equation gives:
Operating assets − Operating liabilities = (Financial liabilities − Financial assets) + Shareholders’ equity
Thus a firm’s capital (net debt plus equity – and, in the case of a group, minority interests) is, bydefinition, equal to its net operating assets.
28 Rajan, R.G. and Zingales, L. (1995), What do we know about capital structure? Some evidence frominternational data, Journal of Finance, 50: 1421–1460.
29 See also La Porta, R., Lopez-de-Silanes, F., Shleifer, A. and Vishny, R.W. (1998), Law and finance,Journal of Political Economy, 106(6): 1113–1155. La Porta et al. constructed a creditors’ rights index foreach of the 49 countries in their sample. Of the G7 countries, Germany and the UK had the highestscores.
CFA_C11.qxd 11/6/03 3:06 PM Page 355

30 In practice, the accounting for the receivable is more complicated. Offenbach records the total undis-counted payments (360,000) as a receivable and the unearned interest income (50,750, on 1 Januaryyear 1) in a separate contra-asset account:
Dr. Lease payments receivable (A+) 360,000Cr. Sales revenue (OE+) 309,250Cr. Unearned interest income (CA+) 50,750
In the balance sheet, it reports a net receivable of 309,250. The IASB favours this accounting treatment.31 Under the more complicated accounting noted above, the contra-asset account, ‘Unearned interest
income’, is reduced as interest is earned. The end-year 1 entries to record interest earned and the leasepayment received are as follows:
Dr. Unearned interest income (CA–) 24,750Cr. Interest income (OE+) 24,750
Dr. Cash (A−) 120,000Cr. Lease payments receivable (A−) 120,000
The end-year 1 net receivable is still 213,990 (240,000 less unearned interest income of 26,010 (50,750– 24,750)).
356 PART 2 • THE HOUSE OF ACCOUNTING
CFA_C11.qxd 11/6/03 3:06 PM Page 356

Shareholders’ equity
INTRODUCTIONThe shareholders’ equity section of the balance sheet shows the capital of thecompany provided by its owners. Part they contribute directly, part they pro-vide indirectly when they approve the reinvestment of the company’s earnings.The total amount represents their equity – or interest – in the net assets of thecompany.
In this chapter we look at the way a company accounts for its shareholders’equity. We start by trying to answer basic questions about business organisations.What are the major forms of business organisation? Why do entrepreneurs –and investors – prefer the corporate form? Investors receive shares as evidenceof their ownership interest in a company. This prompts additional questions.What are the various classes of share a company can issue? What are theirrespective rights?
We have already seen how the way a firm accounts for its assets and liabilities– when it recognises them and how it measures them – affects owners’ inter-ests through their impact on profits and reserves. In this chapter, we concen-trate on accounting and reporting issues which are unique to shareholders’equity. These issues include:
l the issuance of shares;l the distribution of profits;l the appropriation of profits to reserves; andl the write-down of capital.
In these areas accounting practice is heavily influenced by national legalrequirements. EU company law directives have reduced but not eliminated thedifferences among member states. Our discussion in section 1 of the chapterreflects the continuing legal diversity within Europe.
In section 2 of the chapter we turn to specialised topics. In particular, wedescribe the accounting for:
l the purchase by a company of its own shares;l convertible securities and warrants; andl government grants.
In our discussion we try to answer broader questions. Why, for example, do com-panies buy back their own shares? Why do firms issue convertible securities? Theanswers shed light on the way companies now account for these transactions.
1212
SECTION 1Core issues
l Different forms ofbusiness organisation
l Share capital
l Accounting for shareissues and profitappropriation
SECTION 2Specialised topics
l Purchase of ownshares
l Convertible securitiesand warrants
l State aid tocompanies
SECTION 3Shareholders’ equity andfinancial statementanalysis
In this chapter
CFA_C12.qxd 11/6/03 3:09 PM Page 357

358 PART 2 • THE HOUSE OF ACCOUNTING
SECTION
1
An ‘equity’ number appears in measures of profitability (return on equity) and leverage(debt–equity ratio) and in valuation calculations (price-to-book ratio). In section 3 we considerhow investors define ‘equity’ in these ratios. We also review the form and content of a new finan-cial statement, the statement of changes in equity, that an increasing number of companies pub-lish as part of their annual accounts.
Core issues
Different forms of business organisation
Batavus Droogstoppel has been a coffee broker on the Amsterdam Exchange for the past 17years. For long an aficionado of coffee in all its forms, he’s keen to expand the market for thehumble bean. He’s considering starting a business to produce and market coffee-flavouredyoghurt and ice cream, with decaffeinated variants for consumers concerned about their caffeineintake.
l Sole proprietorship
He has yet to decide on the form his business should take. One possibility is to register the nameof his venture ‘Coffee Cornucopia’ and begin producing his coffee-flavoured desserts on hisown. As the sole proprietor of his business, he enjoys the following advantages.
l He retains total control of the management of the business.l He saves the legal and economic costs of forming and running a company. One such cost is the
required disclosure of information about the business which may help competitors.
l Partnership
Friends of his are willing to invest in his business. A second possibility, therefore, is to form apartnership with them. If his fellow partners are general partners, they will participate in theday-to-day running of the business and he will no longer have total control of it. However, if hecan persuade them to be limited partners, they will be investors only and their liability for part-nership debts will be limited to their capital contributions to the partnership. In this case, he will:
l enjoy all the advantages of sole proprietorship;l have access to additional capital to expand the business.
The partnership agreement sets out the rights of each partner. In particular, it states how eachpartner is to share in the profits and losses of the business.
l Incorporation
A third possibility is for Droogstoppel to incorporate his business.1 In this case, a company isformed, Coffee Cornucopia Company. CCC is a separate legal entity – with a name, residenceand set of powers which specify the activities it can engage in – all contained in its (legallyapproved) charter of incorporation. As a separate entity, it can enter into contracts with indi-viduals and other companies. In addition, a company has a constitution which governs the way
CFA_C12.qxd 11/6/03 3:09 PM Page 358

CHAPTER 12 • SHAREHOLDERS’ EQUITY 359
it functions. For example, the constitution lays down rules governing meetings of shareholders(frequency of meetings, tabling of resolutions, voting procedures).
Droogstoppel and his friends can benefit from investing in a company rather than a partner-ship. Two important benefits are:
1 a limit to their liability to the company; and2 easier transfer of their ownership rights.
Limited liabilityA shareholder is, in most cases, only liable for the nominal (or par) value of the shares he has subscribed for. Once this capital has been paid in, the company’s creditors must look to the com-pany, not the shareholders, for satisfaction of their claims. By contrast, the sole proprietor andthe partners (other than limited partners) have unlimited liability for the obligations of theirrespective businesses.
Ease of transfer of ownershipIf the company is a public company (EU) or corporation (USA), a shareholder can transfer hisownership interest usually without hindrance – by selling his shares to outside investors withoutthe prior consent of other shareholders.2 By contrast, to withdraw capital from a partnership, apartner must first get the agreement of other partners. This can disrupt the running of the busi-ness. For example, in some cases, the retirement of one partner may force the dissolution of theold partnership and the creation of a new one.
A consequence of incorporation is that investors are more willing to put their capital into thebusiness. Their liability is limited and they can withdraw their capital easily. As a result, an enter-prise like CCC can raise equity capital at a lower cost if it’s incorporated.
The advantages of incorporation should not be overstated. Banks and other creditors oftenrequire the owners of small companies to guarantee the company’s debts personally. As a result,shareholders’ liability is no longer limited. Private companies place restrictions on the transfer ofshares. For example, a holder of a private company’s shares may be required to gain the consentof a majority of other shareholders before selling his shares to a third party. Moreover, the EUrequires that, except in the case of very small firms, companies must publish their annualaccounts and certain other information (e.g. the names of directors). In the words of one UKofficial, ‘disclosure of the accounts is the price companies pay for limited liability’.
In the EU, most companies are either public or private companies. We’ve already identifiedthe major feature distinguishing the two. The shares of a public company are freely transferable(in principle). This enables it to raise capital through the stock market if it wishes to. To pro-tect investors, the EU’s 2nd Company Law Directive lays down a minimum share capital (of a25,000) for a public company. (Member states are free to set the minimum at a higheramount.) For example, the minimum share capital for a UK public company is £50,000 (a75,000approximately). The minimum share capital required of private companies varies across EUmember states.
Share capital
l TerminologyA share is a proportionate interest in the net assets of a company. Assume CCC, the companyfounded by Droogstoppel, issues 100,000 shares. An investor holding 1,000 shares has a 1% stakein the company.3
CFA_C12.qxd 11/6/03 3:09 PM Page 359

A company usually assigns a par value (nominal value) to its shares when it is incorporated.4
Suppose CCC assigns a par value of 5 euros to its shares. Then the share capital of CCC for legalpurposes is a500,000. A share’s par value has little relation to its market price, which is a func-tion of the firm’s expected earnings and market interest rates.
The term ‘share capital’ is often prefixed, particularly in European company accounts, by anadjective such as ‘subscribed’, ‘called-up’ or ‘paid-up’. It’s helpful to know what these termsmean. Let’s start at the company’s creation. Its statutes specify the number (and type) of sharesit can issue. The directors of the company must obtain the consent of shareholders in generalmeeting before this limit can be increased. The reason for this is clear. Shareholders incur a costas a result of a capital increase – either directly if they buy the additional shares or indirectlythrough dilution of their ownership stake if they don’t. They need to be persuaded of the needfor the capital increase before agreeing to it.5
A quoted company may raise new capital through a public offering of its shares. Investorssubscribe for shares. Shares are allotted – on a proportionate or scaled basis if the offer is over-subscribed. To encourage interest among small investors, the company may decide that paymentfor the shares issued is to be made by instalment. The first payment accompanies subscription,second and later instalments (after allotment has taken place) are called by the company.Between the first and last instalment, the shares are partly-paid. Once all the cash is received, theshare capital is subscribed for, allotted, called-up and fully paid!
l Par value and its significance
Share capital (total issued shares at par value) is the permanent capital of a company. It can bereturned to shareholders only under restrictive conditions – for example, a court’s permissionmay be necessary before a company’s capital can be reduced. Similar restrictions may apply to afirm’s non-distributable reserves. It is argued that this affords protection to creditors since thecompany must maintain net assets equal to its share capital and non-distributable reserves.However, in some countries firms set par value low. If a firm’s non-distributable reserves are alsosmall, then its creditors enjoy little effective protection.
Par value can be of significance to individual shareholders in some circumstances. Recall thata shareholder is not liable to the company except to the extent that par value on his shares isunpaid. When is par value unpaid? One circumstance is when shares are issued ‘partly paid’.Under the EU’s 2nd Directive, only one-quarter of a public company’s minimum share capitalmust be paid in on incorporation. Another circumstance is when a company issues shares at adiscount to par value. This practice is banned under the EU’s 2nd Directive which states thatshares must be issued at a price equal to or above par value. However, it is permitted in certainUS states.
l Ordinary share capital: ownership rights
A share is an ownership claim. As a part-owner of a company, a shareholder has certain rights.An ordinary shareholder (US: common stockholder) generally has the right to share proportionatelyin:
1 the earnings of the company;2 the management of the company;3 new issues of shares of the company; and4 its assets, should the company be liquidated.
These rights have the following practical force.
360 PART 2 • THE HOUSE OF ACCOUNTING
CFA_C12.qxd 11/6/03 3:09 PM Page 360

1 Shareholders share in the earnings of the firm through corporate dividend payments. Anordinary dividend is not a fixed amount per share. Each year the directors propose, and theshareholders approve, the amount of corporate earnings to be distributed as dividend. Thisamount can vary from year to year, depending on the company’s economic circumstances.6
2 Directors are ultimately responsible for the management of the company. Through votes castat general meetings, shareholders appoint and may dismiss the directors. They also amend theconstitution of the company in the same way.7
3 Existing shareholders have the right of first refusal when new shares are issued. This ensurestheir ownership stake in percentage terms is not diluted without their consent. A company’sshareholders can vote in general meeting to waive their ‘preemptive right’. Note that com-pany law in some countries does not grant shareholders this right.8
4 Should the company be wound up and the assets sold, any cash remaining after the creditors’claims have been met is distributed among shareholders in proportion to their equity stake.
l Other classes of share
Companies can usually issue other classes of share besides voting ordinary shares. Each class hasa different set of rights. In some cases, the aim is to offer investors securities carrying less risk: inreturn, investors accept lower potential rewards. In other cases, the intention is to raise equity cap-ital from new shareholders while allowing existing shareholders to retain control of the company.
Preference shares
One popular alternative class of share is the preference share (USA: preferred stock). A company’spreference shareholders have priority over its ordinary shareholders when it distributes profits. Thepreference dividend must be paid first before ordinary dividends can be paid. Hence preferenceshares carry less risk than ordinary shares.
The preference dividend is usually a stated amount per share which is fixed at the time ofissuance. As a result, preference shareholders forgo the higher returns which ordinary share-holders may earn. If the preference shares are participating shares, then the holder participateswith ordinary shareholders in the residual profits of the company once the prescribed dividendhas been paid.
In most cases, the preference dividend is cumulative: any unpaid preference dividends accu-mulate from one year to the next and must be paid off in full (along with the current preferencedividend) before the company can resume payment of the ordinary dividend. Note that anypreference dividend in arrears is not a legal obligation of the company. The amount is notreported as a liability on the balance sheet but is disclosed in the notes to the accounts.
Preference shareholders have different rights from ordinary shareholders in other ways. Theytake precedence when the company’s assets are distributed on liquidation. In Anglo-Saxoncountries, preference share capital usually carries limited voting rights: holders do not have theright to vote in general meeting, except in certain circumstances (e.g. when their dividends arein arrears).
Shares with differential voting rights
As a general rule, one ordinary share carries one vote. However, a company may be allowedunder its statutes to issue ordinary shares that carry more – or less – than one vote per share.Shareholders’ rights in other respects – for example, to share in the profits of the company andin its assets on liquidation – are unaffected.
Issuing shares with differential voting rights is one means by which a group of shareholders,usually the founding family and its descendants, can bring in new risk capital to the business
CHAPTER 12 • SHAREHOLDERS’ EQUITY 361
CFA_C12.qxd 11/6/03 3:09 PM Page 361

Corporate ownership and control: international perspectivesBOX12.1
Imagine you run a large and successful family company. Most of your wealth and that of otherfamily members is tied up in the business. Some of the younger generation who are notinvolved in the management of the company are growing restless. They want to sell their stakesand invest the capital elsewhere. You are in a quandary. You can’t afford to buy them out,either with your own capital or with borrowed money. However, if you allow them to sell theirshares to outsiders, you risk losing control of the company.
Many companies that are family controlled or have a dominant shareholder need to raiseoutside equity capital at some point in their history. It may be to finance growth or, as in ourexample, to replace the equity provided by certain shareholders. There are, in principle, vari-ous ways they can do so and still allow the family (or dominant shareholder) to retain control.We describe three below. They can be used individually or in combination. Legal and tax con-siderations may limit the choice in practice.
1 Differential voting rights. The company issues different classes of ordinary share – for example,A shares and B shares. A shares may have multiple votes (say, 10 votes per share) whereasB shares carry just one. Alternatively, only holders of A shares are enfranchised (one voteper share): B shares are non-voting.
2 Cross-shareholdings. One or more firms with close business ties to the company acquire astake in it. The company reciprocates. The stakes held by friendly investors may be smallindividually but together they protect the company from takeover and allow it to raise addi-tional capital.
3 Pyramid structure. The family establishes a holding company – or chain of holding companies– which it controls usually by means of a significant minority holding (e.g. more than 20%).Each holding company attracts outside shareholders. The result is that the family can obtainoutside capital and still control the business through the holding company or companies.
In a recent study of corporate ownership in 27 countries using 1995 data, La Porta, Lopez-de-Silanes and Shleifer found that many large as well as medium-sized companies have a dominant shareholder.9 (The study employs two measures of dominance: direct and indirectcontrol of more than (a) 20% and (b) 10% of voting rights.) Moreover, the shareholder usually exercises control by means of one or more of the above techniques and, in the case offamilies, through involvement in the company’s management as well. They found evidence ofa dominant shareholder in some of the world’s biggest companies. Examples are:
l Samsung Electronics (South Korea). Lee Kun-Hee, the son of Samsung’s founder, controlsmore than 10% of the votes through a pyramid structure.
l ABB (Sweden) and Fiat (Italy). In each case, a family (Wallenberg for ABB, Agnelli for Fiat)controls more than 20% of the votes through a combination of pyramid structure and dif-ferential voting rights.
l Toyota Motor Corporation (Japan). Companies within the Mitsui Group control morethan 10% of the votes directly. Toyota itself holds shares in Mitsui Group companies.
Two of La Porta et al.’s findings are especially interesting. First, concentrated ownershipappears to be the rule rather than the exception. Only in 36% of their large firm sample and24% of their medium-sized firm sample are shares widely held. The traditional model, popu-larised by Berle and Means in the 1930s, that ownership of large companies is diffuse, appliesin only a few countries (UK, USA). Second, ownership is significantly more concentrated incountries with weak shareholder rights. In these countries, families control over half of thesampled medium-sized firms and they do so mainly through pyramid structures (and involve-ment in management). Families’ reluctance to relinquish control is understandable given thepoor legal protection they would enjoy as minority shareholders.10
CFA_C12.qxd 11/6/03 3:09 PM Page 362

CHAPTER 12 • SHAREHOLDERS’ EQUITY 363
without diluting their voting power. There are other ways they can achieve the same result – forexample, through cross-shareholdings and using a pyramid of companies. A recent study of cor-porate ownership around the world found that family control of companies, even of large ones,is widespread, especially in countries with weak shareholder protection. However, the devicemost commonly used by families to maintain control is a pyramid structure rather than shareswith differential voting rights (see Box 12.1).
l Shareholder rights and European companies
Departure from the one share, one vote principle is common in Europe. In addition to issuingshares with differential voting rights, companies may place a voting cap on individual share-holders or grant additional voting rights to long-term shareholders. For example, no shareholdercan hold, directly or indirectly, more than 3% of the share capital of Nestlé, the Swiss food andbeverage giant. PSA Peugeot Citroën shares that are registered in the name of the same holderfor at least four years carry double voting rights.
These discriminatory practices are under attack. The European Commission argues that theyare inconsistent with the free movement of capital, a key aim of the EU. Minority (i.e. non-controlling) shareholders oppose them because they depress the value of their investment. There aresmall signs of progress. Some companies like GUS, a major UK retailer and owner of Burberry’s,the clothing store, have voluntarily enfranchised their non-voting shares. A determined biddercan surmount a voting cap, as Vodafone’s purchase of Mannesmann in 2000 demonstrates. Butgetting all EU member states to accept the principle of one share, one vote is proving harder. Thedifficulty the Commission experienced in the early 2000s securing passage of its takeover direc-tive illustrates this. Some governments and boardrooms opposed the 2002 draft directivebecause they feared its insistence that a target firm’s shareholders should have equal voting rightsduring a takeover bid would make it easier for foreign companies to acquire key national firms.
Accounting for share issues and profit appropriation
Droogstoppel decides to incorporate his business as a public company, Coffee CornucopiaCompany. Many of his friends and relatives subscribe for shares in the company. In this sectionwe trace the first year of the life of CCC, focusing on those events which affect the shareholders’equity section of the balance sheet. The events we examine are:
l the issuance of shares for cash;l the payment of dividends;l the transfer of profits to reserves;11
l share dividends and share splits; andl the write-down of capital.
Much of the accounting for shareholders’ equity is determined by company law. This variesfrom country to country (or from state to state in countries with a federal structure like the USAor Canada). Our example emphasises practices found in EU countries.
l Issuance of shares for cash
At the start of year 1, CCC issues for cash 100,000 ordinary shares with a par value of 5. (All cur-rency amounts are in euros.) The price paid by subscribers is 8 a share. All shares are fully paidat the time of issue. The company makes the following journal entry.
CFA_C12.qxd 11/6/03 3:09 PM Page 363

364 PART 2 • THE HOUSE OF ACCOUNTING
Issuance of shares on fully-paid basisDr. Cash (A+) 800,000
Cr. Share capital (at par) (OE+) 500,000Cr. Share premium (OE+) 300,000
CCC credits the total par value of the shares issued (100,000 shares × 5) to ‘Share capital’. It creditsthe excess of the proceeds from issue (800,000) over par value (500,000) to ‘Share premium’.12
Jurisdictions differ in the restrictions they place on share premium (USA: additional paid-incapital). In most countries it is considered a non-distributable reserve. However, it can be cap-italised, that is, new share capital can be created from it. We illustrate the capitalisation of reserveslater.
All issues of shares for cash are accounted for in the manner shown above. The accounting isthe same whether the shares are ordinary or preference, or whether they are issued at the time ofincorporation (the initial offering) or at a later date. Where the company receives assets otherthan cash (e.g. property or investments in other companies) as consideration for the shares, theshares issued are usually valued at the market value of the assets received.
Public offerings of shares can be costly. Banks or securities firms often underwrite issues ofshares by quoted companies. For smaller issues, underwriting fees can amount to 5–10% of thegross proceeds from the sale of shares – to which must be added legal and accounting costsincurred preparing the prospectus. The usual practice is for the issuing company to write off thetransaction costs associated with a share issue against share premium.
As we have mentioned, EU companies can issue partly-paid shares. There are restrictions onthis practice, however. At least 25% of the par value (and 100% of the share premium) must bepaid in at the time of share allotment. In its share offer document, the company states on whichdate or dates it will call the remaining balance from shareholders. EU companies usually showthe total capital subscribed, whether called or uncalled, as ‘Share capital’ on the equity side of thebalance sheet. The uncalled portion (plus any called portion that has not yet been received) isshown as an asset.13
Remember that the transfer or trading of shares after issuance has no impact on the issuingcompany’s accounts. In the case of registered shares, the company – or the registrar of its shares– simply notes the change in share ownership in its records. (No record of change of ownershipis – or can be – made for bearer shares.)
l Payment of dividendsCCC has a good beginning. It reports profits of 80,000 in year 1 and 200,000 in year 2. When theyear 2 results are published in March year 3, the directors propose the payment of a cash divid-end of 100,000 (i.e. 1 a share). This is the company’s first profit distribution. The shareholdersduly approve the dividend at the annual general meeting in May year 3. CCC makes the follow-ing entry when the dividend is paid in June:
CFA_C12.qxd 11/6/03 3:09 PM Page 364

CHAPTER 12 • SHAREHOLDERS’ EQUITY 365
Payment of dividend in June year 3Dr. Profit for year 2 (OE−) 100,000
(or: Retained profits (OE−))Cr. Cash (A−) 100,000
(A company may set up a temporary owners’ equity account, ‘Dividends’, record profit distri-butions in it, and then close it to a permanent owners’ equity account at year-end.)
The presentation of the profit earned and distributed by CCC in its year 2 balance sheet will differ depending on which country CCC is based in. In Exhibit 12.1 we show three differentformats. Many EU companies (i.e. those in Belgium, France, Italy and Spain) follow the firstformat. The remaining two correspond to the formats used by UK/Irish and North Americancompanies.
Under the ‘dominant EU’ format, companies distinguish, on the face of the balance sheet,between ‘Profit for the year’ and profit retained from previous years (format 1). In most EU
FactsCCC reports net income in year 1 of 80,000 and net assets at the end of the year of 880,000.No dividend is paid out of year 1 income. In year 2 it reports net income of 200,000. Thedirectors propose a dividend of 1 a share (or 100,000) in March year 3 when the year 2 resultsare published. The year 2 accounts and proposed dividend are approved by shareholders atthe annual general meeting in May year 3.
The following are alternative ways of presenting the shareholders’ equity section of CCC’s year2 balance sheet.
Shareholders’ equityEnd- End-
In 000 year 2 year 1
Format 1 Share capital 500 500(Dominant Share premium 300 300
in EU) Profit retained 80 0Profit for the year 200 80
1,080 880
Format 2 Share capital 500 500(UK and Share premium 300 300Ireland) Profit and loss account 180* 80
980 880
Format 3 Common stock 500 500(USA) Additional paid-in capital 300 300
Retained earnings 280** 801,080 880
* Retained profits of years 1 and 2, after deducting proposed year 2 dividend of 100. Dividendpayable of 100 shown as current liability in year 2 balance sheet.
** Dividend not declared at balance sheet date.
Presentation of shareholders’ equity following announcement of profit and dividend:illustration of EU and US formats (amounts in euros)
Exhibit 12.1
CFA_C12.qxd 11/6/03 3:09 PM Page 365

366 PART 2 • THE HOUSE OF ACCOUNTING
countries, the ‘Profit for the year’ number on the balance sheet is the same as that reported inthe income statement since shareholders have not yet approved the appropriation of the year’sprofit. When this occurs, the dividend is recognised. Since, at the end of year 2, CCC’s share-holders have not yet approved the year 2 dividend, it is not deducted from shareholders’ equityin the end-year 2 balance sheet.
By contrast, UK and US companies combine the retained profits of the current and previousyears and show them as one line on the balance sheet. Increasingly, this is the presentationfavoured by all large international companies. UK/Irish and US companies differ in theiraccounting for dividends, however. A UK/Irish company recognises a dividend in the accounts of theperiod to which it relates (format 2). As a UK/Irish firm, CCC records the dividend proposed inMarch year 3 in its year 2 accounts – before the latter are closed in year 3 – on the grounds thatthe dividend is a distribution of its year 2 profit.
Proposed dividend (UK/Ireland):adjustment to year 2 accountsDr. Profit and loss account (OE−) 100,000
Cr. Dividend payable (L+) 100,000
As a result, CCC reports lower shareholders’ equity and higher current liabilities in its end-year2 balance sheet than if it had followed the dominant EU practice (format 1).
A US company recognises a dividend (and the related liability) on the date when its board ofdirectors declares it (format 3). CCC announces the dividend in year 3 and so, under US practice,there is no effect on its year 2 accounts.
l Interim dividends
Companies often pay an interim dividend in addition to the final one. (Most US quoted com-panies declare dividends on a quarterly basis.) In some countries, the dividend that can be paidduring the year is restricted. For example, French public companies can pay an interim dividendonly if audited accounts show profits at least equal to the interim dividend.
The accounting for interim dividends varies across Europe. A common practice in contin-ental European countries is to show the interim dividend as a deduction, ‘Dividend on account’,in the shareholders’ equity section of the balance sheet. Once shareholders have approved theappropriation of the year’s profit, the ‘dividend on account’ is eliminated and retained profitsreduced. UK and US companies follow national practice, as shown in Exhibit 12.1, whenaccounting for interim dividends.
l Transfer of profits to reserves
EU public companies are required by law to transfer profits to reserves in certain circumstances.First, most Continental European countries, and many Latin American, African and Asian coun-tries with a Continental European accounting tradition, require public companies to establish alegal reserve. A legal reserve is intended to protect the company’s creditors by reducing the profitsavailable for distribution. This should reduce the profits actually distributed, thereby conservingthe company’s assets. A company must transfer a percentage (usually 5%, in some cases 10%) ofits annual after-tax profits to a legal reserve until the reserve reaches a specified minimum level,usually expressed as a percentage of share capital. (The percentage varies – from 10% in Franceto 100% in Taiwan.) Beyond that level, transfers are voluntary.14
CFA_C12.qxd 11/6/03 3:09 PM Page 366

CHAPTER 12 • SHAREHOLDERS’ EQUITY 367
Suppose CCC is a French company. It makes a transfer of 5% of year 2 profits to reserveswhen shareholders approve the annual dividend in May year 3. Year 2 profits amount to 200,000so the transfer to legal reserve is 10,000.
Transfer of profit to legal reserveDr. Profit for year 2 (OE−) 10,000
Cr. Legal reserve (OE+) 10,000
Second, the EU’s 2nd Company Law Directive requires public companies to establish areserve when they buy back their own shares. This ‘Reserve for own shares’ is created by transfer-ring an amount from retained profits equivalent to the cost of the shares repurchased. We examine why and how companies acquire their own shares in section 2 of this chapter.
Companies transfer profits to reserves for other reasons. Company statutes may require it. Orthe directors may propose it on a voluntary basis – for example, when a heavy capital investmentprogramme is in progress. Transferring profits to reserves, whether by law or by choice, does notinvolve the setting aside of cash. It merely signals to investors that not all the profits earned in currentand past periods are available for distribution.
Revaluation of assets, where permitted, can also result in the creation of a reserve. As we sawin our discussion of fixed assets and inventories, any unrealised holding gain from the increasein the market value of such assets above cost is credited to a revaluation reserve. Under the EU’s4th Directive, such gains are not distributable until the related assets are used up or sold and thegains realised. (Unrealised losses are charged first to this reserve and, when it is exhausted, tocurrent year’s profits.)
l Non-cash dividends
Dividends need not be in cash. If its statutes permit it, a company can distribute to shareholdersa dividend in kind (for example, shares it holds in other companies) or a share dividend (thatis, additional shares in itself). A share dividend goes by several names: stock dividend, bonusissue, capitalisation issue. Although dividends in kind are unusual, share dividends are common.
Dividend in kind
There is no agreed accounting treatment. Many companies follow US practice and record a dividend in kind at the fair value of the non-cash assets distributed. If the assets are not alreadycarried at fair value in the company’s accounts, a gain or loss must be recognised at the time of distribution. For example, suppose a company plans to distribute an investment in debt secur-ities to shareholders and it carries this asset at an amount less than fair value. It makes the fol-lowing entries:
Revaluation of investment to fair valueDr. Investment in debt securities (A+) xxx
Cr. Gain on revaluation of investment (OE+) xxx
Dividend in kindDr. Retained profits (OE−) xxx
Cr. Investment in debt securities (A−) xxx
The company recognises the gain in the income statement since the asset is ‘derecognised’ andthe gain is realised. (To simplify presentation, we assume no time lag between dividend declara-tion and payment.)
CFA_C12.qxd 11/6/03 3:09 PM Page 367

368 PART 2 • THE HOUSE OF ACCOUNTING
Share dividend
Most EU firms record a share dividend at the par value of the shares issued. For example, sup-pose CCC’s shareholders approve in May year 3 a 20% share dividend – that is a distribution ofone new share for every five held. CCC’s share dividend is in place of its cash dividend. Theissuance of the 20,000 shares (remember, CCC has 100,000 shares outstanding) is recorded asfollows:
Share dividend: EU practiceDr. Retained profits (OE−) 100,000
Cr. Share capital (OE+) 100,000(20,000 × 5 par value)
Thus retained profits (or, in some countries, share premium) are reduced by the par value of the20,000 shares issued.
US companies, by contrast, must record share dividends at the fair value of the shares dis-tributed. For example, if CCC observes US GAAP and the market price of its shares is 9 at thedate the 1:5 share dividend is declared in year 3, it makes the following entry in its US-styleaccounts:
Share dividend: US practiceDr. Retained earnings (OE–) 180,000
Cr. Common stock (OE+) 100,000(20,000 shares × 5 par value)
Cr. Additional paid-in capital (OE+) 80,000(20,000 shares × (9 – 5))
The excess of the market value over the par value of the shares issued is credited to the US equi-valent of share premium. As the example shows, a US company finds it more ‘costly’, in termsof distributable profits, to pay a share dividend than its European counterpart.15
Notice a common feature of both the European and US treatment of share dividends.Companies convert reserves (usually retained profits) into shares. In effect, they capitalise (makecapital out of) reserves – hence the term ‘capitalisation issue’.
Why do companies declare dividends in the form of shares? We have seen already (in Chapter6) that companies can be profitable and yet short of cash. A fast-growing company, for example,may face a cash constraint as it seeks to finance investment in new plant and working capital. Toavoid the outflow of funds which a cash dividend will cause, it ‘rewards’ its shareholders withadditional shares. As a result, shareholders have tangible evidence of their share of the firm’saccumulated profits.
But are shareholders rewarded? In theory, they should be no better off. The company has notdistributed assets to them. In fact, its own net assets are unchanged. (Look at the journal entryCCC makes in May year 3: shareholders’ equity has not changed in total.)
An individual shareholder’s net assets should also be unchanged. For example, Mevrouw Last,an investor, holds 1,000 shares of CCC. At a market price of 9 a share, her investment is valuedat 9,000. After receiving a 20% share dividend, she now holds 1,200 shares. However, the market value of her investment should still be 9,000: the price per share should fall to 7.5. In practice, this does not occur. Announcement of a share dividend is viewed by investors asinformation (‘news’) about the company. They may interpret it as good news (faster growth and a higher cash dividend in future) or bad news (inability to pay cash dividend because ofdifficult trading conditions), depending on the company’s circumstances. They will buy or sellthe shares accordingly. As a result, the market price will not adjust to its theoretical value of 7.5a share and the value of Mevrouw Last’s investment will not remain at 9,000.
CFA_C12.qxd 11/6/03 3:09 PM Page 368

CHAPTER 12 • SHAREHOLDERS’ EQUITY 369
Scrip dividendSome companies allow shareholders to take a cash dividend in shares. The shareholder mayenjoy a tax advantage from taking the dividend in ‘scrip’ (i.e. shares) and, if she wants to increaseher shareholding in the company, she also avoids the transaction costs associated with share purchase.
There is no agreed accounting treatment for scrip dividends (also known as ‘optional stockdividends’). Many companies account for them at fair value. They debit ‘Retained profits’ for thefair value of the shares taken in lieu of cash (measured at the date the cash dividend is declared).The par value of the shares distributed is credited to ‘Share capital’ and the difference betweenfair and par value to ‘Share premium’.
l Share splitsCompanies often split their shares when the market price per share rises above a certain level.They do so to make their shares more liquid and marketable. By increasing the number of sharesoutstanding, a share split usually results in more share transactions, a larger shareholder base –and hence greater liquidity. Moreover, a high share price may deter the small investor. He or shecannot afford to buy a large number of shares and the transaction costs (e.g. brokers’ charges)are proportionately higher for small purchases. A share split lowers the price and makes theshares attractive to a wider range of investors.
A company which splits its shares issues new shares in exchange for old ones. The new sharescarry a lower par value. Thus if CCC declares a 2:1 share split, it will issue 200,000 new shareswith a par value of 2.50 a share, in place of the 100,000 old shares (with a par value of 5 a share).16
A share split has no accounting implications. No accounts are adjusted. The book amount of thefirm’s shareholders’ equity does not change. Share capital is simply recalibrated. Thus CCC’s sharecapital account now consists of double the number of shares (200,000) at half the par value (2.5).
Note the difference between a share split and a share dividend. If CCC declares a 100% sharedividend, it issues 100,000 additional shares at the existing par value of 5. To do so, it capitalises500,000 of reserves. Its accounts are adjusted. Although the balance in ‘Shareholders’ equity’does not change in total, its share capital increases at the expense of its reserves.
In theory, the market value of a company should be unaffected by a share split. In our CCCexample, 100,000 shares valued at, say, 9 a share should become 200,000 shares at 4.5 a share:CCC’s total market value should still be 900,000. In practice, the share price may not adjust fully(i.e. halve to 4.5). It should benefit from the shares’ greater liquidity and from the positive signal – about the company’s future earnings and dividends – conveyed by the split.
If the market price of a company’s shares falls to very low levels, the company faces a different problem. Regular investors spurn the shares and price volatility increases as day-tradersspeculate on them. Some stock exchanges may delist shares when the price falls below a specifiedminimum ($1 in the case of Nasdaq and the New York Stock Exchange). To drive up the price,management may decide to consolidate the shares, issuing fewer new shares in exchange for oldones. A ‘reverse share split’, as it’s known, is accounting-neutral. There is no change to share-holders’ equity. Share capital consists of fewer shares at a higher par value. However, the shareprice may not respond as expected. Fewer shares in circulation mean the market for them islikely to be less liquid. Moreover, management appear to be telling investors that the share priceis unlikely to increase unaided.
l Shareholder accounting for dividend receivedHow does a shareholder account for a dividend received? If the dividend is in cash, the shareholderrecognises investment income and records an increase in his or her cash balance:
CFA_C12.qxd 11/6/03 3:09 PM Page 369

Receipt of cash dividendDr. Cash (A+) xxx
Cr. Investment income (OE+) xxx
If the dividend is a share dividend, the shareholder adjusts the cost base of his or her investment inthe company. The shareholder does not record any income from the share dividend. Consider the caseof Mevrouw Last. She acquired 1,000 shares of CCC at a price of 8 a share (the initial issue price).After CCC’s declaration of a 20% share dividend, she now has 1,200 shares, still with a carryingamount of 8,000. She recognises no income. Should she sell any CCC shares at a later date, thecost per share in the calculation of the gain or loss on disposal will be 6.67 (8,000/1,200 shares).
Share dividend: adjustment to cost base
ShareBefore dividend (20%) After
Total cost 8,000 8,000
÷
Number of shares held 1,000 +200 1,200
×
‘Old’ cost/share 8
‘New’ cost/share 6.67
l Capital write-downAs mentioned earlier, a share dividend is sometimes known as a ‘capitalisation issue’. Retainedprofits (or other reserves such as share premium) are converted into share capital. The reversecan occur. A company in financial difficulties may, as part of a capital restructuring, convertcontributed capital into earned capital. Why would it do this? After all, the conversion has noeffect on its shareholders’ equity in total. The main reason a company writes down its capital is toeliminate its accumulated book losses.
Consider the case of a firm whose operations are profitable – or have been made so as a resultof an operational restructuring – but which has accumulated losses. It wishes to attract new cap-ital, preferably on favourable terms. This requires the early resumption of dividend payments.Without a capital restructuring, the company would have to dedicate future profits to ‘payingoff ’ past losses. Cash dividends would be delayed.
How is the write-down carried out? After obtaining shareholders’ approval and, in some cir-cumstances, the court’s permission, the company cuts the par value of its shares and cancels partor all of the share premium. The aim is to reduce contributed capital to the extent necessary toeliminate the accumulated losses:
Dr. Share capital (OE−) xxxDr. Share premium (OE−) xxx
Cr. Accumulated losses (OE+) xxx
The court may lay down additional conditions, for example, the appropriation of part of thefuture profits of the firm to a special (non-distributable) reserve. The court’s intention is to protect the interests of the firm’s creditors. As we have noted, a capital write-down makes
370 PART 2 • THE HOUSE OF ACCOUNTING
CFA_C12.qxd 11/6/03 3:09 PM Page 370

CHAPTER 12 • SHAREHOLDERS’ EQUITY 371
SECTION
2
possible the early resumption of dividend payments. The special reserve is designed to restrictthe outflow of corporate assets to shareholders when this occurs.
l Shareholders’ equity and IAS
IAS address the accounting for shareholders’ equity in two main areas only: the definition of anequity instrument and the disclosure of share capital and reserve balances (and their movement)in the accounts. We look at definitional issues here and at disclosure issues in section 3.
Accounting regulators view shareholders’ equity as a residual. As we saw in earlier chapters,IAS carefully define what is an asset and a liability and set out recognition and measurementrules for them. Shareholders’ equity is then simply the difference between total assets and totalliabilities. IAS apply the same approach to financial instruments. They define what is a financialliability. A financial instrument that is not debt is considered to be equity.
According to the IASB, a financial liability is ‘any liability that is a contractual obligation todeliver cash or another financial asset to another enterprise’.17 Ordinary share capital is clearlynot a financial liability since the company is not obligated to make payments to shareholders.However, certain types of preference share are equity instruments in name only. Examples areredeemable preference shares where redemption is either mandatory or at the option of theshareholder. In these cases, the issuing company has a contractual obligation to repay the sharecapital at some future date. Under IAS, it must classify such redeemable preference share capitalas debt on its balance sheet and report dividend payments as a financing expense on its incomestatement. Other equity securities with debt-like features (e.g. fixed-term securities paying tax-deductible ‘dividends’) must also be accounted for as a financial liability if the contract requiresthe issuer to make payments to security holders. Where a financial instrument contains both aliability and an equity element – as in the case of convertible securities, IAS require the issuingcompany to present the two elements separately in its financial statements.
IAS also impinge on the accounting for share issues and profit distributions. Internationalrule-makers support the current practice of writing off share issuance costs against reserves: only the costs of failed share issues should be expensed.18 More significantly, a company fol-lowing IAS may not recognise as a liability at the balance sheet date dividends that it proposes or declares after that date. This is likely to have a major impact on UK and US companies. As wenoted earlier, it’s common practice for directors of UK and US firms to propose or declare thefinal dividend rate (on ordinary or common shares) at some date between the balance sheet dateand the date the accounts are published. Under IAS, firms must disclose the amount of this pro-posed or declared dividend but not book a liability for it at the balance sheet date.19
Specialised topics
Purchase of own shares
l Reasons for share repurchase
Share buybacks can take one of two forms. A company that repurchases its own shares eithercancels them after purchase or holds them in treasury for later resale.
Why would a company want to buy back and cancel its shares? The main reason is to shrink its business. Management may reckon they can’t find sufficient profitable investment
CFA_C12.qxd 11/6/03 3:09 PM Page 371

opportunities for shareholders’ funds. Just as companies raise equity from investors to pursuewealth-creating investments, so they return it when such opportunities disappear.
Management usually have different motives for buying the company’s shares for treasury.They may believe its shares are undervalued. The acquisition is then a temporary investment ofcorporate cash: management hope to sell the shares at a higher price in the future (assuming themarket comes to accept management’s view of the share’s worth). Another reason is to makeshares available to employees under company-sponsored share purchase and share option plans.The alternative, a special issue of new shares, involves higher transaction costs for the company.Note that, if the law allows, the company may use the treasury route even if its aim is to shrinkthe business. Buying shares for treasury is more flexible than share repurchase and immediatecancellation: the company has the option to cancel the shares at a later date.
From the company’s perspective, a share repurchase is equivalent to a cash dividend. In bothcases, equity and cash are reduced. However, shareholders may view them differently. All share-holders receive a dividend; only those that proffer their shares receive cash from a buyback.Moreover, the tax impact of each is likely to differ. A share repurchase is more advantageous forshareholders than a dividend if the tax rate on the capital gain from the share sale is less than theincome tax rate on dividend income.
l EU and US practice
Share repurchase is a common practice among US firms; it is less so in the EU. EU law placesrestrictions on its use. In general, an EU public company must:
1 obtain shareholder authorisation before a repurchase can take place;20
2 limit the amount of shares repurchased to 10% of its subscribed capital;3 ensure that non-distributable capital (share capital plus non-distributable reserves) is
preserved.
Some EU member states impose tougher rules on share repurchase.Why are there restrictions on EU firms buying back their own shares? One reason is that
in many European countries the law takes a narrow view of what are the legitimate actions a company can take. It’s argued that shareholders never intended that managers should investtheir capital in the company’s own shares. Such a practice has been described as ‘autophagy’(eating oneself). Hence, shareholder approval is required before a repurchase can occur (con-dition 1).
In addition, there is a fear that if given the right to buy and sell their own shares freely, com-panies will abuse it. For example, shareholders are not privy to the same information about thecompany as managers: the latter may use their inside information to buy back and then reissuethe company’s shares to their advantage. Because of tough US laws against insider trading,investors in US listed companies enjoy better protection against such risks than investors inEuropean firms.
Nonetheless, an increasing number of European firms are buying back their own shares andthose EU states that place additional restrictions on share repurchase are coming under pressureto lift them. (Some, for example Germany and the UK, have already done so.) Internationalinvestors form a growing proportion of shareholders of large European listed firms. They con-sider a company’s primary goal is to increase its shareholders’ wealth. Among the measures acompany can take to achieve this is to identify surplus equity in the business and return it, in atax-efficient manner, to shareholders.
372 PART 2 • THE HOUSE OF ACCOUNTING
CFA_C12.qxd 11/6/03 3:09 PM Page 372

CHAPTER 12 • SHAREHOLDERS’ EQUITY 373
l Accounting for share repurchaseShares held in treasuryUnder IAS, shares repurchased and held in treasury should be accounted for as a deduction fromequity. The usual practice is to show the cost of the shares as a one-line adjustment within share-holders’ equity. For example, suppose CCC buys back 5,000 of its own shares at a price of 12 anddoes not cancel them. It records the transaction as follows:
Repurchase of shares for treasuryDr. Shares held in treasury (Contra-OE+) 60,000
Cr. Cash (A−) 60,000
CCC shows the 60,000 cost of the treasury shares as a debit balance, either below contributedcapital or at the bottom of the shareholders’ equity section of the balance sheet.
IAS also require that any gain or loss from later resale of the treasury shares should not berecognised in income, on the grounds that the gain or loss represents a transfer between share-holders.21 IAS do not specify how gains or losses should be recorded in the balance sheet, largelybecause of differences in national law regarding the creation and utilisation of individual reserveaccounts. Some companies take all gains and losses to retained profits. An alternative approach isto credit all gains to share premium (USA: additional paid-in capital) and charge losses first to sharepremium up to the amount of previous treasury gains and then the balance to retained profits.
Note that some companies do not account for treasury shares as a deduction from equity.Instead, they record the investment in ‘Own shares’ as an asset and recognise any gain or lossfrom later resale on the income statement. This treatment is no longer acceptable under IAS.
Shares held in treasury are considered to be ‘issued but not outstanding’. They are excludedfrom the calculation of earnings per share (only outstanding shares are included in the EPSdenominator). They do not qualify for dividends although they are adjusted for share splits.
Cancelled sharesShares repurchased and cancelled result in a reduction in share capital and, usually, share premium.Any share premium recorded on the issuance of the shares is reversed on their cancellation. Ifthe shares are repurchased at a price greater than the issue price, the difference is usually chargedagainst retained profits.
In certain circumstances, EU law requires firms to establish a special (non-distributable)reserve when buying back their own shares. This must be done when the shares are repurchasedfor cancellation and there’s no fresh issue of shares to offset those cancelled. We illustrate thiswith our CCC example. Recall that the company originally issued the 5 par shares at 8 a share.If it buys back 5,000 shares at 12 each and cancels them, it makes the following entries:
Repurchase and cancellation of sharesDr. Share capital (OE−) 25,000
(5,000 shares × 5 par) Dr. Share premium (OE−) 15,000
(5,000 shares × (8 – 5))Dr. Retained profits (OE−) 20,000
Cr. Cash (A−) 60,000(5,000 shares × 12)
Dr. Retained profits (OE−) 40,000Cr. Reserve for own shares (OE+) 40,000
(5,000 shares × 8)
CFA_C12.qxd 11/6/03 3:09 PM Page 373

374 PART 2 • THE HOUSE OF ACCOUNTING
The purpose of the above entries is to preserve the capital of the firm. CCC’s non-distributable capital is maintained at 800,000 after the share repurchase, as can be seen below:
Before Afterrepurchase repurchase
(100,000 shares) (95,000 shares)
Non-distributable capital:Share capital (5 par) 500,000 475,000Share premium 300,000 285,000Reserve for own shares 0 40,000
800,000 800,000
Under EU law, a company can only reduce its capital if it has the approval of its shareholdersand creditors’ interests have been safeguarded. It cannot use a share repurchase and cancellationto circumvent these legal requirements.
Convertible securities and warrants
Companies issue securities which contain both debt and equity components. They are known as‘compound’ financial instruments. Examples include:
1 Convertible securities. These comprise convertible bonds and convertible preference shares. Aholder has the right to convert each bond (or preference share) into a predetermined num-ber of ordinary shares during a specified future period. The conversion price (implicit in theconversion rate of convertible stock for ordinary shares) is usually set higher than the marketprice of ordinary shares at the date of the convertible’s issue. A holder will convert the stockonly if the market price per share rises above the conversion price. If it does not, the bonds orpreference shares remain outstanding until they mature or are redeemed.
2 Warrants. A company issues straight bonds or preference shares with warrants attached. Awarrant is a long-term call option: it entitles the holder to buy a specified number of ordinaryshares at a predetermined price (the exercise price) during a future period (the exercise term).A holder will exercise the warrant only if the market price of the ordinary share is above theexercise price. If this does not occur, the warrant will expire unused at the end of the exerciseterm. Warrants are sometimes ‘detachable’: in this case, they can be separated from their hostbonds or shares and traded independently.
What is the attraction of convertible securities or warrants to the issuing company andinvestors? Consider the companies that make frequent use of such instruments. They areoften small and fast-growing. Internal cash flow is insufficient to finance growth so they mustseek outside capital. Issuing straight equity is costly. The market fears the issue signals anovervalued share price (management have an information advantage which the marketbelieves they’re trying to exploit) and forces the company to issue new shares at a discount,thereby depressing the value of existing shareholders’ stakes. As for straight debt, the highcoupon the company must pay increases the risk of financial distress. Compound instrumentslike convertible bonds alleviate these problems. They enable small firms to invest and, if theinvestments are successful, build up their equity base.22
As for investors, convertibles and warrant-carrying securities offer a relatively secureincome stream – in the form of bond interest or preference dividends – and the opportunityto share in profits as ordinary shareholders, if the company does well.
CFA_C12.qxd 11/6/03 3:09 PM Page 374

CHAPTER 12 • SHAREHOLDERS’ EQUITY 375
l Accounting for convertibles and warrantsMany companies still account for convertibles and warrants according to their form. Thus convertible bonds are treated as straight debt and non-detachable warrants are not recognisedseparately. Under new international rules, however, firms must account for compound instru-ments according to their substance. The liability and equity components of such instrumentsmust be recognised and valued separately. This new approach will replace traditional account-ing over time. We illustrate both approaches below.
Traditional approach: no separation of liability and equity componentsConsider, first, the case of convertible securities. Suppose that early in year 3 CCC issues at par500 of five-year 4% convertible bonds with a nominal value of 1,000. (All currency amounts are ineuros.) Under the terms of the bond issue, from the start of year 5 holders can convert each 1,000 bondinto shares at the rate of 65 shares to each bond. Thus bondholders have no incentive to convertthe bonds until the share price reaches the conversion price of 15.4 (1,000/65 shares = 15.3846).(Assume CCC’s shares are trading at a price below this when the bonds are issued.)
Under traditional practice, CCC accounts for the bonds as debt. It assigns all the issue pro-ceeds to a liability account. (Issuance costs are ignored.)
Issue of convertible bonds, start year 3Dr. Cash (A+) 500,000
Cr. Convertible bonds payable (L+) 500,000
CCC applies the coupon rate to the face amount of the bonds to determine their periodic cost.Annual interest expense is 20,000 (4% × 500,000).
Annual cost of convertible bondsDr. Interest expense (OE−) 20,000
Cr. Cash (A−) 20,000
If conversion takes place, the issuing company usually records the shares issued at the carryingamount of the convertible securities exchanged. Assume bondholders convert the 500 bonds intoCCC ordinary shares at the start of year 5. CCC records the 32,500 shares issued at 500,000, thecarrying amount of the bonds. (In effect, each share is valued at the conversion price of 15.4.)
Conversion of bonds at start year 5Dr. Convertible bonds payable (L−) 500,000
Cr. Share capital (OE+) 162,500(32,500 shares × 5 par)
Cr. Share premium (OE+) 337,500(32,500 shares × (15.3846 – 5))
If the bonds are not converted, they remain, as debt, on CCC’s balance sheet until they matureor are redeemed.
The accounting for securities issued with non-detachable warrants is similar to that for con-vertible securities. At the time of issue, the equity component (in this case, the warrant) is notrecognised. If the warrants are exercised, the company records the issue of shares at the exerciseprice:
Dr. Cash (at exercise price) xxxCr. Share capital (at par) xxxCr. Share premium (exercise price – par) xxx
CFA_C12.qxd 11/6/03 3:09 PM Page 375

376 PART 2 • THE HOUSE OF ACCOUNTING
Where the warrants are detachable, they are recognised, as equity, at the time of issue. Themethod that issuing companies use to value securities with detachable warrants, namely theresidual value method, is also used in the new approach to measuring compound financialinstruments which we describe and illustrate below.
New approach: separation of liability and equity componentsA company following international accounting standards must show separately on the balancesheet the liability and equity components of any compound financial instrument it issues. Thisinvolves recognising, at the time of issue, the value of the conversion option implicit in a con-vertible bond or preference share and the value of the call option implicit in a warrant. The issu-ing company measures the compound instrument using a ‘residual value’ approach. It values theliability component of the instrument as if it were a ‘straight’ security (i.e. one without a con-version option or warrant attached). The difference between the value of the compound instru-ment at the issue date and the value of the liability component is the residual value assigned tothe equity component (i.e. the option or warrant).
We illustrate the residual value approach using our CCC example. An investment bankadvises CCC that it would have to offer investors an 8% return if the five-year bond containedno conversion option: this is the prevailing interest rate for straight bonds of this risk class andmaturity. Exhibit 12.2 shows how the value of the conversion option of CCC’s 4% five-year con-vertible bonds is established.
CCC records the issue of the convertible bonds as follows:
Issue of convertible bonds, start year 3Dr. Cash (A+) 500,000Dr. Bond discount (CL+) 79,640
Cr. Convertible bonds payable (L+) 500,000Cr. Equity component of convertible bonds (OE+) 79,640
The bonds are stated in CCC’s start year 3 balance sheet at 420,360, the fair value of equivalentstraight debt then. The conversion option is valued at 79,640, the difference between the fairvalue of the whole convertible (500,000) and the fair value of the liability component.
FactsCCC issues 500,000 of five-year 4% convertible bonds at the start of year 3. If it issuesstraight debt then, it must offer investors an 8% yield to maturity. (Each 1,000 bond isconvertible into 65 CCC ordinary shares from year 5.)
Valuation of equity and liability components of convertibleValue of five-year 4% convertible bonds at issue 500,000
Less: Value of liability component:PV factor Present
Amount (at 8%) valueAnnual interest 20,000 3.993 79,860Principal 500,000 0.681 340,500
–420,360Value of equity component (conversion option) 79,640
Valuation of equity and liability components of convertible bonds: residual valueapproach (amounts in euros)
Exhibit 12.2
CFA_C12.qxd 11/6/03 3:09 PM Page 376

CHAPTER 12 • SHAREHOLDERS’ EQUITY 377
How will CCC measure the liability and equity components during the life of the convertiblebonds? The liability component is accounted for in the same way as debt issued at a discount.Thus the debt discount of 79,640 is amortised over the five-year life of the bonds, using the inter-est method of amortisation as illustrated in Chapter 11. The interest charge each period is basedon the cost of straight debt at the time of issue, namely 8%. Under HC accounting, the bondsare reported in CCC’s balance sheet at amortised cost (principal amount less unamortised dis-count). Meanwhile, the equity component does not alter. It is included with reserves in CCC’sshareholders’ equity.
On conversion of the bonds, the liability component is eliminated while the equity compon-ent is absorbed into share premium. No gain or loss arises on conversion: the shares issued arevalued at the combined carrying amounts of the liability and equity components. Thus if CCC’sbondholders convert all the bonds at the start of year 5 and the carrying amount of the liabilitycomponent then is 448,540 (or 500,000 less unamortised discount of 51,460), CCC records theconversion as follows:
Conversion of bonds at start year 5Dr. Convertible bonds payable (L−) 500,000Dr. Equity component of convertible bonds (OE−) 79,640
Cr. Bond discount (CL−) 51,460Cr. Share capital (OE+)
(32,500 shares × 5 par) 162,500Cr. Share premium (OE+) 365,680
The 32,500 shares issued in exchange for the 500 bonds are valued at 528,180, the sum of theunamortised cost of the debt (448,540) and the value assigned initially to the conversion option(79,640).
The merit of the new approach is that it recognises explicitly the equity component of a com-pound financial instrument and attempts to measure both liability and equity components accur-ately at the date of issue. Note, however, that the liability component is measured at amortisedcost and thus changes in fair value during its life are not recognised in the issuing company’sfinancial statements.
State aid to companies
In virtually all countries, governments offer financial assistance to companies. They do so forseveral reasons. They seek to stimulate investment and reduce unemployment, especially inpoorer regions. They want to encourage research and development in industries which are heldto be of ‘national importance’ (e.g. defence, aerospace, information technology, energy). Andthey try to forestall bankruptcy, especially of large companies. Government financial assistancetakes many forms, ranging from grants and subsidies to tax holidays and low-interest loans. Wefocus in this section on the accounting for equity-related aid.
Where there is evidence that the government has ownership rights (e.g. the company issuesshares to it in exchange for financial aid), the company accounts for the aid in the same way asany other issue of share capital.
When the assistance is in the form of a cash grant or subsidy, the company should not recordthe amount received as permanent capital. Under international accounting rules, it should recog-nise the assistance as income on an accrual basis, that is, in the period or periods it expects to benefitfrom it.23 In the case of a grant towards the cost of new equipment, it can establish a liabilityaccount, ‘Deferred income’, on the balance sheet and amortise it to income over the asset’sexpected life (the deferred income approach). Alternatively, it can deduct the grant from the cost
CFA_C12.qxd 11/6/03 3:09 PM Page 377

378 PART 2 • THE HOUSE OF ACCOUNTING
of the asset acquired (the net-of-grant approach). The accounting benefits from the grant arecaptured in the income statement in the form of lower depreciation charges.
An example contrasts the two accounting methods. Tasman Company offers survey servicesto mining and oil companies. At the start of x1, it has capital of 3 million. Early in the year, itpurchases remote sensing equipment, at a cost of 2 million, for use in aerial surveys and receivesa government grant of 10% towards the cost. The equipment is expected to have a four-year life.Exhibit 12.3 shows the effect of the grant on Tasman’s x1 accounts under the deferred incomeand net-of-grant approaches.
FactsTasman Company offers survey services to mining and oil companies. Early in x1, it purchasesremote sensing equipment for use in aerial surveys. The equipment costs 2 million. It receivesa government grant of 10% towards the cost. The equipment is expected to have a four-year life.
Tasman’s capital at the start-x1 is 3 million. x1 profits before depreciation are 700,000.(Income taxes are ignored.)
Accounting for receipt of grant and amortisation of benefit (amounts in 000)
Deferred income approach Net-of-grant approach
Dr. Cr. Dr. Cr.Start x1Equipment 2,000 Equipment 2,000
Cash 2,000 Cash 2,000Cash 200 Cash 200
Deferred income (L+) 200 Equipment 200
End years x1–x4Depreciation expense 500 Depreciation expense 450
Accumulated depreciation 500 Accumulated depreciation 450Deferred income (L−) 50
Other income (OE+) 50
Tasman’s end-x1 balance sheet (amounts in 000)
Deferred income approach Net-of-grant approach
Assets AssetsPlant 2,000 Plant 1,800– Accumulated depreciation – 500 – Accumulated depreciation – 450
1,500 1,350Other assets 1,900 Other assets 1,900
Total assets 3,400 Total assets 3,250
Equities EquitiesCapital, start-x1 3,000 Capital, start-x1 3,000Profit in x1 250 Profit in x1 250
Shareholders’ equity 3,250 Shareholders’ equity 3,250Deferred income 150
Liabilities and shareholders’ equity 3,400
Accounting for government grants: deferred income and net-of-grant approachesExhibit 12.3
CFA_C12.qxd 11/6/03 3:09 PM Page 378

CHAPTER 12 • SHAREHOLDERS’ EQUITY 379
SECTION
3
The ‘bottom line’ impact of the two methods is the same. Consider Tasman’s profit in x1.Assuming profit before depreciation is 700,000 and the remote sensing equipment is the onlydepreciable asset, Tasman’s x1 before-tax profit is 250,000 in both cases:
Deferred income Net-of-grantapproach approach
Profit before depreciation 700,000 700,000– Depreciation –500,000 –450,000+ Other income +50,000 –Profit before tax 250,000 250,000
During the amortisation period, Tasman’s balance sheet differs between the two approaches.The carrying amount of fixed assets and total equities are lower under the net-of-grant approach.At the end of the amortisation period (end-x4 in Tasman’s case), the balance sheets should bethe same.
Ignoring indirect effects, government financial assistance clearly benefits a company’s share-holders. The accounting reflects this. Shareholders’ equity is higher each year by the amount of theamortised grant or subsidy. Moreover, because the aid flows into shareholders’ equity by way ofreported earnings, it can be distributed. Other things being equal, Tasman’s retained profits – andthus its distributable capital – are 200,000 greater at the end of x4 than if no grant had been received.
Shareholders’ equity and financial statementanalysis
l DisclosureThe published annual accounts are a rich source of information about a firm’s capital structure.National law usually requires firms to disclose the following:
l The number and par value of shares issued at the balance sheet date. This information is givenfor each class of share (e.g. ordinary, preference).
l The composition of reserves. For example, EU companies break down this figure into: sharepremium; revaluation reserve; retained profits (identifying separately the profit or loss for theyear); and other reserves required by national law (e.g. legal reserve).
l The dividends declared – or proposed to be paid – with respect to the current year’s profits.
IAS go further. Companies following IAS must disclose changes in their capital structure, in par-ticular the change in shares outstanding and the changes in share capital (including treasuryshares) and reserves. They can show these changes in equity either in a separate statement or inthe notes to the accounts. They must also provide information about ‘off-income-statement’gains and losses – either in the statement of changes in equity or separately – so that readers of the financial statements can determine the firm’s comprehensive income or loss for theperiod.24
Most companies following IAS now include a statement of changes in equity as a fourth state-ment after the balance sheet, income statement and cash flow statement. Exhibit 12.4 shows anextract from the statement in the BMW Group’s 2001 accounts.What were the main events affecting BMW’s equity in 2001?
CFA_C12.qxd 11/6/03 3:09 PM Page 379

380 PART 2 • THE HOUSE OF ACCOUNTING
Balance sheet (part) at 31 December(in euro million)
Notes 2001 2000
Subscribed capital 673 672Capital reserves 1,937 1,914Revenue reserves 9,405 7,849Accumulated other equity −−1,245 −1,003Equity [26] 10,770 9,432
Statement of changes in equity (part)(in euro million)
Subscribed Capital Revenue Accumulated other equity Total
capital reserves reserves
Translation Fair value Derivative
differences measurement financial
of marketable instruments
securities
Balance at31 December 2000 672 1,914 7,849 −−261 −−23 −−719 9,432
Subscribed capital increase 1 – – – – – 1Additional paid-in capital
on preferred stock – 23 – – – – 23Dividends paid – – –310 – – – –310Translation differences – – – –165 – –23 –188Financial instruments – – – – –92 38 –54Net profit 2001 – – 1,866 – – – 1,866
Balance at31 December 2001 673 1,937 9,405 −−426 −−115 −−704 10,770
Note 26 Equity (part)
Number of shares issuedAt 31 December 2001, issued BMW AG common stock was divided, as in the previous year, into 622,227,918shares with a par value of one euro. Issued BMW AG preferred stock was divided into 50,638,232 (2000:49,597,812) non-voting shares, with a par value of one euro. All of the company’s stock is issued in the form of bearer shares. Preferred stock bears an advance profit (additional dividend) of A0.02 per share.
At the Annual General Meeting held on 18 May 1999, authorised capital was created with a total nominalamount of A5 million for the issuance of 5 million preferred stock shares. During the fiscal year 2001, this wasused for the subscription of 1,040,420 (2000: 1,138,000) employee shares. . . .
Capital reservesCapital reserves comprise additional paid-in capital on the issue of shares. The addition to capital reserves ofA23 million (2000: A21 million) arose in the year from the subscription of employee shares.
Revenue reservesRevenue reserves are disclosed in accordance with the disclosure requirements contained in Germancommercial law. They comprise the post-acquisition and non-distributed earnings of consolidated groupcompanies. In addition, revenue reserves include both positive and negative goodwill arising on theconsolidation of group companies prior to 31 December 1994 and the effect, recognised as an adjustment to the opening balance of revenue reserves, of the first-time application of IAS.
BMW Group: extracts from 2001 consolidated accountsExhibit 12.4
(Source: BMW Group, Annual Report and Accounts 2001. Reproduced by permission of BMW Group.)
CFA_C12.qxd 11/6/03 3:09 PM Page 380

CHAPTER 12 • SHAREHOLDERS’ EQUITY 381
l First, the company raised only a small amount (a24 million) of additional capital. Note 26 tothe accounts tells us employees subscribed for around 1 million shares of preferred stock in2001. (BMW’s preferred stock does not have a fixed dividend rate. Holders share in the earn-ings of the company in the same way as common stockholders but they receive an additionaldividend of a0.02/share to compensate them for the loss of voting rights.)
l Second, BMW’s revenue reserves (i.e. retained profits) rose over a1.5 billion, the net effect ofnet profits in the year of a1.8 billion and dividends paid (out of 2000 profits) of a0.3 billion.
l Third, cumulative off-income-statement losses – described as ‘Accumulated other equity’ onBMW’s balance sheet – increased by a242 million to a1,245 million at end-2001. They con-sist of unrealised losses (net of gains) arising from investments held in other currencies(‘Translation differences’) and from certain financial instruments measured at fair value.Changes in exchange rates give rise to ‘differences’ (i.e. gains or losses) when BMW translatesits foreign subsidiaries’ financial statements into euros before consolidating them. (We illus-trate the accounting in Chapter 15.) And IAS require firms to value certain financial instru-ments at fair value and take unrealised holding gains and losses on them directly to equity, aswe’ll see in Chapter 13.
BMW’s comprehensive income is the sum of its reported net profit and off-income-statementgains and losses in the year. Given the company reported a242 million of such losses in 2001,comprehensive income was only a1,624 million that year. Moreover, off-income-statementlosses increased sharply between 2000 and 2001, offsetting in part the rise in net profit:
(In B million) 2001 2000 % changeNet profit 1,866 1,209 +54Off-income-statement losses, net −242 −18Comprehensive income 1,624 1,191 +36
(The comparative figures for 2000 are taken from BMW’s 2001 consolidated accounts.)An alternative way of presenting off-income-statement gains and losses is to provide a state-
ment of comprehensive income as an adjunct to the regular income statement. UK companies,for example, include a ‘Statement of recognised gains and losses’ beneath the income statement.The statement, known locally as the ‘struggle’ after its initials (st_rgl), combines the net profit orloss recognised in the income statement with other gains and losses recognised directly in share-holders’ equity on the balance sheet.
l Definition of ‘equity’ in key financial ratios‘Equity’ in profitability ratiosWhen investors speak of ‘equity’ in a profitability context – as in ‘return on equity’ (ROE) –they’re usually referring to the capital provided by a company’s ordinary (common) sharehold-ers. These are the owners of the firm and ROE is designed to measure the return they’ve earnedon their investment. That investment consists of their contributions (paid-up share capital andshare premium) and the cumulative profits attributable to them that have been reinvested in thefirm on their behalf. From a profitability perspective, it is irrelevant whether the reinvested cap-ital has a restricted use (e.g. legal reserve, reserve for own shares) or is available for immediatedistribution (e.g. retained profits).
Return on equity ==
Preference share capital is not included in the denominator of ROE and income attributable
Net income attributable to ordinary shareholders in period
Share capital and reserves attributable to ordinary shareholders (period average)
CFA_C12.qxd 11/6/03 3:09 PM Page 381

382 PART 2 • THE HOUSE OF ACCOUNTING
to these shareholders is excluded from the numerator. Similarly, in the case of a group, ‘equity’is usually defined as the capital provided by the parent company’s ordinary shareholders. Theinterests of minority shareholders in subsidiaries’ net assets and income are excluded fromdenominator and numerator, respectively. Note that since treasury stock is deducted fromequity, the denominator represents the capital attributable to outstanding shares.
Book value per share and price-to-book ratioInvestors also refer to ordinary shareholders’ equity as stated in the accounts as ‘book value’. Bycontrast, ‘market value’ represents the interests of the same ordinary shareholders measured atcurrent market value. Book value is often expressed on a per-share basis:
Book value per share ==
Investors compare a company’s per-share book value (taken from the most recent accounts)with the current market price of its shares, by means of the price-to-book ratio:
Price-to-book ratio ==
Profitable and growing companies have a price-to-book ratio of greater than one. This is evidentwhen we analyse the price-to-book (P/B) ratio: the ratio is the product of return on equity andthe price–earnings ratio.
Price-to-book ratio ==
We learned in Chapter 6 that investors use the P/E ratio as an indicator of a company’s growthprospects. The P/B ratio serves the same role – but it’s a richer measure because it includes thefirm’s current profitability as well. And it’s a more reliable measure in the case of companieswhose earnings are cyclical or that suffer short-term earnings declines. PSA Peugeot Citroën’srecent history illustrates this well. The French vehicle manufacturer made losses in 1997. Itreturned to profit in 1998 and improved its profitability in each of the following three years. Thecompany’s P/B ratio for the five years to 2001 is analysed below:
1997 1998 1999 2000 2001PSA Peugeot CitroënP/B ratio 0.72 0.78 1.23 1.20 1.20Return on equity (end-year) (0.05) 0.057 0.084 0.15 0.162P/E ratio – 13.6 14.7 8.0 7.4
The company’s P/B ratio was less than unity in 1997 and 1998: the company’s return on equitywas less than its cost in both years. The P/B ratio rose above unity in 1999 as the companyincreased its ROE. Despite the company’s rising profitability in subsequent years, the marketjudged its growth prospects to be limited: the P/B ratio remained around 1.2 in 2000 and 2001.(Note that French share prices were declining in these years and PSA’s share price was affectedby the change in market sentiment.) By contrast, the P/E ratio tells a less clear story. It was relativelyhigh in 1998 and 1999 – because earnings were low but recovering – but fell back in 2000 and2001 as earnings stabilised. (It can’t be computed for 1997 because PSA made losses that year.)
Investors combine information about current book value with forecasts of future earnings intheir valuations of companies. Box 12.2 describes one such valuation model they use – it’sknown as the residual income model – and the insights it provides.
Earnings per share
Book value per share (end period)
Current market price per share
Earnings per share××
Current market price per share
Book value per share (end of most recent quarter or year)
Share capital and reserves attributable to ordinary shareholders (end-period)
End-period ordinary shares outstanding
CFA_C12.qxd 11/6/03 3:09 PM Page 382

Valuing companies using book value and residual incomeBOX12.2
How do investors value a company? The traditional approach is to forecast the dividends it willpay during its lifetime and discount them to the present time. The dividend discount modelhas the following form:
(1)
where:MVE0 is the market value of a firm’s equity at time 0;DIVt is the dividends it pays in period t; andre is the cost of the firm’s equity capital (i.e. the minimum return investors demand forinvesting in the firm).
Dividends are the cash return investors expect to get from their investment. Should they sellthe investment in the future, the price they will receive will be based on the dividends the mar-ket expects the company to pay thereafter. All firms can be valued on this basis. Even those thatdon’t pay dividends currently because they can profitably reinvest all their earnings will paythem at some point in the future as investment opportunities diminish.
Economists have shown that the above model can be expressed in terms of accountingnumbers.25 If we assume ‘clean surplus accounting’, that is, income in the period is ‘compre-hensive income’ and includes off-income-statement gains and losses, then the dividends acompany pays in a period are equal to net income (NI) adjusted for the change in the bookvalue of equity (BVE) over the period. (Capital transactions can be ignored because of theiroffsetting effects on the book value of equity each period.)
BVEt = BVEt−1 + NIt − DIVt
Thus:
DIVt = NIt + BVEt−1 − BVEt (2)
Substituting (2) into (1) and rearranging terms gives the following ‘residual income’ model:
(3)
Residual income – or abnormal earnings as the term is also known – is equal to reported netincome (NI) less a capital charge (reBVE). The capital charge is, in effect, the minimumincome shareholders demand given the investment they’ve made in the firm. Thus the secondterm on the right-hand side of equation (3) is the discounted value of future abnormal earn-ings. The market value of equity today is the sum of these discounted future abnormal earn-ings and the book value of equity today.
The residual income valuation model yields important insights. First, if a company can earna return on equity no greater than its cost, the second term on the right-hand side of equation(3) is zero and the market value of equity is equal to its book value. It is current and expectedabnormal earnings that cause market value to exceed book value. Second, the larger the abnormalearnings the firm can generate, the faster they grow and the longer they’re expected to last, thegreater is the market premium over book value (MVE0 – BVE0). Note, however, that abnor-mal earnings usually have a limited life. Other firms become aware of them, enter the marketand compete them away. Third, the present value of expected abnormal earnings is sensitiveto the firm’s cost of capital. A fall in the risk premium that investors demand for investing inequities leads to a fall in the cost of capital for all firms. Some economists attribute the bullmarket of the 1990s and its reversal in the early 2000s to the way changes in expectations aboutcorporate earnings growth and changes in the equity risk premium were mutually reinforcing.
MVE BVENI BVEe
0 01
1 1
( )= +
−+
−
=
∞
∑ t t
et
t
r
r
MVEDIV
e0
1 1
( )=
+=
∞
∑ t
tt r
CFA_C12.qxd 11/6/03 3:09 PM Page 383

384 PART 2 • THE HOUSE OF ACCOUNTING
‘Equity’ in leverage ratios
When calculating financial leverage, investors opt for a broader definition of equity. In additionto ordinary shareholder’s equity, they include other sources of non-repayable capital such as(non-redeemable) preference shares. In the case of a group, ‘equity’ embraces minority interestsas well as those of parent company shareholders. Thus the consolidated debt–equity ratio is usu-ally calculated as follows:
Debt–equity ratio ==
There is disagreement about how to classify equity with debt characteristics. For example, ispreferred stock redeemable at the option of the holder debt or equity? Companies following IASaccount for it as debt. Companies following US GAAP, however, must show such redeemablepreferred stock and other types of ‘quasi-equity’ (also known as ‘temporary equity’) in a separ-ate section – between long-term debt and shareholders’ equity – on the balance sheet. Howmight an investor deal with debt-like equity securities in leverage calculations? A usefulapproach is to check the terms of the contract between issuing company and security holder (thecompany usually provides summary details in the notes to the accounts) and decide on theclassification of each type of security on a case-by-case basis.
Summary
Investors favour the corporate over other forms of business organisation because their liabilityfor an enterprise’s debts is limited and they can transfer their ownership interest more easily.Firms exploit these advantages to raise equity capital more cheaply.
Shares are evidence of ownership of a company. There are various classes of share. Investorswho hold ordinary shares enjoy the greatest potential returns but bear the greatest risk of loss.Ordinary shares carry certain rights, in most cases the rights to participate in the firm’s earningsand to vote. Shares that carry a different set of rights, such as preference shares, offer investors adifferent risk–return prospect.
The shareholders’ equity of a company comprises contributed capital and earned capital.Equity and net assets increase when the firm issues new shares for consideration (increase incontributed capital) or generates profits (increase in earned capital). Both decrease when it buysback and cancels its shares (decrease in contributed capital) or generates losses (decrease inearned capital).
Dividends in cash or in kind are distributions of earned capital and decrease shareholders’equity and net assets. Share dividends, transfers of profit to reserves and capital write-downsalter the composition of shareholders’ equity but not its overall amount.
Companies purchase shares for treasury as a financial investment, to fund employee shareschemes, and as an alternative to paying a cash dividend. Whatever the reason, the accounting isthe same. Shares held in treasury are a deduction from equity and any gains or losses on tradingshould not be recognised on the income statement.
Government grants are not viewed as contributed capital. They are recorded as deferredincome or as a reduction in the cost of the grant-financed asset. Either way, they serve over timeto increase income and thus distributable capital.
Net debt at end-period
Shareholders’ equity(of ordinary and non-redeemable
preference shareholders), end-period
Minority interests,end-period
++
CFA_C12.qxd 11/6/03 3:09 PM Page 384

CHAPTER 12 • SHAREHOLDERS’ EQUITY 385
Until recently, form rather than substance governed the accounting for compound instru-ments such as convertible securities. This is now changing. Under new international rules, com-panies must account for the liability and equity components of such instruments separately.
Investors use ‘equity’ – or ‘book value’ – in profitability, leverage and valuation calculations.They also monitor the change in shareholders’ equity over the year, using the ‘statement ofchanges in equity’ now provided by many companies. Information in this statement allows themto calculate a company’s comprehensive income, a broader measure of performance that incor-porates off-income-statement gains and losses arising in the year.
Problem assignments
P12.1 Accounting for share issue and profit appropriationIn year 5, a group of business school graduates decide to launch a courier service in an unnamed EUcountry. They call their company Iris and its logo shows a pair of winged (and nimble) feet.
Listed below are key events in years 6 and 7 which affect Iris’s shareholders’ equity. (All currencyamounts are in euros.)
1 The company issues 400,000 shares for 15 a share on 2 January year 6. The shares are fully paidin year 6. The par value of a share is 5.
2 The company has a 31 December year-end. At the end of year 6, it reports a net profit of 1 million.This is recorded in a ‘Profit for the year’ account in the year 6 balance sheet.
3 Iris’s shareholders approve the following appropriation of profits in June year 7: – a cash dividend of 1 a share; – a transfer of 10% of profits to a legal reserve, as required by law; – the balance of the year 6 profit to be retained.
4 Iris’s shareholders also approve the declaration of a 10% share dividend in June. The companyaccounts for the dividend by capitalising retained profits at the par value of the shares issued.
Required
(a) Show the effect of the events listed above on the company’s accounts, using journal entries or the balance sheet equation. Specify the shareholders’ equity account(s) affected. If assets orliabilities are affected, assume the entry is to ‘Net assets’.
(b) An investor buys 8,000 Iris shares on 2 January year 6, and is still holding them in June year 7.What journal entries does he make in his own accounts at the time of the above events? Assumehe has a 31 December year-end and accounts for investments at cost. What is the cost per shareof his investment in Iris at the end of June year 7?
Check figure:(a) Share capital, June year 7 2.2 million
P12.2 Reporting changes in share capitalFlySavvy is a low-cost airline based in Europe. Revenues and profits have grown rapidly since itstarted operations in x1. The company has invested heavily in new aircraft as it has expanded its routenetwork. To finance these investments, it has had to raise additional capital from its shareholders andborrow funds from financial institutions. The company launched an initial public offering of its sharesin x3 and made a secondary issue of shares in x4. The shareholders’ equity section of its end-x4 bal-ance sheet is set out below (all amounts, save per-share amounts, are in A000).
CFA_C12.qxd 11/6/03 3:09 PM Page 385

386 PART 2 • THE HOUSE OF ACCOUNTING
Shareholders’ equity At end-x4
Share capital (A0.05 par value ordinary shares,147.1 million issued and outstanding) 7,355
Share premium 297,479Retained earnings 231,084
535,918
Net profit for x4 of 83,586 is included in the retained earnings figure. The company pays no dividendson its shares.
The following events affect FlySavvy’s shareholders’ equity in x5 (again, all amounts are in A000,save per-share amounts):
l The company issues 5.5 million ordinary shares in March x5 at a price of A22.8 a share. Issue costsof 4,213 are charged against the share premium account.
l The company carries out a 2:1 split of its shares in July x5.l It reports net profit for the year of 120,328.
Required
(a) Prepare the shareholders’ equity section of FlySavvy’s x5 balance sheet. What is the number ofissued and outstanding shares at the end of x5?
(b)* Consider the effect of the following additional event in x5. FlySavvy buys back 3 million shares inNovember x5 and holds them in treasury. (The company has a share option scheme for execut-ives and wants to ensure there are sufficient shares available should executives exercise theoptions in x6 when they’re allowed to.) The repurchased shares were issued at an average priceof A7.63 and FlySavvy buys them back at a price of A12.08. Revise the shareholders’ equity sec-tion of the company’s x5 balance sheet prepared in (a). What is the book value per FlySavvy shareat end-x5?
* Part (b) of the assignment draws on material in section 2 of this chapter.
P12.3 Dividends and other appropriations of profit: impact on the accountsRepsol YPF is a large Spanish integrated oil and gas company that has extensive oil and gas holdingsin Argentina. Exhibit 12.5 contains an extract from the note on ‘Stockholders’ equity’ in the English-language version of its 2001 accounts.
Under Spanish corporation law, a company must transfer 10% of its net income each year to alegal reserve until the balance in the reserve reaches at least 20% of capital stock (i.e. share capital).‘Paid-in surplus’ is another term for the share premium account. The column ‘Translation differences’shows the exchange gains or losses that arise from translating the net assets of Repsol YPF’s foreignbusinesses, including its investments in Argentina, into euros.
Repsol YPF paid interim dividends of A232 million (A0.19 per share) in 2000 and A257 million (A0.21 per share) in 2001. Shareholders at the company’s annual general meeting in 2001 approveda supplementary dividend of A378 million (A0.31 per share) for 2000 but the following year acceptedmanagement’s recommendation that none be paid for 2001.
Required
(a) Why didn’t Repsol YPF transfer 10% of 2000 net income to legal reserve in 2001?
(b) Why does the company show an ‘interim dividend’ as a deduction in the shareholders’ equity section of the balance sheet each year?
(c) What was the dividend paid by Repsol YPF to its shareholders in 2001?
(d) What is the company’s dividend pay-out ratio in 2000? in 2001?
(e) With the information Repsol YPF discloses in its 2001 accounts, it is possible to determine thedistribution of its 2001 income in 2002.
CFA_C12.qxd 11/6/03 3:09 PM Page 386

CHAPTER 12 • SHAREHOLDERS’ EQUITY 387
(i) What is the amount the company must transfer to legal reserve in 2002?(ii) What is the expected transfer to voluntary reserves in 2002?
(f ) Why do you think management recommended no supplementary dividend be paid out of the company’s 2001 income?
P12.4 Share splits, share repurchases, and conversion of debentures*PSA Peugeot Citroen is one of Europe’s largest and most successful vehicle manufacturers. Net salesof its manufacturing and sales companies exceeded A50 billion in 2001, earnings per share increasedalmost 28% and the share price bucked the downward trend in world stock markets by rising 18%over the year.
There were a number of transactions and events causing changes to shareholders’ equity in 2001.Unusually, the company’s issued and outstanding shares declined over the year. Extracts from the2001 consolidated accounts relating to shareholders’ equity are set out in Exhibit 12.6.
Required
(a) PSA split its stock in July 2001. A shareholder asks: “Why is there no entry in the accounts torecord the share split? Surely this is a capitalisation of reserves and there should be a transferfrom ‘Capital in excess of par value of stock’ or other reserve to ‘Common stock’.” Explain to theshareholder why ‘Common stock’ has not increased as a result of the share split.
(b) When PSA buys shares for capital reduction purposes, it records the purchase as a deductionfrom equity. (Shares purchased for employee stock option schemes – the other main reason thecompany buys back its shares – are recorded as an asset.)(i) Reconstruct the journal entries the company made in 2001 to record the purchase and
cancellation of shares as part of its capital reduction programme.(ii) Under EU law, the company should transfer distributable reserves to ‘reserve for own shares’
when it buys back shares for cancellation. What is the amount of the transfer to ‘reserves forown shares’ the company should make in 2001 to ensure it preserves its capital? (Althoughthere is no evidence of a transfer in 2001, PSA may have done so. ‘Retained earnings’ includeslegal and statutory reserves.)
Other reserves of
the parent company
Voluntary Reserves of Income
Capital Paid-in Legal and other consolidated Translation for the Interim
stock surplus reserve reserves companies differences period dividend Total
Balance as ofDecember 31, 2000 1,221 6,428 224 1,114 3,397 562 2,429 (232) 15,143
Distribution of 2000 income:Legal reserve – – 20 – – – (20) – –Interim dividend – – – – – – (232) 232 –Supplementary dividend – – – – – – (378) – (378)Voluntary reserves – – – 39 1,760 – (1,799) – –
Translation differences & other – – – – 21 (1,016) – – (995)Net income for the year – – – – – – 1,025 – 1,025Interim dividend – – – – – – – (257) (257)
Balance as ofDecember 31, 2001 1,221 6,428 244 1,153 5,178 (454) 1,025 (257) 14,538
Repsol YPF: Movement in stockholders’ equity in 2001 (in A millions)Exhibit 12.5
(Source: Repsol YPF, Annual Report and Accounts 2001.)
CFA_C12.qxd 11/6/03 3:09 PM Page 387

388 PART 2 • THE HOUSE OF ACCOUNTING
CONSOLIDATED STATEMENT OF STOCKHOLDERS’ EQUITYCapital inexcess of Cumulative
Stockholders’ Common par value Retained Treasury translation(in B millions) equity stock of stock earnings stock adjustment
Balance,as of December 31, 2000 9,361 278 276 9,515 (507) (201)2001 net income 1,691 – – 1,691 – –Dividend (A5 per A6 par
value share) (217) – – (217) – –Issuance of shares 109 4 105 – – –Purchases of treasury stock (458) – – – (458) –Cancellations of treasury stock – (23) (381) (510) 914 –Translation adjustment (204) – – – – (204)Balance, as of December 31, 2001 10,282 259 – 10,479 (51) (405)
Note 29 – Stockholders’ equity (extracts). Common stock, capital in excess of par value of stock.
a – Common stockAs of December 31, 2001, the Company’s capital stock amounted to A259,109,146, represented by common shares with a par value of A1 (note 29-c), all fully paid. The shares may be held in bearer orregistered form, at the choice of stockholders. Shares registered in the name of the same holder for at leastfour years carry double voting rights (article 38 of the bylaws).
b – Changes in the number of shares issued and outstanding(in euros) 2001
As of January 1 278,223,630Cancelled shares (23,450,000)Shares issued on conversion of debentures 4,335,516As of December 31 259,109,146
c – 2001 stock splitOn July 2, 2001, existing A6 par value shares were exchanged for new A1 par value shares, on a six-for-onebasis. This stock split was authorized by stockholders at the Extraordinary Meeting of May 16, 2001.
e – Capital reductionOn November 23, 2001, the Company cancelled 23,450,000 new A1 par value shares under a stockholder-approved program. . . . The difference between the cost of the shares and their par value was chargedagainst ‘Capital in excess of par value of stock’ in the amount of A381 million . . . and against ‘Retainedearnings’ for A510 million.
j – Treasury stockEffective from December 31, 1999, treasury stock corresponds to the cost of all the Peugeot S.A. sharespurchased on the open market, net of cancelled shares and shares held for allocation on exercise ofmanagement and employee stock options which are reported under ‘Short-term investments’ (in the balance sheet).
Share and shareholder data: supplementary information
Buyback and cancellation of sharesThe share buyback program launched in 1999 was actively pursued in 2001 when a net total of 10,424,509Peugeot SA shares were bought back at an average price of A46.40. Under the authorization granted at theAnnual Stockholders’ meeting on May 16, 2001, 23,450,000 shares representing 8.3% of shares outstanding,were cancelled as of November 23, 2001. . . At December 31, 2001, the Company held 2,994,287 of itsshares in treasury, of which 1,940,100 were allocated to stock option plans.
PSA Peugeot Citroën: extracts from accounts on stockholders’ equity, 2001Exhibit 12.6
(Source: PSA Peugeot Citroën, Annual Report and Accounts 2001. Reproduced by permission of PSA Peugeot Citroën).
CFA_C12.qxd 11/6/03 3:09 PM Page 388

(c) Holders of PSA convertible debentures converted most of the debentures to shares in 2001. Thecompany gives details of its convertible debentures in note 34 of the accounts:
“In March 1994, Peugeot S.A. issued convertible debentures for a total of A604 million. The four mil-lion debentures were issued at a price of A150.92 and were convertible at any time on the basis ofone share per debenture.
The debentures matured on January 1, 2001. Of the 747,329 debentures outstanding as ofDecember 31, 2000, 722,586 were converted into shares and 24,743 were redeemed for cash.”
According to the 2000 consolidated balance sheet, the carrying amount of the convertible deben-tures outstanding at end-2000 was A113 million. The company classifies the convertibles asstraight debt in its accounts.(i) How many shares were issued in 2001 on conversion of the debentures?(ii) Reconstruct the journal entries the company made in 2001 to record the conversion and
redemption of debentures.
* Assignment draws on material in section 2 of this chapter.
P12.5 Accounting for share repurchase and cancellation*Iris Company started a courier service in year 5 (see P12.1). Following a reappraisal of the company’sinvestment opportunities in year 9, management decide to return some of its capital to the owners.After obtaining shareholder approval, they buy back 50,000 shares at a price of A19 a share and cancel them.
Assume the cost of the shares bought back is A13.6 a share. Iris’s shareholders’ equity just beforethe share repurchase stands at A7.7 million. It consists of 440,000 issued ordinary shares (with a parvalue of A5/share), share premium of A4 million and retained profits of A1.5 million.
Required
Show the effect of the share repurchase and cancellation on Iris’s year 9 accounts, using journalentries or the balance sheet equation. Assume the company establishes a non-distributable reserve,‘Reserve for own shares’, in order to maintain its permanent capital.
* Assignment draws on material in section 2 of this chapter.
P12.6 Accounting for convertible securities*Suizo-Hispania, a designer and builder of luxury automobiles, issues at par 15 million of 3% ten-yearconvertible bonds at the start of year 7. (All currency amounts are in euros.) Holders can convert each1,000 bond into 250 Suizo-Hispania ordinary shares (of 1 par value) from year 9. The company wouldhave had to offer investors an 8% yield if it had issued debt without the conversion option.
Required
(a) How does Suizo-Hispania (S-H) record the issue of bonds in year 7, assuming:(i) it accounts for them as debt only?(ii) it recognises the equity component of the securities separately?
Use journal entries or the balance sheet equation. Ignore issuance costs. Assume the residualvalue approach is used to measure the equity component of the securities.
(b) What is the interest expense Suizo-Hispania records in year 7 under assumption (a) (i)? underassumption (a) (ii)? The company has a calendar financial year and a full year’s interest is chargedin year 7. The company uses the interest method to determine interest expense under (a) (ii).
(c) Bondholders convert all the bonds to ordinary shares at the start of year 9. The market price ofan ordinary S-H share then is 5. How does S-H record the issue of ordinary shares in exchangefor bonds, assuming that on issue of the bonds in year 7:
CHAPTER 12 • SHAREHOLDERS’ EQUITY 389
CFA_C12.qxd 11/6/03 3:09 PM Page 389

390 PART 2 • THE HOUSE OF ACCOUNTING
(i) it accounts for them as debt? (ii) it recognises the equity component of the securities separately?
Check figure: (a) (ii) Equity component 5.03 million
* Assignment draws on material in section 2 of this chapter.
P12.7 Capital provided by risk- and revenue-sharing partnerships:accounting issuesRolls Royce, the UK aero-engine maker, was criticised for some of its accounting policies in 2002. Onearea of controversy was its treatment of risk- and revenue-sharing partnerships (RRSPs). These aredesigned to help the company fund development of new jet engines, which are often costly and riskyinvestments. Management explain in the notes to the 2001 accounts how the group accounts for them.
Risk- and revenue-sharing partnerships. From time to time the Group enters into arrangements with part-ners who, in return for a share in future programme turnover or profit, make cash or other payments inkind which are not expected to be refundable. Sums received are credited to other operating income andpayments to partners are charged to cost of sales.
Many analysts challenge this accounting treatment. They argue that an RRSP is a source of financ-ing and should be accounted for as such on the balance sheet. Some think it is equity capital; othersclaim it is a loan.
Rolls Royce’s management disagree. They maintain it has none of the features of a loan. ‘Is itrepayable? No. Does it accrue interest? No. It has no attributes of a loan, which is why it is not treatedas a loan,’ says Paul Heiden, the company’s then finance director.
RRSPs had a significant impact on Rolls Royce’s 2001 results. The group reported sales of £6,328million (A10,206 million) and pre-tax profit (excluding exceptional items) of £422 million that year. Thepre-tax profit figure was struck after crediting £126 million for RRSPs:
£mRRSPs – receipts (credited to ‘other operating income’) 239
– payments (charged to ‘cost of sales’) (113)Net impact of RRSPs on pre-tax profit 126
Required
Comment on the way Rolls Royce accounts for its RRSPs. Explain why its accounting treatment is –or is not – correct, in your view. If you disagree with the company’s treatment, outline the way youthink it should account for the RRSPs.
P12.8 Unusual types of security: debt or equity?Some companies issue unusual types of security that are difficult to classify as either debt or equity.Details of three such issues are given below. They are taken from the notes to the 2001 accounts ofcertain large international companies.
(1) Redeemable preference shares of a subsidiary company
On 30 March 2001, a wholly owned subsidiary of Company A issued perpetual, cumulative, non-voting preference shares for a total amount of A205 million.
The preference shares have no voting rights. They are not redeemable, except at the exclusiveoption of the issuer, in whole but not in part, on or after the fifth anniversary of the issue date or atany time in case of certain limited specific pre-identified events including changes in taxation laws.Should redemption occur, the redemption price would be equal to the par value together with divid-ends accrued, but not yet paid.
CFA_C12.qxd 11/6/03 3:09 PM Page 390

CHAPTER 12 • SHAREHOLDERS’ EQUITY 391
From the issue date to the fifth anniversary of the issue date the preference shares will carry a dividend based on a variable 6-month Euribor rate. Beyond the fifth anniversary, the dividend rate will increase by an additional 2% per annum, in line with market conditions for such instruments.
The dividends are payable semi-annually from the issue date. The preference shareholders willbenefit from a limited Company A guarantee covering the subsidiary’s obligations under its shares.
(2) Undated subordinated notes
Company B issued, on 29 Septem illion Auction Rate Coupon Undated Subordinated Notes. Thesenotes may be redeemed at the option of the issuer except in certain exceptional circumstances,including any failure to pay interest when due, when they may be redeemed at the option of their hold-ers. They rank pari passu (i.e. equally) with holders of other subordinated indebtedness. Interest ispayable semi-annually, at variable rates based on Euribor. The payment of accrued interest may besuspended if both of the following conditions are satisfied:
(i) the annual non-consolidated accounts of Company B show an absence of income available fordistribution;
(ii) the annual consolidated accounts of Company B show that the consolidated net income availablefor distribution to common shareholders is less than or equal to zero.
(3) Non-voting participating securities
Company C issued 100,000 non-voting participating securities in ecus in 1984. The non-voting par-ticipating securities are not redeemable. Their remuneration is included in financial charges. Thesesecurities were converted into euros in 1999.
Each security carried a coupon that gave the holder the right to subscribe to a new non-voting par-ticipating security until February 1987. There were 94,633 securities resulting from the exercise of thecoupons.
The remuneration of the 194,633 non-voting participating securities comprises a fixed interest ele-ment of 60% of the nominal value of the security and equal to 7.5% per annum and a variable amounton the remaining 40% based on the consolidated net income of the previous year within the limitsfixed in the prospectus.
Required
Consider each of the above issues of securities. How should the issuing company present the secur-ities in its accounts under IAS? Give reasons for your decision.
Notes to Chapter 12
1 Other forms of business organisation may be available. For example, in some countries investors canstructure the business as a hybrid of partnership and company. Examples are the German GmbH &Co. and the US limited liability company (LLC). These are partnerships for tax purposes but some(GmbH & Co.) or all (LLC) of the members enjoy limited liability.
2 The term ‘public’ is used in its legal sense here. It signifies a company of a certain size which meetsEU legal requirements for that designation. However, investors also use the term to describe com-panies whose shares are listed on a stock exchange. We refer to these as quoted companies.
3 Evidence of ownership can take different forms. In the case of registered shares, the company knowswho the owners are, since it (or its representative) maintains a register of shareholders and sharehold-ings. In the case of bearer shares, the share certificate itself is the only evidence of ownership. Onlypublic companies – and, even then, in some but not all EU member states – can issue bearer shares.
4 In some jurisdictions in Europe and the USA, companies are allowed to issue shares without a par value.5 In some countries, there’s a two-stage approval process. A company’s statutes specify the shares it is
authorised to issue. Its issued share capital is usually less than its authorised capital. Shareholdersapprove, by simple majority, a proposal of the directors to increase the number of shares issued – upto the authorised level. Any increase beyond the authorised level requires further shareholder
CFA_C12.qxd 11/6/03 3:09 PM Page 391

392 PART 2 • THE HOUSE OF ACCOUNTING
approval, this time by super-majority vote, to amend the firm’s statutes and set a new limit on author-ised share capital.
6 Note that firms are not required to distribute earnings. Shareholders may decide in general meetingthat, because of the high returns available from investments within the firm, all profits should be reinvested.
7 Many companies in northern Europe have a management board and a supervisory board. In this case,shareholders (and employees) elect members to the supervisory board which in turn appoints and maydismiss members of the management board.
8 This is not the only example of a shareholder right that is available in some countries but not in others. For other examples, see Box 7.1 ‘Legal tradition, investor protection and company financing’in Chapter 7.
9 La Porta, R., Lopez-de-Silanes, F. and Shleifer, A. (1999), Corporate ownership around the world,Journal of Finance, 54: 471–517. Another method of maintaining control available in some countriesis to use a special legal vehicle, the ‘partnership limited by shares’ (KGaA in Germany; SCA in France).This is a quoted company with a separate legal personality. The majority of its shareholders have limited liability (they are, in effect, limited partners) but there is at least one that has unlimited liabil-ity and management control (the general partner). Family-controlled firms such as Henkel and Merckin Germany and Michelin in France use this legal structure.
10 La Porta et al., op. cit., tables II, III and IV.11 The payment of dividends and the transfer of profits to reserves are examples of ‘profit appropriation’,
the setting aside of profits for a particular purpose.12 Should a company issue ‘no par value’ shares, it will credit the whole proceeds of the issue to ‘Share
capital’. In some jurisdictions, however, the company may assign an ‘accounting value’ to the no parvalue shares, in which case the entry is as shown.
13 Practice is different in some countries. UK and Irish firms show ‘called-up capital’ on the balancesheet. They disclose subscribed capital not yet called in the notes to the accounts. US firms show ‘sub-scriptions receivable’ as a deduction within shareholders’ equity rather than as an asset.
14 Companies face other legal hurdles preventing them from depleting assets through ‘excessive’ profitdistributions. For example, the EU’s 2nd Directive requires firms to transfer from retained profits to anon-distributable reserve the effect of accrual adjustments which increase profits but not cash (e.g.capitalisation of R&D costs). The non-distributable reserve is reduced as these adjustments reverse(e.g. through amortisation).
15 Under US GAAP, the term ‘share dividend’ can strictly only be used where the shares issued as a resultof the dividend amount to 25% or less of the shares previously outstanding. A distribution larger thanthis is considered to be, in effect, a share split since management’s intent is to reduce the market priceper share – the same rationale as for a share split. (In fact, US companies refer to a large share divid-end as a ‘stock split effected in the form of a stock dividend’.) US companies account for large sharedividends by capitalising retained profits or share premium at par, not fair value.
16 Be careful of the phrase ‘x for y’ when applied to share issues. We have used it here in the sense of ‘inexchange for’. However, it can also be used in the sense of ‘in addition to’. In a 1:1 share split, one newshare is issued in exchange for one old. In a 1:1 (or 100%) share dividend, an additional share is dis-tributed for every one share held.
17 International Accounting Standards Board, IAS 32: Disclosure and Presentation, para. 5. An equityinstrument is defined in the same paragraph as ‘any contract that evidences a residual interest in theassets of an enterprise after deducting all of its liabilities’.
18 Standing Interpretations Committee [of the IASC], SIC 17: Equity – Costs of an Equity Transaction,para. 6.
19 International Accounting Standards Board, IAS 10: Events After the Balance Sheet Date, paras 11 and 12.20 This condition need not apply if shares are purchased for an employee share ownership scheme or to
‘prevent serious and imminent harm to the company’ (2nd Directive, Art. 19).21 Standing Interpretations Committee [of the IASC], SIC 16: Share Capital – Reacquired Own Equity
Instruments (Treasury Shares), paras 4 and 5.22 For a fuller discussion of these ideas, see Jen, F.C., Choi, D. and Lee, S.-H. (1997), Some new evidence
on why companies use convertible bonds, Journal of Applied Corporate Finance, Spring, pp. 44–53.
CFA_C12.qxd 11/6/03 3:09 PM Page 392

23 International Accounting Standards Board, IAS 20: Accounting for Government Grants and Disclosureof Government Assistance.
24 International Accounting Standards Board, IAS 1: Presentation of Financial Statements.25 For an extensive discussion of the model and a comparison with other methods of valuing companies,
see Palepu, K.G., Healy, P.M. and Bernard, V.L. (2000), Business Analysis and Valuation, 2nd edition,South-Western College Publishing, chapter 11.
CHAPTER 12 • SHAREHOLDERS’ EQUITY 393
CFA_C12.qxd 11/6/03 3:09 PM Page 393

Financial investments
INTRODUCTIONCompanies as well as individuals can be investors. They buy and sell debt and equity securities issued by other companies and governments. These areprimary financial instruments. They also invest in secondary (or derivative)instruments such as options or futures. They may acquire non-financial assets– commodities, real estate, works of art – for investment purposes. In thischapter and the next we focus on the accounting for and reporting of financialinvestments.
The way a company accounts for a financial investment depends in part onmanagement’s reasons for acquiring it. Thus investments in debt securitiespurchased for trading purposes are valued differently from those that manage-ment plan to hold to maturity. In addition, the method of accounting for long-term equity investments depends on the power the investor company canexert over the investee’s operating and financing decisions. Investments in debtsecurities, (passive) investments in equity securities and derivatives are thesubject matter of this chapter. We discuss the accounting for long-term equityinvestments where the investor has influence or control in Chapter 14.
The accounting for financial investments is changing. New internationalrules require companies to value them at fair value. Traditionally, companiesmeasured them at cost or LOCOM. We focus on the new approach in thischapter, illustrating how fair value accounting is applied and explaining why it has found favour with investors and regulators alike. We also look at the way derivatives are accounted for. Derivatives are widely used as a means of hedging against adverse price or cash flow movements and we show howcompanies account for both hedging instruments (e.g. derivatives) and itemsbeing hedged (e.g. existing financial assets and liabilities or expected futuretransactions) under new IAS.
In the final section we discover what information investors can glean abouta firm’s financial investments from the annual accounts and how they use it toanalyse the returns from the investments and their risk.
1313
l Types of investment
l Recognition andmeasurement
l Fair value accountingunder IAS
l Derivatives andhedge accounting
l Disclosure andanalysis of financialinvestments
In this chapter
CFA_C13.qxd 11/6/03 3:12 PM Page 394

CHAPTER 13 • FINANCIAL INVESTMENTS 395
Types of financial investment
Companies’ financial investments take many forms. Companies buy other firms’ bonds, sharesand short-term securities such as commercial paper. They purchase derivative instruments suchas futures and options. They also invest in government securities – from treasury bills to long-term government debt. They make loans to other firms: companies within a group do this, aswell as banks.
l Reasons for investing in financial assets
Why does a company make such investments? One obvious reason is that the expected return ishigh relative to the risk assumed. But there may be other considerations and these affect the typeof investment made.
1 Cash management. A company usually invests cash that is surplus to its operating require-ments in the short-term debt of governments (treasury bills) or companies (commercialpaper) or in funds which invest in such securities (money market funds). It may invest suchcash in a portfolio of actively traded equity securities, too. It chooses these investmentsbecause they are highly liquid and involve small price risk.1
The amount of these investments can be large. For example, a company may raise long-term capital through a debt or equity issue just before the balance sheet date but not spendthe cash on the purchase of long-term assets until after it. Sometimes a company purposelycarries large cash balances. Acquisition-hungry companies maintain high levels of liquidassets – to buy target firms on advantageous terms – if they find it costly to raise external capital quickly.
2 Business strategy. Often a company acquires a shareholding in another for strategic reasons.For example, it may want to gain access to new technology. The shareholding may be defen-sive – to prevent the investee’s takeover by another. Or the investment could be in the nature of an option – giving the firm the opportunity to enlarge its stake at a later date if the initialinvestment proves worthwhile. The investments by some pharmaceutical giants in smallbiotechnology start-ups can be viewed in this way.
In all the above cases, the shareholding in percentage terms is likely to be small. Theinvestor has a voice in the investee’s affairs but no power. Power, from an investment per-spective, is usually correlated with the size of a shareholding. A company acquires a large stakein another as a means of exercising influence or control over it.
3 Risk protection. A company may acquire a financial asset as a hedge. It wishes to protect itself against adverse movements in asset prices or cash flows. For example, it buys a putoption (the right to sell at a specified price) on a shareholding to hedge against a decline in the share’s market price. An exporter enters into a forward exchange contract to limit losses arising from the appreciation of its home currency. A firm that borrows funds at a floating rate signs a swap agreement to cap its interest charges: under the swap it receivesinterest at a floating rate but pays interest at a fixed rate. Note that in this case it acquires afinancial asset (a stream of variable receipts) and incurs a financial liability (a stream of fixedpayments).
4 Funding of liabilities. Companies set aside cash – and invest it – to meet future liabilities. For example, a firm may establish a sinking fund in order to repay the principal of a loanwhen it matures. A company that offers a defined benefit pension scheme to its employeesinvests cash – internally or via a separate pension fund – to meet future pension payments to retirees.
CFA_C13.qxd 11/6/03 3:12 PM Page 395

396 PART 2 • THE HOUSE OF ACCOUNTING
l Balance sheet presentationFinancial statement users can often deduce the reason for a financial investment by the way it ispresented on the balance sheet. Investments which are held for trading purposes or which man-agement expect to realise within the year are shown as current assets. Those which managementplan to hold to maturity (debt securities) or for more than one year are shown as financial fixedassets. Thus investments which are strategic in nature are usually classified as long-term; thosewhich serve a cash management role are classified as current.
Users can also learn more about the nature of the company’s equity investments from theirdescription on the balance sheet. Various types of equity investment are illustrated in a partialbalance sheet in Exhibit 13.1. Note that this is company X’s individual balance sheet, not the con-solidated balance sheet of the X group.
It’s helpful to know the terms used to describe the various types of equity investment. Wherecompany X has a large minority stake in another, C, and participates in its management, it has a‘participating interest’ in C. C is an associate (or associated company) of X. Where X has amajority stake in another, B, and controls its operations, X is B’s parent company and B is X’ssubsidiary (or affiliate).
Equity investments: description and balance sheet presentationExhibit 13.1
Fixed assetsTangible and intangibleFinancial
Investment in subsidiary BInvestment in associate COther long-term investments
Current assetsInventoriesAccounts receivableShort-term investmentsCash
Total assets
XX
XXXX
XXXXXXXXXX
XX
XXXXXX
X COMPANYBalance sheet (part)at 31 December ×1
SubsidiaryB
AssociateC
D, E, F
A
Short-termholding in . . .
Long-termholdings in . . .
X COMPANY
FactsX Company holds an equity holding in A which it plans to sell within thenext year. It holds 60% of B’s shares and 25% of C’s. It has minor stakes inD, E and F. These are all long-term holdings.
CFA_C13.qxd 11/6/03 3:12 PM Page 396

Exhibit 13.1 can be adapted to cover non-equity investments. ‘Other long-term investments’include investments in debt securities which the company plans to hold to maturity and otherassets (e.g. real estate, works of art) held for investment purposes. All investments which are heldfor trading purposes and/or have a short life are ‘short-term investments’.
Recognition and measurement
The accounting for financial investments is in transition. The major change concerns their measurement. Companies following IAS must now value many of their investments in debt andequity securities and derivative instruments at fair value. Traditional methods of valuation –namely, the cost method and the lower of cost or market (LOCOM) method – are outlawed(LOCOM) or can be used in limited circumstances only (cost). US GAAP impose similarrequirements on US companies. The European Commission introduced a fair value directive in2001 amending the main accounting directives (4th and 7th) to permit EU companies to recordcertain investments at fair value. However, outside North America, cost and LOCOM continueto be widely used. (Listed EU companies are not required to adopt IAS until 2005.) In our dis-cussion of financial investments, we outline all the main valuation methods now in use – cost,LOCOM, fair value – but place special emphasis on the fair value method.
l Recognition and initial measurementRecognition of financial investments poses few problems. A company usually records an invest-ment on its balance sheet on acquisition, that is, when it acquires legal title to the asset.2 Thestandard criteria for recognising assets are met at this point: the risks and rewards of ownershiphave passed to the company and the cost or fair value of the asset can be measured reliably.
Where an investor company acquires a compound financial instrument (i.e. an investment con-taining an embedded derivative), IAS require the derivative and the host contract to be recognisedand measured separately. Thus a company that buys another firm’s convertible securities as aninvestment should account for the two components – the straight debt element and the conver-sion option – as separate investments. However, it can account for the compound instrument asone investment if (a) the two components share similar economic characteristics and (b) eachwould be accounted for in the same way (i.e. at fair value and changes in fair value taken toincome) if separated.
Companies record investments initially at cost.3 This holds under both traditional and new approaches to investment accounting. ‘Cost’ includes transaction costs, such as purchasecommissions. In addition, certain adjustments may have to be made. For example, a companyacquiring debt securities must show separately any unpaid interest that has accrued up to thedate of purchase. Assume Grandet Company buys, at par, 40 million of 7% French governmentbonds on 1 October x1. Assume the government pays interest on these bonds annually on 30 June.Thus the price Grandet pays for the bonds is 40.7 million. It records the accrued interest of700,000 (40 million × 7% × 3/12) separately as a receivable (amounts shown are in millions):
Investment in bonds with accrued interestDr. Investment in 7% bonds (A+) 40.0Dr. Accrued interest receivable (A+) 0.7
Cr. Cash (A−) 40.7
Similarly, a company making an equity investment should record separately, as dividendreceivable, any distributions by the investee from its pre-acquisition profits. In each case, theaccrued interest or dividend is an adjustment to the investment’s cost and should not be
CHAPTER 13 • FINANCIAL INVESTMENTS 397
CFA_C13.qxd 11/6/03 3:12 PM Page 397

398 PART 2 • THE HOUSE OF ACCOUNTING
reported as income by the investor. Thus, assuming Grandet has a 30 June year-end, it recordsthe interest of 2.8 million received on 30 June x2 as follows:
Payment of first-period’s interestDr. Cash (A+) 2.8
Cr. Accrued interest receivable (A−) 0.7Cr. Interest income (OE+) 2.1
(40 million × 7% × 9/12)
Grandet recognises interest income for only the nine months to end-June x2 that it holds the bonds.
l Measurement subsequent to acquisitionHow are financial investments measured after acquisition? Here the accounting becomes morecomplicated. There are several ways of valuing an investment. From Exhibit 13.2 we see that thevaluation method depends partly on management’s intentions when the investment wasacquired (e.g. to hold it for trading or for other purposes) and partly on the nature of the invest-ment (e.g. size of shareholding, in case of equity investments).
We consider below the accounting for small equity shareholdings and investments in debtsecurities. (We discuss methods of accounting for large equity stakes in other companies inChapter 14.) We outline the traditional cost-based approach to valuing these investments andthen explain and illustrate the new fair value-based approach.
Financial investments: principal valuation/accounting methods*Exhibit 13.2
Traditional cost-based approachUntil recently, most companies in Europe and elsewhere accounted for short-term investmentsat LOCOM and long-term investments at cost. The main features of the two valuation methodsare summarised below.
CFA_C13.qxd 11/6/03 3:12 PM Page 398

CHAPTER 13 • FINANCIAL INVESTMENTS 399
l Cost. Under the cost method, the investor company carries the asset at cost throughout theholding period. It recognises interest income as it accrues and dividend income on receipt.Changes in the asset’s market value are generally not recognised until disposal. Only if theasset is impaired does the investor company write it down to its lower recoverable amount.When the company sells the asset, it recognises the difference between the net proceedsfrom sale and the asset’s carrying amount (cost or lower recoverable amount) as a realisedgain or loss.
l LOCOM (lower of cost of market). Under the LOCOM method, the investor company carries the asset at cost – or market value if lower. Where market value is below cost, thecompany writes down the asset and recognises a loss for the amount of the write-down.
Dr. Loss from decline in market value of investment (OE−) xxxCr. Investment in ABC Company (A−) xxx
Should the asset’s market value recover in a later period, the company recognises as a gainthe recovery of the asset’s value – but only up to its cost.
Dr. Investment in ABC Company (A+) xxxCr. Gain from recovery in market value of investment (OE+) xxx
The LOCOM rule may be applied on an individual investment or a portfolio basis. In the lattercase, a loss is recognised only when the portfolio’s market value is less than its cost. The carry-ing amount of the portfolio is adjusted through a valuation allowance (similar to that usedfor inventory write-downs): the individual investments themselves are still carried at cost.
In other respects, the accounting is similar to that under the cost method. The investor company accrues interest income but recognises dividend income on receipt. On the saleof the asset, it records as a gain or loss the difference between the net proceeds from saleand the asset’s carrying amount.
What is the rationale for these two valuation methods? Consider the cost method first.Supporters argue that an investor company – and by extension, its owners – want to know thereturn generated by an asset or set of assets. In the case of an equity investment held for the long-term, the return will be mainly in the form of dividends. Where a debt investment is heldto maturity, the return will consist of interest. Given the expected holding period, changes in the market value of the investment from one period to the next are of little economic interest to the investor company or its shareholders, it’s claimed.
Advocates of LOCOM point to weaknesses in the cost method. Investments are overstatedwhen market value is below cost. LOCOM provides a prudent basis for valuation: declines inmarket value are recognised, but increases (above cost) aren’t. Moreover, it deters managementfrom gambling with company assets. Managers who are not required to reveal unrealised lossesmay be tempted to make risky investments in the hope of generating offsetting gains. Such invest-ments may result in yet larger losses. This was the experience of some Japanese companies in theearly 1990s. LOCOM forces management to disclose – and account for – all unrealised losses.
New fair value-based approachUnder the fair value method, the investor company carries the investment on the balance sheetat end-of-period market value. It recognises in income any change in the asset’s market valuethat arises in the period. Interest and dividend income – and realised gains and losses – areaccounted for in the same way as they are under the cost and LOCOM methods.
Fair value accounting is often described in the financial press as ‘mark-to-market’ account-ing. The fair value of an investment traded in an active market is clearly its quoted market price.
CFA_C13.qxd 11/6/03 3:12 PM Page 399

400 PART 2 • THE HOUSE OF ACCOUNTING
Where an active market does not exist – as in the case of unquoted securities, fair value is estim-ated using accepted valuation techniques (e.g. discounting of future cash flows).
Accounting for financial investments at fair value is not new. It has long been popular in partsof the financial sector (e.g. mutual funds). What is new is the growing demand from the invest-ment community that all companies should account for financial investments in this way. Whyis this? What are the merits of fair value accounting for this class of asset? Supporters point to its informational benefits. Most of the expected return on short-term investments takes the form of capital gain. For this reason, investors want to know the changes in the market value ofsuch investments from period to period. The market values of long-term investments are also ofinterest: investors can determine the opportunity cost to the company of retaining the investments(i.e. the benefit forgone by not selling them.)
Companies can provide these informational benefits by disclosing the fair values of invest-ments in the notes to the accounts. Why require companies to recognise fair values in theiraccounts? Supporters make the following argument in defence of recognition. By having toinclude unrealised gains and losses in income, management have less scope to manipulate cor-porate profits. Under the cost and LOCOM methods, a gain is shown in the income statementonly when an investment is sold. (Under the cost method, most losses are recognised only thentoo.) As a result, management can alter reported profit by delaying or bringing forward the saleof an investment whose market value is greater than its cost. Under fair value accounting, man-agement cannot do this: all changes in value are recognised as they occur.
This argument has added force owing to stock market developments in recent years. The world’sstock markets have grown in size and depth. Market capitalisation soared from US$9.4 trillionin 1990 to US$36 trillion in 1999, a 280% increase. (World GDP grew 34% in the same period.)The markets are also broader and more liquid. There are now many more quoted securities andthey are traded in more active markets. For example, the number of listed companies on the world’sstock markets almost doubled in the 1990s – from 25,400 in 1990 to 49,600 in 1999. Value tradedincreased, too – from US$5.5 trillion in 1990 to US$31 trillion in 1999.4 As a result, informationabout the current values of many financial investments is easier to obtain and more reliable.
Fair value accounting under IAS
l General framework
Current IAS do not insist on full fair value accounting for all financial investments.5 Companiesfollowing IAS must classify investments into one of three categories and account for them as follows:
1 Held-to-maturity (HTM) investments. These are investments in debt securities that the investorcompany has the ‘positive intent and ability’ to hold to maturity. HTM investments must beaccounted for at amortised cost.
2 Held-for-trading (HFT) investments. These are investments that the investor company design-ates as such on acquisition. They can be debt or equity securities and are usually held for theshort-term. HFT investments must be accounted for at fair value; all changes in fair value shouldbe recognised in income.
3 Available-for-sale (AFS) investments. All other financial investments are described as AFSinvestments. They can be investments in debt or equity securities and presented as either current or non-current assets, depending on the expected holding period. AFS investments areaccounted for at fair value; changes in fair value are recognised directly in shareholders’ equity inthe balance sheet. Unrealised gains and losses are transferred to the income statement when aninvestment is sold (or if it’s impaired).
CFA_C13.qxd 11/6/03 3:12 PM Page 400

Thus IAS require the investor company to measure all financial investments at fair value with theexception of HTM investments. If fair value cannot be reliably determined (i.e. there is no activemarket from which to obtain a quoted price and it is not feasible to estimate fair value in other ways),then IAS require that the investment be measured at cost (at amortised cost if it has a fixed maturity).
l IllustrationHow a company classifies an investment – as HTM, HFT or AFS – can have a significant impacton its accounts. We use a simple example to illustrate this. Rosaura’s company designs andmakes family games: her most successful product is the board game Battle of the Sexes. With thegrowing integration of national markets in Europe, she decides to invest in other EU countries.At start-x3, her company buys small equity stakes in Castiglia and Runebif, quoted Spanish andUK companies respectively, and invests in the debt securities of Lebleu and Bosco Nero, a Frenchand an Italian company. Acquisition prices and end-x3 fair values of the four investments are setout below. All currency amounts are in euros. Note that the effective interest rate on the Lebleuand Bosco Nero securities is 6% at the date of acquisition in x3. (Transaction costs are ignored.)
Face or nominal Acquisition price Amortised costCategory and investment value (in x3) at end-x3
Held-to-maturity investmentBosco Nero 5% bonds, due end-x7 400,000 383,157 386,146
Fair valueat end-x3
Held-for-trading investmentCastiglia ordinary shares, A5 par 75,000 126,000 140,000
Available-for-sale investmentsLebleu 8% bonds, due end-x15 200,000 235,400 215,880Runebif ordinary shares, A2.50 par 125,000 300,000 311,000
Rosaura accounts for the investment in Bosco Nero bonds as a held-to-maturity investment. She views the small equity stake in Castiglia as a speculative investment – the shares were under-valued at start-x3 in her view – and accounts for it as a held-for-trading investment. The othertwo investments are classified as available-for-sale investments: Rosaura considers both to belong-term investments but does not plan to hold the Lebleu bonds to maturity.
The accounting entries Rosaura makes in x3 with regard to these four investments areexplained below.
Bosco Nero bonds: held-to-maturity investment
Rosaura acquires the 400 Bosco Nero bonds for cash.
Start-x3: Dr. Investment in Bosco Nero 5% bonds (A+) 383,157Cr. Cash (A−) 383,157
Bosco Nero pays interest on the bonds annually at the end of December so there is no accruedinterest in the purchase price. The bonds purchased have a face value of a400,000. Rosaura mustamortise the discount of a16,843 at the purchase date over the remaining five years of the bonds’life, using the interest method. Rosaura records interest income of a22,989 in x3: this is based onan effective interest rate of 6% at the start of x3 when the bonds were purchased and includesa2,989 of amortised discount. (Note that the creditor’s accounting for investments in fixed-rate
CHAPTER 13 • FINANCIAL INVESTMENTS 401
CFA_C13.qxd 11/6/03 3:12 PM Page 401

bonds mirrors that used by the debtor to account for fixed-rate liabilities – and which wedescribed in Chapter 11.)
During x3: Dr. Accrued interest receivable [5% × A400,000] (A+) 20,000Dr. Investment in Bosco Nero 5% bonds (A+) 2,989
Cr. Interest income [6% × A383,157] (OE+) 22,989
End-x3: Dr. Cash (A+) 20,000Cr. Accrued interest receivable (A−) 20,000
The carrying amount of the bonds in Rosaura’s balance sheet at the end of x3 is a386,146. Themarket value of the bonds is only a372,900 because the market interest rate on these bonds was7% at year-end. However, the bonds are not written down to this lower value because theincrease in interest rates does not indicate an impairment of the investment.
Castiglia ordinary shares: held-for-trading investmentRosaura’s Castiglia investment (15,000 ordinary shares) is also acquired for cash.
Start-x3: Dr. Investment in Castiglia ordinary shares (A+) 126,000Cr. Cash (A−) 126,000
Castiglia does not pay a dividend in x3. The shares increase in value during the year. At year-end,Rosaura revalues the investment and recognises the unrealised holding gain in income. (Weassume Rosaura’s company prepares annual financial statements only. If it prepares accountsevery six or even every three months, it will record the change in value of AFS (and HFT) invest-ments half-yearly or quarterly.)
End-x3: Dr. Investment in Castiglia ordinary shares (A+) 14,000Cr. Unrealised holding gain in income (OE+) 14,000
Rosaura carries the investment in the end-x3 balance sheet at a140,000. The a14,000 unrealisedgain is shown on the income statement under ‘Financial income’.
Lebleu bonds and Runebif ordinary shares: available-for-sale investmentsAs with her other investments, Rosaura pays for the 200 Lebleu bonds and 50,000 Runebif ordinary shares with cash.
Start-x3: Dr. Investment in Lebleu 8% bonds (A+) 235,400Dr. Investment in Runebif ordinary shares (A+) 300,000
Cr. Cash (A−) 535,400
Runebif declares and pays a dividend of 18 cents a share in June x3. Interest on Lebleu’s 8%bonds is paid at the end of the year. Rosaura records dividend income when received but accruesinterest income as it’s earned over the year.
June x3: Dr. Cash (A+) 9,000Cr. Dividend income [18¢ × 50,000 shares] (OE+) 9,000
During x3: Dr. Accrued interest receivable (A+) 16,000Cr. Interest income [8% × A200,000] (OE+) 16,000
End-x3: Dr. Cash (A+) 16,000Cr. Accrued interest receivable (A−) 16,000
At the end of x3, Rosaura adjusts the carrying amounts of the two investments to fair value(Runebif +a11,000; Lebleu −a19,520). The decline in the fair value of the Lebleu bonds is due
402 PART 2 • THE HOUSE OF ACCOUNTING
CFA_C13.qxd 11/6/03 3:12 PM Page 402

CHAPTER 13 • FINANCIAL INVESTMENTS 403
to the rise in market interest rates during x3. Rosaura recognises the unrealised holding gain(Runebif ) and loss (Lebleu) directly in shareholders’ equity in the balance sheet.
End-x3: Dr. Unrealised holding loss in equity (OE−) 19,520Dr. Investment in Runebif ordinary shares (A+) 11,000
Cr. Investment in Lebleu 8% bonds (A−) 19,520Cr. Unrealised holding gain in equity (OE+) 11,000
The net unrealised holding loss of a8,520 is recorded in a separate reserve account – under thecaption ‘Accumulated fair value adjustments’ or ‘Unrealised holding gains/losses (UHG/L) inequity’. (The loss should be stated net of tax.) The impact of the revaluation on Rosaura’s end-x3 balance sheet is illustrated below:
BALANCE SHEETAssets
...End-x3
Cost Revaluation fair valueInvestments– in Runebif shares 300,000 11,000 311,000– in Lebleu bonds 235,400 (19,520) 215,880
(8,520)
Shareholders’ equity...
Start-x3 Revaluation End-x3Unrealised net holding loss in equity 0 (8,520) (8,520)
...
l Impairment, disposal and transfer of financial investmentsIn the previous section we presented the basic framework of fair value accounting under IAS. Wenow extend it by showing how companies account for impairments of investments, disposals,and transfers between categories of investment. We use our Rosaura example to illustrate theaccounting for each of these events. The key facts on which we’ll base our discussion are sum-marised below (amounts are in euros):
Acquisition Amortised Impaired Disposal Fair valueprice cost value value on transfer
Category and investment (in x3) at end-x3 at end-x4 in x4 to AFS
Held-to-maturity investmentBosco Nero 5% bonds, due end-x7 383,157 386,146 372,900
Fair valueat end-x3
Held-for-trading investmentCastiglia ordinary shares, A5 par 126,000 140,000 136,000
Available-for-sale investmentsLebleu 8% bonds, due end-x15 235,400 215,880 96,000Runebif ordinary shares, A2.50 par 300,000 311,000 318,000
CFA_C13.qxd 11/6/03 3:12 PM Page 403

ImpairmentAn investor company must carry out an impairment test on its financial investments at each balance sheet date. An investment is considered impaired if its carrying amount is greater than the(discounted) cash flows the company can expect to recover from sale (HFT and AFS investments) orholding the asset (HTM investments). For evidence of impairment, the company must first assessthe health of the investee (i.e. the issuer of the debt or equity securities). Warning signals includesustained periods of losses, continuing restructuring of the business and renegotiation of loanagreements. If evidence of impairment exists, the company must write down the investment to recoverable amount and recognise the impairment loss in income.
Impairment of AFS investments can have a significant income statement impact. If the com-pany has any unrealised holding gains on such investments, impairment results in the transferof these gains from the balance sheet to the income statement. Suppose, for example, that Lebleuencounters financial difficulties in late x4 and Rosaura estimates the recoverable amount of itsLebleu 8% bonds at only a96,000 at the end of the year. Rosaura records the impairment loss as follows:
End-x4: Dr. Loss from impairment (OE−) 139,400Cr. Unrealised holding loss in equity (OE+) 19,520Cr. Investment in Lebleu 8% bonds (A−) 119,880
The loss from impairment is the difference between the acquisition cost (a235,400) and the estim-ated recoverable amount from selling the AFS investment (a96,000) at end-x4. The unrealisedloss of a19,520 recorded in x3 is removed from equity and the investment itself is written downby a119,880 – from its end-x3 carrying amount (a215,880) to the recoverable amount. This isshown below:
BALANCE SHEET INCOME STATEMENTAssets
. .. .. .Investment in Lebleu bonds, start-x4 215,880Less: Impairment in x4 (119,880)Investment in Lebleu bonds, end-x4 96,000 Operating income xx
... Financial income/expense:...
Shareholders’ equity Loss from impairment (139,400). .. .. .
Unrealised holding loss in equity, start-x4 (19,520)Transfer to income on asset impairment 19,520
0...
DisposalUnder IAS, a company ‘derecognises’ a financial investment (or other financial asset) when:
1 it gives up its rights to the asset’s cash flows;2 it transfers those rights to another party and has no continuing involvement in them; or3 the rights expire.
Event 1 occurs when a company sells an investment; event 3 occurs when an option expires. (Thereason for including event 2 is to prevent a company disguising a loan – with financial assets
404 PART 2 • THE HOUSE OF ACCOUNTING
CFA_C13.qxd 11/6/03 3:12 PM Page 404

CHAPTER 13 • FINANCIAL INVESTMENTS 405
transferred to the lender as collateral – as a sale of assets.) On disposal of an investment (the mostcommon form of derecognition), the company realises a gain or loss and books it in the incomestatement. The gain or loss is the difference between the net proceeds from sale and the carryingamount of the investment. A further adjustment may be needed if the investment sold is an AFSinvestment. Any unrealised holding gains or losses that have accumulated in equity are realisedthen and must be recognised in income.
Rosaura disposes of two investments in x4. She grew disenchanted with her equity stakes inCastiglia and Runebif during the year and decides to sell them both. Castiglia is an HFT invest-ment, Runebif an AFS one. The market value of Rosaura’s stake in Castiglia falls back – froma140,000 at end-x3 to a136,000 at the date of sale in March x4. By contrast, Runebif ’s share pricecontinues to rise but at a slow rate. By November x4, when Rosaura decides to get rid of it, her stake in Runebif is worth a318,000. Rosaura makes the following entries in x4 to record thesale of both investments. (Transaction costs are ignored.)
March x4: Dr. Cash (A+) 136,000Dr. Loss on sale of HFT investment (OE−) 4,000
Cr. Investment in Castiglia ordinary shares (A−) 140,000
Nov. x4: Dr. Cash (A+) 318,000Dr. Unrealised holding gain in equity (OE−) 11,000
Cr. Investment in Runebif ordinary shares (A−) 311,000Cr. Gain on sale of AFS investment (OE+) 18,000
In the case of the HFT investment (Castiglia), a loss arises because the net proceeds from the sale (a136,000) are less than the carrying amount of the investment (a140,000, the fair value at end-x3). As for the AFS investment (Runebif ), disposal results in a reported gain of a18,000:this is the difference between the net proceeds (a318,000) and the acquisition cost (a300,000).The gain includes the unrealised holding gain accumulated in equity (a11,000) and the changein the investment’s fair value between the last balance sheet date and the date of sale (a318,000– a311,000). Note, though, that the net impact on shareholders’ equity in x4 is only a7,000. Theabove calculations of gain and loss ignore tax effects. The financial statement impact of the disposal of the Runebif shares is shown below:
BALANCE SHEET INCOME STATEMENTAssets
. .. .. .Investment in Runebif shares −311,000
... Operating income xxCash from disposal of investment +318,000 Financial income/expense:[Gain arising in x4 +7,000]
. .. .. .Gain from sale of investment 18,000
Shareholders’ equity. .. .. .Unrealised holding gain in equity, start-x4 11,000Transfer to income on asset disposal (11,000)
0...
CFA_C13.qxd 11/6/03 3:12 PM Page 405

TransferCurrent international accounting rules create a new problem for investor companies: how toaccount for transfers of investments between categories. Such transfers occur for bona fide reasons(e.g. a change in management’s intentions with regard to the holding period) and for suspectones, too. For example, if a company is nursing unrealised holding losses on an HFT investment,management might seek to reclassify it as an AFS investment – or an HTM investment, in thecase of a debt instrument – before the balance sheet date, in order to avoid recognising the lossesin income. Regulators have devised rules for transfers that limit the opportunities for earningsmanagement in this way.
Two features of international rules on investment transfers stand out. First, an HFT investmentshould never be reclassified. By electing to classify an investment in this category at the time ofacquisition, the company commits itself to recognising in income all unrealised gains and losseson the investment until disposal. Second, all permitted reclassifications must be carried out at fair value. The new classification determines the treatment of the unrealised holding gains or losses.For example, where a company transfers an HTM investment to the AFS category (because of achange in intent or ability), it recognises unrealised gains and losses in equity. Where it transfersan AFS (debt) investment to the HTM category it designates the fair value at date of transfer asthe new amortised cost and amortises past gains and losses, along with the discount or premiumat date of transfer, over the remaining life of the investment.
Rosaura’s portfolio of investments allows us to illustrate the accounting for transfers. At thestart of x4, she reclassifies the investment in Bosco Nero’s 5% bonds to the AFS category sinceshe no longer intends to hold them to maturity. The market value of the bonds at that time isa372,900 (since the market interest rate has risen to 7%) and the amortised cost of the bonds isa386,146 then. She makes the following entry to record the transfer:
Start-x4: Dr. Investment in Bosco Nero 5% bonds [AFS] (A+) 372,900Dr. Unrealised holding loss in equity (OE−) 13,246
Cr. Investment in Bosco Nero 5% bonds [HTM] (A−) 386,146
The above entry ensures that the transfer of the bonds occurs at fair value and the unrealised loss(a386,146 – a372,900) is taken to equity, in the same way as other unrealised gains and losses onAFS investments.
Exhibit 13.3 summarises the effect of the above-mentioned events in both x3 and x4 on thecompany’s key ledger accounts.
l New international standards on financial investments: a review
The new international accounting rules on financial instruments are a compromise. The thenIASC had originally planned to introduce fair value accounting for all financial assets and liabil-ities but its draft proposals encountered considerable opposition when they were published in1997. To meet the deadline of IOSCO (International Organisation of Securities Commissions)for a core set of international accounting standards to be issued by 1998, the IASC scaled backits ambitions. The resulting standard on the recognition and measurement of financial instru-ments, IAS 39, is similar in essentials to US GAAP on the topic. The three-way split of invest-ments – held-for-trading (HFT), held-to-maturity (HTM), and available-for-sale (AFS)investments – is taken directly from the US standard. Many companies were concerned that fairvalue accounting would lead to greater income volatility, investors would perceive companies tobe more risky, and corporate capital costs would rise. As a result, US GAAP (and IAS) restrictpure fair value accounting – where changes in fair value pass through the income statement – toHFT investments only.
406 PART 2 • THE HOUSE OF ACCOUNTING
CFA_C13.qxd 11/6/03 3:12 PM Page 406

Key events in x3 and x41 Rosaura accounts for 400,000 5% Bosco Nero bonds at amortised cost in x3. Bonds yield 6% to maturity.
x3 amortisation is 2,989 [(6% × 383,157) – (5% × 400,000)].2 Castiglia shares are a held-for-trading investment. End-x3 fair value is 140,000. Unrealised gain of 14,000
is recognised in income.3 Runebif shares and Lebleu bonds are available-for-sale investments. End-x3 fair values are 311,000 and
215,880 respectively. Unrealised gain (11,000) and loss (19,520) are recognised in equity.4 Lebleu bonds are impaired in x4. End-x4 fair value is 96,000. Impairment loss (of 139,400) is recognised in
income. It includes previous unrealised losses recorded in equity (19,520).5 Rosaura sells Castiglia (5a) and Runebif (5b) shares in x4. Realised loss (4,000) and gain (18,000) are
recognised in income. Gain on Runebif sale includes previous unrealised gain recorded in equity (11,000).6 Rosaura transfers Bosco Nero bonds to ‘available-for-sale’ category at start-x4. Bonds are adjusted down
to fair value (372,900) and unrealised loss (of 13,246) is recognised in equity.
Fair value and other adjustments to financial investments: ledger entries
ASSETS
Investment in Bosco Nero 5% bonds Investment in Castiglia ordinary shares
Purchase, x3 383,157 Purchase, x3 126,000[1] Discount [2] Revaluation 14,000
amortised, x3 2,989Balance, end-x3 140,000
Balance, end-x3 386,146 [6] Revaluation [5a] Disposal 140,000on transfer 13,246
Balance, end-x4 0Fair value, start-x4 372,900
Investment in Lebleu 8% bonds Investment in Runebif ordinary shares
Purchase, x3 235,400 Purchase, x3 300,000[3] Revaluation 19,520 [3] Revaluation 11,000
Balance, end-x3 215,880 Balance, end-x3 311,000[4] Impairment 119,880 [5b] Disposal 311,000
Balance, end-x4 96,000 Balance, end-x4 0
OWNERS’ EQUITY (‘Profit for the year’) OWNERS’ EQUITY (‘Reserves’)
Unrealised gain/loss in income Unrealised gain/loss in equity(‘Accumulated fair value adjustments’)
[2] Revaluation of C shares, [3] Revaluation [3] Revaluation end-x3 14,000 of L bonds, of R shares,
end-x3 19,520 end-x3 11,000Impairment loss
Balance, end-x3 8,520[4] Impairment of [5b] Sale of R [4] Impairment of
L bonds, x4 139,400 shares, x4 11,000 L bonds, x4 19,520[6] Transfer of
Realised gain/loss on disposal BN bonds, start-x4 13,246
[5a] Loss on sale [5b] Gain on saleof C shares, x4 4,000 of R shares, x4 18,000
Rosaura: financial investments and fair value adjustments (amounts in A)Exhibit 13.3
CFA_C13.qxd 11/6/03 3:12 PM Page 407

Fair value accounting in its IAS 39 form is not problem-free, however. First, companies stillface the risk of increased volatility – but to their balance sheets rather than their income state-ments. The rise and fall in world stock markets at the turn of the millennium had a correspond-ing impact on companies’ assets and shareholders’ equity – and the impact was most marked incompanies that accounted for investments at fair value. Banks are required, under national andinternational regulations, to maintain minimum capital adequacy ratios: these ratios, in effect,relate shareholders’ equity to assets. Many companies that borrow funds agree (or ‘covenant’)not to let the debt–equity ratio exceed a specified limit. For these companies, fair value account-ing increases the risk that these limits will be breached. The French Banking Federation appealedto the European Commission in October 2002 not to adopt IAS 39 in its current form becauseit would increase banks’ balance sheet volatility.6
Second, the new standard increases the risk of income manipulation. As mentioned earlier,prior to IAS 39 companies usually accounted for short-term investments at LOCOM and long-term (passive) investments at cost. A criticism of the cost method is that companies are encour-aged to time disposals of investments so that the resulting realised gains or losses smooth theirbottom-line income. LOCOM reduces the scope for doing this, however, since companies mustrecognise in income all declines in investments’ fair value. By classifying all its investments asAFS (and thereby deferring unrealised gains and losses in equity), a company can ensure that the income statement impact will be identical to that under the cost method. Moreover, the new rules put added strain on the impairment test. Recall that if an investment is impaired, thedecline in value is considered permanent and the investor company must recognise it in incomeimmediately. How will managers decide – and auditors verify – that a large decline in marketvalue is temporary (and therefore deferrable) rather than permanent? Although IAS 39 offersguidance, managers will try to interpret the rules to their company’s advantage.
Finally, many analysts and investors question the reliability of ‘synthetic’ fair values. Inter-national rules allow firms to estimate an investment’s fair value – using the market value of acomparable asset, discounted cash flow analysis or an option pricing model – if a quoted marketprice (from an active market) is not available. Following Enron’s collapse in 2001, evidence cameto light that US energy trading companies had misused such estimation techniques.7
Derivatives and hedge accounting
Companies invest in derivative financial instruments – or derivatives, for short – as well as primary ones such as debt and equity securities. Derivatives include share options, forward contracts for foreign exchange (‘currency forwards’), commodity futures contracts and interestrate swaps. Companies invest in these instruments mainly for hedging purposes. We focus in this section on the accounting problems that derivatives as hedges give rise to.
l Derivatives: definition and terminology
According to IAS, a derivative is a financial instrument:
1 whose value changes in response to the change in a specified price, rate or index;2 that requires little or no initial net investment; and3 that is settled at a future date.
The price, rate or index to which a derivative’s value is linked is known as the underlying. Thus themarket price of the ABC share is the underlying of the ABC share option; the euro-yen exchangerate is the underlying of the euro-yen currency forward. A derivative contract usually specifies anotional amount: it could be the number of shares in the case of a share option or the number of
408 PART 2 • THE HOUSE OF ACCOUNTING
CFA_C13.qxd 11/6/03 3:12 PM Page 408

currency units in the case of a currency forward. The amount to be exchanged on the settlementdate – the settlement amount – is a function of the notional amount of the derivative and theunderlying’s price or value. Thus the settlement amount of a euro-yen currency forward is:(Forward euro-yen exchange rate − Spot euro-yen exchange rate on the settlement date) ×Number of currency units.
l HedgingExposure to risk is an unavoidable aspect of commercial life. A company that buys or sells goodsin a foreign currency bears the risk of adverse exchange rate movement while the transaction isoutstanding. A firm that borrows money at a floating rate of interest runs the risk that the inter-est rate will rise during the life of the loan. Companies can try to offset these risks – in part or inwhole – through hedging activities. Alternatively, they can accept the risk exposure. Hedging canbe costly. Moreover, if a company’s shareholders hedge their own investment risks, corporatehedging may simply duplicate their efforts.
Hedging can take many forms. Generally, there are two types of economic hedge: naturalhedges and derivative-based ones. A company with US dollar revenues decides to borrow moneyin that currency: the cash inflows in dollars provide a natural hedge for the debt payments itmust make in them. Derivatives provide another means of hedging. Consider the case of a metalrefining company with large quantities of copper in inventory. It has agreed to deliver the metalto a customer six months hence at the spot price then. It decides to sell the copper forward, usinga futures contract that matures on the delivery date. The futures contract is thus a hedge againsta decline in the copper price over the six months.
This second example illustrates the two essential elements of an economic hedge. First, theremust be a hedged item – the copper inventory in our example. This is an asset or liability, com-mitment or expected future transaction that exposes the company to the risk of changes in thefuture cash flows or in the fair values of an asset or liability. Second, there must be an effectivehedging instrument – the futures contract in our example. This is usually a designated derivat-ive whose fair value or cash flows are expected to offset, to a high degree, changes in the fair valueor cash flows of the hedged item.
l Hedge accountingThere are essentially two ways to account for a hedging instrument. Under hedge accounting, thehedging instrument is measured in the same way as the hedged item. Under fair value account-ing, it is ‘marked to market’ each period, irrespective of the way the hedged item is measured.Consider our copper inventory example. Under hedge accounting, the copper and the futurescontract are both measured in the same way – at fair value, under IAS – and changes in the values of each are recognised in the same period. Under fair value accounting, the futures con-tract is measured at fair value and changes in value are recognised in income each period whilethe inventory is measured at cost and holding gains and losses are deferred until it is sold.
An example illustrates how hedge accounting works in practice. On 1 January x1, Bottomborrows a10 million from General Weavers Capital (G.W. Capital) to finance expansion of hisbusiness. The loan is for three years at a floating rate of interest equivalent to Euribor (EuropeanInterbank Offered Rate) and interest is reset (and paid) annually.8 Being a cautious weaver,Bottom wants to guard against interest rate increases during the term of the loan. He enters intoa swap contract with Wild Thyme Bank on the same day, under which he pays interest at a fixedrate of 7% a year and receives interest at a floating rate equivalent to Euribor. The notional prin-cipal of the swap is a10 million, the term is three years and the (variable) interest rate is resetannually, so the swap is an effective hedging instrument. Interest under the loan and swap con-tracts flows as follows:
CHAPTER 13 • FINANCIAL INVESTMENTS 409
CFA_C13.qxd 11/6/03 3:12 PM Page 409

410 PART 2 • THE HOUSE OF ACCOUNTING
The swap in this case converts a variable-rate loan into a fixed-rate one.Now to the accounting for the swap. First, we must establish its fair value each period. At
1 January x1, Euribor is 7% so the swap contract has a fair value of zero. The Euribor rate at eachinterest payment (and resetting) date and the fair value of the swap contract then are given below:
Net swap receipt Fair value ofDate Euribor (payment) swap asset (liability)
31 December x1 6.5% A(50,000) A(90,400)31 December x2 7.15% 15,000 14,02531 December x3 6.75% (25,000) 0
In calculating the fair value of the swap contract at subsequent balance sheet dates, we assume, forsimplicity, that Euribor remains at the then current rate for the remainder of the contract and theresulting stream of net swap receipts or payments is discounted at the fixed rate under the contract.Thus at end x1, the swap contract liability of a90,400 is based on assumed net payments of a50,000(a650,000 floating rate receipt less a700,000 fixed rate payment) in x2 and x3 discounted at 7%.
Under hedge accounting, changes in the fair value of the interest rate swap are not recognisedin income as they arise. Instead, they’re deferred in a hedging reserve account and released to theincome statement when ‘settling up’ occurs. Thus, as the hedging company recognises interestexpense each period, it records as a gain or loss the net amount it receives or pays under the swap contract and adjusts the carrying amount of the swap at that time. Exhibit 13.4 shows, insimplified form, the entries Bottom makes each year between x1 and x3 in connection with theG.W. Capital loan and related swap contract.
Note that the swap has an offsetting effect on Bottom’s income. For example, when Euriboris greater than 7% – as in x2, the gain on the hedging instrument (i.e. the net amount of a15,000Bottom receives under the swap contract) offsets the ‘loss’ on the hedged item (the additionala15,000 interest payment under the loan agreement). As a result, the cost of the loan is fixed at 7%.
Hedge accounting is controversial. Supporters argue that it reflects management’s intent inacquiring the hedge. Moreover, the income number is more meaningful. Gains from the hedginginstrument are matched with losses arising on the hedged position; they are not recognised indifferent periods. Opponents criticise hedge accounting on practical grounds. They claim it givestoo much discretion to management. By choosing the manner and timing of hedging, manage-ment can manipulate profits. New international accounting rules permit hedge accounting but,as we show below, seek to address the concerns of critics by imposing restrictions on its use.
l Derivatives and hedge accounting: international rulesLike other financial investments, derivatives are measured initially at cost. For derivatives such as forward and futures contracts and interest rate swaps, there’s usually no net investment initially so cost at that time is zero. For call options, however, the initial asset is the premium paidto the writer of the option for accepting the risk.
After the initial recognition date, derivatives must be ‘marked to market’ each balance sheetdate.9 If they’re held for trading or speculative purposes, changes in fair value are recognised in income, as with other held-for-trading investments. If they’re held for hedging purposes,
CFA_C13.qxd 11/6/03 3:12 PM Page 410

CHAPTER 13 • FINANCIAL INVESTMENTS 411
FactsAt start-x1, Bottom borrows A10 million from G.W. Capital for three years at Euribor. Interest is paid and reset annually. Bottom enters into a swap contract with Wild Thyme Bank on thesame date. The terms of the swap (notional principal of A10 million, three-year term, variableinterest rate, Euribor-linked, reset annually) match those of the loan. Under the swap Bottompays interest at a fixed rate of 7% and receives interest at a rate equivalent to Euribor.
Annual swap receipts and payments – and end-year fair values of the swap contract – in thethree years x1–x3 are set out below (currency amounts are in euros).
Floating rate Fixed rate Net receipt Fair value ofDate Euribor receipt payment (payment) swap A/(L)
1 Jan x1 7% Nil31 Dec x1 6.5% 650,000 700,000 (50,000) (90,400)31 Dec x2 7.15% 715,000 700,000 15,000 14,02531 Dec x3 6.75% 675,000 700,000 (25,000) 0
Loan- and swap-related accounting entries (in A000)
x1 x2 x3Date Dr Cr Dr Cr Dr Cr
1/1 Cash (A+) 10,000Loan (L+) 10,000
To record loan from GW Capital
31/12 Interest expense (OE−) 650 715 675Cash (A−) 650 715 725
To record interest paid on loan
Loss on hedge (OE−) 50 25Cash (A−) 50 25
Cash (A+) 15Gain on hedge (OE+) 15
To record net payment or receipt under swap contract
Hedging reserve (OE−) 90.4 14.025**Swap contract asset/liability 90.4 14.025
Swap contract asset/liability 104.425*Hedging reserve (OE+) 104.425
To record change in fair value of swap contract
Loan (L−) 10,000Cash (A−) 10,000
To record repayment of loan
* Entry to adjust swap contract liability of 90.4 at end-x1 to swap contract asset of 14.025 at end-x2.** Entry to adjust swap contract asset of 14.025 at end-x2 to nil value at end-x3.
Interest rate swap contract and hedge accounting: illustrationExhibit 13.4
CFA_C13.qxd 11/6/03 3:12 PM Page 411

412 PART 2 • THE HOUSE OF ACCOUNTING
unrealised gains and losses are either recognised in income or deferred in equity, depending onthe nature of the hedge and its effectiveness.
IAS identify three categories of hedge and specify the way companies must account for each.
1 A company uses a fair value hedge when it seeks to protect itself against changes in the fairvalue of an asset or liability that are attributable to a particular risk. The change in fair valuemust affect net income. The hedge of copper inventory using a commodity futures contractthat we discussed earlier is an example of a fair value hedge.
In the case of a fair value hedge, IAS require the company to recognise the gain or loss onthe hedging instrument in income. The company must also adjust the asset or liability beinghedged for the change in fair value attributable to the hedged risk. Thus, in the case of thehedge of copper inventory, not only must the metal refiner mark the futures contract to mar-ket and take unrealised gains and losses to income but it must also adjust the carrying amountof the copper inventory to fair value and record these gains and losses in income as well.
2 A company uses a cash flow hedge when it seeks to protect itself against changes in future cashflows due to risks connected with (a) an existing asset or liability or (b) a forecast transaction.Variable rate debt is an example of (a): this is an existing liability where the company isexposed to the risk of variation in interest rates in future. An interest rate swap – in the formof a ‘pay fixed, receive variable’ contract like the one Bottom entered into with Wild ThymeBank – is a cash flow hedge. A planned future purchase of a fixed asset in a foreign currencyis an example of (b): this is a probable future transaction where the company is exposed to therisk of variation in exchange rates in the future. Purchasing foreign currency forward represents a cash flow hedge against this risk.
With a cash flow hedge, IAS require a company to defer the gain or loss on the hedginginstrument in equity (assuming the hedge is effective). The company brings the gain or lossinto income in a future period when the hedged cash flow affects the income statement. Thus,as we saw in our Bottom example, changes in the fair value of its interest rate swap aredeferred in ‘Hedging reserve’. They are released into the income statement when the hedgedinterest payments are reflected – as interest expense – in Bottom’s income statement.
3 A company may also designate a financial asset or liability as a hedge of a net investment ina foreign entity. Thus, under IAS, a eurozone-based parent with a US subsidiary can earmarka US dollar loan – raised by the parent company – as a hedge of the US subsidiary’s net assets.As with cash flow hedges, the company must defer gains or losses on the hedging instrument(in this case, the exchange gains and losses on the dollar loan) in equity. The gains or lossesare ‘recycled’ in income when the company disposes of the investment.
We mentioned earlier that hedge accounting is open to abuse. Management may try to set upa hedge retrospectively – by designating a derivative as a hedging instrument after sustainingunrealised holding losses on a financial asset or liability. In addition, the derivative designated asa hedge could be ineffective because, for example, the hedging instrument and the hedged itemare in different currencies. Accounting regulators have sought to reduce the scope for abuse bylaying down strict conditions when hedge accounting can be used. Under IAS, a company canuse hedge accounting only if:
l it prepares formal documentation, at the outset, identifying the hedging instrument, thehedged item or transaction, and the nature of the risk being hedged; and
l the hedge is expected to be highly effective – that is, the company expects changes in fair valueor cash flows of the hedging instrument to ‘almost fully’ offset those of the hedged item andactual results are within a range of 80–125% of expected results.
A hedge can have both an effective and an ineffective portion. Hedge accounting can be appliedonly to the effective portion. The gain or loss on the ineffective portion of the hedging instru-ment must be reported in income immediately (if the hedging instrument is a derivative). In
CFA_C13.qxd 11/6/03 3:12 PM Page 412

CHAPTER 13 • FINANCIAL INVESTMENTS 413
practice, this limits a company’s ability to defer gains and losses on cash flow hedge and hedgesof net investments in foreign entities.
Disclosure and analysis of financial investments
l Disclosures
Firms in the EU and elsewhere usually distinguish current from long-term investments (‘financialfixed assets’) on the balance sheet. They also disclose the income from these investments in theincome statement. Larger EU firms must provide additional information. They give a breakdownof long-term investments, showing separately investments in subsidiaries (unconsolidated sub-sidiaries in the case of group accounts), associated companies and other firms (i.e. investmentsin debt securities and passive minority shareholdings in other companies). They must also reportloans to companies in these three categories. Moreover, they are required to disclose interest income,dividends received, realised gains and losses and value adjustments (e.g. losses from impairmentof long-term investments). They must show separately the interest and other income they receivefrom subsidiary and associated companies.
Companies following IAS must provide similar information about their financial investments.New standards impose additional disclosure requirements, however.10 As we’ve already seen, IASnow require most investments to be carried at fair value in the balance sheet. Companies must statethe methods and assumptions used in estimating fair value. In the case of available-for-sale invest-ments, they must state the unrealised gains and losses arising in the period and the amounts trans-ferred to the income statement. For those financial assets and liabilities accounted for at amortisedcost, companies must disclose their fair values in the notes (unless these can’t be measured).
The new international standards also deal with disclosures relating to hedging activities. Forexample, companies must describe their risk management objectives and policies. Where theyuse hedging, they should give the following information for each of the three types of hedge (fairvalue, cash flow, and investment in foreign entity):
l the nature of the risks being hedged, including when hedged forecasted transactions areexpected to occur;
l the hedging instruments used – and their fair values at the balance sheet date; andl where gains and losses on hedging instruments are deferred in equity, the amounts trans-
ferred in and out of hedging reserve in the period.
Illustration
Novartis, a large Swiss pharmaceutical company, prepares its accounts in accordance with IAS. Itreports on its 2001 balance sheet SFr 11 billion of marketable securities – shown as a current asset– and over SFr 2 billion of long-term investments. Together they represent 20% of total assets.
The marketable securities comprise equity and debt securities – classified as available-for-sale investments – and time deposits longer than 90 days. Long-term investments are likewiseavailable-for-sale investments. At the start of 2001, when Novartis adopted IAS 39, net unrealisedgains, pre-tax, on all AFS investments were SFr 1.9 billion.
Novartis makes extensive disclosures about its investments in derivatives. According to man-agement, the company is exposed to risks from changes in exchange rates, interest rates and themarket values of short-term investments. It uses derivatives to manage the resulting volatility.Specifically, it uses forward contracts and foreign currency option contracts to hedge expectedforeign currency revenues and its net investment in foreign subsidiaries. It uses interest rate swapagreements to hedge interest rate risk and options to hedge price risk on investments. It does notuse derivatives for purposes other than hedging. Panel A of Exhibit 13.5 contains an extract from
CFA_C13.qxd 11/6/03 3:12 PM Page 413

414 PART 2 • THE HOUSE OF ACCOUNTING
Panel A Derivative financial instrumentsContract orunderlying Positive Negative
principal amount fair values fair values
In SFr millions 2001 2000 2001 2000 2001 2000
Currency-related instrumentsForward foreign exchange rate contracts 7,114 8,191 94 355 (214) (5)Over-the-counter currency options 13,259 13,815 90 119 (157) (155)Cross-currency swaps 1,332 – – – (33) –Total of currency-related instruments 21,705 22,006 184 474 (404) (160)
Interest-related instrumentsInterest rate swaps 3,700 2,854 29 21 (5) (30)Forward rate agreements 6,450 2,950 – 1 (17) (6)Interest rate options 150 300 – – (4) (2)Total of interest-related instruments 10,300 6,104 29 22 (26) (38)
Options on equity securities 12,018 10,386 79 503 (539) (528)
Total derivative financial instruments 44,023 38,496 292 999 (969) (726)
Panel B Fair value adjustments in ‘Statement of changes in equity’
Fair value ofRetained deferred cash
In SFr millions earnings flow hedges Total
January 1, 2001 fair value adjustmentsAvailable-for-sale marketable securities 1,891 1,891Derivative financial instruments 265 138 403Deferred tax on above (213) (35) (248)
Effect of introducing IAS 39 on January 1, 2001 1,943 103 2,046Changes in fair value:– Available-for-sale marketable securities (150) (150)– Cash flow hedges 18 18Realised gains or losses transferred to the income statement:– Marketable securities sold (648) (648)– Derivative financial instruments (265) (152) (417)Impaired securities and investments 101 101Deferred tax on above 73 11 84
Fair value adjustments at December 31, 2001 1,054 (20) 1,034
Novartis: extracts from 2001 accounts concerning financial instrumentsExhibit 13.5
(Source: Novartis Group, Annual Report and Accounts 2001. Reproduced by permission of Novartis Group.)
CFA_C13.qxd 11/6/03 3:12 PM Page 414

CHAPTER 13 • FINANCIAL INVESTMENTS 415
Novartis’s 2001 accounts showing derivatives’ underlyings and their fair values – positive andnegative – at the end of 2000 and 2001. The ‘contract or underlying principal amount’ shows theend-year notional amount of each derivative instrument that Novartis uses: it doesn’t representthe amount at risk. The fair values are based on market prices or values derived from standardpricing models. The company states that the use of derivatives did not have a material impact onthe 2000 and 2001 accounts.
Exhibit 13.5 also contains a note to the statement of changes in equity, showing the move-ment in fair value adjustments during 2001 (panel B). Fair value adjustments relate to both AFSinvestments and derivative financial instruments. Unrealised gains, net of tax, are SFr 2 billionat the start of 2001. Half of these gains are realised in the year and released to the income state-ment, either because marketable securities have been sold or because transactions that were hedgedin advance occur that year. (Impairment losses of SFr 101 million represent unrealised losses onAFS investments that are recognised in income in 2001 because they are judged to be no longer temporary.) Note that the derivative-related fair value adjustments shown in panel B are a subsetof the gains and losses on derivatives that Novartis recognises in 2001. Because they relate to(effective) cash flow hedges, they are deferred in equity until realised; gains and losses on fairvalue hedges (and ineffective cash flow hedges), however, are recognised in income as they arise.
l Analysis of financial investmentsIn valuing a firm, investors focus on its operating activities and estimate the returns its operatingassets will generate in the future. The investment income (of a non-financial firm) is of secondaryimportance. The returns on its financial assets are rarely as large as those on its operating assets.Moreover, they are harder to forecast. The income from financial assets comprises dividendsreceived, interest income and recognised gains less losses. This last figure is the hardest for outside investors to estimate because it’s influenced by management decisions. For example, it can be boosted or depressed simply as a result of the timing of decisions to sell investments(and realise gains or losses) or recognise asset impairment.
Despite these earnings forecasting problems, the stock market does not ignore a company’sfinancial assets when valuing its shares. Moreover, investors appear to consider fair value informa-tion reliable and use it in their valuation decisions, according to studies of market reaction topublication of this information by Danish and US banks (see Box 13.1).
In the past, differences in the way companies accounted for financial investments made it diffi-cult to compare returns on these assets across companies. Publication of fair value informationshould make this task easier now. However, it does require a further adjustment to the calcula-tion of financial income. In addition to the elements mentioned above – dividends received,interest income, realised gains less losses and impairment losses – investors must include a fairvalue adjustment. This is, in effect, the unrealised holding gains less losses on the investmentsthat arise in the period. Thus, to be comparable across firms, total financial income should becomputed as follows:
Dividends received++ Interest income earned
++/−− Realised gains less losses on investments sold−− Losses on impairment of investments (less recoveries)
++/−− Fair value adjustment (i.e. unrealised holding gains less losses in the period)Total financial income (on fair value basis)
Note that, even if a company classifies an investment as ‘available-for-sale’ (thereby deferringunrealised gains and losses in equity) or simply discloses fair value information in the notes (as in the case of held-to-maturity investments), the investor can still determine the ‘fair valueadjustment’ and, by extension, financial income on a fair value basis.
CFA_C13.qxd 11/6/03 3:12 PM Page 415

416 PART 2 • THE HOUSE OF ACCOUNTING
Fair value accounting and banks: stock market lessonsBOX13.1
Among the sectors most affected by the switch to fair value accounting of financial instru-ments is the financial sector. Financial assets represent a large proportion of the assets of banksand other financial institutions. Financial liabilities dominate the equities side of their balancesheets, too. Set out below are aggregated (and condensed) balance sheets of US and Germancommercial banks at end-1999, scaled by total assets.
US German US GermanCash and balance with Central bank 3.4 1.6 Capital and reserves 8.3 4.6Interbank deposits 3.0 19.9 Interbank deposits 0.9 27.7Loans 63.8 50.3 Customer deposits 66.2 42.8Securities 20.2 21.8 Bonds 1.3 16.1Other assets (incl. premises) 9.6 6.4 Other liabilities 23.3 8.8
100.0 100.0 100.0 100.0
Source: OECD (2001), Bank Profitability: Financial Statements of Banks 2000.
International (and US) standards on financial instruments require companies to disclosethe fair values of all financial assets and liabilities (unless reliable estimates of fair value can’tbe obtained). Thus even though banks can continue to account for major financial assets andliabilities such as loans to customers, deposits and borrowings at (amortised) cost, they mustshow the fair value of these assets and liabilities in the notes to the accounts.
Do investors find such fair value disclosures useful? One way of addressing this question is by looking at the impact of such disclosures on share prices. In a study of US banks in theearly 1990s, Barth, Beaver and Landsman found that some of the fair value information thatbanks were disclosing for the first time was definitely ‘value-relevant’. In regressions of the difference between the market and book values of equity on the difference between the fair andbook values of banks’ assets and liabilities, the fair value information in loans – and to a lesserextent, in securities and long-term debt – helped explain banks’ share prices in those years.11
If investors value this information, why not require its inclusion in the financial statementsthemselves? Critics of fair value-based accounts for banks argue that:
1 the numbers are more easily manipulable and therefore less reliable than cost-based ones; and2 they increase the volatility of reported earnings (because changes in fair value are recognised
in the income statement). As a result, banks’ capital adequacy ratios are violated more often,regulators are forced to intervene more frequently and the value of banks’ assets – especiallytheir intangibles – declines.
Bernard, Merton and Palepu carried out a comparative study of Danish and US banks in the late1980s to test the validity of these arguments. Danish banks have long used mark-to-marketaccounting to measure investment securities, loans and derivatives, whereas US banks at thattime accounted for these assets at cost or LOCOM (and did not disclose fair value data). Theresearchers found no evidence that Danish banks manipulated fair values (but like their UScounterparts they did tend to smooth the recognition of loan losses). As for income volatility,Danish banks’ earnings were clearly more variable when fair value adjustments were includedbut this did not change large banks’ behaviour. (Small Danish banks, however, maintained alarger equity ‘cushion’.) Based on the history of failed Danish banks in the late 1980s, there wasno evidence that regulatory interventions had reduced banks’ asset values. In sum, the Danishexperience does not support the arguments of the fair value critics, according to Bernard et al.12
CFA_C13.qxd 11/6/03 3:12 PM Page 416

CHAPTER 13 • FINANCIAL INVESTMENTS 417
Summary
Financial investments comprise investments in debt and equity securities and in derivativeinstruments. Companies invest in such assets: to increase returns on surplus cash, to develop orprotect long-term business relationships, to gain influence over or control of other firms, to fundfuture liabilities and to hedge risks. The nature of the investment and management’s reasons foracquiring and holding it affect the way it is accounted for.
We focus in this chapter on debt investments, passive equity investments and derivatives. Theaccounting recognition and initial measurement of such investments are straightforward. Acompany recognises an investment as an asset when it becomes a party to the contract for it. Theinvestment is measured initially at cost. What is unusual is how such assets are measured sub-sequently. Under new international rules, most financial investments must be measured at fairvalue. The only exceptions are investments in debt securities to be held to maturity and invest-ments where fair value can’t be reliably determined. The former must be measured at amortisedcost, the latter at cost.
The new valuation rules represent a major change in accounting for investments. Traditionally,short-term investments were measured at LOCOM and long-term investments at cost. But thechange in measurement affects companies’ balance sheets more than their income statements.Unrealised holding gains and losses must be recognised in income only in the case of investmentsheld for trading purposes. Most financial investments, however, are classified as ‘available-for-sale’investments and companies defer unrealised gains and losses on them in equity. Only when suchinvestments are sold or impaired, are the resulting gains or losses recognised in income.
Companies invest in derivatives largely to hedge risk. New international rules permit firms touse hedge accounting but only in clearly defined circumstances. Under hedge accounting, a com-pany accounts for the hedging instrument (e.g. a derivative such as an interest rate swap or currencyforward) in the same way as the hedged item (interest payments under existing debt, a futureforeign currency payable). When a company hedges its exposure to changes in asset or liabilityvalues (fair value hedge), it measures both the hedging instrument and the asset or liability at fairvalue and recognises all gains and losses in income. When it hedges its exposure to fluctuationsin future cash flows (cash flow hedge) or to exchange rate changes affecting a foreign investment(investment-in-foreign-entity hedge), it defers the gains and losses on the hedging instrument in equity until the hedged cash flows affect the income statement or the foreign investment issold. To minimise abuse of hedge accounting, international rules require firms to designate allhedging instruments in advance and apply hedge accounting only to effective hedges.
The accounts of larger firms contain a wealth of information on financial investments. Invest-ments are broken down by type, investment income by source. Reporting of fair value informationallows investors to recast investment income and asset numbers on a fair value basis. Disclosuresabout derivatives shed light on the scale and focus of a firm’s hedging activities.
Problem assignments
P13.1 Equity investments: LOCOM and fair value accountingAt the start of x1, Deriganov, a diversified industrial group, buys 80,000 shares of Pishchik, a chinaclay producer, at a price of 50 a share. Although the holding is only 5% of Pishchik’s issued sharecapital, Deriganov views the investment as a strategic move since it has a majority stake in anothercompany that makes porcelain.
CFA_C13.qxd 11/6/03 3:12 PM Page 417

Pishchik reports earnings of 5/share and pays a dividend of 2.5/share in x1. At the end of x1, themarket value per share has risen to 60.
There is an economic downturn in x2. Pishchik’s EPS falls to 4.2/share but the company maintainsits dividend. The end-x2 market price is 47/share.
Pishchik’s earnings recover in x3 as the economy rebounds. In response to shareholder dissatisfac-tion with the low returns they’ve received, Deriganov decides to focus on its core activities and disposeof its porcelain and related operations. It sells all its shares in Pishchik at a price of 55/share in x3 –prior to earnings and dividend announcements for the year.
Required
(a) Deriganov accounts for its investment in Pishchik at LOCOM. Show the effect of the investmenton Deriganov’s accounts in each of the three years x1 to x3. Use journal entries or the balancesheet equation.
(b) Deriganov accounts for its investment in Pishchik at fair value. It classifies Pishchik as an available-for-sale investment and records unrealised holding gains and losses in equity. The decline in themarket value of Pishchik’s shares in x2 is not an impairment of the investment. Show the effect ofthe investment on Deriganov’s accounts in each of the three years x1 to x3. Use journal entries orthe balance sheet equation.
Check figures:Gain on disposal, x3 (a) 640,000
(b) 400,000
P13.2 Accounting for financial investments under new IAS: basic frameworkChisme Company makes certain investments in debt and equity securities at the start of year 4. Theacquisition cost of the investments and their end-year 4 market values are set out below. (Amountsare in A000.)
Acquisition End-year 4cost market value
Dingsda AG, 30,000 ordinary shares 750 570Thingummy plc, 20,000 ordinary shares 680 700Truc SA, 1,500 8% preference shares 120 not availableCoso SpA, 6% bonds, due end-year 7 356.1 360
The Thingummy shares Chisme holds are a held-for-trading investment; the Dingsda shares are anavailable-for-sale investment. As for the Truc investment, the (non-redeemable) preference shares are accounted for at cost as they are unquoted and their end-year 4 market value cannot be deter-mined reliably. Chisme plans to hold the Coso bonds to maturity and therefore accounts for them atamortised cost. The bonds have a face value of A350,000 and pay interest annually. The effectiveinterest rate at the date of purchase was 5.5%.
None of the companies in which Chisme holds shares pays a dividend in year 4.
Required
Show the effect of the following events on Chisme’s year 4 accounts:
(a) purchase of the four investments at the start of the year;
(b) accrual and receipt of interest during the year;
(c) fair value adjustments at year-end.
Use journal entries or the balance sheet equation.
Check figure:Total carrying amount of investments,end-year 4 (in A000) A1,744.7
418 PART 2 • THE HOUSE OF ACCOUNTING
CFA_C13.qxd 11/6/03 3:12 PM Page 418

CHAPTER 13 • FINANCIAL INVESTMENTS 419
P.13.3 Accounting for financial investments under new IAS: extensions
Chisme Company (see P13.2) makes certain changes to its investment portfolio in year 5. Thesechanges – and the end-year 5 fair values of its investments – are set out below.
1 Chisme sells half of its Thingummy shares for A355,000 in May year 5. The market value of theremaining shares is A33/share at the end of year 5.
2 Dingsda experiences financial problems in year 5. At year-end, the market value of the shares isonly A10/share. Chisme’s management consider the investment impaired and decide to recognisethe loss in income that year.
3 After a review of the company’s investments at end-year 5, Chisme’s management decide toreclassify the Coso bonds as an available-for-sale investment as they no longer plan to hold themto maturity. The fair value of the bonds then is A363,200.
4 As a result of an overhaul of its business by new management, Truc makes profits in year 5 andresumes paying a dividend (of A8/share) on its preference shares. (The preference dividend is not cumulative.) Although the company is unquoted, Chisme’s management use cash-flow-based valuation techniques to value the investment. They estimate its end-year 5 value at A160,000 andclassify Truc as an available-for-sale investment.
Required
Show the effect on Chisme’s year 5 accounts of the following events:
(a) Accrual and receipt of interest (on Coso bonds) and receipt of dividend (on Truc’s preferenceshares) during the year. Neither Dingsda nor Thingummy pays a dividend in year 5.
(b) Sale of Thingummy shares in May.
(c) Recognition of impairment of Dingsda investment at year-end.
(d) Transfer of Coso bonds to AFS category at year-end.
(e) Fair value accounting of Truc shares and fair value adjustment of other investments at year-end.
Use journal entries or the balance sheet equation.
P13.4 Hedge accounting: fair value hedge using an interest rate swapIn the example of hedge accounting in the chapter, the borrower, Bottom, swaps floating paymentsfor fixed ones to hedge fluctuations in interest rates and therefore in its cash flows. But what if Bottomswaps fixed payments for floating ones? In this case, it’s the fair value of the debt that is being hedgedsince the value of fixed-rate debt is sensitive to interest rate changes. The key facts of Bottom’s newinterest rate swap are summarised below.
At start-x1, Bottom borrows A10 million from G.W. Capital for three years at a fixed rate of 7%.Interest is paid annually. Bottom enters into a swap contract with Wild Thyme Bank on the same date.Under the swap Bottom pays interest at a floating rate equivalent to Euribor and receives interest at a fixed rate of 7%. The swap has a notional principal of A10 million and a three-year term and thevariable interest rate is reset annually.
Annual swap receipts and payments – and end-year fair values of the swap contract – in the threeyears x1–x3 are set out below. (Currency amounts are in euros.)
Fixed rate Floating rate Net receipt Fair value ofDate Euribor receipt payment (payment) swap A/(L)
1 Jan x1 7% Nil31 Dec x1 6.5% 700,000 650,000 50,000 90,40031 Dec x2 7.15% 700,000 715,000 (15,000) (14,025)31 Dec x3 6.75% 700,000 675,000 25,000 0
CFA_C13.qxd 11/6/03 3:12 PM Page 419

Bottom designates changes in the fair value of the swap as a hedge of changes in the fair value ofthe debt due to changes in Euribor. Under IAS 39, the swap contract must be separately recognisedand measured at its fair value. (Initially, this is zero as the Euribor rate is 7% at the start of x1.) Thecarrying amount of the loan is also adjusted for changes in its fair value due to changes in Euribor. Allgains and losses are recognised in the income statement.
Required
Show the entries Bottom must make in its accounts to record the loan payments and the changes in fair values of both swap and loan over the three years x1–x3. What is the net cost of the loan toBottom in each of the three years?
P13.5 Investments: converting accounts from LOCOM to fair value basisOrkla a.s., one of Norway’s largest listed companies, has three main areas of activity: branded con-sumer goods, chemicals and financial investments. Its portfolio of investments, with a book value ofNOK 11,400 million, represents over 20% of the group’s end-2001 assets. The company classifies theportfolio investments as a current asset and accounts for them at the lower of portfolio cost or market.However, it provides market value information in the notes to the accounts. Set out below are keydata from its 2001 accounts. Amounts are in NOK million.
2001 2000 1999Income statementOperating revenues 44,799 34,083 31,492
Operating profit 3,260 2,607 2,177Dividends 545 555 325Portfolio gains/(losses)* (760) 2,727 595Other financial items, net 208 (718) (778)
Profit before tax 3,253 5,171 2,319
* These comprise gains and losses on disposal of investments and asset write-downs.
2001 2000 1999 1998Notes to the accountsSecurities portfolio
Market value 14,140 18,053 20,875 12,624Book value 11,394 12,622 11,340 8,495Unrealised gains before tax 2,746 5,431 9,535 4,129
Required
What is the profit before tax Orkla would have reported in the three years 1999–2001 if it had accountedfor its securities portfolio at fair value? What do the fair value-based profit numbers reveal about theperformance of its financial investments division in these years?
P13.6 Computing returns on financial assets under fair value accountingMicrosoft is the world’s largest computer software company and, according to a Financial Timessurvey in May 2002, the world’s second most valuable company by market capitalisation. Extractsfrom its 2002 accounts (year ended 30 June) are set out in Exhibit 13.6.
As a US company, Microsoft prepares its accounts according to US GAAP. The accounting forfinancial investments under US GAAP is similar to that under IAS. Microsoft classifies all short-term financial investments and most long-term financial investments as ‘available-for-sale securities’ and defers unrealised gains and losses in equity. Equity securities that are not publicly traded arerecorded at cost.
420 PART 2 • THE HOUSE OF ACCOUNTING
CFA_C13.qxd 11/6/03 3:12 PM Page 420

In US$ millions 2001 2002
INCOME STATEMENTS (for year ended 30 June) (part)
Revenue 25,296 28,365
Operating income 11,720 11,910Investment income (loss):
Dividends 377 357Interest 1,808 1,762Net recognised gains/(losses) on investments (2,221) (2,424)
(36) (305)Income (loss) on equity method investments (159) (92)Income before taxes 11,525 11,513
...
BALANCE SHEETS (at 30 June) (part)
Cash and equivalents 3,922 3,016Short-term investments 27,678 35,636Other current assets (including A/R, deferred taxes) 7,610 9,924
Total current assets 39,210 48,576Equity and other investments 14,361 14,191Other long-term assets (including Property and equipment) 5,259 4,879
Total assets 58,830 67,646
STOCKHOLDERS’ EQUITY STATEMENTS (part)...
Retained earningsBalance, beginning of year (1 July) 18,173 18,899Net income 7,346 7,829Other comprehensive income:
Cumulative effect of accounting change (75) –Net gains on derivative instruments 634 (91)Net unrealised investment gains (losses) (1,460) 5Translation adjustments and other (39) 82Comprehensive income 6,406 7,825
Common stock repurchased (5,680) (6,191)Balance, end of year (30 June) 18,899 20,533
NOTES TO THE ACCOUNTS (extract)
Other comprehensive income (part)...
Net gain on derivative instruments:Unrealised gains/(losses), net of tax effect of 246 in 2001
and 30 in 2002 499 55Reclassification adjustment for (gains)/losses included in net
income, net of tax effect of 67 in 2001 and (79) in 2002 135 (146)634 (91)
Net unrealised investment gains/(losses)Unrealised holding gains/(losses), net of tax effect of (351)
in 2001 and (955) in 2002 (1,200) (1,774)Reclassification adjustment for (gains)/losses included in net
income, net of tax effect of (128) in 2001 and 958 in 2002 (260) 1,779(1,460) 5
Microsoft: extracts from 2002 accountsExhibit 13.6
(Source: Microsoft Inc., Annual Report and Accounts 2002. Copyright Microsoft Corporation. Reproduced by permission.)
CFA_C13.qxd 11/6/03 3:12 PM Page 421

422 PART 2 • THE HOUSE OF ACCOUNTING
The line item ‘Net recognised gains/(losses) on investments’ in the income statement includesimpairment losses, realised gains and losses on disposal of investments, and unrealised losses onderivatives (mainly with respect to those not designated as hedging instruments). Using informationin the notes to the accounts, the net recognised gains/(losses) on investments can be broken downas follows (amounts in US$ billions):
Year ended 30 June 2001 2002
Impairment losses (4.80) (4.32)Realised gains/(losses), equity and other investments 3.00 2.12Realised gains/(losses), short-term investments 0.17 0.26Unrealised losses, derivatives (0.59) (0.48)
Net recognised gains/(losses) on investments (2.22) (2.42)
Required
(a) Calculate Microsoft’s pre-tax financial income on a fair value basis for 2001 and 2002 (i.e. includeinvestment-related unrealised gains and losses arising in the year).
(b) After reviewing the accounts for 2001 and 2002, an analyst remarks: ‘Microsoft’s financial perform-ance is being adversely affected by the poor returns it’s earning on its investments.’ Calculate thecompany’s return on total assets, return on operating assets (ROOA) and return on financialassets (ROFA) for both years. ROOA and ROFA are defined as follows:
ROOA = ROFA =
Use pre-tax income numbers in the numerator and end-year asset figures in the denominator ofthe ratios. Assume financial income (and therefore total income) is computed on a fair value basis.Assume also that financial assets consist of short-term investments and equity and other invest-ments and all other assets are operating assets. Comment on the ratios you’ve calculated. Is theanalyst correct? What do you think Microsoft’s response might be – to the analyst’s commentsand to your calculations?
P13.7 Investments and insurance companies: impact of stock market declineAllianz is Germany’s – and Europe’s – largest insurance group. Premiums earned exceeded A50 billionin 2001 and total assets were almost A1,000 billion at the end of that year. Yet the group experienceddifficulties throughout 2001 and 2002. Its banking unit, Dresdner Bank, which it acquired in 2001, madelosses in both years. Its main property and casualty insurance business was hit hard – by asbestosclaims in the USA and flood damage claims in central Europe. And the decline in the stock marketwiped off billions of euros from its investment portfolio.
The group’s problems are reflected in its annual 2001 and interim 2002 financial statements. Returnon equity fell from 10.6% in 2000 to 4.8% in 2001, below the cost of equity capital. Performance con-tinued to be weak in the first half of 2002. Operating cash flow was negative in that period and theparent company made a loss in the second quarter. The company’s equity base was further eroded bythe decline in share prices. Shareholders’ equity (of the parent company) fell A3 billion (to A28.7 billion)in the first half of 2002: unrealised investment losses more than offset the small retained income in theperiod. Exhibit 13.7 gives a breakdown of the group’s investments at end-December 2001 and end-June 2002 and shows the change in unrealised gains on equity investments between December 2000and June 2002. (Allianz prepares its accounts according to IAS.)
In September 2002 Allianz was forced to deny reports that it needed to raise new equity capital tosupport its business. At the time its share price was A100, down from A400 at the end of 2000.
Required
(a) Analyst A reckons that Allianz has no need to raise new equity. The group can simply sell someof its investments. By doing this, it would raise cash and increase shareholders’ equity – since therealised gains would boost profits. Is the analyst’s reasoning correct? If not, explain why.
Financial incomeFinancial assets
Operating incomeOperating assets
CFA_C13.qxd 11/6/03 3:12 PM Page 422

CHAPTER 13 • FINANCIAL INVESTMENTS 423
(b) Analyst B notes that the company’s market capitalisation in September 2002 is below the fairvalue of its principal listed equity investments (as set out in the notes to the annual accounts).
In B bn Sept 2002 End-Dec 2001Market capitalisation 26 64Listed equity investments 36 (estimate) 55(MV ≥ A100m or % stake ≥ 5%)
Allianz Group: extracts from annual 2001 and interim 2002 reportExhibit 13.7
Equity securities 30/6/02 31/12/01 31/12/00Market value 65.8 81.5 91.7Cost 62.4 69.9 62.4Unrealised gains 3.4 11.6 29.3
Unrealised (loss) in period (8.2) (17.7)
(Source: Allianz Group, Annual Accounts 2001 and Interim Report for 6 months to 30 June 2002. Reproduced by permission of AllianzAktiengesellschaft.)
Condensed balance sheet (in Bbn)30/6/02 31/12/01 30/6/02 31/12/01
ASSETS EQUITY AND LIABILITIES
Intangible assets 18.5 16.9 Group equity 38.3 49.0Investments 361.3 380.2 Subordinated debt 12.1 12.2Loans to customers/banks 310.7 301.0 Insurance reserves 325.1 324.2Trading assets 117.6 128.4 Customer and bank deposits 303.9 312.7Cash and cash equivalents 17.0 21.2 Certificated liabilities 124.9 134.7Other assets 95.4 95.2 Other liabilities 116.2 110.1
Total assets 920.5 942.9 Total equity and liabilities 920.5 942.9
Investments 30/6/02 31/12/01Investments in affiliates, associates and joint ventures 10.3 10.2Investments held on account and at risk of life
insurance policyholders 25.4 24.7Other investments:
Securities held to maturity 7.2 7.7Securities available for sale
Equity securities 65.8 81.5Government bonds 113.5 112.3Corporate bonds 84.3 86.3Other 40.9 42.1
304.5 322.2Real estate used by third parties 11.6 12.0Funds held by others under reinsurance
contracts assumed 2.3 3.4Total 361.3 380.2
CFA_C13.qxd 11/6/03 3:12 PM Page 423

424 PART 2 • THE HOUSE OF ACCOUNTING
The analyst considers the company is vulnerable to a takeover bid since it is trading on a price-to-book ratio of less than one. A bidder could buy the company, sell the listed investments and earn aprofit on its investment. Comment on this argument. What are the assumptions the analyst is making?
Notes to Chapter 13
1 A company is also likely to hold surplus cash on deposit with a financial institution. For the purposesof this chapter, we treat bank deposits as ‘cash’ rather than as an investment.
2 Recognition should occur only when a company becomes a party to the contract for the financialinstrument (IAS 39: Financial Instruments: Recognition and Measurement). This can be either the date the company commits to purchase the asset (the trade date) or the date it takes delivery of it (the settlement date). Under settlement date accounting, the company must account for the change in valuebetween the trade and settlement dates for investments carried at fair value.
3 More precisely, at the fair value of the consideration given. This is important to remember when afinancial investment is acquired for other than cash.
4 Standard & Poor’s (2001), Emerging Stock Markets Factbook 2000; United Nations (2002), StatisticalYearbook 55th issue.
5 The relevant international standards are: IAS 32: Financial Instruments: Disclosure and Presentation,and IAS 39: Financial Instruments: Recognition and Measurement. The procedures described in this section incorporate the main amendments to these two standards proposed by the IASB in an exposuredraft issued in June 2002. One goal of the amendments is to align international standards on financialinstruments with the US standard on this topic (FAS 133).
6 Parker, A. and Pretzlik, C. (2002), French banks go to EU over rule changes, Financial Times, 8 October.
7 In testimony to the (US) Senate governmental affairs committee in January 2002, Frank Partnoy, auniversity professor and former derivatives trader, alleged that some Enron employees ‘used dummyaccounts and rigged valuation methodologies to create false profit and loss entries for the derivativesEnron traded’ (reported by McNulty, S. and Hill, A. (2002), Mark-to-market accounting: energygroups under renewed pressure, Financial Times, 31 January). A former controller of Dynegy, anotherUS energy trading company, claimed the company sacked him when he refused to manipulate forwardgas prices in 2000 to reduce ‘mark-to-market’ losses (McNulty, S. (2002), Former executive accusesDynegy of civil conspiracy, Financial Times, 5 August).
8 In practice, the Euribor-based interest rate would be reset semi-annually rather than annually. In addition, we assume that, in calculating the fair value of the swap contract each period, future swapreceipts or payments are based on the current Euribor rate. But, in practice, the expected interest ratein future periods may be higher or lower than the current rate and these future rates will be reflectedin the current value of the swap contract.
9 The rules governing derivatives and hedge accounting are set out in IAS 39: Financial Instruments:Recognition and Measurement.
10 Although IAS 32 is nominally the disclosure standard for financial instruments, IAS 39 also containsdisclosure provisions, especially in relation to hedge accounting. This can lead to confusion. It isexpected that the IASB will combine the two standards into one comprehensive standard on financialinstruments at a future date.
11 Barth, M., Beaver, W.H. and Landsman, W.R. (1996), Value-relevance of banks’ fair value disclosuresunder SFAS No. 107, The Accounting Review, 71(4): 513–537.
12 Bernard, V.L., Merton, R.C. and Palepu, K.G. (1995), Mark-to-market accounting for banks andthrifts: lessons from the Danish experience, Journal of Accounting Research, 33(1): 1–32.
CFA_C13.qxd 11/6/03 3:12 PM Page 424

Equity accounting andconsolidations
INTRODUCTION
A company may acquire a stake in another in order to play an active role in itsoperations. This involves buying a sizeable shareholding: shares usually carryvotes and votes spell power. In these circumstances, the methods of account-ing for investments we described in Chapter 13 are considered deficient. Theyprovide the investor company’s shareholders with insufficient informationabout the profitability and risk of the investee. As a result, alternative methodsof accounting for ‘active’ investments have been devised.
Under these methods, an investor company must distinguish investeeswhose operating and financial policies it influences from those whose policiesit controls. The former are its associates, the latter its subsidiaries. It accountsfor associates by the equity method of accounting. In the case of subsidiaries,it prepares an additional set of accounts – known as consolidated accounts –for the group of companies it controls.
We describe and illustrate, in broad terms, both the equity method andglobal consolidation accounting in section 1 of the chapter. Goodwill can ariseon the acquisition of associates and subsidiaries, and we explain the two mainways of accounting for it.
Section 2 of the chapter deals with more specialised topics. First, we extendthe discussion of consolidation accounting and show how shares in a subsidiarycompany not owned by the parent – ‘minority interests’ – are accounted for.Next, we look at investments in incorporated joint ventures and describe pro-portionate consolidation, the preferred method of accounting for them underIAS. Finally, we examine the way companies account for divestments.
Consolidated accounts bring informational gains and losses. Shareholdersbenefit from seeing the total picture – the performance and health of a groupof companies under common control. However, they are deprived of informa-tion about the components of the group. In section 3 of the chapter we look atthe difficulties shareholders face when analysing consolidated accounts and theways in which they try to overcome them.
Exhibit 14.1 summarises the circumstances in which each of the variousmethods of accounting for investments – from fair value to consolidation – isused. Note that the equity method and consolidation accounting apply only tolong-term investments in which the investor company has an active minorityor majority stake respectively.
1414
SECTION 1Core issues
l Equity method ofaccounting
l Consolidationaccounting: basicstructure
l Fair valueadjustments andgoodwill
l Consolidation and acquisitionaccounting under IAS
SECTION 2Specialised topics
l Minority interests
l Joint ventures
l Divesting a business
SECTION 3Consolidated accountsand financial statementanalysis
In this chapter
CFA_C14.qxd 11/7/03 2:13 PM Page 425

426 PART 2 • THE HOUSE OF ACCOUNTING
Financial investments: principal valuation/accounting methods*Exhibit 14.1
SECTION
1 Core issues
Equity method of accounting
A company acquires a shareholding in another which is large enough for it to exercise influenceover, but not sufficient for it to control, the investee’s operations. The investee is then an asso-ciate of the investor company. How should the investor account for its (long-term) investment?Accountants argue that, since it is able to shape the associate’s operating and financial policies,it should use the equity method (or equity accounting).
l Equity method: basic structureUnder the equity method, an investment in another company’s shares is considered equivalent to aninterest in (equity in) the net assets of that company. As the net assets of the investee change, sothe carrying amount of the investment changes too. Thus when the investee operates profitablyand increases its net assets, the investor company’s books should reflect this: the carryingamount of the investment increases. When the investee pays a dividend (or reports a loss), its netassets decrease: so in proportionate terms does the investor company’s assets. This is illustratedin diagrammatic form in Exhibit 14.2.
Assume X acquires 40% of Y’s shares at a price of 40. Y has net assets of 100 at the date ofacquisition so X buys the shares at their book value. Y earns a profit of 10 in the year followingX’s investment. As a result, its net assets increase by that amount – from 100 to 110. Under the
CFA_C14.qxd 11/7/03 2:13 PM Page 426

CHAPTER 14 • EQUITY ACCOUNTING AND CONSOLIDATIONS 427
equity method, the carrying amount of X’s investment in Y increases proportionately – from 40to 44. When Y pays a cash dividend of 5 and its net assets decline from 110 to 105, the carryingamount of X’s investment decreases by 40% of the dividend – from 44 to 42.
The investor company applies the same logic in determining the annual profit or loss from itsinvestment. Under the equity method, it reports in its income statement its share of the investee’sreported profit or loss in the period. Any dividend received from the investee has no effect on itsincome. The dividend is a distribution of the investee’s profit. The investor company wouldcount the same income twice if it recognised as income both its share of the investee’s profit andthe dividend it received.
l Mechanics of equity method: illustrationConsider the case of Pangloss Company, a newspaper publisher whose journals all carry upbeateditorials. It decides to diversify its operations. On 1 January x1, it acquires 50,000 shares ofCandide Company, manufacturer of garden products, for 5/share. Candide’s total issued sharecapital is 200,000 shares and its reported net assets on that date are 1 million. Pangloss’s 25%stake gives it influence over Candide’s operating policies. Candide reports after-tax profit of180,000 (or 0.9/share) in x1. It pays a dividend of 60,000 (0.3/share) in December x1.
Pangloss makes the following entries in x1 with respect to its investment in Candide:
(a) Acquisition of 25% stake in Candide1/x1Dr. Investment in Candide (A+) 250,000
Cr. Cash (A−) 250,000
The equity method: link between investee’s net assets and carrying amount ofinvestor’s asset
Exhibit 14.2
CFA_C14.qxd 11/7/03 2:13 PM Page 427

Pangloss reports its ‘Investment in Candide’ as a financial fixed asset in its balance sheet.
(b) Recognition of 25% share of Candide’s x1 profitEnd x1Dr. Investment in Candide (A+) 45,000
Cr. Investment income (OE+) 45,000
Pangloss recognises as income its share of Candide’s x1 profit, namely 45,000 (25% × 180,000).Its asset, ‘Investment in Candide’, increases by this amount, reflecting the increase in Candide’snet assets of which it owns a 25% share.
(c) Receipt of dividend from Candide12/x1Dr. Cash (A+) 15,000
Cr. Investment in Candide (A−) 15,000
Candide’s net assets decrease by 60,000 when it pays a dividend of this amount. Pangloss’sasset, ‘Investment in Candide’, declines in proportionate terms (25% × 60,000). Overall,Pangloss’s net assets do not change: the receipt of the cash dividend offsets the decrease in thecarrying amount of its investment.
At the end of x1, Candide reports net assets of 1.12 million. (We assume there are no changesto its capital during the year.) On that date, the carrying amount of Pangloss’s asset, ‘Investmentin Candide’, stands at 280,000, 25% of Candide’s reported net assets:
CANDIDE PANGLOSS
Net assets Investmentin Candide
Balance, 1/1/x1 1,000,000 Cost of acquiring 25% stake 250,000Profit in x1 +180,000 Share of Candide’s x1 profit +45,000Dividend in x1 −60,000 Share of Candide’s x1 dividend −15,000Balance, 31/12/x1 1,120,000 Carrying amount of investment, 31/12/x1 280,000
The 45,000 increase in Pangloss’s financial fixed asset is its share of Candide’s after-tax profit.If it so chooses, it can report its share of Candide’s profit or loss on a before-tax basis in itsincome statement. Either way, it should disclose separately the tax expense (or benefit)attributable to this profit (or loss). Note that Pangloss is unlikely to have a current tax liabilityof this amount. The tax authorities usually tax an investor company on the dividend it receivesrather than on its share of the investee’s profit.
Suppose Candide reports a loss of 180,000 in x1. Pangloss recognises its share of the loss(45,000) and reduces the carrying amount of its investment by this amount:
Dr. Investment loss (OE−) 45,000Cr. Investment in Candide (A−) 45,000
Pangloss continues applying the equity method to account for Candide’s losses in later periodsuntil the carrying amount of the investment is reduced to zero.1 However, before this occurs, theremay be evidence that the investment is impaired. As with other fixed assets, Pangloss shouldcarry out an annual impairment test of each of its equity-method investments. If the estimated
428 PART 2 • THE HOUSE OF ACCOUNTING
CFA_C14.qxd 11/7/03 2:13 PM Page 428

recoverable amount (based on discounted expected cash flows) is below the carrying amount ofthe investment, it should write down the asset and recognise an impairment loss.
As with other financial investments, the investor company records a realised gain or loss ondisposal of part or all of its stake in an associate. The gain or loss recognised is the differencebetween the consideration received and the carrying amount of the investment. Thus if Panglosssells its stake in Candide for 300,000 cash at the end of x1 when the carrying amount of its invest-ment is 280,000, it recognises a gain of 20,000.
l Equity and cost methods contrasted
What impact does the equity method have on the investor company’s accounts? One way toanswer this is to compare it with the cost method – a common method used by investor com-panies to account for associates in their individual (unconsolidated) accounts. Thus, where theinvestee is profitable and does not distribute all its earnings, the investor company reports higherincome and assets under the equity method than under the cost method. This is evident fromPangloss’s x1 accounts (amounts are in thousands).
Assets = EquitiesProfit in year
Investment (Investmentin Candide Cash income)
Equity methodPurchase of investment +250 −250 −Share of C’s profit +45 +45Share of C’s dividend −15 +15 −Balance, end-x1 280 −235 45
Cost methodPurchase of investment +250 −250 −Share of C’s profit − − −Share of C’s dividend − +15 +15Balance, end-x1 250 −235 15
Under the cost method, Pangloss recognises as income only its share of Candide’s dividend.Under the equity method, Pangloss recognises as income its share of Candide’s profit in the year.As for the balance sheet, the carrying amount of Pangloss’s investment under the equity methodexceeds that reported under the cost method by its share of Candide’s retained profits accumu-lated since acquisition.
l Application of equity method: international rules
A company following IAS must use the equity method to account for its investments in associateswhen it prepares consolidated accounts. (The 7th Directive lays down a similar requirement onEU companies.) In its own accounts, it carries the investment at either cost or fair value.2
An associate is a firm over which the investor exercises ‘significant influence’. Significantinfluence is defined as the power to participate in the investee’s financial and operating policy de-cisions. An investor company is usually considered to have significant influence if it owns 20–50%of the investee’s (voting) shares. However, the investee company may be able to prevent aninvestor with a shareholding of this size from exercising influence. Under international rules, the
CHAPTER 14 • EQUITY ACCOUNTING AND CONSOLIDATIONS 429
CFA_C14.qxd 11/7/03 2:13 PM Page 429

investor company must demonstrate (to its auditor’s satisfaction) that its power is real. Here aresituations where significant influence is evident:
l representation on the investee’s board of directors;l participation in its ‘policy-making processes’;l ‘material transactions’ between investor and investee;l interchange of managers; andl supply by the investee of ‘essential technical information’.3
Without such evidence, holdings larger than 20% should be accounted for in accordance withIAS 39 (i.e. at fair value – or cost, if fair value is not determinable). With such evidence, holdingssmaller than 20% can be accounted for by the equity method. The 20% figure is a guide, not acut-off.4
The equity method is the most widely used method of accounting for investments in associatesin consolidated accounts. Even in Australia where national rules require that such investmentsbe accounted for at cost, companies still must provide supplementary information showing the effect on the financial statements of accounting for them by the equity method. However,countries differ in their implementation of the method. An investor company may be deemed to exercise significant influence over a quoted investee company with a much smaller share-holding than 20%. For example, the lower limit is 3% in Spain and 10% in Italy. A common feature in all countries is that companies tend to decide on the accounting for associates basedon a quantitative measure (e.g. the standard 20–50% shareholding guideline) rather than on aqualitative assessment of influence.
l Rationale for equity methodWhy is a company allowed to report as income its share of the profits of other companies overwhich it has influence? This question appears to trouble the general public if press comment isany guide. Commentators consider the equity method ‘loose’ accounting since ‘all that is reallyarriving is dividends’ (The Economist, 13 January 1990).
There are two major arguments in support of the equity method. The first is conceptual.Measurement of a company’s performance is better served by an accrual- rather than a cash-based measure of income. What applies to an investor company’s own performance appliesequally to the performance of other firms which its management are able to shape.
There’s a practical argument, too. In the past, equity investments were usually accounted forat cost or LOCOM. Under these methods, readers of financial statements are at a disadvantage.They lack information about the results of the investor company’s associates (and subsidiaries).In addition, the investor company’s management have greater scope to manipulate profits. They can bring its ‘significant influence’ to bear on the dividend policy of the investee. When theinvestor company’s profits are high, the investee will be persuaded to hold, or moderate theincrease in, its dividend rate. When the investor company’s profits are low, the investee will beencouraged to raise its dividend. In this way, the underlying variability in the investor company’sown profits is concealed.
Of course, the equity method can also give rise to abuse. A company may claim to wieldinfluence over an investee when it does not, in order to inflate its reported profits. We havealready noted that, to guard against this, management must show evidence of significantinfluence. Less obvious is abuse in the opposite direction, namely denying significant influencewhen it exists. This may arise when the investee is unprofitable and the investor company wants to avoid including in income its share of the investee’s losses. For this reason, some firmsrestrict their holdings in new ventures (to, say, 10–15%) where large losses are expected initially(e.g. biotechnology ventures) and claim they are passive investors.
430 PART 2 • THE HOUSE OF ACCOUNTING
CFA_C14.qxd 11/7/03 2:13 PM Page 430

CHAPTER 14 • EQUITY ACCOUNTING AND CONSOLIDATIONS 431
Consolidation accounting: the basic structure
l Form and purpose of consolidated accounts
Consider now the case of a company that acquires a majority (51% or more) of the voting shares of another. Such a shareholding gives it control of the investee. (It can gain control inother ways, as we’ll see later.) It may be a short step – in terms of share ownership – for aninvestor company to move from ‘significant influence’ to ‘control’ but the difference in account-ing is profound.
Accountants argue that when one firm acquires control of another, a new economic entity (a group) is created. A group consists of the investor company (the parent) and the investeecompany or companies (its subsidiaries). The parent company prepares accounts for the group:these are known as consolidated accounts. In addition, the parent and each of the subsidiary companies, being legal entities, continue to prepare separate accounts.
Thus, if P Company controls S Company, three sets of accounts are produced: for P alone(showing, as an asset, its investment in S), for S and for the P group (P and S combined). Weillustrate the links between the accounts of parent, subsidiary and group in Exhibit 14.3.
In the annual accounts of a group (e.g. P Group), the income statements and balance sheetsof the individual subsidiary companies are not presented. However, EU companies usually dis-close, with their consolidated accounts, the balance sheet and, UK and Irish companies excepted,the income statement of the parent company.
A group of companies under common control has, in most countries, no legal personality – for example, contracts cannot be signed in its name. However, it clearly has economicsignificance. Consolidated accounts provide financial statement readers with information about allthe resources under one company’s command: what form they take, how they’re financed and howsuccessfully they’ve been employed in the year. This is the raison d’être of consolidated accounts.
l Global consolidation
Global consolidation involves the combining of the accounts of parent and subsidiaries.Conceptually, it is simple. The assets and liabilities of the various companies are added together to form a consolidated balance sheet. Similarly, their revenues and expenses are summed to give a consolidated income statement. In practice, the exercise is more complicated. In preparing consolidated accounts, management must make adjustments to the accounts of the parent andsubsidiary companies. The adjustments are of three types:
1 Alignment of accounting policies. Consolidated accounts assume group companies follow acommon set of accounting policies. The first adjustment is to apply group accounting policiesto the accounts of all subsidiary companies.
2 Elimination of intercompany balances. Intercompany balances must be eliminated when combining the accounts of group companies in order to avoid double-counting. Examples areintercompany sales and loans.
3 Accounting for consolidation-only balances. Certain items arise only on consolidation and mustbe accounted for in group accounts. Examples are goodwill on consolidation and minorityinterests.
In this chapter we illustrate the latter two adjustments. We start with the first consolidationadjustment a company makes – to remove the share capital and reserves (at acquisition) of itssubsidiary companies.
CFA_C14.qxd 11/7/03 2:13 PM Page 431

432 PART 2 • THE HOUSE OF ACCOUNTING
l Illustration 1: Initial consolidationGlawari Industries, currently run by Hanna Glawari, the widow of the founder, is rumoured to be the subject of a takeover by an unnamed French company. The Pontevedrian govern-ment betrays the spirit of the EU’s single market and seeks a national solution. It persuadesDanilo Corporation (CEO: Graf Danilo) to make an offer for Glawari. At first, Danilo hesitates.He’s not sure there’s much synergy between his company’s leisure business (principally, therestaurant/nightclub, Maxim’s) and Glawari’s Vilja timber interests. Hanna has her doubts,
Parent, subsidiary and group: illustration of accounting linksExhibit 14.3
CFA_C14.qxd 11/7/03 2:13 PM Page 432

CHAPTER 14 • EQUITY ACCOUNTING AND CONSOLIDATIONS 433
too. They become convinced of the merits of union, however, when each discovers the quality of the other’s assets.
Danilo acquires for cash all of Glawari Industries’ share capital of 200,000 shares at 1 Januaryyear 1. It pays 5 for each share, the book amount of Glawari’s net assets at that date. (To begin with, we’ll assume the book values of Glawari’s assets and liabilities are the same as their current values.) Exhibit 14.4 shows Danilo’s own balance sheet, immediately before and after theacquisition of Glawari, as well as Glawari’s balance sheet at that time.
We now construct a consolidated balance sheet at 1 January. To do this, we must eliminatethe balances at that date in Glawari’s shareholders’ equity accounts and in Danilo’s ‘Investmentin Glawari’ account. Consider why. Glawari’s share capital is now owned by Danilo’s shareholders.Their interests, however, are already accounted for in Danilo’s shareholders’ equity. By the sametoken, Glawari’s assets of 1.8 million and liabilities of 0.8 million are included in the consolidatedassets and liabilities of the Danilo group. To include Danilo’s asset ‘Investment in Glawari’ inconsolidated assets as well would be to count Glawari’s net assets twice. Exhibit 14.5 shows theconstruction of the consolidated accounts of the Danilo group at the start of year 1.
Danilo GlawariBefore After
buying G buying GAssetsInvestment in Glawari – 1,000 –Other assets 5,000 4,000 1,800
Total 5,000 5,000 1,800EquitiesShareholders’ equity 3,600 3,600 1,000Liabilities 1,400 1,400 800
Total 5,000 5,000 1,800
Danilo Company and Glawari Company: summary balance sheets at start of year 1(amounts in 000)
Exhibit 14.4
Danilo Eliminations(after and other Danilo
buying G) Glawari adjustments* Group AssetsInvestment in G 1,000 – –1,000 –Other assets 4,000 1,800 0 5,800
Total 5,000 1,800 –1,000 5,800 EquitiesShareholders’ equity 3,600 1,000 –1,000 3,600 Liabilities 1,400 800 0 2,200
Total 5,000 1,800 –1,000 5,800
* Elimination entry on consolidation:
Dr. Shareholders’ equity (of Glawari) 1,000Cr. Investment in Glawari (Danilo’s asset) 1,000
Danilo Group and group companies: summary balance sheets at 1 January year 1(amounts in 000)
Exhibit 14.5
CFA_C14.qxd 11/7/03 2:13 PM Page 433

434 PART 2 • THE HOUSE OF ACCOUNTING
Note that the elimination entry does not appear in either Danilo’s or Glawari’s books. Thegroup’s accounts comprise a worksheet (usually computer-based), listing balances from parentand subsidiary company books together with the elimination (and other) entries needed to cre-ate the consolidated financial statements.
Two further points on Exhibits 14.4 and 14.5. First, Danilo offers Hanna cash for her sharesin Glawari Industries. He could have offered her securities – shares or bonds of DaniloCompany, for example. The market value of those securities would then determine the cost ofthe acquisition. Second, Danilo accounts for the purchase of Glawari as an acquisition in itsgroup accounts, since it gains voting control of the company. Should neither party to a businesscombination dominate, the transaction is viewed as a merger. We describe merger accounting, theapproach once widely used to account for such business combinations, at the end of this section.
l Illustration 2: Consolidated year 1 income statementDanilo and Glawari trade separately for most of the year. However, in the final quarter, Glawarisells goods to Danilo on account for 320,000 which had cost Glawari 240,000 to produce. Byyear-end, Danilo has sold the goods for 375,000 to outside entities and has paid Glawari all but 50,000 of the amount it owes its subsidiary. Exhibit 14.6 shows the derivation of the group’syear 1 income statement from the (assumed) revenues and expenses of Danilo and Glawari.Income taxes are ignored. The income statements are extended to include the effect of dividendpayments by Glawari (60,000) and Danilo (220,000). In Danilo’s own accounts, the dividendreceived from Glawari is shown as investment income.
The Danilo group’s year 1 consolidated income is 700,000, the difference between consolidatedrevenues and consolidated expenses. After taking account of the 220,000 dividend to Danilo’sshareholders, the group’s retained income for the year is 480,000.
Two adjustments are made in calculating consolidated income. The purpose of eliminationentry (a) is to avoid the double-counting of intercompany sales. Goods sold by Glawari to Daniloare also included in Danilo’s accounts (as sales of 375,000 to outside entities). Since Glawarirecognises the 240,000 cost of its sales to Danilo in its own accounts, an adjustment must bemade in the consolidated accounts to avoid the counting of those costs twice.
Eliminationsand other Danilo
Danilo Glawari adjustments* Group
Operating revenues 6,600 3,000 (a) –320 9,280Operating expenses –6,100 –2,800 (a) +320 –8,580
Operating income 500 200 0 700Investment income 60 – (b) –60 0
Total income 560 200 –60 700Dividend paid –220 –60 (b) +60 –220
Retained income 340 140 0 480
* Elimination entries on consolidation:(a) Dr. Sales revenue (Glawari) 320
Cr. Cost of sales (Danilo) 320
(b) Dr. Investment income (Danilo) 60Cr. Retained income (Glawari) 60
Danilo Group and group companies: summary year 1 income statements (amounts in 000)
Exhibit 14.6
CFA_C14.qxd 11/7/03 2:13 PM Page 434

Glawari Danilo Elimination Group
Sales revenue 320 375 −320 375Cost of sales −240 −320 −(−320) −240Operating income 80 55 0 135
Elimination entry (b) serves a similar purpose. Distribution of part of Glawari’s year 1 profit toits owner, Danilo, is an internal transaction from the group’s perspective.
In our example, we assume Danilo sells in year 1 all the goods it purchased from Glawari thatyear. If, however, part of Glawari’s sales to Danilo are still in Danilo’s inventory at the end of theperiod, Glawari’s profit on those sales must be excluded from consolidated income – and con-solidated inventory. For example, suppose Danilo sells to outside entities only 256,000 (i.e. 80%)of the goods it purchased from Glawari for 320,000. Then the elimination entry at end-year 1 is:
Dr. Sales revenue 320,000Cr. Cost of sales 304,000Cr. Inventory 16,000
Consolidated income and inventory are both reduced by 16,000, one-fifth of the gross profit of80,000 (320,000 – 240,000) which Glawari recognises on its intercompany sale. Only profitsrealised from sales to outsiders should be recognised on consolidation.
l Illustration 3: Consolidated balance sheet at end-year 1Of course, Danilo’s and Glawari’s operations in year 1 also affect their end-year balance sheets –and that of the group. Exhibit 14.7 sets out all three, together with the consolidation adjust-ments. To simplify calculations, we assume that for both companies the balance in ‘Liabilities’ isthe same at the start and end of year 1.
On consolidation, Danilo’s asset ‘Investment in Glawari’ and Glawari’s pre-acquisition share-holders’ equity are eliminated (entry (c)) to avoid double-counting. Amounts owing between groupcompanies are also eliminated (entry (d)). As a result, consolidated receivables and payablesreflect only those amounts owed by and to outside entities. Note the consistency between theconsolidated year 1 income statement and balance sheet. The consolidated net assets increaseduring year 1 by 480,000, the amount by which profits retained by the group increase.
Consolidation adjustments are made to other intercompany transactions, for example inter-company loans (and related interest) and sales of fixed assets between group companies. In eachcase, the purpose is the same: to avoid double-counting assets and liabilities (and revenues andexpenses) and to ensure that the consolidated accounts reflect only profits realised from trans-actions with outside entities.
Fair value adjustments and goodwill
A parent company rarely acquires a subsidiary at a price equal to the book value of the latter’snet assets. The price it pays reflects its assessment of the cash flows those net assets are expectedto generate. The amount may be more or less than book value. As a result, a positive or negative‘consolidation difference’ arises. How is this difference accounted for?5
In most countries the difference is accounted for in two steps. First, the investor companyrevalues the individual assets and liabilities of the acquired company to fair value at the date ofacquisition. (In countries which observe historical cost accounting strictly, this is a consolidationexercise only: the subsidiary’s books are not altered.6) ‘Fair value’ means market value or a current
CHAPTER 14 • EQUITY ACCOUNTING AND CONSOLIDATIONS 435
CFA_C14.qxd 11/7/03 2:13 PM Page 435

436 PART 2 • THE HOUSE OF ACCOUNTING
valuation. The reason for this adjustment is clear. If the investor company purchased assets fromthe investee on an individual basis, it would record them at their fair value at the date of exchange.
Any remaining difference between purchase price and the fair value of net assets at acquisi-tion is described as ‘goodwill’ (‘negative goodwill’ if the purchase price is less than fair value).Goodwill represents the capitalised value of the ‘above-normal’ earnings attributable to anacquired company or collection of assets. In the second of the two steps, the goodwill is usuallyrecognised as an intangible asset in the consolidated balance sheet. A minority practice is to writeit off against consolidated reserves at the date of acquisition. There are also different ways com-panies account for negative goodwill. It may be deducted from the positive goodwill balance,shown as ‘deferred income’ on the equities side of the consolidated balance sheet or, in the caseof a bargain purchase, recognised as a gain in the consolidated income statement.
An upward valuation of assets will lead, via higher cost of sales and depreciation charges, tolower consolidated income in later periods. Where goodwill is capitalised and amortised, con-solidated income will be further reduced by the amortisation charge. (It will be increased if thereis negative goodwill and it is amortised into income over time.)
l Illustration 4: Goodwill on consolidationWe now illustrate both treatments of goodwill. Let us suppose that Danilo pays 8 per share, or1.6 million, for the net assets of Glawari which on 1 January have a book value of 1 million.(Danilo’s ‘other assets’ fall to 3.4 million as a result.) We also assume that, of the positive consolidation difference of 600,000:
Eliminationsand other Danilo
Danilo Glawari adjustments* Group
AssetsInvestment in G 1,000 – (c) –1,000 –Other assets
Start year 1 4,000 1,800Year 1 increase 340 140
4,340 1,940 (d) –50 6,230Total 5,340 1,940 –1,050 6,230
EquitiesShareholders’ equity:
at 1 January 3,600 1,000 (c) –1,000 3,600Year 1 income retained 340 140 0 480
3,940 1,140 –1,000 4,080Liabilities 1,400 800 (d) –50 2,150
Total 5,340 1,940 –1,050 6,230
* Elimination entries on consolidation:
(c) Dr. Shareholders’ equity (of Glawari) 1,000Cr. Investment in Glawari (Danilo’s asset) 1,000
(d) Dr. Accounts payable (Danilo’s liability) 50Cr. Accounts receivable (Glawari’s asset) 50
Danilo Group and group companies: summary balance sheets at 31/12/year 1(amounts in 000)
Exhibit 14.7
CFA_C14.qxd 11/7/03 2:13 PM Page 436

CHAPTER 14 • EQUITY ACCOUNTING AND CONSOLIDATIONS 437
l 200,000 is attributable to a revaluation of Glawari’s fixed assets to fair value; andl the balance of 400,000 represents goodwill.
Exhibit 14.8 shows how the start-year 1 consolidated balance sheet of the Danilo group isderived under each of the two treatments of goodwill: capitalisation (panel (a)) and immediatewrite-off (panel (b)).
Notice how, under capitalisation, an intangible asset is recognised. ‘Goodwill’ appears only inthe consolidated balance sheet. Under the alternative treatment, immediate write-off (IWO),group reserves are reduced by the amount of the (positive) goodwill. Thus in panel B, the con-solidation adjustment to shareholders’ equity of 1.4 million includes the goodwill of 400,000arising from the purchase of Glawari.7
What is the effect on the group accounts of later periods if goodwill is capitalised? Exhibit 14.9shows the consolidated accounts of the Danilo Group for year 1, prepared under the assump-tion that Danilo capitalises and amortises the goodwill arising on the acquisition of GlawariIndustries. We also assume Danilo’s and Glawari’s operating results are the same as those illus-trated in Exhibits 14.6 and 14.7 but, for simplicity’s sake, we exclude intercompany transactions(other than the dividend payment from Glawari to Danilo).
Danilo Eliminations(after and other Danilo
buying G) Glawari adjustments* Group (a) Goodwill capitalisationAssetsGoodwill – – +400 400Investment in G 1,600 – –1,600 –Other assets 3,400 1,800 +200 5,400
Total 5,000 1,800 –1,000 5,800EquitiesShareholders’ equity 3,600 1,000 –1,000 3,600Liabilities 1,400 800 0 2,200
Total 5,000 1,800 –1,000 5,800
(b) Write-off of goodwillAssetsInvestment in G 1,600 – –1,600 –Other assets 3,400 1,800 +200 5,400
Total 5,000 1,800 –1,400 5,400EquitiesShareholders’ equity 3,600 1,000 –1,400 3,200Liabilities 1,400 800 0 2,200
Total 5,000 1,800 –1,400 5,400
* Eliminations and other adjustments:Panel (a) Panel (b)
Dr. Goodwill on consolidation 400 –Dr. Fixed assets (‘Other assets’) 200 200Dr. Shareholders’ equity (of Glawari) 1,000 1,400
Cr. Investment in Glawari (Danilo’s asset) 1,600 1,600
Danilo Group and group companies: summary balance sheets at 1 January year 1assuming (a) capitalisation and (b) immediate write-off of goodwill (amounts in 000)
Exhibit 14.8
CFA_C14.qxd 11/7/03 2:13 PM Page 437

438 PART 2 • THE HOUSE OF ACCOUNTING
Danilo makes two additional consolidation adjustments during year 1. First, depreciation ischarged on the revalued assets. The assets are assumed to have a remaining life of eight years andare depreciated on a straight-line (SL) basis. This results in additional depreciation expense of25,000 (200,000/8 years). (To keep things simple, we assume the revaluation and additionaldepreciation are consolidation entries.) Second, goodwill is assumed to have a five-year life. Thisyields an annual charge, assuming SL amortisation, of 80,000 (400,000/5 years). This, too, is a
Summary year 1 income statementsEliminationsand other Danilo
Danilo Glawari adjustments* GroupOperating income 500 200 – 700Investment income 60 – –60 –
Total income 560 200 –60 700Additional depreciation (a) –25 –25Goodwill amortisation (b) –80 –80
Consolidated income 595Dividend –220 –60 +60 –220
Retained income 340 140 –105 375
Summary balance sheets at end-year 1Eliminationsand other Danilo
Danilo Glawari adjustments* GroupGoodwill – – +400 # 320
(b) –80 $Investment in G 1,600 – –1,600 –
+200 #Other assets 3,740** 1,940** (a) –25 $ 5,855
Total assets 5,340 1,940 –1,105 6,175
Shareholders’ equityStart year 1 3,600 1,000Year 1 income retained 340 140
3,940 1,140 –1,000 # 3,975(a)&(b) –105 $
Liabilities 1,400 800 0 2,200Total equities 5,340 1,940 –1,105 6,175
* Additional depreciation and goodwill amortisation adjustments:
(a) Dr. Depreciation expense (200/8 years) 25Cr. Accumulated depreciation, fixed assets 25
(b) Dr. Goodwill amortisation expense (400/5 years) 80Cr. Accumulated amortisation, goodwill 80
** Derivation of end-year 1 ‘Other assets’:Start year 1 + Year 1 income retained
Danilo 3,400 + 340 = 3,740Glawari 1,800 + 140 = 1,940
Danilo Group and group companies: summary year 1 accounts assuming goodwillcapitalisation and amortisation (amounts in 000)
Exhibit 14.9
CFA_C14.qxd 11/7/03 2:13 PM Page 438

consolidation entry. As a result of these adjustments, year 1 group income and end-year share-holders’ equity are 595,000 and 3,975,000 respectively – or 105,000 less than the amountsreported in Exhibits 14.6 and 14.7. As before, we assume that the liabilities’ balance is unchangedand therefore the increase in shareholders’ equity from the companies’ profitable operationsflows through to ‘other assets’.
Consolidation and acquisition accounting under IAS
l Consolidation requirementsInternational standards lay down simple rules to ensure consolidated accounts are consistentand timely. As already mentioned, parent and subsidiaries should apply similar accounting policies; if policies are different, the accounts should be adjusted before they are consolidated. In addition, consolidated and parent company accounts should be drawn up to the same date.If this is not feasible, then the reporting date of a subsidiary’s accounts should be no more thanthree months before that of the consolidated accounts. The accounting effect of any significantevents that occur between these reporting dates should be incorporated in the consolidatedaccounts.
A company prepares consolidated accounts if it controls another. What is meant by ‘control’?According to IAS, evidence of control exists when:
l the investor company owns a majority of the investee’s voting shares; orl it controls a majority of the voting rights of the investee’s shares as a result of an agreement with
other shareholders; orl it can exercise a dominant influence on the investee’s policy-making under a statute or an agree-
ment; orl it can appoint or remove a majority of the investee’s directors; orl it can cast a majority of the votes at meetings of the board of directors.8
Thus in some circumstances a company can exercise control over another without owning amajority of its voting shares.
Certain companies may be exempted from the consolidation requirement. One example is the intermediate parent company, that is, a company with subsidiaries that is itself owned byanother – so long as the ultimate parent company prepares consolidated accounts and minorityshareholders of the intermediate parent consent.9 The EU’s 7th Directive also exempts the ‘small’(EU-based) group, i.e. one where two of the following three criteria are not exceeded in two consecutive financial years: total assets of a14.6 million; total sales of a29.2 million; and averageemployees in the year of 250 (art. 6). The exemption does not apply to quoted companies.
Consolidation of some subsidiaries is forbidden. IAS require exclusion of a subsidiary where:
l control is intended to be short-term; orl the parent’s ability to receive funds from the subsidiary is constrained because of severe
restrictions on its operations.10
Under IAS, the parent company accounts for such unconsolidated subsidiaries at fair value – orat cost, if fair value can’t be determined reliably.
Subsidiaries that have activities very different from those of other group companies present a special accounting problem. Consider, for example, the car manufacturer that has a financesubsidiary that lends money not just to car buyers but also to purchasers of other products andservices. The balance sheet and income statement characteristics of the finance subsidiary arecloser to those of a bank than those of a manufacturer. It was long felt that consolidation of all
CHAPTER 14 • EQUITY ACCOUNTING AND CONSOLIDATIONS 439
CFA_C14.qxd 11/7/03 2:13 PM Page 439

subsidiaries in these circumstances would distort the group accounts. Thus under earlier inter-national standards, companies had to account for subsidiaries pursuing dissimilar activities bythe equity method rather than fully consolidate them.
Non-consolidation can lead to distortion of another kind, however. As we’ve seen, the equitymethod provides limited information about the investee’s performance and financial condition.All that appears in the consolidated accounts is one line on the income statement (‘Share ofprofit or loss of unconsolidated subsidiary’) and one line on the balance sheet (‘Investment inunconsolidated subsidiary’). As a result, investors can’t determine the profit margin or financialleverage of the equity-accounted subsidiary. For this reason, IAS now require full consolidationof subsidiaries pursuing dissimilar activities.11 Companies with such subsidiaries must providedisaggregated balance sheet and income statement information – either on the face of the con-solidated financial statements or in the notes – to allow investors to understand better how the components of the group have performed. We describe these disclosures in section 3 of thechapter.
l AcquisitionsUnder IAS, the acquirer accounts for the purchase of another company or business at cost. ‘Cost’is the cash paid, or the fair value of the consideration given, for the net assets acquired. The assetsand liabilities acquired or assumed comprise only those existing at the date of acquisition: thusthe acquirer can’t include within assumed liabilities a provision for restructuring the acquiredbusiness, unless it puts forward a restructuring plan at or before the acquisition date.12
Assets and liabilities acquired or assumed must be measured at fair value. The excess of costof acquisition over the fair value of net assets acquired is ‘goodwill’. The acquirer must capitalisegoodwill in the consolidated accounts and amortise it on a straight-line basis over its useful life.‘Useful life’ is the period over which the acquirer expects to receive economic benefits from thegoodwill asset. IAS lay down a 20-year upper limit for useful life but this can be extended if theacquirer can justify it. Like other fixed assets, goodwill must be assessed annually for impairmentand written down when the recoverable amount is less than the carrying amount.
When the cost of acquisition is less than the fair value of net assets acquired, the acquirerrecords ‘negative goodwill’ – as a deduction under intangible assets – in the consolidatedaccounts. If negative goodwill relates to future losses or expenses the acquirer expects to incur asa result of the acquisition, it’s recognised as income when the losses or expenses are recognised(i.e. it has an offsetting effect). Any remaining negative goodwill should be amortised (usuallyon a straight-line basis) over the remaining average useful life of the acquired depreciableassets.13
The EU’s 7th Directive on consolidated accounts is more permissive than IAS in somerespects. EU member states can allow companies to write off goodwill against reserves, insteadof capitalising it. The 4th Directive (on annual accounts) lays down a maximum amortisationperiod of five years, but member states can permit companies to write off capitalised goodwillover a longer period provided the amount doesn’t exceed the asset’s estimated useful life.14
l Goodwill: international practiceMost companies today capitalise goodwill arising on consolidation. Until recently, some EUmember states (Denmark, Ireland, the Netherlands, UK) and certain countries with a UK legaland accounting tradition (Hong Kong, Malaysia, Singapore) permitted immediate write-off(IWO) as an alternative to capitalisation and it was widely used. As a result of new national standards introduced in the late 1990s, however, the IWO alternative was banned in most ofthese countries. The arguments of those favouring capitalisation – that goodwill represents part
440 PART 2 • THE HOUSE OF ACCOUNTING
CFA_C14.qxd 11/7/03 2:13 PM Page 440

CHAPTER 14 • EQUITY ACCOUNTING AND CONSOLIDATIONS 441
SECTION
2
of the investment made by the acquirer and the asset can be identified and measured reliably at the date of acquisition – have prevailed. Although the use of IWO is now rare, its impact canstill be seen in company accounts: reported goodwill and reserves are lower, and balance sheetleverage higher, than in companies that have always capitalised goodwill.
Goodwill remains a controversial issue. Currently the debate centres on whether goodwill shouldbe amortised on a systematic basis. Those who oppose the practice argue that the amortisationcalculation is arbitrary. It’s not possible to determine the estimated life of the asset or how itsbenefits will be consumed in this period. The consolidated balance sheet will contain a moreaccurate measure of goodwill if the carrying amount is based on an annual impairment review.Those in favour argue that it is no more difficult to estimate the useful life of goodwill than it isto estimate that of other (amortisable) intangibles. Moreover, systematic amortisation providesless scope for managers to manipulate company earnings. Impairment reviews rely heavily onestimates by managers of future corporate cash flows which, by their nature, are hard to verifyand therefore to audit.
The IASB has already indicated that it accepts the anti-amortisers’ arguments. It published in the summer of 2002 a summary of Board discussions on business combinations. The Boardplans to issue new standards on this topic in 2003 and 2004. The following are among the keyproposed changes to the existing standard:
l Merger accounting is to be banned (see Box 14.1). All business combinations are to beaccounted for by the purchase method.
l Goodwill (and other intangible assets with indefinite useful lives) should not be amortised.Instead, they should be tested for impairment at each financial year-end.
l Intangibles with finite useful lives that are acquired in a business combination should berecognised separately so long as the asset is separable and arises from contractual or legalrights. In-process research and development costs are one such intangible.
l Negative goodwill should not be carried forward. The acquirer should reassess the net assetsacquired and recognise all liabilities – including contingent liabilities – arising as a result ofthe business combination. Valuations should be checked for measurement error. Any remain-ing negative goodwill represents a bargain purchase and should be recognised immediately as a gain.15
Specialised topics
Minority interests
An investor company may acquire less than 100% of the investee’s shares. In principle, it cangain control of the investee by purchasing a majority (more than 50%) of its voting shares.Moreover, outright purchase may be neither desirable nor feasible. For example, it may wantcertain shareholders (e.g. former owner-managers) to continue to be involved in its new sub-sidiary – or it may be forced to accept them. National law in many developing countries requireslocal participation in a domestic company controlled by a foreign investor.
The interests of outside shareholders in a group’s subsidiary companies are known as minor-ity (or third-party) interests. Under global consolidation, the parent company consolidates 100%of the subsidiary’s net assets and income, even when it does not own 100% of the shares. A companywith a controlling stake has control over all the investee’s assets and liabilities. Thus all the assets
CFA_C14.qxd 11/7/03 2:13 PM Page 441

Merger accountingBOX14.1
The pooling-of-interests method – or merger accounting – was a popular method of account-ing for business combinations in the USA until it was banned in 2001. Why was it popular –and why was it banned?
Accountants devised the pooling method because it was felt that the alternative, the purchasemethod, was an inappropriate method of accounting for mergers. In a merger, two companiesjoin together – or ‘pool their interests’. To effect the merger, one company – the offeror, A –offers its shares in exchange for those of B, the offeree. The ratio of shares exchanged is basedon the market values of the two companies’ shares at that date (and whether or not there isany cash or other consideration as well). Unlike in an acquisition, there’s no major outflow ofcash or other resources. All that occurs in substance is a change in the ownership of B’s shares:B’s shareholders become part of A’s. Since the now-united entities continue trading as before,there’s no need to distinguish pre-combination from post-combination activities, so it’s argued.
The pooling method reflects this ‘uniting of interests’. Here are its essential features.
1 Revenues and expenses of the two companies are combined from the start of the period in whichthe merger takes place. The consolidated income statement for calendar year x1 includes the fullx1 revenues and expenses of both companies even if the merger takes place in December.
2 Assets and liabilities are combined at their carrying amounts. There are no fair value adjust-ments. No goodwill arises on consolidation.
3 Consolidated retained profits include the retained profits of the combining companies from theirinception. Both companies’ accumulated profits are available for distribution.
Not surprisingly, the pooling method found favour with acquisition-hungry companies, espe-cially during the merger wave of the 1960s. They liked its financial effects. The offeror’s earnings pershare is boosted by a full year’s earnings of the offeree firm in the year of merger. Reported pro-fitability is raised: assets are lower (no goodwill) and income is higher (no goodwill amortisationcharges). And the offeree’s pre-combination retained profits can be distributed as dividend.
As a result, a growing number of US companies accounted for acquisitions as well as mergersby the pooling method. To halt the abuse, US regulators introduced rules in the early 1970sdesigned to limit its use. The key requirement was that the combination had to be largely share-based: A must offer shares (with identical voting rights to its existing ones) in exchange forsubstantially all of B’s. ‘Substantially all’ was defined as 90% or more. B’s shareholders couldbe offered cash but pooling could only be applied if the actual cash element of the deal was10% or less. The rules included anti-avoidance measures – preventing, for example, creepingpurchases of shares followed by an all-share offer or major cash distributions to the offeree’sshareholders either before or after the merger.
US companies responded to the new rules by structuring many acquisitions as mergers. All-share offers became popular, especially in periods of high share prices: in the late 1990s,the pooling method was used in 30% of all merger and acquisition transactions. Some com-panies went to great lengths to secure its use. According to Lys and Vincent, AT&T reportedlyoffered to pay NCR’s shareholders an extra US$450 million (increasing the purchase price to US$7.5 billion) if it could account for the acquisition of their company by the poolingmethod. AT&T’s managers estimated that accounting for NCR as a purchase would have cutconsolidated 1990 earnings by around 20% (because of goodwill amortisation charges) andthey were concerned about the impact of the earnings decline on AT&T’s share price.16
The continued abuse of the pooling method troubled investors and companies. There waslittle support for the method outside the USA, even though it was permitted under IAS (andthe EU’s 7th Directive). After much study, US and international regulators concluded that all business combinations should be accounted for by the purchase method. True mergers –where no party dominates the combined entity – are rare. Any criteria used to distinguish suchtransactions would be arbitrary and companies would find ways of circumventing them.
CFA_C14.qxd 11/7/03 2:13 PM Page 442

CHAPTER 14 • EQUITY ACCOUNTING AND CONSOLIDATIONS 443
and liabilities (and revenues and expenses) of the subsidiary should be combined with those ofthe parent, it’s argued. The interests of the subsidiary’s minority shareholders are then recognisedseparately in the consolidated accounts – as a deduction from group income in the income statementand as a separate equity account on the balance sheet. Exhibit 14.10 shows diagrammatically howminority interests arise under global consolidation.
l IllustrationTo illustrate the accounting for minority interests, we return to our original example outlined inExhibit 14.4 in which Danilo acquires shares in Glawari at book value. Assume now that Daniloacquires only 75% of Glawari’s 200,000 shares at a price of 5/share at the start of year 1. Danilo’sconsolidated balance sheet at that date is derived in Exhibit 14.11.
Parent company and outside shareholders: interests in group entityExhibit 14.10
Eliminationsand other Danilo
Danilo Glawari adjustments* Group AssetsInvestment in G 750 – –750 –Other assets 4,250 1,800 0 6,050
Total 5,000 1,800 –750 6,050
EquitiesShareholders’ equity 3,600 1,000 –1,000 3,600Minority interest in G’s net assets – – +250 250Liabilities 1,400 800 0 2,200
Total 5,000 1,800 –750 6,050
* Eliminations and other adjustments:
Dr. Shareholders’ equity (of Glawari) 1,000Cr. Investment in Glawari (Danilo’s asset) 750Cr. Minority interest in G’s net assets (25% × 1,000) 250
Danilo Group and group companies: summary balance sheets at 1 January year 1assuming Danilo has 75% interest in Glawari (amounts in 000)
Exhibit 14.11
CFA_C14.qxd 11/7/03 2:13 PM Page 443

Danilo’s cash outlay is 750,000 (150,000 × 5/share), not 1 million, and its ‘other assets’ fallfrom 5 to 4.25 million. We assume Hanna Glawari retains a 25% stake in Glawari Industries. Onconsolidation, the subsidiary’s capital and reserves at the date of acquisition and the parent’sinvestment in the subsidiary are both eliminated as before.
What’s new in this case is that Hanna’s minority stake is recognised in the group accounts as‘Minority interest in G’s net assets’ at that date. It is valued at 250,000, 25% of Glawari’s net assetvalue, and forms part of the Danilo group’s equity. (We assume that the book values of Glawari’sassets and liabilities at the start of year 1 reflect their fair values then and thus no adjustmentsneed be made to them in the consolidated accounts.)
We now move forward a year and examine Danilo’s consolidated accounts for year 1. Wemake the same trading assumptions as we made in our goodwill example (Exhibit 14.9):
l Danilo and Glawari have operating incomes of 500,000 and 200,000 respectively;l Danilo distributes 220,000 and Glawari 60,000 of their respective profits;l there are no intercompany transactions.
The group’s income statement for year 1 and its end-year 1 balance sheet are derived in Exhibit 14.12.How does Hanna’s minority stake affect the group accounts? First, the group income state-
ment distinguishes between the total consolidated income and the consolidated incomeattributable to the parent company’s shareholders. In year 1, one-quarter of Glawari’s 200,000income or 50,000 accrues to Hanna, the minority shareholder. Thus while total income is still700,000, consolidated income attributable to Danilo’s shareholders is only 650,000.
Second, Glawari’s 60,000 dividend is shared 75:25 between Danilo’s shareholders and Hanna.As a result, Danilo reports investment income of 45,000 in its own accounts: this is eliminatedon consolidation. At the same time, the equity account ‘Minority interest’ on the group balancesheet is adjusted. ‘Minority interest’ represents, in approximate terms, the minority shareholders’interest in the net assets of subsidiaries. In our example, the book amount of this equity accountincreases in year 1 by Hanna’s share of Glawari’s retained income that year, namely 35,000(50,000 income less the 15,000 dividend Hanna receives). The end-year 1 balance in the accountis 285,000, the initial 250,000 plus the 35,000 share of retained income. Note that this balance isalso 25% of Glawari’s net assets of 1,140,000 on that date.
l Focus of consolidated accounts: parent company or entity?There is a wider issue here: what should be the focus of consolidated accounts? Should they highlight the interests of the parent company’s shareholders? After all, it’s they who control thedestiny of the group. Or should the interests of parent company and minority shareholders betreated equally, given that the entity depends on the capital of both?
This issue affects the way consolidated accounts are prepared. If consolidated accounts are to focus on the interests of the parent company’s shareholders, then only the parent company’sshare of fair value adjustments and goodwill is recorded when a subsidiary is acquired. Theminority shareholders’ stake is recorded at book value. (The argument is that the purchase trans-action values directly only the parent company’s stake.) If, however, the focus of consolidatedaccounts is the entity, then the minority shareholders’ share of fair value adjustments and good-will must also be recognised.
There are differences in presentation, too. ‘Minority interests’ on the balance sheet may beshown separately from the equity of parent company shareholders (parent company approach)or as part of group capital and reserves (entity approach).
Current international standards favour the parent company approach. It’s not mandatory,however. Some companies prepare consolidated accounts on an entity basis, on the grounds thatthis is more in keeping with the aim of consolidation.17
444 PART 2 • THE HOUSE OF ACCOUNTING
CFA_C14.qxd 11/7/03 2:13 PM Page 444

CHAPTER 14 • EQUITY ACCOUNTING AND CONSOLIDATIONS 445
Summary year 1 income statementsEliminationsand other Danilo
Danilo Glawari adjustments* Group
Operating income 500 200 – 700Investment income(75% of G’s dividend) 45 – (a) –45 –Total income 545 200 –45 700Minority interest in G’s income (b) –50 –50Income attributable to D’s shareholders 650
(a) +45 #Dividend –220 –60 (c) +15 $ –220Retained income 325 140 –35 430
Summary balance sheets at end-year 1Eliminationsand other Danilo
Danilo Glawari adjustments* Group
Investment in G 750 – –750 –Other assets:
Start year 1 4,250 1,800Year 1 increase 325 140
4,575 1,940 0 6,515Total assets 5,325 1,940 –750 6,515 Shareholders’ equity
Start year 1 3,600 1,000 –1,000 3,600Year 1 income retained 325 140 (b)&(c) –35 430
3,925 1,140 4,030Minority interest in G’s net assets – – +250 #
(b)&(c) +35 $ 285
Liabilities 1,400 800 0 2,200Total equities 5,325 1,940 –750 6,515
* Post-acquisition eliminations and other adjustments:
(a) Dr. Investment income (of Danilo) 45Cr. Retained income (of Glawari) 45
To eliminate intercompany dividend.(b) Dr. Minority interest in G’s income (25% x 200) 50
Cr. Minority interest in G’s net assets 50To recognise minority interest in G’s income.
(c) Dr. Minority interest in G’s net assets (25% x 60) 15Cr. Retained income (of Glawari) 15
To record effect of G’s dividend on minority interest.
Danilo Group and group companies: summary year 1 accounts assuming Danilo has75% interest in Glawari (amounts in 000)
Exhibit 14.12
CFA_C14.qxd 11/7/03 2:13 PM Page 445

446 PART 2 • THE HOUSE OF ACCOUNTING
Joint ventures
In recent years, it has become common for companies to enter into joint ventures with otherfirms. A joint venture is a contractual arrangement in which two or more companies agree to work together on, and accept joint control over, some economic activity, for example producing ormarketing a product. Such an alliance can take one of several forms. Sometimes, assets are jointlyowned (for example, an oil pipeline and pumping equipment) or operations are carried out jointly(for example, the marketing and distribution of a drug in a foreign market). In other cases, a separate company is formed with the ‘joint venturers’ as shareholders. A joint venture allowsparticipants to share risks when embarking on a new line of business or expanding an existingone. It also means, of course, that returns are shared too.
Incorporated joint ventures pose an interesting accounting problem. Since the company isjointly owned, no one shareholder exercises dominant influence over it: thus no shareholdershould use global consolidation to account for its investment.
Investor companies use either the equity method or proportionate consolidation (pro-rataconsolidation) to account for their investment in an incorporated joint venture. The mechanicsof equity accounting – and its rationale – are discussed in section 1 of the chapter. Under pro-portionate consolidation, each investor includes in its consolidated accounts its share of the assets, liabilities, revenues and expenses of the jointly controlled company.18 It does not include its share ofprofits on transactions between it and the joint venture, since such gains are not realised.
l Incorporated joint venture: accounting by venturer
We contrast the two ways of accounting for a joint venture, proportionate consolidation and the equity method, in the venturer’s books. Candide, our garden products manufacturer, andMartin, a potter, decide that garden ornaments – and red sheep in particular – have good salesprospects. They set up a new entity, Eldorado Company, to market them. Each invests 500,000 cashin the company. Eldorado borrows 800,000 and acquires plant, inventory and other assets withthe 1.8 million capital.
We illustrate the accounting for the joint venture in Candide’s books. (The same issues applyto Martin, the other venturer.) Prior to the investment, the company has assets of 3 million andliabilities of 1.4 million. Exhibit 14.13 shows the effect of the investment on its accounts on 1 January before Eldorado begins operations.
Under proportionate consolidation, Candide combines 50% of Eldorado’s assets (900,000) withits own (2.5 million, after the investment of 500,000 cash in Eldorado). Candide’s consolidatedliabilities figure is calculated in the same way ((50% × 800,000) + 1.4 million). Under the equitymethod, Candide records as an asset its investment in Eldorado (500,000 at 1 January).
As for the income statement, under proportionate consolidation, Candide includes its share(50%) of Eldorado’s revenues and expenses in its consolidated income statement. Under the equitymethod, it shows, as investment income, its share of Eldorado’s profit or loss.
Thus Candide’s reported assets and liabilities and revenues and expenses are higher underproportionate consolidation. However, its total profit or loss – and, by extension, its end-yearshareholders’ equity – are the same under the two accounting methods.
Advocates of proportionate consolidation argue it better reflects the investor’s financial performance and position. Use of the equity method results in a loss of information: Candide’sshare of Eldorado’s liabilities, for example, are concealed in the asset ‘Investment in Eldorado’.Critics, however, maintain it is misleading for a company to consolidate assets and liabilities(and revenues and expenses) where it has full control with those where it has joint control. Tohave a 50% stake in a building valued at 1 million is not the same as owning outright a building
CFA_C14.qxd 11/7/03 2:13 PM Page 446

CHAPTER 14 • EQUITY ACCOUNTING AND CONSOLIDATIONS 447
FactsCandide and Martin each owns 50% of Eldorado’s shares. Each invests 500 in Eldorado.Eldorado borrows 800. Thus Eldorado’s initial total assets are 1,800.
Summary balance sheets at 1 January
Candide: Candide:Candide proportionate equity
(pre- consolidation accountingEldorado Eldorado) of Eldorado of Eldorado
AssetsInvestment in Eldorado – – – 500Other assets 1,800 3,000 3,400* 2,500
Total 1,800 3,000 3,400 3,000EquitiesShareholders’ equity 1,000 1,600 1,600 1,600Liabilities 800 1,400 1,800 1,400
1,800 3,000 3,400 3,000
* 3,000 – 500 + 900 5Assets pre- Investment 50% of 6
Eldorado in Eldorado E’s assets 7
Candide’s accounting for Eldorado joint venture: summary balance sheets at 1 January under proportionate consolidation and equity method (amounts in 000)
Exhibit 14.13
valued at 500,000. Under this view, joint control implies the ability to exercise significantinfluence and no more. Investments in joint ventures should therefore be accounted for by theequity method.
l International rules and practiceUnder IAS, proportionate consolidation is the preferred method of accounting by venturers forincorporated joint ventures; the equity method is an ‘allowed alternative’.19 (The EU’s 7th Directivealso permits both methods.) Where proportionate consolidation is used, the venturer’s share ofthe joint venture’s assets, liabilities, revenues and expenses can be shown separately in the con-solidated accounts or combined with like items. Separate presentation overcomes the objectionto proportionate consolidation mentioned above.
The choice of accounting treatments under IAS reflects differences in national accountingpractice. For example, Dutch and French companies have long used proportionate consolidationto account for incorporated joint ventures; US companies normally account for such ventures bythe equity method. The consequence is that two venturers – Candide and Martin, for example –may account for their investments in a jointly controlled company (Eldorado) using differentaccounting methods.
Divesting a business
Companies dispose of businesses as well as acquire them – and for similar reasons. Managementhope to create wealth for shareholders by selling off subsidiaries that are performing poorly orare not part of the company’s core operations. (The stock market, we’re told, values more highly
CFA_C14.qxd 11/7/03 2:13 PM Page 447

448 PART 2 • THE HOUSE OF ACCOUNTING
the earnings of ‘focused’ companies.) In addition, companies in financial difficulties sell busi-nesses to raise cash. Divesting businesses became popular in the USA in the 1980s and spread toother countries in the 1990s. Recent examples include DuPont’s carve-out of its Conoco oil busi-ness in 1998 and Telmex’s spin-off of its mobile phone business in 2001. Research shows that theaverage demerger benefits shareholders. A study of 38 European spin-offs in the 1990s foundthat the share price of companies announcing a demerger outperformed the market by 5.5% onaverage at the time of the announcement.20
Divestment can take several forms. The divesting company (i.e. the parent) can sell anunwanted business to another company (or a private equity fund) via a trade sale. Alternatively,it can offer shares in the business to stock market investors in an initial public offering (IPO).However, when stock markets are depressed, it may decide that demerging the business createsmore value for shareholders. There are two main types of demerger.21 In a spin-off, the parentcompany distributes new shares representing 100% of the unwanted business directly to itsshareholders on a pro-rata basis (e.g. one share in the spun-off entity for every share held in theparent). The spun-off entity lists its shares on the stock market and shareholders can then tradethem. In an equity carve-out, the parent offers shares in part of the demerged entity via an IPO.It can spin off or sell the rest of the now quoted company at a later date. The diagram below con-trasts the two types of demerger.
Note that both pure spin-offs and equity carve-outs are structured so that shareholders can post-pone or avoid tax on the distribution of shares in the demerged entity.
How do companies account for divestments? This depends on the divestment route taken. In the case of a trade sale or IPO, the parent company receives cash, removes the assets and liabilities of the divested business from the consolidated balance sheet and records a gain or losson disposal. If, in an IPO, the parent loses control of the divested business but doesn’t sell all its shares to public investors, it deconsolidates the business and records the net assets retained asan investment. An example may help here. Suppose SpiceFolk, a spice-trading company basedin South East Asia, decides to sell 70% of its shares in TeaTotal, a fully owned tea-trading sub-sidiary. It raises 350 in cash from an IPO. TeaTotal has net assets of 400 then. SpiceFolk recordsthe IPO transaction in its consolidated accounts as follows. (All amounts are in millions. Taxesand transaction costs are ignored.)
Dr. Investment in TeaTotal 120Dr. Cash 350
Cr. Net assets of TeaTotal 400Cr. Gain on disposal of TeaTotal shares 70
CFA_C14.qxd 11/7/03 2:13 PM Page 448

SECTION
3
The credit to ‘Net assets of TeaTotal’ is a summary entry. In practice, SpiceFolk removes fromthe consolidated accounts the carrying amounts of TeaTotal’s individual assets and liabilities. Asfor its remaining investment in TeaTotal, SpiceFolk accounts for this by the equity method –assuming it exercises significant influence over the company.
In the case of an equity carve-out, the parent company retains control of the subsidiary afterthe IPO. Outside shareholders have a minority interest in the subsidiary’s net assets and this isreflected in the parent’s consolidated accounts. Thus if SpiceFolk sells 30% of TeaTotal in an IPOand receives cash of 130, it makes the following entry in the consolidated accounts to record thetransaction.
Dr. Cash 130Cr. Minority interest (in TeaTotal’s net assets) 120Cr. Share premium 10
‘Minority interest’ reflects outside shareholders’ 30% stake in TeaTotal’s net assets of 400. Theprice SpiceFolk receives for each TeaTotal share is assumed to be less in an equity carve-out thanin a sale of a majority stake because there’s no control premium (and less liquidity). SpiceFolkcredits the gain on disposal of TeaTotal shares to the share premium account. TeaTotal is stillpart of the SpiceFolk group. Gains and losses from trading own shares – whether the parentcompany’s or a subsidiary’s – should not be recognised in income since this undermines theearnings number as a measure of corporate performance.
A spin-off is treated in the consolidated accounts as a ‘dividend in kind’. The parent companydistributes part of its assets – by way of shares – to its shareholders and the distribution isrecorded as a reduction in retained earnings. SpiceFolk records a dividend in kind of 400 on dis-tribution of its shares in TeaTotal to its shareholders:
Dr. Retained earnings 400Cr. Net assets of TeaTotal 400
No gain or loss is recorded since, under current accounting practice, the shares distributed to theparent company’s shareholders are valued at the carrying amount of the underlying net assets ofthe demerged entity.
To help investors gauge the effect of a divestment on future consolidated earnings and cashflows, IAS require firms to show separately the assets and liabilities, revenues and expenses ofoperations that are to be ‘discontinued’ – either on the face of the financial statements or in thenotes. We illustrate IAS-required disclosures for discontinued operations in Chapter 20.
Consolidated accounts and financial analysis
l Disclosures related to equity/consolidation accounting
Most companies include a statement of consolidation policy in the notes to their consolidatedaccounts. The statement sets out, at a minimum:
l the criteria used to determine which investee companies are consolidated – and when;l the consolidation procedures followed; andl the accounting treatment of associated companies.
CHAPTER 14 • EQUITY ACCOUNTING AND CONSOLIDATIONS 449
CFA_C14.qxd 11/7/03 2:13 PM Page 449

450 PART 2 • THE HOUSE OF ACCOUNTING
BestPrice Stores, the fictitious Euroland retailer we encountered in earlier chapters, providessuch a statement in its x2 accounts; see Exhibit 14.14.
BestPrice lists in its annual report its principal subsidiaries and associates, giving the name, country of incorporation and its percentage stake in each. This is common practice. The informa-tion helps financial statement users in several ways. They learn more about the geographicalspread – and the related operating and financial risks – of the company’s business. In addition, bycomparing the listing of subsidiaries and associates in successive annual reports, they discover howthe composition of the group is changing – for example, which subsidiaries and associates havebeen acquired and sold and in which companies the group’s stake has increased or decreasedduring the year.
With this information, users can better explain changes in the consolidated numbers. Forexample, a reduction in a majority holding in a subsidiary is reflected in an increase in ‘Minorityinterests’ in the balance sheet.
Another important disclosure concerns related-party transactions. Two parties are ‘related’ ifone is able to control or exercise significant influence over the other in making financial and operat-ing decisions. Note that, in this context, an individual such as a large shareholder or a director ofa company – or a close family member – can be a related party of a company. ‘Transactions’include purchases and sales of goods and services, licence agreements, loans, guarantees andmanagement contracts. Under international rules, a company must disclose the nature and extentof related-party transactions.22
Consolidation principles
The consolidated accounts include those of the parent company, BestPrice Stores S.A., andall companies in which it held directly or indirectly more than 50% of the voting power at theend of the year. Changes in the consolidation scope take effect from the date of acquisition ordivestment. The global consolidation method has been applied. The minority interests of thirdparties in equity and income are shown separately in the balance sheet and income statement.
Investments in associated companies have been accounted for in the consolidated financialstatements under the equity method. An associated company is a company in which the groupholds between 20% and 50% of the voting power and exercises significant influence over itsoperating and financial decisions. Under the equity method, the group’s share of the profit orloss of an associated company is shown in the consolidated income statement under‘investment income’ and the group’s share in the associated company’s equity is shown in theconsolidated balance sheet under ‘long-term financial investments’.
All material intercompany balances and transactions have been eliminated in the consolidatedfinancial statements.
Intercompany shareholdings have been eliminated by deducting the amount of eachsubsidiary’s equity at the time of acquisition from the acquisition cost of its shares. Thedifference between a subsidiary’s acquisition cost and the fair value of its net assets at thetime of acquisition has been entered as goodwill in the consolidated balance sheet.
BestPrice Stores: statement of consolidation policy in ×2 accountsExhibit 14.14
(Source: Nokia Corporation, Annual Report and Accounts 2002.)
CFA_C14.qxd 11/7/03 2:13 PM Page 450

CHAPTER 14 • EQUITY ACCOUNTING AND CONSOLIDATIONS 451
l Analysing consolidated accounts: problem areasInvestors value consolidated accounts. Empirical evidence suggests that they prefer them tounconsolidated ones.23 However, they encounter problems using them. We identify three anddiscuss how they try to overcome them.
Performance of components of groupConsolidated accounts are, by definition, aggregated accounts. They show the combined financialresults and condition of the companies in the group. It is difficult to find out from them how the various affiliates have performed. The problem is particularly serious when the group isdiversified by product line or market. In this case, there is a greater likelihood that the aggregatedresults mask differences in performance within the group.
How do investors get accounting data on a group’s components? Companies sometimes help.Under EU and international rules, certain companies must disclose, in the notes to the accounts,key financial numbers like sales broken down by line of business and geographical area. (We discuss segmental reporting in detail in Chapter 20.)
A second line of attack is to look at the accounts of the parent and subsidiary companies. Aswe mentioned earlier, a European company that produces consolidated accounts often includespart or all of the parent company’s accounts in the annual report. To get financial informationabout subsidiary companies is more difficult. In most European countries, however, public com-panies, whether quoted or unquoted, must file their accounts with a government agency and the public can inspect them. Investors have two options: they can consult this source directly orthey can purchase the products of information providers – such as credit rating agencies andfinancial database producers – who make use of it.
Change in composition of group and effect on accountsWhen a company sells part of its business or takes over another firm, the composition of the groupchanges. The consolidated sales and profit figures reported after the change may not be com-parable to those reported before. Without additional information, investors will have difficultyjudging how well the group has performed in the current period relative to the past. Trends insales, margins and asset efficiency are likely to be distorted. Future profits are harder to forecast.
Once again, investors can turn to the accounts of the individual companies in the group –including those bought or sold – and try to unravel the effects of changes in the group’s make-up.But they often find valuable information in the consolidated accounts themselves. Under IAS, acompany must show the effects of major business disposals – on sales and profits, for example –on the face of the consolidated income statement. (We illustrate the disclosures companies makeconcerning their ‘discontinuing’ operations in Chapter 20.) In the case of acquisitions, it mayprovide pro forma financial statements (showing, for example, what sales and profits would havebeen in the absence of the acquisition) in the notes.
Off-balance-sheet debtHighly indebted firms are risky investments for creditors and shareholders alike. They are atgreater risk of bankruptcy and bear higher capital costs as a result. Management of these firmshave an incentive to conceal corporate debt. One approach, as we saw in Chapter 11, is to ensurethat debt is carried by affiliates that are equity-accounted and not fully consolidated.
Accounting for investments by the equity method is often described as one-line consolida-tion. The company’s shares of the investee’s revenues and expenses are netted and shown as oneline (‘Investment income’ or ‘Equity in earnings of investee’) on its income statement. Similarly,its shares of the investee’s assets and liabilities are netted and shown as one line (‘Financial fixedasset’) on its balance sheet.
CFA_C14.qxd 11/7/03 2:13 PM Page 451

452 PART 2 • THE HOUSE OF ACCOUNTING
Under one-line consolidation, the company reports profitability and leverage ratios differentfrom – and usually more favourable than – those it reports under global or proportionate con-solidation. For example, total revenues and assets are lower under one-line consolidation. Netprofit, however, is not affected. The result is that reported net margins are higher but total assetturnover is lower. More importantly, the liabilities of the equity-accounted affiliates are notincluded in consolidated liabilities because they are set off against assets in the ‘Investment’ account.The effect? Reported leverage ratios are lower.
Contrast the effect on Danilo’s accounts of accounting for its (100%) stake in Glawari under the equity method and global consolidation. Exhibit 14.15 presents, in summary form,
Equity GlobalDanilo Company method consolidationYear 1 income statementOperating revenues 6,600 9,280Operating expenses –6,100 –8,580
Operating profit 500 700Share of Glawari’s profit +200 –
Net profit 700 700Dividend –220 –220
Retained profit in year 480 480
End-year 1 balance sheetInvestment in Glawari:
Cost of acquisition 1,000Share of retained profit 140
1,140 –Other assets:
Start-year 1 4,000 5,800Year 1 increase 340 480
4,340 6,280Total assets 5,480 6,280
Shareholders’ equity:Start-year 1 3,600 3,600Year 1 retained profit 480 480
4,080 4,080Liabilities 1,400 2,200
Total equities 5,480 6,280
RatiosNet profit margin ratio (in %) 10.6% 7.5%(Net profit/Operating revenues)
Total asset turnover 1.2× 1.5×(Operating revenues/Assets at end-year)
Liabilities-to-equity ratio (in %) 34.3% 53.9%(Total liabilities/Total shareholders’ equity)
Danilo’s investment in Glawari: equity accounting and global consolidationcontrasted (amounts in 000)
Exhibit 14.15
CFA_C14.qxd 11/7/03 2:13 PM Page 452

CHAPTER 14 • EQUITY ACCOUNTING AND CONSOLIDATIONS 453
Danilo’s year 1 accounts under both accounting methods. (The underlying figures are takenfrom Exhibits 14.6 and 14.7. We assume no intercompany transactions have taken place.) Key financial ratios are also given. If Danilo were to account for its investment in Glawari by the equity method, its year 1 profit margin ratio would be higher (10.6% against 7.5% under full consolidation) and its end-year 1 liabilities-to-equity ratio would be lower (34.3% against53.9%).
Companies also have an incentive to ensure that newly acquired affiliates that are highly leveraged qualify for equity method treatment. Thus Renault acquired only a 37% stake inNissan in 1999 when the Japanese vehicle manufacturer was in financial difficulties. Renault’sstake was judged to be a participating rather than a controlling one: it was forced to report itsshare of Nissan’s losses but avoided consolidating Nissan’s debts.24
How does an investor discover the extent of debt raised off balance sheet via associated com-panies? Where the associate is publicly quoted, as in Nissan’s case, the information is readilyavailable. Failing this, the investor must unearth the accounts of the associated companies to discover the extent of their financial leverage. Sometimes the parent company comes to theinvestor’s rescue and provides, in the notes, condensed accounts of each of its principal equity-accounted investments.25
In some countries, companies can use special purposes entities (SPEs) to hide debt. An SPEis a trust, partnership or other legal vehicle set up to hold and manage financial assets such asreceivables. For example, a company that securitises its receivables can transfer them to an SPE andthe latter then raises debt to finance them (see Box 10.1 in Chapter 10). Companies also use SPEsto avoid capitalising lease obligations. An SPE acquires assets – with debt or under a finance lease– and the company sponsoring the SPE then ‘rents’ them under an operating lease arrangement.
Under US accounting rules, the sponsor of the SPE does not consolidate the SPE’s accountswith its own so long as the SPE meets certain conditions. Among these conditions is the require-ment that providers of outside capital to the SPE – that is, parties unconnected with the sponsor-ing company – must have made a substantial investment in it. This is defined as at least 3% ofthe SPE’s total assets.26 Given that the percentage of required outside capital is so low, it is quitepossible for the sponsoring company to control an SPE and yet avoid consolidating it. Enron,the failed energy trading company, made extensive use of SPEs. It’s estimated that by the end of1999 it had removed US$27 billion – the equivalent of 45% of its total assets – from its balancesheet in this way. There was little information in Enron’s accounts about the assets of the SPEsor the debt used to finance them but, in some cases, the SPEs’ own financial statements werepublicly available.
Summary
When a company owns a large proportion of another’s shares, the financial investment is of aspecial kind. The accounting reflects this.
A company that has an active minority stake in another – normally in the range of 20% to50% – can usually exercise significant influence over its affairs. The investee is then its associate.It accounts for the associate by the equity method (in its consolidated accounts). It recognises as income its share of the profit or loss of the associate. The carrying amount of the investment is approximately its share of the associate’s net assets. One advantage of equity accounting forinvestors is that a company is unable to manipulate its reported profits through its associate’sdistribution policy.
A company that controls another prepares, in addition to its own accounts, consolidatedaccounts for the two companies. The most common way for a company to acquire control is bybuying a majority of another’s voting shares. Under consolidation accounting, parent company
CFA_C14.qxd 11/7/03 2:13 PM Page 453

454 PART 2 • THE HOUSE OF ACCOUNTING
and subsidiaries combine their accounts, eliminating intercompany balances and unrealisedprofits or losses on intercompany transactions in the process. Under global consolidation, 100%of a subsidiary’s assets and liabilities, revenues and expenses are included in the consolidatedaccounts. If the parent owns less than 100% of the subsidiary’s shares, the interests of outsideshareholders in the subsidiary’s income and net assets are recorded as ‘minority interests’ in theconsolidated accounts.
A thorny problem is the accounting treatment of ‘goodwill’. In consolidation accounting, this is the difference that arises when the price an investor company pays for its shareholding is greater than the fair value of the net assets it acquires. IAS require firms to capitalise and amortise goodwill. In some countries, however, firms can substitute an annual impairment reviewfor systematic amortisation of the goodwill asset. Analysts overcome accounting differences byadjusting firms’ accounts for goodwill amortisation.
Business combinations may take other forms and the accounting must adapt to them. In the case of joint ventures, firms share control. Such ventures are proportionately consolidated or accounted for by the equity method. Mergers, however, are accounted for in the same way as a purchase: it’s argued that even in mergers of equals one firm effectively controls another. But where a firm demerges an entity by spinning it off to shareholders, the spin-off is viewed asa dividend in kind and its assets and liabilities are removed from the consolidated accounts at their carrying amounts.
Investors benefit from consolidation accounting. Consolidated accounts show the financialperformance and condition – the total liabilities as well as the total assets – of an economic entityunder common control. They pay a price, however. Consolidated accounts are aggregatedaccounts. In the absence of additional disaggregated data, it is hard for investors to discover howthe components of the group are performing.
Problem assignments
P14.1 Equity method and consolidation accounting: general issues
Equity method and consolidation accounting are not always straightforward as the following (inde-pendent) situations demonstrate.
(1) Oceana, an investment company, increases its stake in Etam, a retailer, from 24% to 34.4% andannounces that it will begin using the equity method to account for the investment in its consolidatedaccounts. Etam, a quoted (and profitable) company, files a complaint with the regulatory arm ofits national stock exchange, arguing that Oceana’s proposed accounting treatment is misleadingsince it doesn’t exercise significant influence over Etam. Oceana has no representatives on Etam’sboard of directors and doesn’t have any cooperation agreements with the company. In reply,Oceana’s management maintain they can exert significant influence. First, Oceana is Etam’s largestshareholder. In addition, its shareholding gives it the power to block special resolutions (whichrequire a 75% majority in general meetings of shareholders).
(2) The Photowell Group manufactures, sells and operates coin-operated automatic photobooths.The group has operations throughout the world, with photobooths in metro stations, airports andshopping malls in every major country. Photowell’s reported turnover in x7 was 170 million (in localcurrency). ‘Turnover’ comprises revenues from manufacturing and selling photobooths as well asrevenues from operating and servicing them. The company presented its consolidated turnover inits x7 accounts as follows:
CFA_C14.qxd 11/7/03 2:13 PM Page 454

CHAPTER 14 • EQUITY ACCOUNTING AND CONSOLIDATIONS 455
Turnover MillionsManufacture and distribution of photobooths:
Sales to other divisions and companies within the Group 10.3Sales to third parties 35.8
46.1Operation and servicing of photobooths 123.9
170.0
The company explains its treatment of turnover in the notes to its x7 accounts:
TurnoverTurnover includes sales, by the Group’s manufacturing divisions to Group undertakings [i.e. other divisions and companies within the Group], of equipment which is then capitalised with the accountsof the Group’s undertakings. . . . Inter-company profit arising on such sales is excluded from theGroup’s profit.
(3) Koopman, a Dutch trading house, is preparing consolidated accounts for calendar year x1. Justbefore year-end, a Latin American subsidiary, Lamsa, collapses with large debts. Koopman’smanagement want to exclude the subsidiary from the consolidated accounts for x1 and accountfor the investment at cost. They argue that, given the bankruptcy of Lamsa, Koopman’s invest-ment will be sold off or liquidated in x2 and thus its control of Lamsa is ‘temporary’.
Required
Consider the accounting issue in each of the above cases. How should Oceana account for its invest-ment in Etam in its consolidated accounts? How should Photowell report consolidated turnover in x7?How should Koopman account for its investment in Lamsa in its consolidated x1 accounts? Give reasons for your answers.
P14.2 The nature of goodwillDuring the so-called bubble years in the late 1990s, many companies in the telecoms, media and tech-nology (TMT) sectors used their highly valued shares to acquire other companies. They accounted forthe acquisitions by the purchase method in most cases. Since the acquired companies often had fewtangible assets, much of the purchase price was attributed to goodwill. When share prices in the TMTsectors collapsed in 2001/02, the acquirers were forced to write down the goodwill on their acquisitions,following interim and year-end impairment reviews. The sums involved were huge in some cases.Examples are given below.
GoodwillGoodwill write-downs
Acquirer Target(s) on acquisition in 2001/02
America Online Time Warner US$128bn US$54bnJDS Uniphase SDL #
E-Tek $ US$56.5bn US$54.3bn
Vivendi Canal Plus A14.1bn A11.2bnFrance Telecom Mobilcom A2.7bn A2.5bn
Many managers argue that goodwill write-downs are bookkeeping adjustments and have little or no economic significance. According to Tony Muller, then chief financial officer of JDS Uniphase,big accounting charges like goodwill write-downs have no impact on ‘real-world issues like cash flowor the company’s bank covenants’ (Financial Times, 18 June 2001).
Required
(a) What is the economic significance, if any, of a goodwill write-down? If a write-down has no economic significance, what is the economic significance of the goodwill asset itself?
CFA_C14.qxd 11/7/03 2:13 PM Page 455

(b) Some analysts argue that a distinction should be made between acquisitions for cash and acquisitions for ‘paper’ (i.e. using the acquirer’s own shares). Goodwill write-downs representvalue destruction in the former case but not in the latter. Comment on this argument. Why is itcorrect – or incorrect?
P14.3 Long-term equity investments: cost method and equity methodOlivia, a fashion house, acquires 1.2 million of the 4 million voting shares of Malvolio, a small textilecompany (best known product: yellow stockings) for A15 million at the start of year 6. The carryingamount of Malvolio’s net assets is A50 million at that date. Malvolio reports net income in year 6 of A5million and pays a cash dividend of A0.5 per share that year.
Required
(a) Assume Olivia does not exercise significant influence over Malvolio and uses the cost method toaccount for her investment. Show the effect on Olivia’s year 6 accounts of:(i) the acquisition of her stake in Malvolio;(ii) the reporting by Malvolio of net income in year 6; and(iii) the payment by Malvolio of cash dividends to his company’s shareholders in year 6.
Use journal entries or the balance sheet equation.
(b) Assume Olivia does exercise significant influence over Malvolio and uses the equity method toaccount for her investment. Show the effects on Olivia’s year 6 accounts of the three events listedin (a) above.
(c) Suppose that Malvolio distributes a share dividend – of one share for every five shares held – toall shareholders in year 6. The share dividend is declared after the payment of the cash dividend.How does this affect your answers to (a) and (b) above?
Check figure:(b) ‘Investment in Malvolio’ #
at end-year 6 $ A15.9m
P14.4 Equity method, goodwill and lossesAt the start of x1, Pasquale Company pays A10 million to acquire a 25% stake in Norina SpA. Norina’snet assets at that date are A24 million. Pasquale exercises significant influence over Norina andaccounts for its investment by the equity method. The company attributes the difference between thepurchase price and its share of Norina’s net assets to goodwill and proposes to amortise the asseton a straight-line basis over ten years. (It does not show the goodwill separately.)
The Norina investment is a disastrous one for Pasquale. Norina pays no dividends. It incurs lossesof A4 million in calendar year x1 and further losses of A1.2 million in x2. Pasquale carries out an impair-ment review at the end of x2, as a result of which it writes off the remaining goodwill. In x3 Norinagenerates a small profit of A1.6 million. Pasquale takes advantage of the recovery in the value of itsinvestment by selling its stake in Norina for A4.4 million at the end of x3.
Required
(a) Show the effect of its investment in Norina on Pasquale’s accounts for each of the years x1−x3.Use journal entries or the balance sheet equation.
(b) Suppose that Pasquale carried out an impairment review at the end of x1 and wrote off the wholeof its investment in Norina then. How would your answer to (a) differ?
Check figure:(a) Investment in Norina,
carrying amount at end-x2 A4.7m
456 PART 2 • THE HOUSE OF ACCOUNTING
CFA_C14.qxd 11/7/03 2:13 PM Page 456

CHAPTER 14 • EQUITY ACCOUNTING AND CONSOLIDATIONS 457
P14.5 Consolidation: basic structure
Impressed by the research and production skills of Fleurant Corporation, Argan SA decides at the end of x1 to buy a controlling interest in the pharmaceutical company for cash. The book value ofFleurant’s net assets is 50 then. Argan’s net assets prior to the acquisition are 350. (All amounts arein millions.)
In x2, Argan reports operating profit of 30 (i.e. before including income from Fleurant) and pays dividends of 14. That same year, Fleurant’s profit is 6 and the dividend it pays is 4. (In its ownaccounts, Argan uses the cost method to account for its investment in Fleurant.) Any goodwill arisingon consolidation is amortised on a SL basis over 10 years.
Required
Prepare (i) a summary consolidated balance sheet at end-x1 and (ii) summary x2 accounts (incomestatement and end-year balance sheet) for the Argan Group (Argan + Fleurant) under each of the following assumptions:
(a) Argan purchases 100% of Fleurant’s shares for 50;
(b) Argan purchases 100% of Fleurant’s shares for 80;
(c)* Argan purchases 80% of Fleurant’s shares for 40.
Check figure:(a) Argan Group:
Shareholders’ equity, end-x2 372
* Assignment draws on material in section 2 of this chapter.
P14.6 Consolidation and intercompany sales(1) At the start of year 8, Fireball Company pays 10/share in cash for all 3 million of Slowcoach
Company’s shares. Slowcoach has assets of 40 million and liabilities of 10 million at that date.Fireball’s assets before the acquisition are 150 million and its liabilities 50 million.
Required
Draw up a summarised consolidated balance sheet for the Fireball Group at the start of year 8.Assume Slowcoach follows the same accounting policies as Fireball and its assets and liabilities arestated at fair value.
(2) In year 8, Fireball reports revenues of 80 and expenses of 60. (All amounts are in million.) Slow-coach’s reported revenues and expenses are 37 and 34 respectively. During year 8, Fireball sellsgoods to Slowcoach on account for 10 which cost it 7 to make and for which Slowcoach has paidFireball only 5 by year-end. Slowcoach sells all the goods to outside customers for 12 in year 8.
Fireball pays a dividend of 8 to its shareholders in year 8; Slowcoach pays a dividend of only 2that year. The two companies’ total liabilities at end-year 8 are unchanged from the start of the year.
Required
(a) Draw up summarised consolidated accounts for year 8 for the Fireball Group.
(b) How would your answer to (a) differ if Slowcoach had sold to outside customers only half of thegoods purchased from Fireball and recognised revenues of 6 on them? ( [Assume] Slowcoach’stotal reported revenues and expenses are still 37 and 34 respectively.)
Check figures:(2)(a) Year 8 group profit 23.0m
(b) End-year 8 shareholders’ equity 113.5m
CFA_C14.qxd 11/7/03 2:13 PM Page 457

458 PART 2 • THE HOUSE OF ACCOUNTING
P14.7 Consolidation: fair value adjustments and restructuring provisionAt start year 5, Hardcastle pays 80 in cash to acquire 100% of Marlow’s shares. The balance sheetsof the two companies at end year 4 are set out below. (Amounts are in A million.)
Hardcastle MarlowFixed assetsProperty, plant and equipment 184 142Investments 76 83
260 225
Current assetsInventories 72 29Receivables 135 75Cash and marketable securities 158 41
365 145Total assets 625 370
Shareholders’ equity 327 70Debt 139 163Provisions and other long-term liabilities 68 75Accounts payable and accrued expenses 91 62
298 300Total equities 625 370
Hardcastle prepares consolidated accounts at start-year 5. It uses the purchase method to accountfor the acquisition and makes the following fair value adjustments to Marlow’s accounts. (Amountsare in A million.)
Equipment: downward revaluation −20Investments: upward revaluation +30Inventories: reduction due to larger provision for slow-moving items −3Receivables: reduction due to increase in allowance for doubtful accounts −5
Hardcastle plans to restructure the Marlow business and wants to include a restructuring provision of12 with the fair value adjustments at the time of the initial consolidation.
Required
(a) Prepare an initial consolidated balance sheet for the Hardcastle Group at start-year 5. Include therestructuring provision in the fair value adjustments.
(b) Hardcastle and Marlow report year 5 income of 39 and 14, respectively. The fair value adjustmentto equipment is depreciated over the assets’ remaining life of 5 years. No further value adjust-ments are made to Marlow’s investments in year 5. The adjustments to inventories and receiv-ables are ‘amortised’ through COGS and bad debt expense in year 5. Goodwill is subject to anannual impairment test: no impairment is recorded in year 5. Compute the year 5 consolidatedincome of the Hardcastle Group. Ignore income taxes.
(c) The auditors disagree with Hardcastle’s treatment of the restructuring provision. They note thatthere was no detailed formal plan for restructuring Marlow at the time of acquisition. They requireHardcastle to record the provision as an additional cost in Marlow’s year 5 accounts and notinclude it with the fair value adjustments in the initial consolidation. How does this change in treatment affect (i) the initial consolidated balance sheet at start-year 5; and (ii) the calculation ofconsolidated income for year 5?
Check figure:(a) Goodwill 20
CFA_C14.qxd 11/7/03 2:13 PM Page 458

CHAPTER 14 • EQUITY ACCOUNTING AND CONSOLIDATIONS 459
P14.8 Joint ventures: alternative methods of accounting*At the start of year 1, Zeus reports the following balance sheet:
Zeus CompanyAssets EquitiesCash 20 Liabilities 100Other assets 180 Shareholders’ equity 100
200 200
On that date Zeus enters into a joint venture with Maia. They establish a new firm, Hermes, and eachinvests cash of 10 in it. Hermes raises debt (on the strength of Zeus’s and Maia’s guarantees) tofinance the purchase of fixed assets. When this investment is made, Hermes’s balance sheet looksas follows:
Hermes CompanyAssets Equities
Liabilities 80Shareholders’ equity:
Cash and Zeus 10other assets 100 Maia 10 20
100 100
Required
(a) Zeus wants to know how to account for its investment in Hermes. Prepare a balance sheet forZeus Company at the start of year 1, assuming the investment: (1) is accounted for by the equity method; (2) is consolidated on a proportionate basis;(3) is consolidated on a global basis.
When should Zeus use each of the above methods?
(b) At the end of its first year, Hermes reports revenues of 70 and profit of 10. It pays a dividend of8. Liabilities of 80 are unchanged. In the same period, Zeus reports revenues of 150 and profit(from its own activities) of 20. It pays a dividend of 12. Its end-year liabilities are still 100. Thereare no intercompany transactions between Zeus and Hermes except for the dividend. Ignoretaxes.
For each of the methods listed in (a) above:(i) calculate Zeus’s total profit for year 1; and(ii) prepare Zeus’s balance sheet at the end of year 1. (Combine cash and other assets.)
Check figures: (b) (ii) End-year 1 total assets
(1) 213 (2) 253 (3) 304
* Assignment draws on material in section 2 of this chapter.
P14.9 Acquisitions and disclosures: financial disclosuresUnilever, the giant Anglo-Dutch food and consumer products company, made major acquisitions anddisposals of businesses in 2000 and 2001. Key cash flow statement information for both years is givenbelow (amounts in A million).
CFA_C14.qxd 11/7/03 2:13 PM Page 459

460 PART 2 • THE HOUSE OF ACCOUNTING
2001 2000
Cash flow from operating activities 7,497 6,738Interest payments (net of financial income) (1,805) (760)Taxation (2,205) (1,734)Capital expenditures and financial investment (1,358) (1,061)Acquisitions and disposals 3,477 (27,373)Dividends paid on ordinary share capital (1,420) (1,365)Cash flow before financing and treasury operations 4,186 (25,555)Financing and treasury operations (3,992) 25,366Increase (decrease) in cash in year 194 (189)
Unilever’s biggest acquisition was in October 2000. It paid A23.6 billion in cash for Bestfoods, aUS food products company. In 2001 it raised almost A2 billion from the sale of Bestfoods’ bakerybusinesses (and other businesses acquired in 2000 and held for resale) and A1.65 billion from the dis-posal of group companies. Details of the Bestfoods acquisition in 2000 and the disposal of groupcompanies in 2001 are set out in Exhibit 14.16. They are taken from the notes to Unilever’s 2000 and2001 accounts.
Unilever uses the purchase method to account for acquisitions. Prior to 1998, it wrote off againstreserves goodwill arising on acquisitions. Since 1998, the company capitalises goodwill and amortisesit over 20 years.
Required
(a) What was the carrying amount – in the books of Bestfoods – of the net assets Unilever acquiredin 2000?
(b) What was the main reason for the negative accounting policy adjustment of a1.1 billion to Bestfoods’intangible assets?
(c) Unilever paid a23.6 billion in cash for Bestfoods but the price of the business was a26.1 billion.How did it finance the difference?
(d) Unilever revalued ‘acquired businesses held for resale’ at the time of Bestfoods’ acquisition. Whatwould have been the effect on its accounts – in 2000 and in 2001 when it sold them – if it had notdone so?
(e) Show in summary form the effect on Unilever’s 2001 accounts of the businesses it sold that year.Account for ‘net assets sold’ as one item. Use a journal entry or the balance sheet equation.
P14.10 Divestment of a business: interpreting financial disclosures*British Telecom (BT), the UK telecoms group, assembled all its wireless operations in a new sub-sidiary, mmO2 plc. Because BT’s fixed line and wireless operations had ‘different market focus andexpected growth characteristics’, its board of directors decided in 2001 to split off mmO2. Under thescheme, two new holding companies, BT Group and mmO2, were established, one for fixed line andthe other for wireless operations. A BT shareholder received one share in BT Group plc and one sharein mmO2 plc for every share they held in the old BT. Trading in the shares of the two companies beganon the London Stock Exchange on 19 November 2001.
Exhibit 14.17 shows the pro forma balance sheet of BT Group plc – after adjustment for mmO2 plc– at 30 June 2001.
BT’s management decided that, in view of mmO2’s current losses and its expected heavy capitaloutlays, it should carry less debt as an independent entity than it had as part of BT. As a result, debtwas transferred from mmO2 to BT Group (see third column of Exhibit 14.17).
CFA_C14.qxd 11/7/03 2:13 PM Page 460

CHAPTER 14 • EQUITY ACCOUNTING AND CONSOLIDATIONS 461
Acquisition of Bestfoods in 2000Provisional Provisional
Balance sheets adjustments to fair valuesof acquired align accounting Provisional at date of
In A million businesses policies revaluations acquisition
Intangible assets 1,504 (1,126) (378) –Fixed assets 2,184 (361) – 1,823Acquired businesses held for resale 946 – 811 1,757Other current assets 1,816 (71) – 1,745Creditors (1,782) (183) – (1,965)Provisions for liabilities and charges:
Pensions and similar obligations (674) 237 – (437)Deferred taxation 450 (326) – 124Other provisions (938) – – (938)
Minority interest 55 (34) – 21
Net assets acquired 3,561 (1,864) 433 2,130
Goodwill arising in subsidiaries 23,321Goodwill arising in joint ventures 632
Consideration 26,083
Of which:Cash paid 23,623Cash and current investments of Bestfoods 3,028Translation adjustment between accounting rate and actual exchange rate
at settlement date (568)
The book values of the net assets acquired have been restated to provisional fair values as at the date ofacquisition. The principal adjustments recognise acquired businesses held for resale at the present value ofnet expected proceeds and write off certain intangible assets. . . . The accounting policy alignment reflectsthe write-off of capitalised software, interest and certain intangible assets and the valuation of workingcapital, pension provisions and deferred tax in accordance with Unilever’s accounting policy.
Disposals in 2001
. . . In 2001, disposed businesses principally comprised Unipath and Batchelors/Oxo in the United Kingdom,Royco in the Netherlands and Elizabeth Arden and Gortons in the USA.
A millionFixed assets 279Current assets 351Creditors (112)Provisions for liabilities and charges (11)Minority interest (2)Net assets sold 505Attributable goodwill 223Profit on sale attributable to Unilever 927Consideration 1,655Of which:
Cash 1,650Cash, current investments and borrowings of businesses sold (6)Non-cash and deferred consideration 11
Unilever’s acquisitions and disposals in 2000/01: selective disclosuresExhibit 14.16
(Source: Unilever, Annual Accounts 2000 and 2001.)
CFA_C14.qxd 11/7/03 2:13 PM Page 461

462 PART 2 • THE HOUSE OF ACCOUNTING
AdjustmentsAdjustments for mmO2 Pro forma
In B million Historical BT for mmO2 net debt BT Group
Profit (loss) for year to 30 March 2001 (2,378) 4,107 – 1,729[loss]
BALANCE SHEET at 30 June 2001Fixed assetsIntangible assets 18,297 (15,998) – 2,299Tangible assets 21,610 (3,877) – 17,733Investments 3,675 (30) – 3,645
Total fixed assets 43,582 (19,905) – 23,677
Current assetsStocks 289 (145) – 144Debtors 7,380 (1,602) – 5,778Investments 10,754 (495) 133 10,392Cash at bank and in hand 388 (343) 343 388
Total current assets 18,811 (2,585) 476 16,702
Creditors: amounts falling due within 1 yearLoans and other borrowings (10,990) 5,777 (5,277) (10,490)Other creditors (8,961) 2,107 – (6,854)
Total creditors: amounts falling due within 1 year (19,951) 7,884 (5,277) (17,344)
Net current assets (liabilities) (1,140) 5,299 (4,801) (642)
Total assets less current liabilities 42,442 (14,606) (4,801) 23,035Creditors: amounts falling due after more than 1 yearLoans and other borrowings (17,633) 11,481 (11,119) (17,271)Provisions for liabilities and charges (2,769) 191 – (2,578)
Total net assets 22,040 (2,934) (15,920) 3,186
Minority interests 82 – – 82Capital and reserves 21,958 (2,934) (15,920) 3,104
22,040 (2,934) (15,920) 3,186
BT: pro forma income and balance sheets on divestment of mmO2Exhibit 14.17
(Source: BT, Circular to shareholders, September 2001. Reproduced by permission of BT Group plc.)
Required
(a) What type of divestment is BT’s splitting-off of its wireless operations – a trade sale, IPO, spin-offor equity carve-out? Give reasons for your answer.
(b) Show in summary form the entries BT made in its consolidated accounts to record the divestmentof mmO2 and adjustment of mmO2’s net debt on 30 June 2001. Combine operating assets andoperating liabilities in one line entry and debt and liquid assets in another. Why doesn’t BT reporta gain or loss from its divestment of mmO2?
(c) What was mmO2’s net debt at 30 June 2001 after adjustments?
* Assignment draws on material in section 2 of this chapter.
CFA_C14.qxd 11/7/03 2:13 PM Page 462

CHAPTER 14 • EQUITY ACCOUNTING AND CONSOLIDATIONS 463
Notes to Chapter 14
1 If Candide starts making profits again, Pangloss can resume reporting its share of them – but only aftermaking good its share of unrecognised losses.
2 International Accounting Standards Board, IAS 28: Accounting for Investments in Associates; EuropeanCommission, 7th (Company Law) Directive, Art. 33. If the investment is intended to be temporary,the investor should account for it at cost or fair value in accordance with IAS 39.
3 IAS 28, para. 5.4 A change in shareholding may force an investor company to change the way it accounts for an invest-
ment. By increasing its shareholding, it may acquire significant influence over the investee’s policies:the equity method is applied from the date this occurs. By reducing its shareholding, it may losesignificant influence: the carrying amount of the investment is then its cost from that date.
5 The discussion that follows applies equally to an equity-accounted investment in an associated company. The investor company makes similar adjustments – first to the fair values of assets (and liabilities) acquired and then to goodwill – whenever the purchase price is greater (or less) than theinvestor’s share of the book value of the associate’s net assets.
6 Incorporating fair value adjustments into the acquired company’s accounts is known as push-downaccounting. Although it is not an accepted practice, certain listed US companies involved in businesscombinations have implemented it on the instruction of the Securities and Exchange Commission.
7 If the investor company sells part or all of the investee subsequently, it should include, in the carryingamount of the assets sold, the related goodwill written off. This is known as goodwill write-back. Theeffect of the write-back is to reduce the reported gain (or increase the reported loss) on disposal.
8 International Accounting Standards Board, IAS 27: Consolidated Financial Statements and Accountingfor Investments in Subsidiaries, para. 12. Article 1 of the EU’s 7th Directive contains similar phrasing.
9 Under IAS, an intermediate parent company must be at least 90% owned by another.10 The EU’s 7th Directive permits exclusion in these circumstances – and also in the case that consolida-
tion of the subsidiary has no material effect on the financial statements (Art. 13).11 IAS 27, para. 14. By contrast, the EU’s 7th Directive requires exclusion of subsidiaries with activities
dissimilar to those of other group companies (Art. 14). This will have to be amended before 2005 whenEU listed companies must adopt IAS.
12 International Accounting Standards Board, IAS 22: Business Combinations.13 This assumes negative goodwill is less than the fair value of acquired depreciable assets. Any amount
greater than this should be recognised in income immediately.14 IWO of goodwill is permitted under Art. 30(2) of the 7th Directive. Article 37(2) of the 4th Directive
specifies the amortisation period for capitalised goodwill.15 International Accounting Standards Board, Project Summary – Business Combinations Phase 1, July 2002.
Note that the two key proposals – to ban merger accounting and to replace goodwill amortisation withan annual impairment test – are in line with new UK and US accounting standards on this topic.
16 Lys, T. and Vincent, L. (1995), An analysis of the value destruction in AT&T’s acquisition of NCR,Journal of Financial Economics, 39: 353–379.
17 As part of its project on business combinations (see note 15), the IASB plans to eliminate the parentcompany approach. According to the Board’s current thinking, the entity approach provides userswith more useful information for assessing management’s stewardship of the group’s resources andshould be the only basis for preparing consolidated accounts.
18 The assets, liabilities, revenues and expenses of unincorporated joint ventures are usually accounted foron a proportionate basis.
19 International Accounting Standards Board, IAS 31: Financial Reporting of Interests in Joint Ventures.Note that, as with subsidiaries and associates, a temporary interest in a joint venture should beaccounted for according to IAS 39 (i.e. at fair value or at cost if fair value is not determinable).
20 Kirchmaier, T. (2001), Demergers – the way forward after M&A, European Business Forum, 2(1).21 A third type of demerger, the issue of ‘tracking stock’, is similar in form to a spin-off. The parent
issues shares to existing shareholders on a pro-rata basis. These shares represent claims to the profitsof a particular segment of the business. The ‘tracked’ segment remains part of the parent’s legal and
CFA_C14.qxd 11/7/03 2:13 PM Page 463

organisational structure, however. Many analysts believe the lack of managerial independencedepresses the price of tracking shares. For further discussion of the various ways a company can divesta business and their financial implications, see Gilson, S.C. (2001), Creating Value through CorporateRestructuring, Chichester: Wiley Finance.
22 International Accounting Standards Board, IAS 24: Related Party Disclosures.23 A study of German companies over the period 1981 to 1990 found, inter alia, that the association between
stock market returns and consolidated earnings was higher than that between stock market returnsand unconsolidated earnings (Harris, T., Lang, M. and Möller, H. (1994), The value relevance of Germanaccounting measures: an empirical analysis, Journal of Accounting Research, Autumn: 187–209).
24 Renault increased its stake in Nissan to 44% in 2002 and the latter acquired a 15% stake in the Frenchvehicle producer at the same time. Renault continued to account for its Nissan investment by the equitymethod. Although Nissan returned to profitability in 2001, its net debt remained high (Burt, T. andIbison, D. (2001), Renault rules out full Nissan merger, Financial Times, 31 October).
25 The investor company may also disclose proportionate data on the face of its financial statements. Forexample, UK companies show the proportionate share of associated companies’ turnover on the faceof the consolidated income statement (but the amount is excluded from the group’s net turnover).
26 The FASB announced in 2002 that the rules regarding consolidation of SPEs would be tightened. The percentage of required outside capital in an SPE is to rise from 3% to 10% of total assets. TheFASB also introduced an ‘independent economic substance’ test: consolidation is not required if it can be shown that the SPE can function as a separate economic entity. By contrast, international rulesare simpler: the sponsor must consolidate any SPE that it controls.
464 PART 2 • THE HOUSE OF ACCOUNTING
CFA_C14.qxd 11/7/03 2:13 PM Page 464

Transactions and operations in foreign currencies
INTRODUCTIONUp to now, we have assumed that the financial transactions a company entersinto are all in one currency, its domestic currency. This is not usually the case.For countries in the eurozone, external trade (the average of exports and importsin euros) represented 15% of gross domestic product in 2001. For countries notpart of a large currency bloc, the ratio was much higher – over 30% in the caseof Canada, Denmark and South Korea. This means that for many companies,especially those engaged in manufacturing, purchases and sales in foreign currencies make up a significant portion of total transactions. In addition, thesame companies have operations in foreign countries and thus have assets suchas property and equipment denominated in foreign currencies.
In this chapter we study the impact of a firm’s foreign currency transactionsand operations on its accounts. Recognition and measurement problems arisebecause the rate of exchange between domestic and foreign currencies is notstable. For example, it may change while a transaction is open – a foreign creditsale is not yet collected or a foreign credit purchase is not yet paid – and thiscreates an exchange gain or loss on the foreign currency receivable or payable.How and when should this gain or loss be recognised? Similarly, a firm with aforeign operation may experience exchange rate changes. How does it measurein its domestic currency the foreign business’s assets and liabilities? And howshould any resulting translation gains or losses be accounted for?
We conclude the chapter by considering the implications, for investors, ofa firm’s foreign trade and investment. When a firm pursues such activities,shareholders enjoy the prospect of higher returns but they also bear additionalrisks. Even firms that focus exclusively on their home market are affected by exchange rate changes. Thus investors want information about a firm’sexposure to foreign currency risks and the actions it is taking to reduce them.
1515
l Accounting fortransactions inforeign currencies
l Accounting forforeign operations
l Financial statementdisclosures andanalysis
In this chapter
CFA_C15.qxd 11/6/03 3:15 PM Page 465

466 PART 2 • THE HOUSE OF ACCOUNTING
Accounting for transactions in foreign currencies
Many firms import or export goods and services. These transactions often involve the purchaseor sale of a foreign currency. A manufacturing firm buying raw materials from a foreign supplierpurchases foreign currency in order to acquire them. A financial institution marketing financialservices to foreign investors bills them in their local currency which it sells on receipt to obtaincash in its own.
At present, most exchange rates are not fixed. They can and do vary unpredictably from dayto day. This poses difficulties for a company engaged in foreign currency transactions. It canhedge against exchange rate movements by, for example, buying (selling) in advance the foreigncurrency it needs (expects to receive). Or it can buy or sell foreign currency on the spot marketwhen the transaction demands it. We describe the accounting for, first, unhedged and thenhedged transactions.
l Unhedged transactionsConsider the following example. Falkner, an Austrian ski-lift manufacturer, conducts most of itsbusiness in the eurozone and keeps its accounts in euros (see Box 15.1). The euro is its functionalcurrency. On 1 December year 1 it imports machinery costing US$2.5 million when the exchangerate is a1.023 : US$1. Payment (in dollars) does not have to be made until 31 January year 2.Let’s assume the euro weakens to a1.03 against the dollar by 31 December (Falkner’s year-end)
Adoption of the euro: accounting implicationsBOX15.1
The euro is the official currency of countries within the EMU (economic and monetary union)of the European Union. All EU member states save Denmark, Sweden and the UK were in theEMU – or eurozone – in 2003. The two key features of the eurozone are: (a) one central bank,the European Central Bank, determines monetary and exchange rate policies for the zone and (b) national governments, though retaining control of fiscal policy, commit themselves to avoiding excessive government deficits (defined as no more than 3% of gross domesticproduct). The eurozone is likely to grow in future years: in addition to the above three EUmember states, the ten applicant countries that are due to join the EU in 2004 are potential newmembers of the zone. Government ministers stress the economic advantages of membership:being part of a single currency zone reduces exchange rate risk for companies trading withinit and fosters competition through greater price transparency.
Adoption of the euro has accounting as well as economic implications for companies in these countries. First, exchange gains and losses on open monetary transactions crystalliseon the date a country enters the eurozone. This means that, in effect, exchange gains and losses are realised the day before and companies should recognise them in their accounts of that year. If, for example, the UK enters the eurozone on 1 January 2006 (unlikely, but miracles do happen), a UK company with a calendar year-end recognises exchange gains and losses on its outstanding euro receivables and payables in its 2005 accounts (so long as the receivables/payables are not a designated hedge of an investment in a eurozone entity). The translation gains and losses on eurozone investments are not considered realised on 31 December 2005, however. UK companies will continue to defer them in equity until theysell the investments.
CFA_C15.qxd 11/6/03 3:15 PM Page 466

CHAPTER 15 • TRANSACTIONS AND OPERATIONS IN FOREIGN CURRENCIES 467
but then strengthens slightly to a1.027 by 31 January. How does the Austrian firm account forthe effect on this transaction of the changes in the euro–dollar exchange rate between 1December and 31 January?
International accounting rules require firms to account for unhedged transactions in a foreigncurrency as follows:
l the transaction should be recorded in the company’s functional currency using the exchange rateprevailing when the transaction takes place;
l at the balance sheet date, monetary items (e.g. receivables, payables) in a foreign currency shouldbe translated at the closing rate (the spot exchange rate at the balance sheet date);
l at the balance sheet date, non-monetary items (e.g. tangible fixed assets, inventory) that are measured at cost in a foreign currency should be translated using the exchange rate at the date ofthe transaction. Those measured at fair value should be translated using the exchange rate at thedate of valuation;
l exchange differences on monetary items should be recognised as income or expense when theyarise. This applies to unrealised as well as realised gains and losses.1
Thus Falkner records the machinery and the liability to the US supplier at a2,557,500, basedon the 1 December exchange rate of a1.023 : US$1. At the balance sheet date, it increases the outstanding trade payable to a2,575,000, reflecting the weakening of the euro to a1.03 : US$1 by31 December, and recognises an unrealised exchange loss of a17,500 in its year 1 accounts. Whenit pays the supplier the invoiced amount of US$2.5 million on 31 January year 2, only 1.027 eurosare needed to buy a dollar and thus the cost of the payment is a2,567,500 ($2.5 million × 1.027).The strengthening of the euro in January results in a realised exchange gain of a7,500 that month.The entries the company makes in its accounts are (in a000):
1 December year 1: Dr. Equipment (A+) 2,557.5Cr. Account payable (L+) 2,557.5
31 December year 1: Dr. Exchange loss (OE−) 17.5Cr. Account payable (L+) 17.5
Second, par values of shares and bonds have to be converted and the resulting euro valuesmay be awkward numbers. Companies may choose to renominalise shares (and bonds) to ensurethe per-unit nominal value is a round number. For example, suppose a Hungarian company’sordinary shares have a par value of 1,000 forints and the exchange rate is fixed at 175 forints tothe euro. This results in a euro par value of a5.7143 (after rounding). It decides to renominalisethe shares to 875 forints – or a5. This has an administrative cost, however. Renominalisationresults in an increase or decrease in share capital which, under EU law, requires prior approvalof shareholders in general meeting. Note that the change in share capital following renominal-isation also involves adjusting reserves. Suppose our Hungarian company has 2.5 million ordinary shares in issue. It must set up a non-distributable reserve of a1,785,750 [2.5 million× (a5.7143 − a5)] to offset the reduction in share capital of this amount.
Finally, companies must account for the costs of switching to the euro. These include thecosts of altering equipment and computer software. Unless the expenditures meet the usualasset definition and recognition tests (i.e. they yield probable future benefits which can bemeasured reliably), they should be expensed as incurred. In practice, few euro conversion costsqualify for capitalisation. The reason is that, in most cases, companies incur such costs tomaintain the capabilities of existing equipment and systems rather than to enhance them.
Box 15.1 continued
CFA_C15.qxd 11/6/03 3:15 PM Page 467

31 January year 2: Dr. Account payable (L−) 2,575Cr. Exchange gain (OE+) 7.5Cr. Cash (A−) 2,567.5
The book value of the equipment is not adjusted for the change in exchange rates. Assumingthe company follows the historical cost convention, the fixed asset is stated at its (depreciated)historical cost. The difference between the value of the asset acquired (a2,557,500) and the cashpaid for it (a2,567,500) represents a loss to the company of a10,000. This is the net amount ofthe year 1 exchange loss and the year 2 exchange gain.
Other types of monetary transaction are treated similarly. For example, exchange differenceson foreign currency borrowings are recognised in income in the period when they arise.2
l Hedged transactionsIt is common practice now for firms to hedge foreign currency transactions. They use foreigncurrency loans or deposits, forward exchange contracts, currency swaps and currency optionsfor this purpose. However, these instruments don’t automatically qualify as accounting hedges.A financial instrument (e.g. a forward exchange contract) can be considered a hedge for accountingpurposes only if:
l it is formally designated a hedge from the outset;l the item to be hedged – an asset, liability or cash flow – is identified at the same time;l the hedge is expected to be effective: changes in the hedge’s fair value or related cash flows are likely
to largely offsets changes in the fair value or cash flows of the hedged item.
As we saw in Chapter 13, IAS distinguish three types of qualifying hedge – the fair valuehedge, the cash flow hedge, and the hedge of an investment in a foreign entity – and lay downhow each should be accounted for.3 Clearly, the last involves a foreign currency transaction by definition. But changes in exchange rates can expose a company to changes in future cashflows or changes in the fair value of an asset or liability which it can hedge using an effectivehedging instrument. We illustrate foreign investment and fair value hedges in the two examplesbelow.
Hedge of net investment in a foreign entityKoivu, a Finnish forestry products company, has a profitable Canadian subsidiary which needsfunds for expansion. Instead of the subsidiary raising the (Canadian) $50 million needed, Koivuuses its superior credit rating, borrows the funds in Canadian dollars, and invests them –through an increase in the subsidiary’s share capital or an intercompany loan – in its Canadianoperation. The Finnish firm designates the foreign currency borrowing as a hedge of (part of )its Canadian investment: a change in the dollar/euro exchange rate will have an effect on the debtpayments opposite to that on the investment’s cash inflows.
Suppose the euro weakens against the Canadian dollar, from C$ 1.7 : a1, when the investmentwas made, to C$ 1.65 : a1 at the balance sheet date. If Koivu translates its Canadian investmentat the closing rate of C$ 1.65 : a1 when preparing its accounts, it will record a positive exchangedifference, since its Canadian investment is worth more in euros. As we’ll see in the next section,this exchange difference is taken direct to shareholders’ equity on the balance sheet. As regardsthe dollar debt, Koivu sustains a loss from the euro depreciation as the euro cost of the debt isincreased. Since the dollar borrowing is designated as a hedge of the Canadian investment, Koivucan defer the exchange loss of a0.89 million (C$ 50 million/C$ 1.7 − C$ 50 million/C$ 1.65) onthe debt and set it off against the exchange gain (of a similar amount) on the asset. If it had notdesignated the borrowing as a hedge, it would have had to recognise the loss immediately.
468 PART 2 • THE HOUSE OF ACCOUNTING
CFA_C15.qxd 11/6/03 3:15 PM Page 468

CHAPTER 15 • TRANSACTIONS AND OPERATIONS IN FOREIGN CURRENCIES 469
Koivu oyj(Partial) balance sheet (in A million)Exchange rate Exchange rate
1.7 : 1 1.65 : 1 1.7 : 1 1.65 : 1Assets Shareholders’ equityAdditional investment Deferred loss (borrowing) 0 (0.89)in Canadian subsidiary 29.41 30.3 Deferred gain (investment) 0 0.89(C$50m) Net gain/loss 0
LiabilitiesLong-term debt (C$50m) 29.41 30.3
Hedging foreign currency transactionsIn addition to hedging foreign investments, companies also hedge day-to-day transactions inforeign currencies. A common method of doing this is through the forward exchange market. A firm ‘locks in’ an exchange rate by buying (or selling) foreign currency in advance. Falkner,our Austrian ski-lift manufacturer, can do this for its purchase of US equipment. Suppose on 1 November year 1, the date it orders the equipment, it enters into a forward exchange contractwith a bank under which the bank will provide it with US$2.5 million (the cost of the equipment)on the settlement date (31 January year 2). As a result of the contract, the firm protects itself during those three months against exchange losses caused by a depreciating euro.
How does Falkner account for the forward exchange contract? In the past, it might haverecorded the equipment and the account payable at the contracted forward rate. Alternatively, itcould have recorded the equipment at the spot rate (at the start of the forward contract) and theliability to the supplier at the forward rate. The difference, the premium paid on the forwardcontract, would be either booked as an expense immediately or amortised over the period of theforward contract on a straight-line basis. Both methods were popular. A common weakness istheir failure to recognise the forward contract itself and the change in its value over time.
The new hedge accounting rules (in IAS 39) are designed to overcome the flaws in traditionalaccounting methods. Exhibit 15.1 sets out the entries Falkner makes to account for both the pur-chase of the equipment and the forward exchange contract. The euro–dollar spot and forwardexchange rates are assumed.
Our example illustrates how the new rules work. The company recognises the hedging instru-ment – in this case, the forward contract receivable – at the contract date. The net fair value of the contract is zero initially since the forward contract receivable and dollar payable have the same value at this date. Thereafter, changes in the euro–dollar forward rate result in gains orlosses on the forward contract. For example, the strengthening of the dollar against the euromakes the contract more valuable – hence the gains (and growing receivable) in November andDecember of year 1.4
At the same time, the strengthening dollar increases the cost of the liability Falkner hasassumed. Because the company entered into the forward contract on the order date, it is hedg-ing a commitment in the period from order to delivery of the asset and a payable in the period fromdelivery to settlement. Falkner’s hedge of its commitment to the US supplier is considered a fairvalue hedge. The company recognises a temporary liability (‘firm commitment’) and recognisesthe cost of this liability (‘loss on firm commitment’) in income.
On delivery of the equipment on 1 December, Falkner records the asset and related liability(account payable) at the spot exchange rate. It eliminates the commitment and adjusts theequipment’s value for the change in the fair value of the liability between the order and deliverydates. This means that the firm fixes the cost of the equipment at a value that approximates the1 November forward rate.
CFA_C15.qxd 11/6/03 3:15 PM Page 469

470 PART 2 • THE HOUSE OF ACCOUNTING
Once the equipment and payable have been recognised, the forward contract becomes astraightforward hedge of a foreign currency payable. Gains and losses on the forward contractare matched by exchange losses and gains on the foreign currency payable. The gains/losses donot offset exactly because spot and forward rates do not move in tandem.
FactsOn 1 November year 1, Falkner, an Austrian ski-lift manufacturer, orders equipment costing US$2.5 millionfrom a US supplier for delivery on 1 December. On the same day, it enters into a forward exchange contractwith a bank to buy US$2.5 million on 31 January year 2, the date it has agreed to pay the supplier. Relevanteuro–dollar spot and forward exchange rates are given below.
Date Event Spot rate Forward rate(31 Jan year 2)
1 November, year 1 (US$1 = . . . ) Order A1.015 A1.0181 December Delivery 1.023 1.02531 December Year-end 1.03 1.03131 January, year 2 Settlement 1.027 (not applicable)
Accounting entries and explanations* ( journal entry amounts in A000)
Date Entry Dr. Cr. Explanation
1 Nov, yr 1 – Forward contract has zero fair value.
1 Dec Dr. Forward contract receivable 17.5 Change in fair value of forward contractCr. Hedging gain 17.5 [US$2.5m × (1.025 − 1.018)]. Fair value
hedge so gain recognised in income.Dr. Loss on firm commitment 17.5 Weakening euro leads to exchange loss
Cr. Firm commitment 17.5 on purchase order. ‘Firm commitment’ is temporary liability account.
1 Dec Dr. Equipment 2,557.5 Asset and payable recorded at spot rate.Cr. Account payable 2,557.5
Dr. Firm commitment 17.5 Temporary liability (firm commitment)Cr. Equipment 17.5 eliminated and asset’s fair value adjusted.
31 Dec Dr. Forward contract receivable 15 Change in fair value of forward contractCr. Hedging gain 15 [US$2.5m × (1.031 – 1.025)].
Dr. Exchange loss 17.5 Adjust payable for change in spot rateCr. Account payable 17.5 between 1 Dec and 31 Dec.
31 Jan, yr 2 Dr. Hedging loss 10 Change in fair value of forward contractCr. Forward contract receivable 10 [US$2.5m × (1.027 – 1.031)].
Dr. Account payable 7.5 Adjust payable for change in spot rateCr. Exchange gain 7.5 between 31 Dec and 31 Jan.
31 Jan Dr. Cash 22.5 Net settlement. Company pays A2.545mCr. Forward contract receivable 22.5 to bank (based on A1.018 forward rate)
and receives A2.5675m (based on A1.027 spot rate) to convert into dollars.
31 Jan Dr. Account payable 2,567.5 Payable settled at spot rate.Cr. Cash 2,567.5
* Entries for depreciation of equipment not shown. Depreciation begins as from date equipment is ready for use.
Hedging of foreign currency payable via forward exchange contractExhibit 15.1
CFA_C15.qxd 11/6/03 3:15 PM Page 470

CHAPTER 15 • TRANSACTIONS AND OPERATIONS IN FOREIGN CURRENCIES 471
Accounting for foreign operations is a two-stage process of, first, translation and, then, con-solidation. Our concern here is with the first part of the process: how does the parent companytranslate the assets and liabilities, revenues and expenses of the foreign operation into its reportingcurrency?
l Nature of foreign operationsUnder current international (and US) accounting rules, the way a company accounts for itsinvestment in a foreign country depends on the nature of its operations there. International and US standards distinguish two types of foreign operation: those which function as independentunits and those which form an integral part of the parent company’s operations.6 Classification of aforeign operation – as either autonomous unit or satellite of the parent’s operations – affectsboth the exchange rate(s) used to translate foreign currency items and the presentation of anyexchange gains or losses in the parent company’s accounts.
On 31 January year 2, the settlement date, Falkner pays its US supplier US$2.5 million. Thishas a euro cost of a2,567,500 (based on the spot exchange rate at that date). But under the for-ward contract, the cost to the firm of the dollar liability is only a2,545,000. In effect, the bankgives the firm a2,567,500 to buy the dollars but, given the forward contract, receives onlya2,545,000 in return. Thus the firm receives a net a22,500 in cash on the settlement of the for-ward contract.
In sum, by hedging its exposure to changes in the euro–dollar exchange rate, Falkner fixes theeuro cost of the equipment. (The sum paid, a2,545,000, differs slightly from the initial carryingamount of a2,540,000, because the spot rate diverges from the forward rate in November.) Thestrengthening of the dollar against the euro after 1 December results in gains on the forward con-tract that are offset by exchange losses on the payable to the US supplier. Note that the entriesthe firm makes to record the amount payable initially and to adjust it subsequently for changesin the spot rate are identical to those it would make if the transaction were unhedged.
Accounting for foreign operations
Many European companies do more than import and export goods and services. They oftenmake direct investments in other countries, within and outside Europe. For example, a companymay establish a branch abroad – a sales office, for example – or it may incorporate its foreignbusiness. Unlike a branch, a foreign subsidiary is a separate legal entity. Whichever legal form ischosen, the parent company incurs costs, earns revenues and holds assets and liabilities in a for-eign currency. These must then be translated into the currency in which its accounts are pre-pared (the ‘reporting currency’) before being combined with its domestic revenues, earnings,assets and liabilities.5
CFA_C15.qxd 11/6/03 3:15 PM Page 471

The parent company’s managers must weigh various factors when deciding how to classify aforeign operation. Here are the main ones they should consider, according to IAS:
l degree of local content in the good or service produced;l proportion of purchases and sales that are intercompany (especially between foreign unit and
parent company);l proportion of sales made in the local market;l reliance on local sources of finance.
For example, consider a foreign subsidiary that buys inputs, converts them into finishedproduct and sells the output, all in its domestic market. It reinvests its profits to expand opera-tions. Any debt finance it needs it raises locally. The parent company vets its annual budgets and major capital projects but devolves responsibility for most decisions to the subsidiary’s managers. This subsidiary would be viewed as an autonomous unit of the parent company. Itsfunctional currency is the local currency.
Contrast this with a manufacturing operation that a company sets up in a foreign country tosupply it with components for its domestic plants. The foreign unit buys key inputs from – andsells most of its output to – the parent company. It relies on the parent for new capital. In thiscase the foreign unit would be viewed as the parent company’s satellite, an integral part of theparent’s operations. Its functional currency is the parent company’s currency.
In practice, it is not always easy to classify a foreign operation. It may be neither whollyautonomous nor an integral part of its parent company but, instead, display features of both.However, once a classification decision is made, the accounting treatment must be followed con-sistently until the foreign unit’s circumstances change.
l Autonomous unit and closing rate method of translation
International standards require that the parent company should account for an autonomous unit bythe closing rate method. Under this method, the parent company:
l Translates all assets and liabilities in the foreign entity’s balance sheet at the end-year exchangerate between the functional and reporting currencies. (Recall that the functional currency is onein which the foreign entity conducts most of its business.) The end-year rate is known as theclosing (or current) rate of exchange. Contributed capital (share capital, share premium) istranslated at the exchange rate(s) prevailing when the shares were issued.
l Translates all revenues and expenses in the foreign entity’s income statement at the exchange ratesprevailing when the revenues and expenses were recognised. In practice, the average exchangerate for the period is often used.
l Reports any net translation gain or loss as a direct adjustment to shareholders’ equity in the con-solidated balance sheet. Succeeding years’ translation gains and losses are accumulated in thisbalance sheet account.
Illustration
Let’s see how the closing rate method is applied. Assume a UK company, Leicester plc, sets up aUS subsidiary, Arkansas Inc, on 1 January x3, with share capital of $3 million.7 Arkansas tradesprofitably during its first year. At the end of x3, Leicester prepares consolidated accounts. To dothis, it must first translate Arkansas’s dollar-based accounts into sterling. Leicester’s manage-ment review the nature of Arkansas’s operations and decide that it is an autonomous unit withinthe Leicester group. Exhibit 15.2 shows Arkansas’s x3 accounts in US dollars (all the numbersare assumed) and translated into sterling. The translated accounts are then consolidated withthose of Leicester and its other subsidiaries.
472 PART 2 • THE HOUSE OF ACCOUNTING
CFA_C15.qxd 11/6/03 3:15 PM Page 472

CHAPTER 15 • TRANSACTIONS AND OPERATIONS IN FOREIGN CURRENCIES 473
Calculation of the translated amounts in Exhibit 15.2 is straightforward. Since Arkansas’s salesand production occur evenly over the year, Leicester translates Arkansas’s dollar revenues andexpenses at the average exchange rate for x3 (£0.7 : $1). The US firm’s dividend is translated at theend-year exchange rate (£0.74 : $1), the rate when the dividend is paid. (The dividend is eliminatedon consolidation but it is recorded as investment income in Leicester’s own accounts.) All end-x3
Key exchange rate informationAt 1 January x3 £0.67 : $1Average for x3 0.7 : 1At 31 December x3 (closing rate) 0.74 : 1
Arkansas’s common stock is issued at the start of x3. Sales and production are even over theyear. The dividend is paid at the end of x3.
Exchange$000 rate £000
Statement of income and retained earnings for x3Operating revenues 6,000 0.7 4,200Less: Cost of sales –4,200 0.7 –2,940
Depreciation –500 0.7 –350Other expenses –700 0.7 –490
Net income 600 420Dividend –200 0.74 –148Retained earnings, end-x3 400 272
Balance sheet at 31 December x3AssetsCash and receivables 1,700 0.74 1,258Inventory 1,500 0.74 1,110Property and plant, net 1,800 0.74 1,332
Total 5,000 3,700Liabilities and stockholders’ equityPayables (current) 1,000 0.74 740Long-term debt 600 0.74 444Common stock 3,000 0.67 2,010Retained earnings 400 (see i/s) 272Translation adjustment – * 234
Total 5,000 3,700
* Derivation of translation adjustment:Exchange rate
$000 change** £000Net assets, 1 January x3 3,000 +0.07 210Addition to net assetsNet income in x3 +600 +0.04 +24Reduction in net assetsDividend, end-x3 –200 0 0Net assets, 31 December x3 3,400
Translation adjustment 234
** ‘Exchange rate change’ is the change in exchange rate between the date of the event (e.g. net assets acquired on 1/1/x3, net income earned in x3) and the year-end.
Arkansas Inc: translation of x3 accounts to sterling under closing rate methodExhibit 15.2
CFA_C15.qxd 11/6/03 3:15 PM Page 473

474 PART 2 • THE HOUSE OF ACCOUNTING
assets and liabilities are translated at the closing rate. ‘Common stock’ is translated at £0.67 : $1,the rate prevailing on 1/1/x3 when Arkansas issues shares to Leicester in exchange for cash.
The translated amount of retained earnings and the translation adjustment are sometimesharder to understand. In Arkansas’s case, it’s easy to see how the sterling amount of x3 retainedearnings is derived. Since x3 is its first year of operations, the balance sheet figure can be tracedback directly to the income statement. In practice, the translated amount of retained earnings isa composite figure: it represents the sum of each year’s retained profit as translated into thereporting currency that year. Thus at the end of x4, Leicester will translate Arkansas’s x4 revenues,expenses and dividend payments in the same manner as in Exhibit 15.2 and add the sterlingamount of Arkansas’s x4 retained profit to the end-x3 figure of £272,000.
The cumulative ‘translation adjustment’ shows the cumulative gain or loss to the parent companyfrom holding investments in foreign currencies when exchange rates change.8 Consider Leicester’sUS investment in x3. Arkansas had a successful first year. It made a profit of $600,000, a 20%return on its initial equity of $3 million. The strengthening of the dollar during x3 meant that,in sterling terms, it did even better. Its profits (before dividend) are £18,000 higher than theywould have been if the exchange rate had remained at £0.67 : $1. And, as can be seen from thetranslation adjustment, its net assets are £234,000 greater. Exhibit 15.2 shows how the translationadjustment is derived. Leicester has benefited because by end-x3 the dollar has gained 7 pence(£0.67 to £0.74) since it made its initial investment in Arkansas on 1 January and 4 pence (£0.7to £0.74) over its average rate, the rate used to translate the increase in net assets in the year.
Rationale for closing rate method
A parent company views an autonomous foreign operation as a single investment, not as a collection of assets and liabilities held in a foreign currency. Although the various categories of asset and liability are translated separately (they have to be for consolidation purposes), onerate is applied to all end-year assets and liabilities because what matters to the parent companyis the overall effect of an exchange rate change on its investment.
Translation at the closing rate is consistent with a firm’s internal reporting system, proponentsclaim. Head office judges the financial performance of the foreign entity (and its management)on the basis of its financial statements. Under the closing rate method, key financial ratios – forexample, the profit margin and the current ratio – which are used in performance evaluation are thesame after translation as they are in the original currency.
Why are translation gains or losses not recorded in the income statement? Accounting regula-tors argue that, where a foreign operation is considered a long-term investment, an exchange ratechange has no direct effect on the cash flows of the parent company. Thus translation gains andlosses are taken to reserves. When the foreign entity is sold, the parent company’s cash flow isaffected. At that time the cumulative translation gains or losses with respect to that entity arerealised. They should be included in the gain or loss on disposal and recognised in the consolidatedand parent company income statements.
l Integrated operation and temporal method of translation
Where a foreign operation is deemed to be integral to the parent’s activities, the temporal methodof foreign currency translation is used.9 Under the temporal method, assets and liabilities aretranslated at the exchange rate appropriate to the valuation basis used in the foreign entity’saccounts. Thus:
l Monetary assets (e.g. cash, receivables) and monetary liabilities (e.g. payables, most kinds of debt)are translated at the closing rate of exchange. Monetary assets and liabilities are items whosevalue is fixed in money terms: the balance sheet amount reflects their current value.
CFA_C15.qxd 11/6/03 3:15 PM Page 474

CHAPTER 15 • TRANSACTIONS AND OPERATIONS IN FOREIGN CURRENCIES 475
l Non-monetary assets (e.g. inventory, plant) which are stated at historical cost are translated atthe historical exchange rate, i.e. the exchange rate prevailing when the asset was acquired. Thosethat are stated at current value are translated at the rate prevailing at the date of the mostrecent valuation. The same procedure is followed with non-monetary liabilities (e.g. deferredsubscription revenues).
l Revenues and expenses are translated at the exchange rates prevailing when the underlying eventstook place. In practice, the average rate is used unless there are major within-year differencesin revenues and expenses. HC-based cost of sales and depreciation are translated at historicalrates, in keeping with the treatment of non-monetary assets in the balance sheet.
l Translation gains and losses are recognised in the consolidated income statement as they arise.
Illustration
We return to our example. Suppose Leicester’s management decide that Arkansas’s operationsare well integrated with its own. Exhibit 15.3 shows Arkansas’s x3 accounts, in US dollars and insterling under this assumption.
How are the sterling amounts in Exhibit 15.3 arrived at? Consider first the balance sheet items.Monetary items (e.g. cash, long-term debt) are translated at the closing exchange rate (£0.74 : $1),since the balance sheet amounts indicate the current purchasing power which they command(monetary assets) or which must be sacrificed to settle them (monetary liabilities). Inventory andfixed assets are translated at historical rates – £0.72 for end-x3 inventory, £0.67 for fixed assets –as Arkansas values these assets at historical cost. Common stock is a non-monetary item and istranslated at £0.67, the rate on 1/1/x3 when the shares were issued. As this is Arkansas’s first year ofoperation, the translated ‘retained earnings’ figure can be traced directly to the income statement.(In later years, it will consist of the sum of each year’s retained profit after translation.)
The cost of consuming or selling a non-monetary asset is treated in the same way as the assetitself. Thus depreciation is also translated at the historical rate (£0.67). Cost of sales is based ona FIFO flow of costs in this case. As a result, the costs assigned to ending inventory ($1,500) arethe most recent costs and are translated at the rate prevailing when the inventory was acquired(£0.72). Arkansas uses the average rate to translate other income statement items since revenuesare earned – and production inputs and other expenses are incurred – evenly over x3.
In HC-based accounts, the ‘translation gain/(loss)’ under the temporal method shows the effect of holding monetary items in a foreign currency when exchange rates are changing. The gain or lossis derived by applying to inflows and outflows of monetary items the change in the exchange rate between the date the inflow or outflow occurs and the year-end. A company gains when it holds cash and other monetary assets in an appreciating currency; it loses when it carries monetary liabilities in that currency. Arkansas’s monetary assets exceed its monetary liabilitiesthroughout x3 but as it invests its initial $3 million of cash in fixed assets and inventory, its net monetary asset position falls to only $100,000 at year-end. This explains why the translationgain in this case (£33,000) is so much smaller than the translation adjustment under the closingrate method (£234,000).
Rationale for temporal method
Where a foreign operation is bound closely to the parent company, then, in economic terms, its assets and liabilities are really the parent’s assets and liabilities, even though the foreign unithas a separate legal identity. Accounting regulators argue that, in these circumstances, currencytranslation should change only the unit of measure (i.e. from dollar to sterling) and not theattribute of the item being measured. Thus if it is company policy to state property – domesticand foreign – at historical cost, the historical exchange rate should be used for translation purposes. In this way, the attribute (historical cost) of the asset is preserved.
CFA_C15.qxd 11/6/03 3:15 PM Page 475

476 PART 2 • THE HOUSE OF ACCOUNTING
Key exchange rate informationAt 1/1/x3 (shares issued and property/plant acquired) £0.67 : $1Average for x3 0.7 : 1At date when end-x3 inventory was acquired 0.72 : 1At 31/12/x3 (closing rate) 0.74 : 1
Exchange$000 rate £000
Statement of income and retained earnings for x3Operating revenues 6,000 0.7 4,200Less: Cost of sales −4,200 * −2,910
Depreciation −500 0.67 −335Other expenses −700 0.7 −490
Translation gain/(loss) – ** +33Net income 600 498Dividend, end-x3 −200 0.74 −148Retained earnings, end-x3 400 350
Balance sheet at 31 December x3AssetsCash and receivables 1,700 0.74 1,258Inventory 1,500 0.72 1,080Property and plant, net 1,800 0.67 1,206
Total 5,000 3,544Liabilities and stockholders’ equityPayables (current) 1,000 0.74 740Long-term debt 600 0.74 444Common stock 3,000 0.67 2,010Retained earnings 400 (see i/s) 350
Total 5,000 3,544
* Calculation of cost of sales:
Beginning inventory 0 0Production costs (derived) 5,700 0.7 3,990– Ending inventory −1,500 0.72 −1,080Cost of sales 4,200 2,910
** Derivation of translation gain: Exchange rate$000 change to end-x3 £000
Net monetary assets, 1/1/x3 3,000 +0.07 +210Sources of net monetary assetsOperating revenues +6,000 +0.04 +240Uses of net monetary assetsPurchases of property and plant −2,300 +0.07 −161Purchases of production inputs −5,700 +0.04 −228Other operating expenses −700 +0.04 −28Dividend −200 0 0Net monetary assets, 31/12/x3 100
Translation gain +33
Arkansas Inc: translation of x3 accounts to sterling under temporal methodExhibit 15.3
CFA_C15.qxd 11/6/03 3:15 PM Page 476

CHAPTER 15 • TRANSACTIONS AND OPERATIONS IN FOREIGN CURRENCIES 477
Why, under the temporal method, are translation gains and losses recognised in the incomestatement when they arise? Consider once again the relationship between the parent and the foreign operation. The foreign entity has no separate economic existence. Its assets and liabilitiesare those of its parent but in a foreign currency. Its net monetary position can be viewed as itsparent’s net foreign currency receivable or payable. (Remember: in HC-based accounts, monetaryitems are the source of all translation gains and losses under the temporal method.) ThusLeicester starts x3 with $3 million in cash (held via Arkansas). It ends the year with a (net,unhedged) receivable of $100,000 (Arkansas’ end-x3 net monetary assets of that amount). Inthese circumstances, an exchange difference is similar to a transaction gain or loss. Because trans-action gains and losses have a direct effect on the cash a company receives, they are recognisedimmediately in the income statement.
l Special situations
The translation procedures described above are modified in certain circumstances. Here are twoimportant ones.
Foreign operation in a high-inflation economy
If the foreign operation is an autonomous unit and is based in an economy experiencing a very high rate of inflation, the closing rate method may distort the operation’s financial resultsand position. In particular, it understates the amount – and, via depreciation, the cost – of the foreign unit’s long-lived property and plant in the reporting currency. For example, suppose aFrench company invests a1 million in plant and equipment in a new operation in Ruritaniawhen the exchange rate is 100 Ruritanian bezants (RBz) to the euro. A year later, when accountsare drawn up, prices have doubled in Ruritania but have remained stable in the EU: the exchangerate has fallen to RBz200 : a1. If the Ruritanian operation’s accounts are not adjusted, the valueof its fixed assets in the parent company’s accounts will have halved to a500,000 (RBz100 m/200)in one year, even though the productivity of those assets may be unchanged.
There are two ways of dealing with this problem. One is to adjust the local currency financialstatements for the effects of inflation before they are translated:
We explained how accounts are remeasured into units of constant purchasing power in Chapter 7.
The other approach is to assume that the foreign unit is an integral part of the parent company’s operation and translate its accounts using the temporal method:
CFA_C15.qxd 11/6/03 3:15 PM Page 477

478 PART 2 • THE HOUSE OF ACCOUNTING
When changes in exchange rates reflect changes in relative prices alone, the two approachesyield the same result. Consider our Ruritanian example. Under the first approach, the fixedassets are restated to RBz 200 million in CPP terms and then translated at the closing exchangerate (RBz 200 : a1): the book value of the assets (before depreciation) is still a1 million. Underthe second approach, the fixed assets are translated at the historical exchange rate (RBz100 : a1),so that the initial book value of a1 million is preserved.
Both approaches are in use. Under international rules, a company must use the first approachwhen it has an autonomous unit in a country experiencing hyperinflation.10
Intercompany balancesIntercompany receivables and payables are usually treated like other foreign currency transac-tions in the parent company’s accounts. The exchange gain or loss (on an unhedged transaction)is recognised in the income statement when it arises. Note that this applies in the consolidatedaccounts as well: consolidation eliminates the intercompany balances but not the underlyingcurrency exposure.
Not all intercompany balances are settled, however. For example, a parent may advance funds to a foreign operation for legal or tax reasons rather than invest equity capital in it. Froman economic perspective, the loan represents part of the parent’s permanent investment in the foreign unit. As a result, it should take any related exchange gain or loss direct to its reserves(as part of the translation adjustment) until it sells the foreign unit.
l Evolution of foreign currency translation practiceCurrent accounting rules on foreign currency translation represent a compromise between USand European accounting practices. These, in turn, reflect different experiences in foreign invest-ment and different management styles.
The foreign operations of European companies often grew out of trading relationships forgedin colonial times. Key decisions had to be taken by local management because communicationswith head office were difficult. Later, when communications improved, the political situationhad changed. Former colonies became independent states. Governments objected to investmentand employment decisions affecting the country being made by foreign companies and insistedon local participation in ownership and management. For these reasons, European companiescame to view their foreign operations as autonomous. Moreover, there were pragmatic reasonsfor favouring the closing rate method. Many Continental European companies did not prepareconsolidated accounts until recently. A parent company accounted for its foreign operations, in its own accounts, as a long-term investment. It was convenient to translate investments in foreign currencies, whether temporary or long-term, at the closing rate. When consolidationbecame mandatory in the 1980s, companies found the task of consolidating foreign subsidiaries’accounts easier under the closing rate method. Surveys of Dutch, French, German and UK firms
CFA_C15.qxd 11/6/03 3:15 PM Page 478

CHAPTER 15 • TRANSACTIONS AND OPERATIONS IN FOREIGN CURRENCIES 479
carried out in the 1990s show that a large majority of companies in these countries used thismethod to translate the assets and liabilities of their foreign operations.
By contrast, the foreign operations of most US firms are of more recent origin. Many US firmsfirst established an overseas unit to serve the parent company – as a sales outlet or a source ofraw materials. Later, when the operation became more independent – with its own manufactur-ing base and markets – the parent company continued to maintain tight control. Local share-holdings were rare. US nationals occupied key management positions. The financial statementsof foreign subsidiaries were consolidated with those of the parent from the outset and its per-formance was evaluated in dollars, not local currency. The temporal method – or a variant of it– was the logical method of translation in these circumstances.
What turned US business against the temporal method as the sole translation method was notthe bases used to translate foreign assets but the treatment of exchange differences. Exchangerates became more volatile in the 1970s. For US firms with large foreign operations, this meantgreater variability of reported earnings as exchange gains and losses were recognised immedi-ately in the consolidated income statement. US firms protested to the FASB, the US accountingregulator, arguing that the increased variability was misleading. The closing rate method foundfavour because it provided a rationale for effectively deferring exchange gains and losses – if notindefinitely, then at least until the foreign operation was sold.
l Problems with the closing rate and temporal methodsSince the introduction of the dual translation system, managers have softened their criticism.Investors are still uneasy, however. They have difficulty interpreting the translated numbers.What sense is there in translating at current rates items that are stated at historical cost? Whatdoes a ‘positive translation adjustment’ indicate? Is it just a bookkeeping entry or does it indicatean increase in the value of the firm’s foreign operations?
To understand the problem faced by investors, it’s helpful to ask what are the properties of ‘ideal’ translated numbers. Beaver and Wolfson reckon there are two.11 First, the translatednumbers should have ‘economic significance’. For example, the book values of assets and liabilitiesafter translation should be equal to the present value of expected cash flows attributable to themin the reporting currency. The return on foreign investment expressed in that currency shouldapproximate the foreign assets’ economic rate of return. Second, the translated numbers should be unbiased. The accounting numbers should not be affected by the location of the investment.Thus two identical investments in two different countries (using different currencies) yieldingthe same return should produce the same accounting numbers when expressed in a commoncurrency.
Which translation method results in translated numbers having both properties? Beaver and Wolfson demonstrate that the closing rate method meets the two tests, but it does so under very restrictive conditions. First, all assets and liabilities must be valued at current market values.Second, changes in the exchange rates between any two currencies should be caused solely bychanges in the currencies’ relative purchasing power. When both conditions hold, any translationgain (loss) is a real economic gain (loss): it reflects the higher (lower) productivity of net assetsheld in the foreign currency.
Neither condition holds at present – or is ever likely to. Many assets and liabilities are measured at cost or amortised cost. Even if market values were to supplant historical costs,exchange rates would continue to be affected by interest rate differentials, political and economicuncertainties and other factors besides relative price inflation. In sum, only in rare circumstanceswill the translation adjustment in a period capture the change in value of a firm’s foreign operations.
CFA_C15.qxd 11/6/03 3:15 PM Page 479

480 PART 2 • THE HOUSE OF ACCOUNTING
Financial statement disclosures and analysis
l DisclosuresMost firms disclose the methods they use to account for foreign currency transactions and totranslate the financial statements of foreign operations. Those that follow international account-ing standards go further. They disclose:
l the exchange gains and losses included in profit for the period;l the cumulative translation adjustment in reserves. The cumulative amount should be shown
as a separate component of shareholders’ equity and the movement in the account over theyear explained; and
l the impact on the accounts of a change in the classification of a significant foreign operation(e.g. from satellite to autonomous unit) and the reason for the change.12
These disclosure requirements are similar to those in force in North America. Investors check a firm’s accounting policy on foreign currency translation carefully. It can be
difficult comparing two companies in the same industry during periods of exchange rate turbu-lence if each has significant foreign operations but one classifies them as autonomous while theother considers them integral to the parent’s operations.
l Additional information sought by investorsDisclosures required under IAS are of limited help. Investors are forward-looking. They seekinformation about the expected risk and return from a company’s foreign operations. A questionthat concerns them is: how will a company’s transactions and operations in foreign currenciesaffect its future profits and cash flows? To answer this, they must assess its foreign currency exposure in the short and long term.13
Transaction exposure
A company’s reported profits are sensitive to exchange rate changes in several ways. First, thecompany may have open transactions in a foreign currency. Examples are foreign currency receiv-ables and borrowings. Companies in Indonesia, Malaysia, South Korea and Thailand sufferedlarge foreign exchange losses during the currency turmoil of 1997. For example, Siam Cement,Thailand’s largest industrial conglomerate, saw its 1997 baht profits wiped out as a result of foreign exchange losses on its $4 billion of (unhedged) foreign currency loans. This type of riskis known as ‘transaction exposure’.
Transaction exposure can be managed. As we saw earlier, open transactions can be hedged.So, too, can future transactions. A company that plans to export goods to a country with a weak currency in the coming year can protect itself against devaluation by forward sale of theexpected receipts in the weak currency. The first thing investors look for, then, is information in the annual report and accounts about the firm’s hedging policies. SCA, a large Swedish paperand packaging producer, sets out its policies for managing currency risks in its annual report. Exhibit 15.4 contains an extract from the relevant section in its 2001 report.
SCA had consolidated sales of SEK 82 billion (a8.9 billion) in 2001. The group has produc-tion facilities in each of its major markets (Sweden, Germany, UK, USA) but the pulp and otherraw materials for its European plants come mainly from Sweden. Thus it’s exposed to exchangerate changes between the Swedish krona (SEK) and the euro (EUR) and between the krona andthe pound (GBP). According to management, the company applies a decentralised system to
CFA_C15.qxd 11/6/03 3:15 PM Page 480

CHAPTER 15 • TRANSACTIONS AND OPERATIONS IN FOREIGN CURRENCIES 481
CURRENCY RISKS
Transaction exposureTransaction exposure, defined as the commercial currency flow after net calculations of counterflows in thesame currencies, amounts to SEK 8,451 million annually. The most important individual currency relations areSEK against EUR and GBP (see table below.).
SCA applies a decentralised system to manage the Group’s transaction exposure, whereby each business area selects the most appropriate strategy for its subsidiaries within a centrally stipulatedframework. A minimum requirement calls for the hedging of booked accounts receivable and accountspayable. Centrally, there is a mandate to deviate from the subsidiaries’ positions within established risk limits.
During 2001, flows representing a maximum of 8.5 months and a minimum of 5.2 months were hedgedagainst SEK. At year-end, flows representing 5.7 months were hedged, corresponding to a volume of SEK 4,026 million.
Foreign assetsCapital employed in foreign currencies at 31 December 2001 amounted to SEK 58,240 million. The distribution between different currencies is shown in the table below.
In accordance with SCA’s policy for financing of foreign assets, capital employed is matched by borrowings and forward contracts so that the booked debt/equity ratio is unaffected by foreign exchange rate fluctuations. In combination with this policy, SCA strives to optimise capital structure based on theGroup’s tax situation in each country, which means that a higher debt/equity ratio is selected in certaincountries. Overall, this means that, based on present currency distribution and debt/equity ratio, about 47%of the foreign capital employed must be matched.
On 31 December 2001, foreign assets were matched by loans in foreign currencies corresponding toSEK 28,620 million, equivalent to a matching ratio of 50%. . . .
Long-term currency sensitivityThe distribution of SCA’s net sales and operating costs among different currencies shows the Group’s long-term currency sensitivity. With the exception of SEK, SCA maintains a balance between revenues andexpenses in all major currencies (see table below).
SCA Group earnings are also affected indirectly by changes in foreign exchange rates for USD, CAD (Canadian dollar) and EUR, since forest industry companies in North America and Finland are major exporters.
Transaction Capital Operatingflows, employed, Net debt, Net sales, expenses,
Currency SEK mn. SEK mn. SEK mn. % %
Euro (EUR) 3,682 24,595 5,134 48 45British pound (GBP) 2,035 12,567 5,909 16 13Danish krone (DKK) 731 2,482 2,107 4 3US dollar (USD) 112 14,210 14,179 15 16Other 1,891 4,386 1,290 9 6Swedish krona (SEK) −8,451 12,341 −4,758 8 17
Total 0 70,581 23,861 100 100
SCA Group: extracts from ‘Financial risk management’ in 2001 reportExhibit 15.4
(Source: SCA Group, Annual Report 2001. Reproduced by permission of Svenska Cellulosa Aktiebolaget SCA.)
CFA_C15.qxd 11/6/03 3:15 PM Page 481

manage transaction exposure but requires, at a minimum, that each business area hedges bookedreceivables and payables.
In the absence of a statement like SCA’s (and not all firms provide one), investors must searchin the accounts for indirect information about corporate hedging policy. Many companies try touse ‘natural’ hedges, where possible, since they are less costly than financial instruments such asforward exchange contracts which must be purchased.
A natural hedge is one where, as a result of regular operating and financing decisions, a firm’sexpected cash receipts in a foreign currency are equivalent to its expected payments in that cur-rency. Thus oil companies often finance development of new fields with dollar loans because theUS dollar is the currency in which most oil trading takes place. A strengthening of the dollaragainst other currencies results in exchange losses on the dollar debt but exchange gains on oilsales. By combining information in the accounts – for example, the currencies and paymentprofiles of borrowings – with an understanding of the company’s business, investors can assess towhat extent the firm is using natural hedges to protect itself against exchange rate changes.
Translation exposureA second risk is that of ‘translation exposure’. For a firm with operations in more than one country, exchange rate movements affect consolidated figures when the foreign units’ accountsare translated into the group’s reporting currency. Sometimes the reported translation gain or losscan be very large, especially after a major devaluation. Repsol YPF, a Spanish oil and gas companywith large Argentinian operations, booked a translation loss of a1.45 billion in 2001 as a resultof the devaluation of the Argentinian peso at the end of the year. This is equivalent to 10% of itsend-2001 shareholders’ equity and exceeds its reported 2001 net income of a1 billion.14
Investors often have difficulty interpreting the translation gain or loss – or ‘translation adjust-ment’, as it’s also known. For example, there’s general agreement that companies’ Argentinianassets were impaired as a result of the 2001 economic crisis and accompanying peso devaluation.However, the translation adjustments that companies like Repsol reported that year were prob-ably an unreliable indicator of the change in value of their Argentinian net assets since the latterwere, in most cases, measured at (depreciated) cost. The translation adjustment usually capturesthe sign but rarely the magnitude of the gain or loss in net asset value from an exchange ratechange.
Easier to understand is the effect of exchange rate changes on the income statement. Manymultinational companies now provide this information voluntarily and investors find it helpfulwhen preparing earnings forecasts. For example, Unilever, the Anglo-Dutch food and householdproducts group, discloses in its 2001 accounts two calculations of turnover and trading result for the year: at average exchange rates prevailing in 2001 (‘current rates’) and at average ratesprevailing in 2000 (‘constant rates’). (Unilever defines trading result as operating profit beforeexceptional items and amortisation of goodwill and other intangibles.)
2001 2001 2000 % change % changecurrent constant at current at constant
In Bm rates rates rates rates
Turnover 51,514 52,683 47,582 8.3 10.7Trading result 6,579 6,688 3,753 75.3 78.2
Turnover and results were boosted in 2001 by the acquisition of Bestfoods, a US food productscompany. Restructuring also contributed to the sharp profit increase that year. The results were even better when measured using constant exchange rates. The strengthening of the euroin 2001 depressed the growth in group turnover and results: the sales and profit contributions
482 PART 2 • THE HOUSE OF ACCOUNTING
CFA_C15.qxd 11/6/03 3:15 PM Page 482

of Unilever’s US and UK operations had a lower translated value. (The opposite effect is evidentin 2000 when the euro weakened against the dollar and sterling.)
Some firms hedge their translation as well as their transaction exposure. The most commonpractice is for the foreign unit to borrow funds in the local currency to finance its assets. As we saw earlier, under hedge accounting rules, a parent company can even designate its own borrowings in a foreign currency as a hedge of its investment in a foreign subsidiary. SCA goesfurther. According to its statement on currency risk management (set out in Exhibit 15.4), it uses forward contracts as well as foreign borrowings to achieve a target matching ratio of foreigndebt to foreign capital employed. SCA may be required under loan covenants negotiated with its bankers to keep its debt–equity ratio below a specified upper limit and the company usesderivatives as well as natural hedges to ensure this.15
Economic exposure
As we saw with Unilever, firms with foreign operations often indicate the impact on past earningsof exchange rate changes during the year. However, investors are more interested in gauging theimpact of those exchange rate changes on a firm’s future earnings and cash flows. We can thinkof this impact as the firm’s ‘economic exposure’ to currency shifts.
All firms – even those without foreign operations or even foreign transactions – are affectedby exchange rate changes. Sometimes the effect is direct. For example, the appreciation of sterling against Continental European currencies in the late 1990s resulted in a fall in profits for UK-based companies with large export sales in these currencies. In other cases, the effect is indirect. SCA notes that its earnings are affected by the relative strength of the Swedish kronaagainst the US dollar, Canadian dollar and the euro since these are the currencies of its maincompetitors (see Exhibit 15.4).
How can investors assess a firm’s economic exposure to exchange rate changes? The first stepis to check the annual report, in particular management’s review of operations, to see whetherthe firm itself is aware of the risk and has a strategy to deal with it. For example, SCA – in com-mon with other Swedish multinationals – shows the percentage of sales and operating expensesin each of the major currencies of its operations (see Exhibit 15.4). By maintaining a balance of revenues and costs in each currency, the company reduces the sensitivity of its earnings toexchange rate changes. It is for this reason that UK companies responded to the appreciation ofsterling in the late 1990s by increasing the proportion of imported inputs. Car manufacturerssuch as Toyota and Nissan that had UK plants and large EU sales, shifted sourcing of com-ponents to eurozone countries. Note that the balancing of revenues and costs by currencyreduces a firm’s economic exposure to exchange rate changes but cannot overcome the effects ofan overvalued exchange rate on its profitability.
In the absence of a formal statement by management, investors look for evidence of hedg-ing of economic exposure in the firm’s accounts. Where are its main operating assets? Where are its liabilities? In which currencies are most outlays made and in which are proceeds fromsales received? To answer these questions, investors search for information about the following.
l The geographical breakdown of the firm’s sales and, if available, operating assets and liabilities.This is part of the ‘segmental reporting’ disclosures that large quoted companies with foreignoperations are required to make. The information is found either in the annual report or inthe notes to the annual accounts. We discuss this topic further in Chapter 20.
l The location of its major operating subsidiaries and associated companies. National law usuallyrequires firms to publish this information.
l The currencies of its borrowings and the swap commitments it has entered into. Firms followingIAS or US GAAP are required to disclose borrowings by currency.
CHAPTER 15 • TRANSACTIONS AND OPERATIONS IN FOREIGN CURRENCIES 483
CFA_C15.qxd 11/6/03 3:15 PM Page 483

Investors then relate the information they’ve gathered from the accounts to the review bysenior management of the firm’s operations in the annual report. They also consult the annualreports of other firms in the industry to learn about the currency mix of their operations. In thisway, they form a judgement about the risks to the target firm from exchange rate changes – andof the potential rewards, too.
Convenience translations
Some companies present their financial statements in more than one currency. Large Japanesecompanies, for example, present US dollar as well as yen numbers on the face of their financialstatements. The figures in the foreign currency – usually, the US dollar – are for the benefit ofinternational investors who may be unfamiliar with the company’s reporting currency and usethe US dollar numbers to gauge the magnitude of key numbers in the accounts such as sales andnet profit. Such translations are known as convenience translations. The company translates all the numbers in the consolidated financial statements at one exchange rate (usually the spotexchange rate at its financial year-end). The translated numbers have no economic significance:they’re simply a recalibration of those in the reporting currency.
Summary
In this chapter we have looked at the accounting for both transactions and operations in foreigncurrencies. The former is of broader interest. More companies trade – and borrow and lend – inforeign currencies than set up businesses abroad. However, foreign operations raise more trickyaccounting problems.
Accountants distinguish hedged from unhedged foreign currency transactions. In the lattercase, the company does not actively protect itself against loss from exchange rate changes. Under international rules, it must recognise unrealised foreign exchange gains and losses fromsuch transactions immediately. If the company hedges the transaction – and the hedge is aneffective one – it may be able to defer the unrealised exchange gain or loss. In the case of a cashflow hedge, the gain or loss is deferred until the asset or liability arising from the hedged cashflow is recognised. In the case of a foreign investment hedge, the gain or loss is deferred until theinvestment is sold.
A company with a foreign operation holds assets and liabilities in a foreign currency and musttranslate them into its reporting currency in order to prepare consolidated accounts. How it doesthis depends on the nature of the foreign operation. If it’s an autonomous entity, the closing ratemethod is used: the entity’s assets and liabilities are translated at the end-year exchange rate andany net translation gain or loss is deferred until it is sold. If the foreign operation is consideredan integral part of the parent company’s business, the parent uses the temporal method: assetsand liabilities are translated at the exchange rate appropriate to the valuation basis used and the net translation gain or loss is recognised in income immediately. Both methods are flawed.The translation gain or loss under either method is unlikely to show the real change in value of the firm’s foreign operations.
Firms engage in foreign trade and set up foreign operations in the search for higher returns.Such activities bring increased risk, in part because of exchange rate changes. Investors check theannual report for evidence that the firm is protecting itself against foreign currency risks. Thehedges it employs may be artificial (e.g. forward exchange contracts) or natural (e.g. matchingof cash inflows and outflows by currency). At a broader level, the currency mix of a firm’s inputsand outputs and the geographical spread of its operations – and those of its rivals – give investorsclues about the competitive impact on its business of exchange rate changes.
484 PART 2 • THE HOUSE OF ACCOUNTING
CFA_C15.qxd 11/6/03 3:15 PM Page 484

CHAPTER 15 • TRANSACTIONS AND OPERATIONS IN FOREIGN CURRENCIES 485
Problem assignments
P15.1 Unhedged transaction in a foreign currencyOn 15 October x5, a Swiss retail co-op places a bulk order for ‘Rosa’ ragu sauce with Priore, an Italianfood producer. The value of the contract is SFr 2 million. Priore delivers the goods on 1 Decemberand the retail co-op pays the contract amount on 15 February x6, the due date. Priore’s financial year-end is 31 December.
The rate of exchange between the euro (Priore’s reporting currency) and the Swiss franc variesover this period. The spot rates on key dates are given below:
15 October x5 SFr 1.462 : A11 December 1.48531 December 1.62015 February x6 1.515
Priore does not hedge this foreign currency transaction. Its policy is to recognise unrealised exchangegains and losses on foreign currency transactions as they arise.
Required
Show the accounting entry Priore makes on 1 December x5 to record the sale. (Ignore the entryrecording the cost of sales.) What is the exchange gain or loss on this contract that Priore recognisesin x5? In x6?
Check figure:Net exchange loss, x5 and x6 A26,669
P15.2 Hedged transaction in a foreign currencyRefer to the facts in P15.1. Suppose that on receipt of the order from the Swiss retail co-op on 15 October x5, Priore decides to hedge the SFr 2 million receivable to protect itself against appre-ciation of the euro. On that date, it enters into a four-month forward contract with its bank. The forward rates (for 15 February x6) on the order, delivery, and year-end dates are given below:
15 October x5 SFr 1.450 : A11 December 1.47631 December 1.614
On 15 February x6, Priore receives SFr 2 million from the retail co-op. The bank pays Priore A59,178[(SFr 2 million / SFr 1.45) − (SFr 2 million / SFr 1.515)] in settlement of the forward contract.
Required
Show the accounting entries that Priore makes on the order, delivery, year-end and settlement dates with respect to the sale and forward contracts. What is the hedging income or expense on theforward contract it recognises in x5? In x6? What is the exchange gain or loss on the sale contract itrecognises in x5? In x6?
P15.3 Accounting for autonomous foreign operationTo better compete with low-cost imports, Sachs, a German footwear manufacturer, sets up a shoe-making company in an emerging economy, Pacifica, in January year 1, and invests 300 million pesos(A20 million) in it. Sachs Pacifica breaks even in its first year of trading. Its balance sheet at the endof year 1 is shown below (amounts are in millions of pesos).
CFA_C15.qxd 11/6/03 3:15 PM Page 485

486 PART 2 • THE HOUSE OF ACCOUNTING
Balance sheet, end-year 1
Property and equipment 250 Share capital 300Inventories 70Accounts receivable 50Cash 30 Debt and other monetary liabilities 100
Total assets 400 Total equities 400
Sachs Pacifica trades profitably in year 2. Its financial statements for the year are set out in Exhibit 15.5.Information about the movement in the peso/euro exchange rate during years 1 and 2 is also given inthe exhibit. Sachs follows international standards in accounting for foreign operations.
Required
Assume Sachs Pacifica is an autonomous unit for foreign currency translation purposes. Translate itsyear 2 accounts from pesos into euros.
Explain the reason for the change in the carrying amount of the investment. Why has it increasedfrom A20 million at the start of year 2 to A21.52 million by the end?
Sachs PacificaIncome statement, year 2
Sales revenue 500Less:Cost of goods sold:
Beginning inventory 70Production costs 310– Ending inventory –80
–300Depreciation –40Other expenses –120
Net profit 40
Balance sheet, end-year 2Property and equipment 270* Share capital 300Inventories 80** Profit for year 40Accounts receivable 60Cash 40 Debt and other monetary liabilities 110
Total assets 450 Total equities 450
* Start year 2, at net book value 250Purchases at 1/1 60– Depreciation –40End year 2, NBV 270
** Purchased/produced in 4th quarter, year 2.
Exchange rate information:Year 1 bfffffff Year 2 fffffffg
1/1 1/1 Average 4th qtr 31/12Pesos to the euro 15 15 16.1 16 15.8(There was no change in the exchange rate during year 1.)
Sachs Pacifica: annual accounts and key exchange rate data for year 2(currency amounts in millions of pesos)
Exhibit 15.5
CFA_C15.qxd 11/6/03 3:15 PM Page 486

P15.4 Accounting for non-autonomous foreign operationRefer to the facts in P15.3 and Exhibit 15.5.
Required
Assume Sachs Pacifica’s operations are an integral part of those of its German parent company – forforeign currency translation purposes. Translate its year 2 accounts from pesos into euros.
Why do Sachs Pacifica’s operations give rise to a translation gain of A0.36 million in year 2 whenthe peso has weakened against the euro in that year?
P15.5 Non-autonomous foreign operation: translation issuesAce, a South Korean electronics company, has a subsidiary, Diamond, in Puerto Grande, a Caribbeanisland. Diamond assembles computer hardware for sale in the region. Although Diamond keeps its accounts in doblón, the local currency, its functional currency is the South Korean won as it purchases parts and receives financing from its South Korean parent.
As a result of depressed economic conditions in the industry in x2, Diamond is forced to markdown its inventory to market value at 31 December. In addition, a year-end impairment review revealsthat the recoverable amount of its plant and equipment is below the carrying amount.
(In millions of doblón) At 31 Dec x2
Inventory, at cost 30Valuation adjustment −2Inventory, at LOCOM 28
Plant and equipment, at cost 120Accumulated depreciation −24Accumulated impairment losses −15Plant and equipment, net 81
Puerto Grande is an oil and gas producer and the doblón has strengthened against the won and othercurrencies in recent years as new reserves have been discovered. Key exchange rate data are givenbelow:
Start x1 (purchase of plant and equipment) 162 won : 1 doblónAverage in Qtr 3, x2 (purchase of end-x2 inventory) 189Average for x2 18631 December x2 196
Required
Mae-Young, Ace’s controller, is preparing the company’s consolidated accounts for x2. She wants toknow how to translate Diamond’s fixed assets and inventory into won for consolidation purposes.Advise her.
P15.6 Foreign operations in a hyperinflationary economyPortasports, an EU firm, assembles and markets portable sports facilities – or ‘kits’. A kit allows sportsmatches – in, say, soccer, tennis or rugby – to be held in a village or town which lacks permanentfacilities for that sport.
At the start of x3, Portasports establishes a subsidiary in the South Sea Islands (SSI). Portasports(SSI) imports ‘portatennis’ kits from Europe. Each kit contains the key elements of a competition tennis court – ‘roll-away’ court with net, scoreboard and spectator stands.
CHAPTER 15 • TRANSACTIONS AND OPERATIONS IN FOREIGN CURRENCIES 487
CFA_C15.qxd 11/6/03 3:15 PM Page 487

488 PART 2 • THE HOUSE OF ACCOUNTING
Portasports (SSI)’s initial balance sheet is as follows (amounts are in millions of pistoles):
Balance sheet at 1/1/x3Inventory 9 Share capital 11Cash 2 Liabilities 0
Total assets 11 Total equities 11
The inventory consists of three kits costing 3 million pistoles (or A500,000) each.Portasports (SSI) trades profitably in its first year. It sells two of the three kits. Its x3 accounts are
shown in Exhibit 15.6, together with relevant exchange rate and inflation data.The South Sea Islands have experienced a rapid increase in prices in recent years. The cumulative
rate of increase in the three years to the end of x3 is 125%.
Required
(a) Convert Portasports (SSI)’s x3 accounts from pistoles into euros. Either restate the accounts intoend-x3 constant purchasing power units and translate the restated accounts at the closing rateor translate the unadjusted accounts using the temporal method.
(b) Portasports records a translation loss of A0.16 million in its consolidated x3 accounts with respectto its SSI subsidiary. Suggest ways in which it can reduce or eliminate future translation lossesusing a natural hedge.
Portasports (SSI)Income statement for x3
Sales revenue 15(2 kits @ 7.5)Less:Cost of kits sold –6Other expenses –6
Profit 3
Balance sheet at 31/12/x3Inventory 10 Share capital 11(1 kit @ 3, 2 kits @ 3.5) Profit for x3 3Cash 4 Liabilities 0
Total assets 14 Total equities 14
Inflation data:Index during x3
Start-year End Qtr 2 End Qtr 3 End-yearIndex of consumer prices 180 198 210 225(start-x1 = 100)
Exchange rate data in x3:Start-year End Qtr 2 End Qtr 3 End-year
Pistoles per euro 6 6.6 7 7.5
Assumptions:The ‘portatennis’ kits are imported at the start of x3. Sales are made and other expensesincurred at the end of quarter 2. Inventory is replenished (2 kits @ 3.5) at the end of quarter 3.
Portasports (SSI): summary x3 accounts and related data(currency amounts in millions of pistoles)
Exhibit 15.6
CFA_C15.qxd 11/6/03 3:15 PM Page 488

CHAPTER 15 • TRANSACTIONS AND OPERATIONS IN FOREIGN CURRENCIES 489
P15.7 Exchange differences and published accounts(1) Universal Electric (UE), a diversified US company with interests ranging from aero engine produc-
tion to financial services, has extensive operations outside the USA. In the statement of changesin shareholders’ equity in its x9 consolidated accounts, it reports the following balances at year-end (amounts are in US$ million):
x9 x8 x7Cumulative translation adjustment 279 (180) (127)
Required
Did the US dollar, UE’s reporting currency, strengthen or weaken overall relative to the currencies ofcountries where UE has operations: (a) in x8, (b) in x9? What assumptions underlie your answer?
(2) Geosonic, a large Japanese consumer electronics group, sold 80% of its stake in ACM, a USentertainment company, to Bourbon, a Canadian drinks group, in May x5 for US$5.7 billion. It hadacquired its stake in ACM for US$6.1 billion five years earlier. However, because the yen hadappreciated by more than 35% against the dollar since that date, it recorded a loss of ¥165 billion(then equivalent to US$1.9 billion) on the sale. ACM was an autonomous unit of Geosonic for foreigncurrency translation purposes.
Required
(a) Why did Geosonic recognise a foreign exchange loss of ¥165 billion in its income statement (forthe year to 31 March x6), given that ACM was an autonomous unit of Geosonic?
(b) Geosonic’s net assets declined by less than ¥165 billion as a result of the sale. Why?
Notes to Chapter 15
1 International Accounting Standards Board, IAS 21: The Effects of Changes in Foreign Exchange Rates.Where a non-monetary item is revalued, the exchange component of the revaluation is accounted forin the same way as the unrealised holding gain or loss – to reserves if the unrealised gain or loss isdeferred in equity or to the income statement if it’s recognised in profit or loss.
2 Not all unrealised exchange gains and losses on foreign currency monetary transactions must be recognised in income immediately. As we show later, a company can designate a foreign currency borrowing as a hedge of a net investment in a foreign entity under IAS 21. If the hedge is effective, the unrealised exchange gain or loss on the borrowing can be deferred in equity – along with the unrealised exchange loss or gain on the investment – until the investment is sold.
3 International Accounting Standards Board, IAS 39: Financial Instruments: Recognition andMeasurement. Hedge accounting is discussed in greater depth in Chapter 13 (and the accounting for cash flow hedges is illustrated there).
4 In practice, the fair value of the forward contract is not necessarily equal to the notional amount of theforward contract times the change in forward exchange rates. The contract’s fair value is influenced byother factors besides the change in forward rates (for example, the creditworthiness of the counter-party to the contract).
5 The currency in which the parent company prepares its accounts need not be the currency of its homecountry. For example, although BP is a UK-registered company, it prepares its consolidated accountsin US dollars. Most of its business is conducted in – or is referenced to – the US currency.
6 ‘Parent company’ refers to the entity making the foreign investment. The US subsidiary of a Swedishfirm that opens a factory in Mexico is the parent company of the Mexican operation – and the Swedishfirm is the parent of the US one – for purposes of IAS 21.
7 Pronounced ‘Lesster’ and ‘Arkansaw’ respectively. Foreigners, as Mark Twain observed, ‘always spellbetter than they pronounce’ (Twain, M. (1869), The Innocents Abroad, Hartford, CT: AmericanPublishing Company).
CFA_C15.qxd 11/6/03 3:15 PM Page 489

8 The accounting terminology here can be confusing. ‘Exchange difference’ is a general term which coverstransaction and translation gains and losses, whether recorded in income or taken direct to reserves. Atranslation gain or loss which is taken direct to reserves is usually described as a (positive or negative)‘translation adjustment’.
9 IAS 21 does not use the term ‘temporal method’ to describe these translation procedures. Accordingto the standard, the accounting for non-autonomous foreign operations is considered to be equivalentto the accounting for (unhedged) foreign currency transactions.
10 One indicator of a hyperinflationary economy, according to IAS, is a cumulative inflation rate overthree years approaching or exceeding 100% (IAS 29: Financial Reporting in Hyperinflationary Economies).
11 Beaver, W. and Wolfson, M. (1982), Foreign currency translation and changing prices in perfect andcompetitive markets, Journal of Accounting Research, 20: 528–550.
12 IAS 21 also encourages firms to disclose their foreign currency risk management policies.13 Foreign operations entail other risks which investors must also assess. One example is political risk, a
broad term which covers the risks of economic loss arising from government action (e.g. expropriationof corporate assets) or breakdown (e.g. civil unrest leading to suspension of business operations).
14 In addition to the translation adjustment, Repsol booked provisions of a1.3 billion in its 2001 incomestatement to cover the effects of the peso devaluation on its Argentinian operations (e.g. higher baddebts, impairment of assets, additional financial expenses). Repsol also discloses in the notes that thetranslation adjustment would have been a2.6 billion if it had applied the exchange rate prevailing atthe date of issue of the financial statements rather than the rate prevailing at the balance sheet date.
15 Some companies try to minimise currency-induced swings in translated earnings through hedging. If a company expects its reporting currency to strengthen, thereby reducing its foreign unit’s earningson translation, it sells foreign currency forward. The exchange gain on the forward contract offsets the lower translated earnings. If the reporting currency does not appreciate as expected, the companyforgoes the exchange gain on the forward contract but its foreign unit’s earnings are higher in report-ing currency terms. The popularity of such hedging has declined in recent years. It’s costly and doesnot qualify for hedge accounting treatment. Under IAS 39, hedging foreign currency earnings is not acash flow hedge so gains and losses must be recognised in income as they arise.
490 PART 2 • THE HOUSE OF ACCOUNTING
CFA_C15.qxd 11/6/03 3:15 PM Page 490

Employment costs
INTRODUCTIONPay matters – and not just for employees. For many companies, especiallythose in labour-intensive service industries, wages and other employee benefitsare the largest operating cost. On a national level, they represent 50–60% ofthe gross domestic product of developed countries.
Pay takes many forms. In section 1 of the chapter we survey the varioustypes of compensation an employee may receive – from salary to share options,benefits to bonuses – and describe, in general terms, the accounting for eachof them.
As a general principle, a company should recognise the cost of pay andother types of compensation as employees earn them and should measure thatcost at fair value. In some cases, it is difficult to measure fair value when thecompensation is deferred and is contingent on uncertain future events. Weexamine two examples of such compensation – post-employment benefits andemployee share options – in depth in section 2.
In the final section we describe the information European companies dis-close about employee numbers and costs in their annual accounts and showhow it’s used, by investors and others, in financial analysis.
1616
SECTION 1General issues
l Types of employeebenefit
l Accounting foremployee benefits:an overview
SECTION 2Specialised topics
l Pension benefits
l Employee shareoptions
SECTION 3Employment costs andfinancial analysis
In this chapter
CFA_C16.qxd 11/6/03 3:17 PM Page 491

492 PART 2 • THE HOUSE OF ACCOUNTING
SECTION
1 General issues
Types of employee benefit
Companies use pay and other forms of compensation to attract (and retain) staff, to motivatethem and to reward them for good performance. The way staff are paid varies. Compensationcan be fixed (salary) or variable (piece rate, sales commission). It is usually in cash but may bein goods and services (fringe benefits such as subsidised housing, transport and medical care) orthe company’s shares. Sometimes it is deferred – for example, merit increases that raise basesalary in future periods, pensions and bonuses.
If the goals of pay policy are simple, why are there so many types of pay? One reason is thatthe goals require different pay mechanisms. For example, to motivate staff (and, indeed, to attractthem to the company in the first place), the company must reduce their income uncertainties: thismay require payment of a regular, fixed salary. To reward good performance, however, it needsto link part of an employee’s pay to his or her accomplishments – hence the use of bonuses.
Another reason is the influence of a country’s tax and welfare systems. For example, somecountries provide tax incentives for company-sponsored pension plans: company contributionsare tax-deductible but returns on plan assets are tax-exempt. Similarly, fringe benefits can offertax advantages: they may be more lightly taxed than cash income in the hands of employees butthe company is able to deduct their full value in its tax return.1
A third reason lies in the indirect, non-pecuniary effects of an organisation’s pay policy. Pay involves issues of equity and status. For example, a company may increase the level of non-monetary rewards (e.g. certain fringe benefits, office size and location) relative to monetary onesif employees set great store by status.2
Accounting for employee benefits: an overview
Employee benefits comprise not only wages but also other forms of compensation such asbonuses, paid leave and pension benefits which an employee receives for services rendered to thecompany. The accounting for the cost of these benefits is straightforward. The company recog-nises the cost when the employee earns the benefit. The benefit is measured at fair value. In thefollowing sections, we show how these recognition and measurement principles are applied withrespect to the major types of employee benefit.
l Wage and related costsThe principal employment cost for most firms is that of wages. (We use the term in its broadsense. The term ‘salaries’ is used more narrowly to refer to periodical (usually monthly) payments to employees.) A company recognises the cost of wages and the related liability asemployees render services in exchange for them:
Dr. Wages expense (OE−) xxxCr. Accrued wages payable (L+) xxx
Wages include overtime and other contractually agreed payments. For most companies, thisis an accrued liability. The expense and liability accumulate (accrue) over time and payroll
CFA_C16.qxd 11/6/03 3:17 PM Page 492

records are updated weekly or monthly. Periodically, the company settles the debt by paying itsemployees:
Dr. Accrued wages payable (L−) xxxCr. Cash (A−) xxx
In practice, the structure of wage costs is more complicated and the accounting reflects this.First, companies in all countries bear employment costs other than wages. The main additional costis the employer’s share of social security taxes. Think of social security as a government-run multi-coverage insurance policy. Social security taxes are then a form of insurance premium. The rangeand scale of benefits offered by this insurance policy vary widely across countries: coverage caninclude medical care and sickness, disability, industrial injury and occupational diseases, matern-ity and paternity, family allowances, unemployment, retirement and death. As a result, nationalsocial security tax rates also differ markedly. The other important non-wage cost is that of supple-mentary benefits the employer offers existing and former employees. Examples are health care andpension benefits available under company-sponsored plans.
Second, the cash an employee receives is less than the wage he or she earns owing to taxes andother deductions withheld at source. The company may be required by law to withhold from payboth income taxes and its employees’ share of social security taxes and forward them to theappropriate government agency. In addition, company pension and health care plans may be‘contributory’ (the employee must make regular payments to the plan) and the employee’s contributions are deducted at source from his or her pay.
How do employer costs and withholdings affect the accounting for wages? We can illustratethis with an example. Despina’s clinic treats certain medical disorders using magnetic tech-niques. The January payroll records for two employees, Fiordiligi and Dorabella, are based onthe following data:
Salary per employee 1,000Withholding rate of income tax 20%Social security tax:
Employer contribution as % of salary 15%Employee contribution as % of salary 8%
Pension plan: employer contribution/employee 100Health care plan: employer contribution/employee 45(Employees make no contributions to these plans:the plans are ‘non-contributory’.)
The journal entries the clinic makes to record the costs of the two employees’ wages andbenefits in January are as follows:
Wage costsDr. Salaries expense (OE−) 2,000
Cr. Employee income taxes payable (L+) 400Cr. Employee social security taxes payable (L+) 160Cr. Salaries payable (L+) 1,440
Employee benefits costDr. Employee benefits expense (OE−) 590
Cr. Employer social security taxes payable (L+) 300Cr. Employer pension contribution payable (L+) 200Cr. Employer health care contribution payable (L+) 90
CHAPTER 16 • EMPLOYMENT COSTS 493
CFA_C16.qxd 11/6/03 3:17 PM Page 493

Despina pays Fiordiligi’s and Dorabella’s salaries at the end of January and settles the tax andcontribution liabilities when they fall due, at monthly or quarterly intervals. Note that the totalmonthly cost to the clinic of the two employees is 2,590, of which 23% (590/2,590) representsthe costs of employee benefits borne by Despina.
l Compensated absencesEmployment contracts usually stipulate that the employee continues to receive compensationwhen absent from work for certain specified reasons such as sickness, vacations, maternity orpaternity leave, and jury or military service. In many cases, an employee’s right to compensation‘accumulates’, that is, the absences earned can be carried forward and used in future periods. (Ifthe right to compensation ‘vests’, the employee receives a cash payment for absences earned andunused at the date he or she leaves the firm.)
Under IAS, a company should accrue the expected cost of compensated absences that are, by nature,accumulating, as employees earn them. Where the compensated absence does not accumulate (i.e.can’t be carried forward), it should recognise the cost only when the absence occurs. Thus acompany with ten employees that have each earned – and can carry forward – 15 days’ vacationby its financial year-end should recognise an expense and a liability for the expected cost of theseunused holidays:
Dr. Salaries expense (OE−) xxxCr. Accrued vacation pay (L+) xxx
When the employees take the accumulated vacation, the company debits the liability and credits cash.
Accumulating compensated absences are measured at their expected cost. In the above example, the company should base the cost of the 15 days’ earned vacation on the salaries theemployees are expected to receive in the period when they take the vacation rather than whenthey earned it. In the case of accumulated sick-pay, a company measures its liability as the prod-uct of the days of carried-forward sick leave an employee is expected to claim times his or herexpected salary rate at the time of claim.
l Pension and other post-employment benefitsPost-employment benefits are benefits an employee receives after leaving the company’s service or onretirement. They are a form of deferred compensation. The employee accepts a lower wage todayin return for a lump sum or flow of payments in the future. Post-employment benefits include pen-sion, healthcare and insurance benefits. The discussion in this section is framed in terms of pen-sion benefits – for most companies, they are the largest post-employment cost – but the conceptsapply to other post-employment benefits as well.
When setting up a company pension plan, management must make certain decisions. One keyone is whether or not the plan should be funded. (In some countries, firms have no option: theyhave to fund.)
Where the plan is funded, the company, alone or with its employees, sets aside cash to meet futurepension obligations. It does this by either contributing cash to a pension fund or purchasing dedicated insurance policies. The pension fund may be an independent entity (e.g. the fundmanagement arm of a bank) or a unit legally separate from but controlled by the company. Thefund (or insurance company) invests the cash (premiums) in income-yielding assets; later, itpays pensions to retired employees, drawing on those assets. Panel A of Exhibit 16.1 shows thepension-related cash flows between employer, pension fund insurance company and employeeunder a funded plan. (The plan is assumed to be non-contributory.)
494 PART 2 • THE HOUSE OF ACCOUNTING
CFA_C16.qxd 11/6/03 3:17 PM Page 494

CHAPTER 16 • EMPLOYMENT COSTS 495
Where the plan is unfunded, the company pays pensions from its own resources. It may earmarkits own assets (e.g. financial investments) for this purpose but it does not transfer funds to anindependent entity. Panel B of Exhibit 16.1 shows the pension-related cash flows betweenemployer and employee under an unfunded plan.
Another major decision for management is whether the pension plan should specify the pensionbenefits a retiree will receive. Company-sponsored plans fall into one of two groups:
1 Defined contribution plans. A defined contribution (DC) plan specifies the contributions whichthe employer (and, in some cases, the employee) must make to a separate pension fund eachperiod. It does not specify the pension to be paid. Thus the sums an employee receives on retire-ment will depend on the amounts invested in the fund and the cumulative returns on thoseinvestments. In effect, the employee assumes the investment risk. Money purchase plan isanother name for this type of plan.
2 Defined benefit plans. A defined benefit (DB) plan specifies the terms of an employee’s pension– how it is to be computed, the starting date and duration. The pension is usually a function oflength of employment and salary level, usually weighted towards the later years of employment.In fact, this type of plan is also referred to as a final salary plan.
A DB plan can be funded or unfunded. (A DC plan is, by definition, funded.) Note that, witha DB plan, the employer retains the investment risk. This is so even if the plan is funded.Although the contributions to the fund together with the returns on its investments are intended
Pension-related cash flows: funded and unfunded plansExhibit 16.1
CFA_C16.qxd 11/6/03 3:17 PM Page 495

496 PART 2 • THE HOUSE OF ACCOUNTING
to be sufficient to meet retirees’ pension benefits, the company bears the cost if they are notbecause the plan specifies the pensions to be paid.
A pension plan’s form influences the way the company accounts for the cost of pensionbenefits. One principle, however, is universal. Under international rules, a company must followthe accrual basis when accounting for pension (and other post-employment) costs. It recognises theexpense (and related liability) as employees earn the rights to these benefits. Most state pensionschemes, however, are accounted for on a cash (or ‘pay as you go’) basis: pension expense isrecognised when pensions are paid. Exhibit 16.2 shows in outline the accounting for pensioncosts under the accrual and cash bases and, within the accrual basis, contrasts the entries madeunder funded and unfunded plans.
Companies face problems measuring pension cost under DB plans. (In the case of DC plans,pension expense is usually equal to the periodic contribution the company is required to maketo the plan.) There are two major sources of uncertainty. First, what are the future payments the company (or pension fund) will actually have to make to retirees? Remember: the pensionliability of the company (or fund) is the present value of its expected pension payments toretirees. Those future payments must be estimated and the estimates themselves are sensitive toassumptions about future salary levels, employee turnover, life expectancy, interest rates andasset yields.
Second, how should the annual cost of the pension liability be determined? Even if there isagreement on what the pension liability is likely to be at the date of an employee’s retirement,there are many ways in which that liability can be accrued over the employee’s working life.Section 2 of the chapter explores these issues and explains how the international accountingstandard on employee benefits has resolved them.
Recognising the cost of pension benefits: accounting frameworkExhibit 16.2
CFA_C16.qxd 11/6/03 3:17 PM Page 496

CHAPTER 16 • EMPLOYMENT COSTS 497
l Termination benefitsTermination benefits are payments made by the company to staff on ending their employment beforeretirement. Usually the company has a legal obligation to make such payments – legislation orthe employment contract itself requires them – but in some cases its obligation is a constructiveone, based on business practice in the industry. A termination benefit usually comprises a lump-sum payment based on the employee’s salary level and years of service but it can take otherforms. For example, the company may improve the pension benefits of staff laid off.
From an accounting perspective, a company recognises a liability only when it ends an em-ployee’s service contract. Termination benefits are conditional on this event. It would be mislead-ing, therefore, to accrue their cost over some arbitrary period of employee service. The problemis: what is the termination date? Mindful of the practice among some companies of smoothingincome through selective timing of provisions (including provisions for redundancies), account-ing regulators now require a firm to be ‘demonstrably committed’ to terminating employmentbefore it can recognise a liability. Evidence of ‘demonstrable commitment’, according to IAS, isa detailed formal plan for termination and no ‘realistic possibility of withdrawal’. A formal plancan include one in which employees agree to leave under voluntary redundancy terms.
The accounting entry to recognise the expense and liability of termination benefits is, in outline:
Dr. Termination benefits expense (OE−) xxxCr. Provision for termination benefits (L+) xxx
Note that if the company makes an offer to encourage voluntary redundancy, it will have to estimate the number of employees likely to take up the offer in order to calculate the aboveexpense and provision.
In some countries, companies grant termination indemnities to employees. These indemnitiesare payable regardless of how employment is terminated. In Italy, for example, the indemnity ispayable on the employee’s dismissal, resignation, retirement, disability or death. Such an indem-nity is not a termination benefit. It is similar to a pension or other post-employment benefit andshould be accounted for in the same way (i.e. the cost should be accrued each period as theemployee earns his or her entitlement to the indemnity).
l Other employee benefitsEmployees receive compensation in ways other than those mentioned above. The accountingrecognition and measurement principles are still the same. The cost of the benefit should berecognised as the employee earns it and measured at its fair value. Application of these prin-ciples can cause problems, however. We point out some of them below.
Non-monetary benefitsThere are many types of non-monetary benefit. Examples are free or subsidised travel, accom-modation and other services (e.g. club membership). The key issue here is the valuation of thebenefit. For example, suppose a company rents a company-owned flat to an employee at amonthly charge of 500 when the market rate is 800. Assuming rent is received in arrears, therental should be recorded as follows:
Dr. Cash (A+) 500Dr. Employee benefits expense (OE−) 300
Cr. Rental income (OE+) 800
One benefit of using fair rather than cash values is that it highlights the cost to the firm of thesubsidised goods or services.
CFA_C16.qxd 11/6/03 3:17 PM Page 497

498 PART 2 • THE HOUSE OF ACCOUNTING
SECTION
2
Profit-sharing and bonus plans
Under these plans, employees receive a lump-sum payment at the end of a financial period. In somecases, they may only be entitled to the payment if they’ve worked for the firm for a specified period.
The terms of the plan indicate when the liability for the payment arises and its amount. Forexample, the plan may contain a formula linking the payment to reported profit or some otherfinancial number. Only when the terms of the plan are met do employees earn the right to thepayment. Note that the payment is treated as an expense, not a distribution, even when it’slinked to after-tax profit, since it’s awarded for employee services. The calculation in this caserequires care. For example, suppose a bonus is set at a fixed percentage of after-tax profit (the‘bonus rate’) and it is a tax-deductible expense. To find the amount of the bonus, the followingsimultaneous equations must be solved:
Bonus == Bonus rate ×× (Profit −− Bonus −− Tax)
Tax (expense) == Corporate tax rate ×× (Profit −− Bonus)
The ‘profit’ figure in the above equations is profit before bonus and tax but after deducting allother expenses.
Share-based compensation
Employees may receive compensation in the form of shares or other equity instruments (e.g.share options) of the company. In Europe such compensation is often restricted to senior exec-utives; in the USA, however, many start-up companies offer it to all employees. According toproponents, the main advantage of a share-based compensation scheme lies in its incentiveeffect. By linking their income to the market value of the company’s equity, employees areencouraged to act in ways that will increase that value.
In principle, the accounting for share-based compensation should be governed by its sub-stance. The company should recognise as compensation cost the fair value of the shares or otherequity instruments granted to employees. In economic terms, it acquires (and consumes) anasset (employee services) for which it pays in shares rather than cash. In practice, however, eithercompanies do not recognise compensation cost or, if they do, they measure it at an amount lessthan fair value. We look more closely at the accounting for employee share options in section 2of the chapter.
Share-based compensation schemes should not be confused with employee share ownershipplans. The main aim of the latter is to encourage share ownership among employees. The com-pensatory element is small – employees buy the company’s shares at a small discount to the current market price – and is usually ignored.
Specialised topics
Pension benefits
Company-sponsored pension plans, though widespread in the Netherlands, UK and NorthAmerica, are still unusual in many countries. Citizens rely on state pension schemes and theirpersonal savings for income provision in their old age. State pension schemes are usually un-funded: pensions are paid from current taxation.
CFA_C16.qxd 11/6/03 3:17 PM Page 498

CHAPTER 16 • EMPLOYMENT COSTS 499
Demographic changes are causing governments to rethink existing pension policies, however.People are living longer. Fertility rates have fallen, especially in Europe. The result is thatEurope’s dependency ratio, that is, the ratio of pensioners to those of working age, is expectedto rise to 30% by 2040 from around 20% today. To pay pensions to this much larger group willrequire an increase in taxes, the burden of which will fall on the working population. It is partlyfor this reason that European governments are now promoting company-sponsored pensionplans. As a result, the accounting methods illustrated in this section are likely to become morewidespread in European company accounts in future.
l Types of company-sponsored pension planThe way a company accounts for pension benefits is heavily influenced by the type of pension plan it offers employees. As we saw in section 1 of the chapter, there are two types of plan. Adefined benefit (DB) plan specifies the pension (or other benefits) the employee will receive onretirement: the benefit is usually a function of years of service and salary level. A defined contribu-tion (DC) plan specifies the contributions the company (and, under a ‘contributory’ plan, theemployee) will make to the plan during the employment period. A DC plan provides guidanceas to the pension the employee is likely to receive given the amount of contributions and theinvestment performance of the fund but, in contrast to a DB plan, makes no commitment as tothe amount.
In some countries, management face a further decision with respect to DB plans – whether to fund the plan or not. (DC plans are, by definition, funded.) Under a funded DB plan, the company transfers cash to an independent entity which is responsible for running the pensionscheme (i.e. investing the cash, managing the investments and paying pensions to retirees).Under an unfunded DB plan, the company draws on its own assets to pay pensions. However, itprovides for the cost as employees earn their pension rights.
l Measuring the cost of pension benefitsWe saw in section 1 that there’s general agreement that the cost of pension benefits – like otheremployee benefits – should be accrued. Employees earn pension benefits under a company-sponsored plan while they’re working for the company, and the company should recognise theexpense and related liability during this period. Recognition should not be delayed until the pensions are paid. How the cost is measured is still a source of controversy, however. Beforeexploring the issues in this debate, we need to understand how a company with a pension plancalculates its pension expense and liability in a simple setting. The discussion below focuses on funded DB plans. Note that we’re concerned solely with the accounts of the sponsoring company, not those of the pension fund itself.
Determining pension expenseThe accounting for pension cost under DC plans is straightforward. Annual pension expense isequal to the contributions the company must make to the plan with respect to the services performedby participating employees that year. The journal entry at the date of payment to the fund is:
Dr. Pension expense (OE−) xxx(or: Personnel cost, pensions)
Cr. Cash (A−) xxx
Between payment dates, the cost is accrued. If additional contributions are made, these arerecognised as expense in the periods when the employees perform the services to which theyrelate.3
CFA_C16.qxd 11/6/03 3:17 PM Page 499

By contrast, the accounting under DB plans can be complicated. The company’s accountantmust estimate the cost today of pension benefits which employees will receive some, maybemany, years later.
Under a DB plan, the entry the company makes to recognise pension expense is separate fromthe one it makes to record payments to the pension fund:
(a) Expense recognitionDr. Pension expense (OE−) xxx
Cr. Provision for pension costs (L+) xxx(or: Accrued pension costs)
(b) FundingDr. Provision for pension costs (L−) xxx
Cr. Cash (A−) xxx
All companies with defined benefit plans, whether funded or unfunded, make entry (a). Onlycompanies with funded plans make entry (b).4 Note that the expense can be greater or less thanthe cash payment in any one period. If the cumulative charges in the income statement aregreater than the cumulative payments to the fund, the company reports a liability (‘Accrued pen-sion costs’) in its balance sheet. If the cumulative payments are greater than the cumulativecharges, the company reports an asset (‘Prepaid pension costs’) in its balance sheet.
Companies usually get a tax deduction for contributions paid. In countries where unfundedschemes are the norm, special tax rules apply.
How is pension expense under (a) determined? Practice varies but the expense figure of afunded DB plan typically has the following components:
Current service cost + xxInterest on plan liabilities + xxExpected return on fund investments − xxEffects of plan amendments + xxNet actuarial gains or losses +/− xxTotal pension expense xxx
We briefly discuss each component in turn.
1 Current service cost. This is the cost of pension benefits earned by employees as a result of services performed in the current period. It is usually the biggest component of pensionexpense.
Actuaries have devised various methods of determining this cost, largely for funding pur-poses. Accountants have adapted these methods for their own use. A key difference amongthe methods is the assumption made about employees’ future services.
– Under accrued benefit valuation (ABV) methods, only services already rendered byemployees are taken into account in determining the cost of current service.
– Under projected benefit valuation (PBV) methods, future services are accounted for indetermining current service cost. In effect, the cost of an employee’s expected total serviceto the company is calculated and then spread over his or her working life.
ABV methods result in an increasing current service cost per employee as the benefits he orshe earns increase with each year of service; PBV methods, on the other hand, moderate theupward slope in the service cost calculation through their allocation mechanisms. Note thatfor companies with stable or slowly growing workforces, the difference in aggregate currentservice cost under the two valuation methods is not very marked.5
500 PART 2 • THE HOUSE OF ACCOUNTING
CFA_C16.qxd 11/6/03 3:17 PM Page 500

CHAPTER 16 • EMPLOYMENT COSTS 501
2 Interest on plan liabilities. To calculate the fund’s liability (funded DB plans) or the com-pany’s provision (unfunded plans), the amounts and timing of pension payments to retireesin the future must be estimated and their present value determined. As retirement – and payment – approaches, the present value of those liabilities (‘actuarial present value of futurepension benefits’) grows. The effect of the passage of time on the pension liability is usuallycaptured in a separate ‘interest’ component of pension expense.
What discount rate is used to determine the present value? In some countries, the rate isspecified by law. In others, management decide the rate, using as a guide the interest rate onlong-term bonds of similar maturity.
3 Return on investments. In the case of funded DB plans, the investments of the fund earnreturns – in the form of dividends, interest and capital gains – each period. These returnsreduce the annual cost of the pension plan to the company: hence the credit to pensionexpense. To avoid sharp fluctuations in this number from year to year (pension investmentsmay sustain capital losses in some years), companies estimate the expected long-run returnon plan investments and use this figure in the pension expense calculation rather than theactual returns in the year.
4 Effects of plan amendments. A company may amend its DB plan. It may offer benefits for services rendered before the plan was introduced. In addition, it may give additional bene-fits to employees and retirees for each year of service. The cost to date of such amendments isknown as past service cost. (Amendments may reduce benefits. In this case, past service costis negative.)
5 Net actuarial gains or losses. These comprise experience gains and losses and the effects ofchanges in actuarial assumptions. Experience gains and losses arise because outcomes differfrom expectations. Actual returns on investments are higher than expected (an ‘experiencegain’). Or the actuary’s past assumptions about wage inflation or labour turnover prove to betoo optimistic: the upward adjustment to the fund’s liabilities is an ‘experience loss’.
The actuary may alter his or her assumptions about future values of key variables (e.g. incid-ence of early retirement, life expectancy of plan participants). These can lead to increases ordecreases in plan liabilities – and thus losses or gains.
Notwithstanding the netting of actuarial gains and losses, this component of pensionexpense can vary markedly from year to year. To minimise swings in reported pensionexpense, companies may not recognise the net gains or losses immediately but, instead, amortise them – as expense or income within pension expense – over a period of years.6
The above are the main components of pension expense. There are others. For example, if a company curtails a plan (when it lays off staff) or settles existing pension obligations (by grant-ing plan participants a lump-sum payment in place of an annual pension), it recognises any gainor loss immediately – and usually within pension expense.
IllustrationWe use a simple example to illustrate the calculation of pension expense. Lusitanian Shipping, aPortuguese company which specialises in the cargo trade between Europe and the Orient, startsa defined benefit pension scheme for its employees in x3. At the end of x7, the plan has assetsand liabilities of 100 million. (This is unusual. Pension funds are normally in surplus (A > L) orin deficit (A < L).)
CFA_C16.qxd 11/6/03 3:17 PM Page 501

502 PART 2 • THE HOUSE OF ACCOUNTING
Lusitanian Shipping: Pension FundBalance sheet, at end-x7
Assets LiabilitiesActuarial presentvalue of future
Investments 100 pension benefits 100
The company wants to calculate its pension expense for x8. It gives us the following informa-tion (all amounts are in millions):
l Current service cost in x8, calculated using an accrued benefit valuation method, is 10.l At the start of x8, the company amends the plan. It grants additional pension benefits to
employees for services rendered before the plan was started in x3. The cost of past service inpresent value terms is estimated at 8 at 1/1/x8. The company plans to recognise the costimmediately and raise its annual contribution over subsequent years in order to fund thehigher pension liability.
l The interest rate used to discount future pension benefits is 6%. l The expected long-term return on the fund’s investments is 7%.l There is a net actuarial gain of 1.5. Actual returns on fund investments are 5 higher than
expected. However, changes in actuarial assumptions result in an increase of 3.5 in the plan’send-x8 liabilities.
What is the company’s pension expense in x8? The calculation is:
Current service cost 10Past service cost 8Interest on start-x8 plan liabilities
(6% × (100 + 8)) 6.5Expected return on investments
(7% × 100 (start-x8 plan assets)) –7Net actuarial gain –1.5Total pension expense in x8 16.0
Note that the interest component increases – from 6 to 6.5 million – because of the additionalliability caused by the plan amendment.
Lusitanian Shipping increases its contribution to the pension fund to 13 million in x8. (Con-tributions are assumed to be made at the end of the year.) The x8 entries to recognise pensionexpense and record the company’s payment to the pension fund can be combined as follows:
Pension expense and contribution in x8Dr. Pension expense (OE−) 16
Cr. Cash (A−) 13Cr. Accrued pension cost (L+) 3
Determining the company’s pension liabilityIn the simple framework we used in calculating pension expense, the pension liability (‘Accruedpension cost’) a company reports represents the excess of pension charges in current and previ-ous periods over cumulative payments to the pension fund. If cumulative payments to the fund
CFA_C16.qxd 11/6/03 3:17 PM Page 502

CHAPTER 16 • EMPLOYMENT COSTS 503
are greater than cumulative pension charges, the company reports a pension asset (‘Prepaid pen-sion cost’) on its balance sheet.
The company’s pension liability or asset is mirrored in the funding position of the pensionplan. A reported liability indicates – given the assumptions in our example – that the pensionplan is underfunded by that amount (i.e. pension fund liabilities exceed pension fund assets). Ifa company reports a pension asset, this means its pension plan is overfunded. The link betweenthe pension fund’s and the sponsoring company’s balance sheets is illustrated in the diagrambelow. The numbers are taken from our Lusitanian Shipping example.
As we saw above, Lusitanian Shipping reports an increase in pension liability of 3 in x8. Sincethere is no pension asset or liability on the company’s books at the end of x7, this is the balanceof the liability at end-x8. The end-year pension liability of 3 is also the deficit in the company’spension fund at that date. Following a valuation at the end of x8, Lusitanian Shipping discoversthe fund’s investments have a fair value of 121 and its liabilities (‘Actuarial present value offuture pension benefits’) are estimated at 124.
The fund has assets and liabilities of 100 at the start of x8. What are the reasons for the 21increase in fund assets and the 24 increase in fund liabilities? Exhibit 16.3 shows the change inthe fund’s balance sheet during the year. From column 5 of the exhibit, we see that the fund’sliabilities increase in x8 owing to a plan amendment (8), pension benefits earned by employeesfor service in the year (10), and the effects of time (interest) and changes in actuarial assump-tions concerning wage inflation, labour turnover, and other factors (6.5 and 3.5, respectively).As for the fund’s assets (column 4), these increase as a result of contributions to the fund (13)and returns generated on fund assets. Actual returns are 12, of which 7 are expected and 5 unexpected (described as ‘actuarial gains on fund assets’ in the exhibit). Pension payments toretirees (4) reduce both assets and liabilities. The net effect of these movements is that the fund’sliabilities grow faster than its assets, resulting in a fund deficit of 3. (The movement in ‘Fundequity’ – the difference between fund assets and fund liabilities – is not shown for reasons ofspace.)
Exhibit 16.3 also shows how the changes in the fund’s assets and liabilities (columns 4 and 5)directly affect the calculation of Lusitanian Shipping’s pension expense (column 1) in the year.For example, the addition to the fund’s liabilities as a result of the costs of current service andinterest increases pension expense; the addition to the fund’s assets arising from expected invest-ment returns reduces it. The journal entry the company makes to record pension expense andcontribution in x8 – set out above and shown also in the exhibit – summarises all the changes tothe pension fund in the year (with the exception of pension payments to retirees, which is atransaction between the fund and retirees).
As mentioned above, the pension accrual or prepayment a company reports in its balancesheet indicates the funded status of its pension plan. Thus Lusitanian Shipping’s accrued pension
CFA_C16.qxd 11/6/03 3:17 PM Page 503

504 PART 2 • THE HOUSE OF ACCOUNTING
cost of 3 at end-x8 reflects its pension plan’s underfunding then. The company has contractedto provide pension benefits in the future and 3 million is the amount by which the expected costof pension benefits earned by employees (and retirees) at end-x8 exceeds the resources ear-marked to meet them. If a fund’s assets exceed its liabilities, the pension plan is overfunded andthe company reports a pension asset (‘Prepaid pension cost’). The asset reflects the benefits to the company of making lower contributions to the fund in the future. In some countries, a
COMPANY PENSION FUND[1] [2] [3] [4] [5]
Assets LiabilitiesPrepaid/ Actuarial PV
Pension (Accrued) Cash and of futureexpense Cash pension cost investments benefitsDr./(Cr.) (Cr.) Dr./(Cr.) Dr./(Cr.) Dr./(Cr.)
Balance, start-x8 0 100 (100)Pension expense: Plan
Past service cost 8 amendment 0 (8)Adjustedbalance 100 (108)
Current service cost 10 (10)Interest on liabilities
(6% × 108) 6.5 (6.5)Expected return on
assets (7% × 100) (7) 7Actuarial losses on
fund’s liabilities 3.5 (3.5)Actuarial gains on
fund’s assets (5) 5Contribution to fund – (13) 13
Journal entry 16 (13) (3)Pension payments – (4) 4Balance, end-x8 (3) 121 (124)
‘Accrued pension
cost’ Fund deficit = 3
Assumptionsl The fund has assets and liabilities of 100 at the start of x8.l The plan is amended at the start of x8 to award employees pension benefits for past services. The cost of
the amendment is 8.l Pension benefits earned by employees for services in x8 (‘Current service cost’) are 10.l The rate used to discount future pension benefits to their present value is 6%.l Expected return on fund investments is 7%.l The fund receives contributions of 13 from the company at end-x8 and invests them.l It pays pensions of 4 to retirees at end-x8.l Changes in actuarial assumptions (concerning wage inflation, labour turnover, mortality etc.) results in
fund’s estimated liabilities being 124 at end-x8 – hence ‘Actuarial losses on fund’s liabilities’ of 3.5.l The fair value of the fund’s investments is 121 at end-x8. This implies actual returns exceed expected
returns by 5 in the year – hence ‘Actuarial gains on fund’s assets’ of 5.
Lusitanian Shipping: pension accounting by company and fund in x8 Base case: actuarial gains/losses recognised as they occur (amounts in millions)
Exhibit 16.3
CFA_C16.qxd 11/6/03 3:17 PM Page 504

CHAPTER 16 • EMPLOYMENT COSTS 505
company can realise the asset by terminating the existing plan and transferring accrued pensionbenefits – and fund investments equal to those accrued benefits – to a new plan.
Spreading the recognition of actuarial gains and lossesIn the above example, we assume that Lusitanian Shipping recognises all actuarial gains andlosses as they arise. This policy can lead to large variations in pension expense – and income –from year to year. For example, a company whose pension fund investments are weightedtowards equities would have reported large actuarial gains and low or even negative pensionexpense (i.e. a pension credit) during the bull years of the l990s and large actuarial losses andhigh pension expense in the stock market slump of the early 2000s. Many commentators claimthe income statement effects are misleading. The income variability does not relate to a com-pany’s operations but is the result of its pension fund’s investment decisions. Commentatorsalso express doubts about recognising immediately actuarial gains and losses on pension fundliabilities. They argue there is so much uncertainty about the assumptions – concerning futurelabour turnover, inflation, life expectancy – underlying the present value calculations that it isunwise to recognise such gains and losses as they arise.
To overcome these problems, accounting regulators have introduced methods of spreadingthe recognition of actuarial gains and losses. One method favoured by international and US regulators is the corridor treatment. It works as follows:
l First, the firm determines the excludable portion of actuarial gains and losses. This is a band– or corridor – equal to the greater of 10% of the pension fund’s assets or 10% of the fund’sliabilities at the start of the year. Actuarial gains and losses are accumulated and netted at this date. If cumulative net actuarial gains or losses are within the corridor, they’re not recog-nised in pension expense. If they exceed the limits of the corridor, only the excess is recognised,via an amortisation procedure, in pension expense. The corridor calculation is illustratedbelow:
l Second, the firm amortises – or spreads – the excess net actuarial gains or losses. One acceptedmethod of amortisation is to write them off on a straight-line basis over the expected averageremaining working lives of plan participants. The amortised net gain or loss is then recog-nised as a component of pension expense.
We adapt our Lusitanian Shipping example to illustrate the corridor treatment of actuarialgains and losses. Suppose at the start of x8 the company has cumulative unrecognised actuarial
CFA_C16.qxd 11/6/03 3:17 PM Page 505

gains of 20 (million). These are the result of higher than expected returns on plan assets in thepast. The corridor limit is 12, i.e. the greater of 10% of fund assets (120) or 10% of fund liab-ilities (100). The excess gains of 8 are amortised on a straight-line (SL) basis over the averageremaining working life of the company’s employees. As Lusitanian Shipping’s employees are, onaverage, ten years from retirement, this gives an amortisation charge of 0.8. The calculation issummarised below (amounts are in millions):
Cumulative actuarial gains at 1/1/x8 20Corridor limit (10% of fund assets of 120) −12Excess gains 8Average remaining working life of employees 10 yearsAmortisation of actuarial gains (SL basis) 0.8
Given the net actuarial gains of 1.5 that arise in x8, the cumulative unrecognised gainsincrease to 20.7 million by year-end:
Cumulative actuarial gains at 1/1/x8 20Actuarial gain in x8 (plan assets) +5Actuarial loss in x8 (plan liabilities) –3.5
21.5Actuarial gain recognised in x8 –0.8Cumulative actuarial gains at 31/12/x8 20.7
One consequence of the above treatment of actuarial gains and losses is that the pensionasset or liability on a company’s books no longer reflects exactly the funding position of its pension plan. This is evident in Lusitanian Shipping’s case. Exhibit 16.4 builds on the examplein Exhibit 16.3. Using revised data for x8, it shows how actuarial gains (and losses) are recordedoff-balance-sheet and are recognised in the company’s accounts over time.
The company’s start-x8 pension liability is still zero. The actuarial gains of 20, thoughreflected in the pension fund’s assets, are not recognised in the company’s balance sheet. Instead,they’re held off-balance-sheet in a memorandum account. Actuarial gains and losses arising inthe year are accounted for in the same way. In this case, gains increase the fund’s assets and lossesincrease its liabilities. However, the net gains of 1.5 in x8 are not recognised in the company’saccounts that year but are transferred to the memorandum account. Only the amortised portionof the start-year gain is recognised in pension expense in x8. By recording changes in the fairvalues of pension fund assets and liabilities off-balance-sheet – and spreading them over time,Lusitanian Shipping reduces variability in both its income number (less variable pensionexpense) and its balance sheet (less variable pension liability – and shareholders’ equity).
The company discloses in the notes to its x8 accounts the following analysis of the net pen-sion liability at year-end (amounts in millions):
End-x8 Start-x8Funded planActuarial present value of future benefits (124) (100)Fund’s assets at fair value 142.4 120Fund’s assets in excess of fund’s liabilities 18.4 20Unrecognised actuarial net (gains)/losses (20.7) (20)Net recognised liability (2.3) 0
Thus the company’s reported pension liability of 2.3 (million) at end-x8 is the net effect of a pen-sion fund surplus of 18.4 and unrecognised net actuarial gains of 20.7 at that date.
506 PART 2 • THE HOUSE OF ACCOUNTING
CFA_C16.qxd 11/6/03 3:17 PM Page 506

CHAPTER 16 • EMPLOYMENT COSTS 507
l International rules and practiceAn international standard on the accounting for employee benefits was issued in the 1990s. Thebulk of it deals with pension and other post-employment benefits under DC and DB plans.7 Ingeneral, the standard follows the framework set out above. However, it contains detailed provi-sions that affect the way companies implement fair value accounting for DB plans. We list themore important ones below:
COMPANY PENSION FUND Memorandumaccount
[1] [2] [3] [4] [5] [6]Assets Liabilities
Prepaid/ Actuarial PV UnrecognisedPension (Accrued) Cash and of future net actuarialexpense Cash pension cost investments benefits gainsDr./(Cr.) (Cr.) Dr./(Cr.) Dr./(Cr.) Dr./(Cr.) Dr./(Cr.)
Balance, start-x8 0 120 (100) (20)Pension expense: Plan
Past service cost 8 amendment 0 (8)Adjusted balance 120 (108)
Current service cost 10 (10)Interest on liabilities
(6% × 108) 6.5 (6.5)Expected return on
assets (7% × 120) (8.4) 8.4Amortisation of net
actuarial gains (0.8) 0.8Contribution to fund – (13) 13
Journal entry 15.3 (13) (2.3)Pension payments – (4) 4Actuarial gains in year 5 (5)Actuarial losses in year (3.5) 3.5
Balance, end-x8 (2.3) 142.4 (124) (20.7)‘Accrued pension
cost’ Fund surplus = 18.4
Assumptionsl The fund has assets of 120 and liabilities of 100 at the start of x8. The company recognises no pension
asset at this date.l Actuarial gains and losses are recorded off-balance-sheet and are amortised, using corridor treatment,
over the average remaining working life of employees (estimated at 10 years). Excess net actuarial gains at start-x8 are 8 (20 − (10% × 120) ).
l The fair value of the fund’s investments is 142.4 at end-x8. This implies actual returns exceed expectedreturns by 5 in the year.
Other assumptions are as in Exhibit 16.3.
Lusitanian Shipping: pension accounting by company and fund in x8Revised case: amortisation of excess net actuarial gains/losses (amounts in millions)
Exhibit 16.4
CFA_C16.qxd 11/6/03 3:17 PM Page 507

l Benefit valuation method. All companies must use a specific accrued benefit valuation method(known as the ‘projected unit credit method’) to measure pension liability and expense. Themethod incorporates expected wage inflation in the valuation of pension fund liabilities.8
l Frequency of valuation. A company should base the pension liability it recognises in the bal-ance sheet on the current value of its pension fund assets and the present value of its pensionfund obligations at the balance sheet date.
l Discount rate. In determining the present value of its pension fund obligations, a companyshould base the discount rate on the market yields at the balance sheet date of high qualitycorporate bonds (of similar currency and term).
l Expected return on fund’s assets. This should be based on what the market expects an equi-valent portfolio would earn over the entire period the pension obligations are being funded.
l Past service cost. Past service cost should be recognised in pension expense immediately if theadditional benefits have already vested (i.e. they’re not conditional on the employee’s con-tinued employment with the firm). If they haven’t, the cost should be spread on a straight-line basis over the period to the vesting date.
l Actuarial gains and losses. A company can either recognise such gains and losses as they occur(our base case – see Exhibit 16.3) or amortise them using the corridor treatment (our revisedcase – see Exhibit 16.4).9 It must apply the policy consistenty, however.
International rules on accounting for pension costs are of recent origin. As a result, nationalrules – where they exist – still have great influence. Summarised below are the main areas of dif-ference between national and international rules in four countries where DB pension plans arecommon.10
Germany
Many plans are unfunded (they’re known as ‘book reserve’ plans) but employees are protectedsince their benefits are insured. The calculation of pension cost is influenced by tax and legalrules. Companies determine current service cost using a projected benefit valuation method.Expected increases in salaries are not taken into account. The discount rate is fixed by law.Actuarial gains and losses are recognised immediately.
The Netherlands
Plans are funded. There are few rules governing the recognition and measurement of pensioncost. A company can use either an accrued or a projected benefit valuation method – and canignore expected wage inflation – in determining current service cost. It can recognise actuarialgains and losses immediately or defer them. Note that a Dutch plan is legally separate from thecompany. Employees are involved in its management – and in any decision to terminate it.
UK
Plans are funded. Under existing rules, companies have considerable discretion over how theymeasure pension liability and expense. The only requirement is that current service cost shouldbe a substantially level percentage of payroll. New accounting rules – similar to IAS but requir-ing immediate recognition of actuarial gains and losses – have been proposed but their imple-mentation has been deferred. However, companies must now disclose in the notes to theaccounts the fair value of pension fund assets and the funded status of their DB plans.
USA
Again, all plans are funded. Accounting and reporting requirements correspond closely to inter-national rules – in fact, US rules pre-date them and were the main influence on them. There are
508 PART 2 • THE HOUSE OF ACCOUNTING
CFA_C16.qxd 11/6/03 3:17 PM Page 508

some unique features, however. For example, a company with an underfunded plan has to recog-nise a minimum pension liability in its balance sheet. This may involve recognising an intangibleasset as an offset. However, the intangible cannot exceed unamortised past service cost. Anyexcess must be written off against shareholders’ equity. The rationale for the pension intangibleis that the firm enjoys a benefit – in the form of greater employee goodwill – equivalent to thecost of employees’ enhanced pension rights.
As more countries align their national accounting rules with the international standard, cross-border differences in pension accounting should diminish and investors should find it easier tocompare companies’ pension costs and liabilities. Investors may face a moving target, however,as the international standard itself may be revised in the future. Its treatment of actuarial gainsand losses is controversial. Critics argue that amortising such gains and losses using an off-balance-sheet mechanism means that the company’s reported pension liability or asset does notreflect the actual funding position of the pension plan. Moreover, the average investor can’tunderstand the accounting and loses confidence in the company’s accounts, it’s claimed.Supporters point out that the international standard reduces variability in income and balancesheet numbers – an important consideration when stock markets are volatile. As a result, com-panies are less likely to curtail or terminate their DB plans when the latter fall into deficit. Inaddition, investors can discover the actual funding position of a company’s DB plans because it must disclose the assets and liabilities of its pension funds in the notes to the accounts. (Weillustrate these disclosures in section 3.)
Employee share options
The practice of paying employees in the company’s shares dates back to the nineteenth centuryand the early days of the joint-stock company. Using share options as a means of compensationis a more recent development, however. US companies began granting them to top executives inthe 1950s. Their popularity grew in the 1980s and 1990s. Senior executives in non-US com-panies started receiving them in those decades and US start-up firms, especially in the informa-tion and biotechnology sectors, extended eligibility to all employees.
Employee share options (ESOs) are a controversial form of compensation. Although mostcompensation consultants support share-based pay on the grounds that it encourages employeesto think and act like shareholders, many argue that companies should offer employees sharesrather than share options. Share options may encourage employees to take excessive risks withcompany assets since the more volatile the price of the underlying share, the higher is the valueof the option. Employee share options are a costly form of compensation for other reasons.Much of employees’ wealth – pay, pensions and, more generally, the value of their human capital– is linked to the company they work for. Because employee share options are not tradable – soemployees can’t sell them to diversify their asset portfolios, their value to employees is less thantheir cost to the company. As a result, the company must offer more of them to yield the samebenefit to employees as a tradable asset such as cash or company shares.11 This has not deterredcompanies, especially in the USA, from awarding share options to employees, however. It’s estimated that one-third of households in Silicon Valley in California hold them.
l Mechanics of ESOsAll ESO plans share common features though they differ in detail. Employees who qualify forESOs are each granted a certain number of options. These give them the right to buy shares of thecompany at a predetermined price (‘exercise price’) during a specified future period (‘exercise
CHAPTER 16 • EMPLOYMENT COSTS 509
CFA_C16.qxd 11/6/03 3:17 PM Page 509

term’). The number of options granted to an employee each year is restricted – in some cases toa multiple of salary. The exercise price (EP) is usually set close to – or equal to – the market priceof the company’s shares at the date of grant. National tax rules influence how the EP is set.
Under a ‘fixed’ ESO plan, employees must work for a period (‘service period’) before theyearn the right to exercise the options. In the case of a performance-based plan, employees haveto meet specified performance goals in addition before vesting can occur. The options may veston one date (‘cliff vesting’) or in stages over time (‘gradual vesting’). If an employee leaves thecompany before full vesting, he or she forfeits some or all of the options. Employees can exercisethe options at any time between the vesting date and the date when they expire. Again, tax andinvestment rules influence the length of the exercise term. The key dates in a simple cliff-vestingshare option plan are shown in the time line below:
Date of: Grant (G) Vesting (V) Expiry (X)
Service period Exercise term
Clearly, employees hope the share’s market price will be above the exercise price at somepoint during the exercise term. Then they can realise a gain by exercising the options, acquiringshares and immediately selling them. (Of course, they can retain the shares in the hope of greaterreturns in the future.) If the market price remains below the exercise price throughout the exer-cise term, the options will expire unexercised.
ESOs are one form of share-based compensation. There are others. Here are three examples:
l Share appreciation rights (SARs). The employee is entitled to the increase in value on aspecified number of share units over a specified period. The advantage of SARs is thatemployees do not have to buy any shares to capture the increase in share value. Thus theyavoid the financing and transaction costs that would arise under an equivalent share optionscheme.
l Restricted shares. The employee is granted shares directly or can buy them at a deep discount.Usually, ownership does not vest until certain performance goals have been met or aspecified holding period has elapsed. (The term ‘restricted’ is also applied to schemes wherelegislation or the contract itself restricts the sale of the shares for a specified period.)
l Phantom shares. The employee receives notional shares as a reward for his or her performance.The shares entitle the holder to dividends and capital gains (in accordance with a predeterminedformula) but carry no voting rights. Phantom shares are used by unquoted companies and inthe divisions of large quoted firms.
In this section, we look at the accounting for employee share options (ESOs) only. However,companies apply similar recognition and measurement principles when accounting for otherforms of share-based compensation.
l Accounting issuesAccounting for ESOs – and other forms of share-based compensation – is contentious. Peopledisagree on fundamental issues concerning their recognition and measurement. Preparers andusers of financial statements are usually on opposing sides of the debate. We outline the twomain areas of disagreement below.
Are ESOs a cost to the firm?Most people accept that ESOs are a form of compensation to employees. Employees certainlyview them that way. They hope to be able to exercise the options at a future date and enjoy a
510 PART 2 • THE HOUSE OF ACCOUNTING
CFA_C16.qxd 11/6/03 3:17 PM Page 510

capital gain. The better the company performs (thanks, in part, to their efforts), the greater willbe their gain. But on whom does the cost of the compensation fall? Many managers (and account-ants) argue that the company doesn’t incur an expense as there’s no current or future outflow of corporate cash to employees. Instead, the cost falls on existing shareholders. They give up partof their share of the company’s earnings when the options are exercised. They accept this earn-ings dilution because they expect corporate earnings to grow more rapidly in the future as aresult of the option grant.
Investors and other users of financial statements challenge this reasoning. They note that theshare option contract is between the company and its employees, not between shareholders andemployees. The company agrees to grant employees rights to shares (ESOs) in return for labourservices. The absence of any outlay of corporate cash is irrelevant. Companies engage in, andrecognise in their accounts, many non-cash transactions. For example, start-up firms often payfor initial legal and banking services in shares rather than cash because of liquidity constraints.
How should the cost of ESOs be measured?
Some managers concede that ESOs are a cost to the firm but favour a method of valuation thateffectively ensures that no cost is recognised in the company’s accounts. There are two mainways in which the cost of ESOs can be measured – at their intrinsic value or at their fair value.The intrinsic value of a share option is the excess of the market price of the underlying share(MP) over the exercise price (EP) stated in the ESO contract. When MP ≤ EP, the intrinsic valueis zero. Most companies organise their ESO plans so that, at the date of grant of the options, the exercise price is greater than or equal to the market price of the company’s shares. Usingintrinsic value as the measure of cost means that, when the options are granted, intrinsic valueis zero and the company reports no compensation expense in its accounts.
An alternative measure of cost, favoured by users of financial statements, is the option’s fairvalue. The fair value of an option comprises two elements: intrinsic value and time value.According to the widely used Black–Scholes option pricing model, time value captures the effecton an option’s value of four main factors: the term of the option, the expected volatility of theshare price, the expected dividends and the market rate of interest.12 Other things being equal,the longer the term of the option, the more volatile the price of the underlying share, the lowerthe dividends or the higher the interest rate, the larger is an option’s time value. Since time valueis always positive – except at the end of the exercise term when it falls to zero, fair value can neverbe less than intrinsic value. Thus use of fair value in place of intrinsic value results in a positivecompensation cost – and a cost figure that is always greater than that based on intrinsic value.
Some financial statement users favour basing the cost of compensation on the fair value of theservices the company receives from its employees. They argue this provides a more reliable meas-ure of fair value. The alternative approach, namely, basing the cost on the fair value of the ESOsgranted, relies on option pricing models. The standard models assume that options are tradableand lapse only on expiry. ESOs, however, are non-transferable and lapse when an employeeleaves (before vesting occurs) or fails to fulfil the performance criteria specified. But economistshave modified the standard models to allow for the unique features of ESOs.
Fair value measurement illustrated
An example makes clearer the accounting for ESOs at fair value. (We assume fair value is determined by reference to the options rather than the services provided by employees.)Leeuwenhoek forms a company to develop a new type of microscope that he has devised. Thecompany grants 20,000 share options to employees in January year 1. Each option gives theholder the right to buy one of the company’s ordinary shares (par value a1). The exercise priceis set at a7, the market price at the date of grant (so the options’ intrinsic value is zero). The
CHAPTER 16 • EMPLOYMENT COSTS 511
CFA_C16.qxd 11/6/03 3:17 PM Page 511

options vest in January year 4 at the end of the service period and, if unexercised, expire at theend of year 7.
The option’s fair value is estimated at a3 in January year 1, using an option pricing model.The total cost of the options is therefore a60,000. The company doesn’t recognise all this cost inyear 1, however. Because the option award is for future employee services – and those servicesare assumed to be rendered evenly over the three years to the vesting date, the company allocatesthe cost on a straight-line basis over the period. (The cost can be spread on a different basis. Forexample, in the case of production staff, the costs of their compensation are usually matchedwith revenues on an output rather than a time basis.)
Recognition of annual expense, years 1 to 3Dr. ESO-based compensation expense (OE−) 20,000
Cr. Reserve – share options (OE+) 20,000
(‘Reserve – share options’ is a temporary balance sheet account.) Suppose that in year 4, aftervesting has occurred, the market price of Leeuwenhoek’s shares is above the options’ exerciseprice and employees exercise all their options. The company receives a7 a share in cash for eachof the 20,000 shares it issues. The balance in ‘Reserve – share options’ is transferred into per-manent shareholders’ equity accounts when the shares are exercised or, if unexercised, when theoptions expire.
Exercise of options in year 4Dr. Cash (A+) 140,000Dr. Reserve – share options (OE−) 60,000
Cr. Share capital, A1 par (OE+) 20,000Cr. Share premium (OE+) 180,000
If an employee leaves the firm during the service period and forfeits his or her options, the com-pany reverses the expense recognition entry with respect to those forfeited options.
Reviewing the above entries, it appears that employee share options have no overall impacton reported shareholders’ equity until they’re exercised. (We ignore the tax effects of theoptions.) But closer inspection shows that by recognising the cost of ESOs in the accounts, acompany reports lower profits – and lower distributable reserves.
l International rules and practiceThere are no international rules on accounting for ESOs at the time of writing (2002). The IASBplans to issue a standard on share-based payment in 2003/04. The standard will cover payment ofall goods and services with equity instruments. The main features of the proposed standard are:
l The cost of share-based payment transactions should be recognised in the accounts. In the case of ESOs, the cost should be determined on the basis of their fair value, not theirintrinsic value.
l Where the payment is for employee services, the cost should be measured by the fair value ofthe equity instruments (shares, share options) granted. In the case of ESOs, their fair valueshould be estimated using the Black–Scholes option-pricing model. For all other transactions,the cost should be measured by the fair value of the goods or services received. The IASBargues the latter is a more reliable measure of value where the transaction is with an outsideparty.
l Fair value should be estimated on the date the equity instruments are granted or, in the caseof goods and non-employee services, on the date those goods or services are received.13
512 PART 2 • THE HOUSE OF ACCOUNTING
CFA_C16.qxd 11/6/03 3:17 PM Page 512

CHAPTER 16 • EMPLOYMENT COSTS 513
The new international standard is likely to have a major impact on corporate financial state-ments worldwide. Rewarding employees with shares or share options is common in the USA,especially among TMT (telecoms, media and technology) companies. The practice is growing inother countries, as tax rules are changed and employees are taxed when they exercise the options(or later when they sell the shares) rather than when the options are granted.
Currently, most companies follow US GAAP when measuring the cost of ESOs. Existing USrules permit either intrinsic value or fair value measurement of ESOs granted to employees.However, they require firms valuing such instruments at intrinsic value to disclose, in the notesto the accounts, the impact of fair value measurement on earnings and EPS. Until 2002, almostall companies recognised as compensation cost only the intrinsic value of ESOs. (Few non-UScompanies provided fair value disclosures.) In the wake of Enron’s collapse and other corporategovernance scandals that came to light in 2002, a number of leading US companies, includingCitigroup and GE, announced their decision to account for such instruments on a fair valuebasis from 2003. But many US TMT companies remained resolutely opposed to fair valueaccounting and vowed to lobby against any change to US accounting rules, citing the dire eco-nomic consequences of fair value measurement (see Box 16.1).
‘Economic consequences’ of accounting standardsBOX16.1
As with other regulations, accounting standards impose costs as well as confer benefits. Inmost cases, users of financial statements enjoy the benefits – fuller disclosure, clearer pre-sentation, more relevant numbers – while preparers bear the costs. The costs of new standardsinclude the direct costs of compliance – for example, the costs of altering the company’saccounting system to produce the required information. They also include indirect costswhich can be much more burdensome than direct ones. The most important indirect cost isthe impact of a new standard on a company’s contracts. It may alter key income statement orbalance sheet numbers resulting in covenants in loan contracts being breached or higherbonuses being paid to employees under profit-sharing agreements. Managers are also con-cerned about the potential impact of a new standard on the company’s cost of capital and ongovernment decisions affecting the corporate sector (e.g. taxation). In addition, they have apersonal interest in new standards since their wealth is linked – via profit-related bonuses – tothe company’s reported earnings and – via shares and share options – to its share price.14
Where managers perceive the expected costs of a proposed standard to be high, they willlobby to have it changed or withdrawn. Accounting standard-setting is a political as well as atechnical activity: new rules can be implemented only if they enjoy majority support in soci-ety at large. So management use conventional lobbying techniques – letter-writing, repres-entations through industry associations, and pressure exerted through elected representativesand government departments – to try to convince standard-setters that majority support forthe proposed standard is lacking.
Among the most potent weapons that companies employ in their lobbying is the ‘economicconsequences’ argument. The proposed accounting standard, it’s claimed, will cause economicharm to an industry – or to the economy as a whole. US companies used the argument successfully in the early 1990s to thwart the FASB’s attempts to require them to recognise ascompensation expense the fair value of options granted to employees. They enlisted the support of Congress. The Senate even passed a resolution calling on the FASB to desist frompursuing its share option accounting standard because of the standard’s ‘grave economic
CFA_C16.qxd 11/6/03 3:17 PM Page 513

514 PART 2 • THE HOUSE OF ACCOUNTING
consequences particularly for business in new-growth sectors which rely heavily on employeeentrepreneurship’. Senators were concerned that firms that made extensive use of shareoptions to compensate employees would report sharply reduced profits (or increased losses)and this would impair their ability to raise capital for innovation and expansion.15
The ‘economic consequences’ argument has been employed in other countries. UK com-panies, through the Confederation of British Industry (CBI), lobbied the government in early2002 to put pressure on the ASB, the UK standard-setting agency, to modify its standard onpensions. The standard requires companies to account for pension fund assets and liabilitiesat fair value and recognise the resulting fund deficit or surplus directly in equity. The CBIargued that the standard would make the shareholders’ equity number more volatile, increas-ing the risk that a company would breach its loan covenants and, if assets fell below liabilities,making it technically insolvent. The UK government had its own concerns. A number of com-panies had announced they were closing their DB plans to new employees and introducing DCplans for them instead. (In addition to the new accounting standard, management cited therising cost of supporting DB plans – retirees living longer, lower expected investment returns– as grounds for their decision.) DC schemes tend to be less generous than DB ones and thegovernment feared that, as a result, retirees would rely more on state benefits in the future,increasing the burden on the government’s purse. The ASB was prevailed upon in July 2002 topostpone the introduction of its accounting standard while the IASB reconsidered its ownstandard on the topic.16
The ‘economic consequences’ argument poses a challenge for accounting standard-setters.It involves them in a debate which lies outside their area of expertise. They have responded bycommissioning academic research on the economic impact of proposed (and existing) stand-ards. They’re heeding the old maxim: forewarned is forearmed.
SECTION
3 Employment costs and financial analysis
l DisclosuresPersonnel, pay and pensionsPublicly quoted companies and larger private ones often state the size of their workforce in theannual report. In some countries, they’re legally required to do so. Under EU accounting direct-ives, all medium-sized and large firms must disclose:
l the average number of people employed during the financial year, broken down by categoryof activity; and
l staff costs for the financial year. This figure should be split between wages and social securitycosts. Pension costs within the latter should be separately identified (4th Directive, Art. 43(9)).
These are minimum required disclosures. Some EU member states go further. For example,Italian companies must disclose separately the annual cost of termination indemnities (andshow the provision for them in the balance sheet). Large French companies give additionalfinancial information about their employees in the bilan social (social report) which they mustprepare each year and send to employees and shareholders alike. For example, the report reveals
Box 16.1 continued
CFA_C16.qxd 11/6/03 3:17 PM Page 514

the payments made to temporary staff, the profit-related bonuses earned by employees and thecosts incurred on staff training. (It also contains non-financial statistics on health and safety con-ditions and industrial relations.)
Companies following IAS must provide more detailed information about employees’ pensionand other post-employment benefits under DB plans. The international standard focuses onthree areas: the company’s pension liability, its pension expense and the key assumptions under-lying the calculation of both. First, a company must reconcile its pension liability (or asset) tothe net liability (or net asset) position of the pension fund. In particular, it must show, at the balance sheet date:
l present value of DB obligations (separating funded from unfunded liabilities);l plan assets at fair value;l unrecognised net actuarial gains or losses;l unrecognised past service cost (non-vested benefits).
In addition, it must analyse the pension expense figure. We identified the main componentsin section 2 of the chapter (e.g. current service cost, past service cost, interest cost, expectedreturn on plan assets, recognised net actuarial gains or losses). Finally, it should disclose theprincipal actuarial assumptions used in calculating the pension liability (or asset) and expense.These include the discount rate, expected rate of return on plan assets and expected rates ofsalary increase. Two other IAS-required disclosures are of interest to investors – and employees.The company must state how it recognises actuarial gains and losses (i.e. immediate recognitionor spreading via the corridor treatment), and it must reveal how much of the pension fund’sassets are invested in the company’s own shares and bonds.
Exhibit 16.5 shows extracts from the note on employee benefits in the 2001 accounts ofRoche, a large Swiss pharmaceutical company that follows IAS. The company incurred labourcosts of SFr 7.4 billion in 2001. Most of this consists of wages and salaries (SFr 6 billion) andsocial security costs (SFr 0.7 billion). Pensions and other post-employment benefits under DBplans cost the company only SFr 264 million that year.
This last figure is the cost Roche recognises in its accounts. The notes reveal why it’s so low.First, the company includes in the pension expense calculation an expected return on pensionfund assets of SFr 761 million in 2001, which is around 7% of start-of-year plan assets of SFr 10,448 million. This more than offsets the interest cost in the year. The actual return on planassets, however, was a negative SFr 1,334 million. Second, the actuarial losses the company sus-tains in 2001 – the decline in plan assets, the increase in plan liabilities – are not recognisedimmediately. According to the statement of accounting policies (not given in Exhibit 16.5), thecompany amortises only excess actuarial gains and losses outside the 10% corridor. The incomestatement benefit from avoiding recognising actuarial losses in 2001 is significant. The exhibitshows that Roche’s funded plans moved from a net surplus (1,414) to a net deficit (–174) positionbetween end-2000 and end-2001. The SFr 1.6 billion movement is reflected in ‘Unrecognisedactuarial (gains) losses’ which also change by this amount – from gains of SFr 862 to losses ofSFr 731 million at the end of 2001. The actuarial losses arising in 2001 (SFr 1.6 billion) represent50% of Roche’s group operating profits that year.
Thanks to its off-balance-sheet treatment of actuarial losses, Roche reports, on its balancesheet, a net asset of SFr 603 million with respect to its funded DB plans. Once unfunded plans areincluded, however, the overall balance is a net liability of SFr 1,837. (The SFr 2,440 liability onunfunded DB plans relates largely to health care benefits for its US employees.)
Share-based compensationWith no rigorous accounting standards (as yet) to guide them, investors must rely on footnotedisclosures to assess the impact of share-based pay schemes on a company’s accounts. Cost
CHAPTER 16 • EMPLOYMENT COSTS 515
CFA_C16.qxd 11/6/03 3:17 PM Page 515

[Note 8] Post-employment benefits (in millions of Swiss francs)
Most employees are covered by retirement benefit plans sponsored by Group companies. The nature of such plansvaries according to legal regulations, fiscal requirements and economic conditions of the countries in which theemployees are employed. Other post-employment benefits consist mostly of post-retirement healthcare and lifeinsurance schemes, principally in the United States. Plans are usually funded by payments from the Group and byemployees to trusts independent of the Group’s finances. Where a plan is unfunded, a liability for the wholeobligation is recorded in the Group’s balance sheet.
The amounts recognised in arriving at operating profit for post-employment DB plans are as follows:2001 2000
Current service cost 362 333Interest cost 685 675Expected return on plan assets (761) (714)Net actuarial (gains) losses recognised (12) 2Past service cost 5 3(Gains) losses on curtailment (15) (1)
Total (included in ‘Employees’ remuneration’) 264 298
The actual return on plan assets was a negative return of 1,334 million Swiss francs (2000: positive return of 1,175million Swiss francs).
The movements in the net asset (liability) recognised in the balance sheet for post-employment DB plans are as follows:2001 2000
At beginning of year (1,849) (2,078)Changes in Group organisation and Givaudan spin-off – 84Total expenses included in employees’ remuneration (as above) (264) (298)Contributions paid 177 174Benefits paid (unfunded plans) 116 135Currency translation effects and other (17) 134
At end of year (as below) (1,837) (1,849)
Amounts recognised in the balance sheet for post-employment DB plans are as follows:2001 2000
Unfunded plansRecognised (liability) for actuarial PV of unfunded obligations (2,440) (2,423)
Funded plansActuarial PV of funded obligations due to past and present employees (9,575) (9,034)Plan assets held in trusts at fair value 9,401 10,448
Plan assets in excess of actuarial PV of funded obligations (174) 1,414
Unrecognised actuarial (gains) losses 731 (862)Unrecognised past service costs 46 22
Net recognised asset for funded plans 603 574
Asset (liability) recognisedDeficit recognised as part of liabilities for post-employment benefits (2,610) (2,502)Surplus recognised as part of other long-term assets 773 653
Total net asset (liability) recognised (1,837) (1,849)
The Group operates DB schemes in many countries and the actuarial assumptions vary based upon local economicand social conditions. The range of assumptions used in the 2001 actuarial valuations of the most significant DBplans . . . is as follows:
Discount rates 3–8% Expected rates of return on plan assets 3–10%Projected rates of remuneration growth 2–9% Healthcare cost trend rate 5–10%
Roche Group: disclosures on post-employment benefits in 2001 accountsExhibit 16.5
(Source: Roche Group, Annual Report and Accounts 2001. Reproduced by permission of Roche Holding Ltd.)
CFA_C16.qxd 11/6/03 3:17 PM Page 516

CHAPTER 16 • EMPLOYMENT COSTS 517
information is sparse. Outside the USA, few companies disclose the fair value of share optionsgranted to employees. Companies following IAS give little value information about their equitycompensation plans. They reveal the shares and share options in the plans at year-end and themovement in them over the year. In the case of share options, they also publish the average exercise prices for options granted and exercised during the year and for those outstanding atyear-end. With this information, the investor can estimate the cash received – and receivable –from exercised (and exercisable) options.
Companies following US GAAP provide additional information about the cost of their ESOsunder fair value accounting. In some cases, the effect on income is devastating. Yahoo! the USInternet business and consumer services company, is one such case. The company has separateshare option schemes for employees and directors as well as an employee share purchase plan.Exhibit 16.6 contains key extracts from the note on share options and share compensation in its2001 accounts.17 Valuing options granted to employees at fair value (and recognising the costover a four-year service period) results in additional compensation cost (net of tax) of almostUS$900 million in 2001 (2000: over US$1.3 billion) and turns a small loss of US$92 million intoa huge one of US$983 million.
Why does fair value accounting have such an impact in this case? First, the company grants alarge number of options each year (e.g. 38 million in 1999, 27 million in 2000, 60 million in2001). Second, the fair value of these options is high. Although the company does not disclosethe options’ fair value, it’s possible to estimate it using the option pricing assumptions given. Inthe three years to 2001, the fair value of a Yahoo! ESO was at least 50% of the market price of itsshares at the date of grant, thanks largely to the high expected volatility of the share price. OtherUS TMT companies with a history of generous ESO plans and volatile (and inflated) share pricesreport similar huge increases in compensation cost under fair value accounting. It’s not surpris-ing, therefore, that they have been so vociferous in their opposition to fair value measurementof ESOs.
Directors’ compensationDirectors’ remuneration is another issue that has become mired in controversy over the pastdecade. (The term ‘directors’ includes senior executives in this context.) In many countries,directors’ remuneration has increased at a more rapid rate than average earnings during thistime. This is due in part to the growing share of bonuses and other kinds of performance-relatedpay in directors’ pay packages.
Companies vary in the information they disclose about directors’ compensation in the annualreport. Quoted firms in Anglo-Saxon countries provide fuller disclosure than those in othercountries, thanks to stock exchange or government regulations. For example, the SEC requiresdomestic companies listed on a US stock exchange to provide a breakdown of the compensationof the CEO and the four highest paid senior executives (other than the CEO). The informationdisclosed covers annual compensation (salary, bonuses and perquisites), long-term compensa-tion (e.g. share options granted, restricted shares awarded) and other compensation (e.g. pen-sion contributions). The UK stock exchange demands that UK firms listed on the exchangedisclose similar information for each of their directors.
Quoted firms in Continental Europe are less forthcoming about individual directors’ pay butthey’re under pressure to reveal more. Under EU accounting directives, medium- and large-sized firms only have to disclose the aggregate pay and pension benefits of directors (and otherswith equivalent responsibilities) in the financial year.18 However, a European Commission task-force recommended in 2002 that such firms disclose the amount and composition of individualdirectors’ pay, as part of its proposals to strengthen the governance of EU firms.19
CFA_C16.qxd 11/6/03 3:17 PM Page 517

518 PART 2 • THE HOUSE OF ACCOUNTING
Note 8 STOCKHOLDERS’ EQUITY...Stock option plans...Activity under the Company’s stock option plans is summarized as follows (in thousands, except per-shareamounts):
2001 2000 1999
Weighted Weighted WeightedOptions average price Options average price Options average price
outstanding per share outstanding per share outstanding per share
Balance, 1 Jan. 118,325 $49.83 124,790 $32.40 129,274 $10.60Options granted 60,261 18.60 27,176 102.42 38,040 80.76Options exercised (15,317) 3.82 (23,795) 14.36 (33,732) 6.91Options cancelled (26,312) 60.45 (9,846) 63.93 (8,792) 11.09
Balance, 31 Dec. 136,957 39.22 118,325 49.83 124,790 32.40...
Stock compensation
The company measures compensation expense for its stock-based employee compensation plans using theintrinsic value method. If the fair value-based method had been applied in measuring stock compensationexpense, the pro forma effect on net income (loss) . . . would have been as follows (in thousands):
Year ended December 31,
2001 2000 1999
Net income (loss)As reported $ (92,788) $ 70,776 $ 47,811Pro forma $(983,195) $(1,264,987) $(269,563)
...
Because additional stock options are expected to be granted each year, the pro forma disclosures are notrepresentative of pro forma effects on reported financial results for future years. The fair value of optiongrants is determined using the Black–Scholes option pricing model with the following weighted averageassumptions:
Year ended December 31,
2001 2000 1999
Expected dividend 0.0% 0.0% 0.0%Risk-free interest rate ranges 3.1%–4.8% 5.6%–6.7% 4.6%–6.1%Expected volatility 79% 76% 71%Expected life (in years) 3 3 3
Yahoo!: extracts from ESO disclosures in 2001 accountsExhibit 16.6
(Source: Yahoo!, Annual Report 2001.)
CFA_C16.qxd 11/6/03 3:17 PM Page 518

CHAPTER 16 • EMPLOYMENT COSTS 519
l Analysis of employment costs
This is a broad area. We look briefly at two issues – measuring labour productivity and assessingthe impact of pension liabilities on financial leverage – which can cause problems for investorsanalysing company accounts.
Employee data and productivity analysis
Investors and others use employee data in financial reports to construct productivity ratios. Thesimplest is sales per employee. However, in its unadjusted form it is unsuitable for use in inter-company comparisons since it makes no allowance for differences in the following:
l Employment patterns. Some firms make heavy use of part-time labour while others rely exclusively on full-time staff. To make valid intercompany comparisons, the denominator(employees) should be expressed in terms of full-time equivalent (FTE) staff.
l Outsourcing of activities. Companies differ in the extent to which they contract out activitiessuch as credit management or, more fundamentally, parts of the production process. Some carproducers, for example, buy most of a vehicle’s components from outside suppliers; othersmanufacture them in-house. An assembler – of any product – adds less value in its operationsthan an integrated manufacturer. Where there are likely to be large intercompany differencesin ‘value added’ (output less the cost of purchased inputs) within an industry, a more appro-priate measure of productivity is value added per (FTE) employee.
Productivity ratios like ‘sales per employee’ are not necessarily a good guide to cost competit-iveness. High pay and benefits can more than offset high labour productivity, as some Germanmanufacturers discovered to their cost in the 1990s. Thus investors and others monitor labourcost ratios as well as productivity ratios. Labour costs are expressed as a percentage of sales rev-enue or per unit of output. The latter is common in industries where output can be standardised(e.g. steel production in tonnes).
Pension liabilities and financial leverage
As we saw in Chapter 11, balance sheet measures of financial leverage usually relate interest-bearing debt to capital provided by shareholders (shareholders’ equity plus minority interest). Acompany’s obligations for pension and other post-employment benefits are operating liabilities– and thus not included in traditional measures of financial leverage. However, if a company hasan underfunded DB plan and the deficit is large, investors may incorporate the unfunded pen-sion liability in their calculation of its net debt. A key concern of investors – and of credit-ratingagencies – is the additional cash contributions the company must make to reduce or eliminatethe funding deficit. Such cash calls usually occur when the company’s liquidity position isalready weakened by difficult trading conditions. This was the experience of US auto, tyre andsteel companies in 2002/03.
Summary
Companies reward employees in various ways. Compensation can be fixed or variable; in cash,in shares or in kind; current or deferred. The compensation package offered to an employee –the types of compensation and their relative weights – is the result of a balancing act. The firmwants to link pay to performance yet allay the employee’s income anxieties, to reward indi-vidual achievement but also encourage team effort, to use the most efficient pay mechanisms yet take advantage of the prevailing tax and welfare systems in the country.
CFA_C16.qxd 11/6/03 3:17 PM Page 519

520 PART 2 • THE HOUSE OF ACCOUNTING
As a general rule, compensation should be recognised as a cost in the company’s accounts asit is earned. In addition, it should be measured at fair value. These principles are sometimesdifficult to apply, especially when the compensation is deferred and its amount is contingentupon uncertain future events. Two examples of such compensation are pension benefits underdefined benefit plans and employee share options.
It is now accepted practice for companies (though not governments) to recognise the cost ofpension benefits on an accrual basis. In the case of DB plans, accountants draw on the work of actuaries to estimate pension expense. However, they employ smoothing devices – by meansof off-balance-sheet accounts – to spread the cost of large changes in the firm’s pension liabilityfrom year to year.
Employee share options also pose measurement difficulties. As with DB pensions, assump-tions must be made in order to value today a benefit that employees hope to receive in the future.Companies resist fair valuation of ESOs. Instead, they measure them at a lower intrinsic value.The unusual features of ESOs – the restrictive conditions (especially non-transferability) and, in the case of performance-based options, their contingent nature – render suspect the valuesproduced by conventional option pricing models, it’s claimed. The real reason for corporateopposition, however, is the effect of fair value accounting of ESOs on reported profits.
Disclosure of employee data – in terms of numbers and cost – permits investors to calculatelabour productivity and cost ratios. Where a company’s pension liability is significant, theyadapt financial leverage ratios to incorporate it.
Problem assignments
P16.1 Cost of employee pay and benefitsD’Artagnan launches a personal bodyguard service at the start of x1. The company’s name is ‘LesMousquetaires’. Its financial year ends on 31 December. The following three parts deal with payrollissues the company faces during the year. Assume each part is independent. All amounts are in euros.
Part A
‘Les Mousquetaires’ hires three employees: Athos, Porthos and Aramis. Set out below are themonthly pay, tax and benefits data for each of the three men in x1.
Salary 3,000Income tax withheld 18%Social security tax:
Employer: % of salary 25%Employee: % of salary 15%
Company-sponsored pension plan(a defined contribution plan):
Employer contribution 75Employee contribution 50
Supplementary medical care:Employer contribution 60
Required
Calculate the monthly salary expense and employee benefits expense of ‘Les Mousquetaires’ in x1.What is the net pay Athos, Porthos and Aramis receive in a typical month?
CFA_C16.qxd 11/6/03 3:17 PM Page 520

Part B
The salary Athos, Porthos and Aramis receive each month is based on the number of days worked.Assuming a month of 20 working days, this amounts to A150/day. ‘Les Mousquetaires’ grants themtwo paid days of holiday for each month (20 working days) of service. Unused days can be carriedforward indefinitely and are paid off when employment ends.
In x1, the three each earn 24 days’ paid holiday over the year. By the end of the year, each hasused 20 days (Porthos to visit relatives in Brittany, Aramis a ‘cousin’ in Tours, and Athos – well, that’sa mystery).
Required
Calculate the cost to ‘Les Mousquetaires’ of holiday pay earned during x1. What is the ‘accrued holiday pay’ liability at 31/12/x1? Ignore income tax and benefits.
Part C
‘Les Mousquetaires’ has a busy and successful first year. D’Artagnan decides the company will dis-tribute a bonus to the three employees which will amount in total to 10% of its x1 after-tax profits.The corporate income tax rate is 35%. The bonus is tax-deductible.
Required
Complete the summary income statement for x1 set out below. What is the gross amount of bonusAthos, Porthos and Aramis will each receive?
‘Les Mousquetaires’Income statement for x1
Operating revenues 600,000Operating expenses –420,000Profit before bonus 180,000Profit-related bonus _______Profit before taxIncome tax (at 35%) _______Profit after tax _______
Check figure:Part C Income tax 59,155
P16.2 Company-sponsored pension plans: accounting and management issuesDespite their technical nature, the international rules on accounting for pension costs arouse strongfeelings. Here’s a sample of some of the criticisms.
(A) Reviewing the financial statements of companies with DB pension plans that have adopted IAS,an analyst remarks: ‘The balance sheet figure for pension liabilities these companies report ismeaningless. The smoothing techniques allowed under international rules mean that most of theactuarial gains and losses are off-balance-sheet. And there’s no accounting or economic justifica-tion for this. After all, if a company has bank debt and the debt is increasing each year, it can’t removethe increase from the balance sheet. Why should it be able to do this with pension liabilities?’
(B) A UK actuary queries the decision to value pension fund assets and liabilities at fair value at eachbalance sheet date. ‘This doesn’t give a true picture of the state of the pension fund since it onlyrepresents a snapshot of a fund’s assets and liabilities on one day. People look at a pension funddeficit and assume that the company must inject cash of this amount into the fund to eliminatethe deficit. But this isn’t necessarily the case. The liabilities are long-term and the assets already
CHAPTER 16 • EMPLOYMENT COSTS 521
CFA_C16.qxd 11/6/03 3:17 PM Page 521

invested in the fund may well be sufficient to cover them. For example, the aggregate deficit onUK corporate pension funds during the 2001 bear market was around £70 billion. However, if youassume fund assets earn a conservative stock market return – dividends and capital gains com-bined – of 6% a year, this deficit will be wiped out in a decade. It would be more sensible to valuefund assets on a long-term actuarial basis, based on the present value of expected returns.’
(C) A director of a German company that has an unfunded pension plan complains that internationalstandards are forcing German companies to introduce funded plans. ‘Analysts say Germanunfunded plans aren’t transparent. But where’s the lack of transparency? We disclose a break-down of our pension expense in the accounts. We also show the movement in the pension fund’sliabilities over the year. Funding would be costly for us. We would have to hand over companycash to the fund each year. This would deprive us of flexibility – at the moment, we can chooseto invest the cash destined for future pension payments either in financial investments or in ouroperations. As a result, we can finance our business more cheaply. And our employees are pro-tected since, under German law, we have to insure against the risk of default on our pension liabilities.’
Required
Consider the above criticisms separately. According to accounting regulators, there are errors or mis-understandings in each of them. Identify them.
P16.3 Accounting for pension costs under a DB planMirandolina Inns, a European chain of mid-price hotels, operates a DB pension plan for its employees.The company follows international standards when accounting for the costs of the plan. It has electedto use the corridor treatment to recognise net actuarial gains or losses in its accounts.
The company’s pension fund has a deficit of 55 at the end of year 3. (All amounts are in A million.)The deficit has arisen because of the effect of the stock market decline on the value of plan assets.In addition, the fall in long-term interest rates has increased the present value of the pension obliga-tions. Since unrecognised net actuarial losses amount to 50 at end-year 3, the company reports apension liability of only 5 on its balance sheet then.
In BmActuarial present value of pension obligations (400)Plan assets at fair value 345
Funded obligations in excess of plan assets (55)Unrecognised net actuarial losses 50Net liability for funded obligations recognised (5)
The following pension-related events occur in year 4. The cost of pension benefits earned byemployees in the year (‘Current service cost’) is 15. The company contributes 10 in cash to the pen-sion fund. It pays benefits of 8 to retirees. At the end of the year, the pension fund’s assets have afair value of 365 and the DB obligations of the fund have a present value of 433.
In calculating pension liability and expense, the company’s actuaries assume a discount rate of6.5% (the market yield on high-quality corporate bonds) and an expected rate of return on plan assetsof 8%. The company estimates the average remaining working life of employees is 10 years.
Required
(a) Calculate Mirandolina Inns’ year 4 pension expense and end-year 4 pension liability (or asset).
(b) Mirandolina Inns’ management are concerned about the size of the pension fund deficit at the end of year 4. Fabrizio, the chief financial officer, is reviewing the pension scheme with a view tomaking changes to it in year 5. As input to this review, he asks you to determine the effects onthe company’s year 4 accounts if the following decisions had been made in year 4. Calculate theeffect of each separately.
522 PART 2 • THE HOUSE OF ACCOUNTING
CFA_C16.qxd 11/6/03 3:17 PM Page 522

CHAPTER 16 • EMPLOYMENT COSTS 523
(i) The company contributes 15 in cash to the pension fund (instead of 10). The pension fund’sassets at the end of the year are 5 higher (i.e. 370).
(ii) The company amends the plan at end-year 4 and reduces future benefits. The result is a neg-ative past service cost of 5. This is recognised in income immediately.
Check figure:(a) Pension expense, year 4 14.4
P16.4 Share-based compensation: a cost to the company?Accounting regulators’ attempts to require companies to recognise as an expense the shares andshare options granted to employees have met with fierce resistance from the companies themselves.Management employ a variety of arguments. Here are two common ones.
(A) The finance director of a UK software company claims that requiring a company to recognise thecost of employee share options hits its earnings per share twice. ‘EPS suffers a double whammy.The earnings figure is lower by the amount of the compensation charge and the number of sharesoutstanding, the denominator of the ratio, increases when the options are exercised. In reality, it’sonly the latter event that dilutes the interests of existing shareholders in the company’s earnings.’
(B) The controller of a Belgian company questions whether recognising an expense from issuingshares as compensation to employees is consistent with the IASB’s conceptual framework. ‘Inthis framework, an expense is defined as an outflow of net assets. As I understand it, net assetsflow out of a business when cash is paid out, an asset is consumed (depreciable fixed assets) orsold (inventory), or a liability is incurred. None of these events occurs when a company issuesshares – or options on shares – to its employees as compensation. Since there’s no outflow of netassets, the cost of share-based compensation can’t be an accounting expense.’
Required
Consider each of the above arguments separately. Is it wrong – and, if so, why?
P16.5 Accounting for employee share optionsShareholders in Sif, a cosmetics company specialising in hair care products, agree to the establish-ment of a share option plan for employees at a general meeting in early x2. Up to 1.6 million A5 parshares may be issued under the plan.
The first tranche of 234,000 options (on an equivalent number of shares) is granted in early x2. Theterm of the options is ten years: it begins on the date of grant. Options may not be exercised before theend of a two-year period which begins on the day following the date of grant. This period is followedby an eight-year exercise period. The exercise price of the options granted in x2 is A25, equivalent tothe average market price of Sif’s shares on the 20 trading days prior to the issuance of the options.The fair value of the options at that date, based on the Black–Scholes option pricing model, is A10.5.
In early x4, 200,000 options are exercised when the market price of the shares is A31. The remain-ing 34,000 options lapsed in x3 because the employees left the company that year.
Required
(a) Assume Sif measures the cost of its employee share options at intrinsic value.(i) What is the compensation expense the company recognises in x2 with respect to the options
granted that year?(ii) Show the entry the company makes to record the exercise in x4 of the options granted in x2.
(b) Repeat (a), assuming Sif measures the cost of its ESOs at fair value.
(c) A Sif manager wonders whether it’s possible for the company to avoid recording compensationexpense by hedging the exercise of the options. ‘Suppose the company had bought back 234,000of its shares at the time the options were granted in x2 and paid the market price then (A25) forthem. The entry would have been:
CFA_C16.qxd 11/6/03 3:17 PM Page 523

524 PART 2 • THE HOUSE OF ACCOUNTING
Dr. Treasury shares (OE−) A5,850,000Cr. Cash (A−) A5,850,000
When the options are exercised, we reverse the above entry. Lots of companies do this. By buy-ing back the shares at what is the exercise price, the company avoids having to buy them at ahigher price later and incurring a loss as a result.’
Comment on the manager’s idea. Can the company avoid recording compensation expense bybuying back shares equivalent to the options granted? If not, why not?
P16.6 Analysis of pension plan disclosures IAlice is puzzled by certain pension disclosures in Purdon Corporation’s x3 accounts. Purdon is a (ficti-tious) US media company. ‘Purdon’s numbers are a complete wonderland to me’, she says. ‘Can youexplain the information it provides about its defined benefit plans? I’ve highlighted the relevant notein its x3 accounts (see Exhibit 16.7).
‘My first question concerns the company’s income statement. If I understand it right, Purdonclaims its DB plans generated net pension income in x3 – to the tune of US$290 million. (This is netof the cost of health-care and other post-employment benefit plans.) Pension income is a significantfigure – around 10% of the company’s before-tax profits. It appears to be due, in large part, to theincome of some US$850 million the company earned on its pension fund investments that year. Yet,as the exhibit shows, Purdon’s pension fund assets declined by US$930 million in x3. How canPurdon earn a return of US$850 million on pension fund investments and report a decline in them ofUS$930 million in the same year?
‘The relationship between the pension fund and the company’s balance sheet is the source of mynext question. The numbers get curiouser and curiouser, the more I look at them. According to thenumbers in the exhibit, Purdon’s DB plans were in surplus by US$2.86 billion at the end of x3 –US$1.3 billion lower than a year earlier. Yet the company reports a net pension asset of US$2.4 billion at end-x3, a number that has grown by over US$400 million since end-x2. How can Purdon’spension fund surplus decline year-on-year and yet the pension asset it reports on its balance sheetincrease over the same period?’
Required
Help Alice. Answer her two questions, using the information in Exhibit 16.7.
P16.7 Analysis of pension plan disclosures IIToray Industries is a Japanese manufacturer of fibres, textiles, plastics and chemicals. The groupreported worldwide sales of ¥1,016 billion (US$7.6 billion) and net profits of ¥3.8 billion in the year to31 March 2002. It reported a pension liability of ¥115,671 million (and a pension asset of ¥67 million)on its end-March 2002 balance sheet.
Exhibit 16.8 contains extracts from the notes to the company’s 2001/02 consolidated accounts.The company adopted a new national accounting standard on retirement benefits as of 1 April 2000.The standard brings Japanese accounting practice into line with IAS. According to the company, thenet recognised liability represents ‘the estimated present value of projected benefit obligations [i.e.including the effect of expected salary increases] in excess of the fair value of plan assets except that,as permitted under the new standard, unrecognised actuarial differences and unrecognised prior servicecost are amortized on a straight-line basis over a period of 15 years’ (Annual Report 2001/02, p.40).
The company also discloses that it contributed marketable equity securities to the retirementbenefit plan in the year to 31 March 2002. The securities had a fair value of ¥22,005 million at the dateof transfer.
Required
(a) Are Toray’s retirement benefit plans over- or underfunded at 31 March 2002? What is the amountof the over- or underfunding?
CFA_C16.qxd 11/6/03 3:17 PM Page 524

Note 9 Pension benefits under defined benefit plans (extracts)
Effect on operationsIn US$ mn x3 x2
Service cost 173 153Interest cost on benefit obligation 405 385Expected return on plan assets (848) (736)Amortization of transition asset* – (30)Amortization of prior service cost 48 46Net actuarial gain recognized (188) (160)Pension income (410) (342)Cost of other post-employment benefit plans 120 94Pension income, net of cost of OPEB plans (290) (248)
Projected benefit obligation (PBO)In US$ mn x3 x2
Benefit obligation at 1 January 5,593 5,002Service cost 173 153Interest cost on benefit obligation 405 385Plan amendments – 227Actuarial losses 174 190Benefits paid (382) (364)Benefit obligation at 31 December 5,963 5,593
Fair value of plan assetsIn US$ mn x3 x2
Fair value of plan assets at 1 January 9,752 9,848Actual return on plan assets (564) 252Employer contribution 15 16Benefits paid from pension fund (382) (364)Fair value of plan assets at 31 December 8,821 9,752
Prepaid pension asset at 31 DecemberIn US$ mn x3 x2
Fair value of plan assets less PBO 2,858 4,159Unrecognized prior service costs 269 317Unrecognized net actuarial gain (694) (2,468)Net pension asset recognized 2,433 2,008
Actuarial assumptionsAt 31 December x3 x2 x1
Discount rate 7.25% 7.5% 7.75%Compensation increases 5.0 5.0 5.0Return on plan assets 8.5 9.5 9.5
* ‘Transition asset’ is excess of plan assets over benefit obligation at date new US rules on pension accounting wereintroduced. Purdon’s transition asset was fully amortised by end-x2.
Purdon Corporation: disclosures on DB pension plans in x3 accountsExhibit 16.7
CHAPTER 16 • EMPLOYMENT COSTS 525
CFA_C16.qxd 11/6/03 3:17 PM Page 525

526 PART 2 • THE HOUSE OF ACCOUNTING
Note 8 Retirement Benefit Plan
The reserve for employees’ retirement benefits as of March 31, 2002 and 2001 was analysedas follows:
Thousands ofMillions of yen U.S. dollars
2002 2001 2002
Projected benefit obligations ¥342,321 ¥320,918 $2,573,842Plan assets 172,687 154,322 1,298,398
169,634 166,596 1,275,444)Unrecognized actuarial differences 60,727 24,899 456,594Unrecognized prior service cost (6,697) – (50,353)
115,604 141,697 869,203Prepaid pension cost 67 37 504
¥115,671 ¥141,734 $ 869,707
The above table includes the amounts related to the portion subject to the Japanese WelfarePension Insurance Law.
Net pension expense related to the employees’ retirement benefits for the year ended March 31, 2002 and 2001 was as follows:
Thousands ofMillions of yen U.S. dollars
2002 2001 2002
Service cost ¥12,102 ¥13,074 $ 90,992Interest cost 10,493 10,342 78,895Expected return on plan assets (5,212) (5,813) (39,188)Amortization of actuarial differences 1,667 – 12,534Amortization of prior service cost (420) – (3,158)Amortization of transition amount – 48 –
Net pension expense ¥18,630 ¥17,651 $140,075
Assumptions used in calculation of the above information were as follows:
2002 2001
Method of attributing projected benefits to periods of service straight-line basis straight-line basisDiscount rate primarily 3% 3.5%Expected rate of return on plan assets primarily 3.5% 3.5%Amortization period of prior service cost primarily 15 years –Amortization period of actuarial differences primarily 15 years primarily 15 yearsAmortization period of transition amount – 1 year
Toray Industries: disclosures on retirement benefits in 2001/02 accountsExhibit 16.8
(Source: Toray Industries, Annual Report and Accounts for year to March 31, 2002. Reproduced by permission of TorayIndustries, Inc.)
CFA_C16.qxd 11/6/03 3:17 PM Page 526

(b) Toray reports ‘Unrecognised actuarial differences’ of ¥60,727 million at end-March 2002. Arethese differences gains or losses? Suggest possible reasons why the differences more than doubled between end-March 2001 and end-March 2002.
(c) Compare Toray’s retirement benefit disclosures with those of Roche (see Exhibit 16.5). What arethe disclosures Roche makes but Toray doesn’t that investors in Toray would find helpful, in youropinion?
Notes to Chapter 161 This can lead to major differences in the amount and composition of employment costs, even among
countries with a similar per capita income. For example, according to a study of labour costs in themanufacturing sector, Denmark had the highest wage costs per hour worked (on average a19.57) in2001 but Germany had the highest labour costs per hour worked (a27.33) that year. The reason?German firms sustained high non-wage costs (i.e. holiday pay, bonuses, social security contributions):at a12.58/hour, these costs were much heavier than those in other high-wage countries such asDenmark (a5.97/hour), Switzerland and the USA. (See Andersson, K.B. (ed.) (2002), IndustrialOutlook: Wages, Salaries, Labour Costs, Confederation of Swedish Enterprise.)
2 For a fuller discussion of the link between compensation and motivation, see Milgrom, P. and Roberts,J. (1992), Economics, Organization and Management, Englewood Cliffs, NJ: Prentice Hall, Chapter 12.
3 In this chapter, we assume the firm expenses the cost of pensions (and other employee benefits) asincurred. In practice, the cost may be part of production costs and the firm capitalises it in inventory(or in fixed assets constructed for the firm’s own use). How pension cost is calculated each period isnot affected by its allocation, however.
4 Not all companies with funded plans make contributions to them each period. During the 1990s,many US and UK firms took contribution ‘holidays’. The stock market boom in that decade resultedin pension funds that were heavily invested in equities reporting large surpluses.
5 The two types of actuarial valuation method are also applied to the calculation of other componentsof pension expense (e.g. past service cost).
6 Amortisation of actuarial gains – together with returns on fund investments – may outweigh the debitcomponents of pension expense (current service cost and interest on plan liabilities), with the resultthat the company reports a pension credit instead of a pension expense in its income statement.
7 International Accounting Standards Board, IAS 19: Employee Benefits. The standard also deals withlong-term employment benefits, such as long-service benefits, long-term paid leave and deferred com-pensation. These benefits are accounted for in the same way as pension benefits, except that past service costs and actuarial gains and losses are recognised immediately.
8 Under the Projected Unit Credit Method, each year of service gives rise to an additional unit of pension entitlement. Each unit is valued separately. The total pension benefit obligation is the sum ofthese units.
9 If a company has unrecognised net actuarial losses (or unrecognised past service costs), then in theoryit could show a prepaid pension asset in its balance sheet. IAS 19 limits the pension asset a companycan report in these circumstances, however.
10 In countries with no tradition of company-sponsored pension plans for employees (e.g. France,Belgium, Italy), there are no accounting standards covering recognition and measurement of pensioncosts. Companies in these countries that offer DB pension plans to their employees apply US or inter-national rules to account for the resulting costs.
11 For a full exposition of this argument, see Hall, B.J. and Murphy, K.J. (2002), Stock options for un-diversified executives, Journal of Accounting and Economics, 33: 3–42.
12 For an explanation of the Black–Scholes and other option pricing models and their application, seeHull, J.C. (2002), Options, Futures, and Other Derivative Securities, 5th edition, Upper Saddle River, NJ:Prentice Hall.
13 ED2: Share-based Payment. The IASB published the exposure draft in November 2002.14 For a fuller exposition of the costs (and benefits) of accounting standards, see Watts, R.L. and
Zimmerman, J.L. (1986), Positive Accounting Theory, Englewood Cliffs, NJ: Prentice Hall.
CHAPTER 16 • EMPLOYMENT COSTS 527
CFA_C16.qxd 11/6/03 3:17 PM Page 527

15 For details of this and other examples of corporate lobbying of accounting standard-setting bodies inAustralia, the UK, and the USA in the 1990s, see Zeff, S.A. (2002), ‘Political’ lobbying on proposedstandards: a challenge to the IASB, Accounting Horizons, 16(1): 43–54.
16 The details in this paragraph are based on the following Financial Times reports in 2002: Peel, M. andMackintosh, J., CBI to lobby government over [pensions standard] FRS17, FT 14 February; Peel, M.and Shrimsley, R., Darling [UK work and pensions minister] presses for rethink of controversial pen-sions rule, FT 4 March; Parker, A., Pensions accounting rule is set for delay, FT 2 July.
17 Yahoo! also discloses options outstanding and options exercisable at year-end at different exerciseprices. The company’s option ‘overhang’ is large: options outstanding at end-2001 represent 25% ofthe company’s outstanding shares at that date.
18 4th Directive, Art. 43(12). All EU companies (including small ones) must report the amount and termsof any loans or guarantees to directors (Art. 43(13)). IAS also require disclosures about directors’ payand benefits. A director or key manager is a ‘related party’ to the company: he or she has ‘the ability tocontrol [the company] or exercise significant influence over [it] in making financial and operatingdecisions (IAS 24: Related Party Disclosures). Under the standard, all transactions between related par-ties, including payments for services, must be disclosed.
19 Winter Committee (2002), A Modern Regulatory Framework for Company Law in Europe: Final Reportof the High Level Group of Company Law Experts, Brussels: European Commission. The committee alsorecommended that firms disclose their remuneration policy for directors in the annual report.
528 PART 2 • THE HOUSE OF ACCOUNTING
CFA_C16.qxd 11/6/03 3:17 PM Page 528

Accounting for corporateincome taxes
INTRODUCTIONThis chapter looks at the way companies account for their income taxes. It’s said that taxes are, with death, the only things in life we can be certain of.Accountants add to corporate misery by making the accounting for them complicated.
We first discuss, in general terms, the framework of taxation of corporateincome in industrialised countries. At present, countries differ in the way tax-able profit is calculated, in the tax incentives available to companies, and in thetreatment of losses and dividend payments. We outline these differences insection 1 of the chapter.
We then turn to the accounting for income taxes. As with other assets andliabilities, there are two major issues. First, when should a firm recognise thecost of income taxes in its financial statements? Second, how should it measurethat cost?
It is now widely accepted that the cost of income taxes to the company is thetax impact, now and in the future, of the profit it reports in its annualaccounts. This may not be the same as the income tax it pays in the year. Whenthe tax authorities and the company calculate profit in different ways, the two numbers – tax payable and tax expense – diverge. Usually, this is becausethe tax authorities and the company value assets and liabilities differently.Such differences, though, are temporary. If the result is a delay in tax payment,the company reports a deferred tax liability. If taxes are paid early, it reports a deferred (or prepaid) tax asset. We devote much of part 1 and the whole of section 2 of the chapter to explaining how companies calculate income tax expense and determine their tax assets and liabilities under deferred taxaccounting.
Investors monitor a company’s tax figures closely. A company can increaseits profits and cash flow by managing its tax affairs skilfully. We discuss in section 3 of the chapter the tax-related information investors look for in theaccounts and a statistic they use, the effective tax rate, to assess a company’s taxburden.
1717
SECTION 1Core issues
l Taxes on companies
l Taxation of corporateincome: generalframework
l Cost of income taxes:recognition issues
l Internationalaccounting rules and practice
SECTION 2Deferred tax accounting:extensions
l Deferred tax assets
l Tax effects ofrevaluation andconsolidation
l Measurement issues
SECTION 3Corporate income taxesand financial analysis
In this chapter
CFA_C17.qxd 11/7/03 2:14 PM Page 529

530 PART 2 • THE HOUSE OF ACCOUNTING
SECTION
1 Core issues
Taxes on companies
Corporate income taxes are an important source of government revenue in industrialised countries.They are not the major source, however. Among developed countries, for example, only 5–10% oftax receipts comes from corporate income taxes while 20–30% comes from personal income taxes.1
Income taxes are one of several taxes a company must bear. The range and extent of taxes andlevies on business vary from country to country. Some countries levy a tax on the transfer ofassets in certain types of transaction (transfer tax or stamp duty): one example is the initial andsubsequent issues of shares by the company. In many EU countries a firm must pay an annualtax on the assessed value of its property (real estate or property tax). Countries with a federalstructure impose taxes at the local as well as national level: for example, German companies paya municipal trade income tax to help finance municipal and regional (Länder) governments.More significant in national government revenue terms is the value added tax on domestic supplies of goods and services and imports. Among developed countries, around 30% of gov-ernment revenues comes from this source.
Taxation of corporate income: general framework
In principle, the taxation of a company’s income for a period is simple. The tax authorities firstdecide what is the taxable entity. In many cases, the taxable entity is the same as the legal entity.2
(For simplicity, we assume the entity is resident and taxable in only one country.)The tax authorities next calculate the entity’s taxable profit in the year. In essence, taxable
profit is calculated as follows:
Taxable revenues– Tax-deductible expenses
Taxable profit
They then determine its tax liability by applying the corporate income tax rate (or rates) to taxable profit:
Taxable profit ×× Income tax rate == Income tax payable
The company settles its income tax liability at the end of the year.3
Complications now set in. We list them below and discuss each briefly.
1 How do tax authorities determine taxable revenues and tax-deductible expenses?2 How does a company’s dividend policy affect its tax bill and that of its shareholders?3 What happens if a company reports operating losses?4 In what ways do tax-based incentives reduce a company’s tax liability?
Our examples focus on EU member states and are based on tax rules in force in 2002.
l Calculation of taxable profitAs a result of the 4th Directive, companies in the EU should now calculate accounting profit(the before-tax income number reported in the external accounts) independently of taxable
CFA_C17.qxd 11/7/03 2:14 PM Page 530

profit. This is known as ‘separate reporting’. Note, however, that in countries with a uniformreporting tradition (i.e. equivalence of accounting and taxable profits), the provisions of thenational tax code still influence strongly the way accounting profit is calculated.
How does separate accounting work? The Directive requires that a company’s accounts givea ‘true and fair view’ of the performance and position of the firm. Thus a company determinesaccounting profit according to ‘fair presentation’ principles as laid down in national (and inter-national) accounting standards. It can then calculate taxable profit by adjusting accountingprofit to meet the requirements of the tax code. In sum:
Taxable profit == Accounting profit ++/−− Tax code adjustments
Nature of tax code adjustmentsThe adjustments tax authorities make to accounting profit fall into two categories:
1 those which cause accounting and taxable profits to differ permanently; and 2 those which cause accounting and taxable profits to differ temporarily.
Permanent differences arise, in the main, because the government exempts certain revenues fromtax and disallows a tax deduction for certain expenses. The latter is a more common occurrence.For an expense to be tax-deductible, a company must usually show that it is incurred ‘wholly orexclusively’ for the purposes of its business. This is the condition laid down by the UK taxauthorities; similar phrasing is to be found in other countries’ tax codes. But how is it applied?Most tax authorities agree that no tax relief should be provided for expenditures incurredbecause the firm breaks domestic law (e.g. fines, bribes). However, they disagree about the treat-ment of expenditures that break foreign law. And they question whether business entertainmentexpenses and contributions to charities should be tax deductible: are these incurred ‘wholly andexclusively’ for the purposes of the company’s business?
Temporary differences arise because government and firms disagree about when (rather thanwhether) certain revenues and expenses should enter into the calculation of income. Bad debts anddepreciation are two examples of important business costs where the tax authorities often sub-stitute their own figures in place of the company’s. The reasons are different. In the case of baddebts, governments suspect companies of trying to defer income (and thus tax) by overprovid-ing for estimated bad debts. Thus, in many countries, a general provision is disallowed; only aspecific provision (based on, say, an ageing analysis of receivables) or write-offs of known baddebts are tax-deductible.
By contrast, the tax deduction for depreciation is often more generous than that suggested bythe economics of the business. Tax authorities allow companies to depreciate an asset at a fasterrate than the rate at which the asset’s services are consumed. This is the case in countries wherethe option of depreciating certain classes of asset at an accelerated rate for tax purposes appliesto all assets within that class. Exhibit 17.1 provides an illustration.
Thus a French company purchasing plant which, for tax purposes, has a five-year life canapply an ‘acceleration factor’ of 1.75 and depreciate it (and all similar equipment) at a decliningbalance rate of 35%. Government intentions here are plain: to lower the after-tax cost of newfixed assets and thereby stimulate investment.
In many European countries (especially those with a uniform reporting tradition), the depre-ciation rates a firm uses in its tax accounts are often the result of negotiation with the tax author-ities. Hence, in Exhibit 17.1, the straight-line (SL) rate for each asset class and the accelerationfactor are usually shown as a range – save in the UK where negotiation of depreciation rates is rare.
We look at the accounting implications of permanent and temporary differences later in thechapter.
CHAPTER 17 • ACCOUNTING FOR CORPORATE INCOME TAXES 531
CFA_C17.qxd 11/7/03 2:14 PM Page 531

532 PART 2 • THE HOUSE OF ACCOUNTING
Taxable profit and transfer pricingA company with operations in more than one country faces a further problem – the allocationof its taxable profit among various tax jurisdictions. Tax authorities are suspicious of the pricescompanies charge for internal, cross-border transfers of goods and services. Countries with hightax rates fear that outward charges are set low and inward charges set high in order to divert tax-able profits to low tax jurisdictions. Most tax authorities require internal transfers to be priced onan ‘arm’s length’ basis (i.e. as if the good or service were sold to an independent party). In addition,they provide guidance as to how an arm’s length price should be calculated. This is of help to firmsproducing specialised goods and services and other products for which there is no active market.
l Tax treatment of dividendsCountries differ in their tax treatment of dividends. Dividends, you’ll recall, are for legal andaccounting purposes a distribution of profits rather than an expense. There are two importantconsequences. First, companies have an incentive to issue debt rather than equity because inter-est is a tax-deductible expense but dividends are not.4 Second, in the absence of tax relief on dividend income, distributed profits are more heavily taxed than retained profits because theyare taxed twice – once in the hands of the company and again in the hands of the shareholder. MostEU countries now provide at least partial protection against the double taxation of dividends.
The protection can take different forms. Under an imputation system, shareholders offsetpart or all of the corporate income tax paid on distributed profits against their individual income
(a) SL rate (%)
Asset class France Germany Italy Netherlands Spain UK*
Commercial buildings 2–5 3 3–5 2–4 2–3 4Machinery 10–20 6–10 5 10–20 8–12 5Office equipment 5–20 12.5–33.3 6 10–40 10–33.3 10–25 6 25Motor vehicles** 20–25 11–16 7 20 16 7 [DB]
* 4% SL for industrial buildings, 25% DB for general plant and equipment and 6% DB for long-life plant (>25 years).
** Special rules for cars in certain countries.
(b) Accelerated depreciation on plant and machinery*
France Germany Italy Netherlands Spain UK
Method DB DB SL DB DB ***Factor** 1.25 to 3.0 2.0 varies 1.5 to
2.25 (max. 30%) (first 3 by asset 2.5years) class
* Optional. DB = declining balance; SL = straight-line. Both the Netherlands and Spain permit firms to use sum-of-years’-digits (SoYD) method to calculate accelerated depreciation.
** To find the DB depreciation rate (Italy: the accelerated SL rate), apply the factor to the SL rate in (a). The factor varies depending on asset life and/or class of asset.
*** Certain types of company can deduct first-year allowance (of up to 100% of asset’s cost) for certain types of asset. DB rate of 25% per year is applied to any remaining balance.
Typical tax depreciation rates by asset type, in selected EU member statesExhibit 17.1
(Source: International Bureau of Fiscal Documentation (2002), The Taxation of Companies in Europe, Amsterdam: IBFD.)
CFA_C17.qxd 11/7/03 2:14 PM Page 532

CHAPTER 17 • ACCOUNTING FOR CORPORATE INCOME TAXES 533
tax liability. In effect, income tax is imputed to the dividend the shareholder receives. Belgium,Denmark and France use this system. Countries differ in how they implement it. In some juris-dictions, shareholders may receive a tax credit for tax withheld when a dividend is paid: thiscredit is refundable if, for example, the shareholder is tax-exempt (e.g. a charity or pensionfund). Under a split-rate system, there are two statutory corporate income tax rates: a higherrate that applies to retained profits and a lower rate that applies to distributed profits. Germany’spre-2001 tax regime was a combination of split-rate and imputation systems.
By contrast, under the classical system, distributed profits are in effect taxed twice, once atthe corporate level (when the company declares taxable profits) and again when its shareholdersreceive a dividend. However, the effect of double taxation is mitigated if shareholders canexclude from taxable income part or all of the dividend they receive. This relief is usually applieddifferentially: it’s greater for corporate than for individual shareholders. In fact, in many coun-tries, dividends paid by a (domestic) subsidiary to its parent are tax-exempt. In recent years,changes in national tax regimes have seen a shift from imputation to classical systems. Germanyswitched in 2001, Italy did so in 2003, whereas the Netherlands and the USA have long had sucha system.
An example illustrating the imputation and classical systems of taxation is given in Exhibit 17.2.
Assumptionsl Country A has imputation system. Shareholders receive tax credit of 36% of gross dividend
(i.e. dividend + associated tax credit).l Country B has classical system. There is no dividend relief in personal tax calculation.l Corporate tax rate is 36% in both A and B.l Two shareholders, one in A, the other in B, each receive dividend of A100 from a domestic
company. Each has marginal personal tax rate of 40%.
Total tax on dividend of C100Country A Country B
(imputation) (classical)
Corporate income tax* A56.25 A56.25
Personal income tax:
Gross dividend** A156.25Net dividend A100
Income tax at 40% 62.5 40– Tax credit −56.25 –
Personal income tax due 6.25 40
Total tax on dividend A62.5 A96.25
Tax as % of underlying income 62.5 96.25 156.25
× 100156.25
× 100
= 40% = 61.6%
Notes:* Since dividends are a distribution of after-tax profits, in order to pay dividend of 100, company
needs before-tax profit of 156.25 (100/(1 − 0.36)), assuming tax rate of 36%. Thus corporate income tax borne by dividend is 56.25.
** Under imputation system, shareholder reports gross dividend (i.e. dividend + associated tax credit) in tax return.
Tax treatment of dividends: imputation and classical systems contrastedExhibit 17.2
CFA_C17.qxd 11/7/03 2:14 PM Page 533

In our example, country A has a full imputation system: shareholders can claim a credit forall the corporate income tax a dividend has borne. Country B has a classical system with no taxrelief on dividends. To keep our example simple, the corporate tax rate is the same (36%) in bothcountries. So too is the marginal personal tax rate (40%).
A dividend bears both corporate and personal income tax. We assume each company pays adividend of 100. Given the corporate tax rate of 36%, the income necessary to support it is156.25 (100/(1 − 0.36)). Under the imputation system in country A, the corporate and personaltax on that income is 62.5 or 40% of the underlying income. This is the sum of 56.25 of cor-porate income tax (36% × 156.25) and 6.25 of additional personal income tax ((40% − 36%) ×156.25). Under the classical system in country B, the total tax is 96.25 or 61.6% of the under-lying income. This is made up of 56.25 of corporate income tax and 40 of additional personalincome tax (40% × dividend of 100).
In our example, the tax burden on dividends is considerably higher under the classical system.In practice, the tax penalty is likely to be smaller. One reason is that governments in countrieswith classical systems set lower corporate and personal tax rates to offset the effect of doubletaxation.5
l Tax treatment of lossesGovernments usually give tax relief to companies which report operating losses. Countries dif-fer, however, in the form and extent of the relief. Most EU member states permit companies tocarry forward operating losses to set off against future years’ profits. Some countries set a timelimit – for example, five years in France and Italy; fifteen years in Spain. In many countries (theNetherlands, Sweden, the UK), there is no time limit.
Of greater potential benefit in present value terms is the right to carry back operating losses to set off against past years’ profits. Fewer EU countries offer this concession and the period ofcarryback is restricted – usually to a maximum of three years (France, the Netherlands).
In many EU countries, group relief is available. A company and its domestic subsidiaries canelect to file a single tax return. This means that the operating losses of one subsidiary can be setoff against the taxable income of another. As a result, the group can utilise losses earlier than ifeach subsidiary is assessed to tax separately.
l Tax-based incentivesOne of the major obstacles to tax harmonisation in the EU is governments’ reluctance to acceptrestrictions on their right to use fiscal policy to influence companies’ economic behaviour. Atpresent, EU member states use tax measures to promote certain activities (e.g. investment inresearch and development) or certain regions (e.g. creation of new jobs in areas of high un-employment). These tax measures can take many forms – accelerated depreciation, tax credits,even tax holidays.
Spain, for example, offers a variety of tax-based incentives. A company undertaking researchreceives a 30% tax credit for such expenditures, i.e. it can deduct from its annual income tax liability (‘credit against’ the government’s tax receivable) 30% of research outlays in the year.(This is for unchanged spending year-on-year: increases attract a 50% tax credit.) Investments incertain export activities, ‘green’ investments (anti-pollution devices, alternative energy sources),and expenditures on financing employees’ continuing education also attract tax credits. Anyunused tax credits can be carried forward and set off against future tax liabilities (for 15 years,in the case of research tax credits). The government also gives an incentive – in the form of areduction in the corporate income tax rate – to firms that invest in designated Spanish regionsor territories.
534 PART 2 • THE HOUSE OF ACCOUNTING
CFA_C17.qxd 11/7/03 2:14 PM Page 534

CHAPTER 17 • ACCOUNTING FOR CORPORATE INCOME TAXES 535
l Recent changes in corporate taxation in the EUThe 1980s and 1990s saw major changes in the taxation of EU companies. Tax rates were lowered. The basic rate of corporate income tax (at national or federal level) is now less than40% in all member states.6 At the same time, subsidies and tax incentives favouring certainindustries and regions were reduced. The overall corporate tax burden didn’t fall but its distri-bution changed. It became, in the economists’ phrase, more neutral.
Differences in corporate tax regimes within the EU are still significant. The EuropeanCommission believes they influence companies’ investment decisions and distort competition.Its attempts to narrow those differences have met with only modest success to date. Someprogress has been made. A parent–subsidiary directive in 1990 abolished double taxation ofprofit distributions between group companies in different member states. In a 1997 Code ofConduct, member states agreed not to engage in harmful tax competition – for example, byoffering very low tax rates to foreign companies investing in ‘greenfield’ projects in the country.But the Commission has not yet persuaded member states to harmonise the main componentsof corporate income tax: tax rates, the calculation of taxable profit and the scheduling and col-lection of tax payments, as was recommended by a committee of experts in 1992.7
Putting corporate taxes in the EU on a common footing is likely to be a slow process. Anydecision on taxation requires the unanimous approval of member states. Governments do notwant to cede – or appear to cede – sovereignty over fiscal policy. However, the courts mayachieve what politicians and bureaucrats cannot. In a number of recent cases covering transferpricing, thin capitalisation, cross-border loss relief and controlled foreign companies, theEuropean Court of Justice has struck down aspects of individual member states’ tax regimes onthe grounds that they do not comply with EU treaties.8
Exhibit 17.3 summarises the main features of corporate income taxation – from tax systemsto tax rates – in the larger EU states at the end of 2002 and contrasts them with those in theCanada, USA and Japan. The exhibit illustrates the diversity of current corporate tax regimeswithin the EU as well as between EU and non-EU states.
The cost of income taxes: recognition issues
l Accounting profit and taxable profitMost business people view the corporate income tax as a regular cost – a cost they would ratheravoid but one which, in most countries, is an inevitable consequence of profitable operations.9
In this section we ask: how do companies account for this cost in their published accounts? Wedo not discuss, other than in general terms, how the company computes its tax liability. Thisrequires detailed knowledge of national tax laws and is beyond the scope of this book.
The accounting for income taxes is not straightforward because, as we saw earlier, the (before-tax) profit a company reports to shareholders (its accounting profit) is not necessarily the sameas the profit figure the tax authorities use to determine its tax liability (taxable profit). In separate reporting countries, a company calculates accounting profit according to national (orinternational) accounting rules and conventions; the tax authorities calculate its taxable profitaccording to the national tax code. Thus the tax return and the published accounts have the following form:
Tax return Published accountsTaxable revenues xx (Accounting) revenues xxTax-deductible expenses xx (Accounting) expenses xx
Taxable profit xx Profit before tax (accounting profit) xx
CFA_C17.qxd 11/7/03 2:14 PM Page 535

536 PART 2 • THE HOUSE OF ACCOUNTING
Accounting and taxable profit differ if:
1 a revenue or expense is recognised in the tax return and published accounts in different periods;
2 the tax authorities disallow an expense or exempt a particular source of revenue from tax; or3 items are treated as revenues/gains or expenses/losses in the tax return which are not recog-
nised as such in the published accounts.
Type 1 differences are timing (or temporary) differences; types 2 and 3 are permanent differences.An example will help here. Lazarillo is always hungry so he decides to open a restaurant. At
the start of year 1, he forms a company, raises capital of 50 and invests it in a building, equip-ment and materials. We assume that all these assets, with the exception of kitchen equipment,are accounted for in the same way for tax and book purposes. The company depreciates kitchenequipment – which costs 20 and has a four-year expected life – on a straight-line basis in its pub-lished accounts (5/year) but on an accelerated basis in its tax return (8 in the first year and 6, 4and 2 in the remaining three years). The company generates revenues of 100 and incursexpenses, other than depreciation on the equipment, of 85 in year 1. Exhibit 17.4 shows the cal-culation of Lazarillo’s accounting and taxable profits for year 1.
In its first year of operations, Lazarillo Company reports book and tax profit before depreci-ation of 15. Because of the difference in calculation of depreciation, profit after depreciation is not the same. Accounting profit is 10 (15 − 5); taxable profit is 7 (15 − 8). Note that the reasonfor the difference between accounting and taxable profit is a timing difference: depreciation of 3 (8 − 5) is deducted from tax revenues in year 1 but will not be deducted from book revenuesuntil a later year.
Net operating lossesTax Corporate tax rate
system1 standard2 average3 Carry-back Carry-forward% % ( years) ( years)
France I 33.33 35.43 3 5Germany C 25 38.38 1 Unlimited4
Italy I5 36 40.25 0 5UK PI 30 30 1 Unlimited
Japan PI 30 42.66 1 5
Canada PI 257 39.7 3 7USA C8 35 39.3 2 20
Notes:1 C = classical; I = imputation; PI = partial imputation (partial tax credit on dividends to individual
shareholders; dividends to corporate shareholders usually tax-exempt).2 Basic national or federal tax rate.3 Includes temporary surcharge and (typical) state, provincial or local income tax.4 Reduced to 7 years from 2003.5 Replaced by classical system from 2003. Standard tax rate reduced to 33%.6 Based on tax burden on Tokyo-based company. Includes inhabitants and enterprise taxes.7 Net of provincial abatement. Reducing to 23% in 2003 and 21% in 2004.8 US government proposed in 2003 to reduce personal income tax rate on dividend income.
Corporate income tax in G7 countries: key features as of 2002Exhibit 17.3
(Sources: International Bureau of Fiscal Documentation (2002), The Taxation of Companies in Europe, Amsterdam: IBFD;PricewaterhouseCoopers (2002), Corporate Taxes Worldwide Summaries, London: PwC.)
CFA_C17.qxd 11/7/03 2:14 PM Page 536

CHAPTER 17 • ACCOUNTING FOR CORPORATE INCOME TAXES 537
l Income tax expense under taxes payable accountingThe key accounting issue is: how should a company determine the cost of income taxes in the year? Two ways of calculating it have been proposed. Under taxes payable accounting, thecompany records as expense (or credit) the income tax currently payable (or refundable) as a resultof its activities in the year. To find this amount, it applies the current tax rate to its taxable profit(or tax loss) for the year. For example, Lazarillo Company reports taxable profit of 7 in year 1. Ifthe corporate income tax rate is 30%, it recognises a tax expense and liability of 2.1 that year.Exhibit 17.5 shows the link between its tax and published accounts.
Taxes payable accounting (TPA) is flawed. As can be seen from Exhibit 17.5, income taxexpense is based on taxable, not accounting profit. It is thus a function not only of the profit ofthe period but also of the tax concessions the company receives (or tax penalties it bears). If theseconcessions or penalties are temporary, then income tax expense under TPA does not accur-ately reflect the total tax cost of the company’s current profits. Lazarillo’s low tax rate (taxexpense/profit before tax) of 21% in year 1 is unsustainable. It arises because of the tax benefitfrom accelerated depreciation. But this is a temporary benefit. The total amount that the com-pany can deduct from revenues over the equipment’s four-year life is the same in both the pub-lished accounts and the tax return: it is the asset’s cost of 20. If the tax deduction for depreciation
Assumptionsl Initial net assets 50, of which kitchen equipment 20.l Kitchen equipment (KE) has four-year life and zero salvage value.l Book depreciation: SL basis (5/year).l Tax depreciation: accelerated basis (8, 6, 4, 2).l Revenues 100; expenses, other than KE depreciation, 85.
Year 1 accountsStatement of (pre-tax) income for year 1
Tax return Published accountsTaxable revenues 100 (Accounting) revenues 100Tax-deductible expenses, (Accounting) expenses, save
save KE depreciation −85 KE depreciation –85Pre-depreciation profit 15 Pre-depreciation profit 15Tax depreciation Accounting depreciation
on kitchen equipment −8 on kitchen equipment −5Taxable profit 7 Accounting profit 10
(Profit before tax)
(Pre-tax) balance sheet at end of year 1
Tax Publishedreturn accounts
Net assets, except kitchen equipment 45 45Kitchen equipment:
Cost 20 20Less: Accumulated depreciation −8 −5Kitchen equipment, net 12 15
Total net assets 57 60
Taxable and accounting profit contrasted: Lazarillo Company’s year 1 accountsExhibit 17.4
CFA_C17.qxd 11/7/03 2:14 PM Page 537

538 PART 2 • THE HOUSE OF ACCOUNTING
is larger in year 1, it will be smaller in, say, year 3 or 4. This will increase Lazarillo’s tax bill inthose years. This is the future tax cost of Lazarillo’s year 1 profits which TPA ignores.
l Income tax expense under deferred tax accountingIn view of the weaknesses of TPA, accountants devised an alternative approach. Under deferredtax accounting, the company records as expense (or benefit) the tax impact, now and in the future,of its activities in the period. In this case, income tax expense (or benefit) has two components:
1 the income tax currently payable or refundable (as in taxes payable accounting) – known, inthis case, as current tax expense (or benefit); and
2 the future tax impact of the current year’s accounting profit or loss – or deferred tax expense(or benefit).
Exhibit 17.6 shows the calculation of Lazarillo’s income tax expense in year 1 under deferred taxaccounting (DTA).
Lazarillo’s total tax expense in year 1 under DTA is 3 – in this case, the tax rate (30%) appliedto the company’s accounting profit (10). Of the total expense, 2.1 is tax that is currently payable(current tax expense) and 0.9 is tax that is payable later (deferred tax expense). Lazarillo recordsthe tax deferral of 0.9 as a ‘deferred tax liability’ on its balance sheet.
Lazarillo Company: year 1 income tax expense under taxes payable accounting Exhibit 17.5
Published accounts
Profit before depreciation 15Tax return Accounting depreciation −5
Profit before tax (accounting profit) 10Taxable profit 7Tax currently payable −−2.1 Income tax expense −2.1
Taxed profit 4.9 Net profit 7.9
Published accounts
Profit before depreciation 15Tax return Accounting depreciation −5
Profit before tax (accounting profit) 10
Taxable profit 7Tax currently payable −2.1 Current income tax expense −2.1Taxed profit 4.9 Deferred income tax expense −0.9
Total income tax expense −3
Net profit 7
Lazarillo Company: year 1 income tax expense under deferred tax accountingExhibit 17.6
...
...
...
...
CFA_C17.qxd 11/7/03 2:14 PM Page 538

CHAPTER 17 • ACCOUNTING FOR CORPORATE INCOME TAXES 539
If Lazarillo depreciates the kitchen equipment at a faster rate in its books than in its tax return,accounting depreciation is greater than tax depreciation in year 1. In this case, taxable profit ishigher than accounting profit and Lazarillo prepays part of its tax rather than deferring it. Theprepayment is a deferred tax asset and the future tax impact of the current year’s accountingprofit (a reduction in the company’s future tax liability) is recorded as a deferred tax benefit inthe income statement.
l Deferred tax accounting: balance sheet approachHow does a company calculate deferred tax expense (or benefit) and the related deferred tax liab-ility (asset)? The main method used today is the balance sheet approach.10 Under this approach,the company calculates the deferred tax liability and/or asset at the end of each financial year.This is the key step. To compute these balances, the company first determines the tax values ofits assets and liabilities – taken from the balance sheet in its tax return – and compares them withtheir carrying amounts in the published accounts. The difference between an asset’s (or liab-ility’s) tax value and its carrying amount is known as a temporary difference.
The company then applies the current tax rate to the end-year temporary differences. If it has‘taxable’ temporary differences (i.e. the temporary differences increase future taxes), it recog-nises a deferred tax liability. If it has ‘deductible’ temporary differences (i.e. they reduce futuretaxes), it recognises a deferred tax asset – but only to the extent the tax asset is judged to be recov-erable.11 Deferred tax expense or benefit is the net change in the deferred tax balances over theyear.
Exhibit 17.7 illustrates the balance sheet approach, using our Lazarillo example. The kitchenequipment is the only source of temporary difference between Lazarillo’s tax and published balance sheets at the end of year 1. The asset’s tax value then is 12; its carrying amount is 15.(Recall that tax depreciation is 8, book depreciation 5, in year 1.) As this is a taxable temporarydifference, Lazarillo recognises a deferred tax liability of 0.9 (3 × 30%) in its end-year 1 balancesheet. The tax and book values of the equipment are the same (20) at the start of year 1 so thechange in the deferred tax liability over the year is also 0.9. Thus Lazarillo reports deferred taxexpense of 0.9 in its year 1 income statement.
Deferred tax numbers for later years are computed in the same way. Exhibit 17.8 shows thecalculation of Lazarillo’s deferred tax liability at the end of years 1–4 and the deferred taxexpense it reports in those years. We assume the kitchen equipment remains the only source oftemporary difference during that time.
Note the movement in Lazarillo’s deferred tax liability over the four years. Taxes are post-poned when taxable temporary differences increase in years 1 and 2. When those differencesshrink in years 3 and 4, the deferred taxes become payable. This can be seen in the income state-ment. In years 3 and 4, the current tax charge (the amount currently payable) exceeds the totalcharge – hence the deferred tax expense reverses in those years. By the close of year 4 (the end ofthe equipment’s life), the tax value and carrying amount are the same (0): the deferred taxes withrespect to this asset have been paid.
l Financial statement impact of deferred tax accountingExhibit 17.9 summarises the impact of deferred tax accounting on Lazarillo’s income statementin years 1 to 4.
Lazarillo’s total tax charge reflects the tax impact of annual profits now (current tax expense)and in the future (deferred tax expense). Since those profits are expected to remain constant(10/year) over the four years, the total tax charge is also constant (3/year). However, the composition of total tax expense changes over the period. Thanks to the effect of accelerated
CFA_C17.qxd 11/7/03 2:14 PM Page 539

540 PART 2 • THE HOUSE OF ACCOUNTING
depreciation on taxable profits in the early years of an asset’s life, Lazarillo’s current tax liability(and current tax expense) is low initially but as the tax deduction for depreciation declines, so its tax bill and current tax expense increase.
Each component of tax expense has its counterpart in the balance sheet. We can see the linkbetween income statement and balance sheet from the journal entries Lazarillo makes to recordtax expense in years 1 to 4:
Year1 2 3 4
Dr. Cr. Dr. Cr. Dr. Cr. Dr. Cr.Current tax . . .Expense (OE−) 2.1 2.7 3.3 3.9
Liability (L+) 2.1 2.7 3.3 3.9(later, Cash (A−))
Lazarillo Company: year 1 deferred tax liability/expense under balance sheetapproach
Exhibit 17.7
CFA_C17.qxd 11/7/03 2:14 PM Page 540

CHAPTER 17 • ACCOUNTING FOR CORPORATE INCOME TAXES 541
Assumptionsl Kitchen equipment: cost 20; 4-year life; accounting depreciation 5/year.l Tax depreciation (per year): 8, 6, 4, 2.l Corporate income tax rate 30%
Deferred tax liability and expense in years 1–4Year
[Start-year 1] 1 2 3 4
Balance sheet, end-yearFixed asset (kitchen equipment):Tax value 20 12 6 2 0Carrying amount 20 15 10 5 0Deductible/(Taxable) temporary difference 0 (3) (4) (3) 0
Deferred tax asset/(liability) 0 (0.9) (1.2) (0.9) 0
Income statement for year...Deferred tax expense (−) −0.9 −0.3 +0.3 +0.9[Deferred tax expense reversal (+)]
Lazarillo Company: years 1–4 deferred tax liability/expense under balance sheetapproach
Exhibit 17.8
Assumptionsl Profit before equipment depreciation is 15 each year.l Accounting depreciation 5/year (for four years).l Tax depreciation (per year): 8, 6, 4, 2.l Income tax rate 30%.
Published accounts: summary income statementsYear
1 2 3 4
Profit before equipment depreciation 15 15 15 15Accounting depreciation on equipment −5 −5 −5 −5 Profit before tax 10 10 10 10
Current tax expense* −2.1 −2.7 −3.3 −3.9Deferred tax expense (Exhibit 17.8) −0.9 −0.3 +0.3 +0.9Total tax expense −3.0 −3.0 −3.0 −3.0
Net profit 7 7 7 7
* According to company’s tax return:Profit before equipment depreciation 15 15 15 15Tax depreciation on equipment −8 −6 −4 −2
Taxable profit 7 9 11 13Tax currently payable (at 30%) 2.1 2.7 3.3 3.9(= current tax expense)
Lazarillo Company: impact of deferred tax accounting on profit in years 1–4Exhibit 17.9
CFA_C17.qxd 11/7/03 2:14 PM Page 541

542 PART 2 • THE HOUSE OF ACCOUNTING
1 2 3 4Dr. Cr. Dr. Cr. Dr. Cr. Dr. Cr.
Deferred tax ...Expense (OE−) 0.9 0.3
Liability (L+) 0.9 0.3Liability (L−) 0.3 0.9
Expense (OE+) 0.3 0.9[reversal]
l Advantages of deferred tax accountingFor the investor, deferred tax accounting has undoubted advantages over taxes payable account-ing. It shows on the balance sheet the future tax obligations and benefits of a company. In addition,it sends a clearer signal about the profitability of the company’s business. The accrual accountingprinciples that are used to determine profit are also used to determine the tax cost of that profit. Asa result, after-tax profits are not distorted by the impact of tax concessions or penalties whichaffect the timing of tax payments but not their amount. Lazarillo’s experience demonstrates this.
l Sources of temporary differenceTangible fixed assets are not the only source of temporary difference – although for many com-panies they are the most important one. Exhibit 17.10 sets out the various ways deferred taxassets and liabilities can arise under the balance sheet approach.
A deductible temporary difference arises under the following circumstances.
l The tax value of an asset is greater than its carrying amount. For example, a company makes ageneral provision for bad debts, thereby reducing the carrying amount of its receivables. Thetax authorities only allow a tax deduction for actual bad debts. These are less than the provi-sion in the year.
Deferred tax assets and liabilities: sources of temporary difference by typeExhibit 17.10
CFA_C17.qxd 11/7/03 2:14 PM Page 542

CHAPTER 17 • ACCOUNTING FOR CORPORATE INCOME TAXES 543
l The tax value of a liability is less than its carrying amount. A company with a funded definedbenefit plan reports an accrued pension cost in its published accounts because cumulativepayments to the fund are less than cumulative pension expenses. In the tax accounts, how-ever, there is no pension liability. Cumulative expenses equal cumulative payments becausethe tax authorities only grant a tax deduction for contributions made to the fund.
A taxable temporary difference arises under the following circumstances.
l The tax value of an asset is less than its carrying amount. We’ve seen an example of this already.When a company (like Lazarillo) depreciates equipment in its tax accounts at a faster rate thanin its books, the asset’s tax value is less than its carrying amount.
l The tax value of a liability is greater than its carrying amount. A company issues debt securitiesat a discount. It accounts for the debt at amortised cost. Tax rules, however, require it to meas-ure the debt in the tax accounts at the (higher) face value.
Temporary differences can also arise because of valuation changes. Suppose a company revaluesits tangible fixed assets. This increases their carrying amount but not their tax value, resulting ina temporary difference in the year of revaluation. We discuss the tax effects of revaluations insection 2 of the chapter.
l Permanent differences between accounting and taxable profitTemporary differences are not the only reason for the difference between accounting and tax-able profit. As we mentioned earlier, the difference may be of a continuing nature. For example,certain sources of income may escape tax: government grants may be treated as income forreporting purposes but are usually not subject to tax. Certain expenses may be disallowed for taxpurposes: fines are usually non-deductible and so too, in many countries, are the costs of certaintypes of business entertainment.
What is the impact of permanent differences on a company’s published accounts? Non-deductible expenses increase a firm’s current tax expense and liability; tax-exempt revenuesreduce them. For example, suppose Lazarillo incurs a fine (for sharp culinary practice?) of 1.5 inyear 1. (The expense is already included in pre-depreciation profit of 15.) The fine is not taxdeductible – though Lazarillo books it as an expense. As Exhibit 17.11 shows, this increases itscurrent tax expense and liability by 0.45 (1.5 × 30%) that year.
Permanent differences, even when small in amount, upset the relationship between tax expenseand profit. Without the fine, Lazarillo’s effective tax rate is 30%, the same as the statutory tax
Lazarillo Company: effect of permanent difference on year 1 tax expense and liability Exhibit 17.11
Tax return Published accounts� �
Pre-depreciation profit 15 Pre-depreciation profit 15Tax depreciation −8 Accounting depreciation −5
7 Profit before tax (accounting profit) 10Fine +1.5Taxable profit 8.5 Income tax expense
Tax currently payable 2.55 Current −2.55Deferred −0.9Total −3.45
Net profit 6.55
CFA_C17.qxd 11/7/03 2:14 PM Page 543

544 PART 2 • THE HOUSE OF ACCOUNTING
rate. As a result of the fine, its effective tax rate increases to 34.5% (3.45/10). We look moreclosely at the relationship between statutory and effective tax rates in section 3 of the chapter.
International accounting rules and practice
Regulators have banned taxes payable accounting. National rules in most countries require com-panies to recognise the future tax effect of the current year’s profit or loss. International rules gofurther. Companies following IAS must account for all temporary differences using the balancesheet approach outlined in the previous section. The standard also states that if the tax ratechanges, deferred tax balances must be updated. Under this so-called liability method, com-panies must apply the current (or enacted) tax rate to their taxable and deductible temporary differences and adjust tax expense for the period.12
Although deferred tax accounting is now generally accepted, not all companies follow theinternational standard when applying it. Practice differs from international rules in two mainareas.13 First, companies in some countries (e.g. Germany, Spain) use the income statementapproach to calculate deferred tax expense (or benefit) and the related liability (asset). Underthis approach, deferred tax expense (benefit) arises when a company recognises a revenue or anexpense in different periods for book and tax purposes. These book-tax differences are known astiming differences. Thus, using our earlier example, Lazarillo recognises a depreciation timingdifference of 3 in year 1 – the difference between tax depreciation of 8 and book depreciation of5 that year. This timing difference gives rise to a deferred tax expense of 0.9 (3 × 30%) in year 1.The deferred tax liability (or asset) that Lazarillo reports is the tax effect of cumulative timing dif-ferences at the balance sheet date.
The income statement and balance sheet approaches yield the same deferred tax figures inmany situations. However, the balance sheet approach is more timely: there are differencesbetween book and tax balance sheets that have no immediate income statement impact. Forexample, a revaluation of fixed assets that alters their carrying amounts but not their tax valuesgives rise to a temporary difference but will not be reflected in a timing difference until the re-valued assets are depreciated. Likewise, changes in value of available-for-sale investments maylead to book-tax differences that are recognised earlier under the balance sheet approach.
The second area where practice may differ from international rules concerns the scope ofdeferred tax accounting. IAS require firms to account for all temporary differences (subject tocertain exceptions). This is known as comprehensive DTA. However, in some countries (e.g.Italy), companies practise partial DTA. They do not recognise deferred tax liabilities when thelikelihood of payment is remote. Supporters of partial DTA argue that growing companies can postpone for many years the deferred tax liability attributable to capital expenditures.Depreciation timing differences arising on new fixed assets more than offset reversing timing differences on old ones: as a result, the deferred tax liability increases year by year. Only when a company ceases growing and reduces its fixed assets base – which could be many years in thefuture – will its deferred tax liability decline. Opponents note that partial DTA confuses two separate events: the reversal of timing differences on existing assets which is bound to occur; andoriginating timing differences on future purchases of fixed assets which, for reasons of prudence,should not be anticipated.
The IAS version of deferred tax accounting is gaining ground. Norway and the USA adoptedthe balance sheet approach in the 1990s. The UK, Ireland, Hong Kong and Singapore followedsuit in the early 2000s. All listed companies in the EU will be using the IAS version from 2005.By then, the minor differences that now exist between national and international versions ofDTA – concerning, for example, recognition of deferred tax assets and measurement of long-term deferred tax balances – should have been resolved.
CFA_C17.qxd 11/7/03 2:14 PM Page 544

CHAPTER 17 • ACCOUNTING FOR CORPORATE INCOME TAXES 545
SECTION
2 Deferred tax accounting: extensions
In this section we discuss certain accounting problems that can arise under the balance sheetapproach to deferred tax accounting and describe how IAS deal with them.
Deferred tax assets
l Recognition criteriaAccording to the international standard on income taxes, a company must recognise a deferredtax liability with respect to its taxable temporary differences. However, deductible temporary dif-ferences give rise to a deferred tax asset only if the company expects to have taxable profits in thefuture when the differences reverse. If the company reports losses and under existing tax legisla-tion it is able to carry forward those losses to set against profits of future periods, it may alsoreport a deferred tax asset if it is ‘probable that future taxable profit will be available’ againstwhich to set the loss.14
The asset recognition tests for deductible temporary differences and tax losses carried forwardappear to be similar. In practice, a company is unlikely to recognise a deferred tax asset with respectto tax losses unless it can convince its auditors it is able to recoup the losses. The auditors will be per-suaded if the company:
l has sufficient taxable temporary differences in the same tax jurisdiction which, on reversal,will absorb the losses; or
l can show that the losses are attributable to specific factors (e.g. divestment of a loss-makingactivity) and are therefore unlikely to recur; or
l can create, through tax planning, taxable profits to offset the losses (e.g. via the sale of fixedassets and the realisation of taxable holding gains).
The company and its auditors must reassess the position each balance sheet date. If the prob-ability of recouping the losses decreases, the deferred tax asset is written down and a deferred taxexpense recorded. If, later, the company’s trading position improves and the probability ofrecovery increases, the deferred tax asset is reinstated and a deferred tax benefit is recorded inthe income statement.
l Accounting for tax losses: illustrationWe turn again to our Lazarillo example to illustrate the accounting treatment of tax losses. Wemove forward several years. The profits from the restaurant business have not grown as Lazarillohad hoped and when economic conditions worsen in year 9, the company records a loss. As forits tax position, it has deductible and taxable temporary differences. Deductible differences (theresult of an underfunded pension plan) increase over the three years but taxable differences(attributable mainly to depreciation) fluctuate. Key figures for years 7 to 9 are set out below:
Year7 8 9
Before-tax accounting profit (loss) 11 13 (4)Temporary differences at year-end:
Deductible 10 12 17Taxable 6 5 8
CFA_C17.qxd 11/7/03 2:14 PM Page 545

546 PART 2 • THE HOUSE OF ACCOUNTING
Lazarillo wants to know what are the tax figures the company must report in its year 9 accounts.Exhibit 17.12 shows the calculation of deferred tax balances and total tax expense for that year,under the assumption that the amount and timing of future profits are uncertain.
Our first task (Step 1) is to calculate the company’s tax loss in year 9. The accounting loss of 4 is adjusted for increases in both deductible and taxable temporary differences. The result isa tax loss of 2. We assume the loss can only be carried forward and so no refund of past taxespaid is available. (Comparative figures are given for year 8. The company has taxable income of 16 that year and thus a current tax liability of 4.8.)
The next step (Step 2) is to determine the deferred tax balances at the end of year 9 and thechange in these balances over the year. Normally we would apply the current tax rate to the tax-able and the deductible temporary differences to find the end-year deferred tax liability and assetrespectively. But since doubts exist about Lazarillo’s future profitability, the prudent course ofaction is for the company to recognise a deferred tax asset only up to the amount of the deferred taxliability it reports in year 9. When the taxable temporary differences underlying the deferred taxliability reverse in a future period, they create taxable income against which reversing deductibledifferences can be set. Without them, the deductible differences (including the tax losses carriedforward) cannot be used.
The company has taxable temporary differences of 8 at the end of year 9. Given its uncertainfuture prospects, it should restrict the deductible temporary differences accounted for to a sim-ilar number. As a result, it recognises a deferred tax asset of only 2.4 in its year 9 balance sheet– equivalent to its deferred tax liability then (30% × 8 = 2.4).
The deferred tax expense or benefit which a company records in the annual income statementis the net change in its deferred tax balances over the year. Between the start and end of year 9,Lazarillo’s deferred tax liability increases by 0.9 while its deferred tax asset decreases by 1.2(owing to the restriction on usable deductible temporary differences). The net effect is a deferredtax expense of 2.1 in year 9. Since the company has no current tax expense, this is also the totaltax expense it reports that year (step 3).
Since the company incurs a tax cost in year 9, its reported loss is higher on an after-tax basis:
Year 8 Year 9Partial income statement
...Profit/(loss) before tax 13 (4)Tax expense (3.9) (2.1)Net profit/(loss) 9.1 (6.1)
Lazarillo’s deferred tax asset and liability have identical balances (of 2.4) at the end of year 9.Does this mean it can report a net deferred tax balance of zero that year? The answer is yes if, andonly if, the tax asset and liability relate to taxes levied by the same tax authority.
Note that Lazarillo’s unrecognised deductible temporary differences of 9 (17–8) and its taxloss carryforward of 2 are still available for future use. Their amounts should be disclosed in thenotes to the accounts. If the company’s trading position improves in a subsequent period, thedeferred tax asset can be adjusted to include them.
Up to now we’ve assumed that future profits are uncertain. What if Lazarillo’s year 9 lossesare exceptional and the restaurant is expected to make money again in year 10 and later years?In this event, the restriction on the use of deductible temporary differences would be lifted. Thecompany would account for the tax effect of all its deductible temporary differences (17) and itstax loss carryforward (of 2) at the end of year 9. As a result, it would recognise a deferred tax assetof 5.7 then (19 × 30%), an increase of 2.1 over the end-year 8 asset of 3.6.
Its year 9 income statement would show a tax benefit of 1.2, thereby reducing the accountingloss to 2.8 on an after-tax basis:
CFA_C17.qxd 11/7/03 2:14 PM Page 546

CHAPTER 17 • ACCOUNTING FOR CORPORATE INCOME TAXES 547
FactsLazarillo reports the following earnings and end-year temporary differences (TD) in its years7–9 accounts. The tax rate is 30%. Future profits are uncertain.
Year7 8 9
Before-tax accounting profit (loss) 11 13 (4)Temporary differences (end-year):
Taxable 6 5 8Deductible 10 12 17Restricted deductible 10 12 8
Calculation of tax payable and expense in years 8 and 9
Step 1: Calculate taxable income/(loss c/f)Year 8 Year 9
Before-tax accounting profit (loss) 13 (4)Increase/(decrease) in deductible TD 2 5(Increase)/decrease in taxable TD 1 (3)
Taxable income/(loss carried forward) 16 (2)Current tax payable (at 30%) 4.8 −
Step 2: Calculate end-year DTL/DTA and change during yearYear
7 8 9
End-year deferred tax liability (DTL):Taxable TD ×× 30% 1.8 1.5 2.4(Increase)/decrease in DTL during year 0.3 (0.9)
End-year deferred tax asset (DTA):Restricted deductible TD ×× 30% 3.0 3.6 2.4Increase/(decrease) in DTA during year 0.6 (1.2)
Step 3: Calculate tax expense for yearYear 8 Year 9
Effect on deferred tax expense/benefit of:Change in deferred tax liability 0.3 −0.9Change in deferred tax asset 0.6 −1.2
Deferred tax expense (−) / benefit (+) 0.9 −2.1Current tax expense −4.8 –Total tax expense −−3.9 −−2.1
Lazarillo Company: impact of tax loss carryforward on year 9 accountsExhibit 17.12
CFA_C17.qxd 11/7/03 2:14 PM Page 547
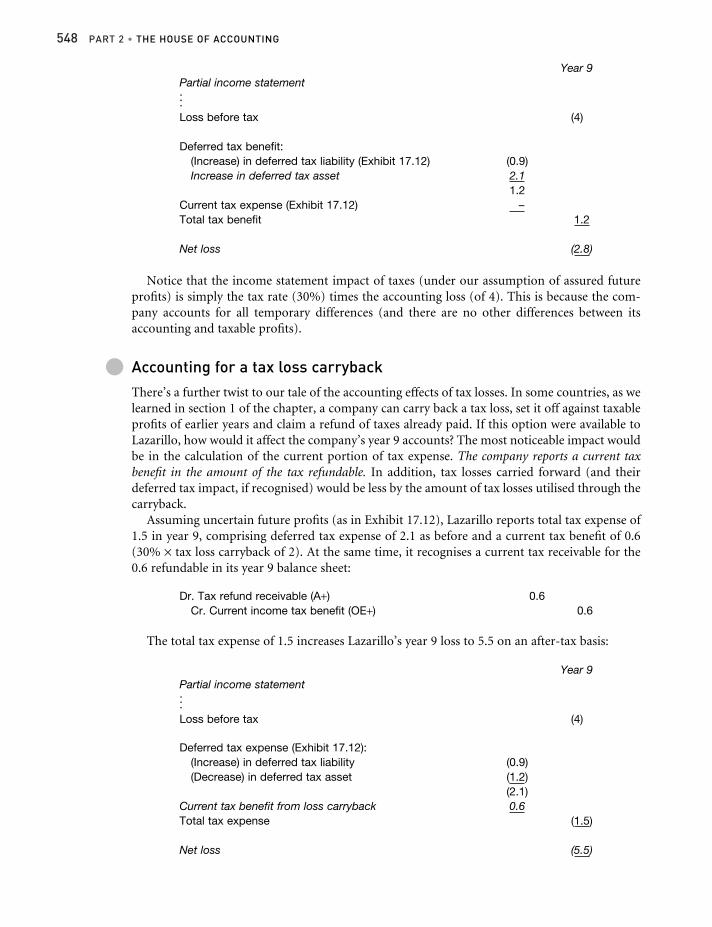
548 PART 2 • THE HOUSE OF ACCOUNTING
Year 9Partial income statement...Loss before tax (4)
Deferred tax benefit:(Increase) in deferred tax liability (Exhibit 17.12) (0.9)Increase in deferred tax asset 2.1
1.2Current tax expense (Exhibit 17.12) –Total tax benefit 1.2
Net loss (2.8)
Notice that the income statement impact of taxes (under our assumption of assured futureprofits) is simply the tax rate (30%) times the accounting loss (of 4). This is because the com-pany accounts for all temporary differences (and there are no other differences between itsaccounting and taxable profits).
l Accounting for a tax loss carrybackThere’s a further twist to our tale of the accounting effects of tax losses. In some countries, as welearned in section 1 of the chapter, a company can carry back a tax loss, set it off against taxableprofits of earlier years and claim a refund of taxes already paid. If this option were available toLazarillo, how would it affect the company’s year 9 accounts? The most noticeable impact wouldbe in the calculation of the current portion of tax expense. The company reports a current taxbenefit in the amount of the tax refundable. In addition, tax losses carried forward (and theirdeferred tax impact, if recognised) would be less by the amount of tax losses utilised through thecarryback.
Assuming uncertain future profits (as in Exhibit 17.12), Lazarillo reports total tax expense of1.5 in year 9, comprising deferred tax expense of 2.1 as before and a current tax benefit of 0.6(30% × tax loss carryback of 2). At the same time, it recognises a current tax receivable for the0.6 refundable in its year 9 balance sheet:
Dr. Tax refund receivable (A+) 0.6Cr. Current income tax benefit (OE+) 0.6
The total tax expense of 1.5 increases Lazarillo’s year 9 loss to 5.5 on an after-tax basis:
Year 9Partial income statement...Loss before tax (4)
Deferred tax expense (Exhibit 17.12):(Increase) in deferred tax liability (0.9)(Decrease) in deferred tax asset (1.2)
(2.1)Current tax benefit from loss carryback 0.6Total tax expense (1.5)
Net loss (5.5)
CFA_C17.qxd 11/7/03 2:14 PM Page 548

CHAPTER 17 • ACCOUNTING FOR CORPORATE INCOME TAXES 549
Carryback of the year 9 tax loss reduces the company’s potential deferred tax asset. It disclosesunrecognised deductible temporary differences of 9 in the notes to its accounts – but, of course,no tax loss carryforwards. Only if past profits in the permitted carryback period are insufficientto absorb this year’s tax losses will the company have tax losses to carry forward.
Tax effects of revaluation and consolidation
l Assets (and liabilities) carried at fair valueAs we saw in earlier chapters, companies in certain European countries are allowed to measureassets at other than historical cost. For example, some Dutch companies value their inventories andfixed assets at replacement cost. Many Irish and UK firms revalue their land and buildings peri-odically. In addition, firms following IAS must carry certain financial investments at fair value.
What effect does an asset (or liability) revaluation have on deferred taxes? The answer is: none– if the tax base of the asset or liability is adjusted at the same time. However, if when the asset orliability is revalued, the tax value remains the same, a temporary difference arises. For example, anupward revaluation of a fixed asset – in the books but not in the tax return – results in a taxabletemporary difference and thus an increase in the firm’s deferred tax liability. The increase invalue is recognised in the books at the time of the revaluation but is not subject to tax until theasset is sold or consumed.
The tax expense figure in the income statement is usually not affected, however. If the revalu-ation is booked direct to reserves, then the related tax effect is charged (or credited) to reservestoo.15 For example, suppose Lazarillo Company revalues land it owns and takes the revaluationsurplus of 100 directly to reserves. If the tax value is unchanged and the tax rate is 30%, Lazarilloaccounts for the increase of 30 in its deferred tax liability as follows:
Dr. Land (A+) 100Cr. Revaluation reserve (OE+) 70Cr. Deferred tax liability (L+) 30
The revaluation reserve increases by the surplus of 100 net of the tax effect of 30.The deferred tax liability is extinguished when the land is sold. For revalued depreciable fixed
assets, the deferred tax liability diminishes each period in which book depreciation – higher as aresult of the revaluation – exceeds tax depreciation.
l Investments in subsidiariesUnder IAS, a company must usually prepare consolidated accounts (in addition to its ownaccounts) when it controls another firm. The consolidated accounts combine the accounts ofparent and subsidiaries. However, the tax authorities may not accept the published consolidatedaccounts as the basis for taxing the companies within the group. One reason is that the tax codeand accounting standards define a group – and thus its assets, liabilities and profits – differently.Another reason is that, under the tax code, only legal entities can be assessed to tax and the groupis not a legal entity. As a result, each company within the group is taxed separately.16
In these circumstances, it is easy to see how book/tax differences can arise. Consider the fol-lowing situations.
Fair value adjustmentsOn acquiring a firm, the parent company restates the assets and liabilities of the new subsidiaryto fair value in the consolidated accounts. The tax values of the subsidiary’s assets and liabilities
CFA_C17.qxd 11/7/03 2:14 PM Page 549

550 PART 2 • THE HOUSE OF ACCOUNTING
(and their carrying amounts in its own accounts) are unchanged. The result? Taxable anddeductible temporary differences arise. The parent recognises a deferred tax liability and asset inthe consolidated accounts.
Goodwill on consolidationThe parent company pays more than fair value for the net assets it acquires. It reports goodwillin the consolidated accounts. If it capitalises goodwill as an intangible asset and there is no corresponding asset in the tax accounts, a taxable temporary difference arises. (It is temporarybecause it disappears when the goodwill is fully amortised or the investment is sold.)
In this case, however, no deferred tax liability is recognised. Accounting regulators argue thatgoodwill is a residual: if a deferred tax liability were recognised, the net assets of the acquiredsubsidiary would decrease and goodwill would increase. For example, suppose a company pays100 for a subsidiary whose net assets have a fair value of 60. It recognises goodwill of 40 in theconsolidated accounts. If it recognises a deferred tax liability with respect to the goodwill of, say,12 (tax rate of 30% × 40), the subsidiary’s net assets in the consolidated accounts fall to 48 andgoodwill increases to 52. No deferred tax asset is recognised with respect to negative goodwill forthe same reason.17
Intragroup transactionsTransactions between parent and subsidiaries are accounted for differently in the consolidatedaccounts and in the tax accounts of the separate companies. For example, profits on intercom-pany transactions are eliminated in the former but not in the latter. Probably the most import-ant difference lies in the treatment of a subsidiary’s profits. The parent company’s share of theseprofits is included in consolidated profit. In the tax accounts of the parent company, however,only the profits distributed by the subsidiary are captured in the taxable profit of the parent. Thusthe parent company’s share of the undistributed profits of its subsidiaries represents a taxable tem-porary difference in the consolidated accounts.
In groups where most of the profits of subsidiaries are reinvested, the potential deferred taxliability may be huge. It is, however, potential: the liability only becomes payable if the subsidiarystarts to distribute its retained earnings. So long as the parent company can control when a sub-sidiary distributes its profits and it’s probable such profits will not be distributed in the foresee-able future (and thus the taxable temporary difference won’t reverse), it should not recognise adeferred tax liability for them in the consolidated accounts. (It must disclose in the notes theamount of any unrecognised liability, however.)
Measurement issues
l Effect of a change in the tax rateWhen temporary book-tax differences arise, a company measures the deferred tax effect byapplying the prevailing tax rate to those differences. But what happens when the tax ratechanges? Does the company continue to value the temporary differences at the historical tax rate(the deferred method) or does it revalue them using the current tax rate (the liability method)?
Virtually all companies now use the liability method and IAS require it. Under the interna-tional standard, a company must measure its deferred tax asset and liability at the tax rate thatis expected to apply when the asset is realised and the liability settled. (The rate must have beenenacted or substantially enacted by the balance sheet date.) Thus, if the tax rate changes, thecompany adjusts its deferred tax balances by applying the new tax rate to its deductible and tax-able temporary differences. The net adjustment to deferred tax balances is shown as an increaseor decrease in its tax expense for the year.
CFA_C17.qxd 11/7/03 2:14 PM Page 550

CHAPTER 17 • ACCOUNTING FOR CORPORATE INCOME TAXES 551
We illustrate the effect of a tax rate change using our Lazarillo example. Suppose that at thestart of year 8 the government enacts legislation under which the tax rate increases from 30% to35%. Exhibit 17.13 shows the calculation of Lazarillo Company’s tax expense and end-yeardeferred tax balances for year 8.
FactsLazarillo reports before-tax accounting profit of 13 in year 8. Temporary differences (TD) at theend of years 7 and 8 are as follows:
Year 7 Year 8
Taxable temporary differences 6 5Deductible temporary differences 10 12
The tax rate in year 7 is 30%. At the start of year 8, it increases to 35%.
Calculation of tax payable and expense in year 8l Current tax liability in year 8
Before-tax accounting profit 13Decrease in taxable temporary differences +1Increase in deductible differences +2
Taxable profit 16Current tax payable at 35% 5.6
l End-year DTL/DTA and change during yearEnd-year 7 Start-year 8 End-year 8
Taxable TD 6 6 5Tax rate 30% 35% 35%
Deferred tax liability (DTL) 1.8 2.1 1.75
Change in DTL +0.3 −0.35attributable to: Change in Decrease in
tax rate taxable TD
Deductible TD 10 10 12Tax rate 30% 35% 35%
Deferred tax asset (DTA) 3.0 3.5 4.2
Change in DTA +0.5 +0.7attributable to: Change in Increase in
tax rate deductible TD
l Tax expense in year 8Year 8
Effect on deferred tax expense (−) or benefit (+) of:Decrease in taxable TD 0.35Increase in deductible TD 0.7Change in tax rate [increase in DTA, less increase in DTL] 0.2
Deferred tax benefit 1.25Current tax expense −5.60Total tax expense −4.35
Lazarillo Company: impact of increase in tax rate on year 8 accountsExhibit 17.13
CFA_C17.qxd 11/7/03 2:14 PM Page 551

552 PART 2 • THE HOUSE OF ACCOUNTING
SECTION
3
Lazarillo must first adjust the deferred tax asset and liability at the start of year 8. Applying a higher tax rate to temporary differences, whether deductible or taxable, increases the deferred tax balances. In this case, the increase in deferred tax asset (0.5) outweighs the increasein deferred tax liability (0.3), so a deferred tax benefit of 0.2 flows into the year 8 income statement.
The remaining calculations are similar to those shown in Exhibit 17.12. The new tax rate isapplied to the end-year 8 temporary differences to give the deferred tax asset (4.2) and liability(1.75) then. Comparing these figures with the amended start-year 8 balances, we find that thedeferred tax asset has increased by 0.7 and the deferred tax liability has decreased by 0.35. Thetotal deferred tax benefit (including the effect of the tax rate change) is 1.25.
The new rate is also applied to year 8 taxable profits in order to compute the current taxexpense and liability. Total tax expense is the sum of current tax expense and deferred taxbenefit. Not surprisingly, the higher tax rate increases Lazarillo’s total tax expense (from 3.9 to4.35). In this case, however, the increase in deferred tax benefit offsets in part the higher currenttax expense.
In sum, a change in the tax rate alters not just the company’s current liability but also thevalue of any deferred tax asset or liability. The company recognises the change in value of thisfuture tax benefit or obligation immediately in the tax charge and discloses the amount, if mater-ial, in the notes.
l Discounting
In some countries (e.g. the Netherlands, UK), companies are allowed under national accountingrules to discount their deferred tax balances. It’s claimed that when a temporary differencereverses affects its current value: the greater the time to reversal, the lower is the value today ofthe future tax effect. The impact of discounting is especially significant for companies with largeamounts of long-lived depreciable fixed assets.
International accounting standards forbid the discounting of deferred tax assets and liabilities(so, too, do US standards). IAS 12 justifies the decision on practical grounds. Discountingrequires ‘detailed scheduling of the reversal of each temporary difference’, a task that is con-sidered too burdensome for a company to perform each financial period. Discounting has also been questioned on conceptual grounds. It’s argued that the fair value of a deferred tax assetor liability is independent of when the underlying temporary difference will reverse (seeBox 17.1).
Corporate income taxes and financial analysis
Income taxes are a cost all profitable companies bear. As with any cost, managers try to minimiseit. Investors check the accounts to see how successful they have been. Here are some tax-relatednumbers they pay special attention to.
l Taxes paid
Knowing how much a company has paid in income taxes in the year is useful in building up apicture of its annual cash flow. A company that publishes a cash flow statement usually disclosespayments (or refunds) of taxes in the year, either in the statement itself or in the notes.
CFA_C17.qxd 11/7/03 2:14 PM Page 552

CHAPTER 17 • ACCOUNTING FOR CORPORATE INCOME TAXES 553
Some companies do not disclose tax payments in the year. In these cases, investors must estimatethe figure. This involves adjusting income tax expense for changes in tax liabilities and assets:
Increase (++ decrease) Increase (++ decrease)Taxes paid == Tax expense −−
in current tax liability −−
in deferred tax liability
(The signs are reversed for changes in current and deferred tax assets.)
Fair valuation of deferred tax assets and liabilitiesBOX17.1
Firms measure their deferred tax assets and liabilities by applying the current tax rate todeductible and taxable temporary differences. But what do the resulting deferred tax figuresmean? Do they represent the fair values of those tax assets and liabilities? And if not, how arethey to be adjusted to fair value?
Guenther and Sansing investigate the impact of deferred tax balances on a firm’s value. Afirm’s value is, according to the standard finance model, the present value of its expectedfuture cash flows. The latter must be expressed in after-tax terms. Using an analytical model,Guenther and Sansing show that, where there are book-tax differences, an adjustment to cashflows must be made, based on the fair value of the resulting deferred tax assets and liabilities.
The reported amounts of deferred tax assets (DTA) and liabilities (DTL) rarely equal theirfair values. One situation where they do is when the underlying asset or liability is stated at fairvalue in the company’s books but its tax value is zero. For example, suppose an oil companymakes a provision for the abandonment of an oil field and measures it in its books at the pre-sent value of future outlays – say, 100. Assume, too, that the tax authorities only allow a taxdeduction for payments made when the field is abandoned (i.e. at the end of its life): thus thetax value at the time the provision is made is 0. The deductible temporary difference then is100 and, at, say, a 30% tax rate, the deferred tax asset is 30. In this case, the reported amountof the DTA is equal to its fair value.
Usually, however, the underlying asset or liability is not stated in the books at fair value (e.g.undiscounted provisions such as a provision for warranties) or its tax value is not zero (e.g.depreciable fixed assets). Where the asset has a positive tax value or the liability’s book valueis greater than its fair value, the fair value of the related DTL or DTA is less than the recordedamount (i.e. its book value). Guenther and Sansing show that, in the case of depreciable fixedassets valued at replacement cost, the adjustment coefficient is [d / (d + r)] where d is the taxdepreciation rate and r is the cost of capital. Thus DTLFV = DTLBV [d / (d + r)].
Guenther and Sansing’s second finding (which follows from their first) has significant policy implications. They show that the value of the firm is not affected by when temporarydifferences are expected to reverse. They use depreciable fixed assets to illustrate their finding.To delay reversal of depreciation temporary differences, a company must purchase new depre-ciable assets. If all new assets are zero net present value investments (a standard assumptionwhere markets are competitive), buying a new one cannot increase the firm’s value. Since thefirm’s value is insensitive to the reinvestment decision – it either reinvests and pays less in divid-ends or doesn’t reinvest and pays more in dividends – it follows that the associated deferredtax liability has no valuation impact. Thus although reinvestment delays the reversal of tem-porary differences and postpones the payment of tax, the shareholders are not better off as thepresent value of those tax savings is captured in the price of the new asset. Guenther andSansing conclude that requiring firms to discount DTA and DTL based on the expected timeto reversal of temporary differences is not justified.18
CFA_C17.qxd 11/7/03 2:14 PM Page 553

554 PART 2 • THE HOUSE OF ACCOUNTING
l Effective tax rateThe effective tax rate is a corporate statistic which investors monitor.19 It shows the company’sincome tax expense as a proportion of its accounting profit:
Effective tax rate ==
Tax expense is a better guide to the tax cost – in current and future years – of a firm’s profitsthan the taxes it pays in the year. To discover how successful managers have been in loweringthis cost, investors often compare a firm’s effective tax rate with the statutory tax rate in itshome country – or, in the case of a multinational, with the weighted average of the statutory taxrates in the countries in which it operates.
Why do effective and statutory rates diverge? Here are some of the main reasons:
l Permanent differences. As we saw earlier, some differences between taxable and accountingprofits are permanent in nature. Certain expenses recognised in the books may not be tax-deductible. Certain revenues may be exempt from tax. Where permanent differences arise, theeffective tax rate can never be the same as the statutory rate.
l Income taxed at other than the statutory income tax rate. In some countries, companies paylocal (state, city) as well as national income tax. In addition, a capital gain (the excess of thesale price of a fixed asset over its original cost) may be taxed at a lower rate than operatingprofit. A company’s effective tax rate will be lower than the statutory income tax rate when itrealises capital gains in the year.
l Investment and other tax credits. A tax credit results in a direct reduction of a company’s taxliability. For example, the government may allow a firm to claim a 5% tax credit when itinvests in certain types of plant and equipment. This means a firm can reduce its tax liabilityby 5% of the cost of qualifying plant and equipment it buys that year. The purpose of such a scheme is to encourage investment by reducing its after-tax cost. Governments offer taxcredits for regional investment, spending on research and development, and other economicactivities they wish to promote. Note that a tax credit is more valuable to a company than atax deduction: the latter only reduces the tax liability by the tax rate times the amount of thededuction.
In accounting for a tax credit, a company can reduce tax expense for the year by the wholeamount of the credit (the flow-through method). Alternatively, it can amortise the credit –to tax expense – over the life of the related asset (the deferral method). In both cases, theeffective tax rate is lower in the year the credit is taken but is lowest under the flow-throughmethod. Regardless of the method of accounting used, the tax the company pays in the year thecredit is received is reduced by the full amount of the credit. A company may be able to carry forward (or back) an unused credit (e.g. where the credit available exceeds the tax liability forthe year).
l Unrecognised deferred tax asset. As we saw in section 2 of the chapter, a company is notallowed to recognise a deferred tax asset for deductible temporary differences or tax losses carried forward if there is doubt about whether it will recover the asset. As a result, the effect-ive tax rate will be higher in the period when such differences or losses arise (and are notrecognised) and lower in the period when they are used. Similarly, a write-off of an existingdeferred tax asset increases the effective tax rate.
For companies that account for deferred taxes on a partial basis (i.e. that recognise only thosetiming differences which will crystallise as a tax liability or asset in the near future), unrecognisedtiming differences are a further reason for a difference between statutory and effective tax rates.Since depreciation is usually the main source of unrecognised timing difference, the effective
Income tax expense
Profit before tax ( 100)××
CFA_C17.qxd 11/7/03 2:14 PM Page 554

CHAPTER 17 • ACCOUNTING FOR CORPORATE INCOME TAXES 555
[A] Effective tax rate calculation
In euro million 2001 2000
Profit from ordinary activities (before tax) [A] 3,242 2,032Average German statutory tax rate 38.9% 52%
Expected tax expense 1,261 1,057Variations due to different tax rates −−94 −348Tax effects of non-deductible expenses 82 104Tax payments (+) / refunds (−) relating to prior periods 24 −22Other variances(mainly write-downs on deferred tax assets) 103 32
Actual tax expense* [B] 1,376 823Effective tax rate [B]/[A] 42.4% 40.5%
* Of which: Current tax 678 425Deferred tax 698 398
[B] Deferred tax disclosures...Deferred tax assets and liabilities at 31 December were attributable to the following positions:
In euro million Deferred tax Deferred taxassets liabilities
2001 2000 2001 2000
Intangible assets and property, plant and equipment 1,464 1,082 3,859 3,651Financial assets 27 109 52 95Current assets 1,555 719 2,755 1,388Tax loss carry forwards 2,263 2,502 – –Provisions 1,213 1,121 536 177Liabilities 2,395 2,011 433 364Consolidations 942 1,018 98 149
9,859 8,562 7,733 5,824Write-downs −−1,641 −1,474 – –Netting −−7,393 −5,625 −−7,393 −5,625
Total 825 1,463 340 199
The carrying value of deferred tax assets is reduced when recoverability is uncertain. Indetermining the level of the write-down, all positive and negative factors concerning the likelyexistence of sufficient taxable profit in the future are taken into account. These estimates canchange depending on the actual course of events. Write-downs include A425 million (2000:A383 million) relating to tax loss carry forwards and A523 million (2000: A539 million) on losseson disposals . . . in Great Britain, which can only be set off against capital gains, but notagainst trading profits. In addition, there is a write-down of A653 million (2000: A552 million) on capital allowances [tax depreciation] in Great Britain, which are shown above in intangibleassets and property, plant and equipment, and a write-down of A40 million (2000: 0) onconsolidations.
BMW Group: effective tax rate and deferred tax disclosures in 2001 accountsExhibit 17.14
(Source: BMW Group, Annual Report and Accounts 2001.)
CFA_C17.qxd 11/7/03 2:14 PM Page 555

tax rate of a firm using partial deferred tax accounting is likely to be lower than the rate it wouldreport under full deferred tax accounting.
We illustrate some of these points using BMW Group’s 2001 accounts. Section A of Exhibit 17.14 shows the calculation of the German vehicle manufacturer’s effective tax rate in2000 and 2001. Firms like BMW that follow IAS have to provide a reconciliation of their actualand expected tax expense (or a reconciliation of their effective and (weighted average) statutorytax rates) in their accounts.
BMW’s effective tax rate rose slightly between 2000 and 2001, despite a decline in its averageGerman corporate tax rate which, on a combined federal and local basis, fell from 52% to 38.9%.The main reason for the 1.9% increase in the effective rate is the write-down of deferred taxassets in 2001: management judged that certain tax losses could no longer be used. Note that thefall in tax rates in Germany narrowed the differential between BMW’s German and foreign taxrates, reducing the benefit to tax expense from 348 to 94 (million euros).
l Composition of tax expense and deferred tax balancesInvestors find a breakdown of total tax expense helpful. Most firms distinguish current fromdeferred tax expense. Using the ‘current tax expense’ figure, investors can estimate the com-pany’s taxable profit for the year and thus the taxes it has paid or will shortly have to pay on that profit. If the deferred component of tax expense is large, total tax expense is a poor guide to a firm’s current tax bill.
Multinational firms often show separately tax expense relating to domestic and foreign opera-tions. By dividing domestic tax expense by the domestic tax rate, investors can estimate the profitearned from domestic operations and, by extension, from foreign operations. This is especiallyhelpful if a firm provides a geographical breakdown of sales but not of profits as domestic andforeign profit margins can then be computed.
Some companies provide, in addition, an analysis of deferred tax expense and deferred taxbalances. Again, this can yield useful information. Some temporary differences, like depreci-ation, reduce a firm’s current tax liability for many years. As the firm expands and its fixed assetbase grows, so the deferred tax liability with respect to depreciation grows too: new depreciationdifferences more than offset old reversing ones. Other temporary differences – such as thoserelating to provisions for restructuring costs – may be short term in nature. The higher tax liability in the year the provision is made is followed by a lower liability the next year as the company makes payments against the provision and obtains a tax deduction for them. Thusinformation about the source of temporary differences (e.g. depreciation, restructuring costs)helps investors predict a firm’s future tax payments.
A company following IAS must disclose the components of tax expense and provide an analysis of its deferred tax assets and liabilities. It must also state the temporary differences forwhich no deferred tax asset or liability is recognised. These include deductible temporary differ-ences (and unused tax losses and credits) where it’s uncertain whether future profits will beavailable to utilise them and taxable temporary differences attributable to undistributed (andreinvested) profits of foreign subsidiaries.
BMW Group’s 2001 accounts illustrate the tax disclosures required under IAS. The companybreaks down tax expense into its current and deferred components and analyses its deferred taxbalances at year-end (see section B of Exhibit 17.14). Where deferred tax assets and liabilitiesarise in the same tax jurisdiction, they’re netted. BMW’s accounts reveal a sharp increase in net-ting between 2000 and 2001, with the result that it reports a net asset of only a825 million and a net liability of only a340 million on its end-2001 consolidated balance sheet. ‘Write-downs’(also known as valuation allowance) also increased in 2001. These represent the tax effect ofdeductible temporary differences or tax loss carry forwards that the company reckons it won’t
556 PART 2 • THE HOUSE OF ACCOUNTING
CFA_C17.qxd 11/7/03 2:14 PM Page 556

CHAPTER 17 • ACCOUNTING FOR CORPORATE INCOME TAXES 557
be able to utilise in the future. In BMW’s case, over a1 billion of these write-downs relate tolosses sustained on the disposal of its Rover car business in 2000 and its inability to set them offagainst profits and gains from its other UK operations.
BMW’s tax disclosures are incomplete. Investors want to know more about the sources of itsdeferred tax assets and liabilities. For example, the tax assets and liabilities relating to ‘current assets’amounted to a1.55 billion and a2.75 billion at end-2001. Which current assets are responsiblefor these deferred tax balances? Inventories? Receivables? And BMW doesn’t reconcile the declineof a779 million in the net deferred tax asset in 2001 – from a1,264 million (1,463 − 199) to a485million (825 − 340) – to the deferred tax expense of a698 million it reports on its 2001 incomestatement: what’s the missing a81 million (779 − 698) attributable to? In addition, it provides noreconciliation of current tax expense, tax paid and current tax balances, as some companies do.
A word of warning. One consequence of new international rules is that companies have morediscretion over the tax expense figure they report. A deferred tax asset can be recognised withrespect to deductible temporary differences and tax losses carried forward only if managementconsider it probable that profits will be available in the future (in the same tax jurisdiction).Without future profits, the company cannot recover the tax asset. A company whose managers areoptimistic about its future prospects is more likely to recognise deductible differences and tax losses asa deferred tax asset. As a result, its tax expense will be lower and its after-tax profit higher than thosereported by its more conservative rivals.
Summary
The income tax a company pays is determined by the income it earns and the tax treatment ofthat income. Each country has its own tax code which spells out how the income of companiesresident there is taxed. The tax code lays down, among other things, tax rates, definitions of tax-able revenues and tax-deductible expenses, the treatment of losses and dividends, and the typeand amount of tax concessions (such as tax credits) available to firms. Attempts to harmonisethe codes of EU member states have not been successful so far.
Companies recognise, as an expense, the tax cost, now and in the future, of profits earned inthe period. Where there are no differences between accounting and taxable profits, the tax costis equal to the tax currently payable on the period’s profits. Such equality is rare. In practice,book-tax differences arise. In some cases the differences are permanent: certain book revenuesare not taxable; certain book expenses are not deductible. Of greater significance are temporarydifferences, that is, differences in the tax and book values of assets and liabilities. Temporary dif-ferences are the source of deferred tax balances. When temporary differences result in a post-ponement of taxes, the company reports a deferred tax liability. When they cause taxes to be paidearly, it reports a deferred tax asset. The company recognises in tax expense the change in itsdeferred tax assets and liabilities.
Deferred tax accounting is complicated by the fact that companies determine deferred tax bal-ances in different ways. Most account for all temporary differences between tax and book profit(comprehensive DTA) and value them at the current tax rate (liability method). However, somefirms calculate deferred taxes by reference to revenue and expense timing differences. And thereis variation in the way companies recognise the deferred tax benefits of tax loss carryforwards.As a result, the calculation of tax expense – and by extension post-tax profitability – may not becomparable across firms.
Quoted firms are disclosing more information in their consolidated accounts about their taxsituation. Increasingly, investors are told how much tax the company paid in the period, why its effective tax rate differs from the statutory rate and what the reasons are for its deferred taxbalances.
CFA_C17.qxd 11/7/03 2:14 PM Page 557

558 PART 2 • THE HOUSE OF ACCOUNTING
Problem assignments
P17.1 Calculation of taxable profitFremskridt Company reports before-tax profit of 750 in its x9 published accounts. (All amounts are inthousands.) This amount is arrived at after charging depreciation of 1,500, bad debt expense of 60and entertainment costs of 25. Under the tax code of Norseland, Fremskridt’s home country, theseamounts must be adjusted in calculating taxable profit. Tax depreciation in x9 is 1,200, the deductionfor bad debts is restricted to the actual debts written off in the year of 27 and only 8 of the entertain-ment costs is deductible. Norseland’s corporate income tax rate is 30%.
Required
(a) Calculate Fremskridt Company’s taxable profit and income tax liability in x9.
(b) Fremskridt’s management want to know the impact on the company of each of the following situ-ations. Recalculate the company’s taxable profit and tax liability for x9 in each case. Each case isindependent. (Amounts are in 000.)(i) Fremskridt receives a cash dividend of 56 from a (domestic) subsidiary. The dividend carries
a tax credit of 24 (i.e. 3/7 of the dividend distributed). The dividend and related tax credit are notincluded in the company’s before-tax profit of 750. Norseland has an imputation tax system.
(ii) Fremskridt’s before-tax profit of 750 is after deducting 240 that the company spent onresearch in x9. Under Norseland’s tax code, Fremskridt can claim a tax credit of 20% againstits income tax liability for research costs incurred in the year.
(iii) Fremskridt can claim an investment deduction of 9% on investments in qualifying fixed assetsin the year. (Certain investments, e.g. those in land, securities, goodwill, licences, concessions,do not qualify for the deduction.) Qualifying investments amount to 1,000 in x9. The invest-ment deduction does not affect the depreciable base of the assets.
P17.2 Deferred tax accounting: taxable temporary differences IColumbara is a textile producer with a reputation for very fast production and delivery of goods. Theproblem is that labelling of finished items is poor, which leads to customer frustration. The existinglabels become detached from garments and customers can’t remember the company’s name. Toremedy this, Columbara buys special labelling equipment at the start of x5. The equipment costs 120,has a four-year life and the expected salvage value is zero. For accounting purposes, the equipmentis depreciated on a straight-line basis (with a full year’s depreciation in the first year). It qualifies foraccelerated depreciation under the tax code: the annual depreciation deduction over the four yearsis 48, 36, 24, 12.
Columbara expects profit before depreciation and tax to be 90 each year over the next four years.The current tax rate is 35%. The company takes a balance sheet approach when accounting fordeferred taxes. It accounts for all temporary differences between book and taxable income. It expectsno other book/tax differences in those years.
Required
(a) What is Columbara’s expected income tax liability each year in the four years x5–x8, given theabove facts?
(b) What is the annual income tax expense and net profit it expects to report in its published accounts between x5 and x8? What is the deferred tax liability or asset it expects to report in its balance sheet at the end of each of those years?
Check figure:(b) Deferred tax expense, x6 2.1
CFA_C17.qxd 11/7/03 2:14 PM Page 558

CHAPTER 17 • ACCOUNTING FOR CORPORATE INCOME TAXES 559
P17.3 Deferred tax accounting: taxable temporary differences II
Refer to P17.2. Columbara is so pleased with the special labelling equipment it purchased in x5 thatit decides to buy an additional machine each year until it has a stock of four. Each machine isexpected to cost 120 and will be depreciated – for book and tax purposes – in the same way as thex5 purchase. Profit (before depreciation and tax) was 100 in x5. It is expected to grow by 30 a yearuntil x8 and then remain at 190 in x9. The tax rate is 35% in x5 and is expected to stay at this levelthrough x9.
Required
(a) Calculate Columbara’s income tax payable, income tax expense and deferred tax liability or assetfor each of the five years, x5–x9.
(b) An investor looks at your calculations and remarks:
‘What the Columbara figures for x8 and x9 show is that when a company has stable earnings, mostif not all of its total tax expense is current. Originating temporary differences on new assets and liab-ilities offset reversing temporary differences on old ones so that the company’s deferred tax asset orliability shows little change and its deferred tax expense is zero or close to zero.’
Comment on these observations. Under what conditions is the deferred component of tax expense‘zero or close to zero’? Do these conditions only apply when earnings are stable?
Check figure:(a) Taxable profit, x7 52
P17.4 Deferred tax accounting: comprehensive example
Tyr Company designs and manufactures military hardware. It has asked you to calculate its incometax expense for x3 and its current and deferred taxes at the end of that year.
Its provisional x3 accounts (with the exception of the tax and tax-related figures) are set out inExhibit 17.15. Comparative end-x2 balance sheet numbers are also given.
On enquiry, you learn the following (all amounts are in millions):
l Plant and equipment. The depreciation rate is 20% SL in the books and 25% SL for tax purposes.The accumulated tax depreciation at the end of x2 is 50. The company purchases plant of 150 inx3. It records a full year’s depreciation in the year of purchase.
l Bribes. The tax authorities have disallowed expenditures of 5 which the company describes in itsaccounts as ‘Foreign sales commissions’.
l Pension cost. Under a new scheme, the company records pension expense of 14 and makes con-tributions to the plan of 11.5. Only pension contributions are tax deductible.
l Bad debts. The company makes a general provision for bad debts of 3 at the end of x3. Only baddebt write-offs are tax deductible. There are no bad debt write-offs in x3.
The tax rate is 40%. The company makes tax payments of 15 in x3. The company takes a balancesheet approach when accounting for deferred taxes and accounts for all temporary differences.Assume that deductible and taxable temporary differences arise in different tax jurisdictions.
Required
Complete Tyr’s x3 accounts in Exhibit 17.15. Calculate income tax expense and deferred tax bal-ances using the balance sheet approach.
Check figure:Total assets, end-x3 279.2
CFA_C17.qxd 11/7/03 2:14 PM Page 559

560 PART 2 • THE HOUSE OF ACCOUNTING
P17.5 Income taxes: analysis of disclosures ISandvik is a large engineering company with headquarters in Sweden. Its high-speed steel tools andmining equipment have a high reputation. Only 5% of its 2001 sales of SEK 48.9 billion (A5.3 billion)and one-third of its production that year were in its home market. Group profit before tax was SEK5.6 billion in 2001 (2000: SEK 5.8 billion). Reported tax expense of SEK 1.7 billion in 2001 was brokendown in the accounts as follows (negative sign indicates expense or debit):
In SEK million 2001 2000Current taxes −1,555 −1,662Adjustment of taxes attributable to prior years 103 −71Total current tax expense −1,452 −1,733Deferred tax expense −241 −137Taxes on participation in associated companies −19 −11Total reported tax expense −1,712 −1,881
In common with other Swedish multinationals, Sandvik provides detailed information about its current and deferred taxes in its consolidated accounts. (The company follows Swedish GAAP whichis similar to IAS in this area.) Exhibit 17.16 contains extracts from the tax note in the consolidatedaccounts.
Tyr CompanyProvisional x3 accounts
(amounts in millions)
Income statement for x3Sales revenue 300Less:Cost of goods sold
(including depreciation of 50) −160Gross profit 140Less:Selling and administrative expenses −80Profit before tax 60Less: Income tax expense
Current ?Deferred ?Total ?
Profit after tax ?Less:Dividend −10Retained profit for year ?
Balance sheets at end of x2 and x3
x2 x3 x2 x3Assets EquitiesPlant and equipment 100 250 Share capital 90 90–Accumulated depreciation −40 −90 Retained profit 30 ?Plant and equipment, at Shareholders’ equity 120 ?
net book value 60 160 Deferred tax liability 4 ?Accounts receivable 40 37 Pension provision 0 2.5Deferred tax asset 0 ? Income tax payable 16 ?Other assets 70 80 Other liabilities 30 99.5
Total 170 ? Total 170 ?
Exhibit 17.15
CFA_C17.qxd 11/7/03 2:14 PM Page 560
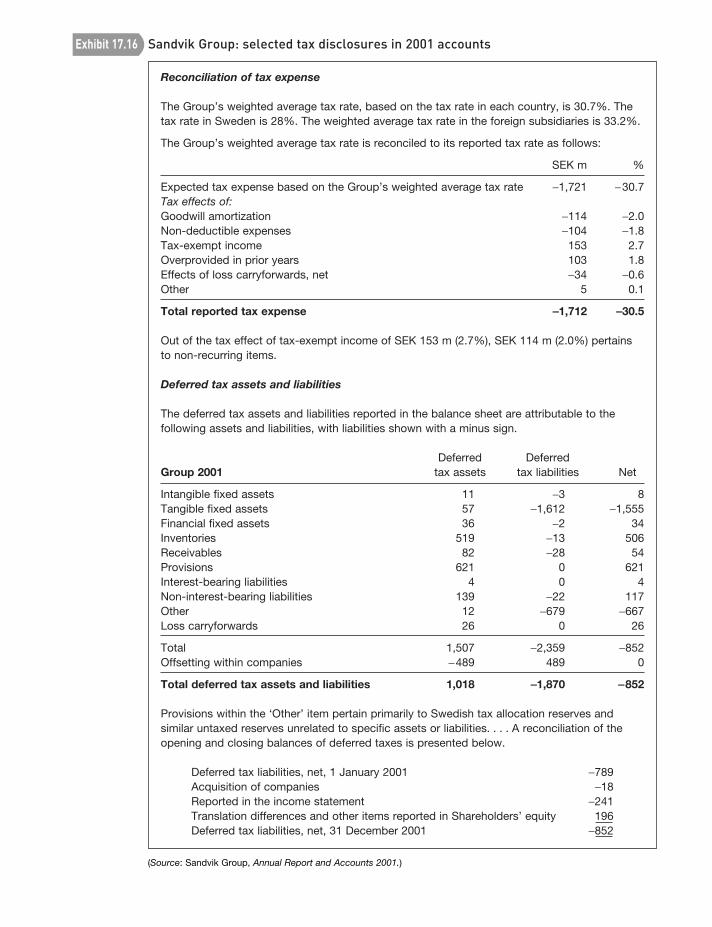
Reconciliation of tax expense
The Group’s weighted average tax rate, based on the tax rate in each country, is 30.7%. Thetax rate in Sweden is 28%. The weighted average tax rate in the foreign subsidiaries is 33.2%.
The Group’s weighted average tax rate is reconciled to its reported tax rate as follows:
SEK m %
Expected tax expense based on the Group’s weighted average tax rate −1,721 −30.7Tax effects of:Goodwill amortization −114 −2.0Non-deductible expenses −104 −1.8Tax-exempt income 153 2.7Overprovided in prior years 103 1.8Effects of loss carryforwards, net −34 −0.6Other 5 0.1
Total reported tax expense −−1,712 −−30.5
Out of the tax effect of tax-exempt income of SEK 153 m (2.7%), SEK 114 m (2.0%) pertainsto non-recurring items.
Deferred tax assets and liabilities
The deferred tax assets and liabilities reported in the balance sheet are attributable to thefollowing assets and liabilities, with liabilities shown with a minus sign.
Deferred DeferredGroup 2001 tax assets tax liabilities Net
Intangible fixed assets 11 −3 8Tangible fixed assets 57 −1,612 −1,555Financial fixed assets 36 −2 34Inventories 519 −13 506Receivables 82 −28 54Provisions 621 0 621Interest-bearing liabilities 4 0 4Non-interest-bearing liabilities 139 −22 117Other 12 −679 −667Loss carryforwards 26 0 26
Total 1,507 −2,359 −852Offsetting within companies −489 489 0
Total deferred tax assets and liabilities 1,018 −−1,870 −−852
Provisions within the ‘Other’ item pertain primarily to Swedish tax allocation reserves andsimilar untaxed reserves unrelated to specific assets or liabilities. . . . A reconciliation of theopening and closing balances of deferred taxes is presented below.
Deferred tax liabilities, net, 1 January 2001 −789Acquisition of companies −18Reported in the income statement −241Translation differences and other items reported in Shareholders’ equity 196Deferred tax liabilities, net, 31 December 2001 −852
Sandvik Group: selected tax disclosures in 2001 accountsExhibit 17.16
(Source: Sandvik Group, Annual Report and Accounts 2001.)
CFA_C17.qxd 11/7/03 2:14 PM Page 561

562 PART 2 • THE HOUSE OF ACCOUNTING
Required
(a) Investors use information in the analysis of a company’s effective tax rate to forecast tax expense– and therefore profits – in future years. With the information Sandvik provides, it’s possible toidentify the recurring elements in the group’s effective tax rate. Assuming Sandvik’s weightedaverage (statutory) tax rate remains at 30.7%, estimate its effective tax rate for 2002. State anyassumptions you have made.
(b) Sandvik reports a net deferred tax liability of SEK 852 million in its end-2001 consolidated balancesheet. There are four main sources of temporary difference. In addition to ‘Other’ (for whichSandvik provides an explanation), they are:(i) tangible fixed assets;(ii) inventories;(iii) provisions.
Suggest an explanation for each of these three major sources of temporary difference (taxable inthe case of tangible fixed assets, deductible in the case of inventories and provisions). Note thatthe company values its inventories in its published accounts at the lower of FIFO cost or market,an acceptable method of valuation for tax purposes. ‘Provisions’ are long-term in nature andrelate mainly to pension benefits and warranties.
(c) Not all the change in the Sandvik’s net deferred tax liabilities in 2001 is reported in the incomestatement. Part relates to ‘Translation differences and other items reported in Shareholders’equity’. Give examples of items reported directly in shareholders’ equity that may have a deferredtax effect (besides translation differences).
P17.6 Income taxes: analysis of disclosures II*Siam City Cement Company (SCCC) is Thailand’s principal cement producer with consolidated 2001revenues of Baht 16 billion (A360 million). The group was hit by the Asian financial crisis in 1997/98and resulting devaluation of the baht. It incurred large operating losses in 1998/99 and did not returnto profitability until 2000. The operating losses generated tax loss carry forwards which SCCC recog-nised as a deferred tax asset in its consolidated balance sheet. Key information concerning the taxeffect of SCCC’s past losses and current profits is given in Exhibit 17.17: it’s taken from the com-pany’s consolidated accounts for calendar year 2001.
Required
(a) Calculate the group’s effective tax rate for 2001.
(b) Why does the company report deferred but not current tax expense in 2001?
(c) How much tax did the group pay in 2001?
(d) Estimate the group’s current and total tax expense for 2002. Assume the group makes consolid-ated before-tax profits of Baht 3,320 million (the same as in 2001) and the statutory corporateincome tax rate in Thailand remains at 30%. State any other assumptions you have made.
* Assignment draws on material in section 2 of the chapter.
P17.7 Accounting for tax losses*Few construction companies have as much experience of land reclamation and conservation as theStevin Company which made its name on the Zuider Zee project. The company had been consistentlyprofitable until x7 when, as a result of a fall in revenues and a large restructuring charge, it reporteda before-tax loss of 200 in its published accounts (amounts are in millions).
Key details from the company’s records are set out below. The taxable temporary differences areattributable largely to differences in the book and tax treatments of depreciation and profits on long-term contracts. Most of the deductible difference in x7 is attributable to the restructuring charge.There are no permanent differences.
CFA_C17.qxd 11/7/03 2:14 PM Page 562

CHAPTER 17 • ACCOUNTING FOR CORPORATE INCOME TAXES 563
In baht million Notes 2001 2000
Statement of income (condensed)
Net sales 15,927.8 14,255.8
Income before tax* 3,320.3 1,597.2Income tax 26 −−998.2 −562.0
Group net income 2,322.1 1,035.2Minority interest in income of subsidiary companies −−72.7 −83.1
Net income attributable to parent company shareholders 2,349.4 952.1
* Of which SCCC’s share of income of associated companies is 235.9 (2000: 41.9 loss).
Balance sheet, end year (condensed)
Current assets 6,705.7 4,608.1Property, plant and equipment, net 12,817.0 13,617.3Investments in associated companies 711.9 544.2Other assets 4,129.3 4,946.6[of which: Deferred tax assets 26 832.7 1,830.9]
Total assets 24,363.9 23,716.2
Current liabilities 1,884.1 2,076.9[of which: Income tax payable – 71.1]Long-term debt 6,219.0 6,892.4Provident fund and employee resignation benefit plan 358.2 333.4Group equity 15,902.6 14,413.5
Total liabilities and shareholders’ equity 24,363.9 23,716.2
Note 26 Income tax (in baht million)
The provision for income tax is as follows:2001 2000
Current tax – 82.4Deferred tax 998.2 479.6
998.2 562.0
The components of the deferred tax asset are as follows:
December 31, Changes December 31,2000 during year 2001
Tax loss carry forwards 1,432.7 (861.0) 571.7Allowance for doubtful accounts 71.1 1.1 72.2Allowance for obsolete stocks 13.0 – 13.0Equity in loss of associated companies 249.9 (142.3) 107.6Provident fund and employee resignation benefit plan 64.2 4.0 68.2
Deferred income tax asset (net) 1,830.9 (998.2) 832.7
Note: ‘Employee resignation benefit plan’ and ‘provident fund’ represent estimated liabilities foremployees’ pension and termination benefits, respectively.
Siam City Cement Company: tax-related disclosures in 2001 accountsExhibit 17.17
(Source: Siam City Cement Company, Annual Report and Accounts 2001.)
CFA_C17.qxd 11/7/03 2:14 PM Page 563

x5 x6 x7Accounting profit (loss) 600 700 (200)
End-year temporary differences:Taxable 270 380 540Deductible 20 50 300
The corporate income tax rate is 40%. The company is uncertain about future profits and thereforerecognises a deferred tax asset only up to the amount of its deferred tax liability at the balance sheet date.
Required
What is the income tax expense or benefit the Stevin Company will recognise in x6 and x7, assuming:
(a) it can carry tax losses forward but not back?
(b) it can carry tax losses back (one year only) as well as carry them forward?
In each case, determine the deferred tax balances Stevin will report in its end-x6 and end-x7 balancesheets.
Check figures:(a) Deferred tax benefit, x7 80(b) Deferred tax benefit, x7 36
* Assignment draws on material in section 2 of this chapter.
P17.8 Net-of-tax method: a simpler approach to deferred tax accounting?‘Why do we bother with deferred taxes?’ asks the financial controller of a publicly quoted company.‘None of our investors – or the analysts covering our company – appears to take any notice of thedeferred tax component of income tax expense or of the deferred tax asset and liability on the bal-ance sheet. They just focus on the company’s current tax expense and payable.
‘Maybe accounting rule-makers should abandon the liability method and require companies to usethe net-of-tax method instead. Under this method, a company reports the tax effects of temporarydifferences as adjustments to the carrying amounts of particular assets and liabilities and the relatedrevenues and expenses. So, for example, equipment would be shown on the balance sheet net of thetax effect of any temporary differences between its tax and book values. And the depreciationexpense for that equipment would be adjusted for the deferred tax expense or benefit relating to thatasset (i.e. the tax effect of the change in temporary difference). The tax expense figure in the incomestatement would comprise current tax payable only but net profit would not be affected. This can beseen in my example below. (I assume a fixed asset costing 100 with book depreciation of 20 and taxdepreciation of 33 in the first year, profit before depreciation of 120 and a tax rate of 30%.)
Liability method Net-of-tax method
Profit before depreciation and tax 120 120Depreciation −20 −24Profit before tax 100 96
Current tax expense −26Deferred tax expense −4Total tax expense −30 −26
Net profit in year 1 70 70
Fixed asset, at NBV, end-year 1 80 76
So the net-of-tax depreciation charge consists of two elements – book depreciation of 20 plus the taxeffect of the excess of tax over book depreciation of 4.
564 PART 2 • THE HOUSE OF ACCOUNTING
CFA_C17.qxd 11/7/03 2:14 PM Page 564

‘The main advantage of the net-of-tax method, in my view, is that the reported amount of an assetor liability incorporates the related tax benefit or cost directly. This gives a truer indication of its eco-nomic value. For example, the market value of the equipment described above is a function of bothits service potential and the tax benefits available to the owner. In addition, the method simplifies thepresentation of the income statement and balance sheet, removing the clutter of deferred tax itemsand making the accounts easier for a layperson to understand.’
Required
Comment on the financial controller’s proposal. What are the potential weaknesses or disadvantagesof the net-of-tax method, in your view?
Notes to Chapter 171 OECD in figures 2002, Paris: OECD.2 It need not be, however. In some countries, a company owned and controlled by a few shareholders is
treated as a partnership: the company’s income is attributed directly to the owners and each is taxedon his or her share as if it were personal income. The individual owners are ‘taxable entities’; the company is not.
3 In many countries, corporate income taxes are paid by instalment during the financial year. Thismeans the company must estimate taxable profits for the year. It adjusts its profit estimate (and tax liability) when the accounts are closed after the year-end and actual taxable profits are known.
4 This can lead to an artificial capital structure. To counter this, tax codes in many countries seek to pre-vent firms from disguising equity capital as debt. Thus, in the case of a ‘thinly capitalised’ company,the tax authorities may deem part of its interest charge to be a distribution of profit and deny the com-pany a tax deduction on it.
5 In our discussion, we’ve focused implicitly on the tax situation of resident shareholders. The differ-ences among the various tax systems have less force for non-resident shareholders. Dividends (andother income payments such as interest and royalties) paid to non-residents bear a withholding tax,regardless of the tax system. The nominal rate is usually 25–30% but the actual rate is much lower(10% or less) thanks to tax treaties between countries. Moreover, in most countries taxpayers canclaim a foreign tax credit for the withholding tax – or a tax exemption for the foreign-source dividendincome – in their home-country tax return. They can’t claim a tax credit for imputed (foreign) cor-porate income tax, however.
6 Many EU member states set a reduced rate for low corporate earnings. This is intended to help smallercompanies.
7 Ruding Committee (1992), Report of the Committee of Independent Experts on Company Taxation,Brussels: European Commission.
8 Cussons, P. and Sylvester, C. (2002), ECJ round-up, Tax Planning International: European UnionFocus, 4(2): 11–12.
9 Corporate income taxes have not always been considered a cost. In some European countries, it wascommon practice until recently to show income taxes in the same way as dividends – as a distributionof profits, rather than as a cost incurred in generating them.
10 The balance sheet approach is not the only way that a company can account for the future tax effectsof current profits. In some countries, firms calculate deferred tax by reference to timing differencesbetween the book and tax amounts of revenues and expenses (the income statement approach). Underyet another approach, the net-of-tax method, no separate deferred tax asset or liability is recognised.Instead, the carrying amounts of individual assets and liabilities are adjusted for the tax effect of anybook/tax differences relating to them. Only the balance sheet approach is permitted under IAS.
11 Recoverability depends on future profits. If there are doubts about whether the company will generateprofits in future periods, the deferred tax asset will be restricted – or not recognised at all.
12 International Accounting Standards Board, IAS 12: Income Taxes.13 There is a third area where practice can differ. Instead of applying the current tax rate to temporary
(or timing) differences (the liability method), a company values those differences at the tax rate(s)
CHAPTER 17 • ACCOUNTING FOR CORPORATE INCOME TAXES 565
CFA_C17.qxd 11/7/03 2:14 PM Page 565

prevailing when they arose (the deferred method). Thus, a change in tax rate does not result in therevaluation of deferred tax balances. Few companies use the deferred method today. It is not accept-able under IAS.
14 IAS 12. The previous international rules were tougher: there had to be ‘assurance beyond any reason-able doubt’ that future taxable profits would be available against which to set the loss before a deferredtax asset could be recognised.
15 More generally, the tax effect of any item that is charged or credited directly to shareholders’ equity isalso charged or credited there too. Thus the tax effect of a foreign currency translation adjustment isbooked directly to reserves.
16 The tax code may grant concessions to corporate groups, however. As we saw in section 1 of the chapter, a parent company may obtain tax relief when it receives dividends from (domestic) affiliatedcompanies. In addition, it may be possible to set off the operating losses of one company within thegroup against the operating profits of another.
17 This treatment is consistent with previous practice, where goodwill amortisation that was notdeductible for tax purposes was considered a permanent rather than a timing difference.
18 Guenther, D.A. and Sansing, R.C. (2000), Valuation of the firm in the presence of temporary book-taxdifferences: the role of deferred tax assets and liabilities, The Accounting Review, 75(1): 1–12.
19 The accountant’s effective tax rate is, in reality, an average tax rate. To an economist, the effective taxrate is the percentage of each additional currency unit (euro, dollar, etc.) of corporate income that isclaimed by the tax authorities, i.e. its marginal tax rate.
566 PART 2 • THE HOUSE OF ACCOUNTING
CFA_C17.qxd 11/7/03 2:14 PM Page 566

Perspectives
PART 3PART 3
CFA_C18.qxd 11/6/03 3:20 PM Page 567

CFA_C18.qxd 11/6/03 3:20 PM Page 568

The cash flow statementrevisited
INTRODUCTIONWe have now finished our exploration of the accounting building. We have abetter understanding of how a firm’s balance sheet and income statement areput together and of the accounting policies that underlie their construction.Our attention now turns outward. In the next three chapters (Chapters 18–20), we consider how investors use financial statements to analyse a company’spast and forecast its future.
We start by revisiting the cash flow statement which we first encountered in Chapter 6. Investors look at a company’s cash flow statement to discoverwhether cash inflows are greater or less than cash outflows in the year. How-ever, they learn more from it than just this. They gain insights into the natureof a company’s business, its debt-paying ability and the impact of accrualadjustments on its accounts. We illustrate each of these points in the first partof the chapter.
We then turn to technical matters. We show how an approximate cash flowstatement can be constructed, using balance sheet and income statement dataonly. This is a valuable skill to have, given that many smaller companies do notpublish a cash flow statement.
The way companies present cash flow data is sometimes puzzling. We illustrate alternative ways of presenting operating cash flows. We close thechapter by explaining how foreign currency transactions and investments inassociated companies, joint ventures and subsidiaries are dealt with in the cashflow statement.
1818
SECTION 1Cash flow analysis:benefits to investors
l Overview
l Assessing risk
l Measuringperformance
l Forecasting
l Detecting earningsmanipulation
SECTION 2Specialised topics
l Constructing a cashflow statement frombalance sheet data
l Presentation of cashflows
In this chapter
CFA_C18.qxd 11/6/03 3:20 PM Page 569

570 PART 3 • PERSPECTIVES
SECTION
1
Operating activities*Net profit for the year xx ANon-cash expenses xx B(Increase) in operating working capital (xx) C
Cash inflow from/(outflow on) operations xx/(xx) D
Investing activitiesPurchase of tangible and intangible fixed assets (xx)Disposal of tangible and intangible fixed assets xxPurchase of financial investments (xx)Disposal of financial investments xx
Cash (outflow on)/inflow from investments (xx)/xx E
Financing activitiesIssuance of shares and bonds xxRepayment of debt/repurchase of own shares (xx)Dividends to shareholders (xx)
Cash inflow from/(outflow on) financing xx/(xx) F
Net cash inflow (outflow) in year (D + E + F) xx/(xx)Cash and equivalents, start-year xxCash and equivalents, end-year xx
* Net loss, non-cash revenues and decrease in operating working capital have the opposite signs.
Format of activity-based cash flow statement (indirect approach)Exhibit 18.1
Cash flow analysis: benefits to investors
Overview
Investors turn to the cash flow statement to find out how a company raised and spent cash during its past financial year. This information is not available directly from either the incomestatement or the balance sheet.
l Format of cash flow statementThe cash flow statement comes in several guises. Increasingly, larger European firms present cashflows by activity. This is the format required by IAS. Exhibit 18.1 shows in outline an activity-based cash flow statement for a non-financial institution. (Financial institutions have separatereporting requirements.) As we saw in Chapter 6 (Exhibit 6.19), the 2001 cash flow statement ofBestPrice Stores has a similar format.
The statement identifies three types of activity – operating, investing and financing. Exhibit18.1 illustrates the main elements commonly found under each.
1 Operating activities. These comprise the sale of goods and services and their associated costs.1 Cash receipts and payments from such activities are rarely shown directly. Instead, as
CFA_C18.qxd 11/6/03 3:20 PM Page 570

Exhibit 18.1 shows, operating cash flow is derived indirectly, by adjusting profit for non-cashexpenses (such as depreciation) and changes in operating working capital (mainly invent-ories, receivables and payables) during the year.
2 Investing activities. These embrace the purchase and disposal of tangible and intangible fixedassets such as property and equipment, trademarks and goodwill. In addition, the acquisitionand disposal of financial investments such as government bonds or shares in other companiesare also considered investing activities.
3 Financing activities. A firm raises outside capital by issuing shares or through borrowing. Itreduces outside capital by repurchasing its shares and repaying debt. These along with thepayment of dividends to shareholders are its principal financing activities.
The sum of the cash flows within an activity can be positive or negative. Note that the way cashflows are classified follows conventional accounting practice. Thus expenditures on research anddevelopment are shown as operating outlays even though, in economic terms, they are investingoutlays like those on plant and equipment.
l Initial analysisThe starting point for an initial analysis of a firm’s cash flow is its operating cash flow (OCF). IsOCF positive or negative? OCF may be negative if the firm is making losses or if it is profitablebut growing very rapidly. Fast-growing firms often invest heavily in operating working capital aswell as in fixed assets. Negative OCF (or a trend of positive but declining OCFs) is a warning toinvestors that the firm may encounter financial difficulties in the future. Even profitable firmscan experience liquidity problems.
For a firm with positive OCF, investors ask: is it self-financing? Can it pay for net capitalexpenditures (purchases less disposals of tangible and intangible fixed assets – known as netcapex) and dividends to shareholders out of operating cash flow alone? If the answer is no, thenthe next question is: how is the firm financing the shortfall? Sources of cash besides operationsinclude new debt, an issue of shares, a disposal of investments or a run-down of its cash balance.Of course, the firm may draw on more than one of these sources to meet the cash shortfall.
If the firm is self-financing, investors ask: how is it deploying the cash surplus? Ways of usingthe surplus include: early repayment of debt; returning cash to shareholders (via special divid-ends or share repurchases); making acquisitions (by buying the shares of other companies); andreplenishing the firm’s own cash balance. We summarise these alternatives below:
Is the firm self-financing?(OCF > (Net capex + Dividends)?)
No Yes
How is shortfall How is surplusfinanced? deployed?
Possible sources: Possible uses:– New debt – Repayment of debt– Issuance of shares – Repurchase of shares– Disposal of investments – Purchase of investments– Reduction of cash balance – Increase in cash balance
The cash flow statement yields other insights. By looking at the composition of a firm’s oper-ating, investing and financing flows, investors can see the effect of management decisions in
CHAPTER 18 • THE CASH FLOW STATEMENT REVISITED 571
CFA_C18.qxd 11/6/03 3:20 PM Page 571

572 PART 3 • PERSPECTIVES
those areas – more clearly than from inspection of the balance sheet and income statement alone.Here are some examples of questions about management policies which the statement can helpanswer:
l Working capital management. To what extent is a change in OCF attributable to a change inworking capital levels? Is the change in working capital sales-related or the result of manage-ment action, e.g. tighter inventory control or (a negative OCF effect) the faster settlement ofsuppliers’ accounts? Note that a reconciliation of profit to OCF – as provided by the indirectapproach – is helpful here.
l Investment strategy. Is the company expanding internally – in which case expenditures on tangible fixed assets will be the major investing outlay – or through acquisition of stakes inother companies?
l Financial structure. Has the company altered the mix of debt and equity capital? Has itrefinanced its debt? If so, has it changed the debt’s term structure (e.g. by substituting long-term for short-term debt)?
Investors also turn to the cash flow statement for help with more specialised enquiries. In par-ticular, they use cash flow data to:
1 assess a company’s financial risk;2 compare its performance with that of other firms which follow different accounting policies;3 improve their forecasts of its future operating and investing cash flows; and4 detect any manipulation of its earnings by management.
We illustrate each of these points in turn.
Assessing risk
Investors consult a firm’s cash flow statement when assessing its credit risk – that is the risk itwill be unable to pay its debts when they fall due.2 The operating cash flow number is crucialhere. A firm may be profitable and yet report a cash outflow from operations. Take the case of acompany enjoying rapid growth in demand for its products. It makes profits but at the sametime invests heavily in inventories and receivables (as well as fixed assets). In terms of Exhibit18.1, negative C outweighs positive A and B.
l Cash-based liquidity and leverage ratios
Investors have devised cash-based liquidity and leverage ratios to shed light on a firm’s ability topay its creditors. The defensive interval, a liquidity measure, relates a firm’s defensive assets (i.e.cash and other liquid assets) to its non-avoidable outlays in the short run.3
Defensive interval (in days) ==
where:Defensive assets = Cash + Marketable securities + Accounts receivable (net), end-year tProjected expenditures = Budgeted outlays (including capital expenditures) in year t + 1.
Where information about budgeted outlays is not available, investors use the firm’s reportedoutlays of the most recent year.
The ratio assumes a worst case scenario, namely, the company generates no cash from salesor other sources. It shows how long a firm can continue normal operations – in the absence of
Defensive assets
Projected expenditures 365××
CFA_C18.qxd 11/6/03 3:20 PM Page 572

sales – without resorting to outside financing. The main advantage of the defensive interval overtraditional liquidity ratios such as the current ratio is that it is forward-looking and focuses onfuture payments to creditors rather than on current liabilities. Moreover, it is less susceptible tomanipulation: deferring until January the receipt of inventory purchased on credit raises theend-December current ratio (assuming it’s greater than unity already) but has no effect on thedefensive interval.
A variant of the defensive interval was widely used by analysts in the ‘dotcom bubble’ years ofthe late 1990s. Most start-up companies ‘burn’ cash initially: operating cash flow is negative aspayments exceed receipts in the early years. Analysts estimate the rate of a start-up’s cash burn(i.e. projected operating cash outflow (including capital expenditures) per quarter). By relatingcash burn to the firm’s liquid assets at the start of the quarter, analysts can work out how long itcan survive until the next cash call – or liquidation.
Cash call interval (in days) ==
Of course, those investing in the firm expect cash burn to diminish and eventually disappear.They assume that as revenues increase the firm will generate positive operating cash flow andfurther cash calls (or bankruptcy) will be avoided. As we now know, for many dotcom start-ups,this was wishful thinking.
Cash-flow leverage ratios have also become popular in recent years. One that’s widely used isthe net debt-to-OCF ratio which, as the title suggests, relates a company’s net debt to its oper-ating cash flow:
Net debt-to-OCF ratio ==
The ratio shows how many years it will take for the company to pay off its debts given the cur-rent rate at which it generates cash from operations. Other versions of the ratio are in use.Analysts sometimes use projected OCF rather than the actual OCF of the most recent year. Inthe case of capital-intensive companies, they may deduct projected capital expenditures fromOCF to give a more realistic measure of cash flow available to service the debt. Another variant,popular with credit-rating agencies, is to use cash earnings or Ebitda (earnings before interest,tax, depreciation and amortisation) in place of OCF on the grounds that OCF can be distortedby non-recurring changes in operating working capital in the year. (We discuss cash earningsand Ebitda in the next section.)
The net debt-to-OCF ratio – or variants of it – is steadily replacing the traditional debt/equityratio as a measure of financial leverage. It has two main advantages. First, it reflects better therisks associated with debt. A company services – and repays – debt with cash. Operations are themain source of recurring cash flow. Thus a company with low OCF relative to net debt will findit harder to meet debt payments when they fall due. Second, new accounting standards haveundermined balance sheet leverage ratios. Fair value adjustments to investments and impair-ment tests applied to goodwill and other fixed assets have made the book equity figure in thedebt–equity ratio more volatile. Moreover, standards-driven charges against book equity do notnecessarily indicate that a company’s debt-servicing ability has worsened.
l Available cash flows and committed outlaysInvestors use cash flow data in other ways to assess a company’s viability. Rather than calculatingratios, they construct a detailed forecast of its future cash flows. A bank, for example, may wishto estimate a potential borrower’s cash flows before approving a loan. In these circumstances, itmakes sense to distinguish the outlays the borrower must make from those it can avoid.
Interest-bearing debt, less cash and cash equivalents, end-year
Operating cash flow in year
t
t
Cash and marketable securities, end-quarter
Projected cash burn (in quarter 1) 90
t
t ++××
CHAPTER 18 • THE CASH FLOW STATEMENT REVISITED 573
CFA_C18.qxd 11/6/03 3:20 PM Page 573

574 PART 3 • PERSPECTIVES
l Committed outlays comprise existing scheduled debt payments and the minimum capital expenditures necessary to maintain operations.
l Discretionary outlays (i.e. outlays the borrower can avoid) include expansionary capital expenditures and investments in other firms. (Strictly, ordinary dividends are, in terms of thisanalysis, a discretionary payment, but companies themselves may well view the existing level of dividends as a committed outlay.)
The cash flows available for servicing new debt (net available cash flows) are the borrowingfirm’s expected inflows from operations and other sources less its committed outlays:
Forecast available cash flowsExpected inflows from:Operations xxAsset disposals xxReturn on investments (e.g. interest and dividends received) xx
Available cash flow xxCommitted outlaysScheduled debt payments:
Debt servicing costs (e.g. interest payments) –xxPayments of principal –xxNon-cancellable contractual payments (e.g. lease payments) –xx
Maintenance capital expenditures –xxNet available cash flow xx
A healthy firm has positive net available cash flow even in the trough of the business cycle.Investors in leveraged buyouts (LBOs) also make use of the above framework. In an LBO, the
purchaser uses the target firm’s own cash flow to service the debt used to finance the acquisition.The key number here is the target firm’s expected free cash flow. Free cash flow is (before-tax)‘available cash flow’ less maintenance capital expenditures. The larger this number, the greater isthe cash available to meet payments of interest and principal and thus the more debt the pur-chaser can employ to fund the buyout.
Measuring performance
We argued in earlier chapters that profit is usually a better measure of financial performancethan cash flow. Thanks to the timing and matching conventions of accrual accounting, profit(loss) more closely reflects the value added (or subtracted) by the firm’s operations during aperiod than does cash flow.4
Nevertheless, investors use cash flow numbers in practice as a financial performance measure.In addition, they often base valuation multiples on cash flow rather than earnings. Some of thearguments they use for doing this are dubious, however.
l Cash earnings and Ebitda margin ratiosWhich cash flow ratios do investors use in interfirm comparisons of performance? One popularindicator is the cash earnings-to-sales ratio. Investors define cash earnings as ‘profit plus depre-ciation (and other non-cash expenses)’. If they focus on the performance of the firm – ratherthan returns to shareholders, they add back interest expense – and tax – as well. This version of cashearnings is known as Ebitda (earnings before interest, tax, depreciation and amortisation).
CFA_C18.qxd 11/6/03 3:20 PM Page 574

Note that these measures of cash flow are not equivalent to operating cash flow. Recall that:
Operating cash flow == Net profit (or loss) ++/−− Effect of accruals
‘Accruals’ are of two types: long term (e.g. depreciation, changes in long-term provisions) andshort term (e.g. changes in inventories, trade receivables and trade payables). Cash flow-basedperformance measures like Ebitda adjust profit for the effect of long-term accruals only:
Ebitda == Profit (or loss) before ++/−− Depreciation, amortisation, and interest and tax other long-term accruals
Why do investors use Ebitda (or cash earnings) rather than reported net profit as a performancemeasure? The main reason is its claimed versatility: it can be used to forecast future cash flowsas well as measure past performance. Many investors believe that depreciation and amortisationdon’t have predictive value: using this information won’t help them make more accurate fore-casts of a firm’s future cash flows, they argue. In addition, they cite international differences inthe accounting for fixed assets. By excluding depreciation and amortisation from profit calcula-tions, they allege they can better compare the performance of companies in different countries.
Both arguments are weak. Long-term accruals do have predictive value. Research shows thatinvestors can improve their predictions of a company’s future cash flows by breaking down itscurrent earnings into cash flow and individual accruals components – long-term as well as short-term – and by building forecasts of future cash flows on these disaggregated amounts.5 As forinternational accounting differences, these diminished considerably in the late 1990s, especiallyin the area of fixed assets, as a result of growing convergence in the accounting for intangiblesand asset impairments.
l Cash flow/shareCash flow per share is another performance measure used in interfirm comparisons. As with thecash flow margin, financial commentators – and companies themselves – may define it as ‘profitplus depreciation’ or Ebitda rather than OCF.
From a conceptual point of view, the ratio is flawed no matter how it is calculated. In contrastto earnings, a firm’s cash flow does not ‘belong’ to its shareholders. It is generated by all the com-pany’s assets, not that part which is financed by the owners. Nevertheless, cash flow per share isa popular performance measure, especially in the telecoms sector where many recent entrantscurrently report low or negative earnings owing to large non-cash charges (e.g. depreciation ofcable and other long-lived assets, amortisation of licences and other intangibles).
l Valuations and cash flow multiplesIt’s a short step from per-share cash flow to corporate valuations using cash flow multiples. Atraditional method of valuing an unquoted company’s shares is to apply a P/E ratio (based onthat of quoted companies in its industry) to its prospective earnings per share. Recently,investors have begun to relate cash flow to ‘enterprise value’. Enterprise value is the sum of themarket values of a firm’s debt as well as its equity. Cash flow is usually defined as Ebitda. Thisresults in an EV/Ebitda ratio:
EV/Ebitda ratio ==
Investors use the EV/Ebitda ratio for the same purposes as the P/E ratio: to value an unquotedfirm’s equity and, more questionably, to look for mispricing of quoted companies’ shares.6 Theadvantage of a cash flow multiple is that it is less sensitive to accounting policy differences thanan earnings multiple. However, be warned: in either form it is a crude valuation device. A more
Debt Shareholders’ equity Minority interests (all at MV)
Earnings before interest, tax, depreciation and amortisation
++ ++
CHAPTER 18 • THE CASH FLOW STATEMENT REVISITED 575
CFA_C18.qxd 11/6/03 3:20 PM Page 575

576 PART 3 • PERSPECTIVES
Lifecycle of a product: income and cash flow impactExhibit 18.2
rigorous approach is to estimate a firm’s future earnings or cash flows on a year-by-year basis anddiscount them using the appropriate risk-adjusted discount rate based on the firm’s cost of capital.
Forecasting
Companies display different cash flow profiles. The way in which operating, investing and financ-ing cash flows vary across firms is attributable in part to industry differences. Companies in fast-growing industries must usually rely on external capital (financing inflows) because internallygenerated funds are insufficient to meet investment needs. Companies in mature industries,however, ‘self-finance’ their capital expenditures and use surplus cash to acquire other companies,retire debt and/or buy back their own shares.
Investors use cash flow profiling to help them forecast a firm’s future operating and investingcash flows. How do they do this? They start by relating a company’s cash flow profile to the var-ious stages in the lifecycle of its products. A product usually passes through (at least) four stagesin its lifecycle: introduction, growth, maturity and decline.7 A product’s impact on the firm’sincome and cash flows during its lifecycle is shown in Exhibit 18.2.
At the time of the product’s introduction, operating cash flows are negative because of heavyproduct development and launch costs. If the product is successful and becomes profitable, OCFmay remain negative as the company invests in working capital to meet sales demand. Duringthis period, the company relies on ‘outside’ capital, e.g. bank borrowings, new equity or evencash flows from the firm’s other mature or declining products.
(Source: Adapted from Financial Reporting and Statement Analysis: A Strategic Perspective, 3rd Edition by Stickney. © 1996. Reprinted with permission of South-Western, a division of Thomson Learning: www.thomsonrights.com. Fax 800 730-2215.)
CFA_C18.qxd 11/6/03 3:20 PM Page 576

CHAPTER 18 • THE CASH FLOW STATEMENT REVISITED 577
In the growth stage, the product generates positive OCF. However, these are not large enoughto cover the growing outlays on fixed assets and outside capital is still needed.
When the product reaches maturity, it becomes self-financing. It generates sufficient cashfrom operations to meet investment needs (largely replacement in nature). Financing flows maywell turn negative as the company repays debt using surplus cash flow.
It’s harder to sketch the cash flow profile of products in decline since they are usuallyrevamped, sold or abandoned before decline takes hold. Operating flows are likely to remainpositive even if the product becomes unprofitable since key expenses like depreciation involveno cash outlay. They are lower than in the maturity phase, however. Investing outflows are modest: in fact, there may well be net inflows in some periods should the company dispose ofproductive capacity. Similarly, financing outflows – on debt repayment or equity transfers tonew products – are small, reflecting declining operations and modest investment needs.
Estimating from actual cash flows the stage in the lifecycle that a company has reached is moredifficult. A firm can be viewed as a portfolio of products. Not all products will be at the same stageof the lifecycle. Take the case of a pharmaceutical company. New drugs are in the ‘introduction’or ‘growth’ stages while drugs that are off-patent are in the ‘decline’ stage. Even for a firm withproducts that are at a similar stage in their lifecycles, actual corporate cash flows may not corre-spond to expected flows in any one year. For example, in a recession a ‘mature’ company maywell report falling profits and operating inflows. If operating cash flows fall below investmentcommitments, it will probably have to raise external capital in the period.
Nevertheless, cash flow profiling is a useful exercise. By first considering the growth trends inthe industry and examining the cash flow statements of competitors, investors can construct anexpected cash flow profile for the target company. This allows them to forecast its future oper-ating and investing cash flows with more confidence.
Detecting earnings manipulation
Earlier we questioned the argument for using operating cash flow – or a variant such as Ebitda– as a performance measure. There is one circumstance, however, when OCF may be a more reli-able indicator of a company’s financial performance than reported earnings, and that is wheninvestors suspect management of manipulating its profits.
To detect possible earnings manipulation, analysts investigate the amount and compositionof a company’s accruals. Rearranging the OCF equation given earlier yields:
Net profit (loss) == Operating cash flow −−/++ Effect of accruals
Faced with slower growth – or even a fall – in a company’s OCF, management may resort toaccounting ploys to boost reported profits or stem their decline. The most popular ploy is tooverstate operating revenues by recognising them early. Other widely used ones are to capitaliseexpenses or defer recognition of asset write-downs and provisions. These profit-boosting tech-niques have an effect on accruals. For example, bringing forward the recognition of revenuesresults in higher accounts receivable. Capitalising expenses manifests itself in an increase inreported inventory or deferred charges. (If the expenses are capitalised in a tangible or intan-gible fixed asset, the increase in accruals is reflected in higher depreciation in later periods.)Underproviding for bad debts and warranty costs also has a balance sheet effect (higher accountsreceivable, lower provisions). Because management may use a variety of profit-boosting tech-niques involving more than one type of accrual, analysts monitor the movement in total accruals.There is empirical evidence that accruals are higher, in proportionate terms, among firms thatare earnings manipulators. Moreover, the accruals of such firms tend to increase over time untilthe manipulation is discovered (see Box 18.1).
CFA_C18.qxd 11/6/03 3:20 PM Page 577

Using cash flow data to detect earnings manipulationBOX18.1
Despite being confusing to the novice investor, the indirect approach to deriving operatingcash flow, namely, adjusting reported profit for non-cash charges and changes in operatingworking capital, does have one key advantage. It helps accounting sleuths. They can identifymore easily a company’s accruals in the period – by both type and amount – and use them tounmask manipulation of its earnings by managers.
Dechow, Sloan and Sweeney carried out interesting research in this area. They studied thecharacteristics of US firms that were subject to accounting enforcement actions by the SEC foralleged violation of US GAAP in the period 1982–92. In most cases, the alleged violation tookthe form of overstating revenues, understating expenses (or losses) or a combination of thetwo. The effect on accruals was significant. Dechow, et al. compared 66 alleged GAAP viola-tors with 69 firms matched by industry, size and time period. For the former group, totalaccruals as a percentage of assets rose in the three years prior to the year the SEC allegedmanipulation took place and then fell sharply in the following two years, as the previousaccrual overstatements were reversed. By contrast, the accruals-to-assets ratio of the controlgroup exhibited no systematic change over the same five-year period.
(Source: Dechow, P., Sloan, R. and Sweeney, A. (1996), Causes and consequences of earnings manipulation: ananalysis of firms subject to enforcement actions by the SEC, Contemporary Accounting Research, 13(1), figure 1.)
What type of company manipulates its earnings? Dechow et al. reason that the activity ismore likely to occur when management have both the incentive and the opportunity to do so.The incentive to manipulate is greater when a company needs to raise outside capital. A com-pany that can demonstrate a history of strong and growing earnings should be able to obtainnew capital at lower cost. Although many industries were represented in the SEC sample ofalleged violators, one-third of the companies came from the capital-hungry high-tech sector(computer equipment, business services (including computer software) and instrumentation).Managers also manipulate earnings to prevent debt covenants being breached. Dechow et al.found that, relative to the control group, a significantly higher proportion of the SEC samplereported a technical violation of a debt covenant in the year of alleged manipulation and thetwo subsequent years.
As for the opportunity to manipulate earnings, this is greater in companies where the governance structure is weak. Dechow et al. investigated various indicators of corporate governance. They found that boards of directors in the SEC sample exercised less oversightover management than did boards in the control sample. Firms in the SEC sample were lesslikely to have an audit committee and had proportionately fewer non-executive directors. In addition, less of the board’s shareholding was in the hands of non-executive directors andthe CEO was more likely to be the founder of the company.8
(Reproduced by permission of Canadian Academic Accounting Association.)
CFA_C18.qxd 11/6/03 3:20 PM Page 578

CHAPTER 18 • THE CASH FLOW STATEMENT REVISITED 579
SECTION
2 Specialised topics
Constructing a cash flow statement from balance sheet data
We’ve indicated some of the benefits to investors from the cash flow statement. What caninvestors do if a company doesn’t provide one? Fortunately, it’s possible to construct a cash flowstatement using balance sheet and income statement data. The resulting statement is onlyapproximate, however. If the company has large foreign operations or has made major acquisi-tions or disposals of businesses in the year, the derived cash flow statement may containsignificant errors. It’s not possible to isolate foreign currency cash flows from changes in balancesheet numbers that are all expressed in the reporting currency. And changes in working capitalderived from balance sheet numbers include the working capital effects of businesses acquired(or disposed of) in the year. These are strictly investing cash flows and should not enter into thecalculation of OCF. Nonetheless, in all other cases the statement should be sufficiently accurateto let the investor perform the kinds of analysis outlined in section 1 of the chapter.
As is evident from its title, the cash flow statement shows the movement in cash over a period.Thus the ‘do-it-yourself ’ (DIY) preparer needs two balance sheets, at the start and end of theperiod, to identify why the company’s cash balance has changed over the period. The incomestatement provides information – for example, about non-cash expenses – to supplement that inthe two balance sheets.
l DIY construction of cash flow statement
To construct a cash flow statement (CFS) for a financial year, the DIY preparer must completethe following steps:
1 Determine the change in the company’s cash balance over the year. This is the CFS’s ‘bottom line’.2 Calculate the changes in all other balance sheet accounts over the year. The changes in these
accounts must be equal, in sum, to the change in cash, if the balance sheet identity: A ≡ L +OE, is to be preserved.
3 Identify the reasons for the changes in the non-cash accounts calculated in step 2. Cash flows arethen grouped by activity, specifically operating, investing and financing activities, as inExhibit 18.1.
We show with an example how a CFS is prepared, using only balance sheet and income state-ment data. Figaro & Company is a conglomerate whose main interests – franchised hair salons,personal valet recruitment – are in the service sector. Figaro’s x2 accounts, summarised inExhibit 18.3, contain an income statement for x2 and comparative balance sheets for x1 and x2.
A cash flow statement for x2 is lacking: our task is to construct one. We do so by applying thethree steps to Figaro’s x2 accounts.
Step 1 Determine the change in cash and cash equivalents
‘Cash’ includes cash held by the company (‘Cash in hand’) and demand deposits held at banksand other financial institutions. ‘Cash equivalents’ are short-term, highly liquid investments –defined as those that mature within three months.9 In Figaro’s case, cash and cash equivalents –‘broad cash’ for short – fall by 2 million in x2.
CFA_C18.qxd 11/6/03 3:20 PM Page 579
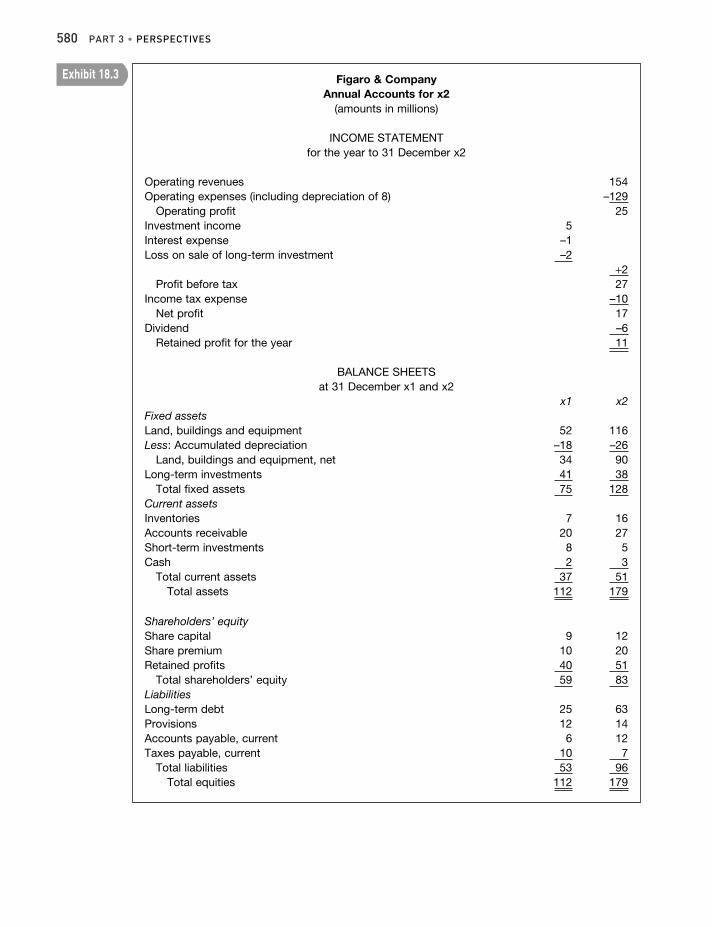
580 PART 3 • PERSPECTIVES
Figaro & CompanyAnnual Accounts for x2
(amounts in millions)
INCOME STATEMENT for the year to 31 December x2
Operating revenues 154Operating expenses (including depreciation of 8) –129
Operating profit 25Investment income 5Interest expense –1Loss on sale of long-term investment –2
+2Profit before tax 27
Income tax expense –10Net profit 17
Dividend –6Retained profit for the year 11
BALANCE SHEETSat 31 December x1 and x2
x1 x2Fixed assetsLand, buildings and equipment 52 116Less: Accumulated depreciation –18 –26
Land, buildings and equipment, net 34 90Long-term investments 41 38
Total fixed assets 75 128Current assetsInventories 7 16Accounts receivable 20 27Short-term investments 8 5Cash 2 3
Total current assets 37 51Total assets 112 179
Shareholders’ equityShare capital 9 12Share premium 10 20Retained profits 40 51
Total shareholders’ equity 59 83LiabilitiesLong-term debt 25 63Provisions 12 14Accounts payable, current 6 12Taxes payable, current 10 7
Total liabilities 53 96Total equities 112 179
Exhibit 18.3
CFA_C18.qxd 11/6/03 3:20 PM Page 580

(In millions) x1 x2 ChangeCash 2 3Short-term investments 8 5
Broad cash 10 8 –2
Step 2 Calculate changes in non-cash accountsRecall the form of the balance sheet identity. It can be written in expanded form as:
Cash ++ Non-cash assets == Liabilities ++ Shareholders’ equity (18.1)
‘Cash’ here is broad cash. Rearranging, equation 18.1 becomes:
Cash == Liabilities ++ Shareholders’ equity −− Non-cash assets (18.2)
Since equation 18.2 holds at any date, it must also be true of changes in the balance sheetbetween two dates:
∆Cash == ∆L ++ ∆SE −− ∆Non-cash A (18.3)
Thus in Figaro’s case, the changes in balance sheet accounts other than cash during x2 must sumto a negative 2 million. This is shown in Exhibit 18.4.
CHAPTER 18 • THE CASH FLOW STATEMENT REVISITED 581
Figaro & Company: Change in cash and non-cash balances in x2 (amounts in millions)
Exhibit 18.4
x1 x2 Change
AssetsLand, buildings and equipment, net 34 90 +56Long-term investments 41 38 –3 +69Inventories 7 16 +9Accounts receivable 20 27 +7
Cash and short-term investments 10 8 –2Total assets 112 179
EquitiesShare capital 9 12 +3Share premium 10 20 +10 +24Retained profits 40 51 +11
Long-term debt 25 63 +38Provisions 12 14 +2Accounts payable, current 6 12 +6
+43
Taxes payable, current 10 7 –3Total equities 112 179
Change in:
Shareholders’ Non-cash Change inLiabilities + equity – assets = (broad) cash+43 + 24 – (+69) = –2
54647
567
54647
CFA_C18.qxd 11/6/03 3:20 PM Page 581

Step 3 Explain why non-cash accounts have changedWe analyse next the movement in Figaro’s individual liability, shareholders’ equity and non-cashasset accounts to discover why (broad) cash declined by 2 million.
A helpful way to carry out this analysis is to set up a worksheet in columnar form. In the firsttwo columns we list each non-cash balance sheet account and set down the net change in theaccount over the year. We then analyse the movement in each account in turn, showing in separate columns the cash flows attributable to operating, investing and financing activities. Anexample of such a worksheet is given in Exhibit 18.5 for Figaro & Company.
We start the worksheet with shareholders’ equity – in particular, the retained profits account– since, for most companies, operating activities are the principal source of cash inflows. Thus theincrease in retained profit of 11 in x2 (all amounts are in millions) is attributable to net profit of 17(an operating inflow) and dividend payments of 6 (here shown as a financing outflow). We assumethat the remaining increase of 13 in shareholders’ equity is the result of an issuance of shares (afinancing inflow). In practice, we would check this by consulting the notes to Figaro’s accounts.
The movement in each liability and non-cash asset account is analysed in a similar way.Sometimes the explanation for the change in a balance sheet account can be found in the incomestatement. For example, the change in ‘accumulated depreciation’ (+8) is attributable to theannual depreciation charge on the company’s fixed assets (see Exhibit 18.3). In many cases, how-ever, we have to make assumptions, as we did with the increase in share capital and premium.Thus we assume that Figaro does not dispose of any property or equipment in x2: the grossincrease of 64 is due solely to purchases of this amount. Other assumptions we make are:
l Figaro acquires no long-term investments in x2; l interest expense and interest paid are the same; andl the increase in provisions is the result of expenses accrued in the year (i.e. these have no cash
impact).
Of course, if we have access to the notes to the accounts (not available in this case), we can prepare a more detailed cash flow statement.
Note that, in contrast to shareholders’ equity and liability accounts, any movement in a non-cash asset account has the opposite effect on cash. This can be seen from equation 18.3. Thus theincrease in Figaro’s land, buildings and equipment (+64) indicates an investing cash outflow, thedecrease in long-term investments (–3) an investing cash inflow.
Many of the changes in balance sheet accounts are the result of accruals and affect the calcu-lation of operating cash flow. This is evident from the worksheet in Exhibit 18.5. The increasesin accumulated depreciation and provisions reflect non-cash expenses. The movements in current liabilities (accounts payable, taxes payable) and current assets (inventories, accountsreceivable) also represent the adjustment from expenses to expenditures, revenues to receipts.10
When the worksheet is complete and we can confirm that the sum of the cash flows by activ-ity equals the change in broad cash, we are in a position to draw up a cash flow statement. Figaroand Company’s x2 statement is set out in Exhibit 18.6.
The statement has three sections – for operating, investing and financing activities – corres-ponding to the three columns in the worksheet. The items in the ‘operating activities’ columnare grouped in order to highlight non-cash items and changes in operating working capital. Welook at alternative ways of presenting cash flows from operations in the next section.
What does the cash flow statement tell us about Figaro’s activities in x2? The companyappears to be growing strongly in x2. Although it is profitable and generates positive OCF thatyear, its internal cash flow is not sufficient to finance its heavy capital expenditure programme.Its free cash flow (defined here as OCF less net capex) is negative. It turns to outside sources –mainly long-term borrowing but also new equity capital – to meet the shortfall. As a result, itsdebt–equity ratio rises from around 40% to over 70% between the start and end of x2.
582 PART 3 • PERSPECTIVES
CFA_C18.qxd 11/6/03 3:20 PM Page 582

CHAPTER 18 • THE CASH FLOW STATEMENT REVISITED 583
Net Cash inflow (+) from, outflow (−) on:Balance sheet change Operating Investing Financingaccount in x2 activities activities activities
Shareholders’ equityRetained profits +11 +17 –6
Net profit DividendShare capital +3# +13Share premium +10$ Issuance
of sharesLiabilitiesLong-term debt +38 +38
Additional loanProvisions +2 +2
Non-cash expenseAccounts payable +6 +6
Increase in A/PTaxes payable –3 –3
Decrease in T/P– Non-cash assetsLand, buildings, and +64 –64equipment (at cost) Purchase– Accumulated depreciation –(+8) +8
Non-cash expenseLong-term investments −3 +3
Disposal*Inventories +9 −9
Increase ininventories
Accounts receivable +7 –7Increase in A/R
Totals, by activity +14 –61 +45
Change in (broad) cash –2
* This is the book value of investments sold. Cash received is only 1, since investments are sold at a loss of 2 (see Exhibit 18.3). The disposal may also be shown as follows:
Operating Investingactivities activities
Long-term investments +2 +1‘Loss on disposal’ ‘Disposal,
(Net profit adjustment) cash proceeds’
Figaro & Company: cash flow worksheet for x2 (amounts in millions)Exhibit 18.5
Presentation of cash flows
Exhibit 18.6 shows a simple cash flow statement. The one investors find in an annual report may well be more complicated. In this section we look more closely at the way cash flow data are presented. We focus on issues where the presentation appears strange or is difficult to
CFA_C18.qxd 11/6/03 3:20 PM Page 583

584 PART 3 • PERSPECTIVES
Figaro & Company Cash Flow Statement for x2
(amounts in millions)
Operating activitiesNet profit 17Adjustments for items not involving cash:
Depreciation +8Increase in provisions +2
27
Changes in operating working capital:Increase in inventories −9Increase in accounts receivable −7Increase in accounts payable +6Decrease in taxes payable −3
−13Cash flow from operations 14*
Investing activitiesPurchase of land, buildings and equipment −64Disposal of investments (at book value) +3
Cash outflow on investing activities −61*
Financing activitiesIssuance of shares +13Increase in debt +38Dividend paid −6
Cash outflow on financing activities +45Net cash flow in x2 −2
Cash and short-term investments, at start-x2 10Cash and short-term investments, at end-x2 8
* If the disposal of investments is shown at the cash amount, the operating and investing activities’sections are modified accordingly:
Operating activitiesNet profit 17Adjustments: Depreciation +8
Increase in provisions +2Loss on disposal of investments +2
29Changes in operating working capital (net) −13
Cash flow from operations 16Investing activitiesPurchase of land, buildings and equipment −64Disposal of investments, cash proceeds +1
Cash outflow on investing activities −63...
The financing activities’ section is unchanged and thus the ‘net cash flow’ is still –2.
Exhibit 18.6
CFA_C18.qxd 11/6/03 3:20 PM Page 584

understand. In each case, we describe the preferred treatment under international accountingrules.11
l Presentation of operating cash flows: the direct approach
In calculating Figaro’s x2 operating cash flow we used the indirect approach. Net profit isadjusted for the effects of accruals in the year. This is the approach used by most companies thatpublish cash flow statements.
Under the alternative direct approach, operating cash flows are stated gross. The first line ofthe ‘operating activities’ section shows operating receipts, which for most companies comprisecash collected from customers during the year. Operating payments – that is, payments formaterials and services, including labour services, made during the year – are deducted from thisfigure. Exhibit 18.7 provides an example of this approach. It is taken from the 2001 consolidatedaccounts of Kone, a large Finnish company that makes, installs and maintains elevators and escalators.
Note that Kone, in line with IAS requirements, provides a reconciliation of profit to cash flowfrom operating activities. Investors can see at a glance the reasons why the two diverge. Thus theyget the benefits of both approaches in one statement.
Investors prefer the direct approach. They find it easier to understand. Accounting regulatorsencourage firms to present operating cash flows in this way. Why then do companies persist inusing the indirect approach? The main reason is cost. Many companies would have to alter theiraccounting systems to produce aggregate operating receipts and payments data. Since there is nointernal demand for this information, they do not gather it.
l Classification of interest and dividends received and paid
Figaro’s net profit of 17 includes investment income and interest charges. As can be seen fromExhibit 18.6, we make no adjustment for them in the operating activities section of Figaro’s x2cash flow statement. As a result, they are, in effect, treated as operating cash flows. This is illo-gical. Interest and dividends received are part of the returns on investment: it would be moreappropriate to show them as investing, not operating, cash inflows. Interest paid is the cost ofdebt: if dividends paid, a cost of equity capital, are shown as a financing outflow, then, logically,interest paid should be too.
IAS permit either the illogical treatment (i.e. that shown in Exhibit 18.6) or the logical one, solong as the company is consistent. Firms following US practice take the illogical route, since USrules require them to. One advantage is that income taxes do not have to be apportioned amongoperating, investing and financing activities. Taxes paid or refunded are shown as part of oper-ating cash flows.
International rules do insist that, whichever treatment is adopted, the company should dis-close the interest and dividends received and paid in the year. Interest cover, a key measure offinancial risk, will be overstated if an investor fails to include in the denominator interest whichhas been paid but which has been capitalised in fixed assets or inventory rather than expensed asincurred.
Irish and UK firms follow a third route. Operating cash flow is stated before interest and tax.Interest and dividends received (returns on investment) and interest and preference dividendspaid (servicing of finance) form a separate section. Income taxes are shown separately; so, too,are ordinary dividends paid. Exhibit 18.8 illustrates the Anglo-Irish version of the cash flowstatement. It is taken from the 2001 consolidated accounts of Waterford Wedgwood, an Irish-owned producer of china and glassware.
CHAPTER 18 • THE CASH FLOW STATEMENT REVISITED 585
CFA_C18.qxd 11/6/03 3:20 PM Page 585

Waterford Wedgwood’s 2001 operating cash flow – before interest and tax – is a68.4 million.The company provides, in the notes to the cash flow statement, a reconciliation of this figure tooperating profit.
l Cash flows from equity method investmentsUnder the equity method of accounting, the investor company recognises as income its share ofthe investee company’s profit or loss in the period. However, the cash return on the investmentis the dividend it receives from the investee. Consider the case of an investor company which,like Figaro, uses the indirect approach to determine operating cash flow. If the starting point ofits OCF calculation is profit including investment income, it must first deduct equity-methodprofit (or add back equity-method losses). It then includes dividends received from the investeeas part of operating (or investing) cash flow. Alternatively, it deducts, from net profit, its share ofthe investee’s undistributed profit for the period.
An example makes this clearer. A company recognises investment income of 9 (million): thisis its share of the investee’s profit. It receives a dividend of 3 from the investee. Thus the incomeit reports overstates the cash return on its investment by 6. It can adjust profit as follows:
Operating activitiesNet profit xxAdjustments to profit:...Less: Share of undistributed profit of associated company –6...Cash flow from operations xx
586 PART 3 • PERSPECTIVES
Million euros 2001 2000
Cash receipt from customers 2,892.2 2,604.0Cash paid to suppliers and employees (2,548.6) (2,366.8)Cash flow from financial items 1.3 (5.6)Cash flow from taxes and other items (90.4) (60.3)
Cash flow from operating activities 254.5 171.3
...Reconciliation of net income to cash flow from operating activities
Net income 141.1 105.6Depreciation 82.4 80.6Minority interest 1.1 0.1
Income before change in working capital 224.6 186.3Change in receivables (30.7) (74.0)Change in payables 15.7 68.2Change in inventories 44.9 (9.2)
Cash flow from operating activities 254.5 171.3
OCF presentation under the direct approachKone: extracts from consolidated statement of cash flows, 2001
Exhibit 18.7
(Source: Kone Corporation, Annual Report 2001.)
CFA_C18.qxd 11/6/03 3:20 PM Page 586

A simpler and clearer way of achieving the same result is for the company to start the oper-ating activities section with ‘Profit before investment income’. In this case, the investor companymakes just one entry in the cash flow statement to record the dividend (of 3) it receives from theinvestee. (Exhibit 18.10 in the Problem Assignments contains an example of this approach.‘Income from associates’ of SFr 133 million, shown under ‘Investing activities’, represents thedividends Nestlé received in 2001 from its associated companies (principally L’Oréal, the Frenchcosmetics producer, in which Nestlé has a 26% stake). Nestlé excludes its share of these com-panies’ profits from the ‘Net profit of consolidated companies’ figure which heads the ‘Operatingactivities’ section of the cash flow statement.)
CHAPTER 18 • THE CASH FLOW STATEMENT REVISITED 587
Year ended 31 DecemberIn B million 2001 2000
Net cash inflow from operating activities 68.4 90.2
Returns on investments and servicing of financeInterest received 2.0 2.1Interest paid (28.0) (26.9)
(26.0) (24.8)
Taxation paid (9.3) (13.4)
Capital expenditure and financial investmentPayments to acquire tangible fixed assets (38.0) (62.5)Receipts from sales of tangible fixed assets 13.7 7.8Net payments for financial assets (0.9) (0.9)
(25.2) (55.6)
Acquisitions and disposalsCosts arising on acquisition of Ashling Corporation (0.7) –Debt assumed on acquisition of Ashling Corporation (4.6) –Acquisition of a further 5.2% of Rosenthal AG (5.3) –Purchase of Hutschenreuther brand and related assets (2.3) (8.4)
(12.9) (8.4)
Equity dividends paid (20.2) (16.8)
Net cash flow before financing (25.2) (28.8)
FinancingIssue of ordinary share capital 1.8 1.7Sale of treasury shares – 8.6New long-term loans 170.4 230.4Repayment of long-term loans (106.2) (250.8)Repayment of capital element of finance lease rentals (0.2) (0.4)
65.8 (10.5)
Increase/(decrease) in cash 40.6 (39.3)
Presentation of cash flow statement under UK/Irish GAAPWaterford Wedgwood: consolidated cash flow statement, 2001
Exhibit 18.8
(Source: Waterford Wedgwood plc, Annual Report and Accounts 2001.)
CFA_C18.qxd 11/6/03 3:20 PM Page 587

l Minority interests and joint venturesA consolidated cash flow statement explains the movement in the group’s cash balance over theyear. This is more than just the parent company’s cash balance. Under global consolidation, itincludes 100% of the cash balances of subsidiary companies as well. As a result, the consolidatedcash flow statement shows the operating, investing and financing cash flows of the parent com-pany and all the companies under its control.
Should the parent own less than 100% of a subsidiary’s shares, it must make adjustments inthe statement for cash flows to and from minority shareholders. For example, where a subsidiarypays a cash dividend, the statement must show, as a group cash outflow, dividends paid to bothparent company shareholders and the subsidiary’s minority shareholders.
In addition, the consolidated cash flow statement may include a ‘minority interests’ adjust-ment under operating activities. If OCF is derived by the indirect approach and the startingfigure is ‘net profit attributable to parent company shareholders’, the minority shareholders’interest in the subsidiary’s profits (losses) must be added back (subtracted) to arrive at groupOCF. We illustrate these points below:
Operating activitiesNet profit to parent company shareholders xx
+ Minority interests (in subsidiary’s profits) +xx+/− Non-cash expenses (of group) +/−xx+/− Change in operating working capital (of group) +/−xx
Cash flow from (group) operations xx
Investing activities− Capital expenditures (of group) −xx
. .. .. .
Financing activities...− Dividends paid to parent company shareholders and
minority shareholders in subsidiary companies −xx. .. .. .Change in cash (and equivalents) of group xx
The accounting treatment of joint ventures dictates the cash flow presentation. Where a jointventure is consolidated on a proportionate basis, the cash flow statement includes the venturer’sshare of the venture’s operating, investing and financing cash flows. Where the joint venture isaccounted for under the equity method, only the venturer’s investments in, and dividends from,the venture are shown in the cash flow statement.
l Acquisitions and disposals of subsidiariesConsolidated cash flow figures can be distorted if a company does not report separately the pur-chase or sale of a subsidiary (or other business unit, e.g. the net assets of a division). For exam-ple, the OCF figure is misstated if, in adjusting net profit for changes in operating workingcapital, the company includes the working capital contributed by subsidiaries acquired in theyear. Such working capital should be viewed as part of the net assets acquired and classified asan investing cash outflow. International standards require firms to show, under investing activ-ities, the net cash flows associated with the acquisition and disposal of subsidiaries. In the notesto the cash flow statement, the firm must disclose the total purchase or sale consideration andprovide a breakdown of the assets acquired or sold and any liabilities assumed or transferred.
588 PART 3 • PERSPECTIVES
CFA_C18.qxd 11/6/03 3:20 PM Page 588

Interbrew’s 2000 accounts illustrate international disclosure requirements well. Belgium-based Interbrew is one of the world’s largest beer producers and has grown rapidly in recentyears largely through acquisitions. Exhibit 18.9 contains details of the investing activities sectionof its 2000 consolidated cash flow statement and the note giving details of the net assets acquired
CHAPTER 18 • THE CASH FLOW STATEMENT REVISITED 589
Investing cash flows and analysis of acquisitionsInterbrew Group: extracts from 2000 accounts
Exhibit 18.9
(Source: Interbrew SA, Annual Report and Accounts 2000.)
In B million 2000
Cash flow from operating activities 871
Investing activitiesProceeds from sale of property, plant and equipment 59Proceeds from sale of intangible assets 3Proceeds from sale of investments 205Acquisition of subsidiaries, net of cash acquired (4,445)Acquisition of property, plant and equipment (465)Acquisition of intangible assets (22)Acquisition of other investments (65)Payments of loans granted (402)
Cash flows from investing activities (5,132)
Cash flows from financing activities 4,594
Net increase in cash and cash equivalents 333
Cash and cash equivalents at beginning of year 321Effect of exchange rate fluctuations on cash held 9
Cash and cash equivalents at end of year 663
Note 3 (condensed) Acquisitions of subsidiaries
Net assets acquired:Property, plant and equipment 1,292Intangible assets other than goodwill 10Financial assets, non-current 368Prepaid employee benefit costs 237Provisions (134)Minority interests (4)Financial creditors, long-term (25)Net working capital 82Cash and cash equivalents 95
1,921Goodwill on acquisition 2,619Consideration paid 4,540Less: Cash and cash equivalents acquired (95)Net cash outflow 4,445
CFA_C18.qxd 11/6/03 3:20 PM Page 589

during the year. The investing activities section shows that Interbrew spent around a400 millionnet on property, plant and equipment in 2000, but over ten times that amount – a4,445 million– acquiring other brewers that year. The firms involved were Whitbread and Bass in the UK and Rogan in the Ukraine. The notes to the accounts give a breakdown by asset (and liability) of the purchase cost of these businesses. (These details have been condensed for the purposes ofthis exhibit.) Interestingly, Interbrew assigns almost 60% (2,619/4,540) of the purchase cost togoodwill.
l Cash flows in foreign currenciesA company with foreign operations – or one that simply conducts business with foreign com-panies – has cash flows denominated in foreign currencies. How does it record these flows in itscash flow statement? The general principle under international rules is that a cash flow in a foreigncurrency should be translated into the reporting currency at the exchange rate prevailing when thecash flow occurs. (If transactions take place evenly during the year, an average rate can be used.)Thus, unrealised foreign currency gains and losses do not appear in the cash flow statement.
We illustrate this with a simple example. Suppose an Italian company has a South Africansubsidiary whose principal asset at the start of x1 is land amounting to R100 million. The sub-sidiary neither buys nor sells land during x1 but the rand weakens from R8.6 : a1 to R9.1 : a1between the start and end of the year. Translating foreign assets at end-year exchange rates (theSouth African subsidiary is an autonomous unit), the Italian group reports a decrease in itsSouth African asset of a0.6 million (11.6 – 11.0) in its x1 consolidated accounts. However, thea0.6 million does not appear in its x1 cash flow statement since no cash transaction has occurred.
Companies with foreign operations usually show an item labelled ‘Exchange rate effect oncash’ (or similar wording – see Exhibit 18.9) next to the start-year cash balance in the cash flowstatement. The purpose of this adjustment is to take account of the effect of exchange ratechanges over the year on start-year foreign currency cash balances. In the case of Interbrew, theforeign currencies in which it held cash at the beginning of 2000 appreciated against the euroduring the year – hence the a9 million positive adjustment to start-year cash in the 2000 cashflow statement.
l Non-cash transactionsSome accounting transactions bypass the cash account completely. A company may swap cap-ital (e.g. debt for equity) or assets (property for investments). It may acquire another companyby issuing and distributing its own shares to the owners. Such transactions involve neither thereceipt nor the payment of cash. As a result, they are not recorded on the cash flow statement.IAS, however, requires companies to disclose separately the impact of material non-cash trans-actions in order to give the financial statement user a fuller picture of a firm’s investing andfinancing activities in the period.
l New developments in the presentation of cash flow dataThe cash flow statement is still evolving. As we have already seen, accounting rule-makers in cer-tain countries require domestic firms to present cash flow data in a different form and in greaterdetail than international rules demand. Some firms are voluntarily providing additional cashflow information in response to investor requests. We look at two recent innovations which maywell be adopted by international regulators in the future.
The first concerns the firm’s capital expenditures on tangible and intangible fixed assets – or‘capex’ for short. Some firms estimate the maintenance and expansion components of capex.
590 PART 3 • PERSPECTIVES
CFA_C18.qxd 11/6/03 3:20 PM Page 590

CHAPTER 18 • THE CASH FLOW STATEMENT REVISITED 591
This allows investors to calculate the firm’s free cash flow directly. (In an earlier section, wedefined free cash flow as available cash flows less maintenance capital expenditures. OCF is oftenused as a proxy for available cash flows.) Orkla, a large Norwegian group with industrial andfinancial interests, breaks down capital expenditures in its industrial division in this way. In fact,it reports the division’s free cash flow on the face of the group’s cash flow statement.
In the second innovation, firms link the change in their cash balance to the change in theirnet indebtedness. ‘Net indebtedness’ is simply debt (i.e. interest-bearing liabilities includingfinance leases) less liquid assets (broad cash and short-term marketable securities). Why is thisfigure of interest to investors? We noted in Chapter 11 that many investors measure leverage interms of net debt since debt-laden companies may carry large amounts of cash for hedging orinvestment reasons. Moreover, companies themselves often combine the management of cashand debt. This is one of the key tasks of a firm’s treasury department. For these reasons the sep-aration of flows of short-term financial investments, debt and cash on the face of the IAS-stylecash flow statement may be artificial and potentially misleading. Irish and UK companies arerequired under national accounting rules to analyse the change in net debt over the year in a sup-plementary note to the cash flow statement. Swedish companies define the bottom line of thecash flow statement in broad terms: where the firm has net debt, the bottom line is the changein financing (or net debt) rather than the change in cash.
Summary
Here’s a nice irony: cash is a well-understood asset that has been around for millennia; the cashflow statement is a new financial statement which perplexes many readers of annual accounts.
Investors are alive to the benefits from analysing a company’s cash flows. As we discuss in thechapter, they use cash flow data to:
l assess a company’s debt-paying ability – they monitor its cash-based liquidity and leverageratios and estimate the future cash flows that are available for servicing its debts;
l construct alternative performance measures – cash-based ratios can provide more comparablemeasures of corporate performance than accrual-based ones, because they overcome differ-ences in accrual accounting practices among firms;
l gain strategic insights – investors look at a company’s cash flow profile to better predict itsgrowth prospects. The composition of its cash flows sheds light on management’s investmentand financing decisions;
l gauge incidence and extent of earnings manipulation – by monitoring the size and direction ofaccruals, investors get early warning of any attempts by management to increase or smooththe company’s earnings.
So useful are cash flow data that investors will construct an approximate cash flow statementif a company does not provide one. We showed how this can be done, using start- and end-period balance sheets and income statement data.
Why then do many investors find published cash flow statements puzzling? The main reasonis the way cash flow data are presented.
l Most firms use the indirect approach to calculate operating cash flow: gross operating receiptsand payments are not disclosed.
l Some investing and financing flows (e.g. interest received and paid) may be shown as operat-ing flows.
l The emphasis on the cash flow impact of transactions (e.g. corporate acquisitions and operationsin foreign currencies) may make it difficult for investors to reconcile cash flow numbers withthose in the balance sheet and income statement. We illustrated these points in the chapter.
CFA_C18.qxd 11/6/03 3:20 PM Page 591

592 PART 3 • PERSPECTIVES
But there is another reason for investor confusion. The activity-based cash flow statementlacks the hierarchical structure of the income statement or balance sheet. The statement’s ‘bottom line’ – the change in cash in the period – is not easy to interpret, unlike net profit or loss,its income statement counterpart. Investors must rearrange the data (and on occasion make estimates) to calculate key numbers such as free cash flow.
Problem assignments
P18.1 Cash flow statements: initial analysisSwiss-based Nestlé is the world’s largest consumer foods company with 2001 sales of A56 billion. It’sbest known for its beverage (Nescafé), bottled water (Perrier, Vittel) and confectionery (Kit Kat)brands. In recent years, it has expanded its petfood business through acquisitions of companies(Spillers (1998), Ralston Purina (2001)). Its consolidated cash flow statement for calendar 2001 is setout in Exhibit 18.10.
Nestlé prepares its cash flow statement according to IAS. The statement has certain unusual features, however. ‘Net profit of consolidated companies’ (the first item under ‘Operating activities’)is group net profit, i.e. before taking account of minority interests in subsidiaries’ profits and Nestlé’sshare of associated companies’ profits. (The dividend Nestlé received from associated companies is shown against ‘Income from associates’ under ‘Investing activities’.) Nestlé shows changes in marketable securities and short-term investments under ‘Financing activities’: management view liquid assets as part of net debt and thus changes in these assets are presented alongside changesin debt.
Required
(a) Prepare an initial analysis of Nestlé’s cash flows in 2000 and 2001. Condense the company’s cashflow statement and calculate the following key numbers for both years:(i) Free cash flow (defined as OCF less net capex and dividends paid);(ii) Net cash flow before financing;(iii) Net increase or decrease in debt;(iv) Net increase or decrease in liquid assets.
(b) As part of your analysis, answer the following questions:(i) Was the company self-financing in 2000 and 2001? If it was, how did it deploy the cash
surplus? If it was not, how did it finance the shortfall?(ii) Were there any major events affecting the company’s investment strategy or financial struc-
ture in either year? If so, how did they affect the company’s cash flows?
P18.2 Assessing financial risk using cash flow dataFranz, an analyst at a large insurance company, receives the following e-mail from Sylvie, his boss.
‘Can you take a look at Unilever’s financial leverage for me? I’m concerned about the impact ofthe Bestfoods acquisition in 2000. It played havoc with their balance sheet. Their profitability seemsto have recovered in 2001 but their debt levels still look very high.
‘I’m particularly interested in the group’s net debt-to-Ebitda ratio. I read that Procter & Gamble,Unilever’s big rival in the household products market, had a net debt-to-Ebitda ratio of only 1.37 in 2001/02 and it’s been pretty steady in recent years (2000/01: 1.39; 1999/2000: 1.33). How doesUnilever compare with P&G on this ratio?
CFA_C18.qxd 11/6/03 3:20 PM Page 592

CHAPTER 18 • THE CASH FLOW STATEMENT REVISITED 593
In millions of Swiss francs 2001 2000
Operating activitiesNet profit of consolidated companies 6,338 5,580Depreciation of property, plant and equipment 2,581 2,737Impairment of property, plant and equipment 222 223Amortisation of goodwill 494 414Depreciation of intangible assets 150 179Impairment of goodwill 184 230Increase/(decrease) in provisions and deferred taxes (92) (4)Decrease/(increase) in working capital (870) (368)Other movements (393) (140)
Operating cash flow 8,614 8,851
Investing activitiesCapital expenditure (3,611) (3,305)Expenditure on intangible assets (288) (188)Sale of property, plant and equipment 263 355Acquisitions (18,766) (2,846)Disposals 484 780Income from associates 133 107Other movements 143 39
Cash flow from investing activities (21,642) (5,058)
Financing activitiesDividend for the previous year (2,127) (1,657)Purchase of treasury shares (1,133) (765)Sale of treasury shares and options 880 1,837Premium on warrants issued 209 81Movements with minority interests (172) (221)Bonds issued 3,338 1,016Bonds repaid (380) (1,143)Increase/(decrease) in other long-term financial
liabilities (71) (155)Increase/(decrease) in short-term financial liabilities 16,754 921Decrease/(increase) in marketable securities and
other liquid assets (2,330) (2,788)Decrease/(increase) in short-term investments 216 1,452
Cash flow from financing activities 15,184 (1,422)
Translation differences on flows 60 (175)
Increase/(decrease) in cash and cash equivalents 2,216 2,196
Cash and cash equivalents at beginning of year 5,451 3,322Effects of exchange rate changes on opening balance (29) (67)Cash and cash equivalents retranslated at beginning
of year 5,422 3,255Fair-value adjustment on cash and cash equivalents (21) –
Cash and cash equivalents at end of year 7,617 5,451
Nestlé Group: consolidated cash flow statement, 2001Exhibit 18.10
(Source: Nestlé Group, Annual Accounts 2001.)
CFA_C18.qxd 11/6/03 3:20 PM Page 593

‘There’s another cash flow measure of financial leverage I’d like you to calculate. It’s called thecash flow adequacy ratio – or CFAR. The folks at Fitch, the credit rating agency, devised it.12 It’s calculated as follows:
CFAR =
where:Net free cash flow = Ebitda – Taxes paid – Interest paid – Preference dividends – Capex, netAverage annual debt maturities . . . = (Debt principal payments due in next five years)/5
‘Fitch claims CFAR is a reliable indicator of changes in corporate credit quality. P&G had a CFAR of2.9 in 2001/02. According to Fitch, that shows financial strength: in effect, the company’s free cashflow covered average debt payments 2.9 times that year.’
Franz collects income and balance sheet data from the 1999–2001 accounts of the Anglo-Dutchfood and household products group (see Exhibit 18.11). In addition, he extracts the following cashflow information from the group’s cash flow statements for these years.
2001 2000 1999
Income taxes paid 1,887 1,734 1,443Interest paid (net of interest received) 1,651 620 58Capital expenditures (net of disposals) 957 890 1,249
He’s about to start work on the assignment when he gets called away on another project. He asksyou to complete the assignment for him.
Required
(a) Calculate Unilever’s net debt-to-Ebitda and CFAR ratios for each of the three years 1999–2001.Identify the main reasons for the changes in the two ratios over this time. Do the two ratios sendthe same signals about the group’s credit quality and changes in it? If not, why not?
(b) Compare the two ratios, net debt-to-Ebitda and CFAR. Which of these ratios, in your opinion, pro-vides a more accurate and reliable measure of a firm’s debt-paying ability – and why?
P18.3 Detecting earnings manipulation with cash flow dataManagers sometimes try to inflate reported corporate earnings using dubious accounting techniques.Careful inspection of the cash flow statement may help investors unmask such manipulation.Consider the following examples.
(1) Unable to persuade customers to pay licensing fees for the use of its technology, SIT Companyenters into ‘advertising agreements’ with some of them. Under the agreements, customers agreeto carry out certain ‘advertising’ for SIT in exchange for technology licences. The advertising feescharged by the customers match the licensing fees SIT charges them so that SIT (and its cus-tomers) experience no net cash inflow or outflow as a result of the transactions. SIT books thelicensing fees as current revenue but defers recognition of the advertising costs. As a result, itreports a profit from the exchange of services.
(2) AC, a carpet retail chain, states that its policy is to recognise revenue on a carpet sale only whenthe carpet has been delivered and fitted. The customer pays for the carpet before delivery occurs.As a result of pressure on store management to meet sales targets in a recent year, many storesbrought forward the recognition of revenues on carpet sales made in the last two weeks of thatyear to the date of payment.
(3) B, a pharmaceutical company, normally books revenues when it ships goods to distributors.Recently, management became concerned that the company would not be able to meet stock
Annual net free cash flowAverage annual debt maturities over next 5 years
594 PART 3 • PERSPECTIVES
CFA_C18.qxd 11/6/03 3:20 PM Page 594

CHAPTER 18 • THE CASH FLOW STATEMENT REVISITED 595
In B million 2001 2000 1999
Consolidated profit and loss account (condensed)
Group turnover 51,514 47,582 40,977
Group operating profit* 5,174 3,302 4,303Share of operating profit of joint ventures 84 57 42Other income from fixed investments 12 (4) 10Interest expense, net (1,646) (632) (14)
Profit on ordinary activities before taxation 3,624 2,723 4,341Taxation on profit (1,547) (1,403) (1,369)
Profit on ordinary activities after taxation 2,077 1,320 2,972Minority interests (239) (215) (201)
Net profit 1,838 1,105 2,771
Preference dividends (51) (44) (20)Dividends on ordinary capital (1,530) (1,414) (1,245)
Result for the year retained 257 (353) 1,506
* After deducting ‘Depreciation and amortisation’ 2,845 1,954 1,147
Consolidated balance sheet at 31/12 (condensed)
Fixed assets 35,221 37,463 9,606
Current assets other than cash 15,876 17,564 14,286Cash 1,862 2,613 3,996Borrowings, current (11,279) (16,675) (2,936)Trade and other creditors, current (11,933) (11,689) (9,198)
Net current assets (5,474) (8,187) 6,148
Total assets less current liabilities 29,747 29,276 15,754
Borrowings, non-current** 14,221 13,066 1,853Other long-term liabilities 7,667 7,423 5,561
Minority interests 664 618 579
Capital and reserves 7,195 8,169 7,761
Total capital employed 29,747 29,726 15,754
** Of which payable within five years (i.e. between years 2 and 5) 11,000 9,775 1,576
Unilever Group: summary income and balance sheet data, 1999–2001Exhibit 18.11
(Source: Unilever Group, Annual Report and Accounts 2000 and 2001.)
market expectations about annual sales and earnings growth. It persuaded distributors to increasepurchases of its products at the end of its financial year by offering them ‘bill and hold’ terms. Underthis policy, a distributor can delay paying for goods it buys. It orders goods from B and has themdelivered to its warehouse. However, it pays for them only when they’re shipped at a later date fromthe warehouse to the final customer (e.g. pharmacy, hospital, clinic). Meanwhile, B recognises rev-enue on delivery of the goods to the warehouse.
CFA_C18.qxd 11/6/03 3:20 PM Page 595

Required
Each of the above accounting policies creates a difference between profit and operating cash flow inthe period. Identify the account or accounts where the difference appears. How might an investor useinformation from the cash flow statement to detect the manipulation of earnings in each case?
P18.4 Construction of a cash flow statement IYou are Emil. You have an eye for numbers. Geppetto, a puppet-maker, is troubled and asks for yourhelp. ‘We had a good year last year. After-tax profits were 13 million. How then can our cash havefallen by 2 million? Can you take a look at last year’s accounts and tell me what’s going on? I can’tmake head or tail of these accounts and people tell me you’re quite a financial detective when itcomes to balance sheets.’
He gives you the balance sheets of the company at 31 December x3 and x4. These are set out inExhibit 18.12.
596 PART 3 • PERSPECTIVES
Geppetto CompanyBalance sheets at 31 December x3 and x4
(amounts in millions, except per-share figures)
x4 x3Fixed assets Buildings and equipment:
Cost 64 58Less: Accumulated depreciation –26 –25Net book value 38 33
Investments 7 1145 44
Current assetsInventory 19 18Accounts receivable 16 13Cash 3 5
38 36
Total assets 83 80
Shareholders’ equityShare capital (par value 5) 22 20Share premium 5 5Retained profits 23 18
50 43Long-term liabilitiesPension and other provisions 11 10Bonds payable, net of discount 0 9
11 19Current liabilitiesBank loan 8 2Accounts payable and accrued liabilities 10 13Corporate income taxes payable 4 3
22 18
Shareholders’ equity and liabilities 83 80
Exhibit 18.12
CFA_C18.qxd 11/6/03 3:20 PM Page 596

In addition, you uncover the following information about the company in x4. (All amounts exceptper-share figures are in millions.)
1 The company spends 21 on new buildings and equipment. It sells, for 9, fixed assets with a netbook value of 11. Depreciation charged in the year is 5.
2 It sells investments with a carrying amount of 4 and reports a gain on sale of 1.5.3 It pays a cash dividend of 1.5 a share during the year. At the end of the year, it declares and
distributes a 10% share dividend to shareholders. There are no other issues of shares in the year.4 Profit before tax is 20. Income tax expense is 7.5 The bonds are retired at the start of the year and 9.5 is paid to bondholders.
Required
Prepare a cash flow statement for Geppetto Company, showing the flows of cash in x4 by activity.Draft a brief memo to Geppetto explaining the reason for the decline in cash in the year.
P18.5 Construction of a cash flow statement II
PaintPot is a manufacturer and distributor of decorative paints for use inside and outside the home. The company’s x4 income statement and end-x3 and end-x4 balance sheets are set out inExhibit 18.13. The notes to the accounts contain the following additional information. (All amountssave per-share amounts are in A millions.)
1 The company purchases equipment (tangible fixed assets) for 13.8 cash in x4.2 PaintPot accounts for its stakes in associated companies by the equity method. It makes no new
investments or disposals during x4.3 All sales are on account. The company writes off bad debts of 8.9 in x4. Bad debt expense is
included in ‘Other operating costs’ on the income statement.4 The company issues one million new A5 par value shares at A12/share towards the end of x4 to
finance the planned acquisition of a wallpaper manufacturer. Issuance costs of 0.4, all paid in theyear, are charged against share premium.
5 Dividends are declared and paid in the same year.6 PaintPot issued at par 10-year 10% bonds at the start of x1. The market rate of interest for debt
of equivalent risk and maturity falls below 6% in x4 and the company decides to refinance thedebt. It retires all the 10% bonds at the end of x4 and at the same time issues new 10 year 6%debt securities with a total face value of 35 at a price of 102 (per cent) yielding 5.73% to maturity.
7 Interest expense (income) is approximately equal to interest paid (received) in x4.
Required
Prepare a cash flow statement for PaintPot for x4, using balance sheet and income statement data.Present cash flows by activity. Use the indirect method to determine operating cash flow. Assumeinterest charges, investment income, interest income and taxes are classified as operating cash flows.
Check figure:Net cash flow from operations 28.8
P18.6 The cash flow statement: alternative format
An investor asks you to explain some features of the cash flow statement of Thorntons, a UK con-fectionery producer and retailer, that puzzle her.
‘Thorntons’ cash flow statement has a strange format. It doesn’t have the usual three-way split ofoperating, investing and financing cash flows. For example, take the statements for the years to end-June 2001 and 2002 (see [A] below: all the numbers are in £ millions). I can see an operating cash flownumber but where are the investing and financing cash flow subtotals?
CHAPTER 18 • THE CASH FLOW STATEMENT REVISITED 597
CFA_C18.qxd 11/6/03 3:20 PM Page 597

598 PART 3 • PERSPECTIVES
Consolidated income statement for x4(in B million)
Sales revenue 474.3Cost of sales −275.3*Other operating costs −161.2
Operating profit 37.8Exceptional items: Gain on disposal of tangible fixed assets +4.8
Loss on early retirement of bonds −5.9–1.1
Profit after exceptional items 36.7Interest expense −4.4Interest income +2.3
Profit before tax 34.6Income tax expense −11.3
Profit of consolidated companies after tax 23.3Share of net profit of associated companies +2.4Minority interests −2.9
Net profit for the year 22.8
* Includes depreciation of 10.8.
Consolidated balance sheets at 31 December(in A million, save per-share amounts)
x4 x3 x4 x3
Fixed assets Shareholders’ equityTangible, at cost 104.6 105.5 Share capital (A5 par) 38.5 33.5Less: Accumulated depreciation −29.7 −32.3 Share premium 41.7 35.1
74.9 73.2 Retained profits 66.7 64.0Investments in associated 146.9 132.6
companies 10.5 9.6 Minority interests 11.8 9.785.4 82.8 158.7 142.3
Long-term liabilitiesCurrent assets Bonds payable 35.7 30.0Inventories 82.3 74.2 Restructuring provision 6.8 12.6Trade receivables 102.1 91.2 42.5 42.6Less: Allowance for bad debts −7.7 −7.1 Current liabilities
94.4 84.1 Bank loans 31.0 22.5Prepayments and accrued income 10.9 17.0 Trade payables 75.1 65.8Cash at bank and in hand 63.5 43.4 Income tax payable 11.7 10.1
251.1 218.7 Accrued expenses 17.5 18.21 35.3 116.6
Total shareholders’ Total assets 336.5 301.5 equity and liabilities 336.5 301.5
PaintPot Company: x4 income statement and end-x4 balance sheetExhibit 18.13
CFA_C18.qxd 11/6/03 3:20 PM Page 598

[A] 2002 2001
Cash inflow from operating activities 21.2 21.1Returns on investments and servicing of finance* (3.5) (4.1)Taxation 0.5 0.9Capital expenditure and financial investment (2.8) (1.6)Equity dividends paid (4.5) (4.5)Cash inflow before use of liquid resources and financing 10.9 11.8Management of liquid resources (2.3) 0.2Financing – decrease in debt (10.7) (10.7)(Decrease)/increase in cash in the period (2.1) 1.3
* Interest received 0.3 0.2Interest paid (3.3) (3.8)Interest element of finance lease rental payments (0.5) (0.5)Returns on investments and servicing of finance (3.5) (4.1)
‘I’m also not sure about the “Cash inflow from operating activities” number. Thorntons seems toderive it from operating profit rather than after-tax profit. I’d like to compare the company’s debt to OCF ratio with that of Swiss and Belgian chocolate makers that follow IAS. How do I adjustThorntons’ OCF number so that it’s comparable? The company includes the following reconciliationin the notes to the 2001/02 accounts:
[B] 2002 2001
Operating profit 10.4 10.1Loss on disposal of fixed assets 0.4 0.1Depreciation and amortisation charges 13.5 13.1Decrease in provisions (0.5) (0.7)Operating cash flows before working capital movements 23.8 22.6(Increase)/decrease in stocks (0.8) 3.8(Increase) in debtors (1.7) (1.4)(Decrease) in creditors (0.1) (3.9)Net cash inflow from operating activities 21.2 21.1
‘One final point. Thorntons provides a reconciliation of net cash flow to the movement in net debt(see [C] below). I’ve not seen this in IAS-style cash flow statements before. On the face of it, this is agood idea. But the reconciliation makes me doubtful about the reliability of the numbers in the cashflow statement. For example, it shows net debt falling from £52.3 million at the start of 2000/01 to£37.2 million at the end of 2001/02, a decline of only £15.1 million.
[C] 2002 2001
(Decrease)/increase in cash in the period (2.1) 1.3Cash outflow from decrease in debt 10.7 10.7Cash outflow/(inflow) from increase/(decrease) in liquid resources 2.3 (0.2)Change in net debt resulting from cash flows 10.9 11.8Inception of new finance leases (3.7) (4.1)Translation difference 0.1 0.1Movement in net debt in the period 7.3 7.8Net debt at beginning of period 44.5 52.3Net debt at end of period 37.2 44.5
‘But according to the cash flow statement, net debt decreased by £22.7 million over the two years.Thorntons seems to have excluded the effect of new finance leases from the cash flow statement.Why have they done this? Surely the finance leases have a cash flow impact?’
CHAPTER 18 • THE CASH FLOW STATEMENT REVISITED 599
CFA_C18.qxd 11/6/03 3:20 PM Page 599

600 PART 3 • PERSPECTIVES
Required
(a) Identify the cash flows in [A] that would be shown under ‘Investing activities’ and ‘FinancingActivities’ in an IAS-style cash flow statement.
(b) Calculate the operating cash flow number that Thorntons would report in the bottom line of the‘Operating Activities’ section of an IAS-style cash flow statement.
(c) Explain why Thorntons has excluded new finance leases from financing flows in the cash flowstatement.
P18.7 Financing statement: conversion to cash basisSpanish companies include a ‘financing statement’ in their published accounts in place of a cash flowstatement. It shows the sources and uses of the company’s funds in the period, where the term‘funds’ indicates working capital (current assets less current liabilities) rather than cash. The state-ment can be converted to a cash basis. However, the resulting cash flow statement is approximatesince key cash flow numbers (e.g. changes in working capital excluding the effects of acquisitions anddisposals of businesses in the year) are not disclosed.
Compañía Logística de Hidrocarburos (CLH) is a company providing logistics services – mainlytransport and storage of oil products – in mainland Spain and the Balearic Islands. Key operating datafor the 1998–2001 period are given below:
In Bm 2001 2000 1999 1998
Operating revenues 541 517 479 468Net income 163 124 125 103
The company undertook a financial restructuring in 2001, replacing equity capital with debt. The aim, according to the company, was to increase returns on equity and thereby attract new shareholders.
CLH includes a financing statement in its 2001 accounts (see Exhibit 18.14). It describes it in theEnglish-language version of the accounts as a ‘statement of changes in financial position’.
Required
(a) Convert CLH’s 2001 statement of changes in financial position to a cash basis. Analyse cashflows by operating, financing and investing activities. Use the ‘Funds obtained from operations’figure as the starting point of the ‘Operating activities’ section. This figure is the sum of profit,depreciation and other long-term accruals.
(b) The company reported a major change in its financial balances in 2001 – from net cash of A153.3million at the end of 2000 to net debt of A161 million a year later.
At 31 December 2001 2000
Short-term financial investments 1.4 152.3Cash 22.4 2.7– Long-term debt (183.4) (1.0)– Short-term debt (1.4) (0.7)
Net cash/(debt) (161.0) 153.3
Using the information in the cash flow statement you prepared in (a), explain the main reasons for theA314.3 million change in CLH’s net financial position in 2001.
Check figure:(a) Cash flow impact from change (A000)
in operating working capital +71,698
CFA_C18.qxd 11/6/03 3:20 PM Page 600

CHAPTER 18 • THE CASH FLOW STATEMENT REVISITED 601
In D000 2001
Application of funds
Tangible fixed asset additions 96,507Dividends 506,745Repayment, or transfer to short-term, of long-term debt 388Provisions for contingencies and expenses 20,442
Total funds applied 624,082
Source of funds
Funds obtained from operations 151,786Fixed asset disposals 85,808
Tangible fixed assets 29,288Long-term financial investments 56,520
Long-term debt 182,879Reduction in working capital 203,609
Total funds obtained 624,082
Variation in working capital
Inventories (11,422)Accounts receivable 74,588Accounts payable (135,331)Short-term debt (657)Short-term financial investments (150,906)Cash 19,652Accrual accounts 467
Total variation in working capital (203,609)
Funds obtained from operations
Income for the year 163,162Add:
Period depreciation and amortization 61,988Provision for contingencies and expenses 19,726Deferred corporate income tax asset 473
Less:Provisions transferred to income 453Capital subsidies transferred to income 4,653Gain on fixed asset disposals 62,227Deferred corporate income tax liability 26,230
Total funds 151,786
CLH: consolidated statement of changes in financial position, 2001Exhibit 18.14
(Source: Compañía Logística de Hidrocarburos (CLH), Annual Accounts 2001.)
CFA_C18.qxd 11/6/03 3:20 PM Page 601

602 PART 3 • PERSPECTIVES
Notes to Chapter 18
1 In the case of banks and other financial institutions, ‘Operating activities’ include the granting of loansand the acceptance of deposits. Similarly, stockbrokers classify the purchase and sale of securities theydeal in as operating cash flows.
2 There are other dimensions to financial risk. For example, investors monitor price risk, that is theeffect of changing prices (including changes in interest rates and exchange rates), on the company’sbusiness and its finances. We focus on credit risk because the cash flow statement is of most benefit inassessing this type of risk.
3 Sorter, G. and Benston, G. (1960), Appraising the defensive position of a firm: the interval measure,The Accounting Review, October: 633–640.
4 Empirical evidence supports this. For example, Dechow found that over various reporting periods(quarterly, annual, four-yearly) US companies’ stock market returns were more closely associated withearnings than with cash flows. (Dechow, P. (1994), Accounting earnings and cash flows as measuresof firm performance: the role of accounting accruals, Journal of Accounting and Economics, 18: 3–42.)
5 Barth, M., Cram, D. and Nelson, K. (2001), Accruals and the prediction of future cash flows, TheAccounting Review, 76(1): 27–58.
6 Applying the EV/Ebitda multiple to a firm’s current (or projected) Ebitda gives an estimate of thevalue of the business (i.e. the firm’s net operating assets). To estimate the value of equity, subtract thefirm’s net debt at that date.
7 See Kotler, P. (2002), Marketing Management, 11th edition, Upper Saddle River, NJ: Prentice Hall,Chapter 11, for a fuller discussion of the concept of product lifecycles. See also Stickney, C. (1996),Financial Reporting and Statement Analysis, 3rd edition, Fort Worth, TX: Dryden Press, Chapter 2.Stickney applies the product lifecycle concept to corporate cash flows.
8 Dechow, P., Sloan, R. and Sweeney, A. (1996), Causes and consequences of earnings manipulation: ananalysis of firms subject to enforcement actions by the SEC, Contemporary Accounting Research, 13(1):1–36. Dechow et al. derive total accruals using balance sheet numbers (∆Current assets − ∆Current liab-ilities − ∆Cash + ∆Short-term debt – Depreciation and amortisation expense) since US firms were notrequired to publish cash flow statements before 1988. However, accruals are measured with error thisway as the effects on working capital of businesses acquired or sold are not excluded from the changesin current assets and liabilities.
9 Where a firm has a bank overdraft (i.e. a bank loan that is repayable on demand), it may, under inter-national rules, deduct it when computing the ‘Cash and cash equivalents’ figure.
10 If Figaro had non-current trade receivables and payables (i.e. where amounts are due more than oneyear after the balance sheet date), any increase or decrease over the year should be included – as anadjustment to profit – in calculating OCF.
11 International Accounting Standards Board, IAS 7: Cash Flow Statements.12 Wolkenfeld, S. (1998), CFAR: a new tool for predicting credit quality, Journal of Applied Corporate
Finance, 11(1): 121–124.
CFA_C18.qxd 11/6/03 3:20 PM Page 602

Financial statement analysis:basic framework
INTRODUCTIONIn this chapter and the next, we explain and illustrate many of the techniqueswhich investors use to analyse a company’s financial statements. We draw on the accounting skills we’ve gained in the previous chapters to do so. It’spossible to analyse financial statements with only a general knowledge ofaccounting. However, the deeper our understanding of corporate accountingand reporting practices, the sharper our analysis will be.
As we saw in Chapter 1, the users of financial statements – and their infor-mation needs – are many and varied. We focus in this and Chapter 20 oninvestors and their needs. Note that questions of concern to investors – How isthe firm doing? What are its prospects? What are the potential risks frominvesting in it? – are also of interest to creditors, employees and customers. Tohelp answer these questions, investors seek information about the firm’s cur-rent and past profitability and risk from its published accounts. This is the coreof financial statement analysis. (Some question one aim of such an analysis,namely to uncover mispricing of quoted securities, given the ‘efficiency’ ofmost capital markets. We examine this issue in Appendix 19.1.)
In this chapter we set out a simple framework for analysing a company’sfinancial statements. This involves the following steps:
1 Understand the business environment it faces. Investors gather both firm-specific information (e.g. product mix, market focus, management skills) andgeneral information about the industries and economies in which it operates.
2 Summarise the financial data in its accounts in a purposeful way. Investorsplot trends in sales and earnings over time. They compare firms by common-sizing financial statements. They also use financial ratios to assess a firm’sprofitability and risk.
3 Interpret the ratios in the light of the knowledge gained about the firm andits environment.
We use the recent financial statements of a major European brewing company,Carlsberg, to illustrate the above steps.
A firm can make profits but fail to create wealth for its shareholders. Onlyif its profitability is greater than its cost of capital will shareholders be betteroff. In the final section, we show how investors estimate the shareholder wealtha firm has created – or destroyed – in a period.
1919
l Understanding thecompany and itsenvironment
l Trend and cross-section analyses offinancial data
l The investor’sfinancial ratio toolkit
l Profitability, risk andcash flow analysisillustrated
l Residual income
l Appendix 19.1:Market efficiency andits implications
l Appendix 19.2:Carlsberg Group –annual accounts for2001
In this chapter
CFA_C19.qxd 11/7/03 2:16 PM Page 603

604 PART 3 • PERSPECTIVES
Understanding the company and its environment
Investors do not analyse a company’s financial statements in a vacuum. They need to have agood understanding of the industry the company operates in and the markets it serves. Byanalysing the economic conditions a company faces, investors can form expectations about itsfinancial performance which they can then test against its published results.
The structure of an industry has a direct bearing on the profitability of companies in it. Onewell-known framework that relates profitability to industry structure is Porter’s ‘five forces ofcompetition’ model.1 Exhibit 19.1 presents Porter’s model in diagrammatic form.
Each of these five forces affects industry profitability. The more intense the competition withinthe industry, the more potent the threats from new entrants or substitute products, and thegreater the bargaining power of suppliers or customers, the smaller the economic rents (returnsin excess of the cost of capital) firms within the industry can earn.
Porter identifies the main constituents of each of the five forces. Consider rivalry within theindustry. Competition is likely to be fierce where there are many firms in the industry all sellinga similar product. In this case competition is price-based. But even in industries dominated by afew firms selling differentiated products, competition can erode profits if the firms are diverse(so they have difficulty agreeing to limit competition) and demand is stagnant or declining (sofirms fight for market share). Note that if firms can differentiate their products, they will tend tocompete through advertising and product innovation rather than on price.
Industry profitability is likely to be low if other firms can enter (and leave) the industry easily.So barriers to entry should raise industry profitability. Sometimes the barriers are inherent in theproduction or distribution process (e.g. production economies of scale). Sometimes they are created by government regulation or law (e.g. patents). Incumbent firms erect barriers to entryby differentiating their products and retaliating swiftly when new firms invade their markets.
There are substitutes for most goods and services. Whether buyers are willing to switchdepends on how sensitive demand is to price changes. Where demand is price-sensitive (in technical terms, price-elastic), the threat posed by substitutes is greater and industry profitability
Industry structure and profitability: Porter’s ‘five forces of competition’ modelExhibit 19.1
Source: Adapted with the permission of The Free Press, a Division of Simon & Schuster Adult Publishing Group, from Competitive Strategy: Techniques for Analyzing Industries and Competitors by Michael E. Porter. Copyright © 1980,1998 by The Free Press.
CFA_C19.qxd 11/7/03 2:16 PM Page 604

CHAPTER 19 • FINANCIAL STATEMENT ANALYSIS: BASIC FRAMEWORK 605
will be lower. Firms may try to reduce this threat by distancing their products from substitutes.Again, the tactics they use include product innovation and advertising.
The bargaining power of customers and suppliers also affects industry profitability. Considercustomers’ bargaining power. A customer who is large (relative to a supplier) or has a large mar-ket share can put pressure on prices and drive down a supplier’s profits. A customer is also in astrong bargaining position if there’s little cost to switching suppliers or it can arrange the supplyitself (e.g. through backward integration). As with substitutes, price is important. Where cus-tomers are sensitive to price changes – because of competitive conditions in their industry orbecause of the importance of the product in their own costs – their bargaining power is increasedand suppliers’ profitability suffers. Note that suppliers’ bargaining power is the mirror image ofthat of customers.
l Illustration: the brewing industry . . .The company whose financial statements we’ll analyse in this chapter is Carlsberg, a Danish-owned international beer producer. Before doing so, we examine briefly the brewing industry –its structure, products and markets – and consider the likely impact of Porter’s five competitiveforces on industry profitability.
IndustryThe brewing industry consists of many small producers and a few very large ones. For example,in 2000 there were 1,650 breweries in the European Union employing 110,000 people and pro-ducing about 310 million hectolitres of beer. In Germany alone there were 1,141 plants each pro-ducing less than 100,000 hectolitres a year. At the other end of the scale, there were four groupswith annual production of more than 50 million hectolitres. Carlsberg was one of them. Thestructure of the industry suggests there are two types of producer: the small brewer supplying adistinctive product to a local market, and the large company supplying standard beers to anational or international market. By concentrating production and setting up sophisticated dis-tribution facilities, the big brewer can enjoy significant economies of scale. The estimated 2000sales volume figures for the ten largest brewers are given in Exhibit 19.2.
Except for health regulations that apply to all food and drink producers, the production ofbeer is not regulated. However, the brewing industry does face restrictions on the sale of beer
2000 sales volumeRank Company (country) (million hectolitres) Leading brand(s)
1 Anheuser-Busch (USA) 158 Budweiser2 SAB/Miller* (South Africa/USA) 109 Castle, Miller3 Interbrew (Belgium) 87 Stella Artois, Labatt4 Heineken (Netherlands) 72 Heineken, Amstel5 Ambev/Quilmes* (Brazil) 68 Brahma6 Scottish & Newcastle (UK) 55 Kronenbourg7 Carlsberg (Denmark) 54 Carlsberg, Tuborg8 Coors (USA) 39 Coors9 Asahi (Japan) 35 Asahi
10 Kirin (Japan) 32 Kirin
* Pro forma, based on deals completed in 2001/02.
Top ten global brewersExhibit 19.2
(Source: Canadean Beverage Market Research. Reproduced by permission of Canadean Ltd.)
CFA_C19.qxd 11/7/03 2:16 PM Page 605

606 PART 3 • PERSPECTIVES
since it is an alcoholic beverage. In most countries licensing laws limit the outlets that can stockit. Moreover, the sale of alcoholic beverages is either restricted to adults or, in the case of Muslimcountries, banned outright.
ProductBeer is, in essence, a simple product – the result of fermentation using the malt of barley and othergrains and flavoured with hops – which has been made in the same way for thousands of years.There are various types of beer (e.g. ale, lager, stout) but the material inputs are largely the same.
Why then is branding so widespread – and, in the case of the largest producers, so successful?Branding enables brewers to differentiate their products, allowing them to obtain higher pricesand earn higher gross margins. The best-known brands provide reassurance to consumers: the tasteand quality are the same over time and across countries. In addition, they have a signalling function.Through advertising a brand becomes associated with a particular lifestyle with which consumersidentify.2 Advertising also indicates the company’s long-term commitment to the product.
MarketsAs with most food and drink products, demand for beer is relatively stable. It varies little overthe economic cycle. It is affected by the size and growth of the 18–35-year-old age group who arethe largest consumers of beer in most countries. Demand is sensitive to changes in price and toweather conditions.
There are two types of market for beer. One is the market for standard beers which is domin-ated by the large national or international producers. The other is the market for specialist beersserved by local producers (‘craft’ beers) and importers (‘exotic’ beers). Demand for standardbeers is growing very slowly or even declining in developed economies but is expanding in manydeveloping countries. By contrast, sales of specialist beers are increasing worldwide. Their shareof the market has risen, especially in developed countries.
Europe illustrates these trends well. Beer sales have been stagnant in the poorer economiesand have fallen in the richer ones. Overall, annual demand in the EU has declined in recent years.Annual per capita consumption in the 15 member states rose from 70 to 79 litres between 1970and 1990. In the 1990s, demand dropped. Per capita consumption was around 75 litres in 2000,the same as in 1980. (The per capita figure is an average and conceals wide variations withinEurope – from 28 litres in Italy to 128 litres in Ireland.) A decline in the 18–35 age group, cam-paigns against drinking and driving, and a shift in consumer tastes (e.g. to soft drinks) are allresponsible. Exhibit 19.3 shows selected EU beer production and consumption statistics for theperiod 1970 to 2000.
Average real annual growth rate1970 1980 1990 2000 70–80 80–90 90–100
Production 247.7 296 321.6 309.2 1.8% 0.83% −0.39%(in hl. m)Consumption 228 266.8 286 284.4 1.58% 0.7% −0.05%(in hl. m)Consumption 70.6 75.1 79.0 75.3(litres/head)
Brewing industry in the European Union: production and consumption, 1970–2000Exhibit 19.3
(Sources: British Beer and Pub Association (2002), Statistical Handbook, reproduced by permission of BrewingPublications Ltd; UN (various) Demographic Yearbook, reproduced by permission of United Nations, the UnitedNations is the author of the original material.)
CFA_C19.qxd 11/7/03 2:16 PM Page 606

Take-home sales of beer have grown in Europe in recent years at the expense of sales inlicensed premises. This has increased the bargaining power of large retail customers (e.g. super-market chains). Some have started to market their own brands of beer.
InputsProduction of standard beers is capital-intensive. This is where the economies of scale alluded toearlier arise. Key inputs besides plant are raw materials and packaging. In the case of large beerproducers, their size relative to that of their suppliers and the competition among the latter meanthat suppliers’ bargaining power is low.
This short survey of the brewing industry suggests that, for standard beer producers, the oppor-tunities for high profits are limited. They face strong competitive pressures from several direc-tions: rivalry within the industry because of stagnant or declining demand, threats fromsubstitutes (specialist beers, soft drinks) and, as take-home sales increase, the growing bargain-ing power of the large supermarket chains. The larger brewing firms have responded by acquir-ing competitors in order to obtain additional production and distribution economies andincrease their own bargaining power. For example, Scottish & Newcastle purchased Danone’sbrewing interests (including the Kronenbourg brands) in 1999; Interbrew acquired two largebrewing companies in the UK (Whitbread and Bass) in 2000 and one in Germany (Beck) in2001; and South African Breweries (SAB) acquired US-based Miller Brewing in 2002.
l . . . and CarlsbergWe turn now to Carlsberg itself. Some companies have features which are unique or hard toreplicate and this may give them a competitive advantage over rivals. Examples of such featuresare organisation, location, technology and reputation. Competition in the brewing industry maybe fierce and profits low but Carlsberg has certain distinctive features which might enable it toearn above-average returns.
What are these distinctive features? The first is size. Carlsberg is a large company. It reportednet sales of a4.6 billion in 2001. More significantly, it is one of the ten largest brewing com-panies in the world and has the leading share of the West European market.3 Giant brewing companies like Carlsberg enjoy economies of scale not just in beer production but also in itsmarketing and distribution.
Carlsberg’s second competitive strength is global reach. Over 90% of its sales are outsideDenmark. In addition to exporting beer, the company has production sites – 90 of them – in 45countries. In recent years it has invested heavily in Asia and eastern Europe, both growth mar-kets. Its leading brands, Carlsberg and Tuborg, enjoy a high reputation internationally. They’reproduced under licence by 60 companies in over 40 countries. In nine European and six Asiancountries (including China), awareness of the Carlsberg brand among consumers exceeded 80%of those polled.4
Third, the company has large soft drinks operations, especially in Scandinavia. It makes andsells Coca-Cola in Denmark and Finland and Pepsi in Sweden and Norway. Soft drinks are asubstitute for beer. Carlsberg has hedged that competitive threat.
One other noteworthy feature of the company is its ownership structure. The CarlsbergFoundation is required by charter to own at least 51% of the shares of the holding company(Carlsberg A/S). This frees managers from the constraint of having to raise profits every periodand allows them to take a longer-term view when evaluating potential investments. However, italso protects them from the threat of takeover, should the company underperform.
In sum, Carlsberg has certain characteristics which should give it a competitive advantageover other brewing companies. High reputation should permit premium pricing and size and
CHAPTER 19 • FINANCIAL STATEMENT ANALYSIS: BASIC FRAMEWORK 607
CFA_C19.qxd 11/7/03 2:16 PM Page 607

608 PART 3 • PERSPECTIVES
global reach should yield scale economies. There is a question mark about the effect of its ownership structure. This may lead to greater organisational slack and, possibly, higher rewardsto employees at the expense of shareholders.5
Trend and cross-section analyses of financial data
We move now from the general to the specific. We’ve collected the necessary background infor-mation and now have a better understanding of the target company and its industry. In this sec-tion, we look more closely at the company itself. We discuss certain techniques investors employto analyse its accounts. We use the 2001 financial statements of Carlsberg – reproduced inAppendix 19.2 – to illustrate these techniques and to show how our newly acquired knowledgeabout the brewing industry helps us interpret better the numbers in them.6
Presented with a firm’s accounts for a particular period, say year x7, our first concern asinvestors is to decide on a benchmark. Without a benchmark – a basis on which comparisonscan be made – the numbers in the accounts have little meaning. There are various types ofbenchmark we can use. We can compare the firm’s accounting numbers for x7 with those ofprior periods (e.g. x2–x6). This is known as trend analysis. Alternatively, we can compare thefirm’s numbers for x7 with those of other firms – for example, in the same industry – for thatyear. We call this cross-section analysis. Of course, the two types of comparison can be com-bined and trends in accounting numbers monitored across firms.
l Trend analysisTrend analysis sheds light on how key numbers (e.g. sales, profit) have changed in the past. Forexample, investors are interested not only in the rate of growth of sales and profits but also intheir variability. The simplest way of observing past trends is to present numbers graphically. Inpanel A of Exhibit 19.4, we plot Carlsberg’s net sales and operating profits over the five years1997–2001. (Carlsberg changed its financial year-end from 30 September to 31 December in2000. Audited accounts for 1999/2000 were for 15 months. The exhibit shows the twelve-month(unaudited) figures that Carlsberg provides for comparison purposes.)
What do the numbers reveal? Carlsberg’s sales and operating profits grew every year over thefive years. There was a sharp increase in both in 1997/98 and again in 2001. Indexation tells thesame story – but with more precision. From Panel B we see that sales grew faster than operatingprofits in 1997/98 but the reverse was true in 2002. It’s evident that the operating margin ratiodeclined in both 1997/98 and 1998/99, recovered in 2000 and surpassed the 1996/97 level in 2001.
The answer to one question usually prompts others. For example, why did sales and operat-ing profits grow so strongly in 1997/98 and 2001? The main reason is new ventures. Coca-ColaNordic Beverages (CCNB), a new company majority-owned by Carlsberg, was formed in 1997to bottle, sell and distribute Coca-Cola and other soft drinks in Denmark and Sweden. A yearlater it was extended to include Norway and Finland. The effect on the company’s soft drinkssales is evident from Panel C: they rose from 15% to 27% of total output between 1996/97 and1998/99. Carlsberg launched another venture in 2000, this time with Orkla, a Norwegian con-glomerate. The two companies pooled their beverage interests in a new company, CarlsbergBreweries, in which Carlsberg has a 60% stake and Orkla the balance. Orkla had extensive beerand soft drinks operations in Scandinavia and Russia and, as controlling shareholder, Carlsbergwas able to consolidate 100% of the results of these operations from the start of 2001 when theywere transferred to the new company.7
For a deeper understanding of the trends in a company’s results, we need to know the relativecontributions of price, volume, product mix and exchange rate changes each year. Carlsberg
CFA_C19.qxd 11/7/03 2:16 PM Page 608

CHAPTER 19 • FINANCIAL STATEMENT ANALYSIS: BASIC FRAMEWORK 609
doesn’t provide this information. For example, it discloses sales volumes for beer and soft drinksproducts – but not revenue and operating profit data by type of beverage. Thus it’s not possibleto compare revenue per litre – or operating profit per litre – for beer and soft drinks lines andassess the effect of changes in product mix on sales and profits.
Moreover, trends in a company’s results can be distorted by changes in its activities. Forexample, in 2000 Carlsberg disposed of most of its non-beverage operations – in particular, asubsidiary making porcelain (Royal Scandinavia) – that had contributed around 10% of rev-enues in prior years. Total revenues per litre fell from DKr 5 in the 15 months to end-2000 toDKr 3.9 in 2001; excluding non-beverage operations, however, the fall was less dramatic – fromDKr 4.36 to DKr 3.8. The expansion of its soft drinks operations in 1997/98 and 1998/99 raised
Panel A: Revenues and operating profit in nominal terms (DKr billion)
Year to 30 September Year to 31 December1997 1998 1999 2000* 2001
Revenues (net of excise duties) 14.9 22.1 24.2 25.7 34.5Operating profit 1.26 1.55 1.67 2.09 3.40
Panel B: Revenues and operating profit in indexed form: 1997 == 100
Year to 30 September Year to 31 December1997 1998 1999 2000* 2001
Revenues (net of excise duties) 100 148 162 172 231Operating profit 100 124 133 166 271
Panel C: Sales volume
Beer and soft drinks (in hl million) 36.9 44.8 50.8 54.6 88.2Indexed (1997 = 100) 100 121 138 148 239
Soft drinks as % of total sales 15 21 27 27 23
* Unaudited comparative figures. Carlsberg changed its financial year-end in 2000. Audited accounts for 2000 were for 15 months, 1 October 1999 to 31 December 2000.
Carlsberg: revenues, operating profit and sales volume, 1997–2001Exhibit 19.4
(Source: Carlsberg Group, Report and Accounts 2001. Reproduced by permission of Carlsberg A/S.)
CFA_C19.qxd 11/7/03 2:16 PM Page 609

610 PART 3 • PERSPECTIVES
its revenue per litre figure but the addition of Orkla’s Russian beverage operations in 2001 withtheir low krone value reduced it.8
l Cross-section analysisAs investors, we want to know how the target firm’s financial performance and health comparewith those of its competitors. This supplements data about trends in the firm’s own profits anddebt – and can be more important. For example, a firm reports a decline in profits; its main mar-kets, we discover, are in economic recession. However, if the profit fall is smaller than that of itscompetitors, this suggests good relative performance on its part.
How can we compare accounting numbers when companies are of different size and/or theiraccounts are stated in different currencies? The answer is to arrange their accounts on a com-mon basis. Each firm’s balance sheet numbers are expressed as a percentage of its total assets andits income statement numbers as a percentage of its total revenues. This procedure is known asthe common-sizing of financial statements.
We illustrate the information benefits from common-sizing. Exhibit 19.5 displays, in per-centage terms, the 2001 balance sheets of Carlsberg and a major European rival, the Dutch brewing giant Heineken NV.
Common-sized balance sheets shed light on companies’ operating activities and their financ-ing decisions. For example, it’s evident that both Carlsberg’s and Heineken’s operations arecapital-intensive: tangible fixed assets (e.g. plant and equipment) represent around 50% of eachcompany’s total assets at end-2001. Neither firm carried much inventory at that date. This isconsistent with the nature of their production activity: brewing requires inexpensive materialinputs, has a short production cycle and, given the consumable nature of the final product,involves little storage. As for financing, the common-sized statements reveal the two companiespursued different strategies in 2001. Carlsberg relied more on debt capital than Heineken. Its netdebt (long-term plus short-term debt less cash and securities) amounted to over one quarter ofassets at end-2001; by contrast, Heineken had no net debt at that date. Not surprisingly, equitycapital was more important to Heineken (43% of assets against Carlsberg’s 31%). In parent com-pany terms, the difference was even more marked (38% vs 20%): one-third of Carlsberg’s equitycapital was provided by minority shareholders in its subsidiaries (Coca-Cola in CCNB, Orkla inCarlsberg Breweries). Inspection of past balance sheets shows that Heineken has long pursued a low or zero debt policy whereas Carlsberg increased its leverage significantly in 1999/2000 fol-lowing a change in the group’s financing policies.
Not all differences in balance sheet structure are substantive, however. Consider the ‘Receivables and prepayments’ figures. Part of the large percentage difference in this itembetween Carlsberg (24% of assets) and Heineken (16%) can be traced to the two companies’ dif-ferent treatment of customer deposits on returnable packaging (e.g. casks, bottles). Heinekennets the deposits against receivables; Carlsberg records the deposits as a liability (under‘Provisions’).9
As we’ve seen, common-sizing removes the effect of size differences. For an investor, this canbe a mixed blessing: sometimes size counts. For example, Carlsberg’s 2001 net sales (a4.6 billionat the end-2001 exchange rate of DKr7.44 : a1) were around 60% of Heineken’s (a7.9 billion)but its tangible fixed assets (a2.7 billion) were 75% of Heineken’s (a3.6 billion) at end-2001.Thus, although tangible fixed assets represent around 50% of total assets for both firms, it’s clear that Heineken generates more sales per euro of them. Knowing the relative sizes of com-panies (as measured by sales) allows an investor to compare the efficiency with which they useassets.
Moreover, common-sizing cannot overcome differences in the way firms account for assetsand liabilities. If material, these accounting differences can undermine conclusions drawn from
CFA_C19.qxd 11/7/03 2:16 PM Page 610

CHAPTER 19 • FINANCIAL STATEMENT ANALYSIS: BASIC FRAMEWORK 611
common-sized figures. For example, Carlsberg values tangible fixed assets at (depreciated) his-torical cost whereas Heineken values them at replacement cost. Restating Heineken’s tangiblefixed assets to historical cost would reduce their reported amount – and raise the company’sreported asset utilisation rate relative to that of Carlsberg.
We can ‘common-size’ other financial statements with equally productive results. For example,common-sized income statements bring to light differences in firms’ cost structures. Assume twofirms classify costs by nature. Common-sizing reveals the relative weights of material, labour anddepreciation in each firm’s cost structure. With this information, we can determine which firmuses labour and capital more productively. Unfortunately, we can’t compare the cost structures ofCarlsberg and Heineken directly because they classify costs differently: Carlsberg classifies them byfunction, Heineken by nature.
We can combine common-sizing and trend analysis. By performing the same common-sizingexercise over several periods, we can see how the composition of a firm’s costs changes over time.
Carlsberg and Heineken: 2001 consolidated balance sheets common-sizedExhibit 19.5
(Sources: Carlsberg A/S, Report and Accounts 2001, reproduced by permission of Carlsberg A/S; Heineken NV, AnnualReport 2001, reproduced by permission of Heineken A/S.)
Consolidated balance sheets at 31 December 2001
Carlsberg Heineken
DKr mn* % % B mnFixed assetsIntangible – – – 13Tangible 20,326 49 50 3,614Financial 4,767 12 8 531
25,093 61 58 4,158Current assetsInventories 2,865 7 10 692Receivables and prepayments 9,820 24 16 1,192Cash and securities 3,291 8 16 1,175
15,976 39 42 3,059
Total assets 41,069 100 100 7,217
Group equityShareholders’ equity 8,059 20 38 2,758Minority interests 4,454 11 5 381
12,513 31 43 3,139Long-term liabilitiesLong-term debt 12,042 29 11 797Provisions and other long-term liabilities 3,702 9 15 1,046
15,744 38 26 1,843Current liabilitiesBank loans and current portion of long-term debt 2,199 5 5 329Payables and accruals 10,613 26 26 1,906
12,812 31 31 2,235
Total equities 41,069 100 100 7,217
* Exchange rate at 31 December 2001: DKr 7.44 : A1.
CFA_C19.qxd 11/7/03 2:16 PM Page 611

612 PART 3 • PERSPECTIVES
Ratio How calculated Purpose
Return on Measures success with which managers assets have used firm’s assets.(RONOA)
Return on Measures success with which managersequity (ROE) have used funds provided by firm’s owners.
Earnings Profit expressed in per-share terms.per share Permits comparisons with share price (EPS) (P/E ratio) and dividend (payout ratio).
Net profit attributable toordinary shareholders
Weighted average ordinaryshares outstanding
Net profit attributable toordinary shareholders
Average ordinaryshareholders’ equity
Net operating profit after taxAverage net operating assets
Key profitability ratios: calculation and purposeExhibit 19.6
It also helps us understand why profit margins change too. Of course, the same insights can begained by examining the trend in individual costs over time. We investigate the reasons for thechange in Carlsberg’s profit margin in a later section.
The investor’s financial ratio toolkit
To many investors, financial statement analysis and financial ratios go hand in hand: the formerimplies calculation and interpretation of the latter. Financial ratios provide a simple and power-ful way of summarising information in financial reports. By relating key numbers in the finan-cial statements, e.g. profits to assets, debt to equity, investors assemble a ‘toolkit’ they can use tobetter gauge a company’s financial performance and condition.
What’s in the investor’s ratio toolkit? In previous chapters we introduced the principal ratioson which investors rely when analysing accounts. They fall into one of two groups: those used tomeasure a company’s profitability and those used to assess its financial risk. We look at eachgroup of ratios in turn.
l Profitability ratiosThree ratios that are widely used to measure a firm’s profitability are:
l (rate of) return on assets (ROA);l (rate of) return on equity (ROE);l earnings per share (EPS).
We defined these ratios in earlier chapters. Exhibit 19.6 reminds us how each is calculated andwhat purpose it’s intended to serve. We examine ROA and ROE more closely in this chapter anddefer scrutiny of EPS to the next.
Return on assetsROA shows how many cents of profit each euro of assets has generated in the financial year. Itis an indicator of the success with which managers have employed the firm’s assets in a period,irrespective of how those assets are financed.
CFA_C19.qxd 11/7/03 2:16 PM Page 612

CHAPTER 19 • FINANCIAL STATEMENT ANALYSIS: BASIC FRAMEWORK 613
In Chapter 3, we calculated ROA by dividing operating profit by average assets. A more logicalapproach is to relate operating profit to net operating assets (i.e. operating assets less operatingliabilities) rather than total assets. Operating assets include tangible and intangible fixed assets,inventories, trade receivables, prepayments and long-term investments in other companies whileoperating liabilities include trade payables, accrued expenses and provisions. This version ofROA is also known as return on net operating assets (RONOA):
RONOA == (19.1)
where:NOPAT = Net profit + Net financial expense (NFE)NFE = [(Interest expense − Interest income) + Losses (− Gains) from financial A/L] × (1 − t)NOA = Operating assets (OA) − Operating liabilities (OL)
Defining return on assets in this way ensures that numerator and denominator are calculated ona consistent basis and the ratio truly measures the operating performance of the firm. We use thisversion of ROA throughout the rest of this chapter.
The numerator, NOPAT, is usually derived indirectly – by adding net financial expense to net profit. In this way, all special and exceptional items are captured in NOPAT: although non-recurring, they still relate to operations. Net financial expense (NFE) includes realised and unrealised holding losses (net of gains) on debt and marketable securities, as well as net interestcharges. The tax rate (t) is the company’s marginal corporate income tax rate. In evaluating agroup’s operating performance, the net profit figure in (19.1) should be consolidated net profit,i.e. before accounting for minority interests.
RONOA is equivalent to return on capital employed (ROCE), a ratio widely cited in thefinancial press. Closer inspection of the balance sheet shows that net operating assets and cap-ital employed are identical.
OA ++ Financial assets (FA) == OL ++ Financial liabilities (FL) ++ Shareholders’ equity (19.2)
Rearranging (19.2) gives:
OA −− OL == [FL −− FA] ++ Shareholders’ equity
or
Net operating assets == Net debt ++ SE
Capital employed
Note that for ease of calculation we classify all cash and short-term investments as financialassets. In practice, part of a company’s liquid assets is used in operations but management rarelydisclose the amount in the financial statements. Long-term investments – and the income fromthem – are treated as operating items.
As we saw in Chapter 3, ROA is the product of two independent financial ratios, profit mar-gin and assets turnover. RONOA can also be broken down in the same way:
RONOA == Profit margin (PM) ×× Assets turnover (AT)
Profit margin and assets turnover can be broken down in turn. The profit margin is simplythe residue of each sales euro after account is taken of the revenues absorbed by production, sell-ing and other costs. This involves calculating cost ratios for the various types of cost incurred by
Operating revenues
Average net operating assets
Net operating profit after tax
Operating revenues
Net operating profit after tax (NOPAT)
Average net operating assets (NOA)
CFA_C19.qxd 11/7/03 2:16 PM Page 613

614 PART 3 • PERSPECTIVES
the firm (e.g. COGS/sales, selling expense/sales, etc.). We can better understand changes in afirm’s profit margin over time – and any differences among firms in the same industry – oncewe have calculated individual cost ratios each period.
As for assets turnover, this is affected by the rate of turnover of specific categories of asset, e.g.receivables, inventories, fixed assets. Exhibit 19.7 sets out the components of profit margin andassets turnover. This is known as the DuPont framework of profitability analysis, after the USchemical company of that name which first championed this approach.
Why does profitability, as measured by ROA, differ across firms? One reason is that firms dif-fer in operational efficiency, that is, the efficiency with which they control costs and the efficiencywith which they use their assets. The DuPont framework summarised in Exhibit 19.7 helpsinvestors identify these efficiency differences.
Other reasons are industry-related rather than firm-specific. Industries differ with respect to:age; degree of competition among member firms; production process and input mix; and cyclic-ality of demand. These factors affect the level, composition and variability of ROA across firms.We consider each of them below.
1 Age. As we saw in Chapter 18, profit is likely to be negative during the introductory stage of aproduct’s life and low (but increasing) during the growth stage (see Exhibit 18.2). As a result,ROA will be negative or low during this period. Firms whose products are mostly in themature stage of the lifecycle tend to report higher ROA. Accounting rules contribute to this:the ROA denominator includes fixed assets whose carrying amount (under HC accounting)at the maturity stage is low owing to accumulated depreciation charges.
2 Degree of competition. Consider the effect of competitive forces on ROA. Where companiesare many, their products are not differentiable and the costs of entering the industry are low,competition is likely to be fierce and ROA will be driven down to the company’s cost of cap-ital. Firms in industries where one or more of these conditions do not apply – e.g. theresearch-based pharmaceutical industry where new products enjoy patent protection and, asa result, entry into the industry is costly – are likely to report higher ROA.
RETURN ON ASSETS (ROA)
PROFIT MARGIN ASSETS TURNOVER
which can be analysed by of which the major componentsexamining individual cost- are:to-revenue ratios:
Cost of sales/Sales (revenue) Receivables =turnover
R&D costs/Sales
Selling expense/SalesInventory
=Administrative expense/Sales turnover
Interest expense/Sales (Tangible) =fixed assets
Income tax expense/Sales turnover
Sales revenueAverage tangible
fixed assets
Cost of sales(or sales revenue)
Average inventories
Revenuefrom credit sales
Average accountsreceivable
DuPont framework of profitability analysis: components of ROAExhibit 19.7
CFA_C19.qxd 11/7/03 2:16 PM Page 614

CHAPTER 19 • FINANCIAL STATEMENT ANALYSIS: BASIC FRAMEWORK 615
3 Production process and input mix. The production process and the mix of capital and labourin it affect more the composition of ROA than its level. Note that a ROA of, say, 10% can beachieved with a PM of 5% and an AT of 2 or with a PM of 2% and an AT of 5. Consider firmsin capital-intensive industries such as glass, steel or chemical manufacture. Given the heavyinvestment in equipment, such firms try to operate at or near capacity to spread fixed costsover more units and thereby lower unit costs. To increase output when the firm is operatingat this level requires large capital expenditures since investment is ‘lumpy’. Thus assetsturnover is low and for technological reasons cannot easily be increased. However, the largeinitial investment in plant and equipment acts as a barrier to entry and normally enables firmsto secure higher margins on their sales.
By contrast, in an industry such as food retailing a relatively small asset base can support alarge amount of sales. Fixed assets (buildings, fittings) are not complex; inventory is kept lowto avoid spoilage; receivables are small because most sales are for cash. The resulting highassets turnover does not result in high ROA because competitive conditions keep profit mar-gins low.10
Nonetheless, there are circumstances where the input mix can affect the level of reportedROA. For example, certain service sector firms such as software providers, management con-sultants and advertising agencies often report high ROA because their main resource, theskills of their employees, does not appear as an asset on the balance sheet.
4 Cyclicality of demand. ROAs differ not only in level and composition but also in variability.The main source of ROA variability is the business cycle and its effect on demand for thefirm’s products. ROAs of companies in cyclical industries (e.g. construction, forestry prod-ucts, heavy machinery) tend to fluctuate more than in industries such as food and drinkwhere demand is relatively stable over the business cycle.
Note that operating leverage (the ratio of fixed to variable costs) can add to ROA variabil-ity. Capital-intensive firms like the glass, steel and chemical producers mentioned earlier havehigh operating leverage. For such firms, a unit change in output has a large impact on profit:costs alter little and so most of the change in revenue (from the output change) flows straightthrough to the ‘bottom line’.
The earnings variability of ‘cycle-sensitive’ firms means that investors seek higher returnsto compensate them for the higher risk. Thus the expected ROAs of such firms are higher.
The above points are summarised below.
Return on assets (ROA)
Factors affecting the . . . Level Composition Variabilityof a firm’s ROA are:
Age (of firm/industry) 3
Production process/input mix 3
Degree of competition 3
Cyclicality of demand 3
Return on equityROE shows how many cents of profit each euro of shareholders’ capital has yielded in the finan-cial year. It is an indicator of the success with which managers have used owners’ funds. Theform of the ratio reflects this. The numerator is usually the net profit attributable to ordinary(common) shareholders: dividends to preference shareholders are deducted to arrive at thisfigure. Similarly, the denominator is usually the capital and reserves attributable to ordinaryshareholders. Capital contributed by preference shareholders is excluded.
CFA_C19.qxd 11/7/03 2:16 PM Page 615

616 PART 3 • PERSPECTIVES
ROE ==
In the case of a group, ROE can be calculated at group level or for parent company’s share-holders only. In the latter case, the minority interest in subsidiaries’ profits (or losses) must beexcluded from the numerator and the minority interest in subsidiaries’ net assets must beexcluded from the denominator.
RONOA and ROE are linked. ROE can be viewed as the sum of two components: the firm’soperating performance (RONOA) and the benefit (or cost) to shareholders from the firmfinancing its NOA with debt.11
ROE == Return on net operating assets ++ Gain (−− Loss) from net financial leverage
The gain from net financial leverage can be broken down in turn. It’s the product of two figures:(a) the difference – or spread – between a firm’s operating returns and its net borrowing costand (b) the leveraging of that spread through the use of debt. This latter ratio is known as thenet financial leverage effect (netflev).
Gain from net financial leverage == SPREAD ×× NETFLEV
==
==
where: Net debt = Financial liabilities − Financial assetsSE = Shareholders’ equity
A company can raise the rate of return on its shareholders’ funds by:
l improving its operating performance (via higher margins, faster assets turnover or both);l reducing its net borrowing costs; and/orl increasing its net financial leverage.
Note that higher operating returns benefits ROE both directly (through higher RONOA) andindirectly (through a larger spread).
Financial leverage increases risk as well as potential rewards to a firm’s shareholders, since itmagnifies any variability in its RONOA. When the firm is doing well (RONOA > NBC – or pos-itive spread), owners benefit. Interest is a fixed cost: it does not usually vary with profit or rev-enues. As a result, owners do not have to share with creditors any increases in the firm’s profits:they capture them all. However, when the firm is doing badly (negative spread), owners suffer.Debtholders are paid first – remember, their claims rank before those of the owners – and theirreturn (interest) is fixed. In these circumstances, interest charges may absorb most of the firm’soperating profits and owners are left with little.12
Exhibit 19.8 illustrates this. Assume a company finances its net operating assets (of 100) witha mixture of debt (40) and equity (60). The debt bears an annual interest rate of 10%. The exhibitshows returns to the firm’s shareholders under three different RONOA assumptions: (a) below,(b) equal to, and (c) above the cost of debt. Taxes are ignored.
Notice the sensitivity of ROE to different levels of RONOA. When the firm’s assets yield areturn greater than the cost of debt (e.g. assumption (c)), owners benefit from financial leverage.The gain in case (c) (where RONOA is 15%) is 3.3%, the product of a positive spread of 5% anda (net) debt–equity ratio of 0.66. When, however, the firm’s assets yield a return less than the
NOPAT
Av. NOA
NFE
Av. net debt Av. net debt
−
××
Av. SE
Return on Netnet operating borrowingassets cost (NBC)
Net financialleverageeffect
−
××
Net profit attributable to ordinary (common) shareholders
Average equity of ordinary (common) shareholders
CFA_C19.qxd 11/7/03 2:16 PM Page 616

CHAPTER 19 • FINANCIAL STATEMENT ANALYSIS: BASIC FRAMEWORK 617
cost of debt (assumption (a)), financial leverage hurts shareholders. In our example, at aRONOA of only 5%, the company sustains a loss from financial leverage of 3.3%, cutting ROEto only 1.7%. Thus by substituting debt for equity in its capital structure, a firm increases therisks as well as the returns to its shareholders.
Empirical evidence indicates that ROA and ROE are highly correlated.13 Most differences ininterfirm ROEs are driven by the same factors that are responsible for differences in ROAs: ageof firm/products, degree of competition, production process and input mix, cyclicality ofdemand. Moreover, the leverage effect of the (US) firms examined was remarkably stable in theperiod studied (1963–99).
l Financial risk ratiosIn the business world, risk usually means the risk of financial loss. Creditors suffer financial losswhen a firm is unable to meet its contractual obligations to them. Shareholders suffer financialloss when they are unable to recover their investment in the firm. This occurs when the marketlowers its expectations about the firm’s future earnings and the firm’s market value falls as a con-sequence. Clearly, shareholders are likely to suffer financial loss before creditors do: a companymay cut its forecast profit yet still be expected to pay its debts when they fall due.
Traditional analysis of financial risk focuses on the risks faced by creditors. For them, the riskof financial loss is less if the company under scrutiny has a history of profitable operations. Sucha company has demonstrated that it can generate positive cash flows from operations (after debtservicing costs) on a continuing basis. Thus ROA or ROE can serve as a measure of risk as wellas profitability.
There are other dimensions to risk. As we saw in earlier chapters, investors have devisedspecific ratios to assess liquidity and solvency risks. A company suffers liquidity problems whenit is unable to pay its short-term debts when they are due. It is insolvent when its liabilities exceed
FactsAt start year 1, a company has net operating assets of 100, financed 60% with equity and40% with debt bearing an annual interest rate of 10%. The table below shows year 1 ROEunder the following RONOA assumptions: (a) 5%, (b) 10% and (c) 15%. Taxes are ignored.
Summary income statement for year 1RONOA assumption (a) (b) (c)
Operating profit 5 10 15Interest expense [10% × 40] −4 −4 −4Net profit 1 6 11
RONOA [Operating profit/NOA (start-year)] 5% 10% 15%
Gain from net financial leverage:Spread [RONOA – NBC] −5% 0 +5%
×× × × ×Netflev [Debt/SE] 0.66 0.66 0.66
–3.3% 0 +3.3%ROE* 1.7% 10% 18.3%
* Based on start-year shareholders’ equity.
Effect of financial leverage on ROE under alternative RONOA assumptionsExhibit 19.8
CFA_C19.qxd 11/7/03 2:16 PM Page 617

618 PART 3 • PERSPECTIVES
its assets. Illiquidity does not imply insolvency: a firm may have sufficient assets to cover its debtsbut the assets cannot be converted quickly into cash. Exhibit 19.9 summarises the ratios mostcommonly used to measure these risks.
Liquidity ratiosHow do we assess a firm’s ability to pay its short-term debts? The usual approach is to establishwhat the firm’s current liabilities are (those payable within a year) and to see whether it has theresources available to settle them.
One measure of ‘available resources’ is current assets: cash and other assets which areexpected to be converted into cash within a year. The current ratio shows how many times a firm’s current assets at a particular date cover its current liabilities then. A variant of this ratio, the quick ratio (or acid test ratio), adopts a tougher definition of available resources.Inventories are excluded from the numerator because they’re usually the least liquid of currentassets. Both ratios are widely used measures of a firm’s liquidity.
They have weaknesses, however. First, both show a firm’s liquidity on one date in the yearonly. Management can make both ratios look better by careful choice of the firm’s financial year-end. In addition, either ratio can be raised by temporarily paying off loans or other current liabilities just before the year-end (but only if the ratio is already greater than one). Second,
Ratio How calculated Purpose
Liquidity risk
Current ratio Shows extent to which short-term (CR) obligations are covered by cash
and trading assets.
Quick ratio As for CR but a more severe test of liquidity.
Defensive Shows how long company can fund interval operations from existing cash and
near-cash resources.
Solvency risk (financial leverage)
Debt–equity Expresses interest-bearing debt ratio (less cash) as a proportion of equity.
Debt-to- As for debt–equity ratio, but debt capitalisation and equity are measured at marketratio rather than book values.
Times interest Shows income cover for debt earned servicing costs.
Net debt-to- Shows how long it will take firm to OCF ratio pay off debt at current rate of cash
flow generation.
Net debtOperating cash flow
Profit before interest and tax expenseInterest expense Capitalised interest+
Net debt at MVShareholders’ equity at MV
Net debtShareholders’ equity (of group)
Cash, securities and A/RProjected operating outlays
( )× 365
Cash, securities and A/RCurrent liabilities
Current assetsCurrent liabilities
Key liquidity and solvency ratios: calculation and purposeExhibit 19.9
CFA_C19.qxd 11/7/03 2:16 PM Page 618

they equate ‘liquid’ with ‘current’. Some fixed assets may be highly liquid. Remember that ifmanagement intends to hold shares or bonds of another company for longer than a year, theinvestment is classified as a fixed asset. If the securities held are quoted, management may be ableto convert them into cash quickly.
As a result investors employ other ratios. For example, they check the firm’s defensive inter-val. This relates a company’s current liquid assets to its projected operating outlays in the nextperiod. The ratio shows how long the firm can finance its operations from its cash and near-cashresources in the event it receives no cash from sales. It’s adaptable – the numerator can beexpressed net of current liabilities and actual operating outlays in the current period can be usedin the denominator – and less easy for management to manipulate than the current ratio.
In addition, they use turnover ratios to estimate the firm’s operating cycle in cash terms. Theoperating cycle is the average period (in days) between payment for goods and supplies and receiptof cash from customers. For a typical manufacturing company, it is estimated as follows:
RatioAverage credit period taken by customers (365/Receivables turnover)
+ Average productionand storage period (365/Inventory turnover)
– Average credit periodobtained from suppliers (365/Payables turnover)
Average operating cycle(in days)
We have already shown how the receivables and inventory turnovers are calculated (Exhibit19.7 – and Chapters 10 and 9). The payables turnover is calculated as follows:
Payables turnover ==
Companies that present the income statement in a natural format usually disclose purchasesof goods and services either on the face of the statement or in the notes. For those firms that clas-sify expenses by function, investors must estimate purchases using cost of sales and inventoryfigures.
Operating cycles vary across industries, largely because of differences in the productionperiod. What interests investors are intra-industry differences in the operating cycle and, in par-ticular, any change in its length. A lengthening cycle usually indicates greater liquidity risk.
Solvency (or financial leverage) ratiosThe ratios we describe as solvency ratios in Exhibit 19.9 carry other titles. Few firms are at riskof not being able to pay their debts. Nonetheless, other things being equal, that risk is greater, thegreater is a firm’s financial leverage (or gearing). Thus solvency ratios are often described as fin-ancial leverage (or gearing) ratios. As leverage is a broader term, we’ll use it in place of solvency.
Investors measure a firm’s financial leverage in various ways. The simplest approach is torelate net debt to shareholders’ equity (the debt–equity ratio shown in Exhibit 19.9). Alternat-ively, net debt can be expressed as a proportion of financial capital (Net debt + Group equity).The numerator can be broadened to include all liabilities. A variant, the long-term debt to equityratio, can be calculated to highlight the term structure of the firm’s debt.
All the above debt ratios are based on book amounts. These may overstate a firm’s true lever-age. The market value of a firm’s equity is often greater than its book value. The latter captures
(Credit) purchases of goods and services
Average accounts payable
CHAPTER 19 • FINANCIAL STATEMENT ANALYSIS: BASIC FRAMEWORK 619
CFA_C19.qxd 11/7/03 2:16 PM Page 619

only the value of net assets ‘in place’ while market value includes the discounted value of expectedabove-normal future earnings (or ‘growth opportunities’) as well. Hence some analysts calculatea market value-based debt ratio. The debt-to-(market) capitalisation ratio relates the marketvalue of a firm’s debt to the market value of its equity. Nevertheless, leverage ratios based onbook amounts are still popular, especially with creditors who argue that the collateral providedby growth opportunities is too uncertain.
Balance sheet leverage ratios have the same flaws as balance sheet liquidity ratios. They pro-vide a snapshot of the firm’s capital structure at one date only. They are manipulable: as we sawin earlier chapters, firms are adept at finding ways to keep debt off the balance sheet – or, at least,outside the liabilities’ section of it. Above all, they tell us little about a company’s ability to service its debt.
One solution is to calculate the burden of debt on profits. The times interest earned ratio (orinterest cover) shows how many times a firm’s profits before interest and tax cover its financialexpenses in a period. Some financing costs may be ‘off income statement’, however. Analystshave devised a broader version of the TIE ratio, the fixed charge coverage ratio, to incorporatethem. As discussed in Chapter 11, capitalised interest and the interest element in lease paymentsare considered part of a company’s fixed (financial) charges which should be covered by profitsfrom operations. The TIE and FCC ratios are reliable indicators of a firm’s debt servicing abilityso long as the profit figure in the numerator reflects recurring income.
If non-cash expenses (e.g. depreciation and increases in provisions) are large in relation torevenues, investors may substitute operating cash flow for profits in the TIE ratio. Another cash-based ratio is the net debt-to-operating cash flow ratio. The reasoning behind this ratio is thesame as that for the defensive interval: the risk of financial loss to the creditor is less where acompany has strong operating cash flows relative to its liabilities. Again, the ratio is adaptable.Some investors use projected OCF – or projected Ebitda – in the denominator; others estimatethe firm’s maintenance capital expenditures and deduct these from the OCF number to give anet debt-to-free cash flow ratio.
Financial risk and earnings variabilityThe problem with traditional risk ratios is that they’re based on financial data of one date orperiod and they take no account of the nature of the company’s business. The likelihood of a firmdefaulting on its debt is a function not just of the level of that debt but also of the variability ofthe firm’s earnings over time. This last point can be easily demonstrated. Consider two firms withsimilar profitability and capital structures. The probability of reporting losses – and thus the riskof being unable to service its debt – is lower for the firm with the more stable pattern of earnings.
What factors influence earnings variability? Two important ones are:
l the sensitivity of a firm’s revenues to the economic cycle – in other words, the variability of itsrevenues; and
l the firm’s cost structure and, in particular, its operating leverage.
Variability of revenues is the more important factor. High operating leverage will not resultin high earnings variability without it. For example, gas distribution companies and electricitygenerating firms make major investments in plant and transmission equipment. Fixed costs suchas depreciation are large relative to variable costs. Their operating leverage is high. Yet such firmsusually avoid large variations in earnings because in most countries their business is regulatedand, as a result, the variability of their revenues is low.
How is earnings variability measured? One approach is to calculate the deviation of aprofitability ratio such as ROE from its mean over the business cycle. A statistic such as thestandard deviation can be used. The larger the deviation, the more earnings have fluctuated inthat period.
620 PART 3 • PERSPECTIVES
CFA_C19.qxd 11/7/03 2:16 PM Page 620

CHAPTER 19 • FINANCIAL STATEMENT ANALYSIS: BASIC FRAMEWORK 621
Note that firms whose earnings vary little do not necessarily have higher debt ratios. Theirlower financial risk gives them higher debt capacity. Whether they exploit that capacity dependsultimately on the decision of their owners.
Bankruptcy predictionRisk ratios also appear in bankruptcy prediction models. Researchers have found that certainfinancial ratios of failed companies differ markedly from those of healthy companies in the oneto two years preceding bankruptcy. According to one widely used model, the variables that havethe most discriminating power are:
1 profitability (ROA);2 size (total assets excluding intangibles);3 liquidity (current ratio);4 cumulative profitability (retained profits/total assets);5 capitalisation (market value of equity/market value of total capital, based on five years’ aver-
age data);6 earnings stability (standard deviation of ROA, based on ten years’ data).
The ratios used are in parentheses. A model with these variables in it correctly classified over90% of a sample of failed US firms at the date of the last published financial statements prior tobankruptcy.14 It is reassuring that many of the risk factors we discussed earlier – profitability andhistory of profitability, liquidity, financial leverage, debt servicing ability, earnings stability – arecaptured in the model.
The profitability and risk ratios we’ve discussed above are the financial ratios most oftenfound in the investors’ toolbox. They’re not the only ones, however. Investors devise other ratios– for example, by combining non-financial and financial data – in order to gain further insightsinto a firm’s financial performance and condition. Examples are the revenue yield and capacityutilisation ratios used to evaluate firms in the air transport and hotel industries.
Profitability, risk and cash flow analysis illustrated
We now analyse Carlsberg’s 2001 financial statements, drawing on the material in this and theprevious chapter. Earlier we outlined the key economic characteristics of the brewing industryand Carlsberg’s place in it. We summarise our findings below. By keeping in mind the businessenvironment Carlsberg operates in, we’ll make our analysis richer.
Carlsberg, we learned, is a major player in the European brewing industry. Important featuresof the market for beer in Europe are:
l Stagnant or declining demand for standard beers. Demography, health concerns and changes inconsumer tastes are contributory factors.
l Intense competition. Given stagnant sales, standard beer producers battle for a higher marketshare. Substitutes (specialist beers, soft drinks) pose an additional threat.
l Economies of scale. Large producers enjoy production and distribution economies of scale.They extend them by acquiring or merging with brewing companies in new markets. Savingsare channelled into brand promotion. Both inhibit the entry (or development) of additionallarge producers.
l Growth in retailer bargaining power. Take-home sales are increasing. Large supermarketchains have growing market share. Beverage producers compete for shelf access.
In light of the above – and what we know about Carlsberg as a company – what are ourexpectations about Carlsberg’s profitability, leverage and cash flow profile?
CFA_C19.qxd 11/7/03 2:16 PM Page 621

622 PART 3 • PERSPECTIVES
l Competitive conditions in the brewing industry make it unlikely that the major players earnreturns much above their cost of capital. Carlsberg’s profits should benefit from its size andglobal reach. A capital-intensive production process means its asset turnover is likely to below. Production economies should boost gross profit margins.
l Carlsberg’s liquidity and debt ratios are likely to be strong, thanks to stable demand for beerand soft drinks and the group’s healthy operating cash flows. The latter will be greater thanprofits because of large depreciation charges.
l Carlsberg should generate positive free cash flow owing to the maturity of its brands and thelimited opportunities for internal growth.
l Carlsberg’s financial performance in 2001To understand the present, we need to be aware of the past. Exhibit 19.10 shows the main pro-fitability ratios of Carlsberg for 2001 and the preceding four years. (We show the calculation ofCarlsberg’s 2001 ratios, along with its consolidated 2001 financial statements, in Appendix 19.2.)
Return on assetsWhat do the profit ratios tell us about Carlsberg? The first impression is that the group per-formed well between 1997 and 2001. It was consistently profitable in this period. Its RONOAand ROE increased each year from 1999: in fact, its ROE in 2001 was more than double the 1999 level. (For 1999 and earlier years, Carlsberg’s financial year ended on 30 September. Theaccounts for 2000 cover a 15-month period: for profitability ratio calculations, the income numbers have been apportioned.)
Closer inspection reveals that Carlsberg’s performance was like the proverbial curate’s egg –good in parts. The increase in RONOA and ROE between1999 and 2001 was, in fact, a recoveryfrom depressed levels: the group suffered a sharp fall in profitability in 1999. RONOA had still notregained 1998 levels by 2001. Margins achieved new highs in 2001 but assets turnover remainedsluggish. The increase in ROE was noteworthy but 60% of the improvement was due to highergains from financial leverage. By increasing the proportion of debt in its capital structure, thegroup raised returns to shareholders but at the same time increased the riskiness of their investment.
Analysis of profit marginWhat are the reasons for the improvement in the NOPAT margin between 1999 and 2001? Didthe group raise prices, cut costs or shift sales to higher margin products? To what extent was theimprovement due to special – and non-recurring – factors?
Financial period* 1996/97 1997/98 1998/99 1999/2000** 2001
Return on net operating assets 10.5% 15.4% 9.1% 10.3% 13.9%Profit margin 6.3% 7.4% 5.2% 6.8% 9.0%Assets turnover 1.67× 2.08× 1.76× 1.51× 1.55×
Gain on net financial leverage 2.6% 1.1% 1.0% 5.5% 8.7%
Return on equity 13.1% 16.5% 10.1% 15.8% 22.6%
* 2001: to 31 December; 1999/2000: 15 months to 31 December; 1998/99 and earlier years: to 30 September.
** Income statement numbers in ratios based on 12/15ths of reported numbers.
Carlsberg Group: key profitability ratios, 1997–2001Exhibit 19.10
CFA_C19.qxd 11/7/03 2:16 PM Page 622

CHAPTER 19 • FINANCIAL STATEMENT ANALYSIS: BASIC FRAMEWORK 623
Carlsberg’s accounts provide answers to most of these questions; industry and general economic data supply the rest. Increased prices contributed little to Carlsberg’s bottom line inthe 1997–2001 period: inflation in western Europe (responsible for 60% of Carlsberg’s revenuesin 2001) was low and, as we’ve seen, demand for beer in this market was stagnant or decliningduring this time. In fact, the change in the group’s structure in 2001 contributed to a decline in revenue per litre.
1996/97 1997/98 1998/99 1999/2000 2001(15 months)
Beverage revenue/litre (DKr) 3.5 4.2 4.1 4.4 3.8Beer sales (mn hl) 31.3 35.3 37 51 67.9Soft drink sales (mn hl) 5.6 9.5 13.8 18.9 20.3Beer sales (% of total) 85 79 73 73 77
Carlsberg benefited – in revenue/litre terms – from the expansion of soft drink sales in the late 1990s, following the setting-up of the Scandinavian joint venture with Coca-Cola that tookeffect in 1997. The merger of Carlsberg’s and Orkla’s beverage interests in 2001, however,resulted in a decline in revenue/litre. Orkla had extensive brewing operations in Eastern Europeand these sales had a relatively low krone value in 2001. (In addition, Carlsberg had to relinquishcertain soft drinks operations in Scandinavia for anti-trust reasons which also contributed to therevenue/litre decline that year.)
Despite the adverse effects of the 2001 merger on per-unit revenues, Carlsberg’s profit margins didn’t suffer. Orkla’s beverage operations had low krone costs. Exhibit 19.11 containscommon-sized income statements for the three years to 2001.
Comparing Carlsberg’s margins in 2001 with those in 1998/99 before the Orkla deal was even considered, we can see that Carlsberg spent less of each sales euro on production (down
Year to 30 Sept 15 months to 31 Dec Year to 31 Dec1999 2000 2001
Sales revenue 100% 100% 100%Production costs −52.6 −49.5 −50.5
Gross profit 47.4 50.5 49.5Sales and distribution expense −33.9 −35.9 −33.0Administration expense −7.2 −7.8 −8.0Other operating income +0.6 +1.6 +1.4
Operating profit 6.9 8.4 9.9Special items* +0.3 +1.2 –Interest expense, net −0.5 −0.7 −1.9Other financial items** +0.1 +0.1 +1.7
Profit before tax 6.8 9.0 9.7Income tax expense −2.0 −2.6 −2.1
Group net profit 4.8 6.4 7.6
(1 − t) Interest expense, net +0.4 +0.4 +1.4Profit margin (Exhibit 19.10) 5.2 6.8 9.0
* Includes gain/loss from sale of businesses, restructuring charges, write-downs of tangible fixed assets.
** Includes gain/loss from sale of investments and write-downs of investments.
Carlsberg Group: analysis of profit margin, 1999–2001Exhibit 19.11
CFA_C19.qxd 11/7/03 2:16 PM Page 623

624 PART 3 • PERSPECTIVES
2.1 cents) and selling and distribution costs (down 0.9 cents) but more on administration (up0.8 cents) in 2001 than in 1999. Other operating income contributed an additional 0.8 cents. But Carlsberg’s bottom line in 2001 also benefited from one-off items – for example, gains onthe sale of investments (in ‘Other financial items’) and a lower than normal effective tax rate(22% in 2001 against 29% in 2000 and 1999). In sum, not all of the improvement in NOPATmargin between 1999 and 2001 is sustainable. Carlsberg should be able to hold on to aroundthree percentage points of the pre-tax gains as, according to management, they arise from pro-duction and distribution economies.
Assets turnoverCarlsberg’s assets turnover in 2001 and 2000 was significantly lower than in 1999, offsetting thebenefits from higher margins and depressing RONOA. Why was assets turnover sluggish in thesetwo years? Exhibit 19.12 presents key activity ratios for the three years to 2001; these ratios arethe major components of net operating assets turnover.
The ratios show that Carlsberg improved its utilisation of trade receivables, inventory andplant and equipment – three major operating assets – over the 1999–2001 period. In each case,it generated more revenues per euro of assets year-on-year and this, in turn, led to a shorteroperating cycle. For example, from the inventory turnover figures we see that the average pro-duction and storage period fell from 61 days (365/6.02) in 1999 to 51 days in 2001. The increasein overall assets turnover in 2001 reflects the more intensive use of trade receivables, inventoryand tangible fixed assets. The fall in the ratio in 2000 relative to 1999 was due to the impact ofhigher financial fixed assets and non-trade receivables (and lower operating liabilities).
Note that in some areas of asset management Carlsberg’s absolute performance was still poorin 2001. For example, its customers took on average 64 days – i.e. over two months – to pay theirbills that year.
Financial period* 1998/99 1999/00 2001
Trade receivables turnover 5.43× 5.46× 5.67×[Days’ sales in receivables (365/trade RT) 67.2 66.9 64.4]Inventory turnover** 6.02× 6.7× 7.18×Tangible fixed assets turnover 1.81× 1.84× 1.87×
Net operating assets turnover (Exhibit 19.10) 1.76×× 1.51×× 1.55××
* 1998/99: year to 30 September; 1999/2000: 15 months to 31 December; 2001: year to 31 December. Figures for 1999/2000 are apportioned.
** Numerator is production costs. (For other turnover ratios, it is revenues net of excise duties.)
Carlsberg Group: key activity ratios, 1999–2001Exhibit 19.12
Return on equityAs we saw in Exhibit 19.10, Carlsberg raised returns on shareholders’ funds even faster thanreturns on assets in the 1999–2001 period. Why was this? The main reason was management’sdecision to increase the group’s financial leverage. Exhibit 19.13 charts the average net debt toequity ratio over the five years 1997–2001. The group’s financial structure changed dramatic-ally during this period – from a net cash balance of DKr 0.3 billion in September 1997 to net debtof almost DKr 11 billion at the end of 2001. Management decided in 1998 to finance futureacquisitions from the company’s own internal funds, where possible. If outside funding wereneeded, long-term debt would be used instead of equity.
CFA_C19.qxd 11/7/03 2:16 PM Page 624

CHAPTER 19 • FINANCIAL STATEMENT ANALYSIS: BASIC FRAMEWORK 625
The increased financial leverage is only part of the story, however. To achieve gains fromfinancial leverage, a company must generate positive ‘spread’ – the excess of RONOA over netborrowing costs – as well. In Carlsberg’s case, ‘spread’ almost doubled in the 1999–2001 period.
1998/99 1999/2000 2001
RONOA 9.1% 10.3% 13.9%Gain from net financial leverage 1% 5.5% 8.7%Spread [RONOA − NBC*] 4.9% 8.5% 9.5%Netflev 0.203 0.647 0.918ROE (group) 10.1% 15.8% 22.6%
* Net borrowing costs 4.2% 1.8% 4.4%
A postscript on ROE. What we have calculated above is the rate of return on the equity capitalprovided by Carlsberg’s group shareholders. The return earned by its parent company shareholderswas slightly greater than group ROE in 1999 and 2000 but much less in 2001.15
In DKr mn 1998/99 1999/2000 2001
Group net profit 1,156 2,227 2,615Minority interests 8 −94 −1,109Net profit, Carlsberg A/S share 1,164 2,133 1,507
ROE (parent company) 11.6% 17.6% 17.6%
This indicates that the ventures in which Carlsberg had a majority stake performed much betterin 2001 than those that it owned outright. The reverse was true in 1999 and 2000. The signific-ance to the group of the new subsidiary, Carlsberg Breweries, that combines Carlsberg’s andOrkla’s beverage interests and in which Carlsberg A/S has a 60% stake can be seen from the 2001figure for ‘minority interests’ in the above table.
Carlsberg Group: net financial leverage, 1997–2001Exhibit 19.13
* 15 months to 31 December.
CFA_C19.qxd 11/7/03 2:16 PM Page 625

626 PART 3 • PERSPECTIVES
Comparing Carlsberg’s performance with its rivals’Carlsberg earned high rates of return – on assets and equity – in 2001 compared with the returnsit reported in earlier years. But how did its performance compare with that of its rivals? Exhibit19.14 charts the 2001 ROE – and its main components, RONOA and gain/loss from net financialleverage – of Carlsberg and three of its main rivals, Anheuser-Busch, Heineken and Interbrew.
The exhibit reveals large differences in the four firms’ operating performance and financialstructure in 2001. Measured against Anheuser-Busch and Heineken, the leaders in the industry,Carlsberg’s profitability in 2001 was disappointing. Its operating returns were only half those ofHeineken and two-thirds those of Anheuser-Busch. This meant, in turn, that it had less ‘spread’(RONOA – net borrowing cost) to lever up on its shareholders’ behalf: Anheuser-Busch’s spreadwas over 16% against Carlsberg’s 9.5%.
Moreover, Carlsberg’s and Heineken’s reported profitability – in asset and equity terms – isoverstated relative to Anheuser-Busch’s. Both firms made sizeable acquisitions in the 1990s.Much of the purchase price of these acquisitions was assigned to goodwill which, under account-ing policies then in force at the two firms, was written off against reserves. By contrast,Anheuser-Busch capitalised and amortised purchased goodwill during this time.
There is some consolation for Carlsberg’s management. The company outperformedInterbrew, a much larger firm. It employed debt to its shareholders’ benefit – which Heinekendid not. And Anheuser-Busch with its domestic focus – the USA absorbed 95% of its beer out-put in 2001 – could reap production and distribution economies not available to a geographic-ally dispersed group like Carlsberg.
l Financial risk in 2001Carlsberg was in good financial health in 2001. This is evident from its liquidity and financialleverage ratios that year. Exhibit 19.15 shows key financial risk ratios for the company and threeof its main rivals in 2001.
Carlsberg Anheuser-Busch Heineken Interbrew2001Net revenues from sales (in Abn) 4,632 14,472 7,937 7,303
Return on net operating assets [RONOA] 13.9% 20% 27.8% 9.4%Gain/(Loss) from net financial leverage 8.7 21.6 (0.5) 2.8
Return on group equity 22.6% 41.6% 27.3% 12.2%
Carlsberg and main rivals: comparison of 2001 profitabilityExhibit 19.14
CFA_C19.qxd 11/7/03 2:16 PM Page 626

CHAPTER 19 • FINANCIAL STATEMENT ANALYSIS: BASIC FRAMEWORK 627
The risk of Carlsberg not being able to meet its short-term debts at the end of 2001 was small.For example, Carlsberg had one krone of ‘quick’ assets (cash, short-term investments, receiv-ables) for every krone of current liabilities at the end of 2001. These assets were sufficient tofinance 140 days of the group’s operating outlays (including capital expenditures) that year.Heineken and Interbrew reported a similar ‘defensive interval’. By contrast, Anheuser-Busch’scash and receivables were sufficient to finance barely a month of operating expenditures.Differences in operating environment are partly responsible for the difference in defensive inter-val. The three European brewers have extensive international operations that require them tocarry larger cash balances than their US-focused rival.
Leverage ratios indicate low credit risk, too. Although Carlsberg’s net debt at the end of 2001was almost 90% of its group equity, its strong profits and cash flow meant it had no difficultyservicing these liabilities. For example, interest payments in 2001 were covered six times by earnings and, at the 2001 rate of (pre-tax, pre-interest) operating cash flow, the group couldrepay its debt in three years. Carlsberg’s rivals revealed similar financial strength. As we saw earlier, Heineken had no net debt in 2001 (or in earlier years). More interestingly, Anheuser-Busch had greater balance sheet leverage but higher interest cover and faster debt-repaymentability that year.
l Cash flow profileAnalysis of Carlsberg’s cash flows sheds light on the company’s past investing and financingdecisions. Exhibit 19.16 presents summary cash flow data for the 1999–2001 period. (The figuresfor 2001 are taken from Carlsberg’s 2001 accounts which are given in Appendix 19.2.)
Here is a synopsis of the cash flow ‘story’ for these years:
l Carlsberg’s operations generated positive cash flows. After adjusting for special items in 1998/99 and the 15-month financial period in 1999/2000, operating cash flow grew year-on-year.
l The group continued to invest heavily in plant and equipment, despite little or no growth indemand for beer in its main west European markets. Capital expenditures exceeded depreci-ation every year.
l Increased capex was stimulated by the group’s merger and acquisition activities. Carlsbergacquired majority stakes (‘corporate acquisitions’) and minority stakes (‘financial invest-ments’) in brewing companies in Europe and Asia throughout this period. For example, inaddition to the merger of its beverage interests with Orkla’s at the start of 2001, Carlsbergmade brewery purchases in Switzerland in 2000 and Poland and Turkey in 2001 and made orincreased investments in breweries in South Korea (1999) and Malaysia (2001).
Carlsberg Anheuser-Busch Heineken InterbrewLiquidity riskCurrent ratio 1.3 0.9 1.4 0.8Quick ratio 1.0 0.5 1.1 0.6Defensive interval (in days) 140 28 125 137
Financial leverageDebt–equity ratio 87.5% 97.3% n/a* 50.5%Times interest earned 6.0× 7.5× 16.5× 5.0×Net debt / Operating cash flow 3.0 1.6 n/a 2.0
* n/a: not applicable (company has no net debt).
Carlsberg and main rivals: financial risk in 2001Exhibit 19.15
CFA_C19.qxd 11/7/03 2:16 PM Page 627

628 PART 3 • PERSPECTIVES
l Carlsberg was unable to finance capital expenditures let alone corporate acquisitions andfinancial investments out of operating cash flow. Free cash flow was negative every year. Thegroup’s net outflows after deducting all investing flows totalled almost DKr 9 billion in the1999–2001 period.
l The group financed these net outflows by selling part of its portfolio of short-term invest-ments (DKr 3 billion), raising capital through bank loans and via minority shareholdings innew subsidiaries (DKr 4.6 billion) and reducing its cash balance (DKr 1.3 billion). Carlsbergalso assumed debt with its acquisitions. As a result, reported debt in the consolidated accountsgrew by DKr 7 billion over the three years.16
l Analysis of Carlsberg’s 2001 financial statements: summaryHow accurate were our predictions of Carlsberg’s financial performance and health in 2001? Ourexpectations about the group’s financial health were met but we overestimated its ability to gen-erate superior returns. We also misjudged its cash flow profile. Carlsberg’s cash flows in the1999–2001 period were similar to those of a company in its growth phase – despite beer being amature product in Carlsberg’s main European markets.
1 Profitability. Carlsberg’s performance in 2001 appears to be strong. RONOA and ROE bothincreased and, in the case of ROE, achieved its highest level in five years. However, by com-parison with its main rivals, the group did not earn high operating returns. In particular, itsoperating margins were low. Moreover, its reported performance was overstated because ofits policy of writing off goodwill against reserves.
2 Liquidity and leverage. As expected, liquidity was strong and, despite growing financial lever-age, the group was able to service its debts with ease.
In DKr million 1998/99 1999/2000 2001(15 months)
Operating cash flow* 730** 2,305 2,215
Capital expenditures, net −2,024 −2,770 −3,551Other investment income +33 +38 +1,020Dividends paid −256 −256 −345Free cash flow −−1,517 −−683 −−661
Other investing flows:Corporate acquisitions, net −496 −4,309 −1,340Financial investments, net −399 +248 +192
Operating less investing cash flows −−2,412 −−4,744 −−1,809
Financed by:Disposal of securities +1,427 +736 +821Changes in financial liabilities and minority interests −1,153 +3,797 +1,991
Net change in cash*** −−2,138 −−211 ++1,003
* Depreciation 1,354 2,153 2,224** After deducting special items of 1,091.
*** Excludes effect of exchange rate changes.
Carlsberg Group: analysis of cash flows, 1999–2001Exhibit 19.16
CFA_C19.qxd 11/7/03 2:16 PM Page 628

CHAPTER 19 • FINANCIAL STATEMENT ANALYSIS: BASIC FRAMEWORK 629
3 Cash flows. Surprisingly, free cash flow was negative – not just in 2001 but in the precedingtwo years, too. Note, however, that capex includes expenditures to expand as well as maintainits fixed asset stock and is affected by the group’s merger and acquisition spree during thisperiod. The net outflow was financed by disposals of short-term investments and by borrowing.
Residual income
We’ve seen that Carlsberg was profitable in accounting terms in the 1997–2001 period. The com-pany generated positive RONOA and ROE each year during this time. But were the returnssufficient to make its shareholders richer? To answer this question we need to know the cost ofthe capital employed by Carlsberg. Only if the returns on the capital employed by Carlsberg weregreater than its cost did the company increase shareholders’ wealth. The excess of returns overcost of capital is known as ‘economic profit’ or residual income.
Calculating residual income (RI) is simple in principle. The usual approach is to deduct fromafter-tax operating profit a capital charge for the use of invested capital. Invested capital isdefined as the book value of (net) debt and equity.
Residual income == NOPAT −− (CC ×× BVCAP)
where NOPAT is net operating profit after tax, CC is the cost of capital, and BVCAP is the bookvalue of debt and equity capital. ‘Debt capital’ includes short-term and long-term borrowing; it’susually stated net of cash and cash equivalents. Where RI is calculated for a group, ‘equity capital’includes minority interests. BVCAP can be measured using start-of-period or average carryingamounts of debt and equity capital.
How do investors (and managers) estimate a company’s cost of capital? A common approachis to combine the costs of its debt and equity capital on a weighted basis. Assuming a simple capital structure containing debt and ordinary share capital only, the weighted average cost ofcapital (WACC) is calculated as follows:
WACC ==
where kd is the before-tax cost of debt, ke is the after-tax cost of equity, and t is the tax rate asso-ciated with the tax shelter provided by interest. Since interest is tax-deductible but dividends arenot, the cost of debt should be adjusted to an after-tax basis. Market values should be used incalculating ‘Debt’ and ‘Equity’.
How are kd and ke computed? The cost of debt is the current interest rate on debt of equi-valent risk and maturity. The cost of equity is harder to estimate. One widely used approach isto view ke as the sum of a long-term risk-free interest rate and a market risk premium which isadjusted for the underlying volatility of the company’s shares:17
Long-termke ==
risk-free interest rate ++
The interest rate on high-grade long-term government bonds is a proxy for the risk-free rate.The volatility indicator, known as ‘beta’, is stock market-linked. A company has a beta of 1 if thereturn (i.e. dividend and capital gains/losses) on its shares fluctuates in line with the return onthe stock market. (The stock market is a proxy for all assets.) Such a firm is considered to be ofaverage risk. A higher-risk (lower-risk) firm has a beta of more (less) than 1: the return on itsshares fluctuates more (less) than the market return. The market risk premium is the additionalreturn that investors demand for investing in risky securities (as represented by the overall stockmarket).
Firm-specificvolatility indicator
Marketrisk premium
××
Debt
Debt Equity (1 )
Equity
Debt Equity
+
×× −− ++++
××k t kd e
CFA_C19.qxd 11/7/03 2:16 PM Page 629

630 PART 3 • PERSPECTIVES
Obtaining an accurate estimate of beta is, in practice, a difficult task and is best undertakenby financial economists. Rather than trying to estimate Carlsberg’s beta and thus the actual cost of its equity capital in 2001, we calculate below the company’s break-even WACC in the year,that is, the cost of capital that results in zero RI. From this we can derive the break-even cost of equity capital. If Carlsberg’s actual cost of equity is less than the break-even level, we can con-clude that the company generated positive RI and created wealth for its shareholders in theperiod.
Carlsberg’s breakeven WACC in 2001 – based on reported numbers – was 13.9%. Since‘invested capital’ is equivalent to net operating assets, break-even WACC must be equal toRONOA:
NOPATt −− [WACCB/E,t ×× BVCAPt] == 0 ⇒⇒ WACCB/E,t == RONOAt
As shown in Exhibit 19.10 (the calculation is set out in panel B of Appendix 19.2), Carlsberg’sRONOA in 2001 was 13.9%.
To estimate the break-even cost of equity capital, we need to estimate the weights of debt andequity capital in Carlsberg’s capital structure, using market values. At the end of 2001, the mar-ket value of the company’s equity was DKr 20.9 billion. Assuming the market values of debt andminority interests approximate their book values, this implies that (net) debt representedaround 30% of Carlsberg’s end-2001 financial capital in market value terms.18 The company’snet borrowing cost in 2001 was 4.4% (see Appendix 19.2, panel B) and we assume that thisapproximates the company’s after-tax cost of debt that year. Based on the above estimates ofbreak-even WACC, debt (and equity) weights in the capital structure and the cost of debt,Carlsberg’s break-even cost of equity was 18% in 2001:
13.9% = [(0.3 × 4.4%) + (0.7 × ke,B/E)] ⇒ ke,B/E = 18%
A break-even cost of equity capital of 18% is higher than Carlsberg’s actual cost of equity in 2001which, in view of the low-to-medium risk of investments in global beverage companies, wasprobably in the 10–15% range. At first glance, it appears Carlsberg added value for its share-holders that year.
A second – and closer – glance of the numbers reveals that Carlsberg’s performance in 2001 was not so impressive. We mentioned earlier that Carlsberg wrote off against reserves anygoodwill arising on acquisitions.19 As a result, the reported balance sheet figure for shareholders’equity doesn’t reflect the actual capital invested by shareholders. The amount of the under-statement is large. According to management, Carlsberg wrote off DKr 7.5 billion of purchasedgoodwill up to the end of 2000 and a further DKr 1.6 billion in 2001. Adding back the cumulativegoodwill write-off increases average invested capital to DKr 30.5 billion:
In DKr bn 2001Reported average invested capital (or NOA), at book value 22.2Cumulative goodwill write-off [7.5 + (1.6/2)] 8.3Adjusted average invested capital 30.5
If 2001 NOPAT remains at DKr 3.08 billion (the reinstated goodwill asset is assumed to have anindefinite life and is not amortised), the break-even WACC falls from 13.9% to 10.1%(3.08/30.5) and break-even cost of equity from 18% to 12.5%. This figure is in the middle of therange of likely actual equity costs in 2001.
Adding back goodwill write-offs is only one of several adjustments that can be made to correct Carlsberg’s capital figure so that it reflects more closely the resources invested in the business by shareholders and creditors. Other examples are the reversal of asset write-downs and
CFA_C19.qxd 11/7/03 2:16 PM Page 630

CHAPTER 19 • FINANCIAL STATEMENT ANALYSIS: BASIC FRAMEWORK 631
the capitalisation of non-cancellable operating leases.20 The net effect of including all suchadjustments would be to lower further Carlsberg’s break-even cost of equity – and increase thelikelihood of it being below the company’s actual cost of equity in 2001.
The company’s failure to create wealth for its shareholders is evident more directly – in theshare price. Set out below are end-year market prices of the company’s B shares (the most widelyheld and traded class of its shares) between 1996 and 2001, along with the per-share dividendpaid each year. Recall that the market return on an investment is the sum of the dividend yieldand the percentage change in the share price during the period.
In DKr 1995/96 1996/97 1997/98 1998/99 1999/2000 2001(15 months)
End-year market priceof B shares 353 374 400 257 468 348
Dividend/share 3.4 3.6 4.0 4.0 5.4 5.0
Carlsberg’s share price at the end of 2001 was approximately the same as at end-September 1996,51/4 years earlier. The only return a shareholder investing in September 1996 enjoyed during thesubsequent five years was dividend income – which, in yield terms, averaged around 1% a year.
Summary
In this chapter we show by example how investors analyse a company’s financial statements.Three themes emerge from our investigation of Carlsberg’s 2001 accounts.
1 There is no point in analysing financial statements in a vacuum. Before studying a company’saccounts, we need to be familiar with the industries it operates in and the markets it serves.In particular, we should be aware of the likely effects – on its profitability, asset mix and cap-ital structure – of technological and competitive forces on those industries and markets.Background knowledge such as this improves our understanding of the company and helpsus interpret financial statements better.
2 Analysis involves making comparisons – with the company’s competitors and with its past. Afinancial ratio is only high or low, strong or weak, relative to the benchmark chosen. Caremust be taken to ensure the benchmark is appropriate. An important profitability benchmarkis the firm’s cost of capital. A firm creates wealth for its shareholders only if it earns a returnon its assets greater than the cost of financing them.
3 As investors we should use all the data in financial statements. The profit margin, for ex-ample, reveals only part of the profitability story: the cost ratios, and their movement overtime, tell us more. Similarly, insights we gain from the individual assets turnover ratios –receivables, inventory, fixed assets turnover – add to what we’ve learnt from the total assetsturnover ratio. Moreover, we should test the internal consistency of financial statement num-bers – making sure, for example, that the picture of the company portrayed in its incomestatement tallies with that in its cash flow statement.
A major reason investors analyse financial statements – for many, the reason – is to help themmake investment decisions. They use them, in conjunction with other data, to make forecasts ofcorporate earnings and cash flows and, by extension, to value companies. But financial state-ments have limitations in this role. In the next chapter, we describe and illustrate these limita-tions and show how investors try to overcome them.
CFA_C19.qxd 11/7/03 2:16 PM Page 631

632 PART 3 • PERSPECTIVES
APPENDIX
19.1 Market efficiency and its implications
In recent years stock market professionals have questioned the benefit to investors of analysingpublished financial statements. They claim securities markets are efficient and thus the ordinaryinvestor cannot profit from information which is publicly available. In this section, we ask:
l What is meant by ‘market efficiency’? Are securities markets efficient?l What are the implications for financial statement analysis if markets are efficient? if they’re not?
Our discussion of market efficiency is brief. A fuller treatment can be found in finance texts.21
l Market efficiency: theory and evidence
The definition of market efficiency is simple. A market is said to be efficient if prices in it reflectall available information. Securities markets bear the hallmarks of such a market, it’s claimed.Rational investors value a security on the basis of the present value of its expected cash flows. Ifits market price is below (above) their valuation, they see an opportunity to make money andwill buy (sell short) the security, bidding up the price (or driving it down) until the mispricingis removed and there are no further gains from trading. New information causes investors torevise their valuations and buy or sell accordingly. In an efficient market, investors act on newinformation as soon as it becomes available and the prices of securities adjust to it quickly andcorrectly.
What if investors are not rational? No problem, say supporters of the ‘efficient markethypothesis’ (EMH). If the investment decisions of irrational investors are uncorrelated, then theirtrades cancel each other out – in essence, their trading has a random pattern – and prices of secur-ities continue to reflect fundamental values. If the investment decisions of irrational investors arecorrelated – that is, such investors exhibit herd-like behaviour – ‘smart investors’ such as arbit-rageurs intervene in the market and restore prices to their fundamental values. Arbitrageurs earntheir living from identifying mispriced securities and acting on that information.
To test the EMH, researchers needed more precise definitions of ‘information’ and ‘gainsfrom trading’. They proposed three information strengths. In its ‘weak’ form, security pricesreflect fully the information contained in the past pattern of prices. This suggests that technicalanalysis, that is, plotting past price movements and looking for patterns in them, is of no help toinvestors since, in effect, prices move in a random way. In its ‘semi-strong’ form, security pricesreflect fully all publicly available information. This includes published interim and annualreports, company announcements and general economic and financial data. In its ‘strong’ form,security prices reflect fully all available information, including information not publicly availablebut known to insiders only. Insiders are those with privileged access to corporate information:this group includes management and other employees and extends to those who through theirwork have access to information about the company which has not been made public (e.g. thefirm’s bankers). As for ‘gains from trading’, researchers measured them in risk-adjusted terms.They defined gains (and losses) as abnormal returns, that is, returns above (below) the normalreturns an investor would demand given the risk assumed by investing in the security.
Many empirical studies in the 1960s and 1970s found evidence in support of the weak andsemi-strong forms of the efficient market hypothesis. For example, early research showed thatwhen the company announces its earnings for a past period, its share price already reflects theexpected earnings for that period. In addition, the share price responds quickly to any unexpectedcomponent in the earnings figure. This suggests that investors constantly update their estimates
CFA_C19.qxd 11/7/03 2:16 PM Page 632

CHAPTER 19 • FINANCIAL STATEMENT ANALYSIS: BASIC FRAMEWORK 633
of earnings during the period as new information – about the company or about events that mayaffect it – becomes available.
l Efficient market hypothesis under attackThe EMH has been challenged in recent years. The attack has two prongs. Investors andresearchers cite evidence from stock markets that is not consistent with the hypothesis. Andsome economists question the validity of the assumptions underlying it.
Many empirical studies were published in the 1980s that cast doubt on the EMH in its semi-strong (and even its weak) form. Some found that a security price reaction was still evident60–90 days after the annual earnings announcement – evidence of an ‘underreaction’ to newinformation. By contrast, other studies found that the market overreacts to information. Forexample, ‘growth’ stocks – that is, firms that have achieved a very high rate of growth of earn-ings in the past and trade on a high price-to-book (P/B) or P/E ratio – underperform, while‘value’ stocks (those with a low P/B or P/E ratio) outperform, in the future. This suggests thatinvestors overreact: they bid up prices of growth stocks above, and drive down the prices of valuestocks below, the level warranted by the discounted value of the company’s expected future cashflows.
In addition to research studies, EMH sceptics point to stock market history. Why did the USstock market crash on 19 October 1987? What was the ‘new information’ that caused the 22.6%fall in the Dow Jones Industrial Average index that day? More recently, why did US and Euro-pean stock markets become so overvalued during the dotcom bubble of the late 1990s? And whydid the overvaluation persist so long, given the profitable opportunities available to arbitrageurs?
The theoretical foundations of the EMH have also been attacked. Some economists questionwhether investors are rational. They point to research findings in psychology which offer manyexamples of human behaviour that do not accord with the economist’s notion of rationality. Forexample, human beings tend to make decisions heuristically, relying on patterns they observe inlimited data sets from the past. (This helps explain investor overreaction to companies’ pastearnings history.) Moreover, market professionals doubt whether, in practice, arbitrageurs cancounter the actions of irrational investors. Arbitrage requires a security to have a close substituteso that an arbitrageur can lay off the risk (i.e. buy a security similar to the one he or she has soldshort). Close substitutes exist for derivative instruments (e.g. futures and options) but rarely forshares and bonds. Even where a close substitute for a share exists, arbitrage can be a risky activ-ity. It may take a long time for the prices of the two securities to converge and, in the meantime,the arbitrageur must have the resources to maintain his or her position in them. Prematureunwinding of that position may result in losses. As a result, securities may be mispriced – andthe stock market over- or undervalued – for months if not years.
Not surprisingly, supporters of the EMH have been active in its defence. Empirical studiesthat indicate the market underreacts or overreacts to new information suffer from poor researchdesign, they claim: researchers misspecify risk and so fail to measure risk-adjusted returns cor-rectly. As for stock market ‘anomalies’, these can be explained by changes in discount rates. Forexample, a decline in the equity risk premium – that is, the extra return investors demand forinvesting in risky equities instead of risk-free government bonds – was responsible for high sharevalues in the late 1990s, they argue. And they dispute the contention that arbitrage is, in prac-tice, ineffective at removing mispricing of securities.
l Implications for financial statement analysisThe controversy over the EMH continues. Meanwhile, investors are left wondering whetheranalysing financial reports is a worthwhile activity. For example, if markets are efficient, they will
CFA_C19.qxd 11/7/03 2:16 PM Page 633

634 PART 3 • PERSPECTIVES
APPENDIX
19.2
be unable to profit from financial statement analysis as the new information in a company’sinterim or annual accounts is impounded into its share price too quickly for them to act on it.
First, we should note there are circumstances when the efficiency – or inefficiency – of secur-ities markets is of no direct concern to the financial statement user. For example, the securitiesof private companies and some state-owned companies are not publicly traded. Moreover,financial statement users are diverse and their reasons for analysing a company’s financial state-ments are also varied. Banks use them to evaluate a loan request, unions to formulate a payclaim, governments to help shape tax policy.
Analysing quoted companies’ accounts can still be fruitful even when securities markets areefficient. Investors check financial statements to confirm announcements by a firm of its pastfinancial performance and condition. Interim and annual reports have ‘reassurance’ value: theyhelp reduce investor uncertainty. In addition, investors consult them when assessing the riski-ness of their investments.
But what if markets are not efficient, as EMH sceptics claim? Surely, analysing financial state-ments is a worthwhile activity in these circumstances? Yes – but the scope for investors to makemoney from it may be limited. For example, if a share is mispriced and arbitrage is unable toeliminate the mispricing, investors may have to wait until market sentiment towards the com-pany changes before they can put their analysis of its accounts to profitable use. Experience inthe 1990s suggests there can be periods when they have to wait a long time.
Carlsberg Group: annual accounts and key ratios for 2001
l Panel A Carlsberg Group’s financial statements for 2001*
PROFIT AND LOSS ACCOUNT 2001(in DKr million)
Turnover 46,975Production costs 17,393Excise duties on beer and soft drinks, etc. 12,515
GROSS PROFIT 17,067Sales and distribution expenses 11,386Administration expenses 2,752Other operating income, net 430Profit before tax from participating interests in associated companies 41
OPERATING PROFIT 3,400Special items, net 17
PROFIT BEFORE FINANCIALS 3,417Income from other participating interests, etc. 688Other interest income and similar income 1,210Write-down of fixed asset investments, securities, etc. 78Interest expenses and similar charges 1,878
PROFIT BEFORE TAX 3,359Corporation tax 743
GROUP PROFIT 2,616Minority interests 1,109
PROFIT FOR THE YEAR, Carlsberg A/S’s share 1,507
* Reproduced by permission of Carlsberg A/S.
CFA_C19.qxd 11/7/03 2:16 PM Page 634

CHAPTER 19 • FINANCIAL STATEMENT ANALYSIS: BASIC FRAMEWORK 635
l Panel A Carlsberg Group’s financial statements for 2001 continuedBALANCE SHEET AS AT 31 DECEMBER 2001
(in DKr million)
Assets 31/12/01 31/12/00
FIXED ASSETSTangible fixed assetsLand and buildings 7,683 6,805Plant and machinery 7,983 5,984Other fixtures and fittings, tools and equipment 3,061 3,230Construction in progress 1,599 476
20,326 16,495
Fixed assets investmentsParticipating interests in associated companies 625 474Loans to associated companies 63 195Other investments and shareholdings 1,572 621Other debtors 1,992 1,834Deferred tax 480 1,076Holding of own shares 35 0
4,767 4,200
TOTAL FIXED ASSETS 25,093 20,695
CURRENT ASSETSStocks and debtorsStocks 2,865 1,977Trade debtors 6,580 5,564Amounts owed by associated companies 209 969Other debtors 2,542 2,380Prepayments and accrued income 489 506
12,685 11,396
Securities, cash and cash equivalentsShares 9 10Bonds and other securities 117 1,212Cash at bank and in hand 3,165 1,678
3,291 2,900
TOTAL CURRENT ASSETS 15,976 14,296
TOTAL ASSETS 41,069 34,991
CFA_C19.qxd 11/7/03 2:16 PM Page 635

636 PART 3 • PERSPECTIVES
l Panel A Carlsberg Group’s financial statements for 2001 continuedBALANCE SHEET AS AT 31 DECEMBER 2001
(in DKr million)
Equity and liabilities 31/12/01 31/12/00
EQUITYShare capital 1,278 1,278Reserves 6,781 7,702
8,059 8,980
Minority interests 4,454 1,651
TOTAL EQUITY 12,513 10,631
LIABILITIESProvisionsPensions and similar commitments 780 366Liabilities for deposits on returnable packaging 1,239 1,142Deferred tax 1,137 924Other 546 699
3,702 3,131
Long-term liabilitiesBond loans 7,172 3,047Credit institutions 4,804 2,887Other 66 75
12,042 6,009
Current liabilitiesBond loans 598 1,170Credit institutions 1,601 6,022Trade creditors 3,414 2,651Amounts owed to associated companies 348 150Corporation tax 518 161Excise duties and VAT 1,596 1,262Other 3,312 2,278Accruals and deferred income 1,105 1,181Proposed dividend 320 345
12,812 15,220
TOTAL LIABILITIES 24,854 21,229
TOTAL EQUITY AND LIABILITIES 41,069 34,991
CFA_C19.qxd 11/7/03 2:16 PM Page 636

CHAPTER 19 • FINANCIAL STATEMENT ANALYSIS: BASIC FRAMEWORK 637
l Panel A Carlsberg Group’s financial statements for 2001 continuedCASH FLOW STATEMENT 2001
(in DKr million)
Operating profit 3,400Depreciation 2,224Other adjustments −407Financial expense, net −578Corporation tax paid −839
Cash flow from operations before changes in working capital 3,800Change in debtors −770Change in stocks −176Change in creditors, excise duties, etc. −639
CASH FLOW, OPERATIONS 2,215
Acquisition of tangible fixed assets, net −3,551Acquisition/disposal of companies, net −1,996Acquisition of fixed asset investments −656Disposal of fixed asset investments 848Disposal of securities 821Dividend received from associated companies 1,020
CASH FLOW, INVESTMENTS −−3,514
Dividend paid −345Receivables from sale of companies 656Repayment of debt −1,013Minority interests −513Financial income and expenditure 3,517
CASH FLOW, FINANCING 2,302
CASH FLOW FROM OPERATIONS, INVESTMENTS AND FINANCING 1,003
Cash and cash equivalents, beginning of year 1,678Currency translation adjustments of start-year cash and cash equivalents −21Acquired/sold cash at bank and in hand 505Cash flow for the year 1,003
Cash and cash equivalents, end of year 3,165
Note: The statement of cash flow cannot be derived solely from the published annual accounts.
CFA_C19.qxd 11/7/03 2:16 PM Page 637

638 PART 3 • PERSPECTIVES
l Panel B Derivation of certain financial ratios for 2001
Profitability ratios
Return on equity = Return on net operating assets + [(RONOA − Net bwg cost) × Net financial leverage]
+
NFE = Net financial expense = [Interest expense − Interest income] × (1 − t)[1,878 − 1,210] × (1 − 0.3) = 468
t = Marginal tax rate = 30% (Danish statutory tax rate in 2001)
NOPAT = Net operating profit after tax = Group net profit + Net financial expense2,616 + 468 = 3,084
NOA = Operating assets − Operating liabilities = Net debt + Group equity
End 2001 End 2000Long-term debt 12,042 6,009Short-term debt 2,199 7,192
14,241 13,201Less: Cash and securities −3,291 −2,900Net debt 10,950 10,301 Av. net debt 10,626
Group equity 12,513 10,631 Av. gp equity 11,572
NOA 23,463 20,932 Av. NOA 22,198
Operating revenues = Turnover − Excise duties46,975 12,515 = 34,460
In sum:ROE = [Profit margin × Assets turnover] +
9% × 1.55 [(13.9% − 4.4%) × 0.918]
13.9% + 8.7% = 22.6%Operating performance Gain from net financial leverage
Activity ratios
Inventory turnover 7.18××
Receivables turnover 5.67××
Liquidity ratios
Defensive interval 140 days1262232 858
365,,
( )×Cash Securities Debtors, end-year
Actual operating outlays in yearOp. costs (excl. depn) Capex)
(
+ +
≈ +
34 4606 072
,,
Turnover Excise dutiesAv. trade debtors
−
17 3932 421
,,
Production costsAv. stocks
1062611572
,,
46810626,
3 08422198
,,
34 46022198
,,
3 08434 460
,,
NOPATAv. NOA
NFEAv. net debt
Av. net debtAv. gp equity
−
×
NOPATOp. revenues
Op. revenuesAv. net op. assets
×
[ SPREAD
(RONOA – NBC)NETFLEV]×
CFA_C19.qxd 11/7/03 2:16 PM Page 638

CHAPTER 19 • FINANCIAL STATEMENT ANALYSIS: BASIC FRAMEWORK 639
Problem assignments
P19.1 Alternative approach to financial statement analysis
Asked what she looked for when analysing a company’s financial statements, a prominent fund man-ager, Florence Cash, gave a two-word reply: ‘Cash flow’. Florence then elaborated: ‘When evaluatinga company, I don’t spend time calculating profit margins or return on capital employed or any of theother traditional ratios favoured by financial analysts. The two questions that most concern me are:(1) Does the company generate positive free cash flow? and (2) Is free cash flow growing? I use thesecash flow questions as a screening device. Only if the answer to both is yes, will I consider the com-pany a candidate for investment and investigate it further.’
Required
Comment on Florence’s approach to analysing financial statements. What are the advantages anddisadvantages of this approach?
P19.2 Japanese production methods and profitability
Do Japanese production methods improve corporate profitability? This is a question that has longinterested European and US managers. Recently, some researchers carried out a study of manu-facturing companies in an EU member state to try to answer this question. They found that, for thesample of companies chosen, the profitability of high and low users of Japanese production methodswas very similar, fluctuating between 6% and 8% in the period studied (1986–92). According toresearchers, there was intense interest in Japanese production methods in Europe in the late 1980s;many of the EU firms adopting them did so in these years.
The researchers define profitability in the study as the ratio of operating profit to sales. Just-in-time(JIT) production, JIT delivery of supplies, cellular manufacture and quality circles are examples ofJapanese production methods.
Required
Comment on the above findings. Is the operating profit to sales ratio the most appropriate measureof profitability in this case? Given the nature of Japanese production methods, what impact do youexpect them to have on a firm’s profitability?
P19.3 Effect of transactions on financial ratios
Pappacoda, a macaroni producer, has a current ratio of 1.5, a receivables turnover of 5, and an inven-tory turnover (cost of sales/average inventory) of 10.
Required
Consider the impact of each of the following events separately on Pappacoda’s current ratio, re-ceivables turnover and inventory turnover. Will the ratio increase, decrease or be unaffected?
(a) Purchase of flour and other materials on account. The company assumes a FIFO flow of costs.
(b) Payment of suppliers of materials which were purchased previously on account.
(c) Sale of macaroni on account. Sale price exceeds cost.
(d) Write-off of a bad debt. No provision has been made for doubtful accounts.
CFA_C19.qxd 11/7/03 2:16 PM Page 639

640 PART 3 • PERSPECTIVES
P19.4 Profitability: alternative ways of analysing ROEFKI is a UK-based engineering group with interests in automated material handling, lifting products,and energy technology (e.g. electrical generators, transformers and switchgear). Sales rose 30% inthe 2000/01 financial year but operating profits only managed a 12% increase so margins slipped.Summary income and balance sheet data from that year’s consolidated accounts are set out below.All amounts are in £ millions.
Condensed profit and loss account for year to 31 March 2001
Turnover 1,740Operating profit 202Interest expense, net −44Profit on ordinary activities before tax 158Tax on profit on ordinary activities −55Profit on ordinary activities after tax 103
Condensed balance sheet: average of end-March 2001 and 2000 figures
Tangible fixed assets 398 Capital and reserves 443Goodwill and other fixed assets 522 Long-term borrowings 663
920 Other long-term creditors and provisions 67Stocks 249 730Debtors 394 Short-term borrowings 18Cash and short-term deposits 168 Trade and other short-term creditors 540
811 558Total assets 1,731 Total equities 1,731
Required
(a) Calculate FKI’s return on equity for the year to 31 March 2001. Analyse ROE. What was thegroup’s profit margin, assets turnover and return on net operating assets in 2000/01? How muchdid it gain or lose from financial leverage that year? (Assume ‘Cash and short-term deposits’ areall financial assets. The UK corporate tax rate was 30% in 2000/01.)
(b) Under an alternative approach, ROE is expressed as the product of return on assets and incomeand balance sheet leverage effects. The larger the interest expense in relation to net profit or thelarger total liabilities in relation to total assets, the greater is the impact on ROE of these respect-ive leverage effects.
Return on assets Income leverage Balance sheet leverage
Return on equity = × ×
What are the advantages, if any, of the method of analysing ROE outlined in the chapter (i.e. ROE= RONOA +/− gain/loss from financial leverage) over the above approach?
Check figure:(a) Spread in 2000/01: 8%
P19.5 Profitability: comparing corporate performanceKao Corporation is a Japanese toiletries and household products group. The range of its products issimilar to that of US-based Procter & Gamble but the group is smaller (2001/02 sales of US$6.3 bnvs P&G’s US$40 bn) and less international (domestic sales 75% vs 53% for P&G). Although Kao’sprofits have grown rapidly in the five years to 2002, its profitability in 2001/02 still lagged behindP&G’s. P&G’s group ROE in 2001/02 was 33.8%. By contrast, Kao’s was only 12.9% that year. Kao’sfinancial statements for 2001/02 are presented in condensed form in Exhibit 19.17.
Average total assetsAverage shareholders’ equity
Net profitNOPAT
NOPATAverage total assets
CFA_C19.qxd 11/7/03 2:16 PM Page 640

CHAPTER 19 • FINANCIAL STATEMENT ANALYSIS: BASIC FRAMEWORK 641
Condensed income statement for year to 31 March 2002
¥ million
Net sales 839,026Cost of sales −−361,433
Gross profit 477,593Selling, general and administrative expenses −−365,865
Operating income 111,728Interest income, net of interest expense 31Other non-operating expense, net −−3,818
Income before taxes and minority interests 107,941Income tax expense −−45,778
Income before minority interests 62,163Minority interests in earnings of consolidated subsidiaries −−1,888
Net income 60,275
Condensed balance sheets at end-March 2001 and 2002
¥ million2002 2001
Current assetsCash and short-term investments 159,130 173,250Notes and accounts receivable, net of allowance for doubtful accounts 102,244 105,319Inventories 67,220 69,903Other current assets 24,168 17,739
Total current assets 352,762 366,211
Property, plant and equipment, at net book value 295,563 297,958Intangible assets 53,158 57,370Investments and other assets 70,662 62,221
Total assets 772,145 783,760
Current liabilitiesShort-term debt and current portion of long-term debt 19,290 26,272Notes and accounts payable 91,603 98,627Accrued expenses and other current liabilities 103,759 105,695
Total current liabilities 214,652 230,594
Long-term liabilitiesLong-term debt 36,676 43,142Other long-term liabilities 38,354 26,314
75,030 69,456
Minority interests 22,732 20,722Shareholders’ equity 459,731 462,988
Total liabilities and shareholders’ equity 772,145 783,760
Kao Corporation: condensed financial statements, 2002Exhibit 19.17
(Source: Kao Corporation, Annual Report 2002. Reproduced by permission of Kao Corporation.)
CFA_C19.qxd 11/7/03 2:16 PM Page 641

Summary income and balance sheet numbers taken from P&G’s 2001/02 accounts are givenbelow. (P&G discloses no information about minority interests. Group and parent company equity areassumed to be the same.)
Procter & GambleFinancial year to: 30 June 2002
US$ bn
Net sales 40.24Cost of sales −20.99Selling, general and administrative expenses −12.57Interest expense, net −0.50Other non-operating income, net 0.20Income taxes −2.03Net earnings 4.35
Average net operating assets 23.27Average shareholders’ equity 12.86
Required
(a) Calculate Procter & Gamble’s and Kao’s return on net operating assets (RONOA) for each com-pany’s 2001/02 financial year. P&G’s marginal tax rate is 35%, Kao’s is 42% that year.
(b) Break down RONOA into its profit margin and assets turnover components. What are the reasonsfor P&G’s higher profit margin?
(c) The president of Kao Corporation is puzzled. P&G’s RONOA in 2001/02 is only around 3.7 per-centage points greater than Kao’s but its ROE that year is over 20 percentage points greater(33.8% vs 12.9%). Explain the reason for P&G’s superior performance at the ROE level.
P19.6 Financial ratios: industry differencesCertain industries have distinctive economic traits and these can be seen in the financial statementsof companies in the industry. Set out in Exhibit 19.18 are summary accounts of seven companies fromseven different industries. In each case, numbers from the balance sheets and income statements ofthe three years to 2001 are averaged and then common-sized on net sales (i.e. expressed as a per-centage of net sales).
Required
Match each company in the exhibit to one of the industries below. Give reasons for your choice.
1 Applications software development and production2 Brandy distilling3 Department store retailing4 Drugs development and manufacture5 Electricity generation and distribution6 Supermarket retailing7 Scheduled international air transport
The seven companies come from seven different countries. They do not all use the same accountingmethods. Profitability ratios may be affected. However, industry differences in cost structure, activityratios and financing should still be evident in the seven companies’ accounts.
P19.7 Profitability: competitor analysisThe personal computer (PC) industry has experienced spectacular growth in the last 20 years. Itstarted in the late 1970s when Apple, Atari and Commodore introduced the first personal computers. Ittook off in 1981 when IBM launched its first PC using an Intel microprocessor and operating software
642 PART 3 • PERSPECTIVES
CFA_C19.qxd 11/7/03 2:16 PM Page 642

CHAPTER 19 • FINANCIAL STATEMENT ANALYSIS: BASIC FRAMEWORK 643
provided by Microsoft. Worldwide sales grew by over 15% a year throughout the 1990s. By 2000annual PC sales had reached 130 million units and revenues exceeded US$150 billion that year. Themain reasons for the growth in sales were: the accelerating power of PCs; falling unit prices, helpedby falling prices for components (which represent 80–85% of a PC’s cost); open standards based onIntel’s microprocessor designs and Microsoft’s operating software; and the impact of the Internet.
Rapid growth in sales has not translated into high profits for PC producers, however. Low barriersto entry have resulted in a fragmented industry – the largest firm holds no more than 15% of theworldwide market. Given the dominance of ‘Wintel’ technology, there’s limited opportunity for prod-uct differentiation. Finally, PC producers are in a weak bargaining position relative to their customers(switching costs are low) and component suppliers.
Company(A) (B) (C) (D) (E) (F) (G)
Income statementSales, net 100.0 100.0 100.0 100.0 100.0 100.0 100.0
Operating expenses (excluding D&A and R&D) 90.6 55.5 66.9 95.0 77.4 66.1 84.5
Depreciation and amortisation 8.0 5.0 3.6 2.9 2.9 18.8 3.6Research and development – 16.6 14.0 – – 1.1 –Interest expense (income), net 3.4 (0.8) (0.7) 1.6 6.2 7.2 2.3Income taxes 0.2 8.6 6.6 1.0 4.6 1.9 3.7Other (income) expense, net (1.9) 0.4 (0.1) (1.9) (0.6) 0.4 –
Total expenses 100.3 85.3 90.3 98.6 90.5 95.5 94.1
Group net profit (loss) (0.3) 14.7 9.7 1.4 9.5 4.5 5.9
Balance sheet, end-yearTangible fixed assets:Cost (or value) 167.4 85.8 23.4 30.8 33.3 526.4 58.7– Accumulated depreciation −49.0 −28.9 −9.2 −10.8 −15.9 −297.3 −23.6Net book value 118.4 56.9 14.2 20.0 17.4 229.1 35.1Financial fixed assets 5.6 4.6 10.4 0.1 13.0 11.5 –Other long-term assets* 0.9 0.2 3.9 16.8 89.5 14.1 9.8Inventories 1.3 20.2 0.1 10.0 86.9 13.9 20.3Trade receivables 9.5 16.7 33.4 2.4 21.5 6.6 14.6Cash and securities 12.4 17.0 15.8 1.9 2.2 1.7 0.6Other current assets 5.8 10.4 11.0 1.1 23.4 3.7 0.5
Total assets 153.9 126.0 88.8 52.3 253.9 280.6 80.9
Group equity 25.7 86.9 46.6 16.0 110.3 39.1 28.0Debt (long-term and current) 81.8 8.9 3.6 21.9 87.2 183.9 31.0Provisions and other long-
term liabilities 15.7 7.6 4.3 3.3 11.3 34.4 6.7Current liabilities 30.7 22.6 34.3 11.1 45.1 23.2 15.2
Total equities 153.9 126.0 88.8 52.3 253.9 280.6 80.9
* Including purchased goodwill and other intangibles.
Note: All income statement and balance sheet items are expressed as a percentage of net sales.
Summary common-sized financial statements: average of 1999–2001 figuresExhibit 19.18
CFA_C19.qxd 11/7/03 2:16 PM Page 643

644 PART 3 • PERSPECTIVES
CompanyA B C
Income statementNet sales 100 100 100Cost of sales −87.6 −79.6 −77.1
Gross profit 12.4 20.4 22.9Selling, general and administrative expenses −8.9 −10.3 −15.4Research and development costs −0.5 −1.5 −3.9
Operating income* 3.0 8.6 3.6Financial income/(expense), net +0.1 – +0.3Investment income/(loss) – +1.3 −1.9Other non-operating income/(expense) – – +0.2
Income before tax 3.1 9.9 2.2Income tax expense <0.1 −3.1 −0.8
Net income, group 3.1 6.8 1.4
Balance sheetAssetsCash and securities 10.8 16.7 7.3Accounts receivable 6.6 9.6 18.7Inventories** 8.7 1.4 5.1Other current assets 1.7 2.3 4.8
Total current assets 27.8 30.0 35.9Property and equipment, at cost 4.5 4.7 16.2Less: Accumulated depreciation −1.2 −1.6 −7.9P&E, net 3.3 3.1 8.3Long-term financial investments 0.8 9.0 9.3Intangibles and other long-term assets 8.5 1.5 11.1
Total assets 40.4 43.6 64.6
EquitiesAccounts payable 9.4 13.7 10.7Short-term debt 2.3 – 1.4Other current liabilities 6.1 6.8 16.9
Total current liabilities 17.8 20.5 29.0Long-term debt 0.3 1.8 0.7Other long-term liabilities – 2.2 1.6
Total liabilities 18.1 24.5 31.3Minority interests 0.2 – –Shareholders’ equity 22.1 19.1 33.3
Total equities 40.4 43.6 64.6
* After depreciation of 0.5 0.7 2.4** Of which: Finished goods 5.9 1.0 3.1
Raw materials and work-in-progress 2.8 0.4 2.0
Note: All income statement and balance sheet amounts are expressed as a percentage of net sales.
Three PC producers: common-sized financial statements from 1999/2000Exhibit 19.19
CFA_C19.qxd 11/7/03 2:16 PM Page 644

CHAPTER 19 • FINANCIAL STATEMENT ANALYSIS: BASIC FRAMEWORK 645
Future prospects look bleak. The bursting of the dotcom bubble and the contraction of businessinvestment in the EU, Japan and the USA saw a fall in unit sales and revenues in 2001 and 2002.Growth is not expected to resume until 2004. New competitors have established themselves in thosemarkets that are still growing (e.g. China) and plan to invade the more mature western markets.
Three of the largest firms in the industry are Compaq (since 2002, part of the Hewlett Packardgroup), Dell and Legend. All three pursue a ‘cost leadership’ strategy – aiming to produce a similarproduct to their rivals but at lower cost – but each operationalises it in a different way. Some import-ant characteristics of the three firms are summarised below:
1 Compaq. US company. World’s largest PC producer, with total sales of US$42 billion in 2000.Founded in early 1980s. Focus on lowering production costs through just-in-time delivery of com-ponents and automated assembly lines with low labour content. Has diversified in recent years:half of 2000 sales consisted of servers and storage products and computer-related services,mainly to businesses.
2 Dell. US company. Founded in early 1980s. Total sales of US$32 billion in 2000. Pioneered directsales of PCs to final customers. Assembly of PC is begun when customer places order (by phoneor Internet).
3 Legend. Chinese company. Sales of US$3.5 billion in 2000. Founded in 1984 as distributor of foreign-made computer products. Began making own line of PCs in 1990. By 1997, largest pro-ducer in China. Pursues low price strategy – PC prices are 25% below those of equivalent foreignbrands – made possible by reliance on China-sourced materials and components.
Exhibit 19.19 contains three common-sized balance sheets and income statements taken from recentaccounts of the three companies.
Required
Given the brief information above about the operations and business strategies of Compaq, Dell andLegend, decide which set of accounts belongs to which company. What evidence from the exhibit didyou use in making your decision?
P19.8 Residual income and measuring value creation
Michelin, the French tyre manufacturer, provides in its annual report to shareholders an assessmentof its economic performance in the year. Management compare the group’s actual return on capitalemployed with the target return to determine whether it has created or destroyed value in the period.The target return on capital is similar in concept to the weighted average cost of capital: Michelin’swas estimated by management to be 10.7% in 2001.
Exhibit 19.20 contains summary income statement and balance sheet information for 2001 for theMichelin Group.
Required
(a) Calculate Michelin’s residual income for 2001. According to your figures, did the group create ordestroy value that year? Assume Michelin’s marginal tax rate is 40% in 2001.
(b) In calculating actual and target returns on capital, Michelin include ‘commitments under non-cancellable operating leases’ as part of capital employed. Average operating lease commitmentsin present value terms were A602 million in 2001. Michelin also adjust the profit figure but do notdisclose precisely how they do it. Indicate, in general terms, how Michelin’s NOPAT (net operat-ing profit after tax) should be adjusted for the effect of capitalising non-cancellable operatingleases when calculating residual income. (There is insufficient information in the exhibit to com-pute the adjustment.)
CFA_C19.qxd 11/7/03 2:16 PM Page 645

646 PART 3 • PERSPECTIVES
P19.9 Analysis of leverageDeutsche Telekom (DT) is Germany’s – and Europe’s – largest telecoms group. Investors were con-cerned about DT’s finances in 2002. Fierce competition in its home market resulted in a fall in the revenues and profits of its main division, fixed-line services, in 2001. Its other divisions – Systems,Mobile, and Online – all made losses that year and, in the case of Mobile and Online, are not expectedto become free-cash-flow positive until the middle of the decade. Debt levels were already high owingto the funding of third-generation mobile licences which cost DT over A15 billion in 2000. They rosefurther with the acquisition of US wireless operators VoiceStream and Powertel. DT made an initialinvestment of A5.6 billion in VoiceStream’s preferred stock in September 2000 (classified as a financial asset in DT’s balance sheet). In May 2001 it completed the purchase of both companies bymaking a further cash payment of A4.9 billion and issuing new shares with a market value of A28.7billion. The two companies were included in DT’s consolidated accounts in 2001. They carried aroundA9.5 billion of debt on their books at the time of consolidation and were responsible for most of theincrease in DT’s intangibles (largely, mobile phone licences and goodwill) that year. Together theymade a net loss of A3.1 billion in 2001.
Summary financial statements, taken from DT’s 2001 consolidated accounts, are set out in Exhibit 19.21.
Condensed income statement for 2001in B mn
Net sales 15,775Operating income 1,011Net interest expense −321Income tax expense −329Net income of fully consolidated companies 361Share of losses of equity-method investments −13Amortisation of goodwill −34Net income before minority interests 314Minority interests −18Net income 296
Condensed balance sheets at 31 Decemberin B bn 2001 2000 2001 2000
Fixed assets Shareholders’ equityGoodwill 319 283 Share capital and premium 1,879 1,879Intangible assets 115 122 Retained earnings 2,117 1,964Property, plant and equipment 6,410 5,943 3,996 3,843Investments 493 532 Minority interests 330 311
7,337 6,880 Group equity 4,326 4,154Current assets LiabilitiesInventories 3,302 3,564 Debt 5,820 5,856Trade receivables 3,390 3,340 Provisions for risks and charges 3,959 3,711Other receivables and prepayments 2,414 2,427 Trade payables 1,451 1,590Cash and cash equivalents 939 931 Other payables and accrued expenses 1,826 1,831
10,045 10,262 13,056 12,988Total liabilities
Total assets 17,382 17,142 and shareholders’ equity 17,382 17,142
Michelin Group: summary financial statements, 2001Exhibit 19.20
(Source: Michelin Group, Financial Report 2001.)
CFA_C19.qxd 11/7/03 2:16 PM Page 646

2001 2000
Consolidated income statement
Net revenues 48.3 40.9
Results from ordinary business activities (before tax)* (2.5) 6.5Net income/(loss) (3.5) 5.9
* After deducting: Depreciation and amortisation 15.2 13.0Interest expense, net 4.1 3.1
Consolidated balance sheet (end-year)
Intangible assets 80.0 35.8Property, plant and equipment 58.7 54.1Financial assets 8.0 16.7
Fixed assets 146.7 106.6Inventories, receivables and other 14.3 13.3Cash and short-term investments 3.6 4.3
Total assets 164.6 124.2
Group equity (including minority interests) 66.3 42.7Provisions 18.5 11.4Debt: Long-term 53.7 45.1
Current 13.3 15.2Other liabilities 12.8 9.8
Total equities 164.6 124.2
Consolidated cash flow statement
Net cash from operating activities** 11.9 10.0
Capital expenditures, net −8.7 −6.9Purchase of intangibles, net −0.8 −16.0Net purchase/disposal of financial assets and short-term investments +8.8 −3.6Acquisitions (less disposals) of companies −4.7 −1.2
Net cash used for investing activities −5.4 −27.7
Issuance/repayment (–) of debt −2.9 16.5Dividends −1.9 −1.9Proceeds from share offering – 3.2
Net cash provided by/used for (–) financing activities −4.8 17.8
Net increase in cash and cash equivalents 1.7 0.1
** After deducting interest paid (less interest received) 4.3 2.9
Segmental results for 2001Total revenues Pre-tax results Ebitda
T-Com (fixed-line services) 26.1 3.2 8.0T-Systems 13.8 (0.3) 1.0T-Mobile 14.6 (6.4) 3.1T-Online 1.4 (0.2) (0.1)
Deutsche Telekom: extracts from 2001 consolidated accounts (amounts in A billion)Exhibit 19.21
(Source: Deutsche Telekom, Annual Report and Accounts 2001. Reproduced by permission of Deutsche Telekom AG.)
CFA_C19.qxd 11/7/03 2:16 PM Page 647

Required
(a) Calculate the following ratios for 2000 and 2001:(i) end-year net debt–equity ratio;(ii) times interest earned ratio;(iii) end-year net debt-to-Ebitda ratio.
Based on your calculations of these ratios, was DT less or more able to service its debts in 2001than in 2000? What other aspects of the group’s operations or capital structure might giveinvestors cause for concern about its financial health?
(b) An investor has doubts about the reliability of DT’s published 2001 figures. He queries the group’sreported debt and shareholders’ equity numbers.(i) ‘How can the group record a net repayment of debt on the cash flow statement when its
balance sheet debt increases between the start and end of the year?’(ii) ‘How can the group record an increase in group equity when it reports a loss in the year – and
there’s no evidence in the cash flow statement of a share issue in 2001?’
Answer the investor’s questions. Explain why the group’s debt and shareholders’ equity increasein 2001 despite debt repayments and losses in the year.
Notes to Chapter 19
1 Porter, M.E. (1980), Competitive Strategy, New York: Free Press. Porter’s model is discussed and illus-trated in Grant, R.M. (2002), Contemporary Strategy Analysis: Concepts, Techniques, Applications, 4thedition, Oxford: Blackwell.
2 For a fuller discussion of the economic role of advertising and branding, see Kay, J. (1995), Foundationsof Corporate Success, Oxford: Oxford University Press, chapter 16.
3 Euromonitor (2000), World Drinks Marketing Directory 2000/01, 2nd edition, Vol. 1, London:Euromonitor, chapter 1.
4 Research into brand awareness was carried out by Nielsen Research and is cited in Carlsberg’s 2001annual report.
5 A further distinctive feature – up to 2002 – was the protection Carlsberg enjoyed in its home marketas a result of Danish bottling laws. Beverage containers had to be refillable. This raised importers’ costs(since they couldn’t distribute beer or soft drinks in cans) and represented a barrier to entry into theDanish market. The bottling laws, introduced in 1982 with the aim of encouraging recycling, wererepealed in 2002, in response to legal action by the European Commission. The Commission claimedthat the laws breached the EU’s packaging directive and were a barrier to trade.
6 The analysis in this and subsequent sections is based on the original consolidated accounts for 2001and earlier years. Following the new Danish Financial Statements Act of June 2001, Carlsberg adoptednew accounting policies with respect to, among others, goodwill, restructuring charges, and the valuation of inventories and financial investments as from the first quarter of 2002. At the same time,it showed in summary form the effect of the new policies on the annual accounts of the previous four years.
7 To secure the agreement of Scandinavian competition authorities to the Orkla deal, Carlsberg wasrequired to sell the Swedish and Norwegian operations of Coca-Cola Nordic Beverages, its joint venture with Coca-Cola.
8 We cannot compute the operating profit per litre – by type of beverage or even in total – sinceCarlsberg does not disclose the operating profits of its non-beverage activities.
9 This makes the difference in reported ‘Provisions and other long-term liabilities’ even bigger.Heineken carries larger provisions for pensions (and other staff costs) and deferred taxes.
10 For a fuller discussion of these points – and their implications for business strategy, see Selling, T. andStickney, C. (1989), The effects of business environment and strategy on a firm’s rate of return onassets, Financial Analysts’ Journal, Jan/Feb: 43–52. Selling and Stickney define ‘assets’ as total assetswhen estimating ROA across industries.
648 PART 3 • PERSPECTIVES
CFA_C19.qxd 11/7/03 2:16 PM Page 648

11 A full exposition of this approach can be found in Nissim, D. and Penman, S. (2001), Ratio analysisand equity valuation: from research to practice, Review of Accounting Studies, 6: 109–154. Note thatNissim and Penman calculate ROE (RONOA) using start-of-year equity (net operating assets) insteadof the average-for-the-year figure.
12 A company may report a loss from financial leverage if it carries net cash rather than net debt. In thiscase, netflev is negative.
13 For NYSE and AMEX-listed firms over the 1963–99 period, the Spearman correlation coefficient is0.89: see Nissim and Penman, op. cit., table 2. US firms’ median ROE was consistently greater thantheir median RONOA over the whole of this period, indicating a positive financial leverage effect.
14 Altman, E. (1993), Corporate Financial Distress and Bankruptcy, 2nd edition, New York: John Wiley.For a discussion of the problems associated with bankruptcy prediction models, see Foster, G. (1986),Financial Statement Analysis, 2nd edition, Englewood Cliffs, NJ: Prentice Hall, Chapter 15.
15 The ROE of the parent company’s shareholders can also be derived by applying the following mul-tiple to group ROE:
ROE (parent company) = ROE (group) ×
NI.PC is the net income attributable to the parent company’s shareholders and SE.PC is the equity ofthe parent company’s shareholders.
16 Carlsberg’s 2001 financial statements in general – and its cash flow statement in particular – lack trans-parency. It is not possible to reconcile the cash flow statement data to the change in balance sheet num-bers between end-2000 and end-2001. For example, there is no explanation in the accounts of thechange in debt between the start and end of 2001. In addition, some entries in the cash flow statementare either puzzling or obscure. What is the source of the large dividend received from associated com-panies in 2001? What is included within ‘Financial income and expenditure’ under financing flows?Lack of transparency can be costly to a firm. Investors become suspicious and demand a higher returnto compensate them for the additional perceived risk, thereby driving up the firm’s cost of capital.
17 The following is a simplified description of an asset pricing model known as CAPM (capital asset pric-ing model). For a fuller discussion of the model and some of the problems associated with it, consulta finance textbook (e.g. Brealey, R. and Myers, S. (2001), Principles of Corporate Finance, 7th edition,New York: McGraw-Hill, Chapter 8).
18 Debt’s 30% weighting is based on the following end-2001 figures: net debt of DKr 11 billion, minorityinterests of DKr 4.5 billion and equity of parent company shareholders of DKr 20.9 billion. Minorityinterests are assumed to be part of the equity weight for the purposes of the WACC calculation.
19 As a result of changes to its accounting policies implemented in 2002, Carlsberg now capitalises andamortises goodwill arising on acquisitions.
20 A US consulting firm, Stern Stewart, promotes just such a version of residual income. ‘Economic valueadded’ – or EVA as it’s commonly known – includes a number of adjustments to both operating profitand invested capital that are designed to bring accounting numbers closer to a cash basis and, at the same time, undo the effects of conservatism in determining income. Stern Stewart claim EVA issuperior to traditional profitability ratios as a measure of divisional and company-wide perform-ance. For an independent appraisal of EVA, see O’Hanlon, J. and Peasnell, K. (1998), ‘Wall Street’scontribution to management accounting: the Stern Stewart EVA financial management system’,Management Accounting Research, 9: 421–444.
21 See, for example, Brealey, R. and Myers, S. op. cit., chapter 13. For a critique of the efficient markethypothesis, see Shleifer, A. (2000), Inefficient Markets, Oxford: Oxford University Press.
NI.PC/Group net income
Av. SE.PC/Av. group equity
CHAPTER 19 • FINANCIAL STATEMENT ANALYSIS: BASIC FRAMEWORK 649
CFA_C19.qxd 11/7/03 2:16 PM Page 649
Financial statement analysis:extensions
INTRODUCTIONCarlsberg’s 2001 financial statements which we analysed in Chapter 19 presentfew problems for the investor. Carlsberg draws most of its revenues and profitsfrom one activity, the production and distribution of beer and soft drinks. Thecompany made no major changes to its operations or accounting policies inthe year. Moreover, we restricted our analysis to Carlsberg’s accounts so avoid-ing the problems that can arise when making intercompany comparisons.
This chapter has two goals. The aim in the first part is to look at some of thepractical problems investors face when analysing more complicated financialstatements. These practical problems arise because of:
l Non-comparability of financial statements. A firm’s financial statements maynot be comparable over time because it changes its operations or its account-ing policies. In addition, an investor may have difficulty making cross-bordercomparisons because firms follow different accounting policies.
l Overaggregation. Consolidated financial statements may conceal importantfinancial information about a diversified firm’s business activities.
l Lack of timeliness. Investors want more timely information on the progressof the firm than is provided by annual accounts.
We examine each of these problem areas and show how, with the help of addi-tional information which firms following international standards must nowprovide, investors can overcome them.
In section 2 of the chapter we confront a problem which occurs in even the toughest of regulatory environments: management may manipulate thenumbers in their firm’s financial statements. We discuss the reasons for andmethods of ‘creative accounting’ and explain the steps investors take tounmask it.
Earnings per share is an important statistic used by investors when analysingfinancial statements. Certain firms are required to report it in their annualaccounts. We show in the appendix how it’s calculated.
2020
SECTION 1Problem areas infinancial statementanalysis
l Major changes inoperating activities
l Accounting changes
l Intercompanydifferences inaccounting policies
l Diversified operations
l Interim reporting
SECTION 2Accounting manipulationand its detection
l Appendix: Earningsper share
In this chapter
CFA_C20.qxd 11/7/03 2:17 PM Page 650

CHAPTER 20 • FINANCIAL STATEMENT ANALYSIS: EXTENSIONS 651
SECTION
1 Problem areas in financial statement analysis
Major changes in operating activities
The first problem area concerns the accounting effects of major changes in a company’s operations.As we saw in Chapter 19, investors compare financial numbers and ratios of the current periodwith those of previous periods when analysing a company’s financial statements. They use previousperiods’ numbers as a benchmark when evaluating the company’s current financial performanceand condition. Major changes to the company’s operations – such as a large acquisition or thedisposal of a segment of the business – make such comparisons difficult.
In addition, estimating a company’s future earnings becomes harder. In making earningsforecasts, investors often take as a starting point the company’s current recurring earnings.Recurring earnings consist largely of the income from its continuing operations. When a companysells or spins off a business segment, the operating results of these activities are no longer part ofits income from continuing operations. They – and any gains or losses arising on the disposalitself – represent transitory profits (or losses). If they are not reported as such in the financialstatements, investors will miscalculate the company’s recurring earnings that period.
IllustrationHero’s 2002 results provide a good illustration of the problems that major business changes cancause. Hero is a Swiss consumer foods and baking aids group and the leading jam producer inEurope. In 2002 it acquired several businesses, including Schwartauer Werke, the German con-sumer foods group.
Hero’s 2002 income statement shows the following sales and operating profit figures(amounts in SFr million):
2002 2001 % increase
Net sales 1,386 1,179 17.5Operating profit 144.9 89.6 61.7
Note the large increase in Hero’s sales and profits in 2002. How much of the increase isattributable to the acquisitions that year? Hero discloses that sales from existing businesses (i.e.organic sales) rose only 2.7% in 2002 and acquisitions were responsible for the bulk of the salesgrowth that year. However, it doesn’t provide similar figures for operating profits. As a result,it’s more difficult for investors to construct a group profit forecast for 2003 and later years.1
l Disclosure requirements under IAS Hero’s limited disclosures are not atypical. The EU’s 7th Directive states that where there hasbeen a major change in the composition of a group, the consolidated accounts should provideinformation which makes the comparison of accounts over time ‘meaningful’ (Art. 28). Yet fewEU companies show in detail the effect on sales and profits of significant acquisitions and dis-posals unless, as in Ireland and the UK, national accounting rules require it. One reason may bethat the directive does not spell out precisely what information companies should disclose inthese circumstances.
CFA_C20.qxd 11/7/03 2:17 PM Page 651

652 PART 3 • PERSPECTIVES
The IASB issued an accounting standard in 1998 that sets out disclosure requirements forfirms discontinuing part of their operations. Where a firm sells or closes down a major componentof its business, it should describe the activities to be discontinued and which lines of businessthey’re in. In addition, it should show separately – on the face of the financial statements or inthe notes – the following items which are attributable to the operations it’s discontinuing:
l assets and liabilities in the current and previous year’s balance sheets;l revenues, expenses (including tax), profit and cash flows up to the date of disposal – and
comparative figures for the previous year; andl gain or loss on the disposal itself, showing the tax effect separately.2
The segregation of assets, liabilities, revenues and expenses occurs from the date the companyis ‘demonstrably committed’ to the disposal. Evidence of this is either a binding sale agreementor a detailed formal plan of discontinuance from which the company cannot realistically with-draw. The standard lays down less stringent disclosure requirements for the period between theannouncement of and firm commitment to discontinuance. The reason for the tightly draftedrules is to bring within the disclosure net firms that discontinue a line of business but sell itsassets piecemeal. In addition, accounting regulators want investors to be aware of the impact ofan impending disposal as early as possible.
Companies differ in how they present information about discontinued operations in theiraccounts. Some follow US/UK practice and highlight the revenues and trading results of suchoperations on the face of the income statement; other disclose the information in the notes.Exhibit 20.1 contains an illustration of the latter approach.
Xstrata is a Swiss-based natural resource group. Management carried out a major restructur-ing of the group in 2000 and 2001. They sold its Australian coal mining interests and aluminiumreduction facility, its Argentinian oil and gas fields and a Chilean forestry trading company. They purchased a zinc mining, smelting and refining operation in Spain, acquired a magnesiumscrap refining facility in the USA and increased the group’s stake in an Australian vanadium project. The group discloses the gain or loss on disposal of operations on the face of the incomestatement (Exhibit 20.1, panel A) but shows the trading results of the discontinued operations inthe notes to the accounts (panel B). It’s evident from panel B that the discontinued operationscontributed little to operating results in 2000 or 2001 (though the group made a large gain fromdisposal of its Argentinian oil and gas fields in 2000.) The group does not disclose separately theresults of acquired businesses, but this information can be extracted from the note on segmentaldata, part of which is given in panel C. For example, the new zinc operation generated the sameamount of revenues in 2001 as the long-established ferrochrome division but was less profitable(9% return on capital employed against ferrochrome’s 26%).3
With the information on the group’s discontinued operations and its segmental results, investorsare better able to assess Xstrata’s performance in 2001. And they have two years’ comparable dataabout the group’s continuing businesses to help them forecast its earnings for 2002 and later years.
Accounting changes
The second problem area we look at concerns accounting changes. You’ll recall that one of thefundamental concepts in accounting is consistency. A company is supposed to apply the sameaccounting policies from one period to the next. This allows investors to compare its financialnumbers over time. They have difficulty observing trends in, for example, cost ratios if a firmchanges its accounting policies and does not restate prior years’ accounts at the same time.Moreover, once a firm has closed its accounts for a period, it is not supposed to reopen them andalter the numbers.
CFA_C20.qxd 11/7/03 2:17 PM Page 652

CHAPTER 20 • FINANCIAL STATEMENT ANALYSIS: EXTENSIONS 653
Panel A Consolidated 2001 income statement (part)
In US$ mn 2001 2000
Revenue 613.6 597.9
Cost of goods sold (474.5) (449.7)Depreciation and amortisation (36.0) (21.7)
Operating earnings before effects of disposals and impairment 103.1 126.5
Gain/(loss) on disposal of operations (2.0) 68.9Loss from impairment of assets (45.5) –
Operating earnings 55.6 195.4...
Panel B Results of discontinued operations in 2000 and 2001
Forestry trading Coal Aluminium Oil and gasIn US$ mn 2001 2000 2001 2000 2001 2000 2001 2000
Revenue 23.8 54.8 – 35.4 – 18.1 – –Expenses (21.6) (52.7) – (39.0) – (17.0) – –
Operating earningsbefore effect of disposal 2.2 2.1 – (3.6) – 1.1 – –Gain/(loss) on disposal (1.8) – (0.2) – – 0.1 – 68.8
Operating earnings/(loss) 0.4 2.1 (0.2) (3.6) – 1.2 – 68.8Other (0.5) (0.4) – 0.1 – (0.2) – –Income tax (charge)/credit (0.1) (0.2) – 0.3 – n.s. – –
Net earnings/(loss) (0.2) 1.5 (0.2) (3.2) – 1.0 – 68.8
Panel C Segmental information (part)
Metals and minerals Energy Forestry2001 Ferro- Oil and Plantation(US$ mn) chrome Vanadium Zinc Magnesium gas Coal and trading Other Total
Revenue 257.7 63.5 266.6 n.s. – – 25.8 – 613.6Op. earnings 66.2 (41.6) 47.5 (5.0) – – (0.9) (10.6) 55.6Cap. employed 252.2 106.9 548.1 25.3 – – 33.8 32.6 998.8
Metals and minerals Energy Forestry2000 Ferro- Oil and Plantation(US$ mn) chrome Vanadium Aluminium Magnesium gas Coal and trading Other Total
Revenue 419.3 68.5 18.1 – – 35.4 56.6 – 597.9Op. earnings 114.9 20.6 1.2 – 68.8 (3.6) 2.3 (8.8) 195.4Cap. employed 363.5 206.2 – 3.7 – 39.9 50.5 20.4 684.2
Xstrata Group: income statement effects of 2000 and 2001 disposalsExhibit 20.1
(Source: Xstrata Group, Annual Report 2001. Reproduced by permission of Xstrata plc.)
CFA_C20.qxd 11/7/03 2:17 PM Page 653

However, in practice, firms do change their accounting policies. In addition, they sometimesrestate the numbers in past years’ accounts without changing their policies. In this section, we ask:
l Why do firms make accounting changes?l How do they account for such changes?l What is the impact of accounting practice in this area on financial statement analysis?
l Reasons for accounting changesA company may change the numbers in its past or current accounts for one of the following reasons:
l Error. It discovers a material error which requires it to adjust current and prior years’ accounts.l New accounting rule. It is forced to change accounting methods as a result of legislation or the
introduction of a new accounting standard.l Management decision. It changes its accounting policies voluntarily. Accounting policies
embrace both accounting methods (for example, the straight-line or accelerated method of depreciation) and accounting estimates (the expected economic lives of various types ofequipment, the proportion of receivables likely to prove uncollectible).
One reason for changing an accounting policy is that economic conditions have changed – forexample, the rate of technological change has increased, shortening the economic lives of certainfixed assets – and management adjust accounting estimates or methods (or both) in response.Other reasons that management give are:
l to provide better matching of revenues and expenses;l to bring the firm’s accounting policies into line with those of other firms in the industry.
l Presentation of accounting changes: three approachesHow might a firm report an accounting change? We focus on changes in accounting policy. Hereare the three principal ways (others are variants of these):
1 Restatement. The firm restates previous years’ accounts. In the case of a new accounting policy,it applies the policy retroactively. This ensures that current and prior years’ accounts are pre-pared on a consistent basis, making it easier for an investor to analyse trends. However, it canbe a costly exercise and, if done frequently, can undermine investor confidence in a company’spublished accounts.
2 Cumulative catch-up. The firm adjusts the current year’s accounts only. It shows the cumulativeimpact of the accounting change in one entry. Current and prior years’ accounts are no longerstated on a consistent basis – interperiod comparisons are undermined – but, in contrast torestatement, the effect of the accounting change is highlighted.
3 Prospective adjustment. The firm adjusts the accounts of the current and future periods only. Itmakes no adjustment with respect to past periods. Comparability of past and future accountswill suffer and the change is not highlighted. However, this may be the most appropriateapproach where the reason for the change is the arrival of new information (i.e. informationwhich could not have been known in the past).
IllustrationAssume Drosselmeyer Company, a toy-maker, starts business in year 1. From the outset, it spends10 each year on developing new products (all amounts are in millions). Initially, it capitalises the costs of developing new toys and amortises them over five years. However, other firms in the industry expense development costs as they’re incurred. Drosselmeyer decides to align its
654 PART 3 • PERSPECTIVES
CFA_C20.qxd 11/7/03 2:17 PM Page 654

CHAPTER 20 • FINANCIAL STATEMENT ANALYSIS: EXTENSIONS 655
accounting policy with that of its rivals and, at the start of year 5, changes its method of accounting for development costs from capitalisation to immediate expensing.
Exhibit 20.2 shows the effect on Drosselmeyer’s year 5 accounts of two of the threeapproaches: (a) cumulative catch-up and (b) restatement. (Prospective adjustment is reviewedlater.) Comparative figures for year 4 are also given, since these would be shown in the year 5financial statements. Under (a), they are unchanged from those shown in the year 4 financialstatements. Under (b), they are restated.
FactsToymaker Drosselmeyer starts business in year 1. Up to start-year 5, it capitalises andamortises product development costs on a straight-line basis over five years. From year 5, it expenses them as they're incurred. Operating profit (before development costs) is 15,development costs 10 and dividends 5 each year. Start-year 1 net assets are 25. Taxes areignored. Amounts are in millions.
Effect on year 5 accounts if change is accounted for by:(a) Cumulative catch-up (b) RestatementYear 4 Year 5 Year 4 Year 5
Income statementOperating profit 15 15 15 15Development costs amortised −8* – – –Development costs expensed – −10 −10 −10Cumulative effect of changein accounting policy – −20** – –
Profit/Loss (−) 7 −15 5 5Dividend −5 −5 −5 −5
Retained profit/loss (−) 2 −20 0 0
Balance sheetDevelopment costs, gross 40 – – –– Accumulated amortisation −20 – – –Development costs, net 20 – – –Other net assets 25 25 25 25
Total net assets 45 25 25 25
Share capital 25 25 25 25Retained profit, 1/1 18 20 18 0Prior period adjustment – – −18*** –Retained profit or loss (–) for year 2 −20 0 0Retained profit, 31/12 20 0 0 0
Total shareholders' equity 45 25 25 25
Notes: Key numbers from years 1–4 accountsYear 1 Year 2 Year 3 Year 4
Development costs, gross 10 20 30 40– Accumulated amortisation −2 −6 −12 −20Development costs, net 8 14 18 20**Annual amortisation 2 4 6 8*
Profit for year 13 11 9 7Retained profit (cumulative) 8 14 18*** 20
Accounting change: cumulative catch-up and restatement approaches illustratedExhibit 20.2
CFA_C20.qxd 11/7/03 2:17 PM Page 655

Under the cumulative catch-up approach, a one-time adjustment is made to the accounts. If Drosselmeyer changes its accounting method at the start of year 5, it will make the followingentries with respect to development costs that year:
Start-year 5Dr. Cumulative effect of change in accounting policy (OE−) 20Dr. Accumulated amortisation, development costs (CA−) 20
Cr. Development costs (A−) 40To record the cumulative effect of the change in accounting for development costs.
During year 5Dr. Development expense (OE−) 10
Cr. Cash (A−) 10To record the immediate expensing of year 5 development costs.Exhibit 20.2
Drosselmeyer’s ‘Development costs’ asset has a gross cost of 40 at the start of year 5. This is the result of capitalising four years’ expenditures at the rate of 10/year. The carrying amountof the asset is 20 then (see Exhibit 20.2 – under ‘Notes’ – for the calculation of this figure). As a result of the change in policy, the asset is written down to zero. Drosselmeyer shows the‘Cumulative effect . . .’ as a separate item on its year 5 income statement, thereby highlighting the effect of the change. The year 5 income statement also bears the burden of a full year’s chargefor year 5 development costs. The company’s cash flow is unaffected, however (assuming thechange in policy has no tax impact).
Restatement affects not only the accounts in the year of change but also comparative figuresgiven in that year’s accounts. Thus in its year 5 financial statements, Drosselmeyer accounts for product development costs as if it had adopted the policy of immediate expensing ab initio.At the same time, it restates comparative year 4 figures and adjusts the start-year 4 balance inretained earnings. In this case, the prior period adjustment of 18 is the amount by which retainedearnings would have been lower if Drosselmeyer had expensed development costs as they wereincurred, starting in year 1.
If Drosselmeyer accounts for the change in accounting for development costs prospectively(not illustrated in Exhibit 20.2), it would record a prior period adjustment (of –20) to start-year5 retained earnings and recognise development expense of 10 in its year 5 income statement. In contrast to the restatement method, it would not restate year 4’s accounts. The result is thatthe figures for years 4 and 5 presented in year 5’s accounts are not comparable. The year 4 figuresassume development costs are capitalised and amortised while those for year 5 assume they’reexpensed immediately.
IAS requirements
Drosselmeyer is not free to choose the way it presents the change in accounting for productdevelopment costs. Firms that follow IAS must now account for changes in methods and estimates and for fundamental errors in the following way.4
Changes in estimates (e.g. asset lives, collectibility of debts, inventory obsolescence) should be accounted for prospectively. The change will affect the way a firm determines its current andfuture profits only. The firm does not alter its past financial statements.
Under international rules, there are two possible ways a firm can account for a change inaccounting method. One way is to apply the new method retrospectively and restate prior years’accounts. This is the benchmark treatment. The other – acceptable but not preferred – is the cumulative catch-up approach. The ‘Cumulative effect . . .’ should be shown as an exceptional item(before pre-tax income) on the income statement. A firm may be forced to use this approach if
656 PART 3 • PERSPECTIVES
CFA_C20.qxd 11/7/03 2:17 PM Page 656

CHAPTER 20 • FINANCIAL STATEMENT ANALYSIS: EXTENSIONS 657
it’s not allowed, under national law, to restate prior years’ numbers. Note that even in this case,it is encouraged to provide, on a pro forma basis, comparative information for prior years underthe new method.5
What happens if the effect of the change on prior periods’ accounts is not determinable?Suppose, for example, a firm is considering changing the method of valuing its inventory fromFIFO to LIFO. For LIFO purposes, inventory consists of ‘layers’ of cost. The firm must deter-mine when each layer arose and what was its cost. This could involve reconstructing inventorymovements since the date the firm was founded, a costly if not impossible exercise. In this andsimilar cases, the IASC allows firms to apply the new method from the start of the year of changewithout retrospective adjustment.
Where a change in accounting method is voluntary, the firm must justify the change in itsaccounts. It must show that the new method ‘will result in a more appropriate presentation ofevents or transactions’ in its financial statements. If a company is forced to change its account-ing policy as a result of a new international accounting standard, the standard itself will state how the change is to be handled.6 Fundamental errors, when discovered, are accounted for in thesame way as changes in accounting method – preferably by restatement but with cumulativecatch-up as an allowed alternative.
l Impact on financial statement analysisFirms do not often change their accounting methods voluntarily. The law – or the accountingrequirement that the new method must be preferable to the old – constrains them. Changing pastaccounting numbers because of fundamental error is also rare. However, with the introductionof new accounting rules – at national and international levels – mandatory changes in account-ing method have become more common. The cumulative catch-up approach is widely favouredin these cases, on legal and cost grounds. However, unless the company discloses pro forma datashowing past years’ financials prepared according to the new method, investors will find itdifficult to make interperiod comparisons or analyse trends.
Accounting for a change in method has one major benefit for investors. The change is high-lighted in the firm’s accounts. In contrast, investors may be unaware a firm has changed anaccounting estimate. True, companies following international standards are required to show the effect on the accounts, if material, of any change in accounting policy – and that includeschanges in estimates. But national rules are not always so strict. How can a reader of accountsdiscover if a company is changing accounting estimates surreptitiously – perhaps to boost profits or to smooth them? One way is to examine closely accounting items where such changesare likely. Examples are depreciable fixed assets, inventory and accounts receivable. Ratios inthese areas – such as depreciation expense to gross fixed assets or bad debt expense to accountsreceivable – should be monitored for unusual movements.
Intercompany differences in accounting policies
Accounting changes can undermine the trend in a firm’s reported profits; intercompany differ-ences in accounting policies can undermine cross-firm comparisons. We’ve already seen that,when given comparative figures restated or adjusted on a pro forma basis, an investor can over-come the first problem. What can he or she do about the second?
There are several possible remedies. One is to adjust accounts on a piecemeal basis in orderto make them comparable. We call this partial adjustment since investors can rarely estimatethe effects of all accounting differences between companies. Another – the full adjustment route– is to make use of supplementary, ‘alternative GAAP’ information a company may provide.
CFA_C20.qxd 11/7/03 2:17 PM Page 657

658 PART 3 • PERSPECTIVES
For example, many large international firms disclose in the notes to the accounts key financialnumbers prepared according to alternative accounting rules (e.g. US GAAP). A third is to addcash-based measures of performance and risk to the armoury of accrual-based ones we dis-cussed in Chapter 19. By definition, cash-based ratios are free of the accounting methods andestimates that underlie – and compromise – accrual-based ratios.
This problem is not trivial. Differences in accounting policy can affect virtually all items on corporate financial statements – revenues and expenses, liabilities as well as assets. They canhave a major impact on firms’ reported profitability – and on their risk ratios too. Accountingdiversity is evident within countries but it’s often most marked between countries.
l Partial adjustmentInvestors themselves can often adjust specific numbers in the financial statements from oneaccounting basis to another. There may be sufficient detail in the notes to the accounts to allowthem to do this. For example, suppose Drosselmeyer, the toy-maker we met in the previous section, does not change its accounting policy but continues to capitalise and amortise productdevelopment costs. An investor can convert the company’s accounts to the method used by itsrivals – immediate expensing of development costs – by making the following adjustments:
1 Reduce Drosselmeyer’s fixed assets and shareholders’ equity by the end-year carrying amountof the asset, ‘Development costs’.
2 Adjust Drosselmeyer’s before-tax profit for the difference between development costs actuallyamortised and development costs incurred that year. (Under immediate expensing, develop-ment expense is equal to development costs incurred.) Profit is reduced if costs incurredexceed costs amortised.
Sometimes companies help. National law and accounting standards may require firms to pro-vide alternative valuations of key assets and liabilities. For example, EU-based firms that valuetangible fixed assets at other than historical cost must disclose either the HC of such assets or thevaluation adjustment (4th Directive, Art. 33(4)). Quoted firms in the USA that value inventoryon a LIFO basis must disclose its current cost at the balance sheet date (FIFO cost is considereda proxy for current cost).
By their nature, these item-specific disclosures, whether estimated by investors or provided by the company, are of limited value. They permit a partial adjustment of a firm’s financial statements only. Where accounting policy differences are many, investors may be unable to fullyreconstruct a firm’s financials on the same basis as its competitors.
l Full adjustmentThe obvious solution to this problem is for firms to present financial statements on a standardisedbasis. Standardisation can be achieved, nominally at least, if all firms adopt a common set ofaccounting standards. This is the main purpose of IAS. However, international standards have notbeen universally adopted yet. In the meantime, many larger firms offer supplementary informa-tion on a standardised basis.
The supplementary information takes one of two forms. A firm may present an additional setof financial statements prepared according to international or US GAAP. This is the solutionfavoured by large Finnish and Norwegian companies.
Alternatively, it may show, in the notes to the accounts, key numbers such as net profit andshareholders’ equity under international or US GAAP with a reconciliation to national GAAP.For example, non-US firms which arrange for their shares to be listed on a US stock exchangemust provide certain key figures on a US GAAP basis if the primary statements filed with the SEC
CFA_C20.qxd 11/7/03 2:17 PM Page 658

CHAPTER 20 • FINANCIAL STATEMENT ANALYSIS: EXTENSIONS 659
are prepared according to national GAAP. They must present, at a minimum, a reconciliation of(annual) net income between national and US GAAP and state what the end-year shareholders’equity would be under US GAAP.
Exhibit 20.3 illustrates this form of adjustment. It shows the reconciliation by Unilever, theAnglo-Dutch food and household products company, of its published 2001 profit and share-holders’ equity figures to US GAAP. The information is taken from a note to the group’s 2001accounts.
Unilever’s consolidated accounts are prepared in accordance with accounting principles whichdiffer in some respects from those applicable in the United States. The following is a summaryof the effect on the Group’s net profit . . . and capital and reserves of the application of UnitedStates generally accepted accounting principles (US GAAP).
A million2001
Net profit 1,838US GAAP adjustments:
Goodwill (124)Identifiable intangibles (118)Restructuring costs (18)Interest (55)Derivative financial instruments (119)Taxation effect of above adjustments 108
Net (decrease) (326)
Net income under US GAAP before cumulative effect of change in accounting principle for derivative financial instruments 1,512Cumulative effect of change in accounting principle for derivative financial instruments, net of tax benefit of A3 million (6)
Net income under US GAAP 1,506
A million A million2001 2000
Capital and reserves as reported in the consolidated balance sheet 7,195 8,169US GAAP adjustments:
Goodwill 2,303 2,926Identifiable intangibles 3,009 3,067Restructuring costs 166 185Interest 432 487Other comprehensive income effect of derivative financialinstruments transition adjustment (101) –Derivative financial instruments (128) –Pensions and similar liabilities 538 437Dividends 1,059 937Taxation effect of above adjustments (920) (1,133)
Net increase 6,358 6,906
Capital and reserves under US GAAP 13,553 15,075
Unilever Group: US GAAP disclosures in 2001 accounts (extracts)Exhibit 20.3
(Source: Unilever Group, Annual Report and Accounts and Form 20-F 2001.)
CFA_C20.qxd 11/7/03 2:17 PM Page 659

In a separate commentary (not given here), Unilever explains the reason for each of theitemised differences between the company’s accounting principles and US GAAP. The mostsignificant in 2001 concern goodwill and other intangible assets. Prior to 1998, Unilever wroteoff against reserves goodwill and other intangibles that arose on the acquisition of stakes in sub-sidiaries and associated companies. Under US GAAP, goodwill and identifiable intangibles(principally trademarks) must be capitalised and amortised against profit. This is the policy thatUnilever has followed since 1998.7
Amortisation of pre-1998 goodwill and other intangibles reduces Unilever’s before-tax profitunder US GAAP by a242 million. The balance sheet impact is much greater. Capitalisation ofthese intangibles increases end-2001 shareholders’ equity by over a5,300 million. Note that this is the carrying amount (cost less accumulated amortisation) of the goodwill and other intangibles that Unilever wrote off before 1998.
The effect of all the differences between Unilever’s own accounting principles and US GAAPis to reduce net profit by a326 million, an 18% reduction on the income statement figure ofa1,838 million. End-year shareholders’ equity, however, is much greater – and by a huge margin(a6,358 million – or 88%). As a result, profitability under US GAAP is much lower: 2001 USGAAP ROE is 10.5% against 23.9% using reported numbers. But balance sheet leverage is alsoreduced. The end-2001 debt–equity ratio is 163% under US GAAP against 295% under its ownaccounting policies. (Financial leverage is high because the group financed a major acquisitionin 2000 largely with debt.)
The supplementary information provided by Unilever is helpful because it allows investors tocompare a firm’s profitability – and financial leverage – with that of other firms using US GAAP.Moreover, investors can use the information, in particular the type and size of income adjustments,to estimate the profitability, under US rules, of other firms that do not disclose such data.
The disclosures have also been used to judge the conservatism of accounting practices in various European countries relative to US GAAP. National accounting practices are consideredmore (less) conservative than those under US GAAP if they result in lower (higher) reportedincome. But characterising conservatism in this way can be misleading. National accountingrules may allow a firm to reduce its income when economic times are good, by building up provisions or writing down assets, and raise it when times are bad, by drawing down those pro-visions or revaluing the written-down assets. For example, by releasing provisions, DaimlerBenz, the vehicle manufacturer, was able to report net profit of DM 615 million in 1993 underGerman rules. However, under US GAAP it reported a loss of DM 1,833 million that year.German accounting rules at that time encouraged balance sheet conservatism – understatementof assets, overstatement of liabilities – but because they permitted income smoothing, did notensure income was stated conservatively.
A more satisfactory way of judging the (income) conservatism of a country’s accounting practices is to look at the timeliness of earnings, in particular, how quickly bad news – such as a reduction in asset values – gets reflected in earnings. Researchers have found that there are national differences in earnings timeliness: companies in common-law countries tend torecognise bad news in earnings earlier than do those in code-law countries (see Box 20.1).
l Cash-based accounting numbersInvestors do not always have access to standardised financial data. European firms rarely provideit unless they seek capital outside their domestic markets. What other steps can investors take toovercome intercompany differences in accounting policy?
One suggestion is to use cash flow in place of accrual-based numbers. As we showed inChapter 18, operating cash flow – or a variant such as Ebitda – removes the effects of some or all accrual adjustments from profit. Accrual adjustments normally provide useful information
660 PART 3 • PERSPECTIVES
CFA_C20.qxd 11/7/03 2:17 PM Page 660

CHAPTER 20 • FINANCIAL STATEMENT ANALYSIS: EXTENSIONS 661
Accounting conservatism: international differences in earnings timeliness
BOX20.1
‘Anticipate losses but not gains.’ This is the prudence principle we outlined in Chapter 7. Itencapsulates what we mean by accounting conservatism. A company should recognise lossesas soon as they arise but defer the recognition of gains until they are realised.
There are many examples of conservatism in accounting practice: impairment tests forfixed assets, the LOCOM rule in inventory valuation, the prohibition in many countries oftangible fixed asset revaluations. To better understand the accounting effects of conservatism,consider the case of Divergent Company. It has two depreciable assets, each costing a90,000 atthe date of purchase (year 0) and subject to straight-line depreciation over its 10-year estim-ated life. At the start of year 2, new information leads Divergent to change its life estimates: tosix years in the case of asset A and 12 years in the case of asset B. Under current internationalrules, Divergent must write down asset A – from a72,000 to a60,000 – immediately and recognise an impairment loss. It then increases the depreciation charge from a9,000 to a15,000a year. By contrast, Divergent does not write up asset B. Instead, it amortises the depreciableamount (a72,000) over the asset’s remaining life, thereby recognising a gain (in the form of a lower depreciation charge – a7,200 against the original a9,000 a year) only as the benefits ofthe asset are realised. The diagram below charts the carrying amounts of the two assets overtheir respective lives.
As our Divergent example shows, conservatism means that ‘bad news’ (e.g. an unexpectedreduction in an asset’s economic life) is reflected in earnings more quickly than good news (anunexpected increase in the asset’s life). Moreover, because the good news gain is recognisedonly when realised, the earnings impact of good news lasts longer than that of bad news.
Empirical evidence confirms the differences in timeliness and persistence of good and badnews. Basu used stock market returns as a measure of news. He found that over the 1963–90period, US companies’ earnings were four to six times more sensitive to negative stock marketreturns (bad news) than to positive returns (good news). He also found a stronger associationbetween current earnings and stock market returns than between current cash flow and stockmarket returns when news is bad. Our Divergent example suggests why. The company recordsa loss from the write-down of asset A against year 2 income but current cash flow is notaffected as it’s a non-cash charge.8
Are there international differences in accounting conservatism? Ball, Kothari and Robinargue it’s more prevalent in common-law than in code-law countries. As we saw in earlier
CFA_C20.qxd 11/7/03 2:17 PM Page 661

662 PART 3 • PERSPECTIVES
to an investor and do not impede cross-company comparisons. However, where they are theresult of different accounting methods, earnings are compromised as a performance measure. In these circumstances, ‘cash flow smooths the playing field for companies with differentaccounting methods’.10
Cash flow data can also be used in cross-country comparisons of risk. We describe cash-basedliquidity and leverage ratios in Chapter 18.
l Making corporate accounts more comparable: a caveat
Trying to make corporate accounts more comparable – by using adjusted accrual-based data or focusing on cash flow numbers – may lead investors astray. First, comparability adjustmentsmay reduce the usefulness of accounting numbers. For example, toy-maker Drosselmeyer may be justified in capitalising development costs. The future benefits from his outlays on product development may be more assured and easier to measure than is the case for his com-petitors. The difference in accounting captures the difference in the companies’ economic circumstances.
Second, the accounting regime a company follows is not neutral. It influences people’sbehaviour. For example, German managers make investment decisions in the belief that the outcome of those decisions will be reported in the company’s accounts according to Germanaccounting rules. Faced with a different accounting regime, they may make different investmentdecisions. Investors should be mindful of this when making cross-country comparisons of corporate profitability and risk using adjusted data.11
chapters, ownership is more diffuse – and securities markets more important in corporatefinancing – in common-law countries. Ball et al. claim that accounting conservatism acts as aneffective governance mechanism, allowing investors to monitor management of quoted com-panies more efficiently. If managers have to report corporate losses quickly, they’ll move fasterto stem them. Hence early in the development of corporate accounting, shareholders broughtpressure on companies to adopt conservative practices such as the LOCOM rule. When regulatory bodies such as the SEC were established, they too favoured conservatism, imposingprohibitions on upward valuations of fixed assets and mandating equity accounting or fullconsolidation of subsidiaries. Companies in code-law countries faced, in the past, a differ-ent business and regulatory environment: stock markets were weak, many companies were family- or state-owned, governments set accounting rules. There was less call to use corporateaccounts as a mechanism to police managers. Conservatism – in the income statement formoutlined above – was rare.
Ball et al. tested their hypothesis on quoted companies from seven countries over the1985–95 period. They found that the common-law countries examined (Australia, Canada,UK and USA) showed greater accounting conservatism than the code-law countries (France,Germany, Japan). Corporate earnings in the former were more closely associated with changesin stock market returns and more sensitive to negative than to positive stock returns. However,there was evidence of a change in French and German accounting practice over the 11 years.All countries (save Japan) exhibited greater accounting conservatism in 1991–95 than in1985–90 but the change was most marked in the two European countries.9 Developmentssince 1995 – especially, the growing influence of IAS on the corporate accounts of code-lawcountries – are likely to have further reduced the ‘conservatism gap’.
Box 20.1 continued
CFA_C20.qxd 11/7/03 2:17 PM Page 662

CHAPTER 20 • FINANCIAL STATEMENT ANALYSIS: EXTENSIONS 663
Diversified operations
Investors face a further problem when they want to analyse the financial statements of diversifiedcompanies. Traditional consolidated accounts combine the revenues and expenses, assets andliabilities of all subsidiaries under the control of one company. Investors welcome such accountsbecause they can better understand the company as an economic entity – its size, profitability,liquidity and financial structure. The drawback is that the financial information is too aggregated.The accounts do not reveal how the components of the company have performed. As a result,investors lack vital information to help them assess the likely rewards and risks from their investment.
Thanks to legal, stock exchange and accounting rules, most diversified companies now supplement their consolidated accounts with summary financial information about their lines of business and their operations in various geographical areas. Such disclosures are known collectively as segmental data.
l Benefits of segmental disclosures
Investors use segmental data to better understand a firm’s past performance and to improve theirforecasts of its future profits and cash flow. Investors usually forecast a firm’s earnings in a two-stage process. They first forecast its sales and then apply an estimated profit margin ratio to that figure. When segmental data are available, they follow the same procedure but use the disaggregated numbers. Estimated consolidated profit is then the sum of forecast segmentalprofits (adjusted for any common costs or income). The following example, based on a firm withthree business segments, illustrates the general procedure. All the numbers are assumed.
EstimatedForecast profit margin Forecast
sales ratio profitSegment A 100 × 15% = 15
B 250 × 8% = 20C 150 × 12% = 18
53Less: Expected common costs (net)
(e.g. HQ costs, interest, income tax) −5Forecast total net profit 48
Research indicates that profits forecasted in this way are more accurate than those based on consolidated figures alone.12
Segmental data can also shed light on the risk of a firm’s operations. During the financial crisisin East Asia in 1997/98, investors consulted the segmental reports of international companies todiscover the extent of their exposure to East Asian markets.
Illustration
The 2001 accounts of Benetton, the Italian clothing manufacturer and distributor, illustrate wellthe benefits of segmental disclosures to investors. According to the consolidated accounts, revenues grew by only 4% between 2000 and 2001 and contribution margin (defined by thecompany as gross profit less variable selling costs) did little better. The contribution margin ratio inched up to 37% in 2001.
CFA_C20.qxd 11/7/03 2:17 PM Page 663

664 PART 3 • PERSPECTIVES
Benetton Group 2001 2000 % changeNet revenues (in Am) 2,098 2,018 3.9Contribution margin (in Am) 776 740 4.9Contribution margin ratio 37% 36.7%
However, the consolidated figures conceal a marked difference in the performance of the group’sthree main lines of business. Exhibit 20.4 gives a breakdown of Benetton’s 2001 revenues andcontribution margin by business sector and shows the change in sectoral revenues and contri-bution margin ratio between 2000 and 2001.
The segmental data in Exhibit 20.4 reveal the importance of ‘casual wear’ to the group results.It’s by far the largest segment, responsible for 70% of total gross revenues. It’s also the mostprofitable, with a contribution margin ratio of 40%. Moreover, 2001 was a good year for casualwear: revenues and contribution margin increased by 9.5% and 12%, respectively. Why, then,
Panel A: Breakdown of revenues and contribution margin* by sector for 2001
Panel B: Revenues and contribution margin ratio by sector, 2000–01
2001 2000 % changeRevenues (in B mn)Casual wear 1,632 1,490 +9.5Sport 327 398 –17.8Manufacturing and other 379 351 +8.0Intersector sales –240 –221
Total net revenues 2,098 2,018 +3.9
Contribution margin ratioCasual wear 40.3% 39.4%Sport 25.1 31.0Manufacturing and other 10.1 8.5
Group 37.0 36.7
* Benetton defines ‘contribution margin’ as gross profit less variable selling costs.
Benetton Group: business segment data for 2001Exhibit 20.4
(Source: Benetton Group, Annual Report and Accounts 2001. Reproduced by permission of Benetton Group.)
CFA_C20.qxd 11/7/03 2:17 PM Page 664

was overall group performance so anaemic? The segmental figures provide the answer. The‘sport’ sector – covering sportswear and equipment – suffered declines in both revenues andcontribution margin in 2001 (due largely to a one-third contraction in sales of skates and skate-boards, according to the company). This reverse largely offset the gains achieved in the other two sectors.
As well as explaining Benetton’s past performance, the segmental data help investors improvetheir earnings forecasts and assessment of business risk. For example, casual wear is likely toremain the motor that powers the group’s profits. Diversifying into sportswear and equipmentgives Benetton the opportunity to build sales and profits outside the euro area (the Americas andAsia took 50% of ‘sport’ sales but only 15% of casual wear sales in 2001), but it brings added riskas the group’s experience in the skate and skateboard product lines in 2001 illustrates.13
l IAS disclosure requirements
Large companies, especially those whose securities are quoted and which have internationaloperations, face a plethora of rules and guidelines on segmental reporting. In addition to observing national legal and stock exchange requirements, they must also take account of theguidelines of intergovernmental agencies such as the OECD and United Nations.14 The reasonfor governmental interest in segmental reporting is self-evident. The operations of large com-panies can have a significant impact on a country’s economic and social policies, especially in the areas of employment, competition and foreign trade. Companies themselves are reluctant topublish segmental data voluntarily since rival firms may find the information valuable and useit to their competitive advantage.
In drawing up segmental disclosure requirements, regulators must address the followingissues:
l Which companies should be required to make segmental disclosures?l How should a segment be defined?l What information should be disclosed by segment?
The international standard on segmental reporting gives guidance on these issues. We summariseits main provisions below.15
Companies required to disclose segmental data
Only companies whose securities are publicly traded are required to publish segmental data.Moreover they only need provide it in their consolidated accounts.
Definition of segment
The international standard defines a segment in risk and return terms. The basis of segmentationcan be either line of business (known as a ‘business segment’) or geographical area. The key pointis that the business or geographical segment should be subject to risks and returns different fromthose faced by other segments of that type.
The novel feature of the standard is that it lays down different disclosure requirements forbusiness and geographical segments. A company must first decide what is the ‘dominant sourceand nature’ of its risks and returns. If the dominant source is its lines of business, then the primary segmental report should focus on business segment activities. If it’s the geographicalareas in which it produces or sells its products, then the primary segmental report should focuson geographical segment activities. The less important segment is the subject of a secondaryreport. As we’ll see, the primary report must contain more extensive segmental disclosures thanthe secondary report.
CHAPTER 20 • FINANCIAL STATEMENT ANALYSIS: EXTENSIONS 665
CFA_C20.qxd 11/7/03 2:17 PM Page 665

666 PART 3 • PERSPECTIVES
How does a company decide what is the ‘dominant source and nature’ of its risks and returns?The international standard is clear on this. The answer can be found in the way the company is organised. A company’s internal organisational and management structure and its system ofinternal financial reporting have evolved in response to external competitive pressures. They aretherefore the logical basis for identifying its main risks and returns and for determining its primaryand secondary segments.
Defining segments by reference to a company’s internal organisational structure has advant-ages for investors – and for the companies themselves. Investors get a better understanding ofthe way the firm operates. This should help them when they try to forecast its sales and earnings.Companies benefit because information-gathering costs are low: the segmental information can be taken directly from the internal reporting system. The main disadvantage for investors is that since firms’ internal structures often differ, the segmental data may not be comparableacross firms.
Segmental information to be disclosed What information should a company provide by segment? First, the international standardintroduces a materiality test. A company need only report information for larger segments. A‘reportable segment’ is a business or geographical segment that earns a majority of its revenuesfrom sales to external customers and whose sales or results (i.e. profits or losses) or assets are 10%or more of the respective totals for the group.16 The 10% test limits the number of reportablesegments and thus protects firms from costly and competitively damaging disclosures.Exhibit
The standard lays down different disclosure requirements, depending on whether the report-able segment is a primary or secondary one. These requirements are summarised in Exhibit 20.5.
Primary and secondary l Description of activities of each reported business segment segmental reports and composition of each reported geographical segment.
l Basis of pricing intersegment transfers.
Primary segmental For each segment:report l Revenues,* external and intersegment
l Profit or lossl Assetsl Liabilitiesl Capital expendituresl Operating cash flow (or depreciation and other
non-cash expenses)
plus:Reconciliation of above items to the aggregated information in the main financial statements.
Secondary segmental For each segment:report l Revenues, external only
l Assetsl Capital expenditures
* For geographical segments, revenues by location of market should be provided in addition, if theyare significantly different from revenues by location of production.
Disclosures by reportable segments: summary of main IAS requirementsExhibit 20.5
CFA_C20.qxd 11/7/03 2:17 PM Page 666

CHAPTER 20 • FINANCIAL STATEMENT ANALYSIS: EXTENSIONS 667
As the exhibit shows, the disclosures a company must make in its primary segmental report areextensive and potentially very helpful to investors. For example, with segmental sales, profit andnet asset data, investors can calculate each segment’s return on net operating assets (RONOA)and break it down into its profit margin ratio and assets turnover components. Segment netoperating assets are assumed to equal segment assets less segment liabilities. Usually these compriseoperating assets and liabilities only, since management decide on the firm’s capital structure(and thus the amount of net debt it carries) centrally. Note that estimates of segment RONOAmay be affected by the amount of intersegmental sales and the basis on which they’re priced –hence the importance of these two disclosures to investors.
Segmental capital expenditure figures allow investors to extend their analysis. They show howthe company is allocating its investment outlays across business (and geographical) segments.An obvious question investors ask and the IASB’s primary segmental disclosures help answer is: is the company channelling resources into its most profitable segments? Segmental capitalexpenditure figures are also needed to derive segmental free cash flow (operating cash flow less capex). This tells investors which segments are cash-generators and which cash-consumers.If a company doesn’t disclose segmental OCF separately, it must break down depreciation and other non-cash expenses by segment so that investors can estimate it (i.e. OCF = Profit +Non-cash charges).
Investors prize segmental disclosures and there is continual pressure on large, diversified com-panies to provide additional segmental data. As we’ll see in the next section, those applying IASnow break down interim sales and profit figures by segment. Investors also want more detailedincome statement data by segment. Some companies oblige. Benetton, for example, providesgross profit as well as contribution margin figures by business sector. (The company considersfixed selling expenses (e.g. advertising) and general and administrative expenses to be commoncosts and not assignable directly to lines of business.) There are calls on firms to release moregeneral business data by segment. Ericsson’s segmental report illustrates the kind of informa-tion investors are pressing for. The Swedish telecoms equipment producer publishes ordersreceived from customers by segment – and by quarter. The major constraint on a firm supplyingadditional segmental data voluntarily is the fear that competitors will use the disclosures to itsdisadvantage.
Interim reporting
In analysing Carlsberg’s financial results and condition in Chapter 19, we used the company’sannual report as the main information source. From an investor’s standpoint, a weakness ofsuch reports is that the information in them quickly becomes dated. In Carlsberg’s case, thegroup publishes in February annual accounts for the financial year ending in the previousDecember. An investor consulting Carlsberg’s annual accounts in, say, January would learn ofthe financial impact of events that occurred 13–25 months earlier.
In order to satisfy investor demand for timely financial information, quoted companies publish interim reports during the year. An interim report usually comprises a managementreport, condensed consolidated financial statements and explanatory notes for the company andits subsidiaries for the quarter or half-year just ended.
l Benefits of interim reportsInvestors use interim financial data to revise their estimates of an investment’s risk and return.Quarterly income statement numbers are particularly helpful. They give early warning of achange in business conditions and the impact on the firm. In addition, the sales and earnings of
CFA_C20.qxd 11/7/03 2:17 PM Page 667

668 PART 3 • PERSPECTIVES
many firms – from ice-cream producers to gas utilities – display marked seasonal variations. Bycomparing the most recent quarter’s sales and earnings with both the previous quarter’s andthose of the same quarter in the previous year, investors get early warning of a change in thecompany’s fortunes. They can use the information to revise their forecasts of its future sales andearnings – and the sales and earnings of other firms in the same industry.
IllustrationCisco Systems is a US-owned supplier of equipment for the Internet’s infrastructure. No other company better exemplified the information technology boom years of the 1990s. Its sales and earnings grew by more than 30% a year throughout the decade. (Annual sales and earnings figures for the 1998–2002 period are set out in panel A of Exhibit 20.6.) For 43 con-secutive quarters, it met or exceeded analysts’ EPS forecasts. Its market capitalisation soared to over US$580 billion and made it, for a brief period, the most expensive company in the world.
The bursting of the dotcom bubble in 2000 dealt a punishing blow to Cisco’s sales andprofitability. Sales fell 30% between Q2 and Q3 2001. (The company’s sales do not exhibit a seasonal pattern.) Despite a sophisticated information system that enabled the company to close its books in one day, management overestimated demand for the company’s products and had to write off US$2.2 billion of excess inventory in April 2001. The write-off – and the
Panel A: Annual sales and net income/(loss), 1998–2002
Year to end JulyIn US$ mn 1998 1999 2000 2001 2002
Sales 8,489 12,173 18,928 22,293 18,915Net income/(loss) 1,331 2,023 2,668 (1,014) 1,893
Panel B: Quarterly net income/(loss), 2000–02
Quarter I (August–October) 415 798 (268)II (November–January) 816 874 660III (February–April) 641 (2,693) 729IV (May–July) 796 7 772
Cisco Systems: annual and quarterly earnings, 2000–02Exhibit 20.6
(Data source: Company; chart source; author.)
CFA_C20.qxd 11/7/03 2:17 PM Page 668

costs of laying off 18% of the company’s workforce – were responsible for the US$2.7 billion loss reported in Q3 2001. (The company’s financial year ends in July.) The company posted further large one-off charges in Q4 2001 and Q1 2002, resulting in low or negative earnings these quarters. Profit margins did not recover to 1999/2000 levels until Q2 2002. Panel B ofExhibit 20.6 charts the company’s quarterly earnings over the three years from August 1999 to July 2002.
Cisco’s quarterly reports provided investors with timely information about the change in itsfortunes in 2001. Without them, investors would have had to wait until publication of annualdata in August or September that year to learn of the sales collapse and its impact on profits.Note that Cisco’s troubles in 2001 led to a sharp decline in its share price as investors revisedtheir forecasts of future earnings. Its market capitalisation fell two-thirds between February andJuly 2001. With no sign of a resumption of sales growth, the share price continued to decline inthe following financial year.17
l Interim accounts: Integral and discrete approaches
There are two approaches to preparing interim financial statements, the integral and the discreteapproaches. Under the integral approach, the year is considered the pivotal accounting period. The main accounts are the annual accounts and the accounts for each interim period are viewed asa sub-part of them. Interim revenues and expenses are then apportioned annual amounts. Forexample, the bulk of maintenance work on North Sea oil production platforms is performed in the summer months when weather conditions are favourable. Assume Norse Oil Company’sfinancial year runs to 31 December. It incurs maintenance costs of 60 million in the third quarter of the year. Under the integral approach, it estimates the costs and allocates them overthe year, usually on a linear basis.
Q1 Q2 Q3 Q4 TotalMaintenance expense 15 15 15 15 60Maintenance expenditure 60 60
If actual outlays differ from expected, the expense charged in each of the remaining quarters ofthe year is adjusted.
Advocates of the integral approach claim the resulting earnings number is a better guide to company performance in the interim period. It is not distorted by decisions management make concerning the timing of discretionary costs and revenues within the year. In addition, for certain costs such as taxes, the accounting period is the year rather than a sub-part of it.
Under the discrete approach, an interim period is considered a distinct accounting period.Moreover, it carries no less weight than the year in accounting terms. The company applies thesame principles in its interim accounts as it uses in its annual accounts. Consider again NorseOil’s platform maintenance costs. If in the annual accounts the company expenses these costs asthey are incurred, it accounts for them in a similar way in the interim accounts.
Q1 Q2 Q3 Q4 TotalMaintenance expense – – 60 – 60
Allocating repair costs across quarters within the year – the integral approach – is avoided.Advocates of the discrete approach argue that interim figures prepared on this basis are more
transparent and reliable. Managers are not called upon to estimate total revenues and costs inthe year before calculating interim figures. As a result, they have less opportunity to manipulateinterim profits.
CHAPTER 20 • FINANCIAL STATEMENT ANALYSIS: EXTENSIONS 669
CFA_C20.qxd 11/7/03 2:17 PM Page 669

670 PART 3 • PERSPECTIVES
l Interim financial reporting in practiceDisclosure requirementsInterim reporting in the EU is heavily influenced by a 1982 directive on the subject.18 Firmswhose shares are listed on an EU stock exchange are required, by the directive, to issue a half-yearly report covering the first six months of each financial year. The report must be publishedwithin four months of the end of the half-year to which it refers. It must contain at a minimumthe following information:
l net operating revenues;l profit before and after tax;l interim dividend, if paid or proposed; l explanatory statement; andl auditors’ report, if the accounting information is audited.
Comparative figures should be shown for the corresponding six-month period in the pre-ceding financial year. The explanatory statement should provide information to help investorsassess the trend in the firm’s sales and earnings and highlight any special factors that haveinfluenced those figures in the half-year.
The USA and Canada impose more onerous requirements. For example, the US’s SEC requireslisted US companies to file quarterly reports – containing financial statements (with supportingnotes) and management discussion of them – within 45 days of the end of each quarter. Thefiling deadline will be cut to 35 days by 2004.
North American practice is now finding an echo in other countries. Starting in 2003, listedcompanies in Malaysia and Singapore must publish quarterly reports. Japan’s Financial ServicesAgency is considering introducing a similar requirement for listed Japanese companies from2005. As part of its moves to improve corporate financial disclosure, the European Commissionproposes that EU-listed companies file quarterly reports (with a 60-day filing deadline) startingin 2005. The Commission believes this will encourage international investment in Europeancompanies. Note that reporting more frequently than half-yearly is not a totally new idea inEurope. Some national stock exchanges already mandate quarterly or four-monthly reporting:in some cases (Norway, Spain), the ruling applies to all listed companies; in others, only a sub-group is affected (Germany’s DAX-30 ‘blue chip’ companies). Moreover, many large Europeanmultinationals disclose quarterly sales and earnings data on a voluntary basis.
Interim financial statements are usually unaudited, although the SEC requires those of USfirms to be reviewed by external auditors.
Preparation of interim financial reportsThe IASB issued an accounting standard on the preparation of interim financial reports in 1998.The standard is not mandatory. It’s for the benefit of those companies which are required bystock exchange or other regulations to publish interim reports and which follow IAS in theirannual accounts.19
The standard addresses two issues: what should an interim report contain and what account-ing policies should a company follow when preparing it. As regards the first issue, the IASB viewsthe interim report as a shortened version of the annual one. Thus the report should contain in condensed form a full set of statements (balance sheet, income statement, cash flow state-ment, statement of changes in shareholders’ equity) and selected explanatory notes. It shouldshed light on year-to-date as well as the current period’s figures. For example, the third quarterreport would show income numbers for the first nine months of the year and the latest threemonths – and comparable figures in the previous financial year. Cash flow numbers would alsobe for the first nine months. In this way, the investor can see how the company’s earnings and
CFA_C20.qxd 11/7/03 2:17 PM Page 670

cash flows are developing over the year as well as learn about its trading performance in the most recent interim period.
The explanatory notes are intended to help investors interpret the interim figures. Thus thecompany should disclose in each interim report:
l segmental revenues and profit or loss (for business or geographical segments, whichever is theprimary basis of segmental reporting);
l the effect of changes in the composition of the company (e.g. major acquisitions and disposals);l important financing events (e.g. issue of shares, repayment of loans, dividend payments); andl unusual items, such as restructuring charges and investment gains or losses.
The notes should also explain how the interim results are affected by seasonal or cyclical factors.As for the second issue, the standard shows subtlety. At first sight, it appears to favour the dis-
crete approach. ‘An enterprise should apply the same accounting policies in interim financialstatements as are applied in its annual financial statements. . . .’ For example, if at the time ofexpenditure a cost fails an asset recognition test (for example, because of uncertainty of futurebenefits), the company should not defer the expense to a later interim period even if it believesthat the uncertainty may be reduced by then. Nor should it accrue an expense unless it has a legalor constructive obligation to an outside party. Thus Norse Oil should not accrue in the first twoquarters the costs of platform maintenance work scheduled for the third quarter.
However, the standard acknowledges the primacy of annual financial statements in the measurement of assets and liabilities. Companies should measure balance sheet items on a year-to-date basis. In this way, changes in estimates during the year are incorporated in the values ofassets and liabilities.
Calculating interim income tax expense provides a good illustration of this approach. Taxauthorities assess firms’ profits to corporate income tax on an annual basis. Thus, under IAS, acompany should accrue income tax expense in an interim period, using its estimated annualeffective tax rate. This estimated tax rate should be updated each interim period to allow for pro-gressivity in tax rates (e.g. in many countries low corporate income bears a lower tax rate) andevents in the period which raise or lower the effective tax rate (e.g. new permanent differences,new tax credits).
For example, suppose Norse Oil estimates at the end of the second quarter that its annualeffective tax rate will be 30%. Pre-tax profit in the first six months is 120 (million). By the endof third quarter, when year-to-date pre-tax profit rises to 150 (after deducting maintenance costs of 60), management revise the annual effective tax rate upwards to 32%. Norse Oil’s thirdquarter interim report shows the following profit and tax expense numbers:
Three months Nine monthsto 30 September to 30 September
Profit before tax 30 150Income tax expense –12 –48Net profit 18 102
The tax charge of 12 in the third quarter is the difference between the total tax expense for thefirst nine months (32% × 150 or 48) and that for the first six months (30% × 120 or 36).
l Future developments
Interim reports are likely to grow in importance in the future. Adoption of IAS by listed com-panies will result in more detailed reports – currently many firms do not provide interim cash flowor segmental data – and greater consistency in the preparation of interim financial statements.
CHAPTER 20 • FINANCIAL STATEMENT ANALYSIS: EXTENSIONS 671
CFA_C20.qxd 11/7/03 2:17 PM Page 671

672 PART 3 • PERSPECTIVES
SECTION
2
Moreover, quarterly reporting will become more common, as a result of changes in stock exchangelisting requirements and pressure from international, especially North American, investors.
There is unease in some quarters about requiring all listed firms to publish quarterly data,however. Having to produce interim reports quarterly rather than half-yearly imposes an addi-tional regulatory burden on a company. And many wonder whether managers will becomeoverly concerned about the short-term effect of their decisions – that is, the effect on the company’s results next quarter – and reject profitable investments with longer-term payoffs.Nevertheless, the trend towards more frequent (and timely) reporting appears unstoppable.Already many retailing companies and airlines release monthly sales or revenue figures withindays of the month-end.
Accounting manipulation and its detection
From an investment standpoint, accrual accounting has much to commend it. Investors findprofit and its revenue and expense components helpful for assessing a firm’s financial per-formance and valuing it. Likewise, the balance sheet provides useful information about the firm’s resources and obligations. But what gives accrual-based numbers their strength – theopportunity for a firm’s managers to convey, through accounting methods and estimates, infor-mation about its future – can also be a source of weakness. The inherent flexibility of accrualaccounting allows managers to manipulate reported numbers. They can take accounting as well as business decisions that result in the company appearing more (or less) profitable thanotherwise.
Accounting manipulation takes many different forms. In some cases, it’s simple ‘window-dressing’ – for example, delaying payment of suppliers at year-end to improve balance sheet liq-uidity ratios. More usually, earnings are involved – hence the other widely used phrase, ‘earningsmanagement’. Managers alter the timing of revenue or expense recognition to improve currentor future years’ profits. Although the activity is not necessarily illegal – the manipulation maynot violate accounting rules and it can be hard to prove that managers’ intent was to misleadinvestors – it is unethical. Moreover, it imposes costs on both investors and society at large.Resources are misallocated and, when the manipulation is exposed, firms’ capital costs rise asinvestors seek higher returns to compensate them for the extra risk. The late 90s dotcom andtelecoms bubbles and their aftermath illustrate this well.
l Reasons for accounting manipulationWhy do managers manipulate accounting numbers? The reasons are many and varied. Four keyones concern taxes, capital-raising, debt contracts and management compensation.
1 To reduce the tax and regulatory burden. Taxes – and government-imposed regulations in gen-eral – are costs which firms seek to reduce. Subsidies and other reliefs (e.g. trade protectionmeasures) are benefits which they seek to increase. In both cases, firms have an incentive toreduce reported profits (or increase reported losses).
2 To raise capital more cheaply. Firms that are perceived to have low operating and financial riskcan raise debt and equity capital on favourable terms. Managers take actions to lower the per-ceived riskiness of the firm – either by reducing its reported leverage or by dampening thevariability of its reported profits.
3 To avoid violation of debt contracts. To protect the interests of creditors, a debt contract usu-ally imposes operating and financial restrictions on the debtor company. Financial restric-
CFA_C20.qxd 11/7/03 2:17 PM Page 672

tions are often expressed in terms of accounting numbers. Examples are minimum interestcover and maximum debt–equity ratios. If the debtor company fails to observe these limits, itmay be forced to renegotiate the terms of the contract – probably to its disadvantage – or evento repay the debt before maturity. It has an incentive, therefore, to manage key accountingnumbers (profit, interest expense, debt, equity) in order not to violate the debt contract.20
4 To increase managers’ wealth. Managers’ compensation may be linked directly to their firm’sprofitability. For example, they may receive bonuses linked to its reported profits. This does not mean that managers always have an incentive to bolster short-term profits. Forexample, the bonus plan may state that managers will receive no bonus if profits are below a stated minimum level. Should actual profits be below this, managers may be encouraged tolower them still further – by, in effect, charging future costs in the current period – in orderto make it easier to earn a bonus in the future. A new management team may use similar ‘big bath’ tactics at the time of their appointment – to increase future profits during theirtenure and so enhance their reputation and value as managers.
These are not the only reasons for manipulating accounting numbers. Managers resort to‘creative accounting’ in other circumstances – for example, during takeover battles and in majorwage negotiations with trades unions. In all these cases, managers are seeking to increase theirown wealth and/or that of existing shareholders. If they succeed, they do so at the expense ofgovernments, creditors, employees and prospective investors.
l Methods of accounting manipulationHow a firm manipulates its accounting numbers depends on its goals. Exhibit 20.7 identifiesthree: to raise (or lower) short-term profits, to reduce earnings variability and to strengthen thebalance sheet. The exhibit gives examples of the ways a firm can achieve these goals through creative accounting.
Many of the accounting devices listed – e.g. front-loading of revenues, deferring costs, smoothingprofits through provisions, using off-balance-sheet financing techniques – have been described andillustrated in earlier chapters. Note that some have primary cash flow effects (even before takingaccount of any secondary tax impact). For example, bringing forward sales through limited-periodincentives increases short-term profits and operating cash flow. Building up finished goods invent-ory can increase short-term profits (by capitalising in inventory more of the current period’sproduction overhead) but may involve higher current outlays (e.g. additional storage costs).
The methods listed in Exhibit 20.7 assume a relatively stable corporate structure. However,additional opportunities for accounting manipulation arise when a company actively acquires anddisposes of businesses. For example, an acquired business’s operating assets such as inventoriesand plant and equipment may be written down and additional provisions booked in its accountsbefore consolidation takes place. By understating the net operating assets of an acquired business,the acquirer can flatter group results – via lower cost of sales, depreciation and other expenses – in the financial period following the acquisition.
l Safeguards against accounting manipulationGiven the incentives to manipulate accounting numbers – and the number of ways to do it – why isn’t the activity more widespread? An important reason is that managers’ ability to manageaccounting numbers is constrained, partly by institutional factors and partly by investor vigilance.(Of course, managers may reject it on ethical grounds.)
What are these institutional factors? One, obviously, is the set of accounting and reportingrules which a company must follow. These have become tougher in recent years. Consider, forexample, the new international standards on provisions and intang-ible assets. The first limits when
CHAPTER 20 • FINANCIAL STATEMENT ANALYSIS: EXTENSIONS 673
CFA_C20.qxd 11/7/03 2:17 PM Page 673

674 PART 3 • PERSPECTIVES
a restructuring provision can be established and the second lays down strict recognition criteria.It is now harder for managers to smooth earnings through provisions and increase short-termprofits by capitalising costs.
Another institutional factor is the external audit. An audit firm has an incentive to challengethose accounting practices of a client company it considers questionable. Its reputation may be damaged – and its partners’ wealth reduced – if the courts later find the company and itsadvisers guilty of false accounting. (The partners of Arthur Andersen, one of the world’s largestaudit firms, forgot this lesson in the 1990s and, in the aftermath of the Enron accounting scandal,the firm disintegrated in 2001.) Should the audit firm fail to persuade the client’s managementto abandon such practices, it may qualify its audit opinion or resign the audit. Either action is a‘red flag’ for investors.
Investigation of the annual accounts by independent auditors is an example of the way shareholders monitor – and ultimately control – management’s actions. There are many othercorporate governance mechanisms available to shareholders – from appointment of independent,non-executive directors to shareholder approval of top executive pay schemes. The more effectivethey are, the fewer are the opportunities for management to manipulate accounting numbers(see Box 20.2).
Corporate goal Method
Raise short-term profits* Bring forward revenues through:l accounting decisions
(e.g. lessor structures leases as sales-type leases)l ‘real’ decisions
(e.g. limited-period sales incentives to customers)
Delay or cut expense through:l accounting decisions
(e.g. extend depreciable lives of fixed assets)l ‘real’ decisions
(e.g. build up finished goods inventories, cut expenditures on R&D, plant maintenance and employee training)
Reduce profit variability l active use of provisions and allowances (e.g. for bad debts)l exceptional gains/losses (e.g. from asset disposals) to
offset variable operating profits
Strengthen balance sheet Bolster assets and equity through:l revaluation of fixed assetsl disposal of fixed assets with large unrealised holding gains
Keep debt off balance sheet through:l use of operating leasesl financing via equity-accounted and unconsolidated affiliatesl quasi-equity (e.g. preference share capital)
* Lowering short-term profits involves accounting or ‘real’ decisions which have the oppositeeffect (i.e. delaying revenues and bringing forward expenses).
Methods of accounting manipulation (in separate reporting environment)Exhibit 20.7
CFA_C20.qxd 11/7/03 2:17 PM Page 674

CHAPTER 20 • FINANCIAL STATEMENT ANALYSIS: EXTENSIONS 675
Corporate governance and financial reportingBOX20.2
In earlier chapters we characterised suppliers of capital as either ‘insiders’ or ‘outsiders’. Insidersare managers and shareholders with a controlling interest in the firm. Outsiders are minorityshareholders and creditors. When outsiders put capital into a business, they run the risk thatthe return on their investment will be less than they expected because insiders misuse it.
Capital gets misused in various ways. Insiders may steal it – directly or indirectly, by, say,selling corporate assets at below market price to another company they control. They mayexpropriate it by installing family members in managerial positions, awarding themselvesexcessive compensation or ‘empire-building’ (e.g. pursuing size rather than profitabilty goals).Outsiders try to protect themselves against such misuse of their capital. The mechanisms theyuse constitute the governance of a company.
Many factors contribute to effective corporate governance. The most important are the legalrights of shareholders and creditors and the system of enforcing them. We’ve seen examples of such rights in earlier chapters. For example, shareholders have the right to appoint direc-tors, to sue them for misappropriating company funds and to vote in general meeting onmajor investment and financing decisions. Secured creditors can seize a debtor company’sassets when it defaults on its debts.21
Accounting also plays a key role in good corporate governance. As we saw in Chapter 6, thelaw requires companies – all in the EU, only quoted ones in the USA – to publish financialstatements periodically. The way the statements are prepared is also regulated, either by a govern-ment agency or by a private one supported by government. The accounting rules the agencylays down limit insiders’ ability to manipulate financial information and thus make it easierfor outsiders to monitor insiders’ actions. Other corporate governance mechanisms reinforceaccounting’s role. Annual audits by external auditors – mandatory in all countries – and inde-pendent boards of directors serve to reduce the incidence of accounting manipulation.22
In the 1990s the prevailing wisdom was that countries with a common-law tradition – oftenreferred to as ‘Anglo-Saxon’ countries – had more effective corporate governance than those incode-law countries. Investor rights were held to be stronger and better enforced in common-law countries. There was also less incidence of accounting manipulation, it was argued:accounting rules reflected conservatism in income measurement (see Box 20.1) and financialdisclosures were more extensive.
The accounting scandals in the USA in the early 2000s led commentators to question thesuperiority of the Anglo-Saxon model. The US Congress and governments in other common-law countries also had doubts. They imposed new burdens on company executives and toughened audit regulation. For example, the US Sarbanes-Oxley corporate reform act of 2002requires that the CEOs and chief financial officers of all US quoted companies certify theirfirms’ financial statements. They face prison terms and heavy fines if they put their signaturesto false reports. The act creates a new audit regulator, the Public Company AccountingOversight Board. It will establish auditing standards and inspect at least triennially all auditfirms, US and non-US, auditing companies listed on a US stock exchange.
However, empirical evidence indicates that many countries have a worse record of account-ing manipulation than the USA. Leuz, Nanda and Wysocki studied the accounts of over 8,000companies in 31 countries in the 1990–99 period. They found that earnings management wasless evident in countries with large stock markets, diffuse corporate ownership, extensiveinvestor rights and strong enforcement of them. Such countries are labelled ‘outsider-oriented’ by Leuz et al. They include – but are not limited to – richer common-law countrieslike the USA.23
CFA_C20.qxd 11/7/03 2:17 PM Page 675

676 PART 3 • PERSPECTIVES
Investor vigilance also deters managers from manipulating accounting numbers. Analysts andother financial experts scrutinise company accounts and draw attention to signs of ‘low-quality’accounting practice.24 The techniques they use are varied but usually include the following.
Monitoring of key operating numbers and ratiosSales, operating margin, receivables turnover and inventory turnover are all studied carefully.Analysts are looking for signs of operating weakness (faltering cost control, slower receivablescollection, inventory build-up) as well as accounting subterfuge (bringing forward sales, post-poning costs).
Analysts also look at the relationship between operating and net profit. To what extent is the‘bottom line’ inflated by non-operating income and non-recurring gains?
Cash flow checkOperating cash flow and profit are compared. As we saw in Chapter 18, a combination of risingprofits and falling OCF acts as red flag (except, possibly, in the case of a rapidly growing firminvesting heavily in working capital). It prompts analysts to investigate the company’s account-ing policies for signs of front-loading of income and deferral of costs.
The tax expense figure provides a further cash flow check. Analysts are wary of firms thatboast a low current tax ratio (current tax expense/before-tax profit). Most countries’ tax codesreveal a conservative bias: revenues are usually not taxed until cash is received; expenses are tax-deductible only when paid. Should a firm report a low current tax rate, this means its taxableprofits are much less than its accounting profits. This may indicate skilful tax planning by thefirm. However, it may also be evidence that the firm is using aggressive accounting methods(early recognition of revenue or late recognition of expenses) and that some of its accountingprofits are illusory.
Examining the notes to the accountsThe notes to the accounts can be a mine of information. Analysts focus on the following:
l The summary of accounting policies. Analysts are on the look-out for unusual policies. Whendoes the company recognise revenue? How does it account for inventory and depreciablefixed assets? Are the company’s policies similar to those of other firms in the industry?
l Financial investments. There is scope here for concealing debt. For example, does the com-pany have major equity-accounted investments in associates, incorporated joint ventures andunconsolidated subsidiaries? What is the financial leverage of these investee companies?
l Commitments. This note may also reveal evidence of debt concealment. For example, what arethe minimum payments the company is committed to make under operating leases over thenext five years? Are these commitments increasing relative to on-balance-sheet debt?
The above examples assume that analysts are searching for overstatement of profit and assetsand understatement of liabilities. In countries where a uniform reporting tradition prevails, they may be concerned about possible understatement of net assets – through undervaluation offixed assets and overprovisioning – which also makes profit an unreliable measure of corporateperformance.
l Accounting manipulation: an illustrationAccounting rules, external audits, independent directors and investor vigilance serve to limitaccounting manipulation but they don’t eliminate it. Sometimes warning signs are overlooked.MyTravel Group is a UK-based provider of all-inclusive holidays and other leisure travel services.It expanded abroad in the 1990s, and by 2001 owned travel companies in northern Europe and the USA. Revenues more than doubled between 1997 and 2001, exceeding £5 billion in the
CFA_C20.qxd 11/7/03 2:17 PM Page 676

CHAPTER 20 • FINANCIAL STATEMENT ANALYSIS: EXTENSIONS 677
latter year. During 2002, the group suffered setbacks. It issued its first profits warning in March,citing the effects on the travel industry of the September 2001 terrorist attacks in New York. The second came at the end of September; a week later, the chief executive quit. October was an eventful month. The group issued a third profits warning after new auditors insisted that itchange its accounting policies, the final dividend was scrapped and UK regulators began a reviewof the group’s accounts. Meanwhile, the share price had plummeted – from 250p in January to17p by the end of October. In late November, the group published preliminary results for theyear to 30 September 2002. These showed a loss of £73 million and a restated profit (before tax)of only £62 million for the previous year, a quarter down on the original figure. Panel A ofExhibit 20.8 summarises the 2002 and restated 2001 figures.
MyTravel’s travails in 2002 shouldn’t have come as a total surprise to investors. The group’saccounts for 2001 and its governance structure contained red flags. We summarise them below.(Key numbers are given in panel B of Exhibit 20.8.)
Panel A: Summary 2002 and restated 2001 results
Year to 30 September2002 2001
In £mn Restated As reported
Turnover 4,379.2 5,050.8 5,061.4
Operating profit/(loss) before exceptionals and goodwill (20.4) 113.2 132.2
Finance income (charge) 8.5 (2.4) (2.4)Profit/(loss) before exceptionals and goodwill (11.9) 110.8 129.8
Net exceptionals (28.4) (16.7) (16.7)Goodwill amortisation (32.5) (31.8) (31.8)
Profit/(loss) on ordinary activities before tax (72.8) 62.3 81.3
Panel B: Warning signs of declining earnings quality in 2001 accounts
Year to 30 SeptemberIn £mn, except ratios 2001 2000 1999 1998 1997
(1) Low and declining profit margins
Group turnover 5,061 3,949 3,309 2,753 2,236
Profit margin ratios (in %)Profit before tax, exceptionals and goodwill 2.56 1.94 3.97 4.56 5.24Exceptionals and goodwill amortisation (0.96) 3.41 (0.17) – –Profit before tax 1.6 5.35 3.8 4.56 5.24
(2) Deteriorating liquidity
Operating profit before joint ventures and exceptionals 71.9 51.0 89.7 102.8 98.9
Accruals (82.4) 82.9 9.5 (4.4) 57.0Operating cash flow before tax (10.5) 133.9 99.2 98.4 155.9
Net funds/(debt), end-year (20.0) 158.9 104.2 266.0 313.9
MyTravel Group: 2001 accounting ‘red flags’ and earnings restatementExhibit 20.8
(Sources : MyTravel Group plc, Annual Report and Accounts 2001, reproduced by permission of MyTravel Group plc;author’s calculations.)
CFA_C20.qxd 11/7/03 2:17 PM Page 677

l Low and declining profit margins. The group’s before-tax profit margin ratio, already low in 1997 (5.2%), declined year-on-year to 2000 and only recovered slightly in 2001. At 2.6%,the 2001 ratio was only half the 1997 figure. Moreover, these ratios are calculated beforeexceptional items and goodwill amortisation. Exceptional items had a significant impact onthe group’s bottom line in both 2000 and 2001. For example, without the £236 million gainon disposal of a joint venture in 2000, the company would have reported a loss that year.
l Deteriorating liquidity. Like profits, operating cash flows did not grow with revenues. Between1998 and 2000 they hovered around £100 million, not enough to cover capital expendituresin these years. Ominously, OCF turned negative in 2001. Management attributed this to the closing down of the group’s Belgian and French operations: the costs were provided for in 2000 and the cash disbursed in 2001. However, the operating profit figures indicate that the group’s underlying cash flow generation was weak in both years.
Weak cash flow led to greater reliance on debt financing. The group’s financial year-endoccurs in September – after the end of the summer holiday season in Europe and NorthAmerica – when its cash position should be strong. However, the net cash balance halvedbetween 1997 and 2000 and it reported net debt for the first time on its 2001 balance sheet.
l Non-transparent accounting policies. Firms like MyTravel that provide services have scope forfront-loading income by taking an aggressive view of when services have been performed.Investors in such firms look for a clear statement of revenue recognition policies. The state-ment in MyTravel’s 2001 accounts doesn’t provide it:
Revenues and expenses relating to inclusive tours are taken to the Profit and Loss Account on holi-day departure. Other revenues and associated expenses are taken to the Profit and Loss Account asearned. Certain expenses such as the cost of non-revenue earning flights, brochure and promotionalcosts are charged to the Profit and Loss Account over the season to which they relate.
What are ‘other revenues and associated expenses’? When is the earnings process completedfor these items?
The tax figures also raise doubts about the group’s accounting policies. According to management, the tax rate (excluding exceptional items) was only 23% in 2001, well below the UK’s statutory rate of 30% that year. The actual tax payments in 2000 and 2001 were only £8.9 million and £1.3 million, respectively; very low considering the company’s pre-taxprofits were £211.4 million and £81.3 million in those years.
l Weak governance. Although the positions of chairman and chief executive were split, thechairman of the company, David Crossland, was its founder and retained an executive role. Only three of the group’s ten directors in 2001 were outsiders. Of the seven executivedirectors, one, the group finance director, was a former partner of Arthur Andersen, thegroup’s auditors (before 2002), and worked on acquisition transactions for the group while at Andersen.
Poor business decisions were largely responsible for MyTravel’s declining profits and cashflows. The group failed to integrate the businesses it purchased in the late 1990s – its newlyacquired German business made heavy losses in 2000 and 2001 – and did not respond quicklyenough to the slowdown in holiday travel following the September 2001 terrorist attacks in NewYork. However, the restatement of the 2001 results and part of the 2002 loss are attributable toaccounting changes. For example, the new auditors, Deloitte & Touche, insisted that premiumincome on holiday insurance policies should be booked when the customer begins the holidayrather than when the policy is sold. The group was forced to abandon the aggressive accountingpolicies that the previous auditors had condoned.
It’s easy to overlook warning signs. Successful companies present a special challenge. When afirm with a history of sales and profit growth encounters problems, there are always reassuringvoices telling investors that the setback is temporary. Experience should put them on their guard.
678 PART 3 • PERSPECTIVES
CFA_C20.qxd 11/7/03 2:17 PM Page 678

CHAPTER 20 • FINANCIAL STATEMENT ANALYSIS: EXTENSIONS 679
In such companies, growth can become an imperative. If managers cannot find natural ways ofincreasing profits, they may turn to artificial ones.
l Accounting qualitySome financial commentators refer to the ‘quality’ of a company’s accounts. Investors assessquality in terms of the transparency of the numbers in the financial report, the robustness of theaccounting policies underlying them and the predictability of earnings. Transparency flows fromclear presentation and full disclosure, robustness from unbiased policies which avoid over- orunderstatement of profitability and leverage, earnings predictability from the absence of incomesmoothing devices. Clearly, accounting quality and manipulation are linked. Accounts that arejudged to be of high quality are likely to contain little or no evidence of manipulation.
Unfortunately, accounting quality is often misconstrued as accounting conservatism. Considerthe case of a mail-order company. Currently it expenses immediately all costs incurred in acquiringnew customers. It wishes to change its policy and, in future, capitalise (and amortise) such costs.Management believes capitalisation better reflects the economics of its business since, based onpast experience, the company retains customers on average for at least three years.
The problem is how to convince the investment community of the merits of the proposed policy.Analysts view capitalisation as a ‘low-quality’ practice, a device to defer costs in order to improveshort-term profits. The share price may suffer if it’s adopted. The company could try to reinforceits message but any additional steps it takes might prove costly. For example, disclosing moreinformation about customers and retention rates could benefit competitors. It may be that thecompany must use means other than accounting policy – for example, signalling financial strengththrough substituting debt for equity – to communicate the economics of its business to investors.25
Summary
Investors face difficulties analysing a company’s financial statements. The statements may not be comparable with those of past periods or competitors. They are aggregated and thus shed little light on the performance of diversified firms. Finally, the information annual accounts contain quickly becomes dated.
Accounting rule-makers (and stock exchanges) have tried to remedy these problems. A firmfollowing international accounting standards must disclose:
l the sales and profits of any business it’s discontinuing – and the gain or loss when the businessis sold;
l the effect on its accounts from changing its accounting policies – if past periods’ accountsaren’t restated, then pro forma accounts based on the new policy should be provided;
and, if it’s diversified:
l sales, assets and capital expenditures by business and geographical segment. Additional information – in particular, profit and operating cash flow – should be given for whichever of the two bases of segmentation, line of business or geographical area, is the main source of the firm’s risks and returns.
Only publicly quoted firms are required to disclose segmental data. These are also the firmsthat are affected by stock exchange rules on ‘alternative GAAP’ disclosures and interim reports.Adjusting key accounting numbers to US or international GAAP helps investors compare com-panies in different countries. Interim accounts – styled, under international rules, on annualones – provide more timely information.
CFA_C20.qxd 11/7/03 2:17 PM Page 679

680 PART 3 • PERSPECTIVES
APPENDIX
20.1
Accrual accounting is inherently flexible. It allows managers to convey, through accruals,future-oriented information about the firm. However, accrual-based numbers are manipulable.Firms manipulate their accounts for one or more of the following reasons: to reduce tax and regulatory costs, to make capital-raising easier, to avoid violating debt and other contracts and/or to increase managers’ wealth. To achieve these ends, they lower (or raise) short-term profit,reduce its variability and strengthen the balance sheet.
Accounting rules and other corporate governance mechanisms such as the external audit limit firms’ accounting creativity but the most effective safeguard against manipulation is investorvigilance. The forensic techniques investors employ – monitoring operating ratios, checkingprofit against cash flow, analysing the notes to the accounts – require basic accounting skills.
Happily, these are skills you should now have. You’ve acquired them – at times painfully –while studying this book. May they serve you well.
Earnings per share
Investors use EPS as a measure of corporate performance, in its own right and in combinationwith other market and accounting data (e.g. price–earnings ratio, dividend payout ratio). Thereare different ways of calculating EPS. This means that even when firms follow the same account-ing policies, their EPS numbers may not be comparable.
To overcome this problem, international standards now lay down rules on how firms shouldcalculate EPS.26 The rules which we describe and illustrate in this appendix apply only to firmswhose shares are – or will shortly be – publicly quoted: other firms are encouraged but notrequired to disclose EPS.
l Basic EPS: calculationEPS in its basic form is calculated as follows:
Basic EPS ==
EPS represents earnings per ordinary share. To calculate the numerator, the firm must deductdividends declared to preference shareholders in the period. (If the preference shares are cumulat-ive and the dividend is in arrears, then the dividend that should have been declared in the periodis deducted.) In the case of a group, the ordinary shareholders are those of the parent company:
Group net profit (after extraordinary items) xx– Minority interests’ share of profit –xx
Net profit attributable to parent company’s shareholders xx– Dividend to preference shareholders –xx
Net profit attributable to parent company’s ordinary shareholders xx
Note that the net profit figure is after extraordinary items.The calculation of the EPS denominator is more complicated. The ratio relates earnings for
a period to the average number of ordinary shares outstanding in that time. The average should be weighted to take account of when during the period shares are issued or repurchased. (Ownshares held by the company are considered issued but not outstanding and therefore should be excluded from the denominator.) For example, suppose a company with 1 million shares
Net profit (or loss) in period attributable to ordinary shareholders
Weighted average ordinary shares outstanding in period
CFA_C20.qxd 11/7/03 2:17 PM Page 680

outstanding at 1 January year 6 issues for cash 200,000 shares on 1 October that year. Theweighted average shares outstanding in year 6 will be:
Fraction Shares EquivalentPeriod of year outstanding number of shares1 Jan–30 Sept 9/12 1 million 750,0001 Oct–31 Dec 3/12 1.2 million 300,000
1,050,000
If a company declares a share dividend (bonus issue) or splits its shares, the denominator isadjusted from the start of the year. Figures for prior years are also restated in order to ensurecomparability of EPS numbers over time. For example, suppose our company declares a 1 : 1share split in June year 7. Shares outstanding increase from 1.2 to 2.4 million. There are no otherchanges to share capital in year 7. The weighted average shares reported in the company’s year 7accounts will be:
Year 7 Year 6Ordinary sharesoutstanding (in million) 2.4 2.1
(2 × 1.05 million)
Reported EPS for year 6 (and prior years) in the year 7 accounts will be half the reported amountshown in the year 6 accounts.27
The denominator also includes the fully paid-up equivalent of partly paid shares. For ex-ample, if 200,000 partly paid shares are 75% paid-up, 150,000 are included in the weighted average share calculation.
l Diluted EPS
Our EPS tale has another twist to it. A company disclosing basic EPS may have to disclose a second EPS figure, diluted EPS, if it has ‘potential ordinary shares’ in its capital structure. Potentialordinary shares (POS) are ordinary shares that may be issued in the future as a result of :
l the conversion of bonds or preference shares;l the exercise of warrants and employee share options; andl the fulfilment of a contractual condition (e.g. achievement by acquired firm of profit targets agreed
with acquirer).
Diluted EPS is calculated as follows:
Diluted EPS ==
A company must disclose diluted EPS as well as basic EPS if its POS are dilutive. For profitablecompanies, diluted EPS will always be less than basic EPS.
Why are investors interested in diluted EPS? Remember that investors use EPS for forecast-ing and valuation purposes. They want an EPS number that captures the effect of expectedchanges in a company’s capital structure. In the 1960s, EPS was based on actual ordinary sharesoutstanding. Conglomerates and other acquisition-hungry companies in the USA found that
Net profit/loss attributable toordinary shareholders
/ Effect of POS onnet profit/loss
Weighted average ordinary shares and potentialordinary shares (POS) in period
++ −−
CHAPTER 20 • FINANCIAL STATEMENT ANALYSIS: EXTENSIONS 681
CFA_C20.qxd 11/7/03 2:17 PM Page 681

reported EPS could be boosted by financing acquisitions with convertible securities and bondsissued with warrants. In this way, income increased thanks to the earnings of the acquired com-pany and the low reported cost of the debt used to buy it while outstanding shares, the EPSdenominator, remained unchanged. Higher EPS, managers believed, increased the company’sshare price and made future acquisitions cheaper. US accounting regulators brought in ruleswhich forced companies to disclose the effect of potential ordinary shares on EPS. Internationalregulators followed suit.
Diluted EPS is a hypothetical number. A company estimates earnings and outstanding shares asif all convertible securities in its capital structure have been converted and all options or warrantshave been exercised. Conversion or exercise is assumed to take place from the start of the year – or the date of issue of the POS, if later. Should securities be converted or options/warrantsexercised during the year, then the calculation of diluted EPS includes the effect of these POSonly up to the date of conversion/exercise.28
In the case of convertible securities, the calculation of potential dilution is straightforward.The firm estimates the effect of conversion on both EPS numerator and denominator. This isknown as the ‘if converted’ method. The EPS numerator increases – in the case of convertible bonds,by the interest saved (net of any tax effect) and, in the case of convertible preference shares, bythe preference dividend avoided. The EPS denominator also increases – by the ordinary sharesissuable under the conversion terms.
Estimating the potential dilutive effect of warrants and employee share options is moredifficult. In contrast to convertible securities, the firm receives cash from the exercise of warrantsor options which, in practice, is invested. What assumption should the firm make about thereturn on this investment? The international standard, following US practice, avoids this question.Under IAS 33, the firm assumes it purchases its own shares with the cash received from exercise.This is known as the ‘treasury stock’ method. If the warrants or options are ‘in the money’ (themarket price is greater than the exercise price), they are dilutive: the number of shares issued on exercise exceeds the number of the company’s own shares that can be bought back. Thus theEPS numerator is unchanged but the EPS denominator increases.
Exhibit 20.9 summarises the adjustments a firm makes to the EPS numerator and denom-inator when calculating diluted EPS.
As we stated earlier, a company must disclose diluted EPS if its POS are dilutive. The inter-national standard defines dilutive POS as securities that, after conversion or exercise, decrease theper-share profit from continuing, ordinary operations attributable to ordinary shareholders. Notethis benchmark profit figure. It excludes extraordinary items and the effect of discontinued operations. The impact on EPS of each issue or series of POS must be considered in turn, startingwith the most dilutive. If an issue or series of POS is anti-dilutive (i.e. inclusion would result in anincrease in per-share profit from continuing, ordinary operations), it should be excluded from thediluted EPS calculation. This procedure ensures the maximum dilution of basic EPS.
Example
We illustrate how basic and diluted EPS are calculated under IASB rules. Suizo-Hispania, designerand builder of luxury automobiles, reports net profits of a6 million in year 8. It has 12 millionordinary shares outstanding during the year. Its basic EPS is therefore a0.5. It has the followingPOS in its capital structure:
l Employee share options. There are 3 million shares under option in year 8 and their exerciseprice is a2.7. The average market value of the company’s shares is a3.6 per share that year.
l Convertible bonds. At the start of year 7, the company issues, at par, a15 million of 3% ten-year convertible bonds. Holders can convert each a1,000 bond into 250 Suizo-Hispaniaordinary shares starting in year 9. The tax rate is 30%.
682 PART 3 • PERSPECTIVES
CFA_C20.qxd 11/7/03 2:17 PM Page 682

CHAPTER 20 • FINANCIAL STATEMENT ANALYSIS: EXTENSIONS 683
Exhibit 20.10 shows the calculation of Suizo-Hispania’s basic and diluted EPS in year 8. In calculating diluted EPS, conversion of the bonds is assumed to take place at the start of year 8.
Suizo-Hispania’s employee share options and convertible bonds both have a dilutive effecton EPS. We start the diluted EPS calculation with the share options because they are the moredilutive of the two POS. Since the market value of the shares exceeds the exercise price of theoptions, the shares issued on exercise of the options (3 million) are greater than the shares thatcan be bought back with the proceeds (a8.1 million/a3.6 = 2.25 million shares). In consequence,the EPS denominator increases by 750,000 while the EPS numerator is unchanged.
As for the convertible bonds, the company adds only a0.084 to its after-tax income for eachshare issued on conversion:
= A0.084/share
Since the company’s EPS after accounting for the employee share options alone is a0.47(a6,000,000/12.75 million shares), the marginal impact of the convertible bonds is dilutive. Afteradjusting for both POS, the company’s year 8 diluted EPS is a0.38.
But what if Suizo-Hispania’s net profit in year 8 is only a1 million? As stated earlier, the more dilutive of its two POS are the employee share options. Its EPS adjusted for the assumedexercise of these options is only a0.078 (a1 million/12.75 million shares). Since the interest savedon conversion of the bonds is greater than this on a per-share basis (a0.084/share), the effect of conversion is to increase EPS. Diluted EPS rises to a0.08 [(1.0 + 0.315)/16.5]. In this case, theconvertible bonds are anti-dilutive and only the share options are included in the diluted EPScalculation.29
Interest saved (net of tax)Shares issued on conversion
,
, ,=
A315 0003750 000
Framework
Diluted EPS =
Source of dilutive POS Adjustments to EPS numerator and denominatorConvertible bonds Numerator : Add back interest saved (net of tax effect) as a
result of conversion.Denominator : Increase shares outstanding by shares to be
issued on conversion.
Convertible preference Numerator : Add back preference dividend avoided as ashares result of conversion.
Denominator : Increase shares outstanding by shares to be issued on conversion.
Warrants and employee Numerator : No effect.share options Denominator : Increase shares outstanding by excess of
shares to be issued on exercise over the company’s own shares purchasable with proceeds from exercise.
Net profit/loss attributableto ordinary shareholders
Weighted average ordinary shares andin period
/
/
+ −Effect of POS on net
profit losspotential
ordinary shares POS( )
Calculation of diluted EPS: adjustments to EPS numerator and denominatorExhibit 20.9
CFA_C20.qxd 11/7/03 2:17 PM Page 683

684 PART 3 • PERSPECTIVES
l Presentation and disclosure of EPSA company following international rules must report basic and diluted EPS on the face of itsincome statement for the current period and previous ones presented. It should also show how the numerator and denominator of the two EPS figures are arrived at. Loss-making firms (i.e. with negative EPS) must also disclose these EPS figures.
A company may disclose voluntarily per-share amounts of components of profit, such asextraordinary items and the profit or loss from discontinued operations. The IASB encouragesfirms to make these additional disclosures if management believe the information helps investorsevaluate the performance of the company. The calculation should be consistent with the mainEPS figures, that is the same weighted average number of ordinary shares should be used in thedenominator.
l EPS calculation and presentation: an unfinished storyThe calculation and presentation of EPS are still evolving. There’s still uncertainty about how the profit figure in the numerator should be calculated. Witness the IASB’s open approach to thedisclosure of per-share components of profit.
Investment analysts have their own views on this issue. Professional associations of analystsand credit rating agencies in various countries have constructed their own earnings formulas foruse in performance appraisal and valuation of domestic companies. For example, the GermanInstitute of Financial Analysts (DVFA) together with the German Association of BusinessEconomics (SG) has devised an adjusted annual earnings number for German companies. The
Factsl Suizo-Hispania’s net profit in year 8 is A6 million. The tax rate is 30%. There are 12 million
average ordinary shares outstanding in the year.l Three million share options have been granted to employees. The exercise price is A2.7.
The average market price of SH shares in year 8 is A3.6.l SH issued A15 million of 3% ten-year convertible bonds at par at the start of year 7.
Holders can convert each A1,000 bond into 250 SH shares from year 9.
Year 8 EPS calculationAdjusted net Ordinary and
profit to ordinary potential ordinary Earnings pershareholders shares share(Numerator) (Denominator)
Basic EPS A6,000,000 12,000,000 A0.5Employee share options 0 +750,000*
6,000,000 12,750,0003% convertible bonds** +315,000 +3,750,000Diluted EPS A6,315,000 16,500,000 A0.38
Notes:* Cash received on exercise: 3 million × A2.7 = A8.1 million. Shares purchasable: A8.1 million/
A3.6 = 2.25 million. Net increase in shares outstanding: 750,000.** Interest saved, net of tax: A15 million × 3% × (1 – 0.3). Shares issued on conversion:
15,000 bonds × 250.
Diluted EPS calculation: effect of share options and convertible bondsExhibit 20.10
CFA_C20.qxd 11/7/03 2:17 PM Page 684

CHAPTER 20 • FINANCIAL STATEMENT ANALYSIS: EXTENSIONS 685
aims of the adjustments are to strip away tax-driven and transitory elements in reported profitsand improve the comparability of German companies’ results. Thus unscheduled depreciation(i.e. the difference between tax-based and normal depreciation) and gains and losses from majordisposals of fixed assets are excluded from the adjusted earnings number. So, too, are changes inprovisions that don’t involve obligations to third parties. (This adjustment brings the earningsnumber closer to an IAS-based one.) Many German companies disclose DVFA/SG earnings (and EPS) figures in the annual report on a voluntary basis.
Note that the DVFA/SG earnings number cannot be computed without company assistance.By contrast, the ‘core’ earnings number that Standard & Poor’s, the credit rating agency, calculatesfor leading US companies can be derived from published data.
Problem assignments
P20.1 Ebitda: investors’ friend or foe?Many companies now present an Ebitda (earnings before interest, tax, depreciation and amortisation)number in their annual and interim reports, usually among the ‘financial highlights’ or in the ‘financialreview’ section of the report. Management claim they are merely responding to investor demand fora forward-looking earnings number. Disclosing the figure saves investors the trouble of calculating itthemselves.
Financial regulators, however, warn investors to be wary of Ebitda and other so-called pro formaearnings numbers devised by management that are not supported by accounting standards or generallyaccepted accounting principles. Under SEC rules, companies listed on US stock exchanges mustreconcile any ‘pro forma’ earnings number (such as Ebitda) to the US GAAP-based earnings numberon the income statement.
Required
(a) Why do you think some investors are interested in Ebitda? What are the advantages of this earningsnumber over the earnings numbers – such as operating income, income before tax and net income– reported in the income statement?
(b) Why are financial regulators sceptical about Ebitda? What are the potential flaws of this earningsnumber as a performance measure?
P20.2 Restating accounts for new informationUnder current accounting rules, companies – in countries where the practice is permitted – can restatepast years’ accounts in limited circumstances only. Restatement is required if material errors are dis-covered in past years’ accounts. It may be required if a new accounting standard is introduced. It is per-mitted if the company changes an accounting method. Restatement is not permitted in other situations.
Many managers believe these rules are too restrictive. Consider, for example, the treatment of out-lays on research. Even under the new international standard, it is difficult if not impossible for a firmto capitalise non-contractual research costs. At the time of the expenditure, future benefits are likelyto be considered too uncertain to permit asset recognition. If later the research proves successful, thecompany cannot restate past years’ accounts and recognise a research asset retrospectively sincethe circumstance – a revision of estimates of future benefits – does not qualify for restatement.
The economic consequences are potentially severe. Expenditures on intangibles are growing as aproportion of total investment as services increase their share of national output. In addition, there isevidence that technology is now changing at a faster rate – which implies rising corporate expenditureson research and development. These outlays are usually not capitalised and, as a result, balance sheets
CFA_C20.qxd 11/7/03 2:17 PM Page 685

understate companies’ economic resources. In some cases the understatement is extreme. For example,the book value of Microsoft’s net assets was only 22% of their market value at the end of 2002.
Some financial experts have proposed that there should be continuous restatement of financialreports.30 Under their proposal, companies would regularly revise past years’ financial statements asnew information becomes available and uncertainties about the future benefits of expenditures onintangibles are resolved. Note that this proposal is not as revolutionary as it sounds. Revising pastperiods’ accounts to incorporate new information is a common practice in government accounting.
Required
Comment on the above proposal. Are there other advantages of continuous restatement of financialaccounts in addition to those mentioned above? What are the potential disadvantages of this idea?
P20.3 Earnings impact of major changes in operationsSmith & Nephew plc, UK-based producer of medical devices, reorganised its operations in 2001. On1 April that year it set up a joint venture (called BSN Medical) with Beiersdorf AG. S&N contributed itscasting and bandaging and traditional woundcare businesses in return for a 50% equity stake in BSNMedical. (Beiersdorf contributed similar businesses to the joint venture for its 50% stake.) The resultsof these businesses prior to 1 April are shown in S&N’s income statement as ‘Operations contributedto the joint venture’. Exhibit 20.11 contains the group’s profit and loss account for 2001.
S&N also acquired and disposed of other businesses in 2001. As part of its deal with Beiersdorf,it acquired the German company’s advanced woundcare business. It sold its ear, nose and throatbusiness during the year and made a £49 million gain on the disposal. The remaining businesses weregrouped into four product areas – orthopaedics, endoscopy, advanced wound management andrehabilitation – and the company published segmental data for each of them in its 2001 accounts.
Exceptional items of 19.3 (£ million) shown under ‘Ongoing operations’ comprise:
l 2.9 of manufacturing rationalisation costs;l 7.5 of rationalisation costs following the contribution of businesses to BSN Medical;l 8.9 of integration costs in connection with the 2001 acquisition of the advanced woundcare busi-
ness from Beiersdorf.
The exceptional items shown under ‘Operations contributed to the joint venture’ and ‘Share of oper-ating profit of joint venture’ relate, in both cases, to manufacturing rationalisation costs. (The com-pany also reported £4.3 million of such costs under exceptional items in the 2000 income statement.)Management estimate that the taxation charge on profits in 2001 before exceptional items and dis-continued operations is £52.3 million.
Required
(a) You wish to calculate S&N’s operating profitability (i.e. return on net operating assets) in 2001.Calculate the group’s NOPAT (net operating profit after tax) that year. The UK statutory tax ratewas 30% in 2001. (Note: RONOA cannot be calculated as no balance sheet information is given.)
(b) Calculate the 2001 turnover and operating profit figures you would use as the basis for forecast-ing S&N’s group turnover and operating profits for 2002. Explain the basis of your calculation.
P20.4 Change in accounting policyVolund, a metal fabricator, decides to build its own steel mill. The mini-mill costs 120, has a ten-yeareconomic life and an expected scrap value of 10. (Amounts are in A million.) Volund depreciates theplant by an accelerated method (which it also uses for tax purposes). Depreciation in the first four yearsis: 20, 18, 16, 14.
During year 4, Volund decides to change the way it depreciates the mill in its published accounts.It switches to the straight-line (SL) method because it reckons the SL method better reflects the waythe plant’s services are consumed. It continues to depreciate the asset on an accelerated basis in its tax accounts. Volund’s draft year 4 accounts before the accounting change are set out below insummary form:
686 PART 3 • PERSPECTIVES
CFA_C20.qxd 11/7/03 2:17 PM Page 686

CHAPTER 20 • FINANCIAL STATEMENT ANALYSIS: EXTENSIONS 687
Year 4 Year 3Statement of income and change in retained incomeOperating revenues 800 750
Income before tax 80 70Tax expense (at 30%) −24 −21Net income 56 49Retained income, start-year 124 93Income available for distribution 180 142Dividends paid −20 −18Retained income, end-year 160 124
For the year ended 31 December 2001£ mn
TurnoverOngoing operations 1,012.5Operations contributed to the joint venture 35.3
Continuing operations 1,047.8Discontinued operations 33.9
Group turnover 1,081.7Share of joint venture 123.6
1,205.3Operating profitOngoing operations:
Before exceptional items 171.0Exceptional items (19.3)
151.7Operations contributed to the joint venture:
Before exceptional items 3.6Exceptional items (1.8)
Continuing operations 153.5Discontinued operations 0.5
154.0Share of operating profit of the joint venture:
Before exceptional items 12.8Exceptional items (5.0)
161.8Discontinued operations – net profit on disposals 49.2
Profit on ordinary activities before interest 211.0Interest payable (17.4)
Profit on ordinary activities before taxation 193.6Taxation (64.0)
Attributable profit for the year 129.6Ordinary dividends (42.9)
Retained profit for the year 86.7
Smith & Nephew: group profit and loss account, 2001Exhibit 20.11
(Source: Smith & Nephew plc, Annual Report and Accounts 2001. Reproduced by permission of Smith & Nephew plc.)
CFA_C20.qxd 11/7/03 2:17 PM Page 687

688 PART 3 • PERSPECTIVES
Year 4 Year 3Balance sheet at year-endSteel mill, at net book value 52 66Other assets 708 644
Total assets 760 710
Share capital and premium 200 200Retained income 160 124Liabilities (including provision for deferred taxes) 400 386
Total equities 760 710
Required
Adjust Volund’s accounts to reflect the change in depreciation method for the steel mill. AssumeVolund accounts for the change by the restatement method. Show the effect on pre-year 3 incomeas a ‘prior period adjustment’ to start-year 3 retained income.
Check figure:Retained income, end-year 4 176.8
P20.5 Reconciling numbers to US GAAP: effect on profitability and leverage
Helping Hand is a business services firm that specialises in outsourcing services. Although based ina eurozone country – we’ll call it Euroland, it has acquired businesses in other countries in recentyears. Because of its growing international profile, it obtains permission to list its shares on the NewYork Stock Exchange. The company prepares its published accounts according to Euroland GAAPbut provides a reconciliation of net income and shareholders’ equity to US GAAP, as required by SECregulations. The reconciliation given in its x9 accounts is set out in Exhibit 20.12.
Euroland GAAP differs from US GAAP in several important respects.
l Prior to x9, Euroland companies could write off purchased goodwill against reserves. Since thestart of x9, they must capitalise and amortise it.
l Euroland rules for establishing provisions – for restructuring and other costs – are less strict thanUS ones so Euroland companies can set them up at an earlier date than US firms can.
l Euroland companies are permitted to revalue tangible fixed assets. Depreciation is calculated on the revalued amount of the assets. The revaluation surplus is credited to a non-distributablereserve and can be transferred to distributable reserves only when realised. US GAAP does notpermit such asset revaluations.
l In estimating the cost of their defined benefit pension plans, Euroland and US companies use different actuarial methods.
Required
(a) Calculate Helping Hand’s ROE for x9 under both Euroland and US GAAP. Clearly, goodwill isresponsible for the large difference in reported profitability under the two accounting regimes.Why does Helping Hand deduct an amount for goodwill in arriving at US GAAP income but add amuch larger amount under the same heading in arriving at US GAAP shareholders’ equity?
(b) A condensed version of Helping Hand end-x9 balance sheet is set out below. It is preparedaccording to Euroland GAAP. Amounts are in A million.
AssetsFixed assets 6,404Current assets other than cash 3,099Cash and cash equivalents 497
Total assets 10,000
CFA_C20.qxd 11/7/03 2:17 PM Page 688

CHAPTER 20 • FINANCIAL STATEMENT ANALYSIS: EXTENSIONS 689
Shareholders’ equity and liabilitiesShareholders’ equity 1,646Minority interests 235Debt (including financial lease commitments) 4,178Provisions and other long-term operating liabilities 761Current operating liabilities 3,180
Total shareholders’ equity and liabilities 10,000
(i) Using information in Exhibit 20.12, adjust the above balance sheet figures to (approximate) USGAAP.
(ii) Calculate Helping Hand’s end-x9 net debt-to-group equity ratio under both Euroland and USGAAP.
(iii) On seeing your answers to (ii), an analyst remarks: ‘No wonder the market has moved to cash flow measures of financial leverage. Balance sheet measures of leverage give absurdresults.’ What is the point the analyst is making? Under what circumstances do balance sheetmeasures of leverage give ‘absurd results’?
P20.6 Analysis of segmental data
Swiss-based Nestlé is the world’s largest food and beverage group with 2001 sales of SFr 85 billion. Itsmajor brands include Nescafé, Perrier and Vittel in beverages and Maggi and Buitoni in prepared dishes.However, it uses the Nestlé name in milk products, ice cream and confectionery.
Nestlé follows IAS. Under ‘Accounting policies’, it defines its primary and secondary segment formats:
(Amounts in B million) x9 x8
Net income in accordance with Euroland GAAP 526 383
Adjustments to reported net income with respect to:Goodwill (103) (67)Pension costs 5 (8)Property revaluation 3 3Provisions (29) (46)Deferred tax effect of adjustments 7 12
Net income in accordance with US GAAP 409 277
(Amounts in B million) End-x9 End-x8
Shareholders’ equity in accordance with Euroland GAAP 1,646 1,207
Adjustments to reported shareholders’ equity with respect to:Goodwill 3,994 3,412Pension liabilities 34 39Property revaluation (21) (24)Long-term provisions 20 23
Shareholders’ equity in accordance with US GAAP 5,673 4,657
Helping Hand: reconciliation of x9 income and equity to US GAAPExhibit 20.12
CFA_C20.qxd 11/7/03 2:17 PM Page 689

690 PART 3 • PERSPECTIVES
The primary segment format – by management responsibilities and geographic area – represents theGroup’s management structure. The principal activity of the Group is the food business, which is man-aged along three geographic zones. The other activities, mainly pharmaceutical products and water, aremanaged on a worldwide basis. The secondary segment format representing products is divided into fivecategories (segments).
(Nestlé, Management Report 2001)
Exhibit 20.13 shows the information Nestlé discloses under the secondary segment format.
Required
(a) Determine which product group in 2001: (i) enjoyed the fastest sales growth; (ii) earned the highest margin on sales; (iii) was the most asset-intensive; (iv) earned the lowest return on assets.
2001 2000 2001 2000
In SFr millions Sales Results
Beverages 24,023 23,044 4,259 4,318Milk products, nutrition and ice cream 22,953 21,974 2,572 2,620Prepared dishes and cooking aids
(and miscellaneous activities) 21,324 20,632 2,026 1,948Chocolate and confectionery 11,244 10,974 1,234 1,166Pharmaceutical products 5,154 4,798 1,255 1,212
84,698 81,422 11,346 11,264
Unallocated items(a) (2,128) (2,078)
Trading profit 9,218 9,186
(a) Mainly corporate expenses, research and development costs, amortisation of goodwill and restructuring costs.
2001 2000 2001 2000
CapitalIn SFr millions Assets expenditure
Beverages 11,086 10,654 1,062 936Milk products, nutrition and ice cream 11,127 11,215 573 530Prepared dishes and cooking aids
(and miscellaneous activities) 8,620 8,980 460 390Chocolate and confectionery 6,347 6,685 249 250Pharmaceutical products 2,859 2,589 99 113
40,039 40,123 2,443 2,219
Administration, distribution, research and development 1,168 1,086
3,611 3,305
Nestlé Group: segmental information by major product group for 2001 and 2000Exhibit 20.13
(Source: Nestlé, Management Report 2001. Reproduced by permission of Nestlé S.A.)
CFA_C20.qxd 11/7/03 2:17 PM Page 690

CHAPTER 20 • FINANCIAL STATEMENT ANALYSIS: EXTENSIONS 691
(b) An analyst reviewing Nestlé’s product group disclosures questioned their usefulness. ‘A key expend-iture is research and development which, according to the consolidated income statement, totalledSFr 1,162 million in 2001. Nestlé doesn’t break down this figure by product group so the segmentalprofit and investment numbers are misleading.’ Comment on this criticism. Do you agree?
(c) Nestlé publishes additional information under its primary segment format, in particular, liabilitiesand depreciation by segment. The capex and depreciation figures are shown below:
Capital Depreciationexpenditure of property, plant
and equipment(In SFr millions) 2001 2000 2001 2000
Food:Europe 954 946 806 890Americas 747 766 695 767Africa, Asia, Oceania 626 550 438 481
Other activities 1,169 949 558 5193,496 3,211 2,497 2,657
Corporate and R&D 115 94 84 803,611 3,305 2,581 2,737
On comparing the capex and depreciation figures, an investor asks: ‘The depreciation charge on Nestlé’s food assets fell in every area between 2000 and 2001. Yet in Africa, Asia and Oceania and, to a lesser extent, in Europe, food capex rose between these two years. How canthis be?’
Suggest possible reasons why the depreciation charge on a segment’s fixed assets mightdecline in a period when expenditure on property, plant and equipment in that segment increases.
P20.7 Treatment of revenues and expenses in quarterly accountsIt’s early April x5 and Demeter Company, a Mediterranean-based producer of horticultural equipment,is about to publish quarterly financial statements for the first time. The company has a Decemberyear-end and follows international accounting standards. Demeter’s chief financial officer asks youradvice on how the following items should be dealt with in the first quarter’s report (to end-March x5).Set out below is the treatment she thinks is most appropriate for each revenue (expense) item.
Proposed effectItem on Q1 net income CFO’s comments
Deferred maintenance 0 The cost incurred in Q1 was A50,000 but it really charge belongs in Q4 x4. The spending was deferred in
order that the company could achieve its earningstarget in x4. I think we should take the whole costin Q4 x5 as an exceptional charge at year-end.
Dividend on financial A20,000 No dividend was received in the quarter. The investment company expects to receive A80,000 over the
year, the same as in x4. I reckon the incomeshould be spread evenly over the year.
Cost of major advertising (A30,000) The campaign was launched in early March and campaign cost A90,000. The company expects to receive the
benefits evenly over three months, March–May x5.I propose we split the cost and book one-third inQ1 and two-thirds in Q2.
CFA_C20.qxd 11/7/03 2:17 PM Page 691

Proposed effectItem on Q1 net income CFO’s comments
Foreign currency 0 The fall in the dollar in Q1 resulted in a A45,000transaction gain gain on the company’s outstanding dollar debt.
I don’t think we should book any gain in Q1because it’s not realised and the dollar mayrecover later in x5.
Restructuring charge (A17,500) In Q1 the company announced plans to restructure one of its businesses. The plan is an outline only: there are no firm details. Expected total cost is aroundA70,000. No outlays were made in Q1. I proposewe spread the expected cost evenly over the year.
Required
Advise Demeter’s CFO. How should the company account for each of the above five items in its Q1x5 income statement? Give reasons for the accounting treatment you propose.
P20.8 Calculation of earnings per share*Spriggins Company is a small biotechnology company specialising in the development of new varietiesof vegetable and field crop seeds. One of the company’s most successful products is the high-growth,thick-stalk bean which founder Jack Spriggins developed.
Like most fast-growing companies, Spriggins is capital-hungry. It pays no dividends on its 15 millionissued (ordinary) shares, ploughing back all profits into the business. It issued A10 million of ten-yearconvertible zero coupon bonds at the start of x2. The bonds raised A5.584 million giving a yield tomaturity of 6%. Under the conversion terms, each A1,000 bond can be converted at any time into 80ordinary shares.
The company launched a share option scheme for employees in x3, and 1,350,000 options weregranted on 1 May. The options can be exercised from x5 at a price of A8.
Spriggins reports net profit of A9 million in x3. Interest expense on the bonds is A0.355 million thatyear and the tax rate is 30%. The average market price of the company’s shares in x3 is A10.
Required
Calculate the company’s basic and diluted earnings per share for x3.
Check figure:Diluted EPS A0.58
* Assignment draws on material in the appendix to this chapter.
Notes to Chapter 20
1 Investors can estimate organic profit growth in 2002, however. In a note to the 2002 accounts, Herodiscloses the contribution of major acquisitions to group operating profits that year – and the contri-butions of the principal businesses disposed of in 2002 to 2001 as well as 2002 operating profits.
2 International Accounting Standards Board, IAS 35: Discontinuing Operations.3 The sharp falls in the sales, earnings and capital employed of the ferrochrome division in 2001 are
attributable to poor trading conditions: world demand for ferrochrome fell and Xstrata responded bycutting production capacity. As for the forestry segment, the end-2001 figures reflect the net assets ofthe group’s eucalyptus plantation, the forestry trading business having been sold in 2001.
4 International Accounting Standards Board, IAS 8: Net Profit or Loss for the Period, Fundamental Errorsand Changes in Accounting Policies.
692 PART 3 • PERSPECTIVES
CFA_C20.qxd 11/7/03 2:17 PM Page 692

5 The IASB announced in late 2002 that it planned to make restatement mandatory for all voluntarychanges in accounting method. The cumulative catch-up approach would no longer be allowed.(Companies would not need to restate prior years’ accounts if this involved undue cost.) Note that toimplement the proposed IASB ruling some EU countries will have to amend existing accounting lawsthat require the opening balances of each financial year to equal the preceding year’s closing balances.Such laws preclude restatement.
6 Companies switching to international from national accounting standards must restate prior years’accounts unless it’s impracticable to do so or individual IAS require a different transitional treatment(Standing Interpretations Committee [of the IASC], SIC-8: First-Time Application of IASs as thePrimary Basis of Accounting).
7 Other areas where differences in accounting have a significant impact on Unilever’s 2001 accountsinclude interest, pensions and dividends. Unilever expenses all interest costs as incurred; US GAAPrequires interest incurred during the construction of tangible fixed assets to be capitalised and depreciated over their useful lives. Pension and healthcare assets and liabilities are measured at fairvalue under US rules but at actuarial value under (then) UK rules, resulting in a higher net liabilityunder the former. In the UK, dividends are provided for when proposed but in the USA they are not provided for until they become irrevocable.
8 Basu, S. (1997), The conservatism principle and the asymmetric timeliness of earnings, Journal ofAccounting and Economics, 24: 3–37.
9 Ball, R., Kothari, S.P. and Robin, A. (2000), The effect of international institutional factors on propertiesof accounting earnings, Journal of Accounting and Economics, 29: 1–51.
10 Dreyfus, P. (1988), Go with the (cash) flow, Institutional Investor, August: 55–59.11 This argument is developed in Choi, F. and Levich, R. (1990) The Capital Market Effects of Inter-
national Accounting Diversity, New York: Dow Jones/Irwin.12 Collins, D. (1976), Predicting earnings with sub-entity data: some further evidence, Journal of Account-
ing Research, Spring: 163–177.13 Benetton’s segmental disclosures, though helpful, are limited. The company provides no information on
assets and liabilities by line of business so investors can’t determine each sector’s profitability. Moreover,it provides no information about how intersegment transfers are priced. This is important in the caseof the manufacturing sector where over 60% of sales flow to the casual wear and sport sectors. Is casualwear’s high contribution margin the result of low transfer prices being charged by manufacturing?
14 The main concerns of the OECD and UN are the disclosure of segmental data by geographical area.See Organisation for Economic Cooperation and Development (1976), Guidelines for MultinationalEnterprises, Paris: OECD, and United Nations (1986), The United Nations Code of Conduct onTransnational Corporations, New York: UN.
15 International Accounting Standards Board, IAS 14: Segment Reporting. Segmental disclosures requiredunder the EU’s 4th Directive are modest. Large firms must break down annual sales, average staffnumbers and staff costs by activity and geographical market where these activities and markets ‘differsubstantially from one another’ (Art. 43(8) and (9)). The 7th Directive requires the same disclosuresin the consolidated accounts. Neither directive states how a segment should be defined.
16 ‘Sales’ here includes sales to other segments. As for profits, the firm divides its segments into profit-and loss-making ones and applies the 10% test to the profitable segments and loss-making ones separately.
17 Doubts about the quality of Cisco’s earnings surfaced in 2001. The company’s growth in the 1990s wasfuelled by acquisitions. Analysts suspected that the company had boosted reported earnings during the decade by writing down the net assets of firms it acquired before consolidating their accounts. Thisreduced the costs it had to charge against income after the acquisition was effected. In addition, thewrite-offs Cisco booked in April 2001 helped to lift results in the following financial year since, ineffect, the company brought forward 2002 costs to 2001. See Byrne, J.A. and Elgin, B. (2002), Cisco:behind the hype, BusinessWeek, 21 January, pp. 43–49.
18 European Commission (1982), The Interim Reports Directive (82/121/EEC), Brussels.19 International Accounting Standards Board, IAS 34: Interim Financial Reporting.20 The argument that debt and other contracts influence firms’ accounting decisions is summarised and
illustrated in Watts, R. and Zimmerman, J. (1986), Positive Accounting Theory, Englewood Cliffs, NJ:
CHAPTER 20 • FINANCIAL STATEMENT ANALYSIS: EXTENSIONS 693
CFA_C20.qxd 11/7/03 2:17 PM Page 693

Prentice Hall, Chapters 8–12. Most of the empirical work cited by Watts and Zimmerman is US-based.There have been few non-US studies to date. A recent interesting one found that Finnish firms manipulated profits under a dividend-and-tax strategy: they lowered them in ‘fat’ years to reduce taxesand raised them in ‘lean’ years to ensure dividends were covered by current earnings (Kasanen, E.,Kinnunen, J. and Niskanen, J. (1996), ‘Dividend-based earnings management: empirical evidencefrom Finland’, Journal of Accounting and Economics, vol. 22, pp. 283–312).
21 For a fuller exposition of the argument that without legal safeguards outsiders’ capital will be expro-priated by insiders, see La Porta, R., Lopez-de-Silanes, F., Shleifer A. and Vishny, R. (2000), Investorprotection and corporate governance, Journal of Financial Economics, 58: 3–27.
22 In a study of large, quoted US companies in the 1992–93 period, Klein found that decreases in theindependence of boards of directors and audit committees were associated with increases in earningsmanagement at these companies. See Klein, A. (2002), Audit committee, board of director character-istics, and earnings management, Journal of Accounting and Economics, 33: 375–400.
23 Leuz, C., Nanda, D. and Wysocki, P.D. (2003), Investor protection and earnings management: aninternational comparison, Journal of Financial Economics, forthcoming. Using cluster analysis, LNWfound that countries fell into one of three groups: (1) ‘outsider’, (2) ‘insider’ with strong legal enforce-ment, and (3) ‘insider’ with weak legal enforcement. Common-law countries with well-developed capital markets dominate the ‘outsider’ group and code-law countries with a German or Scandinavianlegal tradition the ‘insider with strong legal enforcement’ group. Earnings management increasedacross the three groups, being lowest among companies in group 1.
24 Each major stock market has its (unofficial) chronicler of creative accounting practices. For a USexposé, see Schilit, H. (2002), Financial Shenanigans – How to Detect Accounting Gimmicks and Fraudin Financial Reports, 2nd edition, New York: McGraw-Hill. For a UK exposé, see McBarnet, D. andWhelan, J. (1999), Creative Accounting and the Cross-Eyed Javelin Thrower, Chichester: John Wiley.
25 For a fuller development of this argument, see Healy, P. and Palepu, K. (1993), The effect of firms’financial disclosure strategies on stock prices, Accounting Horizons, March: 1–11.
26 International Accounting Standards Board, IAS 33: Earnings per Share.27 If a company makes a ‘rights issue’ – in which new shares are offered first to existing shareholders at a
discount to the current market price – the issue is treated for EPS purposes as part share dividend andpart new share issue at the full market price. Comparative EPS figures for prior years are adjusted forthe share dividend component of the issue.
28 If ordinary shares are contingently issuable (e.g. issuable on achievement by an acquired firm of profittargets agreed at the time of its acquisition), then for purposes of diluted EPS the denominator shouldinclude the contingently issuable shares even if the conditions have not been met in the period.
29 Our example is highly simplified. If earnings drop to a1 million, the share price is likely to fall, too.The dilutive effect of the employee share options will be reduced or, if the share price falls below theexercise price, eliminated.
30 Lev, B. and Zarowin, P. (1999), The boundaries of financial reporting and how to extend them, Journalof Accounting Research, Autumn: 353–385.
694 PART 3 • PERSPECTIVES
CFA_C20.qxd 11/7/03 2:17 PM Page 694

Absorption costing. Dominant method of costing
inventory in firms’ published accounts. End-periodwork in progress and finished goods bear a share ofthe fixed production costs incurred during the periodthey were produced. (Such costs are ‘absorbed’ ininventory.)
Accelerated method. Depreciation method where pro-portionately more of an asset’s cost is charged againstrevenues in the early years of its life. Examples are thedeclining-balance and sum-of-years’-digits methods.
Acceptance. See Bill of exchange.Account. Document in which accounting transactions
and events of a similar nature are recorded. The termcan be applied to a specific category of asset, liabilityor shareholders’ equity (e.g. ledger account) or a sub-part of it (e.g. individual customer account withinreceivables ledger account).
Account payable. Amount owed by firm to supplierunder general credit arrangement. (Cf. Note payable.)
Account receivable. Amount owed to firm by customerunder general credit arrangement. (Cf. Note receivable.)
Accounting policies. Accounting methods a companyfollows, and estimates its management make, whenrecognising and measuring its assets and liabilities. Seealso Accounting principles.
Accounting principles. Fundamental concepts under-lying accrual accounting. Four main ones are: goingconcern assumption; consistency; prudence; accrualsconcept.
Accounting profit. Before-tax profit reported in pub-lished accounts. (Cf. Taxable profit.)
Accrual adjustment. Adjustment to update accounts for event which has economic impact on the firm inthe period. The event may be the consumption of anasset, the settlement of a liability or the effect of thepassage of time on either.
Accruals concept. Fundamental accounting principle.An event is recognised in accounts at time of its eco-nomic impact on firm. This may or may not coincidewith receipt or payment of cash.
Accrue. To recognise revenue or expense (and relatedasset or liability) before cash is received or paid.
Accrued benefit valuation (ABV) method. Actuarialmethod of determining cost of pension (or otherretirement) benefits. Benefits are based on servicesalready rendered (‘accrued’) by employees.
Accumulated amortisation/depreciation. Cumulativeamortisation/depreciation charges. Balance sheetaccount. Usually shown as contra account to relatedintangible/tangible fixed asset.
Accumulated benefit obligation. Measure of pensionplan’s liability (US). Actuarial present value of vestedand non-vested benefits (computed under requiredABV method), based on current salary levels.
Acid test ratio. See Quick ratio.Acquisition accounting. Method of accounting for
business combination. One firm is deemed to havebought another and records in consolidated balancesheet, at time of acquisition, the fair values of assetspurchased and liabilities assumed. (Cf. Mergeraccounting.)
Actuarial gains/losses. Gains/losses that arise from (1)changes in actuarial assumptions underlying pensionplan assets and liabilities and (2) experience adjust-ments (adjustments to plan assets and liabilitiesbecause experience – of labour turnover, inflation,etc. – differs from expectations).
Actuarial method. See Interest method.Additional paid-in capital. See Share premium.Affiliate/affiliated company. A company linked to
another by shareholding (e.g. subsidiary, associate).Allowance for bad debts. Valuation adjustment to
accounts (or notes) receivable. Estimated amount offirm’s trade debts outstanding at end of period whichmanagement consider are uncollectible. (Also knownas allowance for doubtful accounts and allowance foruncollectible accounts.)
Amortisation. Allocation of cost over predeterminedfuture period in a systematic way. The term is applied to:
– intangible assets – the predetermined future period isthe asset’s expected useful life;
– discount/premium (on bonds) – the predeterminedfuture period is usually the period to maturity.See also Depreciation.
Glossary
CFA_Z01.qxd 11/6/03 3:30 PM Page 695

Amortised cost. Method of valuing investment in debtsecurities. Debt securities are measured at historicalcost adjusted for the amortisation of the issue (or pur-chase) discount/premium.
Annual accounts. For larger companies, these consist ofbalance sheet, income statement, cash flow statement,notes to the accounts, auditors’ report.
Annual report. Accompanies annual accounts. Containsreview by management of firm’s activities during year.
Annuity method. Increasing-charge depreciationmethod. Cost of depreciable fixed asset is annuitisedand interest element is then subtracted from asset’sannual cost to give depreciation charge in period.
Asset. Resource expected to yield future benefits whichis controlled by firm and acquired as a result of a pastexchange.
Assets turnover. Sales revenue divided by (average) totalassets. It measures the intensity with which a firm usesall its assets.
Associate/associated company. Investee company whereinvestor firm exercises significant influence over itsoperating and financial policies, usually as a result oflarge minority shareholding (20–50%).
Audit. Examination of accounting records with aim ofestablishing that the firm’s system of record-keepingis sound and financial statements prepared from themare reliable.
Auditors’ report. Report by independent accountantsappointed by shareholders which is included inannual accounts. It states whether the firm’s accountscomply with legal requirements and convey faithfulpicture (in EU: ‘give true and fair view’) of its resultsand condition on dates indicated.
Available-for-sale investment. Investment in debt orequity securities that is neither held-for-trading norheld-to-maturity investment. Investment is carried atfair value and unrealised holding gains/losses aredeferred in equity (unless investment is impaired).
Bad debt expense. Write-offs of bad debts in the period,net of past bad debts recovered. Where firm providesfor estimated bad debts (via ‘allowance for bad debts’),net write-offs are adjusted for change in required bal-ance in allowance account.
Balance sheet. Statement of assets, and claims of ownersand creditors on those assets, on a stated day.
Bearer share. Share whose owner is not stated on theshare certificate. Ownership is transferred on deliveryof the certificate. (Cf. Registered share.)
Betterment. Expenditure on tangible asset which isexpected to increase its productive capacity. Expend-iture is capitalised and depreciated.
Bill of exchange. Written agreement between seller/lender and purchaser/borrower setting out terms ofpayment. Lender draws up bill; borrower signs(‘accepts’) it.
Bill/billing. Invoice issued by supplier to customerunder terms of contract. May be for work alreadydone or in advance of work done.
Bond. Claim on assets of firm. Claim is usually of fixedduration and may offer periodic cash return (interest)to holder. It carries no ownership rights but ranksbefore claims of owners.
Bonus issue. See Share dividend (1).Book reserve plan. See Unfunded plan.Book value. See Carrying amount.Book value per share. Share capital and reserves attri-
butable to ordinary shareholders divided by ordinaryshares outstanding at that date.
Capital. (1) Source of finance (e.g. debt capital) (2)Resources or assets, as in ‘working capital’ (net trad-ing assets) and ‘capital spending’ (investment in fixedassets). (3) Share capital, as in ‘Capital and reserves’.
Capital employed. The sum of net debt and share-holders’ equity – or equivalently, operating assets lessoperating liabilities.
Capital lease. See Finance lease.Capital reserve. See Reserve.Capital stock. See Share capital.Capital write-down. Reduction in nominal value and
cancellation of part/all of share premium in order toeliminate accumulated losses.
Capitalisation issue. See Share dividend (1).Carrying amount. Value at which asset or liability is
stated (‘carried’) in the firm’s books – hence also‘book value’.
Cash discount. Percentage reduction in invoicedamount available to credit customer who pays invoicewithin stated period.
Cash equivalents. Highly liquid investments such asshort-term bank deposits and Treasury bills thatmature within three months.
Cash flow. See Operating cash flow. The term is often usedin annual reports and the financial press to mean profit/loss for the period plus depreciation and amortisation.
Cash flow hedge. Transaction in which a company useshedging instrument (e.g. interest rate swap) to protectitself against changes in future cash flows of hedgeditem (e.g. variable-rate debt). If hedge is deemedeffective, unrealised gains/losses on hedging instru-ment are deferred in equity until hedged cash flowaffects income statement. (Cf. Fair value hedge, Netinvestment hedge.)
696 GLOSSARY
CFA_Z01.qxd 11/6/03 3:30 PM Page 696

Cash flow statement. Statement explaining the changein firm’s cash (and cash equivalents) balance in a period.Cash flows may be analysed by activity (operating,investing, financing).
Charge. (1) See Debit (b). (2) See Expense.Chart of accounts. Listing of ledger accounts, including
a coding system. May include guidance on accountingpolicies to be followed within the company.
Clean surplus accounting. All revenues and expenses,gains and losses, are recognised in the income state-ment and none is taken directly to reserves in the balance sheet.
Closing rate method. Method of converting accounts of foreign entity (expressed in local currency) intoreporting currency. Assets/liabilities are translated atend-period exchange rate, revenues/expenses at rateprevailing at date of recognition (or end-period rate).Change in exchange rate gives rise to translationadjustment. (Cf. Temporal method.)
Common stock. See Ordinary share.Completed-contract method. Method of recognising
revenue from long-term contract. Revenue (andrelated expenses) are recognised at the date when thecontract – to supply goods or services – is completed.(Cf. Percentage-of-completion method.)
Compound instrument. Security which has both debtand equity components.
Comprehensive deferred tax accounting. See Fulldeferred tax accounting.
Comprehensive income. Increase (or decrease) inshareholders’ equity, excluding changes in con-tributed capital and profit distributions, in a period.Includes gains and losses taken directly to reserves inthe balance sheet as well as net profit or loss reportedin the income statement.
Consignment (inventory). Goods held by third partybut still part of firm’s inventory.
Consolidation accounting. Where one firm (‘parent’)controls another (‘subsidiary’), the parent preparesadditional set of accounts in which its and its sub-sidiary’s accounts are combined. Intercompany bal-ances and unrealised profits/losses on intercompanytransactions are eliminated.
Consolidation difference. Difference between purchaseprice of net assets acquired and their carrying amountin subsidiary’s books. It comprises fair value adjust-ments and goodwill. Sometimes used as synonym forgoodwill alone. See also Acquisition accounting.
Constant purchasing power unit (CPPU). Alternativemeasurement unit to nominal currency. A firm’saccounts are expressed in terms of the buying powerof a currency as of a particular date.
Construction in progress. Building or plant which thecompany is constructing for its own use.
Consumables. See Supplies.Contingent liability (asset). A liability (asset) where the
obligation (resource) depends on the occurrence of afuture event.
Contingent share issue. Issue of shares which is contin-gent on one or more future events (e.g. achievementof profit target). Often used by investor company asform of deferred payment to investee firm’s formerowners. Contingent shares are potentially dilutivesecurities.
Contra account. Account which is offset against (contrato) specific asset or liability. It is often used to writedown carrying amount of asset or liability to a valuebelow cost.
Contracts in progress (inventory). Unfinished goods(or services) which firm is contracted to produce. (Cf.Work-in-progress inventory.)
Contributory plan. Social security or company-sponsored welfare scheme to which employee as wellas employer make cash contributions.
Convertible security. Bond or preference share withconversion option. Option gives holder the right toconvert security into specified number of (ordinary)shares at predetermined conversion rate in futureperiod.
Corporation tax. Income tax on companies.Cost method. Method of accounting for investments.
Investment is carried at cost, unless impaired. Incomeis only recognised when dividend or interest is re-ceived. (Cf. Equity method, Fair value method andLOCOM method.)
Cost of sales. The cost of the goods or services sold in the period. For retailer, ‘cost’ represents that of the merchandise only; for manufacturer, it includesproduction costs. In both cases, support costs such as marketing and administration are usually excluded.
Coupon rate. Annual interest paid on a bond (itscoupon) divided by its face value. More generally, thestated rate of interest on fixed-rate debt.
Credit (Cr.). Shorthand for ‘right-hand side of theaccount’. May be (a) adjective (‘credit entry’), (b)verb (‘to credit an account’) or (c) noun.
Creditor. Individual or organisation to whom firm owesmoney, goods or services.
Cumulative catch-up method. Method of accountingfor change in accounting policy. Cumulative effect ofchange in policy is shown as one-line entry on firm’sincome statement. (Cf. Prospective method, Restate-ment method.)
GLOSSARY 697
CFA_Z01.qxd 11/6/03 3:30 PM Page 697

Current asset. (1) Cash or cash equivalent; or (2) financial asset held for trading purposes and expectedto be converted into cash within twelve months; or (3)operating asset expected to be consumed or convertedinto cash within company’s normal operating cycle.
Current cost. See Replacement value.Current liability. Liability that falls due within 12
months or is expected to be settled within company’snormal operating cycle.
Current rate method. See Closing rate method.Current ratio. Current assets divided by current liabilit-
ies at balance sheet date. The ratio shows the extent towhich firm’s short-term obligations are covered by itscash and trading assets.
Current service cost. Cost of pension (or other retire-ment) benefits earned by employees for services ren-dered in current period.
Current tax expense (benefit). Portion of tax expensewhich is currently payable (refundable). See Deferredtax accounting.
Current value. See Fair value.
Days’ sales in receivables. Number of days in perioddivided by receivables turnover in that period. Theaverage credit period taken by customers.
Debit (Dr.). Shorthand for ‘left-hand side of theaccount’. May be (a) adjective (‘debit entry’), (b) verb(‘to debit an account’) or (c) noun.
Debt–equity ratio. Net debt divided by shareholders’equity. The ratio is an indicator of financial risk.
Debtor. Individual or organisation which owes money,goods or services to the firm.
Declining-balance method. Method of depreciation.Periodic charge is a predetermined, constant percentageapplied to start-of-period carrying amount of fixed asset.
Deductible temporary difference. Excess of carryingamount of liability over its tax value. Excess of taxvalue of asset over its carrying amount.
Defensive interval. Liquidity measure. End-period cashand near-cash (e.g. marketable securities, accountsreceivable) divided by next period’s expected operat-ing outlays and expressed in days. Shows how longcompany can continue operating in absence of oper-ating receipts.
Defer. To recognise revenue or expense (and expiry ofrelated liability or asset) after cash is received or paid.
Deferral method. Method of accounting for tax credit.Tax credit is deferred (via balance sheet account) andthen amortised – and tax expense reduced – over lifeof related asset. (Cf. Flow-through method.)
Deferred tax accounting. Method of accounting for taxeson corporate income. Firm recognises tax impact, now
(current tax expense/benefit) and in future (deferredtax expense/benefit), of current period’s profit/loss.
Deferred tax asset. Amount of income taxes recoverablein the future as a result of deductible temporary differ-ences and tax loss carryforwards. (Alternatively, taxeffect of cumulative timing differences where expenseis recognised earlier (and revenue later) in books thanin tax return.)
Deferred tax liability. Amount of income taxes payablein the future as a result of taxable temporary differ-ences. (Alternatively, tax effect of cumulative timingdifferences where expense is recognised later (and rev-enue earlier) in books than in tax return.)
Defined benefit (DB) plan. Pension (or other retirementbenefits) plan in which benefits are specified but con-tributions are not. Plan may be funded or unfunded.
Defined contribution (DC) plan. Funded pension (orother retirement benefits) plan in which contribu-tions are specified but benefits are not. Benefits arefunction of amount of contributions and fund’sinvestment performance.
Depletion. Using up of exhaustible natural resource.Depreciable amount. Cost less estimated residual value.Depreciation. Allocation of cost (or depreciable amount)
of tangible fixed asset over its expected useful life in asystematic way. See also Amortisation.
Derivative financial instrument. See Financial instrument.
Dilutive security. Security which is expected to result in increase in ordinary shares outstanding relative toearnings in the future, thereby reducing reportedearnings per share. In-the-money employee share optionis dilutive; convertible security is potentially dilutive.See also Earnings per share.
Direct costing. See Variable costing.Direct financing lease. Finance lease in which lessor
acquires asset and leases it to lessee. Lessor is usually afinancial institution and lease is alternative to loanfinance.
Discount (on bonds). Excess of maturity value of debtsecurities (or investment in them) over price at date ofissuance (or purchase).
Discrete approach. Approach to preparation of interimaccounts. Each interim period is considered a separ-ate accounting period. Firm applies same accountingprinciples in both interim and annual accounts. (Cf.Integral approach.)
Dividend. Distribution to firm’s shareholders – usually,from its profits and in cash.
Dividend cover. Earnings per share divided by cash dividend per share.
Dividend method. See Cost method.
698 GLOSSARY
CFA_Z01.qxd 11/6/03 3:30 PM Page 698

Draft. See Bill of exchange.Dual reporting. See Separate reporting.
Earnings. See Result.Earnings per share (EPS). Net profit attributable to
ordinary shareholders, divided by weighted averageordinary shares outstanding in the period. Firms maypublish two types of EPS:
– Basic EPS. EPS calculation as above. No adjustment ismade for dilutive securities.
– Diluted EPS. Hypothetical earnings per share. Profit andshares outstanding are adjusted for effect of dilutivesecurities.
Earnings yield. Earnings per share divided by end-period market price of ordinary share. Reciprocal ofprice–earnings ratio.
Ebit/Ebitda. Earnings before interest and tax (Ebit) and depreciation and amortisation (Ebitda). Earningsfigures used in measuring corporate financial perform-ance. Ebitda is popular where net profit is corruptedas a performance measure by effect of different taxsystems and accounting rules across countries.
Economic value added. Operating profit less capital charge.Capital charge is product of weighted average cost ofcapital and invested capital (i.e. debt and equity capital).Operating profit and invested capital are adjusted toremove effects of conservative accounting rules. EVA isalternative performance indicator to return on assets.
Effective rate (of interest). See Yield to maturity.Effective tax rate. Income tax expense divided by before-
tax profit. A measure of the current and future taxburden on that profit.
Employee share option (ESO). Right to buy employer-firm’s shares at predetermined price during specifiedfuture period. Right is earned after completion of service period (fixed ESO) or once performance goalsare met (performance-based ESO).
Equity. Claim (of owner or creditor) on assets of firm(e.g. equities = assets). The term is often restricted to owners’ claims only (e.g. equity capital, equityinvestments).
Equity accounting/equity method. Method of account-ing for certain equity investments (in particular, associates in consolidated accounts). Investor firmrecords its share of (‘equity in’) investee’s profit orloss in its income statement. The carrying amount of the investment in its books approximates its shareof investee’s net assets. (Cf. Cost method, Fair valuemethod, LOCOM method.)
ESOP. Employee share ownership plan. Company sets up (and finances) trust that buys its shares. Trust allocates shares to employees but holds them until
employees qualify for them (e.g. after service period,on retirement, etc.).
Exchange difference. General term for foreign currencyexchange gain/loss. See Transaction gain/loss, Trans-lation gain/loss and Translation adjustment.
Exercise price. Price at which holder of option or warrant can buy firm’s shares.
Expenditure. Outlay of cash.Expense. Cost associated with generation of revenue in
a period. Cost can arise from consumption of asset orincurrence of liability.
Extraordinary. (1) General meaning: income, expense,gain or loss from event which is not part of firm’sordinary activities. (2) Technical meaning (accordingto international accounting standards): as in (1) but,in addition, the underlying event is unusual in natureand not expected to recur (e.g. flood in Sahara).
Face value. See Nominal value.Factoring (of receivables). Transfer by firm of part/all
of its receivables to outside party (‘factor’) for cash.Factor may have recourse to firm (i.e. be compensatedby firm) if receivables are not collectible.
Fair value. General term indicating price of asset or liability today. Price may be determined by referenceto market value, replacement value or present value(of expected future cash flows).
Fair value hedge. Transaction in which a company useshedging instrument (e.g. commodity futures con-tract) to protect itself against changes in fair value ofhedged item (e.g. stocks of commodity). Unrealisedgains/losses on hedging instrument are recognised inincome as they arise. (Cf. Cash flow hedge, Net invest-ment hedge.)
Fair value method. Method of accounting for invest-ments. Investment is carried at market value or at acurrent valuation. Unrealised gains and losses arerecognised as they arise – in income statement or asseparate item in shareholders’ equity. (Cf. Costmethod, Equity method, LOCOM method.)
FIFO. ‘First in, first out’. Assumption about the flow of production or merchandise costs under historicalcost accounting when prices change. The earliest costsare assigned to products sold; the most recent areassigned to ending inventory. (Cf. LIFO, WAC.)
Final salary plan. Pension plan in which benefits arelinked to employee’s pre-retirement salary. See Definedbenefit plan.
Finance lease. Lease which is, in substance, the purchaseof an asset with debt.
Financial fixed asset. Long-term investment (in debt orequity securities) or long-term loan/receivable.
GLOSSARY 699
CFA_Z01.qxd 11/6/03 3:30 PM Page 699

Financial instrument. Any contract that gives rise to afinancial asset for one party and a financial liability or equity instrument for another. Financial instru-ments are ‘primary’ (e.g. account receivable/payable;financial investment/share capital) or ‘derivative’ (e.g.financial option, interest rate swap) – in which part of financial risk attached to primary instrument istransferred.
Financing cash flow. Net amount of cash in/outflows onfinancing activities. These include issuance of debtand equity capital, their repurchase or retirement,dividends and, in some cases, interest paid. (Interestpaid may be shown as operating outflow.)
Finished goods (inventory). Products completed butnot yet sold.
Fixed asset. Asset used on a continuing basis to support firm’s business.
Fixed charge coverage ratio. Profit before interest andtax expense divided by interest and other scheduledfinancial payments in a period. A more severe test ofincome leverage than times interest earned.
Flow-through method. Method of accounting for taxcredit. Entire tax credit is deducted from income taxexpense in period it is received. (Cf. Deferral method.)
Free cash flow. Operating cash flow less capital expendi-tures. Cash flow measure used in corporate valuationsand risk assessment.
Full consolidation. See Global consolidation.Full cost accounting. Method of accounting for explora-
tion costs in oil and gas industry. All exploration costs – of dry as well as oil-producing wells – withinhydrocarbon-producing area are capitalised. Costs areamortised, on production basis, over expected lives ofoil-producing wells. (Cf. Successful efforts accounting.)
Full deferred tax accounting. Dominant approach todeferred tax accounting. Firm recognises tax effect of all timing or temporary differences.
Functional currency. Currency which dominates foreignentity’s operations. If the local currency, entity isautonomous and closing rate method (of translation)is used. If the parent company’s currency, entity issatellite of parent and temporal method is used.
Funded plan. Pension (or other retirement benefits) planin which employer (and, if contributory, employees)make periodic contributions to entity separate from firm.Entity is responsible for investment of contributionsand payment of pensions (or other retirement benefits).
Funds flow statement. Statement explaining the changein firm’s working capital in a period.
Funds from operations. Profit/loss for the periodadjusted for revenues and expenses that do not involveworking capital.
Gain. Increase in net assets as a result of (1) transactionwhich is not part of firm’s normal activities (gain ondisposal of fixed asset); (2) transaction which is non-reciprocal in nature (windfall gain); or (3) upward(downward) adjustment to carrying amount of asset(liability) (holding gain).
Gearing. See Leverage.General ledger. Collection of all ledger accounts.Global consolidation. Combination of 100% of sub-
sidiary’s assets and liabilities, revenues and expenses,with those of the parent company, even when latterowns less than 100% of subsidiary’s share capital. Seealso Minority interest.
Going concern assumption. Fundamental accountingprinciple. Assumption that firm will be able to con-tinue trading, without threat to its existence, for theforeseeable future.
Goodwill. Excess of purchase price over fair value of thenet assets of a business or company acquired. Shownas intangible asset if capitalised. Where fair value ofnet assets required exceeds purchase price, differenceis known as ‘negative goodwill’.
Gross margin ratio. Gross profit as percentage of salesrevenue.
Gross profit. Excess of sales revenue over cost of sales.
Hedge accounting. Method of accounting for financialassets and liabilities. Asset or liability designated ashedging instrument is accounted for in same way asitem being hedged (‘hedged item’).
Held-for-trading investment. Investment in debt orequity securities that investor company holds forspeculative or trading reasons. Investment is carried at fair value and unrealised holding gains/losses arerecognised in income as they arise. (Cf. Available-for-sale investment, Held-to-maturity investment.)
Held-to-maturity investment. Investment in debt securities that investor company intends to hold tomaturity. Investment is carried at amortised cost. (Cf. Available-for-sale investment, Held-for-tradinginvestment.)
Historical cost. Cost of purchasing or producing an asset. The cash received when a liability is incurred.
Holding gain/loss. Difference between fair value andcarrying amount of asset (or liability).
Hybrid security. See Compound instrument.
Impairment. Fall in recoverable amount of fixed assetbelow its carrying amount.
Income. See (1) Result (e.g. net income for the year) and(2) Revenue (e.g. interest revenue).
700 GLOSSARY
CFA_Z01.qxd 11/6/03 3:30 PM Page 700

Income statement. Statement showing firm’s accom-plishments (increases in net assets) and related efforts(decreases in net assets) from operating and incidentalactivities.
Increasing-charge method. Depreciation charge increaseseach period in a systematic way. See Annuity method.
Instalment method. Method of revenue recognition.Revenue (and related expenses) are recognised on aproportionate basis as the customer pays each instal-ment of the contract amount.
Instalment sale. Sale where title to good passes on delivery but payment is by scheduled instalment.
Intangible asset. Non-monetary fixed asset withoutphysical substance and whose existence is, in mostcases, evidenced by contract (e.g. purchased patent,trademark, licence). See also Goodwill.
Integral approach. Approach to preparation of interimaccounts. Fundamental accounting period is the year;each interim period is a sub-part of it. Annual rev-enues and expenses are allocated to interim periodswithin year. (Cf. Discrete approach.)
Interest cover. See Times interest earned.Interest method. Method of amortising debt discount/
premium arising at issuance (or purchase). Interestexpense (income) is a constant percentage of start-of-period carrying amount of debt (investment in debtsecurities). Difference between interest expense(income) and interest paid (received) in period isamortised discount/premium.
Interim report. Financial report issued by publicly quotedcompany within its financial year – sometimes quarterly,most commonly in Europe half-yearly. Report containscondensed accounts – and management review of firm’sactivities – for interim period and year to date.
Interperiod tax allocation. See Deferred tax accounting.Intrinsic value (of option). Excess of market price of
share over exercise price of option on that share.Inventory. For retailer/wholesaler, it comprises goods
awaiting sale and supplies. For manufacturer, it com-prises, in addition, raw materials and – this applies tosome service providers too – products in the course ofproduction. Advance payments to suppliers (‘paymentson account’) are also included in this asset category.
Inventory profit/loss. See Realised holding gain/loss.Inventory turnover. Cost of sales (or sales revenue)
divided by average inventory in the period. It measuresthe speed with which a firm converts inputs into output– or, in the case of a retailer, merchandise purchasesinto sales.
Investing cash flow. Net amount of cash in/outflows on investing activities. These include the purchase and disposal of tangible, intangible and financial fixed
assets, and dividends and interest received. (Divid-ends and interest received may be shown as operatinginflows.)
Journal. Document in which all transactions arerecorded initially – and in chronological order.
Ledger account. Summary record of all the accountingtransactions and events affecting a particular categoryof asset, liability or shareholders’ equity.
Legal reserve. Reserve to which firm transfers, by law,specified percentage of annual profits until minimumrequired level is reached.
Leverage. Ratio of fixed operating costs to total operat-ing costs (‘operating leverage’) or of interest-bearingliabilities to shareholder’s equity (‘financial leverage’).Company uses capital-intensive production methodsor debt-intensive financing to lever up returns (andrisk) or owners.
Liability. Obligation of firm arising from past exchange.Settlement involves it transferring resources to outsideparty. Liabilities, in total, are the claims of creditors toa firm’s assets.
Liability method. Method of measuring deferred taxasset/liability. Current tax rate is applied to deductible/taxable temporary differences (or cumulative timingdifferences).
LIFO. ‘Last in, first out’. Assumption about the flow ofproduction or merchandise costs under historical costaccounting when prices change. The earliest costs areassigned to ending inventory; the most recent areassigned to products sold. (Cf. FIFO, WAC.)
Linear depreciation. See Straight-line method.Liquidity. Cash and near-cash resources relative to short-
term liabilities as of a particular date. Liquidity ratios(Cf. current ratio, quick ratio) measure firm’s abilityto pay short-term liabilities when they fall due.
LOCOM (method). ‘Lower of cost or market’. Methodof valuing inventories and financial investments. Assetis stated at the lower of its historical cost or its currentmarket value. In the case of inventories, ‘market’ maybe replacement cost. In the case of investments, ‘market’ may be determined on individual security oraggregate basis (‘portfolio LOCOM’). (Cf. Cost method,Equity method, Fair value method.)
Loss. Decrease in net assets as a result of (1) transactionwhich is not part of firm’s normal activities (loss on disposal of fixed asset); (2) transaction which isnon-reciprocal in nature (loss from fire damage); (3)downward (upward) adjustment to carrying amountof asset (liability) (holding loss). See also (4) Result(e.g. loss for year).
GLOSSARY 701
CFA_Z01.qxd 11/6/03 3:30 PM Page 701

Market value. Cash (or equivalent) expected to bereceived from selling an asset today in an orderly mar-ket. Cash required to settle a liability today.
Marketable securities. Debt and equity securities thatcan be traded in an active market. Usually classified ascurrent asset.
Memorandum account. A summary record of transac-tions or events which have not (yet) been recognisedin the firm’s accounts.
Merchandise inventory. Goods held for resale.Merger accounting. Method of accounting for busi-
ness combination. The merging firms combine assetsand liabilities at existing carrying amounts and revenues and expenses from start of year of merger.(Cf. Acquisition accounting.)
Minority interest. Share of subsidiary’s net assets and of its profit or loss for the year which is attributable to shareholders other than those of parent company.Parent company shareholders have a majority interest;other shareholders have a minority interest.
Monetary asset. Asset where the cash to be received iscontractually fixed.
Monetary liability. Liability where the cash to be paid iscontractually fixed.
Money purchase (pension) plan. See Defined contribu-tion plan.
Net assets. Total assets less total liabilities. Equivalent toshareholders’ equity.
Net book value. Cost less accumulated amortisation/depreciation of intangible/tangible fixed asset.
Net cash flow. The net change in cash and cash equivalentsin the period (i.e. Operating cash flow +/– Investingcash flow +/– Financing cash flow).
Net debt. Interest-bearing liabilities less cash and market-able securities.
Net income. See Net profit.Net investment hedge. Transaction in which a company
uses hedging instrument (e.g. foreign currency loan)to protect itself against the effect of exchange ratechanges on the carrying amount of a foreign invest-ment. Unreaslised gains/losses on hedging instrumentare deferred in equity until company disposes ofinvestment (Cf. Cash flow hedge, Fair value hedge.)
Net profit. After-tax profit (for the period).Net worth. See Net assets.Nominal ledger. See General ledger.Nominal value. Monetary amount assigned to bond or
share when authorised. Amount is stated on bond orshare certificate (hence ‘face value’).
Non-contributory plan. Social security or company-sponsored welfare scheme to which only employermakes cash contributions.
Note payable. Amount owed by firm to supplier underformal written agreement. (Cf. Account payable.)
Note receivable. Amount owed to firm by customer underformal written agreement. (Cf. Account receivable andalso Bill of exchange and Promissory note.)
Off-balance-sheet debt. Debt which is not shown as a liability on the face of the balance sheet. It may bedisclosed in the notes (e.g. financial commitments) or reported elsewhere on the balance sheet (e.g. asequity, asset sale, etc.).
On credit. Delayed payment terms granted by seller ofgoods or services to buyer. Also known as ‘on (open)account’.
One-line consolidation. Effect of accounting for finan-cial investment by equity method. Investor firm showsas one-line entry on balance sheet (income statement)its share of investee’s net assets (profit or loss).
Operating cash flow. Net amount of cash in/outflowsrelating to main revenue-producing activities of firm.Corporate income tax payments (or refunds) aretreated as operating flows or are shown separately.
Operating lease. Any lease other than a finance lease.Lease is treated as a rental transaction for accountingpurposes.
Option price. See Exercise price.Ordinary share. Ownership claim on firm’s assets.
Claim is a residual one, i.e. after claims of creditorshave been met. Ordinary shareholder usually has right to share in management of company (by votingat shareholders’ meetings) and in its earnings (via dividends).
Own shares. Shares bought back by firm and held ‘in treasury’ for later resale.
Own work capitalised. Costs incurred in period whichrelate to production of fixed asset for firm’s own use.Costs are capitalised and, when asset is completed, are amortised over its useful life.
Owners’ equity. See Shareholders’ equity.
Par value. See Nominal value.Partial deferred tax accounting. Minority approach
to deferred tax accounting. Firm recognises tax effect of only those timing/temporary differences that areexpected to crystallise (i.e. result in higher/lower taxbills) in foreseeable future.
Participating interest. Large (and influential) minorityshareholding in another firm. Investor company has‘participating interest’ in investee; investee firm isinvestor’s associate.
Past service cost. Cost of pension benefits granted forpast service by employees when plan is first adoptedor when it is amended.
702 GLOSSARY
CFA_Z01.qxd 11/6/03 3:30 PM Page 702

Payment on account. Advance payment for purchase ofasset (usually, inventory or tangible asset).
Payout ratio. Cash dividend per share as percentage ofearnings per share. Reciprocal of dividend cover.
Percentage-of-completion method. Method of recog-nising revenue from long-term contract. Revenue(and related expenses) are recognised during the termof the contract, based on the percentage of work com-pleted during the period. (Cf. Completed-contractmethod.)
Period cost. Cost which is charged as expense in theperiod in which it is incurred.
Periodic system. System of inventory record-keeping inwhich amounts on hand and consumed in period – andtheir costs – are determined periodically (e.g. wheninventories are counted). (Cf. Perpetual system.)
Permanent difference. Difference between accountingprofit and taxable profit attributable to revenues/expenses not recognised in tax return (e.g. non-deductible expenses, tax-exempt income) or to itemson tax return not recognised in books.
Perpetual system. System of inventory record-keepingin which inventory records are updated continuouslyto yield current information about amounts on handand consumed in period – and about their costs. (Cf.Periodic system.)
Phantom shares. Notional shares awarded to employees– usually of unquoted firms – for meeting performancegoals. Notional share yields dividends and capitalgrowth according to predetermined formula.
Pooling-of-interests method. See Merger accounting.Portfolio LOCOM. See LOCOM.Potential ordinary share. See Dilutive security.Preference share/preferred stock. Ownership claim on
firm’s assets which carries special rights (usually inform of priority over ordinary shareholders in profitdistribution).
Premium (on bonds). Excess of price of debt securities(or investment in them) at date of issuance (or pur-chase) over maturity value.
Prepayment. Asset which is acquired as a result ofadvance payment for good or service.
Present value. Expected future cash flows attributable toasset or liability, discounted to present time.
Price–earnings ratio. End-period market price of ordin-ary share divided by earnings per share (of preceding12 months). Stock market indicator of expected profitgrowth.
Price-to-book ratio. End-period market price of ordin-ary share divided by its end-period book value. Per-share book value is (ordinary) shareholders’ equitydivided by ordinary shares outstanding. Stock marketindicator of expected profit growth.
Prior period adjustment. Adjustment to start-of-period retained profits (a) to correct earlier error, (b)to implement retroactive legislation, or (c) to other-wise restate prior years’ accounts (e.g. for change inaccounting policy).
Prior service cost. See Past service cost.Product cost. Cost which is capitalised in inventory and
not expensed (as cost of sales) until the related productis sold.
Pro forma. Term applied to hypothetical accountingnumbers that are prepared under alternative account-ing policies or that are based on alternative assump-tions about company’s operating activities.
Profit. See (1) Gain, as in ‘profit on disposal of fixedasset’, ‘windfall profit’ and ‘inventory profit’; and (2)Result (e.g. profit for year).
Profit and loss account. UK terms for (1) Income state-ment and (2) Retained profits.
Profit margin (ratio). Profit (operating, before-taxprofit, or net profit) as percentage of sales revenue.
Profit reserve. See Reserve.Projected benefit obligation. Measure of pension plan’s
liability (US). Actuarial present value of vested andnon-vested benefits (computed under required ABVmethod), based on expected future salary levels.
Projected benefit valuation (PBV) method. Actuarialmethod of determining cost of pension (or otherretirement) benefits. Benefits employee will earn dur-ing expected service period with firm are estimatedand the cost is then spread over that period.
Promissory note. Written agreement between seller/lender and purchaser/borrower setting out terms ofpayment. Borrower ‘writes’ note (makes promise topay amount x on day y); lender is beneficiary.
Proportionate consolidation. Method of accountingfor incorporated joint ventures. Investor companyconsolidates its proportionate share of venture’s assetsand liabilities, revenues and expenses.
Pro-rata consolidation. See Proportionate consolidation.Prospective method. Method of accounting for
change in accounting policy. Only accounts of currentand future periods are adjusted for effect of change.(Cf. Cumulative catch-up method, Restatementmethod.)
Provision. (1) Estimated liability (e.g. provision forpension costs). (2) Valuation adjustment to asset (e.g.provision for bad debts). (3) Accrued expense (e.g.provision for repairs and maintenance).
Purchase method. See Acquisition accounting.
Quantity discount. Percentage reduction in listed pricequoted by seller where number of items purchased bybuyer in a period exceeds predetermined level.
GLOSSARY 703
CFA_Z01.qxd 11/6/03 3:30 PM Page 703

Quick ratio. Current assets less inventories, divided bycurrent liabilities. A more severe test of liquidity thanthe current ratio.
Raw materials (inventory). Materials used in produc-tion process and traceable directly to products.
Realisable value. Amount of cash (or equivalent) expectedto be obtained by selling asset today in orderly market.
Realised holding gain/loss. Difference between currentvalue and historical cost of asset (e.g. inventory, plant,investment) sold or consumed in the period. Gain(loss) shows the benefit (cost) of acquiring asset whenthe price was less (more) than the current price, abenefit which the firm captures (‘realises’) throughsale or use. (Term may also be applied to liabilities.)
Receipt. Inflow of cash.Receivables turnover. Revenue from credit sales divided
by average accounts receivable. The ratio measures thespeed with which the firm collects cash from its creditcustomers.
Recoverable amount. Higher of net selling price or valuein use. Value in use is present value of estimated futurecash flows generated by asset (including ultimate disposal). See Impairment.
Reducing-charge method. Method of depreciation. SeeDeclining-balance method.
Registered share. Share whose owner (or nominee) isstated on share certificate. Ownership is only trans-ferred when legal requirements regarding registrationhave been met. (Cf. Bearer share.)
Related party. Two parties are ‘related’ if one is able tocontrol, or exercise significant influence over, theother. Individual (e.g. as shareholder) can be a relatedparty of a company.
Replacement value. Cost today of purchasing or pro-ducing a similar asset. Cash obtained if the same obligation were incurred today.
Reporting currency. Parent company’s currency (i.e.currency in which foreign entity’s accounts areexpressed after translation).
Reserve. Two general meanings: (1) contributed capitalin excess of share capital (as in ‘capital reserve’ orshare premium); (2) appropriated profits – as in‘profit reserves’ or ‘revenue reserves’. These includeearned capital retained in business for legal reasons(e.g. legal reserve, statutory reserve) or economic ones(e.g. retained profits). Term also used in connectionwith: (3) surplus on revaluation of assets (e.g. revalu-ation reserve); and (4) deliberate understatement offirm’s net assets by management (e.g. hidden reserve).Reserves in ‘Capital and reserves’ includes (1), (2) and(3) above. Legal rules determine which reserves are
‘distributable’ and ‘non-distributable’. Term also usedas synonym for ‘provision’ or ‘allowance’ (e.g. reservefor bad debts).
Residual value. Amount recoverable from disposal oftangible or intangible fixed asset at the end of itsexpected useful life.
Restatement method. Method of accounting for change in accounting policy. Prior years’ accounts are restated as if new policy had been applied from the beginning. (Cf. Cumulative catch-up method,Prospective method.)
Restricted reserve. Reserve whose distribution isrestricted under legal rules.
Restricted shares. Shares (or other equity instruments)granted directly to employee or purchasable at deepdiscount – but with vesting restriction. Vesting occursonly after service period has elapsed or performancegoals have been met. Term also applies to shares wherecontract or law restricts sale for specified period.
Result. The firm’s total revenues less expenses – plusgains less losses – for the period. Can also be used to describe a subset of revenues less expenses (e.g.operating result).
Retained earnings. See Retained profits.Retained profits. Profits of current and prior periods
which have been reinvested in the firm and not distributed.
Return on assets. After-tax operating profit as percent-age of average assets. ‘Assets’ may be defined morenarrowly as ‘net operating assets’. The ratio measuresthe success with which managers have used firm’sassets in a period.
Return on equity. Net profit attributable to ordinaryshareholders as percentage of average ordinary share-holders’ equity. The ratio measures the success withwhich managers have used funds provided by firm’sowners in a period.
Revenue. Accomplishments of firm – from operatingactivities (e.g. sales revenue) or financial activities(e.g. interest revenue) – during a period.
Revenue reserve. See Reserve.Reverse share split. Consolidation of shares. New shares
carry higher nominal value than old ones but totalnominal value of share capital is unchanged. (Cf.Share split.)
Rights issue. Issue of shares in which existing share-holders have right to subscribe first to the issue, inproportion to their holdings (and thereby preservetheir proportionate stake in the firm).
Sales allowance. Adjustment to sales revenue for allow-ance against value of future purchases (e.g. vouchers)
704 GLOSSARY
CFA_Z01.qxd 11/6/03 3:30 PM Page 704

which the firm gives to customer who receives faultygoods or services.
Sales return. Adjustment to sales revenue for goodsreturned by customer.
Sales-type lease. Finance lease in which manufacturer/dealer leases asset to customer in place of direct sale.Lessor accounts for lease as asset sale with extendedfinancing.
Salvage value. See Residual value.Scrip dividend. See Share dividend (2).Segment. Distinguishable component of firm’s opera-
tions. Segmentation can be by product or geograph-ical area (in which firm’s products are produced orsold).
Separate reporting. Profit in published accounts is calculated according to accounting methods whichare independent of those used to calculate profit in tax return.
Share. See Ordinary share and Preference share.Share appreciation right. Right to shares or cash, based
on increase in market value of share (or other equityinstrument) over predetermined period.
Share capital. Nominal value of ordinary and prefer-ence shares which firm has issued. Strictly, the term is‘issued share capital’ but prefix is often omitted. Otherprefixes used in conjunction with ‘shares’ or ‘sharecapital’ are:
– authorised – shares which firm is permitted to issueaccording to its statutes;
– subscribed – shares applied for by investors;– called-up – shares for which payment has been
demanded by issuing firm;– outstanding – issued shares held by outside investors.
Those held by firm itself (‘own shares’) are excluded.Share dividend. (1) Non-elective. Issue of free shares to
shareholders, in proportion to their existing holdings,by means of capitalisation of reserves. (2) Elective (oroptional). Profit distribution which shareholder electsto take in form of shares rather than cash.
Share premium. Market value of issued shares at time ofissuance less their nominal value.
Share split. Subdivision of shares. New shares carrylower nominal value than old ones but total nominalvalue of share capital is unchanged.
Shareholders’ equity. Claims of owners to firm’s assets.Claims are residual, i.e. those of creditors take prefer-ence. Comprises share capital and reserves.
Solvency. Assets relative to liabilities as of a particulardate. Solvency ratios (cf. debt–equity ratio, timesinterest earned) measure firm’s ability to service itsshort- and long-term liabilities – or settle them whenthey fall due.
Specific identification. Method of determining costs ofsales and inventory. Each item of inventory is taggedwith its actual cost of purchase or production.
Spread. Difference between the return on a company’s(operating) assets and the cost of debt used to financethem.
Stock. (1) Synonym for Inventory. (2) Debt securities(‘loan stock’). (3) Synonym for Share (‘common stock’).
Stock dividend. See Share dividend.Stockholders’ equity. See Shareholders’ equity.Stockholding gain/loss. Realised holding gain/loss with
respect to inventory.Straight-line method. Method of depreciation of
intangible/tangible fixed assets and of amortisation ofbond discount/premium. Asset’s depreciable amountis allocated evenly over its expected useful life; dis-count or premium is allocated evenly over period tomaturity. Depreciation/amortisation charge is a con-stant amount each period.
Subsidiary. Investee company which the investor firmcontrols, usually as a result of majority (>50%) owner-ship of investee’s voting shares.
Successful efforts accounting. Method of accounting for exploration costs of oil and gas companies. During exploration, all costs are capitalised. Results of exploration are then evaluated. Exploration costs of oil/gas producing wells (‘successful efforts’) are capitalised (and amortised over expected life) whilethose of dry wells are written off. (Cf. Full costaccounting.)
Sum-of-years’-digits (SoYD) method. Method ofdepreciation. Depreciation rate (applied to depreciableamount) is: the remaining number of years of asset’sexpected useful life divided by its SoYD. To calculatethe SoYD, express the asset’s life in digits and thensum them.
Supplies. Materials used in production and supportingactivities (e.g. sales and administration) of the firm. Inthe case of production activities, materials are incid-ental to them and not traceable to products.
Synthetic debt. Debt whose risk characteristics havebeen changed – usually through swap arrangement.
Tangible fixed asset. Fixed asset which has physical substance. Examples are land, buildings, plant andequipment, fixtures and fittings, tools. Advance pay-ments for such assets (payments on account) andbuildings and plant under construction by firm arealso included in this category.
Tax credit. Amount by which taxpayer can directlyreduce tax liability in period as a result of, for example,investment in qualifying plant and equipment, R&D,
GLOSSARY 705
CFA_Z01.qxd 11/6/03 3:30 PM Page 705

job creation. (It is a credit against government’s taxreceivable.)
Taxable profit. Taxable revenues less tax-deductibleexpenses.
Taxable temporary difference. Excess of carryingamount of asset over its tax base. Excess of tax base ofliability over its carrying amount.
Taxes payable accounting. Method of accounting fortaxes on corporate income. Firm recognises only taximpact now of current period’s profit/loss. (Cf.Deferred tax accounting.)
Temporal method. Method of converting accounts of foreign entity (expressed in local currency) intoreporting currency. Monetary assets/liabilities aretranslated at end-period exchange rate; non-monetaryassets/liabilities at exchange rate appropriate to measurement basis used; revenues/expenses at rateprevailing when underlying event took place. Changein exchange rate gives rise to translation gain/loss. (Cf.Closing rate method.)
Temporary difference. Difference between tax base andcarrying amount of asset or liability.
Third party (interest). See Minority interest.Time value (of option). Fair value of option less its
intrinsic value.Times interest earned. Profit before interest and tax
expense divided by interest payments in period. Theratio shows income cover for firm’s debt servicingcosts.
Timing difference. Revenue or expense recognised inbooks and tax return in different periods.
Trade creditors. See Account payable.Trade debtors. See Account receivable.Transaction gain/loss. Effect of change in exchange rate
on unhedged foreign currency receivables and payables.Translation adjustment. Effect, in reporting currency,
of change in exchange rate on net assets of foreignentity (and movement in them) over a period. Takento parent company’s reserves and not recognised inincome until foreign entity is sold.
Translation gain/loss. Effect, in reporting currency, of change in exchange rate on net monetary assets offoreign entity (and movement in them) over a period.Recognised in parent company’s income immediately.
Treasury stock. See Own shares.Treasury stock method. Method of calculating effect of
options/warrants on diluted earnings per share. Firmassumes cash received on exercise of share options orwarrants is used to buy back its own shares.
Trial balance. Listing of debit and credit balances inledger accounts at end of financial period to checkthat balance totals agree.
Turnover. (1) Revenues from all operating activities(UK term). (2) Measure of intensity of asset use.
Unfunded plan. Defined benefit plan in which employermakes provision (or ‘book reserve’) for cost of pen-sion (or other retirement) benefits but does not con-tribute cash to separate fund to meet future liabilities.
Uniform reporting. Profit in published accounts is calculated according to same accounting methods asthose used in the calculation of profit in tax return.
Units-of-production method. Method of depreciationbased on output or usage. Depreciation rate (appliedto depreciable amount) is: output (or usage) of assetin the period divided by the total expected output (orusage) over its useful life.
Unrealised holding gain/loss. Difference between cur-rent value and historical cost of assets (e.g. inventory,plant, investment) held by firm at balance sheet date.Gain (loss) shows the benefit (cost) of acquiring assetwhen the price was less (more) than the current price.
Valuation allowance. Adjustment to reduce carryingamount of asset (e.g. inventory, investments, deferredtax) to amount that management consider is recover-able in future years.
Variable costing. Minority method of costing inventoryin firm’s published accounts. End-period work inprogress and finished goods are measured at variableproduction cost. Fixed production costs are treated asperiod costs.
Vested. Attached to. Right to retirement benefits (pension) or shares (e.g. employee share options) isnot conditional on continued service with the firm or job performance.
WAC. ‘Weighted average cost’. Assumption about theflow of production or merchandise costs under historical cost accounting when prices change. Goods sold and in inventory are costed at weightedaverage cost per unit. Unit WAC is total cost of unitsavailable for use or sale divided by their number. (Cf. FIFO, LIFO.)
Warrant. Long-term call option. Right to buy specifiednumber of shares at predetermined price in futureperiod.
Work-in-progress (inventory). Products in course ofmanufacture or processing.
Working capital. Current assets less current liabilities.
Yield to maturity. Discount rate which equates presentvalue of future payments under debt agreement todebt’s current market value (current yield) or marketvalue at date of issuance (historical yield).
706 GLOSSARY
CFA_Z01.qxd 11/6/03 3:30 PM Page 706

You may wish to study in more depth topics we discuss inthe book. The following are English-language referencesthat could be useful to you. Check that the edition you useis the latest. Changes to accounting and reporting rules, atboth the national and international levels, are frequent. Theedition cited is the most recent one known to the author.
International accounting standardsl International Accounting Standards Board, Inter-
national Accounting Standards, London: IASB. (Thiscontains the text of all approved IAS and, since 2002,International Financial Reporting Standards (IFRS) aswell as interpretations of IAS and IFRS. It’s updatedyearly. Information about proposed new and amendedstandards can be found on the IASB’s website,www.iasb.org.uk).
l Epstein, B.J. and Mirza, A.A. (2003), IAS 2003: Inter-pretation and Application of International AccountingStandards, New York: John Wiley. (This explains andillustrates IAS and IFRS in considerable detail. Again,it’s updated yearly.)
The major international accounting firms provide up-to-date information about the IASB’s activities andIAS-related publications on their websites. DeloitteTouche Tohmatsu has a dedicated site for this purpose(www.iasplus.com).
Accounting and reporting practices inindividual countriesThere are a number of reference books in this area. Twowith worldwide coverage are:
l Ordelheide, D. and KPMG (eds) (2001), TransnationalAccounting (3 vols), 2nd edition, Basingstoke/NewYork: Palgrave. (Fourteen EU countries, Argentina,Australia, Canada, Japan and the USA are covered.There are separate chapters on individual companyaccounts and group accounts for each country.)
l Orsini, L.L., Gould, J.D., McAllister, J.P. and Parikh,R.N. (eds), World Accounting (3 vols), New York:Matthew Bender & Co. (Loose-leaf reference guide – with regular updates. Broader coverage than
Ordelheide. There are chapters on the larger emer-ging economies (Brazil, China, India and Mexico) andthe four ‘Asian tigers’ (Hong Kong, Singapore, SouthKorea and Taiwan). Each country chapter contains asection on auditing as well as accounting practices.)
Some accounting guides have a regional focus. One thatdeals with national practices in Europe is:
l Alexander, D. and Archer, S. (eds) (2001), EuropeanAccounting Guide, 4th edition, New York: Aspen Law& Business. (The guide has separate chapters on almostall European countries. It is particularly strong oncentral and eastern Europe, with individual chapters onthe Baltic States, Belarus, the Czech Republic, Hungary,Poland and the Russian Federation. Each chapter con-tains specimen financial statements taken from thepublished accounts of a company in that country.)
Some books combine country studies with comparat-ive analysis of accounting practices. One widely citedexample is:
l Nobes, C.W. and Parker, R.H. (eds) (2002), Com-parative International Accounting, 7th edition, London:FT/Prentice Hall. (As with other accounting guides,there are separate chapters on accounting practices in particular countries, e.g. France, Germany, Japan,the USA. In addition, there are chapters on specifictopics such as consolidation, liabilities, and foreigncurrency translation in which intercountry differencesin these areas are examined.)
Because of the growing importance of internationalaccounting standards, there is an increasing amount ofpublished material that compares the accounting andreporting practices in a particular country with those laiddown by IAS. An alternative approach – adopted by IFAD– is to focus on where national rules differ from IAS.
l International Forum on Accountancy Development(2002), GAAP 2001: A Survey of National AccountingRules in 53 Countries, available at the IFAD website(www.ifad.net). (This contains an overview of differ-ences between national written rules and IAS in 80 keyareas of accounting and is effective as of end-2001.)
Suggestions for further reading
CFA_Z02.qxd 11/6/03 3:31 PM Page 707

Remember that an important audience for these guidesare client firms that plan to set up or have already set upoperations abroad.
TaxThe International Bureau of Fiscal Documentation produces loose-leaf taxation guides which contain moredetailed information about national tax regimes than thatavailable in the above ‘business guides’. These guidescover the various regions of the world e.g. Europe, Asia-Pacific, Africa, and are regularly updated. Their ‘Guidesto European Taxation’ series consists of six volumes.One of them is devoted to corporate tax:
l International Bureau of Fiscal Documentation,Guides to European Taxation. Vol. II: The Taxation ofCompanies in Europe, Amsterdam: IBFD.
Financial statement analysis The following books are widely used in courses onfinancial statement analysis. Not surprisingly, the firstthree have a US slant.
l Palepu, K., Healy, P. and Bernard, V. (2000), BusinessAnalysis and Valuation, 2nd edition, Cincinnati:Southwestern.
l Penman, S.H. (2001), Financial Statement Analysisand Security Valuation, New York: McGraw-Hill.
l Stickney, C.P. and Brown, P.R. (1999), FinancialReporting and Statement Analysis, 4th edition, FortWorth, TX: Dryden Press.
l Walton, P. (2000), Financial Statement Analysis: AnInternational Perspective, London: Thomson LearningBusiness Press.
Journals such as the Financial Analysts’ Journal(published bimonthly by the Association for InvestmentManagement and Research) and the Journal of AppliedCorporate Finance (published quarterly by Stern StewartManagement Services) often contain articles whichsummarise recent academic research of interest to pro-fessional people working in the finance area.
708 SUGGESTIONS FOR FURTHER READING
The above books and websites contain summaries of accounting and reporting requirements in indi-vidual countries. To gain a fuller understanding of these requirements, the original pronouncements ofregulatory agencies in each country – and if neces-sary, independent commentaries on them – should beconsulted.
Consider, for example, US accounting and reportingrequirements. The Financial Accounting StandardsBoard (www.fasb.org) publishes a ‘Current text’ of itsaccounting standards (and technical bulletins) which isupdated yearly. Companies that issue securities to the USpublic or are listed on a US stock exchange must observethe filing requirements of the Securities and ExchangeCommission (www.sec.gov) which are contained in its‘Regulations S–X’.
Information about EU directives and regulations can be found on the European Commission’s website(www.europa.eu.int). Navigating this website can be a daunting experience. The FEE’s website (www.fee.be)provides easier access to EU accounting-related docu-ments. The FEE (Fédération des Experts ComptablesEuropéens) is a ‘representative organisation for theaccountancy profession in Europe’ and serves some 41professional bodies in 29 countries.
Business guidesAs noted in the text, a country’s accounting and report-ing practices are shaped by many forces. Among themare its legal system, tax code and the ownership struc-ture of its firms. Useful sources of information on acountry’s business environment are the business guides(Doing Business In . . . ) published by certain internationalaccounting and law firms. Their names and websites arelisted below:
l BDO International (www.intax.co.uk)l HLB International (www.hlbi.com)l Lex Mundi (a worldwide organisation of independ-
ent law firms) (see www.hg.org)l PricewaterhouseCoopers (www.pwcglobal.com)
CFA_Z02.qxd 11/6/03 3:31 PM Page 708

ABB 362abnormal returns 632ABS (asset-backed securities) 292absence compensation 494absorption costing 235, 238–42, 260–2accelerated methods of depreciation 200–2,
204–5, 222account format for balance sheet 125–6, 127accountants 166, 167, 168
associations 166, 168accounting 2
governments and 5–6, 66, 83–4, 165–6importance 8, 9international differences and universal
features 164–9pervasiveness 8quality 679see also following entries
accounting entities see under entitiesaccounting fallacies 7–8, 28–9, 46–8, 113–14,
131accounting manipulation see manipulationaccounting policies and methods 132–3,
136n5, 164–9, 183alignment of in groups 431and cash flow analysis 574changes in 652–7, 679and comparability 221–2historical and cultural background 164–8intercompany differences 657–60international differences 164–8, 661–2
accounting principles/conceptual framework91, 169–72, 177, 183, 184
departures allowed 169see also accruals concept and US GAAP
accounting rates of return 147accounting records see record-keepingaccounting standards, costs of 9, 513–14Accounting Standards Board (UK) 125, 514accounting systems 2, 70–1, 72+n2, 80–3accounts
A, L and OE see ledger accountscash-based 93charts of 65–6contra see contra accountsconventions used in examples 10definitions 3estimates in see estimatesinterim see interim reportinginventory 240, 249, 287–8ledger see ledger accounts
aid, government see government grants/incentives
Alexander, D. 169n5Allied Lyons 630allowance method for bad debts 280–1,
282–3, 284Altman, E. 621n14amendments see adjustmentsAmerica see USAAmir, E. 218–19amortisation 199, 212, 218–19
of actuarial gains/losses 501, 505, 508, 509
of bond discount/premium 322–6, 329of goodwill 215, 219, 436, 440, 441international differences concerning 575of leased assets 331+n19, 334see also depreciation
analysis of financial statements see underfinancial statements
Andersen, Arthur 674, 678‘Anglo-Saxon’ and ‘continental European’
traditions 164–8, 675Anheuser-Busch 626, 627annual accounts 3–4, 123, 125
EU and 150suggestions for extensions to 131users of see userssee also balance sheet(s), financial
statements, income statement(s) andnotes to accounts
annual report 5, 6, 123–5annuity factors 189approval, sales on 272arbitrage 632, 633, 634Archer, S. 169n5Arthur Andersen 674, 678asset accounts 66–7
see also ledger accountsasset-backed securities (ABS) 292assets 14–16, 29, 65, 171, 172, 339
acquisitions 441average age and life 220–1bankruptcy prediction and 621biological 253comparing 610–11contingent 312n3current 23–4employees and 15, 29expiry 94, 95–6fixed 22, 24, 196–222, 575
objectives 6profit and loss see income statement(s)see also annual accounts
accounts payable (trade payables) 24accounts receivable (trade receivables) 23
see also receivablesaccrual adjustments 80, 90, 94–7accruals 140, 575, 577, 578accruals concept and accrual basis of
accounting 91–4, 169–70, 574, 672and estimates 132and forecasting 93+n3and pension costs 496and prudence 169
accrued benefit valuation 500, 508accrued expenses 24accrued income 23accuracy 7–8, 136
see also estimatesacid test ratio (quick ratio) 618–19acquisition accounting see consolidation
accountingacquisitions see takeoversactivity-based cash flow statement 139–40actuarial gains/losses 500, 501, 505, 508, 509,
515actuarial method see interest methodadditional paid-in capital see share premiumadjustments
accrual 80, 90, 94–7to asset/liability values 110for comparability purposes 221, 341,
610–12, 657–62currency translation 472–4, 479concerning depreciation estimates
205–7+n9for errors 98–9fair value 415inventory valuation 249, 250–3to pension plans 500, 501prospective 654, 656tax code 531translation 474+n8see also restatement
advertising 212–13, 216, 604, 606affiliates 396
see also subsidiariesAFS investments 400–1, 404, 405, 406, 415,
544ageing analysis 281–2agriculture 253, 272, 276
Index
Note: The problem assignments are not indexed; nor is the glossary, which should be used in conjunction with this index. See also the list of abbre-viations on pp. xiv–xvi.
CFA_Z03.qxd 11/6/03 3:32 PM Page 709

assets (continued)franchises and 170goodwill and 16, 436–9government accounting and 93impairments 208–10intangible 24, 177, 196, 211–19international accounting differences
concerning 575, 660investments and 619leases and 15ledger accounts and 76liquidity 619net 39, 53recognition of 171, 172–3, 397repairs and improvements to 205resources and 15–16, 615retirement of 205–7sale of 50, 315share dividends and 368‘soft’ 173tangible 24, 196, 197–211tax and 543transfers of 315–16turnover see assets turnover ratiosuseful life 199, 212, 213values/valuation of 28–9, 50, 110, 166, 170,
207–11see also depreciation
assets–liabilities ratio 339assets turnover ratios 52–3, 54, 220, 235,
258–9, 614assignment 290associates 396, 425
see also equity accountingAT&T 442audit committees 578auditing 2, 123, 135–7, 674, 675
of cash flow statement 137of interim financial statements 670internal 2
autonomous foreign units 472–4, 477
Bacardi-Martini 216backlog depreciation 207n9bad debts 277, 280–4
tax and 531, 542see also doubtful debts
balance sheet(s) 3, 4, 7, 14–26, 109, 396–7abridged 137comparisons of 610–11continuous/permanent nature 17, 21, 99double entry and 70formats/presentation 21–6, 125–7income statements and 38–9individuals’ 28interpreting 26–9lease capitalisation and 333ledgers and 67liabilities on 335–6limitations 28–9long-term contract revenue recognition
methods and 287–9proposed reforms and new types 29, 30transactions and 17–21, 39, 40–5using to construct cash flow statements
579–83
balance sheet approach to deferred taxaccounting 539, 544
balance sheet equation 15, 17, 339n27balance sheet view of provisions 312–13, 314Ball, R. 661–2bankruptcy 17, 280, 341, 621banks 92, 315, 359, 408, 415, 416, 466, 570n1Barclay, M.J. 318n13Barco 126–7bargaining power 605, 607barriers to entry 604, 608n5, 614barter see swapsBarth, M. 416Basu, S. 661‘bath, taking a’ 209bearer shares 359n3, 364Beaver, W. 416, 479benchmarks 608, 651benefit valuation methods 500, 508benefits, employee 491–520Benetton 663–5+n13Benston, G. 572n3Berle, Adolf 362Bernard, V.L. 416beta 629–30between-statement errors 98BG 336–8bias 7‘bill and hold’ practices 300billions 10bills of exchange (drafts) 277, 293–4+n15Black–Scholes option-pricing model 511, 512BMW 314+n6, 379–81, 555, 556–7boards, management/supervisory see
corporate governanceBonbright, J.C. 175n10bonds 319–29
convertible see convertible securitiesbonus issues see share dividendsbonus plans 498book of balances 84book value per share 382bookkeeping 2borrowing see debtborrowing cost, net 616Bosch 257–8bottom line 114, 131, 137, 222
of cash flow statement 591BP 471n5branches, foreign see foreign operationsbrands 215–16, 219, 606, 607
see also trademarksbreak-even 340brewing industry 605–12, 621–2Britain see UKBritish English and terminology 147–8buildings 211
see also propertyBurberry’s 363business environment 604–7business segmentation see segmental
reportingbusiness strategy 371–2, 395businesses
forms of organisation 358–9+n1, 362n9see also companies
buyers (customers) 604, 605buyouts, leveraged 574
Cairns, D. 185n13call provisions 319‘called-up’, meaning of 360capex 571, 590–1capital 25, 177–8, 318, 339
additional paid-in see share premiumcost of 603, 629free movement of 363maintenance of 171, 177–83manipulation and 672physical 178working 27, 137n7see also equity
capital gains, tax and 554capital-intensiveness 615capital restructuring 370capitalisation 197–9, 216–18, 238–9, 679
accounting policy differences 221, 222changes in policy 222of commitments 317of development costs 214, 216, 218of goodwill 214–15, 436–9, 440of improvements to assets 205of leases see finance leasesand prediction of bankruptcy 621of share premium 364
capitalisation issues 367, 368, 370see also share dividends
CAPM (capital asset pricing model) 629n17Carlsberg 603, 605–12, 621–31, 634–8, 650,
667ownership structure 607, 608
Carlsberg Breweries 608, 625Carrefour 133+n4carry-forward and carry-back 534, 548–9,
554carrying amounts (net book value) 199,
203n5, 543cash 15, 24, 137, 395n1
dividends and 113management of 395, 591sources of 571surplus 395, 571
cash-based accounts 93cash basis of accounting for pension costs
496cash books 81, 82cash burn 573cash call interval 573cash discounts see discountscash earnings 221, 573, 574–5cash flow(s) 6
accruals and 140, 142, 574and comparison 660–2cost-flow assumptions and 247–8, 254and debt 318and debt ratios 339depreciation methods and 203–4and forecasting 93+n3free 145+n9, 574, 591leases and 330, 333long-term contract revenue recognition
methods and 288
710 INDEX
CFA_Z03.qxd 11/6/03 3:32 PM Page 710

cash flow(s) (continued)manipulation and 672net available 574operating see operating cash flowprofit/loss and 46–8tax and 552timing 189–90see also cash flow statement(s) and
operating cash flowcash flow forecasting 573–4, 576–7cash flow hedges 412cash flow per share 575cash flow profiles 576–7cash flow ratios 572–3, 574–6cash flow statement(s) 4, 48, 137–46, 570–92
analysis of 144–6, 571–8auditing of 137bottom line 591constructing from balance sheet and
income statement data 579–83format/presentation 570–1, 583–91income statements and 46–8international differences 585, 591
catch-up, cumulative 654–6, 657+n5categorisation see classificationCBI 514CC (completed-contract) method of revenue
recognition 285–90changes
in accounting methods 652–7, 679in operating activities 651–2see also adjustments and restructuring
‘channel stuffing’ 300charitable donations 531charitable organisations 4, 37charts of accounts 65–6checks 71–2cheques 293n15Choi, F. 662n11CIP (contract-in-progress) accounts 287–8Cisco Systems 83+n5, 668–9+n17Citigroup 513classical system (tax) 533–4classification systems 50, 128–31, 255–8, 611
see also geographical classification andsegmental reporting
clean surplus see comprehensive incomecliff vesting 510closing rate method of currency translation
472–4, 479Coca-Cola 608n7, 623Coca-Cola Nordic Beverages 608n7, 623code law see legal systemscoding systems see charts of accountsCOGAFS (cost of goods available for sale)
246Collins, D. 663n12commitment(s) 134, 316–17, 342, 497,
573–4capitalisation of 317obligations and 311, 316
commodity futures contracts 408, 409, 412common law see legal systemscommon-sizing 610–12common stockholders see ordinary
shareholders
communication 83, 122companies
as brands 215governance structures, and accounting
practices 578listed 400organisation, internal, and segmental
reporting 666ownership structures 165–6, 607, 610public 4–6+n1, 150, 359+n2related parties 134, 450resource flow cycle 2–3, 4size 136+n6stock 4treated as partnerships 530n2types 4–5+n1, 150, 358–9+nn1–2valuation of 382–3, 415, 553, 575–6+n6see also entities
company law 150, 164national differences 164, 165–6see also European Union company law
directivescompany lifecycle 576comparability 7, 172, 557, 650
accounting policies and 133, 221–2, 339,340, 575, 610–11, 650, 657–62
change and 451, 650common-sizing and 610–12employee numbers 519
compensation, employee 491–520share-based 498, 509–14, 515–17
competition 604, 614completed-contract method of revenue
recognition 285–90completeness 172n9compliance issues 185compound financial instruments 374–7, 384,
397compounding 187comprehensive income 131, 379, 383comprehensiveness 7computers 65, 70–1, 72+n2, 83Confederation of British Industry 514conservatism 660, 661–2, 6879consignment 272consistency 28, 169, 652consolidation/consolidated accounts 22,
48–9, 164, 166, 316, 431, 439–40,444+n17
debt and 315global 431minority interests and 441–4one-line 451–2overaggregation 650, 663problems of, and supplementary
disclosures 451proportionate (pro-rata) 446–7tax and 549–50see also segmental reporting
consolidation accounting 431–44disclosures concerning policy 449–50purchase method 431–41
consolidation of shares 369constant purchasing power 178, 179–82, 477‘continental European’ and ‘Anglo-Saxon’
traditions 164–8, 675
contingencies 134, 342contingent liabilities/assets 312+n3, 336contra accounts/contra approach 110–11,
249, 281, 282contract-in-progress accounts 287–8contracting-out 519contracts 8
cost-plus 285fixed-price 285long-term 92, 274, 275, 285–90
contribution 268control 4, 316, 362, 363, 395, 396, 425, 431
in different forms of business organisation358–9, 362n9
evidence of 439record-keeping and 83–4see also influence
conventions 10conversion options 319convertible securities 146, 374–7, 397, 683copyright 212corporate governance 134, 361n7, 578,
674–5, 678corporate governance statement 134–5corporate law see company lawcorporate restructuring see restructuringcorporations 359
see also public companiescorrections see adjustmentscorridor treatment of actuarial gains/losses
505, 508, 515cost(s)
of accounting standards 513–14of accounting systems 72n2, 81, 83, 92of capital 603, 629capitalisation of see capitalisationcurrency conversion 467current 173–4, 175debt issuance 326–7direct 260n10employment see employment costsof equity capital 52+n1of financial investments 397+n3financing 197–9of formation 172of goods sold 246, 249, 255inclusive 197of information 7, 92, 250, 585period 239product 239of record-keeping systems 237, 254of sales 50selling, distribution and administrative
239n2set-up 197, 221of takeovers 440transaction see transaction costsvaluing of financial investments at 397,
398–9, 408, 416see also absorption costing, expenses,
historical cost, replacement cost andvariable costing
cost-flow assumptions 243–55, 259international differences 253–4
cost method of accounting for investments397, 400, 429, 430
INDEX 711
CFA_Z03.qxd 11/6/03 3:32 PM Page 711

cost-plus contracts 285coupon rate 319‘Cr.’, meaning of 68+n1creative accounting see manipulation‘credit’, meaning of in accounting 68+n1credit/credit sales 271, 276–7, 295–7
management of 277, 301periods 276–7, 295–7, 299–301and receivables 299–301terms 276–7see also receivables
credit cards 277credit risk 297, 572creditors 28, 336, 617, 675
rights 341+n29secured 675
Criado-Perez, C. 219n18cross-border ventures 150cross-section analysis 608, 610–12cross-shareholdings 362, 363Crossland, David 678cumulative catch-up 654–6, 657+n5currency/currencies 10, 465–84, 590
conversion costs 467functional 466hedges concerning see hedgingreporting 471
current/long-term distinction 396current assets 23–4current cost 173–4, 175
see also replacement costcurrent liabilities 24, 335current ratio 26–7, 28, 259, 573, 618–19
and prediction of bankruptcy 621current service cost of pension benefits 500,
515current tax expense/benefit 538current value 173–4, 181
see also fair valuecurrent value accounting 209–10, 211customers 604, 605cycle, life see lifecyclecycle, operating 619cyclicality of demand 615
D&A/PPE ratio 218–19Daimler Benz 660damages claims see lawsuitsdate, measurement, and constant purchasing
power units 179daybooks see journalsdays’ sales in receivables 301DB see declining-balance method‘debit’, meaning of 68+n1debt(s) 24, 318–19
analysis and 620capitalisation of 239n2consolidation and 315disclosure concerning 336doubtful 92early retirement 327–8, 329and equity 314–16, 318, 384, 616–17leverage and 591lifetime cost 322long-term 318–29manipulation and 672–3
net 27off-balance sheet 314–16, 340–2, 451–2,
453pension liability and 519and profitability 616, 617reliance on,and risk 28risks of 318short-term 318tax and 532+n4unconsolidated 340, 342see also bad debts and compound financial
instrumentsdebt collection 277debt contracts 8debt issuance costs 326–7debt ratios 259, 338–40, 341, 573debt–equity ratio 27–8, 338–9, 384, 408, 573,
618, 619debt-to-(market)-capitalisation ratio 339,
618, 620Dechow, P. 574n4decimals 10decision-making 6, 7, 37, 632, 633, 662declining-balance method of depreciation
200–2, 204–5, 222defensive interval 572–3, 618, 619deferral method of accounting for tax credit
554deferred method 544n13, 550deferred tax accounting 538–44
partial 544, 554deferred tax assets/liabilities 24, 539,
545–9+n14, 553, 556, 557deferred tax expense/benefit 538, 539, 544defined benefit pension plans 495–6, 499,
508–9+n10, 514defined contribution pension plans 495–6,
499, 503, 514demand, cyclicality of 615demergers 447–9, 451demographic issues 499demonstration test 213, 214, 215–16Denmark 608nn5–6dependency ratio 499depletion 199depreciable amount 200depreciation 199–205
amortisation and 199, 331+n19backlog 207n9book/tax 204consolidation and 436contra accounts for 110–11and cost of new assets 199n3financial analysis and 575of improvements to assets 205international differences concerning
204–5, 577of land 199leases and 317methods and choice of method 133, 164,
199–203, 204–5, 221, 222+n19, 223–4and operating cash flow 140and ROA 614and tax 203, 204, 531, 532, 537–8, 539–40,
544, 553, 554–6see also amortisation and valuation
deprival value 175derecognition 404–5derivatives 338, 408–9, 483, 633
embedded 397see also hedging
development 214see also research and development
deviation, standard 620diarios see journalsdifferentiation 604dilution 146, 167, 360, 361, 681–4direct approach to operating cash flow 585direct costing see variable costingdirect write-off of bad debts 280–1directors 134, 167, 361, 517, 578, 675+n22dirigisme concerning valuation of assets 210disclosure
legal systems and 167recognition and 400
disclosure requirements 5–6, 123, 134,136–7, 150, 166
concerning commitments 317concerning debt 336concerning employment costs 514–17concerning financial investments 413–16concerning fixed assets 220concerning inventories 255concerning leases 338concerning long-term contracts 298concerning receivables 298as ‘price’ of limited liability 359
discontinuing operations 451see also disposals
discount, bonds issued at 320–1discount rates
of leases 334, 346pension plans and 508, 515
discounting 174, 187–90deferred tax and 552, 553end-of-period factors 189–90and long-term receivables 295, 297
discounts (reductions for early payment) 277,279–80, 290, 293–4
discrete approach to interim reporting 669,671
disposal value 174disposals 447–9, 451, 588, 652
of investments 404–5diversified operations 663–7divestment 447–9, 451dividend cover 147dividends 90, 112–13+n4, 361, 364–6
accounting for 365, 369–70, 371in arrears 361cancellation of shares and 372cumulative 361interim 366liabilities and 371non-cash 367–9, 370presentation in cash flow statements
585–8and tax 318, 369, 532–4
dotcom bubble 300, 573, 633, 668, 672double-counting, eliminating 431, 434double entry 70, 81
and development of capitalism 81
712 INDEX
CFA_Z03.qxd 11/6/03 3:32 PM Page 712

doubtful accounts 281see also bad debts
doubtful debts 92‘Dr.’, meaning of 68+n1drafts (bills of exchange) 277, 293–4+n15Dreyfus, P. 662n10DuPont 448DuPont framework of profitability analysis
614Dutch Civil Code 84DVFA/SG earnings 684–5Dynegy 408n7
earnings 50abnormal 383cash 221, 573, 574–5DVFA/SG 684–5expected, and share prices 632–3forecasting 651, 663predictability 679timeliness 660–2variability 620–1see also profit(s)
earnings-based debt ratios 340earnings management see manipulationearnings per share see EPSEbitda 573, 574–6, 660ecobalance 30+n3economic exposure 483–4economic life see useful lifeeconomic profit (residual income) 629,
631n20economic value added 631n20economies of scale 605, 607EDI (electronic data interchange) 83EEC (European Economic Community) see
European UnionEEIGs (European economic interest
groupings) 150effective tax rate 544, 554–6+n19efficiency, market 603, 632–4efficient market hypothesis 632–4elasticity, price 604–5elective share dividends see scrip dividendselectronic data interchange 83EMH 632–4emissions 30employee share options 498, 509–14, 517,
683employee share ownership plans 498employees 673
assets and 15, 29numbers 514, 519
employment contracts 8employment costs 491–520
analysis of 519international differences 492n1
EMU 466–7end-of-period discount factors 189–90ENI 164, 165Enron 292, 315, 408+n7, 453, 513, 674enterprise value 575entertainment 531, 543entities
accounting 4, 171n8legal 4, 358–9, 549
special purpose (SPEs) 292, 453+n26taxable 530+n2, 549see also companies
entry barriers 604, 608n5, 614environment, business 604–7environmental balance sheets 30environmental issues 5, 30, 168, 608n5EPS (earnings per share) 146, 612, 650,
680–5diluted 146, 681–4international differences 684–5
equity 14–15, 16, 25, 357debt and 314–16, 318, 384, 616–17defining for use in ratios 27, 339, 381–4see also compound financial instruments,
equity capital, owners’ equity andshareholders’ equity
equity accounting/equity method 426–30,451
cash flow statements and 586–7and joint ventures 446–7
equity accounts 66–7see also ledgers
equity capital 629cost of 52+n1, 198liabilities and 310
equity carve-outs 448equity instruments 371+n17equity investments 396errors 71–2, 98–9, 654, 657
between-statement 98journals and 70safeguards against 71–2self-correcting 98, 99within-statement 98
ESOPs (employee share ownership plans)498
ESOs see employee share optionsestimates 8, 94, 132, 164, 210
adjustments concerning 205–7, 207n9changes in 656, 657, 671concerning depreciation 202of liabilities 311, 312, 313+n5, 314misuse 408+n7prospective price/earnings ratios 147
Euribor 409euro and eurozone 466–7European Central Bank 466European Commission 6, 149, 150, 184, 363,
517, 535and environmental issues 608n5and overdue accounts 277
European companies 10SEs 150
European Court of Justice 535European economic interest groupings
(EEIGs) 150European Union 10, 149–50
aims 363, 608n5company law directives see belowdecisions 149directives 149–50harmonisation programme 149–50institutions 149law 149–50member states and dates of joining 149n10
member states’ abbreviations for public andprivate companies 4–5
presentation of accounts in 125–31regulations 149and tax 534–5see also European Commission
European Union companies 10see also European companies
European Union company law directives 150,164, 168, 169+n6
and absorption/variable costing 262and accounting principles 169+n6and accounting/taxable profit distinction
530–1and auditing 135and balance sheet formats 126and capital 374and capitalisation 197and cash flow statements 137and changes in operating activities 651and consolidated accounts 164, 439+n10,
440n11and debt 329, 336and definitions of assets 172and disclosure requirements 5–6, 123, 134,
136–7, 255, 359, 514, 517and financial investments 397and goodwill 214, 440and holding gains/losses 207–8, 251, 367and income statement formats 128and interim reporting 670and investments in associates 429and joint ventures 447and merger accounting 442and provisions 313and reserves 366+n14, 367and segmental reporting 665n15and shares 360, 372, 374and small/medium-sized companies
136–7+n6, 150, 359and unrealised gains/losses 367and valuation 177, 210, 253, 278, 397, 658and VAT 278–9
EV/Ebitda ratio 575–6+n6EVA 631n20exceptional circumstances 169exceptional items 114+n5exchange differences 474n8exchange rates
accounting concerning 465–84cash flow statements and 590indirect effects 483see also hedging
executives see managementexercise price/term 509–10expectations 383expenditures 36, 46–8
see also expensesexpense accounts 68expenses 3, 37–8, 39, 68, 76, 173
anticipation of 92classification of 50, 128–31, 255–8discounts and 279–80dividends and 112expenditures and 36, 46–8matching principle 91, 92
INDEX 713
CFA_Z03.qxd 11/6/03 3:32 PM Page 713

expenses (continued)and operating cash flow 140recognition 92tax-deductible 531, 532, 543timing 242treatment of share issuance costs as 364see also cost(s)
expiry-of-asset/liability adjustments 95–7exports 279+n9, 607exposure
economic 483–4transaction 480–2translation 482–3
external auditors see auditingextraordinary items 114+n5, 329extraordinary items fallacy 113–14extraordinary profits/losses 113–14
face value 319, 320, 321factoring 277, 290, 291–3, 301fair value(s) 173–4, 177
consolidation accounting 440deferred tax 552, 553financial investments 397, 399–403,
406–8, 415–16investment property 224–5non-monetary liabilities 318+n12share dividends at 368, 369share options 511–12, 513–14, 517and subsidies to employees 497see also current value
fair value adjustments on consolidation435–6
fair value hedges 412faithful representation 172n9fallacies, accounting see accounting fallaciesfamily control 362, 363FASB (Financial Accounting Standards
Board) (USA) 169, 170, 453n26see also US GAAP
Fiat 362FIFO (first in, first out) approach to inventory
cost 243–8, 253, 255, 259final salary pension plans see defined benefit
pension plansfinance leases (sales-type leases) 316–17, 327,
330, 331–4, 335, 343–6financial accounting see accountingfinancial capital maintenance 178, 182financial fixed assets 24financial institutions 570+n1
see also banksfinancial instruments 371
compound 374–7, 384, 397financial investments see investmentsfinancial leverage see leveragefinancial performance, measures of 574–6financial ratios see ratiosFinancial Services Authority 185financial statements
analysing 603–4, 608–31, 633–4and foreign currency transactions 480–4interim see interim reportingkey elements 183objectives 171, 172responsibility for 136
supplementary information 658users of see userssee also annual accounts
financing 8–9financing activities 139fines 531, 543–4finished goods 23firms see companiesfive forces of competition 604fixed assets see under assetsfixed assets turnover 220, 614fixed charge coverage ratio 340, 620fixed-price contracts 285flexibility 173, 329–30flow(s) 4, 30
see also cash flow(s)flow-through method of accounting for tax
credit 554food retailing 27, 52, 53, 219n18, 339, 615forces of competition 604forecasting 93+n3, 573–4, 576–7, 651, 663foreign currency transactions 465–84, 590foreign operations 471–84formation costs 172formats see under balance sheet(s), under cash
flow statement(s) and under incomestatement(s)
forward exchange contracts 338, 408–9, 412,483n15
forward sales 315Foster, G. 621n14Foster, J.M. 318n12France 66, 84, 362n9, 514–15franchises 170, 275fraud 300free cash flow see under cash flowFrench Banking Federation 408fringe benefits 492, 497front-loading 299, 345, 346, 673, 678functional basis of classification 50, 128–30,
131, 255, 258funds 137n7
shareholders’ see shareholders’ equityfutures contracts 408, 409, 412, 633
GAAP, US see US GAAPgains/losses 50
actuarial 500, 501, 505, 508, 509, 515on disposal of assets 206–7exchange-rate/foreign currency related
466–71, 472–7from early retirement of debt 328+n17,
329non-income statement 131, 379, 381see also losses and unrealised gains/losses
GB see UKGE 513gearing see leveragegeneral ledgers 65, 84generally accepted accounting principles
see accounting principles and US GAAP
geographical classification 124, 134, 483, 486,663, 665+n14
Germany 84, 341, 358n1, 362n9global consolidation 431
going concern assumption 8, 29, 169goodwill 212, 213, 214–15, 431, 437, 440
amortisation of 215, 219, 436, 440, 441assets and 16brands and 215–16immediate write-off of 436–7, 440n14,
441merger accounting and 442negative 436, 440+n13, 441, 550tax and 550+n17
goodwill write-back 437n7Gordon, P. 169n5governance see corporate governancegovernance statement 134–5government accounts 93government agencies 4government grants/incentives 377–9, 534,
543, 554government pensions 93, 496, 498, 514Grant, R.M. 604n1grants 377–9, 543Great Britain see UKgross method of accounting for discounts
279group relief 534groups 430, 431
calculating ratios for 625n15changes in composition 451equity 339, 382, 384small 439tax and 534, 549n16
growth 8–9guarantees for debts 342, 359guarantees (warranties) 16, 313Guenther, D.A. 553Guinness 215GUS 363
Hall, B.J. 509n11harmonisation see internationalisationHarris, T. 451n23HC see historical costhealth care benefits 515health and safety 5Healy, P. 679n25hedging and hedge accounting 338, 339, 395,
408, 409–13, 466, 468–71, 480–2,483+n15
disclosures concerning 413natural 482retrospective 412
Heineken 610–11, 626, 627Henkel 362n9Hero 651HFT investments 400, 401, 404, 406historical cost 29, 173–4, 176–7, 182, 235,
243–8, 250, 252–3and constant purchasing power 180–1
holding companies 362, 607holding gains/losses 176, 207–10, 211, 251–3
see also unrealised gains/lossesholiday pay 494HTM investments 400, 401, 404, 406Hull, J.C. 511n12human resource balance sheets 30hyperinflation 182+n12, 478+n10
714 INDEX
CFA_Z03.qxd 11/6/03 3:32 PM Page 714

IASB (International Accounting StandardsBoard, previously IASC/InternationalAccounting Standards Committee) andinternational accounting standards 168,169+n7, 183–5, 406
and accounting principles/conceptualframework 169+n7, 170–2+n8
and accounting for share issues 371and agriculture 272n3and capital maintenance 171, 177–8and capitalisation 197–8, 238+n1, 239n2and cash flow statements 164, 570, 585,
590and changes in accounting methods
656–7+nn5–6compliance issues 185and compound financial instruments 376,
384and consolidated accounts 439–40, 444n17and contingent liabilities 336and cost-flow assumptions 255and costs 197n1and debt 315, 327n16and definitions 171and desirable characteristics of information
172+n9and directors’ compensation 517n18and disclosure requirements 379and discontinuing operations 652and disposals 451and dividends 371and employee benefits 507–8+n9, 509,
512–13, 514, 515and EPS 680–5EU and 150, 164, 169, 184, 329and expense classification 258and financial investments 397, 400–1+n5,
404–5, 406–8, 413+n10, 416and foreign currency transactions 467, 472,
474n9, 480and goodwill 441and government grants 371and harmonisation 658and hedge accounting 409, 410n9, 412history of organisation 184and holding gains/losses 207–8and hyperinflation 182+n12and impairment of assets 209and impairment of long-term receivables
297and improvements/repairs to assets 205and intangible assets 213–16+n14, 218and interim reporting 670–2Interpretations Committee 184and inventories 249, 253, 255and investment property 211, 224–6and investments in associates 429–30and joint ventures 447and lease classification 334+n22, 346and liabilities 171, 172–3, 311–12, 314,
315, 327n16and measurement issues 173, 176–7and merger accounting 442and off-income-statement gains/losses 381and provisions 314and receivables 315
and recognition issues 171, 172–3,213–16+n14, 218, 276, 397+n2
and redundancy 497and securitising 292and segmental reporting 665–7and shareholders’ equity 371and taxation 539n10, 544+n13, 545+n14,
549, 550, 552, 556, 557and transfer of financial assets 315–16and transfer of receivables 291and US GAAP 184and valuation 171, 215–16+n14, 249, 278,
397immediate write-off of goodwill 436–7,
440n14, 441impairment
of assets 208–10of financial investments 404, 408of goodwill 440, 441of receivables 278, 297
impairment tests 249imports 279n9improvements to assets 205imputation system (tax) 532–4imputed equity costs 198incentives, government see government
grants/incentivesincome 50
accrued 23presentation on balance sheet 26comprehensive 131, 379, 383discounts and 279government aid and 377–9interest 397–8, 413residual (abnormal earnings) 383residual (economic profit) 629, 631n20see also profit(s)
income statement(s) 3, 4, 37–8, 48–51balance sheet and 38–9balance sheet focus of definitions 172cash flow statements and 46–8closing of 99, 106–9formats/presentation 48–51, 114, 128–31and holding gains 207–8ledgers and 68limitations 131, 379long-term contract revenue recognition
methods and 285–7single/multiple-step 49–50tax accounting and 543temporary nature 99terminology used in 50–1transactions and 39, 40–5
income statement approach to deferred taxaccounting 539n10, 544
income statement view of provisions 312, 313incorporated joint ventures 446–7incorporation 358–9, 360indemnities, termination 497, 514indexation 182, 608India 68n1indirect approach to operating cash flow
140–3, 582, 585individual traders see sole tradersindustry profitability 604–5, 614–15inflation 182, 211, 253, 254, 477–8
influence 425, 429–30information
accounting systems and 83costs of 7, 92, 250, 585desirable characteristics 7, 171, 172+n9effects of 6inside 372, 632on investment values 400and market efficiency 632reactions to 633segmental see segmental reportingsources of 451strengths 632
initial public offerings 448input(s) 37
ecological aspects 30insiders 372, 632insolvency 17, 338, 617–18intangible assets see under assetsintegral approach to interim reporting 669,
671integrated foreign operations 472–8Interbrew 589–90, 607, 626, 627intercompany balances 431, 434, 478
see also intragroup transactionsinterest and interest rates 616, 629
and accrual adjustments 94capitalisation of costs 197–9compound 187effective interest rate see IRRfixed/floating rate 322and long-term receivables 295–7market rate 295, 297on overdue accounts 277pension plan liabilities 500, 501, 515presentation in cash flow statements 585swaps concerning 395, 408, 409–10tax and 318, 319, 532+n4see also discounting
interest cover (times interest earned ratio)340, 618, 620
interest income 397–8, 413interest method of amortisation 323–7, 329interests, pooling of see mergersinterim dividends 366interim reporting 4, 122, 667–72
international differences 670intermediate parent companies 439internal auditing 2internal rate of return 323–4International Accounting Standards Board
and international accounting standardssee IASB
internationalisation 125, 149–50, 400, 658Internet 83intragroup/related-party transactions 134,
450, 532, 550see also intercompany balances
intrinsic value of share options 511inventory/inventories 15, 23, 24, 235–62
changes in value 50methods of valuing 239, 243–54, 259, 657,
658as proportion of assets 27shrinkage 50, 237transfers of 315
INDEX 715
CFA_Z03.qxd 11/6/03 3:32 PM Page 715

inventory management 83, 259inventory profits see holding gainsinventory turnover 235, 258–9, 614, 619investing activities 139investment property 211, 224–6investments 394–417, 425, 430+n4
‘active’ 425assets and 619available-for-sale 400–1, 404, 405, 406,
415, 544cash flow statement and 571classification 400–1disclosure concerning 413–16fair value accounting for 177held-for-trading 400, 401, 404, 406held-to-maturity 400, 401, 404, 406impairment 404, 408long-term 24presentation of income from in cash flow
statements 585–90reclassification 406recognition 397+n2, 400return on, in pension plans 500, 501, 508,
515strategy concerning 572timing of decisions concerning 415types, accounting practices and 424–5see also consolidation accounting and
equity accountinginvestors 5, 8, 37, 603, 632–4
and foreign currency transactions 479, 480influence on accounting policies 5, 6, 166and manipulation 676preference for consolidated accounts 451and tax in accounts 529, 556see also shareholders
IOSCO (International Organisation ofSecurities Commissions) 184
IÖW (Institut für ÖkologischeWirtshchaftsforschung) 30
IRR (internal rate of return) 323–4irrationality 632, 633issuance costs 326–7, 364, 371issued share capital see share capitalIWO (immediate write-off ) of goodwill
436–7, 440n14, 441
Jen, F.C. 374n22joint ventures 446–7
cash flow statements and 588see also cross-border ventures
journals and journal entries 69–71, 84adjusting entries 94
just-in-time methods 83, 242, 259
Kasanen, E. 673n20Kay, J. 606n2kind, dividends in 368Kinnunen, J. 673n20Klein, A. 675n22knowledge-based activities 216Kone 585, 586Kothari, S.P. 661–2Kotler, P. 576n7KPMG 169n5Kunert AG 30+n3
La Porta, R. 167, 341+n29, 362, 675n21labour cost ratios 519land 133n4, 199, 211, 334Landsman, W.R. 416Lang, M. 451n23law 5–6
breaking, and tax 531, 543–4European Union 149–50see also government and legal systems
lawsuits 312, 336lease payments 334leasebacks 335leases 15, 316–17, 329–35, 343–6
and asset recognition 173cancellation penalties 330carrying amount of liability 332+n20and concealed debt 340, 341disclosure requirements 338finance leases (sales-type leases) 316–17,
327, 330, 331–4, 335, 343–6international differences in treatment 335leveraged 343off-balance-sheet 346operating leases 317, 330, 331, 333–4, 335,
340, 343, 346term of 334
ledgers/ledger accounts 17, 64–8, 71, 73–80,84
adjustments to/adjusting entries 80, 90,94–7
balance sheets and 67cash flow statement and 138–9closing of 99–100, 106–9computer systems 70–1conventions of 67–8income statements and 68shorthand used in 68and trial balance 71–2, 80see also journals
Lee Kun-Hee 362legal action see lawsuitslegal contracts 8legal entities see under entitieslegal reserves 166, 366legal rights 167, 341+n29, 360–1, 675legal systems 166, 167, 662, 675lessee 316, 329lessee accounting 330–5lessor 316, 329lessor accounting 343–6Leuz, C. 675Lev, B. 218–19level yield to maturity see IRRleverage 28, 318, 338–42, 384, 441, 452, 573,
591, 616–17, 619–20accounting methods and 660cash-based ratio 573international differences 341lease capitalisation and 333off-balance sheet debt and 315operating 615pension plans and 519revaluation and 211write-off of goodwill and 215
leveraged buyouts 574leveraged leases 343
Levich, R. 662n11liabilities 14, 16, 65, 310–46
constructive 311, 497contingent 312+n3, 336current 24, 335definitions and recognition tests 16, 171,
172–3, 311–12+n1, 315, 316dividends and 371employment costs 493, 494, 496, 499, 500,
502–3, 519estimated 311, 312, 313+n5, 314expiry 94, 96investing to fund 395ledger accounts and 78legal and accounting 16long-term 24, 312, 336measurement 317non-current 335non-monetary 311–12, 318operating cash flows and 573–4redundancy and 497settlement 327+n16share capital and 371tax and 543values and measurement 110, 311–12,
317–18liabilities–assets ratio 339liability, limited/unlimited 4, 358n1, 359,
362n9liability method of deferred tax accounting
544+n13, 550liberalism concerning valuation of assets 210life
average 221of brands 215useful 199, 212, 213, 334
lifecycle, product/company/industry 576,614, 615
LIFO (last in, first out) approach to inventorycost 243–8, 253, 254, 255, 259, 657
limited liability 4, 358n1, 359, 362n9liquidation 319, 341liquidity 27, 28, 572–3, 617–19, 621, 678loans 315, 343
contracts concerning 8see also debt
LOCOM (lower of cost or market value) 662financial investments 397, 398–9, 400, 408,
416, 430inventories 248–50
long-term assets see assets (fixed)long-term contracts 92, 274, 275, 285–90, 298
and early recognition of revenue 300long-term debt-to-equity ratio 619long-term liabilities 24, 312, 336long-term planning 607losses 38, 40, 50, 131
accounting/economic 297cash flow and 46–8extraordinary 113impairment 209ordinary 40, 113tax 545–9tax treatment 534writing-down 370see also gains/losses
716 INDEX
CFA_Z03.qxd 11/6/03 3:32 PM Page 716

LVMH (Louis Vuitton Moët Hennessy) 215Lys, T. 442
McBarnet, D. 676n24Malaysia 8–9management/managers 134, 209, 314, 318,
517, 578, 672, 673, 674–5management accounting 2management boards 361n7management reports 5, 124–5Management’s Discussion and Analysis 125manipulation 577, 578, 672–3, 676–9
checking for 673–9see also under profit(s)
Mannesmann 363manufacturing 92, 235, 239–42‘mark-to-market’ accounting 399, 409,
410–11, 416see also fair value(s)
market capitalisation 400market efficiency/market price of shares 360,
416, 442, 603, 632–4market rate of interest 295, 297market (rate of ) return 147market risk premium 629market value(s) 174, 175, 176–7, 249, 253,
399–400of bonds 328n17and prediction of bankruptcy 621and ratios 339, 620share splits and 369see also fair value and LOCOM
marketable securities 24markets 604matching principle 38, 91, 92, 169materiality 169n7, 172n9, 666maturity dates 319MD&A (Management’s Discussion and
Analysis) 125Means, Gardiner 362measurement
of inputs and outputs for ecological balancesheet 30
see also valuationmeasurement date 179medium-sized companies 137+n6, 150merchandise 23Merck 362n9merger accounting 441, 442mergers 442Merton, R.C. 416Michelin 362n9Microsoft 218Milgrom, P. 492n2minimum recoverable costs 29mining 220, 253minority interests 396, 431, 441–4
calculation of EPS and 146cash flow statements and 588representation on balance sheets 24–5representation on income statements 49
misstatement 300Mitsui Group 362mobile phone companies 218–19Möller, H. 451n23motivation 492n2
Mueller, G. 165n1Müller-Wenk, R. 30multiple-step income statements 49–50Murphy, K.J. 509n11mutual funds 400MyTravel 676–8
Nanda, D. 675Nasdaq ((US) National Association of
Securities Dealers AutomatedQuotations) 369
national charts of accounts 66natural basis of classification 50, 128–30,
255, 258natural resources 199, 220, 222n19, 276NBC (net borrowing cost) 616NBV (net book value) see carrying amountsnegative goodwill 436, 440+n13, 441, 550Nestlé 363, 587‘net’, meaning of 51, 53, 114net actuarial gains/losses 500, 501, 515net approach 110–11net book value see carrying amountsnet debt 27net debt-to-free cash flow ratio 620net debt-to-OCF ratio 573, 618, 620net method of accounting for discounts 279‘net monthly’ credit period 277net-of-tax approach to deferred tax
accounting 539n10net operating assets 613net operating profit after tax 613net realisable value 249, 253netflev (net financial leverage effect) 616Netherlands, the 84neutrality 7, 172n9New York Stock Exchange 369New Zealand 93NFE (net financial expense) 613NFIs (non-financial indicators) 218–19+n18
see also ecobalanceNiskanen, J. 673n20Nissan 453+n24, 483Nissim, D. 616n11NOA (net operating assets) 613Nobes, C. 165n1nominal value see par valuenon-cash transactions 590non-financial indicators see NFIsnon-profit-seeking organisations 4, 37non-voting shares 362, 363NOPAT (net operating profit after tax) 613normal operating activities 50notes, promissory 293n15, 294notes to accounts 4, 132–4, 136, 336–8, 342
and changes in policy 222and manipulation 676statements of consolidation policy 449–50
Novartis 413–15number of days’ sales in receivables 301numbers, conventions concerning 10
obligations 16, 24, 311see also liabilities
Occidental Petroleum 315Ocean Energy 315
OCF see operating cash flowOECD 665+n14off-balance-sheet financing 314–16, 317,
451–2, 453, 673, 674off-income-statement costs 620off-income-statement gains/losses 131, 379,
381offset accounts see contra accountsoffsetting 169n7O’Hanlon, J. 631n20oil companies 220one-line consolidation 451–2open account credit sales 277operating activities see operationsoperating cash flow 139–43, 144–5, 571–2,
573, 575, 576–7, 578, 591, 660Ebitda and 575indirect approach 140–3presentation of 585, 588and profit 577–8, 617, 676and profitability 617segmental 667
operating cycle 619operating leases see under leasesoperating leverage 615operating liabilities 315operating revenues (turnover) 137operations/operating activities 139, 570+n1,
571, 651–2diversified 663–7in foreign currencies 471–84see also operating cash flow
opportunity cost 198–9, 279+n10, 400optional stock dividends 369Ordelheide, D. 169n5ordinary activities 40ordinary profits/losses 40, 113ordinary shareholders 360–1
see also shareholdersOrkla 591, 608+n7, 610, 623, 625outlays, committed and discretionary 573–4output(s) 37
ecological aspects 30outsourcing 519overaggregation 650overdue accounts 277overheads 238overreaction 633owners’ equity 14, 16–17, 25, 172
see also shareholders’ equityownership
assets and 15–16of businesses, forms of 358–9, 362+n9,
363leases and 316–17, 334risks and rewards of 272+n2, 315, 316, 334of shares, evidence of 359n3, 364structures 607, 608
P/B ratio 382P/E ratio see price/earnings ratioPacioli, Luca 81packaging 30‘paid-up’, meaning of 360Palepu, K. 383n25, 416, 679n25par value 320, 360, 368
INDEX 717
CFA_Z03.qxd 11/6/03 3:32 PM Page 717

parent companies 24, 396, 431, 432, 471+n6intermediate 439
participating interests 396participating shares 361partnerships 4, 150, 358+n1, 359
companies treated as 530n2limited by shares 362n9
Partnoy, Frank 408n7passage-of-time adjustments 94–5, 97past service cost (pension plans) 501, 508,
515patents 212, 213pay 238, 300, 491, 492–4, 517‘pay as you go’ basis of accounting for
pension costs 496payables, trade 24payables turnover 619payout ratio 147payroll records 493Peasnell, K. 631n20Penman, S. 616n11pensions, pension plans and pension funds
168, 395, 494–6, 499–507, 514–15, 519and accounting entities 4accounting rules concerning, effects 9changes in provisions 9+n5funded/unfunded 494, 499government 93, 496, 498, 514international differences 508–9measuring costs 499–502redundancy and 497stock markets and 9tax and 543underfunded 519
per-share book value 382percentage-of-completion method of revenue
recognition 274–5, 276percentage-of-receivables method 281performance, financial, measures of 574–6period costs 239periodic system of inventory records 236–7perpetual system of inventory records 236–7petroleum 220phantom shares 510pharmaceuticals industry 8–9physical capital maintenance 178–9, 182pledging 290policing 185political issues 6, 168pooling of interests see mergersPorter, M.E. 604POS (potential ordinary shares) 681, 682post-balance sheet events 123, 134post-employment benefits 494, 497
see also pensionspower
bargaining 605, 607see also control
prediction see forecastingpreference shares (preferred stock) 361, 371,
384premium, bonds issued at 321premium, share 26, 364‘prepay’ transactions 315prepayments 23, 96
see also deferred tax assets
present value(s) 174, 175, 176–7, 186–90,278
leases and 334and long-term receivables 295
present value tables 187–9presentation of numbers 10price(s) 179, 181
‘arm’s length’ 532bargaining power and 605elasticity 604–5see also under shares
price-to-book ratio 382price/earnings ratio 146–7, 382
prospective 147use to value unquoted companies’ shares
575–6Priceline 300principal 319principles 169
conflict of 92see also accounting principles
prior period adjustment 656private companies 4–6, 359pro forma financial statements 451, 657product costs 239, 240product lifecycle 576, 614, 615production, output and 37productivity 218productivity ratios 519profiling, cash flow 576–7profit(s) 3–4, 37–8, 39, 50, 52, 131
absorption/variable costing and 261–2accounting/taxable distinction 166, 204,
298, 530–2, 535–7, 543, 554and capital maintenance 177cash flow and 46–8comprehensive income 131, 379, 383cost-flow assumptions and 246–7, 248, 254deferred tax assets and 557depreciation methods and 204distribution of 25, 112–13+n4earnings and 50economic (residual income) 629, 631n20front-loading see front-loadingholding gains and 207–8, 211and indirect approach to operating cash
flow 140–1inventory valuation methods and 259long-term contract revenue recognition
methods and 290manipulation of 209, 222, 248, 259, 314,
400, 408, 430, 577–8as measure of financial performance 574,
575operating cash flow and 577–8, 617, 676ordinary/extraordinary 40, 113provisions and 314representation of 365–6retained 54and return to shareholders 603revenue recognition methods and 298–9smoothing 336types and analysis of 49–50uniform/separate reporting 166see also dividends, earnings, gains and
reserves
profit and loss account(s) see incomestatement(s)
profit margin 51–2, 54, 678profit-sharing 498profit-to-sales ratio 51–2, 54, 678profitability 603, 604–5, 612, 614
accounting methods and 660and cost of capital 629deferred tax accounting and 542key ratios 51–4, 114, 612–17and prediction of bankruptcy 621and wealth creation 54
prohibitionism concerning valuation of assets210
projected benefit valuation 500projected unit credit method of benefit
valuation 508+n8promissory notes 293n15, 294property
reasons for holding 226see also investment property
property tax 530proportionate (pro-rata) consolidation 446–7prospective adjustment 654, 656prospective price/earnings ratios 147provisions 8, 166, 172, 312–14+nn4–5, 336,
660of bonds 319international differences 313restructuring 314, 440tax and 531
prudence 7, 92, 169, 182, 661PSA Peugeot Citroën 363, 382public companies 4–6+n1, 359+n2
EU and 150see also companies
publication requirements see disclosurerequirements
purchase method of accounting foracquisitions 431–41
push-down accounting 435n6put options 395PV see present value(s)pyramid structures 362, 363
quality, accounting 679quarterly reporting 667–8, 672
see also interim reportingquasi-equity 315, 340quick ratio (acid test ratio) 618–19quoted companies 359n2
R&D see research and developmentRajan, R. 8–9, 341rate of return on assets see ROArate of return on sales see profit-to-sales ratiorate of return on shareholders’ equity see ROErationality 632, 633ratios 26, 51, 114
D&A/PPE ratio 218–19cash-based 572–3consistency 28definitions of equity and calculation of 27,
381–4dividend cover 147financial risk 617–21
718 INDEX
CFA_Z03.qxd 11/6/03 3:32 PM Page 718

ratios (continued)and financial statement analysis 612–31fixed asset 220–1inventory turnover 235, 258–9labour cost 519limitations 620market return 147payout 147presentation in annual reports 146productivity 519profit-to-sales 51–2, 54profitability 51–4, 114, 612–17receivables turnover 271, 299–301see also assets turnover ratios, cash flow
ratios, debt-equity ratio, effective taxrate, EPS, leverage, liquidity, price/earnings ratio, ROA and ROE
Rauberger, R. 30n3raw materials 23, 30RC see replacement costreaction times 633real estate 226
see also investment propertyreal estate tax 530realisation 91+n2, 131, 169rebates 279
see also discountsreceipts 140
see also revenuesreceivables 271, 295–7
ageing analysis 281–2and credit sales 299disclosure requirements 298impairment 278, 297sale/transfers of 277, 290–4, 315valuation of 277–80see also bad debts, credit and revenue
recognitionreceivables turnover 271, 299–301, 614, 619recognition 91–2, 171, 172–3, 177, 212–13,
216, 497disclosure and 400of financial investments 397+n2, 400see also revenue recognition and under
IASBrecord-keeping 2, 3, 80–4
cycle of 115inventory records 236–7, 242, 254see also ledgers
recourse 277, 291, 293, 315, 340recoverability of tax assets 539+n11recoverable amount 278redeemable preference shares 371, 384redemption premium, bonds with stated 327reducing charge methods of depreciation
200–2, 204–5, 223redundancy benefits 497regulation 5–6, 83–4related parties 134, 450relevance 7, 172+n9reliability 7, 8, 172+n9Renault 453+n24rent 15, 96, 317repairs 205replacement cost 173–4, 175, 176–7, 250–2,
253, 259
report, annual 5, 6, 123–5see also annual accounts
reportable segments 666reporting
frequency 672uniform/separate see separate reporting
and uniform reportingrepresentation, faithful 172n9Repsol YPF 482+n14research and development (R&D) 177,
212–13, 214, 216–18, 571acquisitions 441
reserves 26, 113, 366–7, 379, 441and prediction of bankruptcy 621revaluation 131, 207, 208, 225, 226shares and 368, 369tax and 549
residual income (abnormal earnings) 382–3residual income (economic profit) 629,
631n20residual value 200, 203+n4, 334resource flow cycle 2–3, 4resources 15–16, 339, 615
accruals concept and 93see also assets
responsibility 136restatement 300, 654–6, 657+nn5–6restricted shares 510restructuring 209, 314, 370restructuring provisions 314, 440results see profit(s)retailing 92, 235, 238, 239, 253
see also food retailingretained earnings/profits 25, 26, 54
see also reservesretirement of assets 205–7retirement benefits see pensionsreturn 6
pension plans and 500, 501, 508, 515return on assets see ROAreturn on equity see ROEreturn on sales see profit-to-sales ratioreturns, sales 284revaluation 131, 177, 207–8, 210–11, 250,
251, 674compulsory 210international differences 660and reserves 367taxation and 210, 543, 549
revaluation reserves 131, 207, 208, 225, 226revenue(s) 3, 37–8, 39, 68, 74, 173, 271, 272
and matching principle 91misstatement 300operating 137and presentation of operating cash flow 140receipts and 36, 46–8‘soft’ 173
revenue accounts 68revenue realisation principle 91revenue recognition 91–2, 164, 169, 170,
271–7, 298and fraudulent accounting 300international differences 276long-term contracts 274, 285time-apportioned 276
reverse share splits 369
rights 167, 341+n29, 360–1, 675see also under shareholders
rights issues 681n27risk(s) 6, 336, 409, 572+n2, 616, 617
assessing 572–4credit 277, 572debt and 314, 318disclosure requirements concerning 413foreign currency transactions and 480international comparison 662leases and 330leverage and 338political 480n13price 572n2protection against see hedgingratios concerning 617–21stock market and 629see also under ownership
ROA (return on assets) 53–4+n2, 147,612–15+n10, 616–17+n11
and prediction of bankruptcy 621recognition of intangibles and 216and ROE 617+n13
Roberts, C. 169n5Roberts, J. 492n2Robin, A. 661–2ROCE (return on capital employed) 613
see also ROARoche 515, 516ROE (return on equity) 52, 53, 54, 114, 147,
381–2, 383, 612, 615–17, 620recognition of intangibles and 216and ROA 617+n13
RONOA (return on net operating assets) 612,613, 615–17+nn11,13
segmental reporting and 667see also ROA
Royal Scandinavia 609Ruding Committee 535n7
salaries see paysale-and-leaseback agreements 335, 340sales
on approval 272of assets 50, 315cost of 50forward 315by instalments, leases and 343output and 37returns 284see also credit and receivables
sales allowances 284sales per employee 519sales-type leases see finance leases under leasessalvage value see residual valueSamsung Electronics 362Sansing, R.C. 553SCA 480–2, 483scale, economies of 605, 607Schilit, H. 676n24Scottish & Newcastle 607scrip dividends 369SEC (Securities and Exchange Commission)
(USA) 125, 184, 185, 258, 300, 435n6,662
and non-US companies’ accounts 124n2
INDEX 719
CFA_Z03.qxd 11/6/03 3:32 PM Page 719

securities 371convertible 146, 374–7, 397dilutive 146marketable 24
securitising 277, 292, 293segmental reporting 124, 134, 451, 483, 556,
663–7, 671see also classification
self-billing 83self-financing 576Selling, T. 615n10selling, distribution and administrative costs
238separate reporting 166, 204, 530–1
and timing of revenue recognition 298services 274–5, 276, 300
assets as 96sold with goods 275, 300
SEs (Societas Europa) 150set-up costs 197, 221SGA/sales ratio 218–19share appreciation rights 510share capital 25, 360
minimum requirements 359share certificates 359n3share dividends 368, 370
elective (scrip dividends) 369share options 146, 498, 509–14, 517, 683share premium 26, 364share splits 369+n16shareholders 25, 28, 319
dominant 362, 363liability 359losses 617non-resident, and tax 534n5rights 167, 360–1, 363, 372, 675voting rights 362, 363see also investors
shareholders’ equity 25, 27, 131, 357, 371financial statements and 379–81government aid and 379liabilities and 371revaluation and 211
shareholders’ meetings 167shares 319, 359–64
allotment of 360bearer 359n3, 364called-up/paid-up 360cancelled 373–4companies buying own 367, 371–4consolidating 369earnings per see EPSemployees and 498, 509–13evidence of ownership 359n3, 364financial statements and 379issuance costs 364, 371market value 25nominal value 25non-tradable 509non-voting 362, 363participating 361partly-paid 360phantom 510potential 681, 682preference 361, 371, 384prices 360, 416, 442, 603, 632–4
registered 359n3reserves and 368, 369restricted 510restrictions on ownership/transfer 4, 5,
363substitutes for 633
short-termism 672shrinkage 50, 237Siam Cement 480sick pay 494significant influence 429–30single-entry systems 81–3single-step income statements 50sinking funds 319, 395size of companies 137+n6
and prediction of bankruptcy 621SL see straight-line methodSloan, R. 578small companies 81–3, 137+n6, 150, 359small groups 439Smith, C.W. 318n13Smith, T. 132n3social balance sheets 30social reports 514–15social security 493Societas Europa 150‘soft’ assets/revenues 173sole traders (sole proprietors) 4, 358, 359solvency/insolvency 17, 338, 617–18solvency ratios see leverageSombart, Werner 81Sorter, G. 572n3South African Breweries 607South Korea 8–9Spain 66special purpose entities (SPEs) 292, 453+n26specific identification approach to inventory
cost 234, 248SPEs (special purpose entities) 292, 453+n26spin-offs 448, 651split-rate system (tax) 533stability 621stamp duty 530standard deviation 620start-ups 573state see governmentstated redemption premium, bonds with 327statement of cash flows/statement of changes
in financial position see cash flowstatement(s)
statement of earnings see income statementstatement format for balance sheet 126statement of recognised gains and losses
131–2, 381status 492stepped interest bonds 327Stern Stewart 631n20Stickney, C. 576n7, 615n10stock (goods) see inventorystock (shares) see sharesstock dividends see share dividendsstock exchanges
and compliance issues 185and definition of public companies 5 (n 1)disclosure requirements 137, 184share capital requirements 5
stock market(s) 383, 400, 408, 632–4crashes 633efficiency 632–4see also market efficiency
stock turn see inventory turnover ratestockholders see shareholdersstraight-line method of
amortisation/depreciation 199, 200–2,204, 323, 329
strategy 371–2, 395STRGL see statement of recognised gains and
lossessubsidiaries 24, 396, 425, 431, 432
borrowing through 340, 342cash flow statements and 588exemptions from consolidation 439foreign see foreign operationssources of information on 451, 453tax and 549–50see also consolidation accounting
subsidies 377–9, 534, 543to employees 497
‘substance over form’ 172n9substitutes/substitution 604–5, 633sum-of-years’-digits method of depreciation
222, 223summary financial statements 3supermarket chains 27, 52, 53, 219n18supervisory boards 361n7supplementary income statement 114
see also statement of recognised gains andlosses
suppliers, customers and 604, 605swaps and swap agreements 275–6, 338, 395,
408, 409–10, 483, 590Sweeney, A. 578systems design 2, 72n2
T accounts see ledgerstake-or-pay clauses 342takeovers (acquisitions) 363, 395, 440, 651,
673cash flow statements and 588protection from 607and restructuring 314see also acquisition accounting and
consolidation accounting‘taking a bath’ 209tangible fixed assets, turnover 614tax/taxation 529–35
accounting for 535–52, 554, 556and accounting policies 165–6,
168analysis and 552–7and bad debts 283–4and cancellation of shares 372changes in rates 550–2corporate, as proportion 530cost-flow assumptions and 248and depreciation 203, 204as distribution of profits 535n9dividends and 318, 369, 532–4double 532–3, 534fringe benefits and 492and goodwill 550+n17interim calculations 671
720 INDEX
CFA_Z03.qxd 11/6/03 3:32 PM Page 720

tax/taxation (continued)international differences 532–5, 536, 544,
556and leases 330, 345local 530, 554manipulation and 672and pay 493pensions and 492, 498, 500presentation in cash flow statements 585records and 83–4revaluation and 210and revenue recognition 276, 298and ROA 613statutory and effective rates 544,
554–6+n19valuation/revaluation and 211, 251, 253,
254see also deferred tax assets, separate
reporting, social security, uniformreporting and VAT
tax credits/tax relief 532, 533, 534+n5,549n16, 554
taxes payable accounting 537–8, 542, 544Telefónica 298Telmex 448temporal method of currency translation
472–7+n9, 479temporary difference 536, 539, 542–3, 549,
556, 557term of debt 319termination benefits 497termination indemnities 497, 514terminology 10, 50–1, 114n5, 147–8,
314nn4–5theft 675third-party interests see minority interestsTIE see times interest earnedtime, passage of, adjustments for 94–5,
97time series analysis (trend analysis) 608–10,
611–12time value of share options 511timeliness 7, 650, 660–2times interest earned (TIE) ratio (interest
cover) 340, 618, 620timing
of cash flows 189–90see also revenue recognition
timing difference 531, 536, 542–3, 544unrecognised 554–6
timing principle (revenue realisationprinciple) 91
title to goods 272+n2tobacco industry 8–9total activity ratio see assets turnover ratiosToyota 362, 483tracking stock 448n21tracking of transactions 70trade payables 24trade receivables (accounts receivable) 23
see also receivablestrade sales 448trade unions 9trademarks 212, 215
see also brandstraining 212–13, 214
transaction costs 397see also formation costs and issuance costs
transaction exposure 480–2transactions
and balance sheets 17–21, 39, 40–5in foreign currencies 465–84, 590and income statements 39, 40–5non-cash 590recording see journals and ledgersrelated-party/intragroup 134, 450, 532,
550tracking 70see also sales
transfer pricing 532transfer taxes 530translation, currency 472–7, 479translation adjustments 474+n8translation exposure 482–3transparency 679trend analysis 608–10, 611–12trial balance 71–2, 80, 84, 108–9
adjustments to 80, 90, 94–109‘true and fair view’ 136+n5, 204trusts 292turnover (operating revenues) 137turnover ratios 299–301, 619
see also assets turnover ratios
UHG/L see unrealised gains/lossesUK
creditors’ rights 341and the euro 466Financial Services Authority 185leverage 341ownership of companies 362
UK English and terminology 147–8underlying 409underreaction 633understandability 7, 172uniform reporting 166, 204, 221, 531
and accounting for bad debts 283–4and timing of revenue recognition 298
Unilever 482–3, 659–60unincorporated businesses 4unincorporated joint ventures 446n18United Kingdom see UKUnited Nations 665+n14United States of America see USAunits 10, 179
of constant purchasing power 178, 179units-of-production method of depreciation
222n19, 223–4unrealised gains/losses 131, 182, 206–7,
224–5, 226, 251, 399, 400, 408, 415cash sow statements and 590fair value adjustment 415LOCOM and 250and reserves 131, 367
Upton, W. 318n12US GAAP (generally accepted accounting
principles) 136n5, 169, 184and compound financial instruments 384and ESOs 513, 517and financial investments 406and gains/losses from early retirement of
debt 329
IASB and 184non-US firms and 184, 658–60and share dividends 368
USA 66, 675accounting for goodwill 214auditing in 136n5disclosure requirements in 125and non-US companies’ accounts 124n2,
184, 658–60ownership of companies 362MD&A 125and SPEs 292terminology 147–8use of LIFO in 254see also FASB, SEC and US GAAP
useful life 199, 212, 213, 334users of accounts 5–6, 166, 167, 634
vacation pay 494valuation 28–9, 166, 170, 171, 173–7, 207–11,
250, 251and capital maintenance 178–82of companies 382–3, 415, 553, 575–6+n6and comparability 221date 179of financial investments 397–408+n7,
415–16, 426international differences 210–11of inventories 239, 243–54, 657, 658and methods of currency translation 479concerning pensions 499–502, 508of receivables 277–80reliability 173and tax 549–50see also depreciation, historical cost, market
value, revaluation and unitsvaluation allowance 556–7value
of share options 511–12see also fair value(s), market value(s) and
valuationvalue added 54, 519value added per employee 519value added statement 54–6value added tax 278–9+n9, 284, 530variability of earnings 620–1variable costing 235, 239, 260–2VAT (value added tax) 278–9+n9, 284, 530verifiability 7vesting 510Vincent, L. 442Vodafone 363volatility 629–30volume rebates 279voting rights 362, 363
WACC 629–30wages see payWagner, B. 30n3warranties 16, 313warrants 374–7waste 30Waterford Wedgwood 585–6, 587Watts, R. 6n3, 513n14, 673n20wealth creation 54Weetman, P. 169n5
INDEX 721
CFA_Z03.qxd 11/6/03 3:32 PM Page 721

weighted average approach to inventory cost243–8, 253, 255
weighted average cost of capital 629–30Whelan, J. 676n24wholesalers 92windfalls 50within-statement errors 95Wolfson, M. 479work in progress 23working capital 27, 137n7, 572
world GDP 400write-back, goodwill 437n7write-down, capital 370write-downs 556–7write-off
of bad debts 280–1of goodwill 214–15, 436–7, 440n14,
441of share issuance costs 364
Wysocki, P.D. 675
Xstrata 652, 653
Yahoo! 517+n17, 518year-end, choice of 301
Zeff, S.A. 513n15zero coupon bonds 327Zimmerman, J. 6n3, 513n14, 673n20Zingales, L. 8–9, 341
722 INDEX
CFA_Z03.qxd 11/6/03 3:32 PM Page 722
Copyright © 2022 FDOKUMEN