Corporate Sustainability Accounting - United Nations ...
218
FULL REPORT Corporate Sustainability Accounting WHAT CAN AND SHOULD CORPORATIONS BE DOING? PETER UTTING WITH KELLY O’NEILL
-
Upload
khangminh22 -
Category
Documents
-
view
2 -
download
0
Transcript of Corporate Sustainability Accounting - United Nations ...
F U L L R E P O R T
Corporate Sustainability AccountingWHAT CAN AND SHOULD CORPORATIONS BE DOING?
P E T E R U T T I N G W I T H K E L LY O ’ N E I L L

Corporate Sustainability AccountingWHAT CAN AND SHOULD CORPORATIONS BE DOING?
F U L L R E P O R T
P E T E R U T T I N G W I T H K E L LY O ’ N E I L L
Research and writing by Peter Utting with Kelly O’Neill. Comments and suggestions provided by the Project Team (Ilcheong Yi, Samuel Bruelisauer and Kameni Chaddha) and Advisory Group (Margie Mendell, Mark McElroy, Bill Baue and Sonja Novkovic). Produced by the UNRISD Communications and Outreach Unit, with design and layout by Sergio Sandoval.
Corporate Sustainability Accounting: What Can and Should Corporations Be Doing? is one of the main outputs of phase one of the UNRISD research project Sustainable Development Performance Indicators (SDPI). The project aims to contribute to the measurement and evaluation of the performance of economic entities—both in the for-profit sector and in the social and solidarity economy—in relation to the vision and goals of the 2030 Agenda. The project aims to assess the adequacy of existing methods and data associated with sustainability accounting; expand the scope of sustainability measurement, disclosure and reporting beyond for-profit enterprises to encompass enterprise models in the social and solidarity economy (SSE); and identify and test a set of indicators that can effectively measure impacts, while ensuring that the economic behaviour of enterprises and other organizations contributes to maintaining environmental and social resources at the thresholds required for sustainable development.
UNRISD’s SDPI project (2018-2022) is funded by the Center for Social Value Enhancement Studies, Republic of Korea.
For more information, visit www.unrisd.org/sdpi
The designations employed in this publication and the presentation of material herein do not imply the expression of any opinion whatsoever on the part of UNRISD concerning the legal status of any country, territory, city or area or of its authorities, or concerning the delimitation of its frontiers or boundaries.
For a list of any errors or omissions found subsequent to printing, please visit www.unrisd.org/sdpi
ISBN 978-92-9085-113-4
November 2020
Copyright © United Nations Research Institute for Social Development (UNRISD) and the Center for Social Value Enhancement Studies.
3
CORPORATE SUSTAINABILITY ACCOUNTING: WHAT CAN AND SHOULD CORPORATIONS BE DOING?
This report was drafted in 2019. To borrow a phrase from politics, a week is a long time in the field of corporate social responsibility (CSR) and sustainability disclosure. Normally this is evident in the steady stream of new standards, reporting guidelines and best practices that companies are urged to adopt. But periodically a high-profile corporate scandal, disaster or a global crisis will reveal the limits—indeed, hypocrisy—of main stream efforts to improve corporate sustainability disclosure and performance, and will prompt a major reassessment. Think Enron, the Rana Plaza factory collapse, the BP Deepwater Horizon oil spill, Volkswagen’s vehicle emissions scandal, and the global financial crisis of 2008-2009.
Fast forward to early 2020 and we are now in the midst of a global health crisis, the Covid-19 pandemic. As with other crises, this will be a time when many corporations will step up to the plate with initiatives that attempt to cushion the blow for employees and local communities, or that foster public-private partnerships that assist governments and the wider citizenry. In short, CSR will likely receive a big shot in the arm, adding more content to the ever-expanding portfolio of corporate policies and practices that has characterized CSR over three decades. But as this report reveals, such a trajectory leaves unresolved a series of issues that
are key—both for improving the social or sustainability performance of corporations, and for assessing progress through disclosure and reporting.
The CSR agenda has paid insufficient attention to the necessary transformation of certain structural conditions that reproduce unsustainable development. It has missed the big picture, focusing instead on steps that companies can take to do a bit less harm in relation, for example, to working conditions and environmental protection—incrementalism instead of transformative change. And it has assumed that any initiative associated with improved performance represents progress along a sustainable development pathway, ignoring the need to measure progress in relation to sustain ability thresholds and patterns of fair allocation.
As with the global financial crisis, the present crisis will likely give rise to calls for a new twenty-first century social contract. Some leaders in this field are calling on companies not only to provide immediate assistance to workers, producers, con sumers and local communities, but also to be part and parcel of “a real tipping point on what responsible business should look like”1 or “to adjust its approach and become more strategic and less operational and focus its planning on the long term”.2
Preface
1 Paul Polman, inter viewed by Ethical Corporation on 20 March 2020. Available at http://www.ethicalcorp.com/paul-polman-coronavirus-acid-test-stakeholder-capitalism
2 Richard Edelman. “Covid-19: World Economic Forum and Edelman fill the information void”. 11 March 2020. Available at https://www.edelman.com/insights/covid-19-world-economic-forum-and-edelman-fill-information-void
I
4
UNRISD
Unfortunately this didn’t happen following the global financial crisis and it is unlikely to happen now, unless the focus of attention within CSR and sustainability disclosure shifts towards the set of core issues highlighted in this report. Fundamentally, they relate to skewed patterns of distribution of resources and structures of inequality, both vertical (for example, income and wealth) and horizontal (for example, gender and ethnicity); skewed power relations, and hierarchical as opposed to democratic or participatory governance arrangements; and growth and business models that generate acute environmental externalities that threaten both people’s well-being and the health of the planet.
This report suggests that certain advances in the field of environmental disclosure are now addressing the perverse relationship between the growth model, or capital accumulation, at the enterprise level on the one hand, and the environment on the other. This is evident, for example, in calls not only for improvements related to resource intensity, but also for “absolute decoupling”. Such developments are far less apparent in relation to the social and political or governance dimensions of sustainable development.
The Covid-19 crisis highlights where or how cor porate sustainability disclosure has missed the mark when it come to the big picture issues. Part 2 of this report focuses on five such issue areas: fair remuneration, gender equality, corporate taxation, labour rights and corporate political influence.
As regards fair remuneration, the current crisis has left us wondering why so many of those who are putting themselves at risk in order to provide us with essential goods and services are paid so poorly. Whether in rich or poor countries, millions of people have no savings to cushion the blow of unemployment. And many cannot afford the luxury of social distancing, as they must continue to work outside the home to put food on the table. Why, for so long, has there been so much corporate resistance to paying workers a decent wage as reflected in the concept of a “living wage”? Why
have disclosure and reporting often focused on the issue of whether wages comply with minimum wage regulations or industry norms, rather than the living wage? And, as occurred with the global financial crisis, how can we avoid fuelling income inequality, reflected in extreme CEO-worker pay ratios, via a stimulus or bailout agenda that results in share buy backs and inflated CEO bonuses?
In relation to gender equality, under Covid-19, employees are now urged to work from home via teleworking. This places in sharp relief the chronic failure of the CSR agenda to promote multiple forms of support for employees with caregiving responsibilities—responsibilities that explain much of the workplace disadvantage that women face in pay and promotion. Given the narrow focus on a few weeks of pre- and post-natal care, both companies and standard-setting organizations have failed to recognize that such responsibilities are, in fact, a long-term lifecycle issue.
Regarding corporate taxation, as national health systems struggle under the strain, why are the tax strategies and lobbying efforts of corporations often centred on reducing levels of corporate taxation or resisting increases in income and wealth taxes, thereby depriving national and local governments of the essential fiscal resources needed to maintain adequate health services and social security?
Concerning labour rights, as workers around the world are laid off, their vulnerability might have been mitigated had their bargaining power not been eroded during recent decades. This has partly been due to the flexibilization of labour markets that globalization demanded and corporate lobbyists encouraged. Furthermore, the pandemic raises the spectre of subcontracted, part-time and freelance labour, with few if any labour rights, becoming even more pervasive than before.
Indeed, as the Covid-19 crisis exposes the fragility of global supply chains, and prompts a sharp decline in carbon emissions and pollution, both globalization and the growth
II

5
CORPORATE SUSTAINABILITY ACCOUNTING: WHAT CAN AND SHOULD CORPORATIONS BE DOING?
model it cultivated are being questioned. This, in turn, should focus attention on one of the main driving forces of globalization—the so-called neoliberal policies that underpinned it. These are policies that have often been at the forefront of corporate efforts to influence politics and public policy.
This report urges the United Nations to take a lead in repurposing corporate sustainability accounting for sustainable development. For too long several UN agencies and programmes have promoted an approach to CSR and sustainability disclosure that is not capable of positioning business as an effective agent of change, as demanded by the Sustainable Development Goals. It is hoped that the research findings, and the UNRISD project of which they are a part, provide useful pointers regarding key issues, indicators and normative targets that should be the focus of attention going forward.
Peter UttingManagua, Nicaragua10 April 2020
AcknowledgementsThis report benefitted greatly from participant feedback during several UNRISD workshops and conferences held in Geneva and Montreal in 2019. In particular, we thank the advisory team of the UNRISD project on Sustainable Development Perfor-mance Indicators, in cluding the project coordinator Ilcheong Yi, and Margie Mendell, Mark McElroy, Sonia Novkovic and Bill Baue. Comments and insights from Raymond Saner, Kate Ruff, Rob Michalak, Robert Bloom, Nicolas Zorn, Shahra Razavi, Orlando Núñez and representatives from the International Union of Food, Agricultural, Hotel, Restaurant, Catering, Tobacco and Allied Workers’ Associations (IUF) helped improve the report. Inputs were also provided by Tatiana Krylova and Yuki Mitsuka at the Enterprise Branch of the United Nations Conference on Trade and Development (UNCTAD). Financial support for this research was provided by the Center for Social Value Enhancement Studies, Republic of Korea, and UNRISD institutional funds. Finally, we would like to thank UNRISD staff for feedback and other assistance, including UNRISD Director Paul Ladd, Gabriel Salathé-Beaulieu, Samuel Brülisauer, Kameni Chaddha, Alexander Dénis, Katja Hujo, Martina Piras, Matteo Tarasco and David Vergari. The report was edited and produced by the Institute’s Communications and Out-reach team: Joannah Caborn Wengler, Jenifer Freedman and Sergio Sandoval.
III
6
UNRISD
Contents
Preface i
Acknowledgements iii
Executive Summary vii
Overview 1
⚫ Part 1: Assessing the State of Play
Introduction 31
Chapter 1
A 30-Year Journey33
Ratcheting up and institutionalization 34
Best practice learning 45
Chapter 2
Where Do We Stand?46
Accounting issues 47
Complexity 47
Comparability 48
Relevance and materiality 48
Reliability and credibility 52
Mainstream responses 55
Digital innovations 56
Chapter 3
Thinking Forward58
Learning from cutting-edge innovations 61
Net Positive 61
The MultiCapital approach 63
r3.0 64
Learning from different enterprise models and varieties of capitalism 66
Linkages 66
Private, multistakeholder and multipurpose companies 66
Cooperatives and other social and solidarity economy enterprises and organizations 67
Varieties of capitalism 67
Learning from social science theory and multidisciplinarity 68
Transdisciplinarity 70
Participation, power relations and the politics of change 71
Concluding Remarks 74
IV
7
CORPORATE SUSTAINABILITY ACCOUNTING: WHAT CAN AND SHOULD CORPORATIONS BE DOING?
⚫ Part 2: Indicators and Targets for Transformative Change
Introduction 77
Chapter 4
Learning from the Environmental Dimension79
Chapter 5
Fair Remuneration83
Introduction 83
Income inequality within the firm 84
CEO-worker pay ratio 85
What might a fair CEO-worker pay ratio target look like? 85
Other dimensions of vertical inequality 87
Living wages 88
What is the “living wage”? 88
Measurement issues 90
Comparing actual wages with the living wage 91
Concluding remarks 93
Chapter 6
Gender Equality94
Introduction 94
Structural dimensions of gender disadvantage in the workplace 96
The gender pay gap 97
Gender diversity 99
Care 100
Beyond maternity and parental leave 101
Transparency as a driver of change 106
Targets 108
Concluding remarks 113
Chapter 7
Corporate Taxation114
Introduction 114
Why tax justice is a key performance issue 115
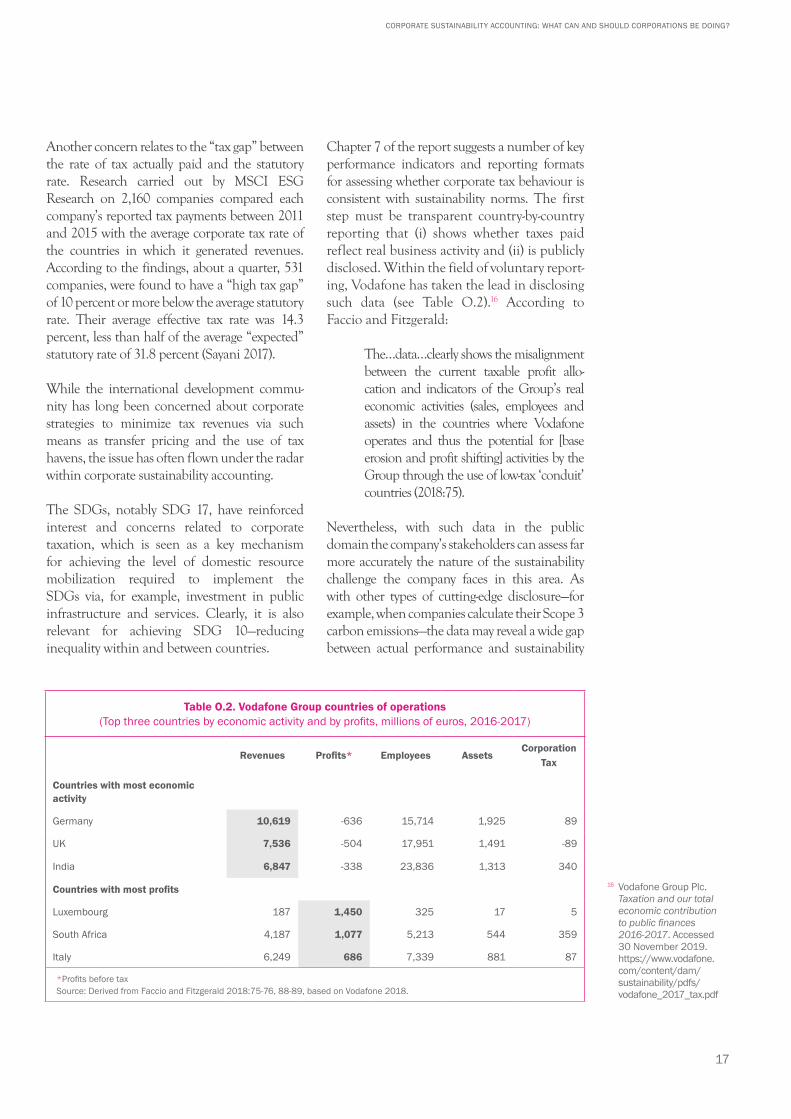
The tax gap and misallocation of profits 117
Normative and regulatory drivers of tax-related sustainability accounting 119
Concluding remarks 123
V
8
UNRISD
Chapter 8
Labour Rights124
Introduction 124
Sustainability disclosure as if labour rights mattered 125
The importance of disaggregated and time series data 126
Country-by-country and supply chain reporting 128
Public disclosure of suppliers 128
Subcontracting via labour brokers 130
Responsible purchasing practices 132
Concluding remarks 134
Chapter 9
Corporate Political Influence135
Introduction 135
What CPI is, and why it matters 136
The structural underpinnings of corporate power 139
The rise of CPI as a key performance issue 140
Ongoing issues and gaps 144
Beyond transparency and integrity 147
Concluding remarks 150
Summing Up 151
Raising the bar 151
Main findings: Issues and indicators 152
Main findings: Transparency and granular disclosure 152
Main findings: Normative goals, targets or target ranges 153
Future work 154
Acronyms 155
List of boxes, figures, tables 156
References 157
Image credits 176
Annexes 177
Annex 1. European Commission Guidance on Non-Financial Reporting 177
Annex 2. SASB Accounting Criteria and Universe of Sustainability Issues 178
Annex 3. Oxfam’s Criteria for Gauging Strong and Weak Performance 179
Annex 4. Mainstream Innovations to Improve Sustainability Accounting 181
Annex 5. The Potential and Limits of Digital Innovations 185
Annex 6. Learning from Social Science Theory and Multidisciplinarity 186
Annex 7. World Federation of Exchanges (WFE) ESG Metrics and Indicators 191
Annex 8. Relevant Standards Adopted by Selected Standard-Setting Organizations: World Federation of Exchanges (WFE), Impact Reporting and Investment Standards (IRIS), Global Reporting Initiative (GRI), Sustainability Accounting Standards Board (SASB)
192
Annex 9. What Counts As Wages? 199
Annex 10. Companies with the Highest Rate of Female Representation at Board and Executive Levels
200
Annex 11. Sustainability Accounting Terminology 201VI
9
CORPORATE SUSTAINABILITY ACCOUNTING: WHAT CAN AND SHOULD CORPORATIONS BE DOING?
The expanding economic power and global impact of transnational corporations in the late twentieth century gave rise to a movement to both rein in negative impacts associated with the environmental, social and governance (ESG) dimensions of corporate performance and reinforce or restore the legitimacy of large corporations. Over the past three decades, this growing movement has resulted in a vast set of standards and compliance practices optimistically packaged as the pathway to sustainable development through gradual improvements in corporate sustainability performance.
This report assesses not only whether the application of existing indicators demonstrates enhanced performance but also whether the indicators themselves are fit for purpose. It was commissioned by UNRISD as part of a four-year inquiry into the ways and means of crafting sustainable development indicators that can adequately measure the performance of both for-profit companies and the enterprises and organizations that make up the social and solidarity economy (SSE). Here we address the corporate dimension of sustainability accounting.
The analysis reveals that conventional sustain-ability disclosure and reporting under taken by transnational corporations and other large companies can neither act as an effective tool for recrafting corporate behaviour, from the perspective of sustainable development, nor allow management and other stakeholders to assess adequately whether a company is progressing along a sustainable development pathway. Further, the report considers ways in which existing performance metrics and indicators might be adapted, complemented or redesigned to facilitate corporate sustainability accounting. Robust accounting should serve to both measure and promote progress from
the perspective of sustainable development and the “transformational vision” of the Sustainable Development Goals (SDGs).
With the aim of spurring discussion about how to repurpose the measurement of corporate sustainability performance for “transformative change”, the report presents a four-pronged argument. First, progress towards generating and reproducing an economic system that is conducive to sustainable development through corporate responsibility (CR) will depend not only on progress associated with the perfor-mance issues and indicators that tend to be the main focus of conventional reporting. Such progress crucially depends on addressing a set of issues and corresponding indicators that relate directly to the structural underpinnings of (un)sustainable development. These issue areas often constitute blind spots within the field of corporate sustainability reporting.
Second, while in recent years there has been notable progress in terms of standard setting, measurement and disclosure related to the environmental dimension of corporate sustain ability performance, the same is not true of the social dimension. Important gaps remain, particularly in relation to issue areas associated with inequality, power relations and distributive justice.
Third, conventional disclosure focuses to a large extent on qualitative indicators, notably elements of a management system deemed necessary for enhanced sustainability performance. Such indicators often serve as a proxy for concrete improvements in performance. Further, data are frequently presented out of context, that is, disconnected from certain background conditions, related variables and normative standards which, when added to the equation, enable users of data to gain a far clearer picture regarding
Executive Summary
VII
10
UNRISD
sustainability performance. Far more attention needs to be directed to quantitative metrics and indicators that measure actual levels and variations of impact over time.
Fourth, progress associated with transformative change also involves a journey towards certain thresholds and equitable patterns of resource allocation compatible with distributive justice. It is these thresholds and “fair allocations” that define sustainable development when under-stood in terms of intra- and intergenerational equity, thriving and regeneration, and not simply incremental adjustments to reduce negative im pacts associated with environ-mental, social and governance perfor mance in selected issue areas.3
⚫ Part 1 of the report, comprising three chapters, begins by tracing the evolution and institutional ization of standard setting and disclosure associ ated with ESG performance over three decades. This review reveals (Chapter 1) the constantly expanding scope of issue areas and indicators seen as material by corporate managers and other stakeholders, as well as frequent improvements in the quality of measurement, disclosure and reporting. It also assesses (Chapter 2) where we stand currently in terms of indicators and report ing practices that allow stakeholders to measure and assess corporate sustainability performance.
The problematic nature of contemporary ESG assessment is widely recognized by managers, standard setters and users alike. Much of the focus is on concerns associated with basic accounting principles such as the proliferation of standards, complexity, user-friendliness, materiality4, reliability, credibility and lack of comparability of existing indicators. Several recent initiatives are reviewed that have been, or are being, introduced to deal with these issues.
In Chapter 3 we argue that many such develop ments are unlikely to get us to where we need to be to accurately assess corporate sustainability performance. Part of the pro-blem lies in a narrow interpretation of what counts as progress towards sustainability. This is often equated with incremental reductions in “harms” asso ciated with environmental and social im pacts or governance arrangements.
Further, sustain able development is more than simply the simul ta neous consideration in time and space of eco nomic, social, environmental and governance dimensions of development. Integrated develop ment—and integrated reporting—also requires recognizing and addressing fundamental contra dictions and dilemmas associated with these dimensions.
The report argues that while an incrementalist and “do less harm” approach may be conducive to partial forms of environmental and social protection or aspects of good governance, it tells us very little about the type of transformative change needed for a sustainable future. The concept of “transformative change” used in this report refers to: (i) patterns of change that modify the structures that reproduce injustice and inequality (or enable justice and equality); and (ii) a journey towards concrete goals and targets in consonance with sustainability thresholds and fair allocations of resources.
Not only conventional corporate sustainability disclosure, but also many contemporary innova-tions within the field, run the risk of bypassing issues, indicators and targets that are key from the perspective of transformative change. Part 1 ends by considering four avenues of inquiry that provide insight into the fundamental factors and conditions that explain and resolve unsustainable development. In so doing, they provide pointers to key “transformative” issue areas, indicators and targets that are often marginalized within corporate sustainability disclosure and assess ment. These include: (i) cutting-edge innovations associated with ambitious target setting; (ii) learn ing from other business or enterprise models and varieties of capitalism that appear to be more conducive to inclusive and sustainable de velopment; (iii) replicating in the social arena the science-based approach that has gained currency in relation to environmental disclosure, by drawing on social science theory and multiple disciplinary perspectives or schools of thought; and (iv) learning from different worldviews and the perspectives of not only conventional stakeholders but also other “rightsholders”.5
⚫ Part 2 of the report opens (Chapter 4) by briefly identifying several recent developments
3 This second aspect of thresholds and allocations draws on the work of Mark McElroy and Bill Baue who also form part of the UNRISD project team (McElroy 2019; Baue 2019; see also Thomas and McElroy 2016; Thurm et al. 2018).
4 In the context of sustainability accounting, materiality refers to issues that are of importance to management and other stakeholders from the perspective of assessing risks, opportunities and impacts.
5 See Thurm et al. 2018.
VIII
11
CORPORATE SUSTAINABILITY ACCOUNTING: WHAT CAN AND SHOULD CORPORATIONS BE DOING?
related to environmental disclosure that are replicable in relation to social dimensions of sustainability performance. These include a more fundamental questioning of conventional growth paths, extending the focus of per-formance assessment beyond the firm to the supply chain, emphasizing not only qualitative but also quantitative indicators, and setting more ambitious performance targets.
Chapters 5 through 9 highlight five issue areas central for measuring performance and progress related to structural and systemic change. These areas are not meant to be exhaustive; rather, they illustrate key issues, indicators, metrics and targets related to inequality, distributive justice and power relations. The first three are:
(i) fair remuneration, comprising both intra-firm (in)equality assessed through the lens of the CEO-worker pay ratio and the payment of a living wage;
(ii) gender equality, comprising gender balance within corporate structures, the gender pay gap, and care support and responsibility—not only in relation to pre-natal and post-natal care but throughout various phases of the lifecycle that impact the situation of women in paid work; and
(iii) the distribution of corporate income via taxation.
Two additional issue areas concern the question of skewed power relations and how to assess progress related to the reconfiguration of power relations in ways amenable to sustainable devel op ment. These areas are:
(iv) labour rights, particularly collective bargaining; and
(v) corporate political influence associated with political spending, lobbying and the “revolving door”.
The discussion of each issue considers the following aspects:• structural implications;• the limits of conventional disclosure
and reporting;• quantitative indicators that should be
considered by corporations, standard-
setting organizations and others involved in promoting ESG disclosure;
• methodological considerations; and• possible normative targets for
assessing progress in terms of sustainable development.
Amidst increasingly vociferous calls for a ma-jor reassessment of corporate sustainability dis closure and accounting, this report provides insights into issues, indicators and targets that do not yet receive the attention they warrant. And in a context where the SDGs and the climate challenge have raised the bar in terms of urgency and action, it is essential that the type of UN-led inquiry for which this report was prepared continues. Considerable work still needs to be done to refine methods, indicators and nor mative goals, and to demonstrate why they are necessary for sustainable development.
While the five issue areas are all relevant and material from the perspective of corporate sus-tainability assessment and the circumstances of large for-profit corporations, the targets may involve benchmarks that are aspirational and long term. Indeed, as some companies are now realizing when accounting fully for their carbon emissions throughout the global value chain, achieving a required target—such as net zero emissions by a certain year—may be impossible given current production methods, technologies, governance arrangements and commercial logic. But such metrics and indicators reveal clearly the scope of the challenge. They indicate a company’s true position along the pathway to sustainable development, and whether progress towards the target is meaningful. This information is vital for any company that adheres to the ethos of cor porate social responsibility and is serious about sustainable development. It is also essential for the multiple stakeholders engaged in the movement for greater corporate accountability. And unless issues related to inequality, distributive justice and power relations are positioned front and centre within the field of corporate sustainability reporting and performance, current efforts to engage corporations as active partners in the SDG process will do little to realize the transformational vision of the 2030 Agenda.
Ix
12
UNRISD
Corporate Sustainability AccountingWhat Can and Should Corporations Be Doing?
Overview
1
CORPORATE SUSTAINABILITY ACCOUNTING: WHAT CAN AND SHOULD CORPORATIONS BE DOING?
In recent decades big business has become an important player in efforts to promote sus-tainable development. Measuring and assessing such efforts has been the remit of what is now a vast industry comprised of corporate sustainability managers and standard-setting organizations, as well as monitoring, certification and rating agencies. This industry is currently at a watershed. It had been assumed that corporate social responsibility (CSR), and so-called triple-bottom-line or ESG (environmental, social and governance) disclosure, would position companies on a pathway to sustainable development through gradual improvements in corporate sustainability performance. This optimistic view is now being questioned.
Many involved in sustainability disclosure and assessment have long recognized the mismatch between reporting practices and basic accounting principles that foster comparability, user-friendliness, relevance, credibility and so forth. A constant stream of adjustments and innovations in reporting guidance and practice have sought to address this issue. But this is only one part of the challenge. Today’s global crises—financial, climate and health—as well as the Sustainable Development Goals (SDGs) have raised the bar in terms of expectations regarding corporate sustainability performance. They have also highlighted the need for sustainability policy and practices that address not only the symptoms of unsustainable development—or incremental reductions in harmful impacts—but also the underlying causes. These are associated with structural conditions that reproduce inequality, vulnerability and planetary degradation. In relation to the environmental dimension of sustainable development, attention is focusing, at least to some extent, on structural conditions
associated with production and consumption patterns and the dominant growth model. In relation to social and governance dimensions, however, structural conditions—for example, skewed patterns of income and wealth dis-tribution, and gender and power relations—are often ignored. Furthermore, conventional approaches tend to obfuscate important con-textual conditions that are needed to effectively assess progress. These include the use of sus-tainability norms or targets against which to measure progress. Without such context, it is impossible to know where a company is truly positioned on a sustainability pathway.
How, then, might corporate sustainability dis-closure and reporting be repurposed to achieve these ends and, in so doing, measure and promote progress from the perspective of the “transformational vision” of the SDGs?
What the Research DemonstratesThe report highlights:
major achievements and challenges as seen from the perspective of some of the key players within the field of corporate sustainability disclosure and reporting;the inherent limits of mainstream approaches to sustainability accounting from the perspective of transformative change;issues, indicators and targets that need to be addressed if corporate sustainability performance and disclosure is to contribute in any meaningful way to realizing the SDGs.
With the aim of spurring discussion about how to repurpose the measurement and reporting of corporate sustainability performance for transformative change, the report presents a four-pronged argument.
First, generating and reproducing an economic system that is conducive to sustainable de-velopment through corporate responsibility will depend not only on making progress on the performance issues and indicators that are currently the main focus of conventional reporting. Such progress also depends crucially on addressing a set of issues and corresponding
Towards 21st Century Sustainability Accounting?
2
UNRISD
indicators that relate directly to the structural underpinnings of (un)sustainable development. Particularly important are conditions associated with distributive (in)justice, inequality and skewed power relations, which are often neglected within the field of corporate sustainability reporting.
Second, while corporate environmental per-formance is often poor, at least there have been some notable innovations and improvements in environmental disclosure with the emergence of more meaningful indicators, as well as science-based targets. Such improvements need to be replicated in other dimensions of sustainability related to social development and democratic governance.
Third, conventional disclosure focuses heavily on qualitative indicators, notably elements of a management system deemed necessary for enhanced sustainability performance. Such indicators often serve as a proxy for concrete improvements in performance. Far more atten-tion needs to be focused on quantitative metrics and indicators that measure actual levels and variations of impact. Also key are time series data that capture trends, as opposed to annual snapshots, and more granular reporting that can reveal significant variations in performance within corporate structures and value chains.
Fourth, progress associated with transformative change involves not only addressing the structural determinants of unsustainable development but also a journey towards certain thresholds and patterns of fair resource allocation. It is these thresholds and “fair allocations” that define sustainable development when understood in terms of intra- and intergenerational equity, thriving and regeneration, and not simply in terms of incremental reductions in negative impacts. Unless a company sets a target that reflects a sustainability norm, neither its management nor other stakeholders can know where that company is positioned in relation to sustainable development.6
The report is divided in two parts. Part 1 assesses the current state of play. It tracks the impressive expansion and ratcheting up of sustainability indicators over three decades, but also identifies ongoing major weaknesses in reporting. These relate to their failure to conform to basic
accounting principles, as well as an “elephant in the room syndrome” whereby a number of issue areas and indicators that are absolutely key for assessing progress towards sustainable development are neglected.
Part 2 delves into the specifics of disclosure from the perspective of “transformative change” (see Box O.1) by focusing on five key performance issues—fair remuneration, gender equality, cor-porate taxation, labour rights, and corporate political influence.
Box O.1. What is transformative change?
As the international community takes stock of the magnitude of the social and environmental challenge facing humanity and the planet, terms like transformational or transformative change have gained currency. But what exactly does “transformative” mean? For some, it is simply a label used to embellish piecemeal reforms or incremental improvements in performance. In the report, transformative change refers to structural changes that are necessary to transform entrenched patterns of production and consumption, as well as social relations and governance arrangements, that underpin social exclusion, inequality and planetary destruction. Without such changes, neither countries nor corporations can claim to be on a sustainable development pathway.
The UNRISD Flagship Report, Policy Innovations for Transformative Change, showed how public policies intended to promote social development often focus on social protection—for example, safety nets and social floors such as minimum wage guarantees and basic health services (UNRISD 2016). Similarly, environmental policy often focuses on doing a bit less environmental harm, or a bit more conservation. The focus, then, is often on fairly minimalist aspects of decent work, “targeting the poor” or environmental protection, rather than a more ambitious agenda to promote simultaneously human well-being, intergenerational equity and planetary regeneration. Yet it is these objectives that define the concept of sustainable development.
More often than not, policy reforms tackle the symptoms rather than the causes of unsustainable development, leaving the structures that generate the problems in the first place largely intact. Yet it is the more comprehensive and ambitious approach that is required. A similar argument can be made both for corporations trying to improve their sustainability performance, and for much of the standards regime promoting corporate sustainability disclosure and reporting.
6 This second aspect of thresh olds and allocations draws on the work of Mark McElroy and Bill Baue, who are also members of the UNRISD project team. See McElroy 2019 and Baue 2019; see also Thomas and McElroy 2016, Thurm et al. 2018 and Raworth 2017.
3
CORPORATE SUSTAINABILITY ACCOUNTING: WHAT CAN AND SHOULD CORPORATIONS BE DOING?
P A R T 1
Assessing the State of Play
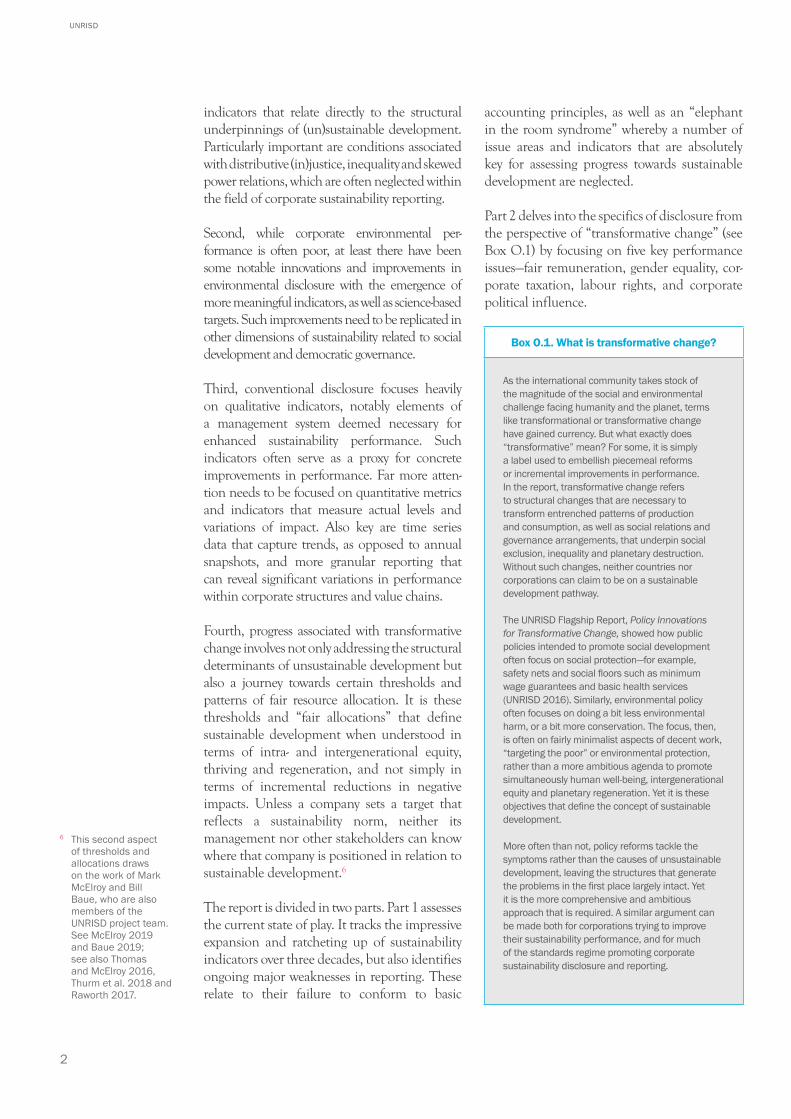
Part 1 of the report takes stock of developments and ongoing challenges related to corporate social and environmental responsibility and sustainability disclosure. Divided into three chapters, it begins by looking at how the field of ESG disclosure has evolved during the past decades.
It then identifies major challenges confronting corporate sustainability accounting and points to the need to think outside the box of mainstream innovations and dynamics that are constantly tweaking corporate sustainability accounting practices. Four avenues of inquiry are proposed for charting a path forward.
4
UNRISD
A 30-Year JourneyChapter 1 identifies key trends and develop-ments—from the early phase of “cosmetic” disclosure to the significant ratcheting up of standards, indicators and guidelines, as well as the development of a dense institutional ecosystem that promotes, supports and regulates disclosure and reporting. Five areas of progress are particularly evident.• The early tendency to pick and choose
what to measure and disclose has given way to a fairly comprehensive range of standards.
• A more encompassing approach is evident in the fact that additional industry sectors and types of business have coalesced under the corporate responsibility umbrella.
• Reporting and certification guidelines have been ratcheted up.
• Third-party verification and assurance is now commonplace.
• The institutionalization of corporate sustainability also involves rating or ranking the sustainability performance of companies and their comparative evaluation.
The evolution of disclosure and reporting sug-gests that there has been a significant change in corporate discourse and policy in recent decades. Over time, attitudes have shifted from outright denial of responsibility, through piecemeal self-regulation associated with bolstering corporate legitimacy and risk and reputation management, to a more comprehensive approach that is gar-nering considerable buy-in from transnational corporations and other companies.
Where Do We Stand?This overview of the evolution of corporate sustainability disclosure and reporting indicates a significant intensification of disclosure activity in the name of sustainability. It is likewise clear that many of the key problems in sustainability reporting identified years ago stubbornly remain. They include:• a level of complexity that confuses,
distracts from measuring impact and defies easy comprehension;
• a lack of data comparability and standardization to support useful evaluation;
• imprecise materiality determination leading to low-quality disclosure and uninformed stakeholders; and
• reliability and credibility problems undermining confidence in the sustainability reporting process itself.
Chapter 2 of the report takes a closer look at these accounting issues and describes several mainstream responses to enhance the quality of disclosure, including attempts to align reporting frameworks, simplify complex disclosure requirements, minimize cherry picking via “multicapital” integrated reporting7, place a value on impacts via monetization, and better determine what is relevant and material from the perspective of sustainable development and the SDGs. Several recent initiatives are presented in Box O.2.
7 See IIRC 2013, Thomas and McElroy 2016.
CHAPTER 1 CHAPTER 2
5
CORPORATE SUSTAINABILITY ACCOUNTING: WHAT CAN AND SHOULD CORPORATIONS BE DOING?
Thinking Forward
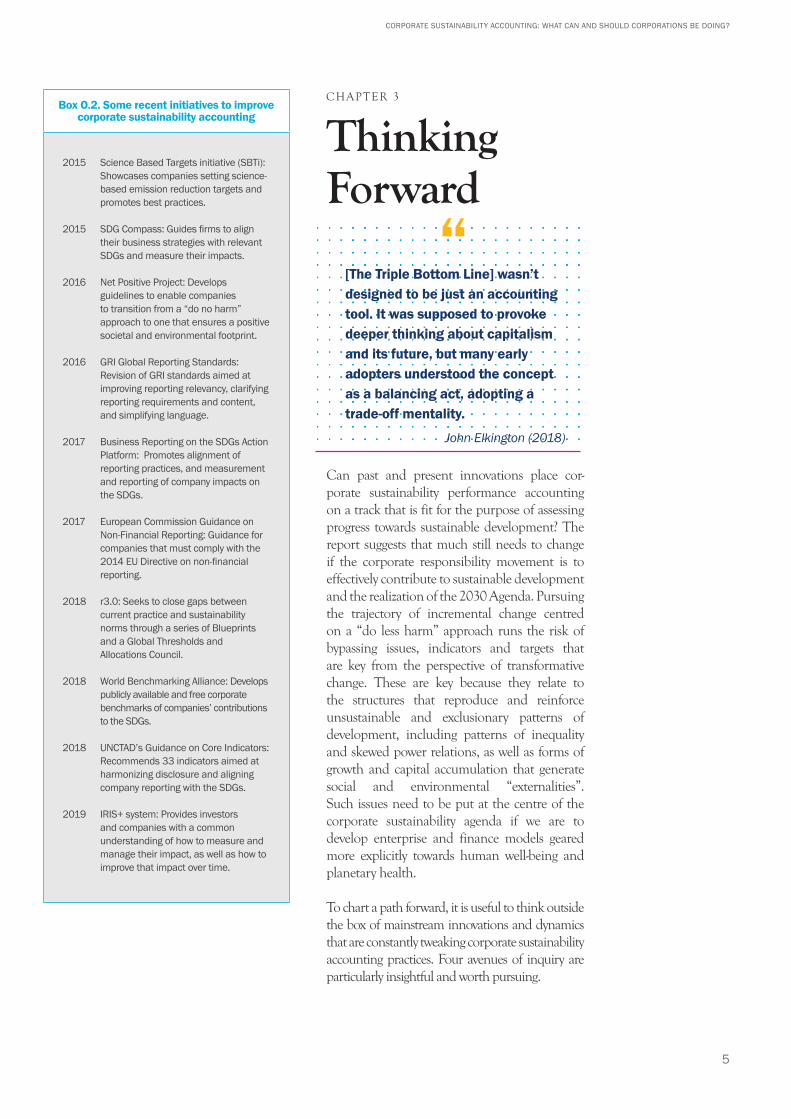
[The Triple Bottom Line] wasn’t designed to be just an accounting tool. It was supposed to provoke deeper thinking about capitalism and its future, but many early adopters understood the concept as a balancing act, adopting a trade-off mentality.
John Elkington (2018)
Can past and present innovations place cor-porate sustainability performance accounting on a track that is fit for the purpose of assessing progress towards sustainable development? The report suggests that much still needs to change if the corporate responsibility movement is to effectively contribute to sustainable develop ment and the realization of the 2030 Agenda. Pursuing the trajectory of incremental change centred on a “do less harm” approach runs the risk of bypassing issues, indicators and targets that are key from the perspective of transformative change. These are key because they relate to the structures that reproduce and reinforce unsustainable and exclusionary patterns of development, including patterns of inequality and skewed power relations, as well as forms of growth and capital accumulation that generate social and environmental “externalities”. Such issues need to be put at the centre of the corporate sustainability agenda if we are to develop enterprise and finance models geared more explicitly towards human well-being and planetary health.
To chart a path forward, it is useful to think outside the box of mainstream innovations and dynamics that are constantly tweaking corporate sustainability accounting practices. Four avenues of inquiry are particularly insightful and worth pursuing.
Box O.2. Some recent initiatives to improve corporate sustainability accounting
2015 Science Based Targets initiative (SBTi): Showcases companies setting science-based emission reduction targets and promotes best practices.
2015 SDG Compass: Guides firms to align their business strategies with relevant SDGs and measure their impacts.
2016 Net Positive Project: Develops guidelines to enable companies to transition from a “do no harm” approach to one that ensures a positive societal and environmental footprint.
2016 GRI Global Reporting Standards: Revision of GRI standards aimed at improving reporting relevancy, clarifying reporting requirements and content, and simplifying language.
2017 Business Reporting on the SDGs Action Platform: Promotes alignment of reporting practices, and measurement and reporting of company impacts on the SDGs.
2017 European Commission Guidance on Non-Financial Reporting: Guidance for companies that must comply with the 2014 EU Directive on non-financial reporting.
2018 r3.0: Seeks to close gaps between current practice and sustainability norms through a series of Blueprints and a Global Thresholds and Allocations Council.
2018 World Benchmarking Alliance: Develops publicly available and free corporate benchmarks of companies’ contributions to the SDGs.
2018 UNCTAD’s Guidance on Core Indicators: Recommends 33 indicators aimed at harmonizing disclosure and aligning company reporting with the SDGs.
2019 IRIS+ system: Provides investors and companies with a common understanding of how to measure and manage their impact, as well as how to improve that impact over time.
“
CHAPTER 3
6
UNRISD
• A set of cutting-edge innovations associated with integrated reporting and ambitious target setting.
• Learning from other varieties of capitalism—for example the “Nordic” model, as well as other business or enterprise models—such as B Corps, cooperatives and other social and solidarity economy entities and organizations, that appear to be more conducive to inclusive and sustainable development.
• Replicating in the social arena the science-based approach that has gained currency in relation to environmental disclosure, by learning from social science theory and multiple disci-plinary perspectives (see Box O.3).
• Learning from the perspectives not only of conventional stakeholders but also of social actors who are impacted directly or indirectly by corporate activities but may have quite different concerns, preferences and worldviews.
These avenues can provide important insights into performance issues, indicators and targets that are key from the perspective of sustainable development and transformative change. It is thus of particular concern for corporate sustainability accounting that they are often neglected within current disclosure and re-porting practices and processes of materiality determination (McElroy 2019).
Box O.3. What does social science theory tell us?
Just as climate science is informing environmental performance standards and target setting, social science should be informing other dimensions of sustainability. Theoretical and analytical insights associated with particular academic subdisciplines and schools of thought within social science can provide important pointers as to the structural causes of unsustainable development, as well as the structural transformations that are needed to effectively position business on a sustainable development pathway. From there it is possible to draw out implications for corporate sustainability performance disclosure in terms of key issue areas, indicators and normative targets. Furthermore, this type of analysis suggests that the portfolio of key performance issues is not overwhelmingly broad; rather, a fairly concise set emerges. Yet it is precisely these issues that often fly under the radar within corporate sustainability disclosure. To illustrate the connections, the report highlights ecological economics, the capabilities approach, political philosophy/sociology, systems dynamics, and institutional economics—as well as the two bodies of thought presented below by way of example: heterodox economics and feminist theories.
Heterodox economics, particularly strands that emphasize the need for redistribution. The work of Thomas Piketty (2014), for example, highlights the crucial role that inequality plays in unsustainable development, as well as the acceleration of inequalities related to (i) income and wealth disparities within society in general and corporations in particular, and (ii) the functional distribution of income—that is, the ratio of profits to wages. Within corporate sustainability accounting, this calls attention to CEO-worker pay differentials; labour productivity versus wage trends; profit shifting; distribution of value among different actors and sectors in the value chain; concentration or market share; long-term versus short-term planning horizons and incentives; workplace democracy, and trade union organization. Attention to different varieties of capitalism and historical periods in the political economy of capitalism can also provide pointers as to normative targets related to fair allocations.
Feminist economics and feminist philosophy highlight how women’s role in social reproduction and unpaid care work is a key enabling condition for the market economy and underpins women’s subordination.* Cultural traits and power relations associated with patriarchy foster discrimination in pay and promotion, and abusive practices in the workplace. The demands and time use associated with care, in turn, reinforce women’s subordination in the workplace, as evidenced in their positioning in lower paid, lower quality jobs and their underrepresentation in management positions. From the perspective of corporate sustainability disclosure, this points to the need to pay far more attention to care as an impediment to decent work, and to indicators that capture the structural conditions that underpin women’s disadvantage in the workplace and career structures, notably segmented labour roles and the gender pay gap. It also points to the key role of women’s collective action through collective bargaining and other mechanisms as a means to women’s economic and political empowerment.
* See, for example, Fraser 2012, Molyneux and Razavi 2002 and UNRISD 2005.
7
CORPORATE SUSTAINABILITY ACCOUNTING: WHAT CAN AND SHOULD CORPORATIONS BE DOING?
“
P A R T 2
Indicators and Targets for Transformative Change
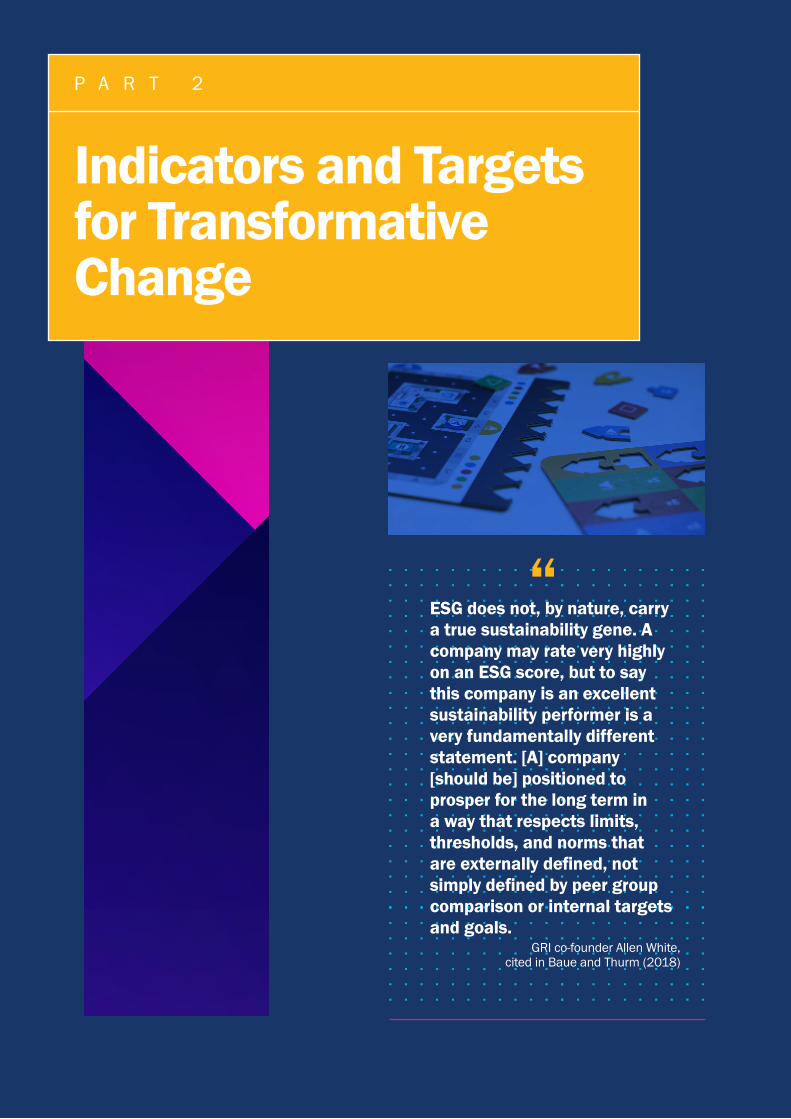
ESG does not, by nature, carry a true sustainability gene. A company may rate very highly on an ESG score, but to say this company is an excellent sustainability performer is a very fundamentally different statement. [A] company [should be] positioned to prosper for the long term in a way that respects limits, thresholds, and norms that are externally defined, not simply defined by peer group comparison or internal targets and goals.
GRI co-founder Allen White, cited in Baue and Thurm (2018)
8
UNRISD
What might disclosure for transformative change look like? The report makes the case for a reconfiguration of key performance issues, where areas of transformative impact associated with distributive justice, equality and democratic governance receive higher pri-ority. This will involve raising the bar above minimalist disclosure or the low-hanging fruit—moving, for example:• beyond compliance with minimum
wage standards to measuring how equitable or skewed the distribution of income is within the enterprise;
• beyond equal pay for equal work to addressing the gender pay gap, as well as its key determinants related to the gender (im)balance in different occupational categories and (lack of) support for caregiving;
• beyond the amount of corporate taxes paid, to focusing on the size of the tax gap (effective tax rate as a percentage of the statutory rate) and the extent of profit shifting;
• beyond occupational health and safety, or working conditions, to addressing labour rights, notably collective bargaining coverage and trade union density; and
• beyond qualitative statements of principle related to corporate political spending and lobbying to providing quantitative data on multiple forms of political influence.
Context-based accounting is also critical at this juncture. The term “context-based” applies specifically to the need to assess performance in relation to thresholds and targets, notably those associated with carrying capacity and sustainability norms related to carbon emissions and water use.8 The problem of “de-contextualization” in sustainability reporting, however, is broader. Failing to make the connections between one indicator and another related variable can provide a misleading picture. Contextualization also refers to the need to be able to detect, where they exist, significant variations in performance, whether through
time, via trend analysis, or within corporate structures, the value chain and jurisdictions where a company operates. Such variations require more granular disclosure because they can be masked by the presentation of aggregate data for the company as a whole (see Box O.4).
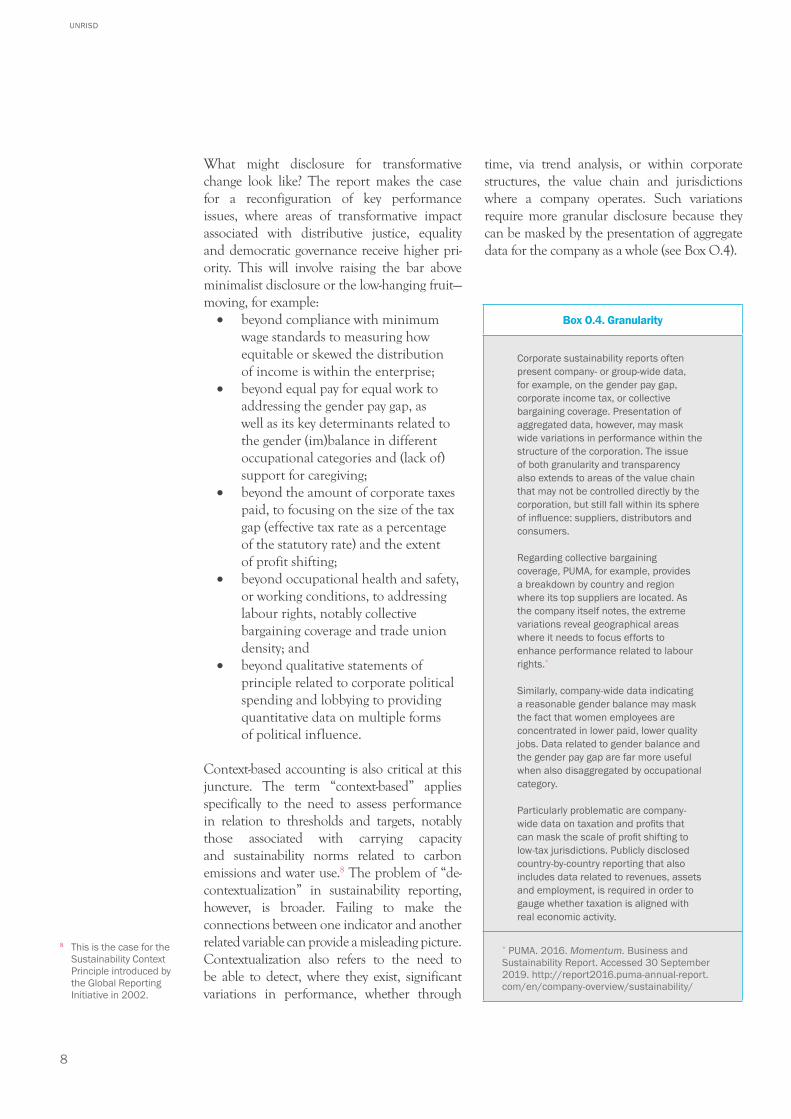
Box O.4. Granularity
Corporate sustainability reports often present company- or group-wide data, for example, on the gender pay gap, corporate income tax, or collective bargaining coverage. Presentation of aggregated data, however, may mask wide variations in performance within the structure of the corporation. The issue of both granularity and transparency also extends to areas of the value chain that may not be controlled directly by the corporation, but still fall within its sphere of influence: suppliers, distributors and consumers.
Regarding collective bargaining coverage, PUMA, for example, provides a breakdown by country and region where its top suppliers are located. As the company itself notes, the extreme variations reveal geographical areas where it needs to focus efforts to enhance performance related to labour rights.*
Similarly, company-wide data indicating a reasonable gender balance may mask the fact that women employees are concentrated in lower paid, lower quality jobs. Data related to gender balance and the gender pay gap are far more useful when also disaggregated by occupational category.
Particularly problematic are company-wide data on taxation and profits that can mask the scale of profit shifting to low-tax jurisdictions. Publicly disclosed country-by-country reporting that also includes data related to revenues, assets and employment, is required in order to gauge whether taxation is aligned with real economic activity.
* PUMA. 2016. Momentum. Business and Sustainability Report. Accessed 30 September 2019. http://report2016.puma-annual-report.com/en/company-overview/sustainability/
8 This is the case for the Sustainability Context Principle introduced by the Global Reporting Initiative in 2002.
9
CORPORATE SUSTAINABILITY ACCOUNTING: WHAT CAN AND SHOULD CORPORATIONS BE DOING?
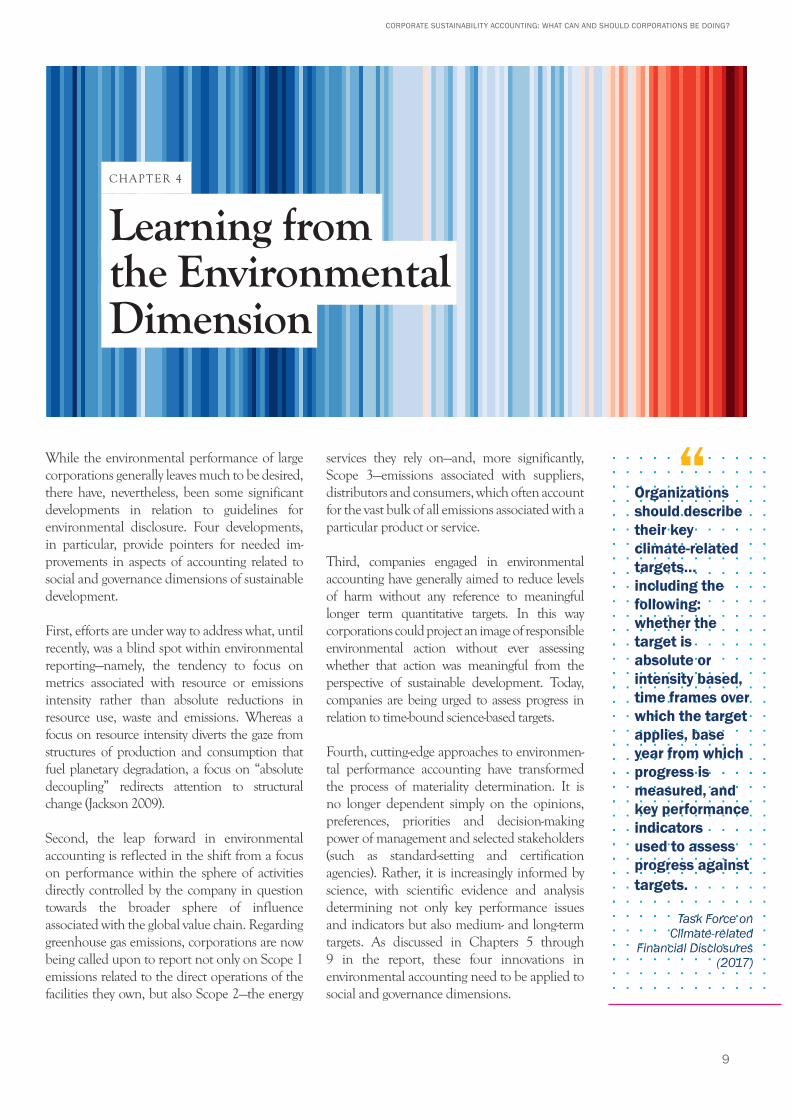
While the environmental performance of large corporations generally leaves much to be desired, there have, nevertheless, been some significant developments in relation to guidelines for environmental disclosure. Four developments, in particular, provide pointers for needed im-provements in aspects of accounting related to social and governance dimensions of sustainable development.
First, efforts are under way to address what, until recently, was a blind spot within environmental reporting—namely, the tendency to focus on metrics associated with resource or emissions intensity rather than absolute reductions in resource use, waste and emissions. Whereas a focus on resource intensity diverts the gaze from structures of production and consumption that fuel planetary degradation, a focus on “absolute decoupling” redirects attention to structural change (Jackson 2009).
Second, the leap forward in environmental accounting is reflected in the shift from a focus on performance within the sphere of activities directly controlled by the company in question towards the broader sphere of influence associated with the global value chain. Regarding greenhouse gas emissions, corporations are now being called upon to report not only on Scope 1 emissions related to the direct operations of the facilities they own, but also Scope 2—the energy
services they rely on—and, more significantly, Scope 3—emissions associated with suppliers, distributors and consumers, which often account for the vast bulk of all emissions associated with a particular product or service.
Third, companies engaged in environmental accounting have generally aimed to reduce levels of harm without any reference to meaningful longer term quantitative targets. In this way corporations could project an image of responsible environmental action without ever assessing whether that action was meaningful from the perspective of sustainable development. Today, companies are being urged to assess progress in relation to time-bound science-based targets.
Fourth, cutting-edge approaches to environmen-tal performance accounting have trans formed the process of materiality determination. It is no longer dependent simply on the opinions, preferences, priorities and decision-making power of management and selected stakeholders (such as standard-setting and certification agencies). Rather, it is increasingly informed by science, with scientific evidence and analysis determining not only key performance issues and indicators but also medium- and long-term targets. As discussed in Chapters 5 through 9 in the report, these four innovations in environmental accounting need to be applied to social and governance dimensions.
Learning from the Environmental Dimension
Organizations should describe their key climate-related targets…including the following: whether the target is absolute or intensity based, time frames over which the target applies, base year from which progress is measured, and key performance indicators used to assess progress against targets.
Task Force on
Climate-related Financial Disclosures
(2017)
“
CHAPTER 4
10
UNRISD
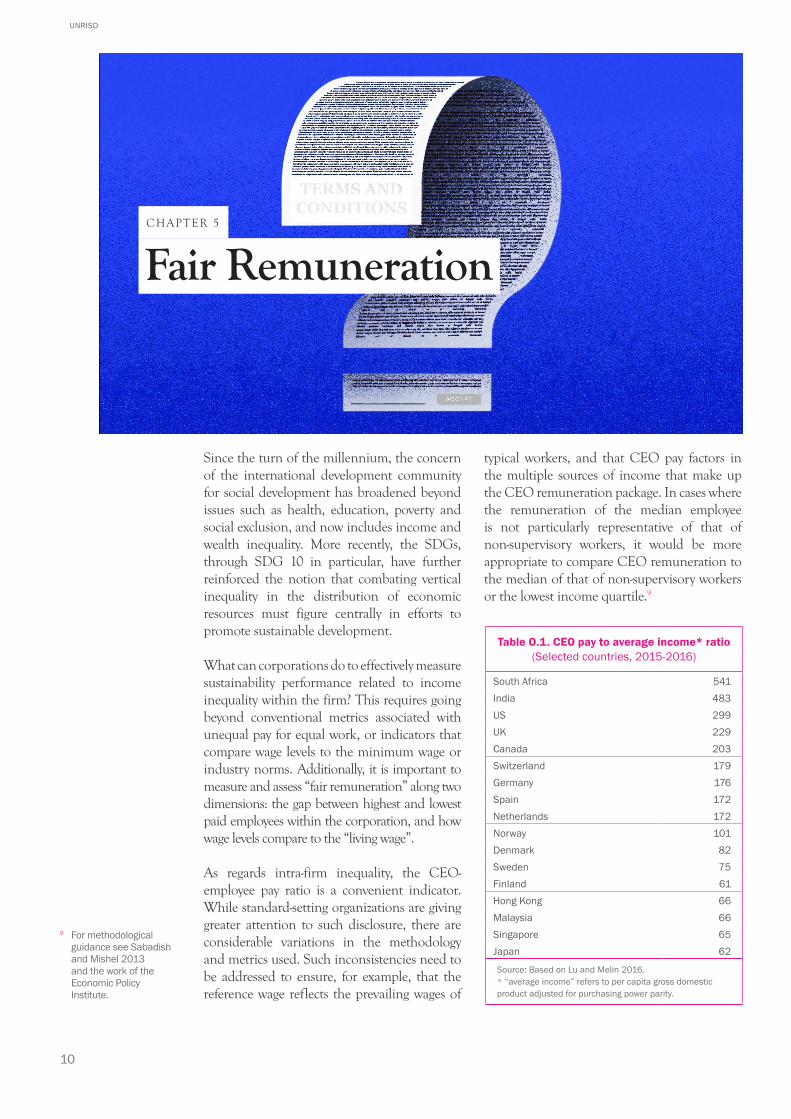
Since the turn of the millennium, the concern of the international development community for social development has broadened beyond issues such as health, education, poverty and social exclusion, and now includes income and wealth inequality. More recently, the SDGs, through SDG 10 in particular, have further reinforced the notion that combating vertical inequality in the distribution of economic resources must figure centrally in efforts to promote sustainable development.
What can corporations do to effectively measure sustainability performance related to income inequality within the firm? This requires going beyond conventional metrics associated with unequal pay for equal work, or indicators that compare wage levels to the minimum wage or industry norms. Additionally, it is important to measure and assess “fair remuneration” along two dimensions: the gap between highest and lowest paid employees within the corporation, and how wage levels compare to the “living wage”.
As regards intra-firm inequality, the CEO-employee pay ratio is a convenient indicator. While standard-setting organizations are giving greater attention to such disclosure, there are considerable variations in the methodology and metrics used. Such inconsistencies need to be addressed to ensure, for example, that the reference wage reflects the prevailing wages of
typical workers, and that CEO pay factors in the multiple sources of income that make up the CEO remuneration package. In cases where the remuneration of the median employee is not particularly representative of that of non-supervisory workers, it would be more appropriate to compare CEO remuneration to the median of that of non-supervisory workers or the lowest income quartile.9
Table O.1. CEO pay to average income* ratio (Selected countries, 2015-2016)
South Africa 541India 483US 299UK 229Canada 203Switzerland 179Germany 176Spain 172Netherlands 172Norway 101Denmark 82Sweden 75Finland 61Hong Kong 66Malaysia 66Singapore 65Japan 62
Source: Based on Lu and Melin 2016.* “average income” refers to per capita gross domestic product adjusted for purchasing power parity.
9 For methodological guidance see Sabadish and Mishel 2013 and the work of the Economic Policy Institute.
Fair RemunerationCHAPTER 5
11
CORPORATE SUSTAINABILITY ACCOUNTING: WHAT CAN AND SHOULD CORPORATIONS BE DOING?
“
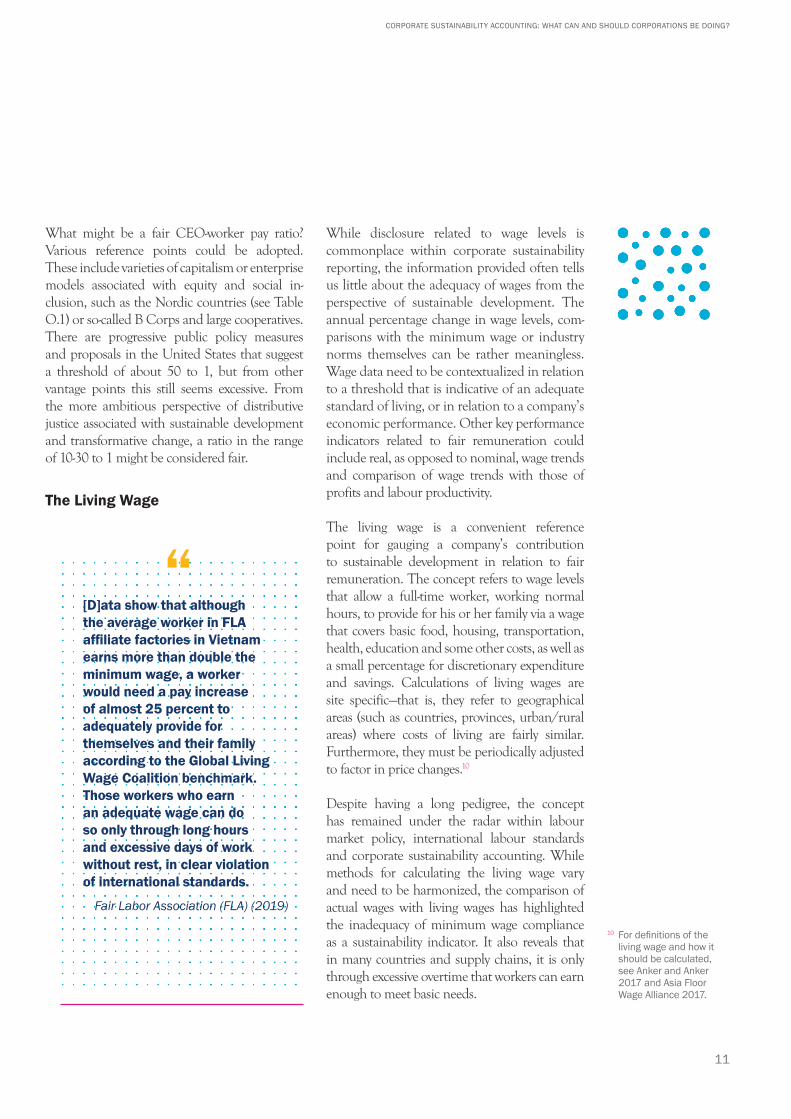
What might be a fair CEO-worker pay ratio? Various reference points could be adopted. These include varieties of capitalism or enterprise models associated with equity and social in-clusion, such as the Nordic countries (see Table O.1) or so-called B Corps and large cooperatives. There are progressive public policy measures and proposals in the United States that suggest a threshold of about 50 to 1, but from other vantage points this still seems excessive. From the more ambitious perspective of distributive justice associated with sustainable development and transformative change, a ratio in the range of 10-30 to 1 might be considered fair.
The Living Wage
[D]ata show that although the average worker in FLA affiliate factories in Vietnam earns more than double the minimum wage, a worker would need a pay increase of almost 25 percent to adequately provide for themselves and their family according to the Global Living Wage Coalition benchmark. Those workers who earn an adequate wage can do so only through long hours and excessive days of work without rest, in clear violation of international standards.
Fair Labor Association (FLA) (2019)
While disclosure related to wage levels is commonplace within corporate sustainability reporting, the information provided often tells us little about the adequacy of wages from the perspective of sustainable development. The annual percentage change in wage levels, com-parisons with the minimum wage or industry norms themselves can be rather meaningless. Wage data need to be contextualized in relation to a threshold that is indicative of an adequate standard of living, or in relation to a company’s economic performance. Other key performance indicators related to fair remuneration could include real, as opposed to nominal, wage trends and comparison of wage trends with those of profits and labour productivity.
The living wage is a convenient reference point for gauging a company’s contribution to sustainable development in relation to fair remuneration. The concept refers to wage levels that allow a full-time worker, working normal hours, to provide for his or her family via a wage that covers basic food, housing, transportation, health, education and some other costs, as well as a small percentage for discretionary expenditure and savings. Calculations of living wages are site specific—that is, they refer to geographical areas (such as countries, provinces, urban/rural areas) where costs of living are fairly similar. Furthermore, they must be periodically adjusted to factor in price changes.10
Despite having a long pedigree, the concept has remained under the radar within labour market policy, international labour standards and corporate sustainability accounting. While methods for calculating the living wage vary and need to be harmonized, the comparison of actual wages with living wages has highlighted the inadequacy of minimum wage compliance as a sustainability indicator. It also reveals that in many countries and supply chains, it is only through excessive overtime that workers can earn enough to meet basic needs.
10 For definitions of the living wage and how it should be calculated, see Anker and Anker 2017 and Asia Floor Wage Alliance 2017.
12
UNRISD
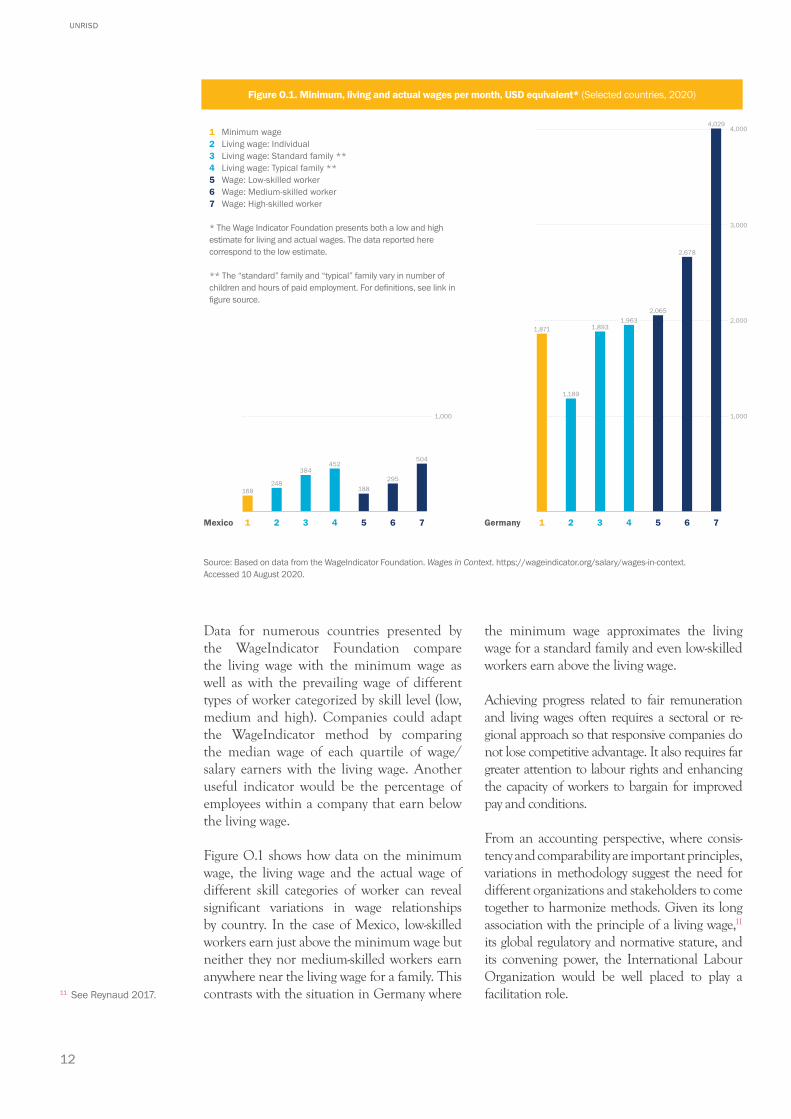
Data for numerous countries presented by the WageIndicator Foundation compare the living wage with the minimum wage as well as with the prevailing wage of different types of worker categorized by skill level (low, medium and high). Companies could adapt the WageIndicator method by comparing the median wage of each quartile of wage/salary earners with the living wage. Another useful indicator would be the percentage of employees within a company that earn below the living wage.
Figure O.1 shows how data on the minimum wage, the living wage and the actual wage of different skill categories of worker can reveal significant variations in wage relationships by country. In the case of Mexico, low-skilled workers earn just above the minimum wage but neither they nor medium-skilled workers earn anywhere near the living wage for a family. This contrasts with the situation in Germany where
the minimum wage approximates the living wage for a standard family and even low-skilled workers earn above the living wage.
Achieving progress related to fair remuneration and living wages often requires a sectoral or re-gional approach so that responsive companies do not lose competitive advantage. It also requires far greater attention to labour rights and enhancing the capacity of workers to bargain for improved pay and conditions.
From an accounting perspective, where consis-tency and comparability are important principles, variations in methodology suggest the need for different organizations and stakeholders to come together to harmonize methods. Given its long association with the principle of a living wage,11 its global regulatory and normative stature, and its convening power, the International Labour Organization would be well placed to play a facilitation role.11 See Reynaud 2017.
Figure O.1. Minimum, living and actual wages per month, USD equivalent* (Selected countries, 2020)
Source: Based on data from the WageIndicator Foundation. Wages in Context. https://wageindicator.org/salary/wages-in-context. Accessed 10 August 2020.
1,871 1,893
2,065
2,678
4,029
1,189
1,963
Mexico Germany
1,000
2,000
3,000
4,000
1,000
168248
384452
188295
504
1 Minimum wage2 Living wage: Individual3 Living wage: Standard family **4 Living wage: Typical family **5 Wage: Low-skilled worker6 Wage: Medium-skilled worker7 Wage: High-skilled worker
* The Wage Indicator Foundation presents both a low and high estimate for living and actual wages. The data reported here correspond to the low estimate.
** The “standard” family and “typical” family vary in number of children and hours of paid employment. For definitions, see link in figure source.
1 2 3 4 5 6 7 1 2 3 4 5 6 7
13
CORPORATE SUSTAINABILITY ACCOUNTING: WHAT CAN AND SHOULD CORPORATIONS BE DOING?
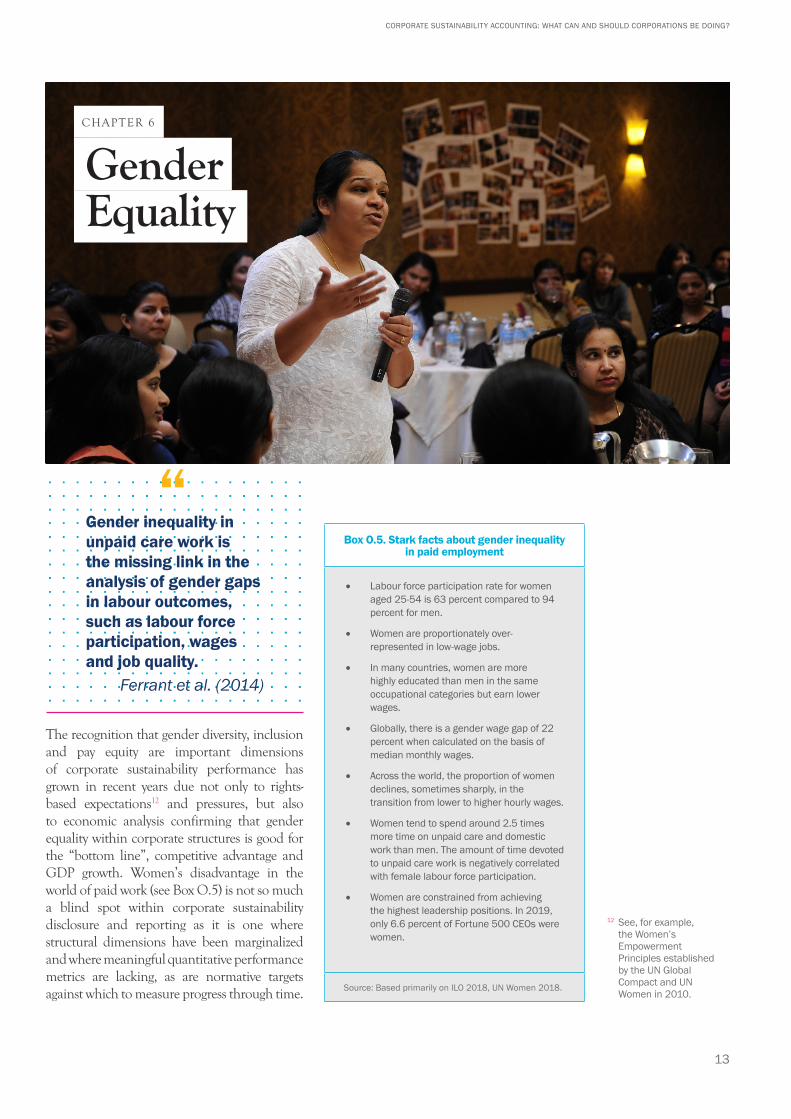
The recognition that gender diversity, inclusion and pay equity are important dimensions of corporate sustainability performance has grown in recent years due not only to rights-based expectations12 and pressures, but also to economic analysis confirming that gender equality within corporate structures is good for the “bottom line”, competitive advantage and GDP growth. Women’s disadvantage in the world of paid work (see Box O.5) is not so much a blind spot within corporate sustainability disclosure and reporting as it is one where structural dimensions have been marginalized and where meaningful quantitative performance metrics are lacking, as are normative targets against which to measure progress through time.
Box O.5. Stark facts about gender inequality in paid employment
• Labour force participation rate for women aged 25-54 is 63 percent compared to 94 percent for men.
• Women are proportionately over-represented in low-wage jobs.
• In many countries, women are more highly educated than men in the same occupational categories but earn lower wages.
• Globally, there is a gender wage gap of 22 percent when calculated on the basis of median monthly wages.
• Across the world, the proportion of women declines, sometimes sharply, in the transition from lower to higher hourly wages.
• Women tend to spend around 2.5 times more time on unpaid care and domestic work than men. The amount of time devoted to unpaid care work is negatively correlated with female labour force participation.
• Women are constrained from achieving the highest leadership positions. In 2019, only 6.6 percent of Fortune 500 CEOs were women.
Source: Based primarily on ILO 2018, UN Women 2018.
Gender inequality in unpaid care work is the missing link in the analysis of gender gaps in labour outcomes, such as labour force participation, wages and job quality.
Ferrant et al. (2014)
“
Gender Equality
12 See, for example, the Women’s Empowerment Principles established by the UN Global Compact and UN Women in 2010.
CHAPTER 6
14
UNRISD
From a structural perspective, what is the core issue underpinning gender inequality in the workplace? Essentially, it relates to segmented labour markets, cultural bias and the gender division of labour associated with caregiving.13 Women’s paid work is often concentrated in low-paid, low-quality jobs. Advancement within the workplace and career structures remains heavily constrained by cultural norms and bias that disadvantage women. These constraints reinforce the so-called double burden: even as women increasingly take up paid work, they continue to assume the primary responsibility for non-paid care provision.
From the perspective of gender justice and transformative change, it is important to re-think priorities and metrics within corporate sustainability accounting related to gender equal-ity in the workplace. Chapter 6 of the report focuses on three specific key performance issues and related indicators: (i) the gender pay gap; (ii) gender balance within corporate structures; and (iii) corporate support for caregiving.
While corporate sustainability reporting may address these issues, the indicators used often do not allow management and other stakeholders to effectively gauge per-formance related to gender equality in any comprehensive sense. The measurement of the gender pay gap—the average remuneration of women as a percentage of that of men,
measured in terms of monthly or hourly earnings—is clouded by methodological issues, underreporting, or the tendency to provide one company-wide figure rather than a breakdown by occupational or income categories. In the case of gender balance, attention focuses heavily on women’s repre-sentation at the highest executive levels, or on company boards, rather than diversity within different occupational and hierarchical cate-gories. In the case of care, attention often focuses narrowly on one aspect—maternity or paternity leave associated with pre- and post-natal care or adoption—rather than care as a multi-faceted and long-term lifecycle issue.
The gender pay gap is an indicator that factors in structural determinants associated with the “sticky floor”, the “glass ceiling” and the “double burden”. In other words, it takes account of the determinants of gender disadvantage linked to sectoral or occupational gender segregation or polarization, as well as the suppression of women’s remuneration and possibilities for full-time work and promotion linked to educational disadvantage, care responsibilities, and cultural norms and bias.
Conventional disclosure and reporting re-lated to these aspects suffer from two major limitations. First, the metrics and indicators do not necessarily tell us very much about whether the structural conditions related to segmented labour markets and segregated occupational categories, as well as cultural norms, bias and the care burden, are being addressed. Second, conventional indicators often relate to very partial aspects of gender inequality and disadvantage in the workplace that miss the bigger picture.
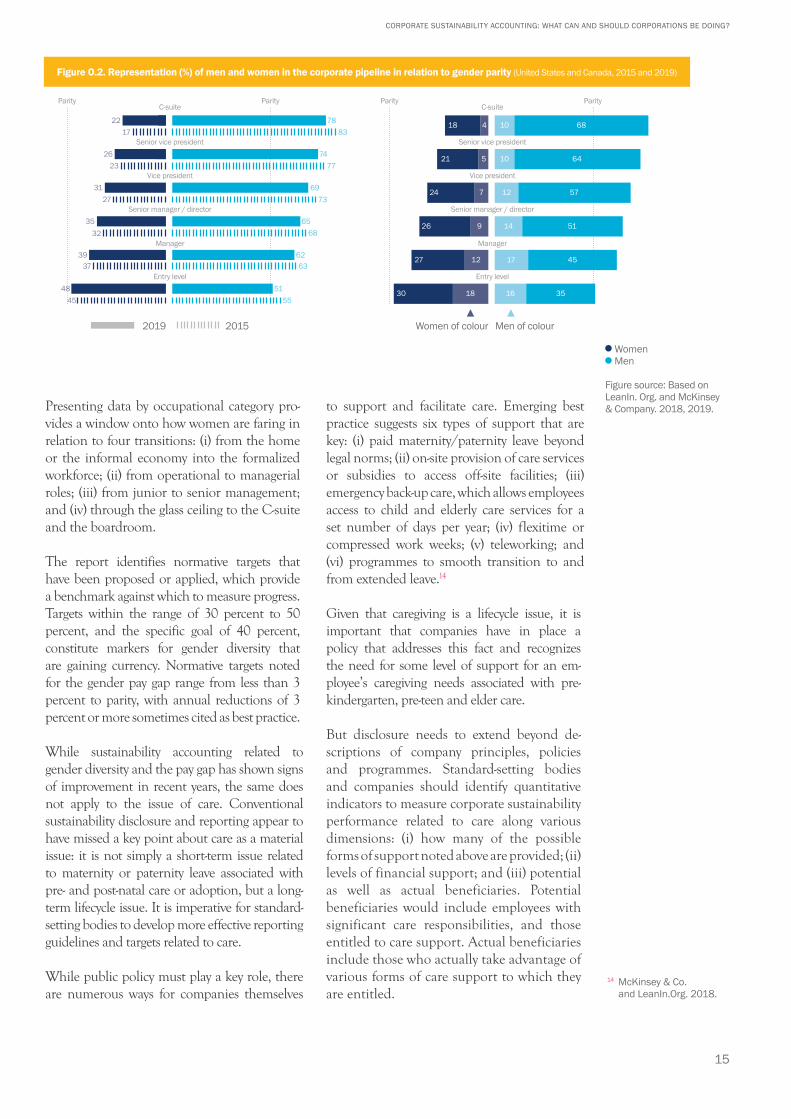
Metrics and targets related to gender balance need to extend beyond company-wide averages, and the boardroom or the C-suite, to a diverse range of occupational, hierarchical and remu-neration categories. Figure O.2 suggests a data presentation format that reveals gender balance within different occupational categories, how it has changed over time and how it relates to gender parity. A similar format can be used to reveal the state of play regarding representation of ethnic or racial groups.
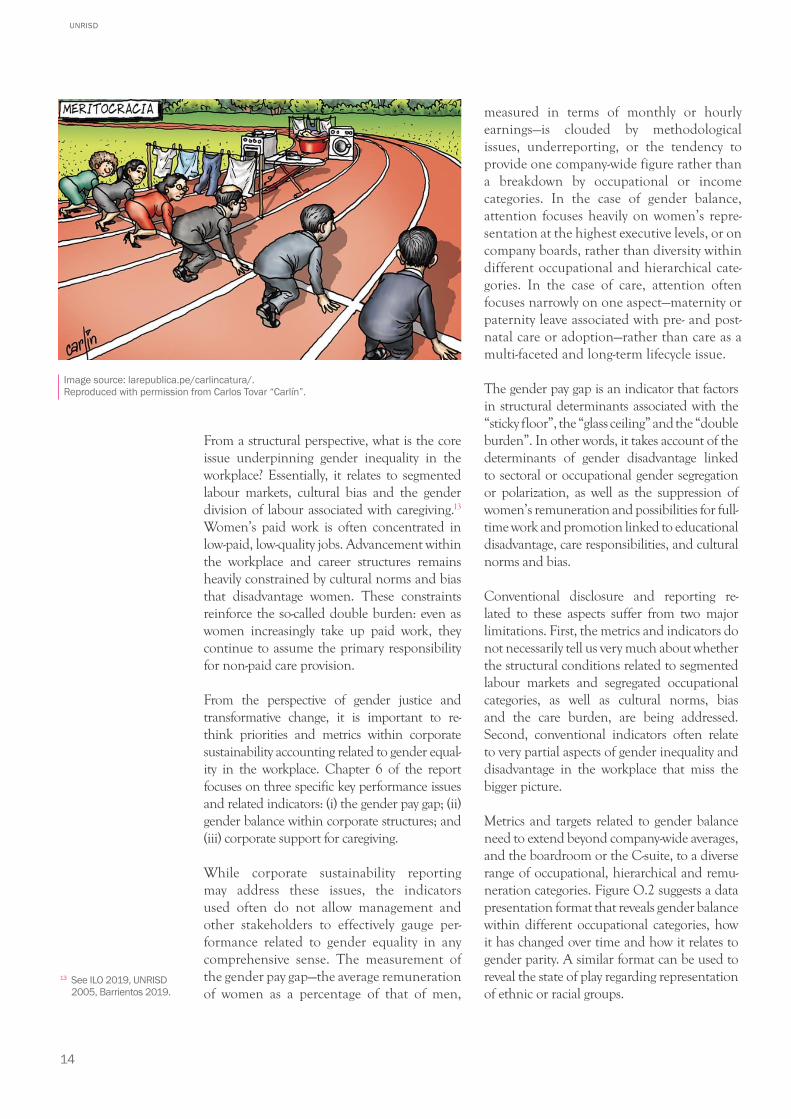
Image source: larepublica.pe/carlincatura/. Reproduced with permission from Carlos Tovar “Carlín”.
13 See ILO 2019, UNRISD 2005, Barrientos 2019.
15
CORPORATE SUSTAINABILITY ACCOUNTING: WHAT CAN AND SHOULD CORPORATIONS BE DOING?
Presenting data by occupational category pro-vides a window onto how women are faring in relation to four transitions: (i) from the home or the informal economy into the formalized workforce; (ii) from operational to managerial roles; (iii) from junior to senior management; and (iv) through the glass ceiling to the C-suite and the boardroom.
The report identifies normative targets that have been proposed or applied, which provide a benchmark against which to measure progress. Targets within the range of 30 percent to 50 percent, and the specific goal of 40 percent, constitute markers for gender diversity that are gaining currency. Normative targets noted for the gender pay gap range from less than 3 percent to parity, with annual reductions of 3 percent or more sometimes cited as best practice.
While sustainability accounting related to gender diversity and the pay gap has shown signs of improvement in recent years, the same does not apply to the issue of care. Conventional sustainability disclosure and reporting appear to have missed a key point about care as a material issue: it is not simply a short-term issue related to maternity or paternity leave associated with pre- and post-natal care or adoption, but a long-term lifecycle issue. It is imperative for standard-setting bodies to develop more effective reporting guidelines and targets related to care. While public policy must play a key role, there are numerous ways for companies themselves
to support and facilitate care. Emerging best practice suggests six types of support that are key: (i) paid maternity/paternity leave beyond legal norms; (ii) on-site provision of care services or subsidies to access off-site facilities; (iii) emergency back-up care, which allows employees access to child and elderly care services for a set number of days per year; (iv) flexitime or compressed work weeks; (v) teleworking; and (vi) programmes to smooth transition to and from extended leave.14
Given that caregiving is a lifecycle issue, it is important that companies have in place a policy that addresses this fact and recognizes the need for some level of support for an em-ployee’s caregiving needs associated with pre-kindergarten, pre-teen and elder care.
But disclosure needs to extend beyond de-scriptions of company principles, policies and programmes. Standard-setting bodies and companies should identify quantitative indicators to measure corporate sustainability performance related to care along various dimensions: (i) how many of the possible forms of support noted above are provided; (ii) levels of financial support; and (iii) potential as well as actual beneficiaries. Potential beneficiaries would include employees with significant care responsibilities, and those entitled to care support. Actual beneficiaries include those who actually take advantage of various forms of care support to which they are entitled.
14 McKinsey & Co. and LeanIn.Org. 2018.
Figure O.2. Representation (%) of men and women in the corporate pipeline in relation to gender parity (United States and Canada, 2015 and 2019)
18
C-suite
Senior vice president
Vice president
Senior manager / director
Manager
Entry level
Parity Parity
21
24
26
27
30
4
5
7
9
12
18
10
10
12
14
17
16
68
64
57
51
45
35
WomenMen
Figure source: Based on LeanIn. Org. and McKinsey & Company. 2018, 2019.
C-suite
Senior vice president
Vice president
Senior manager / director
Manager
Entry level
Parity Parity
2217
2623
3127
3532
3937
4845
7883
7477
6973
6568
6263
5155
Women of colour Men of colour2019 2015

16
UNRISD
[T]he core of public and government concern over corporate tax behaviour is fairly straightforward, i.e. the perception that some corporate taxpayers may be taking steps to ensure that taxable income, profits or gains do not arise in jurisdictions where business operations are actually located, but elsewhere, particularly in jurisdictions where they will be subject to low or no tax.
Christian Aid, Oxfam and ActionAid (2015)
The issue of income inequality involves not only patterns of distribution within corporate structures and value chains, but also distribution involving other stakeholders, not least gov-ernments and citizens affected by taxation. A secular trend under globalization has been the shift from progressive to regressive forms of taxation, reflected, for example, in lower rates of corporate tax and income tax paid by the rich, as well as higher rates of consumption (including value-added) tax. Corporations often engage in so-called aggressive tax strategies and planning, which foster tax dodging. Global profit shifting to affiliates outside of headquarter countries was estimated to involve nearly 40 percent of transnational corporations’ profits in 2015 (55 percent in the case of affiliates of US TNCs), accounting for some USD 600 billion being shifted from relatively high to very low tax destinations.15
15 Tørsløv, Wier and Zucman (2018).
“
Corporate Taxation
CHAPTER 7
17
CORPORATE SUSTAINABILITY ACCOUNTING: WHAT CAN AND SHOULD CORPORATIONS BE DOING?
Another concern relates to the “tax gap” between the rate of tax actually paid and the statutory rate. Research carried out by MSCI ESG Research on 2,160 companies compared each company’s reported tax payments between 2011 and 2015 with the average corporate tax rate of the countries in which it generated revenues. According to the findings, about a quarter, 531 companies, were found to have a “high tax gap” of 10 percent or more below the average statutory rate. Their average effective tax rate was 14.3 percent, less than half of the average “expected” statutory rate of 31.8 percent (Sayani 2017).
While the international development commu-nity has long been concerned about corporate strategies to minimize tax revenues via such means as transfer pricing and the use of tax havens, the issue has often flown under the radar within corporate sustainability accounting.
The SDGs, notably SDG 17, have reinforced interest and concerns related to corporate taxation, which is seen as a key mechanism for achieving the level of domestic resource mobilization required to implement the SDGs via, for example, investment in public infrastructure and services. Clearly, it is also relevant for achieving SDG 10—reducing inequality within and between countries.
Chapter 7 of the report suggests a number of key performance indicators and reporting formats for assessing whether corporate tax behaviour is consistent with sustainability norms. The first step must be transparent country-by-country reporting that (i) shows whether taxes paid reflect real business activity and (ii) is publicly disclosed. Within the field of voluntary report-ing, Vodafone has taken the lead in disclosing such data (see Table O.2).16 According to Faccio and Fitzgerald:
The…data…clearly shows the mis alignment between the current taxable profit allo-cation and indicators of the Group’s real economic activities (sales, employees and assets) in the countries where Vodafone operates and thus the potential for [base erosion and profit shifting] activities by the Group through the use of low-tax ‘conduit’ countries (2018:75).
Nevertheless, with such data in the public domain the company’s stakeholders can assess far more accurately the nature of the sustainability challenge the company faces in this area. As with other types of cutting-edge disclosure—for example, when companies calculate their Scope 3 carbon emissions—the data may reveal a wide gap between actual performance and sustainability
Table O.2. Vodafone Group countries of operations (Top three countries by economic activity and by profits, millions of euros, 2016-2017)
Revenues Profits* Employees AssetsCorporation
Tax
Countries with most economic activity
Germany 10,619 -636 15,714 1,925 89
UK 7,536 -504 17,951 1,491 -89
India 6,847 -338 23,836 1,313 340
Countries with most profits
Luxembourg 187 1,450 325 17 5
South Africa 4,187 1,077 5,213 544 359
Italy 6,249 686 7,339 881 87
*Profits before taxSource: Derived from Faccio and Fitzgerald 2018:75-76, 88-89, based on Vodafone 2018.
16 Vodafone Group Plc. Taxation and our total economic contribution to public finances 2016-2017. Accessed 30 November 2019. https://www.vodafone.com/content/dam/sustainability/pdfs/vodafone_2017_tax.pdf
18
UNRISD
norms, but at least the companies taking on this challenge are among a small group that are being upfront about the state of play.
From the perspective of transformative change, the key question is: “Does the company provide qualitative and quantitative data that might support the commitment to avoiding artificial corporate structures?” (PRI 2018). Of particular interest in this chapter of the report is the quantitative dimension of the question. Useful data include:• effective tax as a percentage of pre-tax
profits by group, affiliate and country;• pre-tax profit as a percentage of revenues
(three-year average, given possible wide fluctuations in annual figures);
• profit attributed to recognized tax havens and low-tax jurisdictions;
• volume and percentage of group profits;
• tax gap: effective tax rate as a percentage of statutory tax rate;
• effective tax rate as a percentage of the industry rate; and
• ratio of pre-tax profits to wages, by affiliate.
Tax justice and the transformative challenge re-lated to taxation involves transitioning from a regressive and aggressive tax system to one that is progressive.
Establishing thresholds and targets to assess good or bad corporate tax performance over time is difficult not only because of differing opinions as to what is legitimate in terms of commercial practice and “tax planning”17 but also because so much depends on public policy and regulation. What should corporations on their own be expected to do? At a general level, it seems clear that they should be facilitating, rather than resisting, reforms aiming for tax justice and enhanced disclosure and transparency. From the perspective of sustainability accounting and transformative change, corporations can no longer be part and parcel of an aggressive and regressive international taxation agenda, where their practices fuel a headwind against people-centred and equitable development (Brock and Pogge 2014).
Benchmarks could be used for certain indicators. In relation to the tax gap, for example, a range of 0 to 5 percent might be considered legitimate. An alternative approach to benchmarking, adopted by the Fair Tax Monitor to assess government performance, scores the trend rather than setting a fixed time-bound benchmark.18 Progressivity, then, would be reflected in con-vergence of effective tax rates with statutory and industry norms; regressivity/aggressivity would be reflected in divergence. For corporations operating in multiple countries, fairness would be reflected in trends showing a reduction of misalignment between taxes paid and economic activity by country.
17 See Faccio and Fitzgerald 2018:76, in relation to Vodafone.
18 Make Tax Fair, Oxfam Novib, Tax Justice Network-Africa. FTM Methodology and Results. 2015. https://maketaxfair.net/ftm/about-fair-tax-monitor/
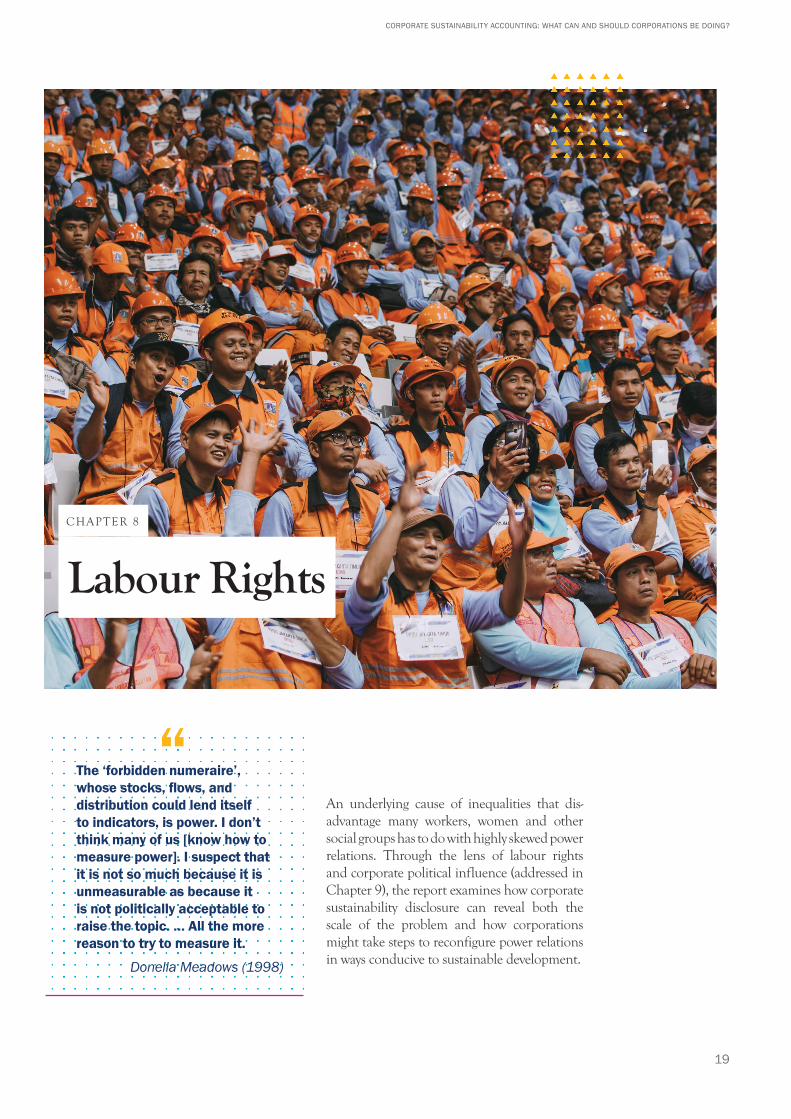
19
CORPORATE SUSTAINABILITY ACCOUNTING: WHAT CAN AND SHOULD CORPORATIONS BE DOING?
An underlying cause of inequalities that dis-advantage many workers, women and other social groups has to do with highly skewed power relations. Through the lens of labour rights and corporate political influence (addressed in Chapter 9), the report examines how corporate sustainability disclosure can reveal both the scale of the problem and how corporations might take steps to reconfigure power relations in ways conducive to sustainable development.
Labour Rights
The ‘forbidden numeraire’, whose stocks, flows, and distribution could lend itself to indicators, is power. I don’t think many of us [know how to measure power]. I suspect that it is not so much because it is unmeasurable as because it is not politically acceptable to raise the topic. … All the more reason to try to measure it.
Donella Meadows (1998)
“
CHAPTER 8
20
UNRISD
Attention to labour rights often figures prom-inently within discourse and policy objec-tives associated with social development and corporate social responsibility. Real world trends, however, have tended to move in the opposite direction, notably in the context of public policy agendas and management strategies favouring labour market flexibilization and outsourcing. The two conventional indicators associated with core labour rights, namely, trade union density (percentage of workers belonging to a trade union) and collective bargaining coverage (percentage of workers covered by collective bargaining agreements) reveal a declining trend over several decades.
There is ample room for corporations to act within their sphere of influence to alter the current trajectory of labour rights erosion. Corporations have the chance to modify this trend, most directly when collective bargaining occurs at the enterprise level but also sectorally—in particular when the corporation in question is a dominant industry player—and nationally, through participation and influence in employers’ associations.
Chapter 8 of the report examines indicators that can demonstrate whether corporations are facilitating the necessary reconfiguration of power relations in corporate governance
through actions that strengthen core labour rights. It outlines several concerns related to underreporting on labour rights and incon-sistency in the type of data disclosed, and goes on to emphasize the need for transnational corporations to provide disaggregated data that reveal variations in labour rights by country where major affiliates and suppliers are located, rather than a general group-wide figure. This in turn requires transparency regarding the location of suppliers. The chapter ends by calling attention to blind spots in reporting that are key for assessing corporate sustainability performance in relation to labour standards and labour rights. They include the scale of reliance on temporary labour and subcontracting via labour brokers, and the extent to which a company’s pricing and procurement policy or practices contradict—or align with—the sustainability objectives of both lead corporations and suppliers.
While reporting frameworks, such as those of the Global Reporting Initiative and Sustainability Accounting Standards Board, generally call on companies to disclose the percentage of employees covered by collective bargaining agreements, few appear to do so. The paucity of disclosure relates not only to organization-wide percentage metrics but also to (i) data disaggregated by region or country where a corporation operates, (ii) supply chain mapping, and (iii) the tendency to provide annual snapshots as opposed to extended time-series data.
A critical first step within sustainability account-ing is to reassert the importance of labour rights by correcting a bias that often characterizes disclosure related to labour standards. Both public policy and corporate policy suffer from the same problem: the tendency to focus more on management systems and performance related to social protection or working con-ditions, rather than the realization of labour rights. But even companies that emphasize labour rights in their social responsibility agenda often fail to comply with the minimum guidance of the GRI and other standard setters regarding quantitative data on collective bargaining coverage.
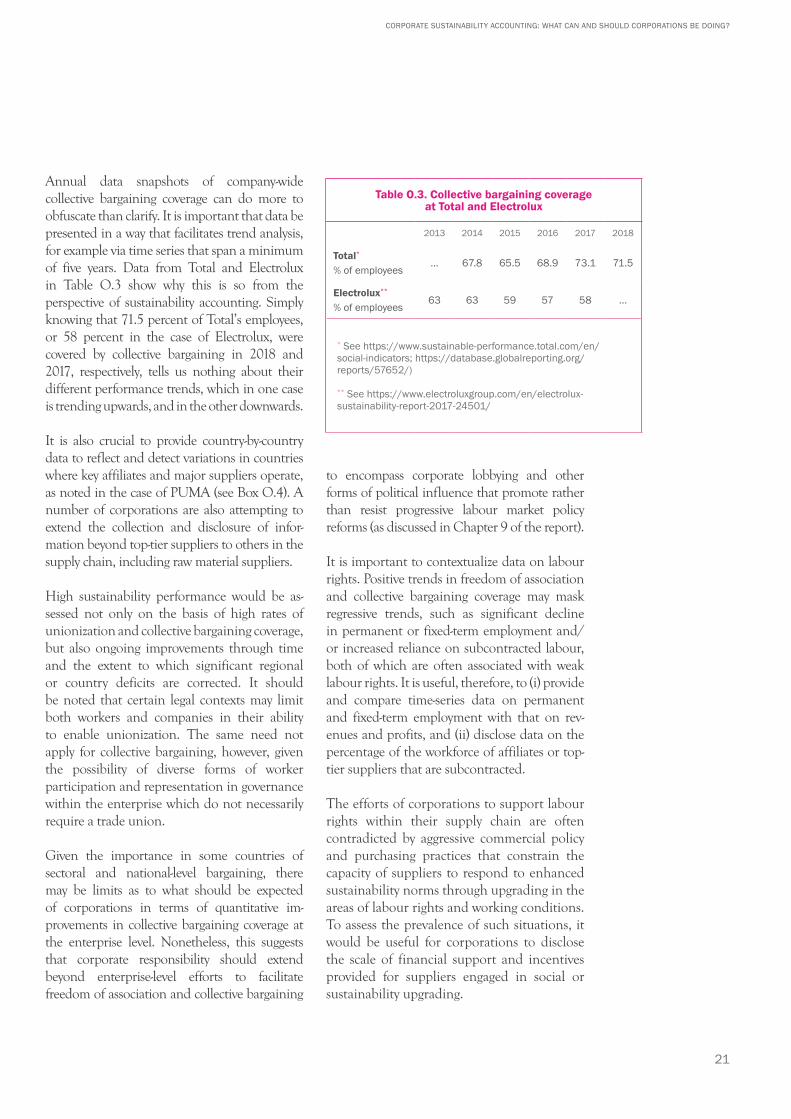
21
CORPORATE SUSTAINABILITY ACCOUNTING: WHAT CAN AND SHOULD CORPORATIONS BE DOING?
Table O.3. Collective bargaining coverage at Total and Electrolux
2013 2014 2015 2016 2017 2018
Total*
% of employees... 67.8 65.5 68.9 73.1 71.5
Electrolux**
% of employees63 63 59 57 58 ...
* See https://www.sustainable-performance.total.com/en/social-indicators; https://database.globalreporting.org/reports/57652/)
** See https://www.electroluxgroup.com/en/electrolux-sustainability-report-2017-24501/
Annual data snapshots of company-wide collective bargaining coverage can do more to obfuscate than clarify. It is important that data be presented in a way that facilitates trend analysis, for example via time series that span a minimum of five years. Data from Total and Electrolux in Table O.3 show why this is so from the perspective of sustainability accounting. Simply knowing that 71.5 percent of Total’s employees, or 58 percent in the case of Electrolux, were covered by collective bargaining in 2018 and 2017, respectively, tells us nothing about their different performance trends, which in one case is trending upwards, and in the other downwards.
It is also crucial to provide country-by-country data to reflect and detect variations in countries where key affiliates and major suppliers operate, as noted in the case of PUMA (see Box O.4). A number of corporations are also attempting to extend the collection and disclosure of infor-mation beyond top-tier suppliers to others in the supply chain, including raw material suppliers.
High sustainability performance would be as-sessed not only on the basis of high rates of unionization and collective bargaining coverage, but also ongoing improvements through time and the extent to which significant regional or country deficits are corrected. It should be noted that certain legal contexts may limit both workers and companies in their ability to enable unionization. The same need not apply for collective bargaining, however, given the possibility of diverse forms of worker participation and representation in governance within the enterprise which do not necessarily require a trade union.
Given the importance in some countries of sectoral and national-level bargaining, there may be limits as to what should be expected of corporations in terms of quantitative im-provements in collective bargaining coverage at the enterprise level. Nonetheless, this suggests that corporate responsibility should extend beyond enterprise-level efforts to facilitate freedom of association and collective bargaining
to encompass corporate lobbying and other forms of political influence that promote rather than resist progressive labour market policy reforms (as discussed in Chapter 9 of the report).
It is important to contextualize data on labour rights. Positive trends in freedom of association and collective bargaining coverage may mask regressive trends, such as significant decline in permanent or fixed-term employment and/or increased reliance on subcontracted labour, both of which are often associated with weak labour rights. It is useful, therefore, to (i) provide and compare time-series data on permanent and fixed-term employment with that on rev-enues and profits, and (ii) disclose data on the percentage of the workforce of affiliates or top-tier suppliers that are subcontracted.
The efforts of corporations to support labour rights within their supply chain are often contradicted by aggressive commercial policy and purchasing practices that constrain the capacity of suppliers to respond to enhanced sustainability norms through upgrading in the areas of labour rights and working conditions. To assess the prevalence of such situations, it would be useful for corporations to disclose the scale of financial support and incentives provided for suppliers engaged in social or sustainability upgrading.
22
UNRISD
[I]ncreasing market concentration in leading sectors of the global economy and the growing market and lobbying powers of dominant corporations are creating a new form of global rentier capitalism to the detriment of balanced and inclusive growth for the many.
UNCTAD (2017:119)
The challenge of reconfiguring power relations involves not only enhancing the capacity of stakeholders negatively impacted by inequality and unsustainable development to exert claims on corporations and governments, but also restricting the capacity of corporate interests to shape public policy in ways that reproduce and reinforce inequitable patterns of development (see Box O.6).
Corporate political influence (CPI) has risen dramatically in recent decades. This reflects both the volume of financial and human resources allocated by corporations to electoral politics, lobbying and other forms of policy advocacy, as well as the relative decline of countervailing ideological and political forces associated historically with developmental or welfare states, trade unionism and other forms
Corporate Political Influence
“
CHAPTER 9
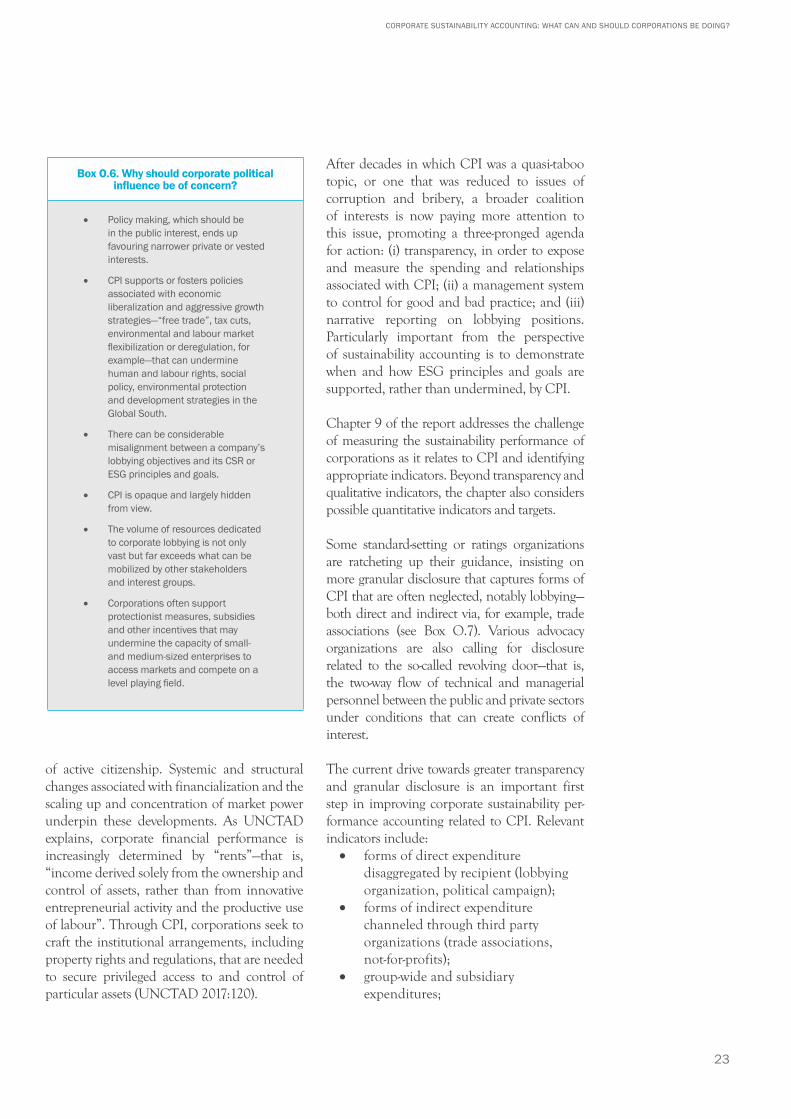
23
CORPORATE SUSTAINABILITY ACCOUNTING: WHAT CAN AND SHOULD CORPORATIONS BE DOING?
of active citizenship. Systemic and structural changes associated with financialization and the scaling up and concentration of market power underpin these developments. As UNCTAD explains, corporate financial performance is increasingly determined by “rents”—that is, “income derived solely from the ownership and control of assets, rather than from innovative entrepreneurial activity and the productive use of labour”. Through CPI, corporations seek to craft the institutional arrangements, including property rights and regulations, that are needed to secure privileged access to and control of particular assets (UNCTAD 2017:120).
After decades in which CPI was a quasi-taboo topic, or one that was reduced to issues of corruption and bribery, a broader coalition of interests is now paying more attention to this issue, promoting a three-pronged agenda for action: (i) transparency, in order to expose and measure the spending and relationships associated with CPI; (ii) a management system to control for good and bad practice; and (iii) narrative reporting on lobbying positions. Particularly important from the perspective of sustainability accounting is to demonstrate when and how ESG principles and goals are supported, rather than undermined, by CPI.
Chapter 9 of the report addresses the challenge of measuring the sustainability performance of corporations as it relates to CPI and identifying appropriate indicators. Beyond transparency and qualitative indicators, the chapter also considers possible quantitative indicators and targets.
Some standard-setting or ratings organizations are ratcheting up their guidance, insisting on more granular disclosure that captures forms of CPI that are often neglected, notably lobbying—both direct and indirect via, for example, trade associations (see Box O.7). Various advocacy organ izations are also calling for disclosure related to the so-called revolving door—that is, the two-way flow of technical and managerial personnel between the public and private sectors under conditions that can create conflicts of interest.
The current drive towards greater transparency and granular disclosure is an important first step in improving corporate sustainability per-formance accounting related to CPI. Relevant indicators include:• forms of direct expenditure
disaggregated by recipient (lobbying organization, political campaign);
• forms of indirect expenditure channeled through third party organizations (trade associations, not-for-profits);
• group-wide and subsidiary expenditures;
Box O.6. Why should corporate political influence be of concern?
• Policy making, which should be in the public interest, ends up favouring narrower private or vested interests.
• CPI supports or fosters policies associated with economic liberalization and aggressive growth strategies—“free trade”, tax cuts, environmental and labour market flexibilization or deregulation, for example—that can undermine human and labour rights, social policy, environmental protection and development strategies in the Global South.
• There can be considerable misalignment between a company’s lobbying objectives and its CSR or ESG principles and goals.
• CPI is opaque and largely hidden from view.
• The volume of resources dedicated to corporate lobbying is not only vast but far exceeds what can be mobilized by other stakeholders and interest groups.
• Corporations often support protectionist measures, subsidies and other incentives that may undermine the capacity of small- and medium-sized enterprises to access markets and compete on a level playing field.
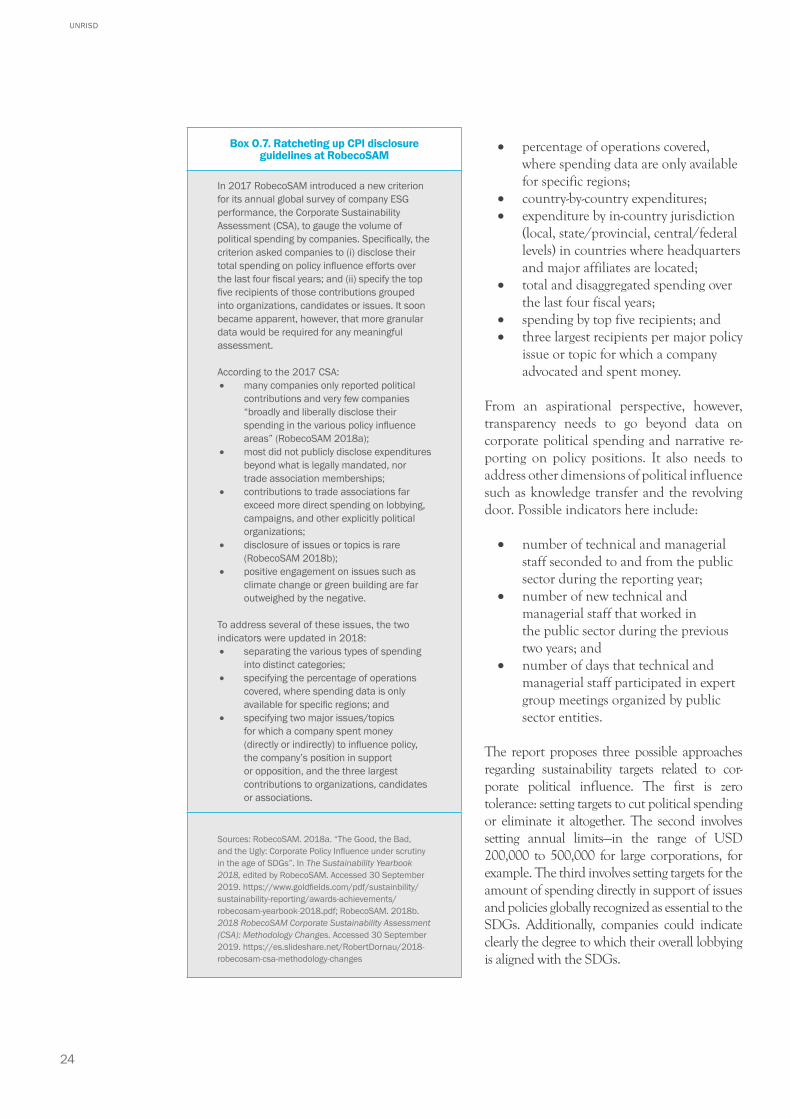
24
UNRISD
• percentage of operations covered, where spending data are only available for specific regions;
• country-by-country expenditures; • expenditure by in-country jurisdiction
(local, state/provincial, central/federal levels) in countries where headquarters and major affiliates are located;
• total and disaggregated spending over the last four fiscal years;
• spending by top five recipients; and• three largest recipients per major policy
issue or topic for which a company advocated and spent money.
From an aspirational perspective, however, transparency needs to go beyond data on corporate political spending and narrative re-porting on policy positions. It also needs to address other dimensions of political influence such as knowledge transfer and the revolving door. Possible indicators here include:
• number of technical and managerial staff seconded to and from the public sector during the reporting year;
• number of new technical and managerial staff that worked in the public sector during the previous two years; and
• number of days that technical and managerial staff participated in expert group meetings organized by public sector entities.
The report proposes three possible approaches regarding sustainability targets related to cor-porate political influence. The first is zero tolerance: setting targets to cut political spending or eliminate it altogether. The second involves setting annual limits—in the range of USD 200,000 to 500,000 for large corporations, for example. The third involves setting targets for the amount of spending directly in support of issues and policies globally recognized as essential to the SDGs. Additionally, companies could indicate clearly the degree to which their overall lobbying is aligned with the SDGs.
Box O.7. Ratcheting up CPI disclosure guidelines at RobecoSAM
In 2017 RobecoSAM introduced a new criterion for its annual global survey of company ESG performance, the Corporate Sustainability Assessment (CSA), to gauge the volume of political spending by companies. Specifically, the criterion asked companies to (i) disclose their total spending on policy influence efforts over the last four fiscal years; and (ii) specify the top five recipients of those contributions grouped into organizations, candidates or issues. It soon became apparent, however, that more granular data would be required for any meaningful assessment.
According to the 2017 CSA: • many companies only reported political
contributions and very few companies “broadly and liberally disclose their spending in the various policy influence areas” (RobecoSAM 2018a);
• most did not publicly disclose expenditures beyond what is legally mandated, nor trade association memberships;
• contributions to trade associations far exceed more direct spending on lobbying, campaigns, and other explicitly political organizations;
• disclosure of issues or topics is rare (RobecoSAM 2018b);
• positive engagement on issues such as climate change or green building are far outweighed by the negative.
To address several of these issues, the two indicators were updated in 2018:• separating the various types of spending
into distinct categories; • specifying the percentage of operations
covered, where spending data is only available for specific regions; and
• specifying two major issues/topics for which a company spent money (directly or indirectly) to influence policy, the company’s position in support or opposition, and the three largest contributions to organizations, candidates or associations.
Sources: RobecoSAM. 2018a. “The Good, the Bad, and the Ugly: Corporate Policy Influence under scrutiny in the age of SDGs”. In The Sustainability Yearbook 2018, edited by RobecoSAM. Accessed 30 September 2019. https://www.goldfields.com/pdf/sustainbility/sustainability-reporting/awards-achievements/robecosam-yearbook-2018.pdf; RobecoSAM. 2018b. 2018 RobecoSAM Corporate Sustainability Assessment (CSA): Methodology Changes. Accessed 30 September 2019. https://es.slideshare.net/RobertDornau/2018-robecosam-csa-methodology-changes
25
CORPORATE SUSTAINABILITY ACCOUNTING: WHAT CAN AND SHOULD CORPORATIONS BE DOING?
Summing UpPart 2 of the report focuses on a concise set of key performance issues that relate to the structural determinants of (un)sustainable development. None of the issue areas is entirely new and yet, while key from the perspective of transformative change, they have been poorly treated within the field of corporate sustainability assessment. Within the portfolio of reporting guidelines of several standard-setting and ratings organizations can be found metrics and indicators that relate to each of the five areas. The report argues, however, that the disclosure bar needs to be raised in various respects.
It is also important to note that while the normative targets identified in the report may appear highly ambitious, they should not simply be dismissed as unrealistic or unhelpful. As noted in relation to carbon emissions, for example, several companies committed to sustainable development objectives are calculating their im-pacts along the entire value chain within their sphere of influence. In so doing, they recognize the daunting challenge posed by science-based emissions targets. They also realize, however, that such measurement and disclosure is critical for alerting management and other stakeholders to the scale of the challenge ahead and for developing a long-term strategy. Such measurement and re-porting, in itself, can be an indicator of whether a corporation truly comprehends the meaning of sustainable development, its position on a sustainability pathway, and where it needs to travel to transform fundamentally.
Raising the barThe bottom line is that it is only possible to gauge whether a company is on a sustainability pathway if it discloses data that are struc turally oriented, quantified, contextualized and user friendly.
The starting point is to prioritize issue areas that relate to the structures that reproduce inequality and injustice. The report argues that the emerging shift within environmental
disclosure—from a narrow concern for resource intensity to the more ambitious goal of absolute decoupling—serves this purpose, as it directs attention to the need for transformative change associated with production and consumption patterns. The five issue areas that are the focus of Part 2 of the report would accomplish a similar purpose for aspects of sustainability associated with distributional justice, gender equality and de mocratic governance.
Throughout, the report also insists on the need to pay more attention to quantitative indicators and to guard against reading too much into many of the qualitative indicators that are often held up as a proxy for improved performance. Another major concern is that conventional disclosure and reporting tend to be de-contextualized, that is, disconnected from certain background, related or normative conditions which, when added to the equation, enable users of data to gain a far clearer picture regarding corporate sustainability performance. Company-wide aver-ages, for example, may mask major variations in performance by region, country or affiliate. A focus on activities directly controlled by the corporation may mask what is happening within a company’s sphere of influence in relation to the supply chain and distribution. Highlighting positive performance in one issue area or indicator may mask negative performance in another related area. Particularly worrisome is the fact that conventional sustainability reporting generally focuses on current performance with-out contextualizing the present in relation to either the past or the future. It is impossible to assess current performance without knowing whence we came (past performance) and where we want to get to in terms of normative targets.
The report’s main findings related to (i) how issues and indicators could be reconfigured, (ii) the need for more granular and transparent disclosure, and (iii) normative targets that define performance in relation to sustainable development are summarized below.
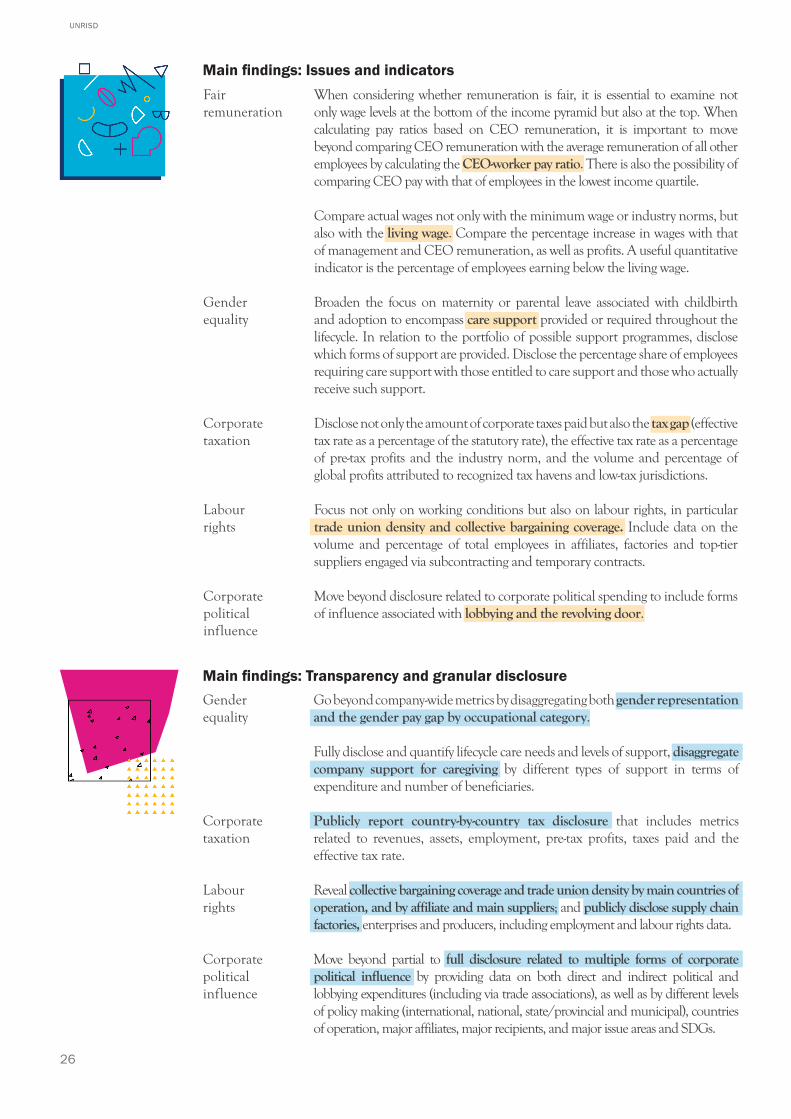
26
UNRISD
Fair remuneration
When considering whether remuneration is fair, it is essential to examine not only wage levels at the bottom of the income pyramid but also at the top. When calculating pay ratios based on CEO remuneration, it is important to move beyond comparing CEO remuneration with the average remuneration of all other employees by calculating the CEO-worker pay ratio. There is also the possibility of comparing CEO pay with that of employees in the lowest income quartile.
Compare actual wages not only with the minimum wage or industry norms, but also with the living wage. Compare the percentage increase in wages with that of management and CEO remuneration, as well as profits. A useful quantitative indicator is the percentage of employees earning below the living wage.
Gender equality
Broaden the focus on maternity or parental leave associated with childbirth and adoption to encompass care support provided or required throughout the lifecycle. In relation to the portfolio of possible support programmes, disclose which forms of support are provided. Disclose the percentage share of employees requiring care support with those entitled to care support and those who actually receive such support.
Corporate taxation
Disclose not only the amount of corporate taxes paid but also the tax gap (effective tax rate as a percentage of the statutory rate), the effective tax rate as a percentage of pre-tax profits and the industry norm, and the volume and percentage of global profits attributed to recognized tax havens and low-tax jurisdictions.
Labour rights
Focus not only on working conditions but also on labour rights, in particular trade union density and collective bargaining coverage. Include data on the volume and percentage of total employees in affiliates, factories and top-tier suppliers engaged via subcontracting and temporary contracts.
Corporate political influence
Move beyond disclosure related to corporate political spending to include forms of influence associated with lobbying and the revolving door.
Main findings: Issues and indicators
Main findings: Transparency and granular disclosureGender equality
Go beyond company-wide metrics by disaggregating both gender representation and the gender pay gap by occupational category.
Fully disclose and quantify lifecycle care needs and levels of support, disaggregate company support for caregiving by different types of support in terms of expenditure and number of beneficiaries.
Corporate taxation
Publicly report country-by-country tax disclosure that includes metrics related to revenues, assets, employment, pre-tax profits, taxes paid and the effective tax rate.
Labour rights
Reveal collective bargaining coverage and trade union density by main countries of operation, and by affiliate and main suppliers; and publicly disclose supply chain factories, enterprises and producers, including employment and labour rights data.
Corporate political influence
Move beyond partial to full disclosure related to multiple forms of corporate political influence by providing data on both direct and indirect political and lobbying expenditures (including via trade associations), as well as by different levels of policy making (international, national, state/provincial and municipal), countries of operation, major affiliates, major recipients, and major issue areas and SDGs.

27
CORPORATE SUSTAINABILITY ACCOUNTING: WHAT CAN AND SHOULD CORPORATIONS BE DOING?
Main findings: Normative goals, targets or target ranges
• CEO-worker pay ratios in the region of 10-50 to 1 depending on sectors and institutional settings
• Wage levels that meet the living wage
• Decreases in the gender pay gap of 3 percent or more per annum, and a gender pay gap of less than 3 percent
• Equal representation of women and men in the workforce; women’s representation above 40 percent at board and executive levels
• A corporate tax gap within the 0 to 5 percent range
• An increasing as opposed to declining trend in collective bargaining coverage, with the aim of achieving full coverage
• Zero corporate political spending, or spending not exceeding USD 200,000 to 500,000 per year in the case of large corporations
• Regarding the revolving door, zero movement of personnel from the public to the private sector during a two-year cooling off period
The discussion in Part 2 also insists on the need to enhance user-friendly disclosure through time series data that reveal trends over time. A five-, 10- or even 20-year time horizon for several of the above indicators is far more revealing than an annual or two- to three-year snapshot. Time series data are important for revealing instances of contradictory performance or red flags. Such data allow stakeholders to better assess the validity of the seemingly positive developments in corporate sustainability metrics and indicators associated with fair remuneration, labour rights/employment and corporate political influence, as noted below.
Fair remuneration
Does compliance with minimum wage regulations and industry norms mask the fact that increases in nominal wages fall far short of increases in labour productivity and profits, or do not translate into increased real wages when adjusted for inflation?
Labour rights
Do increasing rates of collective bargaining coverage among full-time em-ployees occur in a context where the percentage share of full-time employees is declining in relation to subcontracted (non-unionized) labour? How do changing levels of full-time employment compare with those of revenues and profits? Such data reveal whether economic growth supports or undermines growth in full-time employment.
Corporate political influence
Long-term trends that indicate growing market share may signal a context conducive to increased corporate political activity and influence.
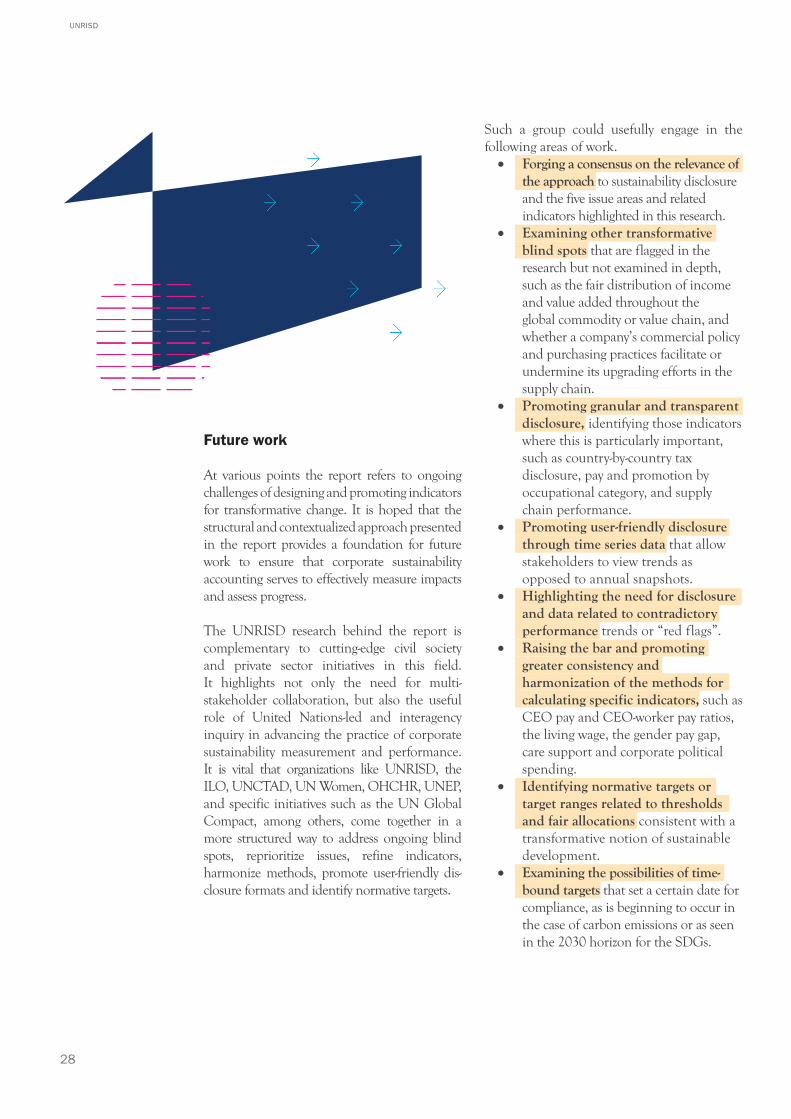
28
UNRISD
Future work
At various points the report refers to ongoing challenges of designing and promoting indicators for transformative change. It is hoped that the structural and contextualized approach presented in the report provides a foundation for future work to ensure that corporate sustainability accounting serves to effectively measure impacts and assess progress.
The UNRISD research behind the report is complementary to cutting-edge civil society and private sector initiatives in this field. It highlights not only the need for multi-stakeholder collaboration, but also the useful role of United Nations-led and interagency inquiry in advancing the practice of corporate sustainability measurement and performance. It is vital that organizations like UNRISD, the ILO, UNCTAD, UN Women, OHCHR, UNEP, and specific initiatives such as the UN Global Compact, among others, come together in a more structured way to address ongoing blind spots, reprioritize issues, refine indicators, harmonize methods, promote user-friendly dis-closure formats and identify normative targets.
Such a group could usefully engage in the following areas of work.• Forging a consensus on the relevance of
the approach to sustainability disclosure and the five issue areas and related indicators highlighted in this research.
• Examining other transformative blind spots that are flagged in the research but not examined in depth, such as the fair distribution of income and value added throughout the global commodity or value chain, and whether a company’s commercial policy and purchasing practices facilitate or undermine its upgrading efforts in the supply chain.
• Promoting granular and transparent disclosure, identifying those indicators where this is particularly important, such as country-by-country tax disclosure, pay and promotion by occupational category, and supply chain performance.
• Promoting user-friendly disclosure through time series data that allow stakeholders to view trends as opposed to annual snapshots.
• Highlighting the need for disclosure and data related to contradictory performance trends or “red flags”.
• Raising the bar and promoting greater consistency and harmonization of the methods for calculating specific indicators, such as CEO pay and CEO-worker pay ratios, the living wage, the gender pay gap, care support and corporate political spending.
• Identifying normative targets or target ranges related to thresholds and fair allocations consistent with a transformative notion of sustainable development.
• Examining the possibilities of time-bound targets that set a certain date for compliance, as is beginning to occur in the case of carbon emissions or as seen in the 2030 horizon for the SDGs.
29
CORPORATE SUSTAINABILITY ACCOUNTING: WHAT CAN AND SHOULD CORPORATIONS BE DOING?
Anker, Richard, and Martha Anker. 2017. Living Wages Around the World: Manual for Measurement. Cheltenham UK: Edward Elgar
Asia Floor Wage Alliance. 2017. Calculating a Living Wage. Accessed 28 November 2019. https://asia.floorwage.org/ calculating-a-living-wage
Barrientos, Stephanie. 2019. Gender and Work in Global Value Chains: Capturing the Gains? Cambridge: Cambridge University Press.
Baue, Bill. 2019. Compared to What? A Three-Tiered Typology of Sustainable Development Performance Indicators: From Incremental to Contextual to Transformational. UNRISD Working Paper 2019-5. Geneva: UNRISD.
Baue, Bill, and Ralph Thurm. 2018. “ESG’s Illusions of Progress and Necessary Transformation.” Accessed 30 December 2018. https://reporting3.org/wp-content/uploads/2018/02/Reporting-3.0-BASIC-Event-14-February-2018-Compressed.pdf
Blasi, Jeremy, and Jennifer Bair. 2019. An Analysis of Multiparty Bargaining Models for Global Supply Chains. Conditions of Work and Employment Series. Number 105. Geneva: ILO. Accessed 30 September 2019. https://www.ilo.org/wcmsp5/groups/public/---ed_protect/---protrav/---travail/documents/publication/wcms_655541.pdf
Brock, Gillian, and Thomas Pogge. 2014. “Global Tax Justice and Global Justice”. Moral Philosophy and Politics. Volume 1, Issue 1, May.
Christian Aid, Oxfam GB, and ActionAid UK. 2015. Getting to Good: Towards Responsible Corporate Tax Behaviour. Discussion Paper. Accessed 30 September 2019. https://www.actionaid.org.uk/sites/default/files/publications/getting_to_good_towards_responsible_corporate_tax_behaviour.pdf
Faccio, Tommaso, and Valpy Fitzgerald. 2018. “Sharing the corporate tax base: equitable taxing of multinationals and the choice of formulary apportionment”. Transnational Corporations. Vol. 25. No. 2. 67-90.
Fair Labor Association. 2019. Toward Fair Compensation in Vietnam: Insights on Reaching a Living Wage. Accessed 10 December 2019. https://www.fairlabor.org/report/toward-fair-compensation-vietnam-insights-reaching-living-wage
Ferrant, Gaëlle, Luca Maria Pesando, and Keiko Nowacka. 2014. Unpaid care work: The missing link in the analysis of gender gaps in labour outcomes, OECD Development Centre, December 2014. Accessed 30 September 2019. https://www.oecd.org/dev/develop ment-gender/Unpaid_care_work.pdf
Fraser, Nancy. 2012. Can societies be commodities all the way down? Polanyian reflections on capitalist crisis. halshs-00725060. Accessed 10 December 2019. https://halshs.archives-ouvertes.fr/halshs-00725060/document
ILO. 2018. Global Wage Report 2018/19. What lies behind gender wage gaps. ILO. Geneva. Accessed 30 September 2019. https://www.ilo.org/wcmsp5/groups/public/---dgreports/---dcomm/---publ/documents/publication/wcms_650553.pdf
ILO. 2019. A quantum leap for gender equality: for a better future of work for all. ILO. Geneva. Accessed 30 September 2019. https://www.ilo.org/wcmsp5/groups/public/---dgreports/---dcomm/---publ/documents/publication/wcms_674831.pdf
IIRC (International Integrated Reporting Council). 2013. International < IR > Framework. Accessed 10 May 2020. https://integratedreporting.org/wp-content/uploads/2013/12/13-12-08-THE-INTERNATIONAL-IR-FRAMEWORK-2-1.pdf
Jackson, T. 2009. Prosperity without Growth: Economics for a Finite Planet. London: Routledge.
Lee, Joonkoo. 2016. Global Supply Chain Dynamics and Labour Governance: Implications for Social Upgrading. ILO Research Paper No. 14, Geneva: International Labour Office. Accessed 30 September 2019. https://ssrn.com/abstract=2780512
Lu, Wei, and Anders Melin. 2016. The Best and Worst Countries to Be a Rich CEO. Bloomberg. Accessed 20 December 2019. https://www.bloomberg.com/news/articles/2016-11-16/ranking-where-to-work-to-be-a-rich-ceo-or-richer-than-neighbors
McElroy, Mark W. 2019. Making Materiality Determinations A Context-Based Approach. UNRISD Working Paper 2019-6. Geneva: UNRISD. Accessed 10 May 2020. http://www.unrisd.org/unrisd/website/document.nsf/(httpPublications)/8E6C3DED0A B73F53802584C8004F6AC1
McKinsey & Co. and LeanIn.Org. 2018. Women in the Workplace 2018. Accessed 10 August 2020. https://www.mckinsey.com/featured-insights/gender-equality/women-in-the-workplace-2018
McKinsey & Co. and LeanIn.Org. 2019. Women in the Workplace 2019. Accessed 10 August 2020. https://www.mckinsey.com/featured-insights/gender-equality/women-in-the-workplace-2019
Meadows, Donella. 1998. Indicators and Information Systems for Sustainable Development. http://donellameadows.org/archives/indicators-and-information-systems-for-sustainable-development/
Molyneux, Maxine, and Shahra Razavi. 2002. “Introduction.” In Gender Justice, Development, and Rights, edited by Maxine Molyneux and Shahra Razavi. Oxford: Oxford University Press.
References
30
UNRISD
Piketty, Thomas. 2014. Capital in the Twenty-First Century. Cambridge, MA: Belknap Press of Harvard University Press.
PRI (Principles for Responsible Investment). 2018. Evaluating and Engaging on Corporate Tax Transparency. An Investor Guide. PRI. Accessed 30 November 2019. https://d8g8t13e9vf2o.cloudfront.net/Uploads/t/r/l/PRI_Evaluating-and-engaging-on-corporate-tax-transparency_Investor-guide.pdf
Raworth, Kate. 2017. Doughnut Economics: Seven Ways to Think Like a 21st-Century Economist. Penguin.
Reynaud, Emmanuel, 2017. The Inter-national Labour Organization and the Living Wage: A Historical Perspective. Inclusive Labour Markets, Labour Relations and Working Conditions Branch. Geneva: International Labour Office.
Sabadish, Natalie, and Lawrence Mishel. 2013. Methodology for Measuring CEO Compensation and the Ratio of CEO-to-Worker Compensation, 2012 data update. Economic Policy Institute. Working Paper 298. Accessed 30 November 2019. https://www.epi.org/publication/methodology-measuring-ceo-compensation-ratio/
Sayani, Ankit. 2017. The Tax Gap: Regulatory Responses and Implications for Institutional Investors. Accessed 30 September 2019. https://www.msci.com/documents/10199/93765fb6- 7685-4a04-b124-d71d4f6195a2
Task Force on Climate-related Financial Disclosures. 2017. Recommendations of the Task Force on Climate-Related Disclosures. Accessed 30 September 2019. https://www.fsb-tcfd.org/wp-content/uploads/2017/06/FINAL-2017-TCFD-Report-11052018.pdf
Thomas, Martin P., and Mark W. McElroy. 2016. The MultiCapital Scorecard: Rethinking Organizational Performance. White River Junction, VT: Chelsea Green Publishing.
Thurm, Ralph, Bill Baue, and Cornis van der Lugt. 2018. Blueprint 5. The Transformation Journey: A Step-By-Step Approach to Organizational Thriveability and System Value Creation. Synthesis of the Reporting 3.0 Work Ecosystem Version 1.0. Accessed 30 December 2018. https://reporting3.org/wp-content/uploads/2018/06/R3-BP5.pdf
Tørsløv, Thomas R., Ludvig S. Wier, and Gabriel Zucman. 2018. The Missing Profit of Nations. National Bureau of Economic Research (NBER) Working Paper 24701. Accessed 19 December 2019. https://gabriel-zucman.eu/files/TWZ2018.pdf
UNCTAD. 2017. Trade and Development Report 2017: Beyond Austerity: Towards a Global New Deal. New York/Geneva: UNCTAD. Accessed 19 December 2019. https://unctad.org/en/Publications Library/tdr2017_en.pdf
UNRISD. 2005. Gender Equality: Striving for Justice in an Unequal World. Geneva: UNRISD. Accessed 10 December 2019. http://www.unrisd.org/ 80256B3C005BCCF9/search/1FF4AC64C1894EA AC1256FA3005E7201
UNRISD. 2016. Policy Innovations for Transformative Change: Implementing the 2030 Agenda for Sustainable Development. Geneva: UNRISD. Accessed 30 September 2019. http://www.unrisd.org/flagship2016
UN Women. 2018. Facts and Figures: Economic Empowerment. Updated July. Accessed 30 September 2019. https://www.unwomen.org/en/what-we-do/economic-empowerment/facts-and-figures
31
CORPORATE SUSTAINABILITY ACCOUNTING: WHAT CAN AND SHOULD CORPORATIONS BE DOING?
Introduction
Efforts to regulate transnational corporations in the 1970s19 and the popularization of the concept of sustainable development in the late 1980s20 spurred a global movement to enhance the social and environmental responsibility of companies. Numerous terms and concepts encapsulate this approach: corporate social responsibility (CSR), corporate citizenship, corporate sustainability, shared value, blended value organizations, the fourth sector, and impact investing, among others. Given the multiplicity of terms and for convenient shorthand, we will refer to this field as that of corporate responsibility (CR).
Within the CR field, “sustainability” is generally defined in terms of practices and processes geared towards a “triple bottom line” approach that simultaneously addresses financial/economic, social and environmental objectives (Elkington 1997). Another term, “ESG” (environmental,
social and governance) performance, also empha-sizes responsibility related to “good govern ance” (including transparency, accountability and stakeholder participation).
The upshot of these efforts has been the emer-gence and consolidation of a vast CR ecosystem comprising myriad organizations and institutions associated with the private sector, civil society and government, operating locally, nationally, regionally and internationally (Utting 2012a,b). Much of the work of the CR ecosystem has centred on designing standards and promoting ESG or non-financial reporting. Thus, most large corporations today disclose and publicly report data related to CR principles, policies, management systems and performance. And other enterprises, notably small and medium-sized enterprises (SMEs) and top-tier suppliers in global value chains, increasingly engage in sustainability measurement, disclosure and reporting.
P A R T 1
Assessing the State of Play
19 Particularly relevant were the 1976 OECD Guidelines for Multinational Enterprises and the 1977 ILO Tripartite Declaration of Principles concerning Multinational Enterprises and Social Policy.
20 See the report of the World Commission on Environment and Development (1987), Our Common Future, which defined sustainable development as “development that meets the needs of the present without compromising the ability of future generations to meet their own needs”.
32
UNRISD
The energetic expansion of disclosure in recent decades would seem to bode well for advancing towards a sustainable future. The macro pic ture, however, does not appear to support any assumption of linear progress. Indeed, recent United Nations assessments indicate the con trary: global greenhouse gas emissions, for example, reached a peak in 2017, a year when the energy and industry sectors increased their emission levels (UNEP 2018). The reduction of working poverty has slowed, while vulnerable employment continues to rise, accounting for 42 percent of the world’s workers (ILO 2018). Furthermore, there are serious concerns within the field of corporate sustainability disclosure itself. The information reported by corporations and what is demanded of them by the CR industry often contradict basic accounting prin ciples and standards.
Part 1 of this report takes stock of developments and ongoing challenges associated with corpo-rate sustainability disclosure and reporting. Divided into three chapters, it begins by looking at how the field of environmental, social and governance performance disclosure has evolved during the past three decades.
Chapter 1 identifies key trends and developments—from the early phase of superficial disclosure to the significant ratcheting up of standards and processes, as well as the development of an institutional ecosystem that promotes, supports and regulates disclosure and reporting.
Chapter 2 takes stock of ongoing issues and challenges associated with some of the basic principles of accounting, including user-friendliness, comparability, reliability, credi-bility, relevance and materiality. It goes on to identify several recent innovations driven by the mainstream CR industry that aim to address these challenges, including attempts to align reporting frameworks, simplify com-plex disclosure requirements, place a value on impacts via monetization, and better determine what is relevant and material from the perspective of sustainable development.
Chapter 3 questions whether past and present innovations can place corporate sustainability
performance accounting on a track that is fit for the purpose of assessing progress towards sustainable development. It suggests that much still needs to change if the CR agenda is to effectively contribute to the realization of the 2030 Agenda and transformative change. Pursuing the trajectory of incremental change guided by a “do less harm” approach runs the risk of bypassing issues, indicators and targets that are key from the perspective of transformative change. The reason why these particular issues, indicators and targets are key is because they relate to the structures that reproduce and reinforce unsustainable and exclusionary patterns of development, including patterns of inequality and skewed power relations, as well as forms of growth and capital accumulation that generate so-called social and environmental externalities. Such issues need to be put at the centre of the CR agenda if we are to develop enterprise and finance models geared more explicitly towards human well-being and planetary health.
To chart a path forward, Chapter 3 suggests that it is useful to think outside the box of mainstream innovations and dynamics that are constantly tweaking the CR agenda. Four avenues of inquiry are presented: (i) a set of cutting-edge innovations associated with ambitious target setting; (ii) learning from other business or enter prise models and varieties of capitalism that appear to be more conducive to inclusive and sustainable development; (iii) replicating in the social arena the science-based approach that has gained currency in relation to environmental disclosure, by learning from social science theory and multiple disciplinary perspectives; and (iv) learning from different worldviews and the perspectives of not only conventional stakeholders but also other “rightsholders”21. All four avenues provide important insights into the fundamental factors that explain and resolve unsustainable development. Furthermore, they point us to key issue areas, indicators and targets that are not only highly relevant from the perspective of sustainable development and transformative change, but also often neglected within conventional corporate sustainability accounting.21 See Thurm et al. 2018.
33
CORPORATE SUSTAINABILITY ACCOUNTING: WHAT CAN AND SHOULD CORPORATIONS BE DOING?
With globalization, transnational corporations were seen to be reaping considerable bene fits without assuming commensurate respon-sibilities in relation to their social and environmental im pacts (UNRISD 1995). Throughout the 1980s, a series of high-profile disasters, scandals and exposés raised public and political awareness of this mismatch. They involved, for example, oil and toxic gas spills (Exxon, Union Carbide), complicity in human rights abuses (Shell), corporate connections to rainforest destruction (McDonalds), sweat-shop labour (Nike) and child labour (carpet industry), and unethical marketing of infant formula (Nestlé).
With greater freedom for the market comes greater responsibility.
Gro Harlem Brundtland22
22 Speech at Second World Industry Conference on Environmental Management. 10 April 1991. Rotterdam. Accessed 15 June 2020. https://www.regjeringen.no/globalassets/upload/smk/vedlegg/taler-og-artikler-av-tidligere-statsministre/gro-harlem-brundtland/1991/dinner-speech-at-conference-on-environmental-management.pdf
“
CHAPTER 1
A 30-Year Journey
34
UNRISD
Watchdog organizations and other forms of “civil regulation” of business actively named and shamed corporations and industry sectors (Bendell and Murphy 2002). And in a context where intangible assets, notably brand names, were becoming an ever more valuable asset,23 it was essential for corporations to safeguard reputation and gain reputational advantage. Threats of government regulation to deal with environmental and other harms associated with corporate behaviour and value chains further pressured companies to self-regulate through voluntary initiatives (NGLS and UNRISD 2002).
Meanwhile, strands of management theory put paid to Milton Friedman’s (1970) adage that “the business of business is business”. Rather, the modern-day corporation should respond to not only the concerns of governments (regulation) and shareholders but also a far broader range of “stakeholders”, defined as those that affect—or are affected by—a company’s operations (Freeman 1984). Such responsiveness was key to gaining a competitive advantage. CR also came to be associated with Total Quality Management—the comprehensive management approach for enhancing quality and reputation, as well as fostering “continuous improvement”—which was instrumental in the success of the Japanese business model in the 1970s and 1980s (Deming 1986). Later Peter Senge (1990) would expand this approach to emphasize the virtues of the adaptive or “learning organization”, a concept that resonated with the evolving CR agenda.
In this context of external pressures and en-light ened self-interest, the field of corporate environmental and social responsibility ex pand-ed rapidly. Early initiatives centred to a large extent on developing industry and company codes of conduct (Jenkins 2002). The nature of corporate philanthropy also began to change, with corporations emphasizing conventional charity less and their contribution to society more through support for local economic and social development. The disclosure and communication of information in the form of stand-alone reports, notably environmental reports, also took off.
There was, however, considerable scepticism re-garding these early initiatives. Codes of conduct were often dismissed as window dressing—an
exercise in public relations. Philanthropy was no substitute for needed reforms in labour practices and production systems, and was generally de-tached from core business strategy (Porter and Kramer 2006). Environmental reports often amounted to “green glossies” or “greenwash”;24 while pleasing to look at they provided little information of substance.
The upshot was that corporate self-regulation did not pass muster. Rather than telling stake-holders to “trust us, we’ll fix it”, companies promoting corporate social and environmental responsibility were urged to adhere to a “tell me and prove it” approach.25 “Tell me” required CR reporting; “prove it” required CR management systems, measurement of impacts, continuous improvement in both management systems and performance, and third-party verification and assurance.
Ratcheting up and institutionalization
The 1992 UN Conference on Environment and Development (Agenda 21) supported the first worldwide call to promote environmental management: “Business and industry, includ-ing transnational corporations, should recog-nize en vironmental management as among the highest corporate priorities and as a key determinant to sustainable development” (United Nations 1992: para 30.3).26 A decade later, the outcome document of the 2002 World Summit on Sustainable Development, the Johannesburg Plan of Implementation, endorsed sustainability reporting and advocated that businesses use the Global Reporting Initiative’s (GRI) Sustainability Reporting Framework launched in 2000 (see Box 1.2).
Around the turn of the millennium CR dis-closure and reporting expanded significantly. Reviewing a decade of sustainability report ing from 1992 to 2002, Ans Kolk (2004) highlighted two sets of developments linked to (i) a stake-holder approach, and (ii) “implementation like-li hood”. The stakeholder approach was evident both in reports that included data on the distribution of value added among categories such as “employees”, “state”, “shareholders”, “com pany”, and in greater attention to stake-holder dialogue and feedback. Enhanced
23 Whereas in 1975, 83 percent of S&P 500 market value was accounted for by financial and physical assets, by 2009 the figure was just 19 percent (Integrated Reporting 2011: 4).
24 See Greer and Bruno 1996.
25 See Dommen 1999.26 See http://www.un.org/
documents/ga/conf151/aconf15126-3.htm
35
CORPORATE SUSTAINABILITY ACCOUNTING: WHAT CAN AND SHOULD CORPORATIONS BE DOING?
“implementation likelihood”, that is, “moving from words to deeds”, was evident in both benchmarking of performance via increased use of performance measurements in reports and the growing influence of standard-setting entities, such as the GRI, launched in 1997. But various caveats applied, including the fact that only 28 percent of the largest 100 corporations in selected countries were publishing environmental reports, and that benchmarking tended to be related to just a few issues areas, notably health, safety and some environmental aspects (Kolk 2004).
Since the turn of the millennium there have been notable advances regarding the scale of dis-closure and reporting.• KPMG reports that the percentage
of large corporations (global top 250) producing CR reports has increased year on year, from 33 percent in 1999 to 93 percent in 2017. For the largest 100 firms in selected countries (totalling 4,900 firms), the corresponding figures were 12 percent and 72 percent (KPMG 2017).
• The world’s largest registry of reports, CorporateRegister.com, contains 97,997 corporate responsibility reports from 16,398 organizations.27
• As of mid-December 2018, some 50,638 reports, 31,198 GRI reports and 13,148 organizations were included in GRI’s Sustainability Disclosure Database.28
• KPMG et al. (2016) identify 383 mandatory and voluntary reporting instruments in 64 countries, with a particularly significant increase in recent years.
• By October 2018, the UN Global Compact recorded 9,886 firms as participants (4,556 companies and 5,330 SMEs).29
Both the scaling up of sustainability disclosure and the ratcheting up of standards has occurred in a dual context where declining trust in a range of institutions, including corporations, coexists with heightened societal expectations that business should do what is “right”.30 Civil society activism has remained a powerful driver of progressive change, expanding its portfolio of action to include not only
naming and shaming of corporations seen to be engaged in wrongdoing, but also various forms of collaboration and partnership. This combination of “insider” and “outsider” tactics has been crucial for ratcheting up standards and processes of disclosure and reporting (Bendell 2004; Utting 2005, 2008, 2012b).
The institutional ecosystem promoting, sup-porting and regulating disclosure and reporting has thickened considerably. Global development institutions and processes associated with inter-governmental and multistakeholder bodies such as the World Bank, the Organisation for Economic Co-operation and Development (OECD), the European Union (EU), the Inter-national Organization for Standardization (ISO), the International Labour Organization (ILO) and other entities in the United Nations system have also played a key role. Building on recommendations emanating from the 1992 and 2002 United Nations “Earth Summits”, the outcome document of the 2012 Rio+20 Summit further encouraged corporations to integrate sustainability disclosure into their reporting practices, and governments, industries, the United Nations and other stakeholders to work to improve this reporting.31
The OECD Guidelines for Multinational Enter-prises (MNEs) were one of the first international regulatory initiatives to establish principles and standards for responsible conduct. Adopted in 1976, the Guidelines have been periodically revised, in part to ensure greater attention to supply chain and human rights issues as well as render the complaints procedure more effective. More recently, the European Commis sion (EC) has obliged large companies to report on ESG issues through a 2014 Directive (Directive 2014/95/EU). As noted in Annex 1, the EC has provided guidance on principles, content and key performance issues and indi cators to be addressed in non-financial reporting (European Commission 2017c).
As in the case of early CR initiatives, not only push factors involving external pressures but also various pull factors associated with conventional business logic explain the ongoing ratcheting up of disclosure and reporting. By the turn of the century it had become clear that a massive “market for virtue” was emerging, creating vast
27 As noted on corporate.register.com, 11 December 2018.
28 As noted on database.globalreporting.org, 11 December 2018.
29 www.unglobalcompact.org
30 This milieu of both distrust and high expec tations continues to exist. The 2018 Edelman Trust Barometer (https://www.edelman.com/trust-barometer) reports that faith in CEOs has fallen to 37 percent while three-quarters of respondents expected companies to both increase profits and improve economic and social conditions in local communities where they operate.
31 See the Rio Outcome document at https://sustainable development.un.org/ futurewewant.html
36
UNRISD
opportunities for generating both profits and reputational advantage by catering to “green” or “ethical” consumers (Vogel 2007). Employee culture was also evolving, with millennials want-ing to work for decent companies and participate in decent causes (BCG 2017). Share holder ac tivism centred on CR concerns emerged as another driver of change. The socially respon-sible investment community also became a key player. According to RBC GAM’s 2018 inter-national survey32 of investment consultants and institutional asset owners regarding attitudes to-wards ESG integration and responsible invest-ing, 84 percent of institutional investors now incorporate ESG into their investment analysis (RBC GAM 2018).
Furthermore, certain strands of management theory insisted that corporate social responsi-bility would not be sustainable unless it were part and parcel of core business strategy that aimed to create “shared value” (Porter and Kramer 2006, 2011). Rather than simply paying farmers more via fair trade for example, the “creating shared value” approach sought to raise both productivity and the quality of products as a means to higher prices and incomes.33
The Bottom of the Pyramid (BoP) approach, popularized by Prahalad (2005), extended this logic by pointing to the business opportunities and profits associated with integrating low-income producers and communities into corpo-rate value chains as suppliers, distributors and consumers. For example, rather than donating cheap drugs, it made more sense, from this perspective, to develop a business model based on packaging and distributing drugs to low-income consumers.34 In Mexico, the cement manufacturer CEMEX, through its programme Patrimonio Hoy, organizes low-income families into self-financing cells to facilitate the building and renovation of homes.35
The changing nature of governance within some global value chains also ensured increased attention to social and environmental stan-dards. For example, within supermarket chains there has been a shift from a situation where lead firms attempted to impose stan-dards on the supply chain to one where multiple inter-firm and intra-firm relations and other multistakeholder interactions re-
produce standards throughout the chain (Pickles et al. 2016).
Another important driver of ratcheting up and institutionalization was the process of “learning by doing”. As companies gained experience with ESG initiatives, they discovered that what had initially appeared as a very high bar became less intimidating. Consequently, some aspects of corporate culture began to change. Institutionalizing sustainability disclosure and reporting within the corporation meant shifting responsibility for non-financial disclosure up the chain of command to the C-suite. In the process, such disclosure gradually moved from being a side show to one that was linked to core business strategy. As such, terminology within the CR field shifted from “corporate social responsibility” to wards “corporate sustainability”.36
The upshot of these drivers has been the emer-gence of an increasingly dense institutional eco system to promote CR and accompanying forms of sustainability disclosure. Beyond the firm itself, this ecosystem is made up of old and new actors and institutions, including:• civil society organizations, as well
as knowledge institutions, engaged in technical assistance, research, monitoring and advocacy;
• multistakeholder standard-setting, promotional, certification and monitoring institutions and initiatives, several of which are indicated in Table 1.1;
• mainstream private sector organizations and institutions such as accounting firms, stock exchanges, and business, employers or industry associations as well as other firms engaged in certification, ratings and assurance;
• state actors—including both national and intergovernmental entities—that regulate, support or otherwise promote corporate sustainability and impact assessment via public-private partnerships, regulations, and “soft” and “hard” law requiring disclosure and reporting or participation in multistakeholder standard-setting and regulatory initiatives.
32 Survey participants came from the United States, Canada, Europe and Asia.
33 Porter cited in Elkington 2011.
34 Porter cited in Elkington 2011.
35 See Shared Value Initiative 2015.
36 See Lacy et al. 2010.
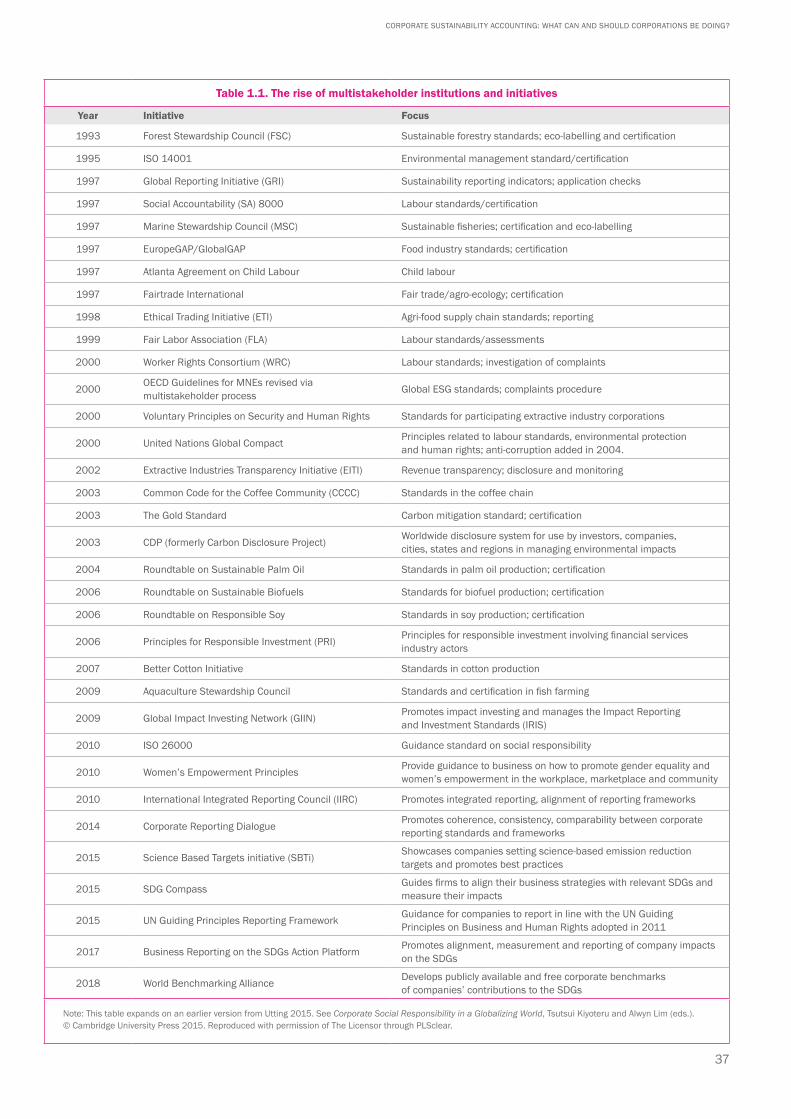
37
CORPORATE SUSTAINABILITY ACCOUNTING: WHAT CAN AND SHOULD CORPORATIONS BE DOING?
Table 1.1. The rise of multistakeholder institutions and initiatives
Year Initiative Focus
1993 Forest Stewardship Council (FSC) Sustainable forestry standards; eco-labelling and certification
1995 ISO 14001 Environmental management standard/certification
1997 Global Reporting Initiative (GRI) Sustainability reporting indicators; application checks
1997 Social Accountability (SA) 8000 Labour standards/certification
1997 Marine Stewardship Council (MSC) Sustainable fisheries; certification and eco-labelling
1997 EuropeGAP/GlobalGAP Food industry standards; certification
1997 Atlanta Agreement on Child Labour Child labour
1997 Fairtrade International Fair trade/agro-ecology; certification
1998 Ethical Trading Initiative (ETI) Agri-food supply chain standards; reporting
1999 Fair Labor Association (FLA) Labour standards/assessments
2000 Worker Rights Consortium (WRC) Labour standards; investigation of complaints
2000 OECD Guidelines for MNEs revised via multistakeholder process Global ESG standards; complaints procedure
2000 Voluntary Principles on Security and Human Rights Standards for participating extractive industry corporations
2000 United Nations Global Compact Principles related to labour standards, environmental protection and human rights; anti-corruption added in 2004.
2002 Extractive Industries Transparency Initiative (EITI) Revenue transparency; disclosure and monitoring
2003 Common Code for the Coffee Community (CCCC) Standards in the coffee chain
2003 The Gold Standard Carbon mitigation standard; certification
2003 CDP (formerly Carbon Disclosure Project) Worldwide disclosure system for use by investors, companies, cities, states and regions in managing environmental impacts
2004 Roundtable on Sustainable Palm Oil Standards in palm oil production; certification
2006 Roundtable on Sustainable Biofuels Standards for biofuel production; certification
2006 Roundtable on Responsible Soy Standards in soy production; certification
2006 Principles for Responsible Investment (PRI) Principles for responsible investment involving financial services industry actors
2007 Better Cotton Initiative Standards in cotton production
2009 Aquaculture Stewardship Council Standards and certification in fish farming
2009 Global Impact Investing Network (GIIN) Promotes impact investing and manages the Impact Reporting and Investment Standards (IRIS)
2010 ISO 26000 Guidance standard on social responsibility
2010 Women’s Empowerment Principles Provide guidance to business on how to promote gender equality and women’s empowerment in the workplace, marketplace and community
2010 International Integrated Reporting Council (IIRC) Promotes integrated reporting, alignment of reporting frameworks
2014 Corporate Reporting Dialogue Promotes coherence, consistency, comparability between corporate reporting standards and frameworks
2015 Science Based Targets initiative (SBTi) Showcases companies setting science-based emission reduction targets and promotes best practices
2015 SDG Compass Guides firms to align their business strategies with relevant SDGs and measure their impacts
2015 UN Guiding Principles Reporting Framework Guidance for companies to report in line with the UN Guiding Principles on Business and Human Rights adopted in 2011
2017 Business Reporting on the SDGs Action Platform Promotes alignment, measurement and reporting of company impacts on the SDGs
2018 World Benchmarking Alliance Develops publicly available and free corporate benchmarks of companies’ contributions to the SDGs
Note: This table expands on an earlier version from Utting 2015. See Corporate Social Responsibility in a Globalizing World, Tsutsui Kiyoteru and Alwyn Lim (eds.). © Cambridge University Press 2015. Reproduced with permission of The Licensor through PLSclear.
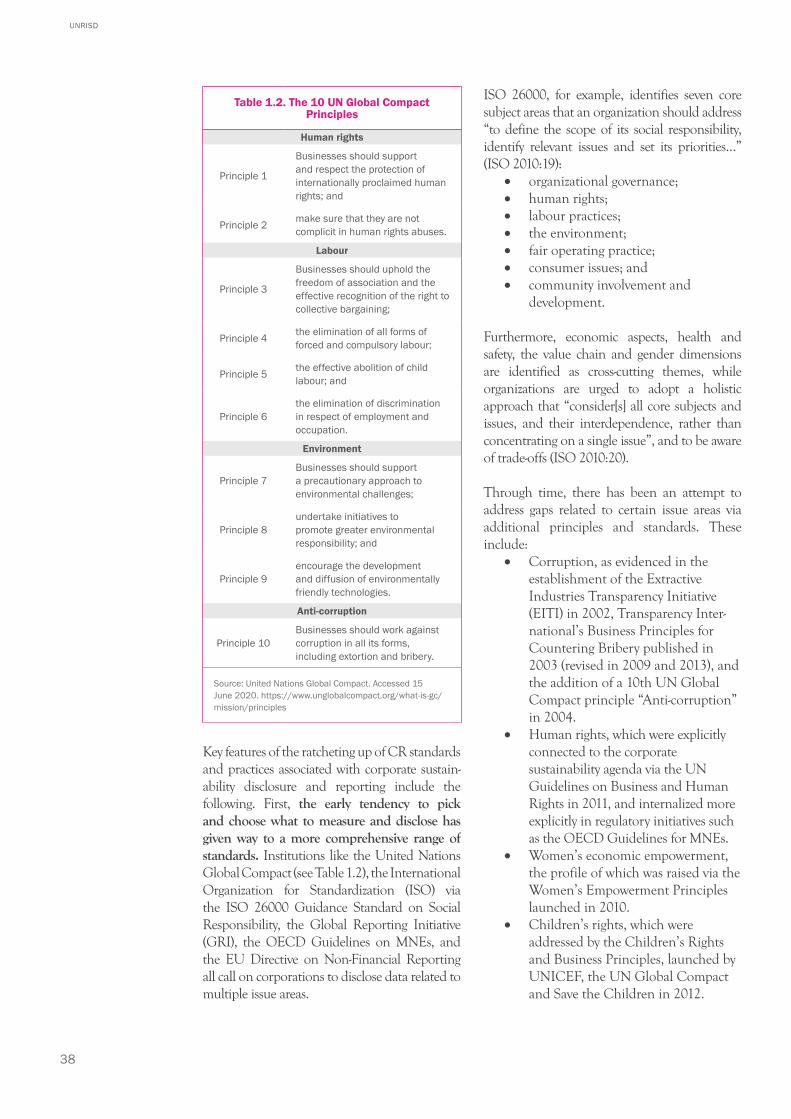
38
UNRISD
Key features of the ratcheting up of CR standards and practices associated with corporate sustain-ability disclosure and reporting include the following. First, the early tendency to pick and choose what to measure and disclose has given way to a more comprehensive range of standards. Institutions like the United Nations Global Compact (see Table 1.2), the International Organization for Standardization (ISO) via the ISO 26000 Guidance Standard on Social Responsibility, the Global Reporting Initiative (GRI), the OECD Guidelines on MNEs, and the EU Directive on Non-Financial Reporting all call on corporations to disclose data related to multiple issue areas.
ISO 26000, for example, identifies seven core subject areas that an organization should address “to define the scope of its social responsibility, identify relevant issues and set its priorities…” (ISO 2010:19):
• organizational governance;• human rights;• labour practices;• the environment;• fair operating practice;• consumer issues; and• community involvement and
development.
Furthermore, economic aspects, health and safety, the value chain and gender dimensions are identified as cross-cutting themes, while organizations are urged to adopt a holistic approach that “consider[s] all core subjects and issues, and their interdependence, rather than concentrating on a single issue”, and to be aware of trade-offs (ISO 2010:20).
Through time, there has been an attempt to address gaps related to certain issue areas via additional principles and standards. These include:
• Corruption, as evidenced in the establishment of the Extractive Industries Transparency Initiative (EITI) in 2002, Transparency Inter-national’s Business Principles for Countering Bribery published in 2003 (revised in 2009 and 2013), and the addition of a 10th UN Global Compact principle “Anti-corruption” in 2004.
• Human rights, which were explicitly connected to the corporate sustainability agenda via the UN Guidelines on Business and Human Rights in 2011, and internalized more explicitly in regulatory initiatives such as the OECD Guidelines for MNEs.
• Women’s economic empowerment, the profile of which was raised via the Women’s Empowerment Principles launched in 2010.
• Children’s rights, which were addressed by the Children’s Rights and Business Principles, launched by UNICEF, the UN Global Compact and Save the Children in 2012.
Table 1.2. The 10 UN Global Compact Principles
Human rights
Principle 1
Businesses should support and respect the protection of internationally proclaimed human rights; and
Principle 2 make sure that they are not complicit in human rights abuses.
Labour
Principle 3
Businesses should uphold the freedom of association and the effective recognition of the right to collective bargaining;
Principle 4 the elimination of all forms of forced and compulsory labour;
Principle 5 the effective abolition of child labour; and
Principle 6the elimination of discrimination in respect of employment and occupation.
Environment
Principle 7Businesses should support a precautionary approach to environmental challenges;
Principle 8undertake initiatives to promote greater environmental responsibility; and
Principle 9 encourage the development and diffusion of environmentally friendly technologies.
Anti-corruption
Principle 10Businesses should work against corruption in all its forms, including extortion and bribery.
Source: United Nations Global Compact. Accessed 15 June 2020. https://www.unglobalcompact.org/what-is-gc/mission/principles
39
CORPORATE SUSTAINABILITY ACCOUNTING: WHAT CAN AND SHOULD CORPORATIONS BE DOING?
• Lobbying practices, with disclosure and reporting guidelines not only calling for greater transparency but also lobbying to “drive stronger social and environmental policy frameworks in support of core business” (SustainAbility and WWF 2005:3).
• Taxation, in a context where “regulation on tax disclosure has increased as companies come under increasing pressure to demonstrate they pay their fair share of taxes in all countries in which they operate” (KPMG International et al. 2016:9).
• Supply chain management, with the establishment of several certification bodies in the late 1990s, and other initiatives, such as the Sustainability Accounting Standards Board (SASB)37 Supplier Code of Conduct.
• Poverty reduction, particularly in the context of the UN Millennium Development Goals (MDGs) and subsequent SDGs (van Tulder 2010).
New issues are constantly being put on the table. Among key emerging issues currently are those related to carbon emissions and the SDGs (SustainAbility 2018).
While initiatives such as ISO 26000, the UN Global Compact and GRI have sought to identify a set of core issue areas of relevance to multiple stakeholders, others like the Sustainability Accounting Standards Board focus primarily on issues material to the company itself in the context of the particular sector within which it operates. Core issues specified by SASB are listed in Annex 2.
Ratcheting up is also apparent in relation to specific issue areas. With regard to remuneration, for example, the attention of certain standard-setting entities such as the Ethical Trading Initiative (ETI) has broadened beyond the pay-ment of minimum wages to the payment of a “living wage”, the topic addressed in Chapter 5. The clothing retailer H&M adopted, in 2013, a “Fair Living Wage Strategy”. The labour standards certification scheme SA8000 transitioned from going beyond certifying compliance with the law, or with the prevailing industry wage, to certifying whether workers were being paid a wage that
was sufficient to meet basic needs. Furthermore, in a context where the law in China does not mandate collective bargaining, SA8000 also called on companies seeking certification for their operations in China to allow workers to freely elect a representative (Rasche and Gilbert 2012:74).
Similarly, in the field of labour rights (addressed in Chapter 8 of this report), global union federations and transnational corporations have signed international framework agreements (IFA) which commit the corporation in ques-tion to assuming responsibility for labour standards across its global operations. The number of transnational corporations signing IFAs increased from 14 in 2001 to 119 in 2017 (Hadwiger 2018; ILO 2018).
A key aspect of ratcheting up relates to the proc-ess by which a company goes beyond a policy statement that signals its commitment to re-sponsible behaviour regarding a particular issue, to specify and apply concrete implementation measures. The discussion below, related to the application of the Women’s Empowerment Principles, is a case in point. The uptake and application of the UN Guiding Principles on Business and Human Rights is another.
Second, progress in terms of a more compre-hensive approach is evident in the fact that additional industry sectors and types of busi-ness have coalesced under the CR umbrella. Particularly relevant in this regard is the financial services sector, which was engaged through initiatives such as the Equator Principles related to managing risk associated with project finance. Initially launched in 2003, the Equator Principles were based on the International Finance Corpo-ration’s (IFC) Performance Standards on En-vi ronmental and Social Sustainability. The Principles for Responsible Investment (PRI), launched in 2006, engaged a far broader range of financial institutions. The PRI has approximately 1,500 reporting signatories38 from the financial services industry.39 The 2017 KPMG Survey of Corporate Responsibility Reporting found that for the first time in the history of the survey every industry sector had a reporting rate of 60 percent or greater. The GRI and the SASB have also developed comprehensive industry and sectoral guidelines and tools.40
37 SASB Sustainability Accounting Standards are comprised of dis-closure guidance and accounting standards on sustain ability topics for use by United States and foreign public companies in their annual filings with the United States Securities and Exchange Commission (SEC). The SASB Stan dards aim to help companies ensure that disclosure is standardized and therefore “decision-useful”, relevant, comparable and comprehensive (SASB 2017a).
38 PRI Signatories are required to report annually. Those that do not are delisted.
39 See PRI 2018 Annual Report https://d8g8t13e9vf2o.cloudfront.net/Uploads/g/f/c/priannualreport_ 605237.pdf
40 In March 2016, SASB released provisional standards for 79 industries (SASB 2017b).
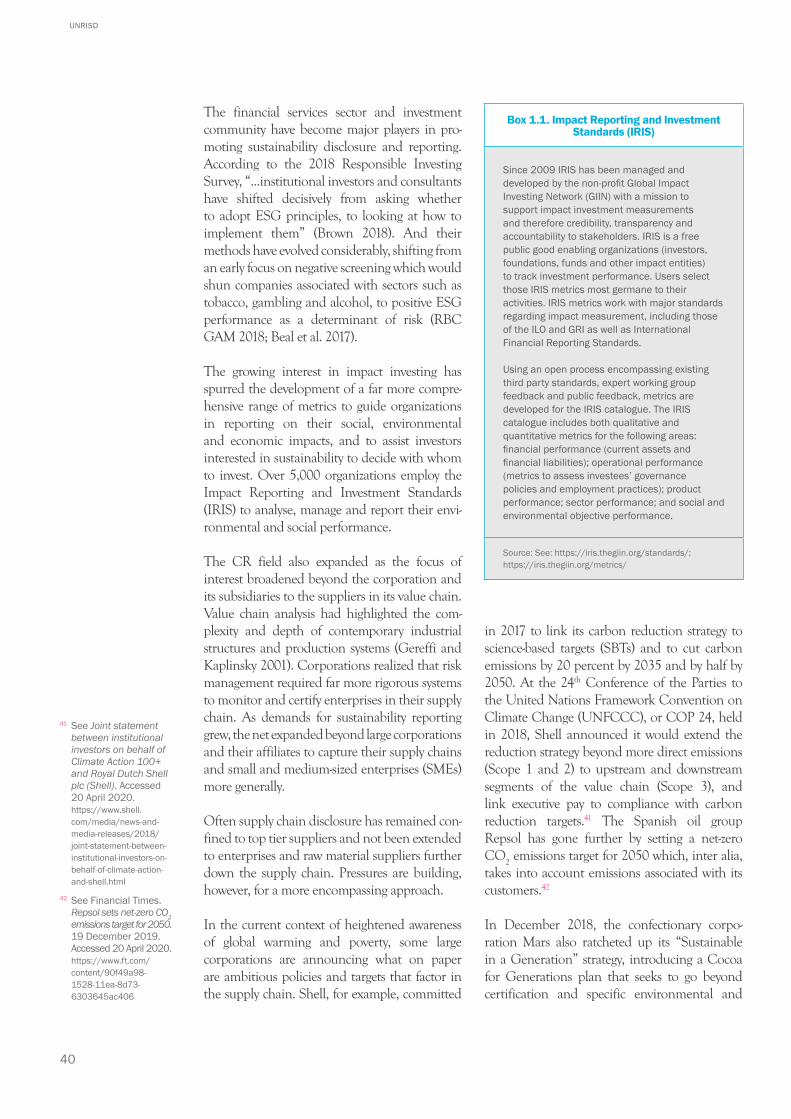
40
UNRISD
The financial services sector and investment community have become major players in pro-moting sustainability disclosure and reporting. According to the 2018 Responsible Investing Survey, “...institutional investors and consultants have shifted decisively from asking whether to adopt ESG principles, to looking at how to implement them” (Brown 2018). And their methods have evolved considerably, shifting from an early focus on negative screening which would shun companies associated with sectors such as tobacco, gambling and alcohol, to positive ESG performance as a determinant of risk (RBC GAM 2018; Beal et al. 2017).
The growing interest in impact investing has spurred the development of a far more compre-hensive range of metrics to guide organizations in reporting on their social, environmental and economic impacts, and to assist investors interested in sustainability to decide with whom to invest. Over 5,000 organizations employ the Impact Reporting and Investment Standards (IRIS) to analyse, manage and report their envi-ronmental and social performance.
The CR field also expanded as the focus of interest broadened beyond the corporation and its subsidiaries to the suppliers in its value chain. Value chain analysis had highlighted the com-plexity and depth of contemporary industrial structures and production systems (Gereffi and Kaplinsky 2001). Corporations realized that risk management required far more rigorous systems to monitor and certify enterprises in their supply chain. As demands for sustainability reporting grew, the net expanded beyond large corporations and their affiliates to capture their supply chains and small and medium-sized enterprises (SMEs) more generally.
Often supply chain disclosure has remained con-fined to top tier suppliers and not been extended to enterprises and raw material sup pliers further down the supply chain. Pressures are building, however, for a more encompassing approach.
In the current context of heightened awareness of global warming and poverty, some large corporations are announcing what on paper are ambitious policies and targets that factor in the supply chain. Shell, for example, committed
in 2017 to link its carbon reduction strategy to science-based targets (SBTs) and to cut carbon emissions by 20 percent by 2035 and by half by 2050. At the 24th Conference of the Parties to the United Nations Framework Convention on Climate Change (UNFCCC), or COP 24, held in 2018, Shell announced it would extend the reduction strategy beyond more direct emissions (Scope 1 and 2) to upstream and downstream segments of the value chain (Scope 3), and link executive pay to compliance with carbon reduction targets.41 The Spanish oil group Repsol has gone further by setting a net-zero CO
2 emissions target for 2050 which, inter alia,
takes into account emissions associated with its customers.42
In December 2018, the confectionary corpo-ration Mars also ratcheted up its “Sustainable in a Generation” strategy, introducing a Cocoa for Generations plan that seeks to go beyond certification and specific environmental and
Box 1.1. Impact Reporting and Investment Standards (IRIS)
Since 2009 IRIS has been managed and developed by the non-profit Global Impact Investing Network (GIIN) with a mission to support impact investment measurements and therefore credibility, transparency and accountability to stakeholders. IRIS is a free public good enabling organizations (investors, foundations, funds and other impact entities) to track investment performance. Users select those IRIS metrics most germane to their activities. IRIS metrics work with major standards regarding impact measurement, including those of the ILO and GRI as well as International Financial Reporting Standards.
Using an open process encompassing existing third party standards, expert working group feedback and public feedback, metrics are developed for the IRIS catalogue. The IRIS catalogue includes both qualitative and quantitative metrics for the following areas: financial performance (current assets and financial liabilities); operational performance (metrics to assess investees’ governance policies and employment practices); product performance; sector performance; and social and environmental objective performance.
Source: See: https://iris.thegiin.org/standards/; https://iris.thegiin.org/metrics/
41 See Joint statement between institutional investors on behalf of Climate Action 100+ and Royal Dutch Shell plc (Shell). Accessed 20 April 2020. https://www.shell.com/media/news-and-media-releases/2018/joint-statement-between-institutional-investors-on-behalf-of-climate-action-and-shell.html
42 See Financial Times. Repsol sets net-zero CO2 emissions target for 2050. 19 December 2019. Accessed 20 April 2020. https://www.ft.com/content/90f49a98-1528-11ea-8d73-6303645ac406
41
CORPORATE SUSTAINABILITY ACCOUNTING: WHAT CAN AND SHOULD CORPORATIONS BE DOING?
social initiatives to more direct and tangible economic benefits for the company’s nearly 180,000 cocoa producers. Under the plan Mars aims to have 100 percent of its cocoa from the Responsible Cocoa programme responsibly sourced globally, and traceable by 2025. Addi-tionally it will attempt to raise farmers’ incomes by extending the current focus on fair trade, protecting children and preserving forests to raising productivity, diversifying incomes and empowering women and communities.43 This strategy complements existing ambitious goals related to emissions:
When we established a formal, global sustainability team in 2007, we decided that we would rely on science to guide our GHG emissions reductions. At that time, we only had good data for Scope 1 and 2 emissions, so we set an initial goal for our direct operations—recognizing that was where we had the most control and influence. Anticipating that working beyond our factories and offices would likely be more challenging than our own operations, we decided to over-deliver against what the science said was necessary in our direct operations—leading to our goal of 100 percent renewable emissions by 2040 (Kevin Rabinovitch, Global Vice President of Sustainability, Mars).44
While generally viewed in a positive light, the ratcheting up of standards reinforced concerns about the growing complexity and cost of ESG disclosure and reporting. Issues of fairness also arose where SMEs, particularly in developing countries, not only confronted additional costs and non-tariff barriers to trade but also found themselves in a situation where transnational corporations were finding ways to transfer the costs of disclosure downstream. Furthermore, lead corporations in global value chains often insisted that suppliers raise standards in an on-going context of aggressive commercial policy that implied tights margins and short lead times for suppliers (Blasi and Bair 2019; Utting 2012).
Third, reporting and certification guidelines have been ratcheted up. As examined more fully in Chapter 2, the field of disclosure has been mired in concerns regarding the quality of data and the lack of adherence to basic accounting
principles. Consequently, reporting and certifi-cation guidelines are periodically revised. Criteria noted by the SASB, for example, are listed in Annex 2.
The world’s most commonly used reporting tool, the GRI framework, has been modified (see Box 1.2) to emphasize new issues and to improve aspects related to accounting principles such as user-friendliness and materiality.
“Integrated reporting” constitutes another sig-nificant development in CR disclosure and reporting. This form of reporting manifests itself, however, in very different guises. A minimalist version simply calls for ESG and financial disclosure to be combined in one report. This format is supposed to signal a commitment to principles of full disclosure and materiality, sug-gesting that ESG is not merely an add-on to the financial dimension. Some 78 percent of the world’s largest 250 corporations included CR information in their annual financial reports in 2017, up from 44 percent in 2011 (KPMG 2017).
A more rigorous interpretation is promoted by the International Integrated Reporting Council (IIRC) and sees integrated reporting as key to the process of assessing current and future value creation and “market value”, as opposed to “book value”.45 The frame of reference for determining materiality is an organization’s “value creation process”. This process is affected by the organization’s use of multiple factors (or “capitals”)—financial, social and relationship, human, manufactured, intellectual and natural. It is also impacted by the creation of opportunities and risks as well as favourable and unfavourable performance (or prospects), as ascertained by the financial provider (Barman 2018:295-296).
According to the IIRC, an integrated report differs from conventional financial reporting not only in its inclusion of non-financial infor-mation, but also in its focus on the ability of a firm to create value in the short, medium and long term, emphasizing simultaneously the need for strategic focus, conciseness, future orientation, connectivity of information and multiple capitals and their interdependencies. It is underpinned by the concept of “integrated thinking”, which accounts for connectivity
43 See “Mars launches new sustainability strategy.” Accessed 15 June 2020. https://www.mars.com/ news-and-stories/press-releases/cocoa-sustainability-strategy
44 Interviewed by The Climate Group. Accessed 15 June 2020. https://www.theclimate group.org/news/kevin- rabinovitch-mars-every-movement-needs-group-first-movers-and-we-believed-we-had
45 According to SASB: “Market value typically differs from book value, in part, because traditional financial statements do not necessarily capture all of the factors that contribute to a company’s long-term ability to create value. Much of this “value gap” is attributable to, or can be significantly impaired by, the management or mismanagement of environmental, social, and human capitals as well as corporate governance” (SASB 2017a:4).
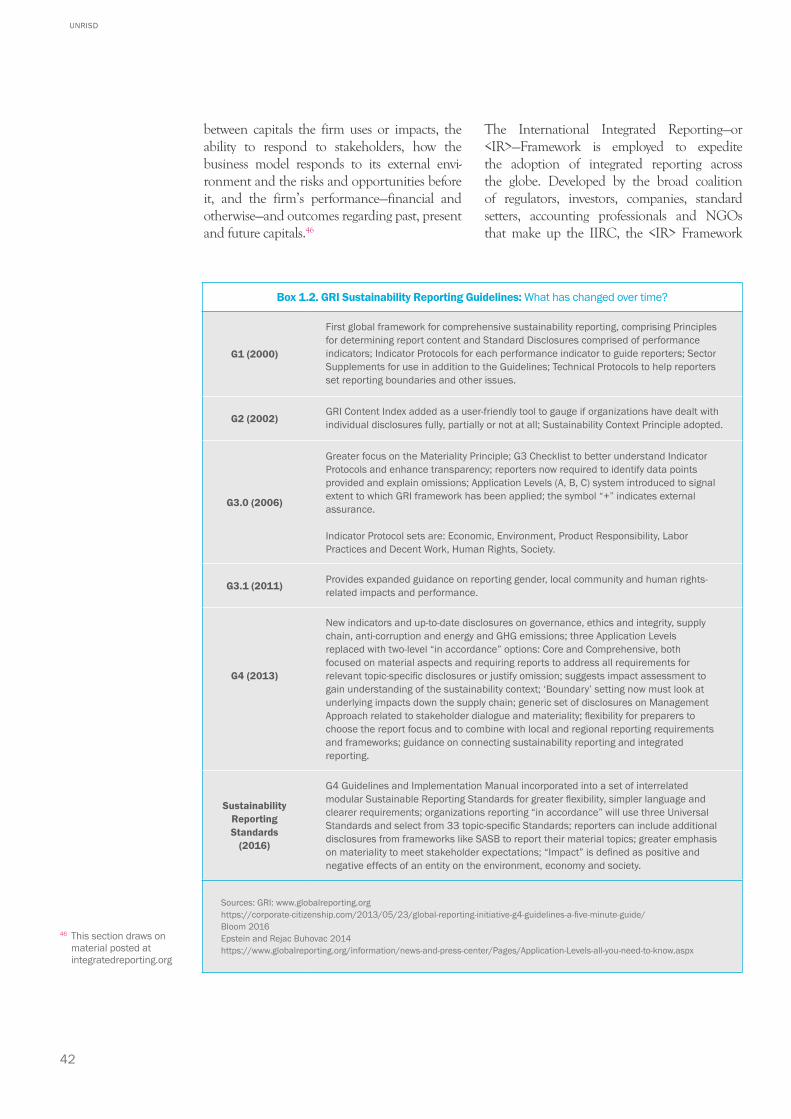
42
UNRISD
between capitals the firm uses or impacts, the ability to respond to stakeholders, how the business model responds to its external envi-ronment and the risks and opportunities before it, and the firm’s performance—financial and otherwise—and outcomes regarding past, present and future capitals.46
The International Integrated Reporting—or <IR>—Framework is employed to expedite the adoption of integrated reporting across the globe. Developed by the broad coalition of regulators, investors, companies, standard setters, accounting professionals and NGOs that make up the IIRC, the <IR> Framework
Box 1.2. GRI Sustainability Reporting Guidelines: What has changed over time?
G1 (2000)
First global framework for comprehensive sustainability reporting, comprising Principles for determining report content and Standard Disclosures comprised of performance indicators; Indicator Protocols for each performance indicator to guide reporters; Sector Supplements for use in addition to the Guidelines; Technical Protocols to help reporters set reporting boundaries and other issues.
G2 (2002)GRI Content Index added as a user-friendly tool to gauge if organizations have dealt with individual disclosures fully, partially or not at all; Sustainability Context Principle adopted.
G3.0 (2006)
Greater focus on the Materiality Principle; G3 Checklist to better understand Indicator Protocols and enhance transparency; reporters now required to identify data points provided and explain omissions; Application Levels (A, B, C) system introduced to signal extent to which GRI framework has been applied; the symbol “+” indicates external assurance.
Indicator Protocol sets are: Economic, Environment, Product Responsibility, Labor Practices and Decent Work, Human Rights, Society.
G3.1 (2011) Provides expanded guidance on reporting gender, local community and human rights-related impacts and performance.
G4 (2013)
New indicators and up-to-date disclosures on governance, ethics and integrity, supply chain, anti-corruption and energy and GHG emissions; three Application Levels replaced with two-level “in accordance” options: Core and Comprehensive, both focused on material aspects and requiring reports to address all requirements for relevant topic-specific disclosures or justify omission; suggests impact assessment to gain understanding of the sustainability context; ‘Boundary’ setting now must look at underlying impacts down the supply chain; generic set of disclosures on Management Approach related to stakeholder dialogue and materiality; flexibility for preparers to choose the report focus and to combine with local and regional reporting requirements and frameworks; guidance on connecting sustainability reporting and integrated reporting.
Sustainability Reporting Standards
(2016)
G4 Guidelines and Implementation Manual incorporated into a set of interrelated modular Sustainable Reporting Standards for greater flexibility, simpler language and clearer requirements; organizations reporting “in accordance” will use three Universal Standards and select from 33 topic-specific Standards; reporters can include additional disclosures from frameworks like SASB to report their material topics; greater emphasis on materiality to meet stakeholder expectations; “Impact” is defined as positive and negative effects of an entity on the environment, economy and society.
Sources: GRI: www.globalreporting.orghttps://corporate-citizenship.com/2013/05/23/global-reporting-initiative-g4-guidelines-a-five-minute-guide/Bloom 2016Epstein and Rejac Buhovac 2014https://www.globalreporting.org/information/news-and-press-center/Pages/Application-Levels-all-you-need-to-know.aspx
46 This section draws on material posted at integratedreporting.org
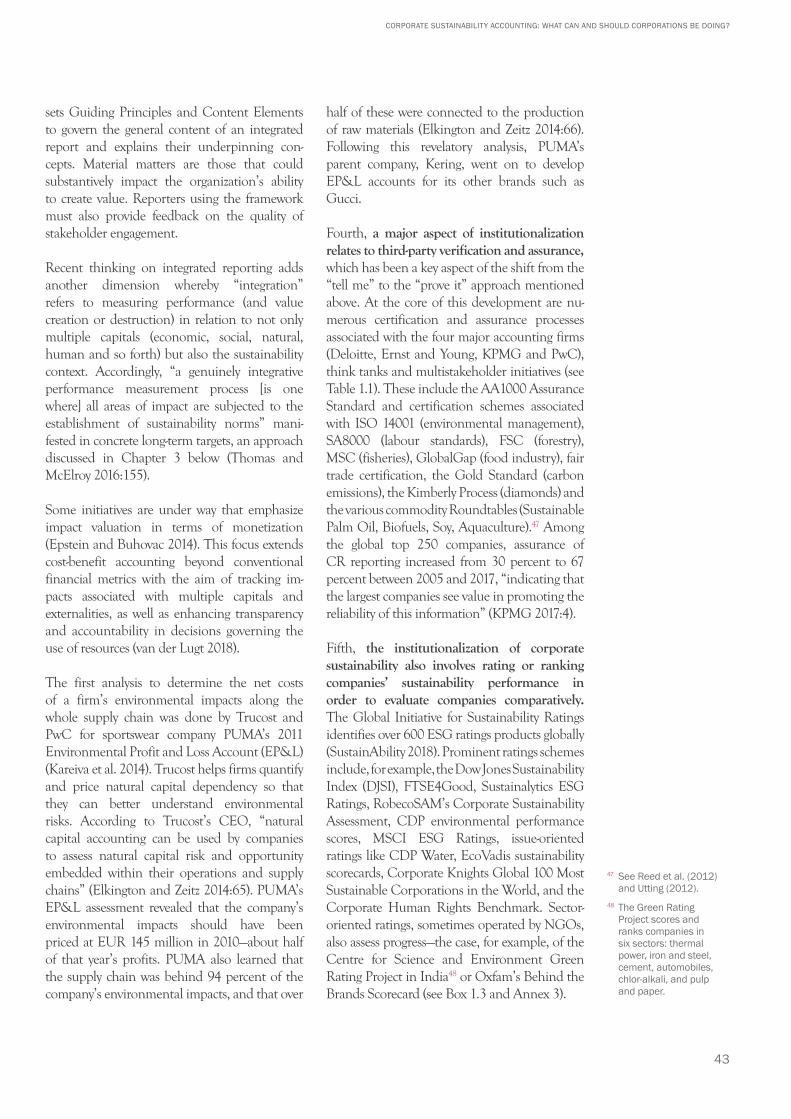
43
CORPORATE SUSTAINABILITY ACCOUNTING: WHAT CAN AND SHOULD CORPORATIONS BE DOING?
sets Guiding Principles and Content Elements to govern the general content of an integrated report and explains their underpinning con-cepts. Material matters are those that could substantively impact the organization’s ability to create value. Reporters using the framework must also provide feedback on the quality of stakeholder engagement.
Recent thinking on integrated reporting adds another dimension whereby “integration” refers to measuring performance (and value creation or destruction) in relation to not only multiple capitals (economic, social, natural, human and so forth) but also the sustainability context. Accordingly, “a genuinely integrative performance measurement process [is one where] all areas of impact are subjected to the establishment of sustainability norms” mani-fested in concrete long-term targets, an approach discussed in Chapter 3 below (Thomas and McElroy 2016:155).
Some initiatives are under way that emphasize impact valuation in terms of monetization (Epstein and Buhovac 2014). This focus extends cost-benefit accounting beyond conventional financial metrics with the aim of tracking im-pacts associated with multiple capitals and externalities, as well as enhancing transparency and accountability in decisions governing the use of resources (van der Lugt 2018).
The first analysis to determine the net costs of a firm’s environmental impacts along the whole supply chain was done by Trucost and PwC for sportswear company PUMA’s 2011 Environmental Profit and Loss Account (EP&L) (Kareiva et al. 2014). Trucost helps firms quantify and price natural capital dependency so that they can better understand environmental risks. According to Trucost’s CEO, “natural capital accounting can be used by companies to assess natural capital risk and opportunity embedded within their operations and supply chains” (Elkington and Zeitz 2014:65). PUMA’s EP&L assessment revealed that the company’s environmental impacts should have been priced at EUR 145 million in 2010—about half of that year’s profits. PUMA also learned that the supply chain was behind 94 percent of the company’s environmental impacts, and that over
half of these were connected to the production of raw materials (Elkington and Zeitz 2014:66). Following this revelatory analysis, PUMA’s parent company, Kering, went on to develop EP&L accounts for its other brands such as Gucci.
Fourth, a major aspect of institutionalization relates to third-party verification and assurance, which has been a key aspect of the shift from the “tell me” to the “prove it” approach mentioned above. At the core of this development are nu-merous certification and assurance processes associated with the four major accounting firms (Deloitte, Ernst and Young, KPMG and PwC), think tanks and multistakeholder initiatives (see Table 1.1). These include the AA1000 Assurance Standard and certification schemes associated with ISO 14001 (environmental management), SA8000 (labour standards), FSC (forestry), MSC (fisheries), GlobalGap (food industry), fair trade certification, the Gold Standard (carbon emissions), the Kimberly Process (diamonds) and the various commodity Roundtables (Sustainable Palm Oil, Biofuels, Soy, Aquaculture).47 Among the global top 250 companies, assurance of CR reporting increased from 30 percent to 67 percent between 2005 and 2017, “indicating that the largest companies see value in promoting the reliability of this information” (KPMG 2017:4).
Fifth, the institutionalization of corporate sus tainability also involves rating or ranking companies’ sustainability performance in order to evaluate companies comparatively. The Global Initiative for Sustainability Ratings identifies over 600 ESG ratings products globally (SustainAbility 2018). Prominent ratings schemes include, for example, the Dow Jones Sustainability Index (DJSI), FTSE4Good, Sustainalytics ESG Ratings, RobecoSAM’s Corporate Sustainability Assessment, CDP environmental performance scores, MSCI ESG Ratings, issue-oriented ratings like CDP Water, EcoVadis sustainability scorecards, Corporate Knights Global 100 Most Sustainable Corporations in the World, and the Corporate Human Rights Benchmark. Sector-oriented ratings, sometimes operated by NGOs, also assess progress—the case, for example, of the Centre for Science and Environment Green Rating Project in India48 or Oxfam’s Behind the Brands Scorecard (see Box 1.3 and Annex 3).
47 See Reed et al. (2012) and Utting (2012).
48 The Green Rating Project scores and ranks companies in six sectors: thermal power, iron and steel, cement, automobiles, chlor-alkali, and pulp and paper.
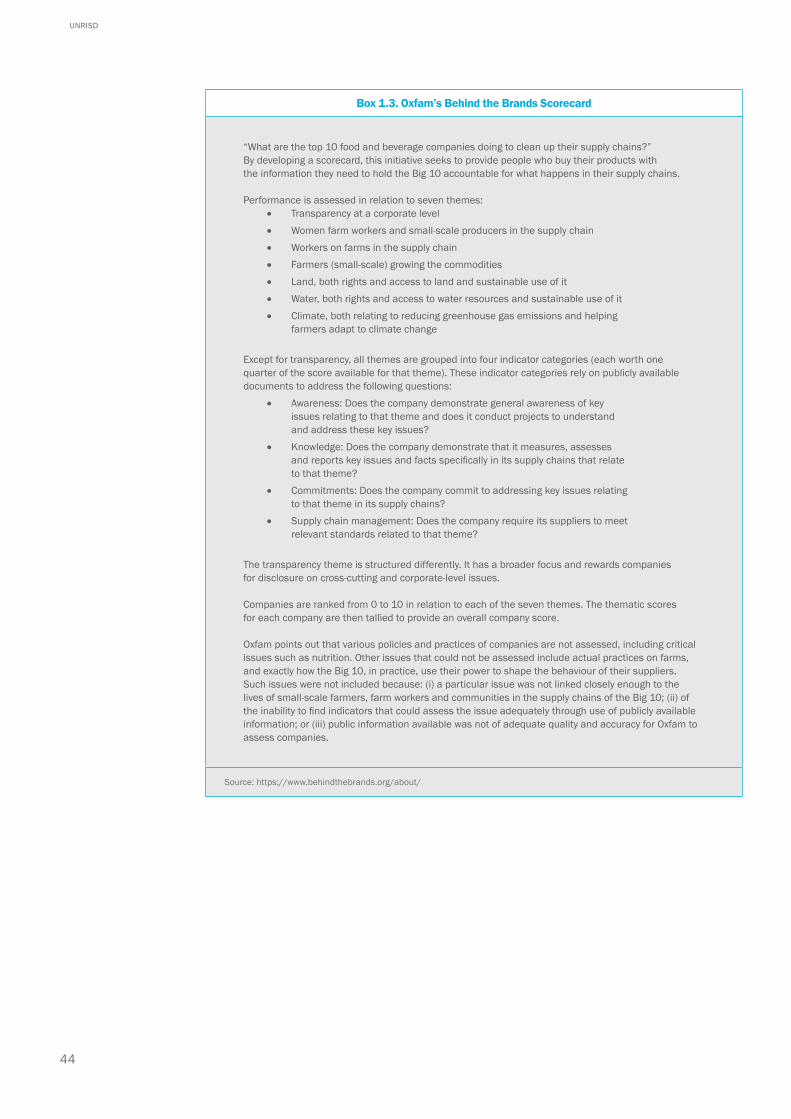
44
UNRISD
Box 1.3. Oxfam’s Behind the Brands Scorecard
“What are the top 10 food and beverage companies doing to clean up their supply chains?” By developing a scorecard, this initiative seeks to provide people who buy their products with the information they need to hold the Big 10 accountable for what happens in their supply chains.
Performance is assessed in relation to seven themes:• Transparency at a corporate level• Women farm workers and small-scale producers in the supply chain• Workers on farms in the supply chain• Farmers (small-scale) growing the commodities• Land, both rights and access to land and sustainable use of it• Water, both rights and access to water resources and sustainable use of it• Climate, both relating to reducing greenhouse gas emissions and helping
farmers adapt to climate change
Except for transparency, all themes are grouped into four indicator categories (each worth one quarter of the score available for that theme). These indicator categories rely on publicly available documents to address the following questions:
• Awareness: Does the company demonstrate general awareness of key issues relating to that theme and does it conduct projects to understand and address these key issues?
• Knowledge: Does the company demonstrate that it measures, assesses and reports key issues and facts specifically in its supply chains that relate to that theme?
• Commitments: Does the company commit to addressing key issues relating to that theme in its supply chains?
• Supply chain management: Does the company require its suppliers to meet relevant standards related to that theme?
The transparency theme is structured differently. It has a broader focus and rewards companies for disclosure on cross-cutting and corporate-level issues.
Companies are ranked from 0 to 10 in relation to each of the seven themes. The thematic scores for each company are then tallied to provide an overall company score.
Oxfam points out that various policies and practices of companies are not assessed, including critical issues such as nutrition. Other issues that could not be assessed include actual practices on farms, and exactly how the Big 10, in practice, use their power to shape the behaviour of their suppliers. Such issues were not included because: (i) a particular issue was not linked closely enough to the lives of small-scale farmers, farm workers and communities in the supply chains of the Big 10; (ii) of the inability to find indicators that could assess the issue adequately through use of publicly available information; or (iii) public information available was not of adequate quality and accuracy for Oxfam to assess companies.
Source: https://www.behindthebrands.org/about/
45
CORPORATE SUSTAINABILITY ACCOUNTING: WHAT CAN AND SHOULD CORPORATIONS BE DOING?
Best practice learning
Much of the impetus for ratcheting up CR comes from a relatively small group of corporations that are seen as leaders in this field. The intense networking and peer pressure that is part of the CR ecosystem ensures that firm-specific in novations can quickly gain kudos and serve as a source of inspiration and peer pressure for others. These best practices provide proof that key emerging issues are not only relevant and material but also actionable. The CR literature frequently identifies the same companies and initiatives as examples of best practice.49 These include:
• Danone (food products): engagement with the social business initiatives associated with the micro-credit bank Grameen; pioneer in relation to international framework agreements (labour rights).
• Google (Internet-related products and services): has already reached its 100 percent renewable energy target; now pursuing a strategy to adopt technologies to power its operations and data centres with renewable energy on a 24/7 basis.
• Interface (carpet manufacturing): proactive application of circular economy principles and practices and zero footprint, renewable energy and recycling goals.
• Levi Strauss (apparel): one of the first companies to set science-based targets in the supply chain, with a target of a 90 percent reduction in greenhouse gas emissions in all its facilities using onsite renewable energy and efficiency improvements and a 40 percent GHG reduction in the supply chain by 2025.50
• Natura & Co. (cosmetics and personal care): has pushed boundaries related to its lifecycle business approach across the value chain, promoting sustainable practices related to raw materials extraction, manufacturing, distribution, use and disposal of its products.
• Novo Nordisk (pharmaceuticals): pay equity within the firm.
• Patagonia (apparel): a leader not only in sustainable design and marketing but also environmental activism.
• PUMA (sportswear): ambitious net-zero emissions strategy and targets extending to the supply chain, and application of rigorous sustainability accounting methods.
• Unilever (household consumer products): Responsible Sourcing Policy; commitment to make all of the company’s plastic packaging fully reusable, recyclable, or compostable by 2025 and to increase the use of recycled plastic content in its packaging to at least 25 percent by 2025 (Beal et al. 2017:26).
Relatively few companies, however, consistently rank at the top of ratings. The DJSI, for example, reported in 2015 that of the many assessed, only 16 companies had consistently remained in the Index. The GlobeScan/Sustainability 2018 survey of experts positions Unilever, Patagonia and Interface in the top three slots followed by IKEA, Marks & Spencer, Tesla, Nestlé, Natura, Danone, Apple and Walmart.51
This outline of the evolution of disclosure and reporting suggests a significant change in cor-porate discourse and policy in recent decades. Over time, attitudes have shifted from outright denial of responsibility, through piecemeal self-regulation associated with bolstering corporate legitimacy and aspects of risk and reputation man agement, to a more comprehensive ap-proach that is garnering considerable buy-in from transnational corporations and other com-panies and is being actively promoted by an ever-expanding network of organizations engaged in standard-setting, promotional and oversight activities.
As examined in Chapter 2, this evolution con tinues into the present with attempts to strengthen not only the breadth of disclosure but also its depth. Numerous adjustments and innovations are taking place to address various limitations in the quality of reporting which con-tradict basic accounting principles associated with reliability, credibility, comparability, user-friendliness, relevance and materiality.
49 This is not to suggest that these companies are acting ethically or sustainably on all fronts. Indeed, several have been criticized for poor performance or embellishing accomplishments in specific issue areas. See, for example, Oxfam (2016) Behind the Brands ranking of Danone, or the New Internationalist report on Unilever (Dupont-Nivet et al. 2017).
50 https://sustainable brands.com/read/leadership/levi-strauss-sets-industry-bar-with-science-based-targets-for-global-supply-chain
51 Respondents were asked to determine how well leading companies perform against each of five key leadership attributes—Purpose, Plan, Culture, Collaboration and Advocacy. See GlobeScan and Sustainability (2018).
46
UNRISD
...to read most accounting and finance publications...you could be forgiven for believing that never has capitalism been so robust or the prospects for the joy and fulfilment of mankind so positive. You would find yourself wondering just who perpetrates all this angst about the power of [multinational corporations], the abdication of governments, the rates of species extinction, the growth in ecological footprints, the rate of child deaths through drought and so on.
Rob Gray (2006:5)
The real danger is when politicians and CEOs are making it look like real action is happening, when in fact almost nothing is being done, apart from clever accounting and creative PR.
Greta Thunberg, COP25, 2019
The preceding overview of the evolution of cor-porate sustainability disclosure and reporting certainly indicates an intensification of dis-closure activity in the name of sustainability. It is likewise clear that many of the key problems in sustainability reporting identified years ago stubbornly remain. The more salient challenges continue to entail (i) reporting complexity that confuses and distracts from measuring impact and easy comprehension; (ii) a lack of data comparability and standardization to support useful evaluation; (iii) imprecise materiality
Where Do We Stand?
CHAPTER 2
““
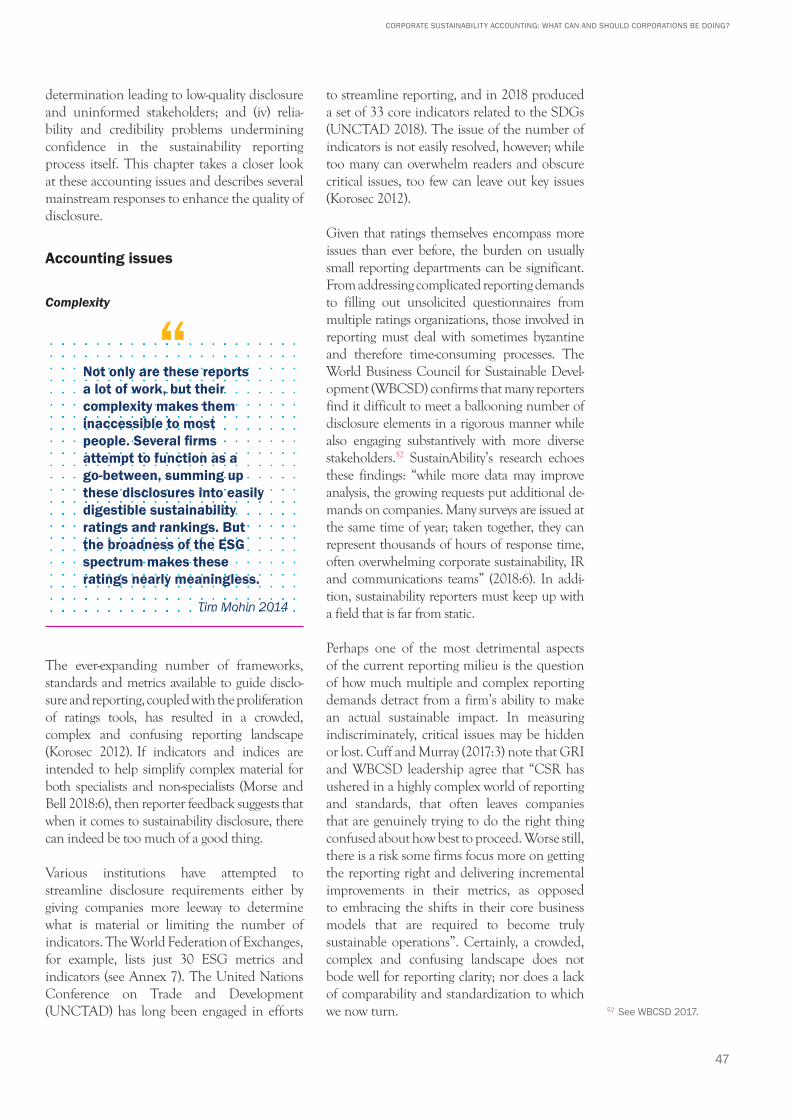
47
CORPORATE SUSTAINABILITY ACCOUNTING: WHAT CAN AND SHOULD CORPORATIONS BE DOING?
deter mination leading to low-quality disclosure and uninformed stakeholders; and (iv) relia-bility and credibility problems undermining confidence in the sustainability reporting process itself. This chapter takes a closer look at these accounting issues and describes several mainstream responses to enhance the quality of disclosure.
Accounting issues
Complexity
Not only are these reports a lot of work, but their complexity makes them inaccessible to most people. Several firms attempt to function as a go-between, summing up these disclosures into easily digestible sustainability ratings and rankings. But the broadness of the ESG spectrum makes these ratings nearly meaningless.
Tim Mohin 2014
The ever-expanding number of frameworks, stan dards and metrics available to guide disclo-sure and reporting, coupled with the proliferation of ratings tools, has resulted in a crowded, complex and confusing reporting landscape (Korosec 2012). If indicators and indices are intended to help simplify complex material for both spe cialists and non-specialists (Morse and Bell 2018:6), then reporter feedback suggests that when it comes to sustainability disclosure, there can indeed be too much of a good thing.
Various institutions have attempted to streamline disclosure requirements either by giving com panies more leeway to determine what is material or limiting the number of indicators. The World Federation of Exchanges, for example, lists just 30 ESG metrics and indicators (see Annex 7). The United Nations Conference on Trade and Development (UNCTAD) has long been engaged in efforts
to streamline reporting, and in 2018 produced a set of 33 core indicators related to the SDGs (UNCTAD 2018). The issue of the number of indicators is not easily resolved, however; while too many can overwhelm readers and obscure critical issues, too few can leave out key issues (Korosec 2012).
Given that ratings themselves encompass more issues than ever before, the burden on usually small reporting departments can be significant. From addressing complicated reporting demands to filling out unsolicited questionnaires from multiple ratings organizations, those involved in reporting must deal with sometimes byzantine and therefore time-consuming processes. The World Business Council for Sustainable Devel-opment (WBCSD) confirms that many reporters find it difficult to meet a ballooning number of disclosure elements in a rigorous manner while also engaging substantively with more diverse stakeholders.52 SustainAbility’s research echoes these findings: “while more data may improve analysis, the growing requests put additional de-mands on companies. Many surveys are issued at the same time of year; taken together, they can represent thousands of hours of response time, often overwhelming corporate sustainability, IR and communications teams” (2018:6). In addi-tion, sustainability reporters must keep up with a field that is far from static.
Perhaps one of the most detrimental aspects of the current reporting milieu is the question of how much multiple and complex reporting demands detract from a firm’s ability to make an actual sustainable impact. In measuring indiscriminately, critical issues may be hidden or lost. Cuff and Murray (2017:3) note that GRI and WBCSD leadership agree that “CSR has ushered in a highly complex world of reporting and standards, that often leaves companies that are genuinely trying to do the right thing confused about how best to proceed. Worse still, there is a risk some firms focus more on getting the reporting right and delivering incremental improvements in their metrics, as opposed to embracing the shifts in their core business models that are required to become truly sustainable operations”. Certainly, a crowded, complex and confusing landscape does not bode well for reporting clarity; nor does a lack of comparability and standardization to which we now turn. 52 See WBCSD 2017.
“
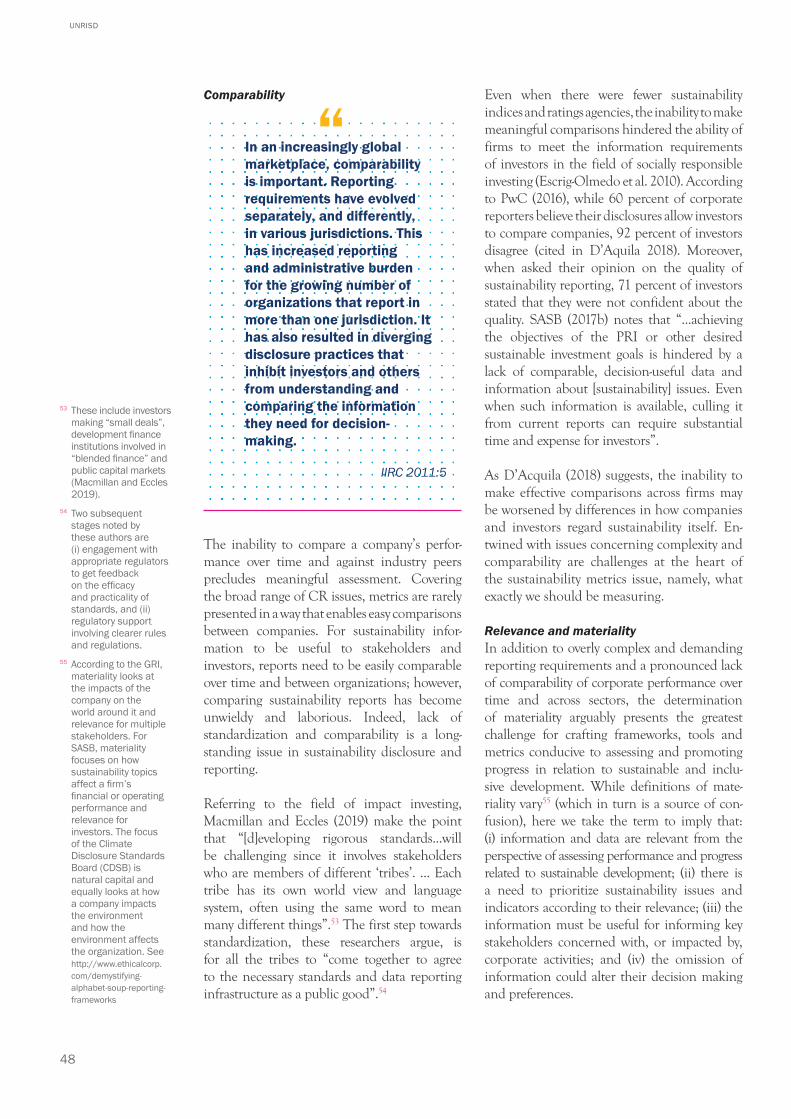
48
UNRISD
Comparability
In an increasingly global marketplace, comparability is important. Reporting requirements have evolved separately, and differently, in various jurisdictions. This has increased reporting and administrative burden for the growing number of organizations that report in more than one jurisdiction. It has also resulted in diverging disclosure practices that inhibit investors and others from understanding and comparing the information they need for decision-making.
IIRC 2011:5
The inability to compare a company’s perfor-mance over time and against industry peers pre cludes meaningful assessment. Covering the broad range of CR issues, metrics are rarely presented in a way that enables easy comparisons between companies. For sustainability infor-mation to be useful to stakeholders and investors, reports need to be easily comparable over time and between organizations; however, comparing sustainability reports has become unwieldy and laborious. Indeed, lack of standardization and comparability is a long-standing issue in sustainability disclosure and reporting.
Referring to the field of impact investing, Macmillan and Eccles (2019) make the point that “[d]eveloping rigorous standards...will be chal lenging since it involves stakeholders who are members of different ‘tribes’. ... Each tribe has its own world view and language system, often using the same word to mean many different things”.53 The first step towards standardization, these re searchers argue, is for all the tribes to “come together to agree to the necessary standards and data reporting infrastructure as a public good”.54
Even when there were fewer sustainability indices and ratings agencies, the inability to make meaningful comparisons hindered the ability of firms to meet the information requirements of investors in the field of socially responsible investing (Escrig-Olmedo et al. 2010). According to PwC (2016), while 60 percent of corporate reporters believe their disclosures allow investors to compare companies, 92 per cent of investors disagree (cited in D’Aquila 2018). Moreover, when asked their opinion on the quality of sustainability reporting, 71 percent of investors stated that they were not confident about the quality. SASB (2017b) notes that “...achieving the objectives of the PRI or other desired sustainable investment goals is hindered by a lack of comparable, decision-useful data and information about [sustainability] issues. Even when such information is available, culling it from current reports can require substantial time and expense for investors”.
As D’Acquila (2018) suggests, the inability to make effective comparisons across firms may be worsened by differences in how companies and investors regard sustainability itself. En-twined with issues concerning complexity and comparability are challenges at the heart of the sustainability metrics issue, namely, what exactly we should be measuring.
Relevance and materialityIn addition to overly complex and demanding reporting requirements and a pronounced lack of comparability of corporate performance over time and across sectors, the determination of materiality arguably presents the greatest challenge for crafting frameworks, tools and metrics conducive to assessing and promoting progress in relation to sustainable and inclu-sive development. While definitions of mate-riality vary55 (which in turn is a source of con-fusion), here we take the term to imply that: (i) information and data are relevant from the per spective of assessing performance and progress related to sustainable development; (ii) there is a need to prioritize sustainability issues and indicators according to their relevance; (iii) the information must be useful for informing key stakeholders concerned with, or impacted by, corporate activities; and (iv) the omission of information could alter their decision making and preferences.
53 These include investors making “small deals”, development finance institutions involved in “blended finance” and public capital markets (Macmillan and Eccles 2019).
54 Two subsequent stages noted by these authors are (i) engagement with appropriate regulators to get feedback on the efficacy and practicality of standards, and (ii) regulatory support involving clearer rules and regulations.
55 According to the GRI, materiality looks at the impacts of the company on the world around it and relevance for multiple stakeholders. For SASB, materiality focuses on how sustainability topics affect a firm’s financial or operating performance and relevance for investors. The focus of the Climate Disclosure Standards Board (CDSB) is natural capital and equally looks at how a company impacts the environment and how the environment affects the organization. See http://www.ethicalcorp.com/demystifying-alphabet-soup-reporting-frameworks
“
49
CORPORATE SUSTAINABILITY ACCOUNTING: WHAT CAN AND SHOULD CORPORATIONS BE DOING?
Immaterial clutter An ongoing concern relates to the presence and volume of “immaterial clutter” in company reports, be they stand-alone environmental or CSR reports or integrated annual reports. The findings and cautionary comments of the ASB/FRC in their 2009 review of the quality of narra tive reporting in annual reports of 50 UK listed companies56 remain pertinent today. The review observes that despite some clear improvements in reporting across multiple content areas, “we found immaterial clutter detracting from important information most frequently in the cor po rate social responsibility (CSR) and risk reporting sections of the narrative” (ASB/FRC 2009:3). By way of example, the ASB/FRC re view notes:
...some [reports] have fallen into the trap of delivering unnecessary clutter such as ‘football coaching’ for an insurance company and ‘donating chocolate gifts to the community at Easter’ for a service company—these are worthwhile activities but in our view are not material to under standing a company’s performance and position (ASB/FRC 2009:9).
Various factors underpin the volume of im-material clutter. These include:• The tendency for corporations
to project a favourable societal image by highlighting philanthropic and other do-gooding activities that may be insignificant from the perspective of sustainability performance or company activities.
• The easy option of providing anecdotal evidence in the absence of concrete performance data.
• The ever-growing array of social pressures and reporting requirements. “We must consider whether further reporting requirements in the business review will succeed in changing company behaviour or just in adding clutter to an already lengthy annual report” (ASB/FRC 2009:12);
• The preference for “listing every conceivable risk adds to clutter” (ASB/FRC 2009:9).
Many company reports contain vague infor-mation as opposed to meaningful indi cators. For example, a company may disclose that it is committed to use renewable energy, but this says nothing about the proportion of total energy use accounted for by renewables. Or a sustainability report might note that a firm has projects supporting women farmers, which leaves us uninformed about the scale and impact of support and any concrete implications for women’s empowerment.
In their work on sustainability reporting by large Italian water utilities,57 Cantele, Tsalis and Nikolau (2018) not only observe a low level of disclosure on indicators suggested by GRI and SASB, but also reveal that most companies dis-close qualitatively, neglecting material aspects re-lated to water management like effluent quality, end-use efficiency, water protection initiatives, customer complaints, and sources of water. The authors contend that in addition to the typically poor quality of disclosed information, only a minority of firms provide the information essential to understanding their impacts on the crucial resource they manage. What they do disclose “cannot be used to assess the process of water utilities performance in various aspects of sustainability and evaluate the effectiveness of their sustainability strategies” (Cantele, Tsalis and Nikolau 2018:8).
Such limitations clearly affect the usefulness of data. So too does the fact that many firms and ratings provide data in the form of annual snapshots, that is, information related to corpo-rate activities and impacts during the financial or calendar year under review. Changes in relation to the previous year may also be noted. Such formats, however, undermine what is essential for assessing corporate sustainability performance, namely trend analysis. Accounting principles related to easy comprehension or user-friendliness require far more attention to multiyear trends of, say, five or 10 years.
Ongoing gaps and blind spotsVarious assessments of the state of disclosure and reporting identify ongoing gaps in issue areas that need to be addressed. The following were among those noted in several of the publi-cations reviewed for this report.
56 The Accounting Standards Board (ASB) is an operating body of the Financial Reporting Council (FRC). The FRC is the United Kingdom’s independent regulator tasked with promoting confidence in corporate reporting and governance.
57 The 22 utilities are considered large according to GRI’s reporting list classification criteria.
50
UNRISD
An EcoVadis analysis of 20,000 companies in 100 countries finds that most companies are “taking a reactive, unstructured approach to fighting corruption risks” with 48 percent having a formal policy on corruption, 37 percent having corruption measures in place, and just 9 percent reporting on ethics issues and 3 percent with sanctions (EcoVadis 2018).
The Corporate Human Rights Benchmark that ranks 98 of the world’s largest corporations in three sectors notes that while the UN Principles on Business and Human Rights placed this issue on the agenda, it is still at an incipient stage in terms of corporate uptake (CHRB 2018).
Oxfam’s Behind the Brands scorecard for the world’s 10 largest food and beverage corporations reveals
“that the social responsibility and sustain-ability programs which companies have implemented to date are typically focused on projects to reduce water use or to train women farmers, for example. But these programs fail to address the root causes of hunger and poverty because companies lack adequate policies to guide their own supply chain operations. Important policy gaps include:
• Companies are overly secre-tive about their agricultural supply chains, making claims of “sustainability” and “social responsibility” difficult to verify;
• None of the Big 10 have adequate policies to protect local communities from land and water grabs along their supply chains; and
• Companies are not taking sufficient steps to curb massive agricultural greenhouse gas emissions responsible for climate changes now affecting farmers” (Oxfam 2016).
Oxfam also notes that of the 10 corporations in this review only one, Nestlé, discloses data on the ratio of CEO to median worker’s pay (Oxfam 2016).
EcoAct (2018) notes that just 35 percent of the corporations it monitored were assessed as adapting to a more circular economy58, while only 29 percent considered the natural capital impact of their operations. EcoAct’s (2018) assessment of the state of environmental reporting of large corporations listed on several stock exchanges, including the FTSE 100, Dow 30, CAC 40 and IBEX 35, shows that while an increasing number are setting carbon reduction targets, relatively few do so with reference to “science-based targets”—that is, ones that are consistent with the goal of keeping global warming at or below 2 degrees Celsius. Furthermore, of the 20 percent with science-based targets, only 8 percent are independently assessed and approved. KPMG notes that carbon targets set by corporations are usually disconnected from international and national carbon reduction goals (KPMG 2017) and that its “survey confirms that a majority of companies do not acknowledge climate change as a financial risk in their annual reports” (KPMG 2017:4).
More specifically, in the field of renewable energy, RE100 (2018:6) points out that even among companies committed to significantly re ducing carbon emissions (such as those reporting to the CDP, discussed below), “only 11% of the power [they] consumed was actively sourced from renewable sources”.
In a review of 124 CSR reports, Littler (2014:10) notes “only 23 (19%)...gave any account at all of their approach to taxation. Only five of those 23—4% of the total—provided anything like a quantitative analysis. The rest gave only a vague assurance that the business was proactive in providing responsible tax planning, without including any facts or figures at all”.
While there are increasing calls for the remu-neration issue to go beyond ensuring firms pay at least a minimum wage by instead paying a “living wage”, progress has been limited. H&M’s commitment to a living wage, noted above, has come in for considerable criticism. While the company asserts progress has been achieved indirectly through their insistence that supplier factories allow workers to have democratically elected representatives and adopt transparent wage management systems,59 various monitoring
58 In contrast to industrial processes and production methods based on the continuous extraction of finite natural resources, the generation of waste and pollution, energy leakage and the degradation of natural ecosystems, the concept of circular economy emphasizes the need to support a regenerative economy, minimizing or reversing these impacts through such means as “closed-loop systems” and “dematerialization” involving eco-efficiency, mainte-nance, repair, reuse, remanufacturing, refurbishing, retro-fitting, recycling and upcycling, among other approaches. See, for example, Ellen MacArthur Foundation (2013).
59 See H&M, Fair Living Wages: What did we promise and what progress have we made? 7 May 2018. Accessed 15 June 2020. https://hmgroup.com/media/news/general-news-2018/fair-living-wages--what-did-we-promise-and-what-progress-have-we.html
51
CORPORATE SUSTAINABILITY ACCOUNTING: WHAT CAN AND SHOULD CORPORATIONS BE DOING?
and advocacy organizations60 claim that the concrete results pale in comparison with the reputational gain the company achieved when it announced this “unique, first-of-its-kind initiative”.61
When corporate sustainability disclosure or standard-setting organizations do factor in the living wage, there is often a tendency to adopt a narrow interpretation by focusing on an enhanced minimum wage, restricting the basket of “basic needs”, or assuming that there is more than one income earner per family. Other more expansive criteria tend to be neglected: a larger basket of basic needs, that the living wage should be earned during a normal working week, that family basic needs should be covered by the wage worker in question, and that the worker/family in question should have the possibility to save (Anker 2011).
If corporations engaged in sustainability dis-closure have begun to look beyond their own facilities to those of top tier suppliers, the same is often not the case for suppliers further down the value chain. Even among a group of companies engaged with the Decent Work in Global Supply Chains Action Platform, developed by the UN Global Compact in 2017, only 53 percent map their suppliers beyond Tier 1 (UNGC 2018). Less than half (47 percent) require major busi-ness partners to have anti-discrimination policies.
An assessment of a group of companies using the Women’s Empowerment Principles Gender Gap Analysis Tool62 revealed that only 12 percent include gender equality criteria in their supply chain management tools. There are also gaps in other aspects related to gender equality. While some 1,800 CEOs have formally committed to continuous leadership and improvement on gender equality and women’s empowerment by signing the CEO Statement of Support for the Women’s Empowerment Principles launched in 2010, even leading companies in this field appear to be failing in various respects. The 2018 Women’s Empowerment Principles Global Trends Report (UNGC et al. 2018) finds that among a group of 100 companies that applied the tool early on, a majority reported progress related to maternity and paternity leave, as well as efforts to embed gender in CSR, philanthropy, advocacy and partnerships. Progress in other areas, how ever, was far less apparent:
5% set procurement and/or percentage spend targets with women-owned enterprises
15% set goals to build the pipeline of women for management positions
10% assess differential impacts on men and women during human rights or social impact assessments
16% ensure equal participation of women and men in community consultations
23% seek to challenge gender norms and promote positive images of women and girls in marketing
30% set time-bound, measurable goals and targets in strategy
32% have an organization-wide gender equality strategy
45% have a policy addressing equal pay for equal work of equal value
49% provide confidential grievance, resolution and non-retaliation mechanisms to ensure an environment free of violence, harassment and sexual exploitation
The fast pace of technological change is gen-erating new issue areas or problems that need to be factored into sustainability disclosure and reporting, for example, the socio-psychological impacts on children and others of social media, increasing emissions associated with the transport sector due to online shopping, and employment issues (including work transition) associated with green economy transitions and artificial intelligence, automation and robotics.63
SDG gaps are also apparent. While large corpo rations increasingly acknowledge the SDGs, action often relates to only a few goals. An analysis of SDG uptake within the field of impact investing found that investors tended to focus on a limited range of issues: first and fore most, decent work/economic growth (SDG 8), followed by climate action (13), then sustainable cities/communities (11) and global health and well-being (3). Relatively few engaged with goals associated with education (4), inequalities (inclu ding gender) (5 and 10)64, peace/justice/strong institutions (16), life on land and below water (14, 15), and partnerships for development (17) (GIIN 2017).
60 See, for example, Clean Clothes Campaign 2018 “Campaign Launch: Turn Around H&M” https://cleanclothes.org/news/2018/04/30/campaign-launch-turn-around-h-m
61 See http://about.hm.com /en/sustainability/sustain able-fashion/wages.html
62 The Women’s Empowerment Principles Gap Analysis Tool (WEPs Tool) was developed in 2017 to provide businesses with a user-friendly and confidential self-assessment of their performance on women’s empowerment and gender equality. The WEPs Tool is composed of 18 multiple choice questions in the areas of leadership, workplace, marketplace and community. Each question is organized across four management stages—commitment, implementation, measurement and transparency—to ensure pledges are coupled with substantive action to implement the WEPs. Topics include company-wide gender equality strategies, equal pay, recruitment, supporting parents and caregivers, women’s health, prevention and response to violence and harassment, gender-responsive sourcing, and advocacy for gender equality in communities of operation. See UNGC et al. (2018) and https://weps-gapanalysis.org/resources/#
63 For a comprehensive analysis of challenges associated with the future of work see Global Commission on the Future of Work 2019 https://www.ilo.org/global/topics/future-of-work/WCMS_578759/lang--en/index.htm
64 This is despite the fact that impact investors identify “women and girls” as a key beneficiary group (see GIIN 2017, Figure IV, Executive Summary).
52
UNRISD
Reliability and credibility
...[B]y and large, companies continue to take a minimally compliant approach to sustainability disclosure, providing the market with information that is inadequate for making investment decisions.
Sustainability Accounting Standards Board 2017a:3
Overly complex and confusing disclosure and reporting, lack of comparability, and clutter and omissions associated with materiality all affect the reliability and credibility of data and reporting narratives. But there are also other conditions that are particularly pertinent in this regard. Here we refer to (i) the degree of bias and self-promotion within reporting, (ii) the possibility that ratings and rankings adopt quite different criteria for assessing performance, (iii) the tendency to focus on policy and reforms to management systems as a proxy for performance, and (iv) a myopic perspective whereby companies fail to relate data on progress to broader long-term goals.
Selective disclosure and reportingAs indicated in the above quote, disclosure by its very nature involves some bias, which is also under pinned by the multiple uses of indicators. Herzi (2018)65 refers to five types of usage which have very different positive and negative impli cations for the quality of disclosure and reporting:• Instrumental: inform decisions
that have impacts• Conceptual: catalyse learning
and understanding• Tactical: substitute for action
and deflect criticism• Symbolic: provide ritualistic assurance• Political: support a predetermined
position
...indicators...are simplifying tools designed to capture complexity and help convey information...[T]his process of simplification results in trade-offs; decisions to exclude and include; and to manipulate data...We must accept that [sustainability indicators] are not ‘laws of nature’ but human constructs that reflect the biases, failings, intention and worldview of their creators.
Bell and Morse 2018:6-7
From the perspective of sustainability, care needs to be taken to constantly rein in the tac-tical, symbolic and political uses of disclosure and reporting. Mark Kramer, who with Michael Porter promoted the concept of “shared value” noted above, points out that while
most companies right now are doing a sustainability report...[they’re] generally not reporting the bad news, and [instead share] some anecdotes about some of the wonderful things they’re doing that they have cherry-picked. So, extractives companies don’t say a whole lot about carbon footprints and fossil fuel, and banks don’t say a whole lot about the high charges for people with bad credit or the overdraft fees. Having this sustainability report gives them a vehicle to report on the things that they want to report on and that make them look good and skip over the tougher issues.66
Despite the considerable efforts of the GRI and others to promote more meaningful disclosure and reporting, there are ongoing concerns that
[t]oo many companies have used the [GRI] framework à la carte, and very few hire external assurers to report on the enterprise’s adherence to the guidelines. ...While organizations are undoubtedly spending considerable time and effort to apply the GRI, the reports
65 These multiple uses are cited in Bell and Morse (2018:7-8).
66 Cited in Nitzberg (2016).
“ “
53
CORPORATE SUSTAINABILITY ACCOUNTING: WHAT CAN AND SHOULD CORPORATIONS BE DOING?
in large part represent a biased public relations medium, emphasizing what those organizations wish to report—the positive features about their sustainability endeavors, omitting descriptions of the negative features that require significant attention (Bloom 2016:229).
Comparing disclosure among large United States corporations in 1977 and 2010, Cho et al. (2015) find that “legitimacy factors” related to firm size and membership in environmentally sensitive industries were a major driver of disclosure. Therefore, they suggest, concerns about disclosure being an exercise in image enhancement remain as pertinent today as they were in the past.
In their evaluation of the Ethical Trading Ini-tiative (ETI), Barrientos and Smith (2012) note that within the area of labour standards there is a tendency for companies to focus more on “outcome standards” related to occupational health and safety or minimum wage compliance than on “process rights” associated with core labour standards such as freedom of association and collective bargaining.
Part of the problem regarding selective reporting and bias concerns the process of determining what is a material issue and indicator—that is, one that is necessary in order to be able to make informed decisions. A rigorous process of materiality determination is the key to consistent, relevant and credible disclosure. As noted in Chapter 3, Mark McElroy (2019) points out that such a determination process should involve identifying the multiple impacts that corporate behaviour has on different forms of capital (natural, social, human, economic and so forth), as well as the key stakeholders impacted. Their concerns and preferences should, in turn, be factored into the process.
Variations in assessment criteriaManagers, like other stakeholders, may adopt quite different criteria to determine what con-stitutes good and bad practice, as well as what is material. This also applies to different ratings and rankings entities or scorecard initiatives that may assess the performance of a particular corporation quite differently. Even assessments
made by stakeholders that have a more critical take on big business may vary significantly.
It is curious, for example, that a company like Danone, which receives kudos from people like Mohammed Yunus and the social business or B Corp community, as well as the international trade union movement concerned with worker rights, comes in at the bottom of the Oxfam ranking of the world’s top 10 food and beverage corporations, as referred to in Box 1.3 and Annex 3.
Why does Oxfam rank Danone so poorly? In relation to workers, it is apparently because the company does not publish the number of workers in its supply chain. For union organizations, such as the International Union of Food, Agricultural, Hotel, Restaurant, Cater-ing, Tobacco and Allied Workers’ Associations (IUF), this indicator probably pales in compar-ison with the fact that Danone was one of the first transnational corporations to sign an inter national framework agreement to respect workers’ rights across its global operations and, more recently in 2016, signed an agreement with the IUF, its tenth, to address the structural problem of precarious employment.67
From the perspective of transformative change, the social business model is important given that the surplus generated is reinvested into the business and the target group of beneficiaries rather than being passed on to investors (Yunus 2007:24). Similarly, international framework agreements between international union federa-tions and transnational corporations can play a key role in promoting labour rights globally. One example with a long track record is the agreement between Danone and the IUF.
Similarly, two companies that rank fairly high on the Oxfam rating—Nestlé and Coca-Cola—are repeatedly singled out as bad performers on the IUF website. The only company that seems to fare reasonably well for both these stake-holders is Unilever. Such discrepancies point to the need for not only greater consensus among key stakeholders on key performance issues and indicators, but also critical assessment of assumptions about what are key performance indicators.
67 See the IUF’s web repository of international framework agreements at http://www.iufdocu ments.org/ifa/

54
UNRISD
Policy versus performanceData and information often focus more on com pany policy and management systems, and less on actual social and environmental performance and impacts. While it is tempting to assume that improvements in management systems inevitably translate into positive out-comes in terms of performance, the evidence is far from conclusive and, indeed, may point in the other direction (Delmas and Blass 2010; Boiral 2013).
The assessment and ranking of 98 of the world’s largest publicly traded companies from three “at risk” sectors—agricultural products, apparel and extractives—conducted by Corporate Human Rights Benchmark (2018) revealed that while most had a system in place to identify human rights risks and impacts,
many companies are not implementing the UN Guiding Principles on Business and Human Rights (UNGPs), with all the dangers of human rights abuses of workers and communities that this implies…On average, companies are better at demonstrating their commit-ments via policy than their actual processes. Similarly, processes are better disclosed than evidence of systematic implementation (CHRB 2018:6).
This observation is confirmed by the data presented above, on how companies are ad-dressing corruption or applying the Gender Gap Analysis Tool in the supply chain. While a substantial percentage of corporations have a policy in place, concrete implementation meas-ures are far less apparent.
Frequently we are reminded of the contradiction between seemingly good CR policy and bad performance when global corporations find themselves at the centre of negative public atten-tion and are delisted from key ratings initiatives such as the DJSI. Examples include:• BASF, Merck (Germany) and others
found guilty by the European Union of price fixing related to vitamins in 2001.
• Siemens, for bribery scandals in 2008.• BP, following the 2010 Deepwater
Horizon oil spill in the Gulf of Mexico.• TEPCO’s health, safety and risk
assessment failures related to the 2011 Fukushima nuclear disaster.
• Olympus, Tesco and Toshiba account-ing scandals unearthed or prosecuted in 2011, 2014 and 2015, respectively.
• Petrobras fraud and corruption scandal reported in 2015.
• Volkswagen’s emissions scandal in 2015.
A more fundamental problem with ratings is that observed by Delmas and Blass (2010) in relation to environmental disclosures. The case may be that corporations with poor performance, who are under the greatest pressure to adopt CR principles and policies and to work hardest to (re)gain reputational advantage, end up having the best environmental management systems. The problem is that, often, ratings as-sess environmental management systems to a far greater extent than actual performance or impacts. Hence, firms that are placed at the top of ratings may be doing well in terms of their environmental management systems and reporting but far worse in terms of performance (Delmas and Blass 2010). Similarly, Boiral finds that information in the sustainability reports of 23 energy and mining companies that claimed the GRI A or A+ rating (see Box 1.2) were largely disconnected from several GRI principles, real business impacts and critical issues revealed by others (Boiral 2013).
Indeed, a key challenge is how to move beyond the focus on adapting or reforming ESG man-agement systems to actual performance and impacts. Too often management system reform is taken as a proxy for improved impacts. The old adage about how a manufacturer of cement life jackets could obtain ISO 9001 certification (for management systems aimed at ensuring product quality) illustrates the problem at hand—the product poses a serious threat to any user regardless of the fact that its design and manufacturing complied with various specifications.
The broader sustainability contextAnother major limitation of data aimed at assessing corporate sustainability performance relates to the broader sustainability context (Reporting 3.0 Blueprint 5). As Ralph Thurm
55
CORPORATE SUSTAINABILITY ACCOUNTING: WHAT CAN AND SHOULD CORPORATIONS BE DOING?
(2013) explains: “information available through sustainability reports and websites only tells us who is less bad. We seem completely in the dark when it comes to knowing what is minimally good enough”. GRI co-founder Allen White argues that:
ESG does not, by nature, carry a true sustainability gene. A company may rate very highly on an ESG score, but to say this company is an excellent sustainability performer is a very fundamentally differ-ent statement. [A] company [should be] positioned to prosper for the long-term in a way that respects limits, thresholds, and norms that are externally defined, not simply defined by peer group com-parison or internal targets and goals (cited in Baue 2013).
Another contextual gap relates to so-called fair allocations—that is, the consideration of what an equitable distribution of resources among stakeholders might entail (Thomas and McElroy 2016).68
As r3.0 points out, “...existing reporting frame-works and standards...tend to provide numera-tors without denominators…[T]his would be a kin to a sports reporter mentioning the improvement rate of a star player’s first-half goal scoring, while neglecting to mention her teammates’ worsening rates dragging the overall team rate down; or the team’s statistical underperformance in the second half, and hence its overall losing streak” (Thurm et al. 2018:52).
For example, a company may provide data that indicate a decline in carbon emissions but not relate this to a tolerable amount of GHG emis-sions from the perspective of science-based targets aimed at controlling global warming.
Other data may show an increase in workers’ wages but fail to relate this to the distribution of company income and economic or financial performance. Put another way, are workers receiving their fair share of the pie or are they getting the crumbs? To know this, workers’ wages need to be viewed in context. How are wage trends faring in relation to profitability and executive remuneration? How unequal
is the CEO-worker pay ratio? How do trends in real wages compare with trends in labour productivity? Similarly, data may show an improvement in certain working conditions among core employees but ignore broader trends related to subcontracting, which are often associated with a decline in labour stan-dards.
Rotz and Fraser (2018) point out that “indicators need to be nested in a broader analysis that helps to make sense of context specific dynamics” (cited in Bell and Morse 2018:6). Emphasizing context also requires an assessment of “linkages, synergies and antagonisms between goals and targets (and their associated sustainability indicators of course) rather than simple listings under themes” (Bell and Morse 2018, citing Gallopin 2018:6).
In an effort to go beyond selective ESG disclo -sures and to ensure that sustainability reporting would “explicitly link micro (company) perfor-mance with macro (systems wide) outcomes”,69 GRI introduced the Sustainability Context Principle in the early 2000s. Companies were expected to link the assessment of performance to key contextual issues and trends at local, national, regional and global levels. However, as noted by the co-founder of the Global Reporting Initiative, Allen White, its application “remains incipient, uneven and occasional”.70 A 2017 study that reviewed over 40,000 sustainability reports published since 2000, found that just 5 percent of reports cited ecological limits at all, while only 31 out of 9,000 companies had disclosed their environmental impacts in the context of ecological limits and strategies for meeting these limits (Bjørn et al. 2017, cited in Reporting 3.0 2018).
Mainstream responses
Within the dense institutional ecosystem that supports CR, efforts are emerging on various fronts to address the above accounting issues related to complexity, comparability, reliability, credibility, relevance and materiality. Indeed, today there is a palpable urgency to the mat-ter and even the stalwarts of sustainability measurement and reporting cannot remain
68 See also Baue 2019, Raworth 2017, UNEP 2015.
69 Allen White cited in Thurm 2017:122.
70 Cited in Baue 2017.
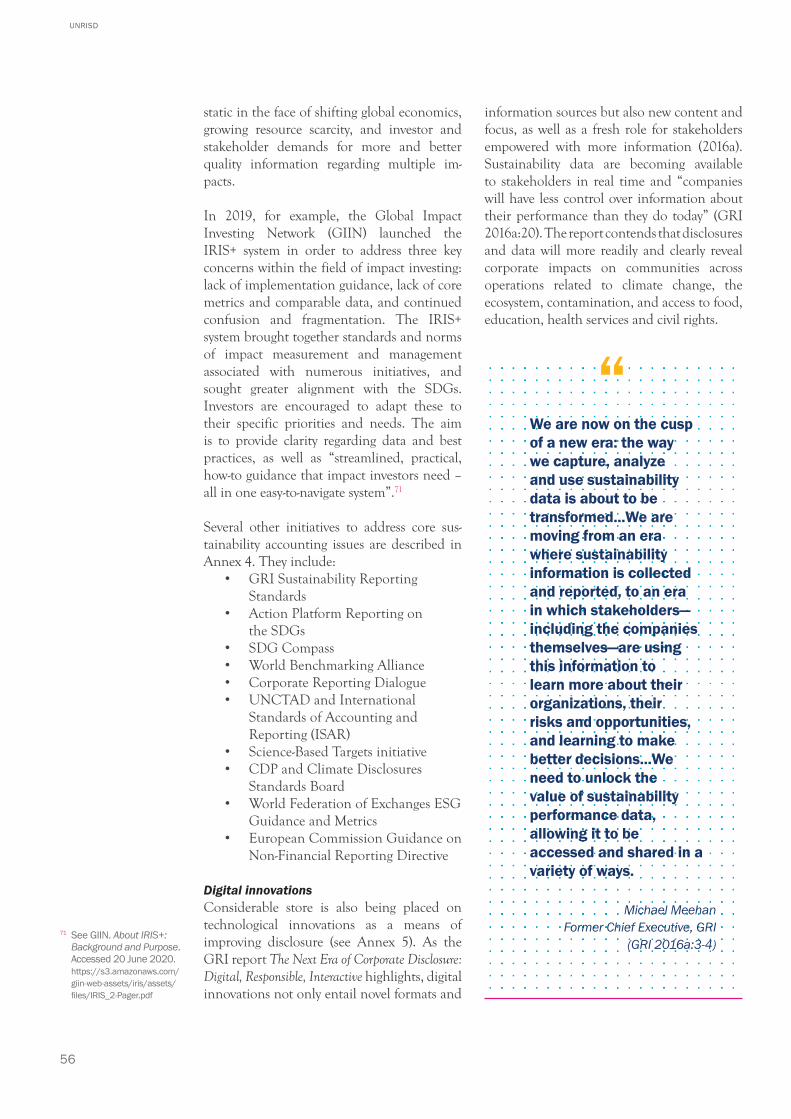
56
UNRISD
static in the face of shifting global economics, growing resource scarcity, and investor and stakeholder demands for more and better quality information regarding multiple im-pacts.
In 2019, for example, the Global Impact Investing Network (GIIN) launched the IRIS+ system in order to address three key concerns within the field of impact investing: lack of implementation guidance, lack of core metrics and comparable data, and continued confusion and fragmentation. The IRIS+ system brought together standards and norms of impact meas urement and management associated with numerous initiatives, and sought greater align ment with the SDGs. Investors are encouraged to adapt these to their specific priorities and needs. The aim is to provide clarity regarding data and best practices, as well as “streamlined, practical, how-to guidance that impact investors need – all in one easy-to-navigate system”.71
Several other initiatives to address core sus-tain ability accounting issues are described in Annex 4. They include:
• GRI Sustainability Reporting Standards
• Action Platform Reporting on the SDGs
• SDG Compass• World Benchmarking Alliance• Corporate Reporting Dialogue• UNCTAD and International
Standards of Accounting and Reporting (ISAR)
• Science-Based Targets initiative• CDP and Climate Disclosures
Standards Board• World Federation of Exchanges ESG
Guidance and Metrics• European Commission Guidance on
Non-Financial Reporting Directive
Digital innovationsConsiderable store is also being placed on tech nological innovations as a means of improv ing disclosure (see Annex 5). As the GRI report The Next Era of Corporate Disclosure: Digital, Responsible, Interactive highlights, digital innovations not only entail novel formats and
information sources but also new content and focus, as well as a fresh role for stakeholders empowered with more information (2016a). Sustainability data are becoming available to stakeholders in real time and “companies will have less control over information about their performance than they do today” (GRI 2016a:20). The report contends that disclosures and data will more readily and clearly reveal corporate impacts on communities across operations related to climate change, the ecosystem, contamination, and access to food, education, health services and civil rights.
We are now on the cusp of a new era: the way we capture, analyze and use sustainability data is about to be transformed...We are moving from an era where sustainability information is collected and reported, to an era in which stakeholders—including the companies themselves—are using this information to learn more about their organizations, their risks and opportunities, and learning to make better decisions...We need to unlock the value of sustainability performance data, allowing it to be accessed and shared in a variety of ways.
Michael Meehan Former Chief Executive, GRI
(GRI 2016a:3-4)71 See GIIN. About IRIS+:
Background and Purpose. Accessed 20 June 2020. https://s3.amazonaws.com/giin-web-assets/iris/assets/files/IRIS_2-Pager.pdf
“
57
CORPORATE SUSTAINABILITY ACCOUNTING: WHAT CAN AND SHOULD CORPORATIONS BE DOING?
Indeed, enhanced and emerging technologies are particularly useful for improving commu-nication and engaging with stakeholders, gathering accurate and reliable information, monitoring performance, and responding to risks and opportunities throughout the supply chain (see Box 2.1).
For further and more detailed examples of how digital innovations are being harnessed to potentially improve sustainability, see Annex 5. It is important to point out that while digital innovations present opportunities to improve the quality of CR disclosure and reporting, they also have a variety of actual or potential limitations, as additionally noted in Annex 5.
Box 2.1. Enhancing Disclosure and Reporting Through Digital Innovations
• Heineken published its first digital-only combined financial and sustainability annual report in 2018. Website visitors can access the company’s interactive GRI reference table to see the company’s reporting against the GRI Sustainability Standards and to learn more about its “Brewing a Better World” strategy.*
• Thread International and Patagonia employ supply chain mapping to trace raw materials (Amesheva 2017). Using Sourcemap software, Thread follows the collection of plastic bottles through to their transformation into “flakes” and, ultimately, clothing.
• Carbon Trust’s collaboration with BT (formerly British Telecom) using big data led to the discovery that emissions beyond the telecom company’s direct control made up 92 percent of the total and that two-thirds of the emissions originated in BT’s supply chain of 17,000 suppliers across the world (Hsu 2014).
• Austral Fisheries is piloting the new OpenSC digital platform, launched by WWF-Australia and BCG Digital Ventures, that employs blockchain and cutting-edge technologies to help firms clear their supply chains of illegal, unethical and environmentally damaging products. OpenSC is one of the world’s first “profit with purpose” startups using blockchain technology to reach the SDGs. Consumers can track “where a specific product came from, when and how it was produced, and how it journeyed along the supply chain” (Austral Fisheries 2019).
• IBM, LG Chem, Huayou Cobalt and Ford are partners in a pilot watched over by RCS Global, a multinational responsible-sourcing organization to cut the use of cobalt connected to human rights abuses. The technology traces cobalt from the Huayou mine and smelter in the Democratic Republic of Congo to the LG Chem battery and cathode factory in South Korea and ultimately to the Ford plant in the United States. The goal is to increase transparency along the mining industry’s worldwide supply chain (Jamasmie 2019).
• Walmart uses an IBM blockchain platform to track 25 types of food products such as chicken, milk and berries. The rationale is to build trust with consumers and respond to their need to know where their food originates, how it was grown and if it is organic. In the future, the company will enable customers to engage with its blockchain solution (Bhattacharyya 2018).
* See www.theheinekencompany.com
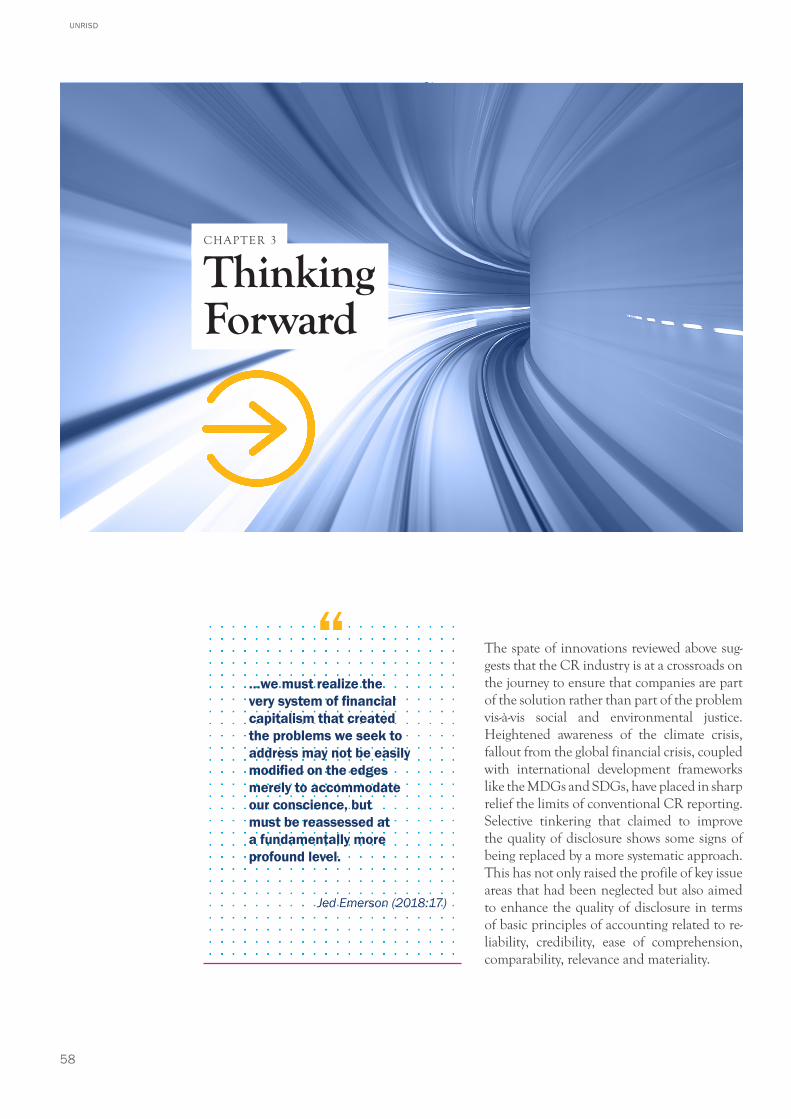
58
UNRISD
Thinking Forward
CHAPTER 3
The spate of innovations reviewed above sug-gests that the CR industry is at a crossroads on the journey to ensure that companies are part of the solution rather than part of the problem vis-à-vis social and environmental justice. Height ened awareness of the climate crisis, fallout from the global financial crisis, coupled with international development frameworks like the MDGs and SDGs, have placed in sharp relief the limits of conventional CR reporting. Selective tinkering that claimed to improve the quality of disclosure shows some signs of being replaced by a more systematic approach. This has not only raised the profile of key issue areas that had been neglected but also aimed to enhance the quality of disclosure in terms of basic principles of accounting related to re-liability, credibility, ease of comprehension, com parability, relevance and materiality.
…we must realize the very system of financial capitalism that created the problems we seek to address may not be easily modified on the edges merely to accommodate our conscience, but must be reassessed at a fundamentally more profound level.
Jed Emerson (2018:17)
“
59
CORPORATE SUSTAINABILITY ACCOUNTING: WHAT CAN AND SHOULD CORPORATIONS BE DOING?
Nevertheless, there are serious concerns that this approach, albeit far more comprehensive than earlier, is unlikely to do much to transform the macro conditions related to human well-being and planetary health (Thomas and McElroy 2016; Baue 2019). CR initiatives are still heavily geared towards reducing the incidence of harm related to selected impacts (Baue and Thurm 2016). Furthermore, they often do so through the proxy of management systems reform rather than concrete changes in performance and im-pact. This approach has not factored in what a sustainable future might actually look like re-garding key social, environmental, economic and governance conditions, nor does it measure pro-gress towards such goals and targets. Moreover, it does not consider key structural determinants of unsustainable development or of well-being, in particular those associated with inequality and power relations. This represents a critical weak ness because both aspects—the normative dimension associated with time-bound targets, and the structural dimension—are what funda-mentally define “transformative change”. Viewed from this perspective, transformative change involves not only a journey towards a sustainable future but also one that is only possible if the structures that underpin and reproduce unsustainable development are transformed.
The idea that the field of CR assessment and sustainability accounting might be able to promote such structural change is, of course, a tall order. Policies and practices related to CR tend to work very much within the rules of the game, not questioning structural dimensions of capitalism—that is, the broader institutions within which corporations are embedded. Referring to the GRI, Levy and Brown note:
The impact of [non-financial reporting (NFR)] is constrained due to its nesting within the broader institutions of capi-talism, particularly financial markets and legal structures of corporate governance. GRI would never have made any progress had it directly challenged the primacy of profit maximization, the legal rights of shareholders or the autonomy of corpo-rate management. These considerations led the GRI entrepreneurs to shape the reporting guidelines as complementary to corporate and financial market needs.
The strategic risk, of course, is that GRI would be co-opted and assimilated within these structures rather than trans-forming them. This does appear to be the emerging outcome. NFR does not appear to be affecting core product or market strategies, or the fundamentals of corporate governance (Levy and Brown 2012:119).
Nevertheless, as noted below, spaces already exist and can be cultivated, not least politically, for structural change to occur. Furthermore, the set of issues examined in Part 2 of this report suggest a number of entry points for forging a movement for transformative change within the CR field.
It is important to note that focusing on such issues, related indicators and normative targets is a means for both assessing performance regard ing the SDGs and transformative change, and understanding what sustainability is really about. As suggested by Bell and Morse:
Hence, it is not solely a case of [Sustain-ability Indicators (SIs)] being created as an operational output after an under-standing of sustainability and resilience has been arrived at, but SIs as a catalytic precursor to help facilitate such an under standing (2018:6).
A transformative approach fundamentally ques-tions the normative hierarchy of sustainable de-velopment goals. In its comprehensive analysis of policy innovations for transformative change, UNRISD (2016) asserts that what needs to change is the prioritization of economic, social and environmental objectives. Mainstream CR disclosure as currently practised—no matter how refined—continues to uphold a normative hierarchy whereby the economic/financial di-mension prevails. As Elkington observes:
Fundamentally, we have a hard-wired cultural problem in business, finance and markets. Whereas CEOs, CFOs, and other corporate leaders move heav-en and earth to ensure that they hit their profit targets, the same is very rarely true of their people and planet targets. Clearly, the Triple Bottom Line has failed to bury the single bottom line paradigm (2018).
60
UNRISD
After some three decades of tinkering and incrementalism, there is growing recognition of the need for a profound rethink of what cor-porate sustainability is in relation to the major con temporary development challenges, and how sustainability impacts should be measured. It is noteworthy that John Elkington, who coined the triple bottom line concept, has himself called for a “product recall” for what has become a defective concept given the somewhat myopic way it has been applied to date. As he further notes:
...the TBL wasn’t designed to be just an accounting tool. It was supposed to provoke deeper thinking about capitalism and its future, but many early adopters understood the concept as a balancing act, adopting a trade-off mentality (2018).
According to Ralph Thurm (2014), corporate sustainability policies and practices need to over-come a minimalist “do no harm” strategy and transition to one that is “net positive”:72
Those dealing with sustainability have often forgotten the true meaning of sus-tainability, especially using ‘inter genera-tional equity’ as one of the most important guidelines... Overall, the major ity of those corporations that have a certain focus on sustainability…are happy with a ‘show less bad’ attitude, simply because they think becoming net positive is impossible to reach (Thurm 2014).
Following years of monitoring and analysing progress, particularly in the agro-food and bev-erage sector, Oxfam (2016), too, has called for a shift from an incremental to a transformative approach, along four dimensions: lobbying to reverse public policies involving a “race to the bot tom”; countering the growing economic pow-er of corporations associated with the con cen-tra tion of capital; redistribution of value with in the value chain; and new patterns of business ownership, issues to which we return below.
In the context of transitions associated with a carbon-neutral and digital future, the Global Commission on the Future of Work (2019) em-pha sizes, inter alia, the need to focus on long-term “transformative” investments in areas of decent and sustainable work. These investments would require not only an enabling public policy environment but also:
Reshaping business incentive structures for longer term investment approaches and exploring supplementary indicators of human development and well-being. These actions can include fair fiscal poli-cies, revised corporate accounting stan-dards, enhanced stakeholder represen-tation and changes in reporting practices. New measures of country progress also need to be developed to account for the distributional dimensions of growth, the value of unpaid work performed in the service of households and communities, and the externalities of economic activity, such as environmental degradation (GCFW, Executive Summary:4).
From a transformative perspective, the notion of risk shifts beyond that of the corpo ration (such as risks to reputation, risks to supply chain coordination, risks related to liability, risks associated with resource depletion and natural disasters) to risks to the sufficiency and health of multiple capitals and the well-being of the stakeholders dependent on them (Thomas and McElroy 2016). Moreover, the notion of what is relevant and material shifts beyond basic aspects of social protection (for example, minimum wages, occupational health and safety, non-discrimination in the workplace) and the elimination of environmental “bads” (such as pollution and waste) to structural conditions. These include:• power asymmetries within corporate
structures and value chains that marginalize the voice and bargaining power of certain stakeholders;
• globalized value chain formation and lengthening trade circuits that mask irresponsibility and unsustainable impacts both upstream and downstream;
• aspects of corporate culture that reinforce business-as-usual and downplay or marginalize social and environmental ethics;
• incentive structures within corporations and financial institutions that privilege conventional priorities such as short-term financial results, aggressive tax planning and the ongoing externalization of social and environmental costs;
72 The term “net positive” refers to “putting more back into the environment or society than a company takes out, with a resulting positive corporate footprint” (Forum for the Future et al. 2014:6).
61
CORPORATE SUSTAINABILITY ACCOUNTING: WHAT CAN AND SHOULD CORPORATIONS BE DOING?
• ownership and governance structures that privilege (i) shareholder primacy and returns to senior management over more equitable patterns of distribution of income and value added, and (ii) the hierarchical power of managerial elites that imposes limits on workplace democracy;
• financialization, which reinforces the imperative of short-term financial results over long-term integrated planning, and enhances the power within value chains of companies that control trading networks, finance and insurance;73
• processes of disempowerment associated with the flexibilization of labour markets and constraints on unionization and collective action involving workers and producers; and processes of empowerment that can enhance the capabilities and influence of disadvantaged stakeholders;
• gender disadvantage in pay and promotion that is related to time use demands and cultural assumptions associated with caregiving; and
• disabling public policy environments, shaped in part by regressive forms of corporate political influence, that not only fail to facilitate and encourage corporate responsibility and sustainability but may actually enable inaction, irresponsible behaviour and the so-called “race to the bottom”.
As the report of the IPPR Commission on Eco-nomic Justice (in the United Kingdom) notes:
Economic justice needs to be ‘hard-wired’ into the way the economy works. [Injustices and inequalities] need to be tackled at source, in the structures of the economy in which they arise. These include the labour market and wage bar-gain ing, the ownership of capital and wealth, the governance of firms, the oper-ation of the financial system and the rules that govern markets (IPPR 2018:4).
Furthermore, the process for determining “struc-tural materiality” and sustainability targets needs to extend beyond the worldviews and bodies
of knowledge that typically inform mainstream disclosure and reporting. It is important to think outside the box, or at least far more holistically than is generally the case. The remainder of this chapter points to four avenues of inquiry that can yield important insights in this regard: (i) cutting edge innovations that have focused on so-called context-based disclosure; (ii) alter-native business and enterprise models and varieties of capitalism—ones that have legal, governance and cultural arrangements that align the DNA of business and enterprise with environmental and social objectives and democratic governance; (iii) social science theory and multidisciplinarity—that is, concep-tual and analytical insights associated with a variety of academic sub-disciplines and schools of thought; and (iv) transdisciplinarity—that is, worldviews, knowledge and perspectives asso-ciated with a broad range of different societal actors.
Learning from cutting-edge innovations
An important avenue for rethinking indicators is to examine the objectives and targets adopted by initiatives that attempt to go beyond conventional approaches to disclosure and reporting. The fol-low i ng seem particularly pertinent in this regard.
Net PositiveThe Net Positive ProjectLaunched in 2016, the Net Positive Project aims to develop analysis, awareness, guidelines, tools and other resources to enable companies to go beyond a “do no harm” approach and transition to one that proactively replenishes the environment and ensures that companies leave a positive societal and environmental foot-print.74 The 12 key principles underlying this approach convey a level of ambition and scope of materiality that far exceeds conventional disclosure and reporting (see Box 3.1).
The world’s most innovative organisa-tions recognise this, and are acting on it. We’re seeing businesses being entirely powered by renewable energy, reusing expensive materials and slashing their carbon emissions and enhancing society.
73 For an analysis of the effects of financialization on the copper value chain, see Kesselring et al. 2019.
74 Members of the Net Positive Group include BT, Capgemini, Dell, Greater Manchester Fire and Rescue, Ikea, Kingfisher, Pepsico, SKF, The Crown Estate and TUI Group.
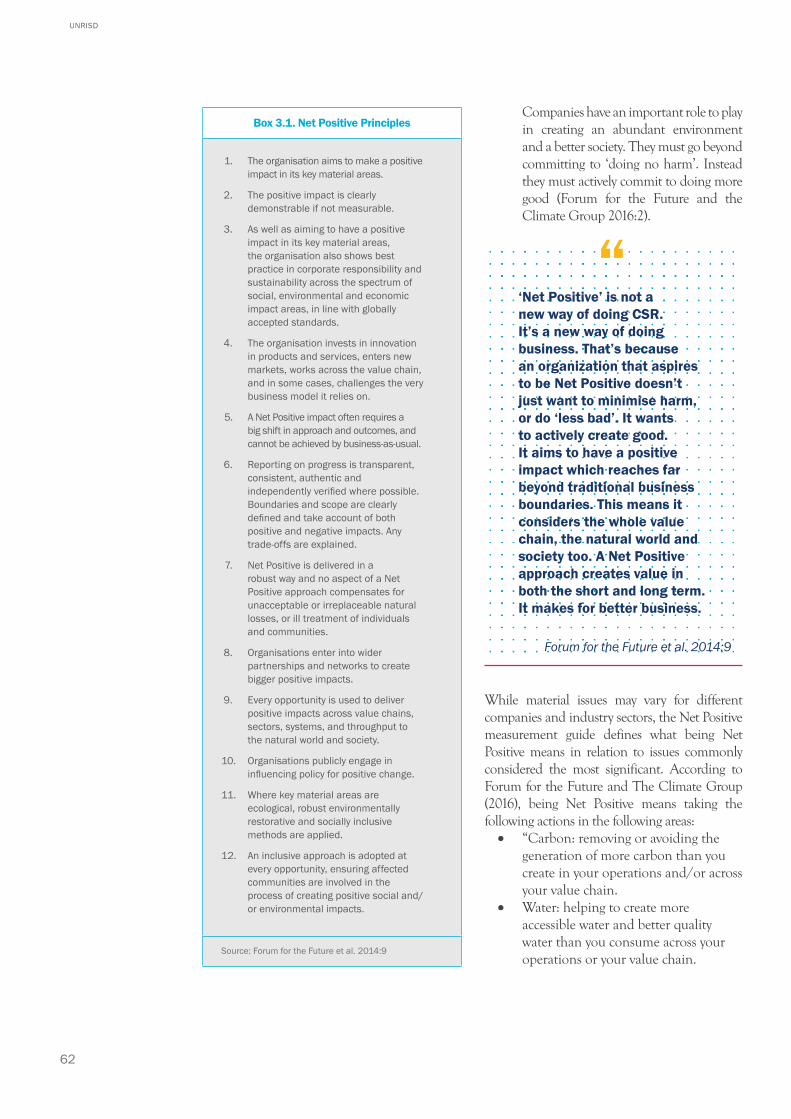
62
UNRISD
Companies have an important role to play in creating an abundant environment and a better society. They must go beyond committing to ‘doing no harm’. Instead they must actively commit to doing more good (Forum for the Future and the Climate Group 2016:2).
‘Net Positive’ is not a new way of doing CSR. It’s a new way of doing business. That’s because an organization that aspires to be Net Positive doesn’t just want to minimise harm, or do ‘less bad’. It wants to actively create good. It aims to have a positive impact which reaches far beyond traditional business boundaries. This means it considers the whole value chain, the natural world and society too. A Net Positive approach creates value in both the short and long term. It makes for better business.
Forum for the Future et al. 2014:9
While material issues may vary for different companies and industry sectors, the Net Positive measurement guide defines what being Net Positive means in relation to issues commonly considered the most significant. According to Forum for the Future and The Climate Group (2016), being Net Positive means taking the following actions in the following areas:• “Carbon: removing or avoiding the
generation of more carbon than you create in your operations and/or across your value chain.
• Water: helping to create more accessible water and better quality water than you consume across your operations or your value chain.
Box 3.1. Net Positive Principles
1. The organisation aims to make a positive impact in its key material areas.
2. The positive impact is clearly demonstrable if not measurable.
3. As well as aiming to have a positive impact in its key material areas, the organisation also shows best practice in corporate responsibility and sustainability across the spectrum of social, environmental and economic impact areas, in line with globally accepted standards.
4. The organisation invests in innovation in products and services, enters new markets, works across the value chain, and in some cases, challenges the very business model it relies on.
5. A Net Positive impact often requires a big shift in approach and outcomes, and cannot be achieved by business-as-usual.
6. Reporting on progress is transparent, consistent, authentic and independently verified where possible. Boundaries and scope are clearly defined and take account of both positive and negative impacts. Any trade-offs are explained.
7. Net Positive is delivered in a robust way and no aspect of a Net Positive approach compensates for unacceptable or irreplaceable natural losses, or ill treatment of individuals and communities.
8. Organisations enter into wider partnerships and networks to create bigger positive impacts.
9. Every opportunity is used to deliver positive impacts across value chains, sectors, systems, and throughput to the natural world and society.
10. Organisations publicly engage in influencing policy for positive change.
11. Where key material areas are ecological, robust environmentally restorative and socially inclusive methods are applied.
12. An inclusive approach is adopted at every opportunity, ensuring affected communities are involved in the process of creating positive social and/or environmental impacts.
Source: Forum for the Future et al. 2014:9
“
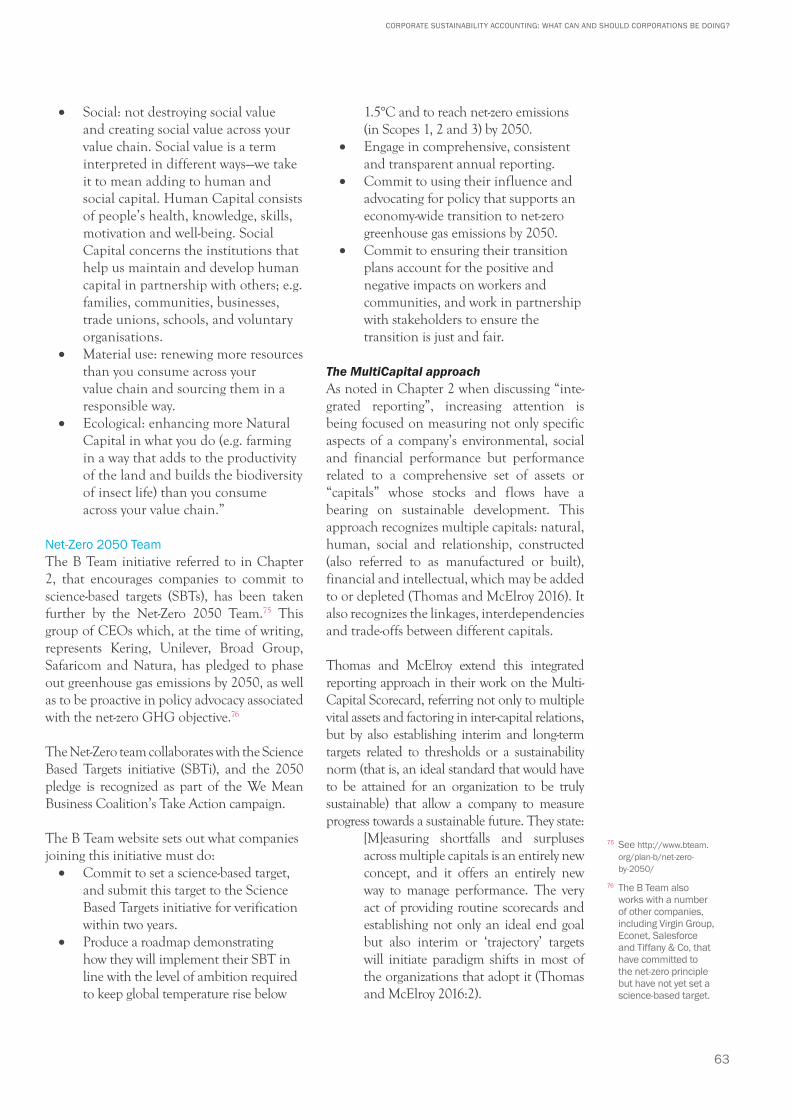
63
CORPORATE SUSTAINABILITY ACCOUNTING: WHAT CAN AND SHOULD CORPORATIONS BE DOING?
• Social: not destroying social value and creating social value across your value chain. Social value is a term interpreted in different ways—we take it to mean adding to human and social capital. Human Capital consists of people’s health, knowledge, skills, motivation and well-being. Social Capital concerns the institutions that help us maintain and develop human capital in partnership with others; e.g. families, communities, businesses, trade unions, schools, and voluntary organisations.
• Material use: renewing more resources than you consume across your value chain and sourcing them in a responsible way.
• Ecological: enhancing more Natural Capital in what you do (e.g. farming in a way that adds to the productivity of the land and builds the bio diversity of insect life) than you consume across your value chain.”
Net-Zero 2050 TeamThe B Team initiative referred to in Chapter 2, that encourages companies to commit to science-based targets (SBTs), has been taken further by the Net-Zero 2050 Team.75 This group of CEOs which, at the time of writing, represents Kering, Unilever, Broad Group, Safaricom and Natura, has pledged to phase out greenhouse gas emissions by 2050, as well as to be proactive in policy advocacy associated with the net-zero GHG objective.76
The Net-Zero team collaborates with the Science Based Targets initiative (SBTi), and the 2050 pledge is recognized as part of the We Mean Business Coalition’s Take Action campaign.
The B Team website sets out what companies joining this initiative must do:• Commit to set a science-based target,
and submit this target to the Science Based Targets initiative for verification within two years.
• Produce a roadmap demonstrating how they will implement their SBT in line with the level of ambition required to keep global temperature rise below
1.5°C and to reach net-zero emissions (in Scopes 1, 2 and 3) by 2050.
• Engage in comprehensive, consistent and transparent annual reporting.
• Commit to using their influence and advocating for policy that supports an economy-wide transition to net-zero greenhouse gas emissions by 2050.
• Commit to ensuring their transition plans account for the positive and negative impacts on workers and communities, and work in partnership with stakeholders to ensure the transition is just and fair.
The MultiCapital approachAs noted in Chapter 2 when discussing “inte-grated reporting”, increasing attention is being focused on measuring not only specific aspects of a company’s environmental, social and financial performance but performance related to a com prehensive set of assets or “capitals” whose stocks and flows have a bearing on sustainable development. This approach recognizes multiple capitals: natural, human, social and relationship, constructed (also referred to as manufactured or built), financial and intellectual, which may be added to or depleted (Thomas and McElroy 2016). It also recognizes the linkages, inter dependencies and trade-offs between different capitals.
Thomas and McElroy extend this integrated reporting approach in their work on the Multi-Capital Scorecard, referring not only to multiple vital assets and factoring in inter-capital relations, but by also establishing interim and long-term targets related to thresholds or a sustainability norm (that is, an ideal standard that would have to be attained for an organization to be truly sustainable) that allow a company to measure progress towards a sustainable future. They state:
[M]easuring shortfalls and surpluses across multiple capitals is an entirely new concept, and it offers an entirely new way to manage performance. The very act of providing routine scorecards and establishing not only an ideal end goal but also interim or ‘trajectory’ targets will initiate paradigm shifts in most of the organizations that adopt it (Thomas and McElroy 2016:2).
75 See http://www.bteam.org/plan-b/net-zero-by-2050/
76 The B Team also works with a number of other companies, including Virgin Group, Econet, Salesforce and Tiffany & Co, that have committed to the net-zero principle but have not yet set a science-based target.
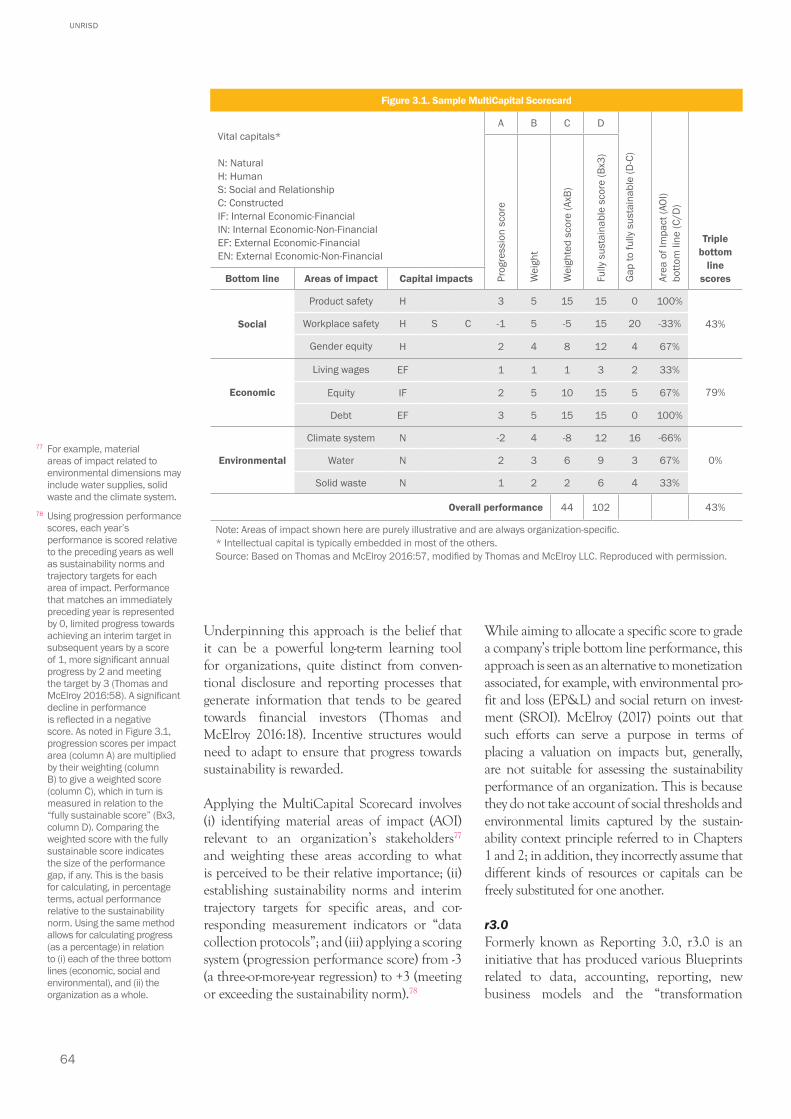
64
UNRISD
Underpinning this approach is the belief that it can be a powerful long-term learning tool for organizations, quite distinct from conven-tional disclosure and reporting processes that generate information that tends to be geared to wards fi nancial investors (Thomas and McElroy 2016:18). Incentive structures would need to adapt to en sure that progress towards sustainability is rewarded.
Applying the MultiCapital Scorecard involves (i) identifying material areas of impact (AOI) relevant to an organization’s stakeholders77 and weighting these areas according to what is perceived to be their relative importance; (ii) establishing sustainability norms and in terim trajectory targets for specific areas, and cor-responding measurement indicators or “data collection protocols”; and (iii) applying a scoring system (progression performance score) from -3 (a three-or-more-year regression) to +3 (meeting or exceeding the sustainability norm).78
While aiming to allocate a specific score to grade a company’s triple bottom line performance, this approach is seen as an alternative to mo n e ti zation associated, for example, with environmental pro-fit and loss (EP&L) and social return on invest-ment (SROI). McElroy (2017) points out that such efforts can serve a purpose in terms of placing a valuation on impacts but, generally, are not suitable for assessing the sustainability performance of an organization. This is because they do not take account of social thresholds and environmental limits captured by the sustain-ability context principle referred to in Chapters 1 and 2; in addition, they incorrectly assume that different kinds of resources or cap itals can be freely substituted for one another.
r3.0Formerly known as Reporting 3.0, r3.0 is an initiative that has produced various Blueprints related to data, accounting, reporting, new busi ness models and the “transformation
Figure 3.1. Sample MultiCapital Scorecard
Vital capitals*
N: NaturalH: HumanS: Social and RelationshipC: ConstructedIF: Internal Economic-FinancialIN: Internal Economic-Non-FinancialEF: External Economic-FinancialEN: External Economic-Non-Financial
A B C D
Gap
to fu
lly s
usta
inab
le (D
-C)
Area
of I
mpa
ct (A
OI)
botto
m li
ne (C
/D)
Triple bottom
line scoresPr
ogre
ssio
n sc
ore
Wei
ght
Wei
ghte
d sc
ore
(AxB
)
Fully
sus
tain
able
sco
re (B
x3)
Bottom line Areas of impact Capital impacts
Social
Product safety H 3 5 15 15 0 100%
43%Workplace safety H S C -1 5 -5 15 20 -33%
Gender equity H 2 4 8 12 4 67%
Economic
Living wages EF 1 1 1 3 2 33%
79%Equity IF 2 5 10 15 5 67%
Debt EF 3 5 15 15 0 100%
Environmental
Climate system N -2 4 -8 12 16 -66%
0%Water N 2 3 6 9 3 67%
Solid waste N 1 2 2 6 4 33%
Overall performance 44 102 43%
Note: Areas of impact shown here are purely illustrative and are always organization-specific.* Intellectual capital is typically embedded in most of the others.Source: Based on Thomas and McElroy 2016:57, modified by Thomas and McElroy LLC. Reproduced with permission.
77 For example, material areas of impact related to environmental dimen sions may include water supplies, solid waste and the climate system.
78 Using progression performance scores, each year’s performance is scored relative to the preceding years as well as sustainability norms and trajectory targets for each area of impact. Performance that matches an imme diately preceding year is represented by 0, limited progress towards achieving an interim target in subsequent years by a score of 1, more significant annual progress by 2 and meeting the target by 3 (Thomas and McElroy 2016:58). A significant decline in performance is reflected in a negative score. As noted in Figure 3.1, progression scores per impact area (column A) are multiplied by their weighting (column B) to give a weighted score (column C), which in turn is measured in relation to the “fully sustainable score” (Bx3, column D). Comparing the weighted score with the fully sustainable score indicates the size of the performance gap, if any. This is the basis for calculating, in percentage terms, actual performance relative to the sustainability norm. Using the same method allows for calculating progress (as a percentage) in relation to (i) each of the three bottom lines (economic, social and environmental), and (ii) the organization as a whole.
65
CORPORATE SUSTAINABILITY ACCOUNTING: WHAT CAN AND SHOULD CORPORATIONS BE DOING?
journey”,79 aimed at designing and scaling-up next generation reporting practices.80 It blends diverse innovations associated with “integrated reporting, contextualization, monetization and internalization, as well as new integrated state-ments such as alternative [profit and loss] accounts and balance sheets” (2016:1).
The r3.0 Data Blueprint focuses less on the data itself and more on (i) “getting a core, harmonised set of principles in place, highlighting also different interpretations of shared principles and normative gaps that need to be filled”, and (ii) “the nature and structure of the met-rics...to accurately measure progress toward fi-nancial, economic, social and environmental sus tainability via dy namic interlinkages between the individual com pany (micro), industry (meso), and systems (macro) levels”.81
While recognizing the debate and concerns re-garding monetization, the measurement of per-for mance partly centres on “New Account ing”, which involves cost and benefit accounting in economic and monetary terms as a means of tracking impacts associated with multiple capitals and externalities (van der Lugt 2018). New Accounting is explicitly linked to the SDGs:
The SDGs can be seen as an intermediate point of reference between the micro and macro levels of target-setting and perfor-mance measurement. A new ac counting system built on revised princi ples and stan-dards can turn this interface into a window of opportunity and lever for scaling up what decision-makers in both the private and public sphere agree are important areas of value creation in the medium and longer term (Reporting 3.0 2016:1).
Key elements of New Accounting include (van der Lugt 2018:5-6):• annual multilayered income
statements (profit and loss accounts);• expanded balance sheets, namely
the Comprehensive Statement of Financial Position, which refers to other capitals;
• the Statement of Long-term Risks and Estimated Value of Assets and Liabilities, which indicates what the balance sheet and risk position may look like in the future; and
• an explanatory narrative text.
The r3.0 approach emphasizes not only the appreciation and depreciation of different cap-itals but also the GRI sustainability context principle of “placing performance information in the broader biophysical, social, and economic context” (GRI 2002:28). As noted by r3.0, “for companies to contribute to the fulfillment of the SDGs, they will need to translate [the trajectories identified in Agenda 2030]...into business-relevant thresholds and set fair, just and proportionate allocations for their respon-sibilities” (Reporting 3.0 2018:2).
Like the MultiCapital Scorecard, r3.0 aims to assess progress in relation to different stages of sustainability performance and business rationales, from “Business-as-usual” (associated with profit maximization), through “Improving” (associated with compliance), to “Sustaining” (repair), on to “Net Positive” (regenerative) and finally, to “Gross Positive” (thriving).
Ethical leadership and internal psychological fac tors are also emphasized by r3.0: “the inter-nal psychological integration needed at the in di vidual and collective level to instigate the transformations necessary to scale up a green and inclusive, regenerative economy” (Thurm 2016). Following the fourth generation of the King Code on Corporate Governance in South Africa, ethical leadership “is exemplified by integ-rity, competence, responsibility, accounta bility, fair ness and transparency” (Thurm et al. 2018:46).
Under the r3.0 approach, the materiality ques-tion involves new interpretations of mate riality, related to thresholds and appropriate timeframes in decision making (Reporting 3.0 2016). And it moves beyond the realm of the micro-level firm to meso-level industries and macro-level economic, social and environmental systems (Baue 2019). Defining what is material requires companies to identify three elements (Thurm and Baue 2018:26):• Rightsholders82 to whom companies
owe legal duties and ethical obliga tions due to direct impacts on their well-being or indirect impacts on vital capital resources that these rightsholders rely on for their well-being.
• Impacts, both negative and positive, on the stocks and flows of vital capital resources that rightsholders rely on for their well-being.
79 See r3-0.org. At the time of writing, forthcoming Blueprints relate to (i) sustainable finance, (ii) the value cycle, and (iii) governments, multilaterals and foundations.
80 See https://www.r3-0.org/
81 See Blueprint 3: Data at https://www.r3-0.org/ wp-content/uploads/ 2019/07/R3-BP3.pdf
82 Under this approach the term “rightsholders” (as opposed to “stakeholders”—those who affect or are affected by a company’s behaviour), is used, as it “more clearly aligns to companies’ accountability for direct and indirect impacts on social, economic, and ecological resources” (Thurm and Baue 2018).
66
UNRISD
• Thresholds that differentiate sustain able levels of these vital capital resources from unsustainable levels — also known as the carrying capacities of capitals; as well as allocations of companies’ fair, just and proportionate shares of these resources.
The r3.0 Platform was instrumental in the for ma tion of the multistakeholder Global Thresholds & Allocations Council (GTAC) tasked with “assessing and validating method-ologies for allocating fair shares of responsibility to organizations for their impacts on the stocks and flows of capitals—natural, human, social and other resources—within their carrying capacities”.83
Learning from different enterprise models and varieties of capitalism
A second avenue of inquiry for determining what is key from the perspective of trans-formative change is to identify business models, enterprise cultures, patterns of in-vestment and varieties of capitalism that are inherently more conducive to inclusive and sustainable development. Particularly relevant are: (i) for-profit companies that are embedded in local economies via so-called linkages; (ii) for-profits that can reduce pressures associated with shareholder primacy by remaining in private hands (for example, family owned) or where non-profits (such as foundations) have a significant stake;84 and (iii) non-profit, “less-for-profit” or “for purpose”85 enterprises that follow a qualitatively different normative hierarchy in relation to triple bottom line objectives, as in the case of the social and solidarity economy (SSE), which is also the focus of the UNRISD programme under which this report has been prepared. Also considered in this section are particular varieties of capitalism associated with governance arrangements and normative perspectives more conducive to fair ness, equality and social protection.
LinkagesAs development economists and organizations like UNCTAD have long argued, an important variable that differentiates a corporation’s im-
pact vis-à-vis local social and economic de-vel opment is the scale, depth and quality of backward and forward linkages with host coun-try communities, enterprises, producers and distributors, as well as governments, society and the economy more generally via, for example, taxation and “spillovers” such as know-how and technology.
In contrast to most extractive or export-processing industries, so-called fast-moving con-su mer goods corporations, for example, are better positioned structurally to develop such linkages (Clay 2005). Furthermore, as implied in several of the company examples noted in Chapter 1, their strategic proximity to “green” or “ethical” consumers can act as an important driver of ESG performance.
As observed in a comprehensive study by Oxfam and Unilever Indonesia of the company’s local impacts, realizing the positive potential of link-ages requires not only the design and application of conventional social and environmental stan-dards, but also measures and conditions that facilitate stronger negotiating power regarding products and services through cooperative organ ization and marketing associations; other social institutions such as insurance, credit and saving schemes; and diversification of income streams to reduce dependency (Clay 2005:86). Other linkages relate to taxation and profit flows, where it is important to capture differences in relation to tax avoidance/evasion versus fiscal responsibility, as well as profit repatriation versus local reinvestment. More recently, attention has centred on the implications for decent work of firms and sectors that are rapidly automating versus those involved in more labour-intensive forms of service provisioning (Borzaga et al. 2017).
Private, multistakeholder and multipurpose companiesAnother category of for-profits that may have a freer rein to push the CR envelope are those that are privately owned or where a non-profit foun dation or cooperative owns a significant share. Several companies referred to above in relation to “best practices” fall into this category, including the confectionary firm Mars, and the pharmaceutical company Novo Nordisk.
83 See https://reporting3.org/gtac/
84 While not addressed in this report, state-owned enterprises would constitute another category of for-profits that may prioritize social objectives.
85 See McCulloch and Ridley 2019.
67
CORPORATE SUSTAINABILITY ACCOUNTING: WHAT CAN AND SHOULD CORPORATIONS BE DOING?
Some others are “Benefit Corporations” (B Corps), which are legally constituted as companies that must balance profit and social and/or environmental purpose. Examples are Patagonia and Natura, referred to earlier, and Divine Chocolate, which is 45 percent owned by the Ghanaian women farmers cooperative, Kuapa Kokoo, which supplies the cocoa. The NGO Christian Aid and the ethical finance institu tion, Oikocredit, also have a stake.86
In a context where conventional “C” corpora-tions can claim B Corp status relatively easily, third party verification and certification have become important to gauge compliance with social and environmental norms. For instance, the B Impact Assessment tool—which is part of the B Corp Certification process administered by the non-profit B Lab—assesses performance in relation to 18 impact areas and scores companies, setting a lower limit score to indicate a minimum standard.87 Sustainability accounting related to B Corps and the broader universe of social and solidarity economy, mentioned briefly below, are the focus of a paper by Salathé-Beaulieu et al. (2019) published for the same UNRISD project as the present report.
Cooperatives and other social and solidarity economy enterprises and organizationsA variety of enterprise models and financing mechanisms have gone much further in crafting structural conditions conducive to inclusive and sustainable development. Organizations and en-ter prises that make up the SSE lean towards prin-ciples and practices associated with the fair dis-tribution of income, democratization of capital ownership, the internalization of social and envi-ronmental costs, and workplace democracy.
Examining the case of employee-owned enter-prises, Hoffmann and Shipper (2018:16) note that “beyond sharing ownership, most of these firms possess a strong corporate culture based on a strong set of core values”. Key values identified include both core foundational values—honesty, autonomy, empowerment and egalitarianism—and four organizational values: accountability, transparency, community and sustainability. They further note that the case study firms also appear to have developed management practices and policies that reinforce these values. The authors conclude by stating:
The implication of this study for practice is that firms desiring top performance need to find ways to empower or energize their employees. A set of values such as those discussed here may provide that basis. It is also clear that firms must constantly work to find ways to make the values part of the way the firm does business. Here again empowered employees can help in this regard (Hoffmann and Shipper 2018:18).
Much of this alternative economy comprises not- for-profit entities (such as self-help groups, community enterprises, NGOs) or less-for-profits (such as social enterprises) or profit mutualization organizations (cooperatives, mutual associations). It also includes alternative arrangements for pro-viding finance, including many collaborative cre dit systems and complementary currency schemes such as WIR in Switzerland, Banco Palmas in Brazil, or Bangla-Pesa in Kenya. These aim to democratize access to affordable, interest-free credit in ways that contrast dramatically with the interest-bearing loans associated with con-ventional financial institutions and micro-credit. Furthermore, they can enhance resilience in economic downturns (Bendell et al. 2015).
Such entities and schemes have a much freer rein in pushing the transformative envelope, given that they are less constrained by imperatives associated with shareholder primacy, short-termism, profit maximization and the externalization of social and environmental costs (Millstone 2012).
Varieties of capitalismBeyond legal determinants and related incentives, as well as ownership patterns at the micro level of the firm, is the question of how different vari eties of capitalism (VoC) structure corporate strategy and culture. The literature on this topic reveals how so-called “liberal” or “Anglo Saxon” market economies (for example, US and UK), or “coordinated” (such as in northern Europe) and “hierarchical” ones (as in Latin America), shape labour-capital relations and unionization, with implications for labour protection, workplace democracy and workers’ empowerment (Hall and Soskice 2001; Schneider 2009). VoC also have implications for corporate culture and questions of income inequality and hierarchy. As the then-CEO of Novo Nordisk noted in 2014:88
86 See Inside Divine, www.divinechocolate.com
87 See www.bcorporation.net
88 See interview with Lars Sørensen in Ignatius and McGinn 2015.
68
UNRISD
I saw that in last year’s list of best-perfor-ming CEOs, I was one of the lowest paid. My pay is a reflection of our company’s desire to have internal cohesion. When we make decisions, the employees should be part of the journey and should know they’re not just filling my pockets. And even though I’m one of the lowest-paid people in your whole cohort, I still earn more in a year than a blue-collar worker makes in his lifetime...I have a Scandina-vian leadership style, which is consensus-oriented. That principle is enshrined in our management procedures. I’m obliged to reach consensus with my colleagues on all decisions, and if we can’t, any objection needs to be reported to the board.
A strand of management theory identifies equal-ity and “the common good” as key values that inform Scandinavian management. Extreme pay differentials are seen as unfair. According to Shuter (2014): “The aim of Scandinavian management is to nurture a climate of company loyalty, group spirit, and open dialogue where individuals are not primarily motivated by the expectation of reward or punishment but rather the belief that what they are doing is in the best interests of their colleagues and the company”.
Learning from social science theory and multidisciplinarity
While it is increasingly recognized that science-based thinking and evidence must inform cor-porate sustainability disclosure and reporting, this tends to apply more to the environmental than the social dimension and involve primarily the natural sciences, notably climate science. As noted in the following examples, social science theory and knowledge drawn from multiple sub-disciplines and schools of thought can play an important role in identifying issue areas and indicators that are key from the perspective of transformative change and corporate sustain-ability performance.
Here we provide just a few examples drawn from the sub-disciplines and selected works presented in Annex 6. Our examples relate to ecological economics, the capabilities approach, heterodox
“redistributive” economics, political philosophy/sociology, systems dynamics, institutional eco-nomics and feminist theory.89 The selection of sub-disciplinary perspectives found in Annex 6 is certainly not meant to be exhaustive; the purpose is rather to illustrate how theoretical and disciplinary windows are useful for pinpointing key underlying causes of unsustainable develop-ment, and possible solutions. And from there it is possible to draw out implications for corporate sustainability performance disclosure in terms of key issue areas and indicators. Furthermore, this type of analysis suggests that the portfolio of key performance issues is not overwhelmingly broad; rather, a fairly concise set of issue areas emerges. Of concern is the fact that it is precisely these issues that often fly under the radar within corporate sustainability disclosure.
Strands of ecological economics found, for exam ple, in the work of Herman Daly (2013) and Tim Jackson (2009) emphasize the relationship between economic growth and the quality of the ecosystem, as well as the issue of distributive justice. Such analysis informs us that the solution to global warming and environmental decline requires deep changes in patterns of investment, production, consumption and economic growth. For sustainability performance accounting, this calls attention to the need for a fundamental shift towards a circular economy and “absolute decoupling” of environmental impacts from growth. In other words, carbon emissions and other environmental “bads” need to decline in absolute terms. The goal should not simply be improvements in resource intensity in contexts of ongoing accumulation and growth, which has been the focus of corporate sustainability disclosure.90 Such perspectives also point to the need to factor thresholds into sustainability strategies (Raworth 2017); and to measure impacts associated with the global value chain, including Scope 3 emissions or whether corporations are supporting their suppliers through fair trade. They also suggest the importance of enterprise models and more labour-intensive service activities associated with well-being and green transitions.
The capabilities approach, associated in partic-ular with Amartya Sen (1999) and Martha Nussbaum (2003), highlights the multi dimen-
89 It should be noted, however, that the “findings” that are yielded by these different perspectives may not always be complementary or synergistic. Tensions may exist. Piketty (associated with heterodox redistributive economics), for example, assumes that economic growth is essential to avoid rising inequality; Jackson and Victor (2014) (associated with ecological economics) insist that it is not.
90 See, for example, Jackson 2009.

69
CORPORATE SUSTAINABILITY ACCOUNTING: WHAT CAN AND SHOULD CORPORATIONS BE DOING?
sional nature of poverty and well-being, and the role of people’s opportunities to do and to be what they have reason to value. It also draws attention to a range of structural and political conditions that are often bypassed within the field of CR disclosure. From the perspective of corporate sustainability accounting, it calls attention to performance across multiple issue areas related to well-being and, by implication, integrated reporting. More specifically, it sug-gests the importance of tackling horizontal in equalities in the workplace; payment of a living wage; effective participation in decision making; and incentives, training and so forth to foster a culture of ethics and ESG performance.
Heterodox or “redistributive” economics high-lights the crucial role that inequality plays in unsustainable development, and the acceleration of inequalities related to (i) income and wealth disparities within society in general and cor-porations in particular, and (ii) the functional distribution of income, that is, the ratio of profits to wages. Within corporate sus tainability accounting this calls attention to: CEO-worker pay differentials; the profit/wage ratio; labour productivity versus real wage trends; the balance between profit and revenues retained in the host country and outflows abroad; extent of reliance on tax havens; distribution of value within the value chain among different actors and sectors; concentration or market share; long-term versus short-term planning horizons and incentives; workplace democracy; and trade union organ-ization.
Political philosophy and political sociology highlight, inter alia, the role of power relations in shaping patterns of distribution and ine-quality. At a time when the term “capital” has become synonymous with multiple asset classes (natural, human, social, financial, and so on), it is useful to revisit branches of classical political philosophy, in particular, the Marxist concept of capital. This reveals that the economic process associated with the capitalist firm nec-essarily generates social, environmental, de-mocratic and competitive contradictions or “externalities”, which derive from forms of accumulation, concentration and domination that are part and parcel of the DNA of the profit-maximizing firm (Harvey 2014). While
corporate sustainability disclosure has focused on harm reduction associated with certain externalities, it has paid scant attention to the implications and impacts of concentration and monopoly power, as well as corporate hierarchy. Some contemporary strands of political philos-ophy and political sociology suggest the need for effective participation and deliberation in standard setting and corporate sustainability (Habermas 1996; Beck 2005). In relation to the field of corporate sustainability assessment, these perspectives call attention to such issues as: collective bargaining; worker and gender representation on company boards and remu-neration committees; facilitation of and engage-ment with associations that can enhance the bargaining power of farmers and other sup-pliers; and diversity and representativeness of stakeholders involved in dialogues, partnerships and decision making.
Institutional economics, à la Elinor Ostrom and systems dynamics à la Jay Forrester (2009) and Donella Meadows (1998) provide additional insights. Concepts such as polycentricity and nested institutions point to the importance of a variety of institutions, interacting and operating at multiple scales, for understanding the trajectory and scope for change. Concepts such as feedback loops, complexity, unintended consequences and tipping points reveal not only the limits to growth91 (Meadows et al. 1972) but also the limits of linear thinking which characterizes much of corporate sustainability disclosure. How corporations influence pu blic policy, the importance of value chain analy-sis, and the need to factor thresholds into sustainability accounting are just some of the implications of this perspective. Furthermore, the concept of “path dependence” suggests that historically ingrained structural and cultural elements act as powerful headwinds against pro-gressive change and need focused attention.
Strands of economic anthropology associated, for example, with Karl Polanyi, also highlight the role of institutions, such as redistribution, reciprocity and regulation, in shaping “market society” and social protection. Relevant sustain-ability issues and indicators include: structural weakening of the labour relation through
91 Analysis associated with systems dynamics formed the basis of the inquiry called for by the Club of Rome, which culminated in the landmark report, The Limits to Growth, published in 1972 (Meadows et al. 1972).
70
UNRISD
contracting out employment; scale and type of interaction with enabling financial circuits, alternative ownership/legal structures; lobbying practices; and policy coherence in terms of company ESG objectives being aligned with national and international development goals. Similarly, learning from other business and investment models associated with SSE, B Corps and impact investing provides additional pointers as to what really matters.
Feminist theory has played a key role in addressing blind spots within both academic analysis and policy making related to gender inequality. Feminist economics and feminist phi losophy not only highlight the role of women in social reproduction and unpaid care work, but how this role is a key enabling condition for the market economy and underpins women’s subordination.92 Cultural traits and power rela tions associated with patriarchy foster discrim ination in pay and promotion, and abusive practices in the workplace. Demands and time use associated with care, in turn, reinforce women’s subordination in the workplace, as evidenced in their positioning in lower paid, lower quality jobs and under-representation in management positions. From the perspective of corporate sustainability disclosure, this analysis points to the need to pay far more attention to unpaid care responsibilities as an impediment to decent work, and to indicators that capture the structural conditions that underpin women’s disadvantage in the workplace and career struc tures, notably segmented labour roles and the gender pay gap. It also points to the key role of women’s collective action through collective bar gaining and other mechanisms as a means to women’s economic and political empowerment.
Transdisciplinarity
Several of these academic perspectives point to the need for effective participation in standard setting and the process of determining what is material. But such participation is often associated with a fairly limited range of stake-holders. Current forms of stakeholder dialogue may involve CR “experts” and others cut from a fairly similar cloth.
The cumbersome term “transdisciplinarity” is a concept used to describe a process of knowledge design and production geared towards complex problem solving which is informed by drawing on and integrating both different disciplinary perspectives and those of multiple societal actors.93 Lang et al. (2012) define transdisciplinarity as a reflexive principle “…aiming at the solution or transition of societal problems…by differentiating and integrating knowledge from various scien tific and societal bodies of knowledge” (cited in Mauser et al. 2013). The multiple actors can include businesses, practitioners, policy makers, regulators, NGOs, trade unions, experts and academics. And as Jed Emerson reminds us when warning about top-down approaches driven by “experts” and “changemakers”: “Maybe we need to create greater space to hear from those whose lives we seek to impact” (2018:4). This, in turn, implies greater space not only for NGOs and trade unions, but also social movement and community organizers and activists. Accordingly, the r3.0 approach reviewed above emphasizes the role of multiple “rightsholders” within materiality determination.
Factoring in other stakeholders means not only that a broader range of impacts, concerns and preferences can inform decision making, but also different worldviews. In the discourse and practice of sustainability, it is possible to identify disparate pathways that are informed by very different worldviews.94
In their content analysis of 108 GRI reports and 122 non-GRI reports, Landrum and Ohsowski (2017) note that the uptake of corporate sustainability is driven by the business benefits that accrue to the company—in other words, it represents an idea of sustainability that is anchored in “weak sustainability”. Pelenc et al. (2015) explain that a weak sustainability world-view assumes that natural and manufactured or other capitals can be substituted for each other, and that the principle of intergenerational equity requires maintaining or increasing the total value of the aggregate stock of capitals for future generations. Furthermore, this position places great store in technical solutions and monetary compensation for dealing with environmental problems.
92 See, for example, Fraser 2012, Molyneux and Razavi 2002, Razavi 2007, and UNRISD 2005.
93 For more on the relationship between multidisciplinarity, transdisciplinarity and complexity, see Clarke and Crane (2018); Hackmann and St. Clair (2012); ISSC/UNESCO (2013); Mauser et al. (2013) and Tulder et al. (2014).
94 See, for example, Clapp and Dauvergne 2005, Utting 2013.
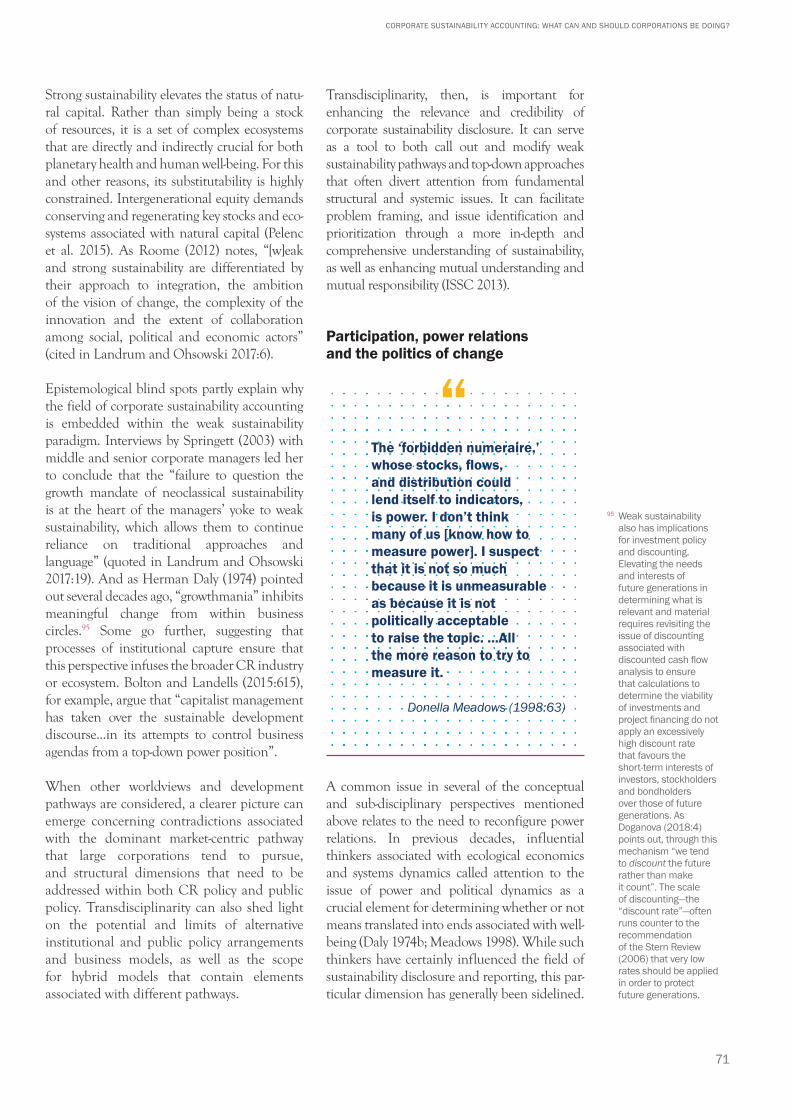
71
CORPORATE SUSTAINABILITY ACCOUNTING: WHAT CAN AND SHOULD CORPORATIONS BE DOING?
Strong sustainability elevates the status of natu-ral capital. Rather than simply being a stock of resources, it is a set of complex ecosystems that are directly and indirectly crucial for both planetary health and human well-being. For this and other reasons, its substitutability is highly constrained. Intergenerational equity demands conserving and regenerating key stocks and eco-systems associated with natural capital (Pelenc et al. 2015). As Roome (2012) notes, “[w]eak and strong sustainability are differentiated by their approach to integration, the ambition of the vision of change, the complexity of the innovation and the extent of collaboration among social, political and economic actors” (cited in Landrum and Ohsowski 2017:6).
Epistemological blind spots partly explain why the field of corporate sustainability accounting is embedded within the weak sustainability paradigm. Interviews by Springett (2003) with middle and senior corporate managers led her to conclude that the “failure to question the growth mandate of neoclassical sustainability is at the heart of the managers’ yoke to weak sustainability, which allows them to continue reliance on traditional approaches and language” (quoted in Landrum and Ohsowski 2017:19). And as Herman Daly (1974) pointed out several decades ago, “growthmania” inhibits meaningful change from within business circles.95 Some go further, suggesting that processes of institutional capture ensure that this perspective infuses the broader CR industry or ecosystem. Bolton and Landells (2015:615), for example, argue that “capitalist management has taken over the sustainable development discourse...in its attempts to control business agendas from a top-down power position”.
When other worldviews and development pathways are considered, a clearer picture can emerge concerning contradictions associated with the dominant market-centric pathway that large corporations tend to pursue, and structural dimensions that need to be addressed within both CR policy and public policy. Transdisciplinarity can also shed light on the potential and limits of alternative institutional and public policy arrangements and business models, as well as the scope for hybrid models that contain elements associated with different pathways.
Transdisciplinarity, then, is important for enhancing the relevance and credibility of corporate sustainability disclosure. It can serve as a tool to both call out and modify weak sustainability pathways and top-down approaches that often divert attention from fundamental structural and systemic issues. It can facilitate problem framing, and issue identification and prioritization through a more in-depth and comprehensive understanding of sustainability, as well as enhancing mutual understanding and mutual responsibility (ISSC 2013).
Participation, power relations and the politics of change
The ‘forbidden numeraire,’ whose stocks, flows, and distribution could lend itself to indicators, is power. I don’t think many of us [know how to measure power]. I suspect that it is not so much because it is unmeasurable as because it is not politically acceptable to raise the topic. ...All the more reason to try to measure it.
Donella Meadows (1998:63)
A common issue in several of the conceptual and sub-disciplinary perspectives mentioned above relates to the need to reconfigure power relations. In previous decades, influential thinkers associated with ecological economics and systems dynamics called attention to the issue of power and political dynamics as a crucial element for determining whether or not means translated into ends associated with well-being (Daly 1974b; Meadows 1998). While such thinkers have certainly influenced the field of sustainability disclosure and reporting, this par-ticular dimension has generally been sidelined.
95 Weak sustainability also has implications for investment policy and discounting. Elevating the needs and interests of future generations in determining what is relevant and material requires revisiting the issue of discounting associated with discounted cash flow analysis to ensure that calculations to determine the viability of investments and project financing do not apply an excessively high discount rate that favours the short-term interests of investors, stockholders and bondholders over those of future generations. As Doganova (2018:4) points out, through this mechanism “we tend to discount the future rather than make it count”. The scale of discounting—the “discount rate”—often runs counter to the recommendation of the Stern Review (2006) that very low rates should be applied in order to protect future generations.
“
72
UNRISD
Often “the political” is reduced to aspects of governance associated with “participation”, understood mainly as stakeholder consultation for determining materiality.
This narrow approach, however, raises several concerns. First, it dilutes the meaning of participation. “Dialogue”, when understood as consultation, is not the political concept that emerged in the 1970s within certain quarters of the UN system and academia, when participation referred to “organized efforts of the hitherto excluded to increase their control over resources and regulative institutions” (UNRISD 2003:69). This definition implied the need to transform power relations, as suggested in the previous discussion about transformative change for sustainable development.
Second, when applying the concept of partici-pation or stakeholder dialogue within the field of sustainability disclosure and reporting, particularly in relation to determining materi-ality, it is often a fairly limited range of stake-holders who are consulted. In the process key stakeholders, not least those who are critical of mainstream approaches and with quite different worldviews, may be excluded. The formal definition of “stakeholder” (anyone affected by or who affects the operations of an organization—Freeman 1984) is encompassing
enough to include disadvantaged or subaltern groups and communities whose livelihoods and environments are impacted by a company. In practice, however, the identification of stake-holders to be consulted often passes through a management filter that restricts the range of actors and interests involved and whose views influence decision making. An ambitious and socially oriented sustainability agenda must ensure that such voices are present and influential in the stakeholder dialogue process. For this reason, r3.0 distinguishes between “stakeholders” and “rightsholders”, a term that “more clearly aligns to companies’ accountability for direct and indirect impacts on social, economic, and ecological resources” (Thurm and Baue 2018). The term rightsholders can also remind us of the principle of intergenerational equity and the needs of future generations—which, while central to the concept of sustainable development, often get lost in discussions on materiality.
Third, once a range of opinions are heard, it is generally management or “experts” who filter these opinions and decide which are useful and actionable. This approach sidelines other political features of participation related to the role of negotiation and bargaining in decision making. These aspects of governance can ensure that stakeholders who are seated at the table not only have “voice” (which may or may not be heard), but also that they are “players” who can effectively shape outcomes.
Fourth, a political interpretation of participation suggests certain issue areas and indicators that should be considered essential to corporate sustainability accounting. These include labour rights (see Chapter 8) such as collective bargain-ing and freedom of association, which are crucial in efforts to secure decent wages and working conditions, and are a core element of the ILO’s definition of decent work. More generally, the concept of political empowerment is given short shrift within mainstream sustainability disclosure as well as in recent innovations. As noted in the earlier discussion related to value chains, empowerment extends well beyond labour in the workplace to producers, suppliers and commu nities. “Organized efforts”, or collective action, are crucial to getting a fairer share of the pie.
73
CORPORATE SUSTAINABILITY ACCOUNTING: WHAT CAN AND SHOULD CORPORATIONS BE DOING?
Fifth, whereas the combination of collaboration and confrontation has been central to ratcheting up standards associated with disclosure and reporting, a cosmetic version of participation downplays the role of contestation and advocacy associated with “strong sustainability” or alter-native worldviews (Utting 2012).
Sixth, given that empowerment is essential to social justice and transformative change, the question arises as to whether it should be considered a key asset (or capital), on a par with natural, social, financial and other physical and relational capitals identified within the integrated reporting approach discussed above. Not only is its appreciation—as in the empowerment of disadvantaged or subaltern groups—key for inclusive development and transformative change, its depreciation (as evidenced in dis em powerment) lies at the heart of trends associated with exclusionary and unsustainable development. This would not be an issue if our understanding of “the social” dimension of capital or sustainable development included such aspects as social organization and collective action. In practice, however, “the social” tends to be reduced to aspects of social protection (such as minimum or living wages, the social wage, occupational health and safety, gender diversity in the workplace).
Seventh, factoring in the issue of power relations involves not only a consideration of how to empower the disadvantaged, but also how to control and restrict the concentration of elite power and corporate political influence (see Chapter 9). Clearly public regulation and policy (fiscal, competition, anti-trust, labour market and so on) have a crucial role in this regard. But the CR industry can also play a role in establishing principles and standards related to such aspects as lobbying, political campaign contributions, the revolving door, corruption and conflict of interest. It can also demand that companies disclose data that reveal the concentration of power, whether it relates to market share, the distribution of value added within global value chains, or labour-management relations.
74
UNRISD
Part 1 of this report has sought to set the scene for the multi-year research-action pro-ject on Sustainable Development Impact Indi cators being carried out by UNRISD. It has (i) taken stock of progress in the field of sus tainability disclosure and reporting, (ii) iden tified ongoing challenges and debates, as well as recent developments and innovation, and (iii) suggested a number of avenues of inquiry for rethinking disclosure along a more transformative pathway.
The analysis suggests that the evolution and institutionalization of corporate sus-tainability disclosure and reporting have managed to significantly expand both the universe of firms engaged and the range of issues addressed. Through time there has been a shift from a highly selective risk and reputation management approach to more comprehensive ESG disclosure and reporting. To date, the trajectory of progress related to disclosure and reporting has been characterized by frequent incremental adjustments to incorporate new issue areas and indicators, adhere to core accounting principles, and strengthen management systems, including reporting and assurance. From the perspective of sustainable and inclusive development, however, this approach remains seriously constrained. Recent innovations, described in Chapter 2 and Annex 4, clearly indicate a growing sense of urgency regarding the need to tackle ongoing accounting issues related to complexity, reliability, credibility, relevance and materiality. This urgency is connected in no small measure to heightened awareness both of climate change and of the SDGs.
The complexity challenge has focused attention on the need to simplify disclosure. Reliability implies the need to minimize problems of selection bias and self-promotion, as well as to focus on concrete implementation measures and actual performance rather than simply allowing statements of corporate policy, on say gender equality, to serve as a proxy for improved performance. Relevance and materiality require refocusing on issues that are key for realizing the transformational vision of the 2030 Agenda, rethinking what is prioritized in terms of issues and indicators, and ensuring that this information effectively assists governments and other stakeholders in their efforts to reform public policy and corporate behaviour.
Part 1 also casts doubt on whether various mainstream initiatives to address these challenges are really up to the task. The discussion in Chapter 3, of recent cutting-edge innovations, identified several important developments, not least accounting frameworks and methods aimed at capturing impacts related to multiple capitals, internalizing externalities and measuring progress in relation to sustainability norms. This has also led to a more rigorous definition or precise understanding of key terms (see Annex 11). Several of these approaches emphasize the need to tackle what is one of the weakest aspects of disclosure, namely, the tendency to only report one part of the picture while ignoring the context. Hence, for example, data may indicate a decline in carbon emissions but the user of the data is left not knowing what a tolerable amount of GHG emissions might be from the perspective of science-based targets. Similarly, data may show an increase in basic wages but fail to relate this to trends associated with profits, labour productivity, real wages, and the remuneration of senior management or the CEO.
Concluding Remarks
75
CORPORATE SUSTAINABILITY ACCOUNTING: WHAT CAN AND SHOULD CORPORATIONS BE DOING?
The above analysis points to the following unresolved issues and avenues for rethinking cor porate sustainability assessment and dis-closure.
Setting ambitious goals not only in the environmental but also the social domain
Within the field of corporate sustainability accounting, considerable thinking and strategizing have gone into addressing the environmental crisis manifested in global warm ing, pollution, waste and resource depletion. The same cannot be said of the social malaise associated with the world of work and gross inequalities of income and wealth. Much more thinking needs to go into how business can transition along a continuum from reducing the level of harm associated with business-as-usual at one end to transformative strategies aimed at both planetary health and meaningful social development at the other. The level of ambition that is emerging in relation to environmental standard- and target-setting needs to be replicated in relation to social dimensions.
Expanding the definition of “the social” beyond selected stakeholders and social protection
While the social dimension of sustainable development is by definition a core element of ESG disclosure, its meaning is often diluted. It tends to relate to selected social actors or stakeholders and to social protection or social security—that is, the basic living conditions of workers, producers and communities. Usually missing is a more expansive sociological or political economy definition of “the social”—one that not only recognizes a broader range of social actors but also emphasizes social relations, social institutions, social organization, and empowerment through social mobilization and collective action. From this perspective, the notion of social development also embraces concerns for effective participation and democratic gov-ernance.
Incorporating the preferences of “rightsholders” and future generations in the determination of materiality
While the question of materiality is central to innovations and debates in the field of sustainability disclosure, it is often the preferences of management, shareholders and mainstream CR industry players that hold sway in the determination of what information is key. While the principle of multistakeholder dialogue is generally accepted within this field, social dialogue often lacks diversity in terms of stakeholder representation and worldviews. If corporate sustainability disclosure is to be effective as a tool for transformative change, the above analysis suggests that other concerns and preferences need to be factored in, not least those of multiple “rightsholders” impacted by business activities and perspectives that reflect upon the challenges to be faced by future generations. It is likely that opening up the process to such preferences and perspectives would shed light on the root causes of complex sustainability problems, and illuminate solutions and specific issues and indicators to assess progress.
Addressing the blind spots of distributive justice, inequality and power
The discussion of the transformative approach in Chapter 3 highlights key structural and systemic issues that need to be factored into the CR agenda far more explicitly than has been the case to date. It is imperative to address these blind spots. As norms associated with human, women’s and children’s rights have infused CR discourse, the question of “horizontal inequality” (between groups) is at least on the CR policy table. As examined in Chapter 6, however, key aspects of gender equality are often marginalized, not least those related to caregiving. Aspects of “vertical inequality” reflected, for example, in CEO-worker pay gaps, skewed distribution of income within value chains and regressive taxation, often receive short shrift. Similarly, the question of intergenerational equity receives lip service but little systematic treatment.
76
UNRISD
There is also a need for a more political under-standing of participation and empowerment—one that emphasizes not only stakeholder consul tation and the economic empowerment of workers, producers, small enterprises and communities through market access, financial services and training, but also political empow-erment. Issues and indicators related to labour rights, workplace democracy, collective bargain ing, and the collective organization of producers and small enterprises are often marginalized. A political understanding of change also needs to focus on the ways and means of constraining and redirecting corporate political influence. Transformative change requires not only greater “voice” for weaker groups in society but a reconfiguration of power relations.
Promoting knowledge-driven dialogue and standard setting
Processes for determining what is relevant and material not only need to be inclusive; they also need to be knowledge driven. We suggest that conceptual and multidisciplinary analysis is important for expanding the boundaries of how the social dimension is understood, and in particular for highlighting issues of inequality, power relations and other structural conditions that are key for addressing the root causes of both unsustainable development and sustainable futures.
A recurring theme throughout this report relates to the concern that mainstream practices, innovations and processes aimed at determining what is relevant and material may be missing or marginalizing key issues. Given this situation it is useful to stand back and reflect on what is important from the perspective of ex/inclusionary development and un/sustainable development. For this reason, we ventured into “big picture” theorizing and conceptual analysis, in the belief that reviewing the work of several prominent thinkers in the field of development and societal change, as well as multiple branches of academic disciplines, can tell us a lot about both root causes and solutions. From there we can think about relevant corporate sustainability accounting issues and
indicators. What this analysis suggests is that several key issues—such as vertical inequality, power relations, institutional capture, absolute decoupling, workplace democracy and aspects of gender equality associated with care—are not those that are typically emphasized within the mainstream CR industry. This in turn raises the question of whether mainstream stakeholder dialogue processes to gauge materiality are fit for purpose. This analysis, we believe, points to the importance of drawing on multiple disciplines and different worldviews to determine what is relevant and material.
The vantage point of multidisciplinarity and transdisciplinarity indicates not only critical issues and indicators that need to be factored into corporate sustainability disclosure but also alternative business models of ownership and governance, associated with specific types of enterprise and finance, as well as different varieties of capitalism. Furthermore, such an approach to learning suggests the scale of the sustainability challenge and the level of ambition required when establishing targets against which to measure progress. In the absence of stakeholders who can effectively represent the interests of future generations, it is perhaps this line of inquiry that allows us to approximate what is required if we are serious about the goal of intergenerational equity, which supposedly lies at the core of sustainable development.
The connection between knowledge and targets has been explicitly recognized in recent years, with calls for disclosure and reporting to relate to science-based targets. It appears, however, that the main science being considered is earth or climate science, and the chief targets are environmental. The notion of SBTs needs to extend to the social arena. Several of the disciplinary perspectives outlined in Chapter 3 provide a useful starting point for identifying science-based content and normative targets related to social dimensions of sustainable development, as well as democratic governance.
77
CORPORATE SUSTAINABILITY ACCOUNTING: WHAT CAN AND SHOULD CORPORATIONS BE DOING?
P A R T 2
Indicators and Targets for Transformative Change
Introduction
The above review of the evolution and current state of corporate sustainability disclosure identified various blind spots within reporting standards and conventional metrics related to ESG disclosure. These areas of omission are key because they relate to what might be regarded as the root causes of unsustainable development, that is, structural conditions that to some extent predetermine opportunities and outcomes. Important in this regard are inequalities related to income distribution, gender biases and skewed power relations. These issue areas are crucial components of the social dimensions of sustainable development, yet they are often marginalized in the data and narratives associated with sustainability reporting.
78
UNRISD
While an increasing number of corporations are engaging more proactively with the Sustainable Development Goals (SDGs), those related to gender equality (SDG 5) and reducing inequalities (SDG 10) have received less attention. Dealing with structural blind spots is one part of the challenge of realizing the transformational vision inherent in the 2030 Agenda for Sustainable Development. Another part relates to the so-called sustainability context. This involves establishing norms related to sustainability thresholds which can serve as targets against which to measure progress along a sustainable development pathway.96 Without such a context, it is impossible to know whether the progress reported via conventional metrics is part of an incrementalist agenda that essentially tweaks business-as-usual, or whether it is meaningful from the perspective of sustainable development and its core elements of integrated development, inter-generational equity, regeneration and thriving. Furthermore, such measurement demands far more attention to quantitative performance indicators.
Part 2 of this report delves into the specifics of disclosure for transformative change by identifying key performance issues, indicators and related normative benchmarks and targets pertaining to the social dimensions of sustainable development. It begins, however, by looking at several significant advances now occurring in the field of environmental disclosure and reporting. Such developments provide important lessons regarding how disclosure might shift from cherry picking and incrementalism to a more rigorous process consistent with the notion of transformative change. Social accounting, in contrast, lags well behind and could benefit by replicating the level of ambition currently emerging in relation to environmental disclosure and reporting.
The remainder of Part 2 examines five key performance issues and related indicators that might enhance the quality of social accounting from a transformative perspective. These issue areas, which relate to blind spots or under-reported aspects of economic, gender and political dimensions of inequality, are:
(i) fair remuneration;(ii) gender equality;(iii) corporate taxation;(iv) labour rights; and(v) corporate political influence.
Each chapter is structured as follows. First, we outline in what way conventional disclosure and reporting is problematic, and then suggest various indicators that might be fit for purpose from the perspective of transformative change. Next, we discuss methodological issues regarding how key terms and concepts associated with certain standards and indicators are defined and applied in practice before finally considering possible targets that could be adopted by corporations in order to effectively measure their progress towards sustainable development. Key indicators and targets, as well as ongoing challenges and future work that needs to be done, are summed up in a final section.
96 See Thurm et al. 2018, Thomas and McElroy 2016, MaterialityTracker: http://www.materiality tracker.net/
79
CORPORATE SUSTAINABILITY ACCOUNTING: WHAT CAN AND SHOULD CORPORATIONS BE DOING?
Before delving into the black box of measurement and disclosure associated with social dimensions of sustainability accounting, it is instructive to draw lessons from the environmental field. Much has changed since the term “greenwash” was popularized in the 1990s97 to highlight the tendency of corporations to disclose environmental information and data via reports that often misinformed stakeholders about their real environmental performance and impact. Despite various ongoing concerns, noted in Part 1 of this report, the quality of environmental disclosure shows some signs of improvement. Recent developments suggest a heightened level of rigour and ambition that could usefully be replicated in the social domain. This is apparent in at least four respects.
Learning from the Environmental Dimension
CHAPTER 4
97 See Greer and Bruno 1996.
80
UNRISD
First, efforts are under way to address what, until recently, was a blind spot within environmental reporting—namely, the tendency to focus on metrics associated with resource or emissions intensity rather than absolute reductions in resource use, waste and emissions. As noted in the 2030 Agenda, development actors need to “endeavor to decouple economic growth from environmental degradation” (SDG 8, Target 8.4). While this principle has a long pedigree, attention within sustainability accounting tended to focus on what is known as relative decoupling, that is, reductions in negative environmental externalities (for example, emissions, waste, pollution and natural resource depletion) relative to a company’s growth measured in revenues or production volume. This often means that negative externalities—such as greenhouse gas emissions—continue to increase in absolute terms although indicators related to resource intensity show improvement (see Table 4.1). Climate science and internationally agreed targets to deal with global warming indicate that a focus on absolute reductions in emissions, or absolute decoupling, is essential for planetary health and, by implication, intergenerational justice (Jackson 2009). Unlike reductions in resource intensity, absolute decoupling requires fundamental changes in investment, production and consumption patterns. In other words, it challenges, rather than aims to co-exist with, the dominant growth model.
While some standard-setting frameworks, such as the International Chamber of Commerce’s (ICC) Business Charter for Sustainable Development, emphasize resource intensity, most leading standard setters like the GRI and the World Federation of Exchanges (WFE) generally call on companies to report on both. Often, however, companies present data related to both aspects but emphasize progress associated with relative decoupling in narrative reporting.
Second, the qualitative leap forward is also reflected in the shift away from a focus on performance related only to activities directly controlled by the company in question. Instead attention is now also being paid to performance associated with the company’s global value chain
and its broader sphere of influence. Regarding GHG emissions, corporations are now being called upon to report not only on Scope 1 emissions related to the direct operations of the facilities they own but also on Scope 2—the energy services they rely on—and, more significantly, Scope 3, which refers to emissions associated with their suppliers, distributors and consumers (WRI and WBCSD 2011). This is particularly important as it is Scope 3 that often accounts for the vast bulk of the emissions associated with a particular product or service.98 While the measurement of Scope 3 emissions is extremely challenging, at least it is now being recognized as an issue within sustainability disclosure. Ultimately, it may prove impossible for a company to significantly reduce Scope 3 impacts, particularly given its limited control over suppliers and consumers,99 but the data themselves are important. They allow managers to identify those specific activities in the value chain where remedial action may be possible. Furthermore, stakeholders more generally surely have a right to know (i) the scale of the entire environmental footprint associated with the goods and services a company produces and the consumption patterns it promotes; (ii) where a company is positioned on a sustainability pathway that factors in such a comprehensive footprint; and (iii) the scale of the challenge of transforming patterns of investment, production, trade and consumption associated with its core business. Crucially, reductions in Scope 3 emissions can shed considerable light on trends and prospects related to the absolute decoupling referred to above.
Third, as noted earlier, improvements in performance tended to be incrementalist in nature. Companies adhering to CR principles aimed to reduce levels of harm without any reference to meaningful longer term quantitative targets. In short, conventional environmental reporting failed to contextualize performance in relation to sustainable development targets. In this way corporations could project an image of responsible environmental action without ever having to assess whether that action was meaningful from the perspective of sustainable development. Today, companies are being urged to assess progress in relation to science-based targets. Not only are they encouraged
98 Patagonia, for example, reports that 86 percent of its carbon emissions come from the raw materials it uses and their supply chains (Patagonia 2019). PUMA estimates that Scope 3 emissions accounted for 81.6 percent of their total in 2018 (PUMA 2019:16).
99 See, for example, Patagonia 2019, Unilever 2019a and Financial Times 2019a referring to Repsol.
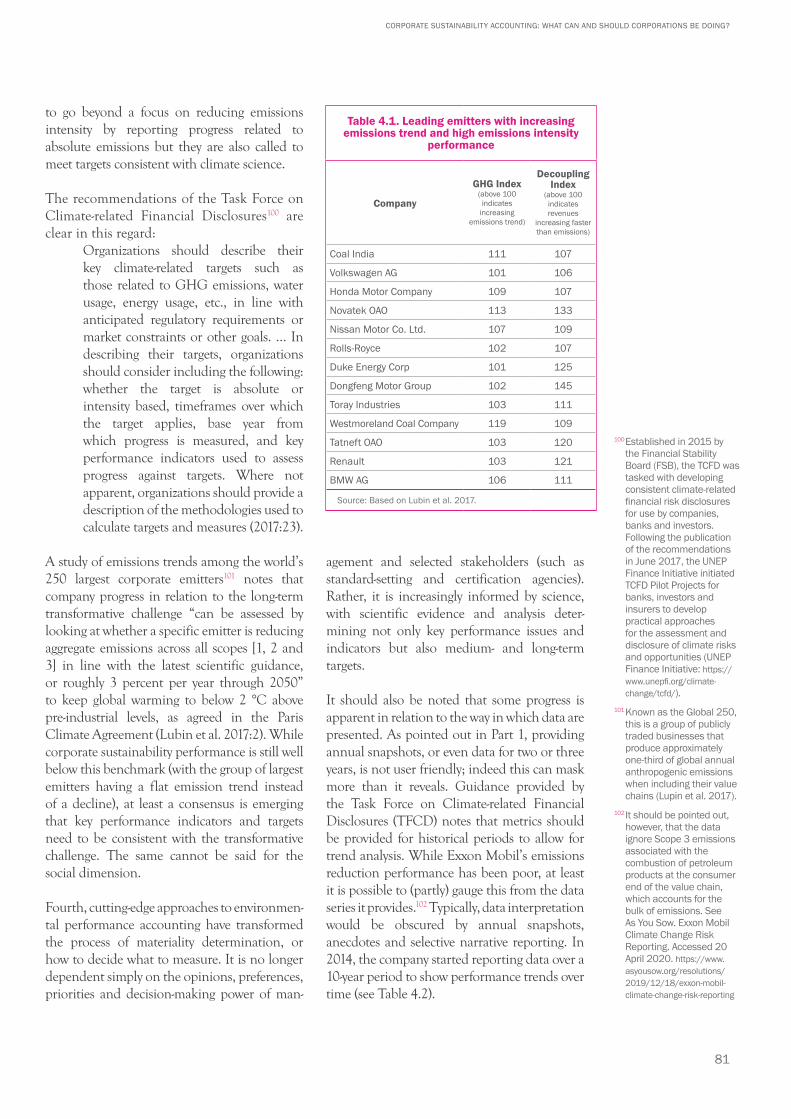
81
CORPORATE SUSTAINABILITY ACCOUNTING: WHAT CAN AND SHOULD CORPORATIONS BE DOING?
to go beyond a focus on reducing emissions intensity by reporting progress related to absolute emissions but they are also called to meet targets consistent with climate science.
The recommendations of the Task Force on Climate-related Financial Disclosures100 are clear in this regard:
Organizations should describe their key climate-related targets such as those related to GHG emissions, water usage, energy usage, etc., in line with anticipated regulatory requirements or market constraints or other goals. … In describing their targets, organizations should consider including the following: whether the target is absolute or intensity based, timeframes over which the target applies, base year from which progress is measured, and key performance indicators used to assess progress against targets. Where not apparent, organizations should provide a description of the methodologies used to calculate targets and measures (2017:23).
A study of emissions trends among the world’s 250 largest corporate emitters101 notes that company progress in relation to the long-term transformative challenge “can be assessed by looking at whether a specific emitter is reducing aggregate emissions across all scopes [1, 2 and 3] in line with the latest scientific guidance, or roughly 3 percent per year through 2050” to keep global warming to below 2 °C above pre-industrial levels, as agreed in the Paris Climate Agreement (Lubin et al. 2017:2). While corporate sustainability performance is still well below this benchmark (with the group of largest emitters having a flat emission trend instead of a decline), at least a consensus is emerging that key performance indicators and targets need to be consistent with the transformative challenge. The same cannot be said for the social dimension.
Fourth, cutting-edge approaches to environ men-tal performance accounting have trans formed the process of materiality determination, or how to decide what to measure. It is no longer dependent simply on the opinions, preferences, priorities and decision-making power of man-
agement and selected stakeholders (such as standard-setting and certification agencies). Rather, it is increasingly informed by sci ence, with scientific evidence and analysis deter-mining not only key performance issues and indicators but also medium- and long-term targets.
It should also be noted that some progress is apparent in relation to the way in which data are presented. As pointed out in Part 1, providing annual snapshots, or even data for two or three years, is not user friendly; indeed this can mask more than it reveals. Guidance provided by the Task Force on Climate-related Financial Disclosures (TFCD) notes that metrics should be provided for historical periods to allow for trend analysis. While Exxon Mobil’s emissions reduction performance has been poor, at least it is possible to (partly) gauge this from the data series it provides.102 Typically, data interpretation would be obscured by annual snapshots, anecdotes and selective narrative reporting. In 2014, the company started reporting data over a 10-year period to show performance trends over time (see Table 4.2).
Table 4.1. Leading emitters with increasing emissions trend and high emissions intensity
performance
Company
GHG Index (above 100 indicates
increasing emissions trend)
Decoupling Index
(above 100 indicates revenues
increasing faster than emissions)
Coal India 111 107
Volkswagen AG 101 106
Honda Motor Company 109 107
Novatek OAO 113 133
Nissan Motor Co. Ltd. 107 109
Rolls-Royce 102 107
Duke Energy Corp 101 125
Dongfeng Motor Group 102 145
Toray Industries 103 111
Westmoreland Coal Company 119 109
Tatneft OAO 103 120
Renault 103 121
BMW AG 106 111
Source: Based on Lubin et al. 2017.
100 Established in 2015 by the Financial Stability Board (FSB), the TCFD was tasked with developing consistent climate-related financial risk disclosures for use by companies, banks and investors. Following the publication of the recommendations in June 2017, the UNEP Finance Initiative initiated TCFD Pilot Projects for banks, investors and insurers to develop practical approaches for the assessment and disclosure of climate risks and opportunities (UNEP Finance Initiative: https://www.unepfi.org/climate-change/tcfd/).
101 Known as the Global 250, this is a group of publicly traded businesses that produce approxi mately one-third of global annual anthropogenic emissions when including their value chains (Lupin et al. 2017).
102 It should be pointed out, however, that the data ignore Scope 3 emissions associated with the combustion of petroleum products at the consumer end of the value chain, which accounts for the bulk of emissions. See As You Sow. Exxon Mobil Climate Change Risk Reporting. Accessed 20 April 2020. https://www.asyousow.org/resolutions/ 2019/12/18/exxon-mobil-climate-change-risk-reporting
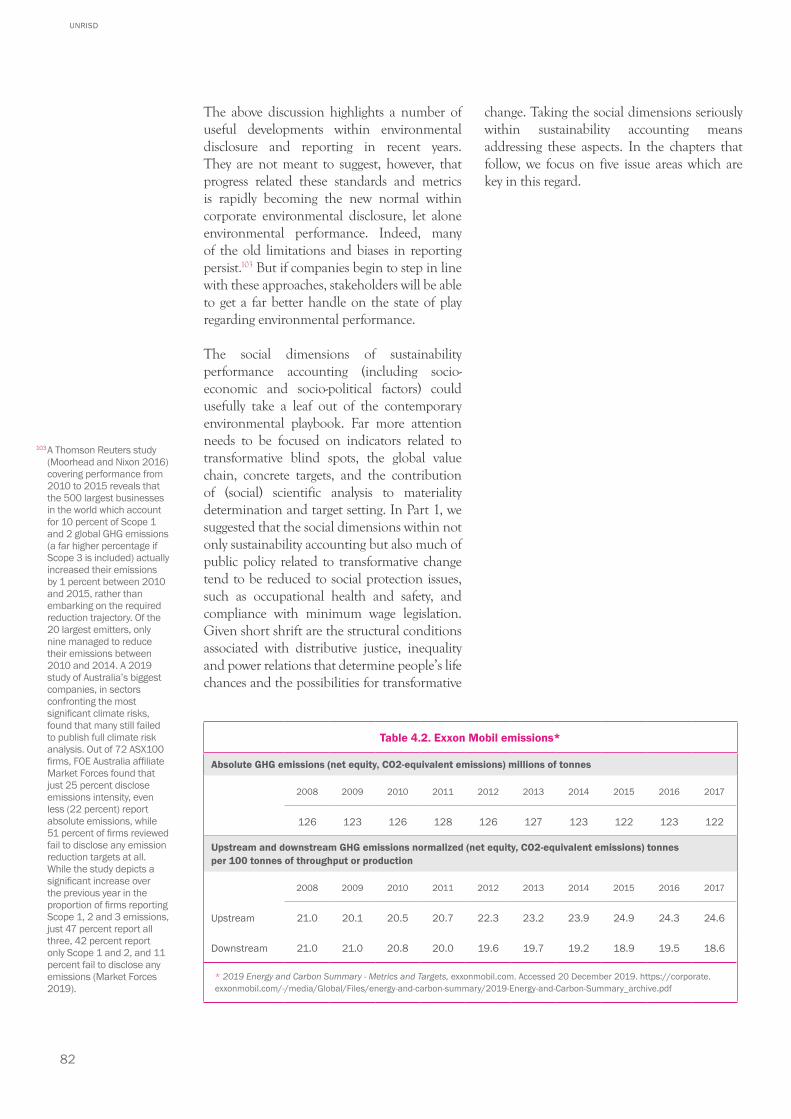
82
UNRISD
The above discussion highlights a number of useful developments within environmental disclosure and reporting in recent years. They are not meant to suggest, however, that progress related these standards and metrics is rapidly becoming the new normal within corporate environmental disclosure, let alone environmental performance. Indeed, many of the old limitations and biases in reporting persist.103 But if companies begin to step in line with these approaches, stakeholders will be able to get a far better handle on the state of play regarding environmental performance.
The social dimensions of sustainability performance accounting (including socio-economic and socio-political factors) could usefully take a leaf out of the contemporary environmental playbook. Far more attention needs to be focused on indicators related to transformative blind spots, the global value chain, concrete targets, and the contribution of (social) scientific analysis to materiality determination and target setting. In Part 1, we suggested that the social dimensions within not only sustainability accounting but also much of public policy related to transformative change tend to be reduced to social protection issues, such as occupational health and safety, and compliance with minimum wage legislation. Given short shrift are the structural conditions associated with distributive justice, inequality and power relations that determine people’s life chances and the possibilities for transformative
change. Taking the social dimensions seriously within sustainability accounting means addressing these aspects. In the chapters that follow, we focus on five issue areas which are key in this regard.
Table 4.2. Exxon Mobil emissions*
Absolute GHG emissions (net equity, CO2-equivalent emissions) millions of tonnes
2008 2009 2010 2011 2012 2013 2014 2015 2016 2017
126 123 126 128 126 127 123 122 123 122
Upstream and downstream GHG emissions normalized (net equity, CO2-equivalent emissions) tonnes per 100 tonnes of throughput or production
2008 2009 2010 2011 2012 2013 2014 2015 2016 2017
Upstream 21.0 20.1 20.5 20.7 22.3 23.2 23.9 24.9 24.3 24.6
Downstream 21.0 21.0 20.8 20.0 19.6 19.7 19.2 18.9 19.5 18.6
* 2019 Energy and Carbon Summary - Metrics and Targets, exxonmobil.com. Accessed 20 December 2019. https://corporate.exxonmobil.com/-/media/Global/Files/energy-and-carbon-summary/2019-Energy-and-Carbon-Summary_archive.pdf
103 A Thomson Reuters study (Moorhead and Nixon 2016) covering performance from 2010 to 2015 reveals that the 500 largest businesses in the world which account for 10 percent of Scope 1 and 2 global GHG emissions (a far higher percentage if Scope 3 is included) actually increased their emissions by 1 percent between 2010 and 2015, rather than embarking on the required reduction trajectory. Of the 20 largest emitters, only nine managed to reduce their emissions between 2010 and 2014. A 2019 study of Australia’s biggest companies, in sectors confronting the most significant climate risks, found that many still failed to publish full climate risk analysis. Out of 72 ASX100 firms, FOE Australia affiliate Market Forces found that just 25 percent disclose emissions intensity, even less (22 percent) report absolute emissions, while 51 percent of firms reviewed fail to disclose any emission reduction targets at all. While the study depicts a significant increase over the previous year in the proportion of firms reporting Scope 1, 2 and 3 emissions, just 47 percent report all three, 42 percent report only Scope 1 and 2, and 11 percent fail to disclose any emissions (Market Forces 2019).
83
CORPORATE SUSTAINABILITY ACCOUNTING: WHAT CAN AND SHOULD CORPORATIONS BE DOING?
Introduction
Since the turn of the millennium the concerns of the international development community regarding social dimensions of development have broadened beyond issues such as health, education, poverty and social exclusion to also include income and wealth inequality.104 More recently the SDGs, and SDG 10 in particular, have further reinforced the notion that vertical inequality in the distribution of economic resources needs to figure centrally in efforts to promote sustainable development.105 This chapter examines what corporations can do to effectively measure sustainability performance related to income inequality within the firm. This requires going beyond conventional metrics associated with unequal pay for equal work, or indicators that compare wage levels to the minimum wage or industry norms. Here the focus is on measuring and assessing fair remuneration along two dimensions, namely, CEO-worker pay ratios, and wage levels compared to the living wage. In subsequent chapters, other aspects of unfair remuneration are addressed, in particular, gender inequality associated with the gender pay gap (Chapter 6) and skewed power relations associated with collective bargaining and corporate policy influence (Chapters 8 and 9).
Fair RemunerationCHAPTER 5
104 Social scientific analysis has played a key role in this process, not least via a series of flagship and other reports by United Nations agencies, the World Bank and think tanks (UNDP 2005, World Bank 2005, UNRISD 2010a, Anderson and O’Neil 2006). Academic research by Piketty and others has provided evidence of the growing disparities in income and wealth associated with the top 0.1 percent (Piketty 2014, Piketty and Saenz 2003). Banner headlines such as “Last Year 26 People Owned the Same as the 3.8 Billon People Who Make Up the Poorest Half of
Humanity” prompted by advocacy work by groups like Oxfam have also fixed the spotlight on vertical inequality (Oxfam International 2019).
105 In a context where international development agencies and think tanks were highlighting multiple negative impacts of inequality in relation to poverty reduction, social cohesion, efficiency and growth, it became apparent that inequality was a blind spot in the Millennium Development Goals (MDGs), and one that needed to be addressed in any post-MDG agenda, as it is now in the SDGs.
84
UNRISD
Income inequality within the firm
The CEO-employee pay ratio is an emerging performance indicator within corporate sustainability reporting. This reflects not only media and civil society concerns about now widely publicized disparities in income and wealth as well as how corporate elites appear to be driving this perverse phenomenon, but also growing concern among governments and investors. Policy makers have been confronted with a wealth of evidence about why inequality matters from the perspective of economic and social development as well as good governance (see Box 5.1). Investors are paying more attention to the issue of vertical inequality partly because of increasing evidence that CEO pay may not reflect corporate financial performance. Research conducted by the Vlerick Business School into 861 companies in six European countries found that firms which delivered strong financial performances over a sustained period shared the following characteristics (Baeten and Said 2016):106
• the remuneration of the CEO is relatively lower;
• the proportion of variable remuneration (such as bonuses or stock options) within the total CEO package is relatively lower;
• there is less leverage in the bonus (difference between target and maximum bonus);
• increasing or decreasing the use of long-term incentives is not important; and
• the CEO-employee pay ratio is lower.
Other research suggests that an extremely high level of executive pay may be partly determined by performance, but corporate culture may be as, if not more, significant:
The salary package … stands as evidence of the potential strength of the company, of its capacity to play in a special league. It is a straightforward means to demonstrate reputation, legitimacy, and financial power. Put simply, it is the economy’s unique impression management tool.
Box 5.1. Why does inequality matter?
The intellectual struggle to reincorporate vertical inequality in the portfolio of mainstream development concerns was intense as it involved overcoming not only a blind spot in conceptualizing and measuring development but also convincing key actors that inequality actually mattered both from a moral and a development perspective. Academic studies have highlighted multiple economic, societal and public policy implications.
Referring in particular to the United States, Boushey et al. (2017:14-16) note the following:• “[I]nequality is a factor that leads enormous investments in resources to deliver little of ultimate value
in the sense of human well-being and human satisfaction”, as noted in the case of the distribution of medical care in the United States.
• Established or inherited wealth “is by its nature hostile to the creative destruction that accompanies rapid economic growth”.
• “[H]igher inequality will slow growth by depriving the nonrich of the resources to invest in themselves, their children and their enterprises … [and] by focusing effort on helping the rich keep what they have at the cost of squelching the development of the new”.
• Elites are opting out of public schools (and health services) and, as a result, may be less inclined to support the tax regimes underpinning public services. Furthermore, “reliance on private wealth to finance higher education has already made that sector far more unequal…”.
• As a result of increased political and policy influence, elites can manipulate governments to “solve problems of concern to the plutocrats and not the people”.
• As elites gain first-mover advantage in new sectors involving, for example, platform-based firms, their influence may make it extremely difficult for policy makers “to rein in the anticompetitive bent of … those who arrive first”, thereby stifling innovation.
• Inequality can reinforce the ability of employers “to pick winners and losers” and drive them “to indignant outrage by the idea of a collective worker voice”. It can also lead to greater segmentation or “fissuring”* within the workforce, which can marginalize the position of manual workers.
• “An unequal society is one in which who you know matters more to your ultimate well-being than what you know … [A] society in which the distribution of well-being is determined by ‘who the rich like’ is unlikely to preserve the gains of racial and gender equality made during the Social Democratic era”.
* Boushey et al. 2017 citing Weil (Chapter 9).
106 See “The Best Performing Companies Pay their CEOs Relatively Less”. Vlerick Business School (20 December 2017). Accessed 30 November 2019. https://www.vlerick.com/en/research-and-faculty/knowledge-items/knowledge/the-best-performing-companies-pay-their-ceo-s-relatively-less
85
CORPORATE SUSTAINABILITY ACCOUNTING: WHAT CAN AND SHOULD CORPORATIONS BE DOING?
This game is a ‘ballgame’ too, although not one played on the pitch, but in the company’s pants, and the masculine smell is no coincidence. Whether the individual manager is worth the money and whether he or she meets the behavioural and performance expectations is not unimportant, but it is distinctly – secondary. Reward systems are a show of power (Wetzel 2014).
In other words, the issue of income and wealth inequality is intimately connected with that of the ongoing empowerment of corporate elites and the disempowerment of workers, issues that are addressed in later chapters of this report that deal with labour rights and corporate political influence.
The upshot of this restructuring of economic and power relations has been a shift in (i) the functional distribution of income, that is, the ratio of profits to wages which, over time, has moved in favour of profits, and (ii) the capacity of senior management to claim a greater share of the income pie. A convenient indicator that sheds light on this situation is the ratio of workers’ pay to that of the highest paid executive in a particular company. Generally, this would be the CEO.
This discussion suggests that the following KPIs are relevant:• CEO-worker or -employee pay ratios;
and• percentage annual increase in CEO
or senior management remuneration compared to that of workers or other employees.
CEO-worker pay ratioMethods for calculating CEO-worker pay ratios vary considerably. The calculation of CEO salaries often omits certain elements that make up the full compensation package. A comprehensive definition is that used by the Economic Policy Institute (EPI) for its study of CEO-worker pay gaps in the United States. This includes salary, bonuses, restricted stock grants, long-term incentive payouts and options realized or options granted (Sabadish and Mishel 2013).
Similarly, what CEO remuneration should be compared to also varies considerably. Most indicators focus on “employees” as opposed to “workers”. The relevant GRI standard (see Annex 8) considers the legitimate comparator to be the median of the wages and salaries of all other employees. Some ratings agencies allow companies to report either the median or the mean average.
Given that workers, managers and other C-suite officers are all factored into the category of “other employees”, the median and mean average can vary depending on the employment and pay structure. While mean averages may be easier to calculate, given the information already on hand, the median—the mid-point of a set of values—is generally considered to reflect more accurately the pay level of “typical” employees, notably in contexts of skewed distribution. The average pay of “other employees” may or may not bear a close relation to the wages of the lowest paid workers, who presumably should be a key focus of attention in any assessment of inequality. Accordingly, when calculating pay ratios, the EPI focuses more directly on “workers” as opposed to employees, defining workers as employees in production and non-supervisory positions when calculating pay ratios in the United States.
In its 2015 ruling related to the implementation of the Dodd-Frank Wall Street Reform and Consumer Protection Act, the United States Securities and Exchange Commission (SEC) requires publicly traded companies to disclose, from 2017 onwards, the ratio of the compensation of the CEO to the median compensation of employees. The ruling, however, provides companies considerable leeway regarding the methods used.107
What might a fair CEO-worker pay ratio target look like?Various reference points could inform the process of determining fair benchmarks and targets.
Historical norms that characterized periods that were considered “fair” are often referenced. During the so-called golden age of capitalism, or the era of “embedded liberalism” in the
107 “… a company will be permitted to select its methodology for identifying its median employee and that employee’s compensation, including through statistical sampling of its employee population or other reasonable methods.” Further, “[t]he rule also permits companies to make the median employee determination only once every three years and to choose a determination date within the last three months of a company’s fiscal year. In addition, the rule allows companies to exclude non-U.S. employees from countries in which data privacy laws or regulations make companies unable to comply with the rule and provides a de minimis exemption for non-U.S. employees. The rule does not apply to smaller reporting companies, emerging growth companies, foreign private issuers, MJDS filers, or registered investment companies.” U.S. Securities and Exchange Commission. 2015. Accessed 10 September 2019. https://www.sec.gov/news/pressrelease/2015- 160.html
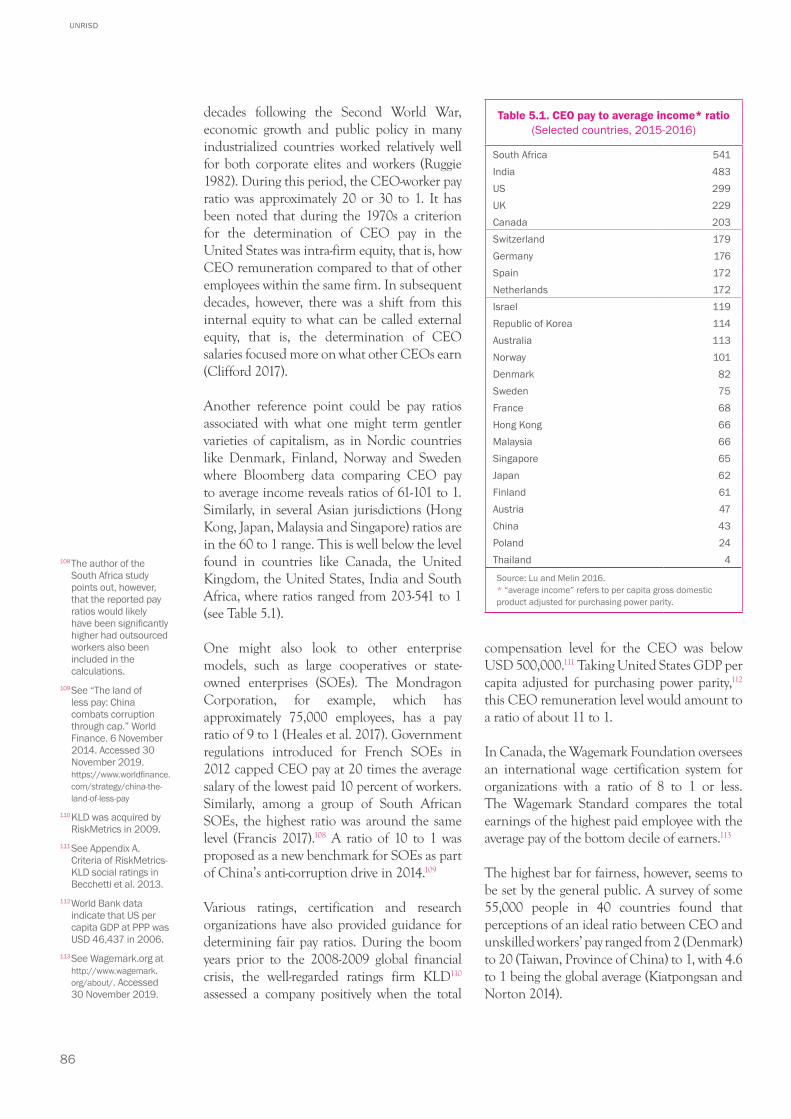
86
UNRISD
decades following the Second World War, economic growth and public policy in many industrialized countries worked relatively well for both corporate elites and workers (Ruggie 1982). During this period, the CEO-worker pay ratio was approximately 20 or 30 to 1. It has been noted that during the 1970s a criterion for the determination of CEO pay in the United States was intra-firm equity, that is, how CEO remuneration compared to that of other employees within the same firm. In subsequent decades, however, there was a shift from this internal equity to what can be called external equity, that is, the determination of CEO salaries focused more on what other CEOs earn (Clifford 2017).
Another reference point could be pay ratios associated with what one might term gentler varieties of capitalism, as in Nordic countries like Denmark, Finland, Norway and Sweden where Bloomberg data comparing CEO pay to average income reveals ratios of 61-101 to 1. Similarly, in several Asian jurisdictions (Hong Kong, Japan, Malaysia and Singapore) ratios are in the 60 to 1 range. This is well below the level found in countries like Canada, the United Kingdom, the United States, India and South Africa, where ratios ranged from 203-541 to 1 (see Table 5.1).
One might also look to other enterprise models, such as large cooperatives or state-owned enterprises (SOEs). The Mondragon Corporation, for example, which has approximately 75,000 employees, has a pay ratio of 9 to 1 (Heales et al. 2017). Government regulations introduced for French SOEs in 2012 capped CEO pay at 20 times the average salary of the lowest paid 10 percent of workers. Similarly, among a group of South African SOEs, the highest ratio was around the same level (Francis 2017).108 A ratio of 10 to 1 was proposed as a new benchmark for SOEs as part of China’s anti-corruption drive in 2014.109
Various ratings, certification and research organizations have also provided guidance for determining fair pay ratios. During the boom years prior to the 2008-2009 global financial crisis, the well-regarded ratings firm KLD110 assessed a company positively when the total
compensation level for the CEO was below USD 500,000.111 Taking United States GDP per capita adjusted for purchasing power parity,112 this CEO remuneration level would amount to a ratio of about 11 to 1.
In Canada, the Wagemark Foundation oversees an international wage certification system for organizations with a ratio of 8 to 1 or less. The Wagemark Standard compares the total earnings of the highest paid employee with the average pay of the bottom decile of earners.113
The highest bar for fairness, however, seems to be set by the general public. A survey of some 55,000 people in 40 countries found that perceptions of an ideal ratio between CEO and unskilled workers’ pay ranged from 2 (Denmark) to 20 (Taiwan, Province of China) to 1, with 4.6 to 1 being the global average (Kiatpongsan and Norton 2014).
Table 5.1. CEO pay to average income* ratio (Selected countries, 2015-2016)
South Africa 541India 483US 299UK 229Canada 203Switzerland 179Germany 176Spain 172Netherlands 172Israel 119Republic of Korea 114Australia 113Norway 101Denmark 82Sweden 75France 68Hong Kong 66Malaysia 66Singapore 65Japan 62Finland 61Austria 47China 43Poland 24Thailand 4
Source: Lu and Melin 2016.* “average income” refers to per capita gross domestic product adjusted for purchasing power parity.
108 The author of the South Africa study points out, however, that the reported pay ratios would likely have been significantly higher had outsourced workers also been included in the calculations.
109 See “The land of less pay: China combats corruption through cap.” World Finance. 6 November 2014. Accessed 30 November 2019. https://www.worldfinance.com/strategy/china-the-land-of-less-pay
110 KLD was acquired by RiskMetrics in 2009.
111 See Appendix A. Criteria of RiskMetrics-KLD social ratings in Becchetti et al. 2013.
112 World Bank data indicate that US per capita GDP at PPP was USD 46,437 in 2006.
113 See Wagemark.org at http://www.wagemark.org/about/. Accessed 30 November 2019.
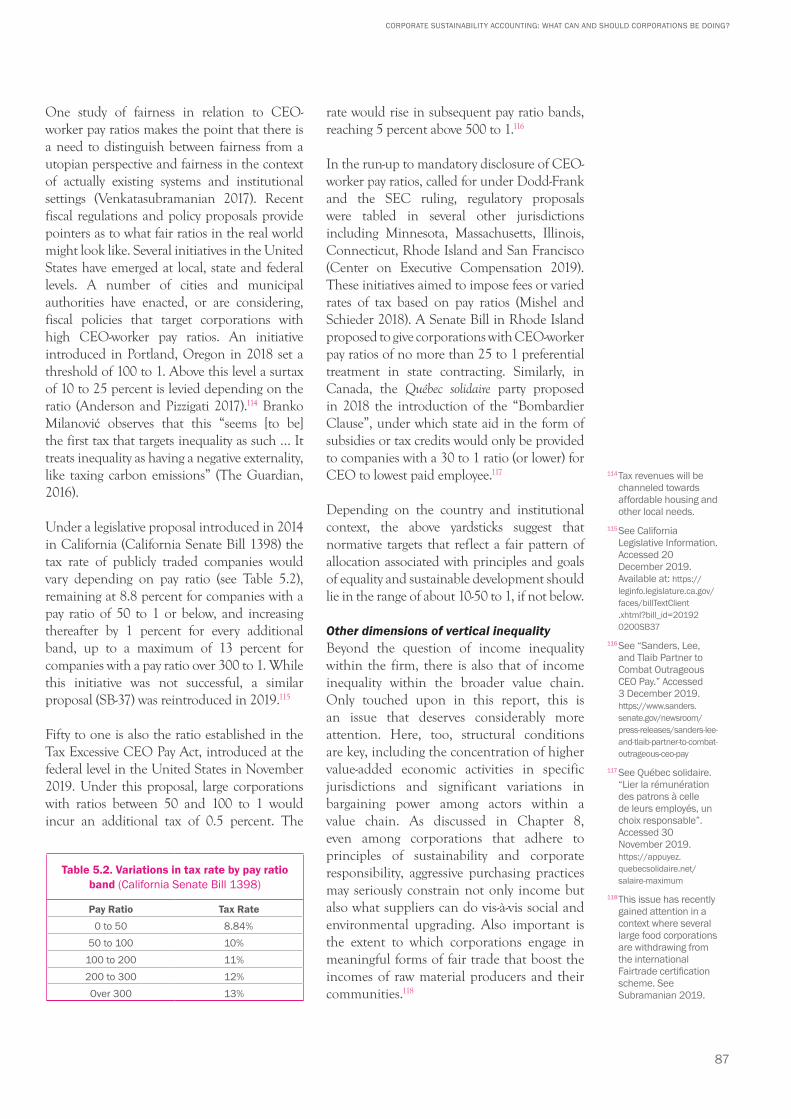
87
CORPORATE SUSTAINABILITY ACCOUNTING: WHAT CAN AND SHOULD CORPORATIONS BE DOING?
One study of fairness in relation to CEO-worker pay ratios makes the point that there is a need to distinguish between fairness from a utopian perspective and fairness in the context of actually existing systems and institutional settings (Venkatasubramanian 2017). Recent fiscal regulations and policy proposals provide pointers as to what fair ratios in the real world might look like. Several initiatives in the United States have emerged at local, state and federal levels. A number of cities and municipal authorities have enacted, or are considering, fiscal policies that target corporations with high CEO-worker pay ratios. An initiative introduced in Portland, Oregon in 2018 set a threshold of 100 to 1. Above this level a surtax of 10 to 25 percent is levied depending on the ratio (Anderson and Pizzigati 2017).114 Branko Milanović observes that this “seems [to be] the first tax that targets inequality as such … It treats inequality as having a negative externality, like taxing carbon emissions” (The Guardian, 2016).
Under a legislative proposal introduced in 2014 in California (California Senate Bill 1398) the tax rate of publicly traded companies would vary depending on pay ratio (see Table 5.2), remaining at 8.8 percent for companies with a pay ratio of 50 to 1 or below, and increasing thereafter by 1 percent for every additional band, up to a maximum of 13 percent for companies with a pay ratio over 300 to 1. While this initiative was not successful, a similar proposal (SB-37) was reintroduced in 2019.115
Fifty to one is also the ratio established in the Tax Excessive CEO Pay Act, introduced at the federal level in the United States in November 2019. Under this proposal, large corporations with ratios between 50 and 100 to 1 would incur an additional tax of 0.5 percent. The
rate would rise in subsequent pay ratio bands, reaching 5 percent above 500 to 1.116
In the run-up to mandatory disclosure of CEO-worker pay ratios, called for under Dodd-Frank and the SEC ruling, regulatory proposals were tabled in several other jurisdictions including Minnesota, Massachusetts, Illinois, Connecticut, Rhode Island and San Francisco (Center on Executive Compensation 2019). These initiatives aimed to impose fees or varied rates of tax based on pay ratios (Mishel and Schieder 2018). A Senate Bill in Rhode Island proposed to give corporations with CEO-worker pay ratios of no more than 25 to 1 preferential treatment in state contracting. Similarly, in Canada, the Québec solidaire party proposed in 2018 the introduction of the “Bombardier Clause”, under which state aid in the form of subsidies or tax credits would only be provided to companies with a 30 to 1 ratio (or lower) for CEO to lowest paid employee.117
Depending on the country and institutional context, the above yardsticks suggest that normative targets that reflect a fair pattern of allocation associated with principles and goals of equality and sustainable development should lie in the range of about 10-50 to 1, if not below.
Other dimensions of vertical inequalityBeyond the question of income inequality within the firm, there is also that of income inequality within the broader value chain. Only touched upon in this report, this is an issue that deserves considerably more attention. Here, too, structural conditions are key, including the concentration of higher value-added economic activities in specific jurisdictions and significant variations in bargaining power among actors within a value chain. As discussed in Chapter 8, even among corporations that adhere to principles of sustainability and corporate responsibility, aggressive purchasing practices may seriously constrain not only income but also what suppliers can do vis-à-vis social and environmental upgrading. Also important is the extent to which corporations engage in meaningful forms of fair trade that boost the incomes of raw material producers and their communities.118
Table 5.2. Variations in tax rate by pay ratio band (California Senate Bill 1398)
Pay Ratio Tax Rate
0 to 50 8.84%50 to 100 10%
100 to 200 11%200 to 300 12%Over 300 13%
114 Tax revenues will be channeled towards affordable housing and other local needs.
115 See California Legislative Information. Accessed 20 December 2019. Available at: https://leginfo.legislature.ca.gov/faces/billTextClient .xhtml?bill_id=20192 0200SB37
116 See “Sanders, Lee, and Tlaib Partner to Combat Outrageous CEO Pay.” Accessed 3 December 2019. https://www.sanders.senate.gov/newsroom/press-releases/sanders-lee-and-tlaib-partner-to-combat-outrageous-ceo-pay
117 See Québec solidaire. “Lier la rémunération des patrons à celle de leurs employés, un choix responsable”. Accessed 30 November 2019. https://appuyez.quebecsolidaire.net/salaire-maximum
118 This issue has recently gained attention in a context where several large food corporations are withdrawing from the international Fairtrade certification scheme. See Subramanian 2019.
88
UNRISD
The contemporary enrichment of the business and financial elite is not a function simply of their skill set and contribution to economic growth, but also of rent-seeking (Reich 2007, Stiglitz 2016, 2018, UNCTAD 2017). In other words, it is associated with the power and influence they have due to their position and ability to influence shareholders, politicians, public policy and the media. Oxfam’s work on inequality highlights the role of cronyism and monopoly power as two key determinants of perverse inequality, along with inheritance and tax-dodging via tax havens and other means (Oxfam 2018). Rising vertical inequality is also a function of changes in power relations that involve the strengthening of the managerial class vis-à-vis both shareholders and trade unions. These issues are addressed in subsequent chapters dealing with corporate taxation, labour rights and corporate political influence.
Living wages
A common response to the issue of vertical inequality within corporate sustainability accounting is to bypass what is happening at the top of the corporate pyramid, and focus instead on efforts to improve working conditions related to occupational health and safety (OHS), pay violations, workplace discrimination, overtime, and compliance with minimum wage regulations as well as norms or regulations related to equal pay for equal work. More recently, the principle of fair remuneration and the concept of the living wage have gained currency within corporate sustainability discourse.
In 2015, the Fair Labor Association (FLA), for example, enhanced its work on the com-pensation element of building socially re-sponsible supply chains by implementing the FLA Fair Compensation Work Plan.119 Similarly, the 2016 revision of the King standards for corporate governance in South Africa introduced the principle that “[t]he governing body should ensure that the organization remunerates fairly, responsibly and transparently so as to promote the achievement of strategic objectives and positive outcomes in the short, medium and long term” (Principle 14, King IV). A number
of corporations—adidas, PUMA, Unilever, H&M, IKEA, AstroZeneca, Vodafone and Standard Chartered Bank, for example—are now referencing fair remuneration or the living wage in their pay strategies.120
From the perspective of the 2030 Agenda, fair remuneration in terms of wage levels is a key element as it would simultaneously contribute to multiple goals, not least SDG 1 (poverty reduction), 5 (gender equality), 8 (decent work), and 10 (reduced inequalities), as well as improved access to food (2), health and well-being (3), education (4), clean water (6) and energy (7).
The concept of fairness in relation to remuneration should involve both the question of allocation—that is, fair patterns of distribution within the corporate structure—and establishing a sustainability threshold, in other words a level of wages conducive to human well-being.
Corporate sustainability reporting frameworks and practices often adopt a minimalist interpretation that judges fairness in terms of compliance with minimum wage regulations or industry norms (see Annex 8). Even an indicator as basic as real wages, that is, nominal wages adjusted for inflation, is often ignored. This is of particular concern given that real wage trends have declined or remained flat in many countries, notably in the G20 (ILO 2018a).
Indicators for transformative change need to go well beyond these minimalist yardsticks by considering progress towards the payment of a living wage.
What is the “living wage”?The concept of the living wage refers to wage levels that allow a full-time worker, working normal hours, to provide for their family via a wage that covers basic food, housing, transportation, health, education and some other costs, as well as a small proportion for discretionary expenditure and savings. Calculations of living wages are site-specific, that is, they refer to geographical areas (such as countries, provinces, urban/rural areas) where costs of living are fairly similar. Furthermore, they must be periodically adjusted to factor in price changes.
119 Previously, in 2011, “the FLA enhanced the compensation element in its Workplace Code of Conduct, affirming workers’ right to wages that meet the worker’s basic needs and provide some discretionary income”. This work plan charts the path forward for implementing that element of the code, providing fair compensation for workers, one of the biggest challenges in building socially responsible supply chains. See: http://www.fairlabor.org/blog/entry/fla-board-directors-approves-implementing-fair-compensation-work-plan
120 See Vaughan-Whitehead 2019:18.
89
CORPORATE SUSTAINABILITY ACCOUNTING: WHAT CAN AND SHOULD CORPORATIONS BE DOING?
How the term is interpreted and applied can vary considerably. Sometimes, it is used loosely by organizations to embellish performance related to compliance with minimum wages. In other instances, organizations may adopt a principle associated with the living wage but, in practice, focus on minimum wage norms that consider some level of living costs related to basic needs.
Indeed, this has occurred in the case of the International Labour Organization (ILO). Over its 100 year history, the ILO has referenced the notion of a living wage, or the need for minimum wages to cover basic needs, at pivotal moments.121 Part XIII of the Treaty of Versailles, which established the ILO in 1919, refers to the need to urgently improve poor labour conditions via “the provision of an adequate living wage”. The 1970 ILO Convention 131 and Recommendation 135 on Minimum Wage Fixing call on governments to consider “‘the needs of workers and their families as a criterion to determine the level of minimum wages, taking into account the general level of wages in the country, the cost of living, social security benefits and the relative living standard of other social groups” (Reynaud 2017: 24). Focusing on fixing or defending minimum wages is not the same, however, as actively promoting the concept of the living wage (Reynaud 2017, AFWA 2017a).
In some contexts, a hybrid term has emerged, as in the case of the United Kingdom. In 2016 the government introduced “the minimum living wage” which simply added 50 pence onto the minimum wage for anyone over 25 years of age.
The task of defining norms associated with more expansive definitions has fallen to others, notably standard-setting and certification bodies, advocacy NGOs and academics.
A second issue concerns what basic needs and household expenditure elements the living wage should cover. While it is generally understood that the living wage should cover basic needs, what constitutes basic needs can be viewed quite differently. This is illustrated in the following typology of wages proposed by the social, economic, research and education organization CREA.
• Level 1 – Marginal survival wage: Wage level does not provide for adequate nutritional needs. Starvation is prevented but malnutrition, illnesses and early deaths are the result.
• Level 2 – Basic survival wage: Wage level allows for meeting immediate survival needs including basic food, used clothing, minimal shelter and fuel for cooking.
• Level 3 – Short-range planning wage: Wage level meets basic survival needs. Possibility of small amount of discretionary income allows for minimal planning beyond living from paycheck to paycheck. Allows for occasional purchase of needed item(s) as small amounts can be set aside after meeting basic survival needs.
• Level 4 – Sustainable living wage: Wage level meets basic needs including food, clothing, housing, energy, transportation, health care and education. Ability to participate in culturally-required activities (including births and related celebrations, weddings, funerals and related activities). Also allows for the setting aside of small amounts of money (savings) to allow planning for the future purchase of items and the meeting of needs. In addition to meeting basic needs and allowing the worker to set aside money for future purchases, allows for the availability of enough discretionary income to allow the worker to support the development of small businesses in a local community, including the support of cultural and civic needs of the community. Wage levels allow for long-range planning and participation (CREA 2019).
From the perspective of sustainable development and transformative change—or thriving—definitions and long-term targets should, presumably, be associated with level 4. In regulatory and advocacy circles, however, the dust seems to be settling on a definition that is somewhere between levels 3 and 4.
121 These include the 1919 Treaty of Versailles which established the organization, the 1944 International Labour Conference in Philadelphia, which reviewed the organization’s mandate in the wake of the Second World War; the context of decolonization in the 1960s; and in 2008 when the Declaration on Social Justice for a Fair Globalization was adopted (Reynaud 2017, AFWA 2017a).
90
UNRISD
Drawing on over 60 living wage descriptions and definitions, the Global Living Wage Coalition (GLWC), for example, defines a living wage as:
remuneration received for a standard work week by a worker in a particular place sufficient to afford a decent standard of living for the worker and her or his family. Elements of a decent standard of living include food, water, housing, education, health care, transport, clothing, and other essential needs including provision for unexpected events.122
Measurement issuesWhile a consensus may be emerging around the definition of a living wage, methods for calculating the living wage vary. Significant issues concern, for example, what constitutes an adequate diet in terms of calories per adult per day, the relative weight of housing costs, the composition of discretionary spending and savings, how many income earners and dependents make up a family or household, what constitutes wages, and how many hours of work are required to earn a living wage. Furthermore, national figures may mask significant variations within countries. These difficulties suggest a role for an international organization like the ILO, which has long acknowledged the principle of the living wage, to facilitate work towards a more standardized methodology that can be applied globally.
Basing their work on what is known as the Anker Methodology123, GLWC (undated) notes some of the differences in methods, stating that theirs:
is a practical compromise between separately estimating the cost of each and every expense families have, and the most common approach currently used for estimating living wage in developing countries, which uses just two expense groups (food costs based on a model diet and nonfood costs based on secondary data). Using normative standards for decent housing and estimating housing costs separately (not as part of nonfood costs, as in typical methodologies) ensures that living wage estimates enable workers to afford decent housing.
In contrast, typical methodologies rely on available expenditure data to estimate housing costs and so replicate current (often substandard) housing conditions. Our methodology also better allows for different living wage estimates for rural and urban areas, as housing costs are usually the most important cause of differences in living costs. Our methodology also increases transparency, because the size of the “all other essential costs” bucket is much smaller and examined more thoroughly (and adjusted when necessary) than in typical approaches.124
The Asia Floor Wage Alliance (2017b) adopts the following assumptions:• A worker needs to be able to
support themselves and two other “consumption units” (1 consumption unit = 1 adult or 2 children).
• An adult requires 3,000 calories a day to be able to carry out their work.
• Food makes up half of a worker’s monthly outlays; housing, health, education, transport and fuel make up 40 percent; 10 percent is for discretionary income associated with entertainment, savings, pension and redundancy of the main earner.
• The Asia Floor Wage is calculated in purchasing power parity (USD), or PPP$, which allows the standard of living between countries to be compared regardless of the national currency.
For its calculations relevant to garment workers in other regions, the Asia Floor Wage Alliance adapts these assumptions to local context:
The Asia Floor Wage calculation cannot be simply applied to other regions as some of the assumptions do not apply, for example, food costs accounting for half of income. This is the case in Asia where food costs are relatively high and standards of living such as housing are very low, however in other regions such as Eastern Europe food costs are relatively lower when compared to housing (AFWA 2017b).
122 See https://www.globallivingwage.org/about/what-is-a-living-wage/. Accessed 28 November 2019.
123 See Anker, Richard and Martha Anker, 2017. Living Wages Around the World: Manual for Measurement. Cheltenham UK: Edward Elgar.
124 See https://www.globallivingwage.org/about/anker-methodology/. Accessed 28 November 2019.
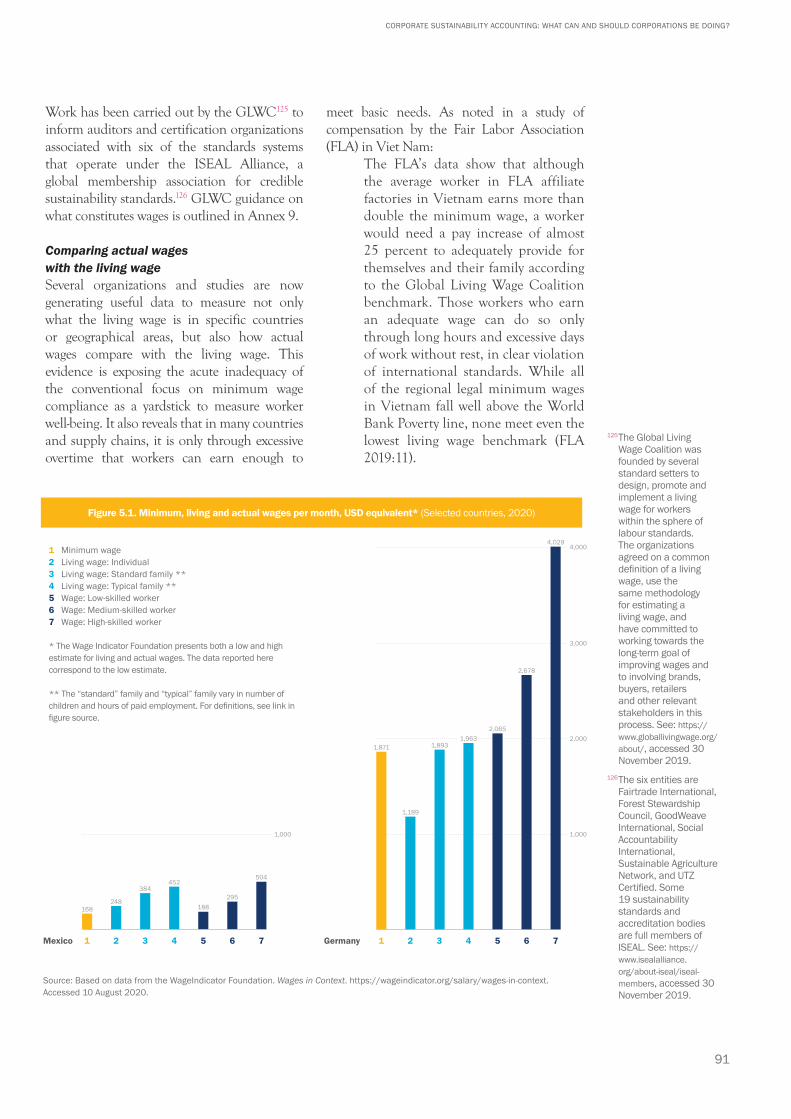
91
CORPORATE SUSTAINABILITY ACCOUNTING: WHAT CAN AND SHOULD CORPORATIONS BE DOING?
Work has been carried out by the GLWC125 to inform auditors and certification organizations associated with six of the standards systems that operate under the ISEAL Alliance, a global membership association for credible sustainability standards.126 GLWC guidance on what constitutes wages is outlined in Annex 9.
Comparing actual wages with the living wageSeveral organizations and studies are now generating useful data to measure not only what the living wage is in specific countries or geographical areas, but also how actual wages compare with the living wage. This evidence is exposing the acute inadequacy of the conventional focus on minimum wage compliance as a yardstick to measure worker well-being. It also reveals that in many countries and supply chains, it is only through excessive overtime that workers can earn enough to
meet basic needs. As noted in a study of compensation by the Fair Labor Association (FLA) in Viet Nam:
The FLA’s data show that although the average worker in FLA affiliate factories in Vietnam earns more than double the minimum wage, a worker would need a pay increase of almost 25 percent to adequately provide for themselves and their family according to the Global Living Wage Coalition benchmark. Those workers who earn an adequate wage can do so only through long hours and excessive days of work without rest, in clear violation of international standards. While all of the regional legal minimum wages in Vietnam fall well above the World Bank Poverty line, none meet even the lowest living wage benchmark (FLA 2019:11).
125 The Global Living Wage Coalition was founded by several standard setters to design, promote and implement a living wage for workers within the sphere of labour standards. The organizations agreed on a common definition of a living wage, use the same methodology for estimating a living wage, and have committed to working towards the long-term goal of improving wages and to involving brands, buyers, retailers and other relevant stakeholders in this process. See: https://www.globallivingwage.org/about/, accessed 30 November 2019.
126 The six entities are Fairtrade International, Forest Stewardship Council, GoodWeave International, Social Accountability International, Sustainable Agriculture Network, and UTZ Certified. Some 19 sustainability standards and accreditation bodies are full members of ISEAL. See: https://www.isealalliance.org/about-iseal/iseal-members, accessed 30 November 2019.
Figure 5.1. Minimum, living and actual wages per month, USD equivalent* (Selected countries, 2020)
Source: Based on data from the WageIndicator Foundation. Wages in Context. https://wageindicator.org/salary/wages-in-context. Accessed 10 August 2020.
1,871 1,893
2,065
2,678
4,029
1,189
1,963
Mexico Germany
1,000
2,000
3,000
4,000
1,000
168248
384452
188295
504
1 Minimum wage2 Living wage: Individual3 Living wage: Standard family **4 Living wage: Typical family **5 Wage: Low-skilled worker6 Wage: Medium-skilled worker7 Wage: High-skilled worker
* The Wage Indicator Foundation presents both a low and high estimate for living and actual wages. The data reported here correspond to the low estimate.
** The “standard” family and “typical” family vary in number of children and hours of paid employment. For definitions, see link in figure source.
1 2 3 4 5 6 7 1 2 3 4 5 6 7
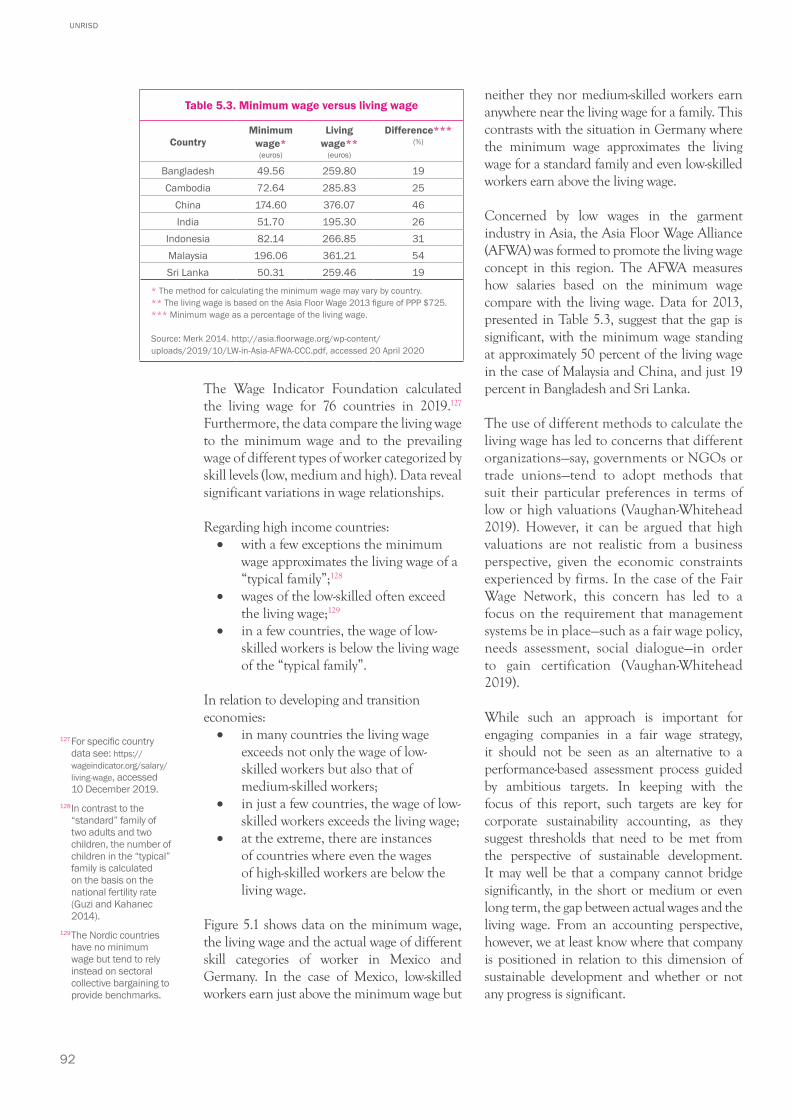
92
UNRISD
The Wage Indicator Foundation calculated the living wage for 76 countries in 2019.127 Furthermore, the data compare the living wage to the minimum wage and to the prevailing wage of different types of worker categorized by skill levels (low, medium and high). Data reveal significant variations in wage relationships.
Regarding high income countries:• with a few exceptions the minimum
wage approximates the living wage of a “typical family”;128
• wages of the low-skilled often exceed the living wage;129
• in a few countries, the wage of low-skilled workers is below the living wage of the “typical family”.
In relation to developing and transition economies:• in many countries the living wage
exceeds not only the wage of low-skilled workers but also that of medium-skilled workers;
• in just a few countries, the wage of low-skilled workers exceeds the living wage;
• at the extreme, there are instances of countries where even the wages of high-skilled workers are below the living wage.
Figure 5.1 shows data on the minimum wage, the living wage and the actual wage of different skill categories of worker in Mexico and Germany. In the case of Mexico, low-skilled workers earn just above the minimum wage but
neither they nor medium-skilled workers earn anywhere near the living wage for a family. This contrasts with the situation in Germany where the minimum wage approximates the living wage for a standard family and even low-skilled workers earn above the living wage.
Concerned by low wages in the garment industry in Asia, the Asia Floor Wage Alliance (AFWA) was formed to promote the living wage concept in this region. The AFWA measures how salaries based on the minimum wage compare with the living wage. Data for 2013, presented in Table 5.3, suggest that the gap is significant, with the minimum wage standing at approximately 50 percent of the living wage in the case of Malaysia and China, and just 19 percent in Bangladesh and Sri Lanka.
The use of different methods to calculate the living wage has led to concerns that different organizations—say, governments or NGOs or trade unions—tend to adopt methods that suit their particular preferences in terms of low or high valuations (Vaughan-Whitehead 2019). However, it can be argued that high valuations are not realistic from a business perspective, given the economic constraints experienced by firms. In the case of the Fair Wage Network, this concern has led to a focus on the requirement that management systems be in place—such as a fair wage policy, needs assessment, social dialogue—in order to gain certification (Vaughan-Whitehead 2019).
While such an approach is important for engaging companies in a fair wage strategy, it should not be seen as an alternative to a performance-based assessment process guided by ambitious targets. In keeping with the focus of this report, such targets are key for corporate sustainability accounting, as they suggest thresholds that need to be met from the perspective of sustainable development. It may well be that a company cannot bridge significantly, in the short or medium or even long term, the gap between actual wages and the living wage. From an accounting perspective, however, we at least know where that company is positioned in relation to this dimension of sustainable development and whether or not any progress is significant.
Table 5.3. Minimum wage versus living wage
CountryMinimum
wage* (euros)
Living wage**
(euros)
Difference***(%)
Bangladesh 49.56 259.80 19Cambodia 72.64 285.83 25
China 174.60 376.07 46India 51.70 195.30 26
Indonesia 82.14 266.85 31Malaysia 196.06 361.21 54Sri Lanka 50.31 259.46 19
* The method for calculating the minimum wage may vary by country.** The living wage is based on the Asia Floor Wage 2013 figure of PPP $725.*** Minimum wage as a percentage of the living wage.
Source: Merk 2014. http://asia.floorwage.org/wp-content/uploads/2019/10/LW-in-Asia-AFWA-CCC.pdf, accessed 20 April 2020
127 For specific country data see: https://wageindicator.org/salary/living-wage, accessed 10 December 2019.
128 In contrast to the “standard” family of two adults and two children, the number of children in the “typical” family is calculated on the basis on the national fertility rate (Guzi and Kahanec 2014).
129 The Nordic countries have no minimum wage but tend to rely instead on sectoral collective bargaining to provide benchmarks.
93
CORPORATE SUSTAINABILITY ACCOUNTING: WHAT CAN AND SHOULD CORPORATIONS BE DOING?
⚫ Concluding remarks
The above discussion regarding fair remu ner-ation suggests the following take-aways.
In a context where trends in income and wealth inequality are undermining the attainment of several SDGs, it is crucial to assess what corporations are doing both to measure their impacts in this area, and to adhere to sustainability principles and norms by correcting skewed patterns of distribution. As regards intra-firm inequality, the CEO-employee pay ratio is a convenient indicator.
While standard-setting organizations are paying more attention to such disclosure, there are considerable variations in methodologies and metrics used. Such inconsistencies need to be addressed to ensure, for example, that the median or the mean average wage reflects the prevailing wages of typical workers and that CEO salaries factor in the multiple sources of income that make up the CEO salary package.
As regards possible long-term targets for assessing progress, several of the initiatives and experiences reviewed in this chapter suggest a threshold of about 50 to 1 as an acceptable CEO-worker pay ratio within large corporations. From other vantage points, however, this remains excessive. From the more ambitious perspective of distributive justice associated with sustainable development and transformative change, a ratio in the range of 10-30 to 1 might be considered fair.
The living wage is another convenient reference point for gauging a company’s contribution to sustainable development in relation to fair remuneration. While it has a long pedigree in terms of conceptualization, it has remained under the radar within both labour market policy and corporate sustainability accounting. Recently, however, it has gained traction within these fields. Companies should provide metrics that allow stakeholders to compare actual wage levels with not only the minimum wage or industry norm but also the living wage. It would be of interest to know the percentage of employees in a company who earn below the living wage. Companies
could also adapt the WageIndicator method, which compares the living wage with the wages of different categories of worker, by referring to the median wage of each quartile of wage/salary earner.
Other key performance indicators related to fair remuneration should include real, as opposed to nominal, wage trends and the comparison of wage trends with those of labour productivity.
Achieving progress related to fair remuneration and living wages often requires a sectoral or regional approach to prevent responsive companies from losing competitive advantage. It also requires far greater attention to labour rights and enhancing the capacity of workers to bargain for improved pay and conditions, the issue discussed in Chapter 8 below.
From an accounting perspective, where consistency and comparability are important principles, variations in methodology suggest the need for different organizations and stakeholders to come together to harmonize methods. Given its long association with the principle of a living wage, its global regulatory and normative stature, and its convening power, the International Labour Organization seems well placed to play a facilitation role.
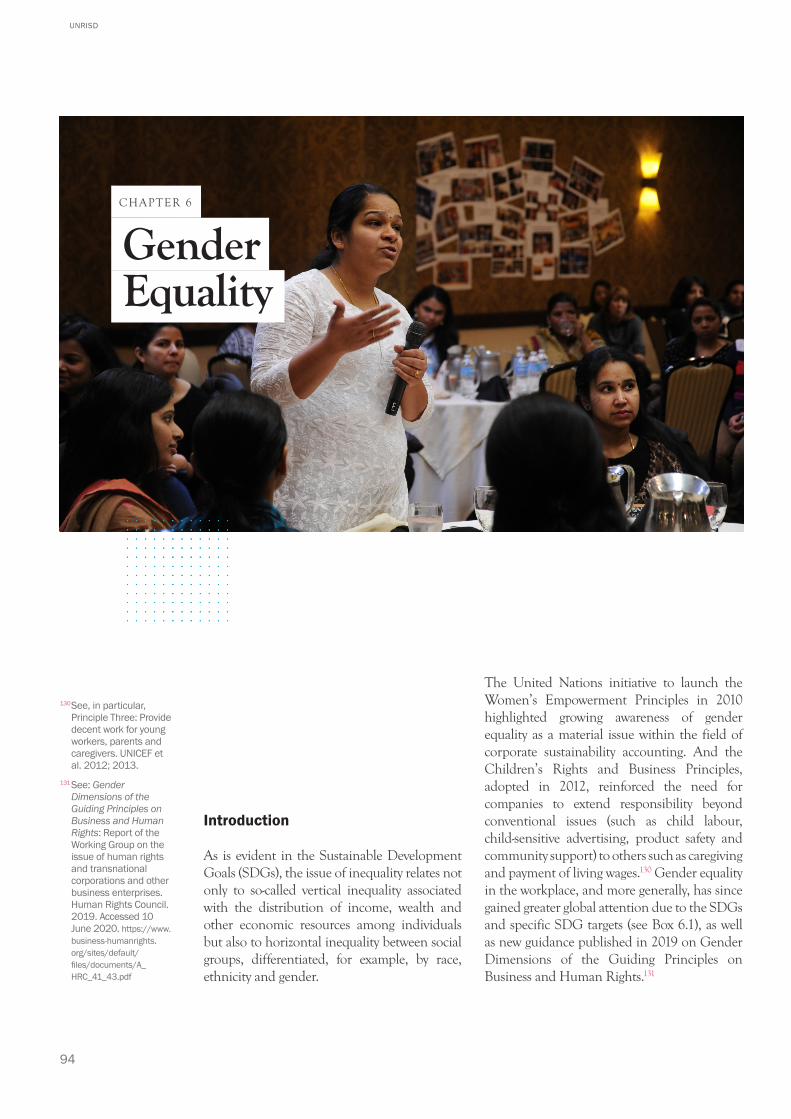
94
UNRISD
Introduction
As is evident in the Sustainable Development Goals (SDGs), the issue of inequality relates not only to so-called vertical inequality associated with the distribution of income, wealth and other economic resources among individuals but also to horizontal inequality between social groups, differentiated, for example, by race, ethnicity and gender.
The United Nations initiative to launch the Women’s Empowerment Principles in 2010 highlighted growing awareness of gender equality as a material issue within the field of corporate sustainability accounting. And the Children’s Rights and Business Principles, adopted in 2012, reinforced the need for companies to extend responsibility beyond conventional issues (such as child labour, child-sensitive advertising, product safety and community support) to others such as caregiving and payment of living wages.130 Gender equality in the workplace, and more generally, has since gained greater global attention due to the SDGs and specific SDG targets (see Box 6.1), as well as new guidance published in 2019 on Gender Dimensions of the Guiding Principles on Business and Human Rights.131
Gender Equality
CHAPTER 6
130 See, in particular, Principle Three: Provide decent work for young workers, parents and caregivers. UNICEF et al. 2012; 2013.
131 See: Gender Dimensions of the Guiding Principles on Business and Human Rights: Report of the Working Group on the issue of human rights and transnational corporations and other business enterprises. Human Rights Council. 2019. Accessed 10 June 2020. https://www.business-humanrights.org/sites/default/files/documents/A_HRC_41_43.pdf
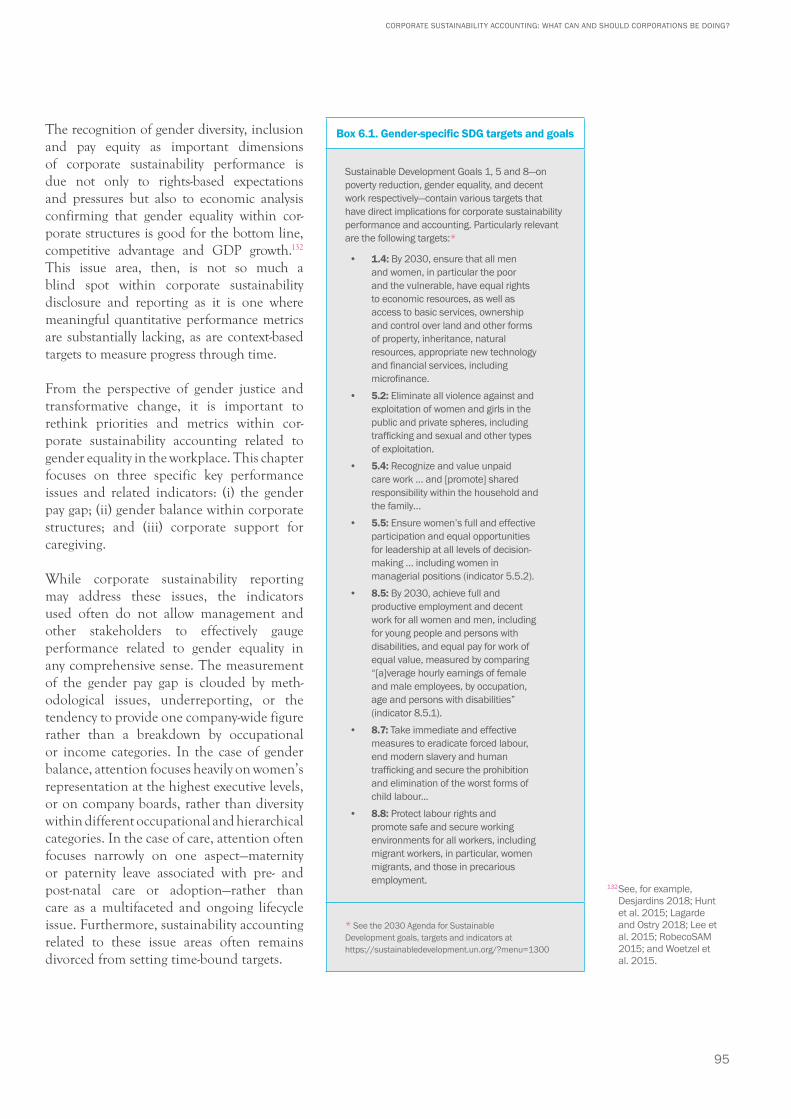
95
CORPORATE SUSTAINABILITY ACCOUNTING: WHAT CAN AND SHOULD CORPORATIONS BE DOING?
The recognition of gender diversity, inclusion and pay equity as important dimensions of corporate sustainability performance is due not only to rights-based expectations and pressures but also to economic analysis confirming that gender equality within cor-porate structures is good for the bottom line, competitive advantage and GDP growth.132 This issue area, then, is not so much a blind spot within corporate sustainability disclosure and reporting as it is one where meaningful quantitative perfor mance metrics are substantially lacking, as are context-based targets to measure progress through time.
From the perspective of gender justice and transformative change, it is important to rethink priorities and metrics within cor-porate sustainability accounting related to gender equality in the workplace. This chapter focuses on three specific key performance issues and related indicators: (i) the gender pay gap; (ii) gender balance within corporate structures; and (iii) corporate support for caregiving.
While corporate sustainability reporting may address these issues, the indicators used often do not allow management and other stakeholders to effectively gauge performance related to gender equality in any comprehensive sense. The measurement of the gender pay gap is clouded by meth-odological issues, underreporting, or the tendency to provide one company-wide figure rather than a breakdown by occupational or income categories. In the case of gender balance, attention focuses heavily on women’s representation at the highest executive levels, or on company boards, rather than diversity within different occupational and hierarchical categories. In the case of care, attention often focuses narrowly on one aspect—maternity or paternity leave associated with pre- and post-natal care or adoption—rather than care as a multifaceted and ongoing lifecycle issue. Furthermore, sustainability accounting related to these issue areas often remains divorced from setting time-bound targets.
Box 6.1. Gender-specific SDG targets and goals
Sustainable Development Goals 1, 5 and 8—on poverty reduction, gender equality, and decent work respectively—contain various targets that have direct implications for corporate sustainability performance and accounting. Particularly relevant are the following targets:*
• 1.4: By 2030, ensure that all men and women, in particular the poor and the vulnerable, have equal rights to economic resources, as well as access to basic services, ownership and control over land and other forms of property, inheritance, natural resources, appropriate new technology and financial services, including microfinance.
• 5.2: Eliminate all violence against and exploitation of women and girls in the public and private spheres, including trafficking and sexual and other types of exploitation.
• 5.4: Recognize and value unpaid care work … and [promote] shared responsibility within the household and the family…
• 5.5: Ensure women’s full and effective participation and equal opportunities for leadership at all levels of decision-making … including women in managerial positions (indicator 5.5.2).
• 8.5: By 2030, achieve full and productive employment and decent work for all women and men, including for young people and persons with disabilities, and equal pay for work of equal value, measured by comparing “[a]verage hourly earnings of female and male employees, by occupation, age and persons with disabilities” (indicator 8.5.1).
• 8.7: Take immediate and effective measures to eradicate forced labour, end modern slavery and human trafficking and secure the prohibition and elimination of the worst forms of child labour...
• 8.8: Protect labour rights and promote safe and secure working environments for all workers, including migrant workers, in particular, women migrants, and those in precarious employment.
* See the 2030 Agenda for Sustainable Development goals, targets and indicators at https://sustainabledevelopment.un.org/?menu=1300
132 See, for example, Desjardins 2018; Hunt et al. 2015; Lagarde and Ostry 2018; Lee et al. 2015; RobecoSAM 2015; and Woetzel et al. 2015.
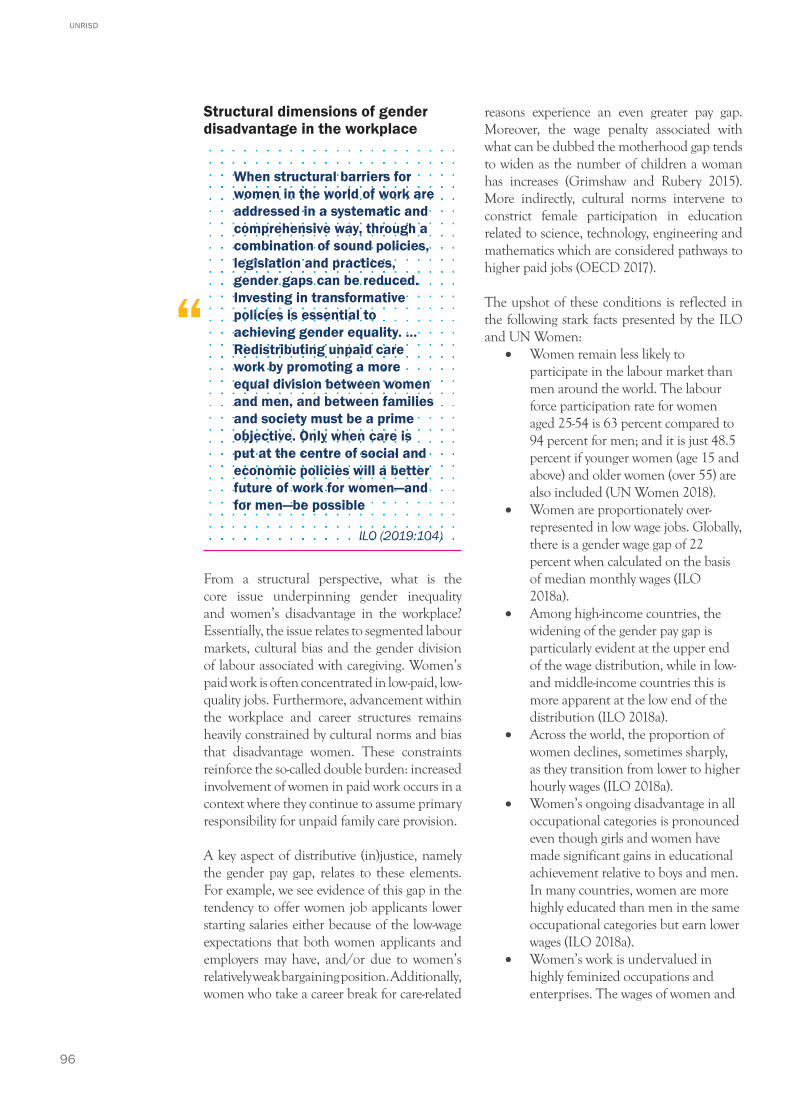
96
UNRISD
Structural dimensions of gender disadvantage in the workplace
When structural barriers for women in the world of work are addressed in a systematic and comprehensive way, through a combination of sound policies, legislation and practices, gender gaps can be reduced. Investing in transformative policies is essential to achieving gender equality. … Redistributing unpaid care work by promoting a more equal division between women and men, and between families and society must be a prime objective. Only when care is put at the centre of social and economic policies will a better future of work for women—and for men—be possible
ILO (2019:104)
From a structural perspective, what is the core issue underpinning gender inequality and women’s disadvantage in the workplace? Essentially, the issue relates to segmented labour markets, cultural bias and the gender division of labour associated with caregiving. Women’s paid work is often concentrated in low-paid, low-quality jobs. Furthermore, advancement within the workplace and career structures remains heavily constrained by cultural norms and bias that disadvantage women. These constraints reinforce the so-called double burden: increased involvement of women in paid work occurs in a context where they continue to assume primary responsibility for unpaid family care provision.
A key aspect of distributive (in)justice, namely the gender pay gap, relates to these elements. For example, we see evidence of this gap in the tendency to offer women job applicants lower starting salaries either because of the low-wage expectations that both women applicants and employers may have, and/or due to women’s relatively weak bargaining position. Additionally, women who take a career break for care-related
reasons experience an even greater pay gap. Moreover, the wage penalty associated with what can be dubbed the motherhood gap tends to widen as the number of children a woman has increases (Grimshaw and Rubery 2015). More indirectly, cultural norms intervene to constrict female participation in education related to science, technology, engineering and mathematics which are considered pathways to higher paid jobs (OECD 2017).
The upshot of these conditions is reflected in the following stark facts presented by the ILO and UN Women:
• Women remain less likely to participate in the labour market than men around the world. The labour force participation rate for women aged 25-54 is 63 percent compared to 94 percent for men; and it is just 48.5 percent if younger women (age 15 and above) and older women (over 55) are also included (UN Women 2018).
• Women are proportionately over-represented in low wage jobs. Globally, there is a gender wage gap of 22 percent when calculated on the basis of median monthly wages (ILO 2018a).
• Among high-income countries, the widening of the gender pay gap is particularly evident at the upper end of the wage distribution, while in low- and middle-income countries this is more apparent at the low end of the distribution (ILO 2018a).
• Across the world, the proportion of women declines, sometimes sharply, as they transition from lower to higher hourly wages (ILO 2018a).
• Women’s ongoing disadvantage in all occupational categories is pronounced even though girls and women have made significant gains in educational achievement relative to boys and men. In many countries, women are more highly educated than men in the same occupational categories but earn lower wages (ILO 2018a).
• Women’s work is undervalued in highly feminized occupations and enterprises. The wages of women and
“
97
CORPORATE SUSTAINABILITY ACCOUNTING: WHAT CAN AND SHOULD CORPORATIONS BE DOING?
men with similar levels of education tend to be lower in highly feminized jobs than in other occupations (ILO 2018a).
• Women bear disproportionate responsibility for unpaid care and domestic work. Women tend to spend around 2.5 times more time on unpaid care and domestic work than men. The amount of time devoted to unpaid care work is negatively correlated with female labour force participation (UN Women 2018a).
• Women are less likely to have access to social protection. Gender inequalities in employment and job quality result in gender gaps in access to social protection acquired through employment, such as pensions, unemployment benefits or maternity protection. Globally, it is estimated that nearly 40 percent of women in wage employment lack access to social protection (UN Women 2018a).
• Women are constrained from achieving the highest leadership positions. In 2019, only 6.6 percent of Fortune 500 CEOs were women.133
As noted in this chapter’s opening quotation, public policy and government regulation need to play a central role in addressing these issues. There is, however, ample room for both corporations and CSR or ESG standard-setters to measure and enhance sustainability performance in this area.
Meaningful progress related to gender diversity, pay gaps, and care—when combined with progress in other issue areas examined in Part 2—could do much to advance the cause of gender equality and achieve several of the SDG targets. Directly relevant in this regard is the question of the living wage, addressed in the previous chapter. It is important that calculations of the living wage include some provision for the cost of caregiving. Also key is collective bargaining, addressed in Chapter 8, and the representation of women and women’s interests within trade unions. As noted by the ILO:
Collective representation and social dialogue, including collective bargaining,
that embrace gender diversity are better positioned to navigate future of work transitions and to more swiftly pursue all the paths that lead to a better future for women at work. It is not a matter of “fixing” women but rather ensuring that the environment is receptive to women’s voice and that barriers are removed to allow women to participate in enterprise, national and international social dialogue processes (ILO 2018:18-19).
The notion of collective bargaining also extends to other forms of social organization and mobilization. Women workers at Amazon, for example, referred to as Momazonians, have joined together in a campaign to extend care-related benefits beyond pre- and post-natal care to back-up care for children (Soper and Greenfield 2019).
The gender pay gap
A key dimension of income inequality within corporate structures relates to the “unadjusted” gender pay gap. This is not the same as unequal pay for equal work, which is illegal in many countries.134 While measurement of the latter requires comparing the remuneration of employees doing the same work, or work requiring essentially the same skills, the former is the average remuneration of females as a percentage of that of males, measured in terms of monthly or hourly earnings. The difference between the two measures is generally significant. Measuring the median salary of men and women with the same job and qualifications, the data and compensation software company PayScale finds that women in the United States earn USD 0.98 for every dollar earned by men with the same job. This compares with USD 0.81 for the unadjusted gender pay gap (PayScale 2020).135
The unadjusted gender pay gap provides a broader measurement of gender disadvantage that can arise from sectoral or occupational gender segregation (also known as polarization), and of gender disadvantage that arises when the level of women’s remuneration and possibilities for full-time work and promotion
133 UN Women 2018, updated by author based on “Only 33 women now lead Fortune 500 companies. And that›s a record high” by Jeanne Sahadi. Accessed 20 December 2020. https://edition.cnn.com/2019/05/16/success/women-ceos-fortune-500/index.html
134 Some 86 countries have laws mandating equal remuneration for work of equal value (ILO 2019:46).
135 As the ILO points out, when measuring the gender wage gap at the country level, in “almost all countries the gender pay gap is higher when the estimate is based on monthly wages rather than hourly wages, reflecting the fact that in most countries women and men differ significantly in respect of working time—specifically, that part-time work is more prevalent among women than among men” (ILO 2018, citing Fagan et al. 2014).
98
UNRISD
are suppressed by educational disadvantage, care responsibilities, and cultural norms and bias that restrict women’s remuneration relative to that of men.136
For this reason, the pay gap figure should be unadjusted; in other words, it should not consider differences in, for instance, hours worked, experience and education. The unadjusted or raw figure, then, captures the fact that women’s lower pay may be a function of women’s employment being concentrated in relatively low-paid jobs or sectors, taking time off or working part-time given maternity and other care responsibilities, or because men are favoured in promotions and bonus pay. As a Eurostat study notes: “The unadjusted GPG [gender pay gap] is therefore a rather complex indicator. Its measurement covers both possible discrimination between men and women through ‘unequal pay for equal work’ and the differences in the average characteristics of male and female employees” (Leythienne and Ronkowski 2018:6).
Such disclosure allows stakeholders to identify variations in company performance—say, top performers versus laggards or those making incremental adjustments. This data can also provide a useful management tool, pointing, for example, to the need for more flexible working arrangements if part-time work is a significant gap factor, or to actions that encourage the promotion of women if the gap is particularly wide in senior management levels.137
The basic calculation—earnings of men minus earnings of women as a percentage of the earnings of men—may be based on mean or median average hourly or monthly earnings. The median average, however, is sometimes considered more appropriate as it prevents outliers from distorting the average and better reflects the experience of most employees.138 But as Unilever (UK) explains in its gender pay gap report, the mean can also reflect the fact that one gender, generally men, occupies the bulk of the highest paying top management positions (Unilever 2019b). It is important, therefore, for gender pay gap calculations to include not only base salary but also compensation associated with incentives and bonuses.
Mean and median calculations can provide quite different readings for the same company. In terms of hourly earnings, Unilever (UK) reports a mean gender pay gap of 8.8 percent in favour of men and a median favouring women of 2.5 percent. In terms of bonus pay, the median for women is 50.4 percent higher than that of men, while the mean for men is 37.2 percent higher than that of women.139
Furthermore, while figures are often based on the remuneration of full-time employees, factoring in part-time employees provides a broader perspective on gender inequality. For instance, in the UK the gender pay gap doubles from 9.1 percent when based on full-time employees to 18.4 percent when part-time employees are included.140
In the United States, an ADP Research Institute study found that while the entry level base salary pay gap was 82 percent between 2010 and 2016, “[t]he average bonus amount for women was less than two-thirds of the amount paid to men who had equivalent base pay, age, and tenure. This incentive pay disparity was observed across all age, salary, and industry groups from the moment of hire and persisted throughout the six-year study window” (Goldar et al. 2019:3).
According to RobecoSAM (2015:13), in 19 out of 24 industry groups the pay gap at management level was greater when taking bonuses into account: “While a gap in base pay appears to be structural and may be influenced by other factors such as the distribution of men and women in support versus profit generating roles, management incentives are more likely to be discretionary so a widening pay gap here raises the possibility that women in management roles are being consistently underrewarded”.
For the above reasons, it is important to measure the gender pay gap for the company as a whole and by different occupational and hierarchical categories. Such data, from the ADP Research Institute, are presented in Table 6.1.
Data disaggregated by multiple hierarchical or occupational categories can reveal where bottlenecks occur. It is important not to mask the scale of disadvantage in one category by conflating categories where variations may be
136 See: ILO 2018; Leythienne and Ronkowski 2018; OECD 2017; Eurofound 2010.
137 The Independent. 2019. ‘Gender pay gap: What is it and how is it different from equal pay?’ by Olivia Petter. 5 April 2019 12:00 https://www.independent.co.uk/ life-style/women/gender- pay-gap-equal-pay-women -paid-less-motherhood -a8856121.html
138 See Financial Times 2018c. The ILO points out that not only the choice of mean or median averages, but also monthly or hourly wages can significantly affect calculations of the gender wage gap: “Using these four different combinations (mean/median and hourly/monthly), the report finds that the weighted global estimates range from about 16 percent to 22 percent, depending on which measure is used. The gender pay gap of 22 percent is obtained when using median monthly wages” (ILO 2018: xv).
139 Unilever explains the difference in the following terms: “Mean figures represent the average across our whole workforce, so are particularly impacted by the highest earners in the UK business – generally senior management roles, more of which are held by men. Median figures represent the midpoint of our workforce and so are higher for women, reflecting the fact that more of our manufacturing roles are held by men, with more women in the higher paid managerial roles in this area of the business” (Unilever 2019b:4).
140 Cited in The Telegraph 2018.
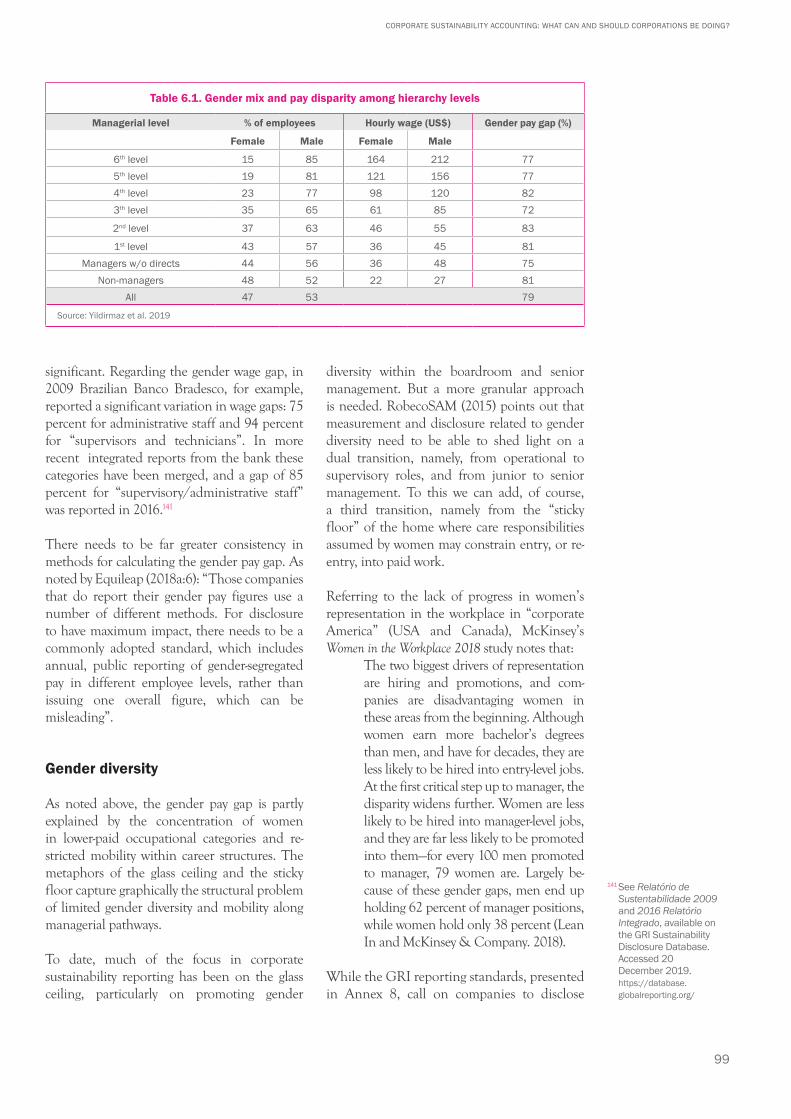
99
CORPORATE SUSTAINABILITY ACCOUNTING: WHAT CAN AND SHOULD CORPORATIONS BE DOING?
significant. Regarding the gender wage gap, in 2009 Brazilian Banco Bradesco, for example, reported a significant variation in wage gaps: 75 percent for administrative staff and 94 percent for “supervisors and technicians”. In more recent integrated reports from the bank these categories have been merged, and a gap of 85 percent for “supervisory/administrative staff” was reported in 2016.141
There needs to be far greater consistency in methods for calculating the gender pay gap. As noted by Equileap (2018a:6): “Those companies that do report their gender pay figures use a number of different methods. For disclosure to have maximum impact, there needs to be a commonly adopted standard, which includes annual, public reporting of gender-segregated pay in different employee levels, rather than issuing one overall figure, which can be misleading”.
Gender diversity
As noted above, the gender pay gap is partly explained by the concentration of women in lower-paid occupational categories and re-stricted mobility within career structures. The metaphors of the glass ceiling and the sticky floor capture graphically the structural problem of limited gender diversity and mobility along managerial pathways.
To date, much of the focus in corporate sustainability reporting has been on the glass ceiling, particularly on promoting gender
diversity within the boardroom and senior management. But a more granular approach is needed. RobecoSAM (2015) points out that measurement and disclosure related to gender diversity need to be able to shed light on a dual transition, namely, from operational to supervisory roles, and from junior to senior management. To this we can add, of course, a third transition, namely from the “sticky floor” of the home where care responsibilities assumed by women may constrain entry, or re-entry, into paid work.
Referring to the lack of progress in women’s representation in the workplace in “corporate America” (USA and Canada), McKinsey’s Women in the Workplace 2018 study notes that:
The two biggest drivers of representation are hiring and promotions, and com-panies are disadvantaging women in these areas from the beginning. Although women earn more bachelor’s degrees than men, and have for decades, they are less likely to be hired into entry-level jobs. At the first critical step up to manager, the disparity widens further. Women are less likely to be hired into manager-level jobs, and they are far less likely to be promoted into them—for every 100 men promoted to manager, 79 women are. Largely be-cause of these gender gaps, men end up holding 62 percent of manager positions, while women hold only 38 percent (Lean In and McKinsey & Company. 2018).
While the GRI reporting standards, presented in Annex 8, call on companies to disclose
Table 6.1. Gender mix and pay disparity among hierarchy levels
Managerial level % of employees Hourly wage (US$) Gender pay gap (%)
Female Male Female Male
6th level 15 85 164 212 775th level 19 81 121 156 774th level 23 77 98 120 823th level 35 65 61 85 72
2nd level 37 63 46 55 83
1st level 43 57 36 45 81Managers w/o directs 44 56 36 48 75
Non-managers 48 52 22 27 81All 47 53 79
Source: Yildirmaz et al. 2019
141 See Relatório de Sustentabilidade 2009 and 2016 Relatório Integrado, available on the GRI Sustainability Disclosure Database. Accessed 20 December 2019. https://database.globalreporting.org/
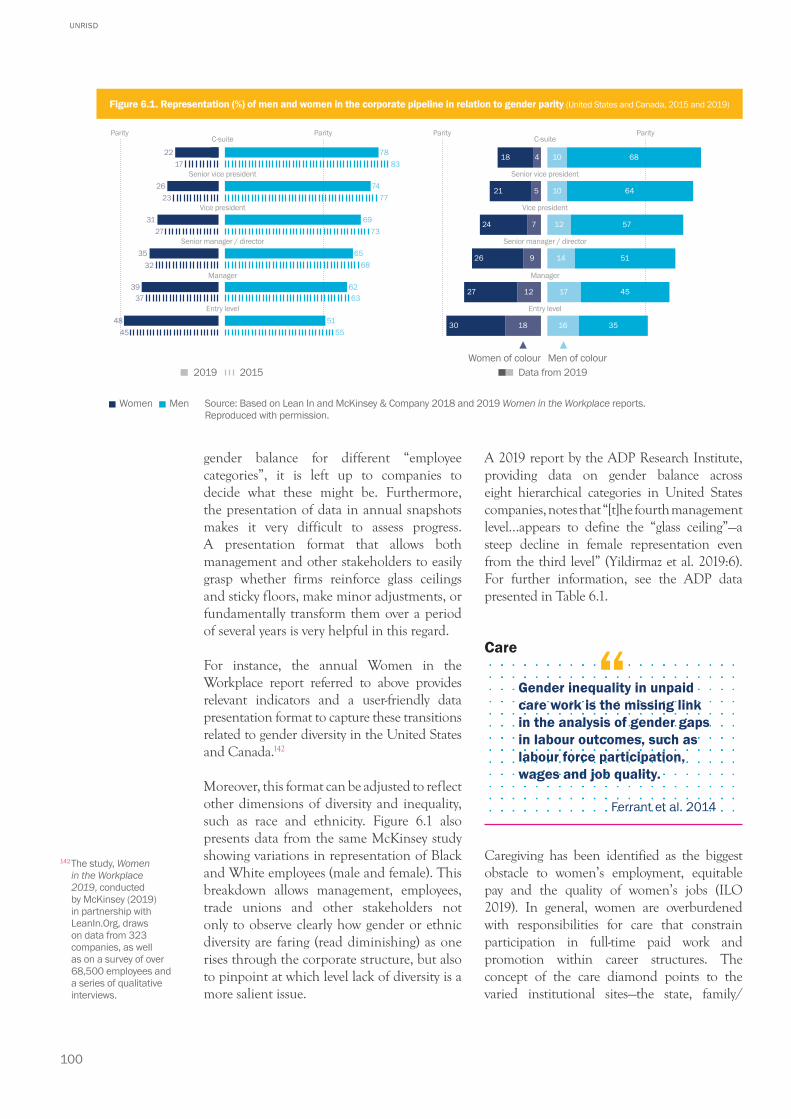
100
UNRISD
gender balance for different “employee categories”, it is left up to companies to decide what these might be. Furthermore, the presentation of data in annual snapshots makes it very difficult to assess progress. A presentation format that allows both management and other stakeholders to easily grasp whether firms reinforce glass ceilings and sticky floors, make minor adjustments, or fundamentally transform them over a period of several years is very helpful in this regard.
For instance, the annual Women in the Workplace report referred to above provides relevant indicators and a user-friendly data presentation format to capture these transitions related to gender diversity in the United States and Canada.142
Moreover, this format can be adjusted to reflect other dimensions of diversity and inequality, such as race and ethnicity. Figure 6.1 also presents data from the same McKinsey study showing variations in representation of Black and White employees (male and female). This breakdown allows management, employees, trade unions and other stakeholders not only to observe clearly how gender or ethnic diversity are faring (read diminishing) as one rises through the corporate structure, but also to pinpoint at which level lack of diversity is a more salient issue.
A 2019 report by the ADP Research Institute, providing data on gender balance across eight hierarchical categories in United States companies, notes that “[t]he fourth management level…appears to define the “glass ceiling”—a steep decline in female representation even from the third level” (Yildirmaz et al. 2019:6). For further information, see the ADP data presented in Table 6.1.
Care
Gender inequality in unpaid care work is the missing link in the analysis of gender gaps in labour outcomes, such as labour force participation, wages and job quality.
Ferrant et al. 2014
Caregiving has been identified as the biggest obstacle to women’s employment, equitable pay and the quality of women’s jobs (ILO 2019). In general, women are overburdened with responsibilities for care that constrain participation in full-time paid work and promotion within career structures. The concept of the care diamond points to the varied institutional sites—the state, family/
Figure 6.1. Representation (%) of men and women in the corporate pipeline in relation to gender parity (United States and Canada, 2015 and 2019)
18
C-suite
Senior vice president
Vice president
Senior manager / director
Manager
Entry level
Parity Parity
21
24
26
27
30
4
5
7
9
12
18
10
10
12
14
17
16
68
64
57
51
45
35
C-suite
Senior vice president
Vice president
Senior manager / director
Manager
Entry level
Parity Parity
2217
2623
3127
3532
3937
4845
7883
7477
6973
6568
6263
5155
Women of colour Men of colour2019 2015
Women Men Source: Based on Lean In and McKinsey & Company 2018 and 2019 Women in the Workplace reports. Reproduced with permission.
Data from 2019
142 The study, Women in the Workplace 2019, conducted by McKinsey (2019) in partnership with LeanIn.Org, draws on data from 323 companies, as well as on a survey of over 68,500 employees and a series of qualitative interviews.
“
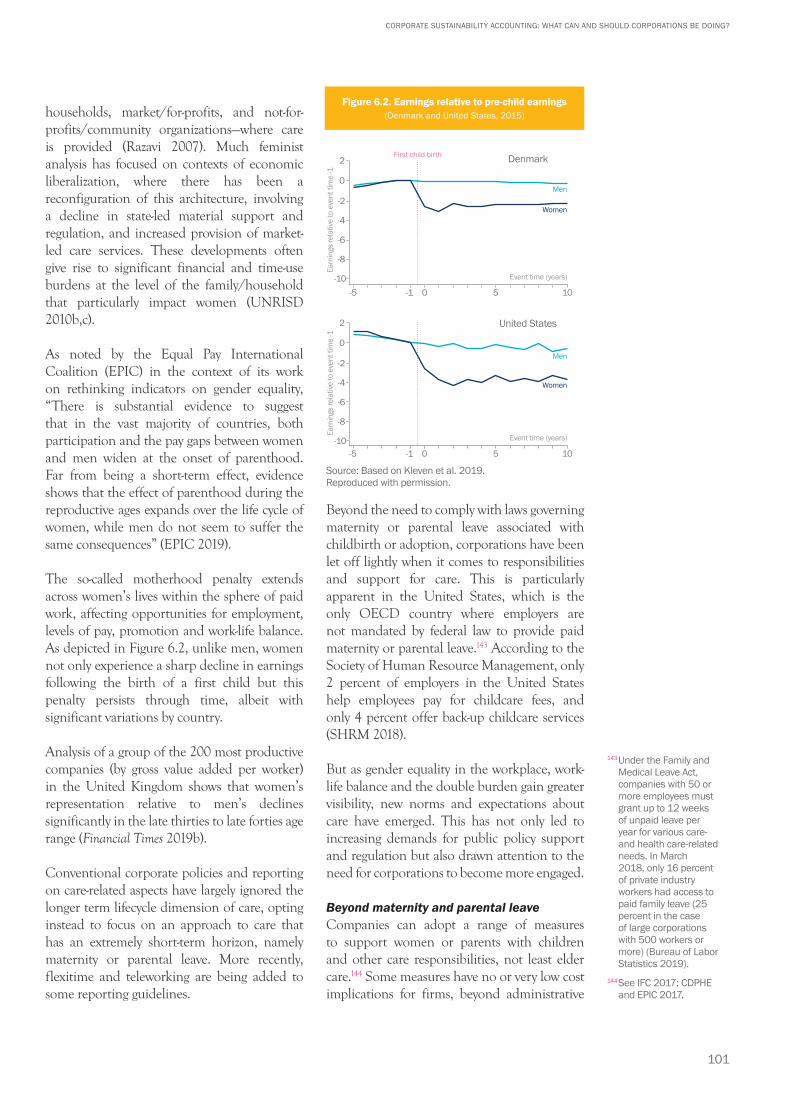
101
CORPORATE SUSTAINABILITY ACCOUNTING: WHAT CAN AND SHOULD CORPORATIONS BE DOING?
households, market/for-profits, and not-for-profits/community organizations—where care is provided (Razavi 2007). Much feminist analysis has focused on contexts of economic liberalization, where there has been a reconfiguration of this architecture, involving a decline in state-led material support and regulation, and increased provision of market-led care services. These developments often give rise to significant financial and time-use burdens at the level of the family/household that particularly impact women (UNRISD 2010b,c).
As noted by the Equal Pay International Coalition (EPIC) in the context of its work on rethinking indicators on gender equality, “There is substantial evidence to suggest that in the vast majority of countries, both participation and the pay gaps between women and men widen at the onset of parenthood. Far from being a short-term effect, evidence shows that the effect of parenthood during the reproductive ages expands over the life cycle of women, while men do not seem to suffer the same consequences” (EPIC 2019).
The so-called motherhood penalty extends across women’s lives within the sphere of paid work, affecting opportunities for employment, levels of pay, promotion and work-life balance. As depicted in Figure 6.2, unlike men, women not only experience a sharp decline in earnings following the birth of a first child but this penalty persists through time, albeit with significant variations by country.
Analysis of a group of the 200 most productive companies (by gross value added per worker) in the United Kingdom shows that women’s representation relative to men’s declines significantly in the late thirties to late forties age range (Financial Times 2019b).
Conventional corporate policies and reporting on care-related aspects have largely ignored the longer term lifecycle dimension of care, opting instead to focus on an approach to care that has an extremely short-term horizon, namely maternity or parental leave. More recently, flexitime and teleworking are being added to some reporting guidelines.
Beyond the need to comply with laws governing maternity or parental leave associated with childbirth or adoption, corporations have been let off lightly when it comes to responsibilities and support for care. This is particularly apparent in the United States, which is the only OECD country where employers are not mandated by federal law to provide paid maternity or parental leave.143 According to the Society of Human Resource Management, only 2 percent of employers in the United States help employees pay for childcare fees, and only 4 percent offer back-up childcare services (SHRM 2018).
But as gender equality in the workplace, work-life balance and the double burden gain greater visibility, new norms and expectations about care have emerged. This has not only led to increasing demands for public policy support and regulation but also drawn attention to the need for corporations to become more engaged.
Beyond maternity and parental leaveCompanies can adopt a range of measures to support women or parents with children and other care responsibilities, not least elder care.144 Some measures have no or very low cost implications for firms, beyond administrative
Source: Based on Kleven et al. 2019. Reproduced with permission.
0 5 10-5
0
2
-2
-4
-6
-8
-10
Denmark
United States
0 5 10-5
0
2
-2
-4
-6
-8
-10
First child birth
Earn
ings
rela
tive
to e
vent
tim
e -1
Earn
ings
rela
tive
to e
vent
tim
e -1
Event time (years)
Event time (years)
-1
-1
Men
Women
Men
Women
Figure 6.2. Earnings relative to pre-child earnings (Denmark and United States, 2015)
143 Under the Family and Medical Leave Act, companies with 50 or more employees must grant up to 12 weeks of unpaid leave per year for various care- and health care-related needs. In March 2018, only 16 percent of private industry workers had access to paid family leave (25 percent in the case of large corporations with 500 workers or more) (Bureau of Labor Statistics 2019).
144 See IFC 2017; CDPHE and EPIC 2017.
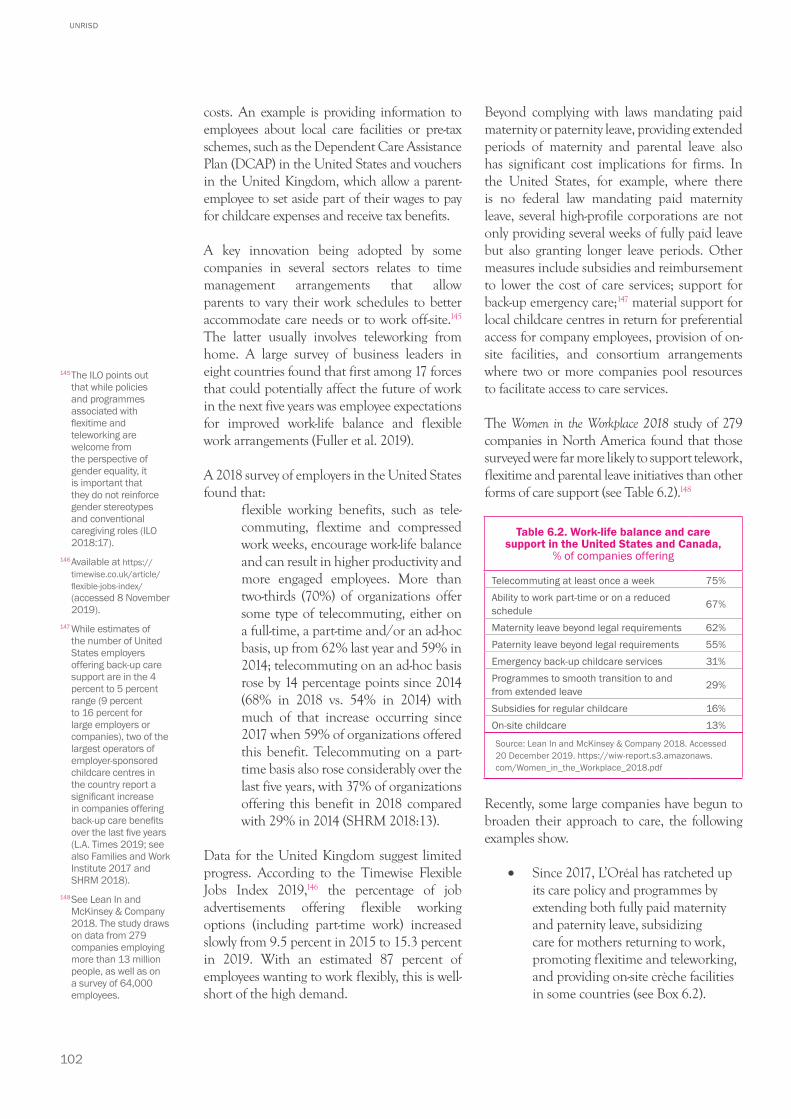
102
UNRISD
costs. An example is providing information to employees about local care facilities or pre-tax schemes, such as the Dependent Care Assistance Plan (DCAP) in the United States and vouchers in the United Kingdom, which allow a parent-employee to set aside part of their wages to pay for childcare expenses and receive tax benefits.
A key innovation being adopted by some companies in several sectors relates to time management arrangements that allow parents to vary their work schedules to better accommodate care needs or to work off-site.145 The latter usually involves teleworking from home. A large survey of business leaders in eight countries found that first among 17 forces that could potentially affect the future of work in the next five years was employee expectations for improved work-life balance and flexible work arrangements (Fuller et al. 2019).
A 2018 survey of employers in the United States found that:
flexible working benefits, such as tele-commuting, flextime and compressed work weeks, encourage work-life balance and can result in higher productivity and more engaged employees. More than two-thirds (70%) of organizations offer some type of telecommuting, either on a full-time, a part-time and/or an ad-hoc basis, up from 62% last year and 59% in 2014; telecommuting on an ad-hoc basis rose by 14 percentage points since 2014 (68% in 2018 vs. 54% in 2014) with much of that increase occurring since 2017 when 59% of organizations offered this benefit. Telecommuting on a part-time basis also rose considerably over the last five years, with 37% of organizations offering this benefit in 2018 compared with 29% in 2014 (SHRM 2018:13).
Data for the United Kingdom suggest limited progress. According to the Timewise Flexible Jobs Index 2019,146 the percentage of job advertisements offering flexible working options (including part-time work) increased slowly from 9.5 percent in 2015 to 15.3 percent in 2019. With an estimated 87 percent of employees wanting to work flexibly, this is well-short of the high demand.
Beyond complying with laws mandating paid maternity or paternity leave, providing extended periods of maternity and parental leave also has significant cost implications for firms. In the United States, for example, where there is no federal law mandating paid maternity leave, several high-profile corporations are not only providing several weeks of fully paid leave but also granting longer leave periods. Other measures include subsidies and reimbursement to lower the cost of care services; support for back-up emergency care;147 material support for local childcare centres in return for preferential access for company employees, provision of on-site facilities, and consortium arrangements where two or more companies pool resources to facilitate access to care services.
The Women in the Workplace 2018 study of 279 companies in North America found that those surveyed were far more likely to support telework, flexitime and parental leave initiatives than other forms of care support (see Table 6.2).148
Recently, some large companies have begun to broaden their approach to care, the following examples show.
• Since 2017, L’Oréal has ratcheted up its care policy and programmes by extending both fully paid maternity and paternity leave, subsidizing care for mothers returning to work, promoting flexitime and teleworking, and providing on-site crèche facilities in some countries (see Box 6.2).
Table 6.2. Work-life balance and care support in the United States and Canada,
% of companies offering
Telecommuting at least once a week 75%Ability to work part-time or on a reduced schedule 67%
Maternity leave beyond legal requirements 62%Paternity leave beyond legal requirements 55%Emergency back-up childcare services 31%Programmes to smooth transition to and from extended leave 29%
Subsidies for regular childcare 16%On-site childcare 13%
Source: Lean In and McKinsey & Company 2018. Accessed 20 December 2019. https://wiw-report.s3.amazonaws.com/Women_in_the_Workplace_2018.pdf
145 The ILO points out that while policies and programmes associated with flexitime and teleworking are welcome from the perspective of gender equality, it is important that they do not reinforce gender stereotypes and conventional caregiving roles (ILO 2018:17).
146 Available at https://timewise.co.uk/article/flexible-jobs-index/ (accessed 8 November 2019).
147 While estimates of the number of United States employers offering back-up care support are in the 4 percent to 5 percent range (9 percent to 16 percent for large employers or companies), two of the largest operators of employer-sponsored childcare centres in the country report a significant increase in companies offering back-up care benefits over the last five years (L.A. Times 2019; see also Families and Work Institute 2017 and SHRM 2018).
148 See Lean In and McKinsey & Company 2018. The study draws on data from 279 companies employing more than 13 million people, as well as on a survey of 64,000 employees.
103
CORPORATE SUSTAINABILITY ACCOUNTING: WHAT CAN AND SHOULD CORPORATIONS BE DOING?
• In 2017, Italian oil and gas multinational Eni launched a pilot Smart Working project on new parenthood which allows both female and male parents to work outside their usual company site of work for two days per week.
• In 2015, Microsoft extended fully paid parental leave for United States employees to 20 weeks (eight weeks of maternity leave plus 12 weeks of parental leave). In 2019, the company extended its subsidized back-up childcare and elder care support for United States employees from 100 to 150 hours.149
• In 2019, Target announced it would expand the package of measures for its 350,000 employees to include up to four weeks of paid time off to care for newborns or sick family members, and 20 days of in-centre childcare or in-home back-up childcare or elder care. These measures apply to both full-time and part-time employees.150
Anecdotal evidence, however, does not confirm a trend. In national or subnational contexts where corporate care policy is not being propelled by government regulation, corporate action in this area may be confined to a fairly narrow set of firms and sectors. In the United States, for example, it is often the large tech, retail and professional services corporations that have taken the lead, responding partly to the changing cultural (millennial) composition of the workforce and/or the tightening of labour markets.
But progress, more generally, has been limited—as indicated by the US 2016 National Study of Employers:
Overall, when we look at the workplace flexibility and employee policy landscape for the nation today, we see trends that do not support the recent high profile announcements of expanded paid parental leave benefits by Netflix, Amazon, Microsoft, Johnson & Johnson, Ernst & Young and a few others. Though there has been a small increase in the proportion of employers allowing (at least some) employees to return to work
gradually after childbirth or adoption and to have special consideration after a career break for personal/family responsibilities, we find that the average maximum number of weeks of parental and caregiving leaves did not change significantly between 2012 and 2016. The highest estimates for all four types of leave were back in 2005 when the economy was still strong! (Matos et al. 2017:5).
This study indicates that a limited level of support has been provided by employers for (i) worksite related childcare (7 percent of sample;
Box 6.2. Ratcheting up care at L’Oréal
The French cosmetics corporation L’Oréal has gradually extended its care cover. In 2013, it launched the L’Oréal Share and Care programme, which mandated all of the group’s subsidiaries to provide a set of benefits related to welfare (financial support in the event of an unexpected life accident); health care (access to full medical cover or health check-ups), maternity leave (fully paid for a minimum of 14 weeks) and quality of life at work. Implementation of a second phase, initiated in 2017 and due to last until 2020, expanded the benefits to include a minimum of 10 days fully paid paternity leave and development of flexitime, “smart work” and teleworking. In Central America and Argentina, the L’Oréal Mama scheme provides additional benefits associated with care. Beyond complying with mandatory maternity leave of 105 days, the company now provides 15 additional days at full pay, allows shorter working hours each week for returning mothers compensated at the full rate, and provides a monthly contribution toward the cost of childcare in a nursery or kindergarten for children up to three years of age. In Argentina, this amounted to between 1,300 and 2,300 pesos per month (approximately USD 75 to 135) when the scheme was introduced, at a time when the monthly minimum wage was 8,060 pesos (or about USD 474). In several other developing countries, such as India, L’Oréal has also established on-site childcare facilities. Additional measures are planned for 2020. According to a study by Sekerler and Gem published by the ILO, “L’Oréal subsidiaries in different countries had witnessed improvements in various social protection benefits, for example maternity leave went up to 14 weeks in 42 percent of the countries where L’Oréal is present”. As a result of the study, “L’Oréal is planning to implement new indicators including the number of employees and firms affected by various features of the program”.
Source: L’Oréal 2018, 2019; ILO 2017c; Sekerler and Gem 2019:34, 23.
149 See Microsoft entry at https://fairygodboss.com/company-benefits/microsoft
150 See Quartz at Work 2019.
104
UNRISD
20 percent of large employers); (ii) vouchers or subsidies (2 percent of sample; 8 percent of large employers); and (iii) back-up or emergency care (5 percent of sample; 9 percent of large employers). Only in the case of back-up care had employer support increased since 2012 (from 3 to 5 percent). The study also found evidence of limited organizational support for flexible working arrangements: no change in the culture of flexibility was found between 2012 and 2016, and there was some evidence of a decline in employer support since 2005.
Between 2012 and 2016, only three forms of flexibility (out of 18 options) showed a significant increase:
• employers allowing (at least some) employees to return to work gradually after childbirth or adoption (73 percent in 2012, 81 percent in 2016);
• employers allowing (at least some) employees to receive special consideration after a career break for personal/family responsibilities (21 percent in 2012, 28 percent in 2016);
• employers allowing (at least some) employees to work some of their regular paid hours at home on a regular basis (33 percent in 2012, 40 percent in 2016).
In several countries, the regulatory environment is moving in a care-friendly direction. This is particularly apparent in some countries of the European Union. Approved in June 2019, the Directive on Work-Life Balance for Parents and Carers is the latest in a series of regulations and guidance addressing the issue of gender equality.151 The Directive supports “carers’ leave”, described as “a new concept at EU level for workers caring for relatives in need of care or support due to serious medical reasons. Carers will be able to take 5 working days per year. Member states may use a different reference period, allocate leave on a case-by-case basis, and may introduce additional conditions for the exercise of this right”. The Directive also promotes paternity leave (at least 10 working days of paid leave); parental leave (four months, with pay level to be determined by member
states); and flexible working arrangements not only for parents but other “working carers” (European Council 2019).
Pressures for regulatory action related to care are not confined to wealthier countries. Several developing countries have passed laws extending paid leave and requiring employers over a certain size to provide on-site childcare facilities. In India, for example, the Maternity Benefit Act was amended in 2017 to extend paid leave from 12 to 26 weeks in organizations employing 10 or more workers, and to oblige employers with 50 or more workers to provide on-site or nearby care facilities for children under six years of age.152 Similarly, in El Salvador the 2018 Special Law for the Regulation and Installation of Childcare Centers obliges employers with over 100 employees to provide nursery facilities for workers’ children up to three years of age, starting in 2020 (FLA 2018).
Regulations, however, often take a long time to be implemented. In some countries, low implementation rates are a major problem. The Republic of Korea, for example, mandates a comprehensive set of care-related measures. Apart from maternity and pregnancy leave, however, relatively few companies comply. A survey of 1,000 businesses in 2013 found the following implementation rates for policies relating to paternity leave (19.4 percent), working hour reduction for childcare (8.4 percent), flexible working hours (12.5 percent), and workplace childcare centres (39.1 percent) (Yoo and Oh 2017).
Implementation of care-related regulations now emerging in several countries can be slow. In the case of the EU, member states have up to three years just to prepare the legal and administrative basis for compliance. Similarly, in India uptake and implementation of the amended Maternity Benefit Act has been sluggish, pending the required regulatory action at the state level and due to a lack of clarity as to the cost implications for employers.153 In such contexts, there is much that corporations committed to sustainability principles and performance can do to take the lead.
151 In addition to the EU Directive on non-financial and diversity reporting discussed in Part 1 and Annex 1, in 2014 the European Commission issued a Recommendation on strengthening the principle of equal pay between men and women through transparency. It confirmed “increasing female labour-market participation and the equal economic independence of women and men; reducing the gender pay, earnings and pension gaps and thus fighting poverty among women; and promoting equality between women and men in decision-making” as three of five priority areas in the document, Strategic Engagement for Gender Equality 2016–2019. This was followed by the 2017 EU Action Plan aimed at tackling the gender pay gap. The Plan identifies eight main strands of action: improving the application of the equal pay principle; combating segregation in occupations and sectors; breaking the glass ceiling: initiatives to combat vertical segregation; tackling the care penalty; better valorizing women›s skills, efforts and responsibilities; uncovering inequalities and stereotypes (“fighting the fog”); alerting and informing about the gender pay gap; and enhancing partnerships to tackle the gender pay gap (European Commission 2016, 2017a).
152 See The Gazette of India, 28 March 2018. https://labour.gov.in/sites/default/files/Maternity%20Benefit%20Amendment%20Act%2C2017%20.pdf
153 See Pathak et al. 2018; Gupta 2018.
105
CORPORATE SUSTAINABILITY ACCOUNTING: WHAT CAN AND SHOULD CORPORATIONS BE DOING?
Unlike those for gender diversity and the gender pay gap, quantitative metrics related to care as a multifaceted issue are severely underdeveloped. Under current reporting guidance issued by GRI and IRIS, the measurement of care-related aspects is largely restricted to maternity and parental leave associated with childbirth or adoption (see Annex 8).154 Corporate best practice typically relates to whether the company goes beyond the time requirements stipulated in law and/or extends leave benefits also to male employees, as well as return and retention rates for employees that have taken parental leave.
When other aspects of care support are reported by companies, there is a tendency to refer to qualitative indictors related to policy intent, the existence of programmes, and tick-box “yes” or “no” answers. To rate companies on diversity and inclusiveness, some tools look no further than whether the company “claim[s] to provide day care services for its employees”; and “claim[s] to provide flexible working hours or working hours that promote a work-life balance” (Thomson Reuters 2018:10).
Bloomberg’s Gender Reporting Framework aims to assess whether such options are available for most employees. Companies are asked the following:
• In markets where this benefit is not covered by government programmes, does the company provide: (i) back-up childcare services or childcare subsidies or (ii) back-up elder care services or elder care subsidies?
• Does the company offer an option to control and/or vary the start or end times of the workday or workweek (for example, flextime) to at least 80 percent of its global employee base?
• Does the company offer an option to control and/or vary the location where employees work (for example, telecommuting or work from home) to at least 80 percent of its global employee base? (Bloomberg 2020:5-6)
But metrics associated with policy intent and the existence of programmes tell us little about the impact of corporate policy on diminishing
the double burden and enhancing work-life balance. Given the centrality of care in explaining gender inequality and women’s disadvantage in the workplace, there is a pressing need to develop quantitative indicators related to care support other than those related to maternity or parental leave and flexitime. To gauge the performance of companies in the care domain, it is important to know something about the scale of support in terms of all or some combination of the following: (i) numbers of beneficiaries; (ii) tangible financial benefits; and (iii) the extent of flexibility in time use.
Regarding the numbers of beneficiaries, one approach would be to extend GRI indicators related to parental leave to care more generally. Regarding parental leave, the GRI specifies the following indicators under its 401-3 standard:
• Total number of employees that were entitled to parental leave, by gender.
• Total number of employees that took parental leave, by gender.
Assessing the care needs of employees in relation to, say, pre-kindergarten, pre-teen and elder care would establish a baseline of the potential universe of employees with significant care responsibilities.155 From there it would be possible to measure (i) the number and proportion of employees entitled to care support under existing company policies and programmes, and (ii) the number of employees who actually take advantage of such support. This, in turn, would shed light on the scale of benefits that may exist on paper but are not taken up by employees.
Family-friendly policies are sometimes referred to as “ghost benefits” given situations in which few employees actually use the benefits (Financial Times 2019b). Referring to the situation of senior female executives in corporate America, and the fact that high-profile tech companies like to publicize their offers of better-paid parental leave, Anne-Marie Slaughter contends: “I still think the question is, do they walk the talk? I mean my first question in any of those companies is, ‘Okay, and how many senior executives have actually taken advantage of these policies?’ Because unless they say ‘many’, or at least ‘some’, it’s not real”.156
154 In 2016, IRIS introduced a new metric on flexible work arrangements, asking organizations to report on whether they offer such arrangements to full-time, part-time, or temporary employees, and to footnote details of the flexible arrangements offered and the uptake of them.
155 As has been noted in relation to elder care, the assessment of care needs can also factor in the intensity of responsibilities, distinguishing different levels of need depending on personal or family circumstances.
156 See interview with Anne-Marie Slaughter about her book Unfinished Business: Women, Men, Work, Family (Random House, 2015) in Business Insider, 15 October 2015. https://www.business insider.com/anne-marie-slaughter-unfinished-business-2015-10
106
UNRISD
Regarding financial support, it would be beneficial to quantify gross and per beneficiary company spending on (i) maternity and paternity leave beyond the mandatory minimum, (ii) care-related subsidies, (iii) back-up care support, and (iv) actual childcare services provided by the company. Concerning time use and locational advantages associated with flexitime and teleworking, it would likewise be useful to know the number and proportion of employees taking advantage of this support, say, per week or month.
Unfortunately, there is a dearth of publicly available financial information on company investment and expenditure on corporate care. Such information may not be available even in-house. Referring to a study of what CEOs require from diversity officers, Edward Hubbard notes that corporate heads “want to see the impact and ROI of their diversity investments but instead receive only activity and satisfaction data” (Hubbard 2017).
Return on investment (ROI) or value of investment (VOI) calculations related to corporate care support are likely to become more commonplace not only as corporations come under increasing pressure to provide support but also in the context of mounting evidence that costing of both tangible and intangible benefits157 is likely to yield positive returns. Chase Manhattan Bank (now JP Morgan Chase), for example, found that while the annual cost of back-up care in 2010 was USD 1.13 million, such care generated USD 1.26 million in net savings and a ROI of approximately 110 percent (Cascio and Boudreau 2011:180). Patagonia, which provides on-site childcare at certain sites, has estimated that this costs an estimated USD 1 million a year, most of which is recoverable.158 For the purposes of transformative sustainability accounting, it is critical that companies begin systematically to calculate care-related investment and expenditure related to both childcare and elder care.
Transparency as a driver of change
Disclosure related to gender equality remains one of the weakest areas of sustainability reporting. As noted earlier, data are often skewed towards very partial aspects (for example, the percentage of women on boards, sexual harassment) or metrics of limited or questionable relevance (such as unconscious gender bias training), or such data are simply not reported.
Reporting standards, like those of the GRI, call for disclosure on the gender pay gap disaggregated by employee category:
GRI 405: Diversity and Equal Opportunity—Disclosure 405-2: Ratio of the basic salary and remuneration of women to men.
a. Ratio of the basic salary and remuneration of women to men for each employee category, by significant locations of operation. b. The definition used for ‘significant locations of operation’.
As RobecoSAM (2015) points out, however, such data are often not disclosed. As in the case of other issues examined in Part 2 of this report, such as corporate taxation (Chapter 7) and corporate political influence (Chapter 9), this implies that the first step within corporate sustainability performance accounting is to insist on transparency.
Transparency is a crucial driver of change. It not only allows management and stakeholders to identify the extent and nature of problems related to gender equality and areas for action; it also assists firms concerned with reputation and risk management. Companies projecting themselves as CSR adherents, or even sustainability leaders, may suddenly observe a clear gap between their discourse and performance. And by being in the spotlight, these and other firms can become targets of stakeholders concerned with inequality, ethical performance or risk management.
In what is reportedly the first empirical study of the impact of mandatory wage disclosure on the gender wage gap, gender diversity and
157 Tangible benefits which are captured in ROI include cost savings and/or productivity and efficiency gains associated with the retention of skilled employees, the costs of hiring and training new employees when former employees leave, and absenteeism. Intangible benefits that feature in VOI include improved morale, focus, commitment and well-being in the workplace; innovation associated with female leadership roles and gender balanced teams; and enhanced corporate reputation that attracts qualified employees and facilitates access to markets (Care.com 2019; EHS Today 2016; IFC 2017).
158 The company has also estimated that it recovers 91 percent of calculable costs via tax benefits, employee retention and “employee engagement” related to job satisfaction, not factoring in various intangible benefits (Macario 2016).
107
CORPORATE SUSTAINABILITY ACCOUNTING: WHAT CAN AND SHOULD CORPORATIONS BE DOING?
the economic performance of relatively small enterprises, Bennedsen et al. (2018) find that in Denmark:
disclosing disparities in gender pay does in fact narrow the gender wage gap. It also can increase the number of women being hired, indicating that the supply pool of female employees increases as gender pay transparency improves; increase the number of female employees being promoted from the bottom of the hierarchy to more senior positions; [and] lower companies’ overall wage bills, largely by slowing down the growth of male wages.159
Equileap draws a connection between legislation mandating transparency about pay gaps and the best performing companies, that is, those achieving a mean overall gender pay gap of less than or equal to 3 percent. While only 27 large corporations of a sample of 1,107 did so, 41 percent are located in the UK where disclosure is mandatory (Equileap 2018a:14).160 The regulatory tide appears to be moving in the direction of greater openness. Beyond ESG reporting standards, a variety of government regulations, shareholder resolutions, ratings initiatives and indexes tailored for investors are all calling for transparency.
Great Britain and France, for example, introduced legislation in 2017 and 2018, respectively, obliging companies over a certain size to report publicly on the gender pay gap. A ruling by the United States Equal Employment Opportunity Commission in 2016 required companies with more than 100 employees to report to the government on pay gaps related to gender, race and ethnicity.161
Germany (2017) and Spain (2019) mandated another approach that gives employees and/or worker representatives the right to know the remuneration of comparable employees.
Pressures are also building on companies to provide a breakdown by category of employee rather than just reporting a global corporate average figure. This may be hierarchical, along the lines presented in Table 6.1 above, and include entry level or operational level, junior management, senior management and C-suite.
The French law also offers the option of a socio-economic classification such as workers, employees, technicians/supervisors, engineers/executives. Furthermore, it mandates that either the hierarchical or socioeconomic data be arranged by age groups (under 30, 30-39, 40-49, and 50 plus).
In addition to data related to a company’s global mean and median raw (that is, un-adjusted) gender pay gap, Bloomberg proposes classification based on income quartiles, as does the UK government:
Measure the number of women in your pay quartiles by stacking all full-time employees globally from highest to lowest compensation and dividing into four equal quartiles. Compensation should include base salary, bonus, stock, and any other monetary benefit(s).(a) What is the company’s proportion of women in the top pay quartile globally?(b) What is the company’s proportion of women in the upper middle pay quartile globally?(c) What is the company’s proportion of women in the lower middle pay quartile globally?(d) What is the company’s proportion of women in the lower pay quartile globally? (Bloomberg 2020:4).
Employers in Great Britain with over 250 employees must report (i) the mean and median gender pay gaps, (ii) the mean and median bonus gender pay gaps, (iii) the proportion of males and females receiving a bonus payment, and (iv) the proportion of males and females in each quartile band (ACAS and Government Equalities Office 2019). Published data show that the percentage share of total female employees in the lowest pay quartile typically exceeds that of men, whereas the percentage share of men in the top quartile is greater than that of women (Financial Times 2018c).
Regarding transparency related to care, the challenge is particularly acute since companies rarely generate and publicly report basic data required to assess performance in quantitative terms. Data could include the number of
159 The study found that the gender pay gap in firms that were obliged to report declined by 7 percent between 2003 and 2008. It also found that these firms experienced a 2.5 percent decline in productivity relative to the control group comprising non-reporting firms. The negative effect on net income, however, was compensated by savings on male wages (Bennedsen et al. 2018).
160 Equileap maintains a database on over 3,000 publicly listed companies with a market capitalization of over USD 2 billion in 23 countries and tracks their gender balance and commitment to gender equity (Equileap 2018b).
161 While the ruling was blocked by the Trump Administration, this decision is, at the time of writing, being challenged in court. See Bloomberg, 6 March 2019. “U.S. companies may have to report gender pay data by end of May,” at https://www.pionline.com/article/20190306/ONLINE/190309911/u-s-companies-may-have-to-report-gender-pay-data-by-end-of-may
108
UNRISD
employees with care responsibilities, both in relation to childcare and elder care; the number of employees entitled to care support under company policies and programmes; the number of actual beneficiaries; and the level of financial support involved per beneficiary.
Targets
Transparency related to public reporting of relevant performance metrics is just the first step in sustainability accounting. There are mounting pressures on large employers not only to disclose but also to explain differences related to gender imbalance, the pay gap and lack of progress, and to adopt action plans and set targets. While companies increasingly report gender equality data, many fail to combine this information with time-bound target-driven plans and programmes. Even among a group of signatory corporations to the UN Women’s Empowerment Principles that were assessed in 2018, only 30 percent set time-bound, measurable goals and targets in their strategies, while just 15 percent set goals to build the pipeline of women for management positions (UN Global Compact et al. 2018).
When assessing the response to legislation mandating public disclosure, the UK Human Rights Commission found that while one in five employers in the sample “had produced an identifiable action plan that was time-bound and included target-driven activities, only 11% had set themselves targets that would enable them to measure the progress of their plans year-on-year” (EHRC 2018:5). And when presented, action plans “in many cases…made a general reference to activities they would undertake, such as ‘reviewing flexible working policies’, without stating when they might do this or, in some cases, their purpose for doing so”. Among those that did set targets was a construction company that aimed to increase the number of women earning over GBP 40,000 a year to at least 25 percent by 2025, and an entertainment firm that committed to ensuring that women would represent 30 percent of their senior management and that the gender pay gap would be reduced to less than 10 percent by 2020.
The experience of publicly mandated disclosure of the gender pay gap in Great Britain and France reveals not only that companies may provide inaccurate and misleading data,162 but also the need for explanatory narrative reports and action plans, including “explicit reference to time-bound and target-driven activities based on best practice policy and practice [sic], as outlined in our strategy to close pay gaps” (EHRC 2018:4). In this regard, France has recently mandated a more rigorous approach to disclosure and proof of progress (Le Roux and Kim 2019). Similarly, Bloomberg’s Gender Equality Index, launched in 2018, asks companies not only to report on whether they publicly disclose quantitative gender pay gap statistics for the global workforce, but also whether they publicly share a specific, time-bound action plan to close the gender pay gap (Bloomberg 2020:4).163
There are different reference points or benchmarks that might guide corporate sustainability performance and accounting related to gender balance and the pay gap. From the perspective of sustainable development—when understood in terms of thresholds and fair allocations associated with thriving, justice and equality—the ultimate target for the gender pay gap would presumably be zero. Whether this can be achieved, however, depends on equal gender representation, particularly in more senior occupational categories. Where this does not occur, something like the Equileap criterion for “best performing companies” could be considered, namely a pay gap equal to or less than 3 percent. Rapid convergence, measured by the annual percentage decrease in the pay gap, would be an indicator of meaningful progress.
As regards gender diversity, there are two ways of thinking about targets from an aspirational perspective associated with thriving. One would be to assume that the appropriate target for gender balance should be determined by demographic balance, that is, 50-50. Another would be to adjust this figure based on the type of analysis found in the capability approach of Amartya Sen (see Chapter 3 and Annex 6), where well-being is seen as the outcome of people realizing their choices. From this
162 See The Guardian. 2019. “Lack of sanctions makes a mockery’ of gender pay gap reports.” Posted 28 February. https://www.theguardian.com/society/2019/feb/28/lack-of-sanctions-makes-a-mockery-of-gender-pay-gap-reports
163 The Index aims to track the performance of large corporations committed to transparency. Companies include those “scored at or above a global threshold established by Bloomberg to reflect disclosure and the achievement or adoption of best-in-class statistics and policies.” Bloomberg. 2018. The 2019 Index included 230 companies headquartered in 36 countries. Eligibility for inclusion in the Index increased to 6,000 public companies in 84 countries in 2020. (Bloomberg, 2019d).
’
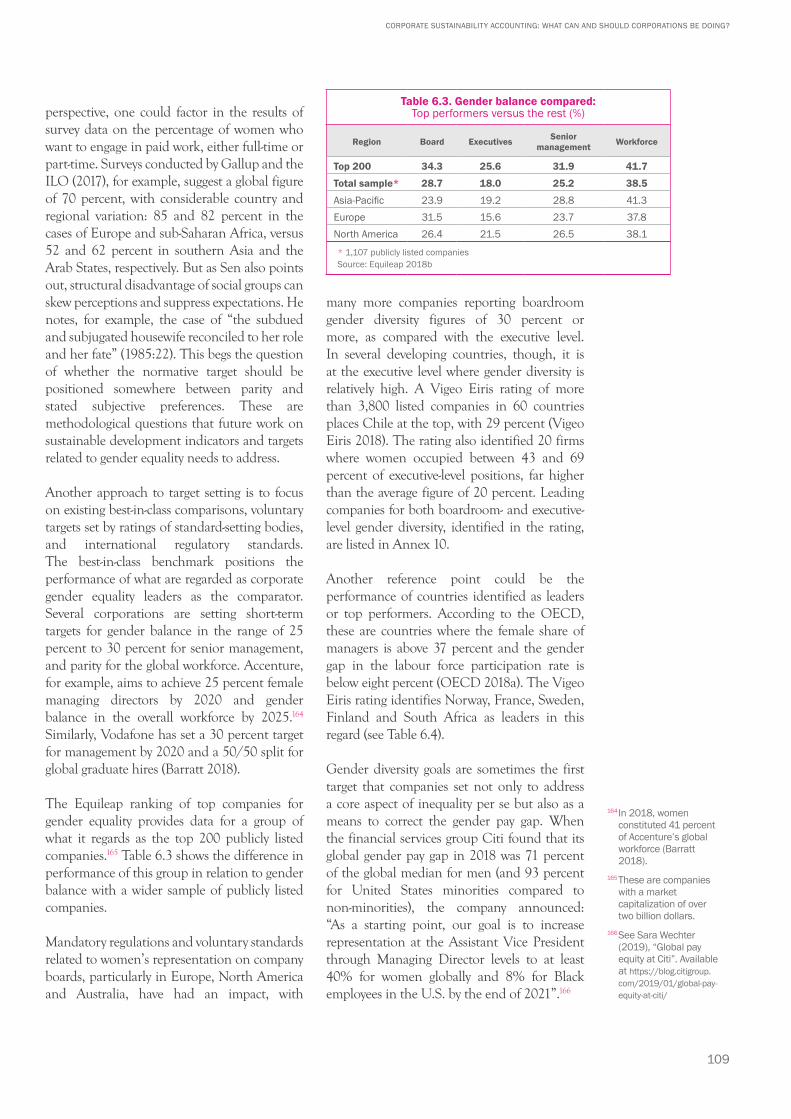
109
CORPORATE SUSTAINABILITY ACCOUNTING: WHAT CAN AND SHOULD CORPORATIONS BE DOING?
perspective, one could factor in the results of survey data on the percentage of women who want to engage in paid work, either full-time or part-time. Surveys conducted by Gallup and the ILO (2017), for example, suggest a global figure of 70 percent, with considerable country and regional variation: 85 and 82 percent in the cases of Europe and sub-Saharan Africa, versus 52 and 62 percent in southern Asia and the Arab States, respectively. But as Sen also points out, structural disadvantage of social groups can skew perceptions and suppress expectations. He notes, for example, the case of “the subdued and subjugated housewife reconciled to her role and her fate” (1985:22). This begs the question of whether the normative target should be positioned somewhere between parity and stated subjective preferences. These are methodological questions that future work on sustainable development indicators and targets related to gender equality needs to address.
Another approach to target setting is to focus on existing best-in-class comparisons, voluntary targets set by ratings of standard-setting bodies, and international regulatory standards. The best-in-class benchmark positions the performance of what are regarded as corporate gender equality leaders as the comparator. Several corporations are setting short-term targets for gender balance in the range of 25 percent to 30 percent for senior management, and parity for the global workforce. Accenture, for example, aims to achieve 25 percent female managing directors by 2020 and gender balance in the overall workforce by 2025.164 Similarly, Vodafone has set a 30 percent target for management by 2020 and a 50/50 split for global graduate hires (Barratt 2018).
The Equileap ranking of top companies for gender equality provides data for a group of what it regards as the top 200 publicly listed companies.165 Table 6.3 shows the difference in performance of this group in relation to gender balance with a wider sample of publicly listed companies.
Mandatory regulations and voluntary standards related to women’s representation on company boards, particularly in Europe, North America and Australia, have had an impact, with
many more companies reporting boardroom gender diversity figures of 30 percent or more, as compared with the executive level. In several developing countries, though, it is at the executive level where gender diversity is relatively high. A Vigeo Eiris rating of more than 3,800 listed companies in 60 countries places Chile at the top, with 29 percent (Vigeo Eiris 2018). The rating also identified 20 firms where women occupied between 43 and 69 percent of executive-level positions, far higher than the average figure of 20 percent. Leading companies for both boardroom- and executive-level gender diversity, identified in the rating, are listed in Annex 10.
Another reference point could be the performance of countries identified as leaders or top performers. According to the OECD, these are countries where the female share of managers is above 37 percent and the gender gap in the labour force participation rate is below eight percent (OECD 2018a). The Vigeo Eiris rating identifies Norway, France, Sweden, Finland and South Africa as leaders in this regard (see Table 6.4).
Gender diversity goals are sometimes the first target that companies set not only to address a core aspect of inequality per se but also as a means to correct the gender pay gap. When the financial services group Citi found that its global gender pay gap in 2018 was 71 percent of the global median for men (and 93 percent for United States minorities compared to non-minorities), the company announced: “As a starting point, our goal is to increase representation at the Assistant Vice President through Managing Director levels to at least 40% for women globally and 8% for Black employees in the U.S. by the end of 2021”.166
Table 6.3. Gender balance compared: Top performers versus the rest (%)
Region Board Executives Senior management Workforce
Top 200 34.3 25.6 31.9 41.7
Total sample* 28.7 18.0 25.2 38.5
Asia-Pacific 23.9 19.2 28.8 41.3Europe 31.5 15.6 23.7 37.8North America 26.4 21.5 26.5 38.1
* 1,107 publicly listed companiesSource: Equileap 2018b
164 In 2018, women constituted 41 percent of Accenture’s global workforce (Barratt 2018).
165 These are companies with a market capitalization of over two billion dollars.
166 See Sara Wechter (2019), “Global pay equity at Citi”. Available at https://blog.citigroup.com/2019/01/global-pay-equity-at-citi/
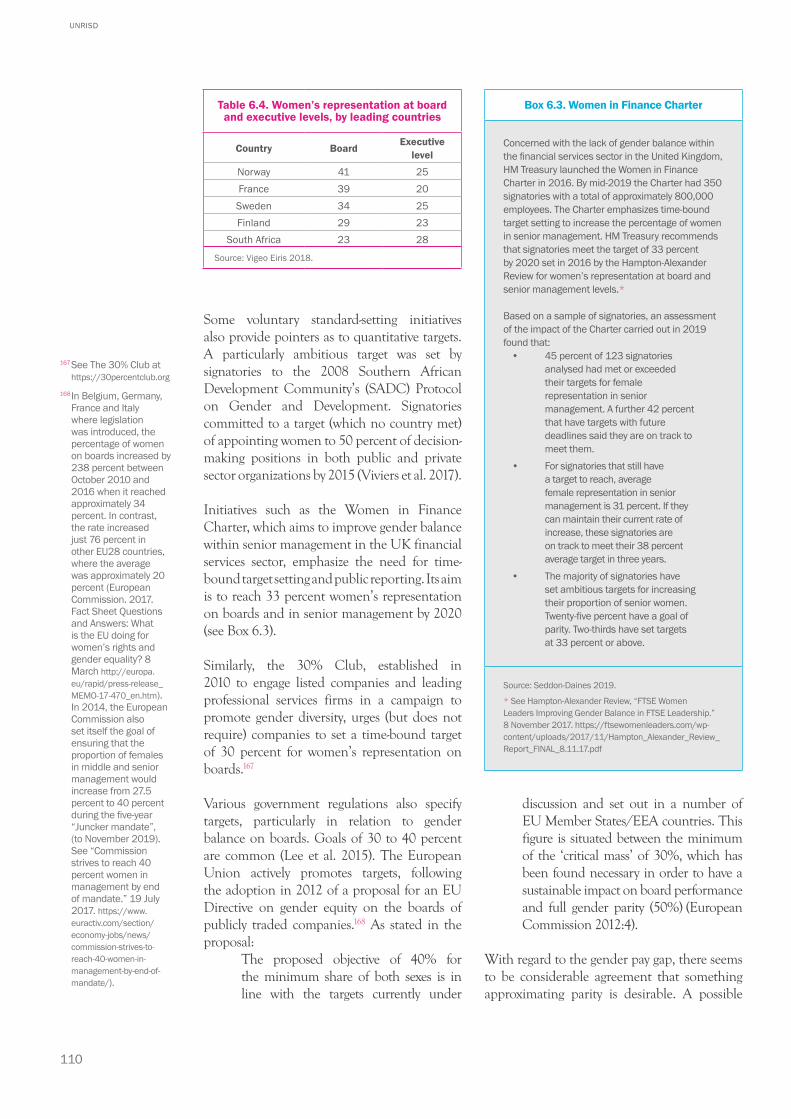
110
UNRISD
Some voluntary standard-setting initiatives also provide pointers as to quantitative targets. A particularly ambitious target was set by signatories to the 2008 Southern African Development Community’s (SADC) Protocol on Gender and Development. Signatories committed to a target (which no country met) of appointing women to 50 percent of decision-making positions in both public and private sector organizations by 2015 (Viviers et al. 2017).
Initiatives such as the Women in Finance Charter, which aims to improve gender balance within senior management in the UK financial services sector, emphasize the need for time-bound target setting and public reporting. Its aim is to reach 33 percent women’s representation on boards and in senior management by 2020 (see Box 6.3).
Similarly, the 30% Club, established in 2010 to engage listed companies and leading professional services firms in a campaign to promote gender diversity, urges (but does not require) companies to set a time-bound target of 30 percent for women’s representation on boards.167
Various government regulations also specify targets, particularly in relation to gender balance on boards. Goals of 30 to 40 percent are common (Lee et al. 2015). The European Union actively promotes targets, following the adoption in 2012 of a proposal for an EU Directive on gender equity on the boards of publicly traded companies.168 As stated in the proposal:
The proposed objective of 40% for the minimum share of both sexes is in line with the targets currently under
discussion and set out in a number of EU Member States/EEA countries. This figure is situated between the minimum of the ‘critical mass’ of 30%, which has been found necessary in order to have a sustainable impact on board performance and full gender parity (50%) (European Commission 2012:4).
With regard to the gender pay gap, there seems to be considerable agreement that something approximating parity is desirable. A possible
Box 6.3. Women in Finance Charter
Concerned with the lack of gender balance within the financial services sector in the United Kingdom, HM Treasury launched the Women in Finance Charter in 2016. By mid-2019 the Charter had 350 signatories with a total of approximately 800,000 employees. The Charter emphasizes time-bound target setting to increase the percentage of women in senior management. HM Treasury recommends that signatories meet the target of 33 percent by 2020 set in 2016 by the Hampton-Alexander Review for women’s representation at board and senior management levels.*
Based on a sample of signatories, an assessment of the impact of the Charter carried out in 2019 found that:
• 45 percent of 123 signatories analysed had met or exceeded their targets for female representation in senior management. A further 42 percent that have targets with future deadlines said they are on track to meet them.
• For signatories that still have a target to reach, average female representation in senior management is 31 percent. If they can maintain their current rate of increase, these signatories are on track to meet their 38 percent average target in three years.
• The majority of signatories have set ambitious targets for increasing their proportion of senior women. Twenty-five percent have a goal of parity. Two-thirds have set targets at 33 percent or above.
Source: Seddon-Daines 2019.
* See Hampton-Alexander Review, “FTSE Women Leaders Improving Gender Balance in FTSE Leadership.” 8 November 2017. https://ftsewomenleaders.com/wp-content/uploads/2017/11/Hampton_Alexander_Review_Report_FINAL_8.11.17.pdf
Table 6.4. Women’s representation at board and executive levels, by leading countries
Country Board Executive level
Norway 41 25France 39 20Sweden 34 25Finland 29 23
South Africa 23 28
Source: Vigeo Eiris 2018.
167 See The 30% Club at https://30percentclub.org
168 In Belgium, Germany, France and Italy where legislation was introduced, the percentage of women on boards increased by 238 percent between October 2010 and 2016 when it reached approximately 34 percent. In contrast, the rate increased just 76 percent in other EU28 countries, where the average was approximately 20 percent (European Commission. 2017. Fact Sheet Questions and Answers: What is the EU doing for women’s rights and gender equality? 8 March http://europa.eu/rapid/press-release_MEMO-17-470_en.htm).
In 2014, the European Commission also set itself the goal of ensuring that the proportion of females in middle and senior management would increase from 27.5 percent to 40 percent during the five-year “Juncker mandate”, (to November 2019). See “Commission strives to reach 40 percent women in management by end of mandate.” 19 July 2017. https://www.euractiv.com/section/economy-jobs/news/commission-strives-to-reach-40-women-in-management-by-end-of-mandate/).
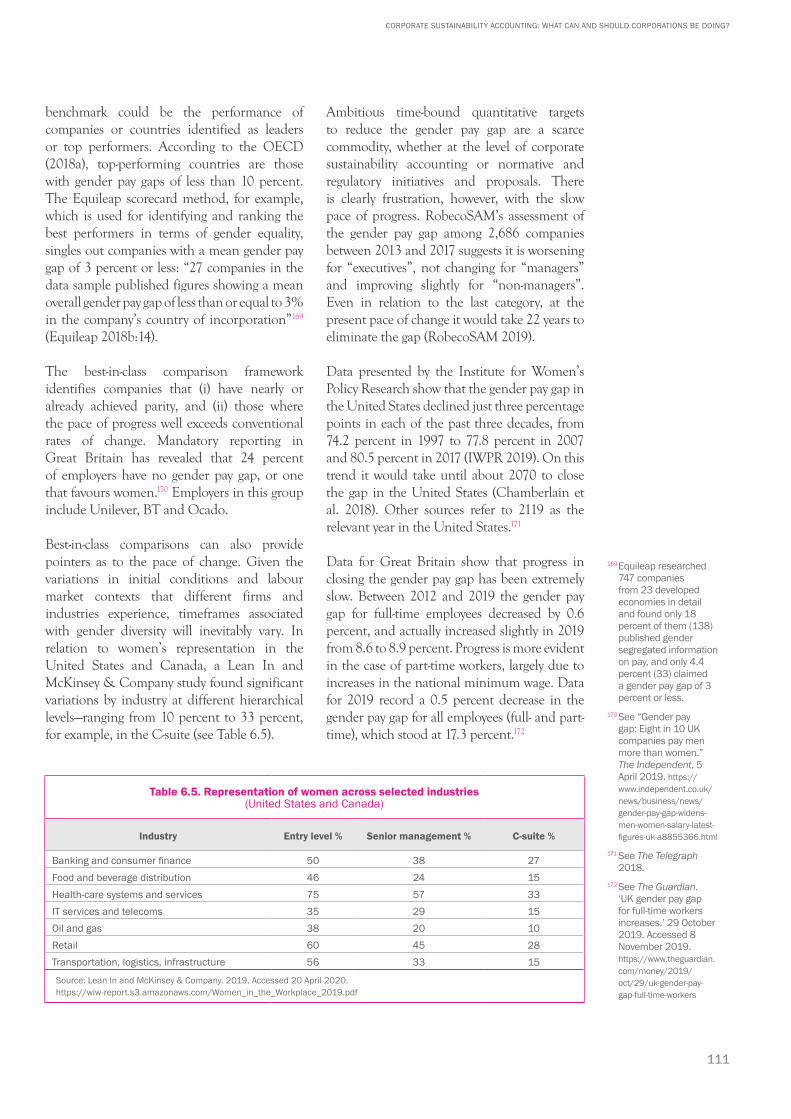
111
CORPORATE SUSTAINABILITY ACCOUNTING: WHAT CAN AND SHOULD CORPORATIONS BE DOING?
benchmark could be the performance of companies or countries identified as leaders or top performers. According to the OECD (2018a), top-performing countries are those with gender pay gaps of less than 10 percent. The Equileap scorecard method, for example, which is used for identifying and ranking the best performers in terms of gender equality, singles out companies with a mean gender pay gap of 3 percent or less: “27 companies in the data sample published figures showing a mean overall gender pay gap of less than or equal to 3% in the company’s country of incorporation”169 (Equileap 2018b:14).
The best-in-class comparison framework identifies companies that (i) have nearly or already achieved parity, and (ii) those where the pace of progress well exceeds conventional rates of change. Mandatory reporting in Great Britain has revealed that 24 percent of employers have no gender pay gap, or one that favours women.170 Employers in this group include Unilever, BT and Ocado.
Best-in-class comparisons can also provide pointers as to the pace of change. Given the variations in initial conditions and labour market contexts that different firms and industries experience, timeframes associated with gender diversity will inevitably vary. In relation to women’s representation in the United States and Canada, a Lean In and McKinsey & Company study found significant variations by industry at different hierarchical levels—ranging from 10 percent to 33 percent, for example, in the C-suite (see Table 6.5).
Ambitious time-bound quantitative targets to reduce the gender pay gap are a scarce commodity, whether at the level of corporate sustainability accounting or normative and regulatory initiatives and proposals. There is clearly frustration, however, with the slow pace of progress. RobecoSAM’s assessment of the gender pay gap among 2,686 companies between 2013 and 2017 suggests it is worsening for “executives”, not changing for “managers” and improving slightly for “non-managers”. Even in relation to the last category, at the present pace of change it would take 22 years to eliminate the gap (RobecoSAM 2019).
Data presented by the Institute for Women’s Policy Research show that the gender pay gap in the United States declined just three percentage points in each of the past three decades, from 74.2 percent in 1997 to 77.8 percent in 2007 and 80.5 percent in 2017 (IWPR 2019). On this trend it would take until about 2070 to close the gap in the United States (Chamberlain et al. 2018). Other sources refer to 2119 as the relevant year in the United States.171
Data for Great Britain show that progress in closing the gender pay gap has been extremely slow. Between 2012 and 2019 the gender pay gap for full-time employees decreased by 0.6 percent, and actually increased slightly in 2019 from 8.6 to 8.9 percent. Progress is more evident in the case of part-time workers, largely due to increases in the national minimum wage. Data for 2019 record a 0.5 percent decrease in the gender pay gap for all employees (full- and part-time), which stood at 17.3 percent.172
Table 6.5. Representation of women across selected industries (United States and Canada)
Industry Entry level % Senior management % C-suite %
Banking and consumer finance 50 38 27Food and beverage distribution 46 24 15Health-care systems and services 75 57 33IT services and telecoms 35 29 15Oil and gas 38 20 10Retail 60 45 28Transportation, logistics, infrastructure 56 33 15
Source: Lean In and McKinsey & Company. 2019. Accessed 20 April 2020. https://wiw-report.s3.amazonaws.com/Women_in_the_Workplace_2019.pdf
169 Equileap researched 747 companies from 23 developed economies in detail and found only 18 percent of them (138) published gender segregated information on pay, and only 4.4 percent (33) claimed a gender pay gap of 3 percent or less.
170 See “Gender pay gap: Eight in 10 UK companies pay men more than women.” The Independent, 5 April 2019. https://www.independent.co.uk/news/business/news/gender-pay-gap-widens-men-women-salary-latest-figures-uk-a8855366.html
171 See The Telegraph 2018.
172 See The Guardian. ‘UK gender pay gap for full-time workers increases.’ 29 October 2019. Accessed 8 November 2019. https://www.theguardian.com/money/2019/oct/29/uk-gender-pay-gap-full-time-workers
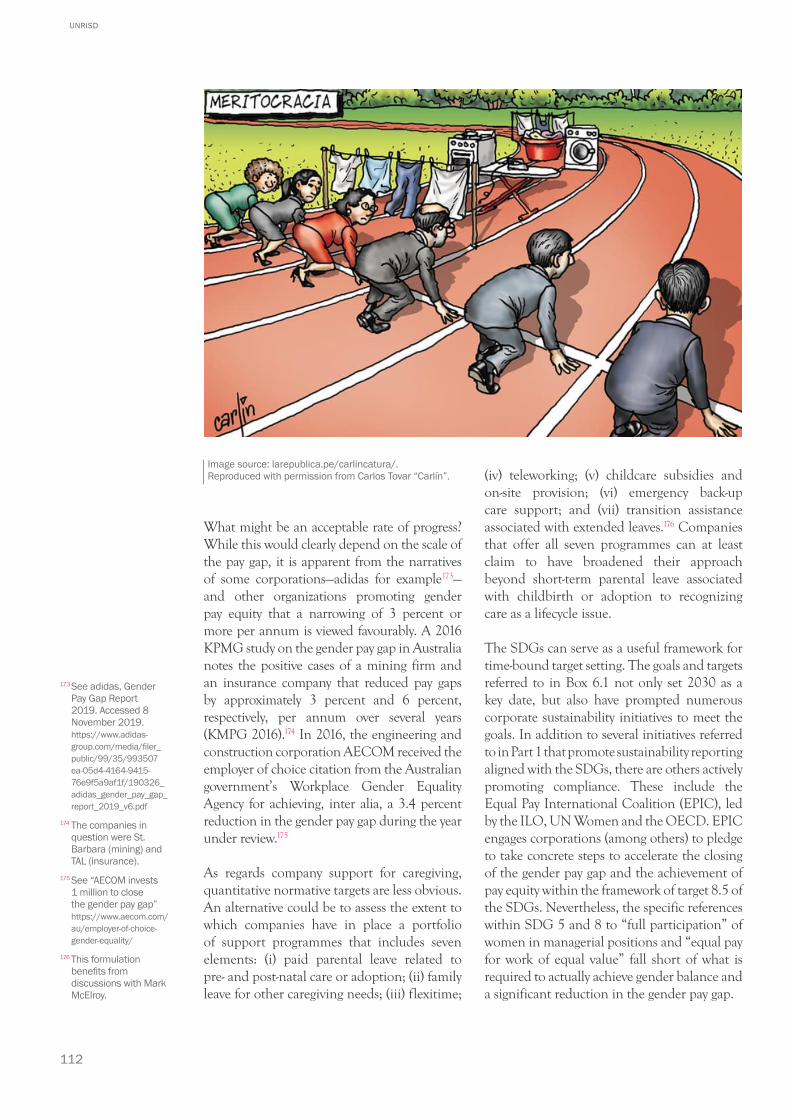
112
UNRISD
What might be an acceptable rate of progress? While this would clearly depend on the scale of the pay gap, it is apparent from the narratives of some corporations—adidas for example173—and other organizations promoting gender pay equity that a narrowing of 3 percent or more per annum is viewed favourably. A 2016 KPMG study on the gender pay gap in Australia notes the positive cases of a mining firm and an insurance company that reduced pay gaps by approximately 3 percent and 6 percent, respectively, per annum over several years (KMPG 2016).174 In 2016, the engineering and construction corporation AECOM received the employer of choice citation from the Australian government’s Workplace Gender Equality Agency for achieving, inter alia, a 3.4 percent reduction in the gender pay gap during the year under review.175
As regards company support for caregiving, quantitative normative targets are less obvious. An alternative could be to assess the extent to which companies have in place a portfolio of support programmes that includes seven elements: (i) paid parental leave related to pre- and post-natal care or adoption; (ii) family leave for other caregiving needs; (iii) flexitime;
(iv) teleworking; (v) childcare subsidies and on-site provision; (vi) emergency back-up care support; and (vii) transition assistance associated with extended leaves.176 Companies that offer all seven programmes can at least claim to have broadened their approach beyond short-term parental leave associated with childbirth or adoption to recognizing care as a lifecycle issue.
The SDGs can serve as a useful framework for time-bound target setting. The goals and targets referred to in Box 6.1 not only set 2030 as a key date, but also have prompted numerous corporate sustainability initiatives to meet the goals. In addition to several initiatives referred to in Part 1 that promote sustainability reporting aligned with the SDGs, there are others actively promoting compliance. These include the Equal Pay International Coalition (EPIC), led by the ILO, UN Women and the OECD. EPIC engages corporations (among others) to pledge to take concrete steps to accelerate the closing of the gender pay gap and the achievement of pay equity within the framework of target 8.5 of the SDGs. Nevertheless, the specific references within SDG 5 and 8 to “full participation” of women in managerial positions and “equal pay for work of equal value” fall short of what is required to actually achieve gender balance and a significant reduction in the gender pay gap.
173 See adidas, Gender Pay Gap Report 2019. Accessed 8 November 2019. https://www.adidas-group.com/media/filer_public/99/35/993507 ea-05d4-4164-9415-76e9f5a9af1f/190326_adidas_gender_pay_gap_report_2019_v6.pdf
174 The companies in question were St. Barbara (mining) and TAL (insurance).
175 See “AECOM invests 1 million to close the gender pay gap” https://www.aecom.com/au/employer-of-choice-gender-equality/
176 This formulation benefits from discussions with Mark McElroy.
Image source: larepublica.pe/carlincatura/. Reproduced with permission from Carlos Tovar “Carlín”.
113
CORPORATE SUSTAINABILITY ACCOUNTING: WHAT CAN AND SHOULD CORPORATIONS BE DOING?
⚫ Concluding remarks
The following key takeaways emerge from this discussion. From a transformative perspective, corporate sustainability accounting needs not only to emphasize gender equality, but also to focus on issues and indicators that relate to the structural underpinnings of gender inequality and disadvantage in the workplace. From this vantage point, key performance issues involve the gender pay gap, gender balance and support for unpaid care work.
Conventional disclosure and reporting related to these aspects suffer from two major limitations. First, the metrics and indicators do not necessarily tell us very much about whether the structural conditions related to segmented labour markets and segregated occupational categories, as well as cultural norms, bias and the care burden, are being addressed. Second, conventional indicators often relate to very partial aspects of gender inequality, injustice and disadvantage that miss the bigger picture.
There needs to be greater clarity and consensus regarding methods to calculate the gender pay gap and more attention paid to transparency via publicly reported data, time-bound targets, and granular disclosure of pay gaps by occupational category and by remuneration category (such as income quartiles).
Metrics and targets related to gender balance need to extend beyond company-wide averages, and the boardroom or the C-suite, to a diverse range of occupational, hierarchical and remuneration categories. This focus would provide a window onto how women are faring in relation to four transitions: (i) from the home or the informal economy to the formalized workforce; (ii) from operational to supervisory or managerial roles; (iii) from junior to senior management; and (iv) through the glass ceiling, represented by the C-suite and the boardroom. Targets within the range of 30 percent to 50 percent, and the specific goal of 40 percent, constitute benchmarks for gender diversity that are gaining currency. Parity is the obvious
normative goal for the gender pay gap, with any disparity not to exceed, say, three percent.
While sustainability accounting related to gender diversity and the pay gap has shown signs of improvement in recent years, the same does not apply to the issue of care. It is imperative for standard-setting bodies to develop more effective reporting guidelines and targets related to care. Conventional sustainability disclosure and reporting appear to have missed a key point about care as a material issue: it is not simply a short-term matter related to maternity or parental leave for pre- and post-natal care or adoption, but a long-term lifecycle issue. While public policy must play a key role in facilitating care, there are numerous ways in which companies themselves can also provide support.
A starting point can be disclosure that reveals whether companies are providing a comprehensive range of support programmes. But standard-setting bodies and companies could go further, identifying quantitative indicators to measure corporate sustainability performance related to care along three dimensions: (i) levels of financial support; (ii) flexible time use arrangements favouring care and work-life balance; and (iii) both potential and actual beneficiaries. Potential beneficiaries include both employees with significant care responsibilities as well as those entitled to care support. Actual beneficiaries include those who actually take advantage of various forms of care support to which they are entitled.
In a context where the pace of change, particularly in relation to the gender pay gap and care, has been slow, where time-bound targets have been neglected, and where more and more corporations are acknowledging the relevance and importance of the Sustainable Development Goals, specific SDGs and their 2030 timeframe provide important markers for corporate sustainability performance and accounting related to gender equality. Yet SDG targets related to pay and diversity fall short of what is required to ensure gender equality in the workplace.
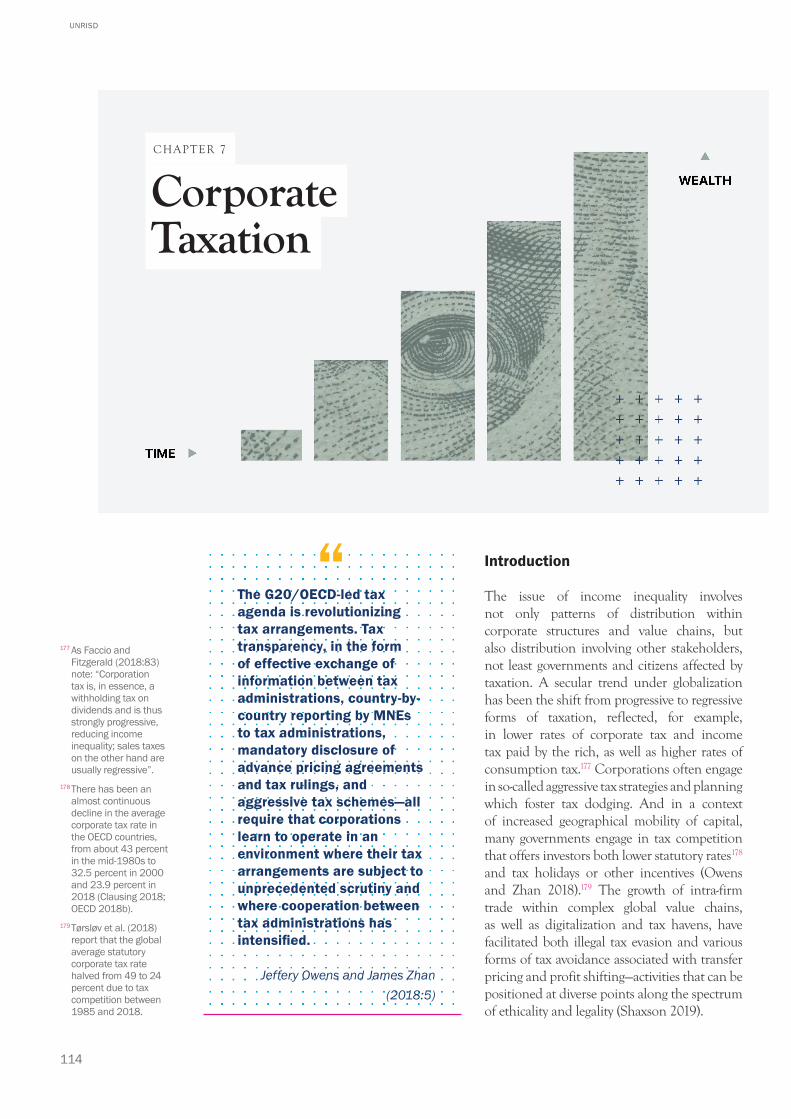
114
UNRISD
The G20/OECD-led tax agenda is revolutionizing tax arrangements. Tax transparency, in the form of effective exchange of information between tax administrations, country-by-country reporting by MNEs to tax administrations, mandatory disclosure of advance pricing agreements and tax rulings, and aggressive tax schemes—all require that corporations learn to operate in an environment where their tax arrangements are subject to unprecedented scrutiny and where cooperation between tax administrations has intensified.
Jeffery Owens and James Zhan (2018:5)
Introduction
The issue of income inequality involves not only patterns of distribution within corporate structures and value chains, but also distribution involving other stakeholders, not least governments and citizens affected by taxation. A secular trend under globalization has been the shift from progressive to regressive forms of taxation, reflected, for example, in lower rates of corporate tax and income tax paid by the rich, as well as higher rates of consumption tax.177 Corporations often engage in so-called aggressive tax strategies and planning which foster tax dodging. And in a context of increased geographical mobility of capital, many governments engage in tax competition that offers investors both lower statutory rates178 and tax holidays or other incentives (Owens and Zhan 2018).179 The growth of intra-firm trade within complex global value chains, as well as digitalization and tax havens, have facilitated both illegal tax evasion and various forms of tax avoidance associated with transfer pricing and profit shifting—activities that can be positioned at diverse points along the spectrum of ethicality and legality (Shaxson 2019).
Corporate Taxation
CHAPTER 7
177 As Faccio and Fitzgerald (2018:83) note: “Corporation tax is, in essence, a withholding tax on dividends and is thus strongly progressive, reducing income inequality; sales taxes on the other hand are usually regressive”.
178 There has been an almost continuous decline in the average corporate tax rate in the OECD countries, from about 43 percent in the mid-1980s to 32.5 percent in 2000 and 23.9 percent in 2018 (Clausing 2018; OECD 2018b).
179 Tørsløv et al. (2018) report that the global average statutory corporate tax rate halved from 49 to 24 percent due to tax competition between 1985 and 2018.
“
115
CORPORATE SUSTAINABILITY ACCOUNTING: WHAT CAN AND SHOULD CORPORATIONS BE DOING?
As Christian Aid, Oxfam and ActionAid point out:
the core of public and government concern over corporate tax behaviour is fairly straightforward, i.e. the perception that some corporate taxpayers may be taking steps to ensure that taxable income, profits or gains do not arise in jurisdictions where business operations are actually located, but elsewhere, particularly in jurisdictions where they will be subject to low or no tax (2015:15).
While the international development com-munity has long been concerned about corporate strategies to minimize tax revenues via such means as transfer pricing and the use of tax havens, the issue has often flown under the radar within corporate sustainability accounting.180 When addressed, it tended to be on a sectoral basis, notably in relation to the extractives industries where multistakeholder regulation and pressure have resulted in standards that a number of corporations have adopted. This has begun to change in recent years as more attention has focused on the issue of responsible tax behaviour within the field of corporate social responsibility (Stephenson and Vracheva 2015).
The Sustainable Development Goals, notably SDG 17, have reinforced interest and concerns related to corporate taxation, which is seen as a key mechanism for achieving the level of domestic resource mobilization required to implement the SDGs via, for example, investment in public infrastructure and services.181 Clearly, it is also relevant for achieving SDG 10—reducing inequality both within and between countries.
While the primary responsibility for reconfiguring tax regimes, of course, lies with governments, there is much that corporations can do to facilitate fiscal restructuring in a progressive and transformative sense. This chapter examines how corporate disclosure and reporting related to tax matters can be part of this process. It begins by recalling why tax justice should be regarded as a key performance issue within corporate sustainability disclosure. The discussion then turns to metrics and
indicators that are key for gauging aspects of (ir)responsible tax behaviour, namely, the tax gap and the misalignment of profit allocation with real economic activity. This is followed by a brief review of recent normative and regulatory initiatives to improve corporate fiscal disclosure.
Why tax justice is a key performance issue
As Brock and Pogge point out, issues of tax justice intersect with those of global justice not least because “practices of international taxation sustain a substantial headwind against which developing countries must struggle and failure to pay or collect taxes greatly reduces revenues available to address poverty, which is among the most pressing global injustices humanity is currently facing” (2014:2).
Regressive and aggressive features of contempo-rary fiscal regimes risk reducing the scope for domestic resource mobilization. Estimates of revenues losses from base erosion and profit shifting (BEPS)182 vary significantly. BEPS refers to tax avoidance strategies that exploit gaps and mismatches in tax rules to artificially shift profits to low or no-tax locations.183
According to Tørsløv et al. (2018), 36 percent of multinational profits were shifted from affiliates outside of headquarter countries to tax havens in 2015 (55 percent in the case of affiliates of US TNCs). This amounted to approximately USD 600 billion dollars. The OECD suggests that losses to tax authorities could have amounted to up to USD 2.1 trillion over 2005–2014, and are “conservatively estimated at between USD 100 billion and 240 billion annually. This is equivalent to between 4% and 10% of global revenues from corporate income tax” (OECD 2015:1). Studies employing different methodologies, and including more countries, cite annual figures of USD 500 to USD 647 billion (see Table 7.1).184 Furthermore, Cobham and Janský find that “… intensity of losses is substantially greater in low- and lower middle-income countries; and in sub-Saharan Africa, Latin America and the Caribbean, and in South Asia compared to other regions” (2018).
180 PRI 2018a; Sikka 2010; Muller and Kolk 2012.
181 See Committee of Experts on International Cooperation in Tax Matters 2018.
182 As defined by the OECD, base erosion refers to efforts to reduce tax bases through deductible payments such as interest or royalties. Profit shifting refers to artificially shifting profits to low or no-tax locations where the company has little or no economic activity. Accessed 30 November 2019. http://www.oecd.org/tax/beps/about/
183 How to separate BEPS from real economic activity is one of the major challenges in measuring BEPS. The mere fact that an MNE or its affiliates take advantage of different countries’ tax rates does not, in itself, amount to BEPS, notably in contexts where such a criterion underpins investment in physical plant or a factory.
184 As Bradbury et al. note: “One final shortcoming of almost all available data sources is the underrepresentation of developing countries. This may lead to underestimates of global profit shifting, especially given the significance of BEPS in developing countries found by some recent studies” (2018:96).

116
UNRISD
There is a risk that the topical issue of BEPS may divert attention from many other ways of reforming or overhauling tax regimes in developing countries (Forstater 2018; Moore and Prichard 2015). Potential fiscal revenues lost through subsidies associated with tax credits, exemptions and rate reductions, for example, are significant. Forstater notes that: “While data is patchy overall they appear to be non-trivial amounts of money, estimated at 2 percent of GDP in Ghana, 2.5 percent of GDP in Kenya and Tanzania, and 5 percent of GDP in Brazil” (2018:24). As for revenue foregone through corporate tax incentives, one estimate for 20 developing countries found a simple average of 0.6 percent of GDP (Hearson 2013).
But non-realizable revenues are only one part of the reason why tax justice is necessary. Political economy analysis reveals other reasons. First, as Piketty points out, higher levels of corporate and wealth tax are key for correcting a structural fault in the market economy, whereby the rate of return on capital exceeds the rate of economic growth. As noted earlier, this sets us on a path to a new Gilded Age (a return to the gross inequalities of the late 19th century) with extremely high concentrations of capital that are “potentially incompatible with the meritocratic values and principles of justice fundamental to modern democratic societies” (Piketty 2014:26). Only by taxing corporations and the wealthy can sufficient revenues be generated to enable national and supranational governments (for example, the EU) both to realign the rate of return on capital and the rate of growth, and to mobilize the resources needed to deal with
crucial 21st century infrastructural, social and climate issues. A proposal introduced by Piketty in 2018 called on the EU to quadruple the EU budget via fiscal reforms that would generate approximately 800 billion euros (4 percent of GDP). Apart from wealth taxes, this proposal contemplated raising corporate profit taxes across the EU to a unified rate of 37 percent, thereby raising an estimated 300 billion euros.185
Second, in the current and future context of climate change, ageing societies and fiscal deficits, it is likely that governments will turn to carbon and other taxes, or regressive pension and social policy reforms, that will impact the working and middle classes and other social groups. As seen in 2019 in France (with the Gilets Jaunes) and Chile, social and political movements can quickly mobilize against such taxes and are likely to do so in contexts where societal perceptions of gross inequality exist: “Why should we be paying more when the rich are getting richer?!” Similarly, why should small and medium-sized enterprises (SMEs) feel inclined to pay more in taxes if the perception or reality is that large corporations are aggressively minimizing their taxes and that governments are facilitating this process. As Tørsløv et al. point out, SMEs are already at a competitive disadvantage as a result of profit shifting as it “reduces the effective rates paid by multinationals corporations compared to what local firms pay …” (2018:33).
Third, as the economic power of elites increases, so too does their capacity to shape public policy. Often, this policy influence favours narrow
Table 7.1. Estimates of the fiscal effects of BEPS
Author, fiscal estimate approach (date) Range (USD billions) Year (level)
UNCTAD, offshore investment matrix (2015) 200* 2012
OECD, aggregate tax rate differential (2015) 100–240 2014
Crivelli et al., tax haven spillover (2016) 123 2013 short-term
Crivelli et al., tax haven spillover (2016) 647 2013 long-term
Clausing, excess income in low-tax countries (2016) 280 2012
Cobham and Janský, tax haven spillover (2018) 500 2013 long-term
Janský and Palanský, offshore investment matrix (2018) 80+* 2015
* Includes only FDI-related BEPSSource: Adapted from Bradbury et al. 2018:101
185 The Guardian. 9 December 2018.
117
CORPORATE SUSTAINABILITY ACCOUNTING: WHAT CAN AND SHOULD CORPORATIONS BE DOING?
interests and rent seeking. But corporate policy influence can also be enlightened and work towards compromises or social pacts that can raise all boats, as was notable, for example, in the decades following the Second World War in Western and Northern Europe. Forstater (2018) makes the case that multinational enterprises can potentially be allies in relation to tax justice. Key elements in this reasoning include the following:
• MNEs, and the private sector more generally, are not a homogenous category; different multinationals have different levels of appetite for engaging in corrupt practices.
• More efficient firms tend to do better in investment and operating environments where more of the transfers to and from the business (including taxation) are through official “rules-based” channels.
• Leveraging political, consumer and investor influence on multinational corporations has often been used as a strategy by governments, civil society organizations and pension funds seeking to break vicious cycles. Companies may then become advocates for legal reforms and better enforcement, and for international cooperation.
• Multinationals have an interest in securing public confidence in the tax system to prevent toxic uncertainty and risk. There are, however, notable barriers to private sector involvement in tax system reform, including lack of mutual understanding, miscommunication and real or perceived conflicts of interest.
Such factors suggest that some MNEs may be in a position to not only be more transparent and facilitate technical solutions but also be part of a social contract promoting accountability and distributive justice through formal institutions. In reality, however, many MNEs engage in the types of corporate political interventions discussed in Chapter 9 that exert pressure on public policy in favour of regressive and aggressive approaches to fiscal “reform”.
The tax gap and misallocation of profits
Aggressive tax planning by corporations and tax competition by governments can give rise to a significant gap between the statutory and effective tax rates, that is, between what companies are expected to pay according to official fiscal policy and what they actually pay.
Research carried out by MSCI ESG Research on 2,160 companies in the MSCI ACWI Index186 compared each company’s reported tax payments between 2011 and 2015 to the average corporate tax rate of the countries in which it generated revenues. Among the findings were the following (Sayani 2017):• About a quarter, 531 companies, were
found to have a “high tax gap” of 10 percent or more below the average statutory rate. Their average effective tax rate was about 14.3 percent, less than half of the average “expected” statutory rate of 31.8 percent.
• Among these companies, 381 (71 percent) were MNEs that may face higher regulatory risks given that the global tax reform movement is largely focused on cross-border tax avoidance.
• Tax gap size was not uniform across sectors. Information technology leads the pack followed by health care. Approximately 40 percent and 35 percent of the companies in these sectors had a tax gap greater than 10 percentage points, respectively. In contrast, less than 10 percent of real estate, utilities, energy and telecom companies had a gap of 10 percentage points or more.
• Were regulators to close the tax gap completely, it could mean additional aggregate tax payouts of around USD 220 billion for MSCI ACWI Index constituent companies with a tax gap. The bulk of the burden (USD 150 billion) would be borne by MNEs.
The MSCI study also points out how con-ventional disclosure impedes accurately esti-mating a company’s tax gap, given
186 The All Country World Index (ACWI), maintained by Morgan Stanley Capital International (MSCI), comprises stocks from approximately 50 countries.
118
UNRISD
the lack of granular disclosure of relevant financial metrics. Typically, companies tend to lump their geographical segments into larger regions as opposed to providing a country-by-country (CbC) breakdown. For this reason, regulators’ initial focus is on improving the transparency around cross-border transactions. Several countries have already enacted or are in the process of enacting laws mandating CbC disclosure of financial metrics (Sayani 2017:8).
Among the multinational companies in the MSCI ACWI Index in 2016, only 45 percent disclosed more than three quarters of their revenue using the CbC format. “Moreover, CbC disclosure beyond revenue and assets on metrics such as profits, taxes, etc., as required by the impending regulations, is seldom observed among companies (Sayani 2017: 8).
A study by the Institute on Taxation and Economic Policy (ITEP) of large profitable corporations in the United States found that even following the significant 40 percent tax cut introduced by the Trump administration in 2017 they still paid an average federal income tax rate of 11.3 percent on their 2018 income—approximately half the 21 percent statutory rate. The study also notes that:
Determining the tax rates paid by the nation’s biggest and most profitable corporations shouldn’t be hard. Lawmakers, the media and the general public should all have a straightforward way of knowing whether our tax system requires the biggest and most profitable companies to pay their fair share. But in fact, it’s an incredibly difficult enterprise. The fact that a report such as this takes several months to complete illustrates the need for clearer and more detailed public information about companies’ federal income taxes (Gardner et al. 2019:19).187
This analysis has several implications for corporate disclosure and reporting related to sustainability performance. It suggests the need for high levels of transparency of disclosure both in relation to BEPS and CbC reporting, as well as corporate lobbying, a topic discussed in Chapter 9 of this report.
Much of the responsibility for fixing this situation falls, of course, on governments and public policy. Particularly important in this regard is work on BEPS and CbC reporting, which is key for assessing “if taxes paid match business substance” (PRI 2018b), as well as for facilitating public scrutiny (ActionAid 2015) and risk assessment by investors (PRI 2018b).188
Transparency associated with CbC reporting sheds light not only on effective tax rates and amounts paid by jurisdiction and affiliate, but also on corporate revenues, employment and assets by country—the “denominator”, in other words, for metrics needed to gauge what a fair profit and tax allocation would look like. Within the field of voluntary reporting, Vodafone has taken the lead in disclosing such data.189 This is key for assessing the extent of alignment among such variables as taxes paid, profits and revenues or employment (see Table 7.2). Faccio and Fitzgerald note that:
The…data…clearly shows the mis-alignment between the current taxable profit allocation and indicators of the Group’s real economic activities (sales, employees and assets) in the countries where Vodafone operates and thus the potential for BEPS activities by the Group through the use of low-tax ‘conduit’ countries (2018:75).
Enhanced fiscal disclosure could also shed light on another trend that has often been overlooked, namely what has been happening to companies’ total tax contribution (TTC) and the share of TTC accounted for by corporate income tax. Companies generally pay far more to (local, state and federal) governments via other taxes such as payroll, property, dividend and value added taxes. Over time, however, the percentage share of corporate income tax has tended to decline. A UK survey showed that (i) for every GBP 1 of corporation tax there were GBP 4.46 in other taxes, (ii) TTC tended to trend downwards between 2007 and 2015, with increased rates reported in recent years, and (iii) there was a significant change in the relative weight of different components between 2005 and 2018, with the share of total tax contribution represented by corporate income tax falling
187 Like the MSCI study, ITEP recommends that companies be required to publicly disclose data on a country-by-country basis. “Ideally, this would include the disclosure of total revenues, profit, income tax paid, tax cash expenses, stated capital, accumulated earnings, number of employees on a full-time basis, and book value of tangible assets” (Gardner et al. 2019:19).
188 In 2013, the OECD Action Plan on BEPS was launched, setting out 15 specific action points. Guidance on domestic legislative and administrative changes followed in 2015. Various EU countries subsequently adopted CbC reporting regulations. The United Kingdom, for example, introduced CbC reporting regulations that came into effect in 2016 for large MNEs headquartered in the UK, and some UK sub-groups of non-UK MNEs, which must report revenues, profits, taxes and other information by jurisdiction in which they operate on an annual basis. See: https://www.gov.uk/government/publications/country-by-country-reporting-updated. Accessed 30 November 2019.
189 Vodafone Group Plc. Taxation and our total economic contribution to public finances 2016-2017. Accessed 30 November 2019. https://www.vodafone.com/content/dam/sustainability/pdfs/vodafone_2017_tax.pdf
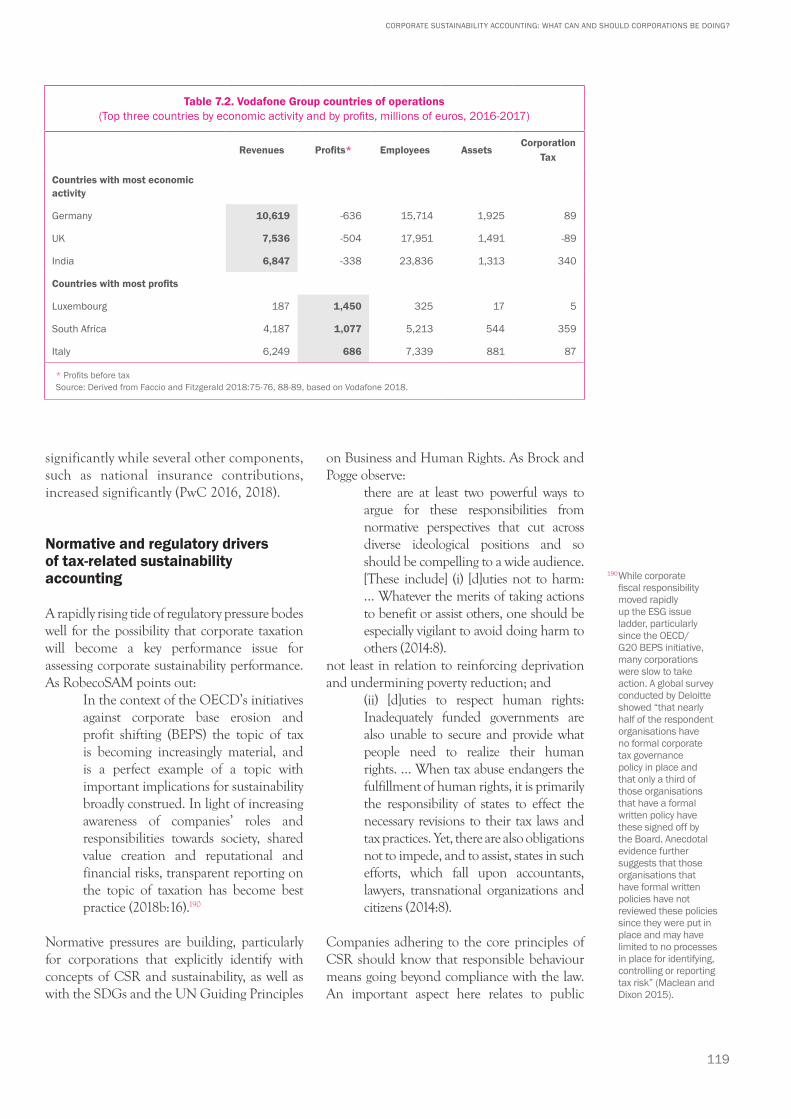
119
CORPORATE SUSTAINABILITY ACCOUNTING: WHAT CAN AND SHOULD CORPORATIONS BE DOING?
significantly while several other components, such as national insurance contributions, increased significantly (PwC 2016, 2018).
Normative and regulatory drivers of tax-related sustainability accounting
A rapidly rising tide of regulatory pressure bodes well for the possibility that corporate taxation will become a key performance issue for assessing corporate sustainability performance. As RobecoSAM points out:
In the context of the OECD’s initiatives against corporate base erosion and profit shifting (BEPS) the topic of tax is becoming increasingly material, and is a perfect example of a topic with important implications for sustainability broadly construed. In light of increasing awareness of companies’ roles and responsibilities towards society, shared value creation and reputational and financial risks, transparent reporting on the topic of taxation has become best practice (2018b:16).190
Normative pressures are building, particularly for corporations that explicitly identify with concepts of CSR and sustainability, as well as with the SDGs and the UN Guiding Principles
on Business and Human Rights. As Brock and Pogge observe:
there are at least two powerful ways to argue for these responsibilities from normative perspectives that cut across diverse ideological positions and so should be compelling to a wide audience. [These include] (i) [d]uties not to harm: … Whatever the merits of taking actions to benefit or assist others, one should be especially vigilant to avoid doing harm to others (2014:8).
not least in relation to reinforcing deprivation and undermining poverty reduction; and
(ii) [d]uties to respect human rights: Inadequately funded governments are also unable to secure and provide what people need to realize their human rights. … When tax abuse endangers the fulfillment of human rights, it is primarily the responsibility of states to effect the necessary revisions to their tax laws and tax practices. Yet, there are also obligations not to impede, and to assist, states in such efforts, which fall upon accountants, lawyers, transnational organizations and citizens (2014:8).
Companies adhering to the core principles of CSR should know that responsible behaviour means going beyond compliance with the law. An important aspect here relates to public
Table 7.2. Vodafone Group countries of operations (Top three countries by economic activity and by profits, millions of euros, 2016-2017)
Revenues Profits* Employees AssetsCorporation
Tax
Countries with most economic activity
Germany 10,619 -636 15,714 1,925 89
UK 7,536 -504 17,951 1,491 -89
India 6,847 -338 23,836 1,313 340
Countries with most profits
Luxembourg 187 1,450 325 17 5
South Africa 4,187 1,077 5,213 544 359
Italy 6,249 686 7,339 881 87
* Profits before taxSource: Derived from Faccio and Fitzgerald 2018:75-76, 88-89, based on Vodafone 2018.
190 While corporate fiscal responsibility moved rapidly up the ESG issue ladder, particularly since the OECD/G20 BEPS initiative, many corporations were slow to take action. A global survey conducted by Deloitte showed “that nearly half of the respondent organisations have no formal corporate tax governance policy in place and that only a third of those organisations that have a formal written policy have these signed off by the Board. Anecdotal evidence further suggests that those organisations that have formal written policies have not reviewed these policies since they were put in place and may have limited to no processes in place for identifying, controlling or reporting tax risk” (Maclean and Dixon 2015).
120
UNRISD
disclosure of tax data. The OECD initiative to promote CbC reporting, for example, is fairly comprehensive in terms of the type of information required but it does not insist on public disclosure (Cobham et al. 2017; TUAC 2016). Adherence to CSR principles should also mean to err on the side of social responsibility in contexts—as in tax strategy—where MNEs have options; for example, where the pursuit of one option may help poorer countries while another may hinder development (Christian Aid et al. 2015). Furthermore, it means being part of coalitions advocating for progressive fiscal reform.
In the wake of the global financial crisis in 2008-2009, both political and public awareness of tax justice issues rose sharply. As inequality and poverty have moved up the ladder of international development priorities, so too have the expectations of citizens and policy makers about corporate tax behaviour. Several controversies, such as the 2016 Panama Papers leak,191 catapulted money laundering and tax evasion into the media and political spotlight, and provoked alarm about the lack of due diligence within the financial sector. Research by Sustainalytics revealed in 2017 that just 9 of 130 assessed banks and other financial firms (7 percent) had high levels of risk preparedness associated with money laundering and tax evasion (Sustainalytics 2017).192
Various think tanks and research and advocacy organizations and networks193 have been actively involved in exposing bad practices. Just as the naming and shaming associated with the sweatshop and oil and chemical spill scandals of the 1980s and 1990s propelled some corporations to improve disclosure and reporting of working conditions and the environment, tax scandals may well do the same today in relation to fiscal responsibility (see Box 7.1).
Beyond naming and shaming, civil society organizations and networks are also advancing normative and technical proposals to inform the process of policy reform. A number of international NGOs have provided useful guidance about the overall trends needed to ensure that changes in corporate culture and tax
governance move in a transformative direction. This is not only to address an important blind spot within corporate sustainability accounting, but also to shift from a “do less harm” approach to one outlining what good performance might actually look like.194
Christian Aid et al. (2015) highlight the need for: (i) realignment of the geography of a corporation’s economic activities with that of its tax liabilities; (ii) transparency, with the publication of a wide set of data associated with tax rates, actual payments, accounting and taxable profits, incentives, relations with tax authorities, advocacy and so forth; and (iii) the development of an internally coherent responsible tax strategy and implementation procedure, as well as the use of tax impact assessments to effectively gauge developmental and other impacts.
According to Christian Aid et al., a “tax-responsible company” is one that:• is radically and proactively
transparent about its business structure and operations, its tax affairs and tax decision-making;
• assesses and publicly reports the fiscal, economic and social impacts (positive and negative) of its tax-related decisions and practices in a manner that is accessible and comprehensive; and
• takes steps—progressively, measurably and in dialogue with its stakeholders—to improve the impact of its tax behaviour on sustainable development and on the human rights of employees, customers and citizens in the places where it does business (Christian Aid et al. 2015).
Regulatory pressures related to tax disclosure are building. These include guidance by intergovernmental bodies such as the OECD and the G20; legally binding rules governing disclosure and reporting associated with BEPS and CbC reporting, which have been introduced in recent years by the European Commission and various governments; and new guidance provided by standard-setting entities like the GRI and PRI, as well as ratings and ranking agencies.
191 The Panama Papers implicated over 214,000 offshore entities and 500 banks (Sustainalytics 2017).
192 According to Sustainalytics (2017:5): “these include DNB, the largest financial services company in Norway, Van Lanschot, the Netherlands-based private bank, and Svenska Handelsbanken. ... These firms are certainly not immune to money laundering or tax evasion controversies but they tend to have advanced policies and programmes and lesser risk exposure. At the other end of the spectrum, 16 percent of examined firms (21 of 130) stand out as poorly prepared. These companies include Wells Fargo, Credit Suisse and Société Générale. Firms in this category are typically distinguished by significant exposure to money laundering and tax evasion risk and inadequate policies.”
193 Particularly significant in this regard are the Tax Justice Network, the Global Alliance for Tax Justice, and Oxfam.
194 See, for example, Christian Aid et al. 2015, ActionAid 2015, and numerous reports and briefs published by the Tax Justice Network (https://www.taxjustice.net/reports-2/).

121
CORPORATE SUSTAINABILITY ACCOUNTING: WHAT CAN AND SHOULD CORPORATIONS BE DOING?
As normative and regulatory pressures grow, so too does the business case for responsible tax disclosure and performance. It centres on risk management associated with reputation and liability, and building or strengthening the enabling environment for business through, for example, infrastructural development and good governance practices. The annual surveys conducted by Deloitte to gauge corporate reactions to BEPS show that 76 percent of corporate respondents “are concerned about
the media, political and activist group interest in corporate taxation [and] are more aware about reputational risk” (Deloitte 2018).
In short, growing public and governmental concern with tax dodging is translating into an institutional environment that is promoting greater transparency in disclosure and reporting related to corporate taxation. Box 7.2 highlights examples of several recent tax-related standard-setting, ratings and certification initiatives.
Box 7.1. Recent tax investigations and rulings in the European Union
Amazon agreed to pay the French government EUR 200 million and to disclose all of its earnings.a In 2017, the European Commission ordered Luxembourg to collect EUR 250 million in back taxes from the company, citing a 2003 arrangement that, without any valid justification, permitted the firm to ascribe its profits to a holding company not required to pay taxes.b The EC stated in the tax ruling that Amazon EU had made royalty payments to Amazon Europe Holding Technologies, thereby significantly reducing the former’s taxable profit.c
Nike Group was charged in 2017 with using a subsidiary in Bermuda to hold its trademark logo for non-United States markets. This enabled the subsidiary to charge Nike’s headquarters in the Netherlands royalty fees, hence diverting billions in profits from tax payments in Europe.d The EU is currently investigating whether the Netherlands’ tax rulings between 2006 and 2015 led to an unfair reduction in the tax payments by Nike. At issue is the tax treatment of two Nike group companies based there.e The EU claims that since the Dutch government taxes the two smaller corporate units based “on a limited operating margin based on sales”, royalty payments look greater than typical market terms. Further, the EU argues that while the units get royalties, they have neither employees nor real economic activities.f
Starbucks caused a political and public uproar in 2017 when it revealed that its UK arm earned a GBP 162 million profit and paid GBP 4 million in tax—indicating a tax rate of just 2.8 percent when the corporate tax rate in the UK is 19 percent.g An EC investigation into a Dutch tax ruling extended to the company was under litigation in EU court at the time of writing.h In 2015, the EU ordered the firm to pay back EUR 30 million to the Irish government.
Apple Inc. reached a confidential settlement with the French government in 2019 to pay a decade’s worth of back taxes following a multiyear audit by the national tax authority.i In 2016, the EC stated that Ireland had given Apple undue tax benefits up to EUR 13 billion, which meant that the company paid an effective corporate tax rate of just 1 percent—compared to the normal corporate tax rate of 12.5 percentj—on its 2003 European profits, falling to 0.005 percent in 2014. This ruling resulted in a payment of EUR 14.3 billion (including interest) to the country.k
a See https://www.theguardian.com/technology/2019/feb/05/apple-to-pay-10-years-of-back-taxes-to-franceb See https://www.forbes.com/sites/jwebb/2017/12/18/ikea-follows-apple-and-amazon-in-facing-a-eu-tax-avoidance-investigation/#1d7a0dadb268c See http://europa.eu/rapid/press-release_IP-17-3701_en.htmd See https://www.cbc.ca/news/business/nike-tax-avoidance-tax-loophole-netherlands-bermuda-1.4380596e http://europa.eu/rapid/press-release_IP-19-322_en.htmf See https://www.bloomberg.com/news/articles/2019-01-10/nike-s-dutch-tax-deals-probed-by-eu-in-latest-fiscal-crackdowng See https://www.express.co.uk/news/uk/1020131/starbucks-accused-corporation-tax-avoidanceh See https://mnetax.com/eu-commission-publishes-decision-to-investigate-ikeas-dutch-tax-rulings-26896i In March 2019, France released draft legislation on a 3 percent tax on the largest technology companies. The government believes this new levy would be a “step…towards a fairer and more efficient taxation for the 21st century.” The Economy Minister noted that “digital giants pay 14 percent less tax than small- and medium-sized European companies.” The legislation is referred to by the acronym GAFA, referring to tech giants Google, Apple, Facebook and Amazon. See https://www.theguardian.com/technology/2019/feb/05/apple-to-pay-10-years-of-back-taxes-to-france. The proposed tax will be on digital advertising, personal data sales and other revenue generated by technology firms operating in France and earning over EUR 750 million (USD 840 million) per year globally. See https://www.france24.com/en/20190409-france-lawmakers-back-gafa-digital-tax-tech-giants.j See https://www.theguardian.com/business/2016/aug/30/apple-pay-back-taxes-eu-ruling-ireland-state-aidk http://europa.eu/rapid/press-release_IP-16-2923_en.htm
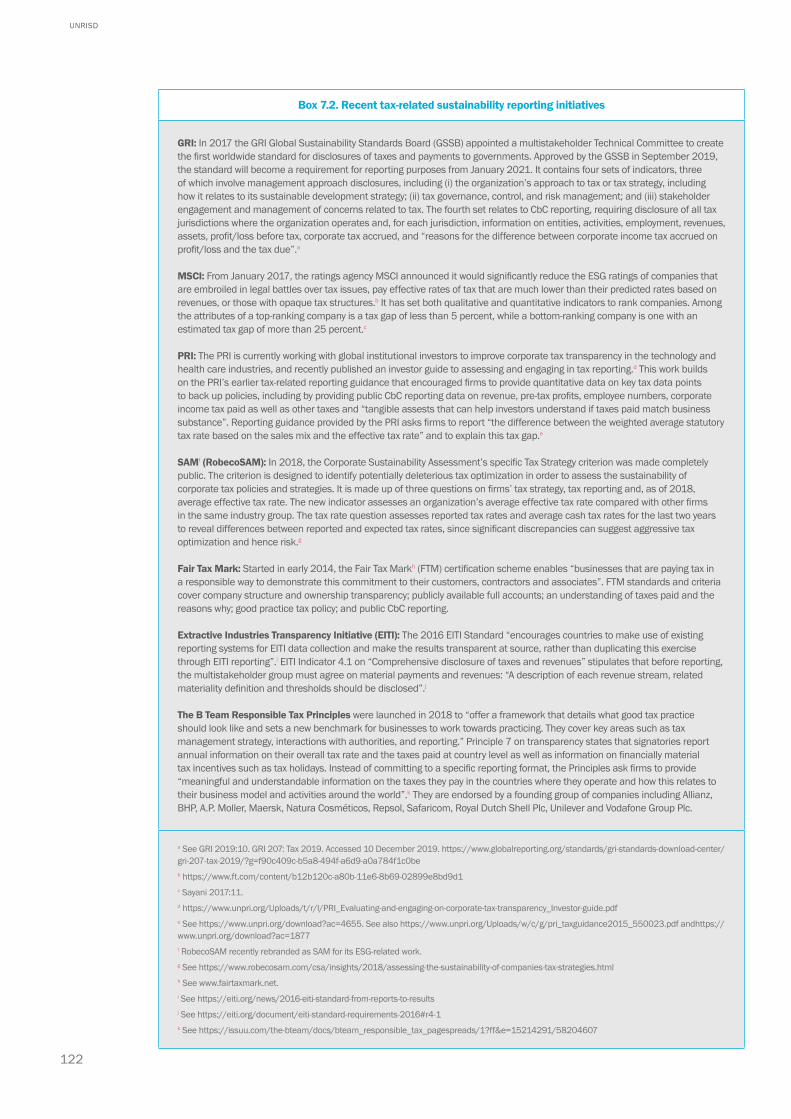
122
UNRISD
Box 7.2. Recent tax-related sustainability reporting initiatives
GRI: In 2017 the GRI Global Sustainability Standards Board (GSSB) appointed a multistakeholder Technical Committee to create the first worldwide standard for disclosures of taxes and payments to governments. Approved by the GSSB in September 2019, the standard will become a requirement for reporting purposes from January 2021. It contains four sets of indicators, three of which involve management approach disclosures, including (i) the organization’s approach to tax or tax strategy, including how it relates to its sustainable development strategy; (ii) tax governance, control, and risk management; and (iii) stakeholder engagement and management of concerns related to tax. The fourth set relates to CbC reporting, requiring disclosure of all tax jurisdictions where the organization operates and, for each jurisdiction, information on entities, activities, employment, revenues, assets, profit/loss before tax, corporate tax accrued, and “reasons for the difference between corporate income tax accrued on profit/loss and the tax due”.a
MSCI: From January 2017, the ratings agency MSCI announced it would significantly reduce the ESG ratings of companies that are embroiled in legal battles over tax issues, pay effective rates of tax that are much lower than their predicted rates based on revenues, or those with opaque tax structures.b It has set both qualitative and quantitative indicators to rank companies. Among the attributes of a top-ranking company is a tax gap of less than 5 percent, while a bottom-ranking company is one with an estimated tax gap of more than 25 percent.c
PRI: The PRI is currently working with global institutional investors to improve corporate tax transparency in the technology and health care industries, and recently published an investor guide to assessing and engaging in tax reporting.d This work builds on the PRI’s earlier tax-related reporting guidance that encouraged firms to provide quantitative data on key tax data points to back up policies, including by providing public CbC reporting data on revenue, pre-tax profits, employee numbers, corporate income tax paid as well as other taxes and “tangible assests that can help investors understand if taxes paid match business substance”. Reporting guidance provided by the PRI asks firms to report “the difference between the weighted average statutory tax rate based on the sales mix and the effective tax rate” and to explain this tax gap.e
SAMf (RobecoSAM): In 2018, the Corporate Sustainability Assessment’s specific Tax Strategy criterion was made completely public. The criterion is designed to identify potentially deleterious tax optimization in order to assess the sustainability of corporate tax policies and strategies. It is made up of three questions on firms’ tax strategy, tax reporting and, as of 2018, average effective tax rate. The new indicator assesses an organization’s average effective tax rate compared with other firms in the same industry group. The tax rate question assesses reported tax rates and average cash tax rates for the last two years to reveal differences between reported and expected tax rates, since significant discrepancies can suggest aggressive tax optimization and hence risk.g
Fair Tax Mark: Started in early 2014, the Fair Tax Markh (FTM) certification scheme enables “businesses that are paying tax in a responsible way to demonstrate this commitment to their customers, contractors and associates”. FTM standards and criteria cover company structure and ownership transparency; publicly available full accounts; an understanding of taxes paid and the reasons why; good practice tax policy; and public CbC reporting.
Extractive Industries Transparency Initiative (EITI): The 2016 EITI Standard “encourages countries to make use of existing reporting systems for EITI data collection and make the results transparent at source, rather than duplicating this exercise through EITI reporting”.i EITI Indicator 4.1 on “Comprehensive disclosure of taxes and revenues” stipulates that before reporting, the multistakeholder group must agree on material payments and revenues: “A description of each revenue stream, related materiality definition and thresholds should be disclosed”.j
The B Team Responsible Tax Principles were launched in 2018 to “offer a framework that details what good tax practice should look like and sets a new benchmark for businesses to work towards practicing. They cover key areas such as tax management strategy, interactions with authorities, and reporting.” Principle 7 on transparency states that signatories report annual information on their overall tax rate and the taxes paid at country level as well as information on financially material tax incentives such as tax holidays. Instead of committing to a specific reporting format, the Principles ask firms to provide “meaningful and understandable information on the taxes they pay in the countries where they operate and how this relates to their business model and activities around the world”.k They are endorsed by a founding group of companies including Allianz, BHP, A.P. Moller, Maersk, Natura Cosméticos, Repsol, Safaricom, Royal Dutch Shell Plc, Unilever and Vodafone Group Plc.
a See GRI 2019:10. GRI 207: Tax 2019. Accessed 10 December 2019. https://www.globalreporting.org/standards/gri-standards-download-center/gri-207-tax-2019/?g=f90c409c-b5a8-494f-a6d9-a0a784f1c0beb https://www.ft.com/content/b12b120c-a80b-11e6-8b69-02899e8bd9d1c Sayani 2017:11.d https://www.unpri.org/Uploads/t/r/l/PRI_Evaluating-and-engaging-on-corporate-tax-transparency_Investor-guide.pdfe See https://www.unpri.org/download?ac=4655. See also https://www.unpri.org/Uploads/w/c/g/pri_taxguidance2015_550023.pdf andhttps://www.unpri.org/download?ac=1877f RobecoSAM recently rebranded as SAM for its ESG-related work.g See https://www.robecosam.com/csa/insights/2018/assessing-the-sustainability-of-companies-tax-strategies.htmlh See www.fairtaxmark.net.i See https://eiti.org/news/2016-eiti-standard-from-reports-to-resultsj See https://eiti.org/document/eiti-standard-requirements-2016#r4-1k See https://issuu.com/the-bteam/docs/bteam_responsible_tax_pagespreads/1?ff&e=15214291/58204607
123
CORPORATE SUSTAINABILITY ACCOUNTING: WHAT CAN AND SHOULD CORPORATIONS BE DOING?
⚫ Concluding remarks
The discussion regarding tax justice suggests that the transformative challenge here involves transitioning from aggressive tax strategies that promote tax dodging to progressive strategies that ensure that corporations pay their fair share of taxes. This requires a closer alignment of not only effective and statutory tax rates but also the geographical distribution of profit allocation and real economic activity. It also requires a new approach to lobbying and the ways in which corporations and their business and trade associations attempt to influence fiscal policy—an issue discussed in Chapter 9. Useful indicators suggested by various sources noted above include:• effective tax as a percentage of pre-tax
profits by group, affiliate and country;195
• pre-tax profit as a percentage of revenues (three-year average, given possible wide fluctuations in annual figures);profit attributed to recognized tax havens and low tax jurisdictions;196
• volume and percentage of group profits;
• tax gap: effective tax rate as a percentage of statutory tax rate;
• effective tax rate as a percentage of the industry rate; and
• the ratio of pre-tax profits to wages by affiliate.197
The above analysis also suggests that the first step must be transparent CbC reporting which (i) shows whether taxes paid reflect real business activity, and (ii) is publicly disclosed. In the case of transnational corporations with operations in multiple countries, a user-friendly form of disclosure coud be, for example, to present data on the effective tax rate in, say, the top three to five countries by revenues, employment and profits.
While tax justice has recently climbed up the corporate sustainability issue ladder, assessment of progress tends to rely on qualitative indicators associated with policies and processes of corporate responsibility or ESG principles and due diligence, such as formulation and disclosure related to a company’s tax strategy and tax policy, board buy-in, training, monitoring and review, responsible lobbying and stakeholder engagement.198
Like the early history of other issue areas associated with ESG reporting, disclosure related to corporate taxation runs the risk of generating qualitative information and narratives that may confuse as much as clarify, and which are not particularly user-friendly. Furthermore, the information provided may make comparisons with other corporations difficult.199
This chapter has identified a number of quantitative indicators that regulators, standard setters, ratings agencies, think tanks, and research and advocacy organizations have adopted or promoted. Establishing thresholds and targets to assess good or bad corporate tax performance over time is difficult not only because of differing opinions as to what is legitimate in terms of commercial practice and tax planning,200 but also because so much depends on public policy and regulation. What should corporations on their own be expected to do?
At a general level, it seems clear that they should be facilitating, rather than resisting, the reform agenda aiming for tax justice and enhanced disclosure and transparency. From the perspective of sustainability accounting and transformative change, corporations can no longer be part and parcel of the aggressive and regressive international taxation agenda alluded to above, where their practices under mine people-centred and equitable de-velopment.
Benchmarks could be used for certain indicators, for example, in relation to the tax gap where a range between, say, 0 to 5 percent might be considered legitimate. An alternative approach to benchmarking has been adopted by the Fair Tax Monitor when assessing government performance. In this case, they score the trend rather than set a fixed time-bound benchmark.201 Progressivity, then, would be reflected in convergence of effective tax rates with statutory and industry norms; regressivity/aggressivity would be reflected in divergence. For corporations operating in multiple countries, fairness would be reflected in trends indicating a reduction of misalignment between taxes paid and economic activity by country.
195 When reconciling or explaining the relationship between effective tax and profits, PRI guidance notes that it is important for multinationals to go beyond the usual practice of using the statutory rate of the home country and use instead the weighted average statutory rate (PRI 2018a:16).
196 The guidance that accompanies the Responsible 100 Scorecard, organized by Profit Through Ethics Ltd, states that “large and multinational corporations must…explain their use of tax havens and low tax jurisdictions and how much profit is attributable to their use”. See: “Tracking changes in questions and scorecards.” Accessed 30 November 2019. https://www.responsible100.com/questions/diff/tax-transparency/3/4/
197 The ratio of pre-tax profits to wages is to some extent indicative not only of the fairness of the worker share of economic returns over time but also of where economic activity is misaligned with tax liability. Zucman reports that in tax haven affiliates the ratio of pre-tax profits to wages (approximately 350 to 1) vastly exceeds that of non-haven affiliates (less than 50 to 1). See Zucman 2019.
198 See, for example, Responsible 100 criteria for scoring “excellent”. Accessed 15 June 2020. http://www.profitthrough ethics.com/about/faq/
199 Critiquing aspects of the B Team Principle related to transparency (see Box 7.2), Cobham makes the point that it not only “stops well short of requiring any kind of consistent reporting [but Principle 7 E in particular] sidesteps the need for any kind of comparable data that could be used objectively to evaluate one multinational against another—to ascertain whether any or all of the other principles have actually given rise to any specific outcome in terms of tax behaviour. Or to evaluate any given multinational’s performance over time. Or the performance of multinationals in one country against their performance in another” (Cobham 2018). This type of comparison, he argues, is possible with the current public reporting by extractive firms or financial firms in the European Union, as well as with the OECD BEPS standards for aligning taxes paid with declared profits with “real economic activity” by country.
200 See Faccio and Fitzgerald 2018:76, in relation to Vodafone.
201 Make Tax Fair, Oxfam Novib, Tax Justice Network-Africa 2015. https://maketaxfair.net/ftm/about-fair-tax-monitor/
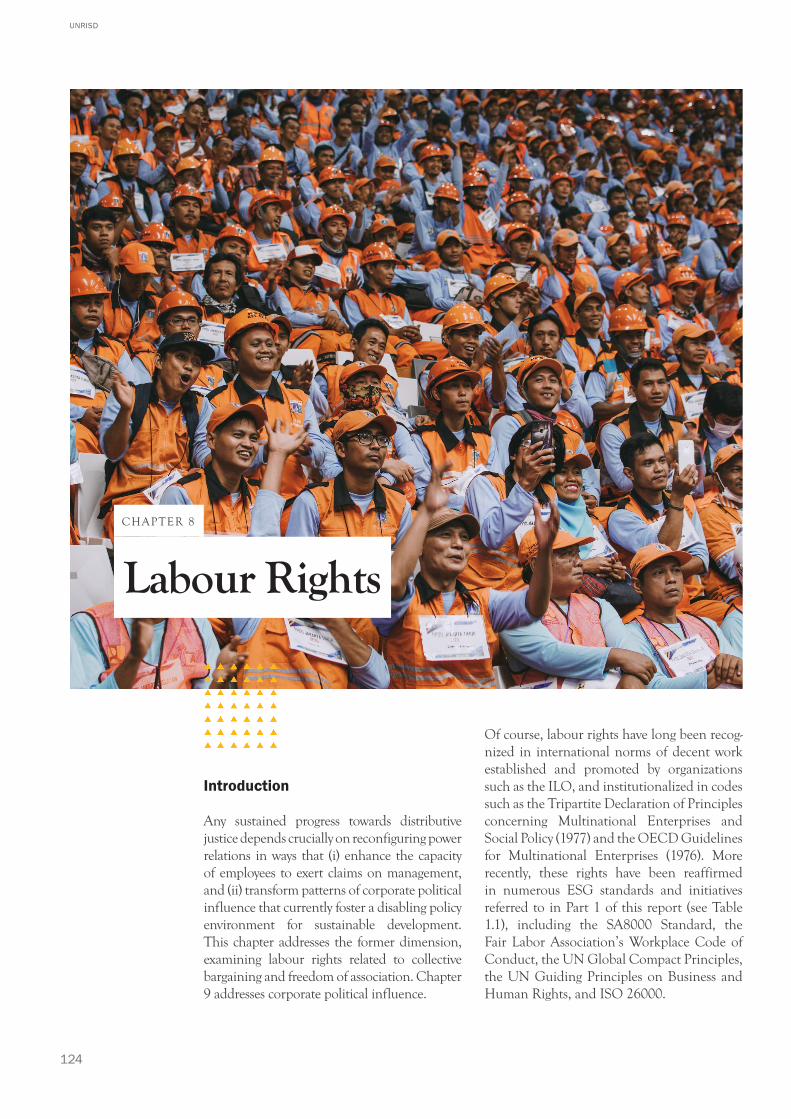
124
UNRISD
Introduction
Any sustained progress towards distributive justice depends crucially on reconfiguring power relations in ways that (i) enhance the capacity of employees to exert claims on management, and (ii) transform patterns of corporate political influence that currently foster a disabling policy environment for sustainable development. This chapter addresses the former dimension, examining labour rights related to collective bargaining and freedom of association. Chapter 9 addresses corporate political influence.
Of course, labour rights have long been recog-nized in international norms of decent work established and promoted by organizations such as the ILO, and institutionalized in codes such as the Tripartite Declaration of Principles concerning Multinational Enterprises and Social Policy (1977) and the OECD Guidelines for Multinational Enterprises (1976). More recently, these rights have been reaffirmed in numerous ESG standards and initiatives referred to in Part 1 of this report (see Table 1.1), including the SA8000 Standard, the Fair Labor Association’s Workplace Code of Conduct, the UN Global Compact Principles, the UN Guiding Principles on Business and Human Rights, and ISO 26000.
Labour Rights
CHAPTER 8

125
CORPORATE SUSTAINABILITY ACCOUNTING: WHAT CAN AND SHOULD CORPORATIONS BE DOING?
As also noted in Part 1, different strands of social science analysis concerning the causes of, and solutions to, the so-called wicked problems of distributive justice, inequality and precarious employment in the 21st century place considerable store in the role of labour rights and workplace democracy to improve the human condition.202
Yet despite this normative and analytical backing for labour rights, real-world trends have tended to move in the opposite direction, notably in the context of global and technological changes in labour markets (Visser 2019), reinforced by public policy agendas and corporate strategies favouring labour market flexibilization and outsourcing. The two conventional indicators associated with core labour rights—namely, trade union density (percentage of workers belonging to a trade union) and collective bargaining coverage (percentage of workers covered by collective bargaining agreements)—reveal a declining trend over several decades. Despite the wide recognition of freedom of association and collective bargaining within mainstream ESG discourse and reporting guidelines, this trend shows no sign of reversal. Indeed, as Visser et al. note:
collective bargaining has come under pressure in many countries since the financial crisis of 2008. This followed a longer-term decline in union membership rates… Data on changes in bargaining coverage rates from 2008 to 2013 for 48 countries shows that, on average, there has been a drop in bargaining coverage of 4.6 percent, compared with an average decline in union density in the same period and for the same group of countries of 2.3 percent (2017:1).
There is ample room for corporations to act within their sphere of influence to alter the current trajectory of labour rights erosion. While bargaining at the level of enterprises is only one of several levels where collective bargaining occurs, corporations have the chance to modify this trajectory of change, most directly when collective bargaining occurs at the sectoral level as well—in particular when the corporation in question is a dominant industry player—and nationally, through participation and influence in employers’ associations.203
This chapter examines indicators that can demonstrate whether corporations are facilitating the necessary reconfiguration of power relations within corporate governance regimes through actions that strengthen core labour rights. It outlines several concerns related to underreporting on labour rights and inconsistency in the type of data disclosed, and goes on to emphasize the need for transnational corporations to provide disaggregated data that reveal variations in labour rights by country where major affiliates and suppliers are located, rather than a general group-wide figure. This in turn requires transparency regarding the location of suppliers. The chapter ends by calling attention to what are often blind spots within reporting that are key for assessing corporate sustainability performance in relation to labour standards and labour rights. They include the scale of reliance on temporary labour and subcontracting via labour brokers, and the extent to which a company’s pricing and procurement policy or practices contradict—or align with—the sustainability objectives of both lead corporations and suppliers.
Sustainability disclosure as if labour rights mattered
A critical first step within sustainability accounting is to reassert the importance of labour rights by correcting a bias that often characterizes disclosure related to labour standards. Both public policy and corporate policy tend to focus more on management systems and performance related to social protection or working conditions, than on the realization of labour rights. Referring to public policies, Bosch and Lehndorff (citing Sengenberger 1994) point to the emphasis on “protective” versus “participative” standards that promote workers’ empowerment within governance systems via collective bargaining, freedom of association, and giving workers a voice and vote in decision-making forums such as pay committees and company boards: “Participative standards confer consultation or co-determination rights on employees or their representatives and organisations” (2017:37). Exercising these rights is key to addressing those aspects of inequality associated with both discrimination and income distribution.204
202 See Piketty 2014; Stiglitz 2018; Reich 2007; Jackson 2009; Standing 2011.
203 Beyond the micro level of the enterprise or plant, collective bargaining negotiations between independent unions and employers, and their respective associations, can also take place via forms of coordinated bargaining at national and industry (or sector-wide) levels. Each type of bargaining has its advantages and disadvantages, but industry-wide or economy-wide bargaining tends to be more inclusive of a wider range of workers. Under enterprise-level bargaining, skilled workers often benefit more than unskilled workers (Visser et al. 2017). It has also been found that a hybrid system, involving “vertical coordination, or ‘articulation’, between levels is critical for flexibility, sustainability and performance” (Koukiadaki and Grimshaw 2016:26).
204 See also ILO 2017a.
126
UNRISD
Similarly, in their assessment of the impact of the Ethical Trading Initiative’s (ETI) code of labour practice in worksites in India, South Africa and Viet Nam, Barrientos and Smith (2012) observe some progress related to “outcome standards” such as health and safety, child labour, payment of minimum wages, working hours and the social wage (for example, health insurance and pensions). Far less had been achieved in relation to “process rights” associated with the empowerment of workers to exert claims on management through collective bargaining and freedom of association.
Additionally, where workplace scandals and disasters have forced corporations to ratchet up their sustainability performance, the focus of attention is often on the immediate imperative of “fixing” occupational health and safety (OHS) problems rather than a key structural condition that underpins lack of safety—namely weak or non-existent unionization and collective bargaining. This narrow focus has been evident, for example, in the follow-up to the Rana Plaza factory collapse in Bangladesh that killed and injured well over 3,000 people in 2013. While many companies and investors responded with necessary interventions, albeit slowly, the focus was very much on protective measures associated with OHS. This prompted a group of more than 200 investors who are signatories to the Principles for Responsible Investment (PRI) to recommend “broaden[ing] the current accord to include a focus on freedom of association and collective bargaining and integrat[ing] this into the complaints mechanism process and additional parts of the supply chain where similar risks exist” (PRI 2017:7).
Recent research by the Alliance for Corporate Transparency205 points to concerns within corporate sustainability reporting related not only to labour rights, but also to other key performance issues and indicators addressed in this report. Among 105 large corporations in 10 EU countries, the study notes that:
• “Very few … include outsourced workers in their perspective: only 25% inform about how many there are in the workforce, but less than 5% include them in their reporting on equal opportunities, collective bargaining or salaries.
• “[O]nly 10% of companies report on the living wage, and very few disclose country-by-country information on region-sensitive issues such equal opportunities (6%) and freedom of association (10%), even though a majority of companies included in the research have operations outside Europe (80%).
• “While 80% of companies provide information on anti-discrimination or equal opportunities policies, only 36% report on the effects of these policies” (Alliance for Corporate Transparency 2019).206
In an assessment of how 119 companies in three high-risk sectors207 are responding to norms and regulations aimed at eliminating the use of forced labour in their supply chains, the KnowTheChain initiative208 notes that of seven actionable areas,209 the weakest responses related to recruitment practices and “worker voice”:210 “Yet”, the study notes, “these are the two areas assessed by the benchmark that have the most direct impact on workers’ lives”. Indeed, only 13 percent of the companies disclosed engaging with global or local trade unions to support freedom of association in their supply chains (KnowTheChain 2019:15).
The importance of disaggregated and time series data
While reporting frameworks such as the GRI and SASB (see Annex 8) generally call on companies to disclose the percentage of employees covered by collective bargaining agreements, few appear to do so. Poor disclosure related to labour rights is reflected not only in organization-wide percentage metrics, but also in (i) lack of data disaggregated by region or country where a corporation operates, (ii) absence of supply chain mapping, and (iii) the presentation of annual data snapshots as opposed to time-series data.
Even corporations that might be expected to be leaders in reporting on labour rights show a very mixed record. This reporting weakness emerges from an examination of the sustainability or integrated annual
205 Involving civil society organizations and experts, the Alliance for Corporate Transparency is a three-year research project that aims to provide guidance to companies and regulators via an assessment of whether the 1,000 largest companies in the European Union are providing the type of information required by the EU Directive on non-financial reporting (see Part 1 and Annex 4).
206 See https://alliancefor corporatetransparency.org/news/companies-failing.html
207 These are information and communications technology (ICT), food and beverage, and apparel and footwear.
208 KnowTheChain is a partnership of Humanity United, the Business & Human Rights Resource Centre, Sustainalytics, and Verité aimed at benchmarking progress, promoting transparency and providing guidance related to forced labour abuses within supply chains. See https://knowthechain.org/about-us/
209 These are: (i) commitment and governance; (ii) traceability and risk assessment; (iii) purchasing practices; (iv) recruitment; (v) worker voice; (vi) monitoring; and (vii) remedy.
210 “Worker voice” is understood in terms of “enabling workers to understand and fully exercise their rights [which] is critical for vulnerable workers such as migrant workers, who may not be familiar with their rights and unable to exercise them. In practice, companies can improve labor rights practices by supporting an enabling environment for independent unions and worker associations” (KnowTheChain 2019:15).
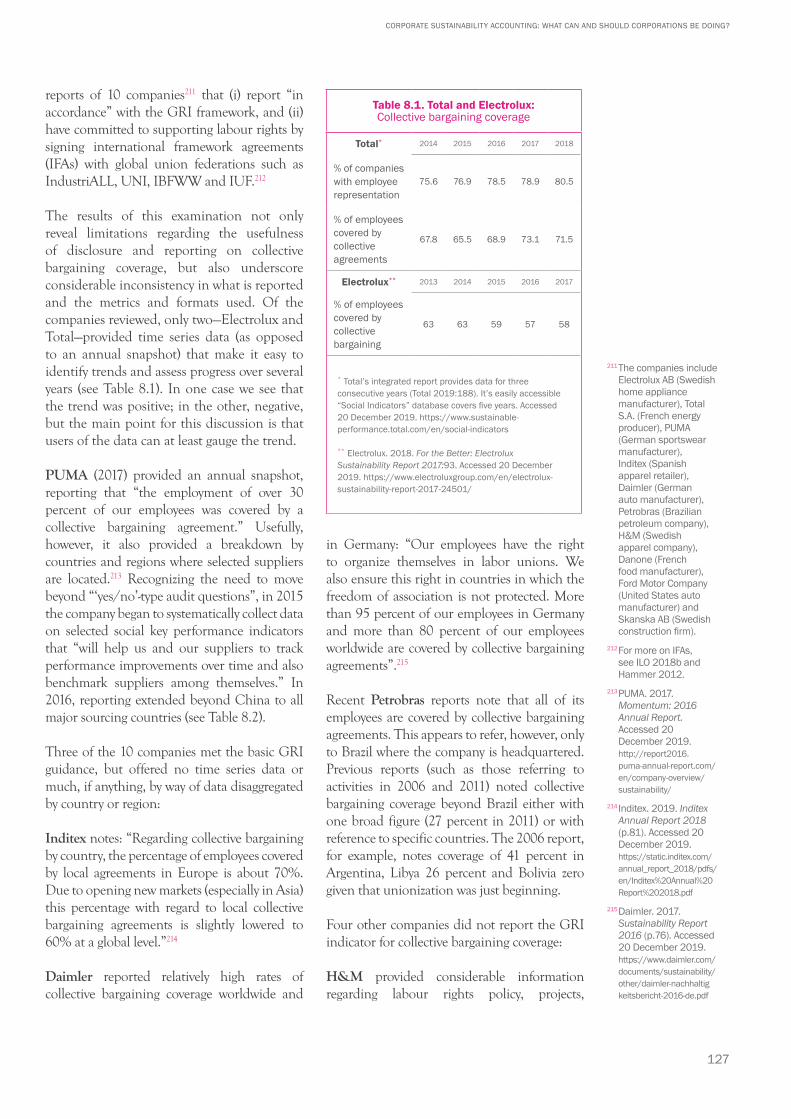
127
CORPORATE SUSTAINABILITY ACCOUNTING: WHAT CAN AND SHOULD CORPORATIONS BE DOING?
reports of 10 companies211 that (i) report “in accordance” with the GRI framework, and (ii) have committed to supporting labour rights by signing international framework agreements (IFAs) with global union federations such as IndustriALL, UNI, IBFWW and IUF.212
The results of this examination not only reveal limitations regarding the usefulness of disclosure and reporting on collective bargaining coverage, but also underscore considerable inconsistency in what is reported and the metrics and formats used. Of the companies reviewed, only two—Electrolux and Total—provided time series data (as opposed to an annual snapshot) that make it easy to identify trends and assess progress over several years (see Table 8.1). In one case we see that the trend was positive; in the other, negative, but the main point for this discussion is that users of the data can at least gauge the trend.
PUMA (2017) provided an annual snapshot, reporting that “the employment of over 30 percent of our employees was covered by a collective bargaining agreement.” Usefully, however, it also provided a breakdown by countries and regions where selected suppliers are located.213 Recognizing the need to move beyond “‘yes/no’-type audit questions”, in 2015 the company began to systematically collect data on selected social key performance indicators that “will help us and our suppliers to track performance improvements over time and also benchmark suppliers among themselves.” In 2016, reporting extended beyond China to all major sourcing countries (see Table 8.2).
Three of the 10 companies met the basic GRI guidance, but offered no time series data or much, if anything, by way of data disaggregated by country or region:
Inditex notes: “Regarding collective bargaining by country, the percentage of employees covered by local agreements in Europe is about 70%. Due to opening new markets (especially in Asia) this percentage with regard to local collective bargaining agreements is slightly lowered to 60% at a global level.”214
Daimler reported relatively high rates of collective bargaining coverage worldwide and
in Germany: “Our employees have the right to organize themselves in labor unions. We also ensure this right in countries in which the freedom of association is not protected. More than 95 percent of our employees in Germany and more than 80 percent of our employees worldwide are covered by collective bargaining agreements”.215
Recent Petrobras reports note that all of its employees are covered by collective bargaining agreements. This appears to refer, however, only to Brazil where the company is headquartered. Previous reports (such as those referring to activities in 2006 and 2011) noted collective bargaining coverage beyond Brazil either with one broad figure (27 percent in 2011) or with reference to specific countries. The 2006 report, for example, notes coverage of 41 percent in Argentina, Libya 26 percent and Bolivia zero given that unionization was just beginning.
Four other companies did not report the GRI indicator for collective bargaining coverage:
H&M provided considerable information regarding labour rights policy, projects,
Table 8.1. Total and Electrolux: Collective bargaining coverage
Total* 2014 2015 2016 2017 2018
% of companies with employee representation
75.6 76.9 78.5 78.9 80.5
% of employees covered by collective agreements
67.8 65.5 68.9 73.1 71.5
Electrolux** 2013 2014 2015 2016 2017
% of employees covered by collective bargaining
63 63 59 57 58
* Total’s integrated report provides data for three consecutive years (Total 2019:188). It’s easily accessible “Social Indicators” database covers five years. Accessed 20 December 2019. https://www.sustainable-performance.total.com/en/social-indicators
** Electrolux. 2018. For the Better: Electrolux Sustainability Report 2017:93. Accessed 20 December 2019. https://www.electroluxgroup.com/en/electrolux-sustainability-report-2017-24501/
211 The companies include Electrolux AB (Swedish home appliance manufacturer), Total S.A. (French energy producer), PUMA (German sportswear manufacturer), Inditex (Spanish apparel retailer), Daimler (German auto manufacturer), Petrobras (Brazilian petroleum company), H&M (Swedish apparel company), Danone (French food manufacturer), Ford Motor Company (United States auto manufacturer) and Skanska AB (Swedish construction firm).
212 For more on IFAs, see ILO 2018b and Hammer 2012.
213 PUMA. 2017. Momentum: 2016 Annual Report. Accessed 20 December 2019. http://report2016.puma-annual-report.com/en/company-overview/sustainability/
214 Inditex. 2019. Inditex Annual Report 2018 (p.81). Accessed 20 December 2019. https://static.inditex.com/annual_report_2018/pdfs/en/Inditex%20Annual%20Report%202018.pdf
215 Daimler. 2017. Sustainability Report 2016 (p.76). Accessed 20 December 2019. https://www.daimler.com/documents/sustainability/other/daimler-nachhaltig keitsbericht-2016-de.pdf

128
UNRISD
education, training, grievances procedures and so forth, but not the recommended quantitative data. As regards whether labour rights goals were being met, goal attainment was generally described as “on track”.216
Danone provided no quantitative collective bargaining coverage data, apart from the percentage of entities (79 percent) having implemented regular collective labour agree-ment negotiations with social partners.217
Ford Motor Company provided considerable quantitative data on such aspects as en-vironmental performance and gender equal-ity, but information regarding freedom of association and collective bargaining was absent in both data and narrative reporting, apart from restating the principle that “we respect employees’ right to freedom of association and to collectively bargain”.218
Skanska did not reference collective bargain-ing, noting only the UN Global Compact Principal that businesses should uphold freedom of association and the right to collec-tive bargaining, and that it does not report on collective bargaining coverage at the Group level.219
Country-by-country and supply chain reporting
The challenge related to reporting on core labour rights involves not only compliance with the basic indicators recommended by standard setters, but also greater transparency regarding performance along the supply chain. Presenting one aggregate global figure for trade union density and collective bargaining coverage may mask the wide variation in labour rights that can exist by region and country. This points to the need for CbC reporting, at least for countries where key suppliers are located.
Data provided by PUMA from its first global assessment of social key performance indicators in selected suppliers reveal significant variations in collective bargaining coverage by country (see Table 8.2).
And as noted in PUMA’s narrative reporting, this assessment has drawn the company’s attention to “a clear need to promote collective bargaining on the Indian subcontinent and some additional countries” (PUMA 2016).
Public disclosure of suppliersDisasters, such as the Rana Plaza factory collapse in Bangladesh, have served to reveal situations where brands do not even know where their products are being produced. Such high profile supply chain events and exposés have led corporations in sectors such as ICT, toys, apparel, footwear, food and supermarkets to pay far greater attention to labour standards and environmental conditions in their supply chains. Regulatory pressures have also built up considerably in recent years.220 Several laws
Table 8.2. PUMA: Supply chain workers covered by a collective bargaining agreement
Latin America(average of 9 suppliers)
Argentina 97
Brazil 100
El Salvador 0
Mexico 44
South Asia (average of 14 suppliers)
Bangladesh 0
India 0
Pakistan 0
East and Southeast Asia (average of 39 suppliers)
China 80
Cambodia 36
Indonesia 67
Malaysia 0
Viet Nam 92
Europe, Middle East, Africa (EMEA) (average of 8 suppliers)
Georgia 0
Madagascar 0
Mauritius 43
Turkey 11
Source: PUMA 2016
216 For example: “Our goal is for all of our strategic supplier factories to have democratically elected and functional workplace representation in place by 2018 at the latest” (H&M 2016. Conscious Actions: Sustainability Report 2015:54). Accessed 15 December 2019. https://about.hm.com/content/dam/hmgroup/groupsite/documents/masterlanguage/CSR/reports/2015%20Sustainability%20report/HM_SustainabilityReport_ 2015_final_FullReport.pdf
217 Danone. 2019. Danone Registration Document 2018, Annual Financial Report (p.199). Accessed 20 June 2020. https://www.danone.com/content/dam/danone-corp/danone-com/investors/en-all-publications/2018/registrationdocuments/ Danone%20-%20Registration%20Document%202018.pdf
218 Ford. 2020. Our Future Is in Motion: What Drives Us? Sustainability Report 2020 (p.23). Accessed 15 June 2020. https://corporate.ford.com/microsites/sustainability-report-2020/assets/files/sr20.pdf
219 Skanska. 2019. Annual and Sustainability Report 2018. Accessed 20 June 2020. https://group.skanska.com/499a5b/siteassets/investors/reports-publications/annual-reports/2018/annual-and-sustainability-report-2018.pdf
220 See ECCJ 2018; Marshall et al. 2016; Mares 2018.
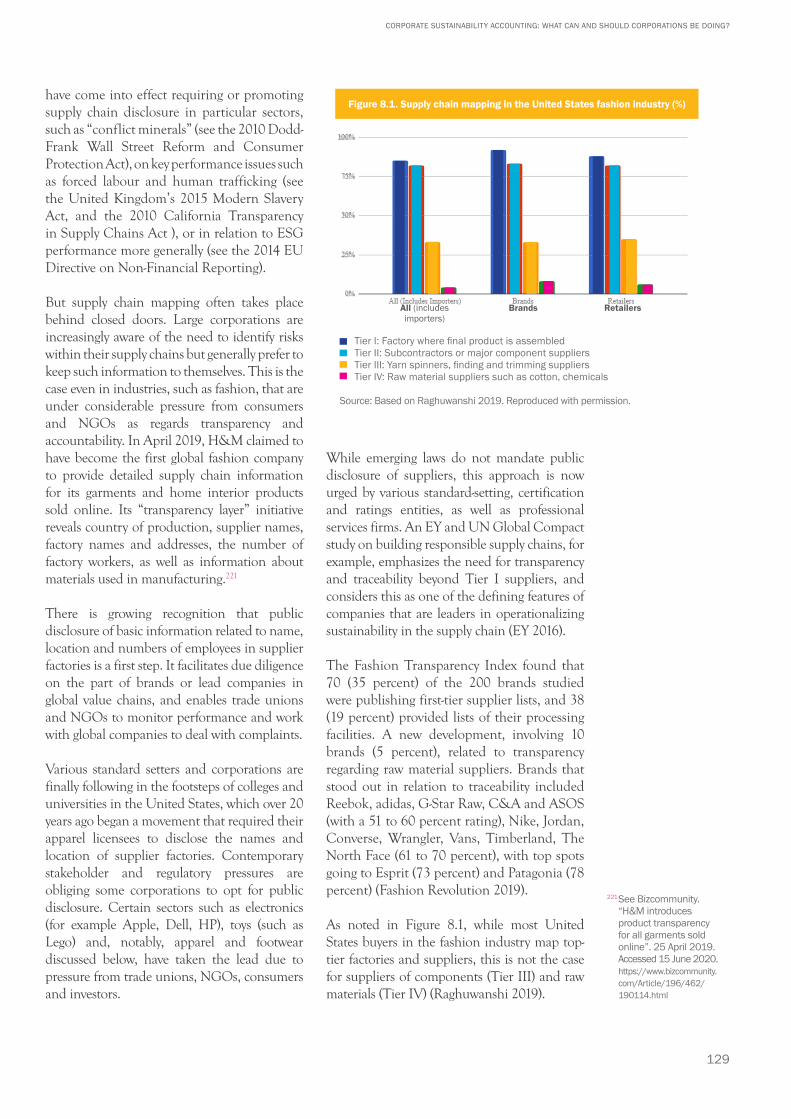
129
CORPORATE SUSTAINABILITY ACCOUNTING: WHAT CAN AND SHOULD CORPORATIONS BE DOING?
have come into effect requiring or promoting supply chain disclosure in particular sectors, such as “conflict minerals” (see the 2010 Dodd-Frank Wall Street Reform and Consumer Protection Act), on key performance issues such as forced labour and human trafficking (see the United Kingdom’s 2015 Modern Slavery Act, and the 2010 California Transparency in Supply Chains Act ), or in relation to ESG performance more generally (see the 2014 EU Directive on Non-Financial Reporting).
But supply chain mapping often takes place behind closed doors. Large corporations are increasingly aware of the need to identify risks within their supply chains but generally prefer to keep such information to themselves. This is the case even in industries, such as fashion, that are under considerable pressure from consumers and NGOs as regards transparency and accountability. In April 2019, H&M claimed to have become the first global fashion company to provide detailed supply chain information for its garments and home interior products sold online. Its “transparency layer” initiative reveals country of production, supplier names, factory names and addresses, the number of factory workers, as well as information about materials used in manufacturing.221
There is growing recognition that public disclosure of basic information related to name, location and numbers of employees in supplier factories is a first step. It facilitates due diligence on the part of brands or lead companies in global value chains, and enables trade unions and NGOs to monitor performance and work with global companies to deal with complaints.
Various standard setters and corporations are finally following in the footsteps of colleges and universities in the United States, which over 20 years ago began a movement that required their apparel licensees to disclose the names and location of supplier factories. Contemporary stakeholder and regulatory pressures are obliging some corporations to opt for public disclosure. Certain sectors such as electronics (for example Apple, Dell, HP), toys (such as Lego) and, notably, apparel and footwear discussed below, have taken the lead due to pressure from trade unions, NGOs, consumers and investors.
While emerging laws do not mandate public disclosure of suppliers, this approach is now urged by various standard-setting, certification and ratings entities, as well as professional services firms. An EY and UN Global Compact study on building responsible supply chains, for example, emphasizes the need for transparency and traceability beyond Tier I suppliers, and considers this as one of the defining features of companies that are leaders in operationalizing sustainability in the supply chain (EY 2016).
The Fashion Transparency Index found that 70 (35 percent) of the 200 brands studied were publishing first-tier supplier lists, and 38 (19 percent) provided lists of their processing facilities. A new development, involving 10 brands (5 percent), related to transparency regarding raw material suppliers. Brands that stood out in relation to traceability included Reebok, adidas, G-Star Raw, C&A and ASOS (with a 51 to 60 percent rating), Nike, Jordan, Converse, Wrangler, Vans, Timberland, The North Face (61 to 70 percent), with top spots going to Esprit (73 percent) and Patagonia (78 percent) (Fashion Revolution 2019).
As noted in Figure 8.1, while most United States buyers in the fashion industry map top-tier factories and suppliers, this is not the case for suppliers of components (Tier III) and raw materials (Tier IV) (Raghuwanshi 2019).
Figure 8.1. Supply chain mapping in the United States fashion industry (%)
100%
75%
50%
25%
0%
Tier I: Factory where final product is assembledTier II: Subcontractors or major component suppliersTier III: Yarn spinners, finding and trimming suppliersTier IV: Raw material suppliers such as cotton, chemicals
Source: Based on Raghuwanshi 2019. Reproduced with permission.
All (includes importers)
Brands Retailers
221 See Bizcommunity. “H&M introduces product transparency for all garments sold online”. 25 April 2019. Accessed 15 June 2020. https://www.bizcommunity.com/Article/196/462/ 190114.html
130
UNRISD
While the Fashion Transparency Index has noted some progress in the depth and breadth of transparency since it was first published in 2016, very few brands disclose information related to labour rights. While 77 percent of brands publish a policy on freedom of association and collective bargaining in their supplier code of conduct, just 9 percent disclose the number of workers in the supply chain covered by collective bargaining agreements. Just 4 percent disclose the number of supplier facilities with independent democratically elected trade unions.
Some multistakeholder standard setters have recently placed far more emphasis on public disclosure of factory information. In early 2019, the Board of the Fair Labor Association (FLA) voted to oblige its 59 affiliated companies222 in the garment industry to publish factory lists. While the scope of disclosure (in terms of type of information and the different tiers of suppliers) remains to be decided, trade union organizations and NGOs that are members of the Transparency Pledge Coalition223 will monitor implementation.
The Ethical Trading Initiative224 has also emphasized the need for public disclosure not only in garments but also other industries and sectors such as food, agriculture, fishing and supermarkets where its approximately 100 affiliated companies operate. Recognizing that considerable change was needed in its approach to transparency, in 2017 the ETI laid out a comprehensive business case for public disclosure and positioned transparency as a priority element of its strategy to 2020 (ETI 2017).
From a sustainability perspective, public disclosure of such information is critical. Not only do various standard setters increasingly demand such reporting, but withholding such information undermines some of the most important drivers of transformative change, namely monitoring, advocacy, dialogue and bargaining involving NGOs, trade unions and civil society networks. As noted by the Assistant Secretary General of the IndustriALL Global Union, Jenny Holdcroft, “knowing the names of major buyers from factories gives workers
and their unions a stronger leverage, crucial for a timely solution when resolving conflicts, whether it be refusal to recognize the union, or unlawful sackings for demanding their rights. It also provides the possibility to create a link from the worker back to the customer and possibly media to bring attention to their issues” (Fashion Revolution 2019:11).
Subcontracting via labour brokersThe disclosure challenge associated with labour rights within the supply chain does not end here. While attention to labour rights issues in the supply chain is growing, it is mainly limited to fixed-contract employees engaged directly by the enterprise in question. Subcontracted labour provided through brokers is often ignored in this process of ratcheting up disclosure related to labour rights and supply chain mapping.
Subcontracting constitutes one of the key structural drivers underpinning the de terioration of labour rights. Shamir (2016:229) sums up the concern as follows:
Subcontracting—the practice of using intermediaries to contract workers, whether through temp agencies, manpower agencies, franchise, or other multilayered contracting—is an increasingly popular pattern of em ploy-ment worldwide. Whether justified from a business perspective or not, subcontracting has dire implications for workers’ rights: it insulates the beneficiary of their labor from direct legal obligations to the workers’ wages and working conditions and drastically reduces their ability to effectively unionize.
Yet disclosure on this aspect is minimal. If corporations are to facilitate the “revitalization of collective representation” and, more specifically, the transition to formalization and inclusion of informal economy workers called for by the Global Commission on the Future of Work (2019:41), then it is crucial for them to be transparent about employment in supply chains and the use of subcontracted labour. As illustrated by the case of Unilever, this is an emerging issue within sustainability accounting (see Box 8.1).
222 See https://www.fairlabor.org/affiliates/participating-companies?page=3
223 Members include: Clean Clothes Campaign, Human Rights Watch, IndustriALL, International Corporate Accountability Roundtable, International Labor Rights Forum, International Trade Union Confederation, Maquila Solidarity Network, UNI Global Union, and Worker Rights Consortium.
224 The ETI promotes human rights due diligence and collaborative multistakeholder best practice learning, and assesses “continuous improvement” among member companies according to its internationally recognized Base Code of labour standards.
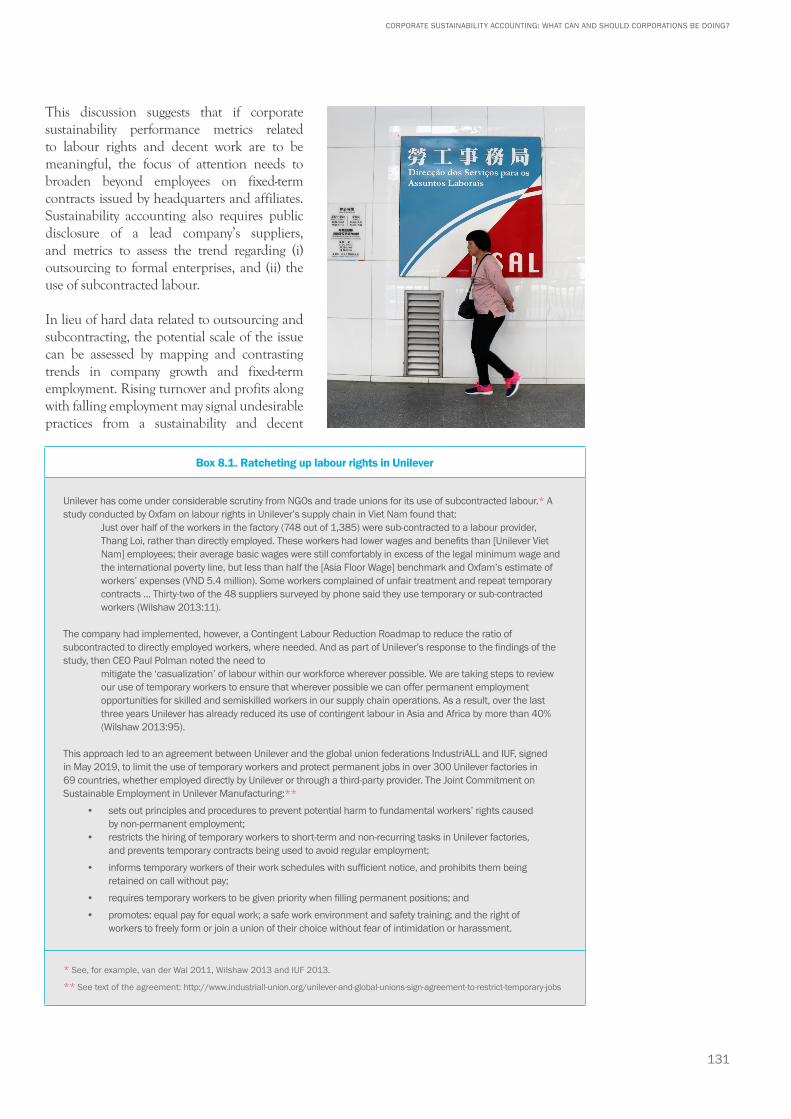
131
CORPORATE SUSTAINABILITY ACCOUNTING: WHAT CAN AND SHOULD CORPORATIONS BE DOING?
This discussion suggests that if corporate sustainability performance metrics related to labour rights and decent work are to be meaningful, the focus of attention needs to broaden beyond employees on fixed-term contracts issued by headquarters and affiliates. Sustainability accounting also requires public disclosure of a lead company’s suppliers, and metrics to assess the trend regarding (i) outsourcing to formal enterprises, and (ii) the use of subcontracted labour.
In lieu of hard data related to outsourcing and subcontracting, the potential scale of the issue can be assessed by mapping and contrasting trends in company growth and fixed-term employment. Rising turnover and profits along with falling employment may signal undesirable practices from a sustainability and decent
Box 8.1. Ratcheting up labour rights in Unilever
Unilever has come under considerable scrutiny from NGOs and trade unions for its use of subcontracted labour.* A study conducted by Oxfam on labour rights in Unilever’s supply chain in Viet Nam found that:
Just over half of the workers in the factory (748 out of 1,385) were sub-contracted to a labour provider, Thang Loi, rather than directly employed. These workers had lower wages and benefits than [Unilever Viet Nam] employees; their average basic wages were still comfortably in excess of the legal minimum wage and the international poverty line, but less than half the [Asia Floor Wage] benchmark and Oxfam’s estimate of workers’ expenses (VND 5.4 million). Some workers complained of unfair treatment and repeat temporary contracts ... Thirty-two of the 48 suppliers surveyed by phone said they use temporary or sub-contracted workers (Wilshaw 2013:11).
The company had implemented, however, a Contingent Labour Reduction Roadmap to reduce the ratio of subcontracted to directly employed workers, where needed. And as part of Unilever’s response to the findings of the study, then CEO Paul Polman noted the need to
mitigate the ‘casualization’ of labour within our workforce wherever possible. We are taking steps to review our use of temporary workers to ensure that wherever possible we can offer permanent employment opportunities for skilled and semiskilled workers in our supply chain operations. As a result, over the last three years Unilever has already reduced its use of contingent labour in Asia and Africa by more than 40% (Wilshaw 2013:95).
This approach led to an agreement between Unilever and the global union federations IndustriALL and IUF, signed in May 2019, to limit the use of temporary workers and protect permanent jobs in over 300 Unilever factories in 69 countries, whether employed directly by Unilever or through a third-party provider. The Joint Commitment on Sustainable Employment in Unilever Manufacturing:**
• sets out principles and procedures to prevent potential harm to fundamental workers’ rights caused by non-permanent employment;
• restricts the hiring of temporary workers to short-term and non-recurring tasks in Unilever factories, and prevents temporary contracts being used to avoid regular employment;
• informs temporary workers of their work schedules with sufficient notice, and prohibits them being retained on call without pay;
• requires temporary workers to be given priority when filling permanent positions; and• promotes: equal pay for equal work; a safe work environment and safety training; and the right of
workers to freely form or join a union of their choice without fear of intimidation or harassment.
* See, for example, van der Wal 2011, Wilshaw 2013 and IUF 2013.
** See text of the agreement: http://www.industriall-union.org/unilever-and-global-unions-sign-agreement-to-restrict-temporary-jobs
132
UNRISD
work perspective. An exercise conducted for this project found that since the turn of the millennium in 2000, Unilever’s turnover (in euros) had increased by roughly 10 percent, and net profits by approximately 500 percent, while the number of employees had declined roughly by half.225 In the 10 years from 2009 to 2018, turnover increased 28 percent and profits increased 150 percent while employment declined 3 percent.
While increased labour productivity (increasing revenues or profits per unit of labour) is generally considered positive from the perspective of efficiency, its implications for sustainable development are less clear. From a sustainability perspective, rapidly falling rates of full-time employees contracted directly by the corporation could signal a red flag that merits further inquiry. Furthermore, such a decline appears to run counter to guidance by standard setters such as the Ethical Trading Initiative and SA8000 that call for a commitment to regular or stable employment (Wilshaw et al. 2013).
Responsible purchasing practices
Beyond the potential for further outsourcing and subcontracting in contexts where labour rights, working conditions and wages are improved for some workers, there is another red flag or contradiction that needs to be highlighted. Power imbalances within global value chains, as well as corporate culture and incentives associated with short-termism and the single bottom line, can easily result in a situation where suppliers find themselves incurring additional costs as a result of so-called sustainability measures adopted by lead companies (Blasi and Bair 2019) and/or purchasing practices that result in short lead times or unplanned changes in orders. As Lee notes:
global buyers’ supply chain strategies, especially sourcing and purchasing practices, have drawn considerable attention as the underlying causes of many labour violations in supplier factories, and the differentiation of labour conditions between regular and temporary workers. Post-crisis [global supply chains (GSCs)] have intensified
the possibility of segmented social up-grading and the wider use of informal work in GSCs (Lee 2016:22).
Any discussion of the sustainability performance of large corporations, therefore, needs to go hand in hand with that of responsible sourcing and purchasing practices (Blasi and Bair 2019; Merk 2005). Concerns related to responsible sourcing have escalated in recent years in part because of in-depth studies on the social and environmental upgrading of value chains226 and surveys to better understand the situation and per-spectives of suppliers. Important in this regard is the work of the ILO (2017b) and the Better Buying initiative (2018).
The central issue relates to the disconnect between commercial and sustainability policy within corporate strategy—more specifically, the failure of lead companies to recognize that commercial policies and practices can place suppliers in a straitjacket, in terms of their ability to improve labour standards. Suppliers are often subject to pressures related to (i) aggressive pricing that may constrict wages and benefits; (ii) product development and short production lead times, which can result in excessive and unplanned overtime; and (iii) short-term or insecure contractual relationships between affiliates and suppliers. Summing up the findings of its Global Survey of purchasing practices and working conditions in global supply chains, the ILO notes:
We saw, for instance, that agreeing on prices that are below production costs puts the suppliers in a difficult situation with regard to paying wages, improving working conditions, and use of only declared work, and can thus even put them at high risk of bankruptcy. A low willingness—and in any case after weeks of delay—to incorporate recent increases in the legal minimum wage into the prices agreed with their suppliers may also reduce the possible margins for suppliers, and thus also impact wages and working conditions, and extend informal work. Similarly, … insufficient lead times and inaccurate technical specifications provided by the brands directly lead to lower wages and an increased number of
225 Actual data for the 2000-2017 period derived from Unilever Annual Reports: turnover (+) 11.75 percent; net profit (+) 487 percent; employment (-) 44 percent.
226 See, for example, the Capturing the Gains programme: http://www.capturingthegains.org/
133
CORPORATE SUSTAINABILITY ACCOUNTING: WHAT CAN AND SHOULD CORPORATIONS BE DOING?
overtime hours. In other cases, suppliers may have recourse to outsourcing, with wages and working conditions also fur-ther deteriorating along this extended chain of sub-contractors (ILO 2017b:20).
The same study found that the proportion of temporary workers hired by suppliers increases significantly when they are more dependent on one buyer, as well as in contexts of aggressive (below cost) pricing and increased outsourcing (ILO 2017b).
These are the kinds of issues that adidas addresses in its responsible purchasing policy:
Responsible sourcing and purchasing practices … shall support decision making and processes that are aligned with: • Contractual and financial terms that do not adversely impact compliance with the adidas Workplace Standards, including the safeguarding of legally mandated wages, benefits & compensation; • Product development, order placement/purchasing, and production lead times that reduce the risk of excessive overtime, unauthorized subcontracting, or other negative supply chain impacts; and • A commitment to long term partnerships with suppliers, which recognise those suppliers delivering sustainable compliance, in accordance with the Workplace Standards, a track record in reducing environmental impacts and maintaining and achieving product safety standards (adidas 2017).
As the ILO study also notes, while buyers may pressure suppliers to improve working conditions, “we also found that buyers do not always accompany such standards with support and financial assistance, adding further pressure—on top of the purchasing practices mentioned above—to the suppliers’ margins” (2017b:20).
As is evident in the FLA Principle concerning responsible sourcing, disclosure related to the alignment of commercial practices with workplace standards is heavily centred on efforts associated with due diligence and management systems, in other words the
existence of policies and clearly defined responsibilities, training, ongoing dialogue between purchasing and labour compliance personnel, grievance mechanisms, monitoring, remediation, and so forth. Also important is the restructuring of bonus and incentive systems to better acknowledge and reward sustainability performance. Such measures aim to align commercial practice with sustainability policy and goals, or as adidas notes, ensure that “[a]ll relevant employees engaged in development, planning, costing, sourcing, and purchasing activities ... conduct their work consistently with the principles of this policy” (adidas 2017:3).
The assessment of responsible sourcing practices does not lend itself easily to quantitative performance indicators. For this reason, disclosure related to the due diligence or process dimension is important. But given the ease with which evidence regarding due diligence can be fudged, it is important to emphasize two indicators that directly address the problematic issues outlined in this chapter. These are, first, the capacity of workers to contest conditions in value chains and shape their upgrading, not only through individualized complaints mechanisms but also through strengthening labour rights that facilitate collective action and bargaining.227 And second, the levels of financial support and incentives provided to suppliers in their efforts to upgrade labour standards. The Global Survey of suppliers conducted by the ILO and the joint Ethical Trading Initiatives (ETIs) in 2016 found that:
nearly half of the suppliers (49 percent) that are expected to follow a code of conduct receive no help from their buyers in achieving the demanded social standards. The remaining 51 percent were found to receive some assistance such as staff training or a joint identification of breaches. Only 17 percent, however, were found to enjoy shared audit costs and even less (9 percent) to receive financial assistance (ILO 2017b:10).
Of the various benchmarks identified by the FLA to gauge performance related to responsible sourcing, one stands out in this regard: the percentage of suppliers and/or facilities receiving incentives. Knowing the types and amounts involved would also be useful.
227 Regarding women workers in global value chains, see Barrientos 2019.
134
UNRISD
⚫ Concluding remarks
To sum up, the above analysis of disclosure and reporting on labour rights underscores the following actions companies can take to ratchet up sustainability disclosure and reporting.
Disclosure related to labour standards remains heavily skewed towards basic working conditions. It is important to correct the inherent bias within disclosure and action by placing far greater emphasis on the labour rights (freedom of association and collective bargaining) component of standards. But even companies that emphasize labour rights in their social responsibility agenda often fail to comply with the minimum guidance of the GRI and other standard setters regarding quantitative data on collective bargaining coverage.
Annual data snapshots related to collective bargaining coverage can do more to obfuscate than clarify. It is important that metrics facilitate trend analysis via time series data spanning, say, a minimum of five years, as noted in the case of Total and Electrolux. It is also crucial to provide CbC data to reflect and detect variations in countries where key affiliates and suppliers operate, as noted in the case of PUMA. As regards suppliers, it is important to follow the lead of corporations that are disclosing information beyond Tier I to other tiers in the supply chain, including raw materials suppliers.
The above discussion suggests that high sustainability performance would be assessed on the basis of high rates of unionization and collective bargaining coverage, ongoing improvements through time, and the extent to which significant regional or country deficits are corrected.
As regards normative targets related to labour rights, both international soft law associated with ILO conventions and ethical obligations associated with the corporate social responsibility agenda would seem to suggest that all workers in large corporations
should be unionized and covered by collective bargaining. In practice, restrictive labour laws in various countries and jurisdictions prevent unionization, making such a target impossible at the enterprise level. The same does not apply, however, to collective bargaining given the possibilities for companies operating in restrictive legal settings to enter into alternative modes of social dialogue that, to some extent at least, involve a degree of collective bargaining. This observation also suggests that corporate responsibility should go beyond enterprise-level efforts to facilitate collective bargaining and extend to forms of corporate lobbying and political influence that promote rather than resist progressive labour market policy reforms.
It is important to contextualize data on labour rights. Positive trends in freedom of association and collective bargaining coverage among full-time employees may mask regressive trends related to a significant decline in permanent or fixed-term employment and/or increased reliance on subcontracted labour, which is often associated with weak labour rights. It is useful, therefore, to (i) provide time-series data on permanent and fixed-term employment and to compare it with that on revenues and profits, and (ii) disclose data on the percentage of the workforce of affiliates employed part time or subcontracted.
The efforts of corporations to support labour rights within their supply chain are often contradicted by aggressive commercial policies and practices that constrain the capacity of suppliers to respond to enhanced sustainability norms through improvement in labour rights and working conditions. To assess the relevance of this situation it would be useful for corporations to disclose the scale of financial support and incentives provided for suppliers engaged in social or sustainability upgrading.
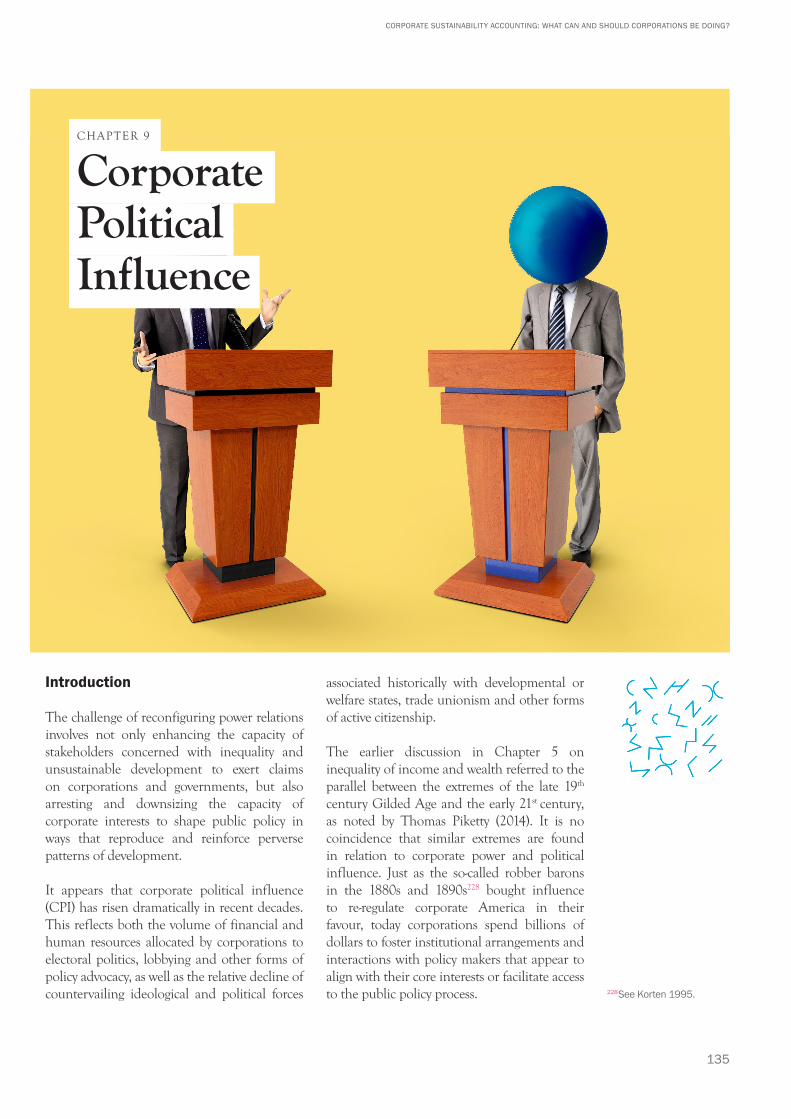
135
CORPORATE SUSTAINABILITY ACCOUNTING: WHAT CAN AND SHOULD CORPORATIONS BE DOING?
Introduction
The challenge of reconfiguring power relations involves not only enhancing the capacity of stakeholders concerned with inequality and unsustainable development to exert claims on corporations and governments, but also arresting and downsizing the capacity of corporate interests to shape public policy in ways that reproduce and reinforce perverse patterns of development.
It appears that corporate political influence (CPI) has risen dramatically in recent decades. This reflects both the volume of financial and human resources allocated by corporations to electoral politics, lobbying and other forms of policy advocacy, as well as the relative decline of countervailing ideological and political forces
associated historically with developmental or welfare states, trade unionism and other forms of active citizenship.
The earlier discussion in Chapter 5 on inequality of income and wealth referred to the parallel between the extremes of the late 19th century Gilded Age and the early 21st century, as noted by Thomas Piketty (2014). It is no coincidence that similar extremes are found in relation to corporate power and political influence. Just as the so-called robber barons in the 1880s and 1890s228 bought influence to re-regulate corporate America in their favour, today corporations spend billions of dollars to foster institutional arrangements and interactions with policy makers that appear to align with their core interests or facilitate access to the public policy process.
Corporate Political Influence
CHAPTER 9
228 See Korten 1995.
136
UNRISD
A key concern about CPI centres on its contradictory nature from the perspective of ESG goals and political norms associated with pluralist and participatory democracy. CPI may also be contradictory when it comes to competition policy. To borrow from UNCTAD’s analysis of monopoly behaviour, rather than increase the economic pie, CPI can enable relatively few corporations to grab a larger share of it (UNCTAD 2017:120-121).
After decades in which CPI was a quasi-taboo and massively underreported topic, a broader coalition of interests concerned with this issue is now taking shape. As a result, some standard setters, regulators, rating agencies and companies are beginning to treat CPI more seriously and comprehensively.
This chapter addresses the challenge of measuring the sustainability performance of corporations as it relates to CPI and identifying appropriate indicators. Following this introduction we briefly define what CPI is and why it matters as a material issue within sustainability performance disclosure. The argument is made that perverse forms of CPI are not simply a case of a few unethical bad apples; rather, they are structural in nature. This, in turn, has important implications for policy solutions and sustainability performance accounting. We then trace the emergence of CPI as a key performance issue within ESG assessment, and describe what constitutes good practice in mainstream ESG assessment. Not only has CPI come to be regarded as a material issue for a broader variety of stakeholders, including investors; there are also calls for more granular disclosure. The overarching purpose of recent developments in CPI disclosure has been to promote transparency regarding contributions and recipients, as well as fostering “integrity”, understood in terms of both creating a “control environment”229 and ensuring that basic ESG principles and goals are supported rather than undermined by CPI. We then examine the possibilities of going beyond transparency and qualitative indicators by considering possible quantitative indicators.
What CPI is, and why it matters
CPI refers to a variety of ways and means by which corporations can shape the policy process. This shaping takes place through a combination of interactions, between corporate interests and individuals or institutions associated with the public sector, which may be direct or indirect, formal or informal, transactional or relational, legal, quasi-legal or illegal. Key aspects of CPI include: direct or indirect payments and other forms of support to politicians, political parties and campaigns; financial and other support for lobbying and advocacy organizations; and other ways of influencing the cultural and knowledge circuits or “epistemic communities”230 that both inform the policy process and frame the broad ideological parameters or worldviews of policy agendas. This latter aspect can be achieved, for example, by providing technical expertise, generating both scientific and anti-scientific data and analysis, and the so-called revolving door syndrome—the two-way flow of personnel between the public and private sectors, which often occurs “in order to exploit their period of service to the benefit of their current employer” (Transparency International 2010:2). CPI gives cause for concern for a number of reasons.• Policy making, which should be in
the public interest, ends up favouring narrower private or vested interests.
• CPI supports or fosters policies associated with economic liberalization and aggressive growth strategies—free trade, tax cuts, environmental and labour market flexibilization or de-regulation231 and so on—that can undermine human and labour rights, social policy, environmental protection and development strategies in the Global South.
• There is considerable misalignment between a company’s lobbying objectives and its own CSR or ESG principles and goals.
• CPI is opaque and largely hidden from view.
• The volume of resources dedicated to corporate lobbying is not only vast but far exceeds that available to other stakeholders and interest groups.
229 See Transparency International UK 2015, which is discussed below.
230 See Haas 1992.231 The term
“de-regulation” refers not only to the rolling back of existing or proposed labour market, environmental, fiscal and other regulations but also to weakened administrative capacity or willingness to implement existing regulations.
137
CORPORATE SUSTAINABILITY ACCOUNTING: WHAT CAN AND SHOULD CORPORATIONS BE DOING?
Beyond these ESG concerns, there are also those associated with fair competition. Corporations often support incentives, sub-sidies and protectionist measures that may undermine the capacity of small- and medium-sized enterprises to access markets and compete on a level playing field. Furthermore, such measures may foster market inefficiencies that ultimately disadvantage consumers through higher prices. And, as noted by Khan when analysing the monopoly power of Amazon in online retail, the dynamics of the contemporary platform economy, combined with fiscal policy and blind spots in antitrust policy, often facilitate rapid growth. Such growth is achieved not only by prioritizing investment over profit maximization, however, but also through “predatory pricing”, as well as “control [of] the essential infrastructure on which their rivals depend…[and by] exploit[ing] information collected on companies using its services to undermine them as competitors” (Khan 2017).
In relation to data on lobbying expenditures by economic sector, findings by RobecoSAM
[concur] with a recent European Central Bank study showing firms in more protected sectors, (i.e. firms from non-tradable or highly regulated sectors) tend to spend more for lobbying activities. The impact is clear—firms with higher lobbying expenditures have higher profits and are less productive, since they are operating in closed or highly concentrated markets. These firms are successful at protecting their own profits and interests even at the expense of greater society. In the mid-term, engaging in this behaviour en-riches owners of incumbent firms who benefit from favourable regulatory and policy regimes. But from a business perspective, even in the short and mid-term, innovation and competition are stymied. In the long term, from a social and environmental perspective, human health, the environment, and social welfare are harmed (2018a:12).
From the perspective of corporations them-selves, CPI can generate significant reputa-
tional risks, exposing a sort of Jekyll and Hyde character when companies that indirectly or directly project themselves as CSR or ESG leaders are revealed as supporting public policies and regulatory action (or inaction) that contradict sustainability goals.
The misalignment of CPI and sustainable development has become particularly apparent in the context of climate change, where the lobbying practices of various trade associations and organizations, as well as politicians supported by corporate finance, undermine global goals concerning emissions reductions. In the United States, this disconnect has prompted numerous shareholder proxy resolutions calling on corporations to align their lobbying practices with climate change goals.
The global financial crisis of 2008-2009 also focused attention on corporate political influence and how it shaped public policy both before and after the crisis. Part of the cause of the crisis related to so-called regulatory capture that had resulted in a protracted period of financial deregulation. Following the crisis, the ongoing intimacy of public and financial interests fostered impunity, the bailout of large banks and some other institutions considered “too big to fail”, and the roll-back of regulatory proposals and controls. This was due as much to the powerful financial lobby machine as the fact that “reformers simply lacked the expertise and necessary information, which they got from the financial sector” (Vander Stichele 2018). In the process, the voices of other interests were marginalized.
The double standards associated with CPI and corporate ESG discourse are reflected not only in outright contradictory behaviour, but also in the pattern of corporate spending on lobbying by issue area. The relative weight of ESG issues within the broader portfolio of lobbying issues appears to be fairly minimal. Oxfam America’s 2018 study of 70 US corporations (the top 10 across seven sectors) reveals that in 2017 they spent approximately USD 1.5 million to lobby Congress on climate change, USD 11 million on diversity and inclusion issues, and USD 44 million to lobby on tax,232 out of a total lobbying expenditure of USD 281.5 million.
232 Even these figures, however, may overestimate the spending on progressive policy positions as the methodology could not capture whether lobbying related to climate change, for example, was for or against solutions to combat climate change (Oxfam 2018).
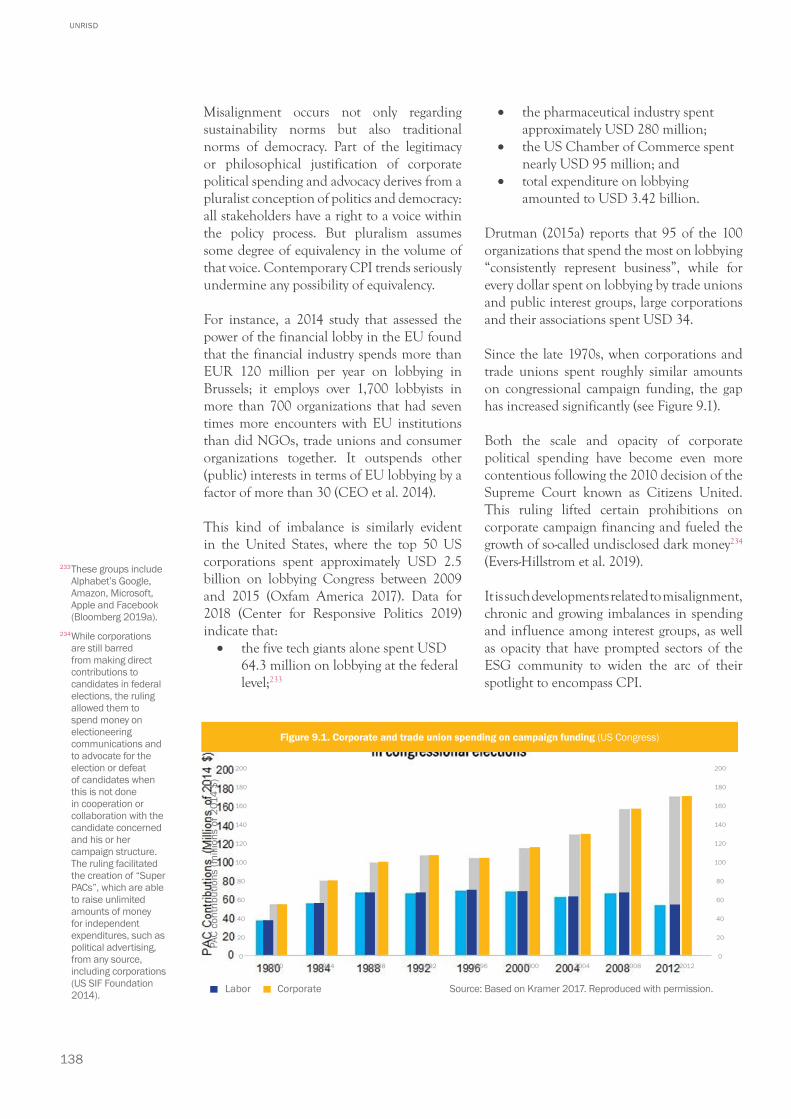
138
UNRISD
Misalignment occurs not only regarding sustainability norms but also traditional norms of democracy. Part of the legitimacy or philosophical justification of corporate political spending and advocacy derives from a pluralist conception of politics and democracy: all stakeholders have a right to a voice within the policy process. But pluralism assumes some degree of equivalency in the volume of that voice. Contemporary CPI trends seriously undermine any possibility of equivalency.
For instance, a 2014 study that assessed the power of the financial lobby in the EU found that the financial industry spends more than EUR 120 million per year on lobbying in Brussels; it employs over 1,700 lobbyists in more than 700 organizations that had seven times more encounters with EU institutions than did NGOs, trade unions and consumer organizations together. It outspends other (public) interests in terms of EU lobbying by a factor of more than 30 (CEO et al. 2014).
This kind of imbalance is similarly evident in the United States, where the top 50 US corporations spent approximately USD 2.5 billion on lobbying Congress between 2009 and 2015 (Oxfam America 2017). Data for 2018 (Center for Responsive Politics 2019) indicate that: • the five tech giants alone spent USD
64.3 million on lobbying at the federal level;233
• the pharmaceutical industry spent approximately USD 280 million;
• the US Chamber of Commerce spent nearly USD 95 million; and
• total expenditure on lobbying amounted to USD 3.42 billion.
Drutman (2015a) reports that 95 of the 100 organizations that spend the most on lobbying “consistently represent business”, while for every dollar spent on lobbying by trade unions and public interest groups, large corporations and their associations spent USD 34.
Since the late 1970s, when corporations and trade unions spent roughly similar amounts on congressional campaign funding, the gap has increased significantly (see Figure 9.1).
Both the scale and opacity of corporate political spending have become even more contentious following the 2010 decision of the Supreme Court known as Citizens United. This ruling lifted certain prohibitions on corporate campaign financing and fueled the growth of so-called undisclosed dark money234 (Evers-Hillstrom et al. 2019).
It is such developments related to misalignment, chronic and growing imbalances in spending and influence among interest groups, as well as opacity that have prompted sectors of the ESG community to widen the arc of their spotlight to encompass CPI.
1980 1984 1988 1992 1996 2000 2004 2008 2012
Labor Corporate Source: Based on Kramer 2017. Reproduced with permission.
0
20
40
60
80
100
120
140
160
180
200
PAC
cont
ribut
ions
(mill
ions
of 2
014
$)
Figure 9.1. Corporate and trade union spending on campaign funding (US Congress)
0
20
40
60
80
100
120
140
160
180
200
233 These groups include Alphabet’s Google, Amazon, Microsoft, Apple and Facebook (Bloomberg 2019a).
234 While corporations are still barred from making direct contributions to candidates in federal elections, the ruling allowed them to spend money on electioneering communications and to advocate for the election or defeat of candidates when this is not done in cooperation or collaboration with the candidate concerned and his or her campaign structure. The ruling facilitated the creation of “Super PACs”, which are able to raise unlimited amounts of money for independent expenditures, such as political advertising, from any source, including corporations (US SIF Foundation 2014).
139
CORPORATE SUSTAINABILITY ACCOUNTING: WHAT CAN AND SHOULD CORPORATIONS BE DOING?
The structural underpinnings of corporate power
Care needs to be taken in how we understand and critique corporate political influence and its relationship with (un)sustainable development. It is easy to reduce the core problem to merely one of unethical behaviour associated with bribery and corruption that results in—or seeks to secure—perverse incentives and subsidies for particular corporations and industries. Nor is it simply ideational—relating, for example, to the views, values and discourse of a managerial class, corporate leaders or traditional investors who assume the need for minimalist government regulation and the legitimacy of cost reduction via environmental and social externalities. Rather, the problem is structural in nature. As UNCTAD’s 2017 Trade and Development Report makes clear, the dramatic rise in asset and income inequality in recent decades is largely explained by the fact that “increasing market concentration in leading sectors of the global economy and the growing market and lobbying powers of dominant corporations are creating a new form of global…capitalism to the detriment of balanced and inclusive growth for the many” (UNCTAD 2017:119).
A key distinguishing characteristic of this “new form” is what economists refer to as rents, that is, “income derived solely from the ownership and control of assets, rather than from innovative entrepreneurial activity and the productive use of labour”. Rents derive from institutional arrangements such as property rights, regulations and power relations “which determine who generates an income from privileged access to, and control of, specific assets, and who will have to make a living through traditional entrepreneurial activity or the provision of labour” (UNCTAD 2017:120).
Systemic and structural changes associated with financialization, and the scaling-up and concentration of market power, underpin these developments. Financialization has fostered “the systematic favouring of short-term financial returns to institutional shareholders, which has biased investment patterns towards sectors and activities that promise quick returns at the
expense of long-term commitments of financial resources to productive activities” (UNCTAD 2017:121).235 Ben Fine also notes that it leads to
prioritizing shareholder value, or financial worth, over other economic and social values; the pushing of policies towards conservatism and commercialization in all respects; extending influence of finance more broadly, both directly and indirectly, over economic and social policy; placing more aspects of economic and social life at the risk of volatility from financial instability; and, conversely, placing the economy and social life at risk of crisis from triggers within particular markets as with the food and energy crises that preceded the financial crisis (2014:24).
As UNCTAD points out, not only the financial but also the non-financial corporate sector is heavily implicated in rentier capitalism. This takes place via such mechanisms as embedding intellectual property rights in trade regimes, tax avoidance and evasion, subsidies or “corporate welfare” (Farnsworth 2012) and “stock market manipulation to boost compensation for firms’ chief executive officers (CEOs) and top management” (UNCTAD 2017:120).
Such analysis suggests that the rise of CPI is both a cause and an effect of structural changes in capitalism that are contradictory to sustainable development. These changes have a number of implications for corporate sustainability performance guidance and assessment. First, when examining whether corporate political spending and lobbying are aligned with ESG goals, it is as important—if not more so— to examine alignment associated with macroeconomic, fiscal and competition policy. Second, public policy is both the immediate cause of and the necessary solution to the imbalances and injustices associated with CPI. Voluntary initiatives and codes of conduct may help, but on their own they can do little to overcome the structural underpinnings of corporate political irresponsibility. Third, given the systemic and structural nature of the issue, what needs to change are not simply instrumental aspects related to political spending and lobbying, but also other
235 UNCTAD also notes that “these strategies have [also] facilitated the expansion of market power and domination by allowing firms to leverage short-term financial success and high market valuation to engage, for example, in aggressive mergers and acquisitions” (2017:121).
140
UNRISD
mechanisms associated more with cultural and social interactions, the revolving door, networking and knowledge transfer. Fourth, whether regressive or progressive from the perspective of sustainable development, policy change requires a reconfiguration of power relations among stakeholders. The crucial question for assessing corporate sustainability performance is whether stakeholder and advocacy coalitions are emerging that can exert the necessary pressures to force both corporations and governments to promote transparency and greater alignment of existing patterns of CPI with the ESG values and goals many corporations purport to uphold. And lastly, do companies claiming ESG credentials support, ignore or resist such coalitions?
The rise of CPI as a key performance issue
While the issue of CPI in general, and lobbying in particular, surface periodically in mainstream CSR or ESG circles, only recently has CPI emerged as a key performance issue of concern to a wide spectrum of stakeholders. Even issues such as anti-corruption and bribery, which were legislated in the United States in 1977 and referenced in the 1976 OECD Guidelines for Multinational Enterprises, took years to be regulated and codified more broadly (Jakobi 2007).236
In the late 1990s, corruption in the oil, gas and mining sectors prompted an upsurge of attention to the issue of transparency. The transnational civil society network Publish What You Pay saw its advocacy rewarded in 2002 when the UK government launched the Extractive Industries Transparency Initiative (EITI), urging both host country governments and companies operating in those countries to publicly disclose their payments and revenues (Kantz 2012).
Efforts to mainstream the issue of CPI received a boost in 2000 via the report Politics and Persuasion in which SustainAbility and Government Policy Consultants (GPC) highlighted the often fragmented and contradictory public policy agendas of companies. The report identified the following five key features of best practice.
• Legitimacy: Are the means of influence proper uses of corporate power? What policies do companies have on topics like political donations, sponsorship and bribery?
• Transparency: Do companies disclose their positions on key public policy issues? Do they reveal their external memberships, donations, and methods of influence?
• Consistency: Do companies have systems in place to ensure that lobbying activities and positions are aligned with their environmental, social, and ethical principles, policies and commitments, and that they are consistent across borders and functions?
• Accountability: Do companies take responsibility for the impacts they have on public policy—through their lobbying, memberships, donations, and other activities?
• Opportunity: Do companies proactively attempt to influence public policy to support the societal transition towards sustainable development? Have they fully explored how more effective public policy on sustainability issues could be a source of competitive advantage? (SustainAbility and GPC 2000:4)
The report noted, however, that “[f]ew, if any, multinationals have directly coordinated their approach to political and policy engagement with their increasingly ambitious public commitments to sustainable development” and that “[f]ew criteria for ranking companies have directly included these aspects” (2000:3-4).
Five years later, SustainAbility and WWF UK (2005) followed up this report with Influencing Power: Reviewing the conduct and content of corporate lobbying—an assessment of how 100 of the world’s largest corporations had responded to the challenge of corporate political transparency and consistency through their reporting practices. Ranking the quality of reporting—from a low of “no disclosure”, on up through “basic”, “developing”, and “systematic” to “integrated” reporting, it found that 82 companies either disclosed
236 It was not until 2004 that the United Nations adopted the UN Convention against Corruption, which entered into force the following year. This became the legal basis for UN Global Compact Principle 10 on anti-corruption, added in 2004. The principle calls on companies to establish management systems to address corruption both internally and within their supply chains.
141
CORPORATE SUSTAINABILITY ACCOUNTING: WHAT CAN AND SHOULD CORPORATIONS BE DOING?
no information or simply acknowledged the relevance of the issue without developing policies or systems to address it. “Systematic” reporting, involving disclosure on several material issues and having an explicit policy on lobbying, was practised by only 8 companies,237 while none achieved the “integrated” reporting status reserved for companies whose lobbying practices were consistent with their ESG values.
That same year the consulting and standards firm Accountability, in partnership with the UN Global Compact, examined what “responsible lobbying” should consist of in its report Towards Responsible Lobbying: Leadership and Public Policy. The concept was defined in terms of “[b]eing consistent with an organization’s stated policies, commitments to stakeholders, and core strategy and actions”, and “[a]dvancing the implementation of universal principles and values (such as those embodied in the UN Global Compact) in business practice” (Accountability 2005:14). The route to responsible lobbying consisted of a six-step “lobbying health-check” comprising a series of questions that management needed to address:• Alignment: Are our lobbying
positions aligned with our strategy and universal principles?
• Materiality: Do we lobby on key issues that affect the organization and its stakeholders?
• Stakeholder engagement: Do stakeholders have a say in developing our lobbying positions?
• Reporting: Are we transparent about our lobbying positions and practices?
• People: Do we know who is lobbying on our behalf and where our spheres of influence are?
• Processes: Are management systems and guidelines in place for responsibly lobbying? (Accountability 2005:14).
Around the same time, a leading United States ratings organization, KLD, added indicators to assess positive and negative performance concerning “political accountability”. Strong performance occurred when “the company has shown markedly responsible leadership on public policy issues and/or has an exceptional
record of transparency and accountability concerning its political involvement in state or federal-level U.S. politics, or in non-U.S. politics” (Becchetti et al. 2013:23).
In 2010, the OECD adopted the Recom-mendation on Principles for Transparency and Integrity in Lobbying which has four main building blocks: (i) promoting a level playing field through openness and access; (ii) enhancing transparency in lobbying; (iii) safeguarding integrity; and (iv) mechanisms for effective implementation, compliance and review. The Recommendation also ex-tended the concern about relations between policy makers and the private sector beyond transparency and integrity related to con-ventional forms of lobbying, by referring to the revolving door issue (OECD 2010).
These and other OECD standards have informed the evolution of GRI reporting standards related to corporate political influence. Under the G2 Guidelines launched in 2002, guidance was fairly general, calling for a “[d]escription of policy, procedures/management systems, and compliance mechanisms for managing political lobbying and contributions” and information on the “[a]mount of money paid to political parties and institutions whose prime function is to fund political parties or their candidates” (GRI 2002:55).
Assessing the quality of reporting related to corporate political influence six years later, Bart Slob (2008) noted that:238
• While political donations and policy influence are sometimes recognized as responsibility issues in the context of human rights, there are few efforts to address the issue of corporate lobbying more widely.
• Many companies choose to ignore relevant GRI guidelines.
• Like many other reporting templates, GRI does not require companies to report on lobbying activities conducted on their behalf by associations and chambers of commerce which may adopt positions contrary to official corporate CSR policy.
237 These were BASF, BP, Chevron, Dow, Ford, General Motors, GlaxoSmithKline and HP.
238 See also Slob and Weyzig 2010.
142
UNRISD
• Although lobbying has rarely been integrated into company responsibility policies and management systems, some companies do provide a measure of transparency on specific aspects of lobbying, with disclosure of political donations being the most advanced element. Unfortunately, this is also probably one of the least important.
• None of the legal structures created so far require transnational corporations to disclose their policy positions, without which corporate accountability remains severely limited. Enforcement of any such laws is often impossible because violations are difficult to detect.
• Voluntary initiatives and policies of individual companies and joint self-regulatory initiatives will be vitally important for progress. Such initiatives might include the disclosure of lobbying positions, funding of civil society organizations and academics, and reporting on a company’s input in business associations.
The issue of lobbying surfaced within the United Nations Guiding Principles on Business and Human Rights, adopted in 2011. Under the pillar of the framework dealing with corporate responsibility to respect human rights, the Principles call for coherence:
Just as States should work towards policy coherence, so business enterprises need to strive for coherence between their responsibility to respect human rights and policies, and procedures that govern their wider business activities and relationships. This should include policies and procedures that set financial and other performance incentives for personnel; procurement practices; and lobbying activities where human rights are at stake (United Nations 2011:17).
In recent years, the question of transparency has largely centred on the need for more in-depth disclosure related to political spending and lobbying. The revised GRI reporting standards that were launched in 2016 introduced a “Public Policy” standard (GRI 415), which
became effective for reports or other materials published on or after 1 July 2018. In addition to recommending that an organization should report “significant issues that are the focus of its participation in public policy development and lobbying”, and “its stance on these issues, and any differences between its lobbying positions and any stated policies, goals, or other public positions”, the GRI standard requires reporting organizations to disclose: • the total monetary value of financial
and in-kind political contributions made directly and indirectly by the organization by country and recipient/beneficiary; and
• if applicable, how the monetary value of in-kind contributions was estimated.239
Guidance is provided as to what constitute direct and indirect political contributions: “financial or in-kind support given directly or indirectly to political parties, their elected representatives, or persons seeking political office”. More specifically, indirect political contribution is defined as “financial or in-kind support to political parties, their representatives, or candidates for office made through an intermediary organization such as a lobbyist or charity, or support given to an organization such as a think tank or trade association linked to or supporting particular political parties or causes” (GRI 2016b). Financial contributions can include donations, loans, sponsorships, retainers, or the purchase of tickets for fundraising events. In-kind contributions can include advertising, use of facilities, design and printing, donation of equipment, or the provision of board membership, employment or consultancy work for elected politicians or candidates for office.
In 2017 RobecoSAM, introduced a new criterion for its annual global survey of company ESG performance, the Corporate Sustainability Assessment (CSA), which forms the basis of the various Dow Jones Sustainability Indices. This criterion aims to assess (i) “the amount of money companies are allocating to legislative, political and public discourse, contributions to political campaigns, lobbying expenditures and contributions to trade associations and other tax-exempt groups organizations [sic]
239 See https://www.globalreporting.org/standards/media/1030/gri-415-public-policy-2016.pdf. Accessed 20 June 2020.
143
CORPORATE SUSTAINABILITY ACCOUNTING: WHAT CAN AND SHOULD CORPORATIONS BE DOING?
whose primary role is to create or influence public policy, legislation and regulations both directly and indirectly” (Gaffuri 2019:17); and (ii) the degree to which companies disclose this information in the public domain.
Specifically, the criterion asked companies to: disclose their total spending on policy influence efforts over the last four fiscal years; and specify the top five recipients of those contributions grouped into organizations, candidates, or issues (RobecoSAM 2018a).
It soon became apparent, however, that more granular data were required for any meaningful assessment. According to the 2017 CSA: • Many companies only reported political
contributions and very few companies “broadly and liberally disclose their spending in the various policy influence areas” (RobecoSAM 2018a).
• Most did not publicly disclose expenditures beyond what is legally mandated, nor trade association memberships.
• Contributions to trade associations far exceed more direct spending on lobbying, campaigns, and other explicitly political organizations.
• Disclosure of issues or topics is rare (RobecoSAM 2018c).
• Positive engagement on climate change or “green” construction are far outweighed by the negative.
• Levels of spending vary widely, by company, sector and region.
• Companies in more protected sectors, (that is, non-tradable or highly regulated sectors240) tend to spend more for lobbying activities.
To address several of these issues, the two indicators were updated in 2018 to:• separate the various types of spending
into distinct categories;241
• specify the percentage of operations covered, where spending data are only available for specific regions;
• specify two major issues/topics for which a company spent money (directly or indirectly) to influence policy, the company’s position in
support or opposition,242 and the three largest contributions to organizations, candidates or associations.
Not only standard-setting organizations but also the ESG investment community is taking note of CPI as a key performance issue. Shareholder proposals that target lobbying have multiplied, notably since the Citizens United Supreme Court ruling (Reuters 2015). Indeed, the largest number of proxy resolutions243 filed by investors who were members of the Interfaith Center on Corporate Responsibility (ICCR)244 by early 2019 concerned lobbying and political contributions (50 resolutions), followed by climate change (45), human rights/trafficking (43) and diversity/inclusiveness (37). Details of the 2019 proxy resolution on lobbying
Box 9.1. 2019 Lobbying disclosure resolution filed at ExxonMobil
“Whereas, we believe in full disclosure of ExxonMobil’s direct and indirect lobbying activities and expenditures to assess whether ExxonMobil’s lobbying is consistent with its expressed goals and in the best interests of shareholders.
Resolved, the shareholders of ExxonMobil request the preparation of a report, updated annually, disclosing:
1. Company policy and procedures governing lobbying, both direct and indirect, and grassroots lobbying communications.
2. Payments by ExxonMobil used for (a) direct or indirect lobbying or (b) grassroots lobbying communications, in each case including the amount of the payment and the recipient.
3. Description of management’s and the Board’s decision-making process and oversight for making payments described above.
For purposes of this proposal, a ‘grassroots lobbying communication’ is a communication directed to the general public that (a) refers to specific legislation or regulation, (b) reflects a view on the legislation or regulation and (c) encourages the recipient of the communication to take action with respect to the legislation or regulation. ‘Indirect lobbying’ is lobbying engaged in by a trade association or other organization of which ExxonMobil is a member.”
Source: Smith 2019
240 These include health care, materials, financials, real estate and utilities.
241 These include (i) lobbying, interest representation or similar; (ii) local, regional or national political campaigns/candidates; (iii) trade and business associations or tax-exempt groups (for example think tanks); and (iv) other expenditures such as ballot measures and referendums. See RobecoSAM 2018.
242 As regards disclosure related to “support”, companies are expected to clarify whether they are engaging in full support; support with minor exceptions, or support with major exceptions related to the substance or geographical scope of the measure.
243 Proxy resolutions are proposals, related to corporate governance and social and environmental responsibility issues, that are submitted by shareholders for a vote at the annual general meetings (AGMs) of publicly listed companies, particularly in the United States. While often failing to gain a majority, they can serve to highlight topical or emerging key sustainability performance issues and place a company in the media spotlight.
244 Some 300 member organizations, comprising faith communities, asset managers, trade unions, pension funds, NGOs and other investors, make up the ICCR. Annually, they file hundreds of resolutions with United States corporations on ESG issues in an effort to foster improved transparency and performance, and in so doing mitigate risk and enhance long-term shareholder value (ICCR 2019).
144
UNRISD
disclosure filed at Exxon Mobil are presented in Box 9.1. While these initiatives usually fail to get the necessary votes for approval, they do add to the groundswell of pressure related to responsible CPI and transparent disclosure.
Through time, then, standard-setting and rating organizations have come to interpret good practice in terms of corporate policy, accountability and disclosure related to political contributions and lobbying. More specifically, attention has centred on (i) the quality of the “control environment” comprising, for instance, explicit and clear company policy, oversight and monitoring mechanisms; (ii) transparency, public reporting and increasingly detailed disclosure related to political contributions and lobbying; and (iii) clarity and explanation regarding the alignment (or misalignment) of CPI practices and ESG principles and policy (Transparency International UK 2015).
As regards transparency, emphasis is placed on more granular disclosure that encompasses the following:• forms of direct expenditure
disaggregated by recipient (such as lobbying organization, political campaign);
• forms of indirect expenditures (for example, trade associations, not-for-profits);
• group-wide and subsidiary expenditures;
• CbC expenditures; and • in countries where headquarters
and major affiliates are located, by in-country jurisdiction, that is local, state/provincial, and federal level.
User-friendly disclosure is also important. In this regard, the CPA-Zicklin Index specifies and gives full credit for rating purposes to semi-annual reporting, disclosure of “at least the past five years” of data, and a dedicated political disclosure webpage. In 2017, the medical technology company Becton-Dickinson (BD) became the first S&P company to score 100 on the CPA-Zicklin Index.245 The company is noted for its easily accessible, user-friendly presentation of detailed information on policy and oversight related to corporate political engagement and
policy positions, as well as time series data on expenditures related to lobbying activities and political campaign contributions.246
Ongoing issues and gaps
While standard setters, ratings organizations and investors are increasingly on board with the idea that CPI merits closer attention within the field of sustainability disclosure and reporting, its uptake as a key performance issue has encountered significant bumps along the road. Most shareholder resolutions, for example, are not successful because of resistance from not only senior management but also the largest institutional investors (Posner 2019). Some standard-setting organizations also convey doubts about the materiality of the CPI issue. The widely-used SASB reporting guidelines, for example, dropped “Regulatory Capture and Political Influence” as a stand-alone general issue category in 2018, subsuming it under “Management of Legal and Regulatory Environment”.247 This was part of a revision that saw the number of issue areas reduced from 30 to 26. The decision reflected the apparent lack of recognition of the materiality of CPI within different industries and sectors. The SASB Materiality Map, which identifies and compares likely material sustainability issues across different industries and sectors, had revealed that “regulatory capture and political influence” was among the least material of 30 issue areas across 10 industries and sectors.
Progress at the level of corporations themselves is also lukewarm or uneven. Transparency International-UK notes that while regulations in the United States require companies to disclose domestic lobbying costs at the federal level, and while the EU Transparency Register recommends voluntary disclosure of expenditures and contacts,
company stakeholders, including in-ves tors and employees, remain largely unaware of precisely how much com-panies invest in lobbying around the world, the issues being pursued and, as is generally the case, how companies are benefiting from lobbying governments.
245 Companies registering the top score of 100 on the 2018 CPA-Zicklin Index included Becton-Dickinson & Co., Edwards Lifesciences Corp. and HP Inc., as well as five others that had a non-spending policy: Accenture PLC, Automatic Data Processing Inc., Goldman Sachs Group Inc., Praxair Inc., and Schlumberger Ltd.
246 See BD website at https://investors.bd.com/participation-political-process
247 The topic, Management of Legal and Regulatory Environment, “addresses a company’s strategy and reliance upon regulatory policy or monetary incentives (such as subsidies and taxes), its actions to influence industry policy (such as through lobbying), overall reliance on a favorable regulatory environment for business compet-itiveness, and ability to comply with relevant regulations. It may relate to the alignment between management’s and investors’ views of regulatory engagement and management of regulatory compliance at large.” See SASB Materiality Map. https://materiality.sasb.org/. Accessed 20 June 2020.
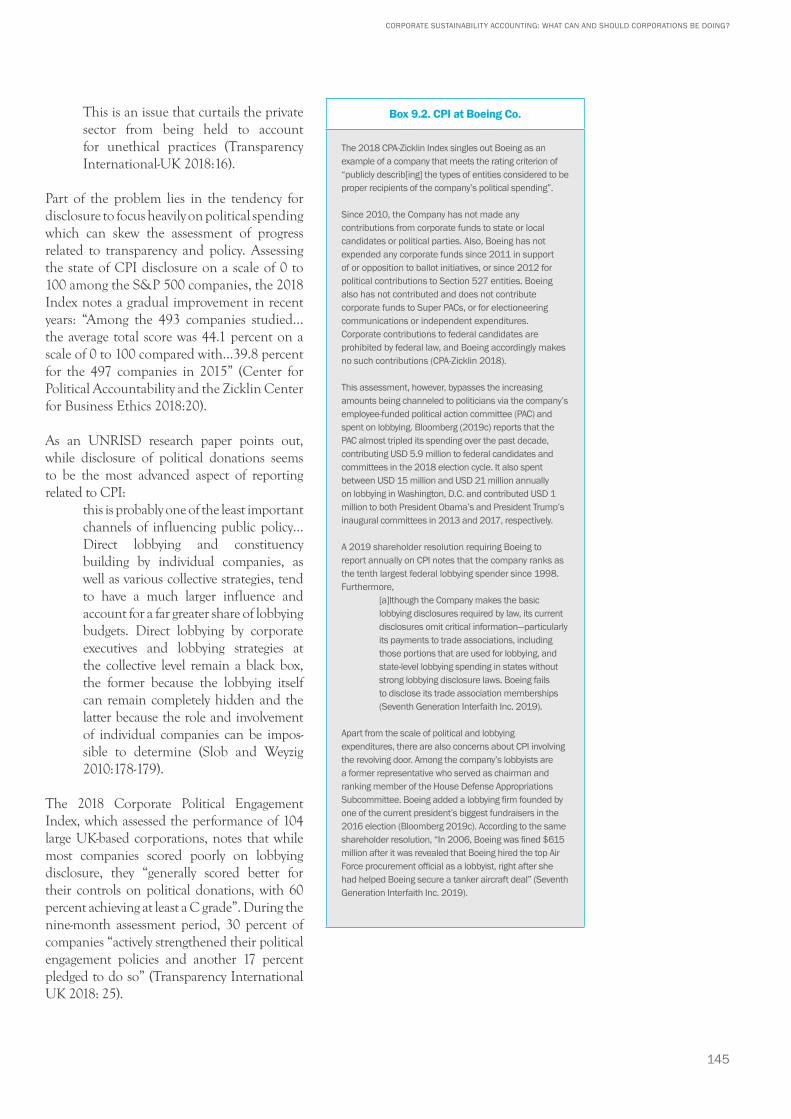
145
CORPORATE SUSTAINABILITY ACCOUNTING: WHAT CAN AND SHOULD CORPORATIONS BE DOING?
This is an issue that curtails the private sector from being held to account for unethical practices (Transparency International-UK 2018:16).
Part of the problem lies in the tendency for disclosure to focus heavily on political spending which can skew the assessment of progress related to transparency and policy. Assessing the state of CPI disclosure on a scale of 0 to 100 among the S&P 500 companies, the 2018 Index notes a gradual improvement in recent years: “Among the 493 companies studied…the average total score was 44.1 percent on a scale of 0 to 100 compared with…39.8 percent for the 497 companies in 2015” (Center for Political Accountability and the Zicklin Center for Business Ethics 2018:20).
As an UNRISD research paper points out, while disclosure of political donations seems to be the most advanced aspect of reporting related to CPI:
this is probably one of the least im por tant channels of influencing pub lic policy… Direct lobbying and cons ti tuency building by individual companies, as well as various collective strategies, tend to have a much larger influence and account for a far greater share of lobbying budgets. Direct lobbying by corporate executives and lobbying strategies at the collective level remain a black box, the former because the lobbying itself can remain completely hidden and the latter because the role and involvement of individual companies can be impos-sible to determine (Slob and Weyzig 2010:178-179).
The 2018 Corporate Political Engagement Index, which assessed the performance of 104 large UK-based corporations, notes that while most companies scored poorly on lobbying disclosure, they “generally scored better for their controls on political donations, with 60 percent achieving at least a C grade”. During the nine-month assessment period, 30 percent of companies “actively strengthened their political engagement policies and another 17 percent pledged to do so” (Transparency International UK 2018: 25).
Box 9.2. CPI at Boeing Co.
The 2018 CPA-Zicklin Index singles out Boeing as an example of a company that meets the rating criterion of “publicly describ[ing] the types of entities considered to be proper recipients of the company’s political spending”.
Since 2010, the Company has not made any contributions from corporate funds to state or local candidates or political parties. Also, Boeing has not expended any corporate funds since 2011 in support of or opposition to ballot initiatives, or since 2012 for political contributions to Section 527 entities. Boeing also has not contributed and does not contribute corporate funds to Super PACs, or for electioneering communications or independent expenditures. Corporate contributions to federal candidates are prohibited by federal law, and Boeing accordingly makes no such contributions (CPA-Zicklin 2018).
This assessment, however, bypasses the increasing amounts being channeled to politicians via the company’s employee-funded political action committee (PAC) and spent on lobbying. Bloomberg (2019c) reports that the PAC almost tripled its spending over the past decade, contributing USD 5.9 million to federal candidates and committees in the 2018 election cycle. It also spent between USD 15 million and USD 21 million annually on lobbying in Washington, D.C. and contributed USD 1 million to both President Obama’s and President Trump’s inaugural committees in 2013 and 2017, respectively.
A 2019 shareholder resolution requiring Boeing to report annually on CPI notes that the company ranks as the tenth largest federal lobbying spender since 1998. Furthermore,
[a]lthough the Company makes the basic lobbying disclosures required by law, its current disclosures omit critical information—particularly its payments to trade associations, including those portions that are used for lobbying, and state-level lobbying spending in states without strong lobbying disclosure laws. Boeing fails to disclose its trade association memberships (Seventh Generation Interfaith Inc. 2019).
Apart from the scale of political and lobbying expenditures, there are also concerns about CPI involving the revolving door. Among the company’s lobbyists are a former representative who served as chairman and ranking member of the House Defense Appropriations Subcommittee. Boeing added a lobbying firm founded by one of the current president’s biggest fundraisers in the 2016 election (Bloomberg 2019c). According to the same shareholder resolution, “In 2006, Boeing was fined $615 million after it was revealed that Boeing hired the top Air Force procurement official as a lobbyist, right after she had helped Boeing secure a tanker aircraft deal” (Seventh Generation Interfaith Inc. 2019).
146
UNRISD
The Index revealed that the only assessment question where the average rating was relatively high (a B on an A to F scale) was whether there was a group-wide global policy. The questions that generated the lowest grading (E or F) included expenditure thresholds, monitoring and evaluation, monitoring or managing memberships related to lobbying, publicly listing all organizations of which the company is a member, transparency of expenditure, contracted politicians, transparency of memberships, revolving door policy, cooling-off period, and transparency of secondments. According to Transparency International UK (2018), of the 104 companies:• 76 ranked either fairly poorly, poorly
or very poorly for their overall political engagement transparency.
• Nearly four out of five companies ranked poorly for their lobbying transparency.
• 97 out of 104 companies ranked poorly for their controls against the revolving door.
• One company (GSK) received the highest (A) ranking.
Full granular disclosure—broken down by jurisdiction or geography, and direct and indirect payments by type of recipient—is rare. Positive moves are often related to one aspect only. Under pressure from activist shareholders, Wal-Mart, for example, announced in 2015 that it would start disclosing what it spends on lobbying not only at the federal level but also on a state-by-state basis.248 According to Reuters:
Th[is] previously unreported move would make Wal-Mart the first constituent of the Dow Jones Industrial Average to break out state expenditures at that level of detail…[But] Wal-Mart’s move [fell] short of what Zevin Asset Management sought when it submitted a shareholder resolution for wider disclosure at Wal-Mart, including any ‘indirect lobbying’ through organizations like the U.S. Chamber of Commerce (Reuters 2015).
Earlier, the distinction was made between transactional and relational forms of CPI. Progress to date within corporate sustainability disclosure related to CPI has been associated
primarily with transactional aspects involving political contributions and lobbying. Relational aspects are far more difficult to assess and measure. This relates partly to their informal nature—the case of networking, for example. A few standard-setting and advocacy organizations, however, have tried to focus on another key relational aspect, namely the revolving door.
Interest in, and public concern about, the revolving door increased in the wake of the global financial crisis and prompted a number of studies on relations between governments and the finance and banking industry. As noted by the OECD:
The close relationship between regulators and lawmakers on the one hand and the finance industry and its lobbyists on the other is fed by the regular cycling of personnel between one side of the fence and the other. …Tackling the revolving door is an indispensable part of the process of restoring confidence in both the political system and the financial markets more generally (2009:66).
In its analysis of the possibility of regulatory capture by large banks in the Netherlands, SOMO (2013) notes the need for the GRI and others to “[b]roaden the scope of the reporting guidelines on issues related to lobbying by developing indicators or compilation points on…the phenomenon of revolving doors, and the number of annual job changes between the company and the public sector (regulators and financial policy makers)” (van Tilburg and Römgens 2013:56).
Among the 10 steps SOMO recommends banks take regarding their efforts to influence public policy are the following: “Report on job mobility between the organisation and the public sector. Be transparent about the ‘revolving door’ phenomenon. Report annually the number of job changes between the organisation and the public sector (financial policy-makers and supervisors). Specify at what level in the organisation this mobility has taken place.” None of the six banks involved in the study accepted this as a feasible step, citing the following reasons: (i) the information was already in the public domain; (ii) the
248 In California and Texas alone, estimates of Wal-Mart’s lobbying payments were in the region of USD 300,000 per state in 2014 (Reuters 2015).
147
CORPORATE SUSTAINABILITY ACCOUNTING: WHAT CAN AND SHOULD CORPORATIONS BE DOING?
impracticality of gathering such information given that former employees are not obliged to inform their employer about their subsequent professional whereabouts; and (iii) excessive bureaucratic demands.
The 2018 TI Corporate Political Engagement Index, which assessed the performance of 104 UK-based companies in relation to five aspects, found that performance fared worst in relation to the revolving door.249 Companies were assessed according to the following questions:• Is there a publicly available policy
and procedure covering the ‘revolving door’…?
• For company staff who were formerly public officials, does the company have a procedure for implementing a ‘cooling-off period’ before they are able to hold discussions on the company’s behalf with their former organization?
• Does the company publish details of secondments to or from the public sector? (Transparency International UK 2018: 34)
While 33 percent of companies had some controls in place to manage the revolving door, only 6 percent published any details of secondments or publicly prohibited secondments, while 15 percent had a publicly available procedure for a “cooling off period” for employing former public officials (Transparency International UK 2018).
Good practice regarding cooling off periods—“whereby a former public office holder or senior official is barred from undertaking tasks in the private sector that relate to their regulatory or representative duties”—tends to draw on regulations introduced in a number of countries with two years being “fairly typical” (OECD 2009:66).
Beyond a focus on policies and procedures, it would also be useful to assess the scale of revolving doors in quantitative terms. What are the numbers of employees involved? Possible indicators include:• number of technical and managerial
staff seconded to and from the public sector during the reporting year; and
• number of new technical and managerial staff that worked in the public sector during the previous two years.
Beyond transparency and integrity
Transparency International (2015) notes that within the field of public sector lobbying reform, regulation generally focuses on three elements: transparency, integrity and equality of access. The first relates to whether interactions between lobbyists and public officials are made transparent and open to public scrutiny; the second to whether there are clear and enforceable rules on ethical conduct for both lobbyists and public officials; and the third to whether public decision making is open to a plurality of voices representative of a wide range of interests. How might these three principles be interpreted and applied in relation to sustainability assessment of CPI?
To date, attention has focused on transparency and integrity. The former mainly entails disclosure related to lobbying and political contributions. Integrity involves two aspects: (i) putting in place a management system that operates as an institutional control environment for responsible political spending and lobbying; and (ii) clarifying policy positions and whether they are consistent with ESG objectives. Fostering a plurality of voices (equality of access) can occur in two ways: first, by explicitly supporting social, human rights and environmental causes and coalitions, and related policy reforms; and second, through imposing limits on the volume of resources allocated to CPI by setting quantifiable targets.
From the above overview of how disclosure related to CPI has evolved, it is clear that the main focus has been on assessing companies based on the degree of transparency and policy commitment and clarification. Quantitative targets or normative assessments are few and far between. As RobecoSAM points out:
Given the newness of the topic and the need to establish baseline data, we evaluated the responses strictly on transparency; there was no judgement on spending levels or spending trends, nor did we critique whether the top
249 The other aspects included (i) the control environment, (ii) political contributions, (iii) responsible lobbying, and (iv) transparency.
148
UNRISD
five issues/items were good or bad. Companies were assessed on the basis of their level of disclosure both in the [Corporate Sustainability Assessment] and in the public domain. Top scoring companies were those that clearly and transparently shared their contributions both across time and across different topic/organization types, and those that provided aggregate figures and amounts in their own public reporting (e.g. not with links to other sites) (2018a).
Where might we look for guidance regarding quantitative targets? In a context where CPI has often been associated with negative influence from the perspective of sustainable development, some players within the field of corporate sustainability assessment extend the notion of zero tolerance—typically associated with norms concerning bribery and “facilitation payments” (Transparency International 2014)—to other aspects of CPI. Certain ratings entities place a high value on zero or minimal spending and a policy against political contributions. The 2015 CPA-Zicklin Index, for example, gives kudos to Western Digital Corp. which markedly improved its ranking in large part for “not giv[ing] to candidates, parties, committees, 527 groups, (c)(4)s, or ballot measures, and…not mak[ing] independent expenditures. As its policy was to make no political contributions at all, no oversight was needed and its policy was clearly stated on the company website” (Center for Political Accountability and the Zicklin Center for Business Ethics 2015:26).
RobecoSAM’s rating methodology also critiques or penalizes companies or sectors that have relatively high levels of political spending. It further cautions against over-generalization: “[a] policy against political contributions is insufficient justification of a company’s prohibition against all policy influence activities. Policies that prohibit policy influence shall specifically address all the relevant categories, and the amounts related to any categories not specifically prohibited shall be reported” (2018c).
In the United States, a few companies have extended zero tolerance to support for political action committees (PACs), which
are the largest source of campaign financing. While companies are legally prohibited from direct financing related to federal-level elections, other forms of support are allowed, including employee PACs. The Transparency International-UK assessment notes that “[a] small number of companies recognise this risk and, in line with our recommendation, prohibit all political contributions, including allowing an employee-run PAC” (2018:13).
Beyond targets associated with zero spending on certain types of CPI, might certain limits be in order? A benchmarking study of seven large United States banks, Ranking the Banks, judged responsible practice related to CPI not only in terms of the presence of a weak or strong policy, and the level of disclosure of political contributions and lobbying activities, but also the voluntary public disclosure of political contribution amounts and whether the bank made less than USD 500,000 in political contributions in the last three years, which would amount to an average of less than USD 200,000 per annum250 (ICCR and Sustainalytics 2012). The lobbying tax proposal announced by Elizabeth Warren as part of her US presidential electoral platform set USD 500,000 per annum as a threshold above which corporations would incur significant taxes (Bloomberg 2019b).251
Might spending as a percentage of turnover be an indicator? Despite the earlier observation regarding non-judgmental assessment, RobecoSAM (2018a) singles out for critical commentary sectors such as health care, materials, and financials where average company yearly spending as a percentage of total revenues is in the 0.025 to 0.035 percent range, followed by real estate and utilities, around 0.02 percent. But in contexts where sector leaders may have revenues well in excess of USD 50 billion even the lowest level of approximately 0.01 percent reported in the information technology sector seems extremely high.
Advocating for, or rating highly, zero tolerance or reduced expenditure levels appears to run counter to recent developments within corporate sustainability guidance where
250 For the study in question, good practices involved (i) existence and strength of a policy on political contributions: “The bank states it does not make political contributions or has a strong and detailed policy”; (ii) public disclosure of direct political contributions: “The bank does not make contributions or discloses direct political contributions and distinguishes amounts given to political parties, trade associations and other organizations”; (iii) public disclosure of lobbying activities: “The bank voluntarily publicly discloses lobbying amounts and distinguishes between parties, trade associations and other organizations”; and (iv) public disclosure of political contribution amounts: “The bank made less than USD 0.5 million in political contributions in the last 3 years” (ICCR and Sustainalytics 2012).
251 Under the Warren proposal, tax rates of 35, 60 and 75 percent would be applied to the following three bands, respectively: between USD 500,000 and 1 million; above 1 million and up to 5 million; and above 5 million per year.
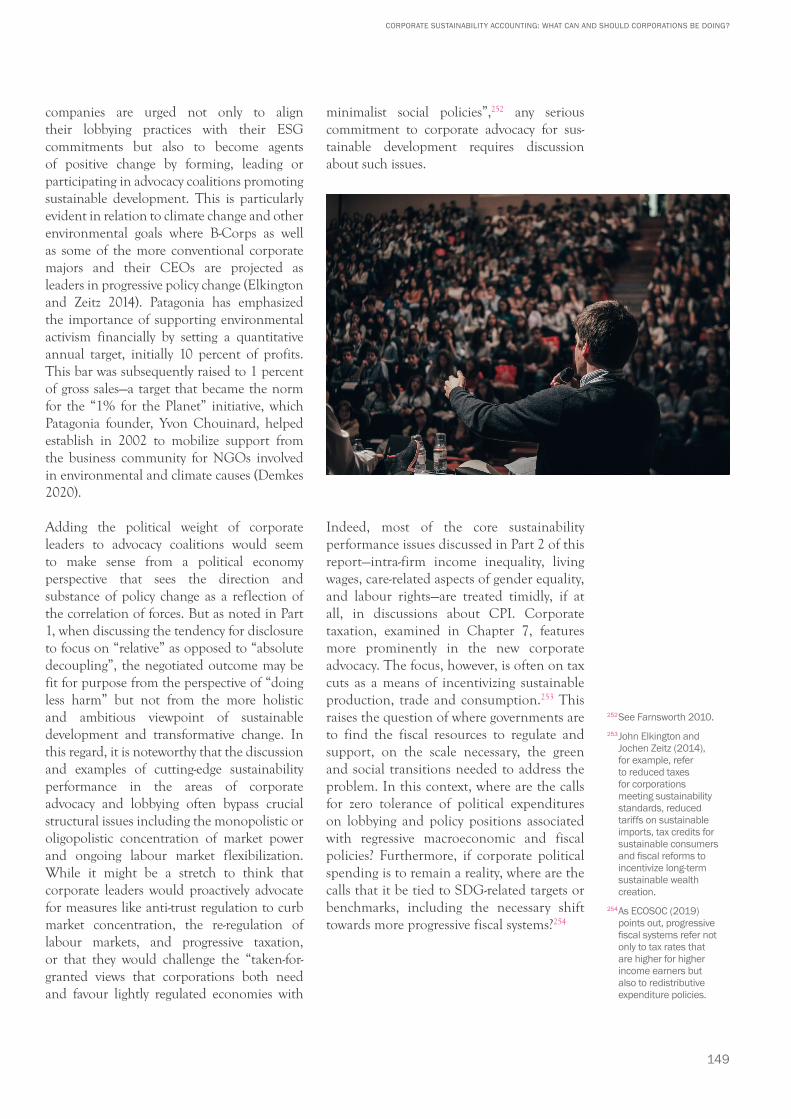
149
CORPORATE SUSTAINABILITY ACCOUNTING: WHAT CAN AND SHOULD CORPORATIONS BE DOING?
companies are urged not only to align their lobbying practices with their ESG commitments but also to become agents of positive change by forming, leading or participating in advocacy coalitions promoting sustainable development. This is particularly evident in relation to climate change and other environmental goals where B-Corps as well as some of the more conventional corporate majors and their CEOs are projected as leaders in progressive policy change (Elkington and Zeitz 2014). Patagonia has emphasized the importance of supporting environmental activism financially by setting a quantitative annual target, initially 10 percent of profits. This bar was subsequently raised to 1 percent of gross sales—a target that became the norm for the “1% for the Planet” initiative, which Patagonia founder, Yvon Chouinard, helped establish in 2002 to mobilize support from the business community for NGOs involved in environmental and climate causes (Demkes 2020).
Adding the political weight of corporate leaders to advocacy coalitions would seem to make sense from a political economy perspective that sees the direction and substance of policy change as a reflection of the correlation of forces. But as noted in Part 1, when discussing the tendency for disclosure to focus on “relative” as opposed to “absolute decoupling”, the negotiated outcome may be fit for purpose from the perspective of “doing less harm” but not from the more holistic and ambitious viewpoint of sustainable development and transformative change. In this regard, it is noteworthy that the discussion and examples of cutting-edge sustainability performance in the areas of corporate advocacy and lobbying often bypass crucial structural issues including the monopolistic or oligopolistic concentration of market power and ongoing labour market flexibilization. While it might be a stretch to think that corporate leaders would proactively advocate for measures like anti-trust regulation to curb market concentration, the re-regulation of labour markets, and progressive taxation, or that they would challenge the “taken-for-granted views that corporations both need and favour lightly regulated economies with
minimalist social policies”,252 any serious commitment to corporate advocacy for sus-tainable development requires discussion about such issues.
Indeed, most of the core sustainability performance issues discussed in Part 2 of this report—intra-firm income inequality, living wages, care-related aspects of gender equality, and labour rights—are treated timidly, if at all, in discussions about CPI. Corporate taxation, examined in Chapter 7, features more prominently in the new corporate advocacy. The focus, however, is often on tax cuts as a means of incentivizing sustainable production, trade and consumption.253 This raises the question of where governments are to find the fiscal resources to regulate and support, on the scale necessary, the green and social transitions needed to address the problem. In this context, where are the calls for zero tolerance of political expenditures on lobbying and policy positions associated with regressive macroeconomic and fiscal policies? Furthermore, if corporate political spending is to remain a reality, where are the calls that it be tied to SDG-related targets or benchmarks, including the necessary shift towards more progressive fiscal systems?254
252 See Farnsworth 2010.253 John Elkington and
Jochen Zeitz (2014), for example, refer to reduced taxes for corporations meeting sustainability standards, reduced tariffs on sustainable imports, tax credits for sustainable consumers and fiscal reforms to incentivize long-term sustainable wealth creation.
254 As ECOSOC (2019) points out, progressive fiscal systems refer not only to tax rates that are higher for higher income earners but also to redistributive expenditure policies.
150
UNRISD
⚫ Concluding remarks
The above analysis suggests that contemporary trends associated with CPI pose several serious challenges for corporate sustainability performance. These include: (i) the sheer volume of resources directed to causes, poli-ticians and policy positions that are antithetical to sustainable development; (ii) the growing gap in the relative spending of corporate and non-corporate stakeholders; and (iii) the misalignment of corporate lobbying positions and ESG and SDG goals.
Recently, the ESG community has paid more attention to CPI, promoting a three-pronged reci-pe for action: (i) transparency, in order to expose and measure the spending and relationships associated with CPI; (ii) a management system to control for good and bad practice; and (iii) nar-rative reporting on lobbying positions.
The current drive towards greater transparency and granular disclosure is an important first step in improving corporate sustainability perfor-mance accounting related to CPI. Relevant indicators include:• forms of direct expenditure disaggregated
by recipient (such as lobbying organization, political campaign);
• forms of indirect expenditure channeled through third-party organizations (for example trade associations, not-for-profits);
• group-wide and subsidiary expenditures;• percentage of operations covered, where
spending data are only available for specific regions;
• country-by-country expenditures; • in countries where headquarters and
major affiliates are located, expenditure by in-country jurisdiction, that is local, state/provincial, and federal level;
• total and disaggregated spending over the last four fiscal years;
• spending by top five recipients;• in relation to the major policy issues or
topics for which a company advocated and spent money, specify the three largest recipients per issue;
• disaggregated disclosure related to lobbying, specifying not only the broad issue area (for example climate change), but also the normative or regulatory intent of the intervention, including its relation to the SDGs.
From an aspirational perspective, however, transparency needs to go beyond data detailing corporate political spending and narrative reporting on policy positions. It also needs to address other dimensions related to political influence channeled via knowledge transfer and the revolving door. Possible indicators include:• number of technical and managerial
staff seconded to and from the public sector during the reporting year;
• number of new technical and managerial staff that worked in the public sector during the previous two years;
• number of days that technical and managerial staff participated in expert group meetings organized by public sector entities.
With regard to sustainability targets related to CPI, the above discussion has identified three possible scenarios. The first relates to the notion of zero tolerance—that is, setting targets to cut political spending or eliminate it altogether. The second involves setting annual limits in, say, the USD 200,000 to 500,000 range for large corporations. The third scenario involves setting targets for the amount of spending directly related to supporting issues and policies globally recognized as essential to the SDGs.
The upshot of the above discussion is that improved disclosure, involving both qualitative and quantitative indicators, is needed to lift the veil on corporate political influence. Such transparency can allow management and other stakeholders to gauge corporate policy coherence—that is, whether the issues and recipients of corporate political and ideological support are consistent with those associated with ESG and SDG values and objectives. Transparency can also reveal whether consistency applies across the different ways and means of engaging with the public sector—via political spending, lobbying and revolving doors. Furthermore, it can allow stakeholders—concerned with the democratic deficit implicit in the growing imbalance in political influence among different interest groups—to gauge both the scale of CPI and its trajectory through time.
151
CORPORATE SUSTAINABILITY ACCOUNTING: WHAT CAN AND SHOULD CORPORATIONS BE DOING?
Summing UpPart 2 of this report has focused on a concise set of key performance issues that relate to the structural determinants of (un)sustainable development. While key from the perspective of transformative change, they have been poorly treated within the field of corporate sustainability assessment. And unless issues related to inequality, distributive justice and power relations are positioned front and centre within this field, current efforts to engage corporations as active partners in the SDG process will do little to realize the transformative vision of the 2030 Agenda.
None of the five issue areas is entirely new. Metrics and indicators that relate to each of the areas can be found within the portfolio of reporting guidelines of several standard-setting and ratings organizations. We argue, however, that the disclosure bar needs to be raised in various respects.
Raising the barThe bottom line is that it is only possible to gauge whether a company is on a sustainability pathway if the data that are disclosed are structurally oriented, quantified, contextualized and user-friendly.
Beyond the need to address structural blind-spots, throughout the report we have insisted on the importance of quantitative indicators and cautioned against reading too much into some of the qualitative indicators that are often held up as proxies for improved performance. Another major concern is that conventional disclosure and reporting tend to be de-contextualized, that is, disconnected from certain background, related or normative conditions which, when added to the equation, enable users of data to gain a far clearer picture regarding corporate sustainability performance (see Box S.1). Company-wide averages, for example, may mask major variations in performance by region, country or affiliate. Positive performance related to one issue area or impact may disguise negative performance in another. Particularly worrisome is the fact that conventional sustainability reporting generally focuses on current performance without con-
textualizing the present in relation to either the past or the future. It is impossible to assess current performance without knowing whence we came (past performance) and where we want to get to in terms of normative targets.
Below, we summarize some of the main findings related to (i) how issues and indicators could be reconfigured, (ii) the need for more granular and transparent disclosure, and (iii) normative targets that define performance in relation to sustainable development.
Box S.1. Assessing Performance in Context
Conventional disclosure in company reports tends to present data out of context. The result can be a very partial picture of sustainability performance, often one seen through rose-tinted glasses. In order to assess performance in a meaningful way, users of sustainability reports need to be able to see (i) trends over time, as opposed to annual snapshots, (ii) significant variations in performance within the organizational structure – not only company-wide averages, (iii) instances of contradictory performance, where “good” performance in one area co-exists with “bad” performance in another, and (iv) how current performance looks when compared to fair and just normative end goals. The contrast between “conventional” and more meaningful “sustainability” disclosure is illustrated by means of the hypothetical disclosures below.
Conventional disclosure• Company A reduced its carbon emissions per unit of revenue or output by 5%
between 2015 and 2020.• Company B reduced its consumption of water by 25% over the past three years
through greater efficiency and recycling.• Company C met its fair remuneration target: all entry level employees earned above
the minimum wage. The target of equal pay for equal work was also achieved. • Company D paid five million dollars in corporate taxation.• Company Y reported that 70% of employees were covered by collective bargaining
agreements.• Company Z disclosed political spending related to elections and direct forms of
lobbying at the federal or national level.
Sustainability disclosure• While Company A reduced its levels of carbon emissions intensity, absolute levels of
emissions increased by 5% due to 10% growth in manufacturing output. The company also failed to align its performance goals with science-based climate change mitigation targets.
• Company B is reducing water consumption but does not factor in water consumption related to its purchased inputs nor provides information to indicate how consumption levels relate to the carrying capacity of the local watershed or what a fair allocation of water resources would be taking into account other users in the area.
• While Company C achieved its fair remuneration targets, average workers’ wages were still 30% below the living wage, the CEO-worker pay gap had increased from 100 to 1 to 300 to 1 over the last 10 years, and the “unadjusted” gender pay gap was in excess of 20%.
• While company D provided millions in taxes to local and federal government authorities, it also engaged in tax avoidance strategies that involved significant profit shifting to low tax jurisdictions. Further, it also has a considerable tax gap, that is, its effective tax rate is substantially below the statutory tax rate.
• While a significant proportion of company Y’s employees are covered by collective bargaining agreements, over five years this has declined from 85% to 70%. Moreover, the data only relate to full-time regular employees. During this period the company reduced the proportion of full-time employees and relied more on subcontracted or part-time labour who were denied core labour rights. Additionally, the company-wide figure of 70% masks wide variations in average by affiliate or region where the company operates.
• While Company Z disclosed some forms of political spending, it failed to disclose the large amounts spent at the subnational level and via indirect forms of lobbying. Further, there is no indication whether the issues it lobbies for align with, or contradict, the Sustainable Development Goals.
152
UNRISD
Main findings: Issues and indicatorsRegarding issues and indicators, the discussion suggests the following adjustments.
Fairremuneration
Move beyond comparing CEO remuneration with the average remuneration of all other employees by calculating the CEO-worker pay ratio. There is also the possibility of comparing CEO pay with that of employees in the lowest income quartile.
Compare actual wages not only with the minimum wage or industry norms but also with the living wage. And compare the percentage increase in wages with that of management and CEO remuneration. Disclose the percentage of employees earning below the living wage.
Genderequality
Broaden the focus on care support beyond maternity or parental leave associated with child birth and adoption to encompass support provided throughout the life cycle of an employee. In relation to the portfolio of possible support programmes, disclose which forms of support are provided. Disclose the percentage share of employees requiring care support compared with those entitled to care support and those who actually receive such support.
Corporatetaxation
Disclose not only the amount of corporate taxes paid but also the tax gap (effective tax rate as a percentage of the statutory rate), the effective tax rate as a percentage of pre-tax profits and the industry norm, and the volume and percentage of global profits attributed to recognized tax havens and low-tax jurisdictions.
Labourrights
Focus not only on working conditions but also labour rights, in particular trade union density and collective bargaining coverage. Include data on the volume and percentage of total employees in affiliates, factories and top tier suppliers engaged via subcontracting and temporary contracts.
Corporatepoliticalinfluence
Move beyond disclosure related to corporate political spending to forms of influence associated with lobbying and the revolving door.
Main findings: Transparency and granular disclosureRegarding transparency and granular disclosure, the discussion emphasizes the need to do the following.
Genderequality
Go beyond company-wide metrics by disaggregating both gender representation and the gender pay gap by occupational category.
Fully disclose and quantify lifecycle care needs and levels of support, disaggregate company support for caregiving by different types of support in terms of expenditure and number of beneficiaries.
Corporatetaxation
Publicly report country-by-country tax disclosure that includes metrics related to revenues, assets, employment, pre-tax profits, taxes paid and the effective tax rate.
Labourrights
Reveal collective bargaining coverage and trade union density by main countries of operation, and by affiliate and main suppliers; and publicly disclose supply chain factories, enterprises and producers, including employment and labour rights data.
153
CORPORATE SUSTAINABILITY ACCOUNTING: WHAT CAN AND SHOULD CORPORATIONS BE DOING?
Corporatepoliticalinfluence
Move beyond partial to full disclosure related to multiple forms of corporate political influence by providing data on both direct and indirect political and lobbying expenditures (including via trade associations), as well as by different levels of policy making (international, national, state/provincial and municipal), countries of operation, major affiliates, major recipients, and by major issue areas and SDGs. Disaggregate disclosure related to lobbying by specifying not only the broad issue area, but also the normative or regulatory intent of the intervention, including its relation to or alignment with the SDGs.
Main findings: Normative goals, targets or target rangesRegarding concrete normative goals associated with a meaningful interpretation of sustainable development, the discussion identifies a number of targets that companies could work towards. The point was made that sustainability norms may appear highly ambitious or aspirational. Such indicators, however, reveal the scope of the challenge, a company’s true position along the pathway to sustainable development and whether progress is meaningful. This information is vital for any company that adheres to the ethos of corporate social responsibility and is serious about sustainable development. It is also essential for the multiple stakeholders engaged in the movement for greater corporate accountability. Several targets or target ranges identified above include:
• CEO-worker pay ratios in the region of 10–50 to 1 depending on sectors and institutional settings;
• wage levels that meet the living wage;• decreases in the gender pay gap of 3 percent or more per annum, and
a gender pay gap of less than 3 percent;• equal representation of women and men in the workforce; women’s
representation above 40 percent at board and executive levels;• a corporate tax gap within the 0 to 5 percent range;• an increasing as opposed to declining trend in collective bargaining
coverage, with the aim of achieving full coverage;• zero corporate political spending or spending not exceeding the USD
0.2 – 0.5 million range per annum in the case of large corporations;• regarding the revolving door, zero movement of personnel from the
public to the private sectors during a two-year cooling off period.
The discussion in Part 2 also insists on the need to enhance user-friendly disclosure through time series data that reveal trends over time. A five-, 10- or even 20-year time horizon for several of the above indicators is far more revealing than an annual or two- to three-year snapshot. Time series data is important for revealing instances of contradictory performance—or red flags—discussed chiefly in Chapter 8. Such data allow stakeholders to better assess the validity of the seemingly positive developments in corporate sustainability metrics and indicators associated with fair remuneration, employment, labour rights and corporate political influence, as follows.
Fairremuneration
Does compliance with minimum wage regulations and industry norms mask the fact that increases in nominal wages fall far short of increases in labour productivity, or do not translate into increased real wages, that is, when adjusted for inflation?
154
UNRISD
Labourrights
Do increasing rates of collective bargaining coverage among full-time employees occur in a context where the percentage share of full-time employees is declining in relation to subcontracted (non-unionized) labour? How do changing levels of full-time employment compare with those of revenues and profits? Such data may reveal whether economic growth supports or undermines growth in full-time employment. Are suppliers upgrading certain ESG standards in contexts of ongoing aggressive commercial policy and purchasing practices?
Corporatepoliticalinfluence
Do trends indicating a significant concentration of corporate power through increases in market share signal increased corporate political influence? Does positive performance related to controls on political spending or increased lobbying for SDG-related issues mask significant lobbying for public policies that support business-as-usual?
Future workAt various points this report has referred to ongoing challenges that confront the task of designing and promoting indicators for transformative change. It is hoped that the structural and contextualized perspective outlined in this research provides a foundation for future work to ensure that corporate sustainability accounting serves to effectively measure impacts and assess progress.
The UNRISD project behind this report has both complemented cutting-edge civil society and private sector initiatives in this field and highlighted the useful role of United Nations-led and interagency inquiry in promoting advanced practice. It is vital that organizations like UNRISD, the ILO, UNCTAD, UN Women, OHCHR, UNEP and specific initiatives such as the UN Global Compact, among others, come together in a more structured way to address ongoing blind spots, reprioritize issues, refine indicators, harmonize methods, promote user-friendly disclosure formats and identify normative targets.
Suggested areas of work for such a group include:• Forging a consensus on the relevance of the approach to sustainability disclosure and
the five issue areas and related indicators highlighted in this research.• Examining other transformative blind spots that are flagged in the research but not
examined in depth, such as the fair distribution of income and value added throughout the global commodity or value chain, and whether a company’s commercial policy and purchasing practices facilitate or undermine upgrading efforts in the supply chain.
• Promoting granular and transparent disclosure, identifying those indicators where this is particularly important, for example, country-by-country tax disclosure, pay and promotion by occupational category, and supply chain performance.
• Promoting user-friendly disclosure through time series data that allow stakeholders to view trends as opposed to annual snapshots.
• Highlighting the need for disclosure and data related to contradictory performance trends and “red flags”.
• Raising the bar and promoting greater consistency and harmonization of the methods used for calculating specific indicators, for example, CEO pay and CEO-worker pay ratios, the living wage, the gender pay gap, care support and corporate political spending.
• Identifying normative targets or target ranges, related to thresholds and fair allocations, consistent with a transformative notion of sustainable development.
• Examining the possibilities of time-bound targets that set a certain date for compliance, as is beginning to occur in the case of carbon emissions or as seen in the 2030 horizon for the SDGs.
155
CORPORATE SUSTAINABILITY ACCOUNTING: WHAT CAN AND SHOULD CORPORATIONS BE DOING?
Acronyms
AFWA Asia Floor Wage Alliance
AOI areas of impact
ASB/FRC Accounting Standards Board/Financial Reporting Council
BEPS base erosion and profit shifting
CbC country by country
CEO Chief Executive Officer
CFO Chief Financial Officer
COP Conference of the Parties (in this case to the United Nations Framework Convention on Climate Change (UNFCCC)
CO2 Carbon dioxide
CPI corporate political influence
CR corporate responsibility
CSR corporate social responsibility
EC European Commission
EITI Extractive Industries Transparency Initiative
EP&L environmental profit and loss
ESG environmental, social and governance
ETI Ethical Trading Initiative
EU European Union
EUR Euro (currency)
FLA Fair Labor Association
FSC Forest Stewardship Council
FTM Fair Trade Mark
FTSE Financial Times Stock Exchange Group
G20 Group of 20
GBP British pounds (currency)
GCFW Global Commission on the Future of Work
GDP gross domestic product
GHG greenhouse gas
GIIN Global Impact Investing Network
GLWC Global Living Wage Coalition
GPG gender pay gap
GRI Global Reporting Initiative
GSSB Global Sustainability Standards Board
IBFWW International Federation of Building and Wood Workers
ICC International Chamber of Commerce
ICT information and communications technology
IFA international framework agreements
IIRC International Integrated Reporting Council
ILO International Labour Organization
IPPR Institute for Public Policy Research
IR integrated reporting
IRIS Impact Reporting and Investment Standards
ISO International Organization for Standardization
ISSC International Social Science Council
IUF International Union of Food, Agricultural, Hotel, Restaurant, Catering, Tobacco and Allied Worker’ Associations
KPI key performance indicator
MDG Millennium Development Goal
MNE multinational enterprise
MSC Marine Stewardship Council
NFR non-financial reporting
NGO non-governmental organization
OECD Organisation for Economic Co-operation and Development
OHS occupational health and safety
OHCHR Office of the High Commissioner for Human Rights
PAC political action committee
PPP$ purchasing power parity (USD)
PRI Principles for Responsible Investment
ROI return on investment
SASB Sustainability Accounting Standards Board
SBT science-based target
SDGs Sustainable Development Goals
SEC Securities and Exchange Commission
SI sustainability indicator
SME small and medium-sized enterprise
SOE state-owned enterprise
SROI social return on investment
SSE social and solidarity economy
TBL triple bottom line
TCFD Task Force on Climate-related Financial Disclosures
TI Transparency International
TNC transnational corporation
TTC total tax contribution
UK United Kingdom
UN United Nations
UNCTAD United Nations Conference on Trade and Development
UNEP United Nations Environment Programme
UNGC United Nations Global Compact
UNIDO United Nations Industrial Development Organization
UNRISD United Nations Research Institute for Social Development
USD United States dollar
VND Vietnamese dong
VoC varieties of capitalism
WBCSD World Business Council for Sustainable Development
WEF World Economic Forum
WFE World Federation of Exchanges
WWF World Wide Fund for Nature
156
UNRISD
List of Boxes, Figures, TablesBoxes
Box O.1. What is transformative change? 2
Box O.2. Some recent initiatives to improve corporate sustainability accounting 5
Box O.3. What does social science theory tell us? 6
Box O.4. Granularity 8
Box O.5. Stark facts about gender inequality in paid employment 13
Box O.6. Why should corporate political influence be of concern? 23
Box O.7. Ratcheting up CPI disclosure guidelines at RobecoSAM 24
Box 1.1. Impact Reporting and Investment Standards (IRIS) 40
Box 1.2. GRI Sustainability Reporting Guidelines: What has changed over time? 42
Box 1.3. Oxfam’s Behind the Brands Scorecard 44
Box 2.1. Enhancing disclosure and reporting through digital innovations 57
Box 3.1. Net Positive Principles 62
Box 5.1. Why does inequality matter? 84
Box 6.1. Gender-specific SDG targets and goals 95
Box 6.2. Ratcheting up care at L’Oréal 103
Box 6.3. Women in Finance Charter 110
Box 7.1. Recent tax investigations and rulings in the European Union 121
Box 7.2. Recent tax-related sustainability reporting initiatives 122
Box 8.1. Ratcheting up labour rights in Unilever 131
Box 9.1. 2019 Lobbying disclosure resolution filed at ExxonMobil 143
Box 9.2. CPI at Boeing Co. 145
Box S.1. Assessing performance in context 151
Figures
Figure O.1. Minimum, living and actual wages per month, USD equivalent (Selected countries, 2020) 12
Figure O.2. Representation (%) of men and women in the corporate pipeline in relation to gender parity (United States and Canada, 2015 and 2019) 15
Figure 3.1. Sample MultiCapital Scorecard 64
Figure 5.1. Minimum, living and actual wages per month, USD equivalent (Selected countries, 2020) 91
Figure 6.1. Representation (%) of men and women in the corporate pipeline in relation to gender parity (United States and Canada, 2015 and 2019) 100
Figure 6.2. Earnings relative to pre-child earnings (Denmark and United States, 2015) 101
Figure 8.1. Supply chain mapping in the United States fashion industry 129
Figure 9.1. Corporate and trade union spending on campaign funding (US Congress) 138
Tables
Table O.1. CEO pay to average income ratio (Selected countries, 2015-2016) 10
Table O.2. Vodafone Group countries of operations (Top three countries by economic activity and by profits, millions of euros, 2016-2017) 17
Table O.3. Collective bargaining coverage at Total and Electrolux 21
Table 1.1. The rise of multistakeholder institutions and initiatives 37
Table 1.2. The 10 UN Global Compact Principles 38
Table 4.1. Leading emitters with increasing emissions trend and high emissions intensity performance 81
Table 4.2. Exxon Mobil emissions 82
Table 5.1. CEO pay to average income ratio (selected countries) 2015-2016 86
Table 5.2. Variations in tax rate by pay ratio band (California Senate Bill 1398) 87
Table 5.3. Minimum wage versus living wage 92
Table 6.1. Gender mix and pay disparity among hierarchy levels 99
Table 6.2. Work-life balance and care support in the United States and Canada, % of companies offering 102
Table 6.3. Gender balance compared: Top performers versus the rest (%) 109
Table 6.4. Women’s representation at board and executive levels, by leading countries 110
Table 6.5. Representation of women across selected industries (United States and Canada) 111
Table 7.1. Estimates of the fiscal effects of BEPS 116
Table 7.2. Vodafone Group countries of operations (Top three countries by economic activity and by profits, millions of euros, 2016-2017) 119
Table 8.1. Total and Electrolux: Collective bargaining coverage 127
Table 8.2. PUMA: Supply chain workers covered by a collective bargaining agreement 128
157
CORPORATE SUSTAINABILITY ACCOUNTING: WHAT CAN AND SHOULD CORPORATIONS BE DOING?
References
ACAS (Advisory, Conciliation and Arbitration Service) and Government Equalities Office. 2019. Gender Pay Gap Reporting: Overview. Accessed 30 September 2019. https://www.gov.uk/guidance/gender-pay-gap-reporting-overview#mandatory-gender-pay-gap-reporting
Accountability. 2005. Towards Responsible Lobbying: Leadership and Public Policy. Accessed 30 September 2019. https://www.unglobalcompact.org/library/254
Accountancy Daily. 2018. “OECD says corporate tax rates in ‘race to the average’”. 5 September. Accessed 30 September 2019. https://www.accountancydaily.co/oecd-says-corporate-tax-rates-race-average
ASB/FRC. 2009. Rising to the Challenge: A Review of Narrative Reporting by UK Listed Companies. Accessed 30 September 2019. https://www.iasplus.com/en/binary/Uk/0910narrativereporting.pdf
ActionAid. 2015. Levelling Up: Ensuring a fairer share of corporate tax for developing countries. Accessed 30 September 2019. https://actionaid.org/sites/default/files/levelling_up_final_0.pdf
adidas. 2017. Global Policy Manual Responsible Sourcing & Purchasing Policy. Accessed 30 September 2019. https://www.adidas-group.com/media/filer_public/ca/ba/caba936a-7da7-4710-9d88-d437bac87923/adidas_responsible_sourcing___purchasing_policy_en.pdf
AECOM. 2016. “AECOM invests 1 million to close the gender pay gap”. Accessed 30 September 2019. https://www.aecom.com/au/employer-of-choice-gender-equality/
Alliance for Corporate Transparency. 2019. Companies failing to report meaningful information about their impacts on society and the environment. Accessed 30 September 2019. https://allianceforcorporate transparency.org/news/companies-failing.html
Amesheva, Inna. 2017. “Five Technology Trends Defining the Future of Corporate Sustainability.” Eco-Business newsletter, 28 August. Accessed 30 September 2019. https://www.eco-business.com/opinion/five-technology-trends-defining-the-future-of-corporate-sustainability/
Anderson, Edward, and Tammie O’Neil. 2006. A New Equity Agenda? Reflections on the 2006 World Development Report, the 2005 Human Development Report and the 2005 Report on the World Social Situation. Working Paper 265. Overseas Development Institute. Accessed 30 September 2019. https://www.odi.org/sites/odi.org.uk/files/odi-assets/publications-opinion-files/1784.pdf
Anderson, Sarah, and Sam Pizzigati. 2019. “When Corporations Pay CEOs Way More Than Employees, Make Them Pay!” The Nation. January 17. Accessed 30 November 2019. https://www.thenation.com/article/inequality-tax-poverty-billionaire/
Anker, Richard. 2011. “Estimating a living wage: A methodological review”. Conditions of Work and Employment Series No. 29. Conditions of Work and Employment Programme. Geneva: ILO. Accessed 30 September 2019. https://www.ilo.org/travail/whatwedo/publications/WCMS_162117/lang--en/index.htm
AFWA. 2017a. Asia Floor Wage Alliance: A Short History at the Brink of Transition. Accessed 28 November 2019. https://asia.floorwage.org/resources/essays-and-reports/afwa-a-short-history-on-the-brink-of-transition/view
AFWA. 2017b. Calculating a Living Wage. Accessed 28 November 2019. https://asia.floorwage.org/calculating-a-living-wage
Auld, Graeme and Benjamin Cashore. 2012. “The Forest Stewardship Council.” In Business Regulation and Non-State Actors: Whose Standards? Whose Development? edited by Darryl Reed, Peter Utting, and Ananya Mukherjee-Reed. London: Routledge/UNRISD.
Austral Fisheries. 2019. “Austral partner with WWF, BCGDV to launch OpenSc” Austral Fisheries Blog, Jan. 17. Accessed 15 June 2020. https://www.australfisheries.com.au/news/2018/austral-partner-with-wwf,-bcgdv-to-launch-opensc
Baeten, Xavier, and Loyens Said. 2016. CEO Remuneration in Europe. Brussels: Vlerick Business School.
Bank Jorgensen, Helle. 2018. “Demystifying the ‘alphabet soup’ of reporting frameworks” July. Accessed 30 September 2019. http://www.ethicalcorp.com/demystifying-alphabet-soup-reporting-frameworks
Barman, Emily. 2018. “Doing Well by Doing Good: A Comparative Analysis of ESG Standards for Responsible Investment.” Advances in Strategic Management 38: 289–312.
Barratt, Bianca. 2018. “5 of the best UK companies for women to work for.” Forbes. October 18. Accessed 30 September 2019. https://www.forbes.com/sites/biancabarratt/2018/10/18/5-of-the-best-uk-companies-for-women-to-work-for/#74bc415919a6
Barrientos, Stephanie. 2019. Gender and Work in Global Value Chains: Capturing the Gains? Cambridge: Cambridge University Press.
Barrientos, Stephanie and Sally Smith. 2012. “Assessing the ETI codes of labour practice.” In Business Regulation and Non-State Actors: Whose Standards? Whose Development? edited by Darryl Reed, Peter Utting, and Ananya Mukherjee-Reed. London: Routledge/UNRISD.
Baue, Bill. 2013. #SustyGoals 2: A Dialogue with Allen White of GISR, the Godfather of Sustainability Context (Part 2). Accessed 15 December 2019. https://sustainablebrands.com/read/new-metrics/sustygoals-2-a-dialogue-with-allen-white-of-gisr-the-godfather-of-sustainability-context-part
158
UNRISD
Baue, Bill. 2014. “Sustainability Con-text Group Website Goes Live.” Accessed 30 December 2018. http://www.sustycontext.org/blog/
Baue, Bill. 2017. “Blueprint 3: Data, Data integration, contextualization & activation for multicapital accounting, Blueprint Report, Final Version 1.0, 30 May.” Reporting 3.0, Blueprint Series 2016–2018. Accessed 30 December 2018. https://reporting3.org/wp-content/uploads/2018/06/R3-BP3.pdf
Baue, Bill. 2019. Compared to What? A Three-Tiered Typology of Sustainable Development Performance Indicators: From Incremental to Contextual to Transformational. UNRISD Working Paper 5. Geneva: UNRISD. Accessed 30 November 2019. http://www.unrisd.org/ 80256B3C005BB128/search/ECC6A114678FD328 8025849B00441788
Baue, Bill, and Ralph Thurm. 2018a. “What Are Thresholds & Allocations, and Why Are They Necessary for Sustainable System Value Creation?” Accessed 30 December 2018. https://medium.com/@ralphthurm/what-are-thresholds-allocations-and-why-are-they-necessary-for-sustainable-system-value-fe127483c407
Baue, Bill, and Ralph Thurm. 2018b. “ESG’s Illusions of Progress & Necessary Transformation.” Accessed 30 December 2018. https://reporting3.org/wp-content/uploads/2018/02/Reporting-3.0-BASIC-Event-14-February-2018-Compressed.pdf
BBC News. 2019. ‘Climate change: Central banks warn of financial risks in open letter’. BBC News, 17 April 2019. https://www.bbc.com/news/world-47965284
Beal D., Eccles R., Hansell G., Lesser R., Unnikrishnan S., Woods W., and D. Young. 2017. Total Societal Impact: A New Lens for Strategy. Boston Consulting Group. https://www.bcg.com/Images/BCG-Total-Societal-Impact-Oct-2017-NL_tcm74-174019.pdf
Bebbington, Jan, and Jeffrey Unerman. 2018. “Achieving the United Nations Sustainable Development Goals: An enabling role for accounting research.” Accounting, Auditing & Account-ability Journal, 31(1):2–24. Accessed 30 September 2019. https://doi.org/10.1108/AAAJ-05-2017-2929
Becchetti, Leonardo, Nazaria Solferino, and Maria Elisabetta Tessitore. 2013. Corporate social responsibility and profit volatility: theory and empirical evidence. Working papers 129. AICCON. Accessed 15 December 2019. https://www.aiccon.it/wp-content/uploads/2017/01/wp129.pdf
Beck, Ulrich. 2005. Power in the Global Age. Cambridge: Polity Press.
Bell, Simon, and Stephen Morse. 2018. “Sustainability Indicators Past and Present: What Next?” Sustainability, 10(5):1688. 20 April. Accessed 30 September 2019. https://www.mdpi.com/2071-1050/10/5/1688/pdf
Bendell, Jem. 2004. Barricades and Boardrooms: A Contemporary History of the Corporate Accountability Movement, Programme on Technology, Business and Society, Paper No. 13. Geneva: UNRISD.
Bendell, Jem, and David Murphy. 2002. “Towards Civil Regulation: NGOs and the Politics of Corporate Environmentalism.” In The Greening of Business in Developing Countries: Rhetoric, Reality and Prospects, edited by Peter Utting. London: Zed Books.
Bendell, Jem, Matthew Slater, and Will Ruddick. 2015. Re-imagining Money to Broaden the Future of Development Finance What Kenyan Community Currencies Reveal is Possible for Financing Development. Working Paper 2015–10. Geneva: UNRISD.
Bennedsen, Morten, Elena Simintzi, Margarita Tsoutsoura, and Daniel Wolfenzon. 2018. “Do firms respond to gender pay gap transparency?” Accessed 30 September 2019. https://wpcarey.asu.edu/sites/default/files/daniel_wolfenzon_seminar_november_9_2018.pdf
Better Buying. 2018. Better Buying™ Index Report 2018. Purchasing Practices Performance in Apparel, Footwear, and Household Textile Supply Chains. Accessed 30 September 2019. https://betterbuying.org/wp-content/uploads/2018/10/Better-Buying-Benchmark-Report_fall-2018.pdf
Bhattacharyya, Suman. 2018. “Brands are Using Blockchain to Promote Sustainable Products.” Digiday UK. 14 September. Accessed 30 September 2019. https://digiday.com/retail/brands-using-blockchain-promote-sustainable-products/
Bjørn, Anders, Niki Bey, Susse Georg, Inge Røpke, and Michael Zwicky Hauschild. 2016. “Is Earth recognized as a finite system in corporate responsibility reporting?” Journal of Cleaner Production. 16 January. Accessed 30 December 2017. http://www.sciencedirect.com/science/article/pii/S0959652615019204
Blasi, Jeremy, and Jennifer Bair. 2019. An Analysis of Multiparty Bargaining Models for Global Supply Chains. Conditions of Work and Employment Series. Number 105. Geneva: ILO. Accessed 30 September 2019. https://www.ilo.org/wcmsp5/groups/public/---ed_protect/---protrav/---travail/documents/publication/wcms_655541.pdf
Blockchain for Good (BC4G). N.d. Block-chain for Good: Humanising the Blockchain. White Paper. Accessed 30 September 2019. https://www.slideshare.net/SimonChan25/theblockchainforgoodmanifesto-1
Bloom, Robert. 2015. “The Global Reporting Initiative on Remu-neration: Analysis and Commen-tary.” Compensation & Benefits Review, 47(5–6):224 –231.
Bloomberg. 2018. 104 Companies Included in First Sector-Neutral Bloomberg Gender-Equality Index. Accessed 20 December 2019. https://www.bloomberg.com/company/press/104-companies-included-first-sector-neutral-bloomberg-gender-equality-index/
Bloomberg. 2019a. Google, Facebook Set 2018 Lobbying Records as Tech Scrutiny Intensifies. By Ben Brody. Updated on January 23. Accessed 30 September 2019. https://www.bloomberg.com/news/articles/2019-01-22/google-set-2018-lobbying-record-as-washington-techlash-expands
Bloomberg. 2019b. Elizabeth Warren Proposes Steep Lobbying Taxes on Top U.S. Companies. By Misyrlena Egkolfopoulou. October 2. Accessed 30 September 2019. https://www.bloomberg.com/news/articles/ 2019-10-02/warren-proposes-steep-lobbying-taxes-on-top-u-s-companies
Bloomberg. 2019c. Boeing’s Washing-ton Influence Network Tested in 737 Max Crisis. By Bill Allison and John McCormick. March 22. Accessed 30 September 2019. https://www.bloomberg.com/news/articles/2019-03-22/boeing-s-washington-influence-network-tested-in-737-max-crisis
CORPORATE SUSTAINABILITY ACCOUNTING: WHAT CAN AND SHOULD CORPORATIONS BE DOING?
Bloomberg. 2019d. Bloomberg Expands Eligibility for 2020 Gender-Equality Index to Include Nearly 6,000 Companies Across 84 Countries. Accessed 15 June 2020. https://www.bloomberg.com/company/press/bloomberg-gei-expanded-eligibility/
Bloomberg. 2020. Bloomberg Gender-Equality Index: Gender Reporting Framework. Accessed 15 June 2020. https://data.bloomberglp.com/company/sites/46/2019/05/EXEC_GEI_Index_GenderReporting Framework_PDF_V6.pdf
Boiral, Olivier. 2013. “Sustainability reports as simulacra? A counter-account of A and A+ GRI reports.” Accounting, Auditing & Accountability Journal, Vol. 26 Issue 7: 1036–1071.
Bolton, Dianne, and Terry Landells. 2015. “Reconceptualizing Power Relations as Sustainable Business Practice.” Special Issue on Emerging Trends in CSR and Sus-tainability, Business Strategy and the Environment. November 20. https://doi.org/10.1002/bse.1893
Borzaga, Carlo, Gianluca Salvatori, and Riccardo Bodini. 2017. Social and Solidarity Economy and the Future of Work. Euricse Working Paper for the ILO (International Labour Office). Geneva: ILO.
Bosch G., and S. Lehndorff. 2017. ‘Autonomous bargaining in the shadow of the law: from an enabling towards a disabling state’, in: D. Grimshaw, C. Fagan, G. Hebson, I. Tavora (eds.), Making work more equal. A new labour market segmentation approach, Manchester University Press, Manchester. Accessed 30 September 2019. https://www.manchesteropenhive.com/view/9781526125972/9781526125972.00009.xml
Boushey, Heather, J. Bradford DeLong, and Marshall Steinbaum (eds.). 2017. After Piketty: The Agenda for Economics and Inequality. Cambridge, MA: Harvard University Press.
Bradbury, David, Tibor Hanappi, and Anne Moore 2018. “Estimating the fiscal effects of base erosion and profit shifting: data availability and analytical issues”. Transnational Corporations, Vol. 25, No. 2.
Brock, Gillian, and Thomas Pogge. 2014. “Global Tax Justice and Global Justice”. Moral Philosophy and Politics. Volume 1, Issue 1, May.
Brown, Amy. 2018. Responsible Investing Survey Reveals Major Shift in ESG Thinking. Triple Pundit. Accessed 18 December 2019. https://www.triplepundit.com/story/2018/responsible-investing-survey-reveals-major-shift-esg-thinking/10601
Bureau of Labor Statistics. 2019. Access to paid and unpaid family leave in 2018. February 27. Accessed 30 September 2019. https://www.bls.gov/opub/ted/2019/access-to-paid-and-unpaid-family-leave-in-2018.htm
Buss, Dale. 2018. “Sanders Calls Out Top CEOs Over Pay. Chief Executive.” June 29. Accessed 30 September 2019. https://chiefexecutive.net/bernie-sanders-calls-out-ceos-pay/
Cantele Silvia, Thomas A. Tsalis, and Ioannis Nikolaou. 2018. “A New Framework for Assessing the Sustainability Reporting Disclosure of Water Utilities.” Special Issue Challenges for a Sustainable Water Use and Re-Use, Sustainability 2018, 10(2), 433. https://doi.org/10.3390/su10020433
Care,com. 2019. Leading with care: Why today’s workforce needs 21st century care benefits? Care@work. Accessed 30 September 2019. https://cdn2.hubspot.net/hubfs/318630/Reports/Leading%20with%20Care/Leading%20with%20Care.pdf
Carney, Mark, François Villeroy de Galhau, and Frank Elderson. 2019. “Open letter on climate-related financial risks. Bank of England.” Accessed 30 September 2019. https://www.bankofengland.co.uk/news/2019/april/open-letter-on-climate-related-financial-risks
Cascio, Wayne, and John Boudreau. 2011. Investing in People: Second Edition: Financial Impact of Human Resource Initiatives. Pearson Education Inc. Upper Saddle River, NJ, USA.
CDPHE (Colorado Department of Public Health and Environment) and EPIC (Executives Partnering to Invest in Children) 2017. Family-Friendly Workplace Toolkit. Accessed 20 December 2019. https://docs.google.com/file/d/1RNdawNQSYx3tOhgq0frAZfSlYUEcj5k/view
Center on Executive Compensation. 2019. “Portland Expecting Up to $3.5 Million In First Year of Pay Ratio Tax.” Accessed on 30 September 2019. http://www.execcomp.org/News/NewsStories/portland-expecting-up-to-3.5-million-in-first-year-of-pay-ratio-tax
Center for Political Accountability and the Zicklin Center for Business Ethics. 2015. The 2015 CPA-Zicklin Index of Corporate Political Disclosure and Accountability. Accessed 15 December 2019. https://politicalaccountability.net/hifi/files/index/CPA-Zicklin_Index_Final_with_links.pdf
Center for Responsive Politics. 2019. Lobbying Database. Open Secrets.Org. Accessed 30 September 2019. https://www.opensecrets.org/lobby/index.php
CEO (Corporate Europe Observatory), The Austrian Federal Chamber of Labour (Arbeiterkammer), and The Austrian Trade Union Federation (ÖGB). 2014. The Fire Power of the Financial Lobby: A Survey of the Size of the Financial Lobby at the EU Level. Accessed 30 September 2019. https://corporateeurope.org/en/financial-lobby/2014/04/fire-power-financial-lobby
Chamberlain, Andrew, Daniel Zhao, and Amanda Stansell. 2019. Progress on the Gender Pay Gap: 2019. March 26. Accessed 30 September 2019. https://www.glassdoor.com/research/studies/gender-pay-gap-2019/
Cheng, Michelle. 2019. “Target is expanding parental leave, including for hourly and part-time workers.” Quartz at Work. June 10. Accessed 30 September 2019. https://qz.com/work/1640142/target-expands-parental-leave-and-other-benefits-for-hourly-and-part-time-workers/
Cho, Charles H., Giovanna Michelon, Dennis M. Patten, and Robin W. Roberts. 2015. “CSR Disclosure: the More Things Change … ?” Open Research Exeter. Accessed 30 September 2019. https://ore.exeter.ac.uk/repository/handle/10871/17859
CHRB (Corporate Human Rights Benchmark). 2018a. Corporate Human Rights Benchmark Progress Report. Executive Summary. Accessed 30 September 2019. https://www.corporatebenchmark.org/sites/default/files/documents/CHRB%202018%20Executive%20Summary-brochure-web.pdf. Accessed 30 December 2018
159
160
UNRISD
CHRB 2018b. Corporate Human Rights Benchmark – 2018 Key Findings. Accessed 30 December 2018. http://www.respect.international/corporate-human-rights-benchmark-2018-key-findings/
Christian Aid. 2018. “Counting the Cost: A Year of Climate Breakdown.” Accessed 30 December 2018. https://media centre.christianaid.org.uk/dont-delete-this-thanks-joe/
Christian Aid, Oxfam GB, and ActionAid UK. 2015. Getting to Good: Towards Responsible Corporate Tax Behaviour. Discussion Paper. Accessed 30 September 2019. https://www.actionaid.org.uk/sites/default/files/publications/getting_to_good_towards_responsible_corporate_tax_behaviour.pdf
Clapp, Jennifer, and Peter Dauvergne. 2005. Paths to a Green World: The Political Economy of the Global Environment. Cambridge: MIT Press.
Clarke, Amelia, and Andrew Crane. 2018. “Cross-Sector Partnerships for Systemic Change: Systematized Literature Review and Agenda for Further Research.” Journal of Business Ethics, 150(2):303–313.
Clausing, Kimberly A. 2018. “Does tax drive the headquarters locations of the world’s biggest companies?” Transnational Corporations, Vol. 25. No. 2. 37–66.
Clay, Jason. 2005. Exploring the Links Between International Business and Poverty Reduction: A Case Study of Unilever in Indonesia. Oxfam GB, Novib Oxfam Netherlands and Unilever.
Clifford, Steven. 2017. “How Companies Actually Decide What to Pay CEOs.” June 14. The Atlantic. Accessed 30 November 2019. https://www.theatlantic.com/business/archive/2017/06/how-companies-decide-ceo-pay/530127/
Cobham, Alex. 2018. The B-Team: Lowering the bar for tax trans-parency? Tax Justice Network. Accessed 30 September 2019. https://www.taxjustice.net/2018/ 02/16/b-team-lowering-bar-tax-transparency/
Cobham, Alex, and Petr Jansky. 2017. Global Distribution of Revenue Loss from Tax Avoidance: Re-estimation and country results. WIDER Working Paper 2017/55.
Cobham, Alex, Jonathan Gray, and Richard Murphy. 2017. What Do They Pay? Towards a Public Database to Account for the Economic Activities and Tax Contributions of Multinational Corporations. Accessed 20 December 2019. http://datafor taxjustice.net/what-do-they-pay/
Committee of Experts on International Cooperation in Tax Matters. 2018. The Role of Taxation and Domestic Resource Mobilization in the Implementation of the Sustainable Development Goals. Seventeenth session Geneva. Accessed 20 December 2019. https://www.un.org/esa/ffd/wp-content/uploads/2018/08/CRP19-The-Role-of-Taxation-and-Domestic-Resource-Mobilization-in-the-Implementation-of-the-Sustainable-Development-Goals.pdf
Cook, Sarah, Kiah Smith, and Peter Utting. 2012. Green Economy or Green Society? Contestation and Policies for a Fair Transition. Geneva: UNRISD/Friedrich Ebert Stiftung.
CREA. 2019. Working Definitions of Wage Levels. Accessed 28 November 2019. https://crea.org/sustainable-living-wage-and-income/working-definitions-of-wage-levels/
Cuff, Madeleine, and James Murray. 2017. “BusinessGreen 10 Years On: Corporate Sustainability has entered the mainstream but where does it go next?” 23 October. Accessed 30 December 2018. https://www.businessgreen.com/bg/analysis/3019493/the-green-business-evolution-uncovering-the-darwinian-challenge-facing-corporate-sustainability
Daly, Herman. 1974. “Steady-State Economics versus Growthmania: A Critique of the Orthodox Conceptions of Growth, Wants, Scarcity, and Efficiency.” Policy Sciences, 5(2):149–167.
Daly, Herman. 2013. Ecological Economics and Sustainable Development: Selected Essays of Herman Daly. Cheltenham, UK and Northampton, MA, USA. Edward Elgar.
D’Aquila, Jill M. 2018. “The Current State of Sustainability Reporting: A Work in Progress.” The CPA Journal. July. https://www.cpajournal.com/2018/07/30/the-current-state-of-sustainability-reporting/
Davies, Dan. 2018. “Sustainable Value Chains and Blockchain: Practical Applications.” 2018. https://sustainablebrands.com/read/supply-chain-1/sustainable-value-chains-blockchain-practical-applications
Delmas, M., and V.D. Blass. 2010. “Measuring Corporate Environmental Performance: the Trade-Offs of Sustainability Ratings.” Business Strategy and the Environment 19: 245-260. doi: 10.1002/bse.676. Accessed 30 September 2019. https://www.ioes.ucla.edu/wp-content/uploads/2010-Delmas-Doctori-Blass-Business-Strategy-and-the-Environment-1.pdf
Deloitte. 2018. 2018 BEPS Global Survey. Accessed 20 December 2019. https://www2.deloitte.com/bd/en/pages/tax/articles/beps-global-survey.html
Deming, W. Edwards. 1986. Out of the Crisis. Cambridge, MA: Massachusetts Institute of Technology, Center for Advanced Engineering Study.
Demkes, Emy. 2020. “The more Patagonia rejects consumerism, the more the brand sells.” The Correspondent. Accessed 29 April, 2020. https://thecorrespond ent.com/424/the-more-patagonia-rejects-consumerism-the-more-the-brand-sells/56126501376-a30f2daa
Desjardins, Jeff. 2018. How gender diversity enhances society. Visual Capitalist. February. Accessed 30 September 2019. https://www.weforum.org/agenda/2018/02/how-gender-diversity-enhances-society
Doganova, Liliana. 2018. “Discounting the Future: A Political Technology”. Economic Sociology, 19 (2): 4–18.
Dommen, E. 1999. “Pertinence et limites de codes étiques.” Reflets Perspectives de la Vie Economique, 38(3):41–51.
Dupont-Nivet, D., A. Ruhaak, M. Marije Schuurs, J. Tielbeke, and Emiel Woutersen. 2017. “Inside Unilever’s sustainability myth,” New Internationalist, April 13. https://newint.org/features/web-exclusive/2017/04/13/inside-unilever-sustainability-myth
Drutman, Lee. 2015a. ‘How Corporate Lobbyists Conquered American Democracy’. April 20. The Atlantic. https://www.theatlantic.com/business/archive/2015/04/how-corporate-lobbyists-conquered-american-democracy/390822/
161
CORPORATE SUSTAINABILITY ACCOUNTING: WHAT CAN AND SHOULD CORPORATIONS BE DOING?
Drutman, Lee. 2015b. The Business of America is Lobbying: How Corporations Became Politicized and Politics Became More Corporate. Oxford: Oxford University Press.
ECCJ (European Coalition for Corporate Justice). 2018. “Corporate Human Rights Due Diligence – identifying and leveraging emerging practice”. ECCJ submission to the UN Working Group on Business and Human Rights. Accessed 30 September 2019. https://www.ohchr.org/Documents/Issues/Business/WGSubmissions/2018/ECCJ.pdf
EcoAct. 2018. The Sustainability Reporting Performance of the FTSE 100. Annual Report. Accessed 30 December 2018. https://info.eco-act.com/the-sustainability-reporting-performance-of-the-ftse-100-2018
ECOSOC (United Nations Economic and Social Council). 2019. Follow-up note on the role of taxation and domestic resource mobilization in achieving the Sustainable Development Goals. Note by the Secretariat. 11 February. E/C.18/2019/2. Accessed 30 September 2019. https://sdg.iisd.org/news/un-secretariat-publishes-note-on-domestic-taxes-for-sdgs/
EcoVadis. 2018 “Less Than 10 Percent of Global Companies Report on Business Ethics KPIs, According to New EcoVadis Anti-Corruption Report.” Accessed 30 September 2019. https://www.ecovadis.com/less-than-10-percent-of-global-companies-report-on-business-ethics-kpis-according-to-new-ecovadis-anti-corruption-report/
EHRC (Equality and Human Rights Commis sion). 2018. Closing the Gender Pay Gap. Accessed 30 September 2019. https://www.equalityhumanrights.com/sites/default/files/closing-the-gender-pay-gap_0.pdf
EHS Today. 2016. Presenteeism Costs Business 10 Times More than Absenteeism. March 16, 2016. Accessed 30 September 2019. https://www.ehstoday.com/safety-leadership/presenteeism-costs-business-10-times-more-absenteeism
Elson, Diane. 1999. Labor markets as gendered institutions: Equality, efficiency and empowerment issues, World Development, Vol. 27, No. 3, 611–627.
Elkington, John. 1997. Cannibals with Forks: The Triple Bottom Line of 21st Century Business. Oxford: Capstone Publishing.
Elkington John. 2011. “Don’t abandon CSR for creating shared value just yet.” The Guardian, 25 May. Accessed 30 December 2018. https://www.theguardian.com/sustainable-business/sustainability-with-john-elkington/corporate-social-resposibility-creating-shared-value
Elkington, John. 2018. “25 Years Ago I Coined the Phrase ‘Triple Bottom Line.’ Here’s Why It’s Time to Rethink It.” Harvard Business Review. June 25. Accessed 30 December 2018. https://hbr.org/2018/06/25-years-ago-i-coined-the-phrase-triple-bottom-line-heres-why-im-giving-up-on-it
Elkington John, and Jochen Zeitz. 2014. The Breakthrough Challenge: 10 Ways to Connect Today’s Profits with Tomorrow’s Bottom Line. San Francisco, CA: Jossey-Bass.
Ellen MacArthur Foundation. 2013. Towards the Circular Economy: Economic and Business Rationale for an Accelerated Transition. Accessed 30 September 2019. https://www.ellenmacarthurfoundation.org/assets/downloads/publications/Ellen-MacArthur-Foundation-Towards-the-Circular-Economy-vol.1.pdf
Emerson, Jed. 2018. The Purpose of Capital: Elements of Impact, Financial Flows, and Natural Being. San Francisco: Blended Value Group Press.
EPIC. 2018. ILO, UN WOMEN and OECD’s Vision for the Equal Pay International Coalition (EPIC) to Contribute to the Achievement of SDG Target 8.5 Focusing on Equal Pay between Women and Men for Work of Equal Value. Accessed 30 September 2019. https://www.equalpayinternational coalition.org/wp-content/uploads/ 2018/10/EPICs-Vision.pdf
EPIC. 2019. Background note for the Technical Meeting: Promoting Better Indicators, Statistics, Data and Policies to Reduce the Gender Pay Gap. 28 February. Accessed 30 September 2019. https://www.equalpayinternational coalition.org/whats_new/an-epic-technical-meeting
Epstein, Marc J., and Adriana Rejc Buhovac. 2014. Making Sustainability Work: Best Practices in Managing and Measuring Corporate Social, Environmental and Economic Impacts. 2nd edition. Oakland, CA: Berrett-Koehler Publishers.
Equileap. 2018a. Bridging the Gap: How governments, companies and investors can tackle gender pay inequality. Research Paper. May. Accessed 30 September 2019. http://equileap.org/wp-content/uploads/2018/05/Equileap_Bridging-the-Gap_EN.pdf
Equileap. 2018b. Gender Equality Global Report & Ranking. Equileap. Accessed 20 December 2019. https://equileap.org/wp-content/uploads/2018/10/Equileap-Gender-Equality-Global-Report-and-Ranking-2018.pdf
Escrig-Olmedo, Elena, Maria Muñoz-Torres, and Maria Fernandez-Izquierdo. 2010. “Socially Responsible Investing: Sustainability Indices. ESG Rating and Information Provider Agencies.” International Journal of Sustainable Economy, 2 (4): 442–461. doi: 10.1504/IJSE.2010.035490.
ETI. 2017. Towards Greater Trans-parency: The Business Case. Accessed 30 September 2019. https://www.ethicaltrade.org/resources/towards-greater-transparency-business-case
Eurodad. 2017. Tax Games: the Race to the Bottom. Accessed on 30 September 2019. https://eurodad.org/tax-games-2017
Eurofound. 2010. Addressing the gender pay gap: Government and social partner actions. Accessed 30 September 2019. https://www.eurofound.europa.eu/sites/default/files/ef_files/pubdocs/ 2010/18/en/2/EF1018EN.pdf
European Commission. 2012. Proposal for a Directive of the European Parliament and of the Council on improving the gender balance among non-executive directors of companies listed on stock exchanges and related measures. Accessed 15 December 2019. https://eur-lex.europa.eu/legal-content/EN/TXT/?uri=CELEX:52012PC0614
162
UNRISD
European Commission. 2016. Stra-tegic engagement for gender equality 2016-2019. Accessed 30 September 2019. https://ec.europa.eu/anti-trafficking/sites/antitrafficking/files/strategic_engagement_for_gender_equality_en.pdf
European Commission 2017a. EU Action Plan 2017-2019: Tackling the gender pay gap. Accessed 30 September 2019. https://www.eesc.europa.eu/en/our-work/opinions-information-reports/opinions/eu-action-plan-2017-2019-tackling-gender-pay-gap
European Commission. 2017b. Fact Sheet. Questions and Answers: What is the EU doing for women’s rights and gender equality? 8 March. http://europa.eu/rapid/press-release_MEMO-17-470_en.htm
European Commission. 2017c. Communication from the Commission: Guidelines on non-financial reporting (methodology for reporting non-financial information). Accessed 30 December 2018. https://eurlex.europa.eu/legalcontent/EN/TXT/?uri=CELEX:52017XC0705(01)
European Council. 2019. “Better work-life balance for parents and carers in the EU: Council adopts new rules.” 13 June. Accessed 30 September 2019. https://www.consilium.europa.eu/en/press/press-releases/2019/06/13/better-work-life-balance-for-parents-and-carers-in-the-eu-council-adopts-new-rules/
Evers-Hillstrom, Karl, Raymond Arke, and Luke Robinson. 2019. “A look at the impact of Citizens United on its 9th anniversary.” OpenSecrets News. The Center for Responsive Politics. January 21. Accessed 30 September 2019. https://www.opensecrets.org/news/2019/01/citizens-united/
EY with the UN Global Compact. 2016. The state of sustainable supply chains: Building responsible and resilient supply chains. Accessed 30 September 2019. https://www.ey.com/Publication/vwLUAssets/EY-building-responsible-and-resilient-supply-chains/$FILE/EY-building-responsible-and-resilient-supply-chains.pdf
Faccio, Tommaso, and Valpy Fitzgerald. 2018. “Sharing the corporate tax base: equitable taxing of multinationals and the choice of formulary apportionment”. Transnational Corporations. Vol. 25. No. 2. 67-90. Accessed 20 December 2019. https://unctad.org/en/PublicationsLibrary/diae2018d4_en.pdf
Fagan, Colette, Helen Norman, Mark Smith, and María C. González Menéndez. 2014. In search of good quality part-time employment. Conditions of Work and Employment Series No. 43, Inclusive Labour Markets, Labour Relations and Working Conditions Branch. Geneva: ILO. Accessed 30 September 2019. https://www.ilo.org/wcmsp5/groups/public/---ed_protect/---protrav/---travail/documents/publication/wcms_237781.pdf
Farnsworth, Kevin. 2010. “Business Power, Social Policy Preferences and Development.” In Business, Politics and Public Policy: Implications for Inclusive Development edited by José Carlos Marques and Peter Utting. Basingstoke, UK: Palgrave Macmillan/UNRISD.
Farnsworth, Kevin. 2012. Social versus Corporate Welfare: Competing Needs and Interests within the Welfare State. Basingstoke, UK: Palgrave Macmillan.
Fashion Revolution. 2019. Fashion Transparency Index. 2019 Edition. Accessed 30 September 2019. https://issuu.com/fashionrevolution/docs/fashion_transparency_index_2019?e=25766662/69342298
Ferrant, Gaëlle, Luca Maria Pesando, and Keiko Nowacka, Unpaid care work: The missing link in the analysis of gender gaps in labour outcomes, OECD Development Centre, December 2014. Accessed 30 September 2019. https://www.oecd.org/dev/development-gender/Unpaid_care_work.pdf
Financial Times. 2018a. “Weather-related catastrophes take toll on insurers.” Accessed 30 December 2018. https://www.ft.com/content/f00ead22-fd4e-11e8-ac00-57a2a826423
Financial Times. 2018b. “The New Climate Change Warriors.” 28 December.
Financial Times. 2018c. “Gender pay gap: how women are short-changed in the UK.” April 5, by Aleksandra Wisniewska, Billy Ehrenberg-Shannon and Sarah Gordon. Accessed 30 September 2019. https://ig.ft.com/gender-pay-gap-UK/
Financial Times. 2019a. “Repsol sets net-zero emissions target for 2050.” Accessed 20 April 2020. https://www.ft.com/content/ 90f49a98-1528-11ea-8d73-6303645ac406
Financial Times. 2019b. “Make work-life balance a key performance metric.” July 22, by Brigid Schultz. Accessed 30 September 2019. https://www.ft.com/content/0c313e88-a89a- 11e9-90e9-fc4b9d9528b4
Fine, Ben. 2014. The Continuing Enigmas of Social Policy. Working Paper 2014-10: Geneva: UNRISD. Accessed 30 September 2019. http://www.unrisd.org/80256B3C005BCCF9/%28 httpAuxPages%29/30B153EE7 3F52ABFC1257D0200420A61/ $file/Fine.pdf
FLA. 2018. Issue Brief. New Law on Employer-Sponsored Childcare in El Salvador. August. Accessed 30 September 2019. https://www.fairlabor.org/sites/default/files/documents/reports/employer-sponsored_childcare_el_salvador_aug2018.pdf
FLA. 2019. Toward Fair Compensation in Vietnam: Insights on reaching a living wage. Accessed 10 December 2019. https://www.fairlabor.org/report/toward-fair-compensation-vietnam-insights-reaching-living-wage
Forrester, Jay W. 2009. Some Basic Concepts in System Dynamics. Sloan School of Management. Cambridge, MA: Massachusetts Institute of Technology. http://static.clexchange.org/ftp/documents/system-dynamics/SD2009-02SomeBasicConcepts.pdf
Forstater, Maya. 2018. Tax and Development: New Frontiers of Research and Action. CGD Policy Paper. Washington, DC: Center for Global Development. Accessed 30 November 2019. https://www.cgdev.org/publication/tax-and-development-new-frontiers-research-and-action
163
CORPORATE SUSTAINABILITY ACCOUNTING: WHAT CAN AND SHOULD CORPORATIONS BE DOING?
Forum for the Future and The Climate Group. 2016. Measuring your way to net positive. Accessed 30 December 2018. https://www.forumforthefuture.org/Handlers/Download.ashx?IDMF=cb41e79a-4e13-4118-97c9-e50996113f29
Forum for the Future, The Climate Group, and WWF-UK. 2014. Net Positive: A New Way of Doing Business. Accessed 30 September 2019. https://www.theclimategroup.org/sites/default/files/archive/files/Net-Positive.pdf
Fraser, Nancy. 2012. Can societies be commodities all the way down? Polanyian reflections on capitalist crisis. halshs-00725060. Accessed 10 December 2019. https://halshs.archives-ouvertes.fr/halshs-00725060/document
Francis, David. 2017. Tackling Wage Inequality in South Africa: Pay Ratios and Capping Pay. National Minimum Wage Research Initiative. Wage Inequality Policy Brief No. 1. Johannesburg: University of Witwatersrand. Accessed 30 November 2019. http://nationalminimumwage.co.za/wp-content/uploads/2018/01/NMW-RI-Wage-Inequality-Policy-Brief-1-Web.pdf
Friedman, Milton. 1970. “The Social Responsibility of Business is to Increase its Profits.” The New York Times Magazine, 13 September.
Freeman, R. Edward. 1984. Strategic Management: A Stakeholder Approach. Boston: Pitman.
Fukuda-Parr, Sakiko. 2003. “The Human Development Paradigm: Operationalizing Sen’s Ideas on Capabilities.” Feminist Economics 9(2–3):301–317.
Fuller, Joseph B., Judith K. Wallenstein, Manjari Raman, and Alice de Chalendar. 2019. Future Positive: How Companies Can Tap Into Employee Optimism to Navigate Tomorrow’s Workplace. Published by BCG, Harvard Business School. Accessed 30 September 2019. https://www.hbs.edu/managing-the-future-of-work/research/Documents/Future%20Positive%20Report.pdf
Gaffuri, Jvan. 2019. Trends in Sustain-ability and Update on the RobecoSAM CSA Methodology. RobecoSAM. February 14, Accessed 30 September 2019. http://docs.wixstatic.com/ugd/eb61fb_4d779630457247 e682bf128b0cfe9903.pdf?index=true
Gallopin, G.C. “The Socio-ecological System (SES) Approach to Sustainable Development Indicators.” In Routledge Handbook of Sustainability Indicators, edited by S. Bell and S. Morse, 329–346. London: Routledge.
Gallup and ILO. 2017. Towards a better future for women and work: Voices of women and men. Geneva: ILO. Accessed 30 September 2019. https://www.ilo.org/global/publications/books/WCMS_546256/lang--en/index.htm
Gardner, Matthew, Lorena Roque and Steve Wamhoff. 2019. Corporate Tax Avoidance in the First Year of the Trump Tax Law. Institute on Taxation & Economic Policy. Accessed 25 March 2020. https://itep.org/corporate-tax-avoidance-in-the-first-year-of-the-trump-tax-law/
Gereffi, Gary, and Raphael Kaplinsky (eds) 2001. “The Value of Value Chains: Spreading the Gains of Globalisation.” IDS Bulletin 32(3) July. Brighton, UK: IDS.
Gibbon, Peter, Stefano Ponte, and Evelyne Lazaro (eds.). 2010. Global Agro-Food Trade and Standards: Challenges for Africa. Basingstoke, UK: Palgrave Macmillan.
GIIN. 2017. The State of Impact Meas-urement and Management Practice. Accessed 30 September 2019. https://thegiin.org/research/publication/imm-survey
Global Commission on the Future of Work. 2017. Work for a Brighter Future. Geneva: ILO. Accessed 30 September 2019. https://www.ilo.org/wcmsp5/groups/public/---dgreports/---cabinet/documents/publication/wcms_662410.pdf
GLWC. 2016. Living Wage Auditor Guid ance. Prepared by Arche Advisors. Accessed 20 December 2019. https://globallivingwage.org/wp-content/uploads/2018/05/Auditor-Guidance-Draft-Oct2016.pdf
GLWC. Undated. The Anker Method-ology for Estimating a Living Wage. Accessed 20 December 2019. https://www.globallivingwage.org/about/anker-methodology/
GlobeScan and Sustainability. 2018. The 2018 GlobeScan-Sustainability Leaders Survey. Accessed 30 December 2018. https://sustainability.com/wp-content/uploads/2018/06/the-2018-globescan-sustainability-leaders.pdf
Goldar, Mita, Christopher Ryan, and Ahu Yildirmaz. 2019. Rethinking Gender Pay Inequity in a more transparent world. Accessed 30 September 2019. https://www.adp.com/-/media/RI/pdf/Rethinking%20Gender%20Pay%20Inequity%20in%20a%20More%20Transparent%20World.ashx
Government Equalities Office. 2018. Reducing the gender pay gap and improving gender equality in organisations: Evidence-based actions for employers. Accessed 30 September 2019. https://assets.publishing.service.gov.uk/government/uploads/system/uploads/attachment_data/file/731288/Gender-Pay-Gap-actions_.pdf
Gray, Rob. 1997. “The Practice of Silent Accounting.” In Building Corporate Accountability: Emerging Practices in Social and Ethical Accounting, Auditing and Reporting, edited by Simon Zadek, Peter Pruzan, and Richard Evans. London: Earthscan.
Gray, Rob. 2003. “Current Developments and Trends in Social and Environmental Auditing, Reporting and Attestation: A Review and Comment.” International Journal of Auditing. 4(3):247–268. Accessed 30 December 2018. https://doi.org/10.1111/1099-1123.00316
Gray, Rob. 2006. Social and Environmental Accounting and Reporting: From Ridicule to Revolution? From Hope to Hubris? – A Personal Review of the Field. Discussion paper. The Centre for Social and Environmental Accounting Research, School of Management. University of St Andrew. Accessed 30 December 2018. https://www.st-andrews.ac.uk/media/csear/discussion-papers/CSEAR_dps-socenv-hopehubris.pdf
164
UNRISD
Greer, Jed, and Kenny Bruno. 1996. Greenwash: The Reality Behind Corporate Environmentalism. Penang: Third World Network.
GRI. 2002. Sustainability Reporting Guidelines. Accessed 30 December 2018. https://www.aeca.es/old/comisiones/rsc/documentos_fundamentales_rsc/gri/guidelines/gri_guidelines_2002.pdf
GRI. 2014. A closer look at remuner-ation in G4. Accessed 30 December 2018. https://www.globalreporting.org/information/news-and-press-center/Pages/a-closer-look-at-remuneration-in-G4.aspx
GRI. 2016a. The Next Era of Corporate Disclosure: Digital, Responsive, Interactive. Accessed 30 De cember 2018. https://www.global reporting.org/resourcelibrary/The-Next-Era-of-Corporate-Disclosure.pdf
GRI. 2016b. GRI 415: Public Policy 2016. Accessed 30 September 2019. https://www.globalreporting.org/standards/media/1030/gri-415-public-policy-2016.pdf
GRI, and United Nations Global Compact. 2018. Business Reporting on the SDGs. August. Accessed 30 September 2019. https://www.globalreporting.org/ resourcelibrary/GRI_UNGC_Reporting-on-SDGs_Practical_Guide.pdf
Grimshaw, Damian, and Jill Rubery. 2015. The motherhood pay gap: a review of the issues, theory and international evidence. International Labour Office. Geneva: ILO. Accessed 15 December 2019. https://www.ilo.org/wcmsp5/groups/public/@dgreports/@dcomm/@publ/documents/publication/wcms_348041.pdf
Gupta, Atul. 2018. “TrilegalIndia: Large employers in India have been mandated to provide crèche facilities.” 13 December. Accessed 30 September 2019. https://www.taylorvinters.com/article/india-large-employers-in-india-have-been-mandated-to-provide-creche-facilities
Guzi, Martin, and Martin Kahanec. 2014. WageIndicator Living Wages: Methodological Note. Accessed 28 November 2019.https://wageindicator.org/documents/publicationslist/publications-2014/141110-Living-Wage-Method_FINAL.pdf
Haas, Peter. 1992. ‘Introduction: Epistemic Communities and International Policy Coordination’, International Organization, 46(1), 1-35.
Habermas, Jürgen. 1996. Between Facts and Norms: Contributions to a Discourse Theory of Law and Democracy. Translated by W. Rehg. Cambridge, MA: MIT Press.
Hackmann, H., and A. L. St. Clair. 2012. Transformative Corner-stones of Social Science Research for Global Change. Report of the International Social Science Council. Paris: ISSC.
Hadwiger, F. 2018. Contracting international employee participation: Global framework agreements. Cham: Springer International Publishing.
Hall, Peter, and David Soskice. 2001. Varieties of Capitalism: The Institutional Foundations of Comparative Advantage. Oxford: Oxford University Press.
Hammer, Nikolas. 2012. “International Framework Agreements and Development.” In Business Regulation and Non-State Actors: Whose Standards? Whose Development? edited by Darryl Reed, Peter Utting, and Ananya Mukherjee-Reed. London: Routledge/UNRISD.
Heales, Charlotte, Mary Hodgson, and Hannah Rich. 2017. MONDRAGON, a social innovation eco-system case study. Humanity at Work. London: The Young Foundation. Accessed 30 November 2019. https://youngfoundation.org/wp-content/uploads/2017/04/Humanity-at-Work-online-copy.pdf
Hearson, Martin. 2013. “Tax incen-tives cost $138 billion…?” July 16. Accessed 30 November 2019. https://martinhearson.net/2013/07/16/709/
Herzberg, Frederick. 1959. The Moti-vation to Work. New York: Wiley.
Herzberg, Frederick. 1968. “One more time: how do you motivate employees”, Harvard Business Review, 46 (1): 53-62.
Herzi, A.A. 2004. “Sustainability indicators system and policy process in Malaysia: A framework for utilisation and learning”. Journal of Environmental Management, 73, 357–371.
Hoffman, Richard C., and Frank M. Shipper. 2018. “Shared core values of high performing employee-owned enterprises.” Journal of Management, Spirituality and Religion. Accessed 30 September 2019. https://doi.org/10.1080/14766086.2018.1482474
Hsu, John. 2014. “Will Big Data Have a Big Impact on Sustainability?” January 31. The Guardian. https://www.theguardian.com/sustainable-business/big-data-impact-sustainable-business
Huang, Jess, Alexis Krivkovich, Irina Starikova, Lareina Yee, and Delia Zanoschi. 2019. Women in the Workplace 2019. McKinsey & Co. 15 October. Accessed 10 June 2020. https://www.mckinsey.com/featured-insights/gender-equality/women-in-the-workplace-2019#
Hubbard, Edward. 2017. “CEOs Want to Know the Impact of Diversity ROI on Initiatives but Aren’t Getting It!” 21 March. Accessed 30 September 2019. https://hubbarddiversityroiinstitute.wordpress.com/2017/03/21/ceos-want-to-know-the-impact-of-diversity-roi-on-initiatives-but-arent-getting-it/
Hunt, Vivian, Dennis Layton, and Sara Prince. 2015. Diversity Matters. McKinsey and Company. Accessed 30 September 2019. https://www.mckinsey.com/~/media/mckinsey/business%20functions/organization/our%20insights/why%20diversity%20matters/diversity%20matters.ashx
ICCR (Interfaith Center on Corporate Responsibility). 2019. ICCR’s 2019 Proxy Resolutions and Voting Guide. Accessed 30 September 2019. https://www.iccr.org/sites/default/files/2019_iccrproxyresolutions andvotingguidelr.pdf
ICCR and Sustainalytics. 2012. Ranking the Banks: A Survey of Seven U.S. Banks. Accessed 30 September 2019. https://www.iccr.org/sites/default/files/resources_attachments/ICCRsRankingTheBanks120413.pdf
IFC (International Finance Corpo ration). 2017. Tackling Childcare: The Business Case for Employer-Supported Childcare. https://www.ifc.org/wps/wcm/connect/cd79e230-3ee2-46ae-adc5-e54d3d649f31/01817+WB+Childcare+Report_FinalWeb3.pdf?MOD=AJPERES&CVID=lXu9vP-
165
CORPORATE SUSTAINABILITY ACCOUNTING: WHAT CAN AND SHOULD CORPORATIONS BE DOING?
IFC and GRI. 2009. Embedding Gender in Sustainability Reporting: A Practitioners Guide. Accessed 30 September 2019. https://www.globalreporting.org/resourcelibrary/Embedding-Gender-In-Sustainability-Reporting.pdf
Ignatius, Adi, and Daniel McGinn. 2015. “Novo Nordisk CEO Lars Sørensen on What Propelled Him to the Top.” November issue. Harvard Business Review. Accessed 30 December 2018. https://hbr.org/2015/11/novo-nordisk-ceo-on-what-propelled-him-to-the-top
IIRC. 2011. Towards Integrated Reporting: Communicating Value in the 21st Century. Accessed 30 December 2018. http://integratedreporting.org/wp-content/uploads/2011/09/IR-Discussion-Paper-2011_spreads.pdf
ILO. 2017a. A Reflection on the Future of Work and Society. Geneva: International Labour Office.
ILO. 2017b. Purchasing practices and working conditions in global supply chains: Global Survey results. INWORK Issue Brief No. 10. Accessed 30 September 2019. https://www.ilo.org/wcmsp5/groups/public/---ed_protect/---protrav/---travail/documents/publication/wcms_556336.pdf
ILO. 2017c. Global Business Network for Social Protection Floors. Annual Report October 2017. Accessed 30 September 2019. https://www.social-protection.org/gimi/gess/Ressou rcePDF.action?ressource.ressourceId=54875
ILO. 2018a. Global Wage Report 2018/19. What lies behind gender wage gaps. ILO. Geneva. Accessed 30 September 2019. https://www.ilo.org/wcmsp5/groups/public/---dgreports/---dcomm/---publ/documents/publication/wcms_650553.pdf
ILO. 2018b. International Framework Agreements in the food retail, gar-ment and chemicals sectors: Lessons learned from three case studies. Geneva: Sectoral Policies Department, International Labour Office.
ILO. 2019. A quantum leap for gender equality: for a better future of work for all. International Labour Office. Geneva. Accessed 30 September 2019. https://www.ilo.org/wcmsp5/groups/public/---dgreports/---dcomm/---publ/documents/publication/wcms_674831.pdf
IPPR. 2018. Prosperity and Justice: A plan for the New Economy. The Final Report of the IPPR Commission on Economic Justice Executive Summary. Accessed 30 December 2018. https://www.ippr.org/files/2018-10/cej-final-summary.pdf
Iqbal, Sarah. 2015. Women, business, and the law 2016: getting to equal. Washington, D.C.: World Bank Group. Accessed 30 September 2019. http://documents.worldbank.org/curated/en/455971467992805787/Women-business-and-the-law-2016-getting-to-equal
ISO. 2010. International Standard ISO 26000: Guidance on social responsibility. Geneva: ISO.
ISSC/UNESCO. 2013. World Social Science Report 2013: Changing Global Environments. Paris: OECD Publishing and UNESCO Publishing.
IUF. 2013. Everything is ‘sustainable’ but employment? Accessed 30 September 2019. http://cms.iuf.org/?q=node/2903
IWPR (Institute for Women’s Policy Research). 2019. The Gender Wage Gap: 2018 Earnings Differences by Race and Ethnicity. Accessed 30 September 2019. https://iwpr.org/wp-content/uploads/2019/03/C478_Gender-Wage-Gap-in-2018.pdf
Jackson, T. 2009. Prosperity without Growth: Economics for a Finite Planet. London: Routledge.
Jackson, T., and P. Victor. 2013. Green Economy at Community Scale. A report to the Metcalf Foundation. Toronto: Metcalf Foundation. Accessed 1st Aug 2014. http://metcalffoundation.com/wp-content/uploads/2013/10/GreenEconomy.pdf
Jackson, T, and P Victor. 2014. Does slow growth increase inequality? Some reflections on Piketty’s ‘fundamental’ laws of capitalism. PASSAGE Working Paper 14/01. Guildford: University of Surrey. http://www.prosperitas.org.uk/SIGMA
Jamasmie, Cecilia. 2019. “Ford to lead blockchain pilot that traces cobalt mined in Congo.” Mining.com. 16 January. Accessed June 23, 2020. http://www.mining.com/ford-lead-blockchain-pilot-trace-cobalt-mined-congo/
Jenkins, Rhys. 2002. “Corporate Codes of Conduct: Self-Regulation in a Global Economy.” In Voluntary Approaches to Corporate Responsibility: Readings and a Resource Guide, edited by NGLS and UNRISD. Geneva: NGLS.
Just Transition, and the B Team. 2018. Just Transition: A Business Guide from the Just Transition Center and the B Team, May. Accessed 30 December 2018. https://bteam.org/assets/reports/Just-Transition-A-Business-Guide.pdf
Kareiva, Peter M., W. Brynn McNally, Steve McCormick, Tom Miller, and Mary Ruckelshaus. 2015. “Improving Global Environmental Management with Standard Corporate Reporting. “ Special Feature: Perspective. Proceedings of the National Academy of Sciences of the United States of America (PNAS) Early Edition. Accessed 30 September 2019. https://www.pnas.org/content/pnas/early/2015/06/10/1408120111.full.pdf
Kesselring, Rita, Stefan Leins, and Yvan Schulz. 2019. Valueworks: Effects of Financialization along the Copper Value Chain. Working Paper. University of Basel/Swiss Network for International Studies.
Khan, Lina. 2017. “Amazon’s Antitrust Paradox.” The Yale Law Journal. Vol.126(3). January. Accessed 20 December 2019. https://www.yalelawjournal.org/note/amazons-antitrust-paradox
Kiatpongsan, Sorapop, and Michael I. Norton. 2014. “How Much (More) Should CEOs Make? A Universal Desire for More Equal Pay.” Perspectives on Psychological Science. Vol. 9(6):587–593. Accessed 30 November 2019. https://www.hbs.edu/faculty/Publication%20Files/kiatpongsan%20norton%202014_f02b004a-c2de-4358-9811-ea273d372af7.pdf
Kirka, Danika. 2018. “Shell agrees to set short-term caps on carbon emissions.” Associated Press, December 3. Accessed 30 December 2018. https://apnews.com/901e35ad09fd4a12b09561b 8fe5607a8
166
UNRISD
Kleven, Henrik, Camille Landais, Johanna Posch, Andreas Steinhauer, and Josef Zweimüller. 2019. “Child Penalties Across Countries: Evidence and Explanations” AEA Papers and Proceedings, Vol. 109, May 2019, pp. 122-26. Accessed 30 September 2019. https://www.henrikkleven.com/uploads/3/7/3/1/37310663/klevenetal_aea-pp_2019.pdf
KnowTheChain. 2019. Three Sectors, Three Years Later: Progress and Gaps in the Fight Against Force Labour. Accessed 30 September 2019. https://knowthechain.org/wp-content/uploads/KTC_Cross_sector_2019.pdf
Kolk, Ans. 2004. “A Decade of Sustainability Reporting: Developments and Significance.” International Journal of Environment and Sustainable Development, 3(1):51–64.
Korten, David. 1995. When Corporations Rule the World. West Hartford, Connecticut: Kumarian Press and San Francisco: Berrett-Koehler Publishers Inc.
Korosec, Kirsten. 2012. “Reporting Could Suffer from Too Many Indicators.” Environmental Leader. November 1. http://www.environmentalleader.com/2012/11/ sustainability-performance-indicators-vary-widely-study-finds/
Kouhizadeh, Mahtab, and Joseph Sarkis. 2018. “Blockchain Practices, Potentials, and Perspectives in Greening Supply Chains.” Sustainability and MDPI. Sustainability, 10 (10), 36-52.
Koukiadaki, Aristea, and Damian Grimshaw. 2016. Evaluating the effects of the structural labour market reforms on collective bargaining in Greece. Conditions of Work and Employment Series No. 85. Geneva: ILO. Accessed 30 November 2019. https://www.ilo.org/wcmsp5/groups/public/---ed_protect/---protrav/---travail/documents/publication/wcms_538161.pdf
KPMG. 2016. She’s Price(d)less: The Economics of the Gender Pay Gap. Report prepared for Diversity Council Australia (DCA) and Workplace Gender Equality Agency (WGEA) Accessed 30 September 2019. https://home.kpmg/content/dam/kpmg/au/pdf/ 2016/gender-pay-gap-economics-full-report.pdf
KPMG. 2017. KPMG Survey of Corporate Responsibility Reporting 2017. Accessed 30 September 2019. https://home.kpmg/xx/en/home/campaigns/2017/10/survey-of-corporate-responsibility-reporting-2017.html
KPMG International, GRI, UNEP, and Centre for Corporate Governance in Africa. 2016. Carrots & Sticks: Global Trends in Sustainability Reporting, Regulation and Policy. 2016 Edition. Accessed 30 September 2019. https://home.kpmg/ru/en/home/insights/2016/05/carrots-and-sticks-global-trends-in-sustainability-reporting-regulation-and-policy.html
Kramer, Curtlyn. 2017. Vital Stats: The Widening gap between corporate and labor PAC spending. Brookings. Accessed 30 September 2019. https://www.brookings.edu/blog/fixgov/2017/03/31/vital-stats-corporate-and-labor-pac-spending/
Lacy, Peter, Tim Cooper, Rob Hayward, and Lisa Neuberger. 2010. A New Era of Sustainability: UN Global Compact-Accenture CEO Study 2010. Accessed 30 December 2018. https://www.unglobalcompact.org/docs/news_events/8.1/UNGC_Accenture_CEO_Study_2010.pdf
Lagarde, Christine, and Jonathan D. Ostry. 2018. The macro-economic benefits of gender diversity. 5 December. Vox, CEPR Policy Portal. Accessed 30 September 2019. https://voxeu.org/article/macroeconomic-benefits-gender-diversity
Landrum, Nancy E., and Brian Ohsowski. 2017. “Identifying Worldviews on Corporate Sustainability: A Content Analysis of Corporate Sustainability Reports.” Business Strategy and the Environment, 27(1):128–151.
Lang. D.J., A. Wiek, M. Bergmann, M. Stauffacher, P. Martens, P. Moll, M. Swilling, and C. J. Thomas. 2012. “Transdisciplinary Research in Sustainability Science – Practice, Principles, and Challenges.” Sustain Sci (2012) 7 (Supplement 1):25–43. Accessed 30 December 2018. https://www.albany.edu/gogreen/files/documents/faculty%20forum/Lang.pdf
LA Times. 2019. “Amazon moms are every working mom, calling for backup day-care benefits.” 8 March. https://www.latimes.com/business/la-fi-amazon-backup-child-care-20190308-story.html
Lean In and McKinsey & Company. 2018. Women in the Workplace 2018. LeanIn.org and McKinsey and Company. Accessed 20 April 2020. https://www.mckinsey.com/featured-insights/gender-equality/women-in-the-workplace-2018#
Lean In and McKinsey & Company. 2019. Women in the Workplace 2019. Accessed 20 April 2020. https://wiw-report.s3.amazonaws.com/Women_in_the_Workplace_2019.pdf
Lee, Joonkoo. 2016. Global Supply Chain Dynamics and Labour Governance: Implications for Social Upgrading. ILO Research Paper No. 14, Geneva: International Labour Office. Accessed 30 September 2019. https://ssrn.com/abstract=2780512
Lee, Linda-Eling, Ric Marshall, Damion Rallis, and Matt Moscardi. 2015. Women on Boards: Global Trends in Gender Diversity on Corporate Boards. November. MSCI. Accessed 30 September 2019. https://www.msci.com/documents/10199/04b6f646-d638-4878-9c61-4eb91748a82b
Levy, David, and Halina Szejnwald Brown. 2012. “The Global Reporting Initiative: Promise and Limitations.” In Business Regulation and Non-State Actors: Whose Standards? Whose Development?, edited by Darryl Reed, Peter Utting, and Ananya Mukherjee-Reed. London: Routledge/UNRISD.
Leythienne, Denis, and Piotr Ronkowski. 2018. A decomposition of the unadjusted gender pay gap using Structure of Earnings Survey data. Eurostat. European Union. Accessed 30 September 2019. https://ec.europa.eu/eurostat/documents/3888793/8979317/KS-TC-18-003-EN-N.pdf/3a6c9295-5e66-4b79-b009-ea1604770676
Le Roux, Marion, and Ji Eun Kaela Kim. 2019. France: New Gender Equality Obligations Established. 15 March. Accessed 30 September 2019. https://www.shrm.org/resourcesandtools/legal-and-compliance/employment-law/pages/global-france-gender-equality-obligations.aspx
167
CORPORATE SUSTAINABILITY ACCOUNTING: WHAT CAN AND SHOULD CORPORATIONS BE DOING?
Littler, Stephen. 2014. “The Missing Link: Tax Avoidance and Corpo-rate Social Responsibility.” Tax Justice Focus, 9(3). Accessed 30 December 2018. https://www.taxjustice.net/wp-content/uploads/2013/04/TJF-2014-Littler1.pdf
L’Oreal. 2018. 2017 Progress Report: Sharing Beauty with All. Accessed 30 September 2019. https://loreal-dam-front-corp-en-cdn.damdy.com/ressources/afile/165320-80369-resource_pdf-progress-report-2017.pdf
L’Oreal. 2019. 2018 Progress Report: Sharing Beauty with All. Accessed 30 September 2019. https://www.loreal-finance.com/system/files/2019-10/LOreal_2018_Progress_Report_SBWA.pdf
Lu, Wei, and Anders Melin. 2016. The Best and Worst Countries to Be a Rich CEO. Bloomberg. Accessed 20 December 2019. https://www.bloomberg.com/news/articles/2016-11-16/ranking-where-to-work-to-be-a-rich-ceo-or-richer-than-neighbors
Lubin, David, John Moorhead, and Tim Nixon. 2017. Global 250 Greenhouse Gas Emitters: A New Business Logic. A Thomson Reuters Financial & Risk White Paper. Accessed 20 April 2020. http://www.bsdconsulting.com/bsd-files/news-downloadable-pdfs/S053299_final_Report.pdf
Macario, Rose. 2016. “Patagonia’s CEO explains how to make on-site childcare pay for itself.” Fast Company. (Article based on Patagonia, 2016. Family Business: Innovative On-Site Child Care Since 1983). Accessed 30 September 2019. https://www.fastcompany.com/3062 792/patagonias-ceo-explains-how-to-make-onsite-child-care-pay-for-itself
Maclean, Annamaria, and Paul Dixon. 2015. Best practice in corporate tax governance – From the finance team to the Board. Deloitte. Accessed 15 December 2019. https://www2.deloitte.com/nz/en/pages/tax-alerts/articles/best-practice-in-corporate-tax-governance.html
Macmillan, Graham, and Robert Eccles. 2019. “Investors Need More and Better Data on Sustainability.” Barron’s. January 14. Accessed 14 January 2019. https://www.barrons.com/articles/esg-investors-need-more-and-better-data-on-sustainability-51547463648
Make Tax Fair, Oxfam Novib, and Tax Justice Network-Africa. 2015. FTM Methodology and Results. 2015. Accessed 30 September 2019. https://maketaxfair.net/ftm/
Malpani, Abha. 2018. “Could Blockchain Boost the Triple Bottom Line Worldwide?” 7 September. Accessed 30 September 2019. https://www.triplepundit.com/2018/09/could-blockchain-boost-the-triple-bottom-line-worldwide/
Mares, Radu. 2018. “Corporate transparency laws: A hollow victory?” Netherlands Quarterly of Human Rights. July 2. Accessed 30 September 2019. https://doi.org/10.1177/0924051918786623
Market Forces. 2019. Investing in the Dark. Accessed 20 December 2019. https://www.marketforces.org.au/wp-content/uploads/2019/02/MF-Investing-in-the-Dark-2019-A4.pdf
Marshall, Donna, Lucy McCarthy, Paul McGrath, and Fiona Harrigan. 2016. What’s your strategy for supply chain disclosure?. MIT Sloan Management Review. Accessed 30 September 2019. https://sloanreview.mit.edu/article/whats-your-strategy-for-supply-chain-disclosure/4/
Martinez-Alier, Joan. 2002. The Environ mentalism of the Poor: A Study of Ecological Conflicts and Valuation. Cheltenham, UK, and Northampton, MA, USA: Edward Elgar.
MaterialityTracker. n.d. Sustainability Thresholds: Little guidance on thresholds can be found in non-financial accounting and assurance standards issued since the 2000s. Accessed 30 September 2019. http://www.materialitytracker.net/standards/sustainability-thresholds/
Matos, Kenneth, Ellen Galinsky, and James T. Bond. 2017. 2016 National Study of Employers. Society for Human Resource Management (SHRM). Accessed 30 September 2019. https://www.shrm.org/hr-today/trends-and-forecasting/research-and-surveys/Documents/National%20Study%20of%20Employers.pdf
Mauser, Wolfram, Gernot Klepper, Martin Rice, Bettina Susanne Schmalzbauer, Heide Hackman, Rik Leemans, and Howard Moore. 2013. “Transdisciplinary Global Change Research: the Co-creation of Knowledge for Sustainability.” Current Opinion in Environmental Sustainability 5(3–4):420–431. Accessed 30 December 2018. https://doi.org/10.1016/j.cosust.2013.07.001
McCulloch, Maureen, and Rory Ridley-Duff. 2019. To profit or not to profit? That is the wrong question. Paper presented at 7th EMES International Research Conference on Social Enterprise. 24-27 June 2019. Accessed 28 April 2020. https://emes.net/content/uploads/ESCP-7EMES-14-McCulloch-Ridley-Duff.pdf
McElroy, Mark W. 2017. “Why Mone-tization Should Not Be Used for Sustainability Accounting,” June 19. Accessed 30 December 2018. https://www.sustainablebrands.com/news_and_views/finance_investment/mark_mcelroy/why_monetization_should_not_be_used_sustainability_ac
McElroy, Mark W. 2019. Making Materiality Determinations A Context-Based Approach. Working Paper 2019-6. Geneva: UNRISD. Accessed 10 December 2019. http://www.unrisd.org/80256B3C005BCCF9/ httpNetITFramePDF?ReadForm& parentunid=8E6C3DED0AB73F5 3802584C8004F6AC1&parent doctype=paper&netitpath=80 256B3C005BCCF9/(httpAuxPages)/ 8E6C3DED0AB73F53802584C800 4F6AC1/$file/WP2019-6--McElroy.pdf
Meadows, Donella. 1998. Indicators and Information Systems for Sustainable Development. http://donellameadows.org/archives/indicators-and-information-systems-for-sustainable-development/
Meadows, Dennis, Donella Meadows, Jørgen Randers, and William W. Behrens III. 1972. The Limits to Growth. Potomac Associates – Universe Books. Accessed 30 September 2019. https://collections.dartmouth.edu/teitexts/meadows/diplomatic/meadows_ltg-diplomatic.html
168
UNRISD
Mendell, Margaret, Brigitte Aulenbacher and Andreas Novy. 2019. “Karl Polanyi and the Global Network Inspired by His Work.” Marguerite Mendell interviewed by Brigitte Aulenbacher and Andreas Novy. Österreich Z Soziol 44:143–151. Accessed 10 December 2019. https://link.springer.com/article/ 10.1007%2Fs11614-019-00343-6
Merk, Jeroen. 2005. From Code Compliance to Fair Purchasing Practices: Some Issues for Discussion. Clean Clothes Campaign. Accessed 30 September 2019. https://digitalcommons.ilr.cornell.edu/globaldocs/1018/
Merk, Jeroen. 2014. Living Wage in Asia: 2014 Report. Clean Clothes Campaign and Asia Floor Wage Alliance. Accessed 20 April 2020. http://asia.floorwage.org/wp-content/uploads/2019/10/LW-in-Asia-AFWA-CCC.pdf
Millstone, Carina. 2015. “Can social and solidarity economy organizations complement or replace publicly traded companies?” In Social and Solidarity Economy: Beyond the Fringe, edited by Peter Utting. London: Zed Books.
Mingxia Li. 2019. “Paying for a Bus Ticket and Expecting to Fly”: How Apparel Brand Purchasing Practices Drive Labor Abuses. Human Rights Watch. Accessed 30 September 2019. https://www.hrw.org/report/2019/04/23/paying-bus-ticket-and-expecting-fly/how-apparel-brand-purchasing-practices-drive
Mishel, Lawrence, and Jessica Schieder. 2018. “CEO Compensation Surged in 2017 Report.” August 16. Accessed 30 December 2018. https://www.epi.org/files/pdf/152123.pdf
Mittal, Kanchan. 2019. “How 2018 Transformed the Child Care Industry.” Entrepreneur. 21 January. https://www.entrepreneur.com/article/326660
Mohin, Tim. 2014. “Are sustainability reports driving change or just ‘losing the signal’?” The Guardian, September 11. Accessed 30 September 2019. https://www.theguardian.com/sustain able-business/2014/sep/11/corporate-responsibility-reporting-transparency-toxic-emissions-labeling-change
Molyneux, Maxine, and Shahra Razavi. 2002. “Introduction.” In Gender Justice, Development, and Rights, edited by Maxine Molyneux and Shahra Razavi. Oxford: Oxford University Press/UNRISD.
Moorhead, John, and Tim Nixon. 2016. Global 500 Greenhouse Gases Performance 2010 – 2015: 2016 Report on Trends. Thomson Reuters. Accessed 20 December 2019. https://www.thomsonreuters.com/content/dam/openweb/documents/pdf/corporate/Reports/global-500-greenhouse-gases-performance-2010-2015.pdf
Muller, Alan, and Ans Kolk. 2012. “Responsible Tax as Corporate Social Responsibility: The Case of Multinational Enterprises and Effective Tax in India.” Business and Society, 54(4):435-463.
Nan Jia, and Xiao-yuan Dong, 2011. Economic transition and the motherhood wage penalty in urban China: Investigation using panel data, University of Winnipeg Department of Economics. Working Paper 2011-02. Accessed 30 September 2019. http://economics.uwinnipeg.ca/RePEc/winwop/2011-02.pdf
NGFS (Network for Greening the Financial System). 2019. Call for Action: Climate Change as a Source of Financial Risk. Accessed 30 September 2019. https://www.dnb.nl/binaries/NGFS%20Call%20for%20action%20report_tcm46-383435.pdf
NGLS and UNRISD. 2002. Voluntary Approaches to Corporate Responsibility: Readings and a Resource Guide. NGLS Develop-ment Dossier. Geneva: NGLS.
Nitzberg, Eric. 2016. “The Wild West of Measuring Corporate Sustain ability.” Stanford Social Innovation Review. Accessed 30 December 2018. https://ssir.org/articles/entry/the_wild_west_of_measuring_corporate_sustainability
Nussbaum, Martha. 2003. “Capabilities as Fundamental Entitlements: Sen and Social Justice.” Feminist Economics, 9(2):33.
OECD. 2009. Revolving Doors, Accountability and Transparency – Emerging Regulatory Concerns and Policy Solutions in the Financial Crisis. Report by Expert Group on Conflicts of Interest. Accessed 30 September 2019. http://search.oecd.org/officialdocuments/displaydocumentpdf/?cote=GOV/PGC/ETH%282009%292&doc Language=En
OECD. 2010. Recommendation of the Council on OECD Legal Instruments Principles for Trans parency and Integrity in Lobbying. Accessed 30 September 2019. https://legalinstruments.oecd.org/public/doc/256/256.en.pdf
OECD. 2015. Taxing Multinational Enterprises: Base Erosion and Profit Shifting. Policy Brief. BEPS Update No. 3. October. Accessed 30 September 2019. http://www.oecd.org/ctp/policy-brief-beps-2015.pdf
OECD. 2016. OECD Due Diligence Guidance for Responsible Supply Chains of Minerals from Conflict-Affected and High-Risk Areas. Third Edition. Paris: OECD. Accessed 30 September 2019. http://dx.doi.org/10.1787/9789264252479-en
OECD. 2017. The Pursuit of Gender Equality: An Uphill Battle. Paris: OECD. Accessed 30 September 2019. http://dx.doi.org/10.1787/9789264281318-en
OECD. 2018a. Is the last mile the longest? Economic gains for gender equality in Nordic countries. Summary brief. Accessed 30 September 2019. http://www.oecd.org/els/emp/last-mile-longest-gender-nordic-countries-brief.pdf
OECD. 2018b. Tax Policy Reforms 2018. Paris: OECD.
Ostrom, Elinor. 2009. “Beyond Markets and States: Polycentric Governance of Complex Economic Systems.” Nobel Lecture delivered in Stockholm, Sweden, December 8. https://www.nobelprize.org/prizes/economic-sciences/2009/ostrom/lecture/
169
CORPORATE SUSTAINABILITY ACCOUNTING: WHAT CAN AND SHOULD CORPORATIONS BE DOING?
Owens, Jeffrey, and James Zhan. 2018. “Introduction to the Special Issue Trade, Investment and Taxation: Policy Linkages.” Transnational Corporations. 25(2). Special Issue on Investment and International Taxation. Accessed 30 September 2019. https://unctad.org/en/PublicationsLibrary/diae2018d4_en.pdf
Oxfam. 2016. The Journey to Sustain-able Food: A Three-year Update on the Behind the Brands Campaign. Oxfam Briefing Paper. Oxfam International. Accessed 30 December 2018. https://www.oxfam.org/en/research/journey-sustainable-food
Oxfam. 2018. Reward Work, Not Wealth. Oxfam Briefing Paper. Accessed 30 September 2019. https://www.oxfamamerica.org/explore/research-publications/reward-work-not-wealth/
Oxfam America. 2018. Dollars and Sense: Corporate responsibility in the era of Trump. Oxfam Media Briefing. April 12. Accessed 30 September 2019. https://www.oxfamamerica.org/explore/research-publications/dollars-and-sense/
Oxfam International. 2019. Public Good or Private Wealth? Accessed 20 December 2019. https://indepth.oxfam.org.uk/public-good-private-wealth/
Patagonia. 2019. How We’re Reducing Our Carbon Footprint. Accessed 20 April 2020. https://www.patagonia.com/stories/how-were-reducing-our-carbon-footprint/story-74099.html
Pathak, Manish, Abhinav Rastogi, and Yashvi Ganeriwal. 2018. “Pipeline for Working Women in India”. November 26. Posted in Corporate Law, Employment Law. Accessed 30 September 2019. https://corporate.cyrilamarchand blogs.com/2018/11/maternity-leave-incentive-scheme-2018-blessing-pipeline-working-women-india/?utm_source=Mondaq&utm_medium=syndication&utm_campaign=View-Original
PayScale. 2020. The State of the Gender Pay Gap 2020. Accessed 1 June 2020. https://www.payscale.com/data/gender-pay-gap
Pelenc, Jérôme, Jérôme Ballet, and Tom Dedeurwaerdere. 2015. Weak Sustainability versus Strong Sustainability. Brief for GSDR. Accessed 30 December 2018. https://sustainabledevelopment.un.org/content/documents/6569122-Pelenc-Weak%20Sustainability%20versus%20Strong%20Sustainability.pdf
Pickles, John, Stephanie Ware Barrientos, and Peter Knorringa. 2016. “New End Markets, Supermarket Expansion and Shifting Social Standards.” Environment and Planning. doi: 10.1177/0308518X16631540
Piketty, Thomas. 2014. Capital in the Twenty-First Century. Cambridge, MA: Belknap Press of Harvard University Press.
Piketty, Thomas, and Emmanuel Saenz. 2003. “Income Inequality in the United States, 1913–1998.” The Quarterly Journal of Economics, 118(1):1–41.
Polanyi, Karl. 1944. The Great Transformation: The Political and Economic Origins of Our Time. Boston: Beacon Press by arrangement with Rinehart & Company, Inc.
Porter, Michael E., and Mark R. Kramer. 2006. “Strategy and Society: The Link between Competitive Advantage and Corporate Social Responsibility.” Harvard Business Review. Accessed 30 September 2019. https://www.sharedvalue.org/sites/default/files/resource-files/Strategy_and_Society.pdf
Porter, Michael A., and Mark R. Kramer. 2011. “Creating Shared Value.” Harvard Business Review. Accessed 30 September 2019. https://hbr.org/2011/01/the-big-idea-creating-shared-value
Posner, Cydney. 2019. Is It Time for Corporate Political Spending Disclosure? Harvard Law School Forum on Corporate Governance and Financial Regulation. March 17. Accessed 30 September 2019. https://corpgov.law.harvard.edu/2019/03/17/is-it-time-for-corporate-political-spending-disclosure/
Prahalad, C.K., 2005. The Fortune at the Bottom of the Pyramid: Eradicating Poverty through Profits. New Delhi: Pearson Education/Wharton School Publishing.
PRI. 2017. An Investor Briefing on the Apparel Industry: Moving the Needle on Responsible Labour Practices. Accessed 30 September 2019. https://www.unpri.org/download?ac=1686
PRI. 2018a. Evaluating and Engaging on Corporate Tax Transparency. An Investor Guide. PRI. Accessed 30 November 2019. https://d8g8t13e9vf2o.cloudfront.net/Uploads/t/r/l/PRI_Evaluating-and-engaging-on-corporate-tax-transparency_Investor-guide.pdf
PRI. 2018b. Explanatory Notes: Investors’ Recommendations on Corporate Income Tax Disclosure. Accessed 30 September 2019. https://www.unpri.org/download?ac=4655
PUMA. 2017. Momentum: 2016 Annual Report. Business and Sustainability Report. Accessed 30 September 2019. http://report2016.puma-annual-report.com/en/company-overview/sustainability/
PUMA. 2019. Annual Report 2018: Sustainability. Accessed 20 December 2019. https://annual-report-2018.puma.com/wp-content/uploads/annual-report-2018/en_Puma _GB2018_Nachhaltigkeit_WEB.pdf
Raghuwanshi, Sandeep. 2019. “How Fashion Industry Sustainability impacts global supply chain?” April 8. ESGRobo. Accessed 30 September 2019. https://esgrobot.com/how-sustainable-fashion-impacts-global-supply-chain/
Rasche, Andreas, and Dirk Ulrich Gilbert. 2012. “Social Accountability 8000 and socioeconomic development.” In Business Regulation and Non-State Actors: Whose Standards? Whose Development?, edited by Darryl Reed, Peter Utting, and Ananya Mukherjee-Reed. London: Routledge/UNRISD.
Raworth, Kate. 2017. Doughnut Econom ics: Seven Ways to Think Like a 21st-Century Economist. London: Chelsea Green Publishing.
Razavi, Shahra. 2007. The Political and Social Economy of Care in a Development Context Conceptual Issues, Research Questions and Policy Options. Geneva: UNRISD. Accessed 30 September 2019. http://www.unrisd.org/80256B3C005BCCF9/ httpAuxPages)/2DBE6A93350A778 3C12573240036D5A0/$file/Razavi-paper.pdf
170
UNRISD
RBC Global Asset Management. 2018. Responsible Investing: Charting a Sustainable Advantage. Accessed 30 September 2019. http://www.rbcgam.com/corporate-governance-and-responsible-investment/pdf/esg-executive-summary-2018.pdf
RE100. 2018. Business Leadership in the Transition to Renewable Electricity. http://media.virbcdn.com/files/ef/f8e97377fa5493be-RE100LeadershipPaper.pdf
Reed, Darryl. 2012. “Fairtrade International (FLO).” In Business Regulation and Non-State Actors: Whose Standards? Whose Development?, edited by Darryl Reed, Peter Utting, and Ananya Mukherjee-Reed. London: Routledge/UNRISD.
Reich, Robert. 2007. Supercapitalism: The Transformation of Business, Democracy and Everyday Life. New York: Alfred A. Knopf.
Reporting 3.0. 2016. Platform Blueprint Projects Series, Project Outline for Blueprint 2: Accounting, Accounting for future-fit reporting. Accessed 30 December 2018. https://reporting3.org/wp-content/uploads/2017/12/R3_BP_2_Outline.pdf
Reporting 3.0. 2018. Global Thresholds and Allocations Council – A Partnership for Next-Generation Sustainability Reporting & Accounting. Accessed 30 December 2018. https://reporting3.org/wp-content/uploads/2018/01/GTAC-ConceptNote-Final.pdf
Reuters. 2015. “Exclusive: Wal-Mart improves lobbying disclosure after shareholder push.” May 13. Accessed 30 September 2019. https://www.reuters.com/article/us-wal-mart-stores-disclosure-lobbying-e-idUSKBN0NY0AH20150513
Reynaud, Emmanuel, 2017. The International Labour Organization and the Living Wage: A Historical Perspective. Inclusive Labour Markets, Labour Relations and Working Conditions Branch. Geneva: International Labour Office.
RobecoSAM. 2015. “Does corporate gender equality lead to outperformance?” RobecoSAM. Accessed 30 September 2019. https://docplayer.net/19367338-Does-corporate-gender-equality-lead-to-outperformance.html
RobecoSAM. 2018a. “The Good, the Bad, and the Ugly: Corporate Policy Influence under scrutiny in the age of SDGs.” In The Sustainability Yearbook 2018. Accessed 30 September 2019. https://www.robecosam.com/en/insights/2018/the-good-the-bad-and-the-ugly.html
RobecoSAM. 2018b. 2018 RobecoSAM Corporate Sustainability Assessment - Annual Scoring & Methodology Review. Accessed 15 June 2020. http://dl.icdst.org/pdfs/files3/f054e60eee3f3355a3e012ac 198faa7d.pdf
RobecoSAM. 2018c. 2018 RobecoSAM Corporate Sustainability Assessment (CSA): Methodology Changes. March 8. Accessed 30 September 2019. https://es.slideshare.net/RobertDornau/2018-robecosam-csa-methodology-changes
RobecoSAM. 2019. The Sustainability Yearbook 2019. Accessed 30 September 2019. https://yearbook.robecosam.com/fileadmin/Files/Documents/2019/The_Sustainability_Yearbook_2019.pdf
Robeyns, Ingrid 2016. “The Capability Approach.” In Stanford Encyclopedia of Philosophy. Accessed 30 September 2019. https://plato.stanford.edu/entries/capability-approach/
Rocamora, Alexis R., and Aryanie Amellina. 2018. Blockchain Applications and the Sustainable Development Goals: Analysis of Blockchain Technology’s Potential in Creating a Sustainable Future. Kanagawa, Japan: Institute for Global Environmental Strategies. doi: 10.13140/RG.2.2.15469.03044.
Rotz, S. and E. Fraser. 2018. “The Limits of Sustainability Frameworks: Lessons from agri-food systems research.” In Routledge Handbook of Sustainability Indicators, edited by Simon. Bell and Stephen Morse, 103–116. London: Routledge.
Ruggie, John Gerard. 1982. Inter-national Regimes, Transactions, and Change: Embedded Liberalism in the Postwar Economic Order. Cambridge: Cambridge University Press.
Ruggie, John Gerard. 2003 “Taking Embedded Liberalism Global: The Corporate Connection.” In Taming Globalization: Frontiers of Governance, edited by David Held and Mathias Koenig-Archibugi. Cambridge: Polity Press.
Sabadish, Natalie, and Lawrence Mishel. 2013. Methodology for Measuring CEO Compensation and the Ratio of CEO-to-Worker Compensation, 2012 data update. Economic Policy Institute. Working Paper 298. Accessed 30 November 2019. https://www.epi.org/publication/methodology-measuring-ceo-compensation-ratio/
Salathé-Beaulieu, Gabriel, in collaboration with Marie J. Bouchard and Marguerite Mendell. 2019. Sustainable Development Impact Indicators for Social and Solidarity Economy – State of the Art. Geneva: UNRISD. Accessed 30 October 2019. http://www.unrisd.org/80256B3C005BCCF9/search/ 5A72131687B4AE478025848D00 3847E4?OpenDocument
Saner, Raymond, Yiu, Lichia, and Melanie Nguyen. 2018. Platform Cooperatives: The Social and Solidarity Economy and the Future of Work. A Preliminary Assessment of Platform Capitalism and Platform Cooperativism and their Effects on Workers’ Satisfaction. Geneva: CSEND. Accessed 10 December 2019. http://www.csend.org/images/articles/files/20190803_CSEND_on_Platform_cooperatives_2_clean.pdf
SASB. 2017a. State of Disclosure 2017: An Analysis of the Effectiveness of Sustainability Disclosure in SEC Filing. Accessed 30 September 2019. https://www.sasb.org/wp-content/uploads/2017/12/2017State-of-Disclosure-Report-web.pdf
SASB. 2017b. SASB Conceptual Framework. https://www.sasb.org/wp-content/uploads/2017/02/SASB-Conceptual-Framework.pdf
SASB. 2018. Sustainable Industry Classification System™ (SICS™) & General Issue Taxonomy Changes. Accessed 30 September 2019. https://www.sasb.org/standards-overview/
171
CORPORATE SUSTAINABILITY ACCOUNTING: WHAT CAN AND SHOULD CORPORATIONS BE DOING?
Sayani, Ankit. 2017. The Tax Gap: Regulatory Responses and Implications for Institutional Investors. Accessed 30 September 2019. https://www.msci.com/documents/10199/93765fb6-7685-4a04-b124-d71d4f6195a2
Schmidheiny, Stephan. 1992. Changing Course: A Global Business Pers pective on Development and the Environment. Cambridge, MA: MIT Press.
Schneider, Ben Ross. 2009. “Hierar-chical Market Economies and Varieties of Capitalism in Latin America”. Journal of Latin Amer-ican Studies, 41(3):553–575.
Schroeder, Robert. 2015. Republican aims to block Export-Import aid to companies with hefty CEO pay. Market Watch. Accessed 30 September 2019. https://www.marketwatch.com/story/republican-aims-to-block-export-import-aid-to-companies-with-hefty-ceo-pay-2015-11-03
Schumpeter, J. 1976. Capitalism, Socialism and Democracy. London: George Allen & Unwin.
Seddon-Daines, Olivia, and Yasmine Chinwala. 2019. HMT Treasury Women in Finance Charter: Assessing the impact of the Charter on signatories and the benefits and challenges they face. Accessed 30 September 2019. https://newfinancial.org/wp-content/uploads/2019/07/2019.07-HMT-WIFC-Signatories-Survey_FINAL.pdf
Sekerler Richiardi, Pelin and Arbo, Ma. Diyina Gem. 2019. Multinational enterprises and social protection: a case study of the L’Oréal Share and Care Program. ILO Working Papers 995019692902676. Geneva: ILO.
Sen, Amartya. 1985. Commodity and Capa bilities. Amsterdam: North-Holland.
Senge, Peter. 1990. The Fifth Discipline: The Art and Practice of the Learn ing Organization. New York: Doubleday.
Sengenberger, W. 1994. “Protection–participation–promotion: The systemic nature and effects of labour standards.” In Creating Economic Opportunities: The Role of Labour Standards in Industrial Restructuring, edited by W. Sengenberger, and D. Campbell. Geneva: International Labour Organization.
Seventh Generation Interfaith Inc. 2019. Shareholder Memo in Support of Report on Lobbying Resolution at Boeing. United States Securities and Exchange Commission. Accessed 30 September 2019. https://www.sec.gov/Archives/edgar/data/12927/0001214659190 02699/g49190px14a6g.htm
Shamir, Hila. 2016. “Unionizing Subcontracted Labor”. Theoretical Inquiries in Law. Volume 17, Issue 1:229-255. Accessed 15 June 2020. https://ssrn.com/abstract=2725521
Shared Value Initiative, 2015. Patrimonio Hoy: Access to Housing and Finance. Accessed 30 September 2019. https://www.sharedvalue.org/sites/default/files/resource-files/Cemex_SVICase_06-08-15.pdf
Shaxson, Nicholas. 2019. “No, corporate tax avoidance is not legal.” Financial Times. May 16. Accessed 30 September 2019. https://ftalphaville.ft.com/2019/ 05/16/1557994769000/No--corporate-tax-avoidance-is-not-legal/
SHRM (Society for Human Resource Management). 2018. 2018 Employee Benefits: The Evolution of Benefits. Accessed 30 September 2019. https://www.shrm.org/hr-today/trends-and-forecasting/research-and-surveys/Documents/2018%20Employee%20Benefits%20Report.pdf
Shuter, Robert. 2013. “Pay or Perish.” Huffington Post. October 10 2013.
Sikka, Prem. 2010. “Smoke and Mirrors: Corporate Social Responsibility and Tax Avoidance.” Accounting Forum, 34(3):153-168. September.
Sikka. P., H. Willmott, J. Christensen, C. Cooper, D. Govindarajan Driver, T. Hadden, C. Haslam. J. Haslam, P. Ireland, M. Parker, G. Pearson, A. Pettifor, S. Picciotto, and J. Veldman. 2019. Regulatory Architecture to Enhance Democracy and Business Accountability. Technical Report commissioned by the Shadow Chancellor of the Exchequer, John McDonnell MP, U.K. Accessed 30 September 2019. http://visar.csustan.edu/aaba/LabourPolicymaking-RegulatoryArchitectureReportJan2019.pdf
Slater, Matt. 2015. List of Famous Companies Who Disclose Their Chinese Suppliers. July 15. Accessed 30 September 2019. https://www.chinacheckup.com/blogs/articles/famous-companies-disclose-chinese-suppliers
Slaughter, Anne-Marie. 2015. Unfinished Business: Women, Men, Work, Family. New York: Random House.
Slob, Bart. 2008. “Towards responsible lobbying.” Clear Profit. Issue 52, June 9. Accessed 30 September 2019. https://www.researchgate.net/publication/280731411_Towards_responsible_lobbying
Slob, Bart, and Francis Weyzig. 2010. “Corporate Lobbying and Corporate Social Responsibility: Aligning Contradictory Agendas.” In Business, Politics and Public Policy: Implications for Inclusive Development, edited by José Carlos Marques and Peter Utting. Basingstoke, UK: Palgrave Macmillan/UNRISD.
Smith, Timothy, and John Keenan. 2019. ‘2019 Lobbying Disclosure Resolutions’. Harvard Law School Forum on Corporate Governance and Financial Regulation. https://corpgov.law.harvard.edu/2019/03/14/2019-lobbying-disclosure-resolutions/
SOMO 2011. Unilever Overview of contro versial business practices in 2010. SOMO Amsterdam, May 2011. Accessed 30 September 2019. https://www.somo.nl/unilever-overview-of-controversial-business-practices-in-2010/
Soper, Spencer, and Rebecca Greenfield. 2019. “Holdout Jeff Bezos Confronted by Amazon Moms Demanding Day Care”. Bloomberg. March 4. Accessed 30 September 2019. https://www.bloomberg.com/news/articles/2019-03-04/holdout-jeff-bezos-confronted-by-amazon-moms-demanding-daycare
Springett, Delyse. 2003. “Business Conceptions of Sustainable Development: A Perspective from Critical Theory.” Business Strategy and the Environment, 12(2):71–86. March. https://doi.org/10.1002/bse.353
Standing, Guy. 2011. The Precariat: The New Dangerous Class. London: Bloomsbury.
172
UNRISD
Steel, Reilly. 2017. “Corporate Political Spending and the Size Effect”. Columbia Law Review, Volume 118, No. 1. Accessed 30 September 2019. https://columbialawreview.org/content/corporate-political-spending-and-the-size-effect/
Stephenson, David, and Veselina Vracheva. 2015. Corporate Social Responsibility and Tax Avoidance: A Literature Review and Directions for Future Research. Conference Paper. Accessed 30 November 2019. https://www.researchgate.net/publication/299648916_Corporate_Social_Responsibility_and_Tax_Avoidance_A_Literature_Review_and_Directions_for_Future_Research
Stern. N. 2006. Stern Review on the Economics of Climate Change. Cambridge: Cambridge University Press.
Stiglitz, Joseph. 2012. The Price of Inequality: How Today’s Divided Society Endangers our Future. New York: W.W. Norton & Company.
Stiglitz, Joseph. 2016. “Monopoly’s New Era.” Chazen Global Insights. May 13. Columbia Business School. Accessed 30 December 2018. https://www8.gsb.columbia.edu/articles/chazen-global-insights/monopoly-s-new-era
Stiglitz, Joseph. 2018. “The American Economy is Rigged (And What Can We Do About It).” Scientific American. Accessed 30 December 2018. https://www.scientificamerican.com/article/the-american-economy-is-rigged/
Subramanian, Samanth. 2019. “Is fair trade finished?” The Guardian. Accessed 15 June 2020. https://www.theguardian.com/busi ness/2019/jul/23/fairtrade-ethical-certification-supermarkets-sainsburys
Sum, Ngai-Ling. 2010. “Global Retail Accumulation Strategies and Wal-Mart’s CSR Regime.” In Business Regulation and Non-State Actors: Whose Standards? Whose Development? Edited by Darryl Reed, Peter Utting and Ananya Mukherjee-Reed. London: Routledge/UNRISD.
SustainAbility. 2018. Rate the Raters 2018: Ratings Revisited. March. Accessed 30 December 2018. https://sustainability.com/wp-content/uploads/2017/12/SA-RateTheRaters_Ratings-Revisited_March18.pdf
SustainAbility and GPC (Government Policy Consultants). 2000. Politics and Persuasion: Corporate Influence on Sustainable Development Policy. Accessed 15 December 2019. https://sustainability.com/wp-content/uploads/2016/09/sustainability_politicsandpersuasion.pdf
SustainAbility, and WWF UK. 2005. Influencing Power: Reviewing the Content of Corporate Lobbying. Accessed 30 December 2018. https://sustainability.com/wp-content/uploads/2016/09/sustainability_influencing_power.pdf
Sustainalytics. 2017. Money Laundering and Tax Evasion: Are Banks Prepared? https://www.researchgate.net/profile/Martin_Vezer2/publication/320067781_Money_laundering_and_tax_evasion_-_are_banks_prepared/links/59cbdb93a6fdcc4 51d5ce53a/Money-laundering-and-tax-evasion-are-banks-prepared.pdf?origin=publication_detail
TCFD. 2017. Recommendations of the Task Force on Climate-related Financial Disclosures. Accessed 30 September 2019. https://www.fsb-tcfd.org/wp-content/uploads/2017/06/FINAL-2017-TCFD-Report-11052018.pdf
The Guardian. 2016. “Portland to vote on taxing companies if CEO earns 100 times more than staff.” 6 December. Accessed 30 September 2019. https://www.theguardian.com/us-news/2016/dec/05/portland-ceo-salary-tax-vote-wealth-inequality
The Guardian. 2018. “Group led by Thomas Piketty presents plan for a ‘fairer’ Europe.” 9 December. Accessed 30 November 2019. https://www.theguardian.com/world/2018/dec/09/eu-brexit-piketty-tax-google-facebook-apple-manifesto
The Telegraph. 2018. “The British companies with no gender pay gap - and how they did it”. 3 April. Accessed 30 September 2019. https://www.telegraph.co.uk/women/life/british-companies-no-gender-pay-gap-did/
The World Bank. 2005. World Development Report 2006: Equity and Development. The World Bank and Oxford University Press. Accessed 30 September 2019. http://documents.worldbank.org/curated/en/435331468127174418/pdf/322040World0Development0 Report02006.pdf
Thomas, Martin P., and Mark W. McElroy. 2016. The MultiCapital Scorecard: Rethinking Organizational Performance. White River Junction, VT: Chelsea Green Publishing.
Thomson Reuters. 2018. Thomson Reuters Diversity and Inclusion Rating: Methodology. Refinitiv. Accessed 30 September 2019. https://www.refinitiv.com/content/dam/marketing/en_us/documents/methodology/diversity-inclusion-rating-methodology.pdf
Thurm, Ralph. 2013. Closing the Context Gap: Sustainability Reporting is Failing Us. Accessed 30 December 2018. https://aheadahead.wordpress.com/2013/05/
Thurm, Ralph. 2014. Heaven or Hell in the Garden of Eden. A/Head/ahead’s year in review. Posted by aheadahead on December 20 in Sustainability Reporting, Thriveability, Towards ‘Sustainomics’. Accessed 30 December 2018. https://aheadahead.wordpress.com/ 2014/12/20/heaven-or-hell-in-garden-eden-aheadaheads-year-in-review/
Thurm, Ralph. 2016. “Integral Thinking & True Materiality – Part 6 Defining Trust, Innovation and Resilience.” Accessed 30 December 2018. https://www.sustainablebrands.com/news_and_views/new_metrics/ralph_thurm/integral_thinking_true_materiality_define_trust_innovation_re
https://sustainability.com/wp-content/uploads/2017/12/SA-RateTheRaters_Ratings-Revisited_March18.pdf
https://sustainability.com/wp-content/uploads/2017/12/SA-RateTheRaters_Ratings-Revisited_March18.pdf
https://sustainability.com/wp-content/uploads/2017/12/SA-RateTheRaters_Ratings-Revisited_March18.pdf
173
CORPORATE SUSTAINABILITY ACCOUNTING: WHAT CAN AND SHOULD CORPORATIONS BE DOING?
Thurm, Ralph. 2017. Blueprint 1: Reporting. A Principles-based Approach to Reporting Serving a Green, Inclusive and Open Economy. Blueprint Report Final Version 1.0. 30 May. Accessed 30 December 2018. https://www.r3-0.org/blueprint-1-reporting/
Thurm, Ralph, and Bill Baue. 2017. “Closing the Context Gap: How Companies Can Transform Degeneration to Regeneration: New Metrics, Sustainable Brands Issue in Focus.” Accessed 30 December 2018. https://www.sustainablebrands.com/news_and_views/new_metrics/ralph_thurm/closing_context_gap_how_companies_can_transform_degeneration_
Thurm, Ralph, and Bill Baue. 2018. “How Do Companies Determine What’s Material? And How Can Materiality Instigate Transformative Change?” Accessed 30 December 2018. https://medium.com/@ralphthurm/how-do-companies-determine-whats-material-9076a2134a12
Thurm, Ralph, Bill Baue, and Cornis van der Lugt. 2018. Blueprint 5. The Transformation Journey: A Step-By-Step Approach to Organizational Thriveability and System Value Creation. Synthesis of the Reporting 3.0 Work Ecosystem Version 1.0. Accessed 30 December 2018. https://reporting3.org/wp-content/uploads/2018/06/R3-BP5.pdf
Tørsløv, Thomas R., Ludvig S. Wier, and Gabriel Zucman. 2018. The Missing Profit of Nations. National Bureau of Economic Research (NBER) Working Paper 24701. Accessed 19 December 2019. https://gabriel-zucman.eu/files/TWZ2018.pdf
Total. 2019. Universal Registration Document 2018. Accessed 20 December 2019. https://www.total.com/sites/g/files/nytnzq111/files/atoms/files/ddr2018-en.pdf
TUAC (Trade Union Advisory Committee). 2016. The Case for Making Country-by-Country Reporting Public. Accessed 20 December 2019. https://tuac.org/wp-content/uploads/2017/12/1606t_beps_cbc-rev-1.pdf
Transparency International. 2010. Regulating the Revolving Door. Working Paper #06/2010. Accessed 30 September 2019. https://images.transparencycdn.org/images/2010_WP_RevolvingDoor_EN.pdf
Transparency International. 2014. Transparency in Corporate Reporting: Assessing the World’s Largest Companies. Accessed 30 September 2019. https://www.transparency.org/en/publications/transparency-in-corporate-reporting-assessing-worlds-largest-companies-2014
Transparency International. 2015. Lobbying in Europe: Hidden Influence, Privileged Access. Accessed 30 September 2019. https://www.transparency.org/whatwe do/publication/lobbying_in_europe
Transparency International. 2016. “Transparency in Corporate Reporting: Assessing Emerging Market Multinationals Frequently Asked Questions.” Accessed 30 September 2019. https://www.transparency.org/files/content/feature/2016_TRACEMM_FAQ_EN.pdf
Transparency International UK. 2015. Corporate Political Engagement Index 2015: Assessing the UK’s Largest Public Companies. Accessed 30 September 2019. https://www.transparency.org.uk/publications/corporate-political-engagement-index-2015/
Transparency International UK. 2018. Corporate Political Engagement Index 2018: Rating Private Sector Political Transparency. Accessed 30 September 2019. https://issuu.com/transparencyuk/docs/1018_cpei_report_print2
Tsutsui Kiyoteru, and Alwyn Lim, editors. 2015. Corporate Social Responsibility in a Globalizing World. Cambridge: Cambridge University Press.
Tulder, Rob van. 2010. “Transnational Corporations and Poverty Reduction: Strategic and Regional Variations”. In Corporate Social Responsibility and Regulatory Governance: Towards Inclusive Development? Edited by Peter Utting and J.C. Marques. Basingstoke, UK: Palgrave Macmillan/UNRISD.
Tulder, Rob van, Alain Verbeke and Roger Strange. 2014. “Taking Stock of Complexity: In Search of New Pathways to Sustainable Development.” In International Business and Sustainable Development (Progress in International Business Research, Volume 8). Edited by Rob van Tulder, Alain Verbeke, Roger Strange. Bingley, UK: Emerald Group Publishing Limited.
United Nations. 1992. United Nations Conference on Environment & Development, Rio de Janeiro, Brazil, 3 to 14 June 1992 AGENDA 21. Accessed 30 December 2018. https://sustainabledevelopment.un.org/content/documents/Agenda21.pdf
United Nations. 2011. Guiding Principles on Business and Human Rights: Implementing the United Nations “Protect, Respect and Remedy Framework”. Accessed 30 September 2019. https://www.ohchr.org/documents/publications/GuidingprinciplesBusinesshr_eN.pdf
United Nations. 2015. Global Sustainable Development Report. 2015 Edition. Advance Unedited Version. Accessed 30 December. https://sustainabledevelopment.un.org/globalsdreport/2015
UNCTAD. 2004. Disclosure of the Impact of Corporations on Society: Current Trends and Issues. Geneva: UNCTAD. Accessed 30 September 2019. https://unctad.org/en/docs/iteteb20037_en.pdf
UNCTAD. 2008. Guidance on Corporate Responsibility Indicators in Annual Reports. Geneva: UNCTAD. Accessed 30 September 2019. https://unctad.org/en/pages/PublicationArchive.aspx?publicationid=260
UNCTAD. 2009. 2009 Review of the Reporting Status of Corporate Responsibility Indicators: Case study of Brazil. Accessed 30 December 2018. https://unctad.org/en/Docs/ciiisarcrp4_en.pdf
174
UNRISD
UNCTAD 2013. Trade and Environment Review 2013: Wake Up Before It Is Too Late. Make Agriculture Truly Sustainable Now for Food Security in a Changing Climate. Accessed 30 September 2019. https://unctad.org/en/Publications Library/ditcted2012d3_en.pdf
UNCTAD. 2017. Trade and Develop-ment Report 2017: Beyond Austerity: Towards a Global New Deal. Accessed 19 December 2019. https://unctad.org/en/PublicationsLibrary/tdr2017_en.pdf
UNCTAD. 2018. Guidance on Core indicators for entity reporting on the contribution towards the attainment of the Sustainable Development Goals. Accessed 30 September 2019. https://unctad.org/en/PublicationsLibrary/diae2019d1_en.pdf
UNDP (United Nations Development Programme). 1990. Human Development Report 1990. New York/Oxford: Oxford University Press.
UNDP. 2005. Human Development Report 2005: International cooperation at a crossroads: Aid, trade and security in an unequal world. Accessed 30 September 2019. http://hdr.undp.org/en/content/human-development-report-2005
UNEP. 2015. Raising the Bar: Advanced Environmental Disclosure in Sustainability Reporting. Accessed 30 September 2019. https://www.unenvironment.org/resources/report/raising-bar-advancing-environmental-disclosure-sustainability-reporting
UN Global Compact. N.d. Guide to Corporate Sustainability: Shaping a Sustainable Future. Accessed 30 September 2019. https://www.unglobalcompact.org/docs/publications/UN_Global_Compact_Guide_to_Corporate_Sustainability.pdf
UN Global Compact and Accenture. 2010. A new era of sustainability in emerging markets? Insights from a global CEO study by the United Nations Global Compact and Accenture. Accessed 30 September 2019. https://www.unglobalcompact.org/library/230
UN Global Compact, UN Women, Business for Social Respon-sibility, Inter-American Development Bank. 2018. Women’s Empowerment Principles: Global Trends Report 2018. Accessed 30 December 2018. https://www.unglobalcompact.org/library/5615
UNICEF, UN Global Compact and Save the Children. 2012. Children’s Rights and Business Principles. Accessed 10 November 2019. https://childrenandbusiness.org/
UNICEF, UN Global Compact and Save the Children. 2013. CSR Reporting Guidance: Guidance for companies for reporting on children’s rights. UNICEF/UN Global Compact/Save the Children.
Unilever. 2019a. Our Greenhouse Gas Footprint. Accessed 20 April 2020. https://www.unilever.com/sustainable-living/reducing-environmental-impact/greenhouse-gases/Our-greenhouse-gas-footprint/
Unilever. 2019b. Gender Pay Report 2018. Accessed 30 September 2019. https://www.unilever.co.uk/Images/sam---unilever-gender-pay-report-2018_v9-final-10-jan-2019_tcm1252-530055_1_en.pdf
UNRISD. 1995. States of Disarray: The Social Effects of Globalization. Geneva: UNRISD.
UNRISD. 2003. Research for Social Change: UNRISD Fortieth Anniversary Report. Geneva: UNRISD.
UNRISD. 2005. Gender Equality: Striving for Justice in an Unequal World. Geneva: UNRISD. Accessed 10 December 2019. http://www.unrisd.org/80256B3C0 05BCCF9/search/1FF4AC64C1894 EAAC1256FA3005E7201
UNRISD. 2010a. Combating Poverty and Inequality: Structural Change, Social Policy and Politics, Geneva: UNRISD. Accessed 30 September 2019. http://www.unrisd.org/80256B3C00 5BCCF9/(httpAuxPages)/92B1D5057 F43149CC125779600434441/
UNRISD. 2010b. “Care and Well-Being in a Development Context.” Chapter 7 in Combating Poverty and Inequality: Structural Change, Social Policy and Politics. Geneva: UNRISD.
UNRISD. 2010c. Why Care Matters for Social Development. Research and Policy Brief 9. Accessed 30 September 2019. http://www.unrisd.org/80256B3C005BCCF9/(httpAuxPages)/25697FE23819206 6C12576D4004CFE50/%24file/RPB9e.pdf
UNRISD. 2016. Policy Innovations for Transformative Change: Implementing the 2030 Agenda for Sustainable Development. Geneva: UNRISD. Accessed 30 September 2019. http://www.unrisd.org/flagship2016
UNRISD. Forthcoming. Sustainable Development Performance Indicators Manual. Geneva: UNRISD.
UN Women. 2018. Facts and Figures: Economic Empowerment. Updated July. Accessed 30 September 2019. http://www.unwomen.org/en/what-we-do/economic-empowerment/facts-and-figures#notes
US SIF Foundation (Forum for Sustainable and Responsible Investment). 2014. Confronting Corporate Money in Politics. A Guide for Individual & Institutional Investors. Accessed 30 September 2019. https://www.ussif.org/files/Publications/Corporate_Money_in_Politics.pdf
U.S. Securities and Exchange Com-mission. 2015. ‘SEC Adopts Rule for Pay Ratio Disclosure Rule Implements Dodd-Frank Man date While Providing Companies with Flexibility to Calculate Pay Ratio’, Washington D.C., Aug. 5, 2015. Accessed 30 September 2019. https://www.sec.gov/news/pressrelease/2015-160.html
Utting, Peter. 2002. “Regulating Business via Multistakeholder Initiatives: A Preliminary Assessment.” In Voluntary Approaches to Corporate Responsibility: Readings and a Resource Guide edited by NGLS/UNRISD. Geneva: NGLS.
Utting, Peter. 2005. “Corporate responsibility and the movement of business.” Development in Practice, 15(3/4):375–88.
Utting, Peter. 2007. “CSR and equality.” Third World Quarterly 28(4):697–712.
175
CORPORATE SUSTAINABILITY ACCOUNTING: WHAT CAN AND SHOULD CORPORATIONS BE DOING?
Utting, Peter. 2008. “The Struggle for Corporate Accountability.” Development and Change, 39(6): 959–975.
Utting, Peter. 2012a. “Introduction: Multistakeholder Regulation from a Development Perspective.” In Business Regulation and Non-State Actors: Whose Standards? Whose Development?, edited by Darryl Reed, Peter Utting and Ananya Mukherjee-Reed. London: Routledge/UNRISD.
Utting, Peter. 2012b. “Activism, Bbusiness Regulation and Development.” In Business Regulation and Non-State Actors: Whose Standards? Whose Development?, edited by Darryl Reed, Peter Utting and Ananya Mukherjee-Reed. London: Routledge/UNRISD.
Utting, Peter. 2013. “Pathways to Sustainability in a Crisis-Ridden World.” In Reducing Inequalities: A Sustainable Development Challenge, edited by R. Genevey, R.K. Pachauri, L. Tubiana. Delhi: Teri Press.
Utting, Peter. 2014. “Multistakeholder Regulation of Business: Assessing the Pros and Cons.” In International Business and Sustainable Development (Progress in International Business Research, Volume 8), edited by Rob Van Tulder, Alain Verbeke and Roger Strange. Bingley, UK: Emerald Group Publishing Limited.
Utting, Peter. 2015. “Corporate social responsibility and the evolving standards regime: regulatory and political dynamics.” In Corporate Responsibility in a Globalizing World, edited by Kiyoteru Tsutsui and Alwyn Lim. Cambridge: Cambridge University Press.
Utting, Peter and Marques, José Carlos. 2010. “Introduction: The Intellectual Crisis of CSR.” In Corporate Social Responsibility and Regulatory Governance: Towards Inclusive Development?, edited by Peter Utting and José Carlos Marques. Basingstoke: Palgrave Macmillan/UNRISD.
Utting, Peter and Marques, José Carlos. 2010. Business, Politics and Public Policy: Implications for Inclusive Development, Basingstoke: Palgrave Macmillan/UNRISD.
Van der Lugt, Cornis. 2018. Blueprint 2: The Blueprint for New Accounting: Laying the Foundations for Future-Ready Reporting. Accounting Blueprint Series 2016-2018. White Paper. Reporting 3.0.
Van der Wal, Sanne. 2013. Certified Unilever Tea Small cup, big difference? SOMO/India Committee of the Netherlands. Accessed 30 September. https://www.somo.nl/certified-
Van Tilburg, Rens and Indra Römgens 2013. Taking Lobbying Public. The Transparency of Dutch Banks’ Lobbying Activities. SOMO. Accessed 30 September 2019. https://www.somo.nl/wp-content/uploads/2013/12/Taking-Lobbying-Public-1.pdf
Vander Stichele, Myriam. 2018. A Lesson Not Learned 10 Years After the Crisis. SOMO. 2018. Accessed 30 September 2019. https://www.somo.nl/lesson-not-learned-10-years-crisis/
Vaughan-Whitehead, Daniel. 2019. “Fair Wages – A Key to Effective Social Capital Management.” In The Sustainability Yearbook 2019, edited by RobecoSAM. Accessed 10 November 2019. https://yearbook.robecosam.com/fileadmin/Files/Documents/2019/The_Sustainability_Yearbook_2019.pdf
Venkatasubramanian, Venkat. 2017. How Much Inequality Is Fair? New York: Columbia University Press.
Vigeo Eiris. 2018. “Gender diversity in corporate senior management: Glass ceiling yet to be cracked.” Accessed 30 September 2019. https://30percentclub.org/assets/uploads/UK/Third_Party_Research/Gender-diversity-in-senior-corporate-managment.pdf
Vincenti, Daniela. 2017. “Commission strives to reach 40% women in management by end of mandate.” July 19. Accessed 30 September 2019. https://www.euractiv.com/
Visser, Jelle. 2019. Trade Unions in the Balance. ILO ACTRAV Working Paper. International Labour Office. Accessed 20 December 2019. https://www.ilo.org/wcmsp5/groups/public/---ed_dialogue/---actrav/documents/publication/wcms_722482.pdf
Visser, Jelle, Susan Hayter, and Rosina Gammarano. 2017. Trends in collective bargaining coverage: Stability, erosion or decline. Issue Brief No. 1. Labour Relations and Collective Bargaining. Geneva: ILO. Accessed 30 September 2019. https://www.ilo.org/wcmsp5/groups/public/---ed_protect/---protrav/---travail/documents/publication/wcms_409422.pdf
Viviers, Suzette, Nadia Mans-Kemp, and Rebecca Fawcett. 2017. “Mechanisms to promote board gender diversity in South Africa.” Acta Commercii 17(1). http://www.scielo.org.za/scielo.php?script=sci_arttext&pid=S1684-199920170001 00023
Vodafone. 2017. Taxation and Our Total Economic Contribution to Public Finances 2016-2017. Accessed 20 December 2019. https://www.vodafone.com/content/dam/vodcom/sustainability/pdfs/vodafone_2017_tax.pdf
Vogel, David. 2005. The Market for Virtue: The Potential and Limits of Corporate Social Responsibility, Washington, DC: Brookings Institution Press.
Webster, Ben. 2019. “Online shopping drives up transport emissions.” The Times. February 6.
Wechter, Sara. 2019. Global Pay Equity at Citi. Accessed 15 December 2019. https://blog.citigroup.com/2019/01/global-pay-equity-at-citi/
Wetzel. 2014. “Performance: That’s not what top managers are paid for.” Vlerick Business School. Accessed 30 September 2019. https://discoversociety.org/2014/ 09/30/performance-thats-not-what-top-managers-are-actually-paid-for/
Wilshaw, Rachel with Liesbeth Unger, Do Quynh Chi, and Pham Thu Thuy. 2013. Labour Rights in Unilever’s Supply Chain: From compliance towards good practice. An Oxfam study of labour issues in Unilever’s Viet Nam operations and supply chain. Accessed 30 September 2019. https://www.unilever.com/Images/rr-unilever-supply-chain-labour-rights-vietnam-310113-en_tcm244-409769_en.pdf

176
UNRISD
Woetzel, Jonathan, Anu Madgavkar, Kweilin Ellingrud, Eric Labaye, Sandrine Devillard, Eric Kutcher, James Manyika, Richard Dobbs, and Mekala Krishnan. 2015. The power of parity: How advancing women’s equality can add $12 trillion to global growth. McKinsey Global Institute. Accessed 30 September 2019. https://www.mckinsey.com/featured-insights/employment-and-growth/how-advancing-womens-equality-can-add-12-trillion-to-global-growth
Workingmother.com. 2018. 2018 Working Mother 100 Best Companies: Data Snapshot. Accessed 30 September 2019. https://www.workingmother.com/sites/workingmother.com/files/attachments/2018/09/2018_best_companies_snapshot_v9.pdf
WBCSD. 2017. Reporting Matters 2017. Accessed 30 September 2019. https://www.wbcsd.org/Programs/Redefining-Value/External-Disclosure/Reporting-matters/Resources/Reporting-Matters-2017
World Commission on Environment and Development. 1987. Our Common Future. Oxford: Oxford University Press.
World Economic Forum. 2015. The Case for Gender Equality. Accessed 30 September 2019. http://reports.weforum.org/global-gender-gap-report-2015/the-case-for-gender-equality/?doing_wp_cron=1562541902.5693910121917724609375
WRI (World Resources Institute) and WBCSD. 2011. Greenhouse Gas Protocol: Corporate Value Chain (Scope 3) Accounting and Reporting Standard. Accessed 20 April 2020. https://ghgprotocol.org/sites/default/files/standards/Corporate-Value-Chain-Accounting-Reporing-Standard_041613_2.pdf
Yildirmaz, Ahu, Christopher Ryan, and Jeff Nezaj. 2019. 2019 State of the Workforce Report: Pay, Promotions and Retention. ADP Research Institute. Accessed 30 September 2019. https://www.adp.com/resources/articles-and-insights/adp-research-institute/research-topics/-/media/62FB03253C3B4B80 A2EE73EB8EC29B82.ashx
Yunus, Mohammed. 2007. Creating a World without Poverty: Social Business and the Future of Capitalism. New York: Public Affairs.
Zadek, Simon. 2001. The Civil Corporation: The New Economy of Corporate Citizenship. London: Earthscan.
Zadek, Simon, Peter Pruzan, and Richard Evans. 1997. Building Corporate Accountability: Emerging Practices in Social and Ethical Accounting, Auditing and Reporting. London: Earthscan.
Zhan, James. 2017. “Opening Statement.” 34th session of UNCTAD’s Intergovernmental Working Group of Experts on International Standards of Accounting and Reporting (ISAR) Palais des Nations, Geneva 1–3 November. Accessed 30 September 2019. https://unctad.org/Sections/dite_dir/docs/ciiisar34th_Zhan_en.pdf
Zucman, Gabriel, 2019. Taxing Multinational Corporations in the 21st Century. Policy Brief 10. Economics for Inclusive Prosperity. Accessed 20 December 2019. https://econfip.org/policy-brief/taxing-multinational-corporations-in-the-21st-century/#
Image attributionIcon in coverAdapted from Lluisa Iborra (Creative Commons via The Noun Project).
Icons Dmitry Kovalev, Dylan Bissonette, Eliricon, EliRatus, Hea Poh Lin, Jorge Mallo, Lluisa Iborra, Neha Tyagi, Nicky Knicky, Olena Panasovska, Path Lord (Creative Commons via The Noun Project).
PhotosAdrien Wiesenbach (public domain via Unsplash), BP Miller (public domain via Unsplash), Chuttersnap (public domain via Unsplash), Christina @ Wocintechchat (public domain via Unsplash), Curtis MacNewton (public domain via Unsplash), Ed Hawkins (Creative Commons BY 4.0 via showyourstripes.info, University of Reading), Fauzan (public domain via Unsplash), Gradienta (public domain via Unsplash), Irfan Simsar (public domain via Unsplash), Kaleidico (public domain via Unsplash), La República (reproduced with permission from Carlos Tovar «Carlín»), Macau Photo Agency (public domain via Unsplash), Marilia Castelli (public domain via Unsplash), Mathew Schwartz (public domain via Unsplash), Melany Rochester (public domain via Unsplash), Micah Boerma (public domain via Pexels), Miguel Henriques (public domain via Unsplash), Morgan Housel (public domain via Unsplash), Morning Brew (public domain via Unsplash), Simone Hutsch (public domain via Unsplash), Stephen Dawson (public domain via Unsplash), Wonderlane (public domain via Unsplash).
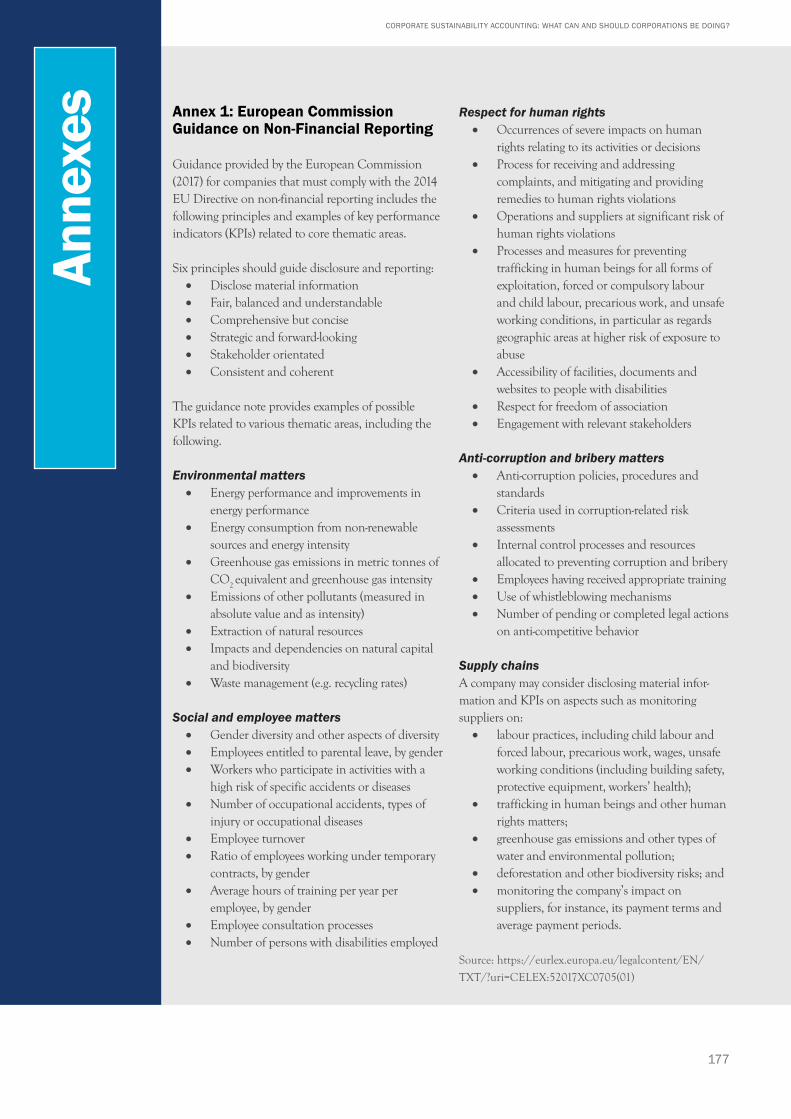
177
CORPORATE SUSTAINABILITY ACCOUNTING: WHAT CAN AND SHOULD CORPORATIONS BE DOING?
Annex 1: European Commission Guidance on Non-Financial Reporting
Guidance provided by the European Commission (2017) for companies that must comply with the 2014 EU Directive on non-financial reporting includes the following principles and examples of key performance indicators (KPIs) related to core thematic areas.
Six principles should guide disclosure and reporting:• Disclose material information• Fair, balanced and understandable• Comprehensive but concise• Strategic and forward-looking• Stakeholder orientated• Consistent and coherent
The guidance note provides examples of possible KPIs related to various thematic areas, including the following.
Environmental matters• Energy performance and improvements in
energy performance• Energy consumption from non-renewable
sources and energy intensity• Greenhouse gas emissions in metric tonnes of
CO2 equivalent and greenhouse gas intensity
• Emissions of other pollutants (measured in absolute value and as intensity)
• Extraction of natural resources• Impacts and dependencies on natural capital
and biodiversity• Waste management (e.g. recycling rates)
Social and employee matters• Gender diversity and other aspects of diversity• Employees entitled to parental leave, by gender• Workers who participate in activities with a
high risk of specific accidents or diseases• Number of occupational accidents, types of
injury or occupational diseases• Employee turnover• Ratio of employees working under temporary
contracts, by gender• Average hours of training per year per
employee, by gender• Employee consultation processes• Number of persons with disabilities employed
Respect for human rights• Occurrences of severe impacts on human
rights relating to its activities or decisions• Process for receiving and addressing
complaints, and mitigating and providing remedies to human rights violations
• Operations and suppliers at significant risk of human rights violations
• Processes and measures for preventing trafficking in human beings for all forms of exploitation, forced or compulsory labour and child labour, precarious work, and unsafe working conditions, in particular as regards geographic areas at higher risk of exposure to abuse
• Accessibility of facilities, documents and websites to people with disabilities
• Respect for freedom of association• Engagement with relevant stakeholders
Anti-corruption and bribery matters• Anti-corruption policies, procedures and
standards• Criteria used in corruption-related risk
assessments• Internal control processes and resources
allocated to preventing corruption and bribery• Employees having received appropriate training• Use of whistleblowing mechanisms• Number of pending or completed legal actions
on anti-competitive behavior
Supply chainsA company may consider disclosing material infor-mation and KPIs on aspects such as monitoring suppliers on:• labour practices, including child labour and
forced labour, precarious work, wages, unsafe working conditions (including building safety, protective equipment, workers’ health);
• trafficking in human beings and other human rights matters;
• greenhouse gas emissions and other types of water and environmental pollution;
• deforestation and other biodiversity risks; and• monitoring the company’s impact on
suppliers, for instance, its payment terms and average payment periods.
Source: https://eurlex.europa.eu/legalcontent/EN/
TXT/?uri=CELEX:52017XC0705(01)
Anne
xes
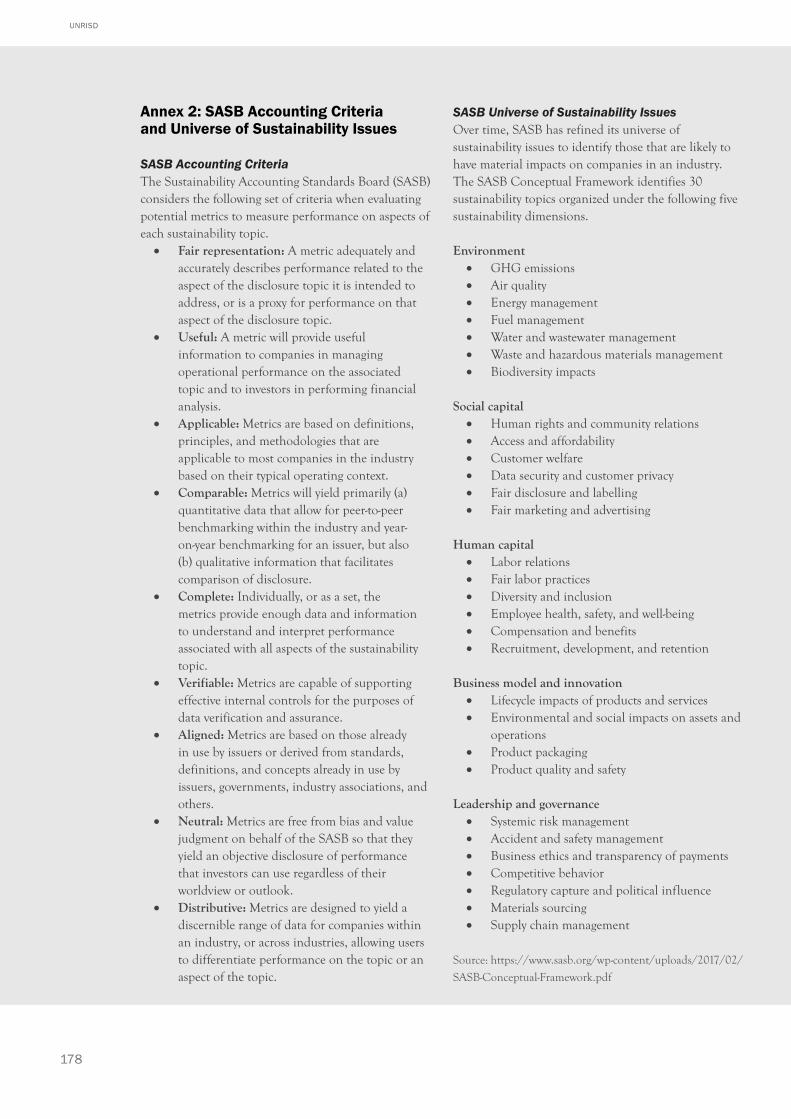
178
UNRISD
Annex 2: SASB Accounting Criteria and Universe of Sustainability Issues
SASB Accounting CriteriaThe Sustainability Accounting Standards Board (SASB) considers the following set of criteria when evaluating potential metrics to measure performance on aspects of each sustainability topic. • Fair representation: A metric adequately and
accurately describes performance related to the aspect of the disclosure topic it is intended to address, or is a proxy for performance on that aspect of the disclosure topic.
• Useful: A metric will provide useful information to companies in managing operational performance on the associated topic and to investors in performing financial analysis.
• Applicable: Metrics are based on definitions, principles, and methodologies that are applicable to most companies in the industry based on their typical operating context.
• Comparable: Metrics will yield primarily (a) quantitative data that allow for peer-to-peer benchmarking within the industry and year-on-year benchmarking for an issuer, but also (b) qualitative information that facilitates comparison of disclosure.
• Complete: Individually, or as a set, the metrics provide enough data and information to understand and interpret performance associated with all aspects of the sustainability topic.
• Verifiable: Metrics are capable of supporting effective internal controls for the purposes of data verification and assurance.
• Aligned: Metrics are based on those already in use by issuers or derived from standards, definitions, and concepts already in use by issuers, governments, industry associations, and others.
• Neutral: Metrics are free from bias and value judgment on behalf of the SASB so that they yield an objective disclosure of performance that investors can use regardless of their worldview or outlook.
• Distributive: Metrics are designed to yield a discernible range of data for companies within an industry, or across industries, allowing users to differentiate performance on the topic or an aspect of the topic.
SASB Universe of Sustainability Issues Over time, SASB has refined its universe of sustainability issues to identify those that are likely to have material impacts on companies in an industry. The SASB Conceptual Framework identifies 30 sustainability topics organized under the following five sustainability dimensions.
Environment• GHG emissions• Air quality• Energy management• Fuel management• Water and wastewater management• Waste and hazardous materials management• Biodiversity impacts
Social capital• Human rights and community relations• Access and affordability• Customer welfare• Data security and customer privacy• Fair disclosure and labelling• Fair marketing and advertising
Human capital• Labor relations• Fair labor practices• Diversity and inclusion• Employee health, safety, and well-being• Compensation and benefits• Recruitment, development, and retention
Business model and innovation • Lifecycle impacts of products and services• Environmental and social impacts on assets and
operations• Product packaging• Product quality and safety
Leadership and governance• Systemic risk management• Accident and safety management• Business ethics and transparency of payments• Competitive behavior• Regulatory capture and political influence• Materials sourcing• Supply chain management
Source: https://www.sasb.org/wp-content/uploads/2017/02/
SASB-Conceptual-Framework.pdf
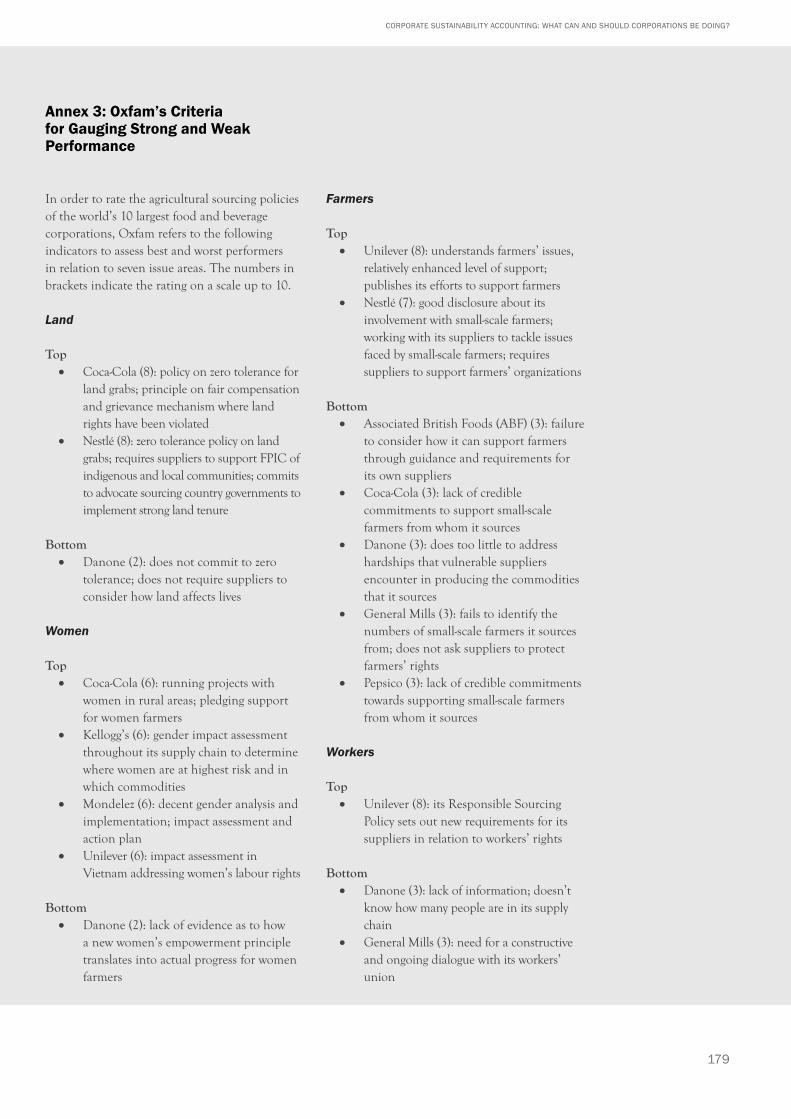
179
CORPORATE SUSTAINABILITY ACCOUNTING: WHAT CAN AND SHOULD CORPORATIONS BE DOING?
Annex 3: Oxfam’s Criteria for Gauging Strong and Weak Performance
In order to rate the agricultural sourcing policies of the world’s 10 largest food and beverage corporations, Oxfam refers to the following indicators to assess best and worst performers in relation to seven issue areas. The numbers in brackets indicate the rating on a scale up to 10.
Land
Top• Coca-Cola (8): policy on zero tolerance for
land grabs; principle on fair compensation and grievance mechanism where land rights have been violated
• Nestlé (8): zero tolerance policy on land grabs; requires suppliers to support FPIC of indigenous and local communities; commits to advocate sourcing country governments to implement strong land tenure
Bottom• Danone (2): does not commit to zero
tolerance; does not require suppliers to consider how land affects lives
Women
Top• Coca-Cola (6): running projects with
women in rural areas; pledging support for women farmers
• Kellogg’s (6): gender impact assessment throughout its supply chain to determine where women are at highest risk and in which commodities
• Mondelez (6): decent gender analysis and implementation; impact assessment and action plan
• Unilever (6): impact assessment in Vietnam addressing women’s labour rights
Bottom• Danone (2): lack of evidence as to how
a new women’s empowerment principle translates into actual progress for women farmers
Farmers
Top• Unilever (8): understands farmers’ issues,
relatively enhanced level of support; publishes its efforts to support farmers
• Nestlé (7): good disclosure about its involvement with small-scale farmers; working with its suppliers to tackle issues faced by small-scale farmers; requires suppliers to support farmers’ organizations
Bottom• Associated British Foods (ABF) (3): failure
to consider how it can support farmers through guidance and requirements for its own suppliers
• Coca-Cola (3): lack of credible commitments to support small-scale farmers from whom it sources
• Danone (3): does too little to address hardships that vulnerable suppliers encounter in producing the commodities that it sources
• General Mills (3): fails to identify the numbers of small-scale farmers it sources from; does not ask suppliers to protect farmers’ rights
• Pepsico (3): lack of credible commitments towards supporting small-scale farmers from whom it sources
Workers
Top• Unilever (8): its Responsible Sourcing
Policy sets out new requirements for its suppliers in relation to workers’ rights
Bottom• Danone (3): lack of information; doesn’t
know how many people are in its supply chain
• General Mills (3): need for a constructive and ongoing dialogue with its workers’ union
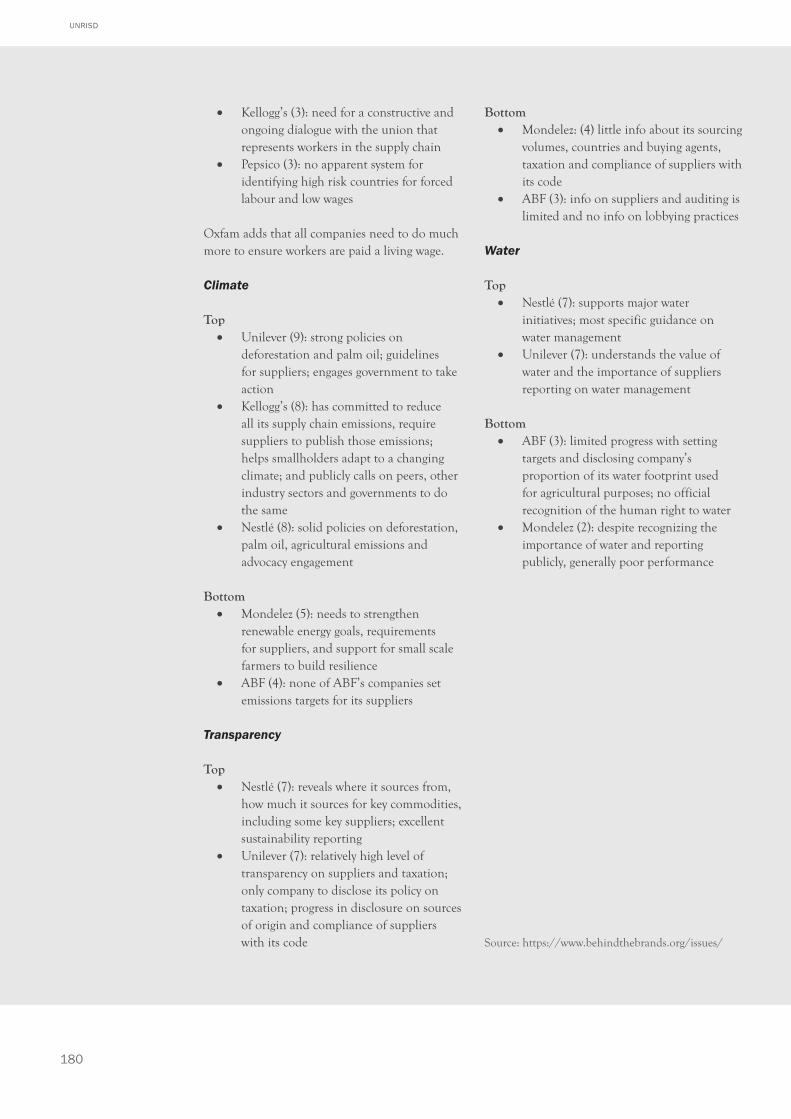
180
UNRISD
• Kellogg’s (3): need for a constructive and ongoing dialogue with the union that represents workers in the supply chain
• Pepsico (3): no apparent system for identifying high risk countries for forced labour and low wages
Oxfam adds that all companies need to do much more to ensure workers are paid a living wage.
Climate
Top• Unilever (9): strong policies on
deforestation and palm oil; guidelines for suppliers; engages government to take action
• Kellogg’s (8): has committed to reduce all its supply chain emissions, require suppliers to publish those emissions; helps smallholders adapt to a changing climate; and publicly calls on peers, other industry sectors and governments to do the same
• Nestlé (8): solid policies on deforestation, palm oil, agricultural emissions and advocacy engagement
Bottom• Mondelez (5): needs to strengthen
renewable energy goals, requirements for suppliers, and support for small scale farmers to build resilience
• ABF (4): none of ABF’s companies set emissions targets for its suppliers
Transparency
Top• Nestlé (7): reveals where it sources from,
how much it sources for key commodities, including some key suppliers; excellent sustainability reporting
• Unilever (7): relatively high level of transparency on suppliers and taxation; only company to disclose its policy on taxation; progress in disclosure on sources of origin and compliance of suppliers with its code
Bottom• Mondelez: (4) little info about its sourcing
volumes, countries and buying agents, taxation and compliance of suppliers with its code
• ABF (3): info on suppliers and auditing is limited and no info on lobbying practices
Water
Top• Nestlé (7): supports major water
initiatives; most specific guidance on water management
• Unilever (7): understands the value of water and the importance of suppliers reporting on water management
Bottom• ABF (3): limited progress with setting
targets and disclosing company’s proportion of its water footprint used for agricultural purposes; no official recognition of the human right to water
• Mondelez (2): despite recognizing the importance of water and reporting publicly, generally poor performance
Source: https://www.behindthebrands.org/issues/
181
CORPORATE SUSTAINABILITY ACCOUNTING: WHAT CAN AND SHOULD CORPORATIONS BE DOING?
Annex 4: Mainstream Innovations to Improve Sustainability Accounting
Multiple initiatives are under way to improve aspects of sustainability accounting and reporting related to complexity, comparability, credibility, relevance and materiality, as well as alignment with the SDGs. In addition to the initiatives identified in Chapters 1 and 2, these include:
• GRI Sustainability Reporting Standards• Action Platform Reporting on the SDGs• SDG Compass• World Benchmarking Alliance• Corporate Reporting Dialogue• UNCTAD and International Standards
of Accounting and Reporting (ISAR)• Science-Based Targets initiative• CDP and Climate Disclosures Standards
Board• World Federation of Exchanges ESG
Guidance and Metrics• EC Guidance on Non-Financial
Reporting
GRI Sustainability Reporting StandardsGRI periodically launches a new generation of reporting guidelines. At the time of writing, the Global Reporting Standards, introduced in 2016, constitute the latest iteration, one which aims to improve reporting relevancy, clarify reporting requirements and content, and simplify language. They are organized into a set of interrelated, modular standards bringing together the G4 Guidelines and the G4 Implementation Manual. Organizations reporting “in accordance” apply three universal standards and select from 33 topic-specific standards to report on material ESG topics. Reporters can comply with entire standards or just cover individual topics. If only using selected standards, the report is classified as “GRI-referenced”. Reporters can now include additional disclosures from frameworks like SASB to report their material topics.
To simplify the disclosure process, the revised format for reporting clearly distinguishes between requirements (indicated by “shall”), recommendations (“should”) and guidance. The Standards have a stronger focus on determining materiality, emphasizing that all impacts considered significant by both internal
and external stakeholders need to be addressed, whether or not they are perceived as important by the reporting organization. To help reporting organizations better understand the challenging and “inconsistently understood” notion of boundary,255 the GRI Standards simplify the concept while also aligning it with important international references such the OECD Guidelines for Multinational Enterprises and the United Nations Guiding Principles on Business and Human Rights. Organizations are now responsible for both direct and indirect impacts via business relationships with customers or suppliers.
Action Platform Reporting on the SDGsTo promote better reporting alignment, the UN Global Compact and GRI have partnered to develop best practices for incorporating SDG reporting into current processes associated with both the UN Global Compact Principles (see table 1.2) and the GRI Reporting Standards. The PRI initiative, which targets the financial services sector, is another partner in the platform. The Action Platform invites leading business representatives to become part of the Action Platform by joining a Corporate Action Group (CAG). The CAG is a peer learning forum to share SDG practices, identify best practices and provide feedback that may be instrumental in new guidance to improve reporting by increasing comparability and relevancy to various stakeholders, including investors and governments. In 2018, GRI and the UN Global Compact released the report, “Business Reporting on the SDGs,” which aims to improve how firms measure and report their impact on the SDGs by enhancing transparency, credibility and accountability. The publication is also intended to address the “stumbling block” represented by the absence of a uniform methodology for reporting contributions to the SDGs and achieving the 2030 Agenda. In the future, the Action Platform will release recommendations on improved SDG data aggregation and analysis to understand corporate impacts related to the SDGs.256
The guidance uses a Principled Prioritization process to encourage companies to focus on the highest priorities that are material for their business rather than select or “cherry-pick” the easiest SDGs and targets on which to report.
255 See https://www.global reporting.org/standards/questions-and-feedback/materiality-and-topic-boundary/
256 See https://www.un globalcompact.org/docs/issues_doc/development/UNGC-GRI-action-platform-reporting-on-the- SDGs.pdf
182
UNRISD
Organizations are called to consider risks to people and the environment and beneficial SDG-related products, services and investments they can offer to achieve the SDGs. Currently, there are more than 40 firms working with the platform and about 35 representatives from civil society, the UN, and governments on the advisory committee (GRI and UN Global Compact 2018:7). SDG CompassCreated in 2015 by GRI, the UN Global Compact and the World Business Council for Sustainable Development, the SDG Compass is a tool designed to help explain how the SDGs affect business and assist firms in identifying GRI Standards that can be employed to demonstrate their contribution to the SDGs.
Users can view how the GRI Standards are mapped against the SDGs in the document “Business Reporting on the SDGs: An Analysis of the Goals and Targets.257 The online Inventory of Business Indicators maps existing ones against the SDGs to enable firms to research commonly-employed indicators that may help measure and report contributions to the SDGs. A filter allows exploration by SDG Goal or target or business theme such as equal opportunity or economic performance and air pollution. As well, new business indicators for the SDG Compass website may be suggested. For instance, when entering SDG Goal 1 (End poverty), the inventory displays the germane SDG Target (1.4: By 2030, ensure that all men and women, in particular the poor and the vulnerable, have equal rights to economic resources, as well as access to basic services, ownership and control over land and other forms of property, inheritance, natural resources, appropriate new technology and financial services, including microfinance), the business theme (access to financial services), the type of indicator (sector-specific) and the GRI indicator source and link (GRI G4 Financial Services Sector Disclosures), indicator description (access points in low-populated or economically disadvantaged areas by type) and indicator ID.
World Benchmarking Alliance (WBA)In 2018 Aviva, the Index Initiative and the UN Foundation, with support from the governments of Denmark, the Netherlands and the UK,
launched the WBA, which will develop free, publicly available benchmarks that compare and rank company performance on the SDGs.258 By benchmarking performance, the initiative aims to increase transparency and accountability for businesses, and empower consumers, investors, governments and civil society to make decisions on where and how to spend money or allocate funds. The results will identify best and worst performers and be used to facilitate dialogues between investors and companies with the aim of promoting behavioural change. The WBA expects to have assessed 2,000 companies by 2023. Five new benchmarks related to the following areas are being developed in collaboration with over 70 WBA Allies:• Climate and energy;• Seafood;• Food and agriculture;• Gender equality and empowerment;• Digital inclusion.
Corporate Reporting Dialogue Launched in 2014, the Corporate Reporting Dialogue is convened by the IIRC and brings together GRI, Climate Disclosures Standards Board (CDSB), SASB with the International Financial Reporting Standards (IFRS), the Financial Accounting Standards Board (FASB), the Carbon Disclosure Project (CDP), and the International Organization for Standardization (ISO). The initiative’s overarching objectives are to communicate about the ongoing development of reporting frameworks, standards and related requirements; identify practical means to align and rationalize these initiatives; share information and use a common voice to engage important regulators.
The Dialogue’s Better Alignment Project has so far led to the Landscape Map and a Statement of Common Principles of Materiality.259 These documents underscore what reporting standard setters and framework providers hold in common and are meant to help direct companies towards frameworks most material to their operations. In late 2019, the Dialogue aims to publish a document depicting the linkages of the Task Force on Climate-related Financial Disclosures (TCFD) Recommendations to SASB, GRI, CDP and CDSB frameworks and the connections among
257 Published by GRI and the UNGC, including the GRI Standards, UN Global Compact-Oxfam Poverty Footprint, CDP 2017 Climate Change and others.
258 See https://www.worldbenchmarking alliance.org/wp-content/uploads/2018/09/WBA-Press-release-24-Sep.pdf
259 See https://corporate reportingdialogue.com/wp-content/uploads/2016/03/Statement-of-Common-Principles-of-Materiality1.pdf
183
CORPORATE SUSTAINABILITY ACCOUNTING: WHAT CAN AND SHOULD CORPORATIONS BE DOING?
the frameworks. The publication will identify how non-financial metrics relate to financial outcomes and explain how the TCFD recommendations should be integrated into mainstream reports.260
UNCTAD and International Standards of Accounting and Reporting (ISAR)The UN Conference on Trade and Development (UNCTAD) has long been engaged in trying to lower the transaction costs of firms by developing sets of environmental and social reporting variables which are clear and concise, and focus on concrete performance rather than management processes and policies (UNCTAD 2004, 2008). In the face of various conceptual and technical issues related to achieving consistency, comparability and usefulness regarding SDG corporate reporting, UNCTAD recently compiled a set of 33 indicators for companies through its Intergovernmental Working Group of Experts on International Standards of Accounting and Reporting (ISAR).261 As noted by James Zhan, Director of Investment and Enterprise at UNCTAD, “Achieving global goals...logically requires globally comparable monitoring indicators. Addressing this challenge during its [2016] quadrennial conference...UNCTAD launched its initiative towards developing a core set of common baseline indicators to assist enterprises in communicating their performance towards achievement of the SDGs to a wide range of stakeholders in a reliable and consistent manner”.262
Building upon earlier work by the Intergovernmental Working Group of Experts in 2016 and 2017, UNCTAD’s recent work includes looking at the challenges around “reporting boundaries, the balance between universality and materiality, the relationship between consolidated and legal entity reporting, external verification and assurance, corporate governance indicators and the alignment of accounting data and statistical indicators.”263
Science Based Targets initiative (SBTi)In the wake of the Paris agreement, the number of corporations committing to emissions reduction has grown rapidly. The swell in interest in science-based targets (SBTs) is due likely to changes in CDP (formerly Climate Disclosure Project) scoring methodology. SBTs help firms specify how much
they need to reduce greenhouse gas emissions and at what rate. A “science-based” target is one in line with the level of decarbonization necessary to keep the rise in global temperature below two degrees Celsius compared to pre-industrial temperatures.264
The Science-based Targets initiative (SBTi) brings together CDP, World Resources Institute, WWF and the UN Global Compact and independently examines and verifies emissions reduction targets using the most recent climate science. As of September 2018, nearly one in five Fortune Global 500 corporations has pledged to set science-based targets. Some 509 companies are now taking science-based climate action and 162 firms have agreed to science-based targets.265 Companies now setting targets include Levi Strauss, Mars, Kraft Heinz, Yamaha Motor Company, brewer AB InBev, India’s Dalmia Cement, clothing firm PVH (Calvin Klein and Tommy Hilfiger), cloud computing firm Salesforce and the engineering company AECOM. Indeed, businesses from 38 countries and adding up to one-eighth (nearly USD 10 trillion or similar to the NASDAQ) of total global market capitalization currently use climate science.266
CDP and Climate Disclosures Standards BoardWorking with investors, companies, cities, states and regions, CDP aims to make environmental reporting and risk management a business norm, driving disclosure and action towards sustainability. Since 2001, more than 5,800 companies have publicly disclosed environmental information through CDP and 7,000 plus firms responded to CDP’s questionnaire on climate change, forests, water, and supply chains.267 The data that is collected by CDP is translated into detailed analysis on key environmental risks, opportunities and impacts.268
To encourage consistency and to clarify to stakeholders where requirements are similar and information can be used to fulfill the needs of different reporting purposes, CDP provides a table that cross references their framework with common reporting provisions like SASB, GRI, UNGC, German Sustainability Code, Integrated Reporting as well as various regulatory
260 See www.corporatere portingdialogue.com
261 See UNCTAD 2018 and isar.unctad.org. Established by ECOSOC in 1982, ISAR is the UN focal point devoted to accounting and reporting issues; its mission is to assist countries in implementing international best practices in corporate reporting and disclosure to enable investment flows and economic development. ISAR has been working towards this objective in partnership with the UN Environment Program and the UN Department of Economic and Social Affairs, as well as in cooperation with other organizations, including the ILO, the IIRC, GRI, the International Accounting Standards Board and International Federation of Accountants.
262 See https://unctad.org/meetings/en/Presentation/ciiisar34th_Zhan_en.pdf
263 “Enhancing the compa-rability of sustainability reporting: Selection of core indicators for entity reporting on the contribution towards the attainment of the Sustainable Development Goals”, October 2018. https://unctad.org/system/files/official-document/ciiisard85_en.pdf
264 See https://sciencebasedtargets.org/what-is-a-science-based-target/
265 See science-based targets website at https://sciencebasedtargets.org/companies-taking-action/. Accessed 10 January 2018.
266 For more information, see https://sustainablebrands.com/read/new-metrics/gcas-8-of-global-market-cap-now-committed-to-science-based-targets
267 See https://www.cdp.net
268 CDP’s recent research found that 100 “carbon majors”—corporations and state-owned fossil fuels and cement producers—have created just over 50 percent of GHG emissions since the industrial revolution (Economist Nov 17th 2018).
184
UNRISD
regimes such as France’s Grenelle II, the EU Non-Financial Reporting Directive and the UK Companies Act.269
CDP hosts the Secretariat of the Climate Disclosure Standards Board (CDSB)—an international consortium of environmental NGOs and businesses to promote the alignment of the corporate mainstream reporting model to equate financial capital and natural capital. CDSB notes that “unacknowledged and unresolved tensions in corporate environmental and natural capital accounting and disclosure practice can produce variation in the quantity and quality of information, which in turn undermines confidence in science, policies, markets and corporate reporting”. The CDSB Framework for reporting environmental information, natural capital and associated business impacts sets out an approach to disclosing environmental data in mainstream reports (annual, Form 10-K/20-F and equivalent).270
The CDP also partners with the Climate Group to lead RE100, an initiative that brings together influential global businesses committed to 100 per cent renewable power, with three-quarters having committed to do so by 2030, if not earlier. They are also proactive in environmental advocacy to change public policy.
World Federation of Exchanges ESG Guidance and MetricsTo promote greater harmonization, comparability and decision-useful information for investors, in 2018 the World Federation of Exchanges (WFE) reworked its sustainability reporting guidance for its more than 35 member stock exchanges. The WFE ESG Guidance and Metrics provide a reference point for exchanges that want to incorporate, or require, ESG reporting in their markets. The revised metrics reflect updates such as the SDGs and the Task Force on Climate-related Financial Disclosures (TCFD) Recommendations. The metrics are mapped against the GRI Sustainability Reporting Standards in a linkage document.271 As a result, firms do not need to adopt extra reporting metrics. The GRI is referenced by 36 stock exchanges around the world. This revision enables companies to use the GRI Standards while also being in accordance with WFE’s 30 baseline ESG metrics (see Annex 7). These metrics purport
to represent the best sustainability practice and cover indicators including human rights, climate risk mitigation, gender pay, emissions, and ethics and anti-corruption.272
EC Guidance on Non-Financial ReportingIn 2017, the European Commission issued guidance for companies that must comply with the 2014 EU Directive on Non-Financial Reporting.273 While stating that “a company may rely on high quality, broadly recognised national, EU-based or international frameworks when preparing its non-financial statement”, the guidance note identifies six principles and examples of key performance indicators (KPIs) related to core thematic areas (see Annex 1). The document also notes that “the non-binding guidelines could represent best practice for all companies that disclose non-financial information, including other companies not included in the scope of the Directive.”
The content of company non-financial statements are expected to include or specify the following:
1. a brief description of the undertaking’s business model
2. a description of the policies pursued by the undertaking in relation to those matters, including due diligence processes implemented
3. the outcome of those policies4. the principal risks related to those
matters linked to the undertaking’s operations including, where relevant and proportionate, its business relationships, products or services which are likely to cause adverse impacts in those areas, and how the undertaking manages those risks
5. material narratives and indicator-based disclosures, commonly referred to as key performance indicators (KPIs)
6. information to the extent necessary for an understanding of the undertaking’s development, performance, position and impact of its activity, relating to, as a minimum, the following thematic matters: environmental, social and employee matters, respect for human rights, anti-corruption and bribery matters and material information on supply chain matters.
269 See https://www.cdsb.net/sites/cdsbnet/files/cdsb_making_the_connections.pdf
270 This paragraph draws on https://www.cdsb.net/harmonization/419/cdsb-connects-corporate-non-financial-reporting-approaches. See also https://www.cdsb.net/sites/cdsbnet/files/cdsb_framework_for_reporting_environmental_information_natural_capital.pdf
271 See https://www.global reporting.org/SiteCollec tionDocuments/2018/Mapping_WFE-ESG-Met rics_GRIStandards.PDF
272 See www.sustainability-reports.com, 2 October 2018.
273 See European Commission 2017, https://ec.europa.eu/info/publications/non-financial-reporting-guidelines_en
185
CORPORATE SUSTAINABILITY ACCOUNTING: WHAT CAN AND SHOULD CORPORATIONS BE DOING?
Annex 5: The Potential and Limits of Digital Innovations
Digital innovations have the potential to address several key issues plaguing CR disclosure and reporting. These challenges include easier comprehension and enhanced stakeholder engagement through, for example, interactive infographics and videos. Emerging technologies may also improve transparency, data timeliness and relevance in the reporting process. As the GRI suggests, this may also lead to greater stakeholder influence in corporate governance (GRI 2016:22). Technologies involving big data, artificial intelligence and blockchain can now collect and analyse sustainability statistics and reveal connections among very complex and opaque data. With increasing processing power and accessibility, big data analytics can help monetize externalities and impacts and furnish a meta view of sustainability reporting through clearer and better integrated measurement and analysis of hitherto intangible ESG indicators (Amesheva 2017).
Importantly, these innovations can also address issues concerning the trustworthiness of sustainability data. Khouhizadeh and Sarkis (2018:1-2) suggest that among all technological developments, blockchain technology has profound implications for supply chain sustainability. Describing blockchains as “decentralized databases or ledgers of records that are shared among networks and supply chain participants”, the researchers observe that “unlike other business information technologies, blockchain uses a unique data structure that stores data as a chain of blocks. Once a new transaction is recorded on the system, it builds a block that is linked to the previous blocks, creating a chain”. At the heart of the technology is decentralization: “Decentralized consensus is the core of the blockchain, which utilizes various algorithms such as proof of work and proof of stake to confirm the reliability of a recorded transaction” (ibid.). The fact that records are also time-stamped increases their traceability and reliability, assuming of course, that data quality is adequate, which may not always be the case.
Enhanced trust, engendered by blockchain technology, is one attribute that underpins its application in supply chains. In a year-long
blockchain pilot project—designed to improve supply chain sustainability—Unilever, Sainsbury’s, packaging company Sappi, three banks (Barclays, BNP and Standard Chartered) and several technology start-ups are collaborating to create a system to follow and verify the contracts for up to 10,000 Malawian tea growers. To this end, the firms are using Provenance’s blockchain-based traceability tools and Halotrade’s supply chain information processing to help with data analysis (Malpani 2018). The project records to a blockchain data regarding the quality and unit price of farmers’ produce as well as sustainability-related crop metrics. The recorded information can then be accessed by all project partners, including banks that appreciate that the data is verifiable. Although such an initiative may ignore a number of key issues—not least the fairness of the process for determining prices in contexts where farmers have weak bargaining power274—producers can be incentivized to employ sustainable agricultural practices through better borrowing terms or preferential pricing.
Other recent examples of companies employing blockchain technology include diamond company De Beers that uses a tool called Tracr to monitor the trajectory of diamonds from mines—through to cutters and polishers—to ensure that they are not being used in conflicts (Bhattacharyya 2018). Everledger also uses the technology to verify the provenance of diamonds in “a digital expression of the Kimberley Process except that it replaces traditional record-keeping with the blockchain” (Davies 2018:2). As Davies suggests, easier automation may well improve the process of supply-chain certification. He also notes that since certification information moves with the diamonds, and can be combined with current labelling methods, it may also be easier for emerging markets to participate in the trade in legitimate ways (Davies 2018:3).
In their study of the potential of blockchain applications to contribute to the SDGs, Rocamora and Amellina (2018) argue that while presently more trials of the technology are in the business and financial sectors, applications in the public and climate change sectors present greater possibilities to positively impact the achievement of the SDGs in the long term. They contend that blockchain
274 We are grateful to Raymond Saner for this observation.

186
UNRISD
applications are most strongly connected to SDG 8 (decent work and economic growth), SDG 9 (industry, innovation and infrastructure), SDG 10 (reduced inequalities) and SDG 16 (peace, justice and strong institutions). The researchers submit that this “can be explained by the fact that most blockchain applications could foster economic growth and innovation, improve the transparency and accountability of organizations and empower small economic actors and vulnerable populations” (Rocamora and Amellina 2018:6).
While digital innovations present opportunities to improve the quality of CR disclosure and reporting, their potential disadvantages are also apparent. Increasingly engaging reporting formats may be more attractive to read, or even watch, but such communication methods remain susceptible to charges of superficiality if they fail to also faithfully represent where the firm can improve its performance. And while Rocamora and Amellina see considerable promise in blockchain technology, they also caution that
the use of blockchain for virtuous purposes should not be seen as a given… Blockchain is likely to become a central element of this [Fourth Industrial] revolution, with economic and social impacts on par with the invention of the Internet …this revolution needs to be guided by a digital governance framework in order to ensure that blockchain technology is designed by and for people (2018:8).
Khouhizadeh and Sarkis (2018) echo this cautious optimism, suggesting that we have yet to see “whether blockchain technology is a true disruptive social innovation, or is another affectation of incremental technology with limited strategic significance for sustainable supply chains” (p.14). Furthermore, as Ngai-Ling Sum (2010) argues “surveillance” technologies are likely to skew inter-firm power relations within value chains even more towards the corporations that dominate such chains. More generally, Bendell (2018) cautions that the governance associated with blockchain, like some earlier technologies, may exacerbate the very inequalities the 2030 Agenda is designed to address.
Annex 6: Learning from Social Science Theory and Multidisciplinarity
While it is increasingly recognized that science-based thinking and evidence must inform corporate sustainability disclosure and reporting, this tends to apply only to the environmental dimension and involve primarily the natural sciences and, more specifically, climate science. As noted in the following examples, social science theory and knowledge drawn from multiple subdisciplines and schools of thought can play an important role in identifying issue areas and indicators that are key from the perspective of transformative change.
Ecological economics suggests that the solution to global warming requires living and producing within ecological boundaries (Raworth 2017) and deep changes in patterns of investment, production, consumption and economic growth (Daly 2013). It also highlights the importance of distributive justice for sustainable development (Martinez-Alier 2002). Tim Jackson (2009) argues that it is not enough to focus on the question of resource intensity or “relative decoupling”, i.e. the goal of ensuring that the rate of growth of emissions or physical throughput is slower than the rate of economic growth of the firm. This may not do anything to solve the climate crisis. What is required is “absolute decoupling”, i.e. absolute reductions in carbon emissions. Furthermore, the goal of living within our ecological boundaries calls for an assessment of whether firms are i) cognizant of the carrying capacities of the sources of natural assets they are using, and ii) whether the volume of the natural resources they are using is not only sustainable but also fair and proportionate in relation to the needs and responsibilities of other user groups (Thurm et al. 2018). Yet current ESG disclosure does not effectively address this issue, if at all.275 Rather, assessments of environmental responsibility tend to focus either on the quality of a company’s environmental management system and/or resource intensity.
To guard against the possibility, highlighted by Piketty (see below), that inequality will increase in contexts of declining growth, Jackson and Victor also argue that:
275 For example, see McElroy (2017), who refers to the need for the GRI framework to address the issues of “thresholds” (carrying capacities) and “allocations” (fair and proportionate shares of responsibility to maintain carrying capacity).
187
CORPORATE SUSTAINABILITY ACCOUNTING: WHAT CAN AND SHOULD CORPORATIONS BE DOING?
Protecting both the quality and the quantity of labour needed in the economy against the incursions of capital, constitutes an important avenue of opportunity for structural change in pursuit of sustainability. Instead of a relentless pursuit of ever-increasing labour productivity, economic policy would aim to protect employment as a priority and recognize that the time spent in labour is a vital component of the value of the activity. The suggestion here is that there are employment opportunities to be had by protecting the quality and intensity of people’s time in the workplace (2014:20).
Other aspects, noted by UNCTAD’s Trade and Environment Review (Hoffmann 2013) in relation to agricultural production, relate to a shift from high external input monoculture methods to an “ecological intensification” approach involving regenerative production systems centred on small-scale farming and multifunctional agriculture. Such an approach also involves the shortening of economic circuits of production and trade, which contrasts with the conventional lengthening of circuits under globalization, as corporations seek out production sites where labour, regulatory and other costs are lower.
Ecological economics tells us that the current focus within corporate sustainability discourse and the practice of “do no harm” needs to be superseded by one that “must replenish the fast-depleting environmental resources we rely on today” or what has been labelled the “net positive” approach (Forum for the Future et al. 2014).
The capabilities approach, associated, in particular, with the work of Amartya Sen (1999) and Martha Nussbaum (2003), highlights the multidimensional nature of poverty and well-being and the role of people’s opportunities “to do and be what they have reason to value”. It also draws attention to a range of structural and political conditions that are often bypassed within the field of MDR.
As Ingrid Robeyns (2016) observes, with this approach,
we…explicitly ask the question which types of means are important for the fostering and
nurturing of a particular capability, or set of capabilities. For some capabilities, the most important means will indeed be financial resources and economic production, but for others it may be particular political practices and institutions, such as effective guarantees and protections of freedom of thought, political participation, social or cultural practices, social structures, social institutions, public goods, social norms, and traditions and habits.
The capabilities approach suggests: (i) the imperative of addressing multiple dimensions of corporate behavior and structural conditions that affect people’s “functionings” (the basic objectives people set such as having a good job, being safe, healthy, etc.) and “capabilities” (what people are able to do given the freedoms and resources they have); (ii) the need to develop a culture of ethics within corporate structures, and not simply at the level of a CSR office or CEO concerned with corporate sustainability; and (iii) the freedom and ability to control one’s own environment through human agency such as the effective participation in relevant decision-making processes, activating labour rights and economic empowerment associated with the ownership of assets. Relating this approach to the SDGs, Bebbington and Unerman (2018) note: “for accounting researchers, the SDGs prompt a re-consideration of the social contract basis for determining corporate social responsibilities (embedded in Rawls). … The SDGs’ emphasis on ‘dignity and justice’…makes exploration of the capabilities approach highly pertinent.”
The field of psychology provides pointers related to conditions of decent work and job satisfaction. Frederick Herzberg’s (1959, 1968) Motivation-Hygiene or Two Factor theory, for example, identifies different determinants of job dissatisfaction and satisfaction: “lower level” conditions needed to survive, so-called hygiene factors, and “higher level” conditions to grow psychologically or so-called “motivators”. While subject to various criticisms, this analysis has been influential in the field of management and yields insights for corporate sustainability disclosure. Apart from suggesting the need for corporations to conduct regular well-designed job satisfaction
188
UNRISD
surveys, it suggests that dealing only with hygiene factors—such as adequate wage levels, occupational health and safety (OHS), job security, non-abusive supervision, etc.—is only part of the equation. Other conditions—“motivators”—play a key role in generating positive long-term impacts on worker satisfaction. These include, for example, opportunities for personal and professional advancement, recognizing and rewarding people’s contributions and allocating responsibility. While both sets of factors need to be addressed simultaneously, it can be argued that the types of issues emphasized in conventional disclosure and reporting, such as compliance with minimum wage legislation and OHS may have a limited bearing on job satisfaction.
As Saner et al. (2018) reveal, this approach is also useful for comparing the performance of enterprises associated with different enterprise models. The researchers compare a digital platform cooperative (Loconomics) and a digital platform capitalist enterprise (TaskRabbit). Focusing on variables that include the ownership structure, the pattern of distribution of profits and benefits, participatory versus hierarchical or top down decision making and the quality of interpersonal relations among employees and stakeholders, they suggest that “the democratic practices of the platform cooperative model in engaging workers through its joint ownership model, inclusive decision-making process, fair distribution of gains, and strong interpersonal relationships allow it to satisfy workers’ needs better than the platform capitalist model” (Saner et al. 2018:17).
Strands of heterodox economics which emphasize the issue of (re)distribution highlight the crucial role that inequality plays in unsustainable development. Thomas Piketty and Joseph Stiglitz, for example, identify worrying trends involving the acceleration of inequalities in income and wealth within society in general and corporations in particular, as well as in the functional distribution of income, i.e. the ratio of profits to wages. Significant gains in worker productivity in recent decades are no longer passed on to workers through increases in real wages (Stiglitz 2012). Rapidly escalating returns to CEOs or “supermanagers” account for much of the growing gap in incomes and wealth
(Piketty 2014).276 The implications for corporate sustainability measurement and disclosure are several. First, corporations need to disclose where they stand in terms of (i) pay differentials, by accurately calculating and presenting in a transparent manner pay ratios between CEOs or senior management and workers;277 (ii) trends associated with the ratio of profits to wages; and (iii) trends associated with labour productivity and real wages. Second, both Piketty and Stiglitz place great store in “workplace democracy” as one pathway towards greater equality. This reinforces the imperative of data and disclosure related to freedom of association, collective bargaining and other means of effective participation in both decision making and profit distribution.
Stiglitz (2012, 2016, 2018) also calls attention to the perverse effects of the concentration of capital, market power, financialization and uncompetitive practices associated with monopolistic advantage, as well as the mechanisms by which corporate interests rig the political system and the policy regime in their favour. While such analysis points to the key role of active citizenship, fiscal policy and regulatory change, it also has implications for corporate responsibility, not least in terms of facilitating the market power of workers through collective bargaining, responsible lobbying and political campaign contributions, declaring and managing conflicts of interest associated with revolving doors and fiscal responsibility.
“Redistributive economics” also has implications for correcting the skewed spatial distribution of income and profits. This manifests itself in various ways, including “urban bias”, profit repatriation and tax havens, i.e. when financial resources are siphoned out of rural areas or local production sites to cities, from host to home countries, or to sites conducive to tax avoidance, respectively.
Political philosophy and political sociology, associated, for example, with the work of Jürgen Habermas and Ulrich Beck, provide pointers related to the need to transform power relations within corporations and global value chains. For Habermas “communicative reason” is key to both power and emancipation: “all political power derives from the communicative power of citizens” (1996:170). For Beck (2005), new
276 Whereas ratios of CEO to “typical” worker pay of 20 or 30 to 1 were common in the United States in the 1960s and 1970s, today they are in excess of 300 to 1. And whereas CEO pay increased by 71 percent between 2009 and 2017, that of workers increased by 2 percent (EPI 2018).
277 Oxfam (2016) notes that of the 10 largest agro-food corporations, only one, Nestlé, publishes data on the ratio of CEO to median workers’ pay.
189
CORPORATE SUSTAINABILITY ACCOUNTING: WHAT CAN AND SHOULD CORPORATIONS BE DOING?
forms of direct participation in decision making, as well as the structuring of a regulatory system beyond the national level, are key for addressing contemporary global problems.
But when considering political philosophy and its relevance for identifying key performance issues for corporate sustainability disclosure and blind spots, it is also useful to go back to classical political philosophy, not least the Marxist notion of “capital”. This reminds us that the profit-making process inevitably generates environmental, social, democratic and competitive contradictions due to the nature of accumulation, concentration and domination that are part of the DNA of the capitalist enterprise (Harvey 2014). Corporate sustainability assessment has focused primarily on the extent to which “multi-capital” impacts associated with contradictions or externalities are being reduced. Far less attention has been focused on issues and indicators associated with the concentration of capital and so-called “corporate hierarchy”.
While corporations increasingly engage in stakeholder dialogue, and while some disclosure guidelines, such as GRI, are calling on companies to consult with a range of stakeholders to determine key contextual and materiality issues, various “political” questions governing this process need to be addressed. Who gets to sit at the table? How much weight does their voice and opinion carry? Are they simply consulted or can they contest and negotiate? Do they actually have decision-making power?
Institutional economics, à la Elinor Ostrom and systems dynamics à la Jay Forrester (2009) and Donella Meadows (1998) likewise offer helpful insights. Concepts such as polycentricity and nested institutions point to the importance of interacting institutions operating at multiple scales, and of interorganizational relations. These can play a key role in patterns of resource management, regulation and cooperation that work well. Concepts such as feedback loops, complexity, unintended consequences and tipping points reveal not only the limits to growth278
(Meadows et al. 1972) but also the limits of the linear thinking that often underpins corporate sustainability disclosure and reporting.
As Bebbington and Unerman observe when analysing conceptual frameworks conducive to SDG-related accounting studies: “What [several]...have in common is that they consider systems dynamics and the nesting of impacts across spatial and temporal scales and seek to explain how change happens on multi-scales” (2018).
Policies and practices related to CR tend to work very much within the rules of the game, not questioning structural dimensions of capitalism, that is, the broader institutions within which corporations are embedded.
The concept of path dependence associated with institutional economics suggests that historically ingrained structural and cultural elements that act as powerful headwinds against progressive change need to be a key focus of attention. Similarly, management theory supporting corporate responsibility and sustainability need to recognize more explicitly the tensions and trade-offs between ESG policy and performance on the one hand, and corporate commercial strategy, on the other hand. Corporate policy that aims to marry ESG principles with product development and core business strategy may ignore the contradictory effects of conventional structural conditions, for example, trade-related externalities, ownership models, labour market flexibilization, trends associated with the concentration of capital and monopoly, and the way conventional consumerist consumption patterns structure production and investment.
Relevant corporate sustainability issues that stem from this analysis include such aspects as: multiple impacts on people and the planet associated with activities along the global value chain; stakeholder engagement and partnerships with multiple actors; the scale and nature of linkages with organizations associated with financial circuits and the sustainability performance of financial service sector organizations; and policy coherence in terms of company ESG objectives being aligned with both a company’s commercial policy and with national and international development goals.
Two key areas of institutional conditionality associated with polycentricity and nesting relate
278 The analysis associated with systems dynamics formed the basis of the inquiry called for by the Club of Rome which culminated in the landmark report, The Limits to Growth, published in 1972 (Meadows et al. 1972).
190
UNRISD
to public policy and the broader rules of the game related to the functioning of capitalism. With regard to public policy, a key indicator of corporate sustainability relates to corporate advocacy and lobbying. To what extent are corporations shifting from regressive to progressive lobbying? While the former facilitates such aspects as deregulation or the externalization of social and environmental costs, the latter aims to counter such aspects. Indeed, the GlobeScan-SustainAbility (2018) survey of experts finds that “advocacy” is perceived to be the weakest aspect of corporate sustainability strategy.279
Strands of economic history and economic anthropology also highlight the role of institutions. For Karl Polanyi, institutions associated with redistribution, reciprocity, regulation, collective ownership and collective action played a key role in shaping “market society”, re-embedding the economy and enhancing social protection.280
Such institutions are essential to deal with crisis tendencies inherent in contexts of deregulating markets, as well as ongoing commodification, when people’s needs and public goods are converted into “fictitious commodities” that are produced and exchanged on the market (Polanyi 1944). This perspective suggests that corporate sustainability disclosure needs to focus on issue areas associated with deregulation, for example, outsourcing and financialization; the deterioration of labour rights such as collective bargaining; alternative enterprise ownership and legal structures associated, for example, with social and solidarity economy; and issues of corporate taxation and corporate political influence that impact public policy and state capacity.
Feminist theory has played a key role in addressing blind spots within both academic analysis and policy making related to gender inequality. Feminist economics and feminist philosophy not only highlight the role of women in social reproduction and unpaid care work, but also how this role is a key enabling condition for the market economy and underpins women’s subordination.281 Furthermore, it is a role that determines significantly whether women’s economic (and other) rights can be substantiated (Nussbaum 2002, Phillips 2002). Cultural traits and power relations associated with patriarchy
foster discrimination in pay and promotion and abusive practices in the workplace. Demands and time use associated with care, in turn, reinforce women’s subordination in the workplace, as evidenced in their positioning in lower paid, lower quality jobs and underrepresentation in management positions. In the contemporary neoliberal context, the role of the state in relation to care has often declined, market provision of care services has increased, and women’s engagement in paid labour has increased (Razavi 2007). This trilogy of conditions suggests that corporations must assume greater responsibilities in this area either through policies that directly support the capacity of employees to provide care or more indirectly, for example, via forms of corporate political influence that promote progressive social policy, including public policies that facilitate caregiving.
From the perspective of corporate sustainability disclosure, this analysis points to the need to pay far more attention to care as an impediment to decent work and gender equality, and to indicators that capture the structural conditions that underpin women’s disadvantage in the workplace and career structures, notably segmented labour roles, the underrepresentation of women in management and promotion, and the gender pay gap. It also points to the limits of focusing on such indicators as compliance with minimum wage regulations or meeting basic conditions associated with occupational health and safety. While meeting a “minimum threshold”282—whether set by public or corporate policy—is, of course, important from the perspective of poverty reduction, it may do little from the perspective of equality (Phillips 2002). Equality demands not only social protection but also emancipation (Fraser 2012). This type of analysis points to the need for corporate sustainability disclosure to also focus on women’s collective action through collective bargaining and other mechanisms as a means to both women’s economic and political empowerment.
279 Of the five predefined leadership attributes that were assessed, corporations were found to be strongest on “Plan” and weakest on “Advocacy” (GlobeScan and Sus-tainability 2018:27).
280 For a succinct review of the influence and relevance of Polanyi’s work see Mendell et al. 2019.
281 See, for example, Fraser 2012, Molyneux and Razavi 2002 and UNRISD 2005.
282 Nussbaum 2006.
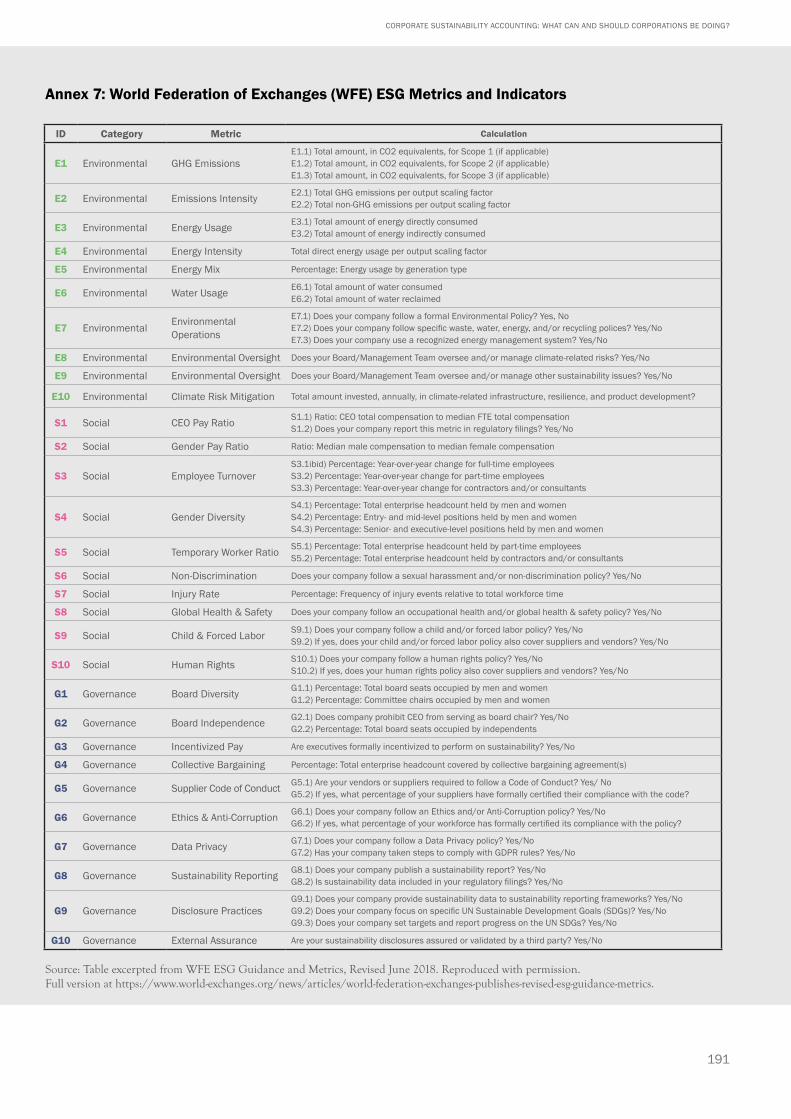
191
CORPORATE SUSTAINABILITY ACCOUNTING: WHAT CAN AND SHOULD CORPORATIONS BE DOING?
Annex 7: World Federation of Exchanges (WFE) ESG Metrics and Indicators
Source: Table excerpted from WFE ESG Guidance and Metrics, Revised June 2018. Reproduced with permission. Full version at https://www.world-exchanges.org/news/articles/world-federation-exchanges-publishes-revised-esg-guidance-metrics.
ID Category Metric Calculation
E1 Environmental GHG EmissionsE1.1) Total amount, in CO2 equivalents, for Scope 1 (if applicable)E1.2) Total amount, in CO2 equivalents, for Scope 2 (if applicable)E1.3) Total amount, in CO2 equivalents, for Scope 3 (if applicable)
E2 Environmental Emissions Intensity E2.1) Total GHG emissions per output scaling factorE2.2) Total non-GHG emissions per output scaling factor
E3 Environmental Energy Usage E3.1) Total amount of energy directly consumedE3.2) Total amount of energy indirectly consumed
E4 Environmental Energy Intensity Total direct energy usage per output scaling factor
E5 Environmental Energy Mix Percentage: Energy usage by generation type
E6 Environmental Water Usage E6.1) Total amount of water consumed E6.2) Total amount of water reclaimed
E7 Environmental Environmental Operations
E7.1) Does your company follow a formal Environmental Policy? Yes, NoE7.2) Does your company follow specific waste, water, energy, and/or recycling polices? Yes/NoE7.3) Does your company use a recognized energy management system? Yes/No
E8 Environmental Environmental Oversight Does your Board/Management Team oversee and/or manage climate-related risks? Yes/No
E9 Environmental Environmental Oversight Does your Board/Management Team oversee and/or manage other sustainability issues? Yes/No
E10 Environmental Climate Risk Mitigation Total amount invested, annually, in climate-related infrastructure, resilience, and product development?
S1 Social CEO Pay Ratio S1.1) Ratio: CEO total compensation to median FTE total compensationS1.2) Does your company report this metric in regulatory filings? Yes/No
S2 Social Gender Pay Ratio Ratio: Median male compensation to median female compensation
S3 Social Employee Turnover S3.1ibid) Percentage: Year-over-year change for full-time employees S3.2) Percentage: Year-over-year change for part-time employeesS3.3) Percentage: Year-over-year change for contractors and/or consultants
S4 Social Gender DiversityS4.1) Percentage: Total enterprise headcount held by men and womenS4.2) Percentage: Entry- and mid-level positions held by men and women S4.3) Percentage: Senior- and executive-level positions held by men and women
S5 Social Temporary Worker Ratio S5.1) Percentage: Total enterprise headcount held by part-time employeesS5.2) Percentage: Total enterprise headcount held by contractors and/or consultants
S6 Social Non-Discrimination Does your company follow a sexual harassment and/or non-discrimination policy? Yes/No
S7 Social Injury Rate Percentage: Frequency of injury events relative to total workforce time
S8 Social Global Health & Safety Does your company follow an occupational health and/or global health & safety policy? Yes/No
S9 Social Child & Forced Labor S9.1) Does your company follow a child and/or forced labor policy? Yes/NoS9.2) If yes, does your child and/or forced labor policy also cover suppliers and vendors? Yes/No
S10 Social Human Rights S10.1) Does your company follow a human rights policy? Yes/NoS10.2) If yes, does your human rights policy also cover suppliers and vendors? Yes/No
G1 Governance Board Diversity G1.1) Percentage: Total board seats occupied by men and womenG1.2) Percentage: Committee chairs occupied by men and women
G2 Governance Board Independence G2.1) Does company prohibit CEO from serving as board chair? Yes/NoG2.2) Percentage: Total board seats occupied by independents
G3 Governance Incentivized Pay Are executives formally incentivized to perform on sustainability? Yes/No
G4 Governance Collective Bargaining Percentage: Total enterprise headcount covered by collective bargaining agreement(s)
G5 Governance Supplier Code of Conduct G5.1) Are your vendors or suppliers required to follow a Code of Conduct? Yes/ NoG5.2) If yes, what percentage of your suppliers have formally certified their compliance with the code?
G6 Governance Ethics & Anti-Corruption G6.1) Does your company follow an Ethics and/or Anti-Corruption policy? Yes/NoG6.2) If yes, what percentage of your workforce has formally certified its compliance with the policy?
G7 Governance Data Privacy G7.1) Does your company follow a Data Privacy policy? Yes/NoG7.2) Has your company taken steps to comply with GDPR rules? Yes/No
G8 Governance Sustainability Reporting G8.1) Does your company publish a sustainability report? Yes/NoG8.2) Is sustainability data included in your regulatory filings? Yes/No
G9 Governance Disclosure PracticesG9.1) Does your company provide sustainability data to sustainability reporting frameworks? Yes/No G9.2) Does your company focus on specific UN Sustainable Development Goals (SDGs)? Yes/NoG9.3) Does your company set targets and report progress on the UN SDGs? Yes/No
G10 Governance External Assurance Are your sustainability disclosures assured or validated by a third party? Yes/No
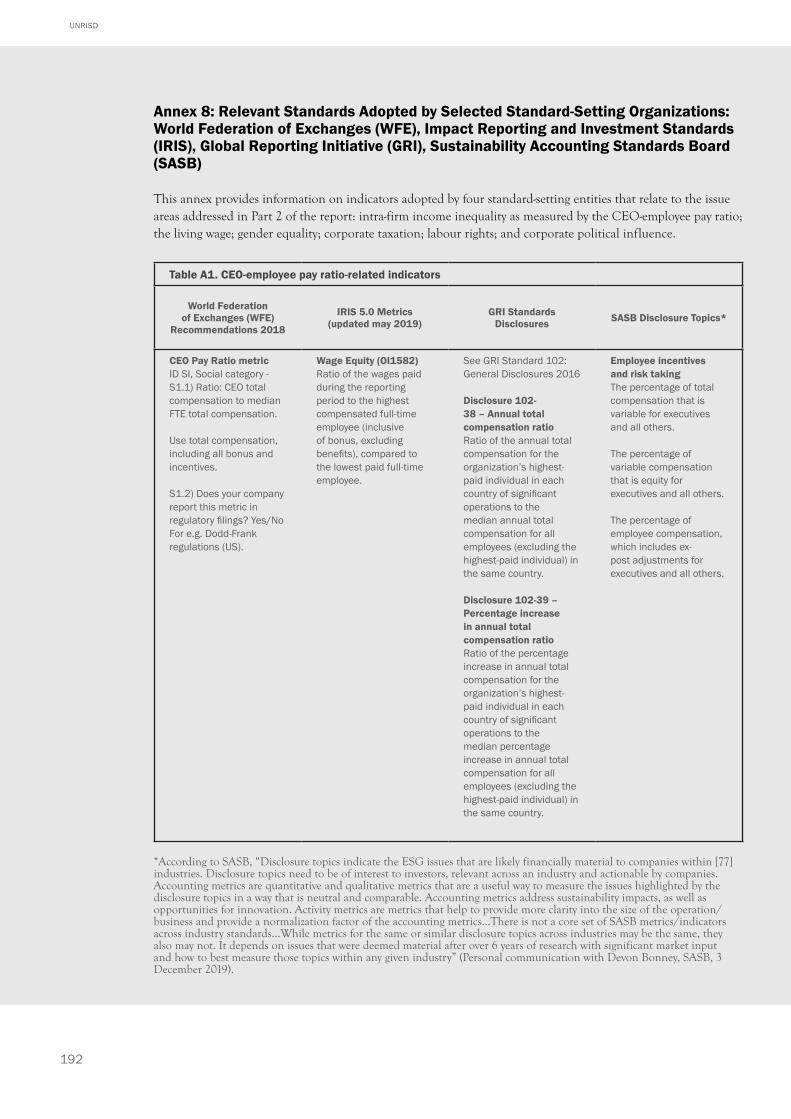
192
UNRISD
Annex 8: Relevant Standards Adopted by Selected Standard-Setting Organizations: World Federation of Exchanges (WFE), Impact Reporting and Investment Standards (IRIS), Global Reporting Initiative (GRI), Sustainability Accounting Standards Board (SASB)
This annex provides information on indicators adopted by four standard-setting entities that relate to the issue areas addressed in Part 2 of the report: intra-firm income inequality as measured by the CEO-employee pay ratio; the living wage; gender equality; corporate taxation; labour rights; and corporate political influence.
Table A1. CEO-employee pay ratio-related indicators
World Federation of Exchanges (WFE)
Recommendations 2018
IRIS 5.0 Metrics (updated may 2019)
GRI Standards Disclosures SASB Disclosure Topics*
CEO Pay Ratio metric ID SI, Social category - S1.1) Ratio: CEO total compensation to median FTE total compensation.
Use total compensation, including all bonus and incentives.
S1.2) Does your company report this metric in regulatory filings? Yes/NoFor e.g. Dodd-Frank regulations (US).
Wage Equity (OI1582)Ratio of the wages paid during the reporting period to the highest compensated full-time employee (inclusive of bonus, excluding benefits), compared to the lowest paid full-time employee.
See GRI Standard 102: General Disclosures 2016 Disclosure 102-38 – Annual total compensation ratio Ratio of the annual total compensation for the organization’s highest-paid individual in each country of significant operations to the median annual total compensation for all employees (excluding the highest-paid individual) in the same country. Disclosure 102-39 – Percentage increase in annual total compensation ratioRatio of the percentage increase in annual total compensation for the organization’s highest-paid individual in each country of significant operations to the median percentage increase in annual total compensation for all employees (excluding the highest-paid individual) in the same country.
Employee incentives and risk takingThe percentage of total compensation that is variable for executives and all others.
The percentage of variable compensation that is equity for executives and all others.
The percentage of employee compensation, which includes ex-post adjustments for executives and all others.
*According to SASB, “Disclosure topics indicate the ESG issues that are likely financially material to companies within [77] industries. Disclosure topics need to be of interest to investors, relevant across an industry and actionable by companies. Accounting metrics are quantitative and qualitative metrics that are a useful way to measure the issues highlighted by the disclosure topics in a way that is neutral and comparable. Accounting metrics address sustainability impacts, as well as opportunities for innovation. Activity metrics are metrics that help to provide more clarity into the size of the operation/business and provide a normalization factor of the accounting metrics…There is not a core set of SASB metrics/indicators across industry standards…While metrics for the same or similar disclosure topics across industries may be the same, they also may not. It depends on issues that were deemed material after over 6 years of research with significant market input and how to best measure those topics within any given industry” (Personal communication with Devon Bonney, SASB, 3 December 2019).
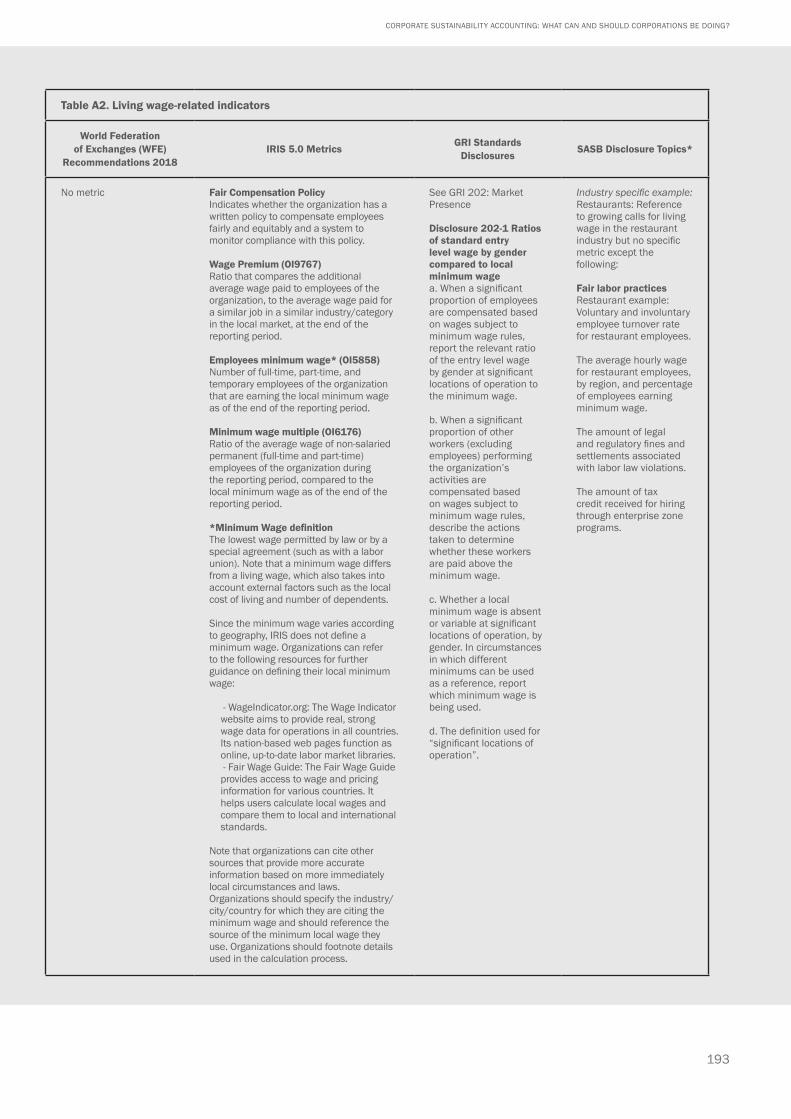
193
CORPORATE SUSTAINABILITY ACCOUNTING: WHAT CAN AND SHOULD CORPORATIONS BE DOING?
Table A2. Living wage-related indicators
World Federation of Exchanges (WFE)
Recommendations 2018IRIS 5.0 Metrics GRI Standards
Disclosures SASB Disclosure Topics*
No metric Fair Compensation PolicyIndicates whether the organization has a written policy to compensate employees fairly and equitably and a system to monitor compliance with this policy.
Wage Premium (OI9767)Ratio that compares the additional average wage paid to employees of the organization, to the average wage paid for a similar job in a similar industry/category in the local market, at the end of the reporting period.
Employees minimum wage* (OI5858) Number of full-time, part-time, and temporary employees of the organization that are earning the local minimum wage as of the end of the reporting period.
Minimum wage multiple (OI6176)Ratio of the average wage of non-salaried permanent (full-time and part-time) employees of the organization during the reporting period, compared to the local minimum wage as of the end of the reporting period.
*Minimum Wage definitionThe lowest wage permitted by law or by a special agreement (such as with a labor union). Note that a minimum wage differs from a living wage, which also takes into account external factors such as the local cost of living and number of dependents.
Since the minimum wage varies according to geography, IRIS does not define a minimum wage. Organizations can refer to the following resources for further guidance on defining their local minimum wage:
- WageIndicator.org: The Wage Indicator website aims to provide real, strong wage data for operations in all countries. Its nation-based web pages function as online, up-to-date labor market libraries. - Fair Wage Guide: The Fair Wage Guide provides access to wage and pricing information for various countries. It helps users calculate local wages and compare them to local and international standards.
Note that organizations can cite other sources that provide more accurate information based on more immediately local circumstances and laws. Organizations should specify the industry/city/country for which they are citing the minimum wage and should reference the source of the minimum local wage they use. Organizations should footnote details used in the calculation process.
See GRI 202: Market Presence
Disclosure 202-1 Ratios of standard entry level wage by gender compared to local minimum wagea. When a significant proportion of employees are compensated based on wages subject to minimum wage rules, report the relevant ratio of the entry level wage by gender at significant locations of operation to the minimum wage.
b. When a significant proportion of other workers (excluding employees) performing the organization’s activities are compensated based on wages subject to minimum wage rules, describe the actions taken to determine whether these workers are paid above the minimum wage.
c. Whether a local minimum wage is absent or variable at significant locations of operation, by gender. In circumstances in which different minimums can be used as a reference, report which minimum wage is being used.
d. The definition used for “significant locations of operation”.
Industry specific example: Restaurants: Reference to growing calls for living wage in the restaurant industry but no specific metric except the following:
Fair labor practices Restaurant example: Voluntary and involuntary employee turnover rate for restaurant employees.
The average hourly wage for restaurant employees, by region, and percentage of employees earning minimum wage.
The amount of legal and regulatory fines and settlements associated with labor law violations.
The amount of tax credit received for hiring through enterprise zone programs.
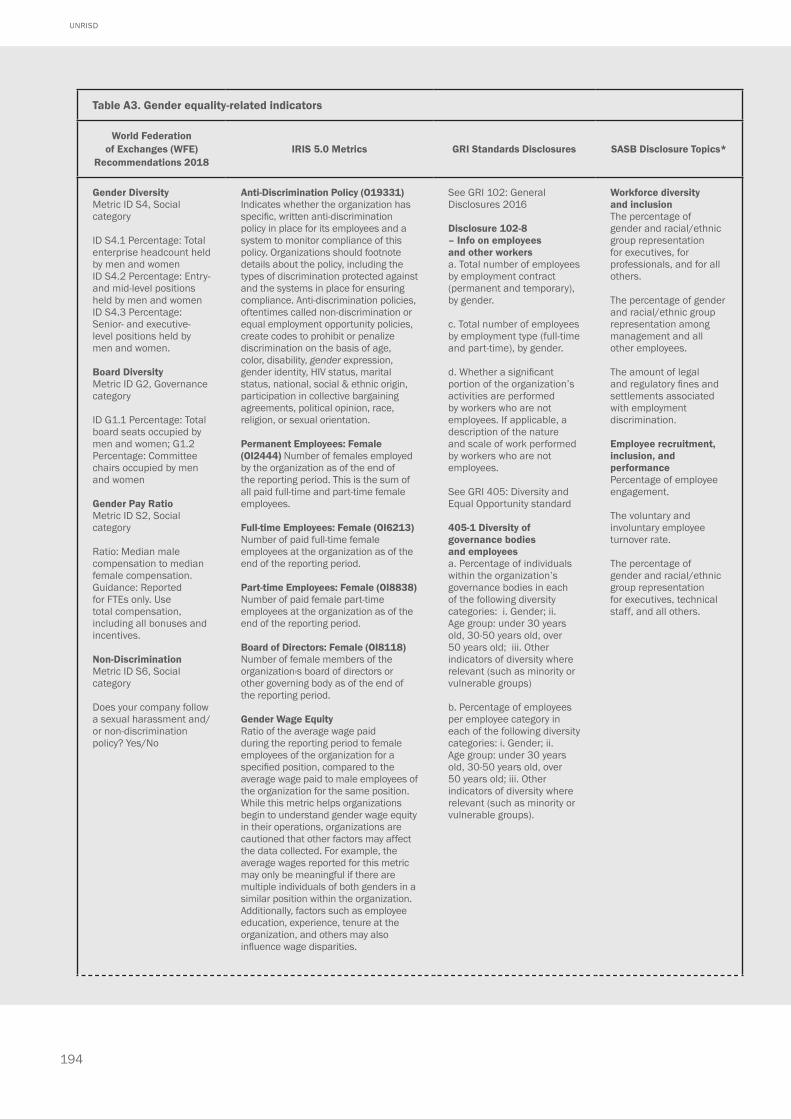
194
UNRISD
Table A3. Gender equality-related indicators
World Federation of Exchanges (WFE)
Recommendations 2018IRIS 5.0 Metrics GRI Standards Disclosures SASB Disclosure Topics*
Gender Diversity Metric ID S4, Social category
ID S4.1 Percentage: Total enterprise headcount held by men and womenID S4.2 Percentage: Entry- and mid-level positions held by men and women ID S4.3 Percentage: Senior- and executive- level positions held by men and women.
Board Diversity Metric ID G2, Governance category
ID G1.1 Percentage: Total board seats occupied by men and women; G1.2 Percentage: Committee chairs occupied by men and women
Gender Pay RatioMetric ID S2, Social category
Ratio: Median male compensation to median female compensation.Guidance: Reported for FTEs only. Use total compensation, including all bonuses and incentives.
Non-DiscriminationMetric ID S6, Social category
Does your company follow a sexual harassment and/or non-discrimination policy? Yes/No
Anti-Discrimination Policy (O19331)Indicates whether the organization has specific, written anti-discrimination policy in place for its employees and a system to monitor compliance of this policy. Organizations should footnote details about the policy, including the types of discrimination protected against and the systems in place for ensuring compliance. Anti-discrimination policies, oftentimes called non-discrimination or equal employment opportunity policies, create codes to prohibit or penalize discrimination on the basis of age, color, disability, gender expression, gender identity, HIV status, marital status, national, social & ethnic origin, participation in collective bargaining agreements, political opinion, race, religion, or sexual orientation.
Permanent Employees: Female (OI2444) Number of females employed by the organization as of the end of the reporting period. This is the sum of all paid full-time and part-time female employees.
Full-time Employees: Female (OI6213) Number of paid full-time female employees at the organization as of the end of the reporting period.
Part-time Employees: Female (OI8838) Number of paid female part-time employees at the organization as of the end of the reporting period.
Board of Directors: Female (OI8118) Number of female members of the organization›s board of directors or other governing body as of the end of the reporting period.
Gender Wage EquityRatio of the average wage paid during the reporting period to female employees of the organization for a specified position, compared to the average wage paid to male employees of the organization for the same position. While this metric helps organizations begin to understand gender wage equity in their operations, organizations are cautioned that other factors may affect the data collected. For example, the average wages reported for this metric may only be meaningful if there are multiple individuals of both genders in a similar position within the organization. Additionally, factors such as employee education, experience, tenure at the organization, and others may also influence wage disparities.
See GRI 102: General Disclosures 2016
Disclosure 102-8 – Info on employees and other workers a. Total number of employees by employment contract (permanent and temporary), by gender.
c. Total number of employees by employment type (full-time and part-time), by gender.
d. Whether a significant portion of the organization’s activities are performed by workers who are not employees. If applicable, a description of the nature and scale of work performed by workers who are not employees.
See GRI 405: Diversity and Equal Opportunity standard
405-1 Diversity of governance bodies and employeesa. Percentage of individuals within the organization’s governance bodies in each of the following diversity categories: i. Gender; ii. Age group: under 30 years old, 30-50 years old, over 50 years old; iii. Other indicators of diversity where relevant (such as minority or vulnerable groups)
b. Percentage of employees per employee category in each of the following diversity categories: i. Gender; ii. Age group: under 30 years old, 30-50 years old, over 50 years old; iii. Other indicators of diversity where relevant (such as minority or vulnerable groups).
Workforce diversity and inclusionThe percentage of gender and racial/ethnic group representation for executives, for professionals, and for all others.
The percentage of gender and racial/ethnic group representation among management and all other employees.
The amount of legal and regulatory fines and settlements associated with employment discrimination.
Employee recruitment, inclusion, and performancePercentage of employee engagement.
The voluntary and involuntary employee turnover rate.
The percentage of gender and racial/ethnic group representation for executives, technical staff, and all others.
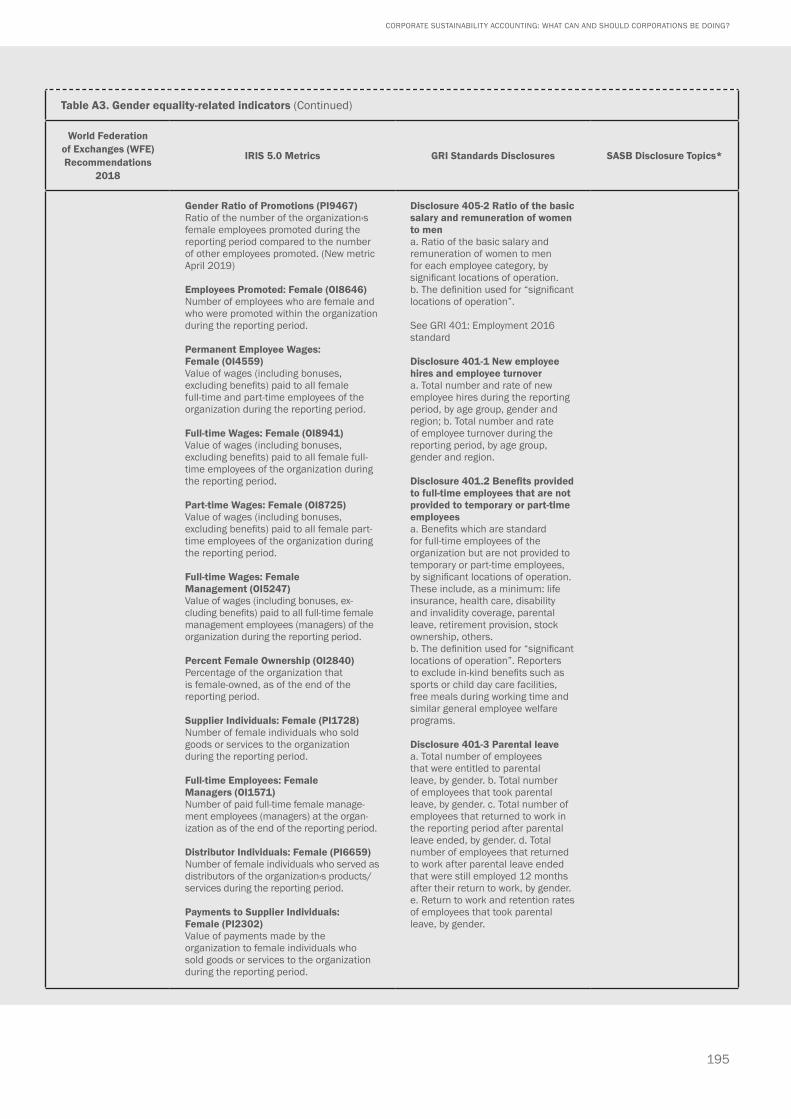
195
CORPORATE SUSTAINABILITY ACCOUNTING: WHAT CAN AND SHOULD CORPORATIONS BE DOING?
Table A3. Gender equality-related indicators (Continued)
World Federation of Exchanges (WFE) Recommendations
2018
IRIS 5.0 Metrics GRI Standards Disclosures SASB Disclosure Topics*
Gender Ratio of Promotions (PI9467)Ratio of the number of the organization›s female employees promoted during the reporting period compared to the number of other employees promoted. (New metric April 2019)
Employees Promoted: Female (OI8646) Number of employees who are female and who were promoted within the organization during the reporting period. Permanent Employee Wages: Female (OI4559)Value of wages (including bonuses, excluding benefits) paid to all female full-time and part-time employees of the organization during the reporting period.
Full-time Wages: Female (OI8941)Value of wages (including bonuses, excluding benefits) paid to all female full-time employees of the organization during the reporting period.
Part-time Wages: Female (OI8725)Value of wages (including bonuses, excluding benefits) paid to all female part-time employees of the organization during the reporting period.
Full-time Wages: Female Management (OI5247)Value of wages (including bonuses, ex-cluding benefits) paid to all full-time female management employees (managers) of the organization during the reporting period.
Percent Female Ownership (OI2840) Percentage of the organization that is female-owned, as of the end of the reporting period.
Supplier Individuals: Female (PI1728) Number of female individuals who sold goods or services to the organization during the reporting period.
Full-time Employees: Female Managers (OI1571)Number of paid full-time female manage-ment employees (managers) at the organ-ization as of the end of the reporting period.
Distributor Individuals: Female (PI6659) Number of female individuals who served as distributors of the organization›s products/services during the reporting period.
Payments to Supplier Individuals: Female (PI2302)Value of payments made by the organization to female individuals who sold goods or services to the organization during the reporting period.
Disclosure 405-2 Ratio of the basic salary and remuneration of women to mena. Ratio of the basic salary and remuneration of women to men for each employee category, by significant locations of operation. b. The definition used for “significant locations of operation”.
See GRI 401: Employment 2016 standard
Disclosure 401-1 New employee hires and employee turnovera. Total number and rate of new employee hires during the reporting period, by age group, gender and region; b. Total number and rate of employee turnover during the reporting period, by age group, gender and region.
Disclosure 401.2 Benefits provided to full-time employees that are not provided to temporary or part-time employees a. Benefits which are standard for full-time employees of the organization but are not provided to temporary or part-time employees, by significant locations of operation. These include, as a minimum: life insurance, health care, disability and invalidity coverage, parental leave, retirement provision, stock ownership, others. b. The definition used for “significant locations of operation”. Reporters to exclude in-kind benefits such as sports or child day care facilities, free meals during working time and similar general employee welfare programs.
Disclosure 401-3 Parental leave a. Total number of employees that were entitled to parental leave, by gender. b. Total number of employees that took parental leave, by gender. c. Total number of employees that returned to work in the reporting period after parental leave ended, by gender. d. Total number of employees that returned to work after parental leave ended that were still employed 12 months after their return to work, by gender. e. Return to work and retention rates of employees that took parental leave, by gender.
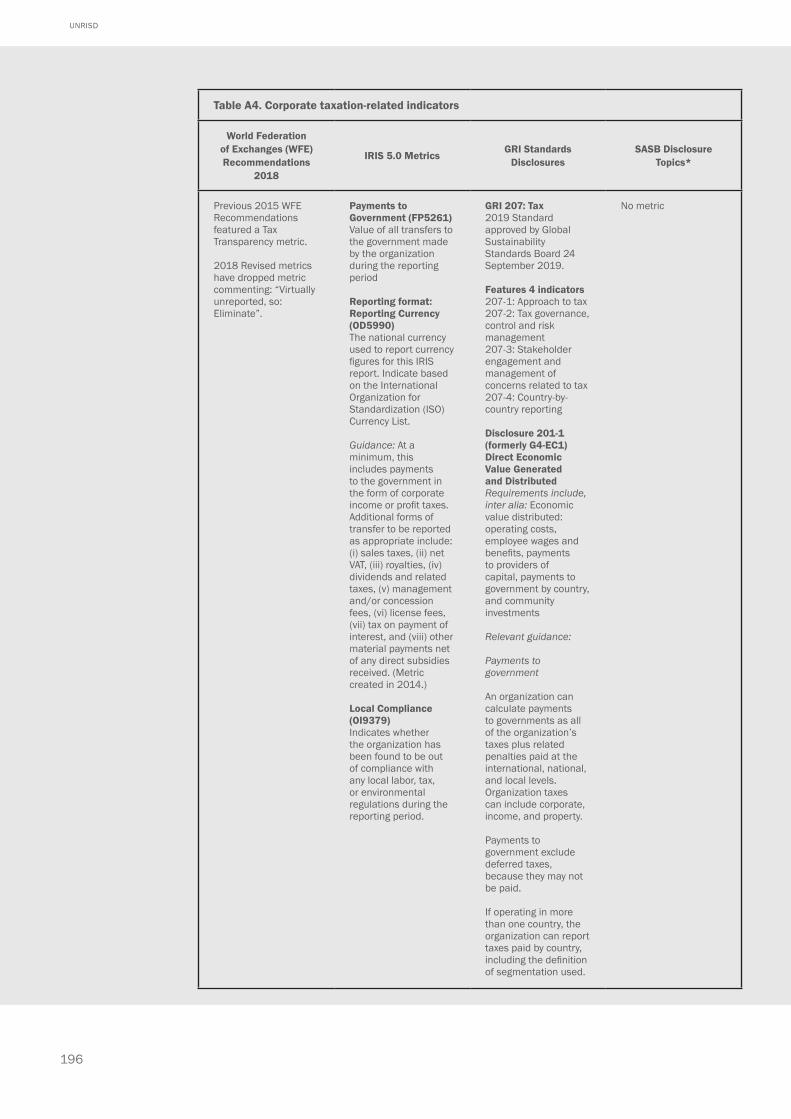
196
UNRISD
Table A4. Corporate taxation-related indicators
World Federation of Exchanges (WFE) Recommendations
2018
IRIS 5.0 Metrics GRI Standards Disclosures
SASB Disclosure Topics*
Previous 2015 WFE Recommendations featured a Tax Transparency metric.
2018 Revised metrics have dropped metric commenting: “Virtually unreported, so: Eliminate”.
Payments to Government (FP5261)Value of all transfers to the government made by the organization during the reporting period
Reporting format: Reporting Currency (OD5990)The national currency used to report currency figures for this IRIS report. Indicate based on the International Organization for Standardization (ISO) Currency List.
Guidance: At a minimum, this includes payments to the government in the form of corporate income or profit taxes. Additional forms of transfer to be reported as appropriate include: (i) sales taxes, (ii) net VAT, (iii) royalties, (iv) dividends and related taxes, (v) management and/or concession fees, (vi) license fees, (vii) tax on payment of interest, and (viii) other material payments net of any direct subsidies received. (Metric created in 2014.)
Local Compliance (OI9379)Indicates whether the organization has been found to be out of compliance with any local labor, tax, or environmental regulations during the reporting period.
GRI 207: Tax2019 Standard approved by Global Sustainability Standards Board 24 September 2019.
Features 4 indicators207-1: Approach to tax 207-2: Tax governance, control and risk management207-3: Stakeholder engagement and management of concerns related to tax207-4: Country-by-country reporting
Disclosure 201-1 (formerly G4-EC1) Direct Economic Value Generated and DistributedRequirements include, inter alia: Economic value distributed: operating costs, employee wages and benefits, payments to providers of capital, payments to government by country, and community investments
Relevant guidance:
Payments to government
An organization can calculate payments to governments as all of the organization’s taxes plus related penalties paid at the international, national, and local levels. Organization taxes can include corporate, income, and property.
Payments to government exclude deferred taxes, because they may not be paid.
If operating in more than one country, the organization can report taxes paid by country, including the definition of segmentation used.
No metric
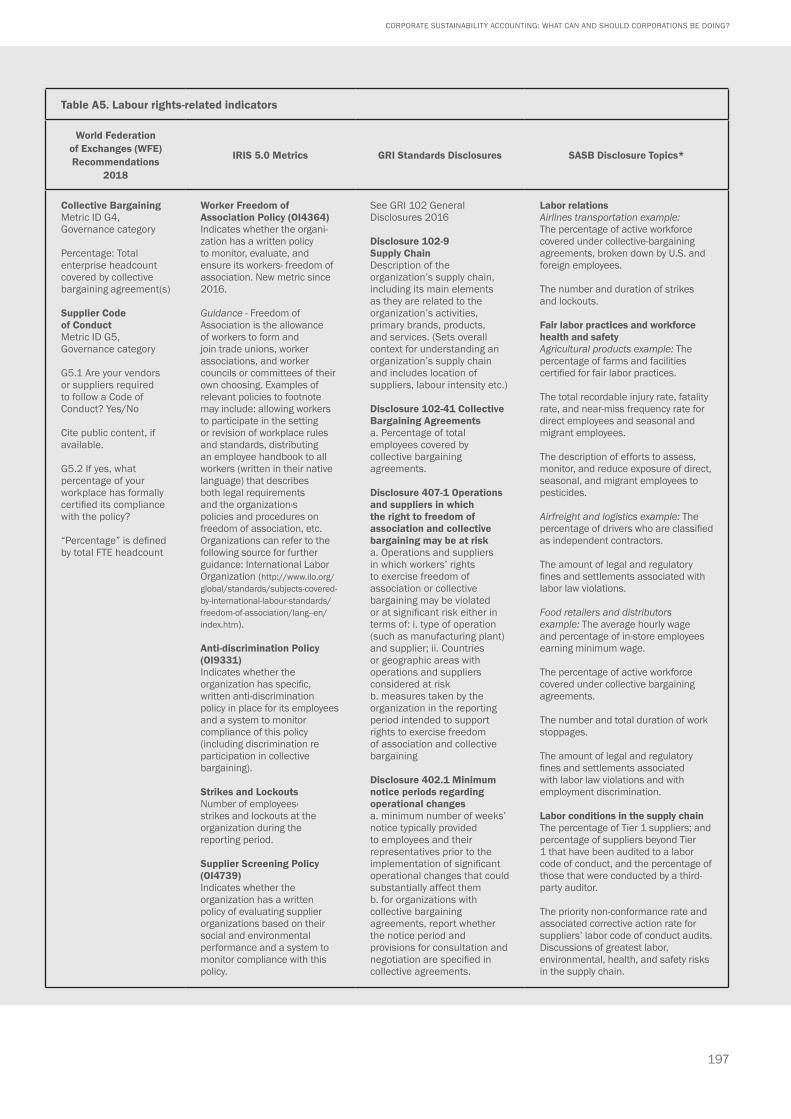
197
CORPORATE SUSTAINABILITY ACCOUNTING: WHAT CAN AND SHOULD CORPORATIONS BE DOING?
Table A5. Labour rights-related indicators
World Federation of Exchanges (WFE) Recommendations
2018
IRIS 5.0 Metrics GRI Standards Disclosures SASB Disclosure Topics*
Collective Bargaining Metric ID G4, Governance category
Percentage: Total enterprise headcount covered by collective bargaining agreement(s)
Supplier Code of ConductMetric ID G5, Governance category
G5.1 Are your vendors or suppliers required to follow a Code of Conduct? Yes/No
Cite public content, if available.
G5.2 If yes, what percentage of your workplace has formally certified its compliance with the policy?
“Percentage” is defined by total FTE headcount
Worker Freedom of Association Policy (OI4364)Indicates whether the organi-zation has a written policy to monitor, evaluate, and ensure its workers› freedom of association. New metric since 2016.
Guidance - Freedom of Association is the allowance of workers to form and join trade unions, worker associations, and worker councils or committees of their own choosing. Examples of relevant policies to footnote may include: allowing workers to participate in the setting or revision of workplace rules and standards, distributing an employee handbook to all workers (written in their native language) that describes both legal requirements and the organization›s policies and procedures on freedom of association, etc. Organizations can refer to the following source for further guidance: International Labor Organization (http://www.ilo.org/global/standards/subjects-covered-by-international-labour-standards/freedom-of-association/lang--en/index.htm).
Anti-discrimination Policy (OI9331)Indicates whether the organization has specific, written anti-discrimination policy in place for its employees and a system to monitor compliance of this policy (including discrimination re participation in collective bargaining).
Strikes and LockoutsNumber of employees› strikes and lockouts at the organization during the reporting period.
Supplier Screening Policy (OI4739)Indicates whether the organization has a written policy of evaluating supplier organizations based on their social and environmental performance and a system to monitor compliance with this policy.
See GRI 102 General Disclosures 2016 Disclosure 102-9 Supply ChainDescription of the organization’s supply chain, including its main elements as they are related to the organization’s activities, primary brands, products, and services. (Sets overall context for understanding an organization’s supply chain and includes location of suppliers, labour intensity etc.)
Disclosure 102-41 Collective Bargaining Agreements a. Percentage of total employees covered by collective bargaining agreements.
Disclosure 407-1 Operations and suppliers in which the right to freedom of association and collective bargaining may be at riska. Operations and suppliers in which workers’ rights to exercise freedom of association or collective bargaining may be violated or at significant risk either in terms of: i. type of operation (such as manufacturing plant) and supplier; ii. Countries or geographic areas with operations and suppliers considered at riskb. measures taken by the organization in the reporting period intended to support rights to exercise freedom of association and collective bargaining
Disclosure 402.1 Minimum notice periods regarding operational changesa. minimum number of weeks’ notice typically provided to employees and their representatives prior to the implementation of significant operational changes that could substantially affect themb. for organizations with collective bargaining agreements, report whether the notice period and provisions for consultation and negotiation are specified in collective agreements.
Labor relationsAirlines transportation example: The percentage of active workforce covered under collective-bargaining agreements, broken down by U.S. and foreign employees.
The number and duration of strikes and lockouts.
Fair labor practices and workforce health and safetyAgricultural products example: The percentage of farms and facilities certified for fair labor practices.
The total recordable injury rate, fatality rate, and near-miss frequency rate for direct employees and seasonal and migrant employees.
The description of efforts to assess, monitor, and reduce exposure of direct, seasonal, and migrant employees to pesticides.
Airfreight and logistics example: The percentage of drivers who are classified as independent contractors.
The amount of legal and regulatory fines and settlements associated with labor law violations.
Food retailers and distributors example: The average hourly wage and percentage of in-store employees earning minimum wage.
The percentage of active workforce covered under collective bargaining agreements.
The number and total duration of work stoppages.
The amount of legal and regulatory fines and settlements associated with labor law violations and with employment discrimination.
Labor conditions in the supply chainThe percentage of Tier 1 suppliers; and percentage of suppliers beyond Tier 1 that have been audited to a labor code of conduct, and the percentage of those that were conducted by a third-party auditor.
The priority non-conformance rate and associated corrective action rate for suppliers’ labor code of conduct audits.Discussions of greatest labor, environmental, health, and safety risks in the supply chain.
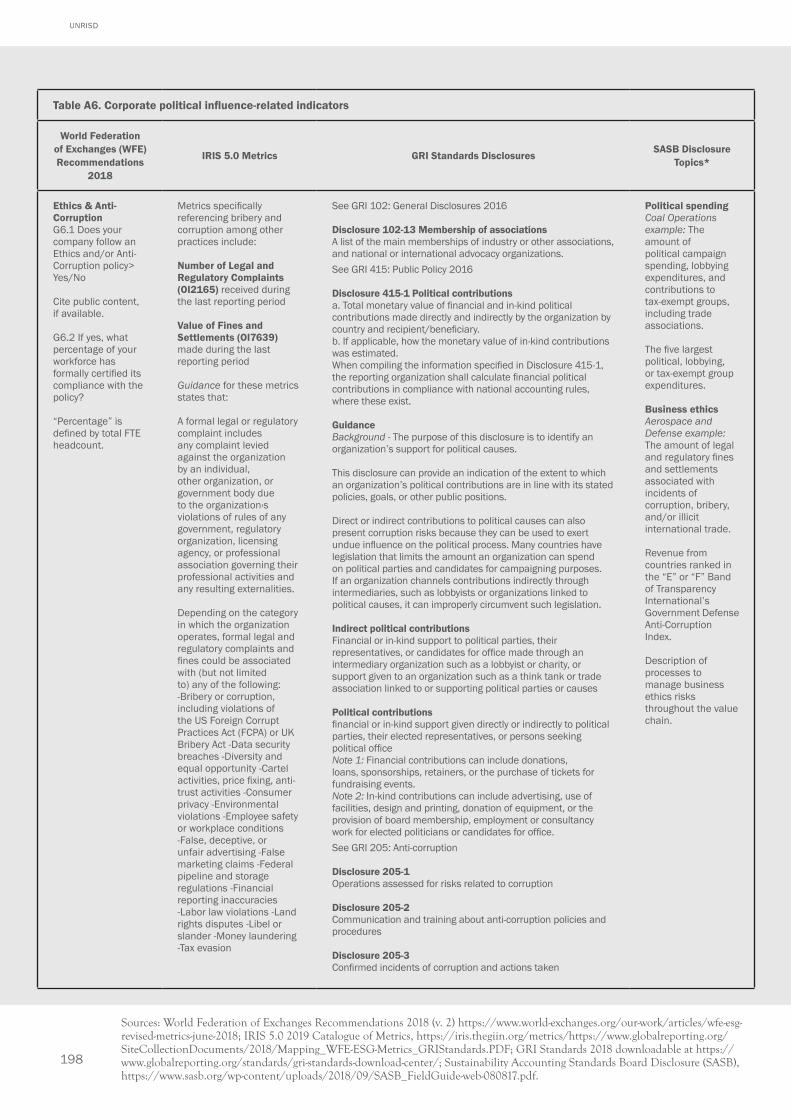
198
UNRISD
Table A6. Corporate political influence-related indicators
World Federation of Exchanges (WFE) Recommendations
2018
IRIS 5.0 Metrics GRI Standards Disclosures SASB Disclosure Topics*
Ethics & Anti-CorruptionG6.1 Does your company follow an Ethics and/or Anti-Corruption policy> Yes/No
Cite public content, if available.
G6.2 If yes, what percentage of your workforce has formally certified its compliance with the policy?
“Percentage” is defined by total FTE headcount.
Metrics specifically referencing bribery and corruption among other practices include:
Number of Legal and Regulatory Complaints (OI2165) received during the last reporting period
Value of Fines and Settlements (OI7639) made during the last reporting period
Guidance for these metrics states that:
A formal legal or regulatory complaint includes any complaint levied against the organization by an individual, other organization, or government body due to the organization›s violations of rules of any government, regulatory organization, licensing agency, or professional association governing their professional activities and any resulting externalities.
Depending on the category in which the organization operates, formal legal and regulatory complaints and fines could be associated with (but not limited to) any of the following: -Bribery or corruption, including violations of the US Foreign Corrupt Practices Act (FCPA) or UK Bribery Act -Data security breaches -Diversity and equal opportunity -Cartel activities, price fixing, anti-trust activities -Consumer privacy -Environmental violations -Employee safety or workplace conditions -False, deceptive, or unfair advertising -False marketing claims -Federal pipeline and storage regulations -Financial reporting inaccuracies -Labor law violations -Land rights disputes -Libel or slander -Money laundering -Tax evasion
See GRI 102: General Disclosures 2016
Disclosure 102-13 Membership of associationsA list of the main memberships of industry or other associations, and national or international advocacy organizations.See GRI 415: Public Policy 2016
Disclosure 415-1 Political contributionsa. Total monetary value of financial and in-kind political contributions made directly and indirectly by the organization by country and recipient/beneficiary.b. If applicable, how the monetary value of in-kind contributions was estimated.When compiling the information specified in Disclosure 415-1, the reporting organization shall calculate financial political contributions in compliance with national accounting rules, where these exist.
Guidance Background - The purpose of this disclosure is to identify an organization’s support for political causes.
This disclosure can provide an indication of the extent to which an organization’s political contributions are in line with its stated policies, goals, or other public positions.
Direct or indirect contributions to political causes can also present corruption risks because they can be used to exert undue influence on the political process. Many countries have legislation that limits the amount an organization can spend on political parties and candidates for campaigning purposes. If an organization channels contributions indirectly through intermediaries, such as lobbyists or organizations linked to political causes, it can improperly circumvent such legislation.
Indirect political contributionsFinancial or in-kind support to political parties, their representatives, or candidates for office made through an intermediary organization such as a lobbyist or charity, or support given to an organization such as a think tank or trade association linked to or supporting political parties or causes
Political contributions financial or in-kind support given directly or indirectly to political parties, their elected representatives, or persons seeking political office Note 1: Financial contributions can include donations, loans, sponsorships, retainers, or the purchase of tickets for fundraising events. Note 2: In-kind contributions can include advertising, use of facilities, design and printing, donation of equipment, or the provision of board membership, employment or consultancy work for elected politicians or candidates for office. See GRI 205: Anti-corruption
Disclosure 205-1Operations assessed for risks related to corruption
Disclosure 205-2Communication and training about anti-corruption policies and procedures
Disclosure 205-3Confirmed incidents of corruption and actions taken
Political spendingCoal Operations example: The amount of political campaign spending, lobbying expenditures, and contributions to tax-exempt groups, including trade associations.
The five largest political, lobbying, or tax-exempt group expenditures.
Business ethicsAerospace and Defense example:The amount of legaland regulatory fines and settlements associated with incidents of corruption, bribery, and/or illicit international trade.
Revenue from countries ranked in the “E” or “F” Band of Transparency International’s Government Defense Anti-Corruption Index.
Description of processes to manage business ethics risks throughout the value chain.
Sources: World Federation of Exchanges Recommendations 2018 (v. 2) https://www.world-exchanges.org/our-work/articles/wfe-esg-revised-metrics-june-2018; IRIS 5.0 2019 Catalogue of Metrics, https://iris.thegiin.org/metrics/https://www.globalreporting.org/SiteCollectionDocuments/2018/Mapping_WFE-ESG-Metrics_GRIStandards.PDF; GRI Standards 2018 downloadable at https://www.globalreporting.org/standards/gri-standards-download-center/; Sustainability Accounting Standards Board Disclosure (SASB), https://www.sasb.org/wp-content/uploads/2018/09/SASB_FieldGuide-web-080817.pdf.
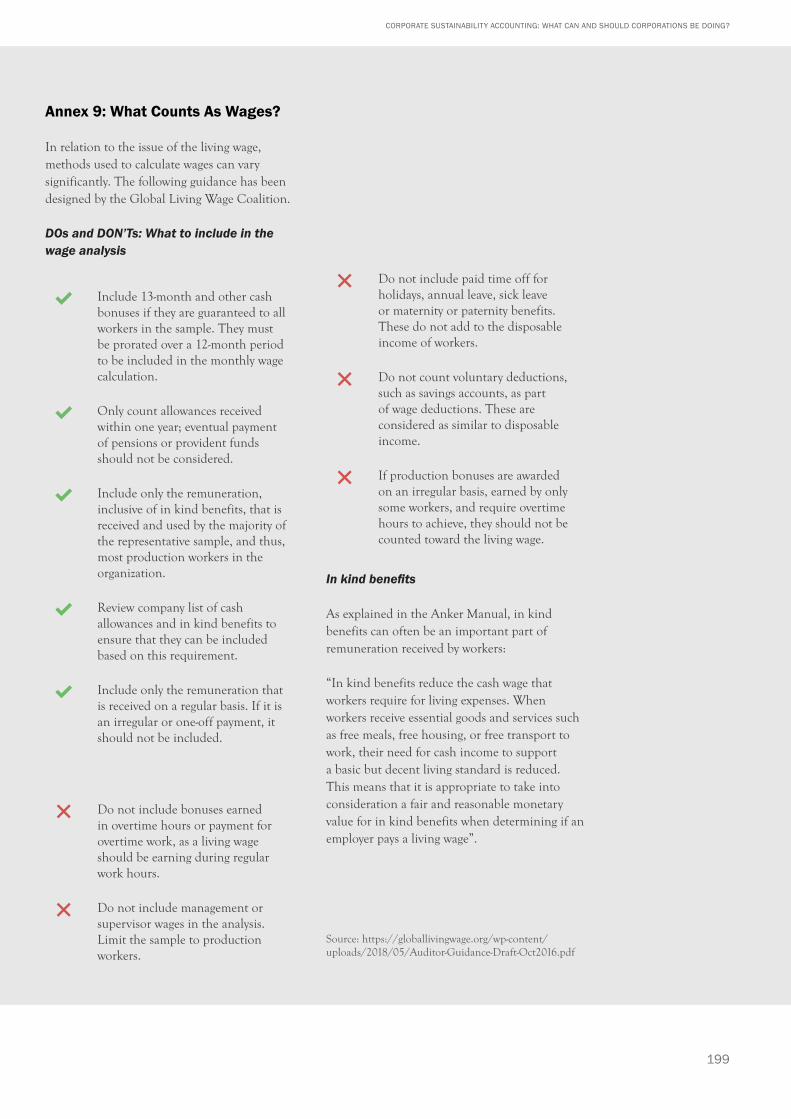
199
CORPORATE SUSTAINABILITY ACCOUNTING: WHAT CAN AND SHOULD CORPORATIONS BE DOING?
Annex 9: What Counts As Wages?
In relation to the issue of the living wage, methods used to calculate wages can vary significantly. The following guidance has been designed by the Global Living Wage Coalition.
DOs and DON’Ts: What to include in the wage analysis
✔️Include 13-month and other cash bonuses if they are guaranteed to all workers in the sample. They must be prorated over a 12-month period to be included in the monthly wage calculation.
✔ Only count allowances received within one year; eventual payment of pensions or provident funds should not be considered.
✔ Include only the remuneration, inclusive of in kind benefits, that is received and used by the majority of the representative sample, and thus, most production workers in the organization.
✔ Review company list of cash allowances and in kind benefits to ensure that they can be included based on this requirement.
✔ Include only the remuneration that is received on a regular basis. If it is an irregular or one-off payment, it should not be included.
❌ Do not include bonuses earned in overtime hours or payment for overtime work, as a living wage should be earning during regular work hours.
❌ Do not include management or supervisor wages in the analysis. Limit the sample to production workers.
❌ Do not include paid time off for holidays, annual leave, sick leave or maternity or paternity benefits. These do not add to the disposable income of workers.
❌ Do not count voluntary deductions, such as savings accounts, as part of wage deductions. These are considered as similar to disposable income.
❌ If production bonuses are awarded on an irregular basis, earned by only some workers, and require overtime hours to achieve, they should not be counted toward the living wage.
In kind benefits
As explained in the Anker Manual, in kind benefits can often be an important part of remuneration received by workers:
“In kind benefits reduce the cash wage that workers require for living expenses. When workers receive essential goods and services such as free meals, free housing, or free transport to work, their need for cash income to support a basic but decent living standard is reduced. This means that it is appropriate to take into consideration a fair and reasonable monetary value for in kind benefits when determining if an employer pays a living wage”.
Source: https://globallivingwage.org/wp-content/uploads/2018/05/Auditor-Guidance-Draft-Oct2016.pdf
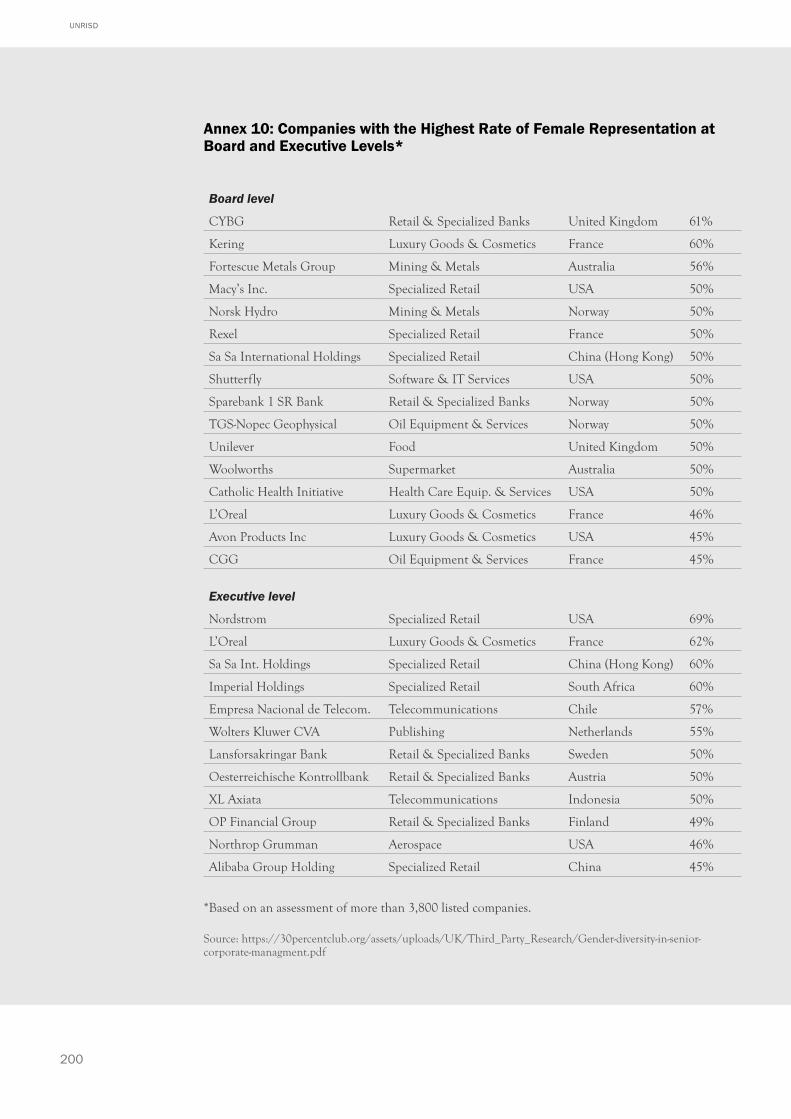
200
UNRISD
Annex 10: Companies with the Highest Rate of Female Representation at Board and Executive Levels*
Board level
CYBG Retail & Specialized Banks United Kingdom 61%
Kering Luxury Goods & Cosmetics France 60%
Fortescue Metals Group Mining & Metals Australia 56%
Macy’s Inc. Specialized Retail USA 50%
Norsk Hydro Mining & Metals Norway 50%
Rexel Specialized Retail France 50%
Sa Sa International Holdings Specialized Retail China (Hong Kong) 50%
Shutterfly Software & IT Services USA 50%
Sparebank 1 SR Bank Retail & Specialized Banks Norway 50%
TGS-Nopec Geophysical Oil Equipment & Services Norway 50%
Unilever Food United Kingdom 50%
Woolworths Supermarket Australia 50%
Catholic Health Initiative Health Care Equip. & Services USA 50%
L’Oreal Luxury Goods & Cosmetics France 46%
Avon Products Inc Luxury Goods & Cosmetics USA 45%
CGG Oil Equipment & Services France 45%
Executive level
Nordstrom Specialized Retail USA 69%
L’Oreal Luxury Goods & Cosmetics France 62%
Sa Sa Int. Holdings Specialized Retail China (Hong Kong) 60%
Imperial Holdings Specialized Retail South Africa 60%
Empresa Nacional de Telecom. Telecommunications Chile 57%
Wolters Kluwer CVA Publishing Netherlands 55%
Lansforsakringar Bank Retail & Specialized Banks Sweden 50%
Oesterreichische Kontrollbank Retail & Specialized Banks Austria 50%
XL Axiata Telecommunications Indonesia 50%
OP Financial Group Retail & Specialized Banks Finland 49%
Northrop Grumman Aerospace USA 46%
Alibaba Group Holding Specialized Retail China 45%
*Based on an assessment of more than 3,800 listed companies.
Source: https://30percentclub.org/assets/uploads/UK/Third_Party_Research/Gender-diversity-in-senior-corporate-managment.pdf

201
CORPORATE SUSTAINABILITY ACCOUNTING: WHAT CAN AND SHOULD CORPORATIONS BE DOING?
Annex 11: Sustainability Accounting Terminology
Several recent cutting-edge innovations discussed in Chapter 3, as well as work conducted for the UNRISD SDPI project, have served to define more precisely and clarify the understanding and relevance of various terms used in the field of sustainability reporting. These include the following.
Sustainable development is defined as “development that meets the needs of the present without compromising the ability of future generations to meet their own needs” (Brundtland Commission 1987). The concept conveys three key ideas that are relevant for organizations:
• Development should not be defined narrowly in economic terms; at its core are objectives related to human well-being and planetary health.
• This broader understanding implies that an organization should pursue an integrated approach that addresses simultaneously these different objectives.
• An organization should be guided not only by short-term but also long-term goals aimed at ensuring the future health and longevity of the organization itself and the well-being of the resource base on which both current and future generations depend.
Sustainability reporting is the practice of publicly disclosing data related to an organization’s performance that impacts sustainable development. Data that matter relate not only to economic and financial dimensions but also environmental, social and governance (ESG) aspects. Sustainability reporting serves the dual purpose of minimizing risks and identifying opportunities both for the organization concerned and for its stakeholders. Large organizations often produce “Sustainability” or “Integrated” Reports, following standards and guidelines produced by standard-setting and ratings organizations.
Integrated reporting not only combines data related to both financial and non-financial aspects of performance but also understands the process of value preservation and creation in terms of the growth in the stocks and flows of different sets of vital assets or types of capital. These include financial, manufactured, human, social (including relationships), intellectual and natural capital. Value creation may also involve maintaining these assets at levels sufficient to ensure and sustain well-being. Integrated reporting aims to measure changes in these resources and also consider their interdependent nature.
Sustainability performance is a measure of the performance of an organization expressed in terms of what its impacts on vital capitals are relative to thresholds or “sustainability norms”. Such norms suggest a level at which an asset and its allocation can be considered sustainable, fair and conducive to the well-being of stakeholders. Gathering the necessary data and calculating how actual performance compares with sustainability norms is the task of sustainability accounting.
Stakeholders generally refers to those groups or individuals who can affect the ability of an organization to achieve its objectives, or who are affected by its activities (Freeman 1984). From the perspective of a company, a stakeholder is anyone to whom that company owes a duty or obligation to manage its impacts – both direct and indirect – on vital capitals in ways that can affect their well-being.
Impact valuation is a method used to quantify or calculate the value of the magnitude of an impact, whether positive or negative, on the stocks and flows of vital capitals. Impact valuation indicators are incrementalist in the sense that they are used to assess the size and marginal change, if any, from, say, one year to the next. Such changes are often expressed in terms of their relationships with other variables, as in the case of the measurement of resource intensity – for example, greenhouse gas emissions per unit of revenue or per unit of production.
Source: Baue 2020, McElroy 2019, UNRISD forthcoming.
202
UNRISD
The United Nations Research Institute for Social Development (UNRISD) is an autonomous United Nations institute that undertakes interdisciplinary research and policy analysis on the social dimensions of contemporary development issues. Through our work, we aim to ensure that social equity, inclusion and justice are central to development thinking, policy and practice.
UNRISD depends entirely on voluntary contributions from national governments, multilateral donors, foundations and other sources, and receives no financial support from the regular budget of the United Nations. We gratefully acknowledge the institutional support received from our funding partners at the Swedish International Development Cooperation Agency (Sida), the Swiss Agency for Development and Cooperation (SDC), the Swiss Federal Department of Foreign Affairs, and the Finnish Ministry of Social Affairs and Health.
UNRISDPalais des Nations, 1211 Geneva 10, [email protected] to the UNRISD eBulletin: www.unrisd.org/myunrisd


Today’s global crises—financial, climate and health—as well as the Sustainable Development Goals have raised the bar in terms of expectations regarding corporate sustainability performance. They have also highlighted the need for sustainability policy and practices that address not only the symptoms of unsustainable development, but also the underlying causes associated with structural conditions that reproduce inequality, vulnerability and planetary degradation.
How, then, might corporate sustainability disclosure and reporting be repurposed to achieve these ends and, in so doing, measure and promote progress from the perspective of the transformational vision of the SDGs?
Part 1 of the report assesses the current state of play, tracking the impressive expansion and ratcheting up of sustainability indicators over three decades. But it also identifies ongoing major weaknesses: the failure of disclosure and reporting to conform to basic accounting principles, as well as the neglect of a number of issue areas and indicators that are absolutely key for assessing progress towards sustainable development.
Part 2 delves into the specifics of disclosure from the perspective of transformative change, focusing on five key performance issues—fair remuneration, gender equality, corporate taxation, labour rights, and corporate political influence—and unpacking the approaches, quantitative indicators and normative targets that need to be adopted if corporate sustainability performance and disclosure is to contribute in any meaningful way to a sustainable future.
Corporate Sustainability AccountingWHAT CAN AND SHOULD CORPORATIONS BE DOING?