financial performance analysis of kalbe farma tbk ... - SEAJBEL
11
South East Asia Journal of Contemporary Business, Economics and Law, Vol. 23, Issue 1 (Dec) ISSN 2289-1560 2020 215 FINANCIAL PERFORMANCE ANALYSIS OF KALBE FARMA TBK BEFORE AND AFTER PRESIDENTIAL INSTRUCTION NO. 6/2016 ON ACCELERATION OF DEVELOPMENT OF THE PHARMACEUTICAL AND MEDICAL DEVICE INDUSTRY Wiwiek Mardawiyah Daryanto Taufiqurrohman Novia Hestiningrum ABSTRACT Kalbe Farma Tbk, one of the representatives of pharmaceutical companies in Indonesia, was reported to have slowed business growth, reaching 14.7% in the 2015-2016 period. Meanwhile, in general, Indonesia's Pharmaceutical MNCs' profit has reportedly decreased since 2016. It is also has been reported that the pharmaceutical industry is difficult to develop in Indonesia because there is no government support in this industry. To overcome this case, the government issued an economic policy package in the form of Presidential Instruction No. 6/2016 on Acceleration of Development of the Pharmaceutical and Medical Device Industry. The purpose of this study is to see if there is an effect of this government policy on the performance of the pharmaceutical industry by measuring the financial performance of the pharmaceutical industry, in this case, Kalbe Farma Tbk and will analyze the significant differences before and after the presidential instruction issuance. The data was retrieved from the annual financial report, and the period was divided into two periods, before (2014-2016) and after the presidential instruction's issuance (2017- 2019). The data analysis technique was done using financial ratio analysis, and a statistical t-test was applied to check the hypothesis based on the 11 financial ratios. The study results show that 3 of the 11 financial ratios analyzed are significantly different: ROI, ROE, and Total Asset Turn Over. Judging from the serious obstacles to the national pharmaceutical industry's development, the issuance of the Presidential Instruction is not sufficient to be a solution. It should be followed by other policy support. The government must play more roles, among others, by compiling a road map for the pharmaceutical industry, making priorities, trading systems, and attractive incentive packages to strengthen pharmaceutical industry players who have been running limp. This study will also help managers in the pharmaceutical industry give insights when making decisions. Key words: Financial Performances, Kalbe Farma, Pharmaceutical Industry, Indonesia INTRODUCTION Indonesia is the fourth most populous country in the world, with around 250 million people. The Indonesian national population and family planning agencies, known as BKKBN (Badan Kependudukan dan Keluarga Berencana Nasional), estimates that Indonesia's population will reach 321 million by 2025. This condition is one of the triggers for the high need for health services, including drugs, pharmaceutical preparations, and medical devices in the future. The availability of drugs and medical devices is one of the instruments to improve the health of the Indonesian population, which, in the long run, affects the quality of Indonesia's human resources. In 2014, the Indonesian government implemented the Indonesian national health insurance program for its citizens. This program is predicted to increase the level of public health and positively impact the development of the pharmaceutical industry business since there will be an increasing need for medications. However, The Indonesian pharmaceutical market in 2014 in absolute terms decreased from the previous years, although in value, it increased by Rp. 58 trillion from the previous year of Rp. 55 trillion. The national pharmaceutical market grows by an average of 11.23% per year, as seen from the Compound Annual Growth Rate (CAGR) during 2010-2014. Domestic companies (11.30%) is currently higher than MNCs (11.03%). (Ministry of Health Decree No. 17/2017). There are not yet studies that have looked at the Presidential Instruction's effectiveness in developing the pharmaceutical industry in Indonesia, while this policy is very strategic. The existence of this related research will bring great benefits in the evaluation and subsequent government policymaking. Therefore, this study will see the effectiveness of the issuance of Presidential Instruction No. 6/2016 on the improvement of the pharmaceutical industry by measuring the financial performance of pharmaceutical companies using financial ratio analysis and assessing differences in performance before and after the presidential instruction issuance. This study is also expected to provide an insight into the pharmaceutical industry in decision-making and the government in analyzing related policies. This study uses Kalbe Farma Tbk as the study subject, as it is one of the state-own enterprises and the largest pharmaceutical companies in Indonesia. Based on the 2019 financial report, the issuer coded KLBF shares experienced a net profit growth of 2.02% on an annual basis. In the previous year, the company's profit reached IDR 2.45 trillion. This profit growth is in line with the growth in the company's core operational performance in 2019. This can be seen from the revenue growth of 7.4 percent on an annual basis to IDR 22.63 trillion. This is in line with the quite high increase in the cost of goods, namely 10.37%. The company's cost of goods sold at the end of last year was recorded at IDR 12.39 trillion, while at the end of 2018, it was IDR 11.22 trillion. Although the percentage growth in the cost of goods was recorded higher than revenue, its gross profit still increased by around 4.2 percent, to Rp10.24 trillion. (Sudarwan, 2020)
-
Upload
khangminh22 -
Category
Documents
-
view
1 -
download
0
Transcript of financial performance analysis of kalbe farma tbk ... - SEAJBEL
South East Asia Journal of Contemporary Business, Economics and Law, Vol. 23, Issue 1 (Dec)
ISSN 2289-1560 2020
215
FINANCIAL PERFORMANCE ANALYSIS OF KALBE FARMA TBK BEFORE AND AFTER
PRESIDENTIAL INSTRUCTION NO. 6/2016 ON ACCELERATION OF DEVELOPMENT OF
THE PHARMACEUTICAL AND MEDICAL DEVICE INDUSTRY
Wiwiek Mardawiyah Daryanto
Taufiqurrohman
Novia Hestiningrum
ABSTRACT
Kalbe Farma Tbk, one of the representatives of pharmaceutical companies in Indonesia, was reported to have slowed business
growth, reaching 14.7% in the 2015-2016 period. Meanwhile, in general, Indonesia's Pharmaceutical MNCs' profit has reportedly
decreased since 2016. It is also has been reported that the pharmaceutical industry is difficult to develop in Indonesia because
there is no government support in this industry. To overcome this case, the government issued an economic policy package in the
form of Presidential Instruction No. 6/2016 on Acceleration of Development of the Pharmaceutical and Medical Device Industry.
The purpose of this study is to see if there is an effect of this government policy on the performance of the pharmaceutical industry
by measuring the financial performance of the pharmaceutical industry, in this case, Kalbe Farma Tbk and will analyze the
significant differences before and after the presidential instruction issuance. The data was retrieved from the annual financial
report, and the period was divided into two periods, before (2014-2016) and after the presidential instruction's issuance (2017-
2019). The data analysis technique was done using financial ratio analysis, and a statistical t-test was applied to check the
hypothesis based on the 11 financial ratios. The study results show that 3 of the 11 financial ratios analyzed are significantly
different: ROI, ROE, and Total Asset Turn Over. Judging from the serious obstacles to the national pharmaceutical industry's
development, the issuance of the Presidential Instruction is not sufficient to be a solution. It should be followed by other policy
support. The government must play more roles, among others, by compiling a road map for the pharmaceutical industry, making
priorities, trading systems, and attractive incentive packages to strengthen pharmaceutical industry players who have been running
limp. This study will also help managers in the pharmaceutical industry give insights when making decisions.
Key words: Financial Performances, Kalbe Farma, Pharmaceutical Industry, Indonesia
INTRODUCTION
Indonesia is the fourth most populous country in the world, with around 250 million people. The Indonesian national population
and family planning agencies, known as BKKBN (Badan Kependudukan dan Keluarga Berencana Nasional), estimates that
Indonesia's population will reach 321 million by 2025. This condition is one of the triggers for the high need for health services,
including drugs, pharmaceutical preparations, and medical devices in the future. The availability of drugs and medical devices is
one of the instruments to improve the health of the Indonesian population, which, in the long run, affects the quality of Indonesia's
human resources. In 2014, the Indonesian government implemented the Indonesian national health insurance program for its
citizens. This program is predicted to increase the level of public health and positively impact the development of the
pharmaceutical industry business since there will be an increasing need for medications. However, The Indonesian pharmaceutical
market in 2014 in absolute terms decreased from the previous years, although in value, it increased by Rp. 58 trillion from the
previous year of Rp. 55 trillion. The national pharmaceutical market grows by an average of 11.23% per year, as seen from the
Compound Annual Growth Rate (CAGR) during 2010-2014. Domestic companies (11.30%) is currently higher than MNCs
(11.03%). (Ministry of Health Decree No. 17/2017).
There are not yet studies that have looked at the Presidential Instruction's effectiveness in developing the pharmaceutical industry
in Indonesia, while this policy is very strategic. The existence of this related research will bring great benefits in the evaluation
and subsequent government policymaking. Therefore, this study will see the effectiveness of the issuance of Presidential Instruction
No. 6/2016 on the improvement of the pharmaceutical industry by measuring the financial performance of pharmaceutical
companies using financial ratio analysis and assessing differences in performance before and after the presidential instruction
issuance. This study is also expected to provide an insight into the pharmaceutical industry in decision-making and the government
in analyzing related policies.
This study uses Kalbe Farma Tbk as the study subject, as it is one of the state-own enterprises and the largest pharmaceutical
companies in Indonesia. Based on the 2019 financial report, the issuer coded KLBF shares experienced a net profit growth of
2.02% on an annual basis. In the previous year, the company's profit reached IDR 2.45 trillion. This profit growth is in line with
the growth in the company's core operational performance in 2019. This can be seen from the revenue growth of 7.4 percent on an
annual basis to IDR 22.63 trillion. This is in line with the quite high increase in the cost of goods, namely 10.37%. The company's
cost of goods sold at the end of last year was recorded at IDR 12.39 trillion, while at the end of 2018, it was IDR 11.22 trillion.
Although the percentage growth in the cost of goods was recorded higher than revenue, its gross profit still increased by around
4.2 percent, to Rp10.24 trillion. (Sudarwan, 2020)
South East Asia Journal of Contemporary Business, Economics and Law, Vol. 23, Issue 1 (Dec)
ISSN 2289-1560 2020
216
On the other hand, the company also experienced several increases in expenses. One of them is the financial burden, which rose
35.92 percent to IDR 40.42 billion. In addition, research and development expenses increased from 17.67 percent to IDR286.65
billion. The company also recorded a loss on foreign exchange of IDR 13.63 billion. In the previous year, the company recorded a
profit difference of IDR10.58 billion. Besides, there were actuarial losses of 34.21 billion. (Sudarwan, 2020)
The company recorded total assets of IDR 20.26 trillion last year, increasing about 11.67 percent. Meanwhile, liabilities and equity
were recorded at IDR 3.55 trillion (up 24.18 percent) and IDR 16.70 trillion (up 9.23 percent). Although the assets increased, the
company's cash position decreased by around 4.96 percent to IDR 2.99 trillion. The cause of a decrease in cash position is an
increase in cash outflows for financing activities and a decrease in net cash generated from operations. (Sudarwan, 2020)
This study is organized into six sections. The first section covers the introduction, followed by literature review in section two.
The third section examined the methodology, followed by results and discussion in section four. Limitations are discussed in
section five, and finally, the conclusion and recommendation in section six.
LITERATURE REVIEW
A. Presidential Instruction No. 6/2016
On 8 June 2016, President Joko Widodo issued Presidential Instruction No. 6 of 2016 concerning the Acceleration of Development
of the Pharmaceutical and Medical Device Industry. The issuance of this presidential instruction is the government's effort to
achieve independence and increase the acceleration of the development of the domestic pharmaceutical and medical device
industry. In the presidential instruction, 12 ministries/agencies were instructed to take steps according to their respective duties,
functions, and authorities to support the pharmaceutical and medical device industry's acceleration and development. The steps
taken must be able to fulfill the purposes and objectives as follows:
1. Guarantee the availability of pharmaceutical preparations and medical devices as an effort to improve health services within
the framework of the National Health Insurance
2. Increase the competitiveness of the domestic and export pharmaceutical and medical devices industry
3. Encouraging mastery of technology and innovation in the field of pharmaceuticals and medical devices, and
4. Accelerate self-sufficiency and development of raw material production for drugs, medicines, and medical devices to meet
domestic and export demands as well as to restore and increase industrial activities/utilization of industrial capacity.
Policies related to the pharmaceutical industry are policies that need to involve multi-sector so that it implicates several
ministries/institutions, namely:
- The Coordinating Ministry for the Economy,
- The Coordinating Ministry for Human and Cultural Development,
- The Ministry of Health,
- The Ministry of Finance,
- The Ministry of Research, Technology, and Higher Education,
- The Ministry of Industry,
- The Ministry of Trade,
- The Ministry of Agriculture,
- The Ministry of State-Owned Enterprises,
- The Indonesian Investment Coordinating Board,
- The Indonesian FDA, and
- Government Goods/Services Procurement Policy Agency.
After four years since its issuance, the Presidential Instruction has not brought fresh air to the world of national pharmaceuticals.
State-Owned Enterprises (BUMN) Minister Erick Thohir said that 90 percent of medicinal raw materials (BBO) are currently
imported. China is the main supplier that meets 70% of our needs, followed by India (20%), and the rest the United States and
Europe. The order in Presidential Instruction 6/2016 does not address fundamental industrial problems. In practice, our drug
industry is still locked in five strategic issues, which Michael Porter calls the Five Forces. Porter, professor of business strategy at
Harvard Business School, outlines the five problems, namely barriers to newcomers, bargaining power of suppliers, bargaining
power of buyers, threats of substitution, and competition from competitors. (Zainal Abidin, 2020)
B. Previous Research using Financial Performance Analysis
There have been many studies on financial performance using financial ratio analysis in various types of industries around the
world, from the SMEs (Voulgaris, Doumpos & Zopounidis, 2000), Hospitality (Kim & Ayoun, 2005), Private Commercial Banks
(Al Karim & Alam, 2013), Club Industry (Schmidgall & DeFranco, 2013), to Education Subsector (Tugas & del Rosario, 2012).
Kazan & Ozdemir (2014) analyze the fourteen large-scale conglomerates' performance, which is traded on the Istanbul Stock
Exchange (ISE) using CRITIC and TOPSIS method; each method was calculated nineteen financial ratios from all fourteen
South East Asia Journal of Contemporary Business, Economics and Law, Vol. 23, Issue 1 (Dec)
ISSN 2289-1560 2020
217
conglomerates during 2009-2011. The study provides financial performance scores for each conglomerate. Another study on the
Jordanian Arab Bank during the period 2001-2009 used the DuPont system of financial analysis based on the ROE model's analysis,
which disaggregates the performance into three components: net profit margin, total asset turnover, and the equity multiplier.
There are also several studies on financial performance in the pharmaceutical industry. Hossan & Habib (2010) compare the
financial performance of Bangladesh's two pharmaceutical companies 2007-2008 using descriptive financial ratio analysis. The
financial ratios evaluated in the study are liquidity ratios, profitability ratios, market value ratios, asset management ratios, and
debt management ratios. Another study on the financial performance of two public sector drug & pharmaceutical enterprises listed
on BSE during the twelve years from 1997 to 2009. The study also measured the companies' liquidity, profitability, solvency, and
financial efficiency using financial ratio analysis paired with statistical measures, i.e., the test of hypothesis t-test and linear
multiple regression analysis (Bhunia, 2010). Although there are already numerous studies on the pharmaceutical industry's
financial performance, studies based in Indonesia are still limited.
METHODOLOGY
A. Data
The data uses in this study are the Kalbe Farma Tbk’s annual reports during period 2014-2019 that were obtained from Kalbe
Farma Tbk’s official website. This study uses descriptive financial ratio analysis to examine Kalbe Farma Tbk's financial
performance during 2014-2019. It also uses a comparative analysis to see if there are significant differences in the company's
financial performance in 2014-2016, before the presidential instruction issuance, and in 2017-2019 after presidential instruction
issuance. A paired sample t-test was applied to check the 11 variables' hypotheses as listed in the variable section.
B. The Variables
Financial performance analysis is the process of identifying the financial strengths and weaknesses of the firm by properly
establishing the relationship between the items of balance sheet and profit and loss account. It also helps in short-term and long-
term forecasting and growth can be identified with the help of financial performance analysis. The financial performance in this
study divided into 4 categories, namely: profitability ratio, liquidity ratio, activity ratio, and solvency ratio.
Profitability Ratio
a. Return on Investment
(ROI)
(Net income / Investment) x 100%
Used to calculate the efficiency of an investment relative to the investment’s cost.
b. Return on Equity (ROE) (Net income / Shareholders’s Equity) x 100%
Evaluates how much a company has gained on the funds invested by shareholders.
c. Return on Assets (ROA) (Net income / Total Assets) x 100%
Shows how much a company has gained on the investment of all the financial
resources dedicated to the company.
Liquidity Ratio
a. Cash Ratio ((Cash + cash equivalents)/Current Liabilities) x 100%
Evaluates the ability of a company to fulfill current liabilities with only cash and cash
equivalents.
b. Current Ratio (Current Assets/Current Liabilities) x 100%
Evaluates the ability of a company to fulfill its current liabilities with current assets.
Activity Ratio
a. Inventory Turnover Ratio Cost of Goods Sold/Average Inventory
South East Asia Journal of Contemporary Business, Economics and Law, Vol. 23, Issue 1 (Dec)
ISSN 2289-1560 2020
218
Used to calculate how many times a company sold its inventory during the year to
show inventory management effectiveness.
b. Total Assets Turnover
Ratio
(Sales Revenue/Total Assets) x 100%
Reflects the ability and efficiency of a company’s assets to generate sales revenue.
c. Collection Period (Average Accounts Receivables/Sales Revenue) x 365 days
Indicates the amount of time needed for a company to receive payment owed by
customers that paid in credit (accounts receivable)
Solvency Ratio
a. Total Equity to Total
Assets Ratio
(Total Equity/Total Assets) x 100%
Reflects the amount or percentage of assets that can be claimed by shareholders.
b. Liability to Equity Ratio (Debt
to Equity Ratio/ DER)
(Total Liability/Shareholder’s Equity) x 100%
Used to indicate the amount of debt or funding used by a company to finance its
assets relative to shareholder’s equity.
c. Liability to Total Assets
Ratio
(Total Liability/Total Assets) x 100%
Shows the total amount of assets funded by creditors and debt.
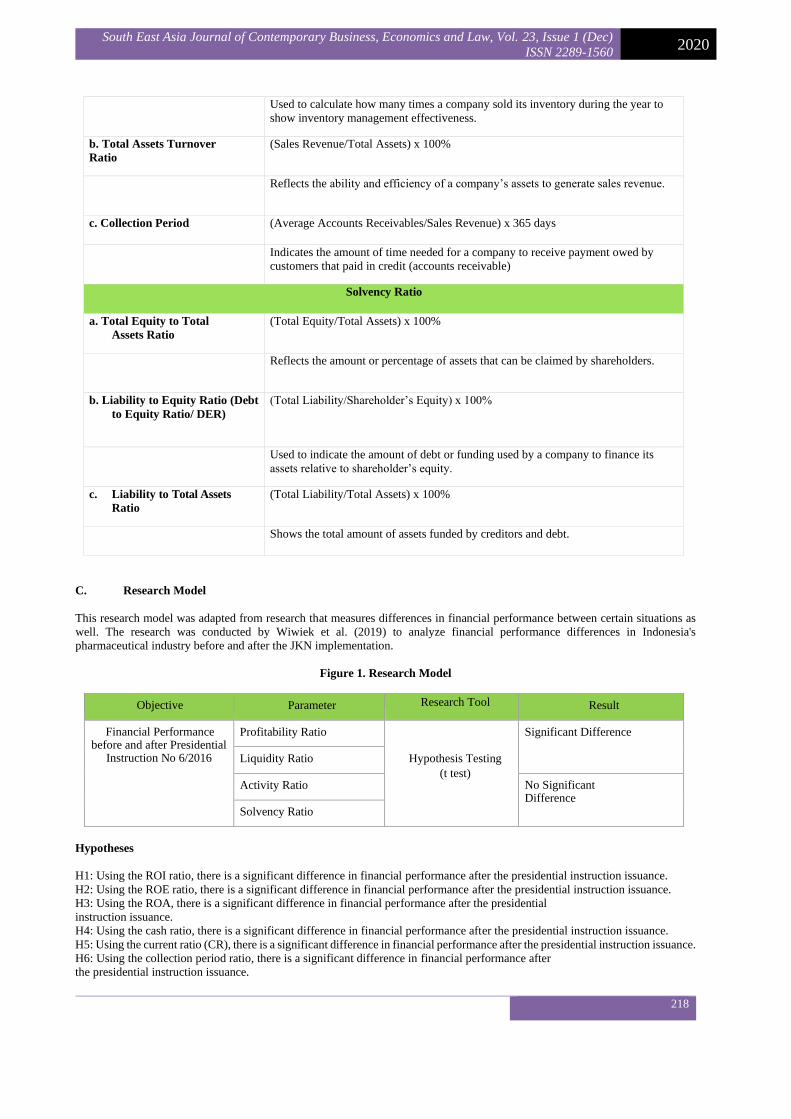
C. Research Model
This research model was adapted from research that measures differences in financial performance between certain situations as
well. The research was conducted by Wiwiek et al. (2019) to analyze financial performance differences in Indonesia's
pharmaceutical industry before and after the JKN implementation.
Figure 1. Research Model
Objective Parameter Research Tool Result
Financial Performance before and after Presidential
Instruction No 6/2016
Profitability Ratio
Hypothesis Testing
(t test)
Significant Difference
Liquidity Ratio
Activity Ratio No Significant Difference
Solvency Ratio
Hypotheses
H1: Using the ROI ratio, there is a significant difference in financial performance after the presidential instruction issuance.
H2: Using the ROE ratio, there is a significant difference in financial performance after the presidential instruction issuance.
H3: Using the ROA, there is a significant difference in financial performance after the presidential
instruction issuance.
H4: Using the cash ratio, there is a significant difference in financial performance after the presidential instruction issuance.
H5: Using the current ratio (CR), there is a significant difference in financial performance after the presidential instruction issuance.
H6: Using the collection period ratio, there is a significant difference in financial performance after
the presidential instruction issuance.
South East Asia Journal of Contemporary Business, Economics and Law, Vol. 23, Issue 1 (Dec)
ISSN 2289-1560 2020
219
H7: Using the inventory turnover ratio, there is a significant difference in financial performance after the presidential instruction
issuance.
H8: Using the total asset turnover ratio, there is a significant difference in financial performance after the presidential instruction
issuance.
H9: Using the total equity to total asset ratio, there is a significant difference in financial performance after the presidential
instruction issuance.
H10: Using the liability to equity ratio, there is a significant difference in financial performance after the presidential instruction
issuance.
H11: Using the liability to total assets ratio, there is a significant difference in financial performance
after the presidential instruction issuance.
RESULT AND DISCUSSION
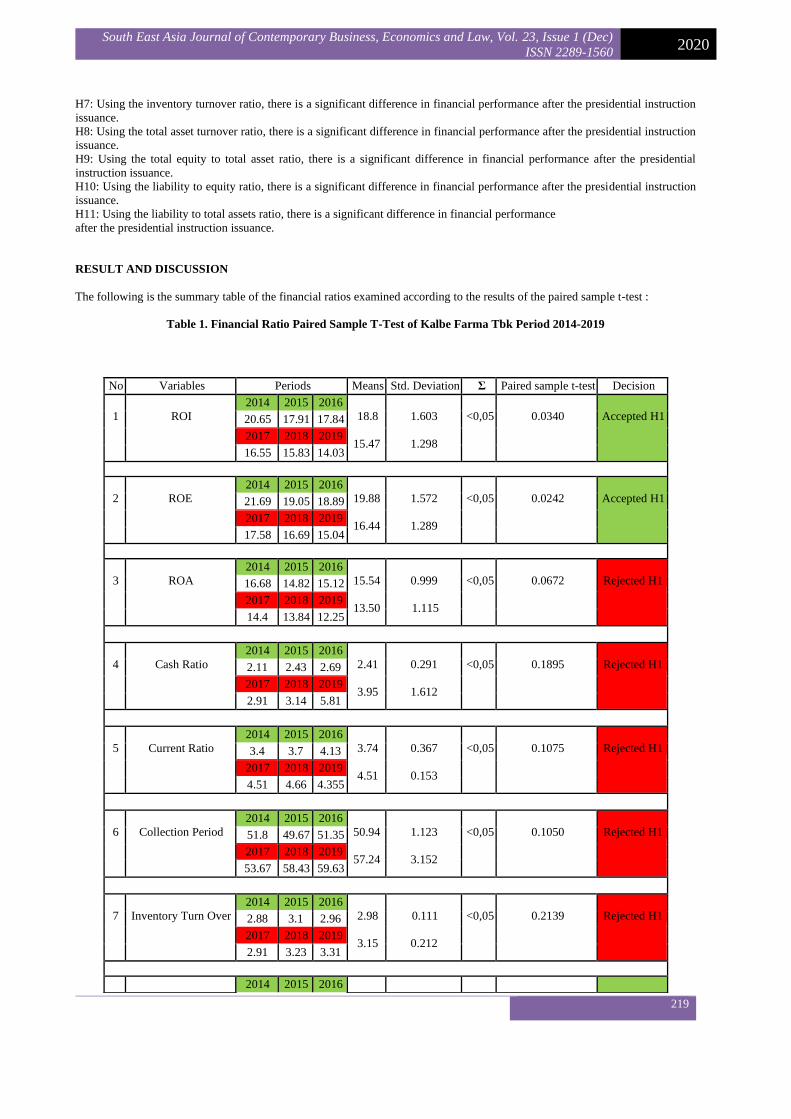
The following is the summary table of the financial ratios examined according to the results of the paired sample t-test :
Table 1. Financial Ratio Paired Sample T-Test of Kalbe Farma Tbk Period 2014-2019
No Variables Periods Means Std. Deviation Σ Paired sample t-test Decision
1
ROI
2014 2015 2016
18.8
15.47
1.603
1.298
<0,05
0.0340
Accepted H1 20.65 17.91 17.84
2017 2018 2019
16.55 15.83 14.03
2
ROE
2014 2015 2016
19.88
16.44
1.572
1.289
<0,05
0.0242
Accepted H1 21.69 19.05 18.89
2017 2018 2019
17.58 16.69 15.04
3
ROA
2014 2015 2016
15.54
13.50
0.999
1.115
<0,05
0.0672
Rejected H1 16.68 14.82 15.12
2017 2018 2019
14.4 13.84 12.25
4
Cash Ratio
2014 2015 2016
2.41
3.95
0.291
1.612
<0,05
0.1895
Rejected H1 2.11 2.43 2.69
2017 2018 2019
2.91 3.14 5.81
5
Current Ratio
2014 2015 2016
3.74
4.51
0.367
0.153
<0,05
0.1075
Rejected H1 3.4 3.7 4.13
2017 2018 2019
4.51 4.66 4.355
6
Collection Period
2014 2015 2016
50.94
57.24
1.123
3.152
<0,05
0.1050
Rejected H1 51.8 49.67 51.35
2017 2018 2019
53.67 58.43 59.63
7
Inventory Turn Over
2014 2015 2016
2.98
3.15
0.111
0.212
<0,05
0.2139
Rejected H1 2.88 3.1 2.96
2017 2018 2019
2.91 3.23 3.31
2014 2015 2016
South East Asia Journal of Contemporary Business, Economics and Law, Vol. 23, Issue 1 (Dec)
ISSN 2289-1560 2020
220
Profitability Ratio
Profitability ratio is a metric that assess a company's ability to generate income relative to its revenue, operating costs, balance
sheet assets, or shareholders' equity.
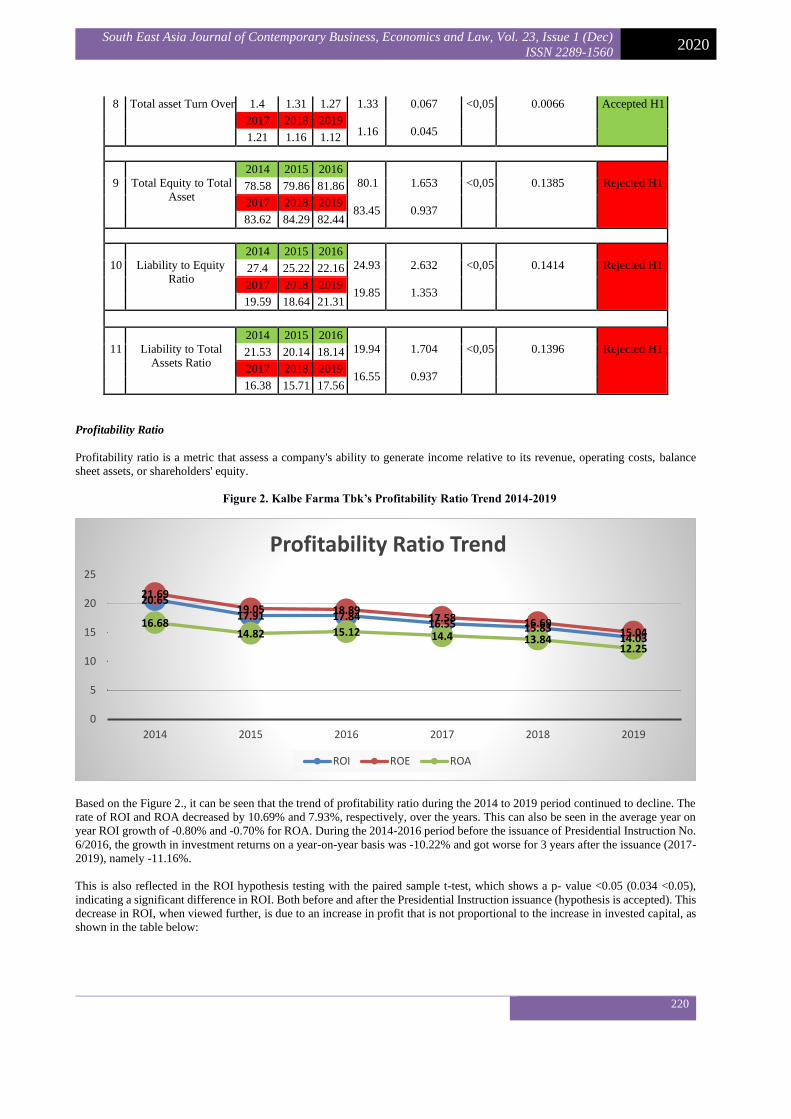
Figure 2. Kalbe Farma Tbk’s Profitability Ratio Trend 2014-2019
Based on the Figure 2., it can be seen that the trend of profitability ratio during the 2014 to 2019 period continued to decline. The
rate of ROI and ROA decreased by 10.69% and 7.93%, respectively, over the years. This can also be seen in the average year on
year ROI growth of -0.80% and -0.70% for ROA. During the 2014-2016 period before the issuance of Presidential Instruction No.
6/2016, the growth in investment returns on a year-on-year basis was -10.22% and got worse for 3 years after the issuance (2017-
2019), namely -11.16%.
This is also reflected in the ROI hypothesis testing with the paired sample t-test, which shows a p- value <0.05 (0.034 <0.05),
indicating a significant difference in ROI. Both before and after the Presidential Instruction issuance (hypothesis is accepted). This
decrease in ROI, when viewed further, is due to an increase in profit that is not proportional to the increase in invested capital, as
shown in the table below:
20.65
17.91 17.8416.55 15.83
14.03
21.69
19.05 18.8917.58 16.69
15.0416.68
14.82 15.12 14.4 13.8412.25
0
5
10
15
20
25
2014 2015 2016 2017 2018 2019
Profitability Ratio Trend
ROI ROE ROA
8 Total asset Turn Over 1.4 1.31 1.27 1.33
1.16
0.067
0.045
<0,05 0.0066 Accepted H1
2017 2018 2019
1.21 1.16 1.12
9
Total Equity to Total
Asset
2014 2015 2016
80.1
83.45
1.653
0.937
<0,05
0.1385
Rejected H1 78.58 79.86 81.86
2017 2018 2019
83.62 84.29 82.44
10
Liability to Equity
Ratio
2014 2015 2016
24.93
19.85
2.632
1.353
<0,05
0.1414
Rejected H1 27.4 25.22 22.16
2017 2018 2019
19.59 18.64 21.31
11
Liability to Total
Assets Ratio
2014 2015 2016
19.94
16.55
1.704
0.937
<0,05
0.1396
Rejected H1 21.53 20.14 18.14
2017 2018 2019
16.38 15.71 17.56
South East Asia Journal of Contemporary Business, Economics and Law, Vol. 23, Issue 1 (Dec)
ISSN 2289-1560 2020
221
Table 2. Net Income and Investment Value of Kalbe Farma Tbk during Period 2014-2019
2014 2015 2016 2017 2018 2019
Net Income
(in billion IDR)
2.073 2.030 2.303 2.393 2.511 2.482
Investment Value
(in billion IDR)
10.039 11.330 12.909 14.459 15.860 17.688
The investment value has increased, market sentiment is positive due to Presidential Instruction No. 6/2016. Therefore, the research
results show that the pharmaceutical industry is still experiencing a downward trend in ROI between before and after the issuance.
Even though the company has positive investment results, the company does not respond quickly to this increase in investment
with the right strategy, which can be maximized to increase profitability.
In this study, the ROA value did not experience a significant difference between the data before and after the Presidential
Instruction was issued. Based on the T-test with a p-value <0.05, the p-value was 0.06. As seen from the trend of asset value from
2014 to 2019, Kalbe Farma Tbk has experienced an increase in assets, this could be the effect of an increase in investment, but the
company has not been able to maximize the increase in asset value to increase profitability.
ROE shows the same trend as the two previous parameters, ROI and ROA, where the trend decreases every year in value. Still,
this decrease is not due to a decrease in profit but rather due to an increase in equity value due to an increase in Kalbe Farma Tbk
investment. From this profitability performance parameter, it can be concluded that Presidential Instruction No. 6/2016 has created
positive sentiment for investors in the world of the pharmaceutical industry. Still, the company has not been able to take advantage
of this positive climate to increase company profitability.
Liquidity Ratio
Liquidity ratio is a ratio that shows the ability of the company's management to meet its obligations or pay its short-term debt.
Figure 3. Kalbe Farma Tbk’s Liquidity Ratio Trend 2014-2019
From Figure 3., it can be seen that the current ratio has an increasing trend from 2014 to 2018 by 37%, and in 2019 it decreased
by 6.5% compared to 2018. Broadly speaking, the current ratio has increased by 20% compared to the previous year between 2014
and 2019. However, this upward trend did not show a significant difference between before and after Presidential Instruction No.
6/2016 issuance, with a p-value of 0.1075. This value is higher than the requirement of p <0.05, indicating that there is no significant
difference in the company's ability to pay its current liabilities with its current assets after the issuance of Presidential Instruction
No. 6 of 2016. Like the current ratio, the cash ratio is also not significantly affected with a p-value> 0.05 (0.1895> 0.05) even
though there is a significant increase in the cash ratio of 85% from 2019 compared to 2018.
A cash ratio of 0.2 is considered acceptable in some countries. A cash ratio that is too high may indicate the use of assets that are
not optimal for the company because it holds too much cash on its balance sheet. The cash ratio value, which tends to be very high,
results in stagnant company profits. High potential cannot be maximized into profitability. The board of directors must devise a
more accurate strategy to use the company's money into profit rather than keeping it in a pocket.
4.51 4.66
5.81
4.36
3.4
2.11
3.7
2.43
4.13
2.69 2.91 3.14
2014 2015 2016 2017 2018 2019
Current Ratio Cash Ratio
South East Asia Journal of Contemporary Business, Economics and Law, Vol. 23, Issue 1 (Dec)
ISSN 2289-1560 2020
222
If a company’s cash ratio is greater than 1, the business has the ability to cover all short-term debt and still have cash remaining.
However, a higher ratio may also indicate that the cash resources are not being used appropriately since it could be invested in
profitable investments instead of earning the risk-free rate of interest.
Activity Ratio
Activity ratio is the ratio used to assess the efficiency or effectiveness of the company in the utilization of all resources or assets
owned by a company.
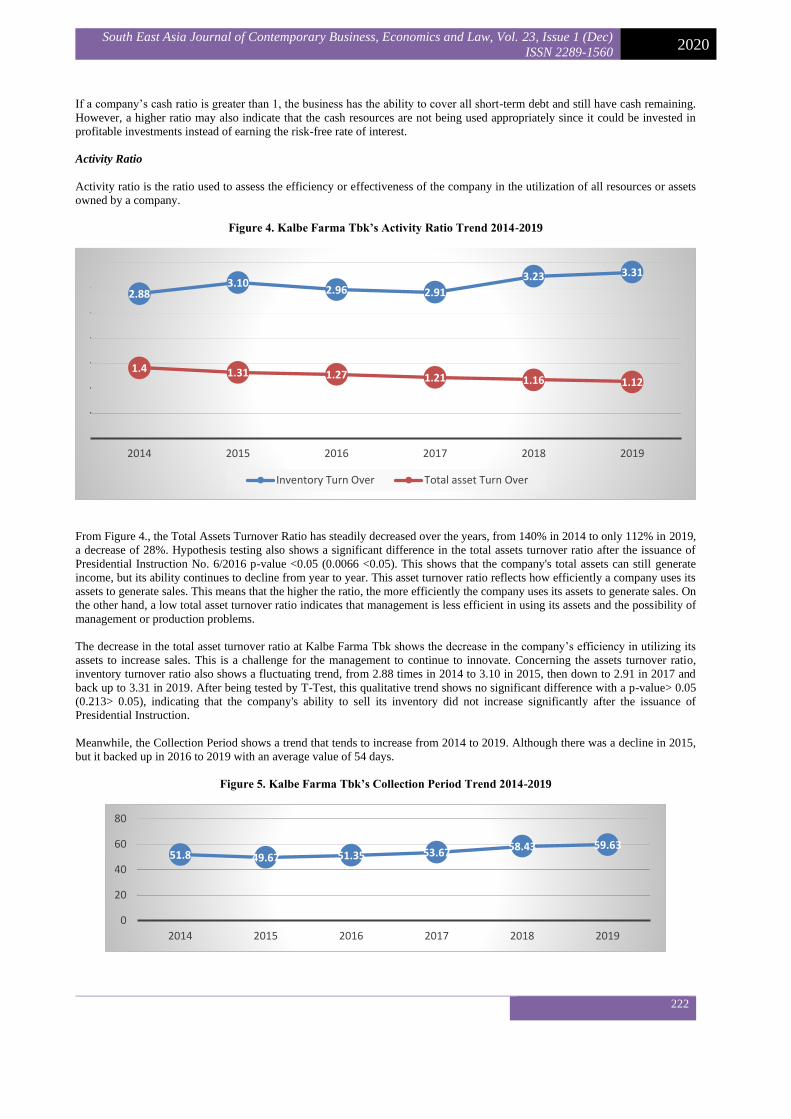
Figure 4. Kalbe Farma Tbk’s Activity Ratio Trend 2014-2019
From Figure 4., the Total Assets Turnover Ratio has steadily decreased over the years, from 140% in 2014 to only 112% in 2019,
a decrease of 28%. Hypothesis testing also shows a significant difference in the total assets turnover ratio after the issuance of
Presidential Instruction No. 6/2016 p-value <0.05 (0.0066 <0.05). This shows that the company's total assets can still generate
income, but its ability continues to decline from year to year. This asset turnover ratio reflects how efficiently a company uses its
assets to generate sales. This means that the higher the ratio, the more efficiently the company uses its assets to generate sales. On
the other hand, a low total asset turnover ratio indicates that management is less efficient in using its assets and the possibility of
management or production problems.
The decrease in the total asset turnover ratio at Kalbe Farma Tbk shows the decrease in the company’s efficiency in utilizing its
assets to increase sales. This is a challenge for the management to continue to innovate. Concerning the assets turnover ratio,
inventory turnover ratio also shows a fluctuating trend, from 2.88 times in 2014 to 3.10 in 2015, then down to 2.91 in 2017 and
back up to 3.31 in 2019. After being tested by T-Test, this qualitative trend shows no significant difference with a p-value> 0.05
(0.213> 0.05), indicating that the company's ability to sell its inventory did not increase significantly after the issuance of
Presidential Instruction.
Meanwhile, the Collection Period shows a trend that tends to increase from 2014 to 2019. Although there was a decline in 2015,
but it backed up in 2016 to 2019 with an average value of 54 days.
Figure 5. Kalbe Farma Tbk’s Collection Period Trend 2014-2019
2.883.10
2.96 2.91
3.23 3.31
1.4 1.31 1.27 1.21 1.16 1.12
2014 2015 2016 2017 2018 2019
Inventory Turn Over Total asset Turn Over
51.8 49.67 51.35 53.6758.43 59.63
0
20
40
60
80
2014 2015 2016 2017 2018 2019
South East Asia Journal of Contemporary Business, Economics and Law, Vol. 23, Issue 1 (Dec)
ISSN 2289-1560 2020
223
The paired t-test resulted in a p-value> 0.05 (0.105> 0.05), which indicated no significant difference, and it took a long time for
the company to receive payments from its customers with credit sales after the issuance of Presidential Instruction No. 6/2016. The
average collection period is the number of days that elapsed between the date the credit was sold, and the date the company received
payment from the credit sale. The short average collection period or ACP measurement can indicate a strict credit policy and
effective receivables management, allowing a company to meet its short-term obligations. On the other hand, a long ACP indicates
that a company must further tighten its credit policy and improve its receivables management to meet its short-term obligations.
Solvency Ratio
Solvency ratio is a ratio that shows the company's ability to fulfill all its obligations, both short and long term, if the company is
liquidated.
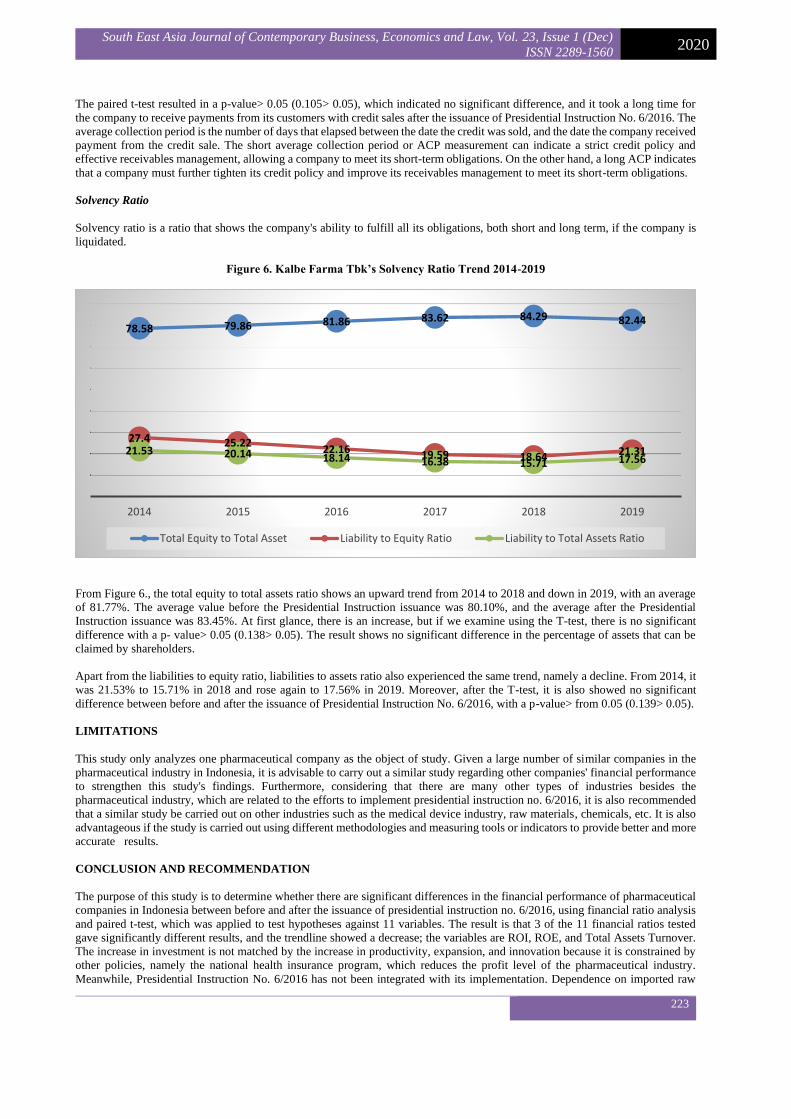
Figure 6. Kalbe Farma Tbk’s Solvency Ratio Trend 2014-2019
From Figure 6., the total equity to total assets ratio shows an upward trend from 2014 to 2018 and down in 2019, with an average
of 81.77%. The average value before the Presidential Instruction issuance was 80.10%, and the average after the Presidential
Instruction issuance was 83.45%. At first glance, there is an increase, but if we examine using the T-test, there is no significant
difference with a p- value> 0.05 (0.138> 0.05). The result shows no significant difference in the percentage of assets that can be
claimed by shareholders.
Apart from the liabilities to equity ratio, liabilities to assets ratio also experienced the same trend, namely a decline. From 2014, it
was 21.53% to 15.71% in 2018 and rose again to 17.56% in 2019. Moreover, after the T-test, it is also showed no significant
difference between before and after the issuance of Presidential Instruction No. 6/2016, with a p-value> from 0.05 (0.139> 0.05).
LIMITATIONS
This study only analyzes one pharmaceutical company as the object of study. Given a large number of similar companies in the
pharmaceutical industry in Indonesia, it is advisable to carry out a similar study regarding other companies' financial performance
to strengthen this study's findings. Furthermore, considering that there are many other types of industries besides the
pharmaceutical industry, which are related to the efforts to implement presidential instruction no. 6/2016, it is also recommended
that a similar study be carried out on other industries such as the medical device industry, raw materials, chemicals, etc. It is also
advantageous if the study is carried out using different methodologies and measuring tools or indicators to provide better and more
accurate results.
CONCLUSION AND RECOMMENDATION
The purpose of this study is to determine whether there are significant differences in the financial performance of pharmaceutical
companies in Indonesia between before and after the issuance of presidential instruction no. 6/2016, using financial ratio analysis
and paired t-test, which was applied to test hypotheses against 11 variables. The result is that 3 of the 11 financial ratios tested
gave significantly different results, and the trendline showed a decrease; the variables are ROI, ROE, and Total Assets Turnover.
The increase in investment is not matched by the increase in productivity, expansion, and innovation because it is constrained by
other policies, namely the national health insurance program, which reduces the profit level of the pharmaceutical industry.
Meanwhile, Presidential Instruction No. 6/2016 has not been integrated with its implementation. Dependence on imported raw
78.58 79.86 81.86 83.62 84.29 82.44
27.4 25.2222.16 19.59 18.64 21.3121.53 20.14 18.14 16.38 15.71 17.56
2014 2015 2016 2017 2018 2019
Total Equity to Total Asset Liability to Equity Ratio Liability to Total Assets Ratio
South East Asia Journal of Contemporary Business, Economics and Law, Vol. 23, Issue 1 (Dec)
ISSN 2289-1560 2020
224
materials is also an obstacle for the pharmaceutical industry, requiring special strategic policies. Positive government policies will
benefit if there is a synergy with its strategy in utilizing this policy.
The large dependence on imports of medicinal raw materials needs the attention of all parties. Indonesia has abundant raw materials
but cannot process them independently. Conducting innovations by maximizing the use of Indonesia's biological wealth by
developing a phytopharmaca-based pharmaceutical industry that has good prospects for the future. This study is also expected to
help managers in the pharmaceutical industry give insights when making decisions and have the guts to be more risk-taker to
increase the net income.
REFERENCES
Abidin, Zainal., (2020). Covid 19 dan Kemandirian Industri Nasional. Retrieved December 06, 2020, from
https://news.detik.com/kolom/d-4987903/covid-19-dan-kemandirian-industri-farmasi-nasional
Al Karim, R., & Alam, T. (2013). An Evaluation of Financial Performance of Private Commercial Banks in Bangladesh: Ratio
Analysis. Jounal of Business Studies Quarterly 2013 Volume 5 Number 2: 65-77.
Bhunia, Amalendu. (2010). Financial Performance of Indian Pharmaceutical Industry A Case Study. Asian Journal of Management
Research: 427-451.
doi: 10.1.1.207.710
Daryanto, Wiwiek Mardawiyah and Meriana, Meriana (2019) Financial Performance Analysis of Indonesia Pharmaceutical
Industry before and After the Implementation of National Health Insurance. International Journal of Innovation, Creativity and
Change, 8 (12). pp. 124-138. ISSN 2201-1323
Hery. (2016). Analisis Laporan Keuangan Integrated and Comprehensive Edition. Jakarta: PT Gramedia Widiasarana Indonesia.
Hossan, F., & Habib, Md Ahsan. (2010). Performance Evaluation and Ratio Analysis of Pharmaceutical Company in Bangladesh.
Retrieved October 28, 2020. from https:// www.diva-portal.org/smash/get/diva2:323754/FULLTEXT01.pdf
Kalbe Farma. (2015). Kalbe Farma Annual Report 2014. Retrieved October 18, 2020, from https://
www.kalbe.co.id/Portals/0/pdf/annual-report/annual-report-2014-PT-Kalbe-Farma-Tbk.pdf
Kalbe Farma. (2016). Kalbe Farma Annual Report 2015. Retrieved October 18, 2020, from https://
www.kalbe.co.id/Portals/0/pdf/annual-report/annual-report-2015-PT-Kalbe-Farma-Tbk.pdf
Kalbe Farma. (2017). Kalbe Farma Annual Report 2016. Retrieved October 18, 2020, from https://
www.kalbe.co.id/Portals/0/pdf/annual-report/Kalbe%20Farma_AR2016.pdf
Kalbe Farma. (2018). Kalbe Farma Annual Report 2017. Retrieved October 18, 2020. from https://
www.kalbe.co.id/Portals/0/pdf/annual-report/KLBF_AR2017_FINAL.pdf
Kalbe Farma. (2019). Kalbe Farma Annual Report 2018. Retrieved October 18, 2020. from https://
www.kalbe.co.id/Portals/0/KLBF%20AR%202018%20website.pdf
Kalbe Farma. (2020). Kalbe Farma Annual Report 2019. Retrieved October 18, 2020. from https://
www.kalbe.co.id/Portals/0/pdf/annual-report/2020_AR%20KLBF%202019final02.pdf
Kazan, H., & Ozdemir, O. (2014). Financial Performance Assessment Of Large Scale Conglomerates Via Topsis And Critic
Methods. International Journal Of Management And Sustainability, 2014, 3(4): 203-224.
Kim, W.G., Ayoun, B. (2005). Ratio Analysis for the Hospitality Industry: A Cross Sector Comparison of Financial Trends in the
Lodging, Restaurants, Airline, and Amusement Sector. The J o u r n a l o f H o s p i t a i t y F i n a n c i a l M a n a g e m e n t
, 1 3 ( 1 ) : 5 9 - 7 8 . d o i : 10.1080/10913211.2005.10653800
Menteri Kesehatan RI. (2017). Peraturan Menteri Kesehatan No. 17 Tahun 2017 Tentang Rencana Aksi Pengembangan Industri
Farmasi dan Alat Kesehatan.
Presiden RI. (2016). Instruksi Presiden No. 6 Tahun 2016 Tentang Percepatan Pengembangan Industri Farmasi dan Alat Kesehatan.
Raymond S. Schmidgall & Agnes L. DeFranco (2004) Ratio Analysis: Financial Benchmarks for the Club Industry, The Journal
of Hospitality Financial Management, 12:1, 1-14, DOI: 10.1080/10913211.2004.10653782
Sudarwan, Ilman A. (2020, April 03) Kinerja 2019 : Tumbuh Tipis, Kalbe Farma (KLBF) Raup Laba Rp2,5 Triliun. Retrieved
October 27, 2020, from https://market.bisnis.com/read/ 20200403/192/1222011/kinerja-2019-tumbuh-tipis-kalbe-farma-klbf-
raup-laba-rp25-triliun
South East Asia Journal of Contemporary Business, Economics and Law, Vol. 23, Issue 1 (Dec)
ISSN 2289-1560 2020
225
Tugas, F.C. (2012). A Comparative Analysis of the Financial Ratios of Listed Firms Belonging to the Education Subsector in the
Philippines for the Years 2009-2011. International Journal of Business and Social Science Vol 3 No. 21: 173-190.
Voulgaris, F., Doumpos, M. & Zopounidis, C. On the Evaluation of Greek Industrial SME's Performance via Multicriteria Analysis
of Financial Ratios. Small Business Economics 15, 127–136 (2000). https://doi.org/10.1023/A:1008159408904
World Health Organization. RAAPP in Indonesia. Retrieved October 26, 2020. From
https://www.who.int/school_youth_health/assessment/raapp/idn/en
Wiwiek Mardawiyah Daryanto
Sekolah Tinggi Manajemen IPMI
Email: [email protected]
Taufiqurrohman
Sekolah Bisnis dan Manajemen, Institut Teknologi Bandung
Email: [email protected]
Novia Hestiningrum
Sekolah Bisnis dan Manajemen, Institut Teknologi Bandung
Email: [email protected]