Regulating Islamic Financial Institutions: The Nature of the Regulated

INSTITUTE OF DEVELOPING ECONOMIES
IDE Discussion Papers are preliminary materials circulated to stimulate discussions and critical comments
IDE DISCUSSION PAPER No. 256 Performance of Financial Institutions in Bhutan
Dil Bahadur Rahut*
Iván Velásquez Castellanos** Pravakar Sahoo***
Key words: Financial institution, performance, loan, deposit, net income, Bhutan.
AbstractThe Kingdom of Bhutan is a small landlocked country in South Asia,
located in the eastern Himalayas, and bordered by India and China. Bhutan is a small and fragile economy with a population of about 687,000. Nevertheless, its banking system plays an essential role in the growth and development of the country. This paper analyzes the financial performance, the development and growth of bank and non-bank financial institutions of Bhutan for the period 1999-2008 using both traditional and data envelopment analysis (DEA). The DEA analysis shows that financial institutions in are efficient and Bhutan National Bank has been the most efficient one. Overall, the paper finds that the ROE of the financial institutions in Bhutan are comparable to the international banks.
JEL Classification: G20; G21; G28; O16 *Chief, Research, Planning and Monitoring Department, Bank of Bhutan, Bhutan. Email: [email protected] **Bolivia Country Programme Coordinator, Konrad Adenauer Stiftung (KAS). Email: [email protected] ***Associate Professor, Institute of Economic Growth, New Delhi, India and Visiting Research Fellow, Institute of Developing Economies, Japan. Email: [email protected]
The Institute of Developing Economies (IDE) is a semigovernmental, nonpartisan,
nonprofit research institute, founded in 1958. The Institute merged with the Japan
External Trade Organization (JETRO) on July 1, 1998. The Institute conducts
basic and comprehensive studies on economic and related affairs in all developing
countries and regions, including Asia, the Middle East, Africa, Latin America,
Oceania, and Eastern Europe. The views expressed in this publication are those of the author(s). Publication does not imply endorsement by the Institute of Developing Economies of any of the views expressed within.
INSTITUTE OF DEVELOPING ECONOMIES (IDE), JETRO 3-2-2, WAKABA, MIHAMA-KU, CHIBA-SHI CHIBA 261-8545, JAPAN
©2010 by Institute of Developing Economies, JETRO
No part of this publication may be reproduced without the prior permission of the IDE-JETRO.

PERFORMANCE OF FINANCIAL INSTITUTIONS IN BHUTAN
a. Background The role of financial system for economic growth is well researched both theoretically and
empirically. As Bagehot (1873); argues the distinguishing characteristic of English financial
markets to mobilize savings to finance a variety of long-term illiquid investment
opportunities led to industrialization in England. Schumpeter (1911) argued that services
provided by financial intermediaries and financial institutions facilitate technological
innovation and economic development, thereby growth, by mobilizing resources, mobilizing
savings, evaluating projects, managing risks and monitoring projects implementation. This is
followed by volume of empirical research on the nexus between financial development and
growth. Some of the seminal empirical works on this area establishing close relationship
between economic and financial development are Goldsmith (1969); McKinnon (1973); King
and Levine (1993); Roubini and Sala-i-Martin (1992); Herring and Santomero, 1991. These
studies have elaborately explained the link between financial development and steady state
growth1. There are a number of cross country empirical studies on growth (Barro, 1991;
Mankiw, Romer and Weil, 1992 and Levine and Renelt, 1992; King and Levine, 1993) which
have also established a strong link between financial development and growth after
controlling relevant variables affecting growth. However there are also studies which
advocates that financial sector development is a result of economic development (Robinson,
1952; Patrick, 1966; Jovanovic 1990). Overall, it’s well established in literature that financial
sector plays the significant role of a mediator among economic agents which leads to better
resource mobilization, investment, risk management and overall economic development2.
By the way, at the macro level, the performance of the financial sector needs regulated and
controlled checks which may otherwise cause serious setback to the economy like the present
Global economic crisis. At the micro level, competition in financial sector creates pressures
on financial institutions to improve their performance and efficiency consistently. Banking
institutions, which basically control the financial sector in developing and less developing
countries like Bhutan, face dynamic and competitive environment due to fast paced global
1 However, studies such as Robinson (1952) and Lucas (1988) suggest that the role of financial development for Growth has been overstressed. 2 See Herring and Santomero (1991) for role of financial sector in economic performance.
1
connectivity. While technological innovation creates more ways to deliver financial services,
modern day consumers demand new services at their door step.
The financial sector in Bhutan is undergoing a transformation and is expected to efficiently
fulfill the role of a mediator of resources in the economy. With the growing competition in
the financial sector, the risk, profitability and balance-sheet structure management would play
an important role in the stability of the financial sectors in Bhutan besides the macro-
economic stability. The financial sector is an important source of financing businesses in a
small economy like Bhutan3. Since financial sector in Bhutan is at the nascent stage, it is
important to examine the performance of financial institutions the measurement of the
financial performance of the financial institution is well advanced within finance and
management fields. Since there is no such study on the financial sectors in Bhutan, this
research systematically analyzes the financial data of Bhutanese financial institutions and
examines the performance of the financial institutions for the period from 1999-2008. The
data has been compiled from the published annual reports of the financial institution. One of
the main contributions of this research is that it will organize the data in a comparable manner,
provide an overview of the financial sector and analyze the performance4 of the financial
institution during last 10 years.
There are different approaches to analyze the efficiency and performance of financial
institutions and can be broadly categorized into parametric and non-parametric5. We use both
traditional approach and non-parametric Data Envelopment Analysis (DEA) to evaluate
performance of financial institutions in Bhutan. The traditional approach includes analysis of
major financial indicators of these institutions over time to reflect a comparative performance.
Next we use DEA with different input-out variables on the basis of established studies in this
area.
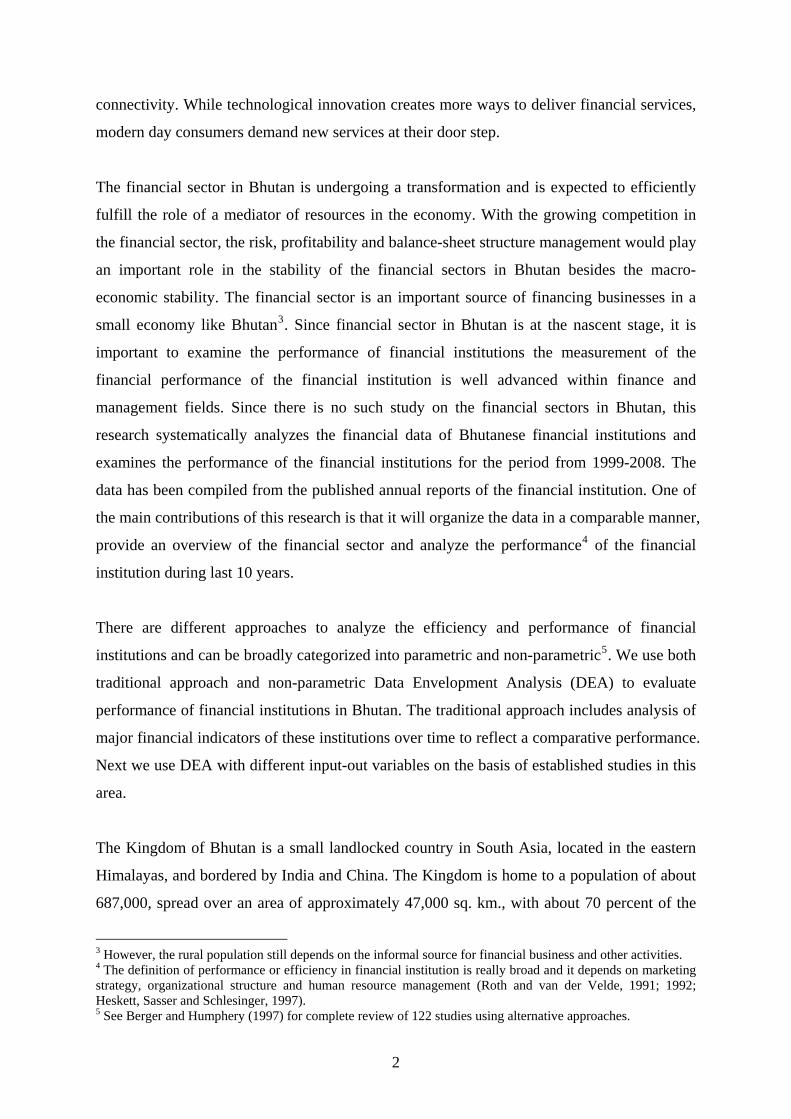
The Kingdom of Bhutan is a small landlocked country in South Asia, located in the eastern
Himalayas, and bordered by India and China. The Kingdom is home to a population of about
687,000, spread over an area of approximately 47,000 sq. km., with about 70 percent of the
3 However, the rural population still depends on the informal source for financial business and other activities. 4 The definition of performance or efficiency in financial institution is really broad and it depends on marketing strategy, organizational structure and human resource management (Roth and van der Velde, 1991; 1992; Heskett, Sasser and Schlesinger, 1997). 5 See Berger and Humphery (1997) for complete review of 122 studies using alternative approaches.
2

land area under forest cover (World Bank, 2010). Much of the population lives in the central
highlands, and almost two-thirds are classified as rural inhabitants. The terrain is mostly hilly,
with alpine peaks in the north, and some sub-tropical plains in the south6. Despite being
landlocked, with difficult terrain and a widely dispersed population, the economy of Bhutan
witnessed steady growth rate of 7-8 percent over the last two decades, mainly supported by
secondary sector (see table-1). However, the growth and contribution of agriculture sector has
slowed down (from 44.6% in 1980 to 20.3% in 2007), particularly since 2000. While the
contribution of tertiary sector did not show much change, the contribution of the finance and
insurance sectors has improved marginally7. According to the World Bank (2010) Bhutan’s
per capita gross national income (GNI), one of the highest in South Asia, has consistently
risen from $730 in 2000 to $1,900 in 2008.
Table-1a. Structure and Growth Bhutanese Economy: 1980-2007
Contribution to Economy Growth of Economy Year Primary Secondary Tertiary Finance Growth rate in % 1980‐1985 43.73 17.07 39.22 2.25 8.05 1986‐1990 38.66 21.80 39.56 3.00 10.14 1991‐1995 35.08 26.24 38.66 2.54 4.70 1996‐2000 31.56 30.68 37.76 3.38 6.34 2001‐2005 26.52 34.88 38.62 3.92 7.64 2006‐2010 21.01 39.47 36.37 5.74 9.32
Source: Estimated from National Statistical Bureau of Bhutan Table‐1b. GDP Per capita
Year 2005 2006 2007 2008 2009 2010 Per‐capita GDP (USD) 1,267.62 1,350.15 1,812.50 1,854.52 1,868.35 2,186.89
Source: Estimated from National Statistical Bureau of Bhutan
6 It is situated in the eastern Hindu Kush Himalayan range and is surrounded by Autonomous region of Tibet China and Indian states. Bhutan is governed through three levels of administration -- the central government agencies, district administrations, and block administrations. The country is currently divided into 20 districts (Dzongkhag), which are further divided into blocks (Gewogs) Bhutan National Human Development Report, 2005). 7 See Table No 1 in Appendix.
3

Figure No 1 Share and Trend of Different sectors: 1980-2007
Source: Annual Report, Bank of Bhutan 1999 to 2008 and Authors calculations.
y = ‐0.8384x + 46.647R² = 0.9549
y = 0.8897x + 13.816R² = 0.9365
y = ‐0.0514x + 39.536
y = 0.0909x + 1.8305
‐
5
10
15
20
25
30
35
40
45
50
1980 1981 1982 1983 1984 1985 1986 1987 1988 1989 1990 1991 1992 1993 1994 1995 1996 1997 1998 1999 2000 2001 2002 2003 2004 2005 2006 2007
Primary Secondary Tertiary Finance
b. Bhutan: Evolution and Structure of Financial Sectors Established in 1982, the Royal Monetary Authority of Bhutan (RMA) is the Central Bank of
Bhutan which is in charge of regulating the financial sector and formulating the monetary
policy. There are two commercial banks8 and two nonbank financial institutions9. In addition,
the Royal Securities Exchange of Bhutan (RSEB), which is the capital market and the
National Pension and Provident Fund (NPPF) are an important component of the Bhutanese
financial sector. In September 2009, Bhutan Insurance Limited an additional private
insurance was established and two Banks namely Druk PNB and T Bank were
granted license in principle in 2009 and are in operation from second and third
quarter of 2010 respectively. The figure No 2 reports the structure of financial sector
in Bhutan.
b.1. Bhutan: Evolution of Major Banks and financial Institutions in Bank
The Bank of Bhutan, the nation's commercial bank, was established on 28th May in 1968 as a
joint venture with the Chartered Bank of India, Australia and China, which owned 25 percent
of the bank. As the public sector commercial bank with a paid-up capital of Nu 2.5 million
and reserve amount of same amount and rendered the function of the Central Bank until the
8 Bank of Bhutan and Bhutan National Bank. 9 Royal Insurance Corporation of Bhutan and Bhutan Development Finance Corporation.
4

establishment of the Royal Monetary Authority of Bhutan. However, the pace of growth of
BOB was marginal due to non-convertibility of the local currency till 1972 when it was
reconstituted under the Royal Charter of Bank of Bhutan (1972) where in State Bank of India
was partner in capital and management with 40 shares10. In 2008, the BOB had a network of
26 branches11 and 3 extension counters with a paid up capital of Nu.400 million. Bank of
Bhutan enjoyed complete monopoly till 1997 when the Unit Trust of Bhutan, an undertaking
of the Royal Government, was converted into country’s second national bank –Bhutan
National Bank (BNB) - with an initial capital of Nu.2.5 million, contributed by the Royal
Government and the Royal Insurance Corporation of Bhutan (RICB). The RICB was set up
on 7th January 1975 as the country’s only insurance company which continues to enjoy the
monopoly in the insurance market in Bhutan. Traditionally, RICB managed the provident
fund of the government employee and public sector companies. However, in 2000, the
provident fund was removed from RICB and National Pension and Provident Fund was
created to manage pension and provident fund of the government and public sector
employees.
Bhutan Development Finance Corporation Limited (BDFCL) was established on January 31,
1988 as a financial institution to cater the financial needs of the micro, small and medium
enterprises with special focus on agricultural development. The BDFCL took over the
administration of rural financial assistance from the Royal Monetary Authority. Loans were
granted for improving farmland, acquiring livestock, and meeting short-term, seasonal
requirements (Worden, 1991). At least some of the funding for the corporation came from the
Asian Development Bank, including an initial US$2.5 million loan in 1988 for the expansion
of small- and medium-sized, private-sector industrial development. By 1991 the corporation
had been privatized (Worden, 1991). The Royal Government of Bhutan owns 87 percent, and
other three financial institutions own 13 percent of the total share of BDFCL. To cater to the
Capital market, the Royal Securities Exchange of Bhutan Ltd. (RSEBL) was established in
1996 by the Royal Government of Bhutan under the Technical Assistance from the Asian
Development Bank as a non profit organization. The RSEBL is owned by Four Brokerage Firms
(BOB Securities Ltd., BNB Securities Ltd., Drook Securities Ltd. and RICB Securities Ltd.).
Two new banks Druk PNB the Tashi Bank have been locally promoted where in
Punjab National Bank has 51 percent ownership. Overall, there have been efforts to
10 However, the SBI share in Bank of Bhutan was reduced to 25 percent in 1982 and then further to 20 percent in 1987. 11 In the year 2010, Bank of Bhutan has 27 branches
5

create institutions and inject competition in the financial sector to fulfill different
socio-economic objectives. However, it is important to analyze the performance of
these institutions to know about their efficiency and sustainability.
c. Brief survey of Previous Literature The literature on performance of financial institutions is rich. Large number of studies either
use traditional approach for analyzing financial indicators or use parametric (Stochastic
frontiers analysis) and non-parametric analysis (such as DEA) to evaluate performance and
efficiency of financial institutions. The definition of performance or efficiency varies across
studies and therefore the approaches used to examine are also different. Since there are large
numbers of studies, here we briefly review few studies which have used DEA approach for
efficiency analysis.
Berger and Humphrey (1997) review 130 efficiency studies of financial institutions including
commercial banks and explain that efficiency estimates of financial institutions in 21
countries vary across studies due to use of different methods used in different studies. They
found that the various efficiency methods do not necessarily yield consistent results and
suggest some ways that these methods might be improved to bring about findings that are
more consistent, accurate and useful. Avkiran (1999) used two DEA models, taking interest
expense and non-interest expense as input variables and net interest income and noninterest
income as output variable, to examine the efficiency of Australian trading banks for the
period 1986 to 1995 and find that efficiencies rose in the post-deregulation period and
acquiring banks are more efficient than target banks.
Chen and Yeh (1998) calculated the operating efficiencies of 34 commercial banks of
Taiwan’s banks using the DEA model where in input variables include staff employed and
interest expense and the output variables include loans, investment interest revenue, non-
interest revenue and bank assets. The authors find that that a bank with better efficiency does
not always mean that it has better effectiveness. Al-Shammari and Salimi (1998) have
examined the comparative operating efficiency of Jordanian commercial banks from 1991-
1994 using a modified version of DEA and find that the majority of banks are fairly
inefficient over the period 1991-94. Noulas (2001) employed both DEA model and the
traditional approach to study the effect of banking deregulation on private and publicly-
owned banks. The interest expense and non-interest expense were the input variables, and
interest revenue and non-interest revenue were the output variables. The results reveal that
6
state banks were less efficient than the private and that the gap widened during the study
period.
Barr (2002) used five input variables namely, salary expense, premises and fixed assets, other
noninterest expenses, interest expenses and purchased funds and four output variables namely
earnings, assets, interest income and noninterest income to evaluate the productive efficiency
of US Commercial banks from 1984 to 1998. The authors find strong and consistent
relationships between efficiency, inputs, output, as well as independent measures of bank
performance. Grigorian and Manole (2002) used DEA for 17 European countries and found
that foreign banks are more cost efficient than domestic banks. Further Jemric and Vujcic
(2002) examined the Efficiency of banks in Croatia by using two DEA models and find
similar results that foreign banks are more efficient. Similarly, Strum and Williams (2004)
and Havrylchyk (2006) use DEA and find that new foreign banks are more efficient than
domestic banks in Australia and Poland respectively.
Analyzing performance and efficiency of financial institutions using DEA is very popular.
The present study contributes to the literature by carrying out an analysis of performance of
four major financial institutions in Bhutan by using DEA method and the traditional ratios. It
is hoped that the study would be useful to scholars and policy makers.
d. Analysis of Performance: Traditional Approach
In this section we analyze the performance of four major financial institutions by analyzing
Profitability/Earning/Operational strategy, productivity/efficiency, leverage and liquidity,
capital adequacy, growth and aggressiveness and market shares by using traditional methods
of looking at important financial indicators. All these indicators for each financial institution
are reported separately in Table No 1 to Table No 6 (See Annexure).
d.1. Profitability/Earning/Operational Analysis
i. Return on Assets (ROA)
The Return on Assets (ROA) of Bank of Bhutan has been very low during 1999 to 2008 with
an average ROA of 1.1. The ROA is low because as most short term volatile funds are parked
with BOB by government owned companies which cannot be invested to generate revenue.
The average ROA of BNB is higher at 1.7 percent during 1999 to 2008. The ROA of Bhutan
National Bank has been close to 2 percent except in 2002, 2003 and 2004, where it was close
to 1 percent. The average ROA of RICB is 3.5 percent, higher than BOB and BNB, with a
7

standard deviation of 1.6, which is significantly higher than both the Banks. The BDFC has
been doing well in recent years resulting in higher average ROA (3.7 percent for 1999-2007).
The ROA of non-bank financial institutions are much higher than that of banks which can
only use 63 percent of the deposit base to generate income after Cash Reserve Ratio (CRR) of
17 percent and Statutory Liquidity Requirement (SLR) of 20 percent.
ii. Return on Capital
The Return on Capital (ROC) reflects the performance of the company. BOB had higher
ROC in initial years but has slowed down in recent years leading to average ROC of BOB of
16.3 per cent for the whole period which is still comparable to most international standards.
The average ROC of BNB and RICB is much higher at 21.7 and 19.9 percent respectively.
BNB and RICB performing much better and more stable compared to other financial
institutions. BDFC has lowest ROC average at 11.9 percent. Though average ROC is
comparatively low, it has improved its performance since 2004. Performance of BNB, RICB
and BOB with average ROC of greater than 15 percent is comparable to any global financial
institution.
iii. Return on loans and investment (ROI)
The average return on loan and investment of all financial institution in Bhutan was around 4
percent during 1999-2007. The return on loans and investment of both BOB and BNB Bhutan
National Bank show a lot of fluctuations with high standard deviations. Though the ROI of
RICB and BDFC are comparable, they are doing much better in last few years averaging 5
percent ROI.
iv. Revenue to Asset ratio (RAR)
The revenue to assets ratio shows how well the assets are being utilized to generate the
revenue for the financial institutions. The average RAR of the BOB is 5.5 where as it is 7.4
and 6.1 for BNB and RICB respectively for the reference period. The RAR of BOB is
slowing down revealing inability of the bank to utilize assets optimally. The reason for
declining revenue is that BOB used to deposit large chunk of assets in its current account in
State Bank of India and earned revenue from the Bank in the initial years which is not
possible now. Further, as mentioned before, government owned corporation and the salary of
the civil servants are deposited in BOB which are short term in nature and highly volatile to
8

use for revenue. The average revenue to assets ratio of BDFC during last 10 years was 11
percent and it has always been greater than 10 percent.
d.2. Productivity/Efficiency Analysis During the last 10 years the average loans and investment per employee (ALIP) of BOB and
BNB are Nu.7.8 million and Nu.14.7 million respectively. Though the ALIP is increasing for
both BOB and BNB, it is increasing much faster for BNB and has highest ALIP for last few
years in Bhutan. Whereas, two other organizations; such as RICB and BDFC have ALIP of
Nu.8.6 and Nu.7.4 million respectively for the ten years. Similarly, BNB has the highest
average profit per employee was (Nu. 0.5 million) followed by 0.4 million for RICB and 0.3
million for BOB and BDFC for the reference period 1999 to 2008. Overall, we observe that
all the four institutions have been improving in efficiency indictors such as ALIP and average
profit per employee.
d.3. Leverage and Liquidity Analysis
The loan and investment to capital helps us to measure how leveraged the firms is? The
average loans and investment to capital ratio of BOB, BNB, RICB and BDFC were 4.3, 5.8,
5.4 and 2.2 respectively. This shows that BNB was most leverage followed by RICB, BOB
and BDFC. Further, the average loans and investment to total assets of BOB is 29.6 percent
where it is 49.4 percent for BNB. The average loan and investment to asset of RICB and
BDFC are 84.4 percent 85.5 percent respectively revealing that these two are most leveraged
institutions in Bhutan. The average loan to deposit ratio of BOB and BNB are 25.5 and 51.9
percent where as the average loan and investment to deposit ratio are 34.5 and 58.2
respectively percent during last 10 years from 1999 to 2008. More importantly we observe
that all four financial institutions have been continuously improving in these indicators (see
table 1-4 in annexure) and almost comparable to international standard.
d.4. Capital Adequacy i. Capital to Asset Ratio (CAR)
Measures first the financial health of the bank and second the ability of the bank to withstand
the losses. The average CAR ratios of BOB, BNB, RICB and BDFC are 7 percent, 8.4
percent, 17.5 percent and 30.6 percent respectively. Although the capital to asset of the banks
is very low, it should not be looked with awe because about 17 percent is in the form of CRR
9

and 20 per cent in the form of SLR remain uninvited. In addition, the assets of the BOB
remained idle in the form of cash and balances with RMA as these are short and volatile
deposits of the governments, government projects and other large government corporations.
The CAR of RICB has been improving much faster since 2004 where as BDFC has fairly
strong CAR from initial years.
ii. Capital to net Loan (CNL)
The CNL ratio measures the equity cushion available to absorb losses on the loan book. We
observe that BOB and BDFC are in a much better position to absorb the losses in the loan
book with average CNL ratios of 34.3 percent and 36.0 percent respectively. However, the
CNL of BOB has declined over the period (from 40.1 in 1999 to 18.7 in 2008) where as the
CNL of the BDFC has always been more than 30 percent during the last 10 years. The
average CNL ratios for BNB and RICB are 20.3 percent and 22.6 percent respectively for the
reference period.
iii. Capital to net Loan and investment (CNLI)
Like CNL, CNLI measures the equity cushion available to absorb losses on the loan and
investment. The average CNLI of BOB, BNB, RICB and BDFC are 24.1 percent, 18.3
percent, 20.3 percent and 35.9 percent. Similar to CNL, BOB and BDFC are better placed in
this indictor though their CNLI has been slowing down in recent years.
d.5. Growth & Aggressiveness i. Bank of Bhutan (BOB)
The assets of BOB have always shown a positive growth on a year to year basis reaching
Nu.21,069 million in 2008 from Nu.7, 417.7 in 1999. During the same period the loan and
investment increased from Nu.2,167.1 million in 1999 to Nu.8,686.8 million in 2008. The
deposits base has increased from Nu.6,323,3 million in 1999 to 18,436.8 million in 2008.
The reserve and capital increased from Nu.451.3 million in 1999 to Nu.1515.8 million in
2008. Although the assets, loan & investment, deposits, revenue and reserve and surplus
increased substantially in 2008, the operating cost increased marginally to Nu.197.5 million
in 2008 from Nu.86.5 million in 1999.
ii. Bhutan National Bank (BNB)
10

We observe that BNB has been quite aggressive over the last ten years. The growth in the
assets, deposit base, loans & investment has been very impressive. While assets of BNB
reached Nu. 16,734.0 million in 2008 from Nu.2,8161 million in 1999, the volume of loan
increased to Nu. 9,188.3 million in 2008 from Nu. 819.6 million in 1999. During the same
period the loan and investment increased from Nu. 834.0 million in 1999 to Nu. 9,740.0
million in 2008. The deposit base and revenue increased from Nu. 2,489.9 million in 1999 to
14,601.4 million in 2008 and from Nu. 199.2 million in 1999 to Nu.1,149.6 in 2008
respectively. However, the operating expenses also increased from Nu. 37.6 million in 1999
to Nu. 217.2 million in 2008.
iii. Royal Insurance Corporation of Bhutan (RICB) and Bhutan Development Finance
Corporation (BDFC)
The assets of RICB was Nu.2,452.6 million in 1999 which declined to Nu.1,336.8 as the
government employee provident fund, which used to be managed by RICB, was moved out
of to NPPF. Gradually, RICBL started building its assets reaching to Nu.2,672.8 million in
2008. Similarly, all other indicators such as loans, investment, revenue and operating cost
also increased over time. BDFC has also achieved positive growth in most of the financial
indicators over the last 10 years.
d.6. Market Shares The market share of these four major financial institutions has changed over time. In 1999,
the BOB, BNB, RICB and BDFC had 55.8 percent, 21.2 percent, 18.4 percent and 4.6
percent of the total assets of the financial institutions which changed to 49.0 percent, 38.9
percent, 6.2 percent and 5.9 percent respectively in 2008. While BOB and RICB shares have
declined, BNB has improved its position. In terms of loans and advances, BOB’s share
remained unchanged around 36 to 37 percent, whereas BNB share increased from 26.8
percent in 1999 to 42.5 percent in 2008. The RICB’s share in total loans decreased
substantially from 22.6 percent in 1999 to 10.1 percent in 2008 while BDFC’s share declined
from 14.7 percent in 1999 to 10.2 percent in 2008. BOB’s share on the total deposits of
Banks was 71.7 percent in 1999, which gradually declined to 55.8 percent in 2008 while
BNB’s share increased to 44.2 percent in 2008 from 28.3 percent in 1999.
e. Data Envelopment Analysis
11

The definition of performance or efficiency in a financial institution is really broad and it
depends on marketing strategy, organizational structure and human resource management
(Roth and van der Velde, 1991; 1992; Heskett, Sasser and Schlesinger, 1997). There are
different approaches to analyzing the efficiency and performance of financial institutions
which can be broadly categorized into parametric and non-parametric12.
DEA, which is a non-parametric approach, is liner programming technique which gives the
set of best practices showing the optimal relations between outputs and inputs (see Charnes et
al, 1978). We use popular DEA with different input-output variables for the efficiency
analysis.
We did an input oriented constant return to scale DEA. Three different DEA were done with
different input-output variables. In the first model, we used capital as input variable and
revenue and profit as output variables. In the second model, we used capital and employee
the as input variable and revenue and profit as output variable. In the third model, we used
assets, capital and employee as input variable and revenue and profit as output variables.
Table 2 Input-Oriented CRS Efficiency (Comparison of Different FIS for Year)
Inputs Capital Capital & Employee Assets, Capital & Employee
Output Revenue & Profit Revenue & Profit Revenue & Profit
Year BOB BNB RICB BDFC BOB BNB RICB BDFC BOB BNB RICB BDFC1999 0.99 1.00 0.55 0.33 0.99 1.00 0.55 0.33 0.99 1.00 0.58 1.00
2000 0.78 1.00 0.46 0.28 0.78 1.00 0.46 0.28 0.78 1.00 0.60 1.00
2001 1.00 1.00 0.87 0.38 1.00 1.00 0.87 0.38 1.00 1.00 1.00 1.00
2002 1.00 1.00 1.00 0.54 1.00 1.00 1.00 0.84 1.00 1.00 1.00 1.00
2003 1.00 0.76 1.00 0.66 1.00 1.00 1.00 0.91 1.00 1.00 1.00 1.00
2004 1.00 1.00 1.00 0.77 1.00 1.00 1.00 1.00 1.00 1.00 1.00 1.00
2005 0.71 1.00 0.97 0.82 0.71 1.00 0.97 0.82 0.71 1.00 1.00 1.00
2006 0.76 1.00 0.89 0.66 0.76 1.00 0.89 0.78 0.76 1.00 1.00 1.00
2007 0.76 1.00 0.82 0.44 0.76 1.00 0.82 0.49 0.76 1.00 1.00 1.00
2008 0.70 1.00 0.77 0.52 0.70 1.00 x0.77 0.52 0.70 1.00 1.00 1.00
12 See Berger and Humphery (1997) for complete review of 122 studies using alternative approaches.
12

Input-Oriented CRS Efficiency of FIs (Comparison of each financial institution across 10 years) BOB BNB RICB BDFC
DMU DEA 1 DEA 2 DEA 3 DEA 1 DEA 2 DEA 3 DEA 1 DEA 2 DEA 3 DEA 1 DEA 2 DEA 3
1999 0.98 0.98 0.98 0.81 0.81 0.81 0.61 0.61 0.61 0.92 0.92 0.92
2000 0.96 0.96 0.96 1.00 1.00 1.00 0.81 0.81 0.81 0.95 0.95 0.95
2001 1.00 1.00 1.00 0.89 0.96 0.99 1.00 1.00 1.00 0.80 0.80 0.81
2002 0.78 0.85 0.85 0.77 0.80 0.80 0.90 0.90 0.90 0.86 0.86 0.87
2003 0.69 0.90 0.90 0.43 0.62 0.80 0.78 0.78 0.78 0.99 0.99 0.99
2004 0.60 0.84 0.84 0.50 0.66 0.78 1.00 1.00 1.00 1.00 1.00 1.00
2005 0.50 0.70 0.70 0.58 0.80 0.92 0.82 0.96 0.96 1.00 1.00 1.00
2006 0.60 0.94 0.94 0.61 0.77 0.83 0.87 0.98 1.00 0.94 1.00 1.00
2007 0.55 0.88 0.88 0.61 0.87 0.96 0.84 1.00 1.00 0.87 0.87 0.98
2008 0.57 1.00 1.00 0.66 1.00 1.00 0.77 1.00 1.00 1.00 1.00 1.00
DEA 1: Inputs-Capital; Output-Revenue & Profit. DEA 2: Inputs-Capital & Number of employee; Output-Revenue & Profit. DEA 3: Inputs-Assets, Capital & Number of employee; Output-Revenue & Profit.
BOB being the banker to the government and government owned companies; its asset is
highly inflated when the large funds of government (revenue, grants etc.) and government
owned companies are deposited in the banks. But most of these large deposits are short term
and are withdrawn within short span of time. Therefore, BOB is not able to use short term
funds to generate revenue. Therefore, the assets are volatile and when used as one of the input
variables to measure efficiency, it produces misleading results. Hence, DEA result with assets,
capital and employee as input variable and revenue and profit as output variable shows Bank
of Bhutan (BOB) as the least efficient financial institution.
The DEA 1 (input variable: capital and output variable: revenue & profit) and DEA 2 (input
variable: capital & employee and output variable: revenue & profit) on efficiency produced
exactly similar result for 10 years during 1999 to 2008. The DEA 1 and DEA 2 show that
Bhutan National Bank (BNB) is the most efficient financial institution in the country from
1999 to 2008 except in 2003. In 2003, BOB and RICB turned out to be most efficient. Both
DEA 1 and DEA 2 show that BDFC has been the least efficient financial institution during
1999 to 2008 except in 2005. Taking BNB as benchmark, we observe that BDFC has been
less than 50 percent efficient in comparison with BNB for the years 1999, 2000, 2001 and
2007. The efficiency of RICB was 89 percent, 82 percent and 77 percent in 2006, 2007 and
2008 respectively in comparison to BNB. In 2006, 2007 and 2008, the efficiency of BOB was
76 percent, 76 percent and 70 percent respectively in comparison to BNB. In 2006, 2007 and
13

2008 the efficiency of Bank of Bhutan was 66 percent, 44 percent and 52 percent respectively
in comparison to Bhutan National Bank.
Overall, BOB has been the second most efficient financial institution in 1999 and 2000 and
most efficient from 2001 to 2004. Royal Insurance Corporation of Bhutan has been most
efficient in 2002, 2003 and 2004. From 2005 to 2008, Royal Insurance Corporation of Bhutan
has been the second most efficient financial institution after Bhutan National Bank.
f. Recent achievements The Bhutanese financial sectors in recent years have witnessed major positive changes
despite being impacted by the global melt down 13 . Tourism and hotel industries, major
contributors to the economy and livelihood of people, witnessed a decline in the tourist
arrivals. Also important ferro-silicon industries suffered due to fall in the prices of the ferro-
silicon products in the international market. The impact of the global melt down on the
tourism and steel industries tickled to the financial sectors due to credit exposure of over 3
billion to these two sectors. As a response to the crisis as well as improving performance in
the future, the ownership of the BOB has been transferred to Druk Holding Investment and
there have been major efforts to modernize banking services by using Flexcube CBS
technology in eight branches with the help of Tata Consultancy Services helping with
implementation of the same. With the upgrading in technology, BOB was able to introduce
convenient delivery channels like the SMS Banking and was also became the first bank to
introduce internet banking facilities on 28th May, 2009 in the country. BoB also has
constructed a $1.00 million, Tier-III, state of the art data centre, the first of its kind in Bhutan.
As Customer satisfaction is one of the major factors for the performance of banks (Roth and
van der Velde, 1991; 1992), it has been given highest priority nowadays and the Bank
regularly conducts feedback surveys to monitor customer satisfaction level. In order to
improve the services and customer conveniences, the Sunday banking was introduced on 30th
November, 2008 to provide 7 days services to the customers in addition to introduction of
ATM, internet and mobile banking to improve the customer satisfaction level. Coinciding
with the centenary and the coronation celebrations, BOB initiated social sector targeted loan
schemes (viz. Education, Ladies Plus and Pensioners) and have increased its loan base from 13 Although Bhutanese economy is weakly linked with the global economy, it was not completely immune from the global recession, so the global melt down affected the economy marginally.
14

6000 to 20,000 customers. Empowered by the CBS, extensive branches, network switch and
plans of installing 100 ATMs across the country, BOB will be able to provide “any time”,
“anywhere” banking in the country. The BOB has implemented the new organizational
structures in order to improve the functioning where as Zonal offices were created to enable
faster delivery of services. Initiatives to launch the IPO to increase the capital base and
diversify ownership base is in progress and it is expected to be launched by 201014. Another
initiative is to give scholarship to 60 BOB employee for masters and post graduate studies
outside in the next 10 years15. It has plans to send 3 senior officers every year for executive
programs.
Similarly, the BNB upgraded the Flexcube CBS technology with higher version and also
introduced new delivery channels like the SMS and internet banking besides ATMs. Further,
BNB hired the services of the Ernest and Young to re-structure the bank to face the
competition that is coming in the Bhutanese Financial Market with the introduction of two
commercial banks.
The RICB has implemented the voluntary retirement scheme to lean down the organization
and face the competition from Bhutan International Limited, a new insurance company which
was introduced in September 2009. The RICB has also introduced new products and reduced
the premium in their policies. BDFC has its corporate office in a new building and obtained
the license in principal to accept deposits and function as a rural bank.
g. Conclusions and Recommendations The financial sector in Bhutan has grown over a period of time both in terms of assets, loans
and investment, deposit base, revenue and profit. The return on capital (ROC) and return on
loan & investment (ROL) has been quite appreciable and comparable to international
standards. The analysis finds that in terms of ROC and also efficiency, Bhutan National Bank
has been the most efficient financial institution in Bhutan. The reason for high level of
efficiency could be that it started fresh with a manageable business size. In terms of liquidity
and capital adequacy, Bank of Bhutan seems to be more secured and stable while Bhutan
National Bank is much more leveraged. Therefore, Bank of Bhutan has much room to expand
further provided it improves it deposits, and does not lose out to new banks. 14 Currently BOB has also encouraged about 5 employees to undergo masters program in Thailand, Philippines, and Malaysia. Bank of Bhutan has also revised its service rules and come up with a ten year HRD master plan. 15 Under this 60 BoB employee scholarship scheme, BoB plans to send at least 6 officials every year for the next 10 years for postgraduate studies in internationally reputed universities. Bank also
15

With the growth in the Bhutanese economy due to implementation of several joint venture
power projects between Government of India and Royal Government of Bhutan, opening up
of the tourism sector, liberalizing the economy for FDI, establishing special economic zones,
liberalizing the power sector for the private sectors, establishing IT parks, allowing the
leasing of agricultural land for large agro-companies and establishment of new banks, the
Bhutanese financial sectors are expected to witness tremendous growth and major changes in
the next decade.
16

References
Al-Shammari, M; and Salimi, A. (1998). Modeling the operating efficiency of banks: a nonparametric methodology. Logistics Information Management 11(1):5-17.
Annual Report, Bank of Bhutan 1999 to 2008 Annual Report, Bhutan Development Corporation of Bhutan 1999 to 2008 Annual Report, Bhutan National Bank 1999 to 2008 Annual Report, Royal Insurance Corporation of Bhutan 1999 to 2008 Annual Report, Royal Monetary Authority of Bhutan 2007 Avkiran, K. N. (1999)., “The evidence on efficiency gains: The role of mergers and the benefits to the
public”. Journal of Banking and Finance 23 (7): 991-1013. A. V. Roth and M. van der Velde 1991. Customer-perceived quality drives retail banking in 90s. Bank
Management, pages 29–35, November 1991. A.V. Roth and M. van der Velde 1992. World Class Banking: Benchmarking the Strategies of Retail
Banking Leaders. Bank Administration Institute,1992. Bagehot, Walter. 1920. Lombard Street: A Description of the Money Market. New York: E.P. Dutton
and Company. Originally published in 1873. Barr, R.S. (2002). Evaluating the productive efficiency and performance of U.S. commercial banks.
Managerial Finance 28(8):3-25. Berger, A.N., Humphrey, D.B., (1997). Efficiency of financial institutions: International survey and
directions for future research, European Journal of Operational Research, Vol. 98, 175- 212. Charnes, A., Cooper, W.W., and Rhodes, E (1978), “Measuring the Efficiency of decision making
Units”, European Journal of operation Research, Vol2, PP. 429-444. Chen, T.Y.; and Yeh, T.L. (1998), “ A Study of efficiency evaluation in Taiwan’s Banks”,
International Journal of Service Industry Management 9(5):402-415. Goldsmith, R. W., (1969), ‘Financial Structure and Development’, New haven CT, yale University
Press. Grigorian, D.A. and V. Manole, (2002). ‘Determinants of commercial bank performance in transition:
An application of data envelopment analysis’, IMF Working Paper No.02/146. IMF, Washington D.C.
Havrylchyk, O., (2006), Efficiency of the Polish banking industry: Foreign versus Domestic banks, Journal of Banking and Finance, mimeo.
Herring, Richard J. and Anthony M. Santomero 1911, The Role of Financial Structure in Economic Performance, (in Swedish) SNS Forlag, Stockholm, 1991.
Heskett, J., Sasser, W. E., & Schlesinger, L. (1997). The Service Profit Chain. New York: The Free Press.
Jemric, I. and B. Vujcic., (2002), “Efficiency of banks in Croatia: A DEA approach”,. Comparative Economic Studies, Vol. 44, PP.69-193.
King, R.G and R. Levine, (1993) “Finance and growth: Schumpeter Might be Right” World bank working paper No 1083.
Levine, R and D. Renelt, (1992) “A sensitivity Analysis of Cross-country Growth Regressions” American Economic Review, Vol. LXXXII. PP 942-63.
Lucas, R. E Jr., (1988) “On the Mechanics of Economic Development” Journal of Monetary Economics, Vol. XXII, pp. 3-42.
Mankiw, N Gregory & Romer, David & Weil, David N, 1992. "A Contribution to the Empirics of Economic Growth," The Quarterly Journal of Economics, MIT Press, vol. 107(2), pages 407-37, May.
McKinnon, R. I, (1973), ‘Money and Capital in Economic Development, Washington, Brooking Institution.
Mukerjee, A.; Nath,P.; and Pal,M. N. (2002), “ Performance benchmarking and strategic homogeneity of Indian Banks”, International Journal of Bank Marketing 20(3):122-139.
Noulas, A. G. (2001), “Deregulation and operating efficiency: the case of Greek Banks”. Managerial Finance 27(8):35-47.
17

18
Hugh T. Patrick, Financial Development and Economic Growth in Underdeveloped Countries Economic Development and Cultural Change, Vol. 14, No. 2. (Jan., 1966), pp. 174-189.
Rangan, N., and Grabowski, R.( 1988), “ The technical efficiency of US banks” Economic Letters, 28, pp. 169-175.
Robert J. Barro, 1991. "Economic Growth in a Cross Section of Countries," NBER Working Papers 3120
Robinson, J (1952), ‘The generalization of the General Theory” in the Rate of Interest and other essays’, Macmillion, London.
Roubini, N. and X. Sala-i-Martin, (1992) “Financial Development, the Trade Regime and Economic Growth, NBER Working Paper No. 876.
Schumpeter, Joseph A. 1911, The Theory of Economic Development (Cambridge, MA: Harvard University Press, 1911)
Sturm, J.E. and B. Williams, (2004), “Foreign bank entry, deregulation and bank efficiency: Lessons from the Australian experience”, Journal of Banking & Finance, Vol. 28, 1775- 1799.
Worden, Robert L. (1991). "Banking and Credit". A Country Study: Bhutan (Andrea Matles Savada, editor). Library of Congress Federal Research Division (September 1991).
World Bank. (2010). Bhutan Economic Update. Economic Policy and Poverty, and Finance and Private Sector Team South Asia Region. The World Bank

Annexure 1: Performance Indicators of Bank of Bhutan 1999 2000 2001 2002 2003 2004 2005 2006 2007 2008 Avg. SDLeverage & Liquidity Loans & Investment/Capital Ratio 4.8 4.1 4.1 4.6 3.1 4.1 3.5 4.0 4.5 5.7 4.3 0.7 Loans & Investment/Total Assets (%) 29.2 24.6 27.7 30.2 23.5 32.2 26.9 29.4 31.1 41.2 29.6 4.9 Assets/Capital (%) 16.4 16.7 14.6 15.2 13.0 12.8 13.1 13.6 14.6 13.9 14.4 1.4 Loans & Investment to Deposits (%) 34.3 29.6 32.7 35.4 28.0 38.3 31.4 33.2 35.2 47.1 34.5 5.3 Profitability/Earning/Operation Return on Assets (ROA) % 1.0 1.0 1.8 1.2 1.4 1.2 0.9 1.2 0.9 0.8 1.1 0.3 Return on Capital (ROC) % 15.7 17.0 26.4 17.8 17.9 15.8 12.4 15.8 13.6 11.1 16.3 4.2Return on Loans & Investment (ROL) % 3.3 4.1 6.5 3.9 5.9 3.8 3.4 3.9 3.0 1.9 4.0 1.3 Revenue to Assets (%) 6.6 6.3 7.5 5.7 5.9 5.0 4.2 4.6 4.1 4.5 5.5 1.1 Net Interest Margin (Net Interest/Assets) 0.9 0.5 1.9 1.2 1.5 1.4 1.1 1.5 1.7 2.0 1.4 0.5 Productivity/Efficiency Loans & Investment per employees 5.1 4.8 5.8 7.2 5.7 8.3 7.0 9.0 10.4 14.5 7.8 3.0 Net Profit per Employee 0.2 0.2 0.4 0.3 0.3 0.3 0.2 0.4 0.3 0.3 0.3 0.1 Interest expense/total expenses (%) 77.2 81.7 80.9 83.2 80.7 74.9 70.7 66.4 59.6 59.7 73.5 9.0 Income and sources of fund Share of Interest Income (%) 74.1 70.5 78.9 78.2 76.4 73.4 74.5 72.5 75.8 75.0 74.9 2.6 Credibility or cost of fund: Interest Expense / Deposit (IE/D) (%) 4.6 4.8 4.7 3.9 3.6 2.8 2.4 2.1 1.7 1.6 3.2 1.3 Capital Adequacy Capital Funds / Total Assets (%) 6.1 6.0 6.8 6.6 7.7 7.8 7.6 7.4 6.9 7.2 7.0 0.6 Capital Funds/ Net Loans & Investment 20.8 24.4 24.7 21.8 32.7 24.2 28.3 25.0 22.1 17.4 24.1 4.2 Growth and Aggressiveness Growth of Assets (%) 13.9 12.0 22.5 2.9 11.5 9.6 17.5 14.5 7.3 12.4 5.7 Growth of Loans & Investment (%) -4.0 26.2 33.3 - 19.9 52.7 -8.4 28.5 21.1 42.3 19.1 24.5 Growth of Deposits (%) 11.1 14.2 23.4 1.2 11.6 11.6 21.5 14.2 6.4 12.8 6.8 Growth of profit (%) 21.9 98.4 -20.4 20.7 - 0.0 -16.3 44.5 -7.7 -8.6 14.7 37.8 Growth in Revenue (%) 9.8 33.0 -7.5 6.0 - 4.7 -7.6 28.5 2.7 17.0 8.6 15.0 Growth Reserve and Capital (%) 12.4 27.8 17.9 20.0 13.1 7.2 13.4 7.0 12.4 14.6 6.5 Market Shares Share to total assets (%) 55.8 58.9 59.4 61.1 59.0 58.0 57.3 56.1 57.6 49.0 57.2 3.3 Share to total loans & investment (%) 48.6 45.2 45.5 46.1 34.4 37.5 34.0 36.7 34.5 37.8 40.0 5.6 Share Deposits (%) 71.7 67.5 69.0 68.6 68.6 66.0 66.0 63.8 66.8 55.8 66.4 4.3
19

Annexure 2: Performance of Indicators: Bhutan National Bank 1999 2000 2001 2002 2003 2004 2005 2006 2007 2008 Avg. SDLeverage & Liquidity Loans & investment/Capital Ratio 4.6 3.8 4.0 6.2 4.4 6.7 6.2 6.9 7.7 7.6 5.8 1.5 Loans & Investment/Total Assets (%) 29.6 25.2 29.7 40.0 53.4 66.4 60.1 56.5 74.9 58.2 49.4 17.2 Assets/Capital 15.5 15.0 13.6 15.4 8.3 10.0 10.3 12.2 10.3 13.0 12.4 2.6 Loans & Investment to Deposits (%) 33.5 28.6 34.0 44.8 64.7 79.7 72.9 65.9 91.1 66.7 58.2 21.6 Profitability/Earning/Operation Return on Assets (ROA) % 1.7 2.7 1.9 0.8 1.0 1.2 1.9 1.9 2.4 1.9 1.7 0.6 Return on Capital (ROC) % 26.3 40.4 25.8 12.2 8.5 11.9 20.0 23.2 24.4 24.1 21.7 9.2Return on Loans & Investment(ROL) % 5.7 10.7 6.4 2.0 1.9 1.8 3.2 3.4 3.2 3.2 4.1 2.8 Revenue to Assets (%) 7.1 9.0 8.9 6.8 6.9 6.8 7.6 6.8 7.7 6.9 7.4 0.9 Net Interest Margin (Net Interest/Assets) (%) 2.9 3.1 2.8 2.1 3.0 3.4 4.0 3.8 5.3 3.7 3.4 0.9 Productivity/Efficiency
Loans & Investment per employees 6.2 6.7 7.4 11.1 13.1 19.9 16.1 17.4 24.4 25.0 14.7 7.0 Net Profit per Employee 0.4 0.7 0.5 0.2 0.3 0.4 0.5 0.6 0.8 0.8 0.5 0.2 Interest expense/total expenses (%) 70.3 75.8 79.7 76.9 72.7 67.8 67.4 62.7 60.2 62.8 69.6 6.6 Income and sources of fund diversification Share of Interest Income (%) 85.7 79.7 84.6 89.3 93.6 89.0 85.7 90.6 98.8 85.8 88.3 5.3 Credibility or cost of fund: Interest Expense / Deposit (IE/D) 3.6 4.6 5.4 4.4 4.2 3.1 3.1 2.7 2.8 2.5 3.7 1.0 Capital Adequacy Capital Funds / Tot Assets 6.5 6.7 7.4 6.5 12.0 10.0 9.7 8.2 9.7 7.7 8.4 1.9 Capital Funds/ Net Loans & Investment 21.8 26.4 24.7 16.2 22.5 15.0 16.2 14.5 13.0 13.2 18.4 5.0 Growth and Aggressiveness Growth of Assets 36.1 7.6 22.8 9.8 24.5 12.7 28.9 4.3 59.7 22.9 17.4 Growth of Loans & Investment 15.7 27.1 65.2 46.5 54.7 2.0 21.2 38.2 24.1 32.8 20.1 Growth of profit 73.4 6.2 -6.3 11.9 21.5 27.1 14.2 19.1 42.3 23.3 23.1 Growth in Revenue 115.1 -24.1 -48.7 42.0 43.9 85.2 26.5 30.1 24.4 32.7 49.6 Growth Reserve and Capital 40.3 19.0 8.3 103.3 3.2 9.9 8.8 23.9 26.1 27.0 30.9 Market Shares Share to total assets 21.2 26.7 25.9 26.7 27.5 30.2 30.6 32.9 30.8 38.9 29.1 4.8 Share to total loans & investment 18.7 21.0 21.3 26.7 36.4 40.3 40.6 41.3 44.4 42.4 33.3 10.2 Share Deposits 28.3 32.5 31.0 31.4 31.4 34.0 34.0 36.2 33.2 44.2 33.6 4.3
20

Annexure 3: Performance indicators of RICB 1999 2000 2001 2002 2003 2004 2005 2006 2007 2008 Avg. SDLeverage & Liquidity Loans & investment/Capital Ratio 6.0 9.0 8.4 6.0 5.3 4.5 4.3 3.7 3.6 3.6 5.4 1.9 Loans & Investment/Total Assets (%) 41.2 79.1 83.2 87.1 84.7 95.1 97.1 94.0 95.3 87.1 84.4 16.3 Assets/Capital 14.7 11.4 10.1 6.9 6.3 4.7 4.4 3.9 3.8 4.1 7.0 3.8 Profitability/Earning/Operation Return on Assets (ROA) % 1.0 1.6 2.3 3.1 2.9 5.0 4.4 5.3 5.3 4.5 3.5 1.6 Return on Capital (ROC) % 14.5 18.6 22.9 21.5 18.5 23.9 19.5 20.7 20.0 18.5 19.9 2.7Return on Loans & Investment(ROL) % 2.4 2.1 2.7 3.6 3.5 5.3 4.5 5.6 5.5 5.1 4.0 1.4 Revenue to Assets (%) 1.7 3.6 5.2 5.3 5.2 8.4 7.8 8.2 8.4 7.2 6.1 2.3 Productivity/Efficiency Loans & Investment per employees 5.0 6.1 8.3 7.4 8.0 8.3 10.0 9.7 11.3 12.3 8.6 2.2 Net Profit Per Employee 0.1 0.1 0.2 0.3 0.3 0.4 0.5 0.5 0.6 0.6 0.4 0.2 Income and sources of fund diversification Capital Adequacy Capital Funds / Tot Assets 6.8 8.8 9.9 14.5 15.9 21.1 22.6 25.4 26.3 24.2 17.5 7.3 Capital Funds/ Net Loans & Investment 16.5 11.1 11.9 16.7 18.7 22.2 23.2 27.0 27.6 27.7 20.3 6.2 Growth and Aggressiveness Growth of Assets -45.5 14.5 -12.8 12.1 -2.8 13.7 6.0 15.5 32.1 3.6 22.3 Growth of Loans & Investment 4.7 20.4 -8.7 9.1 9.1 16.1 2.5 17.1 20.8 10.1 9.7 Growth of Profit -9.8 59.1 19.9 5.3 67.0 -1.0 27.2 15.2 12.2 21.7 26.0 Growth in Revenue 16.7 67.4 -10.7 10.6 55.1 5.4 12.6 17.4 12.9 20.8 24.6 Growth Reserve and Capital -29.7 29.2 27.4 22.7 29.0 21.7 19.3 19.4 21.5 17.9 18.2 Market Shares Share to total assets 18.4 9.3 9.6 7.0 7.4 6.3 6.5 5.7 5.9 6.2 8.3 3.8 Share to total loans 21.8 23.6 21.9 18.5 17.8 13.8 15.7 12.8 11.6 10.1 16.7 4.7 Share to total loans & investment 22.6 23.0 22.1 15.3 15.5 12.1 13.9 12.0 10.9 10.1 15.7 5.0
21

Annexure 4: Performance indicators of BDFC 1999 2000 2001 2002 2003 2004 2005 2006 2007 2008 Avg. SDLeverage & Liquidity Loans & investment/Capital Ratio 1.7 1.6 1.9 2.3 2.6 2.3 2.3 2.0 2.4 2.7 2.2 0.4Loans & Investment/Total Assets (%) 73.5 69.8 79.6 93.2 90.3 91.0 94.1 85.3 93.3 87.3 85.7 8.7Assets/Capital 3.7 3.5 3.3 3.3 3.7 3.2 3.0 2.8 3.0 3.4 3.3 0.3Profitability/Earning/Operation Return on Assets (ROA) % 1.4 2.9 3.0 3.2 3.3 4.9 5.5 5.5 3.6 3.7 3.7 1.3Return on Capital (ROC) % 5.3 10.1 9.9 10.6 12.1 15.6 16.4 15.4 10.8 12.6 11.9 3.3Return on Loans & Investment(ROL) % 1.9 4.1 3.8 3.4 3.6 5.4 5.9 6.4 3.9 4.2 4.3 1.3Revenue to Assets (%) 10.0 10.8 9.7 10.3 10.6 12.1 11.8 11.9 11.6 11.5 11.0 0.9Interest Income / Assets % 8.8 9.2 8.6 10.0 10.3 11.8 11.6 11.3 11.2 11.0 10.4 1.2Net Interest Margin (%)= Net Interest/Assets
6.8 7.1 6.5 8.1 7.9 9.3 9.3 8.4 8.4 7.5 7.9 1.0
Productivity/Efficiency Loans & Investment per employees 3.5 3.8 5.2 6.8 8.4 8.7 8.7 8.1 9.7 10.6 7.4 2.4Net Profit Per Employee 0.1 0.2 0.2 0.2 0.3 0.5 0.5 0.5 0.4 0.4 0.3 0.2Income & sources of fund diversification Share of Interest Income % 88.4 85.4 89.0 96.9 97.3 97.2 97.8 95.3 95.9 95.2 93.8 4.5Capital Adequacy Capital Funds / Tot Assets 27.2 28.5 30.4 30.3 27.1 31.2 33.6 35.6 33.5 29.0 30.6 2.9Capital Funds/ Net Loans & Investment 37.0 40.8 38.2 32.5 30.0 34.3 35.7 41.7 35.9 33.2 35.9 3.7Growth and Aggressiveness Growth of Assets 16.9 12.6 20.6 26.5 2.6 11.3 14.5 19.0 32.5 17.4 8.7Growth of Loans & Investment 11.0 28.4 41.2 22.6 3.3 15.1 3.8 30.2 24.0 20.0 12.7Growth in Profit 135.6 17.7 28.1 29.1 53.2 25.7 13.7 21.1 33.8 35.1 42.6Growth of Revenue 26.9 0.5 29.1 30.1 16.9 8.8 15.0 16.6 31.3 19.5 10.7Growth Reserve and Capital 22.3 20.4 20.1 13.1 18.0 20.1 21.2 12.0 14.8 18.0 3.8Market Shares Share to total assets 4.6 5.0 5.1 5.1 6.1 5.5 5.5 5.3 5.6 5.9 5.4 0.4Share to total loans 14.7 14.5 14.8 15.1 16.4 11.9 13.4 11.1 11.1 10.2 13.3 2.1Share to total loans & investment 10.1 10.9 11.2 12.0 13.7 10.1 11.5 10.0 10.1 9.7 10.9 1.2
22

23
Annexure 5: Growth and Size of Financial Institution 1999 2000 2001 2002 2003 2004 2005 2006 2007 2008BOBL Assets 7,417.7 8,449.8 9,467.3 11,598.9 11,935.5 13,303.8 14,585.2 17,141.3 19,630.2 21,069.3
Loans & Investment 2,167.1 2,081.4 2,626.2 3,501.2 2,806.2 4,284.1 3,924.8 5,041.6 6,103.5 8,686.8
Deposits 6,323.3 7,025.8 8,025.2 9,901.5 10,019.5 11,184.3 12,486.4 15,174.5 17,330.2 18,436.8
Revenue 488.7 536.5 713.5 660.0 699.6 667.1 616.6 792.2 813.4 951.7
Net Profit 70.6 86.1 170.8 136.1 164.2 164.2 137.5 198.6 183.3 167.6
Operating Expenses 86.5 75.9 89.8 77.0 85.4 104.0 122.5 164.0 196.1 197.5
Reserve and Capital 451.3 507.4 648.2 764.6 917.3 1,037.3 1,111.7 1,260.3 1,348.2 1,515.8
BNBL Assets 2,816.1 3,831.5 4,124.2 5,062.7 5,559.3 6,921.6 7,799.4 10,051.8 10,481.1 16,734.0
Loans & Investment 834.0 964.7 1,226.5 2,026.4 2,969.5 4,593.8 4,685.4 5,679.5 7,850.2 9,740.0
Deposits 2,489.9 3,376.1 3,610.2 4,522.2 4,587.1 5,761.6 6,424.6 8,622.9 8,614.8 14,601.4
Revenue 199.2 345.4 366.8 343.8 384.9 467.7 594.5 678.7 808.1 1,149.6
Net Profit 47.9 102.9 78.1 40.1 56.9 81.9 151.6 191.8 249.5 310.4
Operating Expenses 37.6 49.8 50.2 60.1 71.6 85.8 96.2 140.5 162.2 217.2
Capital, Reserve and RE 181.8 254.9 303.3 328.5 668.0 689.5 757.9 824.6 1,021.7 1,288.7
RICBL Assets 2,452.6 1,336.8 1,530.1 1,334.0 1,495.3 1,454.0 1,652.9 1,751.3 2,023.0 2,672.8
Loans & Investment 1,009.9 1,057.1 1,272.8 1,161.7 1,267.2 1,382.3 1,605.1 1,645.5 1,927.3 2,329.1
Deposits Net Profit 24.2 21.9 34.8 41.7 43.9 73.3 72.6 92.3 106.3 119.3
Operating Expenses 6.0 12.9 29.8 11.4 15.8 16.8 14.7 12.5 17.6 21.0
Capital, reserve and RE 167.1 117.6 151.9 193.6 237.5 306.4 373.0 445.1 531.5 646.0
BDFC Assets 614.7 718.6 809.3 976.3 1,234.8 1,266.6 1,410.3 1,614.8 1,921.5 2,546.2
Loans & Investment 451.7 501.5 643.9 909.5 1,115.4 1,152.5 1,327.1 1,377.0 1,792.8 2,222.3
Deposits Revenue 61.2 77.7 78.1 100.8 131.2 153.3 166.9 191.8 223.7 293.8
Profit 8.8 20.7 24.4 31.3 40.4 61.8 77.7 88.3 69.6 93.2
Operating Expenses 27.7 25.6 25.9 31.8 35.9 37.3 48.9 51.7 69.7 75.0
Capital & Reserves 167.2 204.5 246.2 295.8 334.7 394.9 474.4 574.8 643.5 738.6

Annexure 6: Key Indicators Item 1998/99 1999/00 2000/01 2001/02 2002/03 2003/04 2004/05 2005/06 2006/07 2007/08(p)
GDP Growth and Prices (percent change) GDP at Constant(2000) Price (a), (b) 6.1 7.9 7.9 6.8 10.9 7.2 6.8 6.5 6.3 21.4Consumer Prices (c) 9.2 3.6 3.6 2.7 1.8 4.6 5.5 6.2 5.9 8.8Wholesale Prices (India) (d) 2.5 5.3 6.6 1.7 5.7 5.6 5.2 4.6 5.4 9.6
Government Budget (in millions of Nu.) (e) Total Revenue & Grants 6,919.5 7,859.5 8,686.7 8,826.7 7,054.3 11,113.9 10,501.1 13,452.2 16,082.1
Of which: Foreign Grants 3,262.6 3,274.1 3,711.0 3,748.5 2,269.1 5,367.4 4,373.1 6,424.7 6,000.0Total Expenditure and Net Lending 7,224.4 8,624.1 11,177.6 10,052.1 9,945.3 10,534.1 12,893.7 13,770.9 15,795.0
Money and Credit (% change, end of period) Broad Money, M2 21.4 20.3 6.4 17.6 43.6 4.4 10.7 26.3 8.6Credit to Private Sector 5.2 4.1 57.1 27.7 23.4 32.8 26.3 32.2 35.5
Interest Rates (end of period) One Year Deposits 10.0 9-10 9-10 9.0 7.0 6.0 4.5 4.5 4.5Lending Rate 13-16 12-16 12-16 12-16 12-16 10-16 10-16 10-16 10-1691-day RMA Bills 7.5 7.3 6.9 4.7 3.5 3.5 3.5 3.5 3.5
External Indicators (end of period) Gross Official Reserves in Millions of USD 258.3 291.1 292.6 315.3 373.3 383.3 366.5 478.8 600.4 645.7
(In months of merchandise imports) 19.3 19.3 19.0 18.9 21.2 17.6 9.3 13.6 13.3 14.6 External Debt (percent of GDP) 39.8 44.6 54.8 61.6 73.6 81.8 82.2 84.6 79.2 61.1 Debt-Service Ratio (f) 12.1 4.9 4.7 4.9 6.8 6.8 11.9 7.6 3.6 23.2
Trade Balance -2,453.7 -3,087.3 -4,059.1 -4,795.5 -4,481.0 -4,766.0 - -5,496.7 2,061.8 -3,086.2 With India -738.3 -1,354.5 -2,654.3 -3,088.3 -3,911.3 -3,820.7 -3,601.2 -3,170.7 4,447.6 -853.2Current Account Balance 384.2 1,049.6 -2,024.6 -3,127.4 -4,011.9 -3,318.0 - -1,695.7 6,417.2 2,089.0 (In percent of GDP) 2.4 5.7 -10.1 -13.7 -15.3 -11.3 -32.4 -4.6 15.9 3.9 With India -921.4 1,537.5 -1,918.3 -2,327.1 -4,479.3 -3,420.8 -5,253.9 -2,344.6 5,882.1 1,559.7 (In percent of GDP) -5.8 8.4 -9.6 -10.2 -17.1 -11.7 -16.3 -6.4 14.5 2.9Memorandum Items:
Nominal GDP (in millions of Nu.) (a), (b) 15,813.7 18,326.5 20,111.7 22,895.0 26,422.2 29,385.6 32,320.0 36,462.6 40,448.1 51,521.5Money Supply, M2 (end of period) 7,359.2 8,851.6 9,419.8 11,076.9 15,904.7 16,597.7 18,376.9 23,208.7 25,208.7Money Supply, M1 (end of period) 2,868.4 3,612.7 4,477.9 5,019.5 7,502.5 8,524.7 9,331.9 10,678.1 13,542.3
Reserve Money , M0, of which 4,464.0 4,872.0 4,631.9 5,937.6 8,008.0 9,370.3 9,340.1 13,474.7 13,319.6Money Multiplier (M2/M0) 1.6 1.8 2.0 1.9 2.0 1.8 2.0 1.7 1.9Income Velocity (GDP/M2) 2.1 2.1 2.1 2.1 1.7 1.8 1.8 1.6 1.6Population Growth Rate (a), (g), (h) - - - 3.1 2.4 1.3 2.5 1.3 1.3Unemployment Rate (a), (g),(h) - - - 1.9 - 1.8 2.5 3.1 3.2
24

No. Author(s) Title
255 Mitsuhiro KAGAMI Recent Trends in Asian Integration and Japanese Participation 2010
254 Hisaya ODA, Yuko TSUJITA The Determinants of Rural Electrification in Bihar, India 2010
253Kiyoyasu TANAKA, Naomi
HATSUKANOThe Size Distribution of All Cambodian Establishments 2010
252Kazunobu HAYAKAWA, Fukunari
KIMURA, Tomohiro MACHIKITAGlobalization and Productivity: A Survey of Firm-level Analysis 2010
251Kuo-I CHANG, Kazunobu
HAYAKAWA, Toshiyuki MATSUURA
Location Choice of Multinational Enterprises in China: Comparison
between Japan and Taiwan2010
250Kazunobu HAYAKAWA, Kiyoyasu
TANAKA, Yasushi UEKIAre Trading Partners Complementary in International Trade? 2010
249Takeshi INOUE, Shigeyuki
HAMORI
How Has Financial Deepening Affected Poverty Reduction in India?
Empirical Analysis Using State-Level Panel Data2010
248 Hisatoshi HOKENRestoration of Micro Data of John Lossing Buck‟s Survey and Analysis of the
Inverse Relationship between Yield and Farm Size in Rural China in the 1930‟s2010
247 Quoc Hung NGUYEN Liability Dollarization and Fear of Floating 2010
246 Hideki HIRAIZUMI Trade of Heilongjiang Province (China) with Russia 2010
245 Abu S SHONCHOYThe Dynamics of Spending and Absorption of Aid: Panel Data
Analysis2010
244 KHOO Boo TeikCyber-networks, physical coalitions and missing links: Imagining and
realizing dissent in Malaysia 1998–20082010
243 Miwa TSUDA Kenya's 2007 Election Crisis 2010
242 Takeshi INOUEEffectiveness of the Monetary Policy Framework in Present-day
India: Have Financial Variables Functioned as Useful Policy
Indicators?
2010
241 Kiyoyasu TANAKATransport Costs, Distance, and Time: Evidence from the Japanese
Census of Logistics2010
240 Takeshi KAWANAKAPolical Institutions and Policy Outcomes: Effects of Presidential
Vetoes on Budget Making2010
239KHOO Boo Teik and Vedi R.
HADIZ
Critical Connections: Islamic Politics and Political Economy in
Indonesia and Malaysia2010
238 KHOO Boo TeikSocial Movements and the Crisis of Neoliberalism in Malaysia and
Thailand2010
237Ikuo KUROIWA
Hiromichi OZEKI
Intra-regional Trade between China, Japan, and Korea: Before and
After the Financial Crisis2010
236 KHOO Boo Teik No Insulation: Politics and Technocracy‟s Troubled Trajectory 2010
235 Koichi KAWAMURA Is the Indonesian President Strong or Weak? 2010
234Toshiyuki MATSUURA, Kiyoyasu
TANAKA, Shujiro URATA
The Determinants of Offshore Production by Multinational
Corporations (MNCs): A Comparison of Japanese and US MNCs2010
233 Takeshi KAWANAKA Interaction of Powers in the Philippine Presidential System 2010
232 Takahiro FUKUNISHIFDI and Export particiaption of Local Firms in Africa: The Case of
the Kenyan Garment Industry2010
231 Hitoshi SUZUKIA Critical Review of Opinion Polls relating to Iranian Voting Intentions:
Problems of Research Methodology as applied to Complex Societies2010
230 Mai FUJITAThe Diversity and Dynamics of Industrial Organisation: Transformation of
Local Assemblers in the Vietnamese Motorcycle Industry2010
229 Miki HAMADA, Masaru KONISHI Related Lending and Bank Performance: Evidence from Indonesia 2010
228 Hisao YOSHINO Strategic Trade Policy and Non-Linear Subsidy 2010
~Previous IDE Discussion Papers ~

No. Author(s) Title
227 Masahiro KODAMALarge Fluctuations in Consumption in Least Developed Countries
2010
226 Chiharu TAMAMURACost Reduction Effects of “pseudo FTAs” in Asia -Application of a Price
Model Based on a Multilateral I/O Table- 2010
225 Koji KUBO Natural Gas Export Revenue, Fiscal Balance and Inflation in Myanmar 2010
224 Mariko WATANABESeparation of Control and Lash-flow Rights of State Owned Listed
Enterprises: Channels of Expropriation following Discriminated Share Reform
in China
2010
223 Haruka I. MATSUMOTO The Taiwan Strait Crisis of 1954-55 and U.S.-R.O.C. Relations 2010
222 Miwa TSUDAThe Experience of National Rainbow Coalition (NARC): Political
Parties inKenya from 1991 to 20072010
221 Kensuke KUBOInferring the Effects of Vertical Integration from Entry Games: An
Analysis of the Generic Pharmaceutical Industry2010
220Ikuo KUROIWA
Hiroshi KUWAMORI
Shock Transmission Mechanism of the Economic Crisis in East Asia:
An Application of International Input-Output Analysis2010
219 Yuri SATO, Mai FUJITACapability Matrix: A Framework for Analyzing Capabilities in Value
Chains2009
218Soya MORI, Tatsufumi
YAMAGATA
Measurements to Assess Progress in Rights and Livelihood of Persons
with Disabilities: Implications Drawn from the IDE-PIDS Socio-
Economic Survey of PWDs
2009
217 Omar Everleny Pérez VillanuevaThe Cuban Economy: A Current Evaluation and Proposals for
Necessary Policy Changes2009
216Takeshi INOUE, Shigeyuki
HAMORI
What Explains Real and Nominal Exchange Rate Fluctuations?
Evidence from SVAR Analysis for India2009
215 Nu Nu Lwin Analysis on International Trade of CLM Countries 2009
214 Koichiro KIMURAThe Technology Gap and the Growth of the Firm: A Case Study of
China‟s Mobile-phone Handset Industry2009
213 Soshichi KINOSHITAThe Effect of Product Classifications on the Formulation of Export
Unit Value Indices2009
212Kazunobu HAYAKAWA, Zheng JI,
Ayako OBASHI
Agglomeration versus Fragmentation: A Comparison of East Asia and
Europe2009
211Kazunobu HAYAKAWA, Toshiyuki
MATSUURA
Complex Vertical FDI and Firm Heterogeneity: Evidence from East
Asia2009
210 Hajime SATO The Iron and Steel Industry in Asia: Development and Restructuring 2009
209Hiroko UCHIMURA, Yurika
SUZUKIMeasuring Fiscal Decentralization in the Philippines 2009
208 Kazunobu HAYAKAWA Market Access and Intermediate Goods Trade 2009
207
Kazunobu HAYAKAWA, Daisuke
HIRATSUKA, Kohei SHIINO, Seiya
SUKEGAWA
Who Uses FTAs? 2009
206 Ikuko OKAMOTOIssues Affecting the Movement of Rural Labour in Myanmar: Rakhine
Case Study2009
205 Takao TSUNEISHIBorder Trade and Economic Zones on the North-South Economic
Corridor: Focusing on the Connecting Points between the Four
Countries
2009
204Ando ASAO
Bo MENG
Chao QU
Trade Coefficients and the Role of Elasticity in a Spatial CGE Model
Based on the Armington Assumption2009
203 Toshihiro KUDOLocation Advantages and Disadvantages in Myanmar:The Case of
Garment Industry2009
202 Yasushi HAZAMA Economic Voting and Electoral Volatility in Turkish Provinces 2009
201 Tatsuya SHIMIZUStructural Changes in Asparagus Production and Exports from
Peru2009
200Takeshi INOUE,
Shigeyuki HAMORI
An Empirical Analysis of the Monetary Policy Reaction
Function in India2009
199 Yuko TSUJITADeprivation of Education in Urban Areas: A Basic Profile of
Slum Children in Delhi, India2009
No. Author(s) Title
198 Kaoru MURAKAMIConstructing Female Subject: Narratives on Family and Life
Security among Urban Poor in Turkey2009
197 Akiko YANAINormative Influences of "Special and Differential Treatment"
on North-South RTAs2009
196 Hisaya ODAPakistani Migration to the United States:
An Economic Perspective2009
195 Yukihito SATOPerfecting the Catching-up: The Case of Taiwan‟s Motorcycle
Industry2009
194 Natsuko OKAEthnicity and Elections under Authoritarianism: The Case of
Kazakhstan2009
193 Futaba ISHIZUKAVietnamese Local State-owned Enterprises (SOEs) at the
Crossroads: Implications of SOE Restructuring at the Local
Level
2009
192 Yasushi HAZAMAConstitutional Review and Democratic Consolidation: A
Literature Review2009
191 Hisao YOSHINOTechnology Choice in the IT Industry and Changes of the Trade
Structure2009
190 Toshikazu YAMADAIn Memory of Dr. Ali Al-Gritly (1913-1982): His Views on
Egypt‟s Experience with Socialism2009
189 Kanako YAMAOKAThe Feasibility of Cuban Market Economy: A Comparison with
Vietnam2009
188Tomohiro MACHIKITA, Yasushi
UEKI
Linked versus Non-linked Firms in Innovation: The Effects of
Economies of Network in Agglomeration in East Asia2009
187 Hisao YOSHINOFinancial Policies and Dynamic Game Simulation in Poland
and Hungary2009
186 Kazushi TAKAHASHIIs South Sulawesi a Center of Growth in Eastern Indonesia?:
Japanese ODA Strategy Revisited2009
185Bo MENG,
Satoshi INOMATA
Production Networks and Spatial Economic Interdependence:
An International Input-Output Analysis of the Asia-Pacific
Region
2009
184
Bo MENG,
Nobuhiro OKAMOTO,
Yoshiharu TSUKAMOTO,
Chao QU
Input-Output Based Economic Impact Evaluation System for
Small City Development: A Case Study on Saemangeum's Flux
City Design
2009
183
Nobuhiko FUWA, Seiro ITO,
Kensuke KUBO, Takashi
KUROSAKI, and Yasuyuki
SAWADA
How Does Credit Access Affect Children's Time Allocation in
a Developing Country? A Case Study from Rural India2009
182Moriki OHARA
Yuri SATO
Asian Industrial Development from the Perspective of the
Motorcycle Industry2008
181 Takeshi KAWANAKA Political Conditions for Fair Elections 2008
180 Takeshi INOUEThe Causal Relationships in Mean and Variance between Stock
Returns and Foreign Institutional Investment in India2008
179 Naoko AMAKAWAReconstruction and Development of Rural Cambodia--From
Krom Samakki to Globalization--2008
178Kazunobu HAYAKAWA,
Toshiyuki MATSUURA
Pitfalls of Location Choice Analysis: The Finished Goods
Producer versus the Intermediate Goods Producer2008
177 Yoko ASUYAMAThe Contribution of Supply and Demand Shifts to Earnings
Inequality in Urban China2008
176 Yoko ASUYAMAChanges in the Causes of Earnings Inequality in Urban China
from 1988 to 20022008
175 Satoshi INOMATA
A New Measurement for International Fragmentation of the
Production Process:
An International Input-Output Approach
2008
No. Author(s) Title
174Mayumi MURAYAMA,
Nobuko YOKOTA
Revisiting Labour and Gender Issues in Export Processing
Zones: The Cases of South Korea, Bangladesh and India2008
173 Masahiro KODAMAThe Impact of Unstable Aids on Consumption Volatility in
Developing Countires2008
172 Hiroshi OIKAWA
Empirical Global Value Chain Analysis in Electronics and
Automobile Industries: An Application of Asian International
Input-Output Tables
2008
171 Eiichi YOSHIDA
Transformation of Woodworking and Furniture Industrial
Districts in Kampala, Uganda: Dichotomous Development of
SME Cluster and Large Firm Sector
2008
170 Azusa HARASHIMAThe Impact of Tobacco Production Liberalization
on Smallholders in Malawi2008
169
Zaid Bakht, Md. Salimullah,
Tatsufumi Yamagata, and
Mohammad Yunus
Competitiveness of the Knitwear Industry in Bangladesh: A
Study of Industrial Development amid Global Competition2008
168 Hitoshi OTA Indian IT Software Engineers in Japan: A Preliminary Analysis 2008
167 Hiroshi OikawaTNCs in Perplexity over How to Meet Local Suppliers:
The Case of Philippine Export Processing Zone2008
166Takeshi INOUE, Shigeyuki
HAMORIAn Empirical Analysis of the Money Demand Function in India 2008
165 Mayumi MURAYAMARe-Examining „Difference‟ and „Development‟: A Note on
Broadening the Field of Gender and Development in Japan2008
164 Jose Luis CORDEIRO Constitutions aroumd the World: A View from Latin America 2008
163 Takahiro FUKUNISHIClothing Export from Sub-Saharan Africa: Impact on Poverty
and Potential for Growth2008
162 Koichi USAMIRe-thinking Argentina's Labour and Social Security Reform in
the 1990s: Agreement on Competitive Corporatism2008
161 Mai FUJITAValue Chain Dynamics and the Growth of Local Firms: The
Case of Motorcycle Industry in Vietnam2008
160Kazunobu HAYAKAWA,
Kuo-I CHANG
Border Barriers in Agricultural Trade and the Impact of Their
Elimination: Evidence from East Asia2008
159
Satoru KUMAGAI, Toshitaka
GOKAN, Ikumo ISONO,
Souknilanh KEOLA
The IDE Geographical Simulation Model: Predicting Long-
Term Effects of Infrastructure Development Projectso2008
158 Satoru KUMAGAIA Journey through the Secret History of the Flying Geese
Model2008
157 Satoru KUMAGAIA Mathematical Representation of "Excitement" in Games: A
Contribution to the Theory of Game Systems2008
156Kazunobu HAYAKAWA,
Fukunari KIMURA
The Effect of Exchange Rate Volatility on International Trade:
The Implication for Production Networks in East Asia2008
155 Kazunobu HAYAKAWAThe Choice of Transport Mode: Evidence from Japanese
Exports to East Asia2008
154 Jose Luis CORDEIROMonetary Systems in Developing Countries: An Unorthodox
View2008
153 Takao TSUNEISHI
Development of Border Economic Zones in Thailand:
Expansion of Border Trade and Formation of Border Economic
Zones
2008
152 Nguyen Binh GiangImproving the Foreign Direct Investment Capacity of the
Mountainous Provinces in Viet Nam2008
151 Syviengxay OrabouneInfrastructure (Rural Road) Development and Poverty
Alleviation in Lao PDR2008
150 Chap MolyInfrastructure Development of Railway in Cambodia: A Long
Term Strategy2008
Copyright © 2022 FDOKUMEN