More than Human: A Critical Evaluation of the Intersection of ...
Upload
khangminh22Category
view
0download
0
Nat. Volatiles & Essent. Oils, 2021; 8(4): 15651-15663
15651
Analysis Of Financial Performance And Critical Evaluation Of
The Bsnl Voluntary Retirement Scheme
Dr. Jojomon N A
Designation: Associate Professor of Commerce and Research Guide Post Graduate and Research Department
of Commerce Panampilly Memorial Government College, Potta PO 680722, Chalakudy, Thrissur Dt. Kerala.,
India.
Abstract
Financial analysis identifies the financial strengths and weaknesses of the company by establishing a proper relationship
between the budget item and the profit and loss account. The aim of the study is to analyse the financial performance of
BSNL for the five-year period (2015 to 2019) as well as the critical evolution of the VRS scheme. Voluntary Retirement
Scheme (VRS) is the fact that an individual absolutely stops to be working. The employee may also be semi-retired by
reducing working hours. Numerous workers prefer to resign when they are eligible for private or public pension payments,
while others are required to withdraw as health disabilities no longer enable employees to operate or as a consequence of
laws related to their job. Financial analysis refers to the process of measuring the company's operating and financial
characteristics from the accounting and financial statements. The objective of this analysis is to determine the efficiency
and performance of the management of the company by comparing the five-year balance sheet and its impact on the
evolution of the VRS scheme. The research is an effort to calculate the profitability, liquidity and other indicators of the
business carried out in a reasonable and natural manner by carrying out the analysis of the ratio; it is a method of
interpretation and analysis of the financial statements. It is the process of establishing and interpreting the different ratios
of aid to decision-making. Ensure the return to shareholders to maintain at least its market value. The study showed why
BSNL decided to implement the VRS system.
Key words: Profitability, liquidity, Ratio analysis, Voluntary Retirement Scheme (VRS), Evolution of the VRS scheme.
1 Introduction
With the liberalisation of the Government of India, a new policy plan for major reforms in the
manufacturing and corporate sectors has been introduced. The Government also made it easier for
company and commercial enterprises to reduce the surplus of workers and employees. This
culminated in the modernization of the company leading to the modernisation, the incorporation of
emerging technologies and the introduction of innovative working methods. Thus, on the basis of
the above findings, industrial organisations must work efficiently to survive competition. According
to the Industrial Disputes act 1947, there were several legal barriers and nuanced processes, the
government approved voluntary retirement schemes for workers with acceptable voluntary
retirement compensation, and tax exemption for such compensation to workers who qualify for
voluntary retirement schemes in compliance with the recommendations provided by the
Nat. Volatiles & Essent. Oils, 2021; 8(4): 15651-15663
15652
Government. Furthermore, the powerful reaction of the labour unions to the loss in workers and
working force contributes to difficulties in employment relations. It is also important to find a means
of encouraging businesses , particularly those in government undertakings, to provide voluntary
retirement schemes to offload excess labour without experiencing workplace relations issues. The
voluntary retirement scheme is a mechanism implemented by corporations to decrease the amount
of workers hired. It is a popular tool used to minimize surplus personnel in order to boost the
efficiency of the company.
Majority communication needs of citizens were being met by Government initially through
Department of Telecommunications (DOT) in India till 1990s, later financial liberation era,
Government of India allowed private Telecom operators. In year 2000, Telecom services delivery
wing of DOT, i.e. Department of Telecom Operations transformed as 100% Government of India
owned Public Sector Unit as Bharat Sanchar Nigam Limited (BSNL) on 1st Oct 2000. At present, in
India, both Private telecom service providers including state run PSUs viz., BSNL / MTNL (MTNL
operates in Delhi & Mumbai only, rest of India by BSNL) are serving the telecommunications needs
of the nation.
However, owing to the subsequent predatory market conditions, the whole telecom sector came
under stress and BSNL also remained no exception to it. The revenues started taking nosedive and
expenditure started moving up owing to the tough market scenario. However, still BSNL deserves
credit for keeping the Market Share in upward direction despite the extremely adverse conditions all
these years. BSNL remained self dependent and almost debt free which is basically in sharp contrast
to the other telecom players who have been severely debt ridden owing to the huge loans taken
from banks and other financial institutions. BSNL’s revenues for FY15 stood at ₹28,645 crore, which
rose to ₹32,918 crore in FY16 and then fell to ₹31,532 crore in FY17. The revenues further fell to
₹25,070 in FY18 and ₹19,308 in FY19.The Telecom Market went through a major disruption with the
introduction of low tariffs and cut-throat competition among the private players. The disruption
caused BSNL bleed out a loss of Rs 4,786 crore in 2016-17, Rs 89 crores lower than Rs 4,875 crore in
2015-16, but a great recovery when comparing to the loss of Rs 8,234 crore in 2014-15. It further
went down by a whisker to Rs 4,785 crore in 2017-18. BSNL has a huge legacy workforce. The work
force of BSNL is 1, 53,786. Majority (about 70%) of this workforce was transferred to BSNL from DOT
at the time of formation of BSNL. The workforce of BSNL has an average age of more than 55 years
(especially in the group “C” and “D” staff). As a part of Revival of BSNL, Government of India
announced VRS-2019 on 23rd October 2019 to reduce staff strength and thereby reducing salary bill
of the company.
1.2 Option for VRS towards BSNL Employees
BSNL (Sanjay Singh, 2011) was carved out of DOT (Department of Telecommunication) in October
2000. Around 300 employees retired from service, while the remaining officers are expected to join
in the newly formulated entity BSNL. But at that period, the officers were in a dilemma, for them
BSNL gave the direction of either joining in its division or to opt out of Voluntary Retirement
Scheme. This twin move had left the employees baffled. BSNL had submitted the proposal of VRS to
the DOT for employees who attained the age of 45 years and also have served as regular employees
in BSNL for 15 years. Industry observers felt that the fate of BSNL is at stake. They feel that these
developments will create a massive vacuum in BSNL which will not only affect the basic functioning

Nat. Volatiles & Essent. Oils, 2021; 8(4): 15651-15663
15653
of the company but will also affect other operators as well. Those who opt for VRS will ensure that
the employee get an ex- gratin amount of 60 days salary (Basic + Dearness Allowances) for each
completed year of service or the salary for the number of months left in the service, whichever is
less. However, the compensation would be subjected to a maximum of 60 months‟ salary. The ex-
gratin amount will be in addition to the benefits of normal retirement.
2. Literature Review
In view of (Sudarshanam,2012) it is explored that the respondents reported that they had opted for
VR because they felt that they would get better jobs in other organizations in view of their long
experience and skill background. It was concluded from the analysis that the economic and social
compulsions acted as the predominant force for accepting VRS.
Researchers (Das and Naeem ,2017 ) argued that there is a gap in factors that need to be discussed
by the management of the country's organisations and planners and decision makers. They
concluded that it is counter to the clear HR policies and procedures of every company and plays a
detrimental position in the Employer Branding Scheme, whether VRS or CRS. According to (Masih &
Tripathi ,2013) the study found that BHEL employees had positively viewed VRS whereas ITI
employees had a negative view of VRS because various strategies had been implemented in ITI
management to render this strategy aggressively voluntary, which led to some revolt in the
organisation. The findings from (Sivasankaran & Vadivel, 2016 ) indicate that the CRS / VRS
respondents were not quite happy with their retirement package. In addition, the holders are
influenced by personalities owing to retirement. In comparison, certain citizens thought like their
ambitions had disappeared and that they had damaged their self-confidence, etc.
Researchers (Ahmeda & Wangb , 2018 ) assessed that existing retirement trends in Zanzibar were
appreciative with sufficient coverage of public sector workers, albeit distinguished by unreliable
benefits. Furthermore, the desire to remain in jobs has been favourably associated with the
retirement age and the career status of the company. According to ( Kumar & Nishi Tripathi , 2015),
workers thought that the VRS strategy was just fine for the business but not for the employee. Also,
this influence of VRS was attributed to their experience , age and graduation before they opted for
VRS. In addition, they suggested that the workers' preferences in terms of compensation, like in
certain instances, were those of workers who had already opted for VRS. ( Suri and Poonam, 2013)
studies showed that the most significant factors for males to select were the opportunity for more
jobs, the monotony in their current career, the transition of self or spouse and their desire to set up
their own company with the aid of the financial benefits they earned after their voluntary
retirement. Women 's key motives for opting for VRS were to settle infants, ill health of their own or
relatives, relocation of spouse or themselves, dismissal of work or abilities, spend more time with
their families, which, according to them, they were unable to do because of their busy schedule at
work. The findings of (Aggarwal , 2007 ) indicate that variations in household characteristics were
some of the possible explanations why some employees opted for VRS, while others, while qualified,
did not find it attractive.
The Dutch (Vermeer, 2016) poll of public opinion about what jobs are challenging, whether it is
justified that anyone with a demanding profession should retire sooner, and whether it is willing to
contribute to the quicker retirement scheme for those professions by higher taxes. The research
(Sanjay Kumar , 2015) reveals the effect of VRS on the assumption that, owing to their income, age
Nat. Volatiles & Essent. Oils, 2021; 8(4): 15651-15663
15654
and degree, before opting for VRS, the research also projects employees' preferences in terms of
rewards, as in most cases employees who have already opted for VRS implied that the organisation
could continue to provide a medical service, even though the employee has used VRS because the
medical justification is one of the significant ones. The marriage of daughters, the redemption of
loans and the conditions of the families have emerged as one of the key explanations for the need
for money in Indian society. Employees worked hard all the life to create a nest egg, so it just makes
sense to want a smooth retirement free from financial concern and full of life's enjoyment.
(Pritish & Saxena , 2015) in their Study Report on the Indian Telecom Industry Review concluded that
the Indian Telecom Industry provides a major contribution to India's overall socio-economic growth.
It is an important tool for the development of the nation and the numerous telecommunications
service providers provide voice and data services to consumers throughout different regions of the
world, including urban and rural areas, thereby promoting the growth of this market.
(Yadagiri & Rajaram ,2018) in their research article “ANALYSIS OF OPERATING PERFORMANCE OF
BSNL” Calculates to assess the operating performance of BSNL segment wise in terms of revenue ,
total income, operational income, operating expenses total expenses, employee benefit expenses,
administrative, operating and other expenses, profit before tax, tax expenses and profit after tax .
(Dhanabhakyam & Kurian , 2012) in their Research Article “Profitability Analysis of Bharat Sanchar
Nigam Limited (BSNL)” calculated the Net Profit Ratio, Return On Assets Ratio, Return On Equity,
Earning Per Share and Cash Profit Ratio from the year 2001-02 to 2010-11 and concluded that the
profitability ratios shows fluctuating trends except last two years and the last two years ratios shows
negative values except cash profit ratios.
(Gupta, 2015) in its Research Article "Financial Efficiency Assessment of Telecommunications with
particular regard to BSNL" concluded that BSNL practises an active strategy of liquidity management
and that the firm has ample liquidity reserves to fulfil its short-term liabilities. After analysing BSNL 's
five-year balance sheets and all the circumstances, the author concluded that BSNL was confronted
with a capital challenge that impaired BSNL 's financial status. The financial situation of BSNL was
strong in 2004 relative to the current year. The company's earnings are declining year over year
owing to the continuation of strong liquidity.
3 Significance of Study
In the age of globalisation, liberalisation and privatisation, the problems confronted by public
telecommunications operators in India are distinctive. The problems are heterogeneous and apply
to finance, human resources management, marketing and human resources management, etc.
Benefit is not appropriate. The telecommunications industry has led to the over-the-counter
development of the economy, and the impact of the position of the public sector is unrecognised.
BSNL in the telecommunications market is volatile in both the private and public sectors of the
Indian economy. The continued feasibility of BSNL is also of strategic interest to the Government and
industry. Ratio analysis is a methodology of examination and perception of financial statements by
means of different ratios that aid in decision-making. It also helps to recognise the financial strength
and vulnerabilities of an organisation. The ratio review therefore allows you clarify when things are
not going smoothly and when corrective action needs to be taken. There are various forms of
equations to verify the liquidity, effectiveness and output assessment of the company. Financial
Nat. Volatiles & Essent. Oils, 2021; 8(4): 15651-15663
15655
analysis is a method that seeks to determine the liquidity dynamics, viability, capital structure and
operating performance of the business in order to preserve its market sustainability.
Retirement is a term of modern roots, but it may be traced back to Indian theory. The explanations
for the voluntary retirement programme and its effect on its investors have been examined in this
article. There are a variety of explanations for opting for VRS, such as new jobs, medical rest,
resources, and setting up your own company. The present study therefore analysed the efficiency of
BSNL and the characteristics, advantages and drawbacks of the VRS scheme provided by BSNL 2019.
4. Objectives and Research Methodology of Study
4.1 Objectives of present study
1) To make an analysis of the Balance Sheet of the company over the last five years.
2) To Study the Financial Performance of BSNL over the last 5 years.
3) To Examine the Composition of Expenditure of BSNL over the last five years.
4) To Study the VRS Scheme offered by BSNL 2019.
4.2 Research Methodology
A research without a research design is like being lost on journey without a guiding light. Hence the
research design gives direction to the study. The research methodology for this study is the
Exploratory and Descriptive Research Method, which allows producing fair, accurate and relevant
findings. This study of the sample corporation called BSNL was used for the review of the financial
situation. The present analysis is focused on secondary data obtained by the company's released
annual reports. These financial details are categorised, tabulated and updated as needed by the
company's profitability review. This research covered 5 years of data from 2015 to 2019 for the
review of the financial situation of BSNL. The financial and liquidity status of BSNL was evaluated
using the ratio analysis financial techniques. The data collected was evaluated with the aid of all
major applicable financial factors, such as:
1. NP Ratio;
2. Current Ratio;
3. Liquidity Ratio;
4. ROI;
5. Debt – Equity Ratio;
6. EPS;
The capacity of a company to assess its financial situation is important for enhancing its strategic
position in the marketplace. Via close review of its financial results, the company may find ways to
enhance departmental, entity or organisational performance. In this sense, the concern emerges as
to how the financial success of BSNL is handled, which plays a critical role in the growth and
development of the public sector business. Also to study VRS scheme offered by BSNL, Present
study first analyse performance of BSNL over last 5 year .Then present data related to VRS scheme
offered by BSNL is overviewed .
Nat. Volatiles & Essent. Oils, 2021; 8(4): 15651-15663
15656
5. Analysis of BSNL Balance Sheet of the Financial Year 2015 to year 2019
From table 1 and table 2 it is clear that in financial year 2016, Total non-current assets has negative
growth of -5.266% and -1.205% in year 2015 and 2016 respectively. And in year 2018 and 2019 a
positive growth in term of totals current assets of 0.8142% and 1.267% in year 2018 and 2019
respectively. In term of total current assets only in 2017 a negative growth of 26.371 came out while
in 2016 2018 and 2019 balance sheet show a positive growth i.e. 7.9592%, 5.1726%, 7.2655%
respectively. In term of total equity from year 2015 to 2019 there is very negative growth .Total non-
current liabilities percentage growth in year 2016, 2017, 2018 and 2019 are 54.35764,-3.2398 and
42.3and 25.57% .This further shows that the company has revised long term finances. The overall
financial position of the company is unsatisfactory. Figure 1 is graphical representation of
percentage change in Assets, equity and liabilities.
6. Financial Techniques
The Ratios which are uses in the study are as follows:
6.1 Net Profit Ratio (NPR)
The net benefit ratio is the net profit ratio (after taxes) to revenue. This is presented as a ratio. Net
gains are rendered following reduction of income-tax. The net rate of profit is used to calculate the
total profitability. The higher ratio is stronger in terms of expense management and operating
performance.
6.2 Current Ratio (CR)
It is an indicator of profitability that is often commonly used to assess the company's short-term
financial situation. CR may be defined as the relationship between current liabilitiesand current
assets .
6.3 Liquidity Ratio (LR)
LR is also referred to as the "quick ratio" of float assets to current liabilities. True liquidity refers to a
company’s ability to meet its short-term responsibilities as and when it becomes necessary. Liquid
assets are established current investments minus inventories.
6.4 Ratio of Debt – Equity
The debt-to - equity ratio (D / E) is calculated by dividing the company's total liabilities by its
shareholders ' equity. These figures are seen on the balance sheet of the financial statements of the
company. The ratio is used to calculate the financial leverage of a corporation. The D / E ratio is an
important metric used in corporate finance, reflecting the ability of lenders to reclaim any
outstanding liabilities in the event of a downturn in the market.
6.5 Earnings per Share
EPS is commonly regarded to be a significant element in the calculation of the stock price of the
company's equity capital and in the assessment of the company's willingness to offer dividends to its

Nat. Volatiles & Essent. Oils, 2021; 8(4): 15651-15663
15657
shareholders. Earnings applicable to shareholdings shall be received after deducting the preference
share distribution from both the choice and the equity shares.
6.6 ROI (Return on Investment)
This is the proportion of the net benefit to shareholder expenditure. This is the collaboration
between the net benefit and the shareholder / owner's fund. From the shareholder's point of view,
this ratio establishes the feasibility.
7. Finding and discussion
On the basis of objectives of present study following are the findings of study-
Voluntary Retirement Scheme (VRS): Government of India announced on 23rd October 2019 the
revival package of BSNL & MTNL, in which the employees who completed 50 years of age are eligible
for opting VRS. Under this an exgratin of Rs.17,169 Crore was allotted to meet the expenses towards
pension, gratuity and Commutation. As 92,500 employees of BSNL and MTNL opted for VRS nearly
Rs.8,500 crores will be saved annually towards salaries. From BSNL nearly 78,500 employees opted
for VRS. Those who opted VRS will receive 100-125% of the salary for the remaining service to a
maximum of 42 months.
The overall profitability of BSNL is not satisfactory as the return on investment is showing the
negative value from the previous year which means that almost in every year the BSNL incurring
heavy losses due to over capitalization and underutilization of the existing assets. The efficiency of
the firm is also decreasing from the previous year as the net profit shows results in negative means
the company is running in loss and the percentage of loss is increasing. The EPS (earning per share)
estimates the company’s capacity to pay dividend to its equity shareholders. Here also EPS is
decreasing means its market price of equity shares declines. The average earning per share during
the period of the study is negative. It indicates that the poor profitability of the company. It is also
suggested that the BSNL has to introduce the necessary measures for increasing its profit-making
capacity in the near future; otherwise it may not survive for a long run with this declined trend of
EPS. Current ratio shows that what is the yearly position from the view of payment of current
liabilities whereas liquid ratio indicates the position of payment of current liabilities either
immediately or during a very short period. In this case also if company has to pay off its current
liabilities it has to sell off its fixed assets to pay of the liabilities. BSNL is weighted down with the
current debts as compared to previous year. In this case also if company has to pay off its current
liabilities it has to sell off its fixed assets to pay of the liabilities. BSNL is weighted down with the
current debts as compared to previous year. D/E ratio indication of improper debt equity
management. As the BSNL is cent percent Government owned company, the government waiving
the loan amount taken from the government. Thus the debt liability of BSNL abnormally declining
and the proportionately equity has been increasing. The company in which we are investing should
be capable of relying on fixed assets to meet the current debt but BSNL is not so in the current
period which is represented by Fixed assets to net worth ratio and F/A turnover ratio that company
is not using its assets to the fullest. Overall we can say that BSNL is not in a satisfactory level in its
financial performance in India.
From above discussion it is clear that Performance in term of finance of BSNL is not good and also
Nat. Volatiles & Essent. Oils, 2021; 8(4): 15651-15663
15658
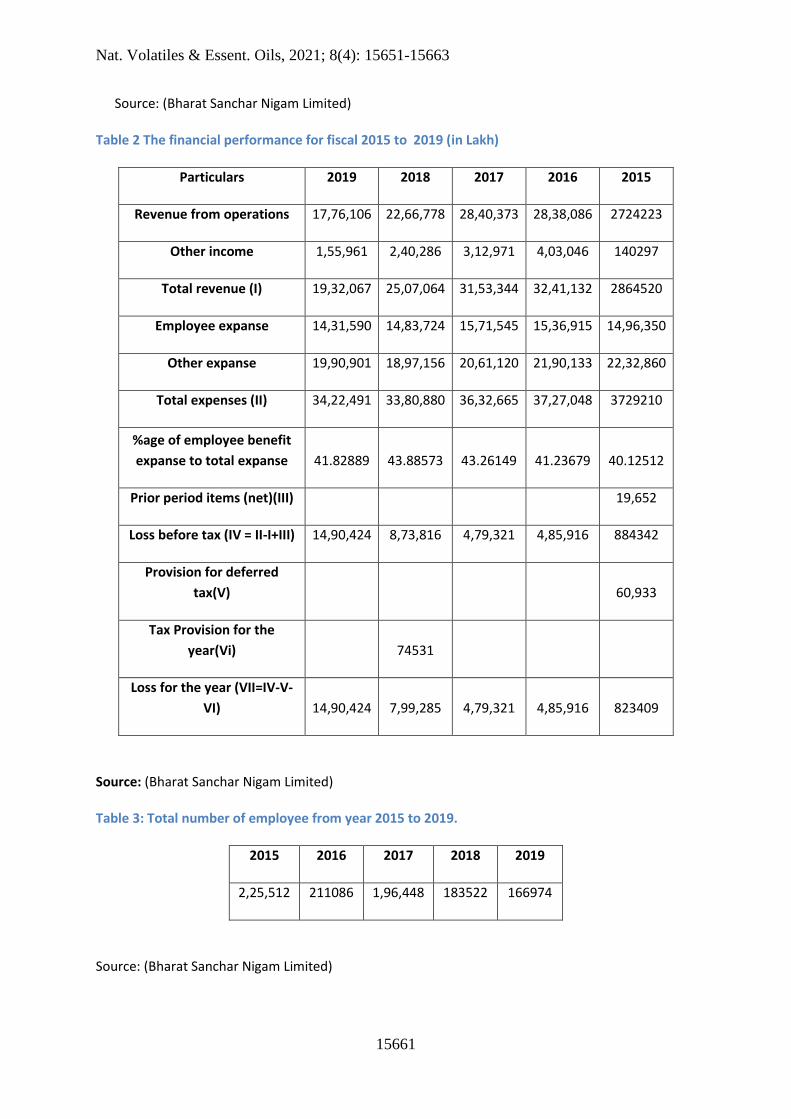
from Table 3 it is also clear that employee benefit expanse is greater than 40 percent of total
expanse. Therefore, decrease in the costs of employees by offering VRS to employees of 50 years
of age and above is fine step for removing some burden of BSNL . The Voluntary Retirement
Scheme (VRS) was provided to BSNL on 4 November 2019 and ended on 03.12.2019. BSNL saved
around Rs. 7000 crores in the rate of salaries. This would have been big savings. The overall
workforce size of BSNL is approximately 1.6 Lakh and before the closing of the scheme, 78,569
BSNL workers had chosen for the VRS. . This requires the distribution of VRS to their staff and the
monetization of their savings. This is also the need for an hour after BSNL recorded continuous loss
years, as we discussed in our analysis.
8. Limitation of the Study
The analysis is carried out using secondary data. The credibility of the findings would be dependent
on the accuracy of the data obtained. Primary data is primarily accessed due to lack of access to the
company's primary financial data. The research is focused on BSNL data; hence, the generalisations
extracted from the analysis might not be universally relevant to the entire telecommunications
sector in India. The statistics have to be approximated in the study of the results when measuring
the ratios, estimates and other statistical indicators. The data included in this analysis were taken
from the released annual reports only. Any data have been categorised and sub-grouped according
to the criteria and need. Financial analysis is focused purely on monetary knowledge, and non-
monetary considerations are overlooked. For the study of the financial situation of BSNL, only the
ratio analysis methods and the comparative review of the financial reporting balance sheet are
included. Study is just a way, not a goal in itself. We've got to create an explanation to draw our own
inference. Different individuals may view the same study in various ways.
9. Conclusion
Since the beginning until the conclusion of its creation in 2020, the company's 34 years of operation
have seen numerous faces along its path. BSNL held a lock on the business at one point. But today
the business faces very strong competition from giants including Bharti-Airtel, Reliance Concept,
Vodafone, Tata, etc. The inference to be taken from the review of BSNL's financial results is that,
firstly, BSNL has indeed witnessed a decline in revenues over the last 5 years, yet the spending has
gradually risen. I also concluded that any business must retain a good financial condition and
preserve the goodwill of the organisation. Thus, the present analysis has shown that the VRS scheme
chosen by BSNL has had positive results after a long time of significant failure.
References
BSNL, Annual Reports 20014-17 to 2018-2019.
Dr. Kanchan Bhatia and Prof Prashanth Jain (2012) ―A study of Performance appraisal and
organizational effectiveness in terms of individual and organizational basis. A
comparative study of BSNL and AIRTEL‖ International Journal on Arts, Management
and Humanities 1(1): pp.63-72.
Amalendu Bhunia, Somnath Mukhuti and Gautam Roy (2011). Financial Performance Analysis-
A Case Study. Current Research Journal of Social Sciences 3(3): 269-275.
Nat. Volatiles & Essent. Oils, 2021; 8(4): 15651-15663
15659
J.Pavithra& Dilip Gurukrishnan A STUDY ON FINANCIAL ANALYSIS OF BSNL” International
Journal of Pure and Applied Mathematics Volume 119 No. 12 2018, 1471-1489 ISSN:
1314-3395.
Enid Masih, & Nishi Tripathi, (2013). Employee perception towards VRS: A Comparative study
of ITI and Bhel. Indian Journal of Commerce & Management Studies, IV(1), 33-37.
Gopala Sudarshanam, (2012). Motivational factors to opt for voluntary retirement scheme – A
study of select undertakings in Andhra Pradesh. International Journal of
Multidisciplinary Research, 2(3), 59-73.
Rajendra Prasad Das, & Syeda Shumaela Naeem, (2017). Causes of Opting VRS by Employees in
Selected Steel Manufacturing Organizations in India- A Comparative Study. SUMEDHA
Journal of Management, 6(1), 69-77.
Salum Mohammed Ahmeda, & Bing Wangb, (2018). A Review on Retirement Practices
Towards Public Employees in Zanzibar in Tanzania. American Scientific Research
Journal for Engineering, Technology, and Sciences, 42(1), 231-241.
Sanjay Kumar, & Nishi Tripathi, (2015). An Analysis of Impact and Implications of Voluntary
Retirement Scheme. European Journal of Business and Management, 7(1), 297-302.
Sivasankaran M.S., Vadivel, C. (2016). A Study on the Satisfaction of CRS/VRS Individuals and
the Impact of Retirement on Them with Special Reference to OOTY Taluk. IOSR
Journal of Business and Management, 18(11/I), 42-47.
Sivasankaran M.S., Vadivel, C. (2016). A Study on the Satisfaction of CRS/VRS Individuals and
the Impact of Retirement on Them with Special Reference to OOTY Taluk. IOSR
Journal of Business and Management, 18(11/I), 42-47.
Suresh Chand Aggarwal, (2007). Impact of Voluntary Retirement Scheme on Indian Public
Sector Banks and its Existing Employees: An Empirical Analysis. Researchgate,
308904327, 1-27.
Suri, R.K., & Poonam, (2003). An analysis of the reasons for voluntary retirement. Delhi
Business Review, 4(1), 1-5.
Dr.M.Dhanabhakyam and Swapna Kurian (March-2012) ―Profitability Analysis of Bharath
Sanchar Nigam Limited (Bsnl)‖ Indian Journal of Applied Research,
Ahmedabad,Volume:1,Issue:6 ISSN-2249-555X.
R.C.Upadhyaya and Vashundhara Sharma (December-2012) ―A Comparative Study
Telecommunication Service providers BSNL and AIRTEL Operating in Gwalior Division
India ―International Journal of Business Management & Research (IJBMR), Vol. 2
Issue4, pp. 13-20
Anand Pawar &M. Pandya Nayak (June 2013) FINANCIAL PERFORMANCE ANALYSIS: A CASE
STUDY OF BSNL, Summer Internship Society Volume IV Issue-2

Nat. Volatiles & Essent. Oils, 2021; 8(4): 15651-15663
15660
Chhaya P.Patel and Smt.K.K.Patel (April-2014) ―Study on Performance Appraisal System in
BSNL‖ VSRD International Journal of Business and Management Research, Vol. IV,
Issue IV.
Anush Gupta(April-2015) ―Financial Performance Evaluation of Telecommunication with
special reference to BSNL‖ SSRG-International Journal of Humanities and Social
Science, ISSN:2394-2703. Ms.Pritish and Dr.Taruna Saxena (Oct-2015) ―An Analysis of
the Indian Telecom Industry‖ IOSR Journal of Business and Management (IOSR-JBM),
Volume 17, Issue10.Ver.II, PP 35-42.
Table 1: Balance Sheet of BSNL (2015-2019) (in Lakh)
Particulars 2019 2018 2017 2016 2015
Total non-current
assets 11755857 11608772 11515012 11655507 12303432
Total current assets 1792419 1671011 1588828 2157879 1998792
Total assets 13548276 13279783 13103840 13813386 14302224
Equity share capital 500000 500000 500000 500000 500000
Total equity Liabilities 7473434 8967242 9767424 10246028 10733480
Total non-current
liabilities 25,01,912 19,92,430 13,99,368 14,46,223 9,36,930
Total liabilities 6074842 4312541 3336416 3567358 3568744
Total equity 74,73,434 89,67,242 97,67,424 1,02,46,028 1,07,33,480
Source: (Bharat Sanchar Nigam Limited)
Figure 1 Percentage change in Assets, Equity and Liabilities.
-40
-20
0
20
40
60
2019
2018
2017
2016
Nat. Volatiles & Essent. Oils, 2021; 8(4): 15651-15663
15661
Source: (Bharat Sanchar Nigam Limited)
Table 2 The financial performance for fiscal 2015 to 2019 (in Lakh)
Particulars 2019 2018 2017 2016 2015
Revenue from operations 17,76,106 22,66,778 28,40,373 28,38,086 2724223
Other income 1,55,961 2,40,286 3,12,971 4,03,046 140297
Total revenue (I) 19,32,067 25,07,064 31,53,344 32,41,132 2864520
Employee expanse 14,31,590 14,83,724 15,71,545 15,36,915 14,96,350
Other expanse 19,90,901 18,97,156 20,61,120 21,90,133 22,32,860
Total expenses (II) 34,22,491 33,80,880 36,32,665 37,27,048 3729210
%age of employee benefit
expanse to total expanse 41.82889 43.88573 43.26149 41.23679 40.12512
Prior period items (net)(III)
19,652
Loss before tax (IV = II-I+III) 14,90,424 8,73,816 4,79,321 4,85,916 884342
Provision for deferred
tax(V)
60,933
Tax Provision for the
year(Vi)
74531
Loss for the year (VII=IV-V-
VI) 14,90,424 7,99,285 4,79,321 4,85,916 823409
Source: (Bharat Sanchar Nigam Limited)
Table 3: Total number of employee from year 2015 to 2019.
2015 2016 2017 2018 2019
2,25,512 211086 1,96,448 183522 166974
Source: (Bharat Sanchar Nigam Limited)
Nat. Volatiles & Essent. Oils, 2021; 8(4): 15651-15663
15662
Table 4: Performance with respect to no. of employees (in Lakh).
Particulars 2019 2018 2017 2016 2015
Total Revenue 19,32,067 25,07,064 31,53,344 32,41,132 2864520
Total Expense 34,22,491 33,80,880 3632665 3727048 3729210
Net loss of year 14,90,424 7,99,285 4,79,321 4,85,916 823409
Revenue per
employee 11.57106 13.66084 16.0518 15.35456 12.7023
Revenue from
operations per
employee 10.63702 12.35153 14.45865 13.44516 12.08017
Net Profit/loss
per employee 8.92608 4.35525 2.43994 2.30198 3.65129
Source: (Bharat Sanchar Nigam Limited)
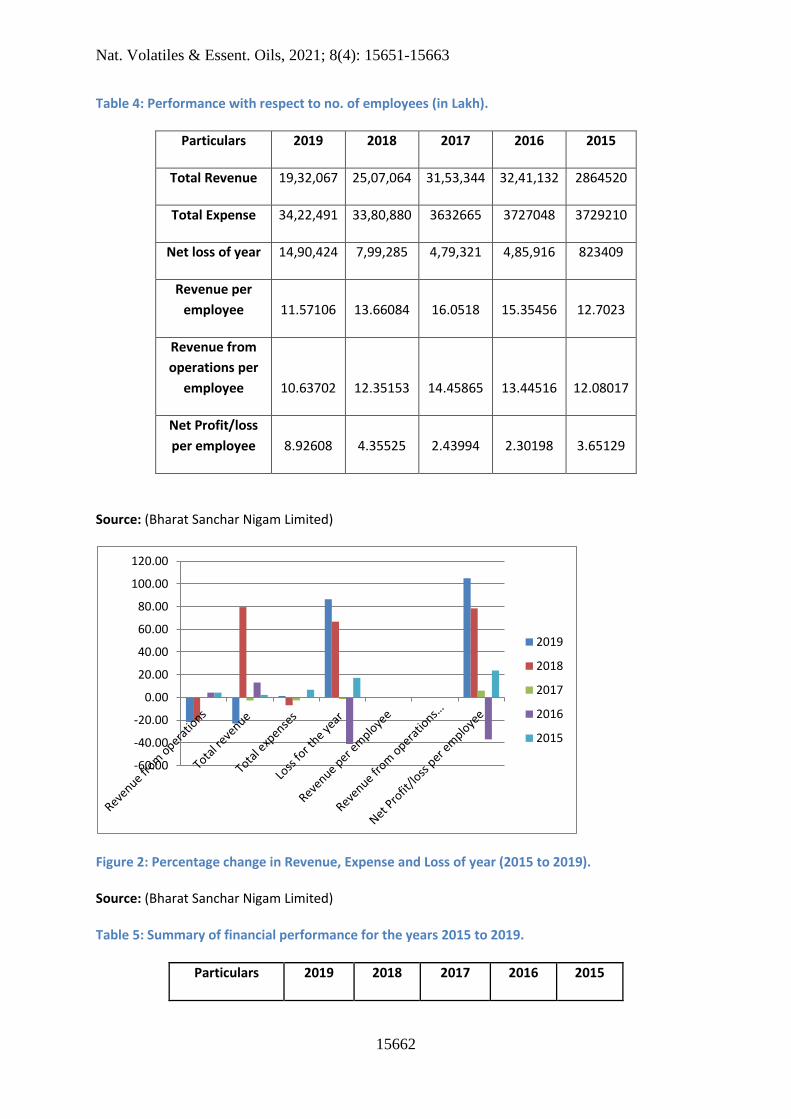
Figure 2: Percentage change in Revenue, Expense and Loss of year (2015 to 2019).
Source: (Bharat Sanchar Nigam Limited)
Table 5: Summary of financial performance for the years 2015 to 2019.
Particulars 2019 2018 2017 2016 2015
-60.00
-40.00
-20.00
0.00
20.00
40.00
60.00
80.00
100.00
120.00
2019
2018
2017
2016
2015

Nat. Volatiles & Essent. Oils, 2021; 8(4): 15651-15663
15663
Liquidity 0.47891 0.71107 0.80966 1.00831 0.75211
Net loss ratio 77.1414 31.8813 15.2004 14.9922 28.7451
current ratio 0.5:1 0.072:1 0.82:1 1.02:1 0.76:1
ROI -19.943 -8.9134 -4.9073 -4.7425 -7.6714
Debt -equity
ratio 0.334774 0.22219 0.143269 0.14115 0.08729
Earnings per
equity share -29.81 -15.99 -9.59 -9.72 -16.47
Source: (Bharat Sanchar Nigam Limited)
Figure 3: Ratio Analysis for the years 2015 to 2019
Source: (Bharat Sanchar Nigam Limited)
-40
-20
0
20
40
60
80
100
Liquidity Net lossratio
currentratio
ROI Debt -equityratio
Earningsper equity
share
2019
2018
2017
2016
2015
Copyright © 2022 FDOKUMEN