quarterly financial performance report - City of Santa Fe
23
CITY OF SANTA FE QUARTERLY FINANCIAL PERFORMANCE REPORT As of June 30, 2018
-
Upload
khangminh22 -
Category
Documents
-
view
2 -
download
0
Transcript of quarterly financial performance report - City of Santa Fe

CITY OF SANTA FE
QUARTERLY FINANCIAL PERFORMANCE REPORT
As of June 30, 2018

FINANCIAL PERFORMANCE REPORT: FOURTH QUARTER FY 2017-2018
2
CITY OF SANTA FE – QUARTERLY FINANCIAL REPORT TABLE OF CONTENTS
Page #
I. QUARTERLY REVENUE UPDATE
A. Executive Summary ......................................................................................................................... 3 B. Chart 1: City of Santa Fe Total Gross Receipts Tax (GRT), June 2018 .......................................... 3 C. Table 1: City of Santa Fe Total Gross Receipts, June 2018 ............................................................. 4 D. Table 2: GRT Distribution Variance by Industry Sector, Month Over Month Comparison ............ 4 E. Table 3: GRT Distribution Variance by Industry Sector, Cumulative FYTD .................................. 5 F. Chart 2: GRT Historical Four-Year Comparison ............................................................................. 5 G. Chart 3: City of Santa Fe GRT by Industry Sector .......................................................................... 6 H. Chart 4: Historical GRT Distribution ............................................................................................... 6 I. Chart 5: August Taxable GRT Distribution ..................................................................................... 7 J. Chart 6: 2013-2019 Lodgers Tax Revenue Comparison .................................................................. 7 K. Chart 7: Unemployment Rate, FY 2014-2019, Seasonally Adjusted ............................................... 8
II. REVENUE/EXPENDITURE PROJECTIONS
A. Executive Summary ......................................................................................................................... 9 B. Table 4: All Funds – Operating Budget Summary ......................................................................... 10 C. Year-End Analysis:
1. Chart 8: FY 2017-18 Budget vs. Actual – All Funds ............................................................... 11 2. Chart 9: FY 2017-18 General Fund Actuals ............................................................................ 11
D. Table 5: General Fund Budget Summary ....................................................................................... 12
III. INVESTMENT PORTFOLIO
A. Chart 10: Total Return Annualized ................................................................................................ 13 B. Chart 11: Portfolio Composition by Security Type ........................................................................ 13 C. Chart 12: Portfolio Composition Yields ......................................................................................... 14 D. Chart 13: Investment Income ......................................................................................................... 14 E. Chart 14: Total Interest Income by Month ..................................................................................... 15 F. Chart 15: Change in Market Value by Month ................................................................................ 15 G. Chart 16: Total Investment Income by Month ............................................................................... 16 H. Chart 17: Monthly Rate of Return .................................................................................................. 16 I. Chart 18: Cumulative Return ......................................................................................................... 17 J. Chart 19: Portfolio by Security Type ............................................................................................. 17 K. Chart 20: Portfolio by Maturity ...................................................................................................... 18 L. Chart 21: Money Market Funds ..................................................................................................... 18 M. Chart 22: Securities by Issuers ....................................................................................................... 19 N. Chart 23: Bank CDs ....................................................................................................................... 19 O. Chart 24: Duration at Quarter End ................................................................................................. 20 P. Chart 25: Weighted Average Maturity at Quarter End................................................................... 20 Q. Investment Strategy ........................................................................................................................ 21 R. Table 6: Portfolio Holdings Report ................................................................................................ 22 S. Table 7: Collateral for Demand Deposits ....................................................................................... 23

FINANCIAL PERFORMANCE REPORT: FOURTH QUARTER FY 2017-2018
3
I. CITY OF SANTA FE – QUARTERLY REVENUE UPDATE
City of Santa Fe Gross Receipts & Lodgers’ Tax Quarterly Update through August 2018
The following provides a brief summary of the Gross Receipts Tax (GRT) for the City of Santa Fe. The New Mexico Taxation and Revenue Department (TRD) reports the monthly tax receipts collection activity data. The following overview covers the GRT activity for the month of June 2018, reported in August 2018.
The gross receipts activity reported in the month of June, for the beginning of the summer tourist season typically presents an annual cyclical uptick in consumer activities and hospitality and tourism. Total gross receipts for June were $537 million, up approximately 13 percent from $475 million reported for June 2017. Receipts received were particularly strong in hospitality and food services and the construction sectors. An increase was observed for the June 2018 GRT distribution to the city of approximately $10.8 million, up 13.7 percent over June 2017 at $9.5 million. Areas of increased tax payments include the healthcare and social assistance, hospitality and food services, construction and manufacturing sectors, while weakness was observed in transportation and warehousing, management of companies and finance and insurance.
Over the last two months, various events have been observed in the data reported by TRD. In the month of May, the food and medical distributions reported by TRD were significantly higher than normal, presenting a one-time increase of approximately $3 million. Upon inquiry by the City, TRD provided an explanation stating, the increase was attributed to an outsized number of amendments filed by taxpayers over multiple periods, then processed during the month, claiming food deductions, which increased the amount due to the City. Additionally, TRD has worked through the process of upgrading the GenTax system. This system upgrade allows TRD to process returns and amendments in a more timely, accurate and efficient manner.
Additionally, the City has joined a lawsuit filed by Gallagher & Kennedy, P.A. against the State of New Mexico Taxation and Revenue Department and acting Cabinet Secretary John Monforte. Santa Fe joins the municipalities of Albuquerque, Artesia, Farmington and Moriarty in the lawsuit. The New Mexico Municipal League estimated in its calculations that the City of Santa Fe may be owed approximately $4.2 million since 2006. The amount owed by TRD may be due to unauthorized adjustments performed by the agency and inconsistencies in tax distributions to municipalities.
Chart 1
Data Source: NM Taxation & Revenue Dept.
Agriculture and Forestry0% Utilities and Mining
2%
Construction 15%
Manufacturing, Wholesale Trade, Transportation,
Warehousing9%
Retail Trade 27%Finance, Insurance and
Information Services4%
Real Estate, Rental and Leasing
4%
Professional, Scientific, and Technical Services
12%
Admin Support, Waste Mgt/Remediation Services
2%
Health Care and Social Assistance
4%
Arts, Entertainment, and Recreation
1%
Hospitality and Food Services
8%
Other Industries 9%
City of Santa Fe Total Gross Receipts June 2018

FINANCIAL PERFORMANCE REPORT: FOURTH QUARTER FY 2017-2018
4
Table 1
City of Santa Fe Total Gross Receipts
Jun-18 Jun-17 YOY $ Change YOY % Change
Agriculture and Forestry 1,016,514 1,200,950 ($184,436) -15.36% Utilities and Mining 7,793,069 7,737,072 $55,997 0.72% Construction 78,478,711 54,671,213 $23,807,498 43.55% Manufacturing, Wholesale Trade, Transportation, Warehousing 48,528,428 48,180,622 $347,806 0.72% Retail Trade 147,288,848 149,315,638 ($2,026,790) -1.36% Finance, Insurance and Information Services 23,228,621 18,180,274 $5,048,347 27.77% Real Estate, Rental and Leasing 21,197,871 20,965,061 $232,810 1.11% Professional, Scientific, and Technical Services 65,946,719 48,488,587 $17,458,131 36.00% Admin Support, Waste Mgt/Remediation Services 11,115,104 11,184,189 ($69,085) -0.62% Health Care and Social Assistance 19,527,681 17,191,082 $2,336,599 13.59% Arts, Entertainment, and Recreation 7,005,002 6,422,251 $582,750 9.07% Hospitality and Food Services 58,969,503 40,320,144 $18,649,359 46.25% Other Industries 47,545,743 51,607,795 ($4,062,052) -7.87% All Industries 537,641,813 475,464,878 $62,176,935 13.08%
Data Source: NM Taxation & Revenue Dept. Please note a two month lag in data provided per reporting from TRD. Table 2
Data Source: NM Taxation & Revenue Dept. Please note a two month lag in data provided per reporting from TRD.
City of Santa FeGRT Distribution Variance by Industry Sector
FY 2019 vs. FY 2018Month over Month Comparison
August AugustCategory FY18 FY17
Agriculture, Forestry, Hunting, Fishing 19,976$ 24,728$ (4,752)$ -19%Mining 796$ 582$ 214$ 0%Utilities 191,339$ 197,122$ (5,783)$ -3%Construction 1,747,503$ 1,149,150$ 598,353$ 52%Manufacturing 186,075$ 135,215$ 50,860$ 38%Wholesale 226,040$ 191,000$ 35,040$ 18%Retail 2,711,235$ 2,732,132$ (20,897)$ -1%Transportation & Warehousing 25,793$ 37,843$ (12,050)$ -32%Information and Cultural Industries 375,941$ 334,054$ 41,887$ 13%Finance & Insurance 183,090$ 250,134$ (67,044)$ -27%Real Estate, Rental & Leasing 266,059$ 248,515$ 17,544$ 7%Professional, Scientific, Technical 787,408$ 871,442$ (84,034)$ -10%Management of Companies 6,289$ 8,113$ (1,824)$ -22%Admin & Support, Waste Mgt. 176,727$ 168,959$ 7,768$ 5%Educational Services 33,239$ 39,892$ (6,653)$ -17%Health Care and Social Assistance 406,751$ 210,424$ 196,327$ 93%Arts, Entertainment & Recreation 123,178$ 92,136$ 31,042$ 34%Accommodation & Food 1,660,496$ 1,103,621$ 556,875$ 50%Other Services 853,852$ 954,513$ (100,661)$ -11%Public Administration 1,076$ -$ 1,076$ 100%Unclassified 42,002$ 74,537$ (32,535)$ -44%State Reimb-Food/Med Tax** 836,634$ 717,425$ 119,209$ 17%Muni. Equivalent Distribution 25,805$ 28,130$ (2,325)$ -8%
Total Distribution 10,887,304$ 9,569,667$ 1,317,637$ 13.77%
$ Variance%
Variance

FINANCIAL PERFORMANCE REPORT: FOURTH QUARTER FY 2017-2018
5
Table 3
Data Source: NM Taxation & Revenue Dept. Please note a two month lag in data provided per reporting from TRD.
Chart 2
Data Source: NM Taxation & Revenue Dept.
City of Santa FeGRT Distribution Variance by Industry Sector
FY 2019 vs. FY 2018Cumulative FYTD
August AugustCategory FY18 FY17
Agriculture, Forestry, Hunting, Fishing 51,720 74,934 (23,214) -31%Mining 1,051 739 312 42%Utilities 369,579 398,218 (28,639) -7%Construction 2,792,160 2,053,634 738,526 36%Manufacturing 349,184 293,413 55,771 19%Wholesale 426,234 388,505 37,729 10%Retail 5,203,368 4,898,930 304,438 6%Transportation & Warehousing 54,437 65,848 (11,411) -17%Information and Cultural Industries 748,174 667,854 80,320 12%Finance & Insurance 270,248 389,748 (119,500) -31%Real Estate, Rental & Leasing 536,480 491,258 45,222 9%Professional, Scientific, Technical 1,544,289 1,593,779 (49,490) -3%Management of Companies 11,110 18,572 (7,462) -40%Admin & Support, Waste Mgt. 325,126 287,215 37,911 13%Educational Services 65,184 105,701 (40,517) -38%Health Care and Social Assistance 918,163 615,702 302,461 49%Arts, Entertainment & Recreation 246,590 177,232 69,358 39%Accommodation & Food 3,081,656 2,389,607 692,049 29%Other Services 1,672,481 1,685,191 (12,710) -1%Public Administration 1,076 3,932 (2,856) 100%Unclassified 74,770 126,480 (51,710) -41%State Reimb-Food/Med Tax** 4,071,691 1,425,015 2,646,676 186%Muni. Equivalent Distribution 50,966 52,797 (1,831) -3%
Total Distribution 22,865,737 18,204,304 4,661,433 25.61%
$ Variance%
Variance
300,000,000
350,000,000
400,000,000
450,000,000
500,000,000
550,000,000
Gross ReceiptsHistorical Four Year Comparison
FY 2015
FY 2016
FY 2017
FY 2018

FINANCIAL PERFORMANCE REPORT: FOURTH QUARTER FY 2017-2018
6
Chart 3
Data Source: NM Taxation & Revenue Dept.
Chart 4
Data Source: NM Taxation & Revenue Dept.
0
20,000,000
40,000,000
60,000,000
80,000,000
100,000,000
120,000,000
140,000,000
160,000,000
180,000,000
200,000,000
City of Santa Fe GRT by Industry Sector3 Years, 2015-2018
Professional, Scientific, and Technical Services * Construction
Accommodation and Food Services Retail Trade
Health Care and Social Assistance Arts, Entertainment, and Recreation
$10,
239,
861
$12,
316,
981
$8,6
55,3
91$9
,291
,302
$7,5
43,0
28$9
,847
,481
$8,7
14,3
70$9
,029
,216
$9,0
63,4
09$9
,017
,657
$9,1
64,1
73$9
,617
,257
$8,4
87,6
04$8
,016
,690
$8,4
26,1
90$7
,136
,445
$7,6
25,8
37$9
,676
,825
$8,2
55,6
13$7
,687
,584
$10,
135,
771
$9,1
73,9
78$8
,907
,215$9
,781
,157
$8,4
19,9
07$8
,022
,887
$8,5
44,7
08$7
,565
,261
$7,5
14,9
18$9
,066
,963
$7,5
08,2
08$8,5
67,1
47$8
,779
,703
$8,6
92,5
72$9
,308
,330
$9,1
83,1
10$8
,454
,787
$8,5
48,5
78$8
,139
,862
$6,7
04,1
28$6
,833
,095
$9,4
88,2
26$7
,510
,200
$8,2
46,0
92$8
,632
,788
$8,5
02,5
82$9
,221
,566
$8,1
98,0
38$7
,391
,713
$7,5
89,2
66$7
,904
,257
$7,3
89,4
19
$6,000,000
$7,000,000
$8,000,000
$9,000,000
$10,000,000
$11,000,000
$12,000,000
$13,000,000
Historical GRT Distribution - Actual

FINANCIAL PERFORMANCE REPORT: FOURTH QUARTER FY 2017-2018
7
Chart 5
Data Source: NM Taxation & Revenue Dept.
Lodgers Tax payments received for the month of June 2018 were $1.1 million, an increase of
approximately 13.6 percent over June 2017. The payments reported are in line with historical collections activity since the inception of the program. Lodgers Tax collections are generated from hotels, motels and short term rentals within the City of Santa Fe. Chart 6
Data Source: City of Santa Fe – Finance Dept.
$8,116,710 $8,469,021 $8,454,696 $8,348,685 $8,442,174 $8,330,378
$9,330,290
$9,937,060 $9,569,666
$10,887,305
$-
$2,000,000
$4,000,000
$6,000,000
$8,000,000
$10,000,000
$12,000,000
2010 2011 2012 2013 2014 2015 2016 2017 2018 2019
August Taxable GRT Distribution(June Activity)
Preliminary Report
$-
$200,000
$400,000
$600,000
$800,000
$1,000,000
$1,200,000
$1,400,000
$1,600,000
Fiscal 2018-2019
Fiscal 2017-2018
Fiscal 2016-2017
Fiscal 2015-2016
Fiscal 2014-2015
Fiscal 2013-2014
Fiscal 2012-2013
2013-2019 Lodgers Tax Revenue Comparison

FINANCIAL PERFORMANCE REPORT: FOURTH QUARTER FY 2017-2018
8
Employment is a strong economic indicator of the health of an economy. The Santa Fe MSA (metropolitan statistical area) has reported some growth in certain sectors, yet remains behind historical levels achieved during 2006-2007. In July, the Department of Workforce Solutions (DWS) reported total non-seasonally adjusted, total nonfarm employment in Santa Fe expanded by 0.6 percent. Gains were reported were in the private sector, while the public sector was down approximately 1.9 percent. Most gains were observed in the private service providing industries and the goods producing industries. Employment in leisure and hospitality industries increased by 3.4 percent, approximately 400 jobs. The sectors of manufacturing, professional and business services and trade, transportation and utilities reported increases while the remaining industries reported no change in employment for the month. The seasonally adjusted unemployment rate for Santa Fe was 3.7 percent in July 2018, down significantly from 5.1 percent in July 2017. Chart 7
Data Source: City of Santa Fe – Finance Dept. and NM Dept. Workforce Solutions
3.0%
3.5%
4.0%
4.5%
5.0%
5.5%
6.0%
6.5%
7.0%
7.5%
8.0%
Une
mpl
oym
ent R
ate
Unemployment Rate FY2014-2019Seasonally Adjusted
Santa Fe
NM
US

FINANCIAL PERFORMANCE REPORT: FOURTH QUARTER FY 2017-2018
9
II. CITY OF SANTA FE – REVENUE/EXPENDITURE PROJECTIONS
This report is a summary of financial results for the City through the fourth quarter of the fiscal year. It provides summarized information on how the City’s financial sources and uses performed through the end of the fiscal year, with detail provided by department and major categories.
HIGHLIGHTS
The City’s overall revenue portfolio, as always, is dominated by Gross Receipts Tax (GRT), which comprises just under 30 percent of all City revenue. GRT receipts ended the year a bit stronger than was projected in previous quarterly reports due to better than expected 4th Quarter GRT receipts (the 3rd Quarter projection forecasted GRT to come in at 3 percent over budget), the year-end GRT picture is thus a positive one, with actual GRT revenue exceeding budget by 6 percent. While some other revenue sources like franchise tax, licenses/permits and parking fees performed below budgeted expectations, other sources such as property tax, lodgers’ tax and utility fees performed better than expected. Overall revenues ended the fiscal year at 2 percent above budget.
On the expenditures side, prior quarterly projections were largely based on past usage history in more ‘discretionary’ accounts such as contractual services and travel/training; as in past years, these categories tend to come in a bit further under budget in most instances than do other categories such as salaries and utilities. The year’s data bear out this trend, with salaries and utilities coming in at 104 percent and 100 percent of budgeted amounts respectively, while contractual services, travel/training and capital purchases ended the year much further from budgeted targets (71 percent, 64 percent and 51 percent respectively), and these and other discretionary categories represented the highest variances from budget targets of all the expenditure categories. As a whole, expenditures ended the fiscal year at 11 percent below budget.
GENERAL FUND
As is the case with all funds, GRT represents the largest portion of General Fund revenues, but in even greater proportion, amounting to approximately 69 percent of total General Fund revenues. Although some revenue categories in the General Fund such as other fees/services, franchise tax and fines came in below their budget targets, other sources such as property tax, ambulance fees and planning/land use fees performed above budgeted expectations, leaving overall General revenues within 1 percent of budget. On the expenditure side, while two City Divisions (Environmental Services/Graffiti and Public Works Administration) exceeded their budget targets, these Divisions’ budgets are relatively small, and other, larger City Departments/Divisions more than made up the difference. Overall, General Fund expenditures ended the fiscal year at 2 percent below budget. The General Fund closed the fiscal year with an ending balance of $10.5 million, well above the City Council-mandated minimum General Fund balance of $8.8 million.
In conclusion, the City ended the fiscal year quite close to its budget targets, a situation attributable to improved revenue forecasting and policy changes that enhanced budget discipline. The Finance Department will continue to closely monitor the City’s revenue and expenditure profile, and recommend adjustments where necessary, to ensure that the City’s financial goals continue to be met in the most efficient and effective manner possible.

FINANCIAL PERFORMANCE REPORT: FOURTH QUARTER FY 2017-2018
10
Table 4FISCAL YEAR
2016/2017 APPROVED AMENDED ACTUAL % RECEIVEDDESCRIPTION ACTUAL BUDGET BUDGET 06/30/2018 / EXPENDED
BEGINNING BALANCE 124,973,340 28,099,696 28,099,696 28,099,696
Revenues :
Gross Receipts Tax 105,536,453 103,559,489 104,559,489 110,811,262 106%
Property Tax 11,287,434 10,128,419 10,128,419 11,392,416 112%
Franchise Tax 4,104,877 4,625,575 4,625,575 4,397,467 95%
Lodgers' Tax 10,809,464 10,800,000 10,800,000 11,530,595 107%
Gasoline Tax 1,548,162 1,445,000 1,445,000 1,445,498 100%
Other Taxes 563,826 490,110 490,110 562,889 115%
Licenses & Permits 3,486,444 4,305,298 4,305,298 4,225,644 98%
Ambulance Fees 4,209,915 1,641,543 1,641,543 2,544,706 155%
Insurance Premiums/Deductibles 28,033,614 28,774,848 28,774,848 28,182,348 98%
Parking Fees 4,710,913 4,967,697 4,967,697 4,833,610 97%
Recreation Fees 3,417,599 3,345,194 3,351,004 3,328,686 99%
Solid Waste Fees 20,910,384 19,835,218 19,835,218 20,040,359 101%
Wastewater Fees 12,254,426 11,841,171 11,841,171 13,197,506 111%
Water Fees 34,606,175 34,102,559 34,389,164 40,325,867 117%
Other Fees/Services** 25,345,796 23,043,050 24,001,347 28,858,381 120%
Fines & Forfeitures 1,025,062 1,625,591 1,625,591 1,268,140 78%
Miscellaneous Revenues*** 7,951,072 6,796,020 20,200,503 18,580,832 92%
Interest on Investments 1,422,603 2,044,579 2,044,579 2,447,023 120%
State Grants 3,632,140 3,943,087 6,741,022 3,986,982 59%
Federal Grants 2,958,892 4,177,483 5,687,403 3,136,174 55%
SF County/Other Grants 85,312 22,500 7,760,895 71,749 1%
Transfers In 63,436,576 50,388,716 56,194,896 56,934,786 101%
Subtotal - Revenues 351,337,136 331,903,147 365,410,772 372,102,922 102%
TOTAL RESOURCES 476,310,476 360,002,843 393,510,468 400,202,619
Expenditures :
Salaries 72,028,538 69,828,417 74,394,883 77,579,341 104%
Benefits 50,348,375 42,434,426 43,797,164 32,573,189 74%
Contractual Services 21,205,991 19,724,042 27,244,590 19,219,255 71%
Utilities 11,830,943 11,560,867 13,125,370 13,088,635 100%
Repairs & Maintenance 4,867,518 7,136,729 8,948,168 5,875,539 66%
Supplies 9,076,346 13,620,557 14,057,437 10,939,388 78%
Insurance 30,843,677 30,725,962 31,762,456 30,721,981 97%
Travel & Training 825,449 1,227,150 1,582,405 1,009,738 64%
Other Operating 24,666,643 33,398,601 34,972,970 29,260,232 84%
Capital Purchases 6,934,547 10,857,557 14,566,747 7,358,727 51%
Land & Building 1,158,509 1,423,141 9,986,161 4,048,005 41%
Debt Service-Principal 65,144,245 19,199,275 19,228,056 19,273,707 100%
Debt Service-Interest 15,937,949 10,467,583 11,183,794 10,401,380 93%
Transfers Out 133,342,050 51,650,370 68,266,492 69,006,466 101%
TOTAL EXPENDITURES 448,210,779 323,254,677 373,116,693 330,355,582 89%
ENDING BALANCE 28,099,696 36,748,166 20,393,775 69,847,037
* Exc ludes CIP funds
** Other Fees /S erv ices inc lude: Internal S erv ice Charges ; A irpo rt Fees ; P o lice /Co urt Fees ; Trans it Fees ; Land Us e Fees ; and vario us o ther fees /s erv ices
*** M is ce llaneo us R evenues are prim arily co m pris ed o f B o nd P ro ceeds . This catego ry als o inc ludes : B o nd P rem ium s ; S ale s R evenue; R e im burs em ents ;
R e funds ; A dvertis ing Inco m e; Ins urance R eco veries ; R ental Inco m e; and o ther m is ce llaneo us revenues
ALL FUNDS* - OPERATING BUDGET SUMMARY
FISCAL YEAR 2017/2018

FINANCIAL PERFORMANCE REPORT: FOURTH QUARTER FY 2017-2018
11

FINANCIAL PERFORMANCE REPORT: FOURTH QUARTER FY 2017-2018
12
Table 5FISCAL YEAR
2016/2017 APPROVED AMENDED ACTUAL % RECEIVEDDESCRIPTION ACTUAL BUDGET BUDGET 06/30/2018 / EXPENDED
BEGINNING BALANCE 15,262,955 8,951,003 8,951,003 8,951,003
Revenues :
Gross Receipts Tax 59,246,682 64,694,523 65,694,523 64,915,409 99%
Property Tax 6,737,420 8,129,139 8,129,139 8,965,751 110%
Franchise Tax 4,090,448 4,605,575 4,605,575 4,378,595 95%
Other Taxes 498,485 430,273 430,273 495,819 115%
Licenses & Permits 3,449,984 4,289,598 4,289,598 4,180,409 97%
Ambulance Fees 4,209,915 1,641,543 1,641,543 2,544,706 155%
Planning/Land Use Fees 327,703 264,817 264,817 399,614 151%
Recreation Fees 477,258 443,051 443,051 445,143 100%
Reimbursed Expenditures* 7,014,308 5,021,173 5,021,173 5,032,074 100%
Other Fees/Services 247,286 362,270 362,270 272,994 75%
Fines & Forfeitures 304,712 746,421 746,421 241,812 32%
Miscellaneous Revenues 141,611 299,148 347,041 220,764 64%
Interest on Investments 27,545 1,613,272 1,613,272 33,994 2%
State/Other Grants 63,430 205,427 413,860 830,182 201%
Transfers In 459,980 692,860 1,512,613 1,658,068 110%
Subtotal - Revenues 87,296,768 93,439,090 95,515,169 94,615,334 99%
TOTAL RESOURCES 102,559,723 102,390,093 104,466,172 103,566,337
Expenditures :
Community Services Department:
-Administration Division 654,984 1,261,030 1,259,930 1,156,530 92%
-Library Division 3,619,964 3,750,737 3,790,287 3,749,766 99%
-Senior Services Division 2,423,473 2,701,986 2,711,723 2,662,950 98%
-Youth & Family Division 609,390 685,279 592,695 521,614 88%
Finance Department 13,744,922 5,328,564 5,965,433 5,792,505 97%
Fire Department 17,409,016 18,434,849 20,024,991 19,826,058 99%
General Government 7,275,976 8,790,641 8,676,074 8,544,266 98%
Human Resources Department 910,996 1,157,631 1,506,636 1,444,277 96%
Information Technology and
Telecommunications Department 4,157,037 - - - N/A
Parks & Recreation Department 8,593,308 9,953,382 10,398,017 10,165,790 98%
Planning & Land Use 4,404,317 5,219,988 5,414,081 5,339,159 99%
Police Department 22,495,788 22,312,726 24,797,389 24,087,914 97%
Environmental Services / Graffiti 284,160 300,427 289,447 313,335 108%
Public Works Department:
-Administration Division 60,444 377,945 374,745 404,658 108%
-Airport Division (GF Subsidy) 145,726 105,544 105,544 105,544 100%
-Engineering Division 2,654,176 3,230,299 2,973,555 2,877,642 97%
-Facilities Maintenance Division 2,708,338 4,564,784 4,104,101 4,020,724 98%
-Streets & Drainage Division 1,456,705 2,412,576 2,102,383 1,998,020 95%
TOTAL EXPENDITURES 93,608,720 90,588,388 95,087,031 93,010,751 98%
ENDING BALANCE 8,951,003 11,801,705 9,379,141 10,555,586
City Council-Mandated Minimum
General Fund Balance** 7,926,112 8,560,788 8,834,715 8,834,715
Equivalent # Days of Operation 41 50 39 45
* R e im burs ed Expenditures are m o s tly co m pris ed o f internal charges to vario us City Divis io ns fo r s erv ices pro v ided by GF Departm ents s uch as Finance , ITT, & HR
** M inim um balance de fined as 1/10 (10%) budge ted annual General Fund expenditures excluding trans fers
GENERAL FUND BUDGET SUMMARY
FISCAL YEAR 2017/2018

FINANCIAL PERFORMANCE REPORT: FOURTH QUARTER FY 2017-2018
13
III. CITY OF SANTA FE INVESTMENT PORTFOLIO AS OF JUNE 30, 2018
The Federal Reserve raised interest rates for the seventh time in June as was expected by Treasury staff and the market. Chart 10 shows the past three years of performance for the portfolio and the impact the Federal Reserve has had on the City’s yield, the blue line. However, as interest rates increase, the market value of the existing securities in the portfolio will decline. The decline is determined by the duration of the portfolio and the amount that interest rates change. The impact of rising interest rates on the market value is the green line.
Chart 10
Chart 11
-1.500%
-1.000%
-0.500%
0.000%
0.500%
1.000%
1.500%
2.000%
2.500%
3.000%
Total Return AnnualizedJuly 2015 to June 2018
Yield Total Return Market Value Change
0%
10%
20%
30%
40%
50%
60%
70%
80%
90%
100%
Portfolio Composition by Security TypeJuly 2015 to June 2018
Savings CDs Money Market Gov't Securities Municipal Securities

FINANCIAL PERFORMANCE REPORT: FOURTH QUARTER FY 2017-2018
14
The Finance Department eliminated the use of savings accounts, (a specific type of bank account) and transferred those funds into the Trust account where they are invested in compliance with the City’s investment policy. The City’s enforcement of New Mexico Statute 6-10-36, where the CD must have the same yield as a US Treasury with the same maturity has diminished local banks interest in the City’s CD program.
Chart 12
Chart 12 clearly demonstrates why staff changed the composition of the portfolio (Chart 11) in November 2016, eliminating the savings accounts, drastically reducing CDs and increasing contributions to the Trust account. While the savings rates have not changed in the past year and a half, the rate of return on money market funds and government securities has, benefiting the City.
Chart 13
The City’s interest income reached $279,000 in the month of June, and with the latest Federal Reserve tightening, staff expects interest income will continue to rise well into 2019.
0.00%0.20%
0.40%
0.60%
0.80%1.00%
1.20%
1.40%1.60%
1.80%
2.00%
Portfolio Composition YieldsJuly 2015 to June 2018
CD's Saving WF Trust
-$200,000-$150,000-$100,000
-$50,000$0
$50,000$100,000$150,000$200,000$250,000$300,000$350,000
Investment IncomeJuly 2015 to June 2018
Change in Market Value Interest Income
FINANCIAL PERFORMANCE REPORT: FOURTH QUARTER FY 2017-2018
15
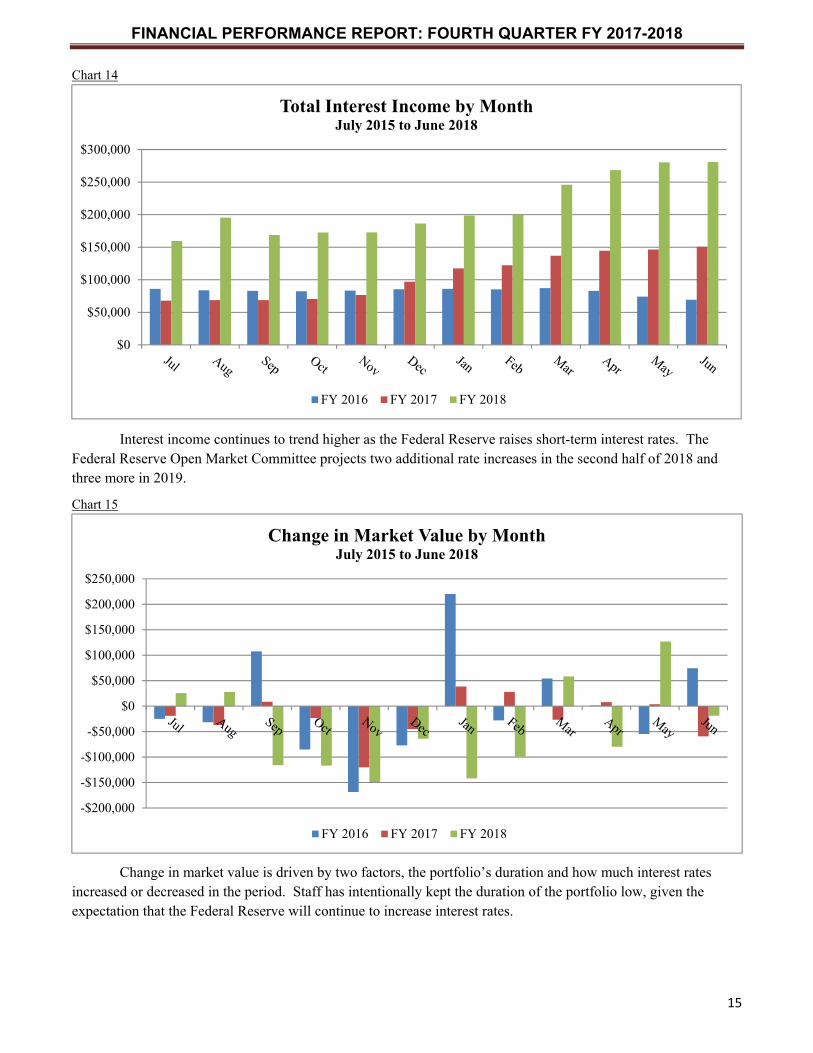
Chart 14
Interest income continues to trend higher as the Federal Reserve raises short-term interest rates. The Federal Reserve Open Market Committee projects two additional rate increases in the second half of 2018 and three more in 2019.
Chart 15
Change in market value is driven by two factors, the portfolio’s duration and how much interest rates increased or decreased in the period. Staff has intentionally kept the duration of the portfolio low, given the expectation that the Federal Reserve will continue to increase interest rates.
$0
$50,000
$100,000
$150,000
$200,000
$250,000
$300,000
Total Interest Income by MonthJuly 2015 to June 2018
FY 2016 FY 2017 FY 2018
-$200,000
-$150,000
-$100,000
-$50,000
$0
$50,000
$100,000
$150,000
$200,000
$250,000
Change in Market Value by MonthJuly 2015 to June 2018
FY 2016 FY 2017 FY 2018

FINANCIAL PERFORMANCE REPORT: FOURTH QUARTER FY 2017-2018
16
Chart 16
Total return is the combination of Charts 14 and 15, interest income and changes in market value (both realized and unrealized). Staff has strategically positioned the portfolio to take advantage Federal Reserve rate changes, however, now that short-term interest rates are equal to or slightly higher than measures of inflation, such as the Consumer Price Index, market expectations are for the Federal Reserve to be more data-driven on rate changes. Employment continues to be very strong and is starting to impact wages. Wage growth is the strongest it has been in over a decade and CPI hit 2.9 percent year over year in June, substantially higher than the Federal Reserve’s target rate of 2.0 percent.
Chart 17
Charts 17 and 18 compare the City’s investment returns to standard industry benchmarks for short-term investment portfolios; the Bloomberg 1-3 year Government, and the Bloomberg 1-3 year Aggregate, which includes all issuers including Corporate, Mortgage and other Asset Backed Securities. The take away from Chart 17 is that the City’s investment portfolio is not as volatile as the market benchmarks. Chart 18 demonstrates the
-$200,000
-$100,000
$0
$100,000
$200,000
$300,000
$400,000
$500,000
Total Investment Income by MonthJuly 2015 to June 2018
FY 2016 FY 2017 FY 2018
-1.00%
-0.50%
0.00%
0.50%
1.00%
Monthly Rate of ReturnJuly 2015 to June 2018
1-3 Gov't 1-3 Agg CoSF Total Return

FINANCIAL PERFORMANCE REPORT: FOURTH QUARTER FY 2017-2018
17
cumulative effect of adding “Credit Risk” to a portfolio. Last fiscal year the City of Santa Fe, as part of its legislative priorities, proposed legislation allowing Municipalities to invest in the same securities as the New Mexico State Treasurer. Given the short session last year, the legislation went nowhere. Senator Nancy Rodriguez contacted Finance staff and intends to introduce legislation in the 2019 Legislative Session.
Chart 18
The benchmarks have a duration of 1.9 years compared to the City’s duration of .3 years; with interest rates moving up the past eight months, the City’s portfolio has out-performed the benchmarks since August 2017.
Chart 19
-0.50%
0.00%
0.50%
1.00%
1.50%
2.00%
2.50%
Cumulative ReturnJuly 2015 to June 2018
1-3 Gov't 1-3 Agg CoSF Total Return
1% 0% 1%
47%
51%
Portfolio by Security Typeas of June 30, 2018
CD Savings Municipal US Agency Money Market

FINANCIAL PERFORMANCE REPORT: FOURTH QUARTER FY 2017-2018
18
Treasury staff continues to keep a large balance in the money market funds with the expectation that the Federal Reserve will continue to raise short-term interest rates. The current yield curve does not compensate investors to take additional interest rate risk by extending maturities. Treasury staff began adding floating rate securities to the portfolio in the second quarter of 2018 in order to keep a balance between money market funds and securities. Floating rate securities have similar duration characteristics to money market funds.
Chart 20
The ten percent with three year maturities are the floating rate notes which have a duration of .25 years or less since the interest rate on the notes resets every 30 to 90 days.
51%
1%0%
8%
16%
14%
10%
Portfolio by Maturityas of June 30, 2018
Over Night One Month Three Months Six Months One Year Two Years Three+ Years

FINANCIAL PERFORMANCE REPORT: FOURTH QUARTER FY 2017-2018
19
Chart 21
The JP Morgan, Fidelity and Blackrock money market funds are Prime Funds, which invest in Commercial Paper, Yankee CDs, Corporate Notes, and Mortgage products as well as US Treasury and Agency securities. Wells Fargo Government Money Market fund invest only in US Government and US Government Agency securities.
Chart 22
36%
21%
27%
16%
Money Market Fundsas of June 30 2018
JP Morgan Fidelity Blackrock Wells Fargo
3%
37%
49%
8% 3%
Securities by Issuersas of June 30, 2018
NM Muni FFCB FHLB FHLMC FNMA

FINANCIAL PERFORMANCE REPORT: FOURTH QUARTER FY 2017-2018
20
Chart 23
The portfolio’s duration and weighted average maturity reflects the Treasury Department’s investment strategy to avoid interest rate risk.
Chart 24
The difference between Modified Duration and Effective Duration is the market value of callable and floating rate securities in the portfolio relative to all securities.
80%
10%
10%
Bank CDsas of June 30, 2018
FNB Santa Fe Guadalupe CU State Employee CU
0.000
0.100
0.200
0.300
0.400
0.500
0.600
0.700
0.800
0.900
Years
Durationat Quarter End
Effective Duration Modified Duration

FINANCIAL PERFORMANCE REPORT: FOURTH QUARTER FY 2017-2018
21
Chart 25
Investment Strategy
The large cash position has greatly benefited the City as the Federal Reserve started raising interest rates for nearly two years now. The Federal Reserve expects to raise interest rates two more times in 2018, September and December. As long as the Federal Reserve continues to raise interest rates every quarter, there is little benefit to extending the duration or weighted average maturity.
Economic data remains strong, with the strongest employment numbers in a generation. Workforce continues to expand as the strong economy draws more sidelined workers back into the job market. Wages are also growing at a rate greater than inflation. Retail sales reflect the strong job market as well.
As long as the economic indicators remain strong, the Federal Reserve will continue to raise short-term interest rates. Finance staff monitors the economic indicators as they drive the duration decision in the coming months.
-
50
100
150
200
250
300
Days
Weighted Average Maturityat Quarter End
WAM

FINANCIAL PERFORMANCE REPORT: FOURTH QUARTER FY 2017-2018
22
Table 6
City of Santa FePortfolio Holdings ReportAs of June 30, 2018
Modified EffectiveIssuer Par Value Market Value Book Value Coupon YTM Maturity Date Duration Duration
State Employee CU 256,320 256,320 256,320 1.52% 1.52% 04/18/2018 0.000 0.000Guadalupe CU 245,000 245,000 245,000 1.21% 1.21% 08/20/2018 0.384 0.384State Employee CU 240,000 240,000 240,000 1.56% 1.56% 07/21/2019 0.288 0.288Sunflower Bank 2,000,000 2,000,000 2,000,000 0.75% 0.75% 07/16/2018 1.286 1.286
Total CDs 2,741,320 2,741,320 2,741,320 0.93% 0.998 0.998
Blackrock Prime Inst #24 26,127,013 26,127,039 26,127,013 2.06%JP Morgan Prime MM Fund #3605 39,962,904 39,962,904 39,962,904 2.06%Fidelity Prime MM Port #2014 20,280,273 20,280,314 20,280,273 2.06%Wells Fargo Bank MM 15,984,763 15,984,763 15,984,763 1.84%Wells Fargo Bank Savings 2,542 2,542 2,542 0.17% - -
Total Money Market 102,357,495 102,357,562 102,357,495 2.03% - -
New Mexico Severance Tax 2,500,000 2,483,675 2,555,425 2.00% 1.25% 07/01/2019 1.220 1.220
Total Municipal 2,500,000 2,483,675 2,555,425 2.00% 1.26% 1.220 1.220
Federal Home Loan Bank 5000000.00 4891250.00 5003550.00 1.63% 1.60% 09/11/2020 2.125 2.125Federal Home Loan Bank 5000000.00 4906300.00 4953800.00 1.13% 1.44% 11/29/2019 1.385 1.385Federal Home Loan Bank 2000000.00 1970240.00 1995780.00 1.38% 1.45% 11/15/2019 1.344 1.344Farmer Mac 5000000.00 5010350.00 5017750.00 2.12% 1.93% 02/03/2021 0.083 0.083Farmer Mac 5000000.00 4944200.00 5000000.00 1.44% 1.44% 08/20/2019 1.111 1.111Federal Home Loan Bank 5000000.00 4989800.00 5054730.00 1.75% 1.20% 12/14/2018 0.454 0.454Federal Home Loan Bank 10000000.00 9949500.00 9936000.00 1.50% 2.12% 03/08/2019 0.674 0.674Federal Home Loan Bank 5000000.00 4963700.00 5034800.00 1.63% 1.34% 06/14/2019 0.937 0.937Federal Home Loan Bank 5000000.00 4963700.00 5032550.00 1.63% 1.36% 06/14/2019 0.937 0.937Federal Home Loan Bank 5000000.00 4940150.00 4985300.00 1.38% 1.53% 09/13/2019 1.175 1.175Federal Home Loan Bank 5000000.00 4973550.00 5046450.00 2.00% 1.52% 09/13/2019 1.171 1.171Federal Farm Credit Bank 5000000.00 4987600.00 5000000.00 1.70% 1.70% 01/07/2019 0.506 0.506Federal Farm Credit Bank 5000000.00 4966350.00 4982400.00 1.25% 1.43% 02/27/2019 0.645 0.645Federal Farm Credit Bank 10000000.00 10002700.00 10000000.00 2.08% 1.98% 10/20/2020 0.083 0.083Federal Farm Credit Bank 5000000.00 4996400.00 5000000.00 2.10% 2.07% 03/26/2020 0.250 0.250Federal Home Loan Mtg Corp 3000000.00 2989290.00 3000000.00 1.05% 1.05% 11/07/2018 0.353 0.000Federal Home Loan Mtg Corp 2000000.00 1992860.00 1997600.00 1.05% 1.11% 11/07/2018 0.353 0.000Federal Home Loan Mtg Corp 3000000.00 2988600.00 3000000.00 1.13% 1.13% 11/28/2018 0.410 0.000Federal National Mtg Assn 2500000.00 2492225.00 2500000.00 1.13% 1.13% 10/29/2018 0.328 0.000
Total Federal Government 92,500,000 91,918,765 92,540,710 29% 1.60% 0.00 0.732 0.690
Total Portfolio 200,098,815 199,501,322 200,194,950 1.81% - 0.365 0.346

FINANCIAL PERFORMANCE REPORT: FOURTH QUARTER FY 2017-2018
23
Table 7
City of Santa FeCollateral for Demand DepositsAs of June 30, 2018
First National 1870Security CUSIP Maturity Par Value Market Value
FNR 2013-94CA 3.50% 3136AGJV5 08/25/1938 5,160,000 1,879,715 - -
Total First National 1870 5,160,000 1,879,715
Wells Fargo Bank, NASecurity CUSIP Maturity Par Value Market Value
FNMA FNMS 3.000% 3138MKPU4 11/01/1942 25,794,727 14,537,675 FNMA FNMS 3.000% 3138W5GJ1 06/01/1943 6,076,743 3,677,650
Total Wells Fargo Bank, NA 31,871,470 18,215,325
Total Collateral 37,031,470 20,095,040