Pro-poor Intervention Strategies in Irrigated Agriculture in Asia
a g r i c u l t u r a l w a t e r m a n a g e m e n t 8 8 ( 2 0 0 7 ) 1 9 2 – 2 0 0
Hydraulic conductivity of Molisolls irrigated withsodic-bicarbonated waters in Santa Fe (Argentine)
P.J. Ghiberto *, M.A. Pilatti, S. Imhoff, J.A. de Orellana
Dep. of Environmental Science, Facultad de Ciencias Agrarias, Universidad Nacional del Litoral, Kreder 2805,
Esperanza (Santa Fe), CP S3080HOF, Argentina
a r t i c l e i n f o
Article history:
Accepted 13 October 2006
Published on line 21 November 2006
Keywords:
Irrigation
Sodication
Sodium adsorption ratio
Clay dispersion
Tension infiltrometers
a b s t r a c t
Irrigation waters with high sodicity and low salinity levels may deteriorate soil physical
properties, consequently affecting the water movement in the soil. The objectives of this
study were: (i) to evaluate the effect of supplemental irrigation with waters that have a
residual sodium carbonate (RSC) [Richards, L.A. (Ed.), 1954. Diagnostico y rehabilitacion de
suelos salinos y sodicos. Manual de Agricultura, vol. 60. Limusa, Mexico] greater than
1.25 mmolc L�1 on the hydraulic conductivity (K) of Hapludolls and Argiudolls located in
Santa Fe State (Argentina) and (ii) to identify the possible causes ofK alteration. Irrigated and
non-irrigated plots were selected to evaluate soil bulk density, water dispersed clay content,
and K in two depth intervals: 0–7 and 15–25 cm. K was measured with tension infiltrometers
at three tension values: 0, 0.15, and 0.3 kPa. Increases in ESP in both depths from 1 to 10
caused a 10% to 79% decrease in K in the irrigated relative to non-irrigated treatments.
Changes in K were associated with increased clay dispersion suggesting that this factor
results in failure of the structure, resulting in increased blockage of soil pores. Between 51%
and 62% of the total clay was dispersed in water in irrigated treatments, and 36–44% in non-
irrigated treatments. Results emphasize the importance of preventing soil dispersion. This
process induces degradation of big pores, especially those with equivalent radii greater than
1000 mm, which is essential for quick water flow. The conductivity of these pores was
decreased from 48% to 79% in irrigated relative to non-irrigated treatment. A field method is
proposed to determine when reclamation practices should begin.
# 2006 Elsevier B.V. All rights reserved.
avai lable at www.sc iencedi rec t .com
journal homepage: www.e lsev ier .com/ locate /agwat
1. Introduction
Waters containing residual sodium carbonate (RSC) greater
than 1.25 mmolc L�1 are marginal for irrigation purposes
(Richards, 1954), and generally produce degradation of
physical and chemical properties of the soil (Andriulo et al.,
1998; Buckland et al., 2002; Pilatti et al., 2004, 2006). As a result,
soil water and air movement are affected. The effect of
irrigating soils with waters of poor quality has been broadly
studied, and it is known that hydraulic conductivity (K) is
negatively affected by soil sodication (Shainberg and Letey,
* Corresponding author. Tel.: +54 3496 420639; fax: +54 3496 426400.E-mail address: [email protected] (P.J. Ghiberto).
0378-3774/$ – see front matter # 2006 Elsevier B.V. All rights reservedoi:10.1016/j.agwat.2006.10.013
1984; Sumner, 1993; Levy, 1999). Although an exchangeable
sodium percentage (ESP) value of 15 is acceptable as a critical
threshold to define Na-affected soils, nowadays researchers
agree that lower ESP values may cause adverse effects if the
soil solution has low electrolyte concentrations (So and
Aylmore, 1993; Crescimanno et al., 1995). Furthermore, the
critical level of the relationship sodium adsorption ratio: water
electric conductivity (SAR/ECw) associated with K deteriora-
tion seems to depend on several factors such as, soil type, clay
mineralogy, texture, pH, oxide content, silt, and CO2 concen-
tration (Shainberg et al., 2001).
d.

a g r i c u l t u r a l w a t e r m a n a g e m e n t 8 8 ( 2 0 0 7 ) 1 9 2 – 2 0 0 193
Irrigation waters with high SAR and low ECw increase the
exchangeable sodium percentage and dilute salt concentra-
tion in soil solution (Richards, 1954; Sumner, 1993; Wienhold
and Trooien, 1995). Moreover, with high concentration of
bicarbonate ion, there is a tendency for calcium to precipitate
as carbonate and the relative proportion of sodium is
increased (Richards, 1954). These processes trigger the
mechanisms responsible for conductive pore deterioration,
therefore, causing the reduction of K. The most common
mechanisms are: (i) destruction of soil aggregates by disper-
sion and slaking and (ii) clay swelling (Frenkel et al., 1978;
Pupisky and Shainberg, 1979; Gupta and Abrol, 1990; Wienhold
and Trooien, 1998). The first one is an irreversible process and
can generate waterproof strata in the soil. The second process
is reversible through the addition of electrolytes or bivalent
cations (Shainberg and Letey, 1984; Oster, 1994; Melkamu
et al., 1997); however, McNeal and Coleman (1966) reported
that reversibility was limited.
It was demonstrated that K is a very sensitive indicator to
detect changes in soil porosity caused by ESP increment (Keren
and Ben-Hur, 2003). Nevertheless, most of the information was
generated under laboratory conditions using soil columns
repacked with aggregates of different sizes, which may not
faithfully represent the field conditions due to the formation of
cracks and channels that originate patterns of preferential
flow (Shainberg and Letey, 1984). To overcome this problem,
Menneer et al. (2001) have proposed field studies to be carried
out using tension-infiltrometers to evaluate the effects of
irrigation with sodium-contaminated wastewaters. This
instrument is being broadly used to determine soil hydraulic
properties in situ, i.e. to detect changes in porous space, and to
study the preferential flow throughout soil macropores
(Watson and Luxmoore, 1986; Ankeny et al., 1990; Haddadj
and Gascuel-Odoux, 1998; Cameira et al., 2003).
The risks and consequences of applying irrigating waters
that have RSC onto soils of the Pampean region of Argentina
have been acknowledged for a long time. Arens (1969)
indicated that few years are necessary to make a good soil
turn into a sodic soil in this region. Cerana (1980) has found
similar results for soils of the State of Cordoba (Argentina) and
proposed an ESP value of 5% being more appropriate than 15%
as the level to be used to classify the soil as sodic.
In the Pampean region of Argentina, the surface irrigated
with waters that have RSC is increasing, and experimental
evidence of soil deterioration has already been shown by
Andriulo et al. (1998). Pilatti et al. (2004) found that supple-
mental irrigation with waters containing RSC greater than
Table 1 – Localization and soils of the studied cases
Town Soil classificati
Hughes Typic Hapludoll, Santa I
Llambi Campbell Acuic Argiudoll, Humbo
Marcelino Escalada Acuic Argiudoll, Angelon
1.25 mmolc L�1 and low saline concentration have caused
sodication in Molisolls of Santa Fe. It is necessary, however, to
identify the physical properties that have deteriorated the
most in order to understand what has caused soil degradation.
Sensitive indicators are needed to promote sustainable
management (Steinberg, 1999). Therefore, the objectives of
this research were: (i) to evaluate in situ the effect of
supplemental irrigation with waters containing a residual
sodium carbonate on the hydraulic conductivity of A horizon
of Hapludolls and Argiudolls in Santa Fe State (Argentina), and
ii) to identify the possible causes for the degradation of
hydraulic conductivity.
2. Materials and method
The field experiments were located in the south central
portion of Santa Fe State (Argentina), near the towns of
Hughes, Llambi Campbell, and Marcelino Escalada, where the
climate is mesothermic subhumid-humid (C2B03ra0,
Thornthwaite (1948)) and annual isohyets vary from 800 to
1000 mm.
Sampling sites (Table 1) were selected based on the soil
characteristics (Pilatti et al., 2004). The soils sampled were
Hapludolls and Argiudolls (INTA, 1983, 1992) with different
particle size distribution (Table 2), and all under no-till
cropping system for more than 4 years. At each place, before
seeding the summer crop and the first irrigation, one non-
irrigated area (NI) and one irrigated area (I) were chosen to
carry out the evaluations. The irrigated areas experienced
sodication due to the application of 100–350 mm year�1 of
irrigation waters, with an RSC greater than 1.25 mmolc L�1
(Table 3). This process took place without increasing soil
salinity. Irrigation of discontinuous supplemental type was
performed with a center pivots. At the field experiment
located near Hughes, two irrigated areas that differed in
irrigation duration (30 and 3 years) were also evaluated. The
30-year irrigated area was named I30 and the 3-year irrigated
area was named I3. Complementary, one natural A horizon
located near Llambi Campbell was also studied to improve the
interpretation results obtained nearby.
Chemical characteristics of the groundwater used for
irrigation are shown in Table 3. Water electrical conductivity
(ECw) was analyzed according to Richards (1954), Ca2+ and Mg2+
by titration, Na+ by flame photometry, and HCO3� and CO3
2�
according to Jackson (1982). The residual sodium carbonate
(RSC) was calculated as [(CO32� + HCO3
�) � (Ca2+ + Mg2+)]
on Treatment
sabel serie (1) Non-irrigated (NI)
(2) Three years irrigated (I3)
(3) Thirty years irrigated (I30)
ldt serie (1) Non-irrigated (NI)
(2) Irrigated (I)
i serie (1) Non-irrigated (NI)
(2) Irrigated (I)
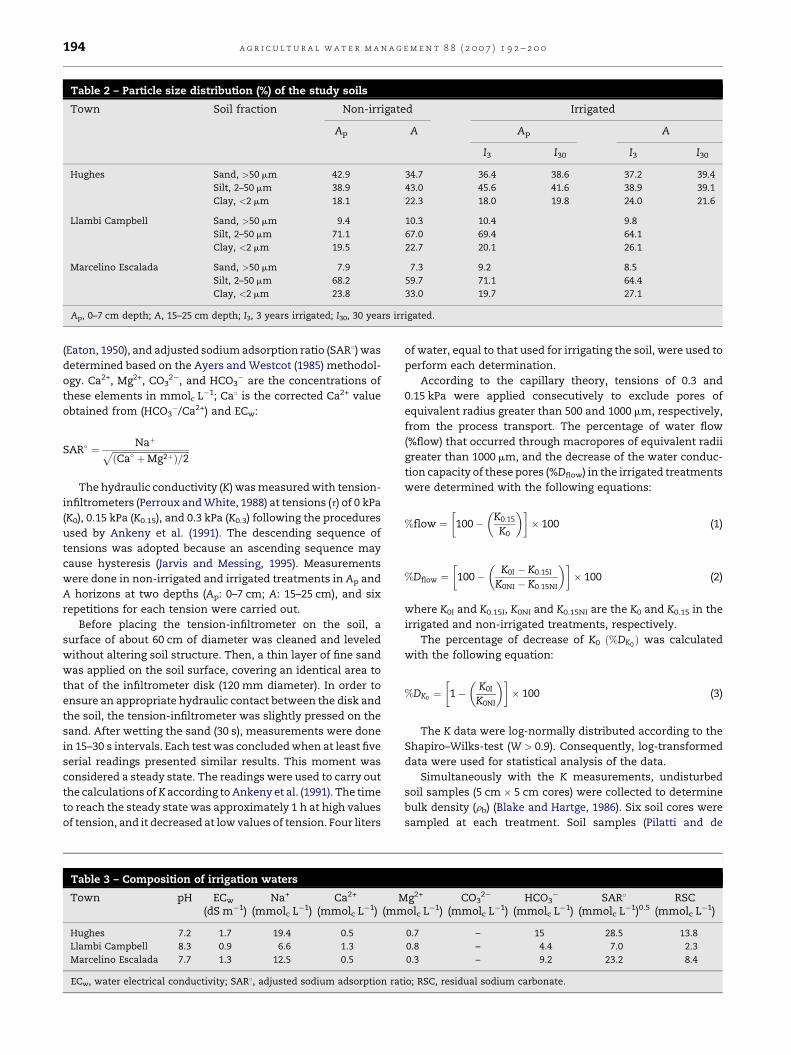
Table 2 – Particle size distribution (%) of the study soils
Town Soil fraction Non-irrigated Irrigated
Ap A Ap A
I3 I30 I3 I30
Hughes Sand, >50 mm 42.9 34.7 36.4 38.6 37.2 39.4
Silt, 2–50 mm 38.9 43.0 45.6 41.6 38.9 39.1
Clay, <2 mm 18.1 22.3 18.0 19.8 24.0 21.6
Llambi Campbell Sand, >50 mm 9.4 10.3 10.4 9.8
Silt, 2–50 mm 71.1 67.0 69.4 64.1
Clay, <2 mm 19.5 22.7 20.1 26.1
Marcelino Escalada Sand, >50 mm 7.9 7.3 9.2 8.5
Silt, 2–50 mm 68.2 59.7 71.1 64.4
Clay, <2 mm 23.8 33.0 19.7 27.1
Ap, 0–7 cm depth; A, 15–25 cm depth; I3, 3 years irrigated; I30, 30 years irrigated.
a g r i c u l t u r a l w a t e r m a n a g e m e n t 8 8 ( 2 0 0 7 ) 1 9 2 – 2 0 0194
(Eaton, 1950), and adjusted sodium adsorption ratio (SAR8) was
determined based on the Ayers and Westcot (1985) methodol-
ogy. Ca2+, Mg2+, CO32�, and HCO3
� are the concentrations of
these elements in mmolc L�1; Ca8 is the corrected Ca2+ value
obtained from (HCO3�/Ca2+) and ECw:
SAR� ¼ NaþffiffiffiffiffiffiffiffiffiffiffiffiffiffiffiffiffiffiffiffiffiffiffiffiffiffiffiffiffiffiffiffiffiffiffiðCa� þMg2þÞ=2
p
The hydraulic conductivity (K) was measured with tension-
infiltrometers (Perroux and White, 1988) at tensions (t) of 0 kPa
(K0), 0.15 kPa (K0.15), and 0.3 kPa (K0.3) following the procedures
used by Ankeny et al. (1991). The descending sequence of
tensions was adopted because an ascending sequence may
cause hysteresis (Jarvis and Messing, 1995). Measurements
were done in non-irrigated and irrigated treatments in Ap and
A horizons at two depths (Ap: 0–7 cm; A: 15–25 cm), and six
repetitions for each tension were carried out.
Before placing the tension-infiltrometer on the soil, a
surface of about 60 cm of diameter was cleaned and leveled
without altering soil structure. Then, a thin layer of fine sand
was applied on the soil surface, covering an identical area to
that of the infiltrometer disk (120 mm diameter). In order to
ensure an appropriate hydraulic contact between the disk and
the soil, the tension-infiltrometer was slightly pressed on the
sand. After wetting the sand (30 s), measurements were done
in 15–30 s intervals. Each test was concluded when at least five
serial readings presented similar results. This moment was
considered a steady state. The readings were used to carry out
the calculations ofK according to Ankeny et al. (1991). The time
to reach the steady state was approximately 1 h at high values
of tension, and it decreased at low values of tension. Four liters
Table 3 – Composition of irrigation waters
Town pH ECw
(dS m�1)Na+
(mmolc L�1)Ca2+
(mmolc L�1)M
(mm
Hughes 7.2 1.7 19.4 0.5
Llambi Campbell 8.3 0.9 6.6 1.3
Marcelino Escalada 7.7 1.3 12.5 0.5
ECw, water electrical conductivity; SAR8, adjusted sodium adsorption rat
of water, equal to that used for irrigating the soil, were used to
perform each determination.
According to the capillary theory, tensions of 0.3 and
0.15 kPa were applied consecutively to exclude pores of
equivalent radius greater than 500 and 1000 mm, respectively,
from the process transport. The percentage of water flow
(%flow) that occurred through macropores of equivalent radii
greater than 1000 mm, and the decrease of the water conduc-
tion capacity of these pores (%Dflow) in the irrigated treatments
were determined with the following equations:
%flow ¼ 100� K0:15
K0
� �� �� 100 (1)
%Dflow ¼ 100� K0I � K0:15I
K0NI � K0:15NI
� �� �� 100 (2)
where K0I and K0.15I, K0NI and K0.15NI are the K0 and K0.15 in the
irrigated and non-irrigated treatments, respectively.
The percentage of decrease of K0 ð%DK0Þ was calculated
with the following equation:
%DK0 ¼ 1� K0I
K0NI
� �� �� 100 (3)
The K data were log-normally distributed according to the
Shapiro–Wilks-test (W > 0.9). Consequently, log-transformed
data were used for statistical analysis of the data.
Simultaneously with the K measurements, undisturbed
soil samples (5 cm � 5 cm cores) were collected to determine
bulk density (rb) (Blake and Hartge, 1986). Six soil cores were
sampled at each treatment. Soil samples (Pilatti and de
g2+
olc L�1)CO3
2�
(mmolc L�1)HCO3
�
(mmolc L�1)SAR8
(mmolc L�1)0.5RSC
(mmolc L�1)
0.7 – 15 28.5 13.8
0.8 – 4.4 7.0 2.3
0.3 – 9.2 23.2 8.4
io; RSC, residual sodium carbonate.
a g r i c u l t u r a l w a t e r m a n a g e m e n t 8 8 ( 2 0 0 7 ) 1 9 2 – 2 0 0 195
Orellana, 1994) were also taken at the same places to measure
the water-dispersed clay content (Cld). This involved the
particle dispersion with distilled water, shaking for 17 h, and
the determination of the suspended particle content with the
densimeter method (Gee and Bauder, 1986). The dispersion
index (DI) was equal to Cld divided by the amount of total clay
in 100 g of soil. The electrical conductivity of the saturation
paste extracts (ECe) was also measured (Richards, 1954). Cation
exchangeable capacity (CEC) was determined after extraction
with ammonium acetate, pH 7. Exchangeable sodium (Exch.
Na+) was analyzed by flame photometry, and soil organic
carbon (OC) according to the Walkley–Black method (Jackson,
1982). Exchangeable sodium percentage (ESP) was calculated
as [(Exch. Na+/CEC) � 100]. Then, the ECe and ESP were used to
calculate the sodicity index [SI = ECe/ESP] (Hulugalle and
Finlay, 2003).
The mean values of the variables rb, DI, OC, Exch. Na+, ECe,
CEC and ESP were analyzed for the treatments NI and I using
the t-test (a = 5%). The statistical analyses were conducted
with SAS (1991).
3. Results and discussion
The irrigation waters can induce soil physical deterioration
according to their sodium adsorption ratio (SAR), electrical
conductivity (ECw), and residual sodium carbonate (RSC)
(Table 3) (Richards, 1954; Ayers and Westcot, 1985; Levy,
1999; Pilatti et al., 2006). Levels of alkalinization and sodication
are shown in Table 4. Irrigation caused a significant increase in
Exch. Na+ content (between 1.7 and 17 times), and ESP
(between two and nine times) in irrigated relative to non-
irrigated treatment in both depths, but ECe did not increase.
Similar results were found by Pilatti et al. (2004), who studied
25 cases spread out the Pampean Molisolls of Argentina.
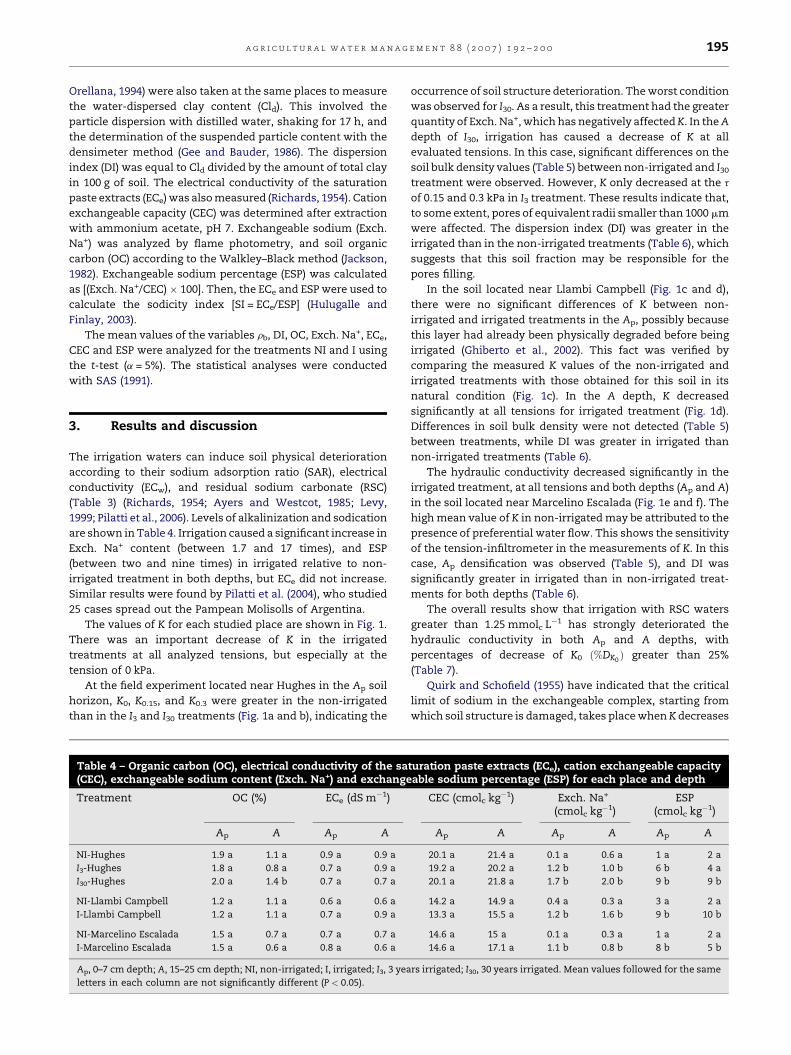
The values of K for each studied place are shown in Fig. 1.
There was an important decrease of K in the irrigated
treatments at all analyzed tensions, but especially at the
tension of 0 kPa.
At the field experiment located near Hughes in the Ap soil
horizon, K0, K0.15, and K0.3 were greater in the non-irrigated
than in the I3 and I30 treatments (Fig. 1a and b), indicating the
Table 4 – Organic carbon (OC), electrical conductivity of the sa(CEC), exchangeable sodium content (Exch. Na+) and exchange
Treatment OC (%) ECe (dS m�1)
Ap A Ap A
NI-Hughes 1.9 a 1.1 a 0.9 a 0.9 a
I3-Hughes 1.8 a 0.8 a 0.7 a 0.9 a
I30-Hughes 2.0 a 1.4 b 0.7 a 0.7 a
NI-Llambi Campbell 1.2 a 1.1 a 0.6 a 0.6 a
I-Llambi Campbell 1.2 a 1.1 a 0.7 a 0.9 a
NI-Marcelino Escalada 1.5 a 0.7 a 0.7 a 0.7 a
I-Marcelino Escalada 1.5 a 0.6 a 0.8 a 0.6 a
Ap, 0–7 cm depth; A, 15–25 cm depth; NI, non-irrigated; I, irrigated; I3, 3 yea
letters in each column are not significantly different (P < 0.05).
occurrence of soil structure deterioration. The worst condition
was observed for I30. As a result, this treatment had the greater
quantity of Exch. Na+, which has negatively affectedK. In the A
depth of I30, irrigation has caused a decrease of K at all
evaluated tensions. In this case, significant differences on the
soil bulk density values (Table 5) between non-irrigated and I30
treatment were observed. However, K only decreased at the t
of 0.15 and 0.3 kPa in I3 treatment. These results indicate that,
to some extent, pores of equivalent radii smaller than 1000 mm
were affected. The dispersion index (DI) was greater in the
irrigated than in the non-irrigated treatments (Table 6), which
suggests that this soil fraction may be responsible for the
pores filling.
In the soil located near Llambi Campbell (Fig. 1c and d),
there were no significant differences of K between non-
irrigated and irrigated treatments in the Ap, possibly because
this layer had already been physically degraded before being
irrigated (Ghiberto et al., 2002). This fact was verified by
comparing the measured K values of the non-irrigated and
irrigated treatments with those obtained for this soil in its
natural condition (Fig. 1c). In the A depth, K decreased
significantly at all tensions for irrigated treatment (Fig. 1d).
Differences in soil bulk density were not detected (Table 5)
between treatments, while DI was greater in irrigated than
non-irrigated treatments (Table 6).
The hydraulic conductivity decreased significantly in the
irrigated treatment, at all tensions and both depths (Ap and A)
in the soil located near Marcelino Escalada (Fig. 1e and f). The
high mean value of K in non-irrigated may be attributed to the
presence of preferential water flow. This shows the sensitivity
of the tension-infiltrometer in the measurements of K. In this
case, Ap densification was observed (Table 5), and DI was
significantly greater in irrigated than in non-irrigated treat-
ments for both depths (Table 6).
The overall results show that irrigation with RSC waters
greater than 1.25 mmolc L�1 has strongly deteriorated the
hydraulic conductivity in both Ap and A depths, with
percentages of decrease of K0 ð%DK0Þ greater than 25%
(Table 7).
Quirk and Schofield (1955) have indicated that the critical
limit of sodium in the exchangeable complex, starting from
which soil structure is damaged, takes place when K decreases
turation paste extracts (ECe), cation exchangeable capacityable sodium percentage (ESP) for each place and depth
CEC (cmolc kg�1) Exch. Na+
(cmolc kg�1)ESP
(cmolc kg�1)
Ap A Ap A Ap A
20.1 a 21.4 a 0.1 a 0.6 a 1 a 2 a
19.2 a 20.2 a 1.2 b 1.0 b 6 b 4 a
20.1 a 21.8 a 1.7 b 2.0 b 9 b 9 b
14.2 a 14.9 a 0.4 a 0.3 a 3 a 2 a
13.3 a 15.5 a 1.2 b 1.6 b 9 b 10 b
14.6 a 15 a 0.1 a 0.3 a 1 a 2 a
14.6 a 17.1 a 1.1 b 0.8 b 8 b 5 b
rs irrigated; I30, 30 years irrigated. Mean values followed for the same
Fig. 1 – Hydraulic conductivity (K) vs. the applied tension (t) for the non-irrigated and irrigated treatments located in: (a)
Hughes, Ap depth; (b) Hughes, A depth; (c) Llambi Campbell, Ap depth; (d) Llambi Campbell, A depth; (e) Marcelino Escalada,
Ap depth; (f) Marcelino Escalada, A depth. Different letters in each tension indicates significant differences (P < 0.05) between
treatments.
Table 5 – Soil bulk density (Mg mS3) for each place anddepth
Town Horizon Non-irrigated Irrigated
Hughes Ap 1.288 a (I3) 1.306 a
A 1.374 a (I3) 1.377 a
Hughes Ap 1.288 a (I30) 1.326 a
A 1.374 a (I30) 1.411 b
Llambi Campbell Ap 1.343 a 1.376 a
A 1.296 a 1.360 a
Marcelino Escalada Ap 1.210 a 1.324 b
A 1.369 a 1.370 a
Ap, 0–7 cm depth; A, 15–25 cm depth; I3, 3 years irrigated; I30, 30
years irrigated. Mean values followed for the same letters in each
line are not significantly different (P < 0.05).
Table 6 – Dispersion index (DI) for each treatment anddepth
Treatment Ap A
NI-Hughes 37.3 a 35.9 a
I3-Hughes 59.9 b 50.9 b
I30-Hughes 56.3 b 57.3 b
NI-Llambi Campbell 41.7 a 37.3 a
I-Llambi Campbell 54.3 b 50.0 b
NI-Marcelino Escalada 37.9 a 43.7 a
I-Marcelino Escalada 58.5 b 61.8 b
Ap, 0–7 cm depth; A, 15–25 cm depth; DI, amount of dispersed clay
in water (Cld) divided by the amount of total clay in 100 g soil.
Mean values followed for the same letters in each place and depth
are not significantly different (P < 0.05).
a g r i c u l t u r a l w a t e r m a n a g e m e n t 8 8 ( 2 0 0 7 ) 1 9 2 – 2 0 0196
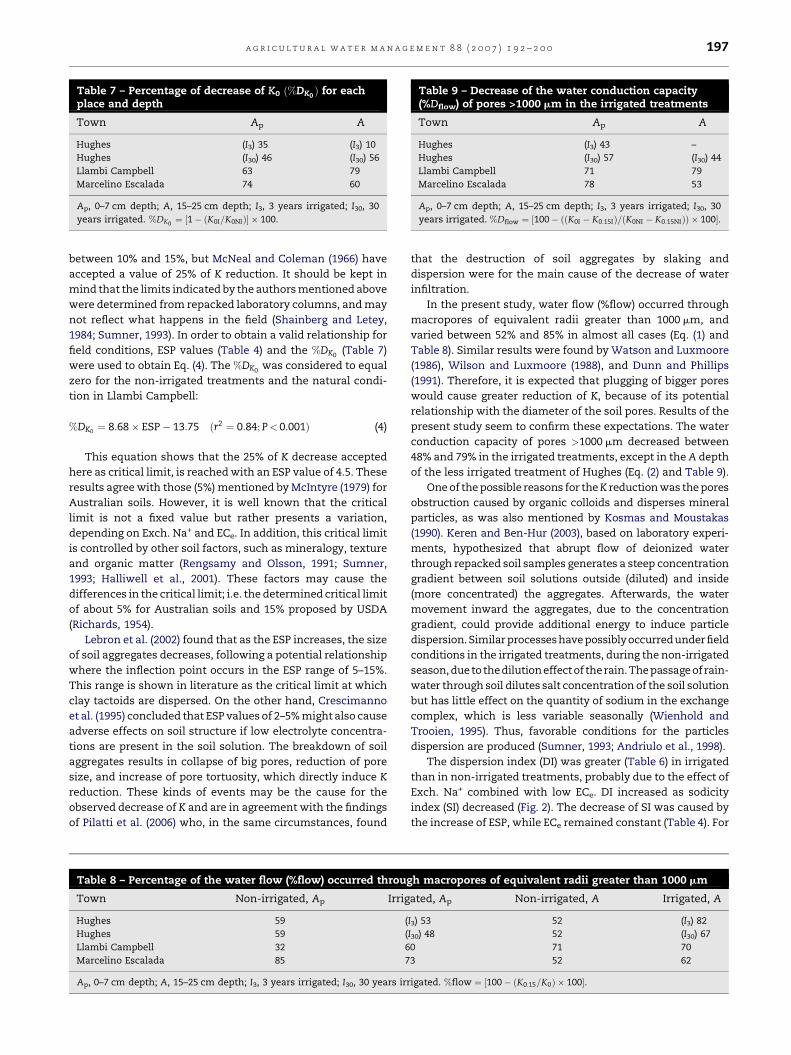
Table 7 – Percentage of decrease of K0 ð%DK0 Þ for eachplace and depth
Town Ap A
Hughes (I3) 35 (I3) 10
Hughes (I30) 46 (I30) 56
Llambi Campbell 63 79
Marcelino Escalada 74 60
Ap, 0–7 cm depth; A, 15–25 cm depth; I3, 3 years irrigated; I30, 30
years irrigated. %DK0 ¼ ½1� ðK0I=K0NIÞ� � 100.
Table 9 – Decrease of the water conduction capacity(%Dflow) of pores >1000 mm in the irrigated treatments
Town Ap A
Hughes (I3) 43 –
Hughes (I30) 57 (I30) 44
Llambi Campbell 71 79
Marcelino Escalada 78 53
Ap, 0–7 cm depth; A, 15–25 cm depth; I3, 3 years irrigated; I30, 30
years irrigated. %Dflow ¼ ½100� ððK0I � K0:15IÞ=ðK0NI � K0:15NIÞÞ � 100�.
a g r i c u l t u r a l w a t e r m a n a g e m e n t 8 8 ( 2 0 0 7 ) 1 9 2 – 2 0 0 197
between 10% and 15%, but McNeal and Coleman (1966) have
accepted a value of 25% of K reduction. It should be kept in
mind that the limits indicated by the authors mentioned above
were determined from repacked laboratory columns, and may
not reflect what happens in the field (Shainberg and Letey,
1984; Sumner, 1993). In order to obtain a valid relationship for
field conditions, ESP values (Table 4) and the %DK0 (Table 7)
were used to obtain Eq. (4). The %DK0was considered to equal
zero for the non-irrigated treatments and the natural condi-
tion in Llambi Campbell:
%DK0 ¼ 8:68� ESP� 13:75 ðr2 ¼ 0:84;P< 0:001Þ (4)
This equation shows that the 25% of K decrease accepted
here as critical limit, is reached with an ESP value of 4.5. These
results agree with those (5%) mentioned by McIntyre (1979) for
Australian soils. However, it is well known that the critical
limit is not a fixed value but rather presents a variation,
depending on Exch. Na+ and ECe. In addition, this critical limit
is controlled by other soil factors, such as mineralogy, texture
and organic matter (Rengsamy and Olsson, 1991; Sumner,
1993; Halliwell et al., 2001). These factors may cause the
differences in the critical limit; i.e. the determined critical limit
of about 5% for Australian soils and 15% proposed by USDA
(Richards, 1954).
Lebron et al. (2002) found that as the ESP increases, the size
of soil aggregates decreases, following a potential relationship
where the inflection point occurs in the ESP range of 5–15%.
This range is shown in literature as the critical limit at which
clay tactoids are dispersed. On the other hand, Crescimanno
et al. (1995) concluded that ESP values of 2–5% might also cause
adverse effects on soil structure if low electrolyte concentra-
tions are present in the soil solution. The breakdown of soil
aggregates results in collapse of big pores, reduction of pore
size, and increase of pore tortuosity, which directly induce K
reduction. These kinds of events may be the cause for the
observed decrease of K and are in agreement with the findings
of Pilatti et al. (2006) who, in the same circumstances, found
Table 8 – Percentage of the water flow (%flow) occurred throug
Town Non-irrigated, Ap Irrig
Hughes 59 (
Hughes 59 (
Llambi Campbell 32 6
Marcelino Escalada 85 7
Ap, 0–7 cm depth; A, 15–25 cm depth; I3, 3 years irrigated; I30, 30 years irr
that the destruction of soil aggregates by slaking and
dispersion were for the main cause of the decrease of water
infiltration.
In the present study, water flow (%flow) occurred through
macropores of equivalent radii greater than 1000 mm, and
varied between 52% and 85% in almost all cases (Eq. (1) and
Table 8). Similar results were found by Watson and Luxmoore
(1986), Wilson and Luxmoore (1988), and Dunn and Phillips
(1991). Therefore, it is expected that plugging of bigger pores
would cause greater reduction of K, because of its potential
relationship with the diameter of the soil pores. Results of the
present study seem to confirm these expectations. The water
conduction capacity of pores >1000 mm decreased between
48% and 79% in the irrigated treatments, except in the A depth
of the less irrigated treatment of Hughes (Eq. (2) and Table 9).
One of the possible reasons for theK reduction was the pores
obstruction caused by organic colloids and disperses mineral
particles, as was also mentioned by Kosmas and Moustakas
(1990). Keren and Ben-Hur (2003), based on laboratory experi-
ments, hypothesized that abrupt flow of deionized water
through repacked soil samples generates a steep concentration
gradient between soil solutions outside (diluted) and inside
(more concentrated) the aggregates. Afterwards, the water
movement inward the aggregates, due to the concentration
gradient, could provide additional energy to induce particle
dispersion. Similar processeshave possiblyoccurredunder field
conditions in the irrigated treatments, during the non-irrigated
season, due to thedilutioneffect of therain. The passage ofrain-
water through soil dilutes salt concentration of the soil solution
but has little effect on the quantity of sodium in the exchange
complex, which is less variable seasonally (Wienhold and
Trooien, 1995). Thus, favorable conditions for the particles
dispersion are produced (Sumner, 1993; Andriulo et al., 1998).
The dispersion index (DI) was greater (Table 6) in irrigated
than in non-irrigated treatments, probably due to the effect of
Exch. Na+ combined with low ECe. DI increased as sodicity
index (SI) decreased (Fig. 2). The decrease of SI was caused by
the increase of ESP, while ECe remained constant (Table 4). For
h macropores of equivalent radii greater than 1000 mm
ated, Ap Non-irrigated, A Irrigated, A
I3) 53 52 (I3) 82
I30) 48 52 (I30) 67
0 71 70
3 52 62
igated. %flow ¼ ½100� ðK0:15=K0Þ � 100�.
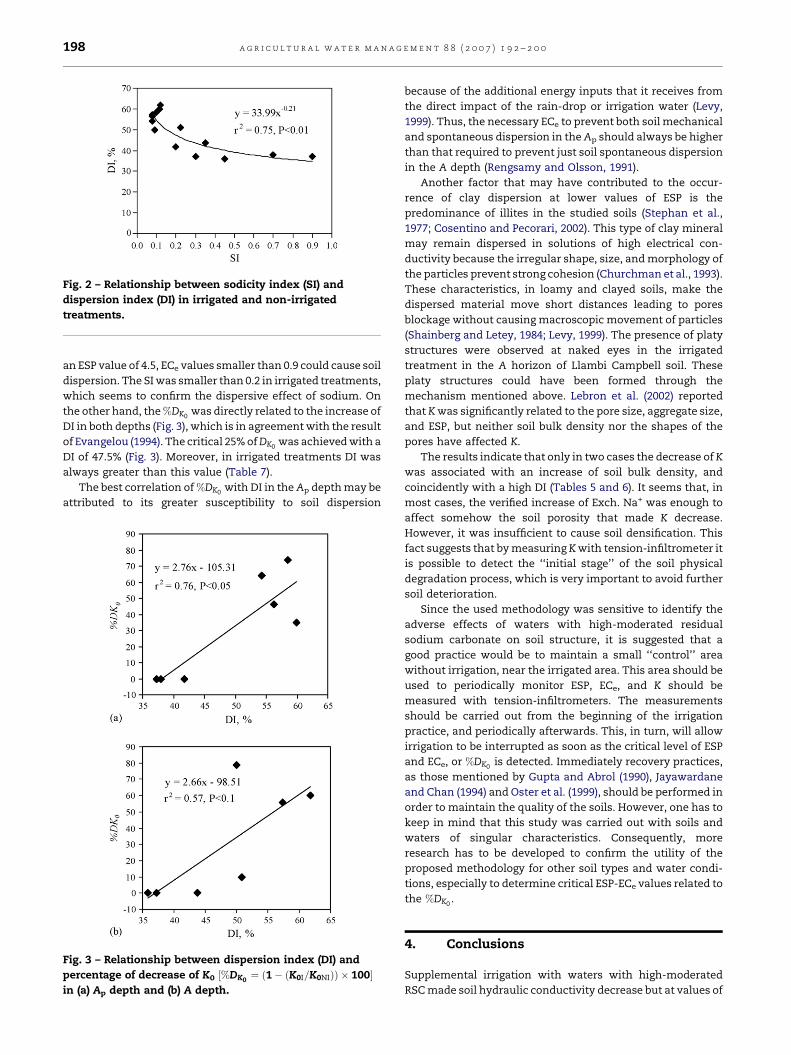
Fig. 2 – Relationship between sodicity index (SI) and
dispersion index (DI) in irrigated and non-irrigated
treatments.
a g r i c u l t u r a l w a t e r m a n a g e m e n t 8 8 ( 2 0 0 7 ) 1 9 2 – 2 0 0198
an ESP value of 4.5, ECe values smaller than 0.9 could cause soil
dispersion. The SI was smaller than 0.2 in irrigated treatments,
which seems to confirm the dispersive effect of sodium. On
the other hand, the %DK0was directly related to the increase of
DI in both depths (Fig. 3), which is in agreement with the result
of Evangelou (1994). The critical 25% ofDK0was achieved with a
DI of 47.5% (Fig. 3). Moreover, in irrigated treatments DI was
always greater than this value (Table 7).
The best correlation of %DK0 with DI in the Ap depth may be
attributed to its greater susceptibility to soil dispersion
Fig. 3 – Relationship between dispersion index (DI) and
percentage of decrease of K0 ½%DK0¼ ð1� ðK0I=K0NIÞÞ � 100�
in (a) Ap depth and (b) A depth.
because of the additional energy inputs that it receives from
the direct impact of the rain-drop or irrigation water (Levy,
1999). Thus, the necessary ECe to prevent both soil mechanical
and spontaneous dispersion in the Ap should always be higher
than that required to prevent just soil spontaneous dispersion
in the A depth (Rengsamy and Olsson, 1991).
Another factor that may have contributed to the occur-
rence of clay dispersion at lower values of ESP is the
predominance of illites in the studied soils (Stephan et al.,
1977; Cosentino and Pecorari, 2002). This type of clay mineral
may remain dispersed in solutions of high electrical con-
ductivity because the irregular shape, size, and morphology of
the particles prevent strong cohesion (Churchman et al., 1993).
These characteristics, in loamy and clayed soils, make the
dispersed material move short distances leading to pores
blockage without causing macroscopic movement of particles
(Shainberg and Letey, 1984; Levy, 1999). The presence of platy
structures were observed at naked eyes in the irrigated
treatment in the A horizon of Llambi Campbell soil. These
platy structures could have been formed through the
mechanism mentioned above. Lebron et al. (2002) reported
that K was significantly related to the pore size, aggregate size,
and ESP, but neither soil bulk density nor the shapes of the
pores have affected K.
The results indicate that only in two cases the decrease of K
was associated with an increase of soil bulk density, and
coincidently with a high DI (Tables 5 and 6). It seems that, in
most cases, the verified increase of Exch. Na+ was enough to
affect somehow the soil porosity that made K decrease.
However, it was insufficient to cause soil densification. This
fact suggests that by measuring K with tension-infiltrometer it
is possible to detect the ‘‘initial stage’’ of the soil physical
degradation process, which is very important to avoid further
soil deterioration.
Since the used methodology was sensitive to identify the
adverse effects of waters with high-moderated residual
sodium carbonate on soil structure, it is suggested that a
good practice would be to maintain a small ‘‘control’’ area
without irrigation, near the irrigated area. This area should be
used to periodically monitor ESP, ECe, and K should be
measured with tension-infiltrometers. The measurements
should be carried out from the beginning of the irrigation
practice, and periodically afterwards. This, in turn, will allow
irrigation to be interrupted as soon as the critical level of ESP
and ECe, or %DK0is detected. Immediately recovery practices,
as those mentioned by Gupta and Abrol (1990), Jayawardane
and Chan (1994) and Oster et al. (1999), should be performed in
order to maintain the quality of the soils. However, one has to
keep in mind that this study was carried out with soils and
waters of singular characteristics. Consequently, more
research has to be developed to confirm the utility of the
proposed methodology for other soil types and water condi-
tions, especially to determine critical ESP-ECe values related to
the %DK0.
4. Conclusions
Supplemental irrigation with waters with high-moderated
RSC made soil hydraulic conductivity decrease but at values of
a g r i c u l t u r a l w a t e r m a n a g e m e n t 8 8 ( 2 0 0 7 ) 1 9 2 – 2 0 0 199
ESP not always considered as critical as the ones in literature.
Changes in the hydraulic conductivity were associated with
soil particles dispersion and with the degradation of bigger
pores. The hydraulic conductivity measured with tension-
infiltrometer in the field, in conjunction with the ESP and ECe,
were sensitive indicators for detecting early soil physical
degradation. These indicators could be used to prevent soil
deterioration, and therefore, to contribute to the sustainable
management of the soils.
r e f e r e n c e s
Andriulo, A., Galetto, M.L., Ferreyra, C., Cordone, C., Sasal, C.,Abgrego, F., Galina, J., Rimatori, F., 1998. Efectos de onceanos de riego complementario sobre un argiudol tıpicopampeano. Ciencia del Suelo 16, 125–127.
Ankeny, M.D., Kaspar, T.C., Horton, R., 1990. Characterization oftillage and traffic effects on unconfined infiltrationmeasurements. Soil Sci. Soc. Am. J. 52, 837–840.
Ankeny, M.D., Ahmed, M., Kaspar, T.C., Horton, R., 1991. Simplefield method for determining unsaturated hydraulicconductivity. Soil Sci. Soc. Am. J. 55, 467–470.
Arens, P., 1969. Algunos efectos del riego suplementario sobrelos suelos de la Pampa Ondulada. Actas V ReunionArgentina de la Ciencia del Suelo, Santa Fe, Argentina, pp.98–102.
Ayers, R.S., Westcot, W., 1985. Water quality for agriculture. FAOIrrigation and Drainage Paper 29, Rev. 1, FAO, Rome, 174 pp.
Blake, G.R., Hartge, K.H., 1986. Bulk density. In: Klute, A. (Ed.),Methods of Soil Analysis: Physical and MineralogicalMethods. American Society of Agronomy, Madison, pp.363–375.
Buckland, G.D., Bennett, D.R., Mikalson, D.E., de Jong, E., Chang,C., 2002. Soil salinization and sodication from alternateirrigations with saline-sodic water and simulated rain. Can.J. Soil Sci. 82, 297–309.
Cameira, M.R., Fernando, R.M., Pereira, L.S., 2003. Soilmacropore dynamics affected by tillage and irrigation for asilty loam alluvial soil in southern Portugal. Soil Till. Res. 70,131–140.
Cerana, J., 1980. Deterioro de los suelos a consecuencia de riegoscon aguas poco salinas que contienen bicarbonatos. ActasIX Reunion Argentina de la Ciencia del Suelo, Parana,Argentina, pp. 55–59.
Churchman, G.J., Skjemstad, O., Oades, J.M., 1993. Influence ofclay minerals and organic matter of effects on sodicity ofsoils. Aust. J. Soil Res. 31, 779–800.
Cosentino, D.J., Pecorari, C., 2002. Limos de baja densidad:impacto sobre el comportamiento fısico de los suelos de laregion pampeana. Ciencia del suelo 20, 9–16.
Crescimanno, G., Iovino, M., Provenzano, G., 1995. Influence onsalinity and sodicity on soil structural and hydrauliccharacteristic. Soil Sci. Soc. Am. J. 59, 1701–1708.
Dunn, G.H., Phillips, R.E., 1991. Macroporosity of a well drainedsoil under no-till and conventional tillage. Soil Sci. Soc. Am.J. 55, 817–823.
Eaton, F., 1950. Significance of carbonates in irrigation waters.Soil Sci. 69, 123–133.
Evangelou, V.P., 1994. Influence of sodium on soils of humidregions. In: Pessarakli, M. (Ed.), Handbook of Plant and CropStress. Marcel Dekker Inc., New York, pp. 32–62.
Frenkel, H., Goertzen, J.O., Rhoades, J.D., 1978. Effect of clay typeand content, exchangeable sodium percentage, andelectrolyte concentration on clay dispersion and soilhydraulic conductivity. Soil Sci. Soc. Am. J. 42, 32–39.
Gee, G.W., Bauder, J.C., 1986. Particle size analysis. In: Klute, A.(Ed.), Methods of Soil Analysis: Physical and MineralogicalMethods. American Society of Agronomy, Madison, pp.383–411.
Ghiberto, P.J., Marano, R.P., Pilatti, M.A., Felli, O., 2002. Riegosuplementario con aguas bicarbonatadas sodicas enMolisoles de Santa Fe. 2. Estudio de caso: Degradacion fısicade un Argiudol en el centro santafesino. Actas XVIIICongreso Argentino de la Ciencia del Suelo, Puerto Madryn,Argentina.
Gupta, R.K., Abrol, I.P., 1990. Salt affect soils: their reclamationand management for crop production. Adv. Soil Sci. 11, 223–288.
Haddadj, D., Gascuel-Odoux, C., 1998. Topographic and seasonalvariations of unsaturated hydraulic conductivity asmeasured by tension disc infiltrometers at the field scale.Eur. J. Soil Sci. 50, 275–283.
Halliwell, D., Barlow, K., Nash, D.M., 2001. A review of the effectsof wastewater sodium on soil physical properties and theirimplications for irrigation systems. Aust. J. Soil Res. 39,1259–1267.
Hulugalle, N.R., Finlay, L.A., 2003. EC1:5/exchangeable Na, asodicity index for cotton farming systems in irrigated andrainfed Vertosols. Aust. J. Soil Res. 41, 761–769.
Instituto Nacional de Tecnologıa Agropecuaria, 1983. Carta desuelos de la Republica Argentina. Hoja 3363-36. INTA,Venado Tuerto, 157 pp.
Instituto Nacional de Tecnologıa Agropecuaria, 1992. Carta desuelos de la Republica Argentina. Hoja 3160-14. INTA, SanJusto, 151 pp.
Jackson, M.L. (Ed.), 1982. Analisis quımico de suelos. Omega,Barcelona, 663 pp.
Jarvis, N.J., Messing, I., 1995. Near-saturated hydraulicconductivity in soils of contrasting texture measured bytension infiltrometers. Soil Sci. Soc. Am. J. 59, 27–34.
Jayawardane, N.S., Chan, K.Y., 1994. The management of soilphysical properties limiting crop production in Australiansodic soils—a review. Aust. J. Soil Res. 32, 13–44.
Keren, R., Ben-Hur, M., 2003. Interaction effects of clay swellingand dispersion and CaCO3 content on saturated hydraulicconductivity. Aust. J. Soil Res. 41, 979–989.
Kosmas, C., Moustakas, N., 1990. Hydraulic conductivity andleaching of an organic saline-sodic soil. Geoderma 46, 363–370.
Lebron, I., Suarez, D.L., Yoshida, T., 2002. Gipsum effect on theaggregate size and geometry of three sodic soils underreclamation. Soil Sci. Soc. Am. J. 66, 92–98.
Levy, G.J., 1999. Sodicity. In: Sumner, M.E. (Ed.), Handbook ofSoil Science. CRC Press, New York, pp. G27–G63.
McIntyre, D.S., 1979. Exchangeable sodium, subplasticity andhydraulic conductivity of some Australian soils. Aust. J. SoilRes. 17, 115–120.
McNeal, B.L., Coleman, N.T., 1966. Effect of solution compositionon soil hydraulic conductivity. Soil Sci. Soc. Am. Proc. 30,308–312.
Melkamu, R., Yano, T., Shainberg, I., 1997. The response of lowand high swelling smectites to sodic conditions. Soil Sci.162, 299–307.
Menneer, J.C., McLay, C.D.A., Lee, R., 2001. Effects of sodiumcontaminated wastewater on soil permeability of two NewZealand soils. Aust. J. Soil Res. 39, 877–891.
Oster, J.D., 1994. Irrigation with poor quality water. Agric. WaterManage. 25, 271–297.
Oster, J.D., Shainberg, I., Abrol, I.P., 1999. Reclamation of saltaffected soils. In: Skaggs, R.W., van Schilfgaarde, J. (Eds.),Agricultural Drainage. Agronomy Monograph, vol. 38.American Society of Agronomy, Madison, pp. 659–691.
Perroux, K.M., White, I., 1988. Designs for disk permeameters.Soil Sci. Soc. Am. J. 52, 1205–1215.
a g r i c u l t u r a l w a t e r m a n a g e m e n t 8 8 ( 2 0 0 7 ) 1 9 2 – 2 0 0200
Pilatti, M.A., de Orellana, J., 1994. Instrucciones para tomarmuestras de suelos. Comunicaciones FAVE, 10 pp.
Pilatti, M.A., Marano, R.P., de Orellana, J.A., 2004. Riegosuplementario con aguas bicarbonatada sodica enmolisoles de Santa Fe. Sodificacion y alcalinizacion.Agrochimica 48, 233–248.
Pilatti, M.A., Imhoff, S., Ghiberto, P., Marano, R.P., 2006. Changesin some physical properties of Molisolls induced bysupplemental irrigation. Geoderma 133, 431–443.
Pupisky, H., Shainberg, I., 1979. Salt effects on thehydraulic conductivity of a sandy soil. Soil Sci. Soc. Am.J. 43, 429–433.
Quirk, J.P., Schofield, R.K., 1955. The effect of electrolyteconcentration on soil permeability. J. Soil Sci. 6,163–178.
Rengsamy, P., Olsson, K.A., 1991. Sodicity and soil structure.Aust. J. Soil Res. 29, 935–952.
Richards, L.A. (Ed.), 1954. Diagnostico y rehabilitacion de suelossalinos y sodicos. Manual de Agricultura, vol. 60. Limusa,Mexico.
Shainberg, I., Letey, J., 1984. Response of soils to sodic and salineconditions. Hilgardia 52, 1–57.
Shainberg, I., Levy, G.J., Goldstein, D., Mamedov, A.I., Letey, J.,2001. Prewetting rate and sodicity effects on thehydraulic conductivity of soils. Aust. J. Soil Res. 39,1279–1291.
So, H.B., Aylmore, A.G., 1993. How do sodic soils behave? Theeffects of sodicity on soil physical behaviour. Aust. J. SoilRes. 31, 761–777.
Statistical Analysis System Institute. SAS/STAT, 1991. ProcedureGuide for Personal Computers. Version 5. SAS Inst., Cary, NC.
Steinberg, B., 1999. Monitoring soil quality of arable land:microbiological indicators. Acta Agric. Scand. 49, 1–24.
Stephan, S., De Petre, A., de Orellana, J.A., Priano, L.J., 1977.Brunizem soils of the central part of the province of SantaFe (Argentine). Pedologie 27, 255–283.
Sumner, M.E., 1993. Sodic soils: new perspectives. Aust. J. SoilRes. 31, 683–750.
Thornthwaite, C.W., 1948. An approach toward a rationalclassification of climate. Geogr. Rev. 38, 55–94.
Watson, K.W., Luxmoore, R.J., 1986. Estimating macroporosityin a forest watershed by use of a tension infiltrometer. SoilSci. Soc. Am. J. 50, 578–582.
Wienhold, B.J., Trooien, T.P., 1995. Salinity and sodicity underirrigated Alfalfa in the Northern Great Plains. Soil Sci. Soc.Am. J. 59, 1709–1714.
Wienhold, B.J., Trooien, T.P., 1998. Irrigation water effects oninfiltration rate in the Northern Great Plains. Soil Sci. 163,853–858.
Wilson, G.V., Luxmoore, R.J., 1988. Infiltration, macroporosity,and mesoporosity distributions on two forestedwatersheds. Soil Sci. Soc. Am. J. 52, 329–335.
Copyright © 2022 FDOKUMEN