
ICICI Prudential Life Insurance announces strong financial ...
Upload
khangminh22Category
view
0download
0
1
“A STUDY ON FINANCIAL PERFORMANCE OF HDFC
LIFE INSURANCE”
Project Report submitted to
UNIVERSITY OF CALICUT
In partial fulfillment of the requirement for the award of the degree of
BACHELOR OF COMMERCE
Submitted by
SANDRA MARIA SURESH
(CCASBCM069)
Under the supervision of
Ms. SANDHYA.V
DEPARTMENT OF COMMERCE
CHRIST COLLEGE (AUTONOMOUS), IRINJALAKUDA
MARCH 2021
2
CHRIST COLLEGE (AUTONOMOUS), IRINJALAKUDA
CALICUT UNIVERSITY
DEPARTMENT OF COMMERCE
CERTIFICATE
This is to certify that the project report entitled "A STUDY ON
FINANCIAL PERFORMANCE OF HDFC LIFE INSURANCE" is a
bonafide record of project done by SANDRA MARIA SURESH, Reg. No.
CCASBCM069, under my guidance and supervision in partial fulfillment of
the requirement for the award of the degree of BACHELOR OF COMMERCE
and it has not previously formed the basis for any Degree, Diploma and
Associateship or Fellowship.
Prof. K.J. JOSEPH Ms. SANDHYA.V
Co-Ordinator Project Guide
3
DECLARATION
I, SANDRA MARIA SURESH, hereby declare that the project work
entitled "A STUDY ON FINANCIAL PERFORMANCE OF HDFC LIFE
INSURANCE" is a record of independent and bonafide project work carried
out by me under the supervision and guidance of Ms. Sandhya. V,Department
of Commerce, Christ College, Irinjalakuda.
The information and data given in the report is authentic to the best of my
knowledge. The report has not been previously submitted for the award of any
Degree, Diploma, Associateship or other similar title of any other university or
institute.
Place: Irinjalakuda Sandra Maria Suresh
Date: CCASBCM069
4
ACKNOWLEDGEMENT
I would like to take the opportunity to express my sincere gratitude to all people who
have helped me with sound advice and able guidance.
Above all, I express my eternal gratitude to the Lord Almighty under whose divine
guidance; I have been able to complete this work successfully.
I would like to express my sincere obligation to Rev. Dr. Jolly Andrews, Principal-in-
Charge, Christ College Irinjalakkuda for providing various facilities.
I am thankful to Prof. K.J. Joseph, Co-Ordinator of B.com (Finance) for providing
proper help and encouragement in the preparation of this report.
I am thankful to Mr. Lipin Raj. K, class teacher for his cordial support, valuable
information and guidance, which helped me in completing this task through various
stages.
I express my sincere gratitude to Ms. Sandhya. V, Assistant Professor, whose
guidance and support throughout the training period helped me to complete this work
successfully.
I would like to express my gratitude to all the faculties of the Department for their
interest and cooperation in this regard.
I extend my hearty gratitude to the librarian and other library staffs of my college for
their wholehearted cooperation.I express my sincere thanks to my friends and family
for their support in completing this report successfully.
Place: Irinjalakuda Sandra Maria Suresh
Date: CCASBCM069
5
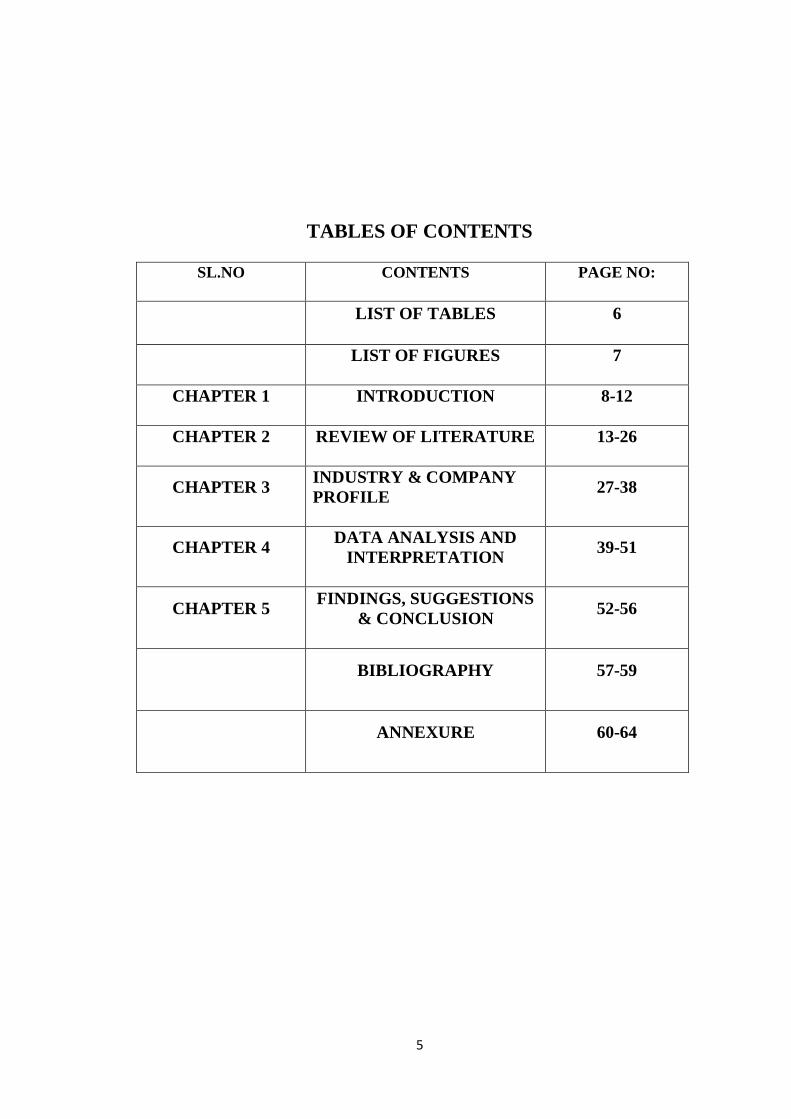
TABLES OF CONTENTS
SL.NO CONTENTS PAGE NO:
LIST OF TABLES 6
LIST OF FIGURES 7
CHAPTER 1 INTRODUCTION 8-12
CHAPTER 2 REVIEW OF LITERATURE 13-26
CHAPTER 3 INDUSTRY & COMPANY
PROFILE 27-38
CHAPTER 4 DATA ANALYSIS AND
INTERPRETATION 39-51
CHAPTER 5 FINDINGS, SUGGESTIONS
& CONCLUSION 52-56
BIBLIOGRAPHY 57-59
ANNEXURE 60-64
6
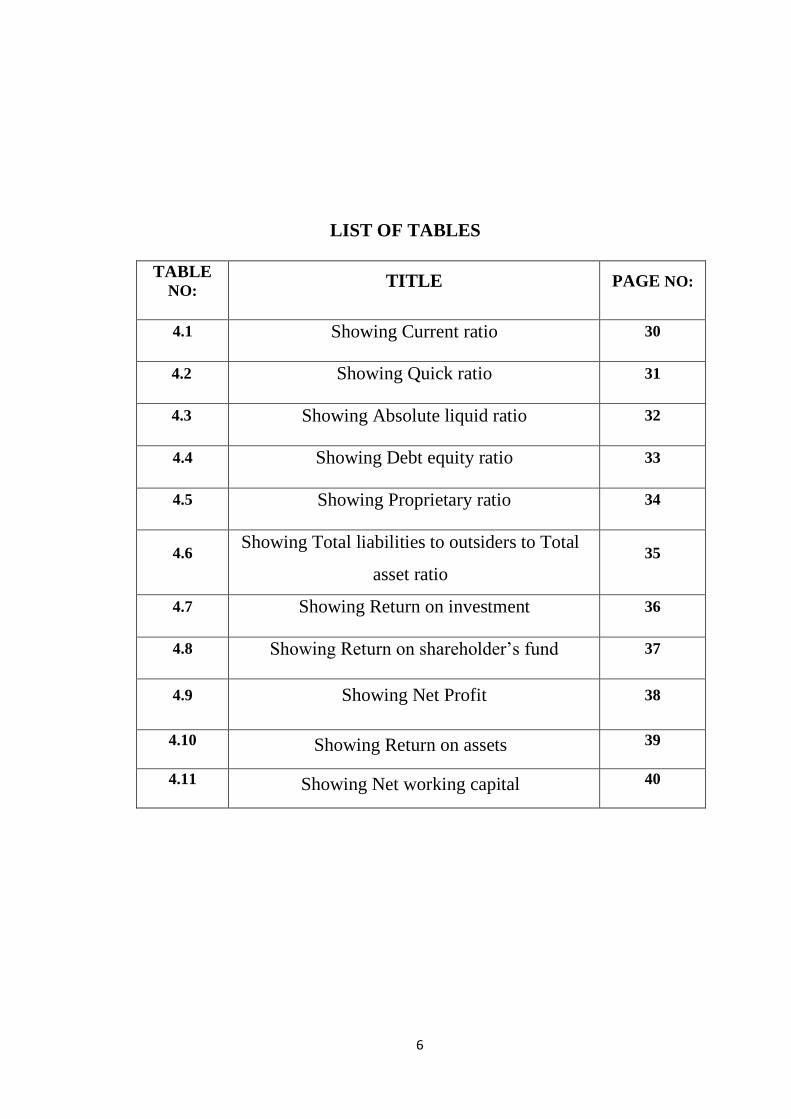
LIST OF TABLES
TABLE
NO: TITLE PAGE NO:
4.1 Showing Current ratio 30
4.2 Showing Quick ratio 31
4.3 Showing Absolute liquid ratio 32
4.4 Showing Debt equity ratio 33
4.5 Showing Proprietary ratio 34
4.6 Showing Total liabilities to outsiders to Total
asset ratio
35
4.7 Showing Return on investment 36
4.8 Showing Return on shareholder’s fund 37
4.9 Showing Net Profit 38
4.10 Showing Return on assets 39
4.11 Showing Net working capital 40
7
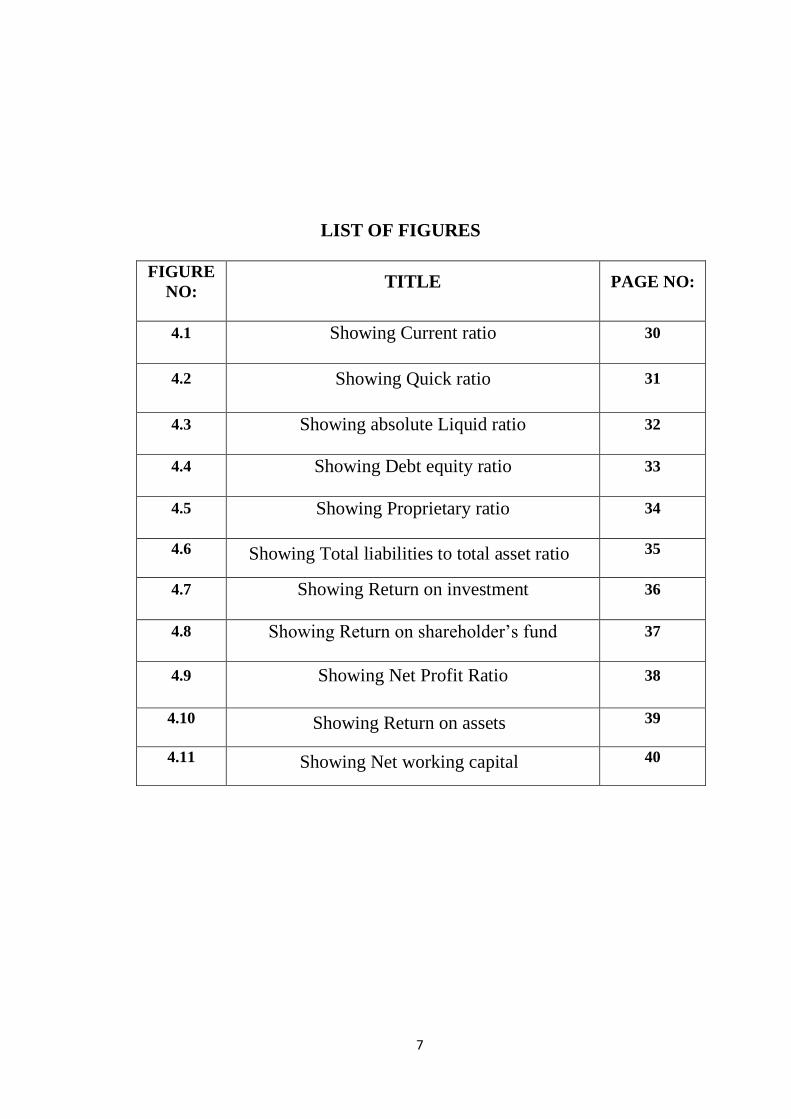
LIST OF FIGURES
FIGURE
NO: TITLE PAGE NO:
4.1 Showing Current ratio 30
4.2 Showing Quick ratio 31
4.3 Showing absolute Liquid ratio 32
4.4 Showing Debt equity ratio 33
4.5 Showing Proprietary ratio 34
4.6 Showing Total liabilities to total asset ratio 35
4.7 Showing Return on investment 36
4.8 Showing Return on shareholder’s fund 37
4.9 Showing Net Profit Ratio 38
4.10 Showing Return on assets 39
4.11 Showing Net working capital 40

8
CHAPTER I
INTRODUCTION
9
1.1 INTRODUCTION
Performance is the action or process of performing a task or function, the
execution of an action or accomplishing something.
Financial performance is a subjective measure of how well a firm can use
assets from its primary mode of business and generate revenues. The term is
also used as a general measure of a firm's overall financial health over a given
period. Analysts and investors use financial performance to compare similar
firms across the same industry or to compare industries or sectors in aggregate.
The financial performance identifies how well a company generates revenues
and manages its assets, liabilities, and the financial interests of its stakeholders.
It undertakes full diagnosis of the profitability and financial soundness of the
business
Thus, financial performance analysis is the process of determining the
operating and financial characteristics of a firm from accounting and financial
statements. The goal of such analysis is to determine the efficiency and
performance of firm’s management, as reflected in the financial records and
reports. The analyst attempts to measure the firm’s liquidity, profitability and
other indicators that the business is conducted in a rational and normal way;
ensuring enough returns to the shareholders to maintain at least its market
value.
Financial analysis involves the use of financial statements. A financial
statement is a collection of data that is organized according to logical and
consistent accounting procedures. Its purpose is to convey an understanding of
some financial aspects of a business firm.
10
The term ‘financial statements’ generally refers to two basic statements: the
Balance Sheet and the Income Statement. Financial performance analysis
involves analysis and interpretation of these financial statements.
However, financial statements do not reveal all the information related to the
financial operations of a firm, but they furnish some extremely useful
information, which highlights two important factors profitability and financial
soundness.
My topic for the project is “The financial performance analysis of HDFC Life
Insurance”. Insurance is the backbone in managing the risk of the country. The
insurance providers offer diversity of products to business, providing protection
from risk thereby ensuring financial security. It helps individual and
organization to minimize the consequences of risk which impart significant
cause on the growth and development of insurance industry.
We examine the past and current financial data of the company, in order to
analyze its financial position, evaluate its performance and estimate the future
risk and potential of the company.
1.2 STATEMENT OF THE PROBLEM
Effective management and control is most important function of financial
management. Analyzing financial performance is the process of evaluating the
common parts of financial statements to obtain a better understanding of firm’s
position and performance. Financial performance analysis enables the investors
and creditors evaluate past and current performance and financial position, and
to predict future performance. Financial statement is used to judge the
profitability and financial soundness of a firm. Hence the present study is to
ascertain the financial performance of HDFC Life Insurance Ltd
11
1.3 . SIGNIFICANCE OF THE STUDY
The significance of the study is to know about the financial performance of the
company and its objectives. It clearly specifies the position of the company and
helps to know about the future risk involved in it.
1.4 SCOPE OF THE STUDY
The study is designed to assess the financial performance of HDFC Life by
using tools and techniques of financial analysis. Financial statement analysis is
not all about ratio analysis it goes beyond that. It helps to predict the future
events. This analysis will give the exact picture of the company. These studies
will also help the management to take managerial decisions and understand the
new possibilities. The study helps us to conduct researches in financial areas
and it also helps us for taking financial decisions.
The study mainly attempts to analyze the financial performance of the
company selected for the study. The financial authorities can use this for
evaluating their performance in future, which will help to analyze financial
statements and help to apply the resources of the company properly for the
development of the company and IT employees to bring overall growth. There
can be forecasting to evaluate the overall company in future. However,
financial statement analysis is not all about ratio analysis it goes beyond that.
1.5 OBJECTIVE OF STUDY
● To analyze the financial statement of the company by the use of
ratios.
● To evaluate working capital position of HDFC Life Insurance Ltd.
● To analyze liquidity, solvency and profitability position.
1.6 RESEARCH DESIGN
1.6.1 NATURE OF STUDY
12
The nature of the study is analytical.
1.6.2 NATURE OF DATA
The data used is secondary data.
1.6.3 SOURCE OF DATA
The secondary data published from the company is used for the collection of
information required for the report.
1.6.3 PERIOD OF STUDY
For the purpose of the study, data of five financial years that is from 2016-2020
of HDFC Life has been taken into consideration.
1.7 TOOLS FOR ANALYSIS
Ratio analysis is the main tool used for analyzing the working capital, liquidity,
solvency and profitability of the company. Mainly three types of ratios are
used: liquidity ratio, solvency ratio and profitability ratio.
1.8 LIMITATIONS
● Only secondary data is available, so the reliability cannot be ensured.
● Done only for the past five years due to time constraint.
● Data collected is of historical in nature and it cannot be used as an index
for future estimates.
1.9 CHAPTERISATION
Chapter1- Introduction
Chapter2- Review of literature
Chapter3- Industry and Company profile
Chapter 4- Data analysis and interpretation
Chapter5 -Findings, suggestions and conclusions.

13
CHAPTER II
REVIEW OF LITERATURE

14
2.1 INTRODUCTION
If you have to write an undergraduate dissertation, you may be required to
begin by writing a literature review. A literature review is a search and
evaluation of the available literature in your given subject or chosen topic area.
It documents the state of the art with respect to the subject or topic you are
writing about.
A literature review has four main objectives:
• It surveys the literature in your chosen area of study
• It synthesizes the information in that literature into a summary
• It critically analyses the information gathered by identifying gaps in current
knowledge; by showing limitations of theories and points of view; and by
formulating areas for further research and reviewing areas of controversy
• It presents the literature in an organized way
A literature review shows your readers that you have an in-depth grasp of your
subject; and that you understand where your own research fits into and adds to
an existing body of agreed knowledge.
Thus, a literature review:
• Demonstrates a familiarity with a body of knowledge and establishes the
credibility of your work;
• Summarizes prior research and says how your project is linked to it;
• integrates and summarizes what is known about a subject;
• Demonstrates that you have learnt from others and that your research is a
starting point for new ideas.
The main types of literature review are evaluative, exploratory and
instrumental.
15
2.2 CONCEPTUAL REVIEW
Ratio analysis is used to evaluate relationships among financial statement
items.
The ratios are used to identify trends over time for one organization or to
compare two or more organizations at one point in time. Ratio analysis focuses
on three key aspects of a business: liquidity, profitability, and solvency.
Ratio Analysis is an important tool for any business organization.
Accounting ratios are a very useful tool for grasping the true message of the
financial statements and understanding them. They act as indicators of financial
soundness, strength, position and status of an enterprise. A comparative study
of the relationship, between various items of financial statements, expressed as
ratios, reveals the profitability, liquidity, solvency as well as the overall
financial position of the enterprises.
One thing that has to be kept in mind in ratio analysis is that the impact of
factor such a s price level changes, changes in accounting policies, window
dressing etc. should also be taken into consideration while attempting to
interpret ratio. The generally accepted classification of ratios is the
classification according to nature or functions and according to it, ratios are of
five types:
• Liquidity ratios.
• Solvency ratios.
• Activity ratios.
• Profitability ratios.
• Market Test ratios
The ratios used in this project are discussed here.
16
1.Liquidity ratios
The term liquidity refers to the firm’s ability to pay its current
liabilities out of its current assets. Liquidity ratios are used to measure
the liquidity position or short term financial position of the firm. These
ratios are used to assess the short term debt paying ability of a firm.
These ratios are highly useful to creditors and commercial banks that
provide short term credit. Important liquidity ratios are Current ratios,
quick ratios, absolute liquid ratios etc.
a) Current ratio or working capital ratio:-
Current ratio may be defined as the relationship between current
assets and current liabilities. This rate is a measure of liquidity and is
most widely used to make the analysis of a short term financial
position or liquidity of the firm.
Current Ratio = Current Asset
Current Liability
The standard current ratio is considered to be 2:1.
b) Quick or liquid ratio:-
Quick ratio is also known as acid test or liquid ratio, is a more
rigorous test of liquidity than the current ratio. The term liquidity
refers to the ability of a firm to pay its short term obligations as and
when they become due. Quick ratio may be defined as the
relationship between quick assets and current liabilities. Current
assets except inventories and prepaid expenses constitute the liquid
asset. And quick liabilities do not include bank overdraft and
includes all other current liabilities.
17
Quick Ratio = Quick Assets
Current /liquid liabilities
The standard liquid ratio is considered as 1:1.
c) Absolute liquid ratio:-
Although receivables, debtors and bill receivables all are generally
more liquid than inventories, yet there may be doubts regarding their
realization into cash immediately or in time. Hence absolute liquid
ratio should be calculated excluding receivables from the liquid
asset.
Absolute liquid ratio = Cash + Bank +Short term securities
Current liabilities
The standard absolute liquid ratio is considered to be 0.5:1.
1. Solvency Ratio
The term solvency refers to the ability of the firm to pay its outside
liabilities (both short term and long term). It is also called leverage
ratios or capital structure ratios. Thus, solvency (long term solvency)
ratios are used to analyze the long term financial position of a business.
In other words, these ratios are used to analyze the capital structure of a
firm. Debt equity ratios, Proprietary ratios etc are some of the important
leverage ratios.
a) Debt-Equity ratio:-
Debt-Equity ratio, also known as external-internal equity ratio is
calculated to measure the relative claims of outsiders and the
owners against the firm’s asset. This ratio indicates the relation
between the external equities or the outsider funds and the internal
equities or the shareholders’ funds.
18
Debt-Equity Ratio= Outsiders Funds (Long Term Debt)
Shareholder’s Funds
The standard or ideal debt- equity ratio is 1:1. This means the funds
provided by outsiders and shareholders must be equal. Some experts
suggest 2:1 as standard ratio .However, lower the ratio better it is. A
debt-equity ratio of 2: 1 is the norm accepted by private sector enterprises.
For public sector enterprises a debt- equity ratio of 1: 1 is expected to be
maintained.
b)Proprietary Ratio or Equity Ratio:-
A variant to the debt equity ratio is the proprietary ratio which is
also known as equity ratio or shareholders to equities ratio or net
worth to total assets ratio. This ratio establishes the relationship
between shareholder’s funds to total assets of the firm. The ratio of
proprietor’s funds to total assets is an important ratio for
determining long term solvency of a firm. The components of this
ratio are shareholder’s funds and total assets.
Proprietary Ratio = Shareholder’s Funds
Total Assets
Generally ratio of 0.5: 1 or above (or 50% or more) is considered ideal. A
higher ratio indicates safety to the predictors and the lower ratio shows greater
risk to the creditors. A higher ratio indicates that the firm is less dependent on
creditors for working capital. Therefore a higher proprietary ratio indicates a
sound financial position.
c) Total liabilities to Total Assets Ratio:-
This ratio indicates the relationship between the total liabilities to
outsiders to total assets of the firm and can be calculated as follows;
19
Solvency ratio= Total Liabilities to Outsiders
Total Assets
The solvency ratio indicates the degree of solvency of a business. A higher
solvency ratio indicates that the solvency and the financial position are strong.
If the ratio is more than one, the lenders can breathe a free air as their
investment is secured. A lower solvency ratio indicates that the solvency and
the financial position are weak.
b) Debt-Service Ratio or Interest Coverage Ratio:-
Net income to debt service or simply debt service ratio is used to
test the debt serving capacity of the firm. This ratio is also known as
interest coverage ratio.
Interest coverage ratio = Net profit (before interest and tax)
Fixed Interest Charges
The higher the ratio, the stronger is the ability of a company to pay interest. But
too high ratio may imply unused debt capacity. A low ratio may indicate
excessive use of debt and the inability to offer assured payment of interest to
creditors. This may affect the solvency of the firm.
Profitability Ratios
The term profitability refers to the ability of a firm to earn income. The
profitability of a firm can be easily measured by its profitability ratios. There
are two types of profitability ratios. First ratios based on investment and ratios
based on sales.
Profitability ratios based on investment:
a) Return on investment (ROI):-
When a firm invests money in a business, it naturally expects adequate return
on its investment. Therefore, the firm wants to know how much profit is
20
earning on its investment. It is for knowing this, ROI is computed. ROI
measures the overall profitability. It establishes relationship between profit or
return and investment. It is also called accounting rate of return. It is computed
as follows:-
ROI= Profit before interest and tax X 100
Capital employed
The higher the ROI, greater is the overall profitability and more efficient use of
capital employed.
b) Return on shareholder’s fund:-
This is the ratio of net profit to shareholder’s fund or net worth. It measures the
profitability from the shareholder’s point of view. This ratio is called the
‘mother of all ratios’. This is perhaps the most important ratio because it
measures the return that is earned on the owner’s capital. It is calculated as
follows:
Return on the shareholders fund= Net Profit after interest and tax X 100
Shareholders fund
c) Return on assets ratio( ROA):-
This ratio is an indicator of how profitable company is relative to its total
assets. ROA gives a manager, investor, or analyst an idea as to how efficient a
company’s management is at using its assets to generate earnings. It is
calculated as follows:
Return on assets= Net income X 100
Total assets
Higher ROA indicates more asset efficiency.
21
Working capital
Working capital, also known as net working capital (NWC), is the difference
between a company’s current assets, such as cash, accounts receivable
(customers’ unpaid bills) and inventories of raw materials and finished goods,
and its current liabilities, such as accounts payable. Net operating working
capital is a measure of a company's liquidity and refers to the difference
between operating current assets and operating current liabilities. In many
cases these calculations are the same and are derived from company cash plus
accounts receivable plus inventories, less accounts payable and less accrued
expenses.
Working capital is a measure of a company's liquidity, operational
efficiency and its short-term financial health. If a company has substantial
positive working capital, then it should have the potential to invest and grow. If
a company's current assets do not exceed its current liabilities, then it may have
trouble growing or paying back creditors, or even go bankrupt.
To calculate the working capital, compare a company's current assets to its
current liabilities. Current assets listed on a company's balance sheet include
cash, accounts receivable, inventory and other assets that are expected to be
liquidated or turned into cash in less than one year. Current liabilities include
accounts payable, wages, taxes payable, and the current portion of long-term
debt. Current assets are available within 12 months. Current liabilities are due
within 12 months.
The standard formula for working capital is:
Working Capital= Current assets- Current liabilities.
22
Working capital that is in line with or higher than the industry average for a
company of comparable size is generally considered acceptable. Low working
capital may indicate a risk of distress or default.
Working capital is important because it is necessary in order for businesses to
remain solvent. In theory, a business could become bankrupt even if it is
profitable. After all, a business cannot rely on accounting profits in order to pay
its bills—those bills need to be paid in cash readily in hand.
There are two concepts of working capital namely gross working capital and
net working capital.
a) Gross Working Capital:
It is also called simply ‘working capital’. It refers to the total of all the current
assets of the firm. Current assets are the assets which are meant to be converted
into cash within a year or an operating cycle. Stock of raw materials, stock of
semi-finished goods, stock of finished goods, trade debtors, bills receivable,
prepaid expenses, cash at bank and cash in hand are examples of current assets.
Gross working capital= total current assets
b) Net Working Capital:
For financing current assets, long-term funds as well as short term funds are
used. Short-term funds are provided by current liabilities i.e. claims of
outsiders which are expected to mature for payment within a year. Trade
creditors, bills payable and outstanding expenses are examples of current
liabilities. Net working capital refers to the excess of current assets over current
liabilities.
Net working capital = current assets – current liability
The net working capital position of the firm is an important consideration as
this will determine the firm profitability and risk. Here the profitability refers to
the profit after expenses risk and refers to the profitability that a firm will

23
become technically insolvent where it will be unable to meet obligation when
they become due for payment.
24
2.3 EMPIRICAL LITERATURE
• Darzi T. A., (2011) in the Ph. D. dissertation 'Financial
Performance of Insurance Industry in Post Liberalization Era in
India' stated that the insurance sector in the country is passing
through a period of structural changes under the combined impact
of financial sector reforms in general and insurance sector in
particular. The market has transformed from earlier government
monopoly to a competitive structure. Liberalization has led to a
paradigm shift in the Indian life insurance sector. Liberalization
has introduced competition leading to expansion and growth of
insurance. Hence, the larger cake is being shared by the existing
and new players. It suggests that life insurers should come out
with innovative covers and selling techniques coupled with wider
choice of pricing and improved customer focus for growth and
expansion of the Indian insurance market. The thesis concentrates
on performance evaluation of the non life insurance sector.
• Kamal Gulati, (2012) studied customer satisfaction level and
analyzed quality of service and post sale relationship is very
important. Many a times in Insurance industry, it is assumed that
“Sell it and forget it” nature of insurance agents and employees.
But it is wrong.
• Rashmita Sahoo, (2012) analyzed Indian Life insurance market.
More than 80% of the population in India does not have any life
insurance cover. There was monopoly of LIC. But after
privatization and opening up of life insurance sector, this sector is
developing very fast. The growth rate of life insurance industry in
India is @ 15 to 20% per annum.
25
• Swadesh Kumar Dash (2013) evaluated the prospectus and
challenges for insurance sector in growing economy of India.
Indian economy is one of the leading economies in the world.
After China, India is fastest growing economy. Insurance sector is
growing whenever there is growth of economy across the world. It
declares that there is huge growth potential for insurance sector in
India.
• Preeti Upadhyay, (2013) the main objective has studied The
Satisfaction level of the policy folders. Simultaneously it is aimed
to study the trends in insurance sector before privatization and
after a decade of privatization. Various products and plans offered
by insurance companies have been studied and awareness about
public sector companies and private sector companies has been
analyzed.
• Yogita Sharma, (2013) The SWOT analysis i.e. “Strength and
weakness” and “Opportunities and threats” in insurance sector in
India has been studied. There is huge potential for growth in
insurance sector in India, very low penetration of insurance is a
big concern as well as it is big opportunities also
• Manoj Kumar Mishra, (2014) analyzed demand of life
insurance. For this annual financial data from the year 1970-71
upto 2009-10 has been considered. It is pointed out that factors
like income, inflation, interest rates, financial development, grows
domestic savings and the rate of growth of economy play vital role
in creating the demand of life insurance.
• N. Prasanna Kumar, (2014) took overall review of Indian
insurance market. There are 52 insurance companies out of which
24 are in life insurance sector and 28 are in general insurance
sector. 8 companies belong to public sector and 44 companies are
private insurance companies.
26
• Suman Si, (2014) the impact of advertisement on decision making
of consumer i.e. Policyholder has been studied. The Study also
focuses on the Role of IRDA as governing body and it has taken
overview of the insurance companies and their advertising efforts
on the insurance sector.
• Ruby Singh, (2014) Studied the need and importance of foreign
direct investment in Indian Insurance Industry. Before it the
review of the scenario of Insurance sector in India on three levels
has been taken (i) Pre independence (ii) Nationalization and (iii)
Post IRDA. It is discussed and analyzed that there is huge
potential for expansion and growth for insurance sector in the
country

27
CHAPTER III
INDUSTRY & COMPANY
PROFILE
28
3.1 Introduction
Industry analysis is a tool that facilitates a company's understanding of its
position relative to other companies that produce similar products or services.
Understanding the forces at work in the overall industry is an important
component of effective strategic planning. Industry analysis enables business
owners to identify the threats and opportunities facing their businesses, and to
focus their resources on developing unique capabilities that could lead to a
competitive advantage. An industry analysis consists of three major elements:
the underlying forces at work in the industry; the overall attractiveness of the
industry; and the critical factors that determine a company's success within the
industry. Industry analysis also provides the essential framework for Company
analysis.
3.2 Industry profile
The insurance industry helps to eliminate risks (as when fire-insurance
providers demand the implementation of safe practices and the installation of
hydrants), spreads risks from individuals to the larger community, and provides
an important source of long-term finance for both the public and private
sectors. The history of insurance traces the development of the modern
business of insurance against risks, especially regarding cargo, property, death,
automobile accidents, and medical treatment.
The market for insurance in India which covers both the public and private
sector organizations is the insurance in India. It is listed in the Constitution of
India in the Seventh Schedule as a Union List subject, meaning it can only be
legislated by the Central Government only.
The insurance industry of India has 57 insurance companies 24 are in the life
insurance business, while 33 are non-life insurers. Among the life insurers, Life
Insurance Corporation (LIC) is the sole public sector company. There are six
public sector insurers in the non-life insurance segment. In addition to these,
there is a sole national re-insurer, namely General Insurance Corporation of
29
India (GIC Re). Other stakeholders in the Indian Insurance market include
agents (individual and corporate), brokers, surveyors and third-party
administrators servicing health insurance claims.
The insurance sector has gone through a number of phases by allowing private
companies to solicit insurance and also allowing foreign direct investment.
India allowed private companies in insurance sector in 2000, setting a limit on
FDI to 26%, which was increased to 49% in 2014. Since the privatization in
2001, the largest life-insurance company in India, Life Insurance Corporation
of India has seen its market share slowly slipping to private giants like HDFC
Life, ICICI Prudential Life Insurance and SBI Life Insurance Company. In
India, the overall market size of the insurance sector is expected to US$ 280
billion in 2020. Government's policy of insuring the uninsured has gradually
pushed insurance penetration in the country and proliferation of insurance
schemes. Gross premium collected by life insurance companies in India
increased from Rs. 2.56 trillion (US$ 39.7 billion) in FY12 to Rs. 7.31 trillion
(US$ 94.7 billion) in FY20. During FY12-FY20, premium from new business
of life insurance companies in India increased at a CAGR of 15% to reach Rs.
2.13 trillion (US$ 37 billion) in FY20. Overall insurance penetration
(premiums as% of GDP) in India reached 3.71% in FY19 from 2.71% in FY02.
Life insurers reported 14% YoY growth in individual annualized premium
equivalent (APE) in October 2020, compared with 4% YoY in September
2020. The market share of private sector companies in the non-life insurance
market rose from 15% in FY04 to 56% in FY21 (till April 2020). In life
insurance segment, private players had a market share of 31.3% in new
business in FY20. In October 2020, health insurance witnessed an increase in
premiums at Rs. 4,074.8 crore (US$ 553.93 million) compared with Rs. 3,840.6
crore (US$ 554.29 million), recording 6% growth on y-o-y basis. Retail health
also witnessed a 30% increase in premiums to Rs. 1,982.6 crores (US$ 269.69
million).
30
FUNCTIONS
Functions of insurance are to spread the loss caused by a particular risk over
several persons, who are exposed to it and who agree to insure themselves
against the risk.
The most important function of insurance is to spread the risk over a number of
persons who are insured against the risk, share the loss of each member of the
society on the basis of the probability of loss to their risk and provide security
against losses to the insured.
So, insurance functions are;
1. The system to spread the risk over several persons who are insured
against the risk;
2. The principle to share the loss of each member of the society based on
the probability of loss to their risk; and
3. The method to provide security against losses to the insured.
The functions of insurance can be studied into two parts;
1. Primary Functions, and,
2. Secondary Functions.
7 Functions of insurance are;
1. Insurance provides certainty,
2. Insurance provides protection,
3. Risk-Sharing,
4. Prevention of loss,
5. It Provides Capital,
6. It Improves Efficiency,
7. It helps Economic Progress.
31
Primary Functions of Insurance:
1. Insurance provides certainty: -
Insurance provides certainty of payment at the uncertainty of loss. The
uncertainty of loss can be reduced by better planning and administration. But
the insurance relieves the person from such a difficult task. Moreover, if the
subject matters are not adequate, the self-provision may prove costlier. There
are different types of uncertainty in a risk: Whether the risk will occur or not,
when will occur, how much loss will be there? In other words, there is the
uncertainty of happening of time and amount of loss. Insurance removes all
these uncertainties and the assured is given certainty of payment of loss. The
insurer charges the premium for providing the said certainty.
2. Insurance provides protection: -
The main function of insurance is to protect the probable chances of loss. The
time and amount of loss are uncertain and at the happening of risk, the person
will suffer the loss in the absence of insurance. The insurance guarantees the
payment of loss and thus protects the assured from sufferings. The insurance
cannot check the happening of risk but can provide for losses at the happening
of the risk.
3. Risk-Sharing: -
The risk is uncertain, and therefore, the loss arising from the risk is also
uncertain. When risk takes place, the loss is shared by all the persons who are
exposed to the risk. The risk-sharing in ancient times was done only at the time
of damage or death; but today, based on the probability of risk, (the share is
obtained from every insured in the shape of premium without which protection
is not guaranteed by the insurer.
32
Secondary Functions of Insurance:
Besides the above primary functions, the insurance works for the following
functions:
4. Prevention of loss: -
The insurance joins hands with those institutions which ate engaged in
preventing the losses of the society because the reduction in loss causes the
lesser payment to the assured arid so more saving is possible which will assist
in reducing the premium. Lesser premium invites more business and more
business cause lesser share to the assured. So again, premium is reduced to
what will stimulate more business and more protection to the masses.
Therefore, the insurance assists financially to the health organization, fire
brigade, educational institutions and other organizations which are engaged in
preventing the losses of the masses from death or damage.
5. It Provides Capital: -
The insurance provides capital to society. The accumulated funds are invested
in the productive channel. The death of the capital of the society is minimized
to a greater extent with the help of investment in insurance. The industry, the
business, and the individual are benefited by the investment and loans of the
insurers.
6. It Improves Efficiency: -
Insurance eliminates worries and miseries of losses at death and destruction of
property. The carefree person can devote his body and soul together for better
achievement, it improves not only his efficiency but the efficiencies of the
masses are also advanced.
7. It helps Economic Progress: -
The insurance by protecting the society from huge losses of damage,
destruction, and death, provides an initiative to work hard for the betterment of
33
the masses. The next factor of economic progress, the capital, is also
immensely provided by the masses. The property, the valuable assets, the man,
the machine and the society cannot lose much at the disaster.
Functions of Insurance Company:
1. Provides Reliability: -
The main function of insurance is that eliminates the uncertainty of an
unexpected and sudden financial loss. This is one of the biggest worries of a
business. Instead of this uncertainty, it provides the certainty of regular
payment i.e., the premium to be paid.
2. Protection: -
Insurance does not reduce the risk of loss or damage that a company may
suffer. But it provides a protection against such loss that a company may suffer.
So at least the organization does not suffer financial losses that debilitate their
daily functioning.
3. Pooling of Risk: -
In insurance, all the policyholders pool their risks together. They all pay their
premiums and if one of them suffers financial losses, then the payout comes
from this fund. So, the risk is shared between all of them.
4. Legal Requirements: -
In a lot of cases getting some form of insurance is actually required by the law
of the land. Like for example when goods are in freight, or when you open a
public space getting fire insurance may be a mandatory requirement. So, an
insurance company will help us fulfill these requirements.
5. Capital Formation: -
The pooled premiums of the policyholder’s help create a capital for the
insurance company. This capital can then be invested in productive purposes
that generate income for the company.
34
HISTORY
The earliest known instance of insurance dates back to the Babylonian periods
2050 BC when the Babylonians developed a type of loan insurance for
Maritime business. The first example of modern insurance was issued in 1653
to William Gibbons of London. The Policy was a one-year term policy;
according to which Gibbon's beneficiaries would get Euro 400 in the event of
his death in exchange for a premium of Euro 32.
Insurance originally evolved as a commercial instrument after 1666 as a result
of the Great fire of London and thus fire insurance emerged. The first fire
insurance company was started in 1667 by Dr Nicholas Barden.
The miscellaneous insurance took the present shape at the later part of the
19th Century with the industrial revolution in England. Accident insurance,
Fidelity insurance, Liability insurance and Theft insurance were the new forms
of insurance.
From its meager origin in ancient times, insurance has evolved in response to
the needs of individuals to mitigate against the risks that they face in the
commercial activities and later to guarantee the personal health and the
financial well-being of the family.
Insurance in India, in this current form has its history dating back to 1818,
when Oriental Life Insurance Company was started by Anita Bhavsar in
Kolkata to cater to the needs of European community. The pre-independence
era in India saw discrimination between the lives of foreigners (English) and
Indians with higher premiums being charged for the latter. In 1870, Bombay
Mutual Life Assurance Society became the first Indian insurer.
At the dawn of the twentieth century, many insurance companies were
founded. In the year 1912, the Life Insurance Companies Act and the Provident
Fund Act were passed to regulate the insurance business. The Life Insurance
Companies Act, 1912 made it necessary that the premium-rate tables and
35
periodical valuations of companies should be certified by an actuary. However,
the disparity still existed as discrimination between Indian and foreign
companies. The oldest existing insurance company in India is the National
Insurance Company, which was founded in 1906, and is still in business.
The Government of India issued an Ordinance on 19 January 1956
nationalizing the Life Insurance sector and Life Insurance Corporation came
into existence in the same year. The Life Insurance Corporation (LIC) absorbed
154 Indian, 16 non-Indian insurers and also 75 provident societies—245 Indian
and foreign insurers in all. In 1972 with the General Insurance Business
(Nationalization) Act was passed by the Indian Parliament, and consequently,
General Insurance business was nationalized with effect from 1 January 1973.
107 insurers were amalgamated and grouped into four companies, namely
National Insurance Company Ltd., the New India Assurance Company Ltd., the
Oriental Insurance Company Ltd and the United India Insurance Company Ltd.
The General Insurance Corporation of India was incorporated as a company in
1971 and it commenced business on 1 January 1973.
The LIC had monopoly till the late 90s when the Insurance sector was
reopened to the private sector. But now there are 23 private life insurance
companies in India. Before that, the industry consisted of only two state
insurers: Life Insurers (Life Insurance Corporation of India, LIC) and General
Insurers (General Insurance Corporation of India, GIC). GIC had four
subsidiary companies. With effect from December 2000, these subsidiaries
have been de-linked from the parent company and were set up as independent
insurance companies: Oriental Insurance Company Limited, New India
Assurance Company Limited, National Insurance Company Limited and
United India Insurance Company.
36
3.3Company profile
HDFC Life Insurance Limited (formerly HDFC Standard Life Insurance
Company Ltd.) is a long-term life insurance provider with its headquarters in
Mumbai, offering individual and group insurance services.
The company is a joint venture between Housing Development Finance
Corporation Ltd (HDFC), one of India's leading housing finance institutions
and Standard Life Aberdeen, a global investment company. As on 31 March
2020, the promoters; HDFC Ltd. and Standard Life (Mauritius Holdings) 2006
Ltd. hold a 51.4% and 12.3% stake in HDFC Life respectively. The remaining
equity is held by public shareholders.
Established in 2000, HDFC Life is a leading long-term life insurance solutions
provider in India, offering a range of individual and group insurance solutions
that meet various customer needs such as Protection, Pension, Savings,
Investment, Annuity and Health. As on September 30, 2020, the Company had
36 individual and 13 group products in its portfolio, along with 7 optional rider
benefits, catering to a diverse range of customer needs. The plans include:
• Protection Plans - insurance plans that provide protection and financial
stability to the family in case of any unforeseen events.
• Click2Protect life is their online term plan.
• Launched CSC Suraksha to be sold exclusive through the Common
Services Centre network.
• Click2Invest is their online ULIP investment plan.
• Health Plan – offers financial security to meet health related
contingencies.
• Savings & Investment plans - These plans help in investment to achieve
financial goals.
• Retirement plans - financial security for life post retirement.
• Women's plans - plans catering to different financial needs of women.
• Children's plans – plans meant to secure children's future.
37
• Rural & social Plans – meant specifically for rural customers.
• Click2Retire completed their Click2 portfolio.
• ULIP Investment with more funds.
HDFC Life continues to benefit from its increased presence across the country
having a wide reach with 420 branches and additional distribution touch-points
through several new tie-ups and partnerships. The count of our partnerships is
in excess of 300, comprising traditional partners such as NBFCs, MFIs and
SFBs, and includes more than 50 new-ecosystem partners. The MD&CEO of
the company is Vibha Padalkar, Executive Director is Suresh Badami, Chief
Financial Officer is Niraj Shah, Chief Operating Officer is Parvez Mulla, Chief
Actuary & Appointed Actuary is Srinivasan Parthasarathy, Chief Investment
Officer is Prasun Gajri, Bancassurance Alliances head and Chief Marketing
Officer is Pankaj Gupta &Vibhash Naik heads the human resources as Head
HR, Admin and L&D. The Company also has a strong base of financial
consultants.
HDFC was incorporated as a public limited company on October 17, 1977
under the Companies Act, 1956 and received a certificate of commencement of
business on December 3, 1977. HDFC received a certificate of registration
dated July 31, 2001 from the NHB under Section 29A of the NHB Act. Its CIN
is L70100MH1977PLC019916 and its registered office is situated at Ramon
House, 169 Back bay Reclamation, H. T. Parekh Marg, Mumbai 400 020,
Maharashtra, India. The equity shares of HDFC were listed on BSE in 1978
and NSE in 1996. The equity shares of HDFC are currently listed on NSE and
BSE.
As per the terms of the memorandum of association of HDFC, the main object
is to, inter alia, advance money to any person, company, association or society,
either at interest or without, and / or with or without any security, for the
purpose of enabling the borrower to erect or purchase or enlarge or repair any
house or building or lease any property in India on such terms and conditions
as it may deem fit.
38
HDFC Life distributes its products through a multi-channel network consisting
of Insurance agents, Bancassurance partners (HDFC Bank, Saraswat Bank,
RBL Bank), a direct channel, Insurance Brokers and an Online Insurance
Platform.
The Insurance Regulatory and Development Authority (IRDA) were
constituted in 1999 as an autonomous body to regulate and develop the
insurance industry. The IRDA opened up the market in August 2000 with the
invitation for application for registrations. HDFC Life was established in 2000
becoming the first private sector life insurance company in India.
By 2001, the company had its 100th customer, strengthened its employee force
to 100 and had settled its first claim. HDFC Life launched its first TV
advertising campaign 'Sar Utha Ke Jiyo' in 2005. In 2006, a study conducted by
the Brand Equity – Economic Times had put HDFC Life at 29th rank in the
most trusted Indian Brands amongst the Top 50 Service Brands of 2010.
The Insurance Regulatory and Development Authority (IRDA) gave
accreditation to HDFC Life for 149 training centers housed in its branches to
cater to the mandatory training required to be given as well as for other sales
training requirements in 2009.
In 2012, it the first private life insurance company to bring back pension plans
under the new regulatory regime, with the launch of two pension plans - HDFC
Life Pension Super Plus and HDFC Life Single Premium Pension Super.
HDFC Life's associated companies include HDFC Ltd, HDFC Bank, HDFC
International Life and Re Company Limited, HDFC Pension, HDFC MF,
HDFC Sales, HDFC Ergo, HDB Financial Services (HDBFS), HDFC
Securities, HDFC RED, HDFC Ventures Trustee Company, GRUH Finance,
HDFC Trustee Company, HDFC Developers, HDFC Property Ventures, HDFC
Investments, Credit Information Bureau (India) Ltd.
39
CHAPTER IV
DATA ANALYSIS AND
INTERPRETATION
40
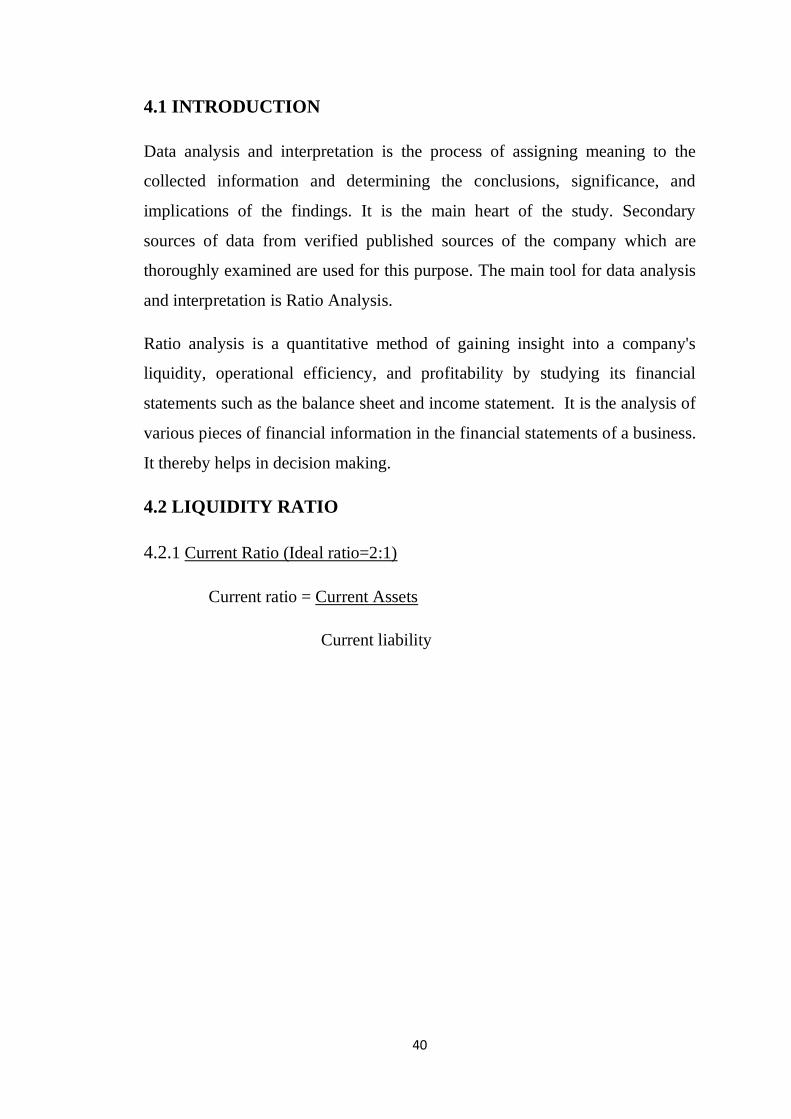
4.1 INTRODUCTION
Data analysis and interpretation is the process of assigning meaning to the
collected information and determining the conclusions, significance, and
implications of the findings. It is the main heart of the study. Secondary
sources of data from verified published sources of the company which are
thoroughly examined are used for this purpose. The main tool for data analysis
and interpretation is Ratio Analysis.
Ratio analysis is a quantitative method of gaining insight into a company's
liquidity, operational efficiency, and profitability by studying its financial
statements such as the balance sheet and income statement. It is the analysis of
various pieces of financial information in the financial statements of a business.
It thereby helps in decision making.
4.2 LIQUIDITY RATIO
4.2.1 Current Ratio (Ideal ratio=2:1)
Current ratio = Current Assets
Current liability
41
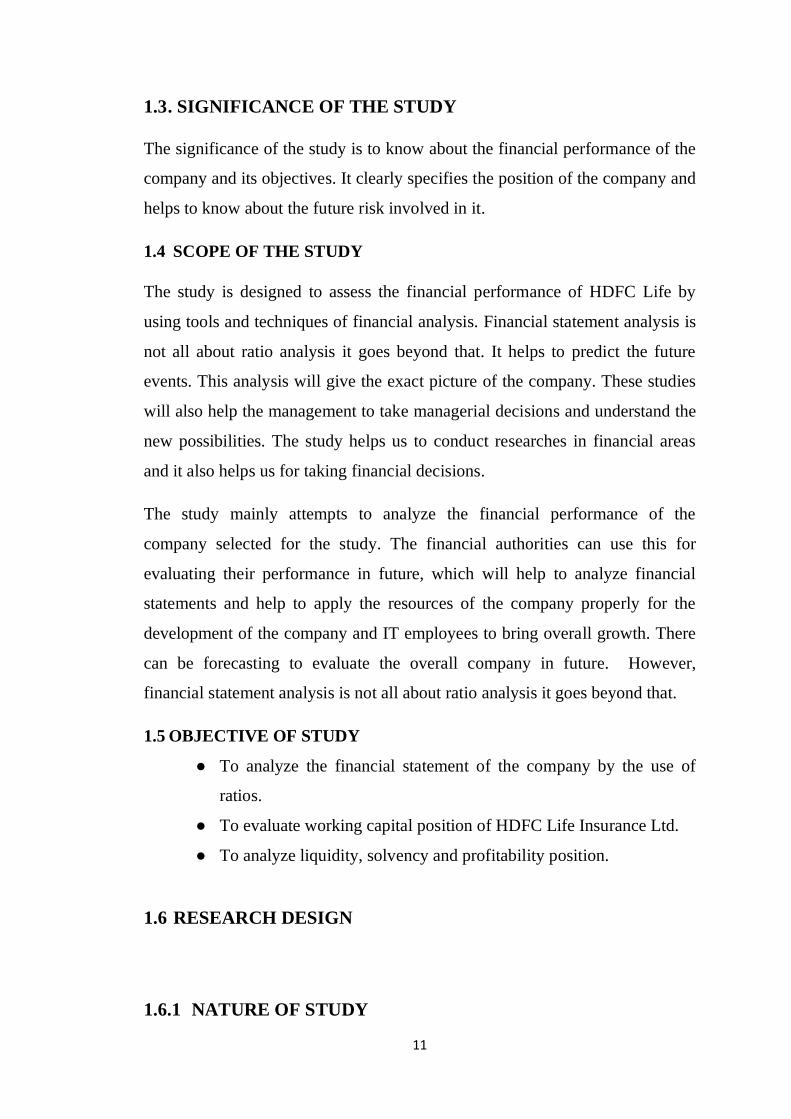
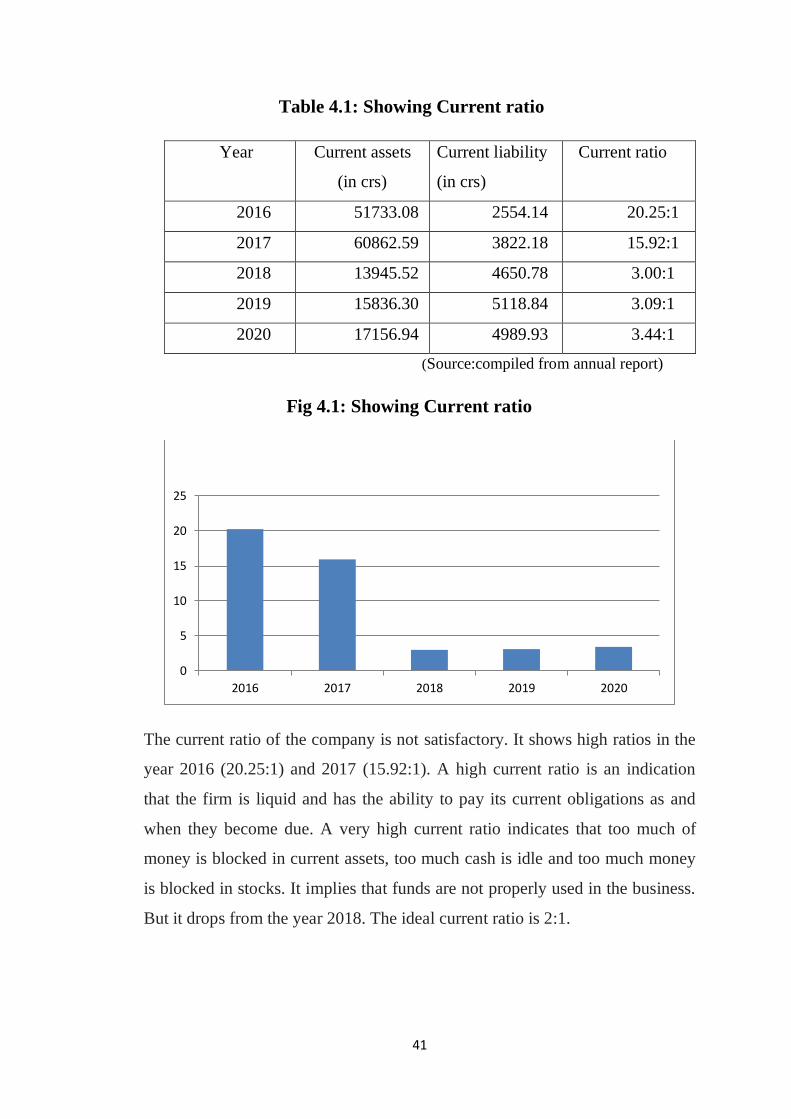
Table 4.1: Showing Current ratio
Year Current assets
(in crs)
Current liability
(in crs)
Current ratio
2016 51733.08 2554.14 20.25:1
2017 60862.59 3822.18 15.92:1
2018 13945.52 4650.78 3.00:1
2019 15836.30 5118.84 3.09:1
2020 17156.94 4989.93 3.44:1
(Source:compiled from annual report)
Fig 4.1: Showing Current ratio
The current ratio of the company is not satisfactory. It shows high ratios in the
year 2016 (20.25:1) and 2017 (15.92:1). A high current ratio is an indication
that the firm is liquid and has the ability to pay its current obligations as and
when they become due. A very high current ratio indicates that too much of
money is blocked in current assets, too much cash is idle and too much money
is blocked in stocks. It implies that funds are not properly used in the business.
But it drops from the year 2018. The ideal current ratio is 2:1.
0
5
10
15
20
25
2016 2017 2018 2019 2020
42
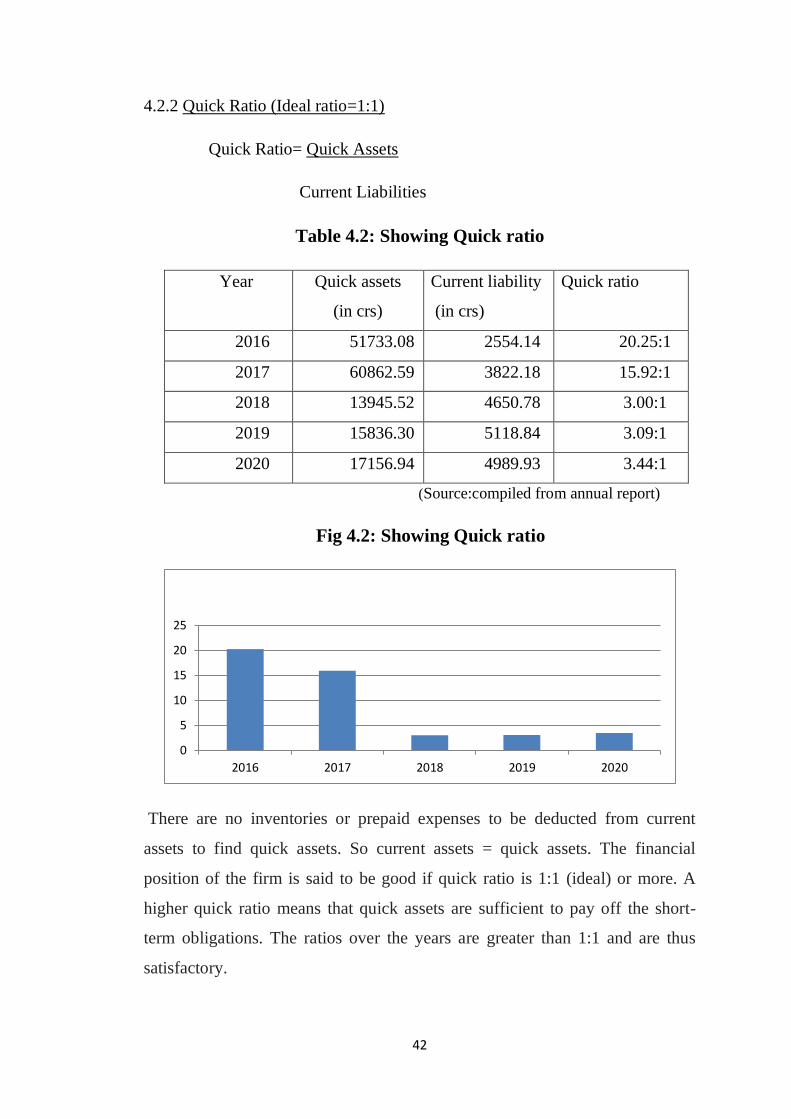
4.2.2 Quick Ratio (Ideal ratio=1:1)
Quick Ratio= Quick Assets
Current Liabilities
Table 4.2: Showing Quick ratio
Year Quick assets
(in crs)
Current liability
(in crs)
Quick ratio
2016 51733.08 2554.14 20.25:1
2017 60862.59 3822.18 15.92:1
2018 13945.52 4650.78 3.00:1
2019 15836.30 5118.84 3.09:1
2020 17156.94 4989.93 3.44:1
(Source:compiled from annual report)
Fig 4.2: Showing Quick ratio
There are no inventories or prepaid expenses to be deducted from current
assets to find quick assets. So current assets = quick assets. The financial
position of the firm is said to be good if quick ratio is 1:1 (ideal) or more. A
higher quick ratio means that quick assets are sufficient to pay off the short-
term obligations. The ratios over the years are greater than 1:1 and are thus
satisfactory.
0
5
10
15
20
25
2016 2017 2018 2019 2020
43
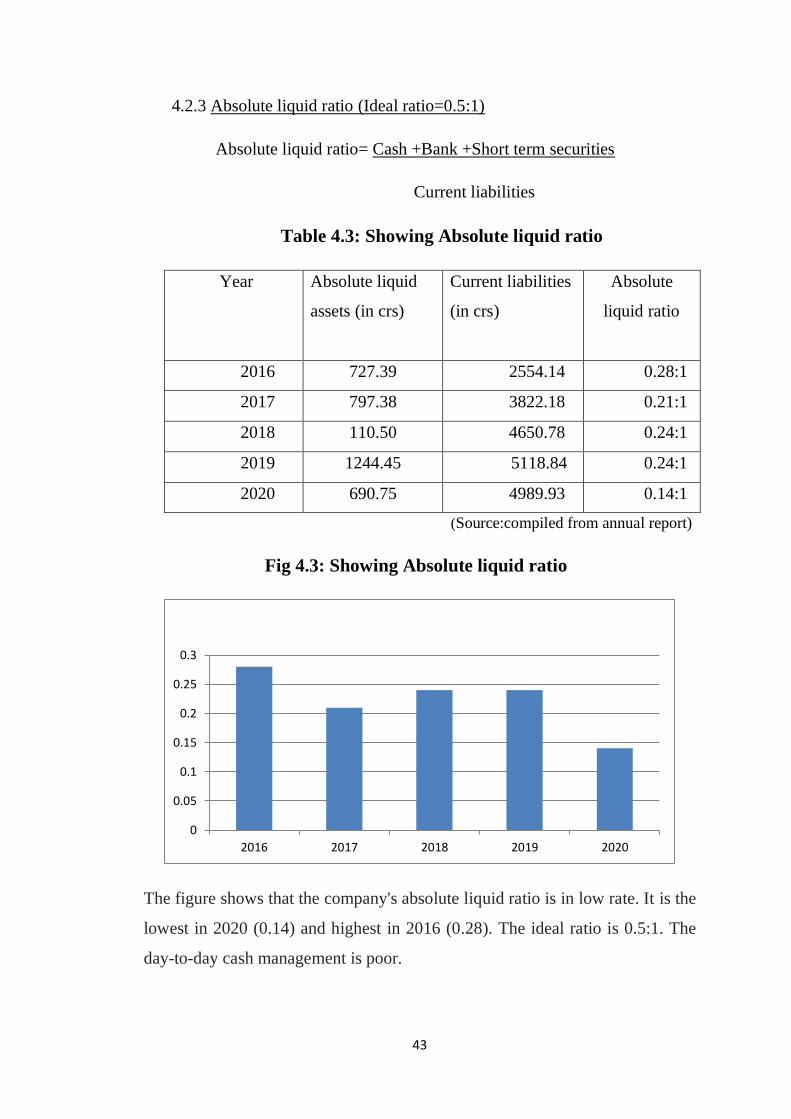
4.2.3 Absolute liquid ratio (Ideal ratio=0.5:1)
Absolute liquid ratio= Cash +Bank +Short term securities
Current liabilities
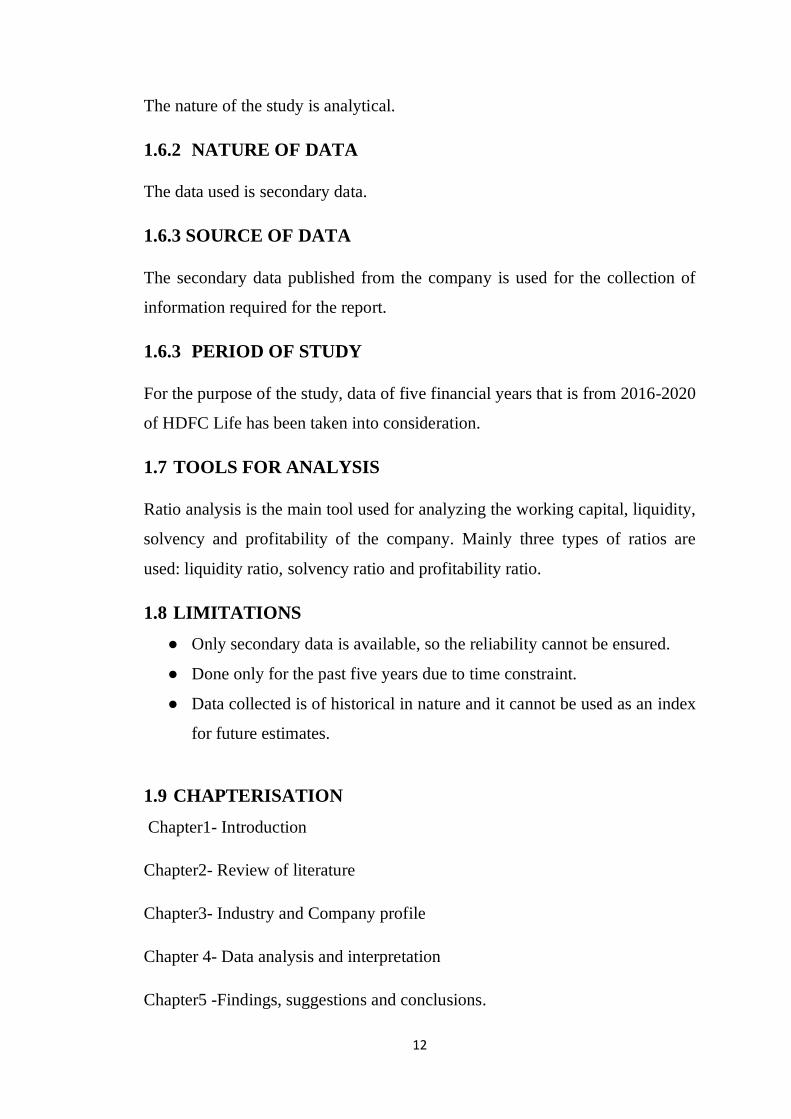
Table 4.3: Showing Absolute liquid ratio
Year Absolute liquid
assets (in crs)
Current liabilities
(in crs)
Absolute
liquid ratio
2016 727.39 2554.14 0.28:1
2017 797.38 3822.18 0.21:1
2018 110.50 4650.78 0.24:1
2019 1244.45 5118.84 0.24:1
2020 690.75 4989.93 0.14:1
(Source:compiled from annual report)
Fig 4.3: Showing Absolute liquid ratio
The figure shows that the company's absolute liquid ratio is in low rate. It is the
lowest in 2020 (0.14) and highest in 2016 (0.28). The ideal ratio is 0.5:1. The
day-to-day cash management is poor.
0
0.05
0.1
0.15
0.2
0.25
0.3
2016 2017 2018 2019 2020
44
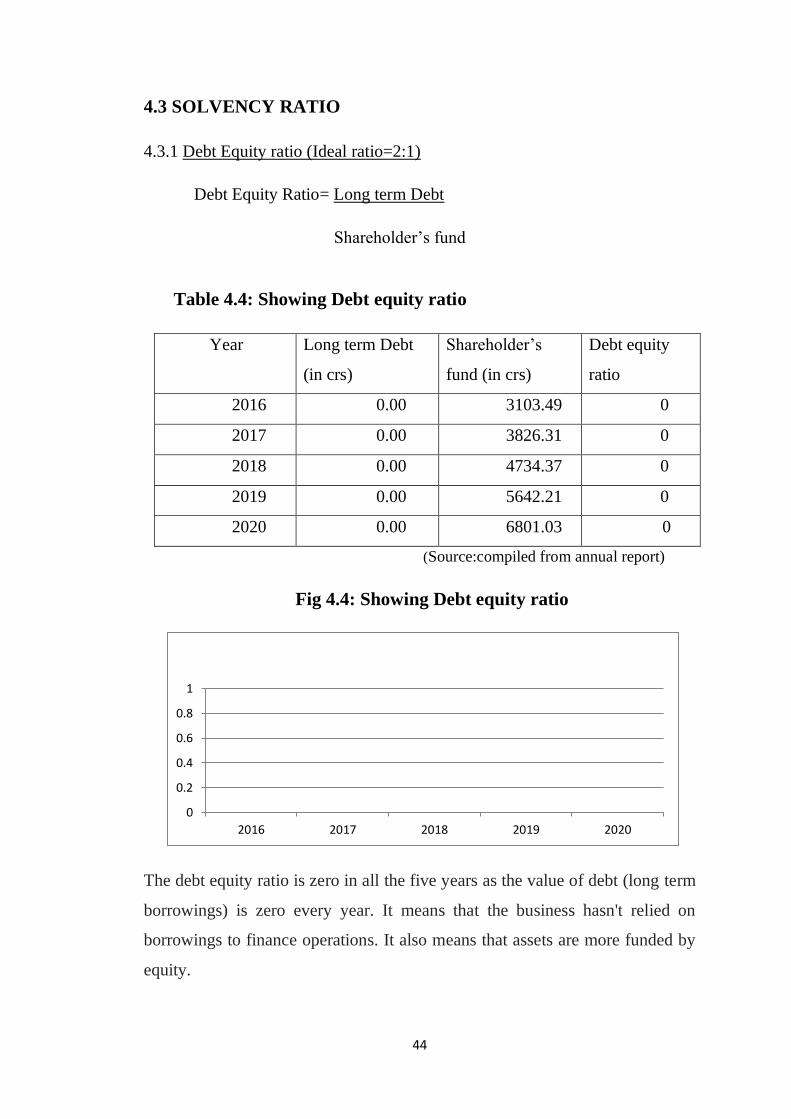
4.3 SOLVENCY RATIO
4.3.1 Debt Equity ratio (Ideal ratio=2:1)
Debt Equity Ratio= Long term Debt
Shareholder’s fund
Table 4.4: Showing Debt equity ratio
Year Long term Debt
(in crs)
Shareholder’s
fund (in crs)
Debt equity
ratio
2016 0.00 3103.49 0
2017 0.00 3826.31 0
2018 0.00 4734.37 0
2019 0.00 5642.21 0
2020 0.00 6801.03 0
(Source:compiled from annual report)
Fig 4.4: Showing Debt equity ratio
The debt equity ratio is zero in all the five years as the value of debt (long term
borrowings) is zero every year. It means that the business hasn't relied on
borrowings to finance operations. It also means that assets are more funded by
equity.
0
0.2
0.4
0.6
0.8
1
2016 2017 2018 2019 2020
45
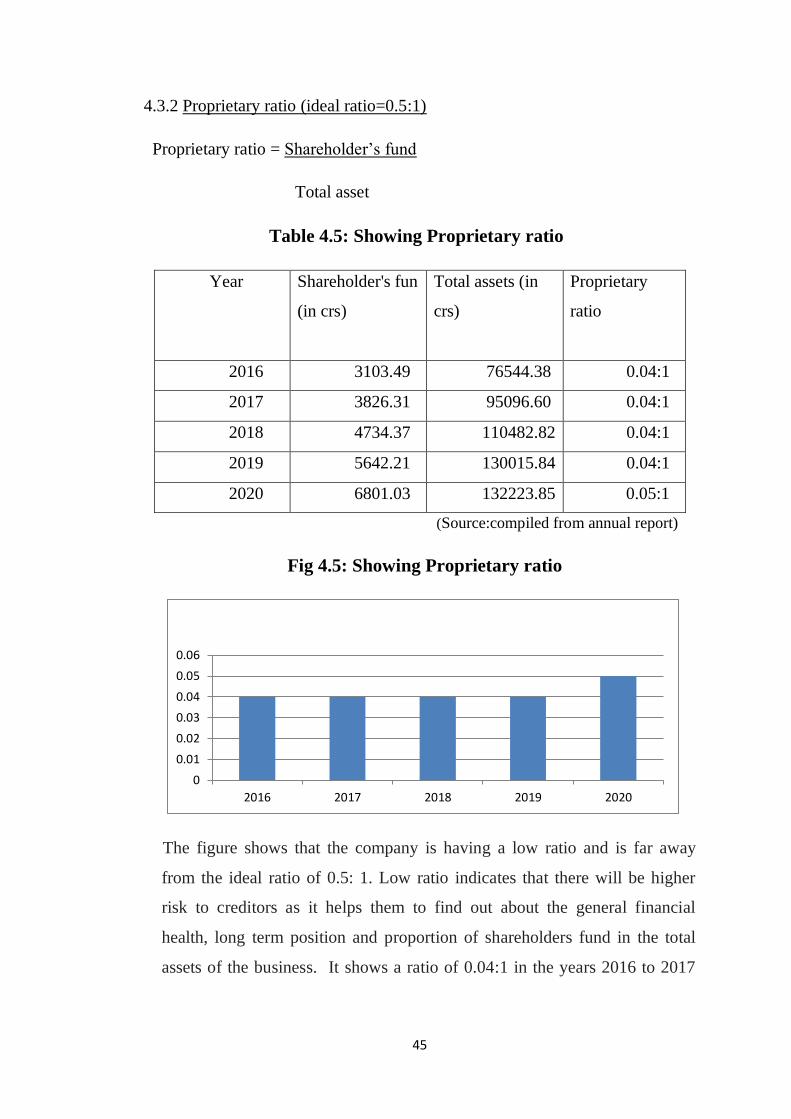
4.3.2 Proprietary ratio (ideal ratio=0.5:1)
Proprietary ratio = Shareholder’s fund
Total asset
Table 4.5: Showing Proprietary ratio
Year Shareholder's fun
(in crs)
Total assets (in
crs)
Proprietary
ratio
2016 3103.49 76544.38 0.04:1
2017 3826.31 95096.60 0.04:1
2018 4734.37 110482.82 0.04:1
2019 5642.21 130015.84 0.04:1
2020 6801.03 132223.85 0.05:1
(Source:compiled from annual report)
Fig 4.5: Showing Proprietary ratio
The figure shows that the company is having a low ratio and is far away
from the ideal ratio of 0.5: 1. Low ratio indicates that there will be higher
risk to creditors as it helps them to find out about the general financial
health, long term position and proportion of shareholders fund in the total
assets of the business. It shows a ratio of 0.04:1 in the years 2016 to 2017
0
0.01
0.02
0.03
0.04
0.05
0.06
2016 2017 2018 2019 2020
46
and 0.05:1 in 2020 and it shows greater risk as the ratios are very less than
the ideal ratio.
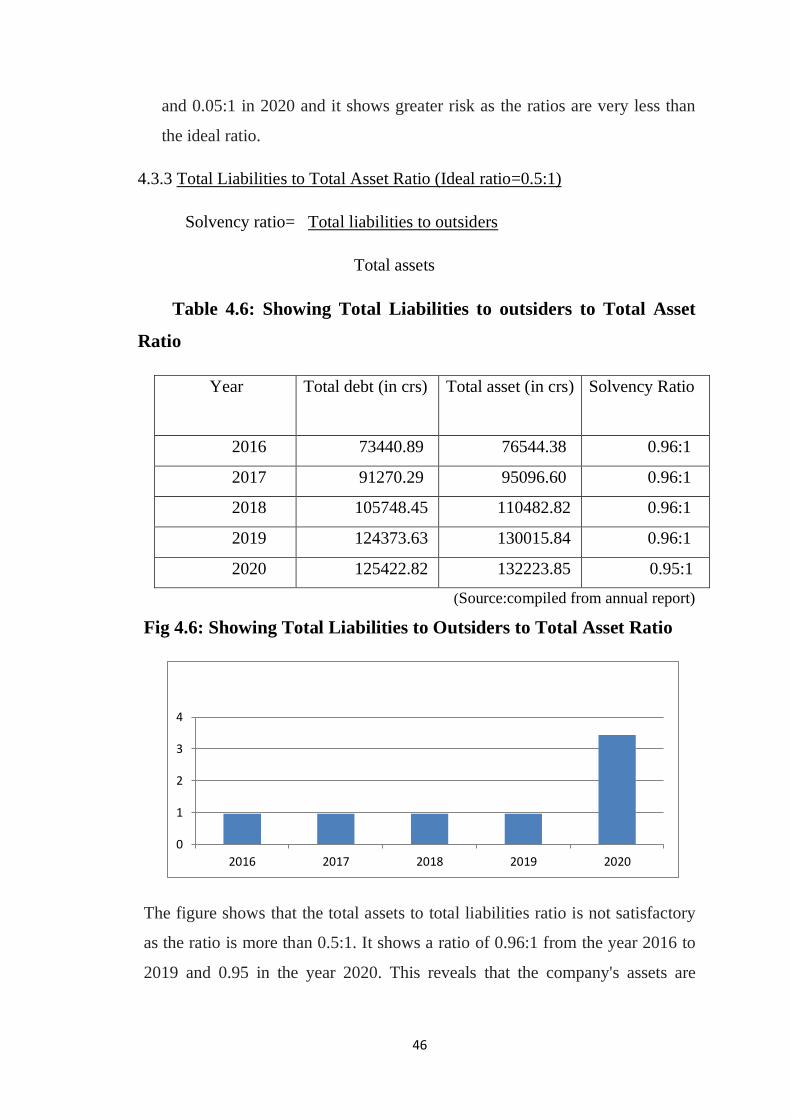
4.3.3 Total Liabilities to Total Asset Ratio (Ideal ratio=0.5:1)
Solvency ratio= Total liabilities to outsiders
Total assets
Table 4.6: Showing Total Liabilities to outsiders to Total Asset
Ratio
Year Total debt (in crs)
Total asset (in crs)
Solvency Ratio
2016 73440.89 76544.38 0.96:1
2017 91270.29 95096.60 0.96:1
2018 105748.45 110482.82 0.96:1
2019 124373.63 130015.84 0.96:1
2020 125422.82 132223.85 0.95:1
(Source:compiled from annual report)
Fig 4.6: Showing Total Liabilities to Outsiders to Total Asset Ratio
The figure shows that the total assets to total liabilities ratio is not satisfactory
as the ratio is more than 0.5:1. It shows a ratio of 0.96:1 from the year 2016 to
2019 and 0.95 in the year 2020. This reveals that the company's assets are
0
1
2
3
4
2016 2017 2018 2019 2020
47
financed through debt and shows higher financial risk. However, the long-term
borrowings are zero.
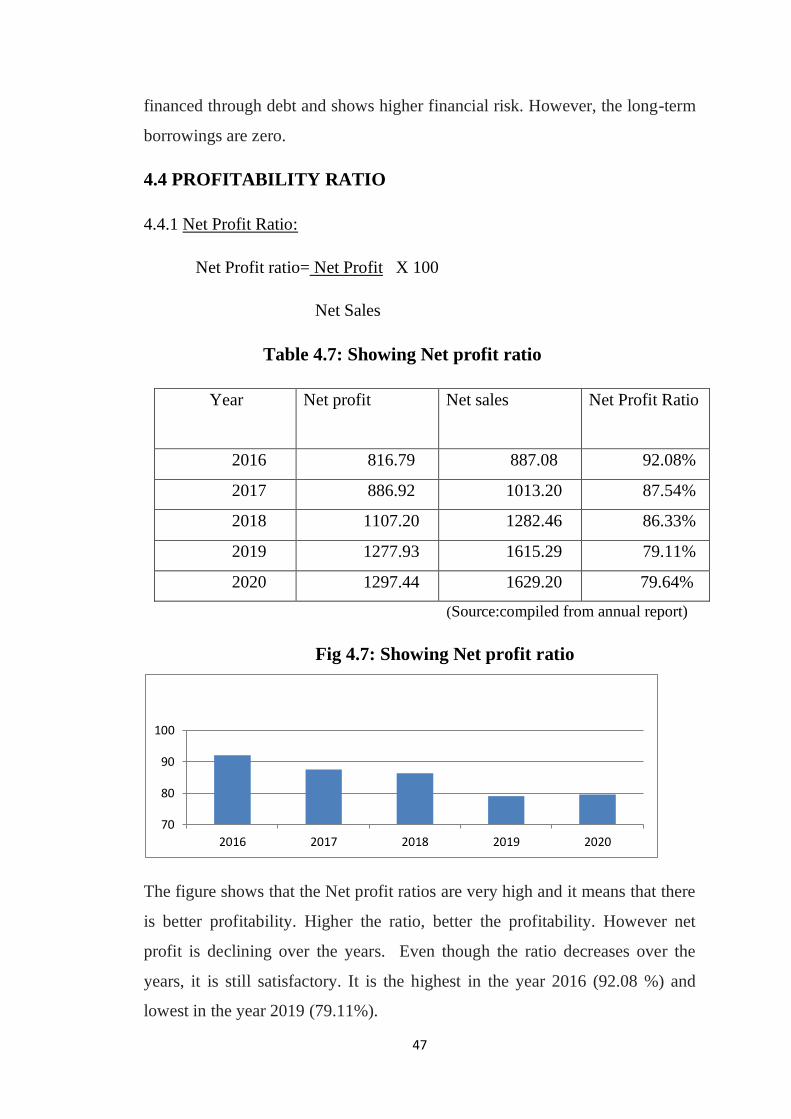
4.4 PROFITABILITY RATIO
4.4.1 Net Profit Ratio:
Net Profit ratio= Net Profit X 100
Net Sales
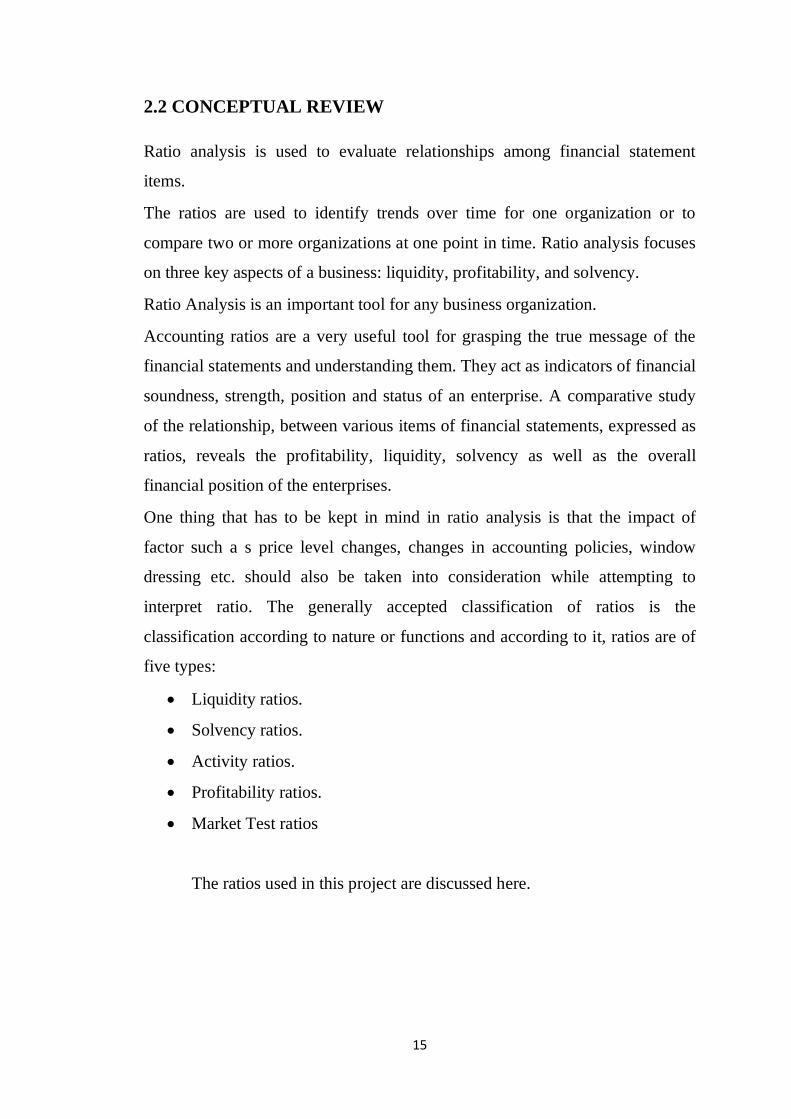
Table 4.7: Showing Net profit ratio
Year Net profit Net sales
Net Profit Ratio
2016 816.79 887.08 92.08%
2017 886.92 1013.20 87.54%
2018 1107.20 1282.46 86.33%
2019 1277.93 1615.29 79.11%
2020 1297.44 1629.20 79.64%
(Source:compiled from annual report)
Fig 4.7: Showing Net profit ratio
The figure shows that the Net profit ratios are very high and it means that there
is better profitability. Higher the ratio, better the profitability. However net
profit is declining over the years. Even though the ratio decreases over the
years, it is still satisfactory. It is the highest in the year 2016 (92.08 %) and
lowest in the year 2019 (79.11%).
70
80
90
100
2016 2017 2018 2019 2020
48
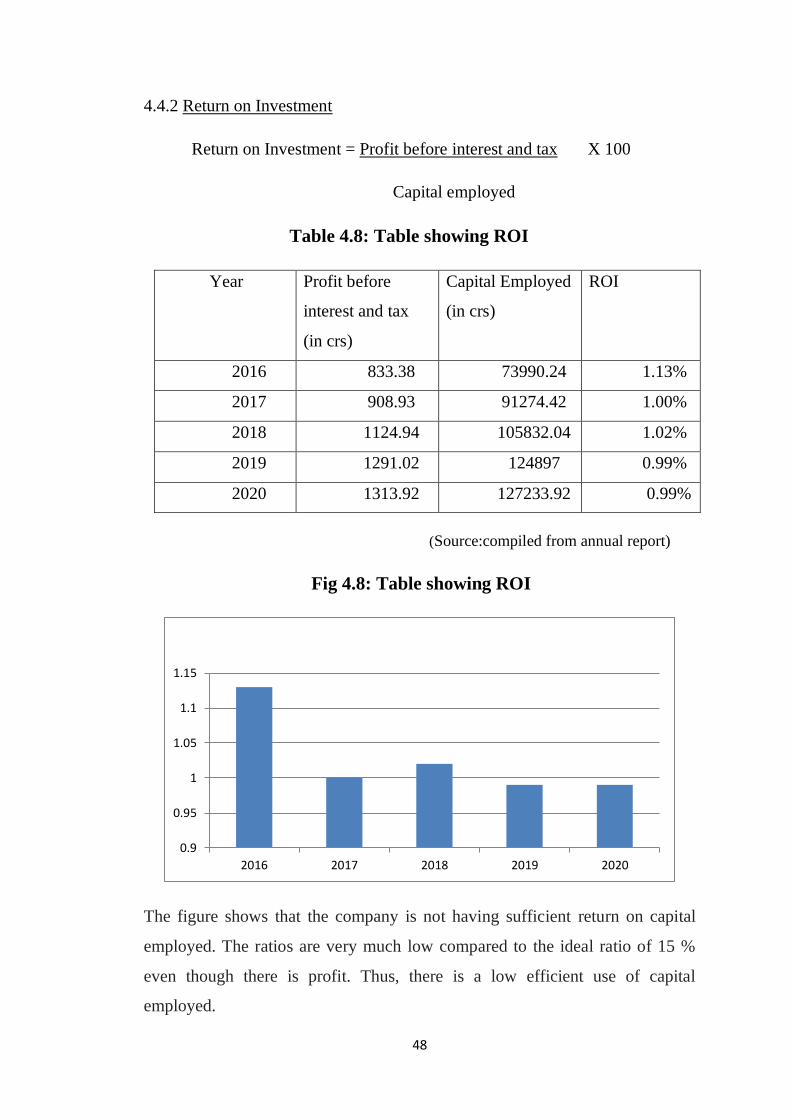
4.4.2 Return on Investment
Return on Investment = Profit before interest and tax X 100
Capital employed
Table 4.8: Table showing ROI
Year Profit before
interest and tax
(in crs)
Capital Employed
(in crs)
ROI
2016 833.38 73990.24 1.13%
2017 908.93 91274.42 1.00%
2018 1124.94 105832.04 1.02%
2019 1291.02 124897 0.99%
2020 1313.92 127233.92 0.99%
(Source:compiled from annual report)
Fig 4.8: Table showing ROI
The figure shows that the company is not having sufficient return on capital
employed. The ratios are very much low compared to the ideal ratio of 15 %
even though there is profit. Thus, there is a low efficient use of capital
employed.
0.9
0.95
1
1.05
1.1
1.15
2016 2017 2018 2019 2020
49
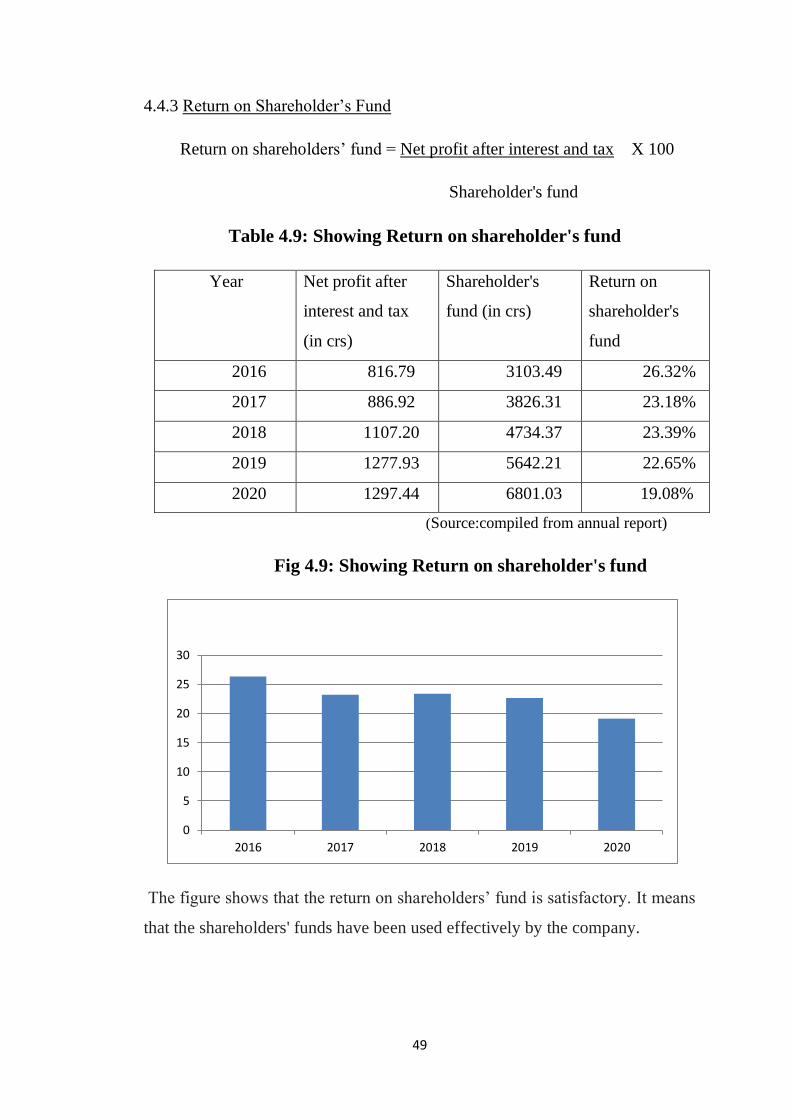
4.4.3 Return on Shareholder’s Fund
Return on shareholders’ fund = Net profit after interest and tax X 100
Shareholder's fund
Table 4.9: Showing Return on shareholder's fund
Year Net profit after
interest and tax
(in crs)
Shareholder's
fund (in crs)
Return on
shareholder's
fund
2016 816.79 3103.49 26.32%
2017 886.92 3826.31 23.18%
2018 1107.20 4734.37 23.39%
2019 1277.93 5642.21 22.65%
2020 1297.44 6801.03 19.08%
(Source:compiled from annual report)
Fig 4.9: Showing Return on shareholder's fund
The figure shows that the return on shareholders’ fund is satisfactory. It means
that the shareholders' funds have been used effectively by the company.
0
5
10
15
20
25
30
2016 2017 2018 2019 2020
50
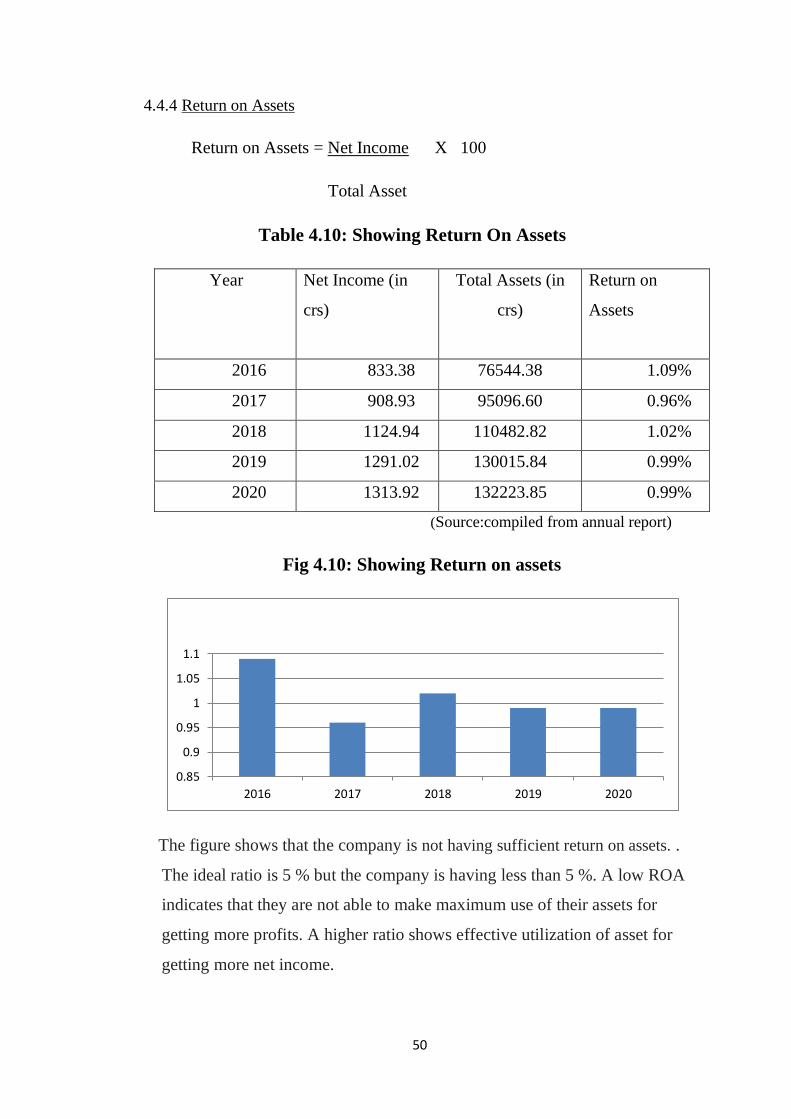
4.4.4 Return on Assets
Return on Assets = Net Income X 100
Total Asset
Table 4.10: Showing Return On Assets
Year Net Income (in
crs)
Total Assets (in
crs)
Return on
Assets
2016 833.38 76544.38 1.09%
2017 908.93 95096.60 0.96%
2018 1124.94 110482.82 1.02%
2019 1291.02 130015.84 0.99%
2020 1313.92 132223.85 0.99%
(Source:compiled from annual report)
Fig 4.10: Showing Return on assets
The figure shows that the company is not having sufficient return on assets. .
The ideal ratio is 5 % but the company is having less than 5 %. A low ROA
indicates that they are not able to make maximum use of their assets for
getting more profits. A higher ratio shows effective utilization of asset for
getting more net income.
0.85
0.9
0.95
1
1.05
1.1
2016 2017 2018 2019 2020
51
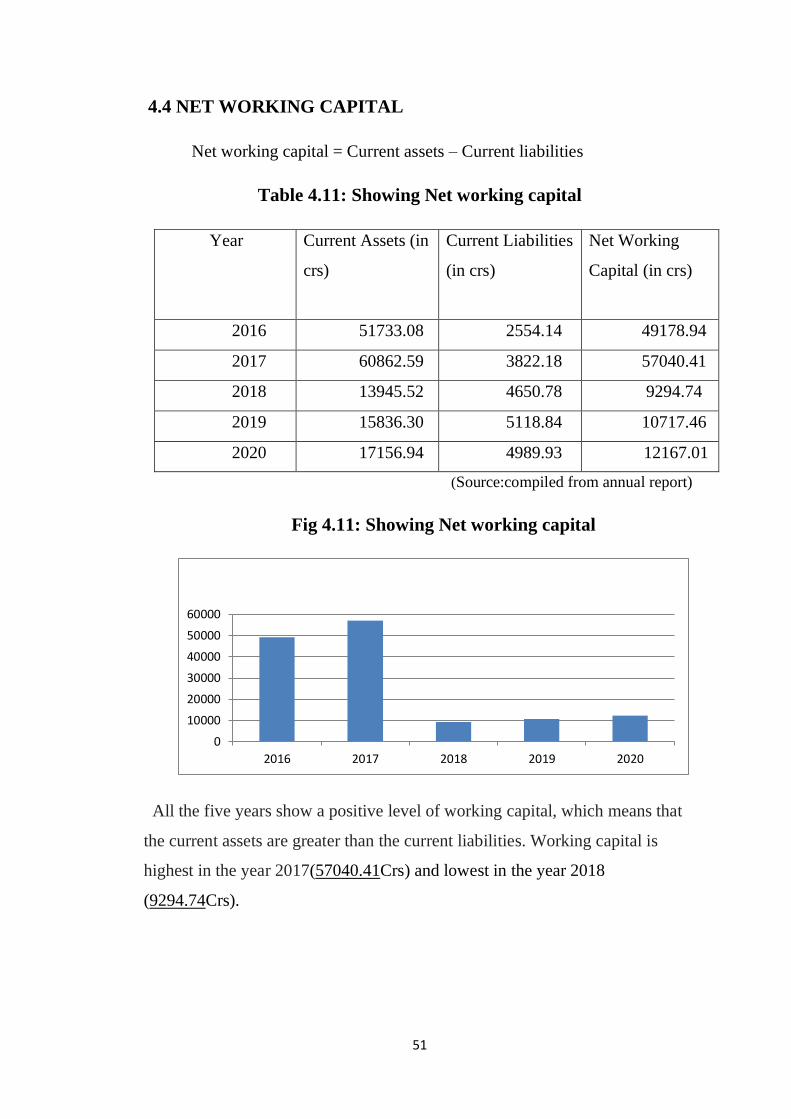
4.4 NET WORKING CAPITAL
Net working capital = Current assets – Current liabilities
Table 4.11: Showing Net working capital
Year Current Assets (in
crs)
Current Liabilities
(in crs)
Net Working
Capital (in crs)
2016 51733.08 2554.14 49178.94
2017 60862.59 3822.18 57040.41
2018 13945.52 4650.78 9294.74
2019 15836.30 5118.84 10717.46
2020 17156.94 4989.93 12167.01
(Source:compiled from annual report)
Fig 4.11: Showing Net working capital
All the five years show a positive level of working capital, which means that
the current assets are greater than the current liabilities. Working capital is
highest in the year 2017(57040.41Crs) and lowest in the year 2018
(9294.74Crs).
0
10000
20000
30000
40000
50000
60000
2016 2017 2018 2019 2020
52
CHAPTER V
FINDINGS, SUGGESTIONS AND
CONCLUSION
53
5.1 FINDINGS
1. The current ratio is very high during the years 2016 and 2017. But it
falls from the year 2018 and is satisfactory as the ratio is nearer to the
ideal ratio 2:1
2. The quick ratios over the years are greater than 1:1 and it means that the
business is financially secure in short-term future.
3. The figure shows that the company is maintaining low rate of absolute
liquid ratio and it keeps on declining over the years.
4. A debt equity ratio of 0 indicates that the firm does not finance
increased operations through borrowing at all and that assets are more
funded by equity.
5. The company is having a low proprietary ratio which indicates that there
will be a higher risk to the creditors as the ratios are less than the ideal
ratio of 0.5:1
6. The solvency ratio of total assets to total liabilities to outsiders is not
satisfactory as the ratio is more than 0.5:1 and it means that the
company's assets are financed through debt and shows higher financial
risk.
7. Net profits over the years are high. However net profit is declining over
the years but the ratios are still satisfactory.
8. The company is not having sufficient return of capital employed as the
returns are very less than ideal ratio of 15 %. Overall, the company is
less efficient in the use of capital employed.
9. The company has a high return on shareholders’ fund and is profitable
from the shareholders point of view.
10. Return on assets is very less than the ideal ratio of 5% and it indicates
that they are not able to make maximum use of their assets for getting
more profits.

54
11. The figure shows that the company has sufficient working capital in all
the years the working capital is the highest in the year 2017 and lowest
in the year 2018.
55
5.2SUGGESTIONS
1. The organization should try to maintain the current ratio at or near to ideal
level i.e.,2:1.
2. The company should improve the Absolute liquid ratio.
3. Return on assets should be maintained at a higher level as it is beneficial for
the company.
4. It is advisable that the company earn more profit by efficient use of capital
employed.
56
5.3 CONCLUSION
HDFC Life is one of India's leading insurance companies offering a range of
individual and group insurance solutions that make various life stages need of
customer. The present study was conducted with the main objective of
analyzing the financial performance of HDFC Life Insurance and for this
purpose I have taken financial statements of past five years (2016-2020). This
study included analysis of liquidity, profitability and solvency position and
working capital management of HDFC Life Insurance. The study revealed that
the liquidity position is absurd at the beginning but improves over the years.
But the solvency and profitability position are not much satisfactory. The Net
Profit is very high and satisfactory but is seen to be declining over the years.
The working capital management of the company is excellent. The overall
financial performance of the company is satisfactory, but can be much
improved in the coming years.

57
BIBLIOGRAPHY
58
BIBLIOGRAPHY
BOOKS:
• Accounting for Management: - A. Vinod.
• Banking and Insurance: - Dr. M. Narayanankutty.
• Financial Accounting: - A.Vinod.
WEBSITES:
• www.hdfclife.com
• www.moneycontrol.com
• www.wikipedia.com
• www.investopedia.com
• www.google.com
JOURNALS:
1. Darzi T. A., (2011), Ph. D. dissertation 'Financial Performance of
Insurance Industry in Post Liberalization Era in India'.
2. Kamal Gulati, (2012), A Study of Changing Trends in E-CRM of
Indian Insurance Industry.
3. RashmitaSahoo, (2012), Life Insurance Market in India: A Review,
International Journal of Management Research and Review, June 2012/
Volume2 /Issue 6.
4. Swadesh Kumar Dash, (2013), Insurance Industry in India - Prospects
and Challenges, Asian Journal of Multidimensional Research, Vol.2
Issue 4, April 2013.
5. PreetiUpadhyay, (2013), Satisfaction of the Policy Holders Protection
in Insurance Sector: A Case Study, International Journal of Advanced
Research in Computer Science and Software Engineering, Volume 3,
Issue 2, February 2013.
59
6. Yogita Sharma, (2013), Analysis of FDI In Insurance Sector in India,
IJRESS Volume 3, Issue 3 (April 2013).
7. Manoj Kumar Mishra, (2014), Demand Analysis for Life Insurance in
India: Some Empirical Observations, International Journal of Advanced
Research (2014), Volume 2, Issue (5).
8. N. Prasanna Kumar, (2014), Indian Insurance Market-An Overview,
AEIJMR – Vol 2 - Issue 7 - July 2014.
9. Suman Si, (2014), Advertising Effectiveness on Consumer Decision
Making & Decision Making: Study of Insurance Industry, International
Journal of Advancements in Research & Technology, Volume 3, Issue
1, January-2014.
10. Ruby Singh, (2014), Foreign Direct Investment and Indian Insurance
Industry, International Journal of Advance Research in Computer
Science and Management Studies, Volume 2, Issue 6, June 2014.

60
ANNEXURE
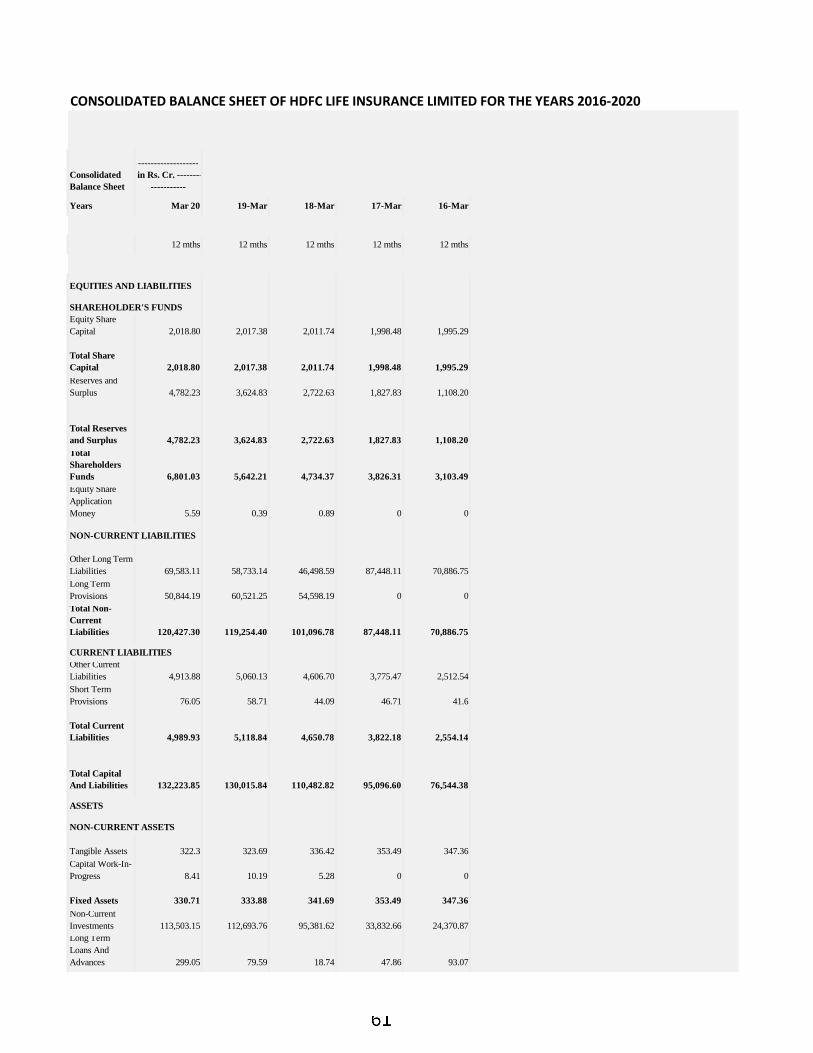
CONSOLIDATED BALANCE SHEET OF HDFC LIFE INSURANCE LIMITED FOR THE YEARS 2016-2020
Consolidated
Balance Sheet
-------------------
in Rs. Cr. --------
-----------
Years Mar 20 19-Mar 18-Mar 17-Mar 16-Mar
12 mths 12 mths 12 mths 12 mths 12 mths
Equity Share
Capital 2,018.80 2,017.38 2,011.74 1,998.48 1,995.29
Total Share
Capital 2,018.80 2,017.38 2,011.74 1,998.48 1,995.29
Reserves and
Surplus 4,782.23 3,624.83 2,722.63 1,827.83 1,108.20
Total Reserves
and Surplus 4,782.23 3,624.83 2,722.63 1,827.83 1,108.20
Total
Shareholders
Funds 6,801.03 5,642.21 4,734.37 3,826.31 3,103.49
Equity Share
Application
Money 5.59 0.39 0.89 0 0
Other Long Term
Liabilities 69,583.11 58,733.14 46,498.59 87,448.11 70,886.75
Long Term
Provisions 50,844.19 60,521.25 54,598.19 0 0
Total Non-
Current
Liabilities 120,427.30 119,254.40 101,096.78 87,448.11 70,886.75
Other Current
Liabilities 4,913.88 5,060.13 4,606.70 3,775.47 2,512.54
Short Term
Provisions 76.05 58.71 44.09 46.71 41.6
Total Current
Liabilities 4,989.93 5,118.84 4,650.78 3,822.18 2,554.14
Total Capital
And Liabilities 132,223.85 130,015.84 110,482.82 95,096.60 76,544.38
Tangible Assets 322.3 323.69 336.42 353.49 347.36
Capital Work-In-
Progress 8.41 10.19 5.28 0 0
Fixed Assets 330.71 333.88 341.69 353.49 347.36
Non-Current
Investments 113,503.15 112,693.76 95,381.62 33,832.66 24,370.87
Long Term
Loans And
Advances 299.05 79.59 18.74 47.86 93.07
ASSETS
NON-CURRENT ASSETS
CURRENT LIABILITIES
EQUITIES AND LIABILITIES
SHAREHOLDER'S FUNDS
NON-CURRENT LIABILITIES
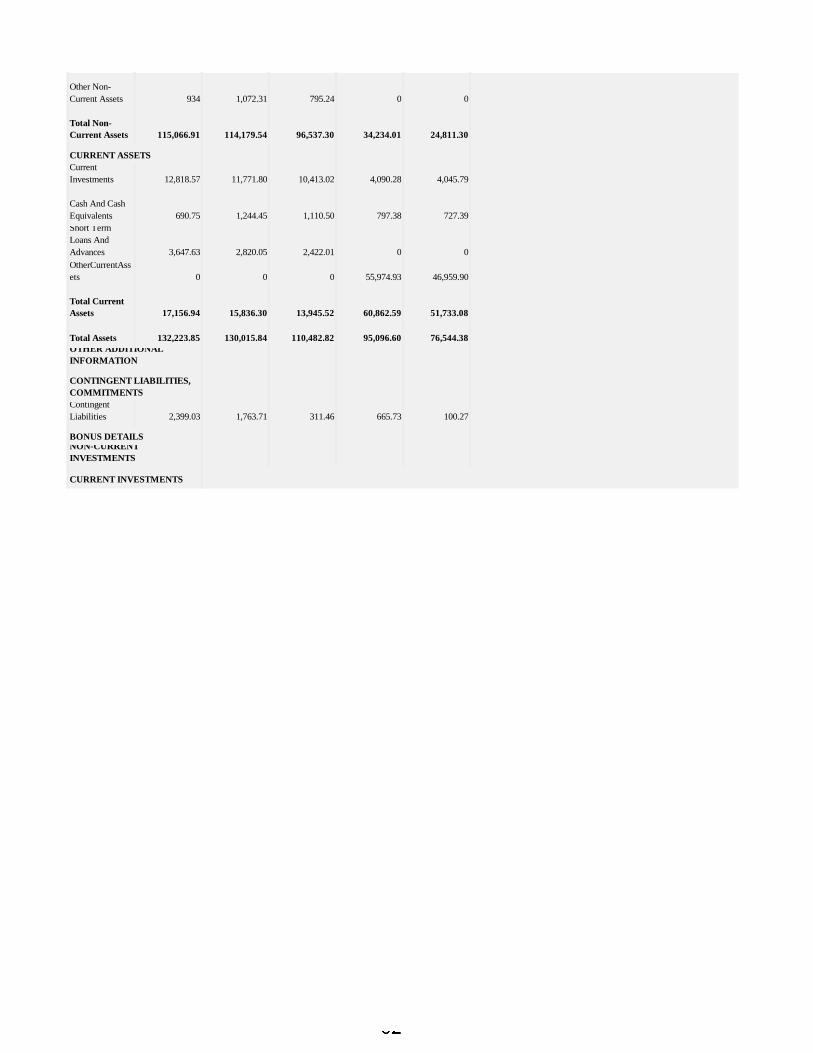
Other Non-
Current Assets 934 1,072.31 795.24 0 0
Total Non-
Current Assets 115,066.91 114,179.54 96,537.30 34,234.01 24,811.30
Current
Investments 12,818.57 11,771.80 10,413.02 4,090.28 4,045.79
Cash And Cash
Equivalents 690.75 1,244.45 1,110.50 797.38 727.39
Short Term
Loans And
Advances 3,647.63 2,820.05 2,422.01 0 0
OtherCurrentAss
ets 0 0 0 55,974.93 46,959.90
Total Current
Assets 17,156.94 15,836.30 13,945.52 60,862.59 51,733.08
Total Assets 132,223.85 130,015.84 110,482.82 95,096.60 76,544.38
Contingent
Liabilities 2,399.03 1,763.71 311.46 665.73 100.27
NON-CURRENT
INVESTMENTS
CURRENT INVESTMENTS
CURRENT ASSETS
OTHER ADDITIONAL
INFORMATION
CONTINGENT LIABILITIES,
COMMITMENTS
BONUS DETAILS
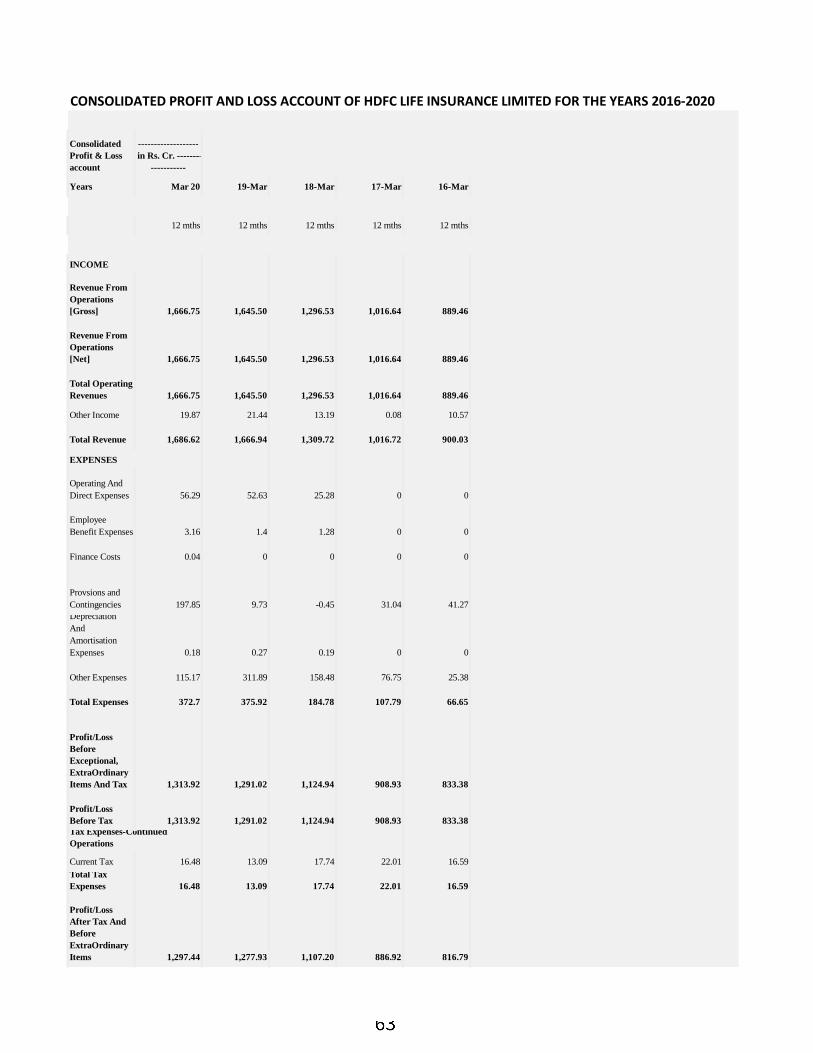
CONSOLIDATED PROFIT AND LOSS ACCOUNT OF HDFC LIFE INSURANCE LIMITED FOR THE YEARS 2016-2020
Consolidated
Profit & Loss
account
-------------------
in Rs. Cr. --------
-----------
Years Mar 20 19-Mar 18-Mar 17-Mar 16-Mar
12 mths 12 mths 12 mths 12 mths 12 mths
Revenue From
Operations
[Gross] 1,666.75 1,645.50 1,296.53 1,016.64 889.46
Revenue From
Operations
[Net] 1,666.75 1,645.50 1,296.53 1,016.64 889.46
Total Operating
Revenues 1,666.75 1,645.50 1,296.53 1,016.64 889.46
Other Income 19.87 21.44 13.19 0.08 10.57
Total Revenue 1,686.62 1,666.94 1,309.72 1,016.72 900.03
Operating And
Direct Expenses 56.29 52.63 25.28 0 0
Employee
Benefit Expenses 3.16 1.4 1.28 0 0
Finance Costs 0.04 0 0 0 0
Provsions and
Contingencies 197.85 9.73 -0.45 31.04 41.27
Depreciation
And
Amortisation
Expenses 0.18 0.27 0.19 0 0
Other Expenses 115.17 311.89 158.48 76.75 25.38
Total Expenses 372.7 375.92 184.78 107.79 66.65
Profit/Loss
Before
Exceptional,
ExtraOrdinary
Items And Tax 1,313.92 1,291.02 1,124.94 908.93 833.38
Profit/Loss
Before Tax 1,313.92 1,291.02 1,124.94 908.93 833.38
Current Tax 16.48 13.09 17.74 22.01 16.59
Total Tax
Expenses 16.48 13.09 17.74 22.01 16.59
Profit/Loss
After Tax And
Before
ExtraOrdinary
Items 1,297.44 1,277.93 1,107.20 886.92 816.79
INCOME
EXPENSES
Tax Expenses-Continued
Operations
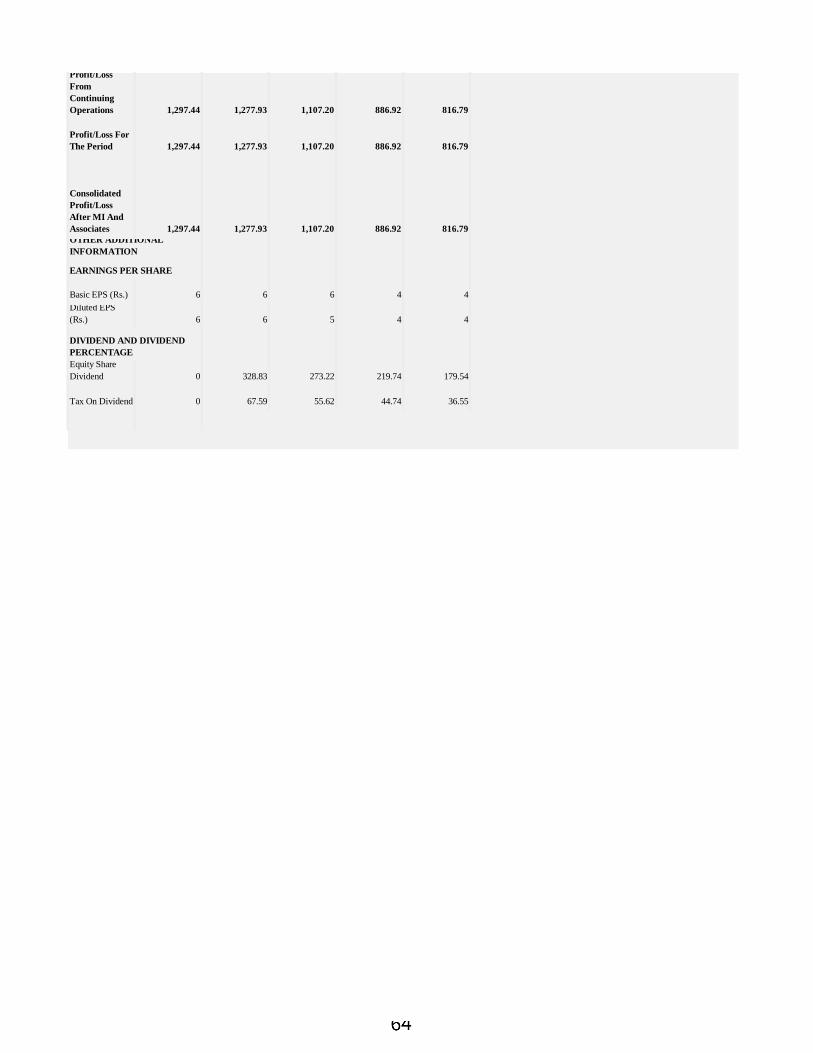
Profit/Loss
From
Continuing
Operations 1,297.44 1,277.93 1,107.20 886.92 816.79
Profit/Loss For
The Period 1,297.44 1,277.93 1,107.20 886.92 816.79
Consolidated
Profit/Loss
After MI And
Associates 1,297.44 1,277.93 1,107.20 886.92 816.79
Basic EPS (Rs.) 6 6 6 4 4
Diluted EPS
(Rs.) 6 6 5 4 4
Equity Share
Dividend 0 328.83 273.22 219.74 179.54
Tax On Dividend 0 67.59 55.62 44.74 36.55
OTHER ADDITIONAL
INFORMATION
EARNINGS PER SHARE
DIVIDEND AND DIVIDEND
PERCENTAGE
Copyright © 2022 FDOKUMEN