Colocalization of γ-aminobutyric acid and acetylcholine in neurons in the laterodorsal and...
15
Research report Colocalization of g-aminobutyric acid and acetylcholine in neurons in the laterodorsal and pedunculopontine tegmental nuclei in the cat: a light and electron microscopic study Hong-Ge Jia a , Jack Yamuy a, * , Sharon Sampogna b , Francisco R. Morales a , Michael H. Chase a,b a Department of Physiology, UCLA School of Medicine, Los Angeles, CA 90095, USA b Brain Research Institute, UCLA, Los Angeles, CA 90095, USA Accepted 21 August 2003 Abstract Cholinergic and g-aminobutyric acid (GABA) mechanisms in the dorsolateral pontomesencephalic tegmentum have been implicated in the control of active (REM) sleep and wakefulness. To determine the relationships between neurons that contain these neurotransmitters in this region of the brainstem in adult cats, combined light and electron microscopic immunocytochemical procedures were employed. Light microscopic analyses revealed that choline acetyltransferase (ChAT) and GABA immunoreactive neurons were distributed throughout the laterodorsal and pedunculopontine tegmental nuclei (LDTand PPT). Surprisingly, approximately 50% of the ChAT immunoreactive neurons in these nuclei also contained GABA. Using electron microscopic pre-embedding immunocytochemistry, GABA immunoreactivity was observed in somas, dendrites and axon terminals in both the LDT and PPT. Most of the GABA immunoreactive terminals formed symmetrical synapses with non-immunolabeled dendrites. Electron microscopic double-immunolabeling techniques revealed that ChAT and GABA were colocalized in axon terminals in the LDT/PPT. Approximately 30% of the ChAT immunoreactive terminals were also GABA immunoreactive, whereas only 6–8% of the GABA immunoreactive terminals were ChAT immunoreactive. Most of the ChAT/GABA immunoreactive terminals formed symmetrical synapses with non-immunolabeled dendrites; however, ChAT/GABA immunoreactive terminals were also observed that contacted ChATimmunoreactive dendrites. With respect to ChAT immunoreactive postsynaptic profiles, approximately 40% of the somas and 50% of the dendrites received synaptic contact from GABA immunoreactive terminals in both the LDT and PPT. These findings (a) indicate that there are fundamental interactions between cholinergic and GABAergic neurons within the LDT/ PPT that play an important role in the control of active sleep and wakefulness and (b) provide an anatomical basis for the intriguing possibility that a mechanism of acetylcholine and GABA co-release from the terminals of LDT/PPT neurons is involved in the regulation of behavioral states. D 2003 Elsevier B.V. All rights reserved. Theme: Neural basis of behavior Topic: biological rhythms and sleep Keywords: Brainstem; GABA; Acetylcholine; Immunohistochemistry; Active sleep; Colocalization 1. Introduction The laterodorsal tegmental nucleus (LDT) and the pedunculopontine tegmental nucleus (PPT) in the brain- stem play a critical role in active (REM) sleep and wakefulness [19]. In these nuclei, there are large numbers of cholinergic and GABAergic neurons [13,20,29,56,57]. Active sleep is thought to be generated, in part, as a result of the activity of cholinergic neurons in these regions because they discharge at higher rates immediately prior to and during active sleep than during quiet sleep [23,45] and the destruction of these neurons results in the abolition of active sleep [21,55]. Several lines of evidence indicate that GABAergic neu- rons in the LDT/PPT are important in the control of sleep and wakefulness. Neurons in these nuclei that were presum- ably GABAergic, originally designated PGO-off cells, in- creased their firing rate during active sleep [46]. In addition, studies that have used Fos immunohistochemistry as a 0006-8993/$ - see front matter D 2003 Elsevier B.V. All rights reserved. doi:10.1016/j.brainres.2003.08.062 * Corresponding author. Tel.: +1-310-825-3348; fax: +1-310-206-3499. E-mail address: [email protected] (J. Yamuy). www.elsevier.com/locate/brainres Brain Research 992 (2003) 205 – 219
Transcript of Colocalization of γ-aminobutyric acid and acetylcholine in neurons in the laterodorsal and...
www.elsevier.com/locate/brainresBrain Research 992 (2003) 205–219
Research report
Colocalization of g-aminobutyric acid and acetylcholine in neurons in the
laterodorsal and pedunculopontine tegmental nuclei in the cat: a light and
electron microscopic study
Hong-Ge Jiaa, Jack Yamuya,*, Sharon Sampognab, Francisco R. Moralesa, Michael H. Chasea,b
aDepartment of Physiology, UCLA School of Medicine, Los Angeles, CA 90095, USAbBrain Research Institute, UCLA, Los Angeles, CA 90095, USA
Accepted 21 August 2003
Abstract
Cholinergic and g-aminobutyric acid (GABA) mechanisms in the dorsolateral pontomesencephalic tegmentum have been implicated in
the control of active (REM) sleep and wakefulness. To determine the relationships between neurons that contain these neurotransmitters in
this region of the brainstem in adult cats, combined light and electron microscopic immunocytochemical procedures were employed. Light
microscopic analyses revealed that choline acetyltransferase (ChAT) and GABA immunoreactive neurons were distributed throughout the
laterodorsal and pedunculopontine tegmental nuclei (LDT and PPT). Surprisingly, approximately 50% of the ChAT immunoreactive neurons
in these nuclei also contained GABA. Using electron microscopic pre-embedding immunocytochemistry, GABA immunoreactivity was
observed in somas, dendrites and axon terminals in both the LDT and PPT. Most of the GABA immunoreactive terminals formed
symmetrical synapses with non-immunolabeled dendrites. Electron microscopic double-immunolabeling techniques revealed that ChAT and
GABA were colocalized in axon terminals in the LDT/PPT. Approximately 30% of the ChAT immunoreactive terminals were also GABA
immunoreactive, whereas only 6–8% of the GABA immunoreactive terminals were ChAT immunoreactive. Most of the ChAT/GABA
immunoreactive terminals formed symmetrical synapses with non-immunolabeled dendrites; however, ChAT/GABA immunoreactive
terminals were also observed that contacted ChAT immunoreactive dendrites. With respect to ChAT immunoreactive postsynaptic profiles,
approximately 40% of the somas and 50% of the dendrites received synaptic contact from GABA immunoreactive terminals in both the LDT
and PPT. These findings (a) indicate that there are fundamental interactions between cholinergic and GABAergic neurons within the LDT/
PPT that play an important role in the control of active sleep and wakefulness and (b) provide an anatomical basis for the intriguing
possibility that a mechanism of acetylcholine and GABA co-release from the terminals of LDT/PPT neurons is involved in the regulation of
behavioral states.
D 2003 Elsevier B.V. All rights reserved.
Theme: Neural basis of behavior
Topic: biological rhythms and sleep
Keywords: Brainstem; GABA; Acetylcholine; Immunohistochemistry; Active sleep; Colocalization
1. Introduction of the activity of cholinergic neurons in these regions
The laterodorsal tegmental nucleus (LDT) and the
pedunculopontine tegmental nucleus (PPT) in the brain-
stem play a critical role in active (REM) sleep and
wakefulness [19]. In these nuclei, there are large numbers
of cholinergic and GABAergic neurons [13,20,29,56,57].
Active sleep is thought to be generated, in part, as a result
0006-8993/$ - see front matter D 2003 Elsevier B.V. All rights reserved.
doi:10.1016/j.brainres.2003.08.062
* Corresponding author. Tel.: +1-310-825-3348; fax: +1-310-206-3499.
E-mail address: [email protected] (J. Yamuy).
because they discharge at higher rates immediately prior
to and during active sleep than during quiet sleep [23,45]
and the destruction of these neurons results in the abolition
of active sleep [21,55].
Several lines of evidence indicate that GABAergic neu-
rons in the LDT/PPT are important in the control of sleep
and wakefulness. Neurons in these nuclei that were presum-
ably GABAergic, originally designated PGO-off cells, in-
creased their firing rate during active sleep [46]. In addition,
studies that have used Fos immunohistochemistry as a
H.-G. Jia et al. / Brain Research 992 (2003) 205–219206
functional marker indicate that LDT/PPT GABAergic neu-
rons discharge during active sleep [29,49]. Furthermore, we
have recently reported that the microinjection of g-amino-
butyric acid (GABA)A agonists into the PPT enhances active
sleep [50]. Therefore, it is reasonable to expect that local
interactions between GABAergic and cholinergic neurons
play a role in the mechanisms that control the states of
active sleep and wakefulness.
In the present study, using a combination of immunocy-
tochemical techniques, we describe the essential morpho-
logical features of cholinergic and GABAergic neurons and
their processes in the LDT/PPT. In addition, we focus on a
surprising observation that was made during the course of
these experiments, namely, that choline acetyltransferase
(ChAT) and GABA are colocalized in the somas and
synaptic terminals of LDT/PPT neurons. This finding indi-
cates that a subpopulation of cholinergic neurons are also
GABAergic, which provides new data that must be inte-
grated into current hypotheses dealing with the mechanisms
of action of mesopontine neurons in the control of active
sleep and wakefulness.
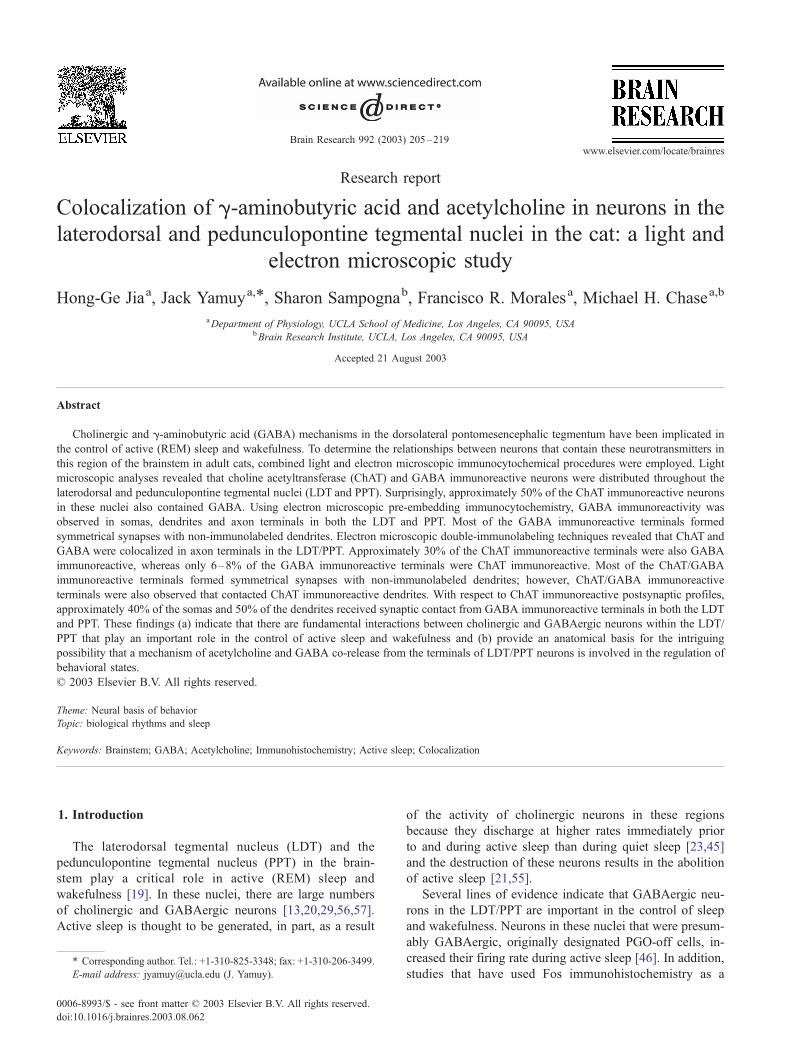
Fig. 1. Immunofluorescence photomicrographs of GABA+ and ChAT+ labeled neu
ChAT-IR (A–B; rhodamine B sulfonyl chloride, red), GABA-IR (C–D; dichloro
double-labeled neurons (E–F; yellow cells indicated by arrowheads). A, C, and
2. Materials and methods
2.1. Animals
Seven adult male cats, weighing 3.5–5.0 kg, were
utilized in the present study. Three cats were used for light
microscopy; four cats were employed for electron micros-
copy (EM). All experimental procedures were conducted in
accordance with the Guide for the Care and Use of Labo-
ratory Animals (NIH Publications No. 80-23) and approved
by the Chancellor’s Animal Research Committee of the
University of California Los Angeles Office for the Protec-
tion of Research Subjects.
2.2. Perfusion and tissue preparation
Under deep anesthesia (Nembutal, 50 mg/kg, i.v.), cats
were perfused transcardially with 1 l of heparinized saline,
followed by 3 l of a fixative solution containing 4%
paraformaldehyde (for light microscopy) or a solution con-
taining 2% paraformaldehyde and 2% glutaraldehyde (for
rons in the LDT and PPT of the cat. (A–F) Immunofluorescence staining for
triazinylamino fluorescein-green, using tyramide signal amplification) and
E in the LDT; B, D, and F in the PPT. Scale bars: A–F = 100 Am.
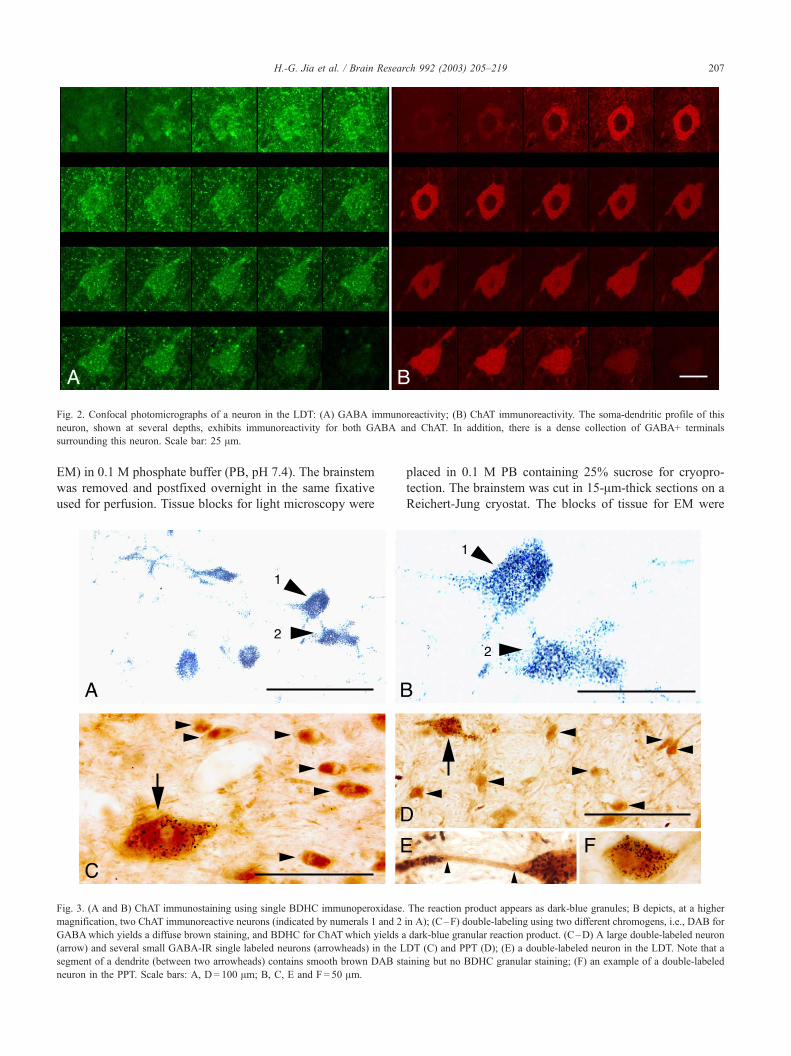
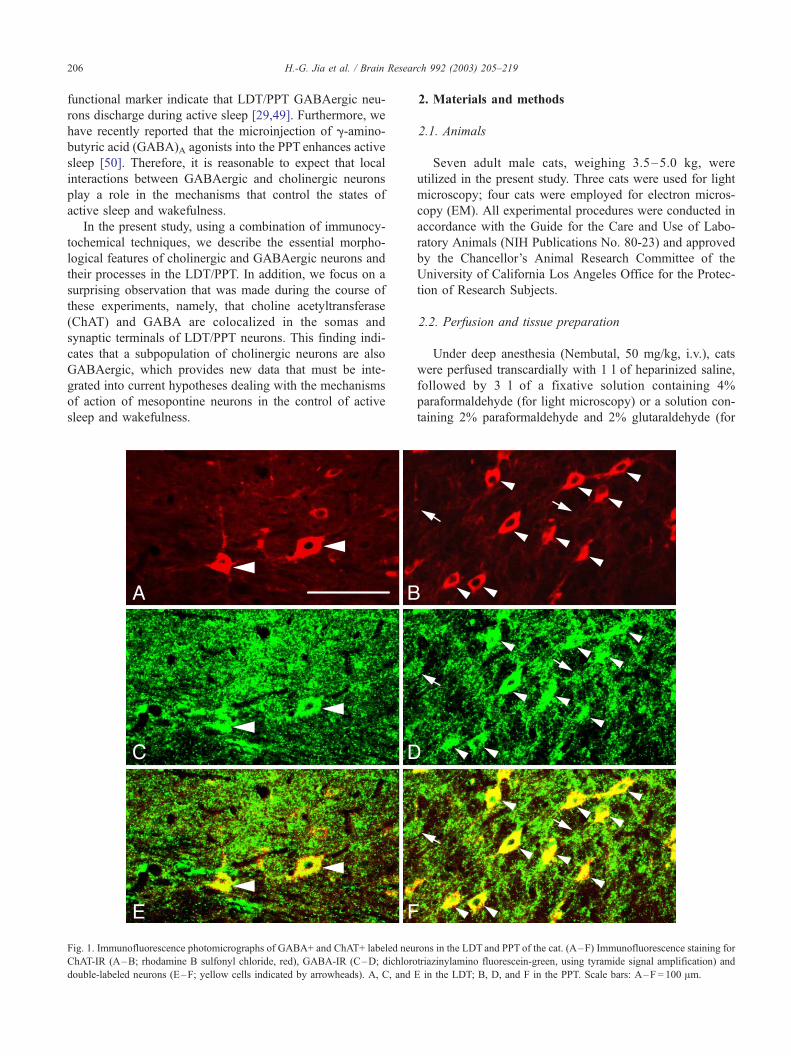
Fig. 2. Confocal photomicrographs of a neuron in the LDT: (A) GABA immunoreactivity; (B) ChAT immunoreactivity. The soma-dendritic profile of this
neuron, shown at several depths, exhibits immunoreactivity for both GABA and ChAT. In addition, there is a dense collection of GABA+ terminals
surrounding this neuron. Scale bar: 25 Am.
H.-G. Jia et al. / Brain Research 992 (2003) 205–219 207
EM) in 0.1 M phosphate buffer (PB, pH 7.4). The brainstem
was removed and postfixed overnight in the same fixative
used for perfusion. Tissue blocks for light microscopy were
Fig. 3. (A and B) ChAT immunostaining using single BDHC immunoperoxidase.
magnification, two ChAT immunoreactive neurons (indicated by numerals 1 and 2
GABAwhich yields a diffuse brown staining, and BDHC for ChAT which yields a
(arrow) and several small GABA-IR single labeled neurons (arrowheads) in the L
segment of a dendrite (between two arrowheads) contains smooth brown DAB st
neuron in the PPT. Scale bars: A, D = 100 Am; B, C, E and F = 50 Am.
placed in 0.1 M PB containing 25% sucrose for cryopro-
tection. The brainstem was cut in 15-Am-thick sections on a
Reichert-Jung cryostat. The blocks of tissue for EM were
The reaction product appears as dark-blue granules; B depicts, at a higher
in A); (C–F) double-labeling using two different chromogens, i.e., DAB for
dark-blue granular reaction product. (C–D) A large double-labeled neuron
DT (C) and PPT (D); (E) a double-labeled neuron in the LDT. Note that a
aining but no BDHC granular staining; (F) an example of a double-labeled
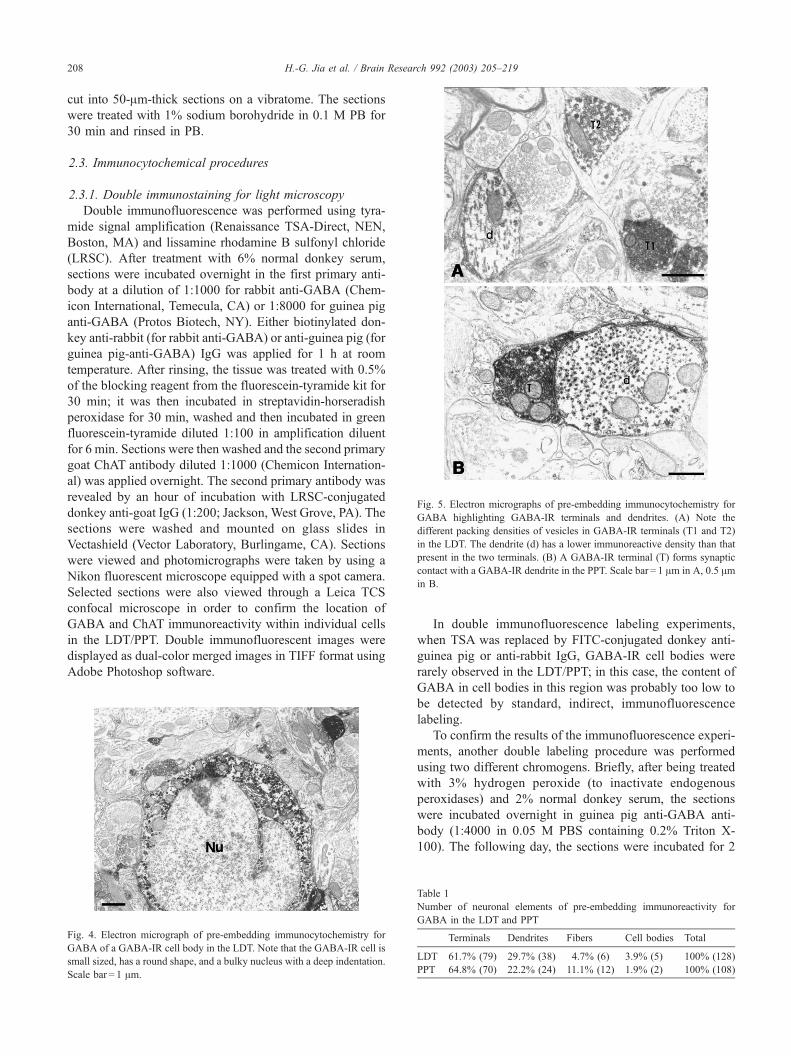
Fig. 5. Electron micrographs of pre-embedding immunocytochemistry for
GABA highlighting GABA-IR terminals and dendrites. (A) Note the
different packing densities of vesicles in GABA-IR terminals (T1 and T2)
in the LDT. The dendrite (d) has a lower immunoreactive density than that
present in the two terminals. (B) A GABA-IR terminal (T) forms synaptic
contact with a GABA-IR dendrite in the PPT. Scale bar = 1 Am in A, 0.5 Amin B.
H.-G. Jia et al. / Brain Research 992 (2003) 205–219208
cut into 50-Am-thick sections on a vibratome. The sections
were treated with 1% sodium borohydride in 0.1 M PB for
30 min and rinsed in PB.
2.3. Immunocytochemical procedures
2.3.1. Double immunostaining for light microscopy
Double immunofluorescence was performed using tyra-
mide signal amplification (Renaissance TSA-Direct, NEN,
Boston, MA) and lissamine rhodamine B sulfonyl chloride
(LRSC). After treatment with 6% normal donkey serum,
sections were incubated overnight in the first primary anti-
body at a dilution of 1:1000 for rabbit anti-GABA (Chem-
icon International, Temecula, CA) or 1:8000 for guinea pig
anti-GABA (Protos Biotech, NY). Either biotinylated don-
key anti-rabbit (for rabbit anti-GABA) or anti-guinea pig (for
guinea pig-anti-GABA) IgG was applied for 1 h at room
temperature. After rinsing, the tissue was treated with 0.5%
of the blocking reagent from the fluorescein-tyramide kit for
30 min; it was then incubated in streptavidin-horseradish
peroxidase for 30 min, washed and then incubated in green
fluorescein-tyramide diluted 1:100 in amplification diluent
for 6 min. Sections were then washed and the second primary
goat ChAT antibody diluted 1:1000 (Chemicon Internation-
al) was applied overnight. The second primary antibody was
revealed by an hour of incubation with LRSC-conjugated
donkey anti-goat IgG (1:200; Jackson, West Grove, PA). The
sections were washed and mounted on glass slides in
Vectashield (Vector Laboratory, Burlingame, CA). Sections
were viewed and photomicrographs were taken by using a
Nikon fluorescent microscope equipped with a spot camera.
Selected sections were also viewed through a Leica TCS
confocal microscope in order to confirm the location of
GABA and ChAT immunoreactivity within individual cells
in the LDT/PPT. Double immunofluorescent images were
displayed as dual-color merged images in TIFF format using
Adobe Photoshop software.
Fig. 4. Electron micrograph of pre-embedding immunocytochemistry for
GABA of a GABA-IR cell body in the LDT. Note that the GABA-IR cell is
small sized, has a round shape, and a bulky nucleus with a deep indentation.
Scale bar = 1 Am.
In double immunofluorescence labeling experiments,
when TSA was replaced by FITC-conjugated donkey anti-
guinea pig or anti-rabbit IgG, GABA-IR cell bodies were
rarely observed in the LDT/PPT; in this case, the content of
GABA in cell bodies in this region was probably too low to
be detected by standard, indirect, immunofluorescence
labeling.
To confirm the results of the immunofluorescence experi-
ments, another double labeling procedure was performed
using two different chromogens. Briefly, after being treated
with 3% hydrogen peroxide (to inactivate endogenous
peroxidases) and 2% normal donkey serum, the sections
were incubated overnight in guinea pig anti-GABA anti-
body (1:4000 in 0.05 M PBS containing 0.2% Triton X-
100). The following day, the sections were incubated for 2
Table 1
Number of neuronal elements of pre-embedding immunoreactivity for
GABA in the LDT and PPT
Terminals Dendrites Fibers Cell bodies Total
LDT 61.7% (79) 29.7% (38) 4.7% (6) 3.9% (5) 100% (128)
PPT 64.8% (70) 22.2% (24) 11.1% (12) 1.9% (2) 100% (108)
H.-G. Jia et al. / Brain Research 992 (2003) 205–219 209
h at room temperature in biotinylated donkey anti-guinea
pig IgG (1:300). Finally, sections were incubated in ABC
complex for another 2 h. Bound peroxidase was revealed
by placing the sections in a solution containing 0.05%
diaminobenzidine (DAB) and 0.003% H2O2 in 0.05 M
Tris–HCl buffer (TB; pH 7.6) for 15–30 min. The brain-
stem sections were then processed for ChAT immunocyto-
chemistry following the procedure described above, with
the exception that bound peroxidase was revealed by
benzidine dihydrochloride (BDHC), which produces a
granular reaction product [26]. In order to avoid the
possibility that the combination of the DAB and BDHC
methods could confound the results from double-labeling
experiments (see Discussion), the following procedures
were carried out. In the BDHC method, pH was restricted
to the range of 6.6–6.8 to maintain the blue color of the
BDHC reaction product. Additionally, in each experiment,
a number of brainstem sections were processed for ChAT
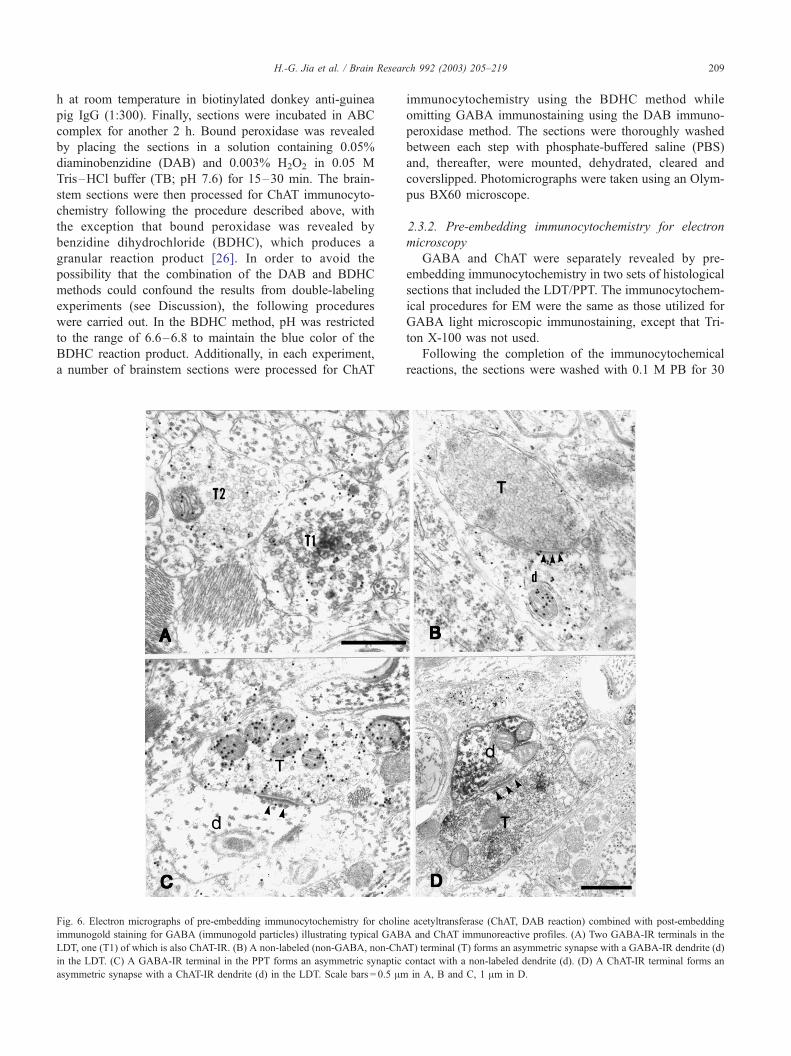
Fig. 6. Electron micrographs of pre-embedding immunocytochemistry for cholin
immunogold staining for GABA (immunogold particles) illustrating typical GAB
LDT, one (T1) of which is also ChAT-IR. (B) A non-labeled (non-GABA, non-ChA
in the LDT. (C) A GABA-IR terminal in the PPT forms an asymmetric synaptic
asymmetric synapse with a ChAT-IR dendrite (d) in the LDT. Scale bars = 0.5 Am
immunocytochemistry using the BDHC method while
omitting GABA immunostaining using the DAB immuno-
peroxidase method. The sections were thoroughly washed
between each step with phosphate-buffered saline (PBS)
and, thereafter, were mounted, dehydrated, cleared and
coverslipped. Photomicrographs were taken using an Olym-
pus BX60 microscope.
2.3.2. Pre-embedding immunocytochemistry for electron
microscopy
GABA and ChAT were separately revealed by pre-
embedding immunocytochemistry in two sets of histological
sections that included the LDT/PPT. The immunocytochem-
ical procedures for EM were the same as those utilized for
GABA light microscopic immunostaining, except that Tri-
ton X-100 was not used.
Following the completion of the immunocytochemical
reactions, the sections were washed with 0.1 M PB for 30
e acetyltransferase (ChAT, DAB reaction) combined with post-embedding
A and ChAT immunoreactive profiles. (A) Two GABA-IR terminals in the
T) terminal (T) forms an asymmetric synapse with a GABA-IR dendrite (d)
contact with a non-labeled dendrite (d). (D) A ChAT-IR terminal forms an
in A, B and C, 1 Am in D.
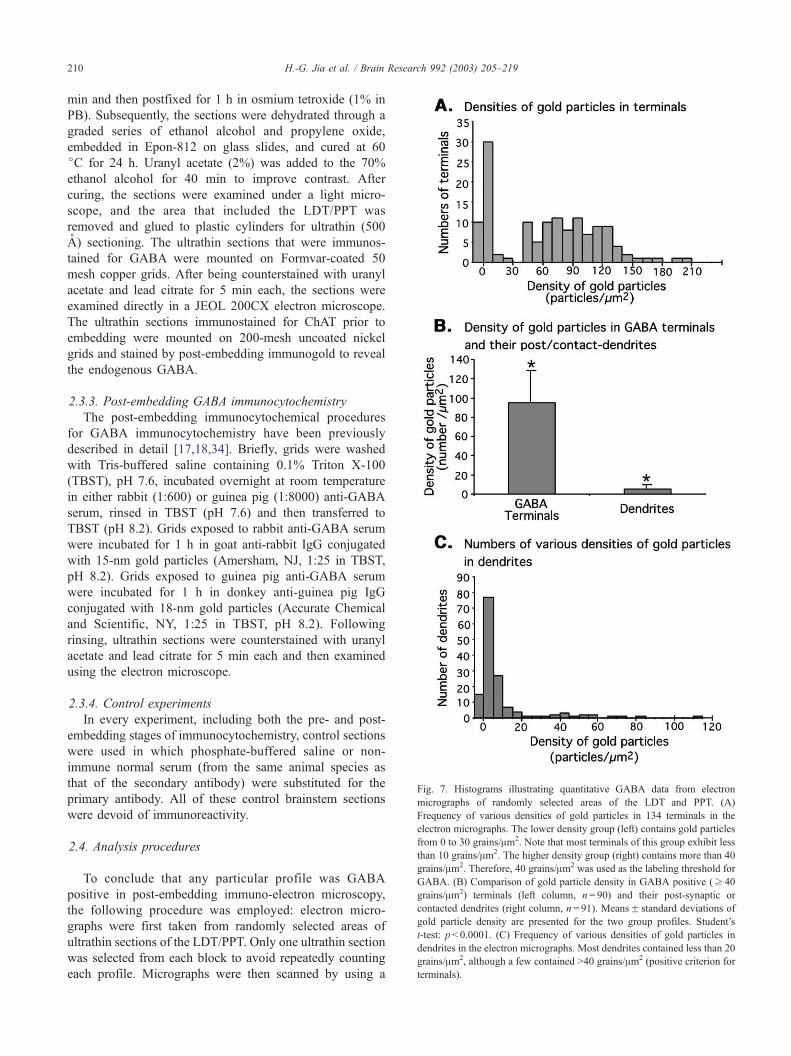
Fig. 7. Histograms illustrating quantitative GABA data from electron
micrographs of randomly selected areas of the LDT and PPT. (A)
Frequency of various densities of gold particles in 134 terminals in the
electron micrographs. The lower density group (left) contains gold particles
from 0 to 30 grains/Am2. Note that most terminals of this group exhibit less
than 10 grains/Am2. The higher density group (right) contains more than 40
grains/Am2. Therefore, 40 grains/Am2 was used as the labeling threshold for
GABA. (B) Comparison of gold particle density in GABA positive (z 40
grains/Am2) terminals (left column, n= 90) and their post-synaptic or
contacted dendrites (right column, n= 91). MeansF standard deviations of
gold particle density are presented for the two group profiles. Student’s
t-test: p< 0.0001. (C) Frequency of various densities of gold particles in
dendrites in the electron micrographs. Most dendrites contained less than 20
grains/Am2, although a few contained >40 grains/Am2 (positive criterion for
terminals).
H.-G. Jia et al. / Brain Research 992 (2003) 205–219210
min and then postfixed for 1 h in osmium tetroxide (1% in
PB). Subsequently, the sections were dehydrated through a
graded series of ethanol alcohol and propylene oxide,
embedded in Epon-812 on glass slides, and cured at 60
jC for 24 h. Uranyl acetate (2%) was added to the 70%
ethanol alcohol for 40 min to improve contrast. After
curing, the sections were examined under a light micro-
scope, and the area that included the LDT/PPT was
removed and glued to plastic cylinders for ultrathin (500
A) sectioning. The ultrathin sections that were immunos-
tained for GABA were mounted on Formvar-coated 50
mesh copper grids. After being counterstained with uranyl
acetate and lead citrate for 5 min each, the sections were
examined directly in a JEOL 200CX electron microscope.
The ultrathin sections immunostained for ChAT prior to
embedding were mounted on 200-mesh uncoated nickel
grids and stained by post-embedding immunogold to reveal
the endogenous GABA.
2.3.3. Post-embedding GABA immunocytochemistry
The post-embedding immunocytochemical procedures
for GABA immunocytochemistry have been previously
described in detail [17,18,34]. Briefly, grids were washed
with Tris-buffered saline containing 0.1% Triton X-100
(TBST), pH 7.6, incubated overnight at room temperature
in either rabbit (1:600) or guinea pig (1:8000) anti-GABA
serum, rinsed in TBST (pH 7.6) and then transferred to
TBST (pH 8.2). Grids exposed to rabbit anti-GABA serum
were incubated for 1 h in goat anti-rabbit IgG conjugated
with 15-nm gold particles (Amersham, NJ, 1:25 in TBST,
pH 8.2). Grids exposed to guinea pig anti-GABA serum
were incubated for 1 h in donkey anti-guinea pig IgG
conjugated with 18-nm gold particles (Accurate Chemical
and Scientific, NY, 1:25 in TBST, pH 8.2). Following
rinsing, ultrathin sections were counterstained with uranyl
acetate and lead citrate for 5 min each and then examined
using the electron microscope.
2.3.4. Control experiments
In every experiment, including both the pre- and post-
embedding stages of immunocytochemistry, control sections
were used in which phosphate-buffered saline or non-
immune normal serum (from the same animal species as
that of the secondary antibody) were substituted for the
primary antibody. All of these control brainstem sections
were devoid of immunoreactivity.
2.4. Analysis procedures
To conclude that any particular profile was GABA
positive in post-embedding immuno-electron microscopy,
the following procedure was employed: electron micro-
graphs were first taken from randomly selected areas of
ultrathin sections of the LDT/PPT. Only one ultrathin section
was selected from each block to avoid repeatedly counting
each profile. Micrographs were then scanned by using a
H.-G. Jia et al. / Brain Research 992 (2003) 205–219 211
ScanJet-II scanner and Photoshop 6.0 software on a Macin-
tosh G3 computer. Gold particles within each profile, ex-
cluding those that were associated with mitochondria in
order to avoid possible false positive data [34], were counted
and profile areas were measured by using the NIH Image
analysis software. The number of grains per square microm-
eter was then employed to assess whether profiles were
GABA positive or negative.
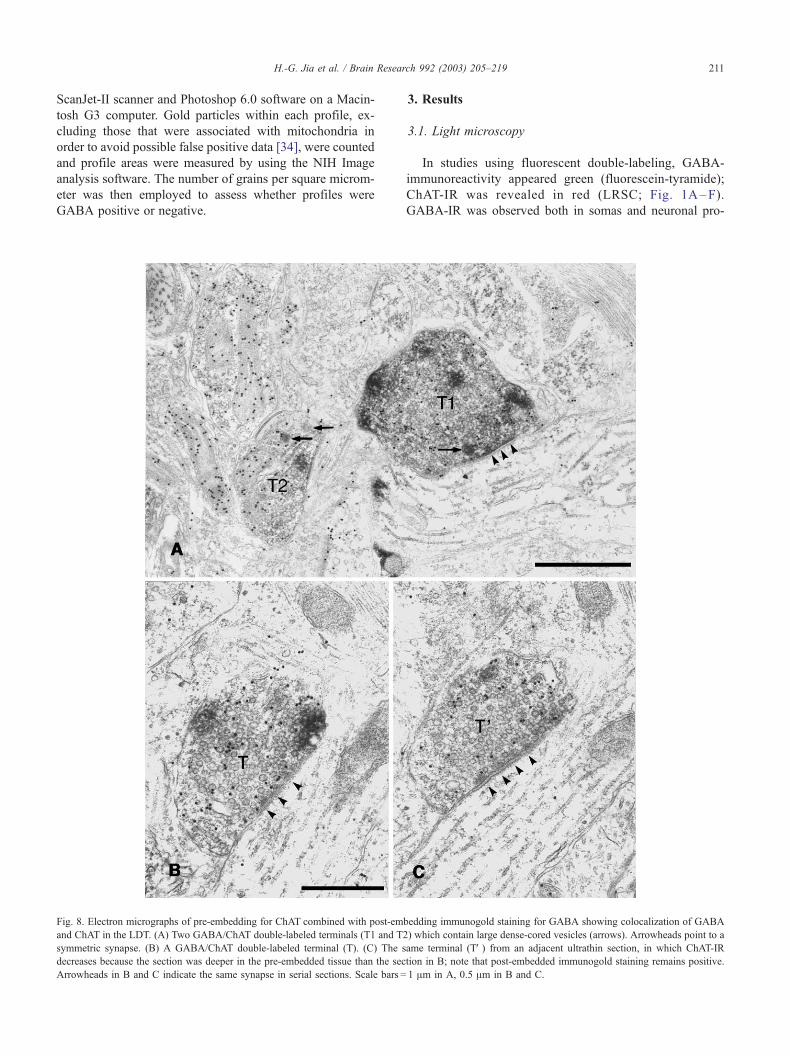
Fig. 8. Electron micrographs of pre-embedding for ChAT combined with post-em
and ChAT in the LDT. (A) Two GABA/ChAT double-labeled terminals (T1 and T2
symmetric synapse. (B) A GABA/ChAT double-labeled terminal (T). (C) The s
decreases because the section was deeper in the pre-embedded tissue than the sec
Arrowheads in B and C indicate the same synapse in serial sections. Scale bars =
3. Results
3.1. Light microscopy
In studies using fluorescent double-labeling, GABA-
immunoreactivity appeared green (fluorescein-tyramide);
ChAT-IR was revealed in red (LRSC; Fig. 1A–F).
GABA-IR was observed both in somas and neuronal pro-
bedding immunogold staining for GABA showing colocalization of GABA
) which contain large dense-cored vesicles (arrows). Arrowheads point to a
ame terminal (TV) from an adjacent ultrathin section, in which ChAT-IR
tion in B; note that post-embedded immunogold staining remains positive.
1 Am in A, 0.5 Am in B and C.
H.-G. Jia et al. / Brain Research 992 (2003) 205–219212
cesses. Most GABA-IR neurons were small (10–20 Am),
although some medium to large-sized cells (20–40 Am)
were also observed. Both GABA antibodies that were used
yielded the same results.
ChAT-IR was present mainly in cell bodies and proximal
dendrites. Throughout the LDT/PPT, ChAT and GABA
immunoreactivities were observed in the same cell. GABA
was colocalized with ChAT in cells that were considered to
be typically cholinergic neurons on the basis of their size
and shape (20–30 Am in diameter, fusiform or multipolar in
shape [20]). The proportion of GABA/ChAT double-labeled
neurons among all ChAT-IR neurons could not be deter-
mined precisely in this immunofluorescent study because
staining of the fibers and terminals often obscured soma
staining (Fig. 1C–F). However, based on an examination of
more than 20 sections from three cats, it appeared that
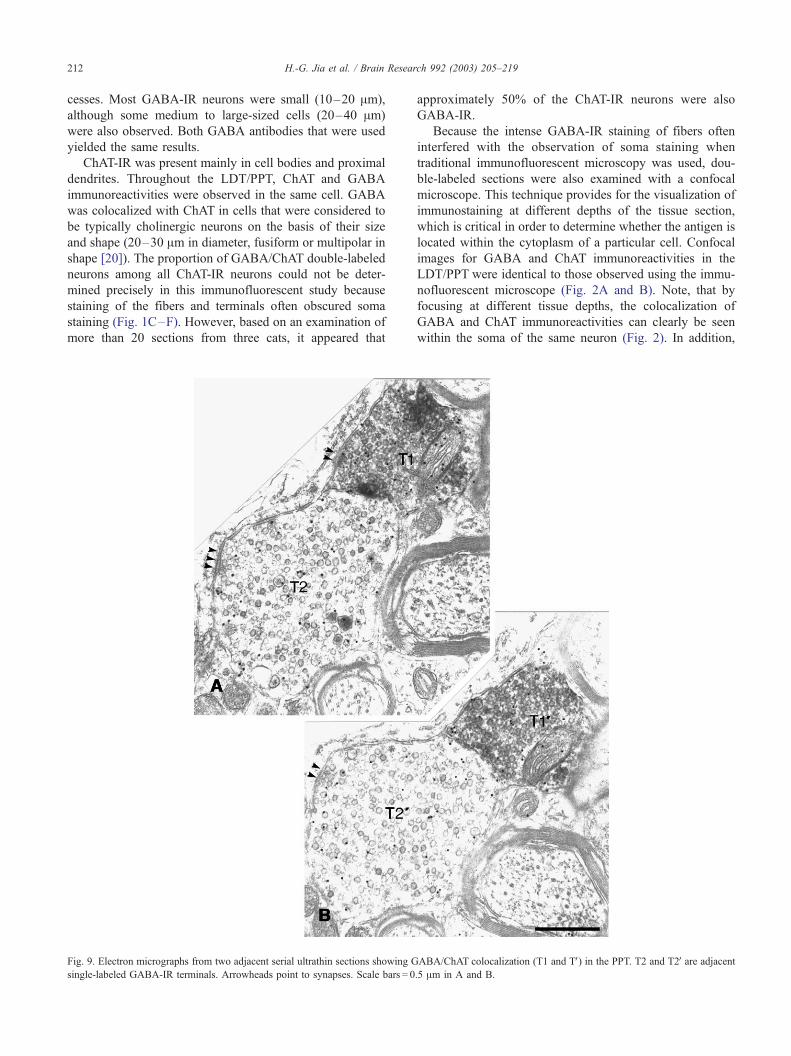
Fig. 9. Electron micrographs from two adjacent serial ultrathin sections showing G
single-labeled GABA-IR terminals. Arrowheads point to synapses. Scale bars = 0
approximately 50% of the ChAT-IR neurons were also
GABA-IR.
Because the intense GABA-IR staining of fibers often
interfered with the observation of soma staining when
traditional immunofluorescent microscopy was used, dou-
ble-labeled sections were also examined with a confocal
microscope. This technique provides for the visualization of
immunostaining at different depths of the tissue section,
which is critical in order to determine whether the antigen is
located within the cytoplasm of a particular cell. Confocal
images for GABA and ChAT immunoreactivities in the
LDT/PPT were identical to those observed using the immu-
nofluorescent microscope (Fig. 2A and B). Note, that by
focusing at different tissue depths, the colocalization of
GABA and ChAT immunoreactivities can clearly be seen
within the soma of the same neuron (Fig. 2). In addition,
ABA/ChAT colocalization (T1 and TV) in the PPT. T2 and T2Vare adjacent.5 Am in A and B.
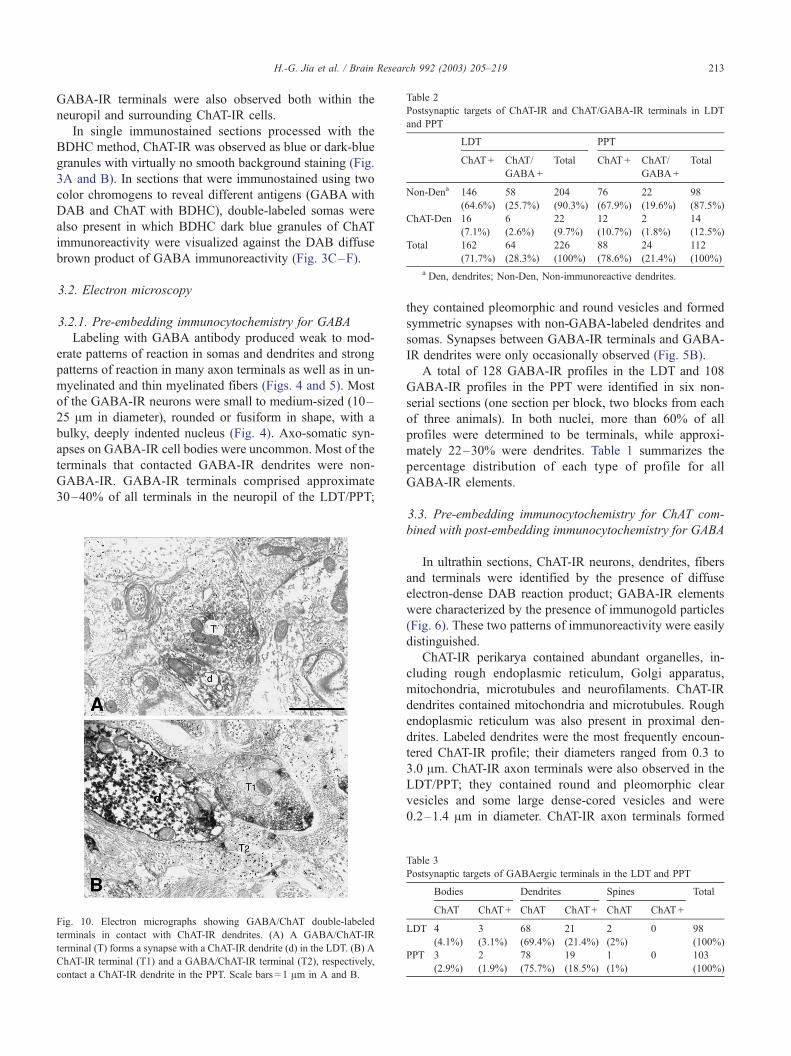
Table 2
Postsynaptic targets of ChAT-IR and ChAT/GABA-IR terminals in LDT
and PPT
LDT PPT
ChAT+ ChAT/
GABA+
Total ChAT+ ChAT/
GABA+
Total
Non-Dena 146
(64.6%)
58
(25.7%)
204
(90.3%)
76
(67.9%)
22
(19.6%)
98
(87.5%)
ChAT-Den 16
(7.1%)
6
(2.6%)
22
(9.7%)
12
(10.7%)
2
(1.8%)
14
(12.5%)
Total 162
(71.7%)
64
(28.3%)
226
(100%)
88
(78.6%)
24
(21.4%)
112
(100%)
a Den, dendrites; Non-Den, Non-immunoreactive dendrites.
H.-G. Jia et al. / Brain Research 992 (2003) 205–219 213
GABA-IR terminals were also observed both within the
neuropil and surrounding ChAT-IR cells.
In single immunostained sections processed with the
BDHC method, ChAT-IR was observed as blue or dark-blue
granules with virtually no smooth background staining (Fig.
3A and B). In sections that were immunostained using two
color chromogens to reveal different antigens (GABA with
DAB and ChAT with BDHC), double-labeled somas were
also present in which BDHC dark blue granules of ChAT
immunoreactivity were visualized against the DAB diffuse
brown product of GABA immunoreactivity (Fig. 3C–F).
3.2. Electron microscopy
3.2.1. Pre-embedding immunocytochemistry for GABA
Labeling with GABA antibody produced weak to mod-
erate patterns of reaction in somas and dendrites and strong
patterns of reaction in many axon terminals as well as in un-
myelinated and thin myelinated fibers (Figs. 4 and 5). Most
of the GABA-IR neurons were small to medium-sized (10–
25 Am in diameter), rounded or fusiform in shape, with a
bulky, deeply indented nucleus (Fig. 4). Axo-somatic syn-
apses on GABA-IR cell bodies were uncommon. Most of the
terminals that contacted GABA-IR dendrites were non-
GABA-IR. GABA-IR terminals comprised approximate
30–40% of all terminals in the neuropil of the LDT/PPT;
Fig. 10. Electron micrographs showing GABA/ChAT double-labeled
terminals in contact with ChAT-IR dendrites. (A) A GABA/ChAT-IR
terminal (T) forms a synapse with a ChAT-IR dendrite (d) in the LDT. (B) A
ChAT-IR terminal (T1) and a GABA/ChAT-IR terminal (T2), respectively,
contact a ChAT-IR dendrite in the PPT. Scale bars = 1 Am in A and B.
they contained pleomorphic and round vesicles and formed
symmetric synapses with non-GABA-labeled dendrites and
somas. Synapses between GABA-IR terminals and GABA-
IR dendrites were only occasionally observed (Fig. 5B).
A total of 128 GABA-IR profiles in the LDT and 108
GABA-IR profiles in the PPT were identified in six non-
serial sections (one section per block, two blocks from each
of three animals). In both nuclei, more than 60% of all
profiles were determined to be terminals, while approxi-
mately 22–30% were dendrites. Table 1 summarizes the
percentage distribution of each type of profile for all
GABA-IR elements.
3.3. Pre-embedding immunocytochemistry for ChAT com-
bined with post-embedding immunocytochemistry for GABA
In ultrathin sections, ChAT-IR neurons, dendrites, fibers
and terminals were identified by the presence of diffuse
electron-dense DAB reaction product; GABA-IR elements
were characterized by the presence of immunogold particles
(Fig. 6). These two patterns of immunoreactivity were easily
distinguished.
ChAT-IR perikarya contained abundant organelles, in-
cluding rough endoplasmic reticulum, Golgi apparatus,
mitochondria, microtubules and neurofilaments. ChAT-IR
dendrites contained mitochondria and microtubules. Rough
endoplasmic reticulum was also present in proximal den-
drites. Labeled dendrites were the most frequently encoun-
tered ChAT-IR profile; their diameters ranged from 0.3 to
3.0 Am. ChAT-IR axon terminals were also observed in the
LDT/PPT; they contained round and pleomorphic clear
vesicles and some large dense-cored vesicles and were
0.2–1.4 Am in diameter. ChAT-IR axon terminals formed
Table 3
Postsynaptic targets of GABAergic terminals in the LDT and PPT
Bodies Dendrites Spines Total
ChAT� ChAT+ ChAT� ChAT+ ChAT� ChAT+
LDT 4
(4.1%)
3
(3.1%)
68
(69.4%)
21
(21.4%)
2
(2%)
0 98
(100%)
PPT 3
(2.9%)
2
(1.9%)
78
(75.7%)
19
(18.5%)
1
(1%)
0 103
(100%)
H.-G. Jia et al. / Brain Research 992 (2003) 205–219214
symmetric and asymmetric synaptic contacts principally
with unlabeled somas or dendrites. A few ChAT-IR termi-
nals formed synapses with ChAT-IR somas or dendrites.
Tissue from animals that were perfused with the fixative
containing 2% glutaraldehyde was particularly well suited
for GABA immunostaining. With this procedure, immuno-
gold particles were found to overlay axons and terminals;
very few particles were observed in conjunction with somas,
dendrites, or glial processes. Both GABA antibodies pro-
duced the same pattern of immunostaining.
In order to determine whether a particular axon termi-
nal was GABA positive, randomly selected electron
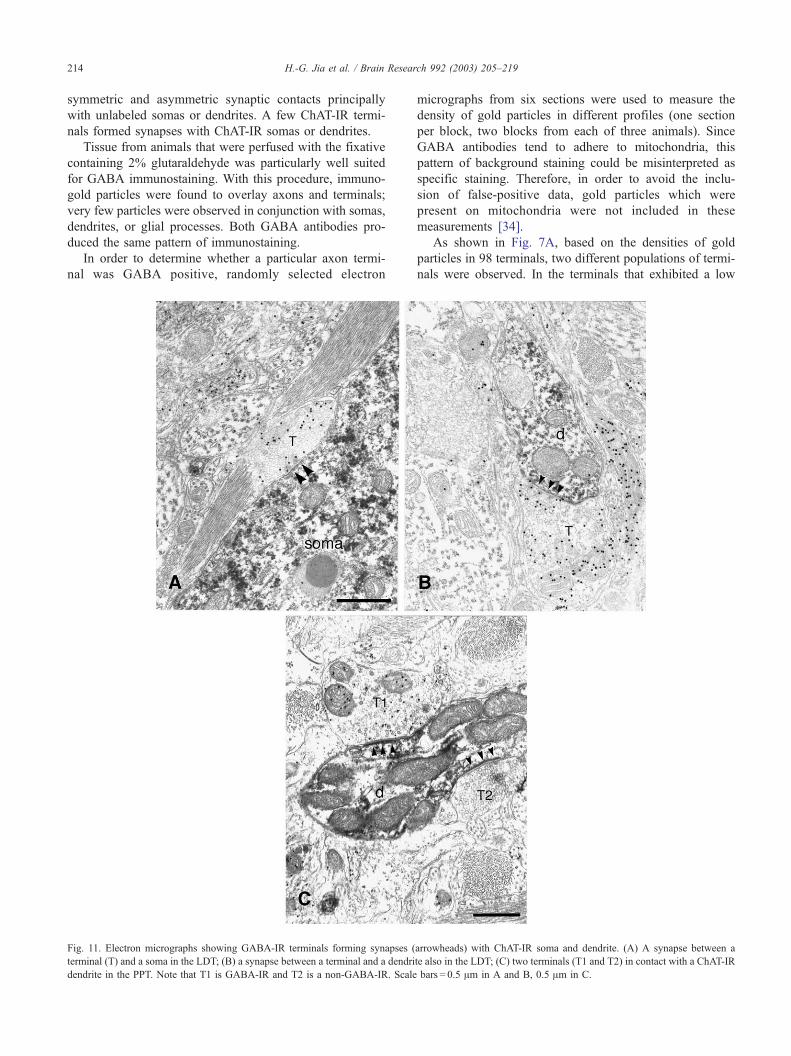
Fig. 11. Electron micrographs showing GABA-IR terminals forming synapses (
terminal (T) and a soma in the LDT; (B) a synapse between a terminal and a dendri
dendrite in the PPT. Note that T1 is GABA-IR and T2 is a non-GABA-IR. Scale
micrographs from six sections were used to measure the
density of gold particles in different profiles (one section
per block, two blocks from each of three animals). Since
GABA antibodies tend to adhere to mitochondria, this
pattern of background staining could be misinterpreted as
specific staining. Therefore, in order to avoid the inclu-
sion of false-positive data, gold particles which were
present on mitochondria were not included in these
measurements [34].
As shown in Fig. 7A, based on the densities of gold
particles in 98 terminals, two different populations of termi-
nals were observed. In the terminals that exhibited a low
arrowheads) with ChAT-IR soma and dendrite. (A) A synapse between a
te also in the LDT; (C) two terminals (T1 and T2) in contact with a ChAT-IR
bars = 0.5 Am in A and B, 0.5 Am in C.
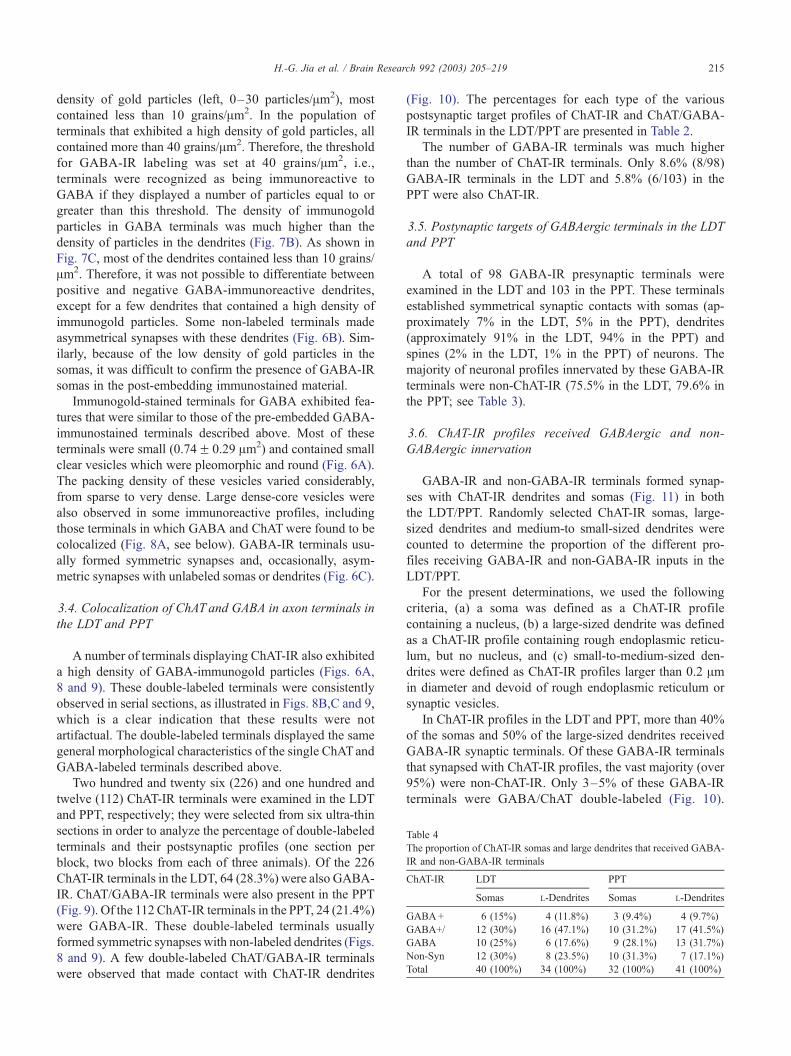
Table 4
The proportion of ChAT-IR somas and large dendrites that received GABA-
IR and non-GABA-IR terminals
ChAT-IR LDT PPT
Somas L-Dendrites Somas L-Dendrites
GABA+ 6 (15%) 4 (11.8%) 3 (9.4%) 4 (9.7%)
GABA+/� 12 (30%) 16 (47.1%) 10 (31.2%) 17 (41.5%)
GABA� 10 (25%) 6 (17.6%) 9 (28.1%) 13 (31.7%)
Non-Syn 12 (30%) 8 (23.5%) 10 (31.3%) 7 (17.1%)
Total 40 (100%) 34 (100%) 32 (100%) 41 (100%)
H.-G. Jia et al. / Brain Research 992 (2003) 205–219 215
density of gold particles (left, 0–30 particles/Am2), most
contained less than 10 grains/Am2. In the population of
terminals that exhibited a high density of gold particles, all
contained more than 40 grains/Am2. Therefore, the threshold
for GABA-IR labeling was set at 40 grains/Am2, i.e.,
terminals were recognized as being immunoreactive to
GABA if they displayed a number of particles equal to or
greater than this threshold. The density of immunogold
particles in GABA terminals was much higher than the
density of particles in the dendrites (Fig. 7B). As shown in
Fig. 7C, most of the dendrites contained less than 10 grains/
Am2. Therefore, it was not possible to differentiate between
positive and negative GABA-immunoreactive dendrites,
except for a few dendrites that contained a high density of
immunogold particles. Some non-labeled terminals made
asymmetrical synapses with these dendrites (Fig. 6B). Sim-
ilarly, because of the low density of gold particles in the
somas, it was difficult to confirm the presence of GABA-IR
somas in the post-embedding immunostained material.
Immunogold-stained terminals for GABA exhibited fea-
tures that were similar to those of the pre-embedded GABA-
immunostained terminals described above. Most of these
terminals were small (0.74F 0.29 Am2) and contained small
clear vesicles which were pleomorphic and round (Fig. 6A).
The packing density of these vesicles varied considerably,
from sparse to very dense. Large dense-core vesicles were
also observed in some immunoreactive profiles, including
those terminals in which GABA and ChATwere found to be
colocalized (Fig. 8A, see below). GABA-IR terminals usu-
ally formed symmetric synapses and, occasionally, asym-
metric synapses with unlabeled somas or dendrites (Fig. 6C).
3.4. Colocalization of ChAT and GABA in axon terminals in
the LDT and PPT
A number of terminals displaying ChAT-IR also exhibited
a high density of GABA-immunogold particles (Figs. 6A,
8 and 9). These double-labeled terminals were consistently
observed in serial sections, as illustrated in Figs. 8B,C and 9,
which is a clear indication that these results were not
artifactual. The double-labeled terminals displayed the same
general morphological characteristics of the single ChATand
GABA-labeled terminals described above.
Two hundred and twenty six (226) and one hundred and
twelve (112) ChAT-IR terminals were examined in the LDT
and PPT, respectively; they were selected from six ultra-thin
sections in order to analyze the percentage of double-labeled
terminals and their postsynaptic profiles (one section per
block, two blocks from each of three animals). Of the 226
ChAT-IR terminals in the LDT, 64 (28.3%) were also GABA-
IR. ChAT/GABA-IR terminals were also present in the PPT
(Fig. 9). Of the 112 ChAT-IR terminals in the PPT, 24 (21.4%)
were GABA-IR. These double-labeled terminals usually
formed symmetric synapses with non-labeled dendrites (Figs.
8 and 9). A few double-labeled ChAT/GABA-IR terminals
were observed that made contact with ChAT-IR dendrites
(Fig. 10). The percentages for each type of the various
postsynaptic target profiles of ChAT-IR and ChAT/GABA-
IR terminals in the LDT/PPT are presented in Table 2.
The number of GABA-IR terminals was much higher
than the number of ChAT-IR terminals. Only 8.6% (8/98)
GABA-IR terminals in the LDT and 5.8% (6/103) in the
PPT were also ChAT-IR.
3.5. Postynaptic targets of GABAergic terminals in the LDT
and PPT
A total of 98 GABA-IR presynaptic terminals were
examined in the LDT and 103 in the PPT. These terminals
established symmetrical synaptic contacts with somas (ap-
proximately 7% in the LDT, 5% in the PPT), dendrites
(approximately 91% in the LDT, 94% in the PPT) and
spines (2% in the LDT, 1% in the PPT) of neurons. The
majority of neuronal profiles innervated by these GABA-IR
terminals were non-ChAT-IR (75.5% in the LDT, 79.6% in
the PPT; see Table 3).
3.6. ChAT-IR profiles received GABAergic and non-
GABAergic innervation
GABA-IR and non-GABA-IR terminals formed synap-
ses with ChAT-IR dendrites and somas (Fig. 11) in both
the LDT/PPT. Randomly selected ChAT-IR somas, large-
sized dendrites and medium-to small-sized dendrites were
counted to determine the proportion of the different pro-
files receiving GABA-IR and non-GABA-IR inputs in the
LDT/PPT.
For the present determinations, we used the following
criteria, (a) a soma was defined as a ChAT-IR profile
containing a nucleus, (b) a large-sized dendrite was defined
as a ChAT-IR profile containing rough endoplasmic reticu-
lum, but no nucleus, and (c) small-to-medium-sized den-
drites were defined as ChAT-IR profiles larger than 0.2 Amin diameter and devoid of rough endoplasmic reticulum or
synaptic vesicles.
In ChAT-IR profiles in the LDT and PPT, more than 40%
of the somas and 50% of the large-sized dendrites received
GABA-IR synaptic terminals. Of these GABA-IR terminals
that synapsed with ChAT-IR profiles, the vast majority (over
95%) were non-ChAT-IR. Only 3–5% of these GABA-IR
terminals were GABA/ChAT double-labeled (Fig. 10).
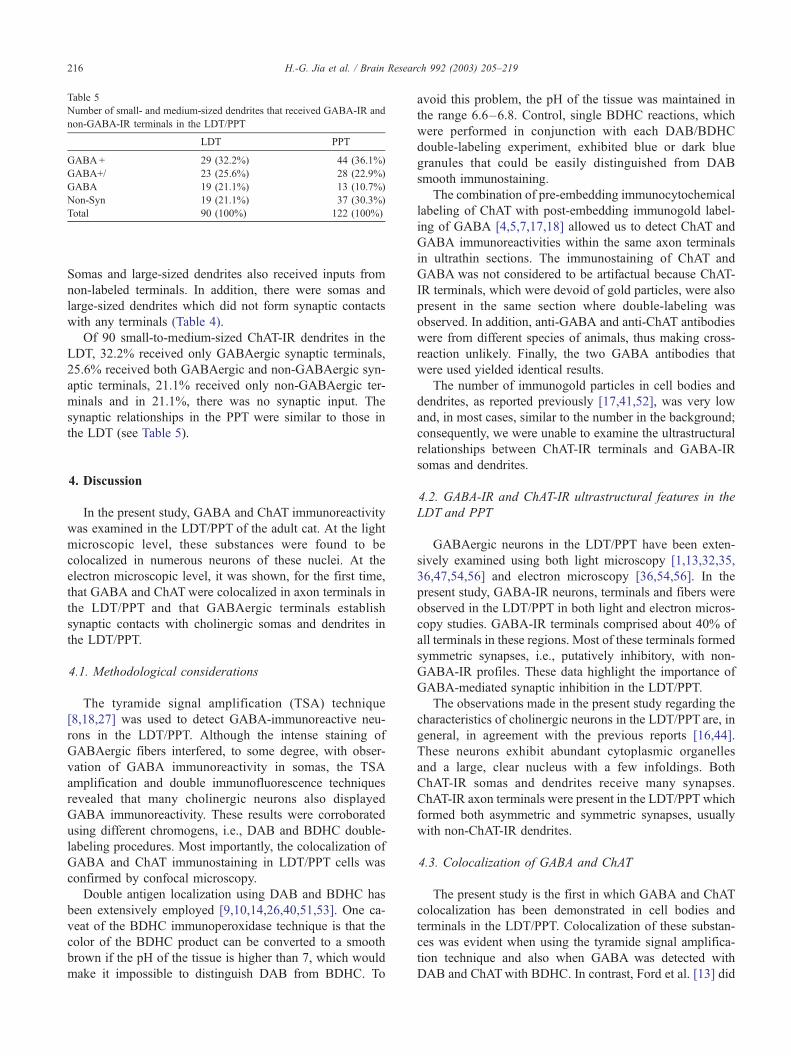
Table 5
Number of small- and medium-sized dendrites that received GABA-IR and
non-GABA-IR terminals in the LDT/PPT
LDT PPT
GABA+ 29 (32.2%) 44 (36.1%)
GABA+/� 23 (25.6%) 28 (22.9%)
GABA� 19 (21.1%) 13 (10.7%)
Non-Syn 19 (21.1%) 37 (30.3%)
Total 90 (100%) 122 (100%)
H.-G. Jia et al. / Brain Research 992 (2003) 205–219216
Somas and large-sized dendrites also received inputs from
non-labeled terminals. In addition, there were somas and
large-sized dendrites which did not form synaptic contacts
with any terminals (Table 4).
Of 90 small-to-medium-sized ChAT-IR dendrites in the
LDT, 32.2% received only GABAergic synaptic terminals,
25.6% received both GABAergic and non-GABAergic syn-
aptic terminals, 21.1% received only non-GABAergic ter-
minals and in 21.1%, there was no synaptic input. The
synaptic relationships in the PPT were similar to those in
the LDT (see Table 5).
4. Discussion
In the present study, GABA and ChAT immunoreactivity
was examined in the LDT/PPT of the adult cat. At the light
microscopic level, these substances were found to be
colocalized in numerous neurons of these nuclei. At the
electron microscopic level, it was shown, for the first time,
that GABA and ChATwere colocalized in axon terminals in
the LDT/PPT and that GABAergic terminals establish
synaptic contacts with cholinergic somas and dendrites in
the LDT/PPT.
4.1. Methodological considerations
The tyramide signal amplification (TSA) technique
[8,18,27] was used to detect GABA-immunoreactive neu-
rons in the LDT/PPT. Although the intense staining of
GABAergic fibers interfered, to some degree, with obser-
vation of GABA immunoreactivity in somas, the TSA
amplification and double immunofluorescence techniques
revealed that many cholinergic neurons also displayed
GABA immunoreactivity. These results were corroborated
using different chromogens, i.e., DAB and BDHC double-
labeling procedures. Most importantly, the colocalization of
GABA and ChAT immunostaining in LDT/PPT cells was
confirmed by confocal microscopy.
Double antigen localization using DAB and BDHC has
been extensively employed [9,10,14,26,40,51,53]. One ca-
veat of the BDHC immunoperoxidase technique is that the
color of the BDHC product can be converted to a smooth
brown if the pH of the tissue is higher than 7, which would
make it impossible to distinguish DAB from BDHC. To
avoid this problem, the pH of the tissue was maintained in
the range 6.6–6.8. Control, single BDHC reactions, which
were performed in conjunction with each DAB/BDHC
double-labeling experiment, exhibited blue or dark blue
granules that could be easily distinguished from DAB
smooth immunostaining.
The combination of pre-embedding immunocytochemical
labeling of ChAT with post-embedding immunogold label-
ing of GABA [4,5,7,17,18] allowed us to detect ChAT and
GABA immunoreactivities within the same axon terminals
in ultrathin sections. The immunostaining of ChAT and
GABA was not considered to be artifactual because ChAT-
IR terminals, which were devoid of gold particles, were also
present in the same section where double-labeling was
observed. In addition, anti-GABA and anti-ChAT antibodies
were from different species of animals, thus making cross-
reaction unlikely. Finally, the two GABA antibodies that
were used yielded identical results.
The number of immunogold particles in cell bodies and
dendrites, as reported previously [17,41,52], was very low
and, in most cases, similar to the number in the background;
consequently, we were unable to examine the ultrastructural
relationships between ChAT-IR terminals and GABA-IR
somas and dendrites.
4.2. GABA-IR and ChAT-IR ultrastructural features in the
LDT and PPT
GABAergic neurons in the LDT/PPT have been exten-
sively examined using both light microscopy [1,13,32,35,
36,47,54,56] and electron microscopy [36,54,56]. In the
present study, GABA-IR neurons, terminals and fibers were
observed in the LDT/PPT in both light and electron micros-
copy studies. GABA-IR terminals comprised about 40% of
all terminals in these regions. Most of these terminals formed
symmetric synapses, i.e., putatively inhibitory, with non-
GABA-IR profiles. These data highlight the importance of
GABA-mediated synaptic inhibition in the LDT/PPT.
The observations made in the present study regarding the
characteristics of cholinergic neurons in the LDT/PPT are, in
general, in agreement with the previous reports [16,44].
These neurons exhibit abundant cytoplasmic organelles
and a large, clear nucleus with a few infoldings. Both
ChAT-IR somas and dendrites receive many synapses.
ChAT-IR axon terminals were present in the LDT/PPT which
formed both asymmetric and symmetric synapses, usually
with non-ChAT-IR dendrites.
4.3. Colocalization of GABA and ChAT
The present study is the first in which GABA and ChAT
colocalization has been demonstrated in cell bodies and
terminals in the LDT/PPT. Colocalization of these substan-
ces was evident when using the tyramide signal amplifica-
tion technique and also when GABA was detected with
DAB and ChATwith BDHC. In contrast, Ford et al. [13] did
H.-G. Jia et al. / Brain Research 992 (2003) 205–219 217
not find neurons double-immunostained for glutamic acid
decarboxylase (GAD) and ChAT in the LDT/PPT of the rat.
They immunostained for GAD using BDHC and for ChAT
using DAB. Possible explanations for this discrepancy are
that different antibodies were used in the two studies (anti-
GABA vs. anti-GAD) and/or that the method employed by
Ford et al. was less sensitive. Colocalization of GABA and
ChAT has been described in cells in other regions of the
nervous system [3,4,6,7,12,25,38,48].
In electron microscopy studies, colocalization of GABA
and ChAT was found in axon terminals of the LDT/PPT. To
the best of our knowledge, this pattern of colocalization of
GABA and ChAT has been reported only in the rat inferior
olive [7] and in the cat striate cortex [4]. Because we
observed colocalization in cell bodies in the LDT/PPT, we
suggest that double-labeled terminals originate in local
somas, although there are GABAergic projections to the
LDT/PPT [25,39].
Double-labeled terminals formed symmetric and, occa-
sionally, asymmetric synapses with non-immunostained
dendrites. These dendrites are likely to contain glutamate,
enkephalin or monoamines, all of which have been reported
to be present in neurons in the LDT/PPT [2,29,54,55,56].
4.4. GABAergic synaptic input to cholinergic neurons
GABAergic terminals formed symmetric synaptic con-
tacts with approximately 40–50% of the cholinergic cell
bodies and dendrites. Over 95% of the GABAergic terminals
that contacted ChAT-IR profiles did not display ChAT-IR.
Because only 20–24% of the total number of GABAergic
terminals innervated cholinergic profiles, most of the
GABAergic terminals innervated non-cholinergic neurons.
Based on the high concentration of GABAergic neurons in
the LDT/PPT, most of the GABAergic axon terminals
probably arise from local neurons. However, it is also
possible that a portion of these GABAergic terminals orig-
inates from other regions, for example, the internal pallidum
and substantia nigra reticulata [11,37,42].
4.5. Functional implications
In the nervous system of the adult animal, GABA
functions as an inhibitory neurotransmitter [33]. Acetylcho-
line (ACh) can act either as an excitatory or as an inhibitory
neuromodulator, depending on the nature of the postsynaptic
receptor [22,24]. Therefore, the result of the concomitant
release of GABA and ACh in the synaptic cleft of any
particular synapse will depend on the nature of the postsyn-
aptic receptors [30]. If the postsynaptic neuron expresses
muscarinic inhibitory receptors and GABA receptors, the
result would be synergistic inhibition. If the receptors for
ACh mediate excitatory actions, a mixed effect would occur
with results that are difficult to predict. It is also possible that
different patterns of presynaptic discharge may act to release
only one or another of these neurotransmitters.
From a behavioral perspective, cholinergic neurons that
also contain GABA may be involved in the initiation of
active sleep and/or in other functions of the LDT/PPT, for
example, locomotion or cognition [15,43]. In light of the
present results, we hypothesize that in the initiation and/or
maintenance of active sleep, there is a GABAergic compo-
nent that acts synergistically with the well-established
cholinergic drive that generates active sleep.
Recently, we have determined that the injection of
muscimol, a GABA agonist, into the PPT induces active
sleep [50]; in addition, GABAergic neurons in the LDT/PPT
express c-fos during active sleep [29,49]. It has also been
reported that excitation during a period of hyperpolarized
membrane potential promotes a bursting pattern of dis-
charge in a portion of cholinergic and non-cholinergic
neurons within the LDT/PPT [28]. This bursting behavior
is due to the de-inactivation of a low-threshold calcium
inward current that occurs during hyperpolarization [28]. It
has been proposed that these bursting neurons are implicat-
ed in the generation of ponto-geniculo-occipital waves that
occur during active sleep [31].
It is therefore possible that, in spite of their hyperpolariz-
ing postsynaptic effect, GABA and ACh act in concert to
increase the responsiveness and alter the pattern of discharge
of cholinergic and non-cholinergic neurons of the LDT/PPT
that are involved in the initiation of active sleep. The finding
that terminals in the LDT/PPT contain both ACh and GABA
raises several questions regarding the pattern of postsynaptic
modulation of the activity of their target neurons as well as
the role of these colocalized substances in the control of the
states of active sleep and wakefulness.
Acknowledgements
This work was supported by the following grants from
the U.S. Public Health Service: MH43362, NS 09999,
NS23426, HL60296, AGO4307, and MH59284.
References
[1] P. Barbaresi, E. Manfrini, Glutamate decarboxylase-immunoreactive
neurons and terminals in the periaqueductal gray of the rat, Neuro-
science 28 (1988) 183–191.
[2] P. Barbaresi, G. Gazzanelli, M. Malatesta, Glutamate-positive neurons
and terminals in the cat periaqueductal gray matter (PAG): a light and
electron microscopic immunocytochemical study, J. Comp. Neurol.
383 (1997) 381–396.
[3] T. Bayraktar, J.F. Staiger, L. Acsady, C. Cozzari, T.F. Freund, K.
Zilles, Co-localization of vasoactive intestinal polypeptide, gamma-
aminobutyric acid and choline acetyltransferase in neocortical inter-
neurons of the adult rat, Brain Res. 757 (1997) 209–217.
[4] C. Beaulieu, P. Somogyi, Enrichment of cholinergic synaptic ter-
minals on GABAergic neurons and coexistence of immunoreactive
GABA and choline acetyltransferase in the same synaptic termi-
nals in the striate cortex of the cat, J. Comp. Neurol. 304 (1991)
666–680.
H.-G. Jia et al. / Brain Research 992 (2003) 205–219218
[5] M.E. Bickford, W.B. Carden, N.C. Patel, Two types of interneurons in
the cat visual thalamus are distinguished by morphology, synaptic
connections, and nitric oxide synthase content, J. Comp. Neurol.
413 (1999) 83–100.
[6] N. Brecha, D. Johnson, L. Peichl, H. Wassle, Cholinergic amacrine
cells of the rabbit retina contain glutamate decarboxylase and gamma-
aminobutyrate immunoreactivity, Proc. Natl. Acad. Sci. U. S. A. 85
(1988) 6187–6191.
[7] A.R. Caffe, R.K. Hawkins, C.I. De Zeeuw, Coexistence of choline
acetyltransferase and GABA in axon terminals in the dorsal cap of the
rat inferior olive, Brain Res. 724 (1996) 136–140.
[8] B.X. Chen, M.J. Szabolcs, A.Y. Matsushima, B.F. Erianger, A strat-
egy for immunohistochemical single enhancement by end-product
amplification, J. Histochem. Cytochem. 44 (1996) 819–824.
[9] F. Cicchetti, J. Vinet, T.G. Beach, A. Parent, Differential expression of
alpha-amino-3-hydroxy-5-methyl-4-isoxazolepropionate receptor
subunits by calretinin-immunoreactive neurons in the human striatum,
Neuroscience 93 (1999) 89–97.
[10] B.J. Ciliax, G.W. Drash, J.K. Staley, S. Haber, C.J. Mobley, G.W.
Miller, E.J. Mufson, D.C. Mash, A.I. Levey, Immunocytochemical
localization of the dopamine transporter in human brain, J. Comp.
Neurol. 409 (1999) 38–56.
[11] M. Crutcher, R. Turner, J. Perez, D. Rye, Relationship of the primate
pedunculopontine nucleus (PPN) to tegmental connections with the
internal pallidum (Gpi), Abstr. - Soc. Neurosci. 20 (1994) 334.
[12] M.S. Davidoff, W. Schulze, Coexistence of GABA- and choline ace-
tyltransferase (ChAT)-like immunoreactivity in the hypoglossal nu-
cleus of the rat, Histochemistry 89 (1988) 25–33.
[13] B. Ford, C.J. Holmes, L. Mainville, B.E. Jones, GABAergic neurons
in the rat pontomesencephalic tegmentum: codistribution with choli-
nergic and other tegmental neurons projecting to the posterior lateral
hypothalamus, J. Comp. Neurol. 363 (1995) 177–196.
[14] M. Fortin, A. Parent, Calretinin-immunoreactive neurons in primate
pedunculopontine and laterodorsal tegmental nuclei, Neuroscience 88
(1999) 535–547.
[15] E. Garcia-Rill, N. Kinjo, Y. Atsuta, Y. Ishikawa, M. Webber, R.
Skinner, Posterior midbrain induced locomotion, Brain Res. Bull.
24 (1990) 499–508.
[16] T. Honda, K. Semba, An ultrastructural study of cholinergic and non-
cholinergic neurons in the laterodorsal and pedunculopontine tegmen-
tal nuclei in the rat, Neuroscience 68 (1995) 837–853.
[17] H.G. Jia, Z.R. Rao, J.W. Shi, Evidence of gamma-aminobutyricaci-
dergic control over the catecholaminergic projection from the medulla
oblongata to the central nucleus of the amygdala, J. Comp. Neurol.
381 (1997) 262–281.
[18] H.G. Jia, A. Rustion, J. Valtschanoff, Metabotropic glutamate recep-
tors in superficial laminae of the rat dorsal horn, J. Comp. Neurol. 410
(1999) 627–642.
[19] B.E. Jones, Paradoxical sleep and its chemical/structural substrates in
the brain, Neuroscience 40 (1991) 637–656.
[20] B.E. Jones, A. Beaudet, Distribution of acetylcholine and catechol-
amine acetyltransferase and tyrosine hydroxylase immunohistochem-
ical study, J. Comp. Neurol. 261 (1987) 15–32.
[21] B.E. Jones, H.H. Webster, Neurotoxic lesions of the dorsolateral pon-
tomesencephalic tegmentum: cholinergic cell area in the cat: I. Effects
upon the cholinergic innervation of the brain, Brain Res. 451 (1988)
13–32.
[22] S. Jones, S. Sudweeks, J.L. Yakel, Nicotinic receptors in the brain:
correlating physiology with function, Trends Neurosci. 22 (1999)
555–561.
[23] Y. Kayama, M. Ohta, E. Jodo, Firing of ‘possibly’ cholinergic neu-
rons in the rat laterodorsal tegmental nucleus during sleep and wake-
fulness, Brain Res. 569 (1992) 210–220.
[24] P. Kofuji, N. Davidson, H.A. Lester, Evidence that neuronal G-pro-
tein-gated inwardly rectifying K+ channels are activated by G beta
gamma subunits and function as heteromultimers, Proc. Natl. Acad.
Sci. U. S. A. 92 (1995) 6542–6546.
[25] T. Kosaka, M. Tauchi, J.L. Dahl, Cholinergic neurons containing
GABA-like and/or glutamic acid decarboxylase-like immunoreactiv-
ities in various brain regions of the rat, Exp. Brain Res. 70 (1988)
605–617.
[26] A.I. Levey, J.P. Bolam, D.B. Rye, A.E. Hallanger, R.M. Demuth, M.
Mesulam, B.H. Wainer, A light and electron microscopic procedure
for sequential double antigen localization using diaminobenzidine and
benzidine dihydrochloride, J. Histochem. Cytochem. 34 (1986)
1449–1457.
[27] F. Loup, O. Weinmann, Y. Yonekawa, A. Aguzzi, H.G. Wieser, J.M.
Fritschy, A highly sensitive immunofluorescence procedure for ana-
lyzing the subcellular distribution of GABAA receptor subunits in the
human brain, J. Histochem. Cytochem. 46 (1998) 1129–1139.
[28] J.I. Luebke, R.W. McCarley, R.W. Greene, Inhibitory action of mus-
carinic agonists on neurons in the rat laterodorsal tegmental nucleus in
vitro, J. Neurophysiol. 70 (1993) 2128–2135.
[29] K.J. Maloney, L. Mainville, B.E. Jones, Differential c-Fos expression
in cholinergic, monoaminergic, and GABAergic cell groups of the
pontomesencephalic tegmentum after paradoxical sleep deprivation
and recovery, J. Neurosci. 19 (1999) 3057–3072.
[30] E. Marder, Neural signalling: does colocalization imply cotransmis-
sion? Curr. Biol. 9 (1999) 809–811.
[31] R.W. McCarley, R.W. Greene, D. Rainnie, C.M. Portas, Brainstem
neuromodulation and REM sleep, Semin. Neurosci. 7 (1995)
341–354.
[32] E. Mugnaini, W.H. Oretel, An atlas of the distribution of GABAergic
neurons and terminals, in: A. Bjorkund, T. Hokfelt (Eds.), Handbook
of Chemical Neuroanatomy, Vol. 4, GABA and Neuropeptides in the
CNS, Part I, Elsevier, Amsterdam, 1985, pp. 436–608.
[33] R.W. Olsen, T.M. DeLorey, R. Dingledine, C.J. McBain, Intercel-
lular signalling, in: G.J Siegel, B.W. Agranoff, R.W. Albers, S.K.
Fisher, M.D. Uhler (Eds.), Basic Neurochemistry: Molecular, Cel-
lular and Medical Aspects, Lippincott-Raven, Philadelphia, 1999,
pp. 191–400.
[34] K.D. Phend, R.J. Weinberg, A. Rustioni, Techniques to optimize post-
embedding single and double staining for amino acid neurotransmit-
ters, J. Histochem. Cytochem. 40 (1992) 1011–1020.
[35] D.B. Reichling, A.I. Basbaum, Contribution of brainstem GABAergic
circuitry to descending antinociceptive controls: I. GABA-immuno-
reactive projection neurons in the periaqueductal gray and nucleus
raphe magnus, J. Comp. Neurol. 302 (1990) 370–377.
[36] W.M. Renno, M.S. Mahmoud, A. Hamdi, A.J. Beitz, Quantitative
immunoelectron microscopic colocalization of GABA and enkephalin
in the ventrocaudal periaqueductal gray of the rat, Synapse 31 (1999)
216–228.
[37] D.B. Rye, H. Saper, H. Lee, B. Wainer, Pedunculopontine tegmental
nucleus of the rat: cytoarchitecture, cytochemistry, and some extra-
pyramidal connections of the mesopontine tegmentum, J. Comp. Neu-
rol. 259 (1987) 483–528.
[38] S. Safieddine, A.M. Prior, M. Eybalin, Choline acetyltransferase, glu-
tamate decarboxylase, tyrosine hydroxylase, calcitonin gene-related
peptide and opioid peptides coexist in lateral efferent neurons of rat
and guinea pig, Eur. J. Neurosci. 9 (1997) 356–367.
[39] K. Semba, H.C. Fibiger, Afferent connections of the laterodorsal and
the pedunculopontine tegmental nuclei in the rat: a retro- and antero-
frade transport and immunohistochemical study, J. Comp. Neurol. 323
(1992) 387–410.
[40] J.F. Smiley, A.I. Levey, M.M. Mesulam, m2 muscarinic receptor
immunolocalization in cholinergic cells of the monkey basal forebrain
and striatum, Neuroscience 90 (1999) 803–814.
[41] Y. Smith, J.P. Bolam, The output neurones and the dopaminergic neu-
rones of the substantia nigra receive a GABA-containing input from
the globus pallidus in the rat, J. Comp. Neurol. 296 (1990) 47–64.
[42] B.M. Spann, I. Grofova, Nigropedunculopontine projection in the rat:
an anterograde tracing study with phaseolus vulgaris-leucoagglutinin
(PHA-L), J. Comp. Neurol. 311 (1991) 375–388.
[43] T. Steckler, W. Inglis, P. Winn, A. Sahgal, The pedunculopontine
H.-G. Jia et al. / Brain Research 992 (2003) 205–219 219
tegmental nucleus: a role in cognitive processes? Brain Res. Rev. 19
(1994) 298–318.
[44] T.L. Steininger, B.H. Wainer, D.B. Rye, Ultrastructural study of chol-
inergic and noncholinergic neurons in the pars compacta of the rat
pedunculopontine tegmental nucleus, J. Comp. Neurol. 382 (1997)
285–301.
[45] M. Steriade, S. Datta, D. Pare, G. Oakson, R. Curro Dossi, Neuro-
nal activities in brain-stem cholinergic nuclei related to tonic acti-
vation processes in thalamocortical systems, J. Neurosci. 10 (1990)
2541–2559.
[46] M. Steriade, D. Pare, S. Datta, G. Oakson, R. Curro Dossi, Different
cellular types in mesopontine cholinergic nuclei related to ponto-gen-
iculo-occipital waves, J. Neurosci. 10 (1990) 2560–2579.
[47] E.L. Sutin, D.M. Jacobowitz, Immunocytochemical localization of
peptides and other neurochemicals in the rat laterodorsal tegmental
nucleus and adjacent area, J. Comp. Neurol. 270 (1988) 243–270.
[48] T. Tkatch, G. Baranauskas, D.J. Surmeier, Basal forebrain neurons
adjacent to the globus pallidus co-express GABAergic and choliner-
gic marker mRNAs, NeuroReport 9 (1998) 1935–1939.
[49] P. Torterolo, J. Yamuy, S. Sampogna, F.R. Morales, M.H. Chase,
GABAergic neurons of the laterodorsal and pedunculopontine teg-
mental nuclei of the cat express c-fos during carbachol-induced active
sleep, Brain Res. 892 (2001) 309–319.
[50] P. Torterolo, F.R. Morales, M.H. Chase, GABAergic mechanisms in
the pedunculopontine tegmental nucleus of the cat promote active
(REM) sleep, Brain Res. 944 (2002) 1–9.
[51] Y.M. Tsang, F. Chiong, D. Kuznetsov, E. Kasarskis, C. Geula, Motor
neurons are rich in non-phosphorylated neurofilaments: cross-species
comparison and alterations in ALS, Brain Res. 861 (2000) 45–58.
[52] J.G. Valtschanoff, R.J. Weinberg, A. Rustioni, Amino acid immu-
noreactivity in corticospinal terminals, Exp. Brain Res. 93 (1993)
95–103.
[53] G.S. Walsh, K.M. Krol, M.D. Kawaja, Absence of the p75 neuro-
trophin receptor alters the pattern of sympathosensory sprouting in the
trigeminal ganglia of mice overexpressing nerve growth factor,
J. Neurosci. 19 (1999) 258–273.
[54] Q.P. Wang, J.L. Guan, Y. Nadai, Immuno-electron microscopy of
enkephalinergic innervation of GABAergic neurons in the periaque-
ductal gray, Brain Res. 665 (1994) 39–46.
[55] H.H. Webster, B.E. Jones, Neurotoxic lesions of the dorsolateral
pontomesencephalic tegmentum: cholinergic cell area in the cat: II.
Effects upon sleep-waking states, Brain Res. 458 (1988) 285–302.
[56] F.G. Williams, A.J. Beitz, Ultrastructural morphometric analysis of
GABA-immunoreactive terminals in the ventrocaudal periaqueduc-
tal grey: analysis of the relationship of GABA terminals and the
GABAA receptor to periaqueductal grey-raphe magnus projection
neurons, J. Neurocytol. 19 (1990) 686–696.
[57] J. Yamuy, S. Sampogna, F.R. Morales, M.H. Chase, C-fos expression
in mesopontine noradrenergic and cholinergic neurons of the cat dur-
ing carbachol induced active sleep: a double-labeling study, Sleep
Res. Online 1 (1998) 28–40 (http://www.sro.org/1998/Yamuy/28/).