Lesion of the pedunculopontine tegmental nucleus in rat augments cortical activation and disturbs...
10
Lesion of the pedunculopontine tegmental nucleus in rat augments cortical activation and disturbs sleep/wake state transitions structure Jelena Petrovic a , Jelena Ciric a , Katarina Lazic a , Aleksandar Kalauzi b , Jasna Saponjic a, ⁎ a University of Belgrade, Department of Neurobiology, Institute for Biological Research, Sinisa Stankovic, 11 060 Belgrade, Serbia b University of Belgrade, Department for Life Sciences, Institute for Multidisciplinary Research, 11 030 Belgrade, Serbia abstract article info Article history: Received 23 November 2012 Revised 30 January 2013 Accepted 13 February 2013 Available online 26 February 2013 Keywords: Pedunculopontine tegmental nucleus Sleep–wake states Sleep–wake states transitions Electroencephalography Lesion Cholinergic neurons Ibotenic acid Rat The pedunculopontine tegmental nucleus (PPT) represents a major aggregation of cholinergic neurons in the mammalian brainstem, which is important in the generation and maintenance of REM sleep. We investigated the effects of unilateral and bilateral PPT lesions on sleep and all the conventional sleep-state related EEG frequency bands amplitudes, in an attempt to find the EEG markers for the onset and progression of PPT cholinergic neuronal degeneration. The experiments were performed on 35 adult male Wistar rats, chronically implanted for sleep recording. During the surgical procedure for EEG and EMG electrodes implantation, the unilateral or bilateral PPT lesion was pro- duced under ketamine/diazepam anesthesia, by the stereotaxically guided microinfusion of 100 nl 0.1 M ibotenic acid (IBO) into PPT. We applied Fourier analysis to signals acquired throughout 6 h of recordings, and each 10 s epoch was differentiated as a Wake, NREM or REM state. We also calculated the group probability den- sity estimates (PDE) of all Wake, NREM and REM conventional EEG frequency amplitudes, and the number of all the transition states using MATLAB 6.5. Our results show that the unilateral or bilateral PPT lesions did not change the sleep/wake architecture, but did change the sleep/wake state transitions structure and the sleep/state related “EEG microstructure”. Unilateral or bilateral PPT lesions sustainably increased Wake/REM and REM/Wake transitions from 14 to 35 days after lesions. This was followed by decreased NREM/REM and REM/NREM transitions from 28 days only in the case of the bilateral PPT lesion. The unilateral PPT lesion augmented both Wake theta and REM beta while it also attenuated the relative ampli- tude of the Wake delta frequency, with a delay of one week. Following a bilateral PPT lesion there was augmen- tation of the relative amplitude of the Wake, NREM, and REM beta and REM gamma frequency which occurred simultaneously to NREM and Wake delta attenuation. We have shown that the PPT cholinergic neuronal loss sustainably increased the number of the Wake/REM and REM/Wake transitions and augmented sleep-states related cortical activation that was simultaneously expressed by the high frequency amplitude augmentation, as well as Wake and NREM delta frequency attenuation. © 2013 Elsevier Inc. All rights reserved. Introduction The pedunculopontine tegmental nucleus (PPT) is postulated to have important functions relevant to the regulation of rapid eye move- ment sleep (REM) (Lu et al., 2006; McCarley and Hobson, 1975), arousal (Bringmann, 1995, 1997; Datta, 2002; Datta and MacLean, 2007; Datta and Siwek, 1997; Datta et al., 2001; Kleiner and Bringmann, 1996; Rye, 1997; Vertes, 1984), and various motor control systems (Inglis et al., 1994; Saper and Loewy, 1982; Takakusaki et al., 2004), including breathing control (Lydic and Baghdoyan, 1993; Radulovacki et al., 2004; Saponjic et al., 2003, 2005a, 2005b, 2006). It is also postulated that PPT is the high relay nucleus for overall REM sleep phenomenon control, and that each REM sleep event, executed by distinct cell groups within the brainstem, may be triggered and modulated by the activation of the PPT (Datta, 1995,1997; Garcia-Rill, 1991). Anatomical studies support the central role of the PPT in controlling the REM sleep phenomenon: each individual REM-sleep-sign generating nucleus receives afferent in- puts from PPT (Rye, 1997; Semba, 1993). The different regulatory functions of the PPT are reflected in electro- encephalographic (EEG/ECoG) or electromyographic (EMG) events and rhythms. For example, EEG desynchronization or gamma activity re- flects cortical activation (Maloney et al., 1997). The activation states of the mammalian neocortex, measured by electroencephalogram (EEG) or electrocorticogram (ECoG), are regulated by a complex interplay of cortical and subcortical networks. While slow EEG/ECoG oscillations (b 1 Hz) are present in neocortical isolated tissue, suggesting that intracortical networks are sufficient to maintain this type of deactivated Experimental Neurology 247 (2013) 562–571 ⁎ Corresponding author at: University of Belgrade, Department of Neurobiology, Institute for Biological Research, Sinisa Stankovic, Despot Stefan Blvd., 142, 11060 Belgrade, Serbia. Fax: +381 11 2761433. E-mail addresses: [email protected], [email protected] (J. Saponjic). 0014-4886/$ – see front matter © 2013 Elsevier Inc. All rights reserved. http://dx.doi.org/10.1016/j.expneurol.2013.02.007 Contents lists available at SciVerse ScienceDirect Experimental Neurology journal homepage: www.elsevier.com/locate/yexnr
-
Upload
independent -
Category
Documents
-
view
1 -
download
0
Transcript of Lesion of the pedunculopontine tegmental nucleus in rat augments cortical activation and disturbs...
Experimental Neurology 247 (2013) 562–571
Contents lists available at SciVerse ScienceDirect
Experimental Neurology
j ourna l homepage: www.e lsev ie r .com/ locate /yexnr
Lesion of the pedunculopontine tegmental nucleus in rat augments cortical activationand disturbs sleep/wake state transitions structure
Jelena Petrovic a, Jelena Ciric a, Katarina Lazic a, Aleksandar Kalauzi b, Jasna Saponjic a,⁎a University of Belgrade, Department of Neurobiology, Institute for Biological Research, Sinisa Stankovic, 11 060 Belgrade, Serbiab University of Belgrade, Department for Life Sciences, Institute for Multidisciplinary Research, 11 030 Belgrade, Serbia
⁎ Corresponding author at: University of Belgrade, Deparfor Biological Research, Sinisa Stankovic, Despot Stefan BlvFax: +381 11 2761433.
E-mail addresses: [email protected], jasnasapon
0014-4886/$ – see front matter © 2013 Elsevier Inc. Allhttp://dx.doi.org/10.1016/j.expneurol.2013.02.007
a b s t r a c t
a r t i c l e i n f oArticle history:Received 23 November 2012Revised 30 January 2013Accepted 13 February 2013Available online 26 February 2013
Keywords:Pedunculopontine tegmental nucleusSleep–wake statesSleep–wake states transitionsElectroencephalographyLesionCholinergic neuronsIbotenic acidRat
The pedunculopontine tegmental nucleus (PPT) represents a major aggregation of cholinergic neurons in themammalian brainstem, which is important in the generation and maintenance of REM sleep.We investigated the effects of unilateral and bilateral PPT lesions on sleep and all the conventional sleep-staterelated EEG frequency bands amplitudes, in an attempt to find the EEG markers for the onset and progressionof PPT cholinergic neuronal degeneration.The experimentswere performed on 35 adultmaleWistar rats, chronically implanted for sleep recording. Duringthe surgical procedure for EEG and EMG electrodes implantation, the unilateral or bilateral PPT lesion was pro-duced under ketamine/diazepam anesthesia, by the stereotaxically guided microinfusion of 100 nl 0.1 Mibotenic acid (IBO) into PPT. We applied Fourier analysis to signals acquired throughout 6 h of recordings, andeach 10 s epochwas differentiated as aWake, NREM or REM state.We also calculated the group probability den-sity estimates (PDE) of all Wake, NREM and REM conventional EEG frequency amplitudes, and the number of allthe transition states using MATLAB 6.5.Our results show that the unilateral or bilateral PPT lesions did not change the sleep/wake architecture, butdid change the sleep/wake state transitions structure and the sleep/state related “EEG microstructure”.Unilateral or bilateral PPT lesions sustainably increased Wake/REM and REM/Wake transitions from 14 to35 days after lesions. This was followed by decreased NREM/REM and REM/NREM transitions from 28 daysonly in the case of the bilateral PPT lesion.The unilateral PPT lesion augmented bothWake theta and REM beta while it also attenuated the relative ampli-tude of theWake delta frequency, with a delay of one week. Following a bilateral PPT lesion there was augmen-tation of the relative amplitude of the Wake, NREM, and REM beta and REM gamma frequency which occurredsimultaneously to NREM and Wake delta attenuation.We have shown that the PPT cholinergic neuronal loss sustainably increased the number of the Wake/REM andREM/Wake transitions and augmented sleep-states related cortical activation thatwas simultaneously expressedby the high frequency amplitude augmentation, as well as Wake and NREM delta frequency attenuation.
© 2013 Elsevier Inc. All rights reserved.
Introduction
The pedunculopontine tegmental nucleus (PPT) is postulated tohave important functions relevant to the regulation of rapid eye move-ment sleep (REM) (Lu et al., 2006;McCarley andHobson, 1975), arousal(Bringmann, 1995, 1997; Datta, 2002; Datta and MacLean, 2007; Dattaand Siwek, 1997; Datta et al., 2001; Kleiner and Bringmann, 1996;Rye, 1997; Vertes, 1984), and various motor control systems (Ingliset al., 1994; Saper and Loewy, 1982; Takakusaki et al., 2004), includingbreathing control (Lydic and Baghdoyan, 1993; Radulovacki et al., 2004;Saponjic et al., 2003, 2005a, 2005b, 2006). It is also postulated that PPT
tment of Neurobiology, Instituted., 142, 11060 Belgrade, Serbia.
[email protected] (J. Saponjic).
rights reserved.
is the high relay nucleus for overall REM sleep phenomenon control,and that each REM sleep event, executed by distinct cell groups withinthe brainstem,may be triggered andmodulated by the activation of thePPT (Datta, 1995,1997; Garcia-Rill, 1991). Anatomical studies supportthe central role of the PPT in controlling the REM sleep phenomenon:each individual REM-sleep-sign generating nucleus receives afferent in-puts from PPT (Rye, 1997; Semba, 1993).
The different regulatory functions of the PPT are reflected in electro-encephalographic (EEG/ECoG) or electromyographic (EMG) events andrhythms. For example, EEG desynchronization or gamma activity re-flects cortical activation (Maloney et al., 1997). The activation states ofthe mammalian neocortex, measured by electroencephalogram (EEG)or electrocorticogram (ECoG), are regulated by a complex interplay ofcortical and subcortical networks. While slow EEG/ECoG oscillations(b1 Hz) are present in neocortical isolated tissue, suggesting thatintracortical networks are sufficient tomaintain this type of deactivated
563J. Petrovic et al. / Experimental Neurology 247 (2013) 562–571
activity pattern (Dringenberg and Olmstead, 2003; Timofeev et al.,2000), the high-frequency oscillations within the beta and gammaranges are not present in the isolated cortex, which suggests a depen-dence on subcortical–cortical impulse flow.
Humandevelopment,maturation, healthy aging and numerous neu-rological diseases are associated with profound changes in sleep/wakestates distribution, and with a variety of sleep-related behavioral disor-ders. Sleep-related behavioral disorders very frequently go unnoticed inpatients with neurodegenerative diseases, and as a symptom, precedethe onset of motor and cognitive disturbances by years or even decades(Boeve et al., 2007; Simic et al., 2009;Whitwell et al., 2007). REMbehav-ioral disorders (RBD) in Alzheimer's and Parkinson's Disease (AD andPD) involve the selective loss of specific neuronal populations withinthe brain, and reflects an underlying synucleinopathywith the presenceof theα-synuclein protein pathology within the REM sleep-related reg-ulatory structures of the dorsal midbrain and pons at the onset of dis-ease, and with ascending pattern of neurodegeneration progressionfrom brainstem to basal areas of the brain (Raggi and Ferri, 2010;Simic et al., 2009; Whitwell et al., 2007).
The cholinergic afferent fibers system of the basal forebrain plays acritical role in switching cortical activity from deactivated slow to acti-vated high-frequency EEG/ECoG patterns (Dringenberg and Olmstead,2003). Inputs to the cortex originating in the thalamus constitute thesecond major system involved in regulation of cortical EEG/ECoG. Thethalamic local network, consisting of thalamic interneurons in the retic-ular nucleus (RT), and thalamocortical projection neurons, generatesspindle oscillations in the thalamocortical network, that are associatedwith reduced behavioral activation in early sleep stages, and block in-coming sensory information (Steriade, 2000, 2003). However, thalamicand RT lesions in rats and cats abolished spindles, even though high fre-quency activation was maintained (Buzsaki et al., 1988; Vanderwolfand Stewart, 1993). All the above mentioned experimental evidencesuggests that thalamic integrity is not essential to the occurrence of cor-tical activation, although it canmodulate the ability of other (e.g. cholin-ergic) systems to induce cortical activation. The rat thalamus receivescholinergic projections exclusively from the brainstem, with the excep-tion of the RT which receives cholinergic innervation from both thebasal forebrain as well as the mesopontine tegmentum (Williamset al., 1994).
Anatomical and electrophysiological studies have demonstratedthat the activating influences of the basal forebrain and thalamus areunder the powerful neuromodulatory control of the fibers from thediencephalon and the brainstem. While the dorsal pathway from thebrainstem innervates the thalamus, the ventral pathway ascendsthrough the subthalamus and the hypothalamus toward the basal fore-brain (Steriade, 2000). It has been shown that the cholinergic (PPT) andmonoaminergic (locus coeruleus — LC; dorsal raphe nucleus — DR)inputs from the brainstem to the thalamus suppress spindle oscillationsand facilitate thalamocortical transmission (Steriade, 2000). Also, thedirect projections from PPT reach both the basal forebrain and the thal-amus (Loiser and Semba, 1993), and therefore the PPT represents thecontrol relay nucleus for intergrated contributions of these two cholin-ergic systems to the regulation of cortical activation (Dringenberg andOlmstead, 2003; Sarter and Bruno, 2000).
This study aims to investigate the effects of unilateral and bilateralPPT lesions on sleep–wake states and all the conventional sleep-staterelated EEG frequency bands amplitudes, in an attempt to find the EEGmarkers for the onset and progression of PPT cholinergic neuronaldegeneration.
Material and methods
We performed the experiments on 35 adult, male Wistar rats,chronically instrumented for sleep recording, and randomly assignedto one of five experimental groups: physiological controls (n = 8),unilateral sham controls (n = 8), bilateral sham controls (n = 5),
unilaterally PPT lesioned rats (n = 7), and bilaterally PPT lesionedrats (n = 7).
Prior to surgery and consistently throughout the experimental pro-tocol, the animals weremaintained on a 12-hour light–dark cycle, andwere housed at 25 °C with free access to food andwater. Principles forthe care and use of laboratory animals in research were strictlyfollowed, in accordance with the Animal Care Committee of the Insti-tute for Biological Research, University of Belgrade, Serbia, and theseprinciples conformed to the recommendations given in the “Guidefor Care and Use of Laboratory Animals” (National Academy of Sci-ences Press, Washington, DC, 1996).
Surgical procedure
The surgical procedures employed for the chronic electrode implan-tation for sleep recording have previously been described (Carley andRadulovacki, 2003; Saponjic et al., 2007), and are outlined below. Weimplanted two epidural parietal stainless-steel screw electrodes forEEG cortical activity recording frommotor (A/P:+1.0; R/L: 2), and sen-sorimotor (A/P:−3.0; R/L: 2) cortex (Paxinos andWatson, 2005) underketamine/diazepam anesthesia (Zoletil 50, VIRBAC, France, 50 mg/kg;i.p). Bilateral electromyogram (EMG) wire electrodes were implantedinto the dorsal nuchal musculature to assess skeletal muscle activity.The referential stainless-steel screw electrode was implanted in thenasal bone. All electrode leads were soldered to a miniature connectorplug (39 F1401, Newark Electronics, Schaumburg, IL, USA), and the as-sembly was fixed to the screw electrodes and skull using acrylic dentalcement (Biocryl-RN, Galenika a.d. Beograd, Serbia).
During the operative procedure we performed, the unilateral or bi-lateral sham microinfusions of 0.1 M phosphate buffered saline (PBS),or the unilateral and bilateral PPT lesionswere induced by the stereotax-ically guided microinfusion of 0.1 M ibotenic acid (IBO)/0.1 M PBS uni-laterally or bilaterally into the PPT (A/P:−7.8; R/L: 1.9; D/V: 7 from thebrain surface), using a Digital Lab Standard Stereotaxic Instrument witha Quintessential Stereotaxic Injector (Stoelting Co, Wood Dale, IL, USA),and aHamilton syringe (1 μl). The IBO (Sigma; pH = 7.4) concentrationwas chosen on the basis of previous studies (Inglis and Semba, 1997).The microinfusions were introduced at a volume of 100 nl, using a sin-gle, 60 s pulse. Following microinfusion the Hamilton syringe was leftwithin the local brain tissue for 5 min, before removal from the brain,allowing the solution to diffuse within the PPT.
Recording procedure
At the end of the surgical procedure, the scalp wounds were suturedand the rats were given a recovery period of 2 weeks before adapting tothe recording cable and plexiglass chamber (30 cm × 30 cm × 30 cm)for one day. EEG and EMG activities were carried from the connectorplug on the rat head by cable, and passed through the sealed port ofthe recording box. They were displayed on a computer monitor, andstored on disk for further off-line analysis. After conventional amplifica-tion and filtering (0.3–100 Hz band pass; A-M System Inc. Model 3600,Carlborg, WA, USA), the analog data were digitized (at a sampling fre-quency of 256/s), and recorded for 6 h, during the normal inactive circa-dian phase for rats (from 9 a.m. to 3 p.m.), using DataWave SciWorksExperimenter Verson 7.2 (Datawave Technologies, Longmont, CO,USA). Each rat was recorded weekly, for 5 weeks.
Tissue processing and histochemistry
At the end of the recording sessions the PPT lesion was identified byNADPH-diaphorase histochemistry (Datta et al., 2001; Paxinos et al.,2009; Sabbatini et al., 1999; Vincent, 1992; Vincent et al., 1983). Therats were deeply anesthetized and perfused transcardially, starting witha vascular rinse until the liver had been cleared (200 ml of 0.9% saline;perfusion speed of 40 ml/min); followed by a 4% paraformaldehyde
564 J. Petrovic et al. / Experimental Neurology 247 (2013) 562–571
solution in 0.1 M PBS (200 ml; 100 ml at 40 ml/min, and then30 ml/min), and finally with the 10% sucrose solution in 0.1 M PBS(200 ml; 30 ml/min). The animals were sacrificed and the brains wereextracted, cleared of the meninges and blood vessels, and immersedin 4% paraformaldehyde overnight, and then in 30% sucrose solutionfor several days. The brains were then cut in a transverse plane into40 μm-thick sections using a cryotome. The free-floating sectionswere stained,mounted, and coverslippedwith DPX (Sigma), and exam-ined under a Zeiss Axiovertmicroscope equippedwith a camera. Briefly,the free floating sections were rinsed in 0.1 M PBS pH = 7.4, and incu-bated for 1 h at 37 °C in the staining solution — a mixture of the sub-strate solution with β-nicotinamide adenine dinucleotide phosphate,reduced-Na4 salt (β-NADPH, Serva), and dimethyl sulfoxide (DMSO,Sigma). The substrate solution contained dissolved nitro blue tetrazoli-um chloride (NBT, Serva), and 5bromo-4chloro-3indolyl phosphate(BCIP, Serva) in the substrate buffer with pH = 9.5 (0.1 M Tris100 mM NaCl, 5 mM MgCl2). To reduce the background staining com-ing from endogenous alkaline phosphatase, the specific inhibitor le-vamisole (Sigma) was added to the staining solution to produce afinal concentration of 2 mM.
We quantified the PPT cholinergic cell loss using Image J 1.46 soft-ware. NADPH-diaphorase positive cells were counted in three 40 μmthick coronal sections of each brain within an overall rostro-caudalPPT dimension.We used the tissue samples of the physiological controlgroup (n = 18), as well as the unilaterally (n = 8), and bilaterally(n = 7) PPT lesioned rats, and these were grouped in three stereotaxicranges posterior to bregma (Paxinos and Watson, 2005): 6.90–7.40;7.50–8.00; and 8.10–8.60. The number of identified neurons wasintended to provide an estimate of the lesion damage rather than an at-tempt to determine the absolute numbers of cholinergic neuronswithinthe PPT. All statistical analyses for the PPT cholinergic cells numberchanges were done using nonparametric single factor Kruskal–WallisANOVA with post-hoc Mann–Whitney U two-tailed tests. There wasno statistically significant difference in the mean absolute number ofthe cholinergic cells of each control PPT side of the physiological con-trols (n = 10) versus control PPT side of the unilaterally lesioned rats(n = 8), and in all three stereotaxically defined ranges (χ2 ≥ 1.16,p ≥ 0.25). As a result, the cholinergic neuronal loss within the unilater-ally lesioned PPT (right PPT) or within each PPT side of bilaterally le-sioned rats, was expressed as % of the absolute mean number of thepooled control PPT sections sample (n = 18) in each defined stereotax-ic range. The control absolute mean numbers of the PPT cholinergicneurons taken as 100% were: 54.83 ± 9.40 (for the 6.90–7.40 range);75.44 ± 12.60 (for the 7.50–8.00 range); and 89.29 ± 15.32 (for the8.10–8.60 range). The cholinergic neuronal loss of the unilateral or
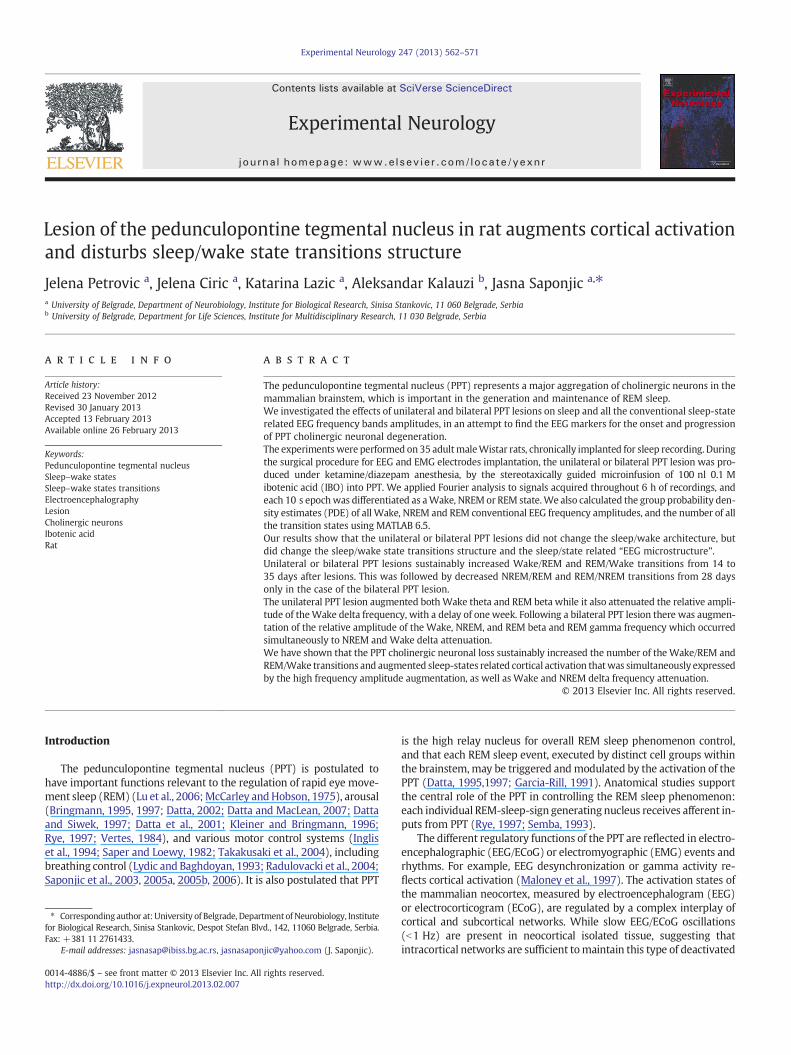
Fig. 1. Typical scattergrams of the 10 s sleep/wake states differentiation during 6 h of sleep recoNREM and REM epochs (B). Each symbol corresponds to one 10 s epoch. Differentiationwas acdifferentiation results. W (dot) — wake; S (star) — sleep; NR (circle) — NREM; R (cross) — REM
bilateral PPT lesion was also expressed as the percent difference ofNADPH-diaphorase positive cells versus the control PPT side for eachrat in each stereotaxic coordinate. In addition, the mean percent differ-ence for each experimental group (froma sample of the sections in eachstereotaxic range)were calculated to determine the approximate site ofthe highest % of cholinergic neuronal loss.
Data analysis
We included the signals recorded from the control rats and all ratswith positively identified unilateral or bilateral PPT lesions in the dataanalysis. Analysis of the recorded signals was conducted with soft-ware we developed using MATLAB 6.5. We applied Fourier analysisto signals acquired throughout each 6-hour recording (2160 10 sFourier epochs), and each 10 s epoch was differentiated as Wake,NREM or REM state for further analysis of the Wake, NREM and REM re-lated EEG amplitudes of all the conventional frequency bands (δ = 0.3–4 Hz; θ = 4.1–8 Hz; σ = 10.1–15 Hz; β = 15.1–30 Hz; γ = 30.1–50 Hz) of the control and PPT lesioned rats. First, we extracted all the10 s Wake epochs from each 6 h recording, based on the product ofsigma and theta frequency powers on the y-axis, and the EMG poweron the x-axis. Further, the differentiation of NREM and REM 10 s epochswas done using the EMG power on the y-axis, and the delta/thetapower ratio on the x-axis. Typical scattergrams of the sleep/wake statedifferentiation are depicted in Fig. 1.
To analyze the sleep/wake state related EEG amplitude changeswecalculated group probability density distributions of all the Wake,NREM and REM conventional EEG frequency bands' relative ampli-tudes over 6 h, for each experimental group, using the ProbabilityDensity Estimate (PDE) routine supplied with MATLAB 6.5. In orderto eliminate any influence from absolute signal amplitude variationson the recordings, we computed the relative Fourier amplitudes:
RAð Þb ¼∑bAmp
∑tot
Amp; b ¼ δ; θ;σ ;β;γf g:
For each sleep/wake state and each frequency band PDE analysis wasperformed on the ensembles of relative amplitudes by pooling measuredvalues (RA)b from all animals belonging to a specific group (the physio-logical control group, and the unilateral or bilateral PPT lesion groups).
More precisely, let the number of recorded animals be Nc (control),Nu (unilateral) and Nb (bilateral lesion). Further, let nc,j(W), nc,j(NREM)
and nc,j(REM) denote the number of identified Wake, NREM and REMepochs, respectively, for the jth control animal. Group ensemble
rding: the differentiation of theWake epochs from Sleep epochs (A); the differentiation ofhieved using two cluster K-means algorithm. Logarithmic valueswere used to improve the.
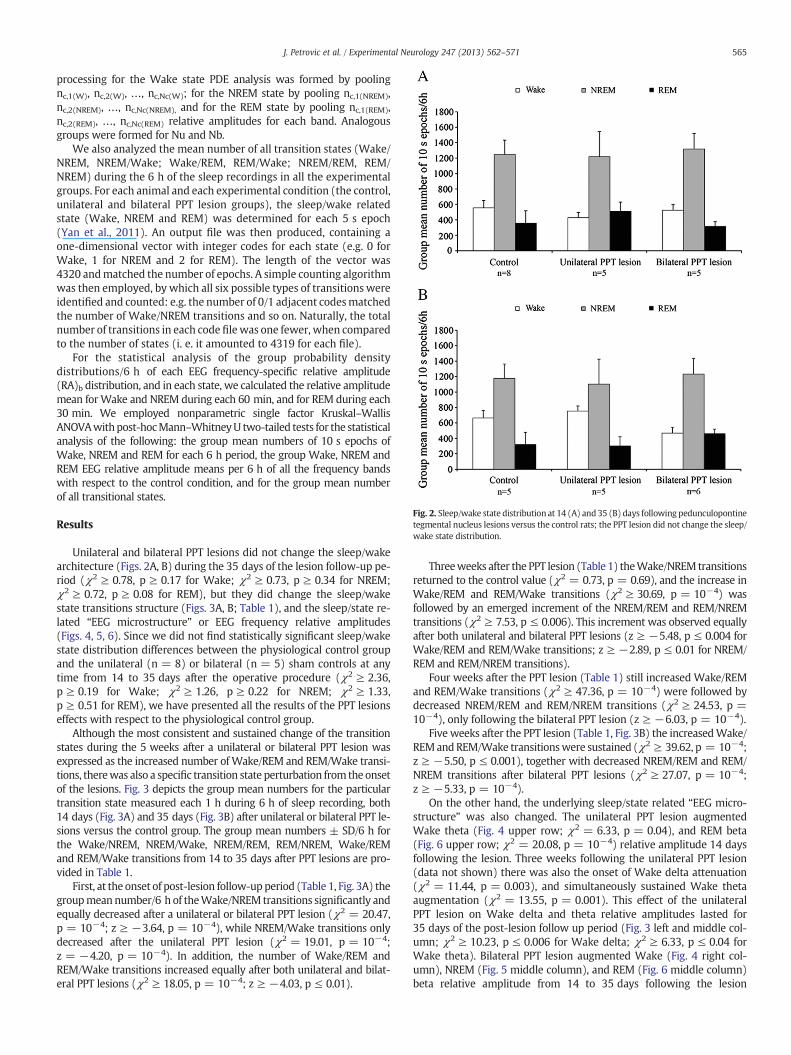
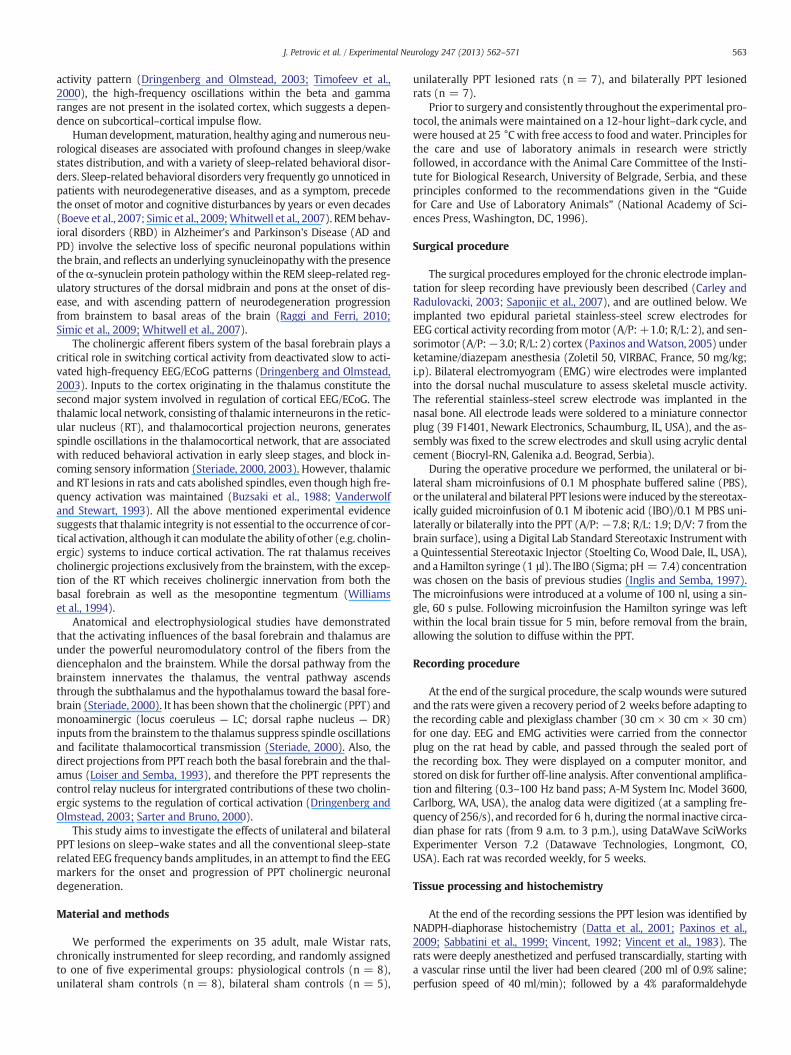
Fig. 2. Sleep/wake state distribution at 14 (A) and 35 (B) days following pedunculopontinetegmental nucleus lesions versus the control rats; the PPT lesion did not change the sleep/wake state distribution.
565J. Petrovic et al. / Experimental Neurology 247 (2013) 562–571
processing for the Wake state PDE analysis was formed by poolingnc,1(W), nc,2(W), …, nc,Nc(W); for the NREM state by pooling nc,1(NREM),nc,2(NREM), …, nc,Nc(NREM), and for the REM state by pooling nc,1(REM),nc,2(REM), …, nc,Nc(REM) relative amplitudes for each band. Analogousgroups were formed for Nu and Nb.
We also analyzed the mean number of all transition states (Wake/NREM, NREM/Wake; Wake/REM, REM/Wake; NREM/REM, REM/NREM) during the 6 h of the sleep recordings in all the experimentalgroups. For each animal and each experimental condition (the control,unilateral and bilateral PPT lesion groups), the sleep/wake relatedstate (Wake, NREM and REM) was determined for each 5 s epoch(Yan et al., 2011). An output file was then produced, containing aone-dimensional vector with integer codes for each state (e.g. 0 forWake, 1 for NREM and 2 for REM). The length of the vector was4320 andmatched the number of epochs. A simple counting algorithmwas then employed, by which all six possible types of transitions wereidentified and counted: e.g. the number of 0/1 adjacent codesmatchedthe number of Wake/NREM transitions and so on. Naturally, the totalnumber of transitions in each code file was one fewer, when comparedto the number of states (i. e. it amounted to 4319 for each file).
For the statistical analysis of the group probability densitydistributions/6 h of each EEG frequency-specific relative amplitude(RA)b distribution, and in each state, we calculated the relative amplitudemean forWake and NREM during each 60 min, and for REM during each30 min. We employed nonparametric single factor Kruskal–WallisANOVAwithpost-hocMann–WhitneyU two-tailed tests for the statisticalanalysis of the following: the group mean numbers of 10 s epochs ofWake, NREM and REM for each 6 h period, the group Wake, NREM andREM EEG relative amplitude means per 6 h of all the frequency bandswith respect to the control condition, and for the group mean numberof all transitional states.
Results
Unilateral and bilateral PPT lesions did not change the sleep/wakearchitecture (Figs. 2A, B) during the 35 days of the lesion follow-up pe-riod (χ2 ≥ 0.78, p ≥ 0.17 for Wake; χ2 ≥ 0.73, p ≥ 0.34 for NREM;χ2 ≥ 0.72, p ≥ 0.08 for REM), but they did change the sleep/wakestate transitions structure (Figs. 3A, B; Table 1), and the sleep/state re-lated “EEG microstructure” or EEG frequency relative amplitudes(Figs. 4, 5, 6). Since we did not find statistically significant sleep/wakestate distribution differences between the physiological control groupand the unilateral (n = 8) or bilateral (n = 5) sham controls at anytime from 14 to 35 days after the operative procedure (χ2 ≥ 2.36,p ≥ 0.19 for Wake; χ2 ≥ 1.26, p ≥ 0.22 for NREM; χ2 ≥ 1.33,p ≥ 0.51 for REM), we have presented all the results of the PPT lesionseffects with respect to the physiological control group.
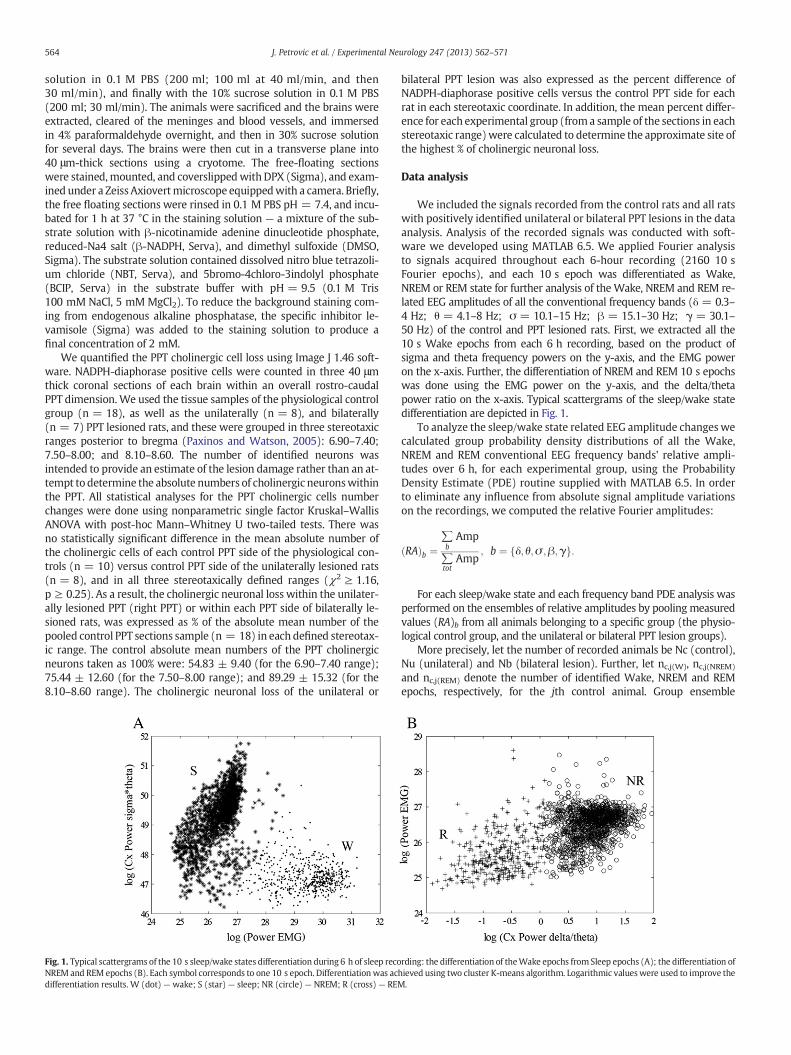
Although the most consistent and sustained change of the transitionstates during the 5 weeks after a unilateral or bilateral PPT lesion wasexpressed as the increased number ofWake/REM and REM/Wake transi-tions, therewas also a specific transition state perturbation from the onsetof the lesions. Fig. 3 depicts the group mean numbers for the particulartransition state measured each 1 h during 6 h of sleep recording, both14 days (Fig. 3A) and 35 days (Fig. 3B) after unilateral or bilateral PPT le-sions versus the control group. The group mean numbers ± SD/6 h forthe Wake/NREM, NREM/Wake, NREM/REM, REM/NREM, Wake/REMand REM/Wake transitions from 14 to 35 days after PPT lesions are pro-vided in Table 1.
First, at the onset of post-lesion follow-upperiod (Table 1, Fig. 3A) thegroupmeannumber/6 h of theWake/NREM transitions significantly andequally decreased after a unilateral or bilateral PPT lesion (χ2 = 20.47,p = 10−4; z ≥ −3.64, p = 10−4), while NREM/Wake transitions onlydecreased after the unilateral PPT lesion (χ2 = 19.01, p = 10−4;z = −4.20, p = 10−4). In addition, the number of Wake/REM andREM/Wake transitions increased equally after both unilateral and bilat-eral PPT lesions (χ2 ≥ 18.05, p = 10−4; z ≥ −4.03, p ≤ 0.01).
Threeweeks after the PPT lesion (Table 1) theWake/NREM transitionsreturned to the control value (χ2 = 0.73, p = 0.69), and the increase inWake/REM and REM/Wake transitions (χ2 ≥ 30.69, p = 10−4) wasfollowed by an emerged increment of the NREM/REM and REM/NREMtransitions (χ2 ≥ 7.53, p ≤ 0.006). This increment was observed equallyafter both unilateral and bilateral PPT lesions (z ≥ −5.48, p ≤ 0.004 forWake/REM and REM/Wake transitions; z ≥ −2.89, p ≤ 0.01 for NREM/REM and REM/NREM transitions).
Four weeks after the PPT lesion (Table 1) still increased Wake/REMand REM/Wake transitions (χ2 ≥ 47.36, p = 10−4) were followed bydecreased NREM/REM and REM/NREM transitions (χ2 ≥ 24.53, p =10−4), only following the bilateral PPT lesion (z ≥ −6.03, p = 10−4).
Five weeks after the PPT lesion (Table 1, Fig. 3B) the increasedWake/REMandREM/Wake transitionswere sustained (χ2 ≥ 39.62, p = 10−4;z ≥ −5.50, p ≤ 0.001), together with decreased NREM/REM and REM/NREM transitions after bilateral PPT lesions (χ2 ≥ 27.07, p = 10−4;z ≥ −5.33, p = 10−4).
On the other hand, the underlying sleep/state related “EEG micro-structure” was also changed. The unilateral PPT lesion augmentedWake theta (Fig. 4 upper row; χ2 = 6.33, p = 0.04), and REM beta(Fig. 6 upper row; χ2 = 20.08, p = 10−4) relative amplitude 14 daysfollowing the lesion. Three weeks following the unilateral PPT lesion(data not shown) there was also the onset of Wake delta attenuation(χ2 = 11.44, p = 0.003), and simultaneously sustained Wake thetaaugmentation (χ2 = 13.55, p = 0.001). This effect of the unilateralPPT lesion on Wake delta and theta relative amplitudes lasted for35 days of the post-lesion follow up period (Fig. 3 left and middle col-umn; χ2 ≥ 10.23, p ≤ 0.006 for Wake delta; χ2 ≥ 6.33, p ≤ 0.04 forWake theta). Bilateral PPT lesion augmented Wake (Fig. 4 right col-umn), NREM (Fig. 5 middle column), and REM (Fig. 6 middle column)beta relative amplitude from 14 to 35 days following the lesion
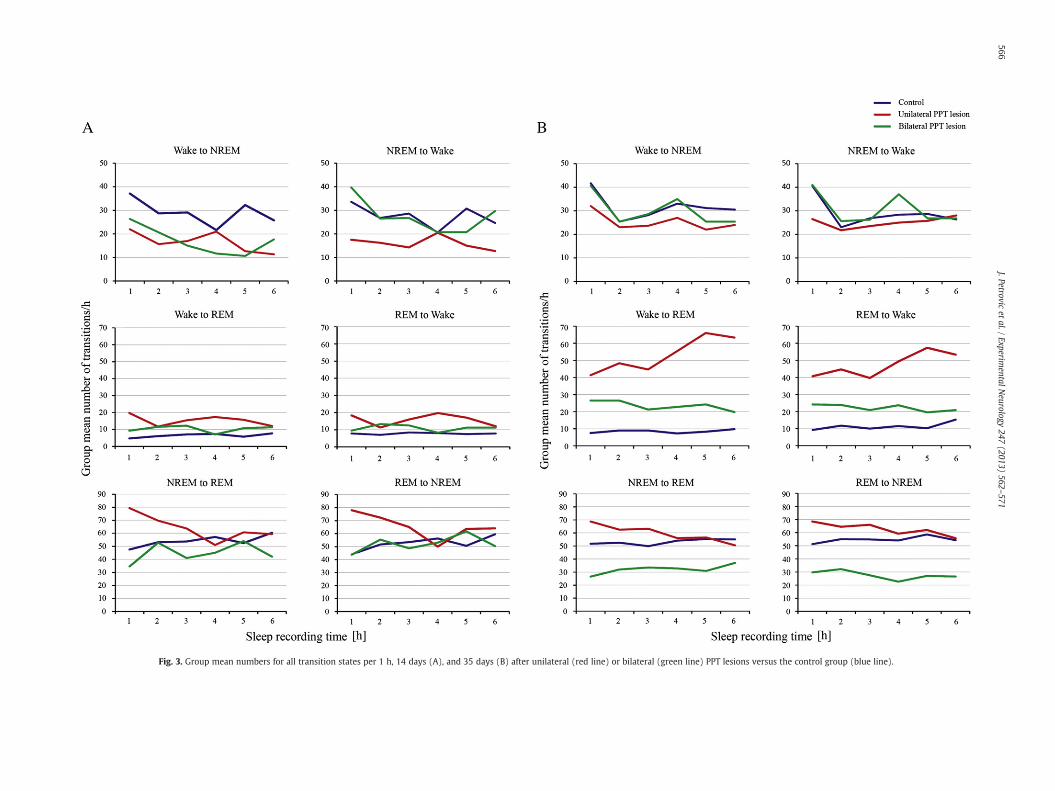
Fig. 3. Group mean numbers for all transition states per 1 h, 14 days (A), and 35 days (B) after unilateral (red line) or bilateral (green line) PPT lesions versus the control group (blue line).
566J.Petrovic
etal./
ExperimentalN
eurology247
(2013)562
–571
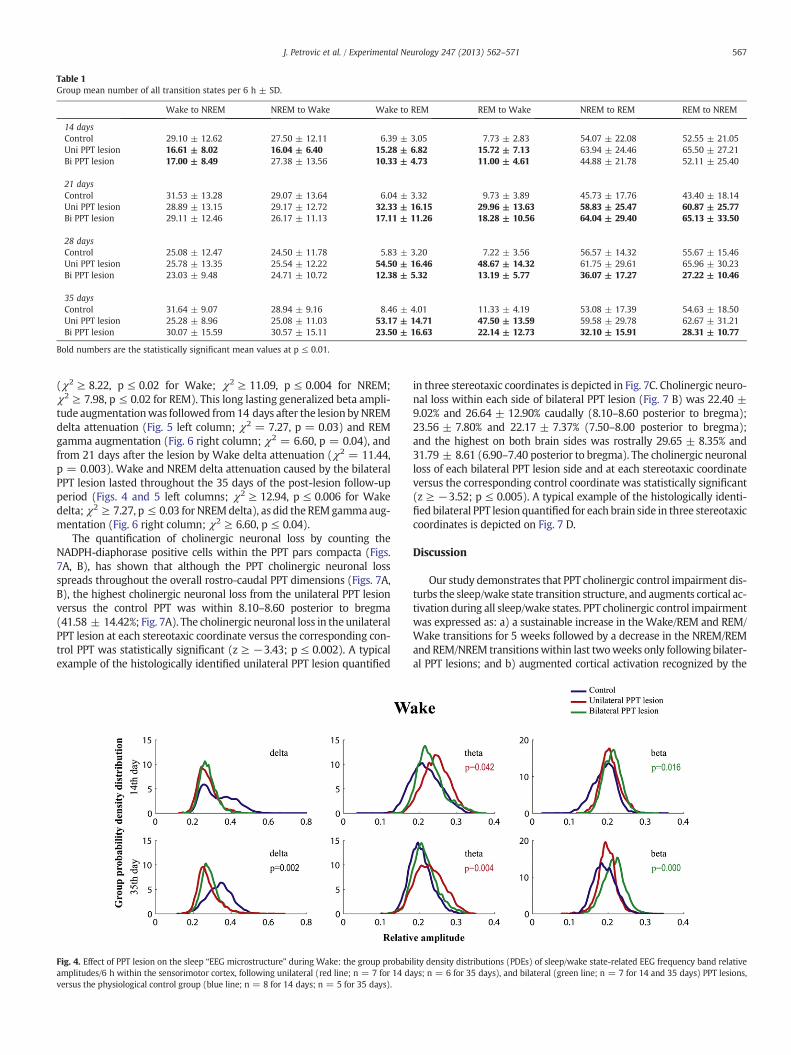
Table 1Group mean number of all transition states per 6 h ± SD.
Wake to NREM NREM to Wake Wake to REM REM to Wake NREM to REM REM to NREM
14 daysControl 29.10 ± 12.62 27.50 ± 12.11 6.39 ± 3.05 7.73 ± 2.83 54.07 ± 22.08 52.55 ± 21.05Uni PPT lesion 16.61 ± 8.02 16.04 ± 6.40 15.28 ± 6.82 15.72 ± 7.13 63.94 ± 24.46 65.50 ± 27.21Bi PPT lesion 17.00 ± 8.49 27.38 ± 13.56 10.33 ± 4.73 11.00 ± 4.61 44.88 ± 21.78 52.11 ± 25.40
21 daysControl 31.53 ± 13.28 29.07 ± 13.64 6.04 ± 3.32 9.73 ± 3.89 45.73 ± 17.76 43.40 ± 18.14Uni PPT lesion 28.89 ± 13.15 29.17 ± 12.72 32.33 ± 16.15 29.96 ± 13.63 58.83 ± 25.47 60.87 ± 25.77Bi PPT lesion 29.11 ± 12.46 26.17 ± 11.13 17.11 ± 11.26 18.28 ± 10.56 64.04 ± 29.40 65.13 ± 33.50
28 daysControl 25.08 ± 12.47 24.50 ± 11.78 5.83 ± 3.20 7.22 ± 3.56 56.57 ± 14.32 55.67 ± 15.46Uni PPT lesion 25.78 ± 13.35 25.54 ± 12.22 54.50 ± 16.46 48.67 ± 14.32 61.75 ± 29.61 65.96 ± 30.23Bi PPT lesion 23.03 ± 9.48 24.71 ± 10.72 12.38 ± 5.32 13.19 ± 5.77 36.07 ± 17.27 27.22 ± 10.46
35 daysControl 31.64 ± 9.07 28.94 ± 9.16 8.46 ± 4.01 11.33 ± 4.19 53.08 ± 17.39 54.63 ± 18.50Uni PPT lesion 25.28 ± 8.96 25.08 ± 11.03 53.17 ± 14.71 47.50 ± 13.59 59.58 ± 29.78 62.67 ± 31.21Bi PPT lesion 30.07 ± 15.59 30.57 ± 15.11 23.50 ± 16.63 22.14 ± 12.73 32.10 ± 15.91 28.31 ± 10.77
Bold numbers are the statistically significant mean values at p ≤ 0.01.
567J. Petrovic et al. / Experimental Neurology 247 (2013) 562–571
(χ2 ≥ 8.22, p ≤ 0.02 for Wake; χ2 ≥ 11.09, p ≤ 0.004 for NREM;χ2 ≥ 7.98, p ≤ 0.02 for REM). This long lasting generalized beta ampli-tude augmentationwas followed from14 days after the lesion byNREMdelta attenuation (Fig. 5 left column; χ2 = 7.27, p = 0.03) and REMgamma augmentation (Fig. 6 right column; χ2 = 6.60, p = 0.04), andfrom 21 days after the lesion by Wake delta attenuation (χ2 = 11.44,p = 0.003). Wake and NREM delta attenuation caused by the bilateralPPT lesion lasted throughout the 35 days of the post-lesion follow-upperiod (Figs. 4 and 5 left columns; χ2 ≥ 12.94, p ≤ 0.006 for Wakedelta;χ2 ≥ 7.27, p ≤ 0.03 for NREMdelta), as did the REMgammaaug-mentation (Fig. 6 right column; χ2 ≥ 6.60, p ≤ 0.04).
The quantification of cholinergic neuronal loss by counting theNADPH-diaphorase positive cells within the PPT pars compacta (Figs.7A, B), has shown that although the PPT cholinergic neuronal lossspreads throughout the overall rostro-caudal PPT dimensions (Figs. 7A,B), the highest cholinergic neuronal loss from the unilateral PPT lesionversus the control PPT was within 8.10–8.60 posterior to bregma(41.58 ± 14.42%; Fig. 7A). The cholinergic neuronal loss in theunilateralPPT lesion at each stereotaxic coordinate versus the corresponding con-trol PPT was statistically significant (z ≥ −3.43; p ≤ 0.002). A typicalexample of the histologically identified unilateral PPT lesion quantified
Fig. 4. Effect of PPT lesion on the sleep “EEG microstructure” during Wake: the group probabiamplitudes/6 h within the sensorimotor cortex, following unilateral (red line; n = 7 for 14 daversus the physiological control group (blue line; n = 8 for 14 days; n = 5 for 35 days).
in three stereotaxic coordinates is depicted in Fig. 7C. Cholinergic neuro-nal loss within each side of bilateral PPT lesion (Fig. 7 B) was 22.40 ±9.02% and 26.64 ± 12.90% caudally (8.10–8.60 posterior to bregma);23.56 ± 7.80% and 22.17 ± 7.37% (7.50–8.00 posterior to bregma);and the highest on both brain sides was rostrally 29.65 ± 8.35% and31.79 ± 8.61 (6.90–7.40 posterior to bregma). The cholinergic neuronalloss of each bilateral PPT lesion side and at each stereotaxic coordinateversus the corresponding control coordinate was statistically significant(z ≥ −3.52; p ≤ 0.005). A typical example of the histologically identi-fied bilateral PPT lesion quantified for each brain side in three stereotaxiccoordinates is depicted on Fig. 7 D.
Discussion
Our study demonstrates that PPT cholinergic control impairment dis-turbs the sleep/wake state transition structure, and augments cortical ac-tivation during all sleep/wake states. PPT cholinergic control impairmentwas expressed as: a) a sustainable increase in the Wake/REM and REM/Wake transitions for 5 weeks followed by a decrease in the NREM/REMandREM/NREM transitionswithin last twoweeks only following bilater-al PPT lesions; and b) augmented cortical activation recognized by the
lity density distributions (PDEs) of sleep/wake state-related EEG frequency band relativeys; n = 6 for 35 days), and bilateral (green line; n = 7 for 14 and 35 days) PPT lesions,
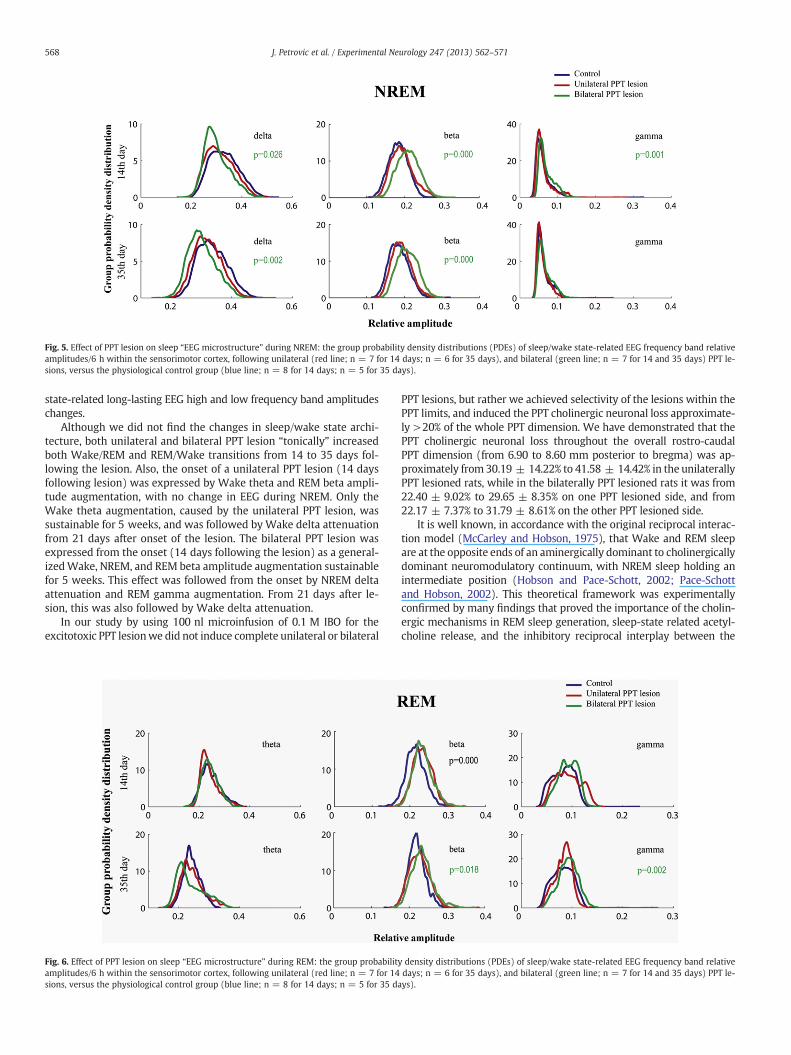
Fig. 5. Effect of PPT lesion on sleep “EEG microstructure” during NREM: the group probability density distributions (PDEs) of sleep/wake state-related EEG frequency band relativeamplitudes/6 h within the sensorimotor cortex, following unilateral (red line; n = 7 for 14 days; n = 6 for 35 days), and bilateral (green line; n = 7 for 14 and 35 days) PPT le-sions, versus the physiological control group (blue line; n = 8 for 14 days; n = 5 for 35 days).
568 J. Petrovic et al. / Experimental Neurology 247 (2013) 562–571
state-related long-lasting EEG high and low frequency band amplitudeschanges.
Although we did not find the changes in sleep/wake state archi-tecture, both unilateral and bilateral PPT lesion “tonically” increasedboth Wake/REM and REM/Wake transitions from 14 to 35 days fol-lowing the lesion. Also, the onset of a unilateral PPT lesion (14 daysfollowing lesion) was expressed by Wake theta and REM beta ampli-tude augmentation, with no change in EEG during NREM. Only theWake theta augmentation, caused by the unilateral PPT lesion, wassustainable for 5 weeks, and was followed by Wake delta attenuationfrom 21 days after onset of the lesion. The bilateral PPT lesion wasexpressed from the onset (14 days following the lesion) as a general-izedWake, NREM, and REM beta amplitude augmentation sustainablefor 5 weeks. This effect was followed from the onset by NREM deltaattenuation and REM gamma augmentation. From 21 days after le-sion, this was also followed by Wake delta attenuation.
In our study by using 100 nl microinfusion of 0.1 M IBO for theexcitotoxic PPT lesionwe did not induce complete unilateral or bilateral
Fig. 6. Effect of PPT lesion on sleep “EEG microstructure” during REM: the group probabilitamplitudes/6 h within the sensorimotor cortex, following unilateral (red line; n = 7 for 14sions, versus the physiological control group (blue line; n = 8 for 14 days; n = 5 for 35 da
PPT lesions, but rather we achieved selectivity of the lesions within thePPT limits, and induced the PPT cholinergic neuronal loss approximate-ly >20% of the whole PPT dimension. We have demonstrated that thePPT cholinergic neuronal loss throughout the overall rostro-caudalPPT dimension (from 6.90 to 8.60 mm posterior to bregma) was ap-proximately from 30.19 ± 14.22% to 41.58 ± 14.42% in the unilaterallyPPT lesioned rats, while in the bilaterally PPT lesioned rats it was from22.40 ± 9.02% to 29.65 ± 8.35% on one PPT lesioned side, and from22.17 ± 7.37% to 31.79 ± 8.61% on the other PPT lesioned side.
It is well known, in accordance with the original reciprocal interac-tion model (McCarley and Hobson, 1975), that Wake and REM sleepare at the opposite ends of an aminergically dominant to cholinergicallydominant neuromodulatory continuum, with NREM sleep holding anintermediate position (Hobson and Pace-Schott, 2002; Pace-Schottand Hobson, 2002). This theoretical framework was experimentallyconfirmed by many findings that proved the importance of the cholin-ergic mechanisms in REM sleep generation, sleep-state related acetyl-choline release, and the inhibitory reciprocal interplay between the
y density distributions (PDEs) of sleep/wake state-related EEG frequency band relativedays; n = 6 for 35 days), and bilateral (green line; n = 7 for 14 and 35 days) PPT le-ys).
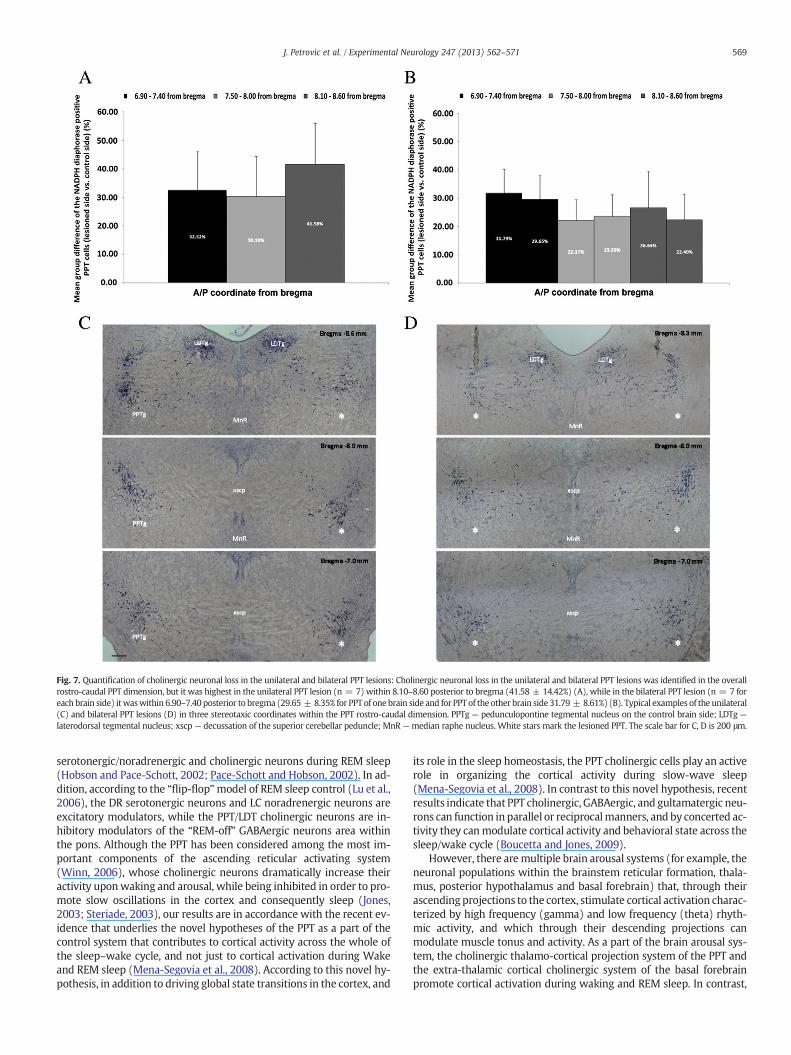
Fig. 7. Quantification of cholinergic neuronal loss in the unilateral and bilateral PPT lesions: Cholinergic neuronal loss in the unilateral and bilateral PPT lesions was identified in the overallrostro-caudal PPT dimension, but it was highest in the unilateral PPT lesion (n = 7) within 8.10–8.60 posterior to bregma (41.58 ± 14.42%) (A), while in the bilateral PPT lesion (n = 7 foreach brain side) itwaswithin 6.90–7.40 posterior to bregma (29.65 ± 8.35% for PPT of one brain side and for PPT of the other brain side 31.79 ± 8.61%) (B). Typical examples of the unilateral(C) and bilateral PPT lesions (D) in three stereotaxic coordinates within the PPT rostro-caudal dimension. PPTg — pedunculopontine tegmental nucleus on the control brain side; LDTg —
laterodorsal tegmental nucleus; xscp — decussation of the superior cerebellar peduncle; MnR —median raphe nucleus. White stars mark the lesioned PPT. The scale bar for C, D is 200 μm.
569J. Petrovic et al. / Experimental Neurology 247 (2013) 562–571
serotonergic/noradrenergic and cholinergic neurons during REM sleep(Hobson and Pace-Schott, 2002; Pace-Schott and Hobson, 2002). In ad-dition, according to the “flip-flop”model of REM sleep control (Lu et al.,2006), the DR serotonergic neurons and LC noradrenergic neurons areexcitatory modulators, while the PPT/LDT cholinergic neurons are in-hibitory modulators of the “REM-off” GABAergic neurons area withinthe pons. Although the PPT has been considered among the most im-portant components of the ascending reticular activating system(Winn, 2006), whose cholinergic neurons dramatically increase theiractivity uponwaking and arousal, while being inhibited in order to pro-mote slow oscillations in the cortex and consequently sleep (Jones,2003; Steriade, 2003), our results are in accordance with the recent ev-idence that underlies the novel hypotheses of the PPT as a part of thecontrol system that contributes to cortical activity across the whole ofthe sleep–wake cycle, and not just to cortical activation during Wakeand REM sleep (Mena-Segovia et al., 2008). According to this novel hy-pothesis, in addition to driving global state transitions in the cortex, and
its role in the sleep homeostasis, the PPT cholinergic cells play an activerole in organizing the cortical activity during slow-wave sleep(Mena-Segovia et al., 2008). In contrast to this novel hypothesis, recentresults indicate that PPT cholinergic, GABAergic, and gultamatergic neu-rons can function in parallel or reciprocalmanners, and by concerted ac-tivity they canmodulate cortical activity and behavioral state across thesleep/wake cycle (Boucetta and Jones, 2009).
However, there aremultiple brain arousal systems (for example, theneuronal populations within the brainstem reticular formation, thala-mus, posterior hypothalamus and basal forebrain) that, through theirascending projections to the cortex, stimulate cortical activation charac-terized by high frequency (gamma) and low frequency (theta) rhyth-mic activity, and which through their descending projections canmodulate muscle tonus and activity. As a part of the brain arousal sys-tem, the cholinergic thalamo-cortical projection system of the PPT andthe extra-thalamic cortical cholinergic system of the basal forebrainpromote cortical activation during waking and REM sleep. In contrast,
570 J. Petrovic et al. / Experimental Neurology 247 (2013) 562–571
the LC noradrenergic neurons promote an aroused waking state andprevent REM and NREM sleep, as well as the histaminergic neurons ofthe posterior hypothalamus, while the DR serotonergic neurons pro-mote a quiet waking state (Jones, 2003). No one brain arousal systemis necessary for the occurrence of waking, but each plays a special rolein waking and sleep. In addition, the thalamo-cortical glutamatergicneurons are excited by acetyl-choline and noradrenaline, but may beinhibited by serotonin, while the thalamic GABAergic reticularis neu-rons are inhibited by acetyl-choline and noradrenaline (Jones, 2003).The cholinergic basal forebrain neurons are excited by glutamate, dopa-mine, histamine, orexin, but they are inhibited by acetyl-choline and se-rotonin (Jones, 2003).
Our results have shown that the most sensitive states to PPT cholin-ergic neuronal control impairment are the Wake and REM sleep states,the behavioral stateswith naturally high PPT cholinergic neuronal activ-ity or thalamic extracellular acetyl-choline concentration, versus NREMsleep. In the latter PPT cholinergic neuronal activity and thalamic acetyl-choline concentration are naturally low. The less severely impaired PPTcholinergic neuronal control in our study (the unilateral PPT lesion)wasexpressed from the onset as sustainedWake/REM and REM/Wake tran-sitions increments, with underlying different “EEG microstructures”during REM sleep versus the Wake state, probably due to naturallydamped monoaminergic neuronal activity during REM in contrast totheWake state. Only bilateral PPT lesion, ormore severe PPT cholinergicneuronal control impairment, disturbed both NREM and REM sleep (thebehavioral states with naturally damped monoaminergic control) “EEGmicrostructure”. This happened alongside an increase inWake/REMandREM/Wake transitions, and decreased NREM/REM and REM/NREMtransitions. Bilateral PPT lesion concerted the EEG changes into sustain-able Wake, NREM, REM beta frequency amplitude augmentationfollowed by NREM and Wake delta frequency amplitude attenuation,and also by REM gamma augmentation.
Recent PET imaging studies in humans demonstrated the thalamiccholinergic denervation in the Parkinsonian disorders with or withoutdementia in contrast to AD, and suggested that the neurodegenerativeinvolvement of thalamic cholinergic afferent projections may contrib-ute to the disease specific motor and cognitive abnormalities (Kotagalet al., 2012b). Cortical and thalamic subcortical cholinergic denerva-tion, due to the degeneration of PPT cholinergic neurons, were relatedto REM behavioral disorder (Kotagal et al., 2012a), and to gait and bal-ance impairment including falls in PD (Bohnen et al., 2009; Bohnnenand Albin, 2011). Neuropathological studies in humans have reporteddegeneration of about 50% of the PPT cholinergic neurons in PD in con-trast to AD, where no reductions in PPT cholinergic neurons werefound (Bohnnen and Albin, 2011). Clinical studies also evidenced thebeneficial effect of AChE inhibitor donepezil in 50% reduction in fallsin PD patients (Chung et al., 2009). Since different clinical studies indi-cate heterogeneous cholinergic denervation in PD, with some subjectshaving maintained and others decreased cortical and/or subcorticalactivity, it was suggested that PD is a multisystem neurodegeneration,and that differences in the degree of or rate of degeneration of differ-ent CNS systems may account for differences in their phenotypic fea-tures (Bohnnen and Albin, 2011).
On the basis of all the abovementioned results in humans, and the re-sults of our study, we can also speculate that in our animal model of PPTcholinergic neurodegeneration, the impaired, but still present, PPT cho-linergic neuronal inhibitory control of the LC noradrenergic neurons,and excitatory control of thalamocortical neuronal activity, togetherwith an additional PPT lesion-enhanced LC noradrenergic neuronal exci-tation of the gultamatergic thalamocortical neurons, and the inhibition ofthe GABAergic thalamic reticular neurons, yields to the state of general-ized enhanced cortical activation. Establishing homeostasis by AChEinhibitors within the cholinergic-noradrenergic interactions at thebrainstemand thalamic levelmay attenuate this pathological generalizedenhanced brain activation due to PPT cholinergic degeneration inducedLC noradrenergic neuronal excitation, and improve sleep.
Conclusion
Our study demonstrates that PPT cholinergic control impairmentsustainably disturbs the sleep/wake state transition structure, andshows that PPT cholinergic neuronal loss augmented sleep-state relatedcortical activation duringWake, NREMand REM. This cortical activationwas expressed by the simultaneous state-related high frequency ampli-tude augmentation, and Wake and NREM delta frequency attenuation.
Acknowledgment
Thisworkwas supported by a SerbianMinistry of Education, Scienceand Technological Development grant OI 173022.
Appendix A. Supplementary data
Supplementary data to this article can be found online at http://dx.doi.org/10.1016/j.expneurol.2013.02.007.
References
Boeve, B.F., Silber, M.H., Saper, C.B., Ferman, T.J., Dickson, D.W., Parisi, J.E., Benarroch, E.E.,Ahlskog, J.E., Smith, G.E., Caselli, R.C., Tippman-Peikert, M., Olson, E.J., Lin, S.C., Young,T., Wszolek, Z., Schenck, C.H., Mahowald, M.W., Castillo, P.R., Del Tredici, K., Braak, H.,2007. Pathophysiology of REM sleep behaviour disorder and relevance to neurodegen-erative disease. Brain Rev. 130, 2770–2788.
Bohnen, N.I., Müller, M.I., Koeppe, R.A., Studenski, S.A., Kilbourn, M.A., Fey, K.A., Albin, R.L.,2009. History of falls in Parkinson disease is associated with reduced cholinergic ac-tivity. Neurology 73, 1670–1676.
Bohnnen, N.I., Albin, R.L., 2011. The cholinergic system and Parkinson disease. Behav.Brain Res. 221, 564–573.
Boucetta, S., Jones, B., 2009. Activity profiles of cholinergic and intermingled GABAergic andputative glutamatergic neurons in the pontomesencephalic tegmentum of urethane-anesthetized rats. J. Neurosci. 29, 4664–4674.
Bringmann, A., 1995. Different functions of rat's pedunculopontine tegmental nucleus arereflected in cortical EEG. Neuroreport 15, 2065–2068.
Bringmann, A., 1997. Nicotine affects the occipital theta rhythm after lesion of thepedunculopontine tegmental nucleus in rats. Neuropsychobiology 35, 102–107.
Buzsaki, G., Bickford, R.G., Ponomareff, G., Thai, L.J., Mandel, R., Gage, F.H., 1988. Nucleusbasalis and thalamic control of neocortical activity in the freelymoving rat. J. Neurosci.8, 4007–4026.
Carley, W.D., Radulovacki, M., 2003. Pathophysiology of sleep-related breathing disorders:unanswered questions. In: Carley, D.W., Radulovacki, M. (Eds.), Sleep-related Breath-ing Disorders: Experimental Models and Therapeutic Potential. Marcel Dekker Inc.,New York–Basel, pp. 3–16.
Chung, K.A., Lobb, B.M., Nutt, J.G., Horak, F., 2009. Cholinergic augmentation in frequentlyfallings subjects with Parkinson's disease. Mov. Disord. 24 (Suppl. 1), S259.
Datta, S., 1995. Neuronal activity in the peribrachial area: relationship to behavioral statecontrol. Neurosci. Biobehav. Rev. 19, 67–84.
Datta, S., 1997. Cellular basis of pontine ponto-geniculo-occipital wave generation andmodulation. Cell. Mol. Neurobiol. 17, 341–365.
Datta, S., 2002. Evidence that REM sleep is controlled by activation of brain stempedunculopontine tegmental kainate receptor. J. Neurophysiol. 87, 1790–1798.
Datta, S., MacLean, R.R., 2007. Neurobiological mechanisms for the regulation ofmammaliansleep–wake behavior: reinterpretation of historical evidence and inclusion of contem-porary cellular and molecular evidence. Neurosci. Biobehav. Rev. 31, 775–824.
Datta, S., Siwek, D.F., 1997. Excitation of the brain stem pedunculopontine tegmentumcholinergic cells induces wakefulness and REM sleep. J. Neurophysiol. 77, 2975–2988.
Datta, S., Spoley, E.E., Patterson, E.H., 2001. Microinjection of glutamate intopedunculopontine tegmentum induces REM sleep and wakefulness in the rat.Am. J. Physiol. Regul. Integr. Comp. Physiol. 280, R752–R759.
Dringenberg, H.C., Olmstead, M.C., 2003. Integrated contributions of basal forebrain andthalamus to neocortical activation elicited by pedunculopontine tegmental stimula-tion in urethane-anesthetized rats. Neuroscience 119, 839–853.
Garcia-Rill, E., 1991. The pedunculopontine nucleus. Prog. Neurobiol. 36, 363–389.Hobson, J.A., Pace-Schott, E.F., 2002. The cognitive neuroscience of sleep: neuronal systems,
consciousness and learning. Nat. Rev. 3, 679–693.Inglis, W.L., Semba, K., 1997. Discriminable excitotoxic effects of ibotenic acid, AMPA,
NMDA and quinolonic acid in the rat laterodorsal tegmental nucleus. Brain Res.755, 17–27.
Inglis, W.L., Allen, L.F., Whitelaw, R.B., Latimer, M.P., Brace, H.M., Winn, P., 1994. An inves-tigation into the role of the pedunculopontine tegmental nucleus in the mediation oflocomotion and orofacial stereotypy induced by D-amphetamine and apomorphinein the rat. Neuroscience 58, 817–833.
Jones, B.E., 2003. Arousal systems. Front. Biosci. 8, s438–s451.Kleiner, S., Bringmann, A., 1996. Nucleus basalis magnocellularis and pedunculopontine
tegmental nucleus: control of slow EEG waves in rats. Arch. Ital. Biol. 134, 153–167.Kotagal, V., Albin, R.L., Müller, M.L.T.M., Koeppe, R.A., Chervin, R.D., Frey, K.A., Bohnen, N.I.,
2012a. Symptoms of rapid eyemovement sleep behavior disorder are associatedwithcholinergic denervation in Parkinson disease. Ann. Neurol. 7, 560–568.
571J. Petrovic et al. / Experimental Neurology 247 (2013) 562–571
Kotagal, V., Müller, M.L.T.M., Kaufer, D.I., Koeppe, R.A., Bohnen, N.I., 2012b. Thalamiccholinergic innervation is spared in Alzheimer disease compared to parkinsoniandisorders. Neurosci. Lett. 514, 169–172.
Loiser, B.J., Semba, K., 1993. Dual projections of single cholinergic and aminergic brainstemneurons to the thalamus and basal forebrain in the rat. Brain Res. 604, 41–52.
Lu, J., Sherman, D., Devor, M., Saper, C.B., 2006. A putative flip-flop switch for control ofREM sleep. Nature 441, 589–594.
Lydic, R., Baghdoyan, H.A., 1993. Pedunculopontine stimulation alters respirationand increases Ach release in the pontine reticular formation. Am. J. Physiol.264, R544–R554.
Maloney, K.J., Cape, E.G., Gotman, J., Jones, B.E., 1997. High frequency gamma electroen-cephalogram activity in associationwith sleep–wake states and spontaneous behaviorsin the rat. Neuroscience 76, 541–555.
McCarley, R.W., Hobson, J.A., 1975. Neuronal excitability modulation over the sleep cycle:a structural and mathematical model. Science 189, 58–60.
Mena-Segovia, J., Sims, H.M., Magill, P.J., Bolam, J.P., 2008. Cholinergic brainstemneurons modulate cortical gamma activity during slow oscillations. J. Physiol.586, 2947–2960.
Pace-Schott, E.F., Hobson, J.A., 2002. Basic mechanisms of sleep: new evidence on the neu-roanatomy and neuromodulation of the NREM–REM cycle. In: Davis, K.L., Charney, D.,Coyle, J.T., Nemeroff, C. (Eds.), Neuropsychopharmacology: The Fifth Generation ofProgress. Lippincott Williams and Wilkins, Philadelphia, USA, pp. 1859–1877.
Paxinos, G., Watson, C., 2005. The Rat Brain in Stereotaxic Coordinates, 5th ed. ElsevierAcademic Press, San Diego, USA.
Paxinos, G., Watson, C., Carrive, P., Kirkcaldie, M., Ashwell, K.W.S., 2009. ChemoarchitectonicAtlas of The Rat Brain, Second edition. Academic Press, London, UK.
Radulovacki, M., Pavlovic, S., Saponjic, J., Carley, D.W., 2004. Modulation of reflex andsleep related apnea by pedunculopontine tegmental and intertrigeminal neurons.Respir. Physiol. Neurobiol. 143, 293–306.
Raggi, A., Ferri, R., 2010. Sleep disorders in neurodegenerative diseases. Eur. J. Neurol. 17,1326–1338.
Rye, D.B., 1997. Contributions of the pedunculopontine region to normal and altered REMsleep. Sleep 20, 757–788.
Sabbatini, M., Bronzetti, E., Felici, L., Fringuelli, Ch., Sagratella, S., Amenta, F., 1999.NADPH-diaphorase histochemistry in the rat cerebral cortex and hippocampus: ef-fect of electrolytic lesions of the nucleus basalis magnocellularis. Mech. AgeingDev. 107, 147–157.
Saper, C.B., Loewy, A.D., 1982. Projections of the pedunculopontine tegmental nucle-us in the rat: evidence for additional extrapyramidal circuitry. Brain Res. 252,367–372.
Saponjic, J., Radulovacki, M., Carley, D.W., 2003. Respiratory pattern modulation by thepedunculopontine tegmental nucleus. Respir. Physiol. Neurobiol. 138, 223–237.
Saponjic, J., Cvorovic, J., Radulovacki, M., Carley, D.W., 2005a. Serotonin and noradren-aline modulate respiratory pattern disturbance evoked by glutamate injection intopedunculopontine tegmentum of anesthetized rats. Sleep 28, 560–570.
Saponjic, J., Radulovacki, M., Carley, D.W., 2005b. Injection of glutamate into thepedunculopontine tegmental nuclei of anesthetized rat causes respiratory dys-rhythmia and alters EEG and EMG power. Sleep Breath. 9, 82–91.
Saponjic, J., Radulovacki, M., Carley, D.W., 2006. Modulation of respiratory pattern andupper airway muscle activity by the pedunculopontine tegmentum: role of NMDAreceptors. Sleep Breath. 10, 195–202.
Saponjic, J., Radulovacki, M., Carley, D.W., 2007. Monoaminergic system lesions increasepost-sigh respiratory pattern disturbance during sleep in rats. Physiol. Behav. 90, 1–10.
Sarter, M., Bruno, J.P., 2000. Cortical cholinergic inputsmediating arousal, attentional pro-cessing and dreaming: differential afferent regulation of the basal forebrain by telen-cephalic and brainstem afferents. Neuroscience 95, 933–952.
Semba, K., 1993. Aminergic and cholinergic afferents to REM sleep induction regions ofthe pontine reticular formation in the rat. J. Comp. Neurol. 330, 543–556.
Simic, G., Stanic, G., Mladinov, M., Jovanov-Milosevic, N., Kostovic, I., Hof, P.R., 2009. DoesAlzheimer's disease begin in the brainstem? Neuropathol. Appl. Neurobiol. 35, 532–554.
Steriade, M., 2000. Corticothalamic resonance, states of vigilance and mentation. Neuro-science 101, 243–276.
Steriade, M., 2003. The corticothalamic system in sleep. Front. Biosci. 8, 878–899.Takakusaki, K., Habaguchi, T., Saitoh, K., Kohyama, J., 2004. Changes in the excitability
of hindlimb motoneurons during muscular atonia induced by stimulating thepedunculopontine tegmental nucleus in cats. Neuroscience 124, 467–480.
Timofeev, I., Grenier, F., Bazhenov, M., Sjenowski, T.J., Steriade, M., 2000. Origin of slowoscillations in deafferented cortical slabs. Cereb. Cortex 10, 1185–1199.
Vanderwolf, C.H., Stewart, D.J., 1993. Thalamic control and neocortical activation: acritical re-evaluation. Brain Res. Bull. 20, 529–538.
Vertes, R.P., 1984. Brainstem control of the events of REM sleep. Prog. Neurobiol. 22,241–288.
Vincent, S.R., 1992. Histochemistry of endogenous enzymes. In: Bloam, J.P. (Ed.), Experi-mental Neuroanatomy: A Practical Approach. Oxford University Press, Oxford-NewYork-Tokyo, pp. 153–171.
Vincent, S.R., Satoh, K., Armstrong, D.M., Fibiger, H.C., 1983. NADPH-diaphorase: a selectivehistochemical marker for the cholinergic neurons of the pontine reticular formation.Neurosci. Lett. 143, 31–36.
Whitwell, J.L., Weigand, S.D., Shiung, M.M., Boeve, B.F., Ferman, T.J., Smith, G.E., Knopman,D.S., Petersen, R.C., Benarroch, E.E., Josephs, K.A., Jack Jr., C.R., 2007. Focal atrophy in de-mentia with Lewy bodies on MRI: a distinct pattern from Alzheimer's disease. Brain130, 708–719.
Williams, J.A., Comisarow, J., Day, J., Fibiger, H.C., Reiner, P.B., 1994. State-dependent re-lease of acetylcholine in rat thalamus measured by in vivo microdialysis. J. Neurosci.14, 5236–5242.
Winn, P., 2006. How best to consider the structure and function of the pedunculopontinetegmental nucleus: evidence from animal studies. J. Neurol. Sci. 248, 234–250.
Yan, M.M., Xu, X.H., Huang, Z.L., Yao, M.H., Urade, Y., Qu, W.M., 2011. Selection of optimalepoch duration in assessment of rodent sleep–wake profiles. Sleep Biol. Rhythms 9,46–55.