CNIT Technical Report-05
271
CNIT Technical Report-05 NTERNET OF HINGS: ECHNOLOGIES, HALLENGES AND MPACT I T T C I I T NTERNET OF THINGS: ECHNOLOGIES,CHALLENGES AND IMPACT Edited by Luigi Atzori & Gianluigi Ferrari Edited by Luigi Atzori & Gianluigi Ferrari CNIT Technical Report-05
-
Upload
khangminh22 -
Category
Documents
-
view
0 -
download
0
Transcript of CNIT Technical Report-05

CNIT
Technical Report-05
NTERNET OF HINGS:
ECHNOLOGIES, HALLENGES AND MPACT
I T
T C I
IT
NT
ER
NE
TO
FT
HIN
GS
:E
CH
NO
LO
GIE
S,C
HA
LL
EN
GE
SA
ND
IMP
AC
T
Edited by
Luigi Atzori & Gianluigi Ferrari
Edited by
Luigi Atzori & Gianluigi Ferrari
CN
IT
Tech
nic
al
Rep
ort-0
5


Low-power Wide-Area Networks: A ComparativeAnalysis Between LoRaWAN and NB-IoT
Chiara Buratti∗, Konstantin Mikhaylov†, Riccardo Marini∗, Roberto Verdone∗
∗Universita di Bologna, †University of Oulu
Abstract: Low Power Wide Area Networks are becoming the most important enablerfor the Internet of Things (IoT) connectivity. Application domains like smart cities,smart agriculture, intelligent logistics and transportation, require communication tech-nologies that combine long transmission ranges, energy efficiency and low infrastructurecosts. Recent and future trends make LoRaWAN and 4G/NB-IoT the main drivers of IoTbusiness. In this contribution we briefly discuss the main features of the two technolo-gies, analyzing some important Key Performance Indicators. The presented results havebeen obtained analytically, via simulations and experiments developed at the University ofBologna via testbeds, that are currently under use to verify different IoT applications anddemonstrate their feasibility.
1 Introduction
The proliferation of embedded systems, wireless technologies, and Internet protocols haveenabled the Internet of Things (IoT), to bridge the gap between the virtual and physicalworld by enabling the monitoring and control of the physical world by data processingsystems. A large variety of communication technologies has gradually emerged, reflectinga large diversity of application domains and requirements. Some of these technologies areprevalent in a specific application domain, such as Bluetooth Low Energy in Personal AreaNetworks [1], and Zigbee in Home Automation systems [2]. Others, like Wi-Fi Low Power,Low Power Wide Area Networks (LPWAN) [3], and cellular communications, such as the3GPP Long Term Evolution for Machines (LTE-M) and Narrowband IoT (NB-IoT), havea much broader scope. In addition, this landscape is constantly and rapidly evolving, withnew technologies being regularly proposed, and with existing ones proliferating into newapplication domains. In this Chapter, we focus on LoRa and NB-IoT, presenting theirmain features and characteristics, and some examples of achievable results via analyzinga set of selected generic Key Performance Indicators (KPIs). The Chapter is organizedas follows: Section 2 deals with the LoRa technology, while Section 3 reports NB-IoTtechnology. Finally, Section 4 compares the two solutions and reports drawn conclusions.
_____________________________________________________________________________________ CNIT Technical Report-05 ꟷ Internet of Things: Technologies, Challenges and Impact
1

2 LoRaWAN Technology: main features and charac-teristics
2.1 LoRaWAN Technology
2.1.1 Overview
LoRa is a Physical Layer developed by Cycleo (a French company) later acquired bySemtech, on top of which LoRaWAN specifies the link and network layer procedures.The first target of LoRa is to allow very low power operations to ensure with a singlebattery a long lifetime to the devices - of more than ten years. It also allows longcommunication ranges (2-5 km in urban areas and up to 15 km in suburban areas) [20,18]. The downside is low data rates, some tens of bit per second in the most robustoptions. However, LoRa can offer certain flexibility and can reach a data rate up to 50kbit/s [4, 5]. LoRa physical layer is based on Chirp Spread Spectrum (CSS) modulation.Using a bandwidth exceeding the necessary one to transmit the data, LoRa performsspectrum spreading, which brings robustness against some characteristics of the channel(e.g., interference, frequency selectivity, Doppler effect). One original characteristic ofLoRa is that information is carried by a cyclic shift in the chirp (position modulation).
The transmitter generates chirp signals by varying their frequency over time andkeeping phase between adjacent symbols constant. The signal frequency band is usuallyset to 125, 250 or 500 kHz in the Industrial Scientific Medical (ISM) bands of 863-870MHz for Europe or 902-928 MHz for US[21]. However, there also exist some narrowerbands (7.8 to 62.5 kHz) in the 166 and 433 MHz bands. Finally, a new version at 2.4 GHzhas recently emerged. The main characteristics of LoRa’s modulation depend on severalparameters:
• The Spreading Factor (SF): it is related to the duration of a symbol. For thehigher spreading factors, more chips are combined in a single symbol, making thetransmission longer (thus reducing the data rate), but increasing its energy thus, po-tentially, allowing longer communication range. LoRa employs six quasi-orthogonalSFs (numbered 7 to 12). Consequently, up to six frames can be exchanged in thenetwork at the same time over the same frequency channel, as long as each one isconfigured with unique SF.
• Forward Error Correction (FEC) techniques, and, specifically, Hamming code, arealso used to increase receiver sensitivity. The Code Rate (CR) index specifies thenumber of additional bits added to a LoRa frame. LoRa offers CR = 0, 1, 2, 3 and4, where CR = 0 means no encoding and the effective coding rate is 4/(4+CR),ranging from 1 (no coding) to 1/2.
• The output of the encoder passes through the Whitening block (optional). Whiten-ing induces randomness, in order to make sure that there are no long chains of 0’sand 1’s in the payload. An interleaving block is then implemented to avoid bursts oferrors. The interleaver uses a diagonal placing method to scramble each codeword.
A packet contains a preamble (for the detection and synchronization purpose), possiblya header (depends on operation mode) and the payload, with a maximum size between51 bytes and 222 bytes, depending on the SF. The raw on-air data rate varies according
2_____________________________________________________________________________________
Low-power Wide-Area Networks: A Comparative Analysis Between LoRaWAN and NB-IoT

to the SF and the bandwidth, and it ranges between 22 bit/s (BW = 7.8 kHz and SF =12) to 27 kbit/s (BW = 500 kHz and SF = 7). The SF 6 offers another option with a rateof 50 kbit/s. Frequency hopping is exploited at each transmission in order to mitigateexternal interference. The choice of the bandwidth, the SF and the CR impact the Time-on-Air. An increase in this time will consequently increase the duration of the periodthe radio has to be off, which imposed by the frequency use regulation. Although fewinformation bits are transmitted per packet, the packet duration can be long, more thanone second for large SF and small bandwidth. To decode a packet, first, a receiver has todetect the preamble consisting of successive up-chirps (typically 4 or 6) and two down-chirps (the up-chirp reversed in time). This allows the synchronization and the detectionof the beginning of the frame. The decoding consists of multiplying each symbol by adown-chirp. The resulting signal is a sine wave with a fixed frequency, given by the shift.The Fourier transform then exhibits a peak, easy to detect, that allows recovering the bitsequence. Besides, the capture effect allows receiving the target packet even under theinterference of a signal with the same SF, given that the interfering signal is weaker thanthe target one.
LoRaWAN networks are based on single-hop transmissions, leading to a star-of-starstopology. Devices transmit their packets directly to Gateways that relay messages to acentral Network Server, through another network (Cellular, Wi-Fi or Ethernet for in-stance). Bi-directional communications are allowed too. LoRaWAN defines three classesof devices (A, B and C):
• Class A devices, aiming low cost and long life devices, use pure ALOHA to accessthe channel in the uplink. A Class-A device is always in sleep mode unless it hassomething to transmit. After transmission, the device listens during two windowperiods, defined by duration, offset time and a data rate. Feedback can only happenafter a successful uplink transmission. The second window can increase robustnessin the downlink, and it is disabled when the end-device receives downlink traffic inthe first window.
• Class B devices are designed to support additional downlink traffic, at the priceof higher energy consumption. A Class-B device synchronizes its internal clockusing beacons emitted by the gateway. This process is called a “beacon lock”.After synchronization, the device negotiates its ping-interval. The LoRa Server isthen able to schedule downlink transmissions on each ping-interval. By doing so,additional downlink traffic can also be supported without relying on prior successfuluplink transmissions.
• Class C devices are always listening to the channel except when they are transmit-ting.
Class A is intended for End-Devices (EDs). The other classes must remain compatiblewith Class A. The three classes can coexist in the same network and devices can switchfrom one class to another. However, there is no specific message defined by LoRaWANto inform the gateway about the class of a device and, hence, this must be handled bythe application.
An essential parameter in LPWANs and networks operating in unlicensed bands is themaximum allowed duty-cycle. It corresponds to the percentage of time during which an
_____________________________________________________________________________________ CNIT Technical Report-05 ꟷ Internet of Things: Technologies, Challenges and Impact
3

Table 1: LoRa Key Parameters Values
Parameter Value CommentBit Rate 22 bit/s – 50 kbit/s Depending on SFr
Frequency Bands [69, 433, 868] MHz (Europe) 2.4 GHz version available915 MHz (North America)
Bandwidth [125, 250, 500] kHz 7.8 - 62.5 kHz Bandwidthsavailable in the 433 MHz band
Topology Stars of starsLink budget 155 dB – 170 dB Depending on SFTX Range Up to 15 km Few km in urban area
Consumptions (TX) 18 mA at 10 dBm84 mA at 20 dBm
end-device can occupy a channel and equals 1% in EU 868 for end-devices. The channelselection is pseudo-random and happens at each transmission.
The most critical parameters are summarized in Table 1.
2.1.2 Protocol Operation
LoRaWAN networks allow EDs to individually use any of the possible combinations ofdata rate and transmitted power. This is referred to as Adaptive Data Rate (ADR) andis designed in order to increase the battery life of the ED while maximizing the networkcapacity [8]. In order to determine the optimal data rate, the network needs to takesome measurements: this is achieved by estimating the link budget between the ED andthe gateway looking at uplink messages. For example, an ED very close to the gatewayshould transmit with the highest possible data rate (i.e., the lowest possible value of SF),in order to reduce as much as possible the Time on Air (ToA) of the transmitted packet,allowing the ED to reduce its energy consumption whilst also reducing the probability ofcollisions with other nodes. The algorithm operating on the network server is designedby the developer while the one working on the node is specified by LoRa Alliance [8].
EDs are in charge of deciding if ADR should be used or not. If it is activated (ADR bitin the frame header set to 1), the network server will control the transmission parametersof the ED through ad-hoc commands. When the ADR bit in the downlink packet is setto 1, the server informs the ED that it will send ADR commands; differently, the nodewill not receive any indication because the server is not able to estimate the best datarate to be used; this happens when the radio channel varies too fast. Besides this, thenode should periodically check if the network still receives its uplink frames when ADRis enabled.
Figure 1 shows the algorithm implemented on the ED. Each time the uplink framecounter is incremented, the same happens to the ADR ACK CNT counter (except forrepeated transmissions that do not increase the counter). After ADR ACK LIMIT mes-sages (by default 64) without any downlink response, the device sends a request to thenetwork, which must respond within the next ADR ACK DELAY frames (by default 32)with a downlink frame. If no reply is received, the ED must try to reconnect to the net-work by first setting the transmitted power to its default one and then possibly switchingto the next lower data rate (which will provides longer transmission range). The device
4_____________________________________________________________________________________
Low-power Wide-Area Networks: A Comparative Analysis Between LoRaWAN and NB-IoT

must lower its data rate every time the ADR ACK DELAY expires and, once it reachesthe lowest data rate, it must re-enable all the default uplink frequency channels.
Figure 1: ED ADR
The ADR algorithm working on the network server exploits data regarding the uplinktransmissions processed by the network server in order to define the optimal data rate tobe used. One of the most widespread implementations, used by The Things Network orChirpStack, to mention some of the most famous LoRa Server architectures, is based onSemtech’s recommended algorithm [17]. It is shown in Figure 2.
Once the network server detects that the ED is sending a packet with the ADR bitset, it starts collecting Signal-to-Noise Ratio (SNR) measurements of the received signal.It keeps recordings, typically, of the 20 most recent transmissions from each ED. Afterreceiving 20 samples, it computes the SNR margin: SNRmargin = SNRmax−SNRreq −M , where SNRmax is the maximum SNR among the collected data, M is set as 10 dB bydefault (it can be controlled by the server administrator), and SNRreq is the minimumSNR required to demodulate the received signal correctly, and it varies according to thedata rate (or the Spreading Factor) as shown in Table 2.
_____________________________________________________________________________________ CNIT Technical Report-05 ꟷ Internet of Things: Technologies, Challenges and Impact
5

Data Rate Spreading Factor SNRreq[dB]
0 12 -201 11 -17.52 10 -153 9 -12.54 8 -105 7 -7.5
Table 2: SNRreq values for different SF with BW=125 kHz.
From SNRmargin, Nstep is computed as: Nstep =⌊SNRmargin
3
⌋.
Then an iterative process starts:
• If Nstep < 0, the transmitted power is increase in each step by 3 dB until themaximum one (according to the regional regulations) is reached; Nstep is increasedby 1;
• If Nstep > 0, first the algorithm tries to increase the data rate in each step un-til it reaches the maximum one (DR=5) or, if this is not possible anymore, thetransmitted power is decreased by 3 dB until it reaches the minimum one; Nstep isdecremented by 1.
The algorithm stops when Nstep = 0 and the server generates a specific packet with thenew transmission parameters and sends it to the selected ED; the changes introduced willreflect on the next uplink message if the packet is correctly received.
2.2 LoRa KPI
We concentrate on the following KPIs: Reliability, Network Throughput and the End-to-End (E2E) Delay, and we provide some example of numerical results achieved viasimulations and experiments. Simulations have been carried out on Matlab. A squaredarea with one gateway in the centre has been considered for the sake of simplicity; thesquare size has been chosen such that nodes using SF7 have a 90% probability of beingconnected to the gateway, while nodes using SF12 have a connection probability of 100%.In the simulator the path loss is modeled as follows: Loss = k0 + k1log10(d) + s, with
k0 = 10log10(4πλ
)2and k1 = 10β, where β is the propagation coefficient and λ is
the wavelength, d is the distance between transmitter and receiver. s represents randomchannel fluctuations, described as a Gaussian r.v. in dB, zero mean and standard deviationσ. The parameters used during simulation are reported in Table 3.
Concerning the experimental platform, Idesio Rigers Board 1.0, a multi-sensor plat-form specifically designed for smart city applications, has been used. It is equipped withthe microchip RN2483 radio transceiver, fully certified 433/868 MHz LoRa module andit supports LoRaWAN Class A devices. Fifteen devices were programmed to work at thesame time, divided into three clusters of 5 devices using respectively SF7, SF10 and SF12,sending packets every 60 s.
6_____________________________________________________________________________________
Low-power Wide-Area Networks: A Comparative Analysis Between LoRaWAN and NB-IoT

Figure 2: Network Server ADR Algorithm
Packet Periodicity T 60 s Area Side 6500 mPacket Size B 16 Bytes Confirmed Message Enabled
Preamble Length 8 Symbols Header Enabledf 868,5 MHz BW 125 kHz
CR 4/5 PTx 13.5 dBmβ 3 σ 3
Table 3: Simulation Parameters
2.2.1 Reliability
Reliability is mainly affected by the use of ALOHA protocol by Class A devices. It is wellknown that the performance of ALOHA is poor in terms of packet delivery success rateand, further, it does not support a network load increase, due to the interference increase.Hence, as long as the network load is low enough (taking into account the number ofSFs, frequency channels, devices), reliability should be enforced. Figure 3 shows thePacket Error Rate (PER) as a function of the number of the nodes in the network,both considering simulations (curve) and experimental results (square points). Whencomputing the PER in the simulations, we account for both, connectivity issues (i.e.,probability that an ED is not connected to the gateway) and collisions (i.e., probabilitythat more than one ED transmit at the same time, using the same channel and SF).In the experiments, three measurements sessions of 20 minutes each have been carriedout and at the end statistics regarding the PER, obtained by counting the number of
_____________________________________________________________________________________ CNIT Technical Report-05 ꟷ Internet of Things: Technologies, Challenges and Impact
7

packets received/lost, have been computed. In the figure, the different curves are relatedspecific values of SF (in this case, we fixed the same value for all nodes in the network),and to the case of ADR. As for the experiments, no ADR has been considered. As canbe seen, the optimum value of SF to be set varies with the number of nodes: when fewnodes are present, the PER is mainly limited by connectivity - therefore SF=10 is thebest solution. When the traffic load increases, SF=7 becomes better, because it allowskeeping under control collisions due to the smaller ToA. Besides this, introducing ADRdrastically improves the performance, since it reduces both connectivity and collisionsissues managing the SF used by the device, making it able to reach the gateway in almostall cases and distributing different SFs among all the nodes.
Figure 3: PER versus the number of nodes in the network.
2.2.2 Network Throughput
The network throughput is defined as the number of bits per second correctly received
at the gateway, given by S = B·N ·(1−PER)T [bit/s], where N is the number of nodes, T
is the period of time between two successive generated packets, and B is the packet size(see Table 3 for parameters settings). The network throughput is depicted in Figure 4 asa function of the number of nodes, and demonstrates a trend similar to that of the PER.
2.2.3 End-to-End Delay
We define the End-to-End (E2E) Delay as the interval of time between the generationof the packet at the network server to be sent in the downlink to a given node, and theinstant when the network server receives a reply from the node. Tests and simulations toderive the average End-to-End Delay have been carried out, accounting for the fact thatthis delay strongly depends on the operating class used by the ED.
In the case of Class C devices, that is assuming the node are always on, the E2E Delay
8_____________________________________________________________________________________
Low-power Wide-Area Networks: A Comparative Analysis Between LoRaWAN and NB-IoT

Figure 4: Throughput
is given by:
E2EDelay = τNS−GW + ToADL + T (node)proc + ToAUL + τGW−NS + TNSproc [s] (1)
where τGW−NS = τNS−GW is the propagation time from gateway to the network serverand viceversa; ToADL and ToAUL are the ToA of the packets transmitted in downlink
and uplink, respectively (they depend on the SF set); T(node)proc is the processing time at
the ED and TNSproc is the processing time at the network server.Since in class A the receive window is opened only after an uplink message, the server
is able to send a downlink message (which contains the request) only after the correcttransmission of the ED. This means that if for some reason an uplink packet is lost, thenetwork server will not know that the receive window of the device is opened and thereforeit will not send the downlink message, waiting for the next uplink. Therefore, in the caseof Class A devices the packet to be sent in downlink remains at the network server fora certain amount of time, denoted as Twait−NS , which depends on the frequency withwhich the ED generates packets in uplink and on the probability that this packet is sentwith success. Therefore, since in our simulations (and also experiments) EDs generate anuplink packet every T , the E2E Delay for the case of Class A is given by:
E2EDelay = Twait−NS + TRXwind + ToAUL + ToADL + T (node)proc + ToAUL +
τGW−NS + TNSproc [s] (2)
where Twait−NS = T2 + T ·PER is the average waiting time of the packet at the network
server, given that nodes generate packets in uplink every T and these packets have aprobability of being correctly received given by (1 − PER). TRXwind is the intervalbetween the end of uplink transmission and the beginning of the first receive windowopened by the ED. The other terms are the same considered for Class C. Results areprovided in Figure 5 for Class A and in Table 4 for Class C. Note that in the case of Class
_____________________________________________________________________________________ CNIT Technical Report-05 ꟷ Internet of Things: Technologies, Challenges and Impact
9

C the network server can send downlink messages almost at any time; therefore there isno variation due to the number of nodes, because delay does not depend on the PER.This deeply reflects the user perception of the system and it appears clearly that Class ALoRaWAN is not thought for real-time application.
Figure 5: End-to-end delay class A
SF7 SF 10 SF12 ADR0,38 s 0,9 s 2,79 s 0,38 s
Table 4: End-to-End Delay class C
3 NB-IoT Technology: main features and characteris-tics
3.1 NB-IoT technology
3.1.1 Overview
NB-IoT is designed to achieve efficient communication in the cellular IoT frameworkand reach a longer battery life for a massive distribution of nodes. Three key elementscharacterize it: low cost, a large number of connections per cell and robust coverage,with very good penetration in underground and indoor environments [6]. NB-IoT isintroduced in Release 13 (Rel. 13) of 3GPP, emerging as an alternative solution to theLPWA technologies already present on the market (e.g., LoRaWAN). NB-IoT leverageson the LTE standard and numerology, but it is designed for ultra-low-cost Machine TypeCommunications (MTC), supporting a massive number of devices per cell. From LTE ittakes the synchronization, radio access, resources definition and assignment. The standard
10_____________________________________________________________________________________
Low-power Wide-Area Networks: A Comparative Analysis Between LoRaWAN and NB-IoT

Table 5: NB-IoT Key Parameters Values
Parameter Value CommentBit Rate up to 253.6 kbit/s UE capabilities and netw. config.
Frequency Bands various in [400,2700] MHz TDD only in band 2490-2690 MHzBandwidth 180 kHz 200 kHz in re-farmed GSMTopology star of stars similar to LTE
Link budget up to 164 dB netw. config.TX Range up to 35 km expected to reach 100 km [16]
Consumption TX: 230 mA at 23 dBm [15]RX: 61 mA
allows modifications to regular LTE by enhancing the link budget and reducing the energyconsumption, complexity and costs to a minimum.
While the other cellular systems for MTC are based on existing radio access tech-nologies, NB-IoT can either operate in a stand-alone mode, within the guard bands ofLTE carriers or within LTE carriers. It supports a nominal system bandwidth of 180 kHz(equal to the one of an LTE Physical Resource Block (PRB)) in both uplink and down-link. The (narrowband) channel spacing is 15 kHz as in LTE, but it can be decreased to3.75 kHz in uplink communications [7]. Traditionally, in Rel. 13 and Rel. 14 the NB-IoTwas limited to frequency-division duplexing (FDD) operation implying the use of differentfrequency bands for uplink and downlink transmissions. However, in Rel. 15 (2019) anew option - the time-division duplexing (TDD) - has been introduced allowing to usethe same frequency band both for uplink and downlink.
As in LTE, NB-IoT eNBs (enhanced Node-B) employ Orthogonal Frequency DivisionMultiple Access (OFDMA) in the downlink, and the User Equipments (UEs, the termused in LTE to denote an end node or a user terminal) use Single Carrier FrequencyDivision Multiple Access (SC-FDMA) in the uplink. However, the modulation schemesare limited to Binary Phase Shift Keying (BPSK) and Quadrature Phase Shift Keying(QPSK) to reduce complexity and ensure a better link budget. A single process HybridAutomatic Repeat Request (HARQ) is expected in both uplink and downlink by default(this requirement was relaxed in Rel. 14), and the half-duplex operation is allowed. NB-IoT UEs (cat NB1/NB2) implement power control in the uplink, in order to keep lowpower and consumption where possible.
The expected Coverage Enhancement (CE) is mainly achieved by allowing repetitions(i.e., temporal diversity [19]). The signalling for control information and data is repeateda number of times in different uplink and downlink channels. Each replica has a differentcoding, and multiple replicas can be combined at the receiver to increase the receptionprobability.
NB-IoT also introduces a UE categorization in several classes of devices, based on mea-sured power levels. It allows an energy-efficient operation, though keeping an ultra-lowdevice complexity. To further reduce costs, the device searches for only one synchroniza-tion sequence and can use a low sampling rate (e.g., 240 kHz) to establish primary timeand frequency synchronization to the network. Also, the maximum transport block sizeis 680 bits/1000 bits in downlink and uplink in Rel. 13 (in Rel. 14 both were increased to2536 bits) and a single transmit-receive antenna can guarantee the performance objectives
_____________________________________________________________________________________ CNIT Technical Report-05 ꟷ Internet of Things: Technologies, Challenges and Impact
11

of NB-IoT.Techniques like Power Saving Mode (PSM) and extended Discontinuous Reception
(eDRX) are used to increase the battery life for cellular IoT devices. Energy consumptioncritically depends on the device behaviour when it is not on an active session: these idletime intervals for cellular networks are used to monitor paging and perform mobilitymeasurements. For this reason, PSM and eDRX support a reduced energy consumptionby extending the periodicity of paging occasions or requiring no monitoring at all.
3.1.2 Protocol operation
To get a better understanding of the NB-IoT technology, we detail the operation of aUE operating in an FDD-based network, using different frequency resources for uplinkand downlink [19]. In case of uplink, the resource grid is composed of multiple subcarrierfrequencies with a step (the so-called frequency separation - ∆f) of either 3.75 kHz or 15kHz, and time slots with a duration of 0.5 ms and 2 ms in case of ∆f=15 kHz and ∆f=3.75kHz, respectively. On top of this, NB-IoT introduces the notation of a resource unit (RU),denoting a combination of a specific number of consecutive subcarriers (i.e., 1,3,6 or 12)and a number of time-domain slots. The RU represents the minimum element, whichcan be allocated to a UE for an uplink data transmission. In the case of downlink, thefrequency separation is fixed at 15 kHz, and the concept of PRBs is used. A PRB spans12 subcarriers over 7 OFDM symbols, and a pair of PRBs is the smallest schedulableunit, which is referred to as a single subframe (thus having the total duration of onemillisecond). Ten subframes compose a single frame (of 10 ms), and 1024 frames make ahyperframe (10.24 s).
Once powered up, a UE typically starts the procedure of cell search, which is theprocedure by which the UE acquires time and frequency synchronization with a cell andidentifies it. For this, the UE enables the receiver and searches first for the narrowbandprimary synchronization signals (NPSS) which are sent by eNB in every 5th subframe ofeach frame. Then it proceeds with detecting the narrowband secondary synchronizationsignals (NSSS) which encode the physical cell identity (PCID) and are sent in 9th subframeof each even frame (the transmission of a complete NSSS sequence takes 4 subframesand thus NSSS are repeated every 80 ms). Once finished, the NB-IoT UE proceeds withacquiring the Master Information Block (MIB-NB, [10]) which has a fixed schedule with aperiodicity of 640 ms composed of 8 data blocks, each repeated eight times. The elementsof MIB (sent in the so-called Narrowband Physical Broadcast Channel - NPBCH) aretransmitted in subframe 0 of every single frame. Once decoded, MIB provides the UE withrelevant information about the network deployment mode, timings and the scheduling ofthe first system information (SI) block (SIB1-NB).
The SIB1-NB uses a fixed schedule with a periodicity of 2560 ms in subframe 4 of everyother frame in 16 continuous frames [10]. The starting frame of the SIB1-NB depends onthe PCID and is derived by the UE from NSSS, while the configuration for repetitions isspecified in MIB-NB. The SIB1-NB provides the UE with the information needed to eval-uate whether it is allowed to connect the cell and carries the scheduling information of theother SI blocks. To the ”required” SI for UE belong MIB-NB, SIB1-NB, SIB2-NB(radioresource configuration), SIBs 3-5-NB(neighbouring cell-related and cell re-selection in-formation), and SIB22-NB(radio resource configuration on non-anchor carriers). The SImessages are sent on Narrow Band Downlink Shared Channel (NPDSCH)[11].
12_____________________________________________________________________________________
Low-power Wide-Area Networks: A Comparative Analysis Between LoRaWAN and NB-IoT

Once possessing all the required SI, the UE may try to establish the connection to thenetwork. For this, it has to execute the special random access (RA) procedure to gainaccess to a radio channel. Specifically, the UE waits for a scheduled (scheduling specified inSIB2-NB and is periodic with a period ranging between 40 ms and 2.56 s [10]) RA channel(RACH) window, randomly selects one of the preambles (number of which depends onthe number of available carriers from 12 to 48) and transmits it. A preamble is sent usingsingle-tone transmission employing frequency hopping between symbol groups. Threedifferent NPRACH preamble formats are currently defined (formats 0 and 1 introducedin Rel. 13 and format 2 added in Rel. 15), featuring the different trade-offs between theon-air time and maximum communication range, which can, potentially, reach 120 km[12]. The basic NPRACH repetition unit consists of four symbol groups for Formats 0 and1, or 6 symbol groups for Formats 2, with a special relationship between tone frequencieswithin a repetition unit. Note, that up to three periodic NPRACH windows can beconfigured in a cell, each associated with a CE level and characterized by the differentnumber of preamble repetitions (ranging from 1 to 128 [10]). The selection of NPRACHto use is made by the device based on its estimation of the radio signal received power(RSRP) from eNB, the network configurations, and the number of previous unsuccessfulRA attempts. The NPRACH transmission is sometimes referred to as Message 1 (Msg1)since this is the first message in RA procedure.
After a RACH window, the eNB delivers the scheduling for RA response (RAR orMsg2) in NPDCCH during the Type 2 common search space[11]. The RAR itself is sent inthe narrowband physical downlink shared channel (NPDSCH) and allocates the resourcesand specifies the MCS and the number of repetitions for the next uplink transmission -the radio resource control (RRC) connection request (Msg3) - for the RA preambles ithas received. The Msg3 are sent by all the UE which have used the specific RA pream-ble carrying the unique data identifying the device, i.e., the UE Contention ResolutionIdentity and which is used to detect the possible collisions. In case of successful Msg3reception, the eNB replies them with Msg4, i.e., the RRC connection setup, which is alsosent in NPDSCH and scheduled through NPDCCH.
Note, that a similar procedure has to be repeated each time an unconnected UErequires to access the radio resources to transmit or receive the data. Note, however,that NB-IoT also supports the contention-free channel access procedure initiated by theeNB, which implies that an eNB dictates a UE it wants to get connected the randomaccess preamble, which no other UE are allowed to use thus ensuring collision avoidance.Following the discussed above RA procedure, the UE and eNB continue exchanging thedata sent in NPDSCH in downlink and NPUSCH in uplink having each data transmissionscheduled through NPDCCH (the respective procedures are discussed in more details inthe following subsection).
Importantly, similarly to LTE, the closing of an active RRC session is handled by thenetwork (i.e., the MME and eNB) and done based on the inactivity timer. In additionto this, the release assistance indication (RAI) procedure has been introduced in Rels.13 and 14, which allows a UE to signalize the network that the UE has no other data tosend and ask for connection release.
_____________________________________________________________________________________ CNIT Technical Report-05 ꟷ Internet of Things: Technologies, Challenges and Impact
13

Table 6: Uplink and downlink TBS configurations
TBS size (bits) in NPDSCHITBS Number of subframes (1 ms long)
0 1 2 3 4 5 6 8 101 16 32 56 88 120 152 208 2562 24 56 88 144 176 208 256 3443 32 72 144 176 208 256 328 4244 56 120 208 256 328 408 552 6805 72 144 224 328 424 504 680 8726 88 176 256 392 504 600 808 10327 104 224 328 472 584 680 968 12248 120 256 392 536 680 808 1096 13529 136 296 456 616 776 936 1256 1544
10 144 328 504 680 872 1032 1384 173611 176 376 584 776 1000 1192 1608 2024
12 208 440 680 904 1128 1352 1800 2280
13 224 488 744 1032 1256 1544 2024 2536
TBS size (bits) in NPUSCHITBS NRU -Number of resource units
0 1 2 3 4 5 6 8 101 16 32 56 88 120 152 208 2562 24 56 88 144 176 208 256 3443 32 72 144 176 208 256 328 4244 56 120 208 256 328 408 552 6805 72 144 224 328 424 504 680 8726 88 176 256 392 504 600 808 10007 104 224 328 472 584 712 1000 12248 120 256 392 536 680 808 1096 13849 136 296 456 616 776 936 1256 1544
10 144 328 504 680 872 1000 1384 173611 176 376 584 776 1000 1192 1608 2024
12 208 440 680 1000 1128 1352 1800 2280
13 224 488 744 1032 1256 1544 2024 2536
3.2 NB-IoT KPI
Note, that unless stated otherwise in what follows we imply the NB-IoT operation usingframe structure type 1, i.e., the FDD mode. In what follows, we start by discussing theperformance of the NB-IoT physical layer and then present the results taking into accountthe link-layer procedures. Importantly, the results presented below illustrate the NB-IoTperformance in different deployment modes and various network and UE configurations,differing with respect to multi-tone support, uplink frequency separation, etc.
14_____________________________________________________________________________________
Low-power Wide-Area Networks: A Comparative Analysis Between LoRaWAN and NB-IoT

3.2.1 Physical layer performance
The peak data rate of NB-IoT at the physical layer is defined by the configurations of theNPDSCH and NPUSCH illustrated in Table 6 .To give an example, for Rel. 13 the 680bits of downlink data can be sent fastest within three one-millisecond-long subframes,resulting in peak throughput of 226.6 kbit/s. The Rel. 14 has introduced new TBSoptions (devices implementing these are referred to as class NB2 in contrast to NB1,which denote to devices operating based on Rel. 13), allowing for slightly higher datarates, which can reach 2536bits/10ms=253.6 kbit/s. Even though the TBS allocationtables for NPDSCH and NPUSCH are rather similar, for NPUSCH TBS is allocated interms of the resource units, duration of which depends on the number of subcarriers andthe subcarriers spacing as discussed in [9].
For frame structure type 1 implying FDD operation and NPUSCH format 1, which isused to transfer user data in uplink, in case of 3.75 kHz subcarrier spacing (∆f=3.75 kHz)only single tone transmissions are supported and the maximum ITBS equals 10. Giventhat the duration of a single resource unit (RU) for ∆f=3.75kHz equals 2ms*16slots = 32ms, the maximum uplink physical layer data rate for Rel. 13 equals 1000 bit/(6*32ms)= 5.208 kbit/s and for Rel. 14 is 1736 bit/(10*32ms) =5.425 kbit/s. The respectivevalues in Table 6 are highlighted with yellow and lime. In the case of 15 kHz subcarrierspacing (∆f=15 kHz) an eNB may assign to the 1,3,6 or 12 sequential tones resultingin the durations of a single resource unit becoming equal to 8, 4, 2, or 1 ms, respec-tively. Therefore, the maximum uplink throughput (the respective TBS configuration inTable 6 is highlighted with turquoise) for Rel. 13 is 1000 bit/(6*8ms)=20.833 kbit/s, 1000bit/(4*4ms)=62.5 kbit/s, 1000 bit/(4*2ms)=125 kbit and 1000 bit/(4*1ms)=250 kbit/sfor single, 3, 6, and 12 tone transmissions, respectively. In case of Rel. 14 the numbers(TBS configuration highlighted with magenta) are 1736 bits/(10*8ms)=21.275 kbit/s,2536 bits/(10*4ms)=63.4 kbit/s, 2536 bits/(10*2ms)=126.8 kbit and 2536 bits/(10*1ms)=253.6 kbit/s for single, 3, 6, and 12 tone transmissions, respectively.
Note, that all the calculations above imply that the minimum number of repetitionsconfigured in the network is one and that the condition of the radio channel between aUE and an eNB is sufficiently good. Otherwise, e.g., for the UE located close to the celledge or experiencing hard radio signal propagation conditions (e.g., a sensor device inthe basement of a building) – a UE may be instructed by the eNB (within the DownlinkControl Information (DCI) packet assigning the uplink/downlink resources) to repeat thetransmission multiple times. The possible options for downlink (NPDSCH) and uplink(NPUSCH) are listed in Table 7. If repetitions are used, the maximum physical layerdata rate decreases proportionally to the increase of the number of repetitions.
However, the discussion above does not account for the protocol-layer features andprocedures, which affect directly the throughput experienced by the applications.
3.2.2 Performance of NB-IoT medium access protocol
Note, that for the following discussion, we imply that the RRC session between the UEand an eNB has been already established. First, we consider the uplink transmissionscenario, which is illustrated with the respective timings in Fig. 6.
Before sending the actual data in the uplink, a UE has to receive in NPDCCH the DCIof format N0, which carries the information about the resources allocated for NPUSCH,
_____________________________________________________________________________________ CNIT Technical Report-05 ꟷ Internet of Things: Technologies, Challenges and Impact
15

Table 7: Repetitions in NPDSCH and NPUSCH
Repetitions in NPDSCH
IRep 0 1 2 3 4 5 6 7 8 9 10 11 12 13 14 15
NRep 1 2 4 8 16 32 64 128 192 256 384 512 768 1024 1536 2048
Repetitions in NPUSCH
IRep 0 1 2 3 4 5 6 7
NRep 1 2 4 8 16 32 64 128
Figure 6: Uplink transmission in NB-IoT and the respective timings
the MSC and the number of repetitions to be used, as well as contains a flag playinga role of a negative acknowledgement and indicating the need of repeating the previousNPUSCH transmission. Depending on the channel conditions the DCI message itselfmay be repeated multiple (up to 2048) times. Note, that the time windows when aneNB may send a DCI packet, which are referred to in the protocol as “search spaces”are limited and happen periodically, with period depending on the configuration of thenetwork. The minimum period for search space is four subframes (remind, that durationof one subframe equals to 1 ms), but since this leaves not many resources for actual datatransfers, in practice the value of the period can be much bigger. After receiving theDCI N0 and before commencing the NPUSCH transmission the UE has to wait for 8 to64 ms, as specified by the eNB. The NPUSCH transmission itself has been discussed inthe previous subsection, and its duration depends on the number of repetitions, the TBS,the number of subcarriers and subcarrier spacing. Following the NPUSCH transmission,the UE waits for an NPDCCH search space, in which the eNB may request (by sendinganother DCI N0) the repetition of NPUSCH in case it was not received or wants toproceed with the transmission of new data. Note, that the protocol prescribes to haveat least a 3-subframe gap between the end of NPUSCH transmission and the start of thenext DCI message to this device.
16_____________________________________________________________________________________
Low-power Wide-Area Networks: A Comparative Analysis Between LoRaWAN and NB-IoT

Considering all the implications discussed above, to every NB-IoT UE’s uplink trans-mission, there is an associated signalling overhead of at least 11 subframes for NPDCCHand guard time intervals. Given this, the practical uplink throughput drops up to twice.Specifically, for 12-tone transmission Rel. 13 and Rel. 14 NB-IoT UE can achieve thethroughput of 62.5 kbit/s and 115,27 kbit/s, respectively. For single tone and frequencyseparation of ∆f=15 kHz the throughput peaks at 16.67 kbit/s and 18.87 kbit/s for Rel.13 and Rel. 14, respectively. Finally, for ∆f=3.75 kHz due to long uplink resource unitduration the maximum possible throughput does not change significantly, staying at 4.9kbit/s and 5.22 kbit/s for Rel. 13 and Rel. 14, respectively.
When this comes to the latency, the minimum one in case of uplink data equals theactual on-air time and can be as small as one subframe duration, i.e., 0.5 ms (up to 224-bitTBS with no repetitions in case of a multitone). However, this implies that the eNB hasto know exactly when the UE will have data to be transmitted and provide resources tosuch transmission in advance. This situation is hardly realistic unless the UE traffic isstrictly periodic.
Figure 7: Downlink transmission in NB-IoT and the respective timings
The phases of NB-IoT downlink transmission and their respective durations are il-lustrated in Fig. 7. Similarly to uplink transmission, the downlink transmission startswith eNB sending a DCI message within the search space time window. Note, that whenarranging a data transfer in the downlink, the format of the DCI message differs from theone used for scheduling an uplink. Specifically, the DCI format N1 message, in additionto the information on the resources and MCS to be used for transmitting the downlink,includes the scheduling information for the uplink acknowledgement (ACK) message to betransmitted by the UE following the downlink. As one can see from Fig. 7, the minimumtime gap from the end of DCI message to start of downlink data depends both on thenumber of downlink repetitions and a scheduling delay and ranges from 4 to 1028 down-
_____________________________________________________________________________________ CNIT Technical Report-05 ꟷ Internet of Things: Technologies, Challenges and Impact
17

link subframe length (equal to 1 ms). The time gap between the downlink transmissionand the following ACK transmission depends on both the scheduling and the frequencyseparation used for uplink resource grid, with the minimum duration of 12 downlink sub-frame lengths. The ACK is sent in NPUSCH using the special uplink frame type (i.e., theNPUSCH format 2). The size of the frame is fixed, and the number of repetitions is oneof the network-specific configuration parameters. Similarly to the uplink, the protocolprescribes to have at least a 3-subframe gap between the end of NPUSCH transmissionand the start of the next DCI message.
Considering all these, the maximum feasible downlink throughput for inband deploy-ment in Rel. 13 for the case of uplink frequency separation of ∆f=3.75 kHz is 21.25kbit/s, and for ∆f=15 kHz is 26.15 kbit/s. For Rel. 14, the respective numbers are 45.68kbit/s and 54.25 kbit/s, respectively. For standalone deployment for Rel. 13 and uplinkfrequency separation of ∆f=3.75 kHz the maximum downlink throughput is 21.93 kbit/sand for ∆f=15 kHz is 27.2 kbit/s. For Rel. 14 these numbers increase to 66.74 kbit/sand 79.25 kbit/s, respectively.
The minimum latency for downlink transmission is defined by the duration of the DCI,the gap between DCI and NPDSCH transmission and the duration of NPDSCH. As thiscan be seen from Fig. 7, the cumulative duration of these three phases is six subframes– i.e., 6 ms.
Note that the calculations above do not account for the signalling overhead due to thescheduled RACH windows in the uplink, or transmission of synchronization signals and SIin the downlink. These may introduce additional delays, thus reducing the throughput.
3.3 Important mechanisms
Since its initial introduction in Rel. 13 NB-IoT technology has significantly evolved,having a set of new (often optional) functionalities introduced. Since these modificationshave the potential to affect the KPIs, in what follows we briefly discuss some of them.
3.3.1 Two HARQ processes
In Rel. 13 the NB-IoT UE were restricted to have only a single HARQ process both withrespect to uplink and downlink. As a result, a UE had to wait for the previous block to beacknowledged before sending/receiving the next one. This, due to the signalling overheadand various gaps, has drastically limited the maximum throughput. This limitation hasbeen relaxed in Rel. 14 introducing for the NB2 devices the optional support of twoHARQ processes [13, 12]. In essence, the support of the second HARQ process allows adevice to send or receive the second block of data even before the first one is acknowledged,thus increasing the maximum data rate. Depending on the configuration, this can bringup to 50% improvement for the throughput.
3.3.2 Early data transmission (EDT)
The need of using RA procedure and establishing an RRC to send the data in uplink bringswith it substantial overheads for both the data delivery time and the energy consumption,which become especially notable in case if the amount of data is small. To address thisissue, the EDT mechanism has been introduced as a part of Rel. 15. This mechanism
18_____________________________________________________________________________________
Low-power Wide-Area Networks: A Comparative Analysis Between LoRaWAN and NB-IoT

allows to integrate up to 1000 bits of data [13] into Msg3 and have them acknowledgedin the following message, without even establishing the connection. Note, that for EDTspecial RACH windows are defined, different from the ones used for conventional RRCconnection establishment.
3.3.3 Other mechanisms
Among other notable mechanisms affecting the NB-IoT performance are the enablementof unacknowledged mode RLC (Rel. 15) [13], the allocation of the NPUSCH resourcesfor periodic buffer status report (BSR) transmission for connected UE (Rel. 15) [9, 13],introduction of the RLC unacknowledged mode (UM) [14] (Rel. 15), introduction ofoptional additional SIB1-NB transmissions to facilitate acquisition of SI needed to connectto the network (Rel. 15), etc.
4 Comparing the two technologies
Both LoRaWAN and NB-IoT have enormous potential for the development of manydifferent IoT applications. Smart cities and precision agriculture are among the domainsthat can benefit more from the adoption of these technologies. Indeed, in most cases,the IoT applications from such domains do not demand high throughput or low latency;their requirements are compatible with the performance offered by either of the twotechnologies.
However, the comparison between LoRaWAN and NB-IoT technologies, and the iden-tification of their actual strengths and limitations, must take into account regulatoryissues and business models, besides technical aspects.
From the regulatory viewpoint, there is a clear difference between the two technologies.NB-IoT can be deployed over existing 4G systems. Only Mobile Network Operators(MNOs) who have a 4G license can offer NB-IOT services. This is both an advantage anda drawback. The good side is that for MNOs, deploying the network is just a technicaland investment issue. In many countries all over the world, they have already deployedNB-IoT plug-ins, and there is no other issue in exploiting it from the user viewpoint.On the opposite, LoRaWAN operates on a license-exempt ISM band which is regulateddifferently from country to country. In Europe, the document providing guidelines forthe use of LoRaWAN (and other) technologies is CEPT Recommendation number 70 03.Different national authorities interpret it in various ways. To date, in Italy, it is stillnot possible to operate a LoRaWAN network on the 868 MHz band, based on currentlimitations posed by the Ministry for Economic Development. In the rest of Europe, thesame frequency band is used by many operators delivering IoT services since some timenow. Assuming that this will be solved soon also in Italy, from the user viewpoint thisfrequency band poses constraints: nodes can not go beyond the one per cent duty cycleboundary. This means that users have to ensure that their devices do not generate datatoo frequently. In most applications, this is not an issue, but potentially such limitationbrings complexity on the shoulders of the user.
The business model behind the two technologies is totally different. As mentioned,NB-IoT services can only be offered by MNOs. As long as they deploy the network,it is publicly available (upon payment of a subscriber fee). On the opposite, anyone in
_____________________________________________________________________________________ CNIT Technical Report-05 ꟷ Internet of Things: Technologies, Challenges and Impact
19

principle could offer LoRaWAN coverage; private deployments may be useful for par-ticular applications (especially in remote locations, which are not attractive to MNOs).LoRaWAN networks might be available for free in some areas, as it happens, e.g., withthe Things Network - a community of open source LoRaWAN gateway owners. LargeLoRaWAN networks are deployed in Italy by some companies for smart city applications.As long as they will be allowed to operate commercially, they will offer subscription-basedservices in large cities like Milano and others.
Finally, the technical side. Numerous differences characterise the two technologies.
• Latencies. The two systems offer comparable performance in the uplink, with la-tencies of up to about two seconds. In the downlink, however (e.g. for sendingcommands to actuators), the two options are quite different. NB-IoT has smallerlatency than in the uplink, while the LoRaWAN protocol requires transmission onthe uplink first, to piggyback packets in the downlink acknowledgements; therefore,downlink latency can be very large, depending on the uplink transmission rate ofthe device.
• Throughput. As mentioned above, NB-IoT can offer throughput in the order of some(or tens of) kbit/s. On the opposite, a LoRaWAN device has maximum throughoutseverely limited by the duty cycle constraint and typically close to few tens of bit/s.
• Security and identification. LoRaWAN with ABP is insecure. On the contrary,NB-IoT has advanced security protocols in place.
• Roaming. Sub-GHz ISM bands (normally used by MNOs for NB-IOT wide cov-erage) are not uniform around the globe, which complicates LoRaWAN trans-ocean roaming. NB-IoT terminals supporting multiple bands can handle this. Re-cently, the intra-continental roaming solutions for LoRaWAN (allowing to roambetween networks deployed in the same bands) have been delivered. However, theirwidespread adoption is still underway.
• Energy consumption. In addition to the overall consumption, the potential problemfor NB-IoT is high peak consumption and the need for a lot of energy during theinitial connection with the network. This may make it hard to enable energy-harvesting powered NB-IoT devices. Overall, for non-frequent transmission of smallamounts of data, battery duration of a LoRaWAN-powered sensor system can beone order of magnitude larger than for NB-IoT.
• IP support. NB-IoT supports IP, and many off-the-shelf transceivers implement IP-based protocols like TCP/UDP, FTP, HTTP, CoAP, MQTT. This enables seamlessintegration between NB-IoT and the Internet; whist LoRaWAN requires some formof adaptation layer (most often based on the NS) in between.
• Handover. LoRaWAN networks do not implement any sort of handover mechanism.NB-IoT has to handle it, though this requires additional signalling.
In conclusion, the two technologies differ in many aspects, and both have strengthsand weaknesses. Depending on the specific application, the best solution can be identifiedbased on the above considerations. While this is true for all countries of Europe, Italy
20_____________________________________________________________________________________
Low-power Wide-Area Networks: A Comparative Analysis Between LoRaWAN and NB-IoT

still suffers from the lack of a vision: while NB-IoT is available, LoRaWAN networks cannot be operated commercially yet. This is affecting the development of the digital agendaof the country.
References
[1] C. Gomez, J. Oller, and J. Paradells. Overview and evaluation of Bluetooth LowEnergy: An emerging low-power wireless technology. Sensors, vol. 12, no. 9, pp. 11734–11 753, 2012.
[2] M. Siekkinen, M. Hiienkari, J. K. Nurminen, and J. Nieminen. How Low Energyis bluetooth low energy? Comparative measurements with Zigbee/802.15.4. WirelessCommunications and Networking Conference Workshops (WCNCW), 2012 IEEE.IEEE, 2012, pp. 232–237.
[3] M. Research. The need for low cost, high reach, wide area connectivity for the internetof things: A mobile network operator’s perspective. White paper, 2014.
[4] F. Adelantado, X. Vilajosana, P. Tuset-Peiro, B. Martinez, J. Melia-Segui and T.Watteyne. Understanding the Limits of LoRaWAN. in IEEE Communications Mag-azine, vol. 55, no. 9, pp. 34-40, Sept. 2017.
[5] Claire Goursaud, Jean-Marie Gorce. Dedicated networks for IoT: PHY / MAC stateof the art and challenges. EAI endorsed transactions on Internet of Things, 2015.
[6] Olof Liberg, Marten Sundberg, Eric Wang Johan, Bergman Joachim Sachs. CellularInternet of Things. Technologies, Standards, and Performance. Elsevier, September2017.
[7] 3GPP TS 36.300 Group Radio Access Network. Evolved Universal Terrestrial Ra-dio Access (E-UTRA) and Evolved Universal Terrestrial Radio Access Network (E-UTRAN). Overall description. 3GPP, December 2018.
[8] LoRa Alliance. LoRaWAN Specification (V1.0.2), 2016.
[9] ETSI TS 136 211 V15.7.0
[10] ETSI TS 136 331 V15.3.0
[11] 3GPP TS 36.523-3 V13.1.0
[12] Olof Liberg, Marten Sundberg, Eric Wang Johan, Bergman Joachim Sachs. CellularInternet of Things. Technologies, Standards, and Performance. Elsevier, December2019.
[13] GSMA, NB-IoT Deployment Guide to Basic Feature set Requirement, June 2019.
[14] ETSI TR 121 915 V15.0.0
[15] Quectel, BC95 Hardware Design, https://www.quectel.com
_____________________________________________________________________________________ CNIT Technical Report-05 ꟷ Internet of Things: Technologies, Challenges and Impact
21

[16] A. Weissberger, NB-IoT, https://techblog.comsoc.org/category/nb-iot/
[17] Semtech Corporation LoRaWAN – simple rate adaptation recommended algorithmRevision 1.0, October 2016
[18] Gianni Pasolini, Chiara Buratti, Luca Feltrin, Flavio Zabini, Roberto Verdone,Oreste Andrisano, Cristina De Castro, Smart City Pilot Project Using LoRa Eu-ropean Wireless 2018; 24th European Wireless Conference, Catania, Italy, 2018, pp.1-6.
[19] L. Feltrin, M. Condoluci, T. Mahmoodi, M. Dohler and R. Verdone, NB-IoT: Per-formance Estimation and Optimal Configuration European Wireless 2018; 24th Eu-ropean Wireless Conference, Catania, Italy, 2018, pp. 1-6.
[20] L. Feltrin, C. Buratti, E. Vinciarelli, R. De Bonis and R. Verdone, LoRaWAN: Eval-uation of Link- and System-Level Performance IEEE Internet of Things Journal, vol.5, no. 3, pp. 2249-2258, June 2018.
[21] LoRa Alliance LoRaWAN 1.1 Regional Parameters, 2017
22_____________________________________________________________________________________
Low-power Wide-Area Networks: A Comparative Analysis Between LoRaWAN and NB-IoT

LoRaWAN: current status and research directions
Lorenzo Vangelista, Andrea Zanella, Michele Zorzi
Universita degli Studi di Padova
Dipartimento di Ingegneria dell’Informazione
Abstract: Among the different Low-Power Wide Area Network (LPWAN) technologies,Long-Range Wide Area Network (LoRaWAN) stands out for flexibility, performance, andopen specifications, characteristics that have been attracting interest from both the in-dustrial and scientific communities. LoRaWAN, indeed, features a number of tuneablenetwork parameters that, in principle, make it possible to better configure the system ac-cording to the specific context, thus improving energy efficiency, fairness, and capacity. Inthis chapter, we discuss the main characteristics of the LoRaWAN technology and presentsome results that shed light on the effect of different parameter settings in some illus-trative scenarios. Furthermore, we illustrate the most recent features introduced by theLoRaWAN specifications and possible future developments of the technology.
1 Introduction
As stated in [1], the Internet of Things (IoT) paradigm underpins the place-and-playconcept, according to which the end devices, i.e., the “things,” just need to be placedwhere they are needed, and are automatically and seamlessly connected to the rest of the(cyber-physical) world. Cellular networks, with their world-wide established footprint,are the ideal candidates to provide such a service, which is indeed the target of the NB-IoT standard. On the other hand, the signaling and control traffic of NB-IoT, althoughoptimized for sporadic machine-type communications, may become the bottleneck of thesystem [2].
In the meantime, a number of Low Power Wide Area Network (LPWAN) technologieshave appeared in the market, in an attempt to fill this gap. Such technologies are char-acterized by long-range links (in the orders of kilometers), and typically have a simplestar-shaped network topology, where the end nodes are directly connected to a gatewaythat, in turn, provides legacy IP connectivity with other networks or with the publicInternet. Moreover, LPWAN implements robust modulations that guarantee excellentenergy-efficiency and coverage range, at the cost of very low bitrates. Finally, mostLPWANs operate on unlicensed radio bands, thus avoiding the huge royalties to accessreserved frequencies, and adopt uncoordinated access schemes, which make it possible tosimplify the hardware and reduce the manufacturing costs and the energy consumption.
LoRaWAN is an LPWAN technology that has been gaining a considerable share ofthe market in the last years, thanks to some interesting features, such as the chirp mod-ulation used at the PHY layer that allows for long-range, robust communications, with
_____________________________________________________________________________________ CNIT Technical Report-05 ꟷ Internet of Things: Technologies, Challenges and Impact
23

low complexity, low power and low cost receivers, and the simple protocol stack. As aconsequence, a strong eco-system is growing around this technology, with partners de-veloping different parts of the systems, and integrators selling the complete solutions forboth geographical and residential/industrial types of networks.
This chapter is dedicated to the analysis of the LoRaWAN system, offering a broadoverview of its main features, from the physical layer up to the application layer. Inparticular, Sec. 2 discusses the chirp modulation that characterizes the physical layerof the technology and that, being covered by an industrial patent, is not of public do-main, and hence could only be inferred by means of reverse engineering. Sec. 3 presentsthe protocol stack, as described in the open specifications issued by the LoRa Alliance.Furthermore, the section reports the results of some studies presented in the literature,which investigate the performance of the system with different parameter settings, in anattempt to unravel the intertwining of the different elements of the system. In Sec. 4, wedescribe the network aspects of the standard, dwelling upon the roaming mechanisms andthe protocols to interconnect the end devices with the IP-based world. Sec. 5 addressesa possible extension of the application field of the technology in satellite systems, whileSec. 6 concludes the chapter by recalling the key points, and remarking limitations andpotentials of the standard.
2 The physical layer
2.1 The LoRa modulation
The LoRa modulation, i.e., the physical layer of LoRaWAN, has never been officiallydisclosed by Semtech, the company owning the patents on the LoRa modulation andproducing the chips implementing it. Nevertheless, several attempts have been made toreverse engineer the LoRa modulation, the first ones appeared only on-line in Internetwebpages, such as [3]. To the best of the authors’ knowledge, instead, the first paperpublished in the archived literature was [4], while the first mathematically rigorous de-scription of the LoRa modulation was presented in [5]. The latest and correct1 descriptionof the LoRa modulation is provided in [6], which we will take as reference for the notation.
Following [6], we denote by SF the so–called Spreading Factor (SF) parameter, whichcan take any integer value from 7 to 12, by B the bandwidth of the modulated signal,by f0 the carrier frequency, and by Ts the symbol period, with Ts = MTc and Tc = 1/B.Therefore, for the LoRa M -ary modulation, with M = 2SF , in the band [f0 − B/2, f0 +B/2], the complex envelope of the transmitted signal in the symbol interval [0, Ts) for atransmitted symbol a ∈ {0, 1, . . .M − 1} is given by:
x(t; a, SF )=exp
{2πBt
(a
M− 1
2+Bt
2M
)−u(t−M − a
B
)}(1)
where
u(t) =
{1 , t ≥ 0
0 , otherwise.(2)
1[5] contains a minor error, i.e., a 1/2 in the quadratic term of the phase.
24_____________________________________________________________________________________
LoRaWAN: current status and research directions

frequency axis
time axis
1T 2T 3T 4T
−B2 + 14
1T
−B2 + 24
1T
−B2 + 34
1T
−B2 + 44
1T
−B2 + 0 · 1T
Figure 1: Example of LoRa modulation’s instantaneous frequency patterns with SF=2:in magenta the case a = 0, in red the case a = 1, in blue the case a = 2 and eventuallyin green the case a = 3 = 2SF − 1.
A pictorial representation for a simple case (i.e., taking SF = 2) of the instantaneousfrequency of the LoRa signal for different modulated symbols is shown in Fig. 1. Althoughthe LoRaWAN specifications constrain the Spreading Factor to be in the range 7–12, inFig. 1 we set SF = 2 just to illustrate the concept without making the picture unreadable(with SF = 7, we would have had 128 lines). This consideration also applies to Fig. 2.
The complex envelope of the transmitted LoRa signal is then, again with reference to[6],
x(t;SF ) =+∞∑
n=−∞x(t− nTs; an, SF )gTs
(t− nTs) ; (3)
where
gTs(t) =
{1 , 0 ≤ t ≤ Ts0 , otherwise.
(4)
The LoRa modulation, as defined in (1), exhibits several important properties:
1. it is a constant envelope modulation (this is a key enabler for low power consumptionin power amplifiers);
2. it is a continuous phase modulation i.e., the phase at the beginning and at the endof a symbol is the same;
3. while the sequences x(kT ) are orthogonal, it is not, strictly speaking, an orthogonalmodulation (see [6]);
4. it exhibits lines in the power spectral density, although of power almost irrelevant,for SF ≥ 7, with respect to the power of the continuous part of the power spectraldensity;
_____________________________________________________________________________________ CNIT Technical Report-05 ꟷ Internet of Things: Technologies, Challenges and Impact
25

frequency axis
time axis
1T 2T 3T 4T
−B2 + 14
1T
−B2 + 24
1T
−B2 + 34
1T
−B2 + 44
1T
−B2 + 0 · 1T
14
1T
24
1T
34
1T
44
1T
Figure 2: Example of LoRa demodulation’s instantaneous frequency patterns for thesampled signal with SF = 2 and a = 1: in red the instantaneous frequency of thetransmitted signal for the case a = 1, in solid blue the downchirp, in dashed blue thedownchirp folded on top (the frequency domain is periodic) and in green the result of themultiplication.
5. its power spectral density is not limited to the interval [−B/2, B/2], although thepower of the energy outside the interval [−B/2, B/2] is negligible for SF ≥ 7.
The structure of the demodulator for the LoRa modulation is basically made by asampling of the received signal, followed by a multiplication of the signal by a downchirp
e2πB2t2
2M
followed by a Discrete Fourier Transform (DFT). In the case of non-coherent detection,the transmitted symbol a corresponds to the index of the bin with the greatest magnitudein the DFT output, whereas for coherent demodulation it is associated to the index ofthe bin with the greatest real part. In Fig. 2 a pictorial view of the demodulation in thesampled signal domain is provided.
The computation of the Bit Error Rate for uncoded transmission has been carried outin [7].
26_____________________________________________________________________________________
LoRaWAN: current status and research directions

2.2 On the orthogonality of LoRa Signals with different Spread-ing Factors
As we will see in Section 3, in LoRaWAN packets from the different End Nodes (ENs) andfrom the gateways are multiplexed in time in the same band [f0 − B/2, f0 + B/2]. Thechoice of the SF for these packets is determined by the Adaptive Data Rate algorithm(see Section 3) that is applied to each link. Ideally, packets overlapping in time andfrequency, but using different SFs, should not interfere, while some mutual interferencecan be expected when the packets are transmitted with the same SF. In other words, thenaive idea which is behind many descriptions (even in the early academic literature) ofthe LoRaWAN system is that it is made of several parallel and non-interfering channels,one for each SF. Unfortunately, this is not the case, as can be easily demonstratedmathematically.
Although not strictly orthogonal, still transmissions with different SFs generate littlemutual interference and are often said to be quasi–orthogonal, or it is said that there isgood isolation between packets with different SFs. The first quantitative results on theisolation of transmissions with different SFs are reported in [4]. A couple of remarks arein order for the results reported in [4]:
1. unfortunately, no description is reported on the methodology used to derive theresults;
2. the isolation between packets with the same SF is 6 dB, which means that if twopackets with the same SF clash in time and frequency, the strongest one can becorrectly demodulated if its received power is at least 6 dB higher than that of theother packet; otherwise both packets cannot be demodulated.
Considerable work has been done in assessing the isolation between the different SFsand – at the time of writing – the state of the art is [8]. In [8] first of all a clear methodologyis presented for the software simulations carried out to assess the isolation; furthermore,the simulation results in [8] have been validated with a hardware emulation. A couple ofremarks are in order for [8] too:
1. the results differ significantly from those reported in [4] and, as discussed above,they appear to be much more reliable;
2. the results for interfering packets with the same SF show that the isolation is around0 to 1 dB, which means that, in practice, the packet arriving with stronger poweris demodulated correctly. This results into the so–called capture effect, which cansubstantially impact the network level performance.
3 The LoRaWAN protocol stack
One of the most interesting features of LoRaWAN is the simplicity of its architecture andprotocol stack [9, 10]. Fig. 3 sketches the protocol stack of the three main elements of theLoRaWAN architecture, namely the End Node (EN), Gateway (GW), and Network Server(NS). The LoRa EN, which is also referred to as End Device (ED), is the most peripheralelement of the network, and can be any device (typically equipped with sensing units)
_____________________________________________________________________________________ CNIT Technical Report-05 ꟷ Internet of Things: Technologies, Challenges and Impact
27

Figure 3: LoRaWAN Protocol Stack.
capable of communicating through the LoRa wireless interface. The LoRa GW providesseamless connection towards the IP legacy technologies, making it possible to exchangedata between LoRa nodes and the NS. Finally, the NS is in charge of the managementof the whole system: it sets the tuneable parameters, gets the data from the LoRa nodesto the server-side applications and back, sends Acknowledgment (ACK) messages to theperipheral nodes (when required), and so on.
The standard defines three operating modes for the EDs, namely Class A (All), Class B(Beacon), and Class C (Continuous). In Class A mode, the radio interface is activatedonly to transmit an uplink (UL) data packet. After each transmission, the EN opens twoconsecutive receive windows during which it can receive downlink (DL) packets from theNS (through one of the GWs). In Class B mode, ENs get time-synchronized by beaconstransmitted by the GWs, and wake up periodically to receive possible DL packets. InClass C mode, finally, ENs keep their radio interface always active and can transmit andreceive at any time. Clearly, the energy consumption of the nodes is strongly impactedby the operating mode and most battery-powered devices operate in Class A mode.
The ENs can opt for unconfirmed transmission, which does not entail any reply fromthe network, or confirmed transmission that, instead, requires an ACK from the NS inone of the two reception opportunities after the transmission. In case of missing ACK, aconfirmed packet is re-transmitted for at most m− 1 additional times, where the settingof the parameter m and of the timing of the retransmissions for the same confirmedmessage is at the discretion of the EN and may be different for each EN. If still notacknowledged after m transmissions, the packet is generally dropped, although the ENmay be programmed to try again with a lower data rate. It is worth noting that thereception windows are opened also for unconfirmed transmissions, in order to receivepossible DL packets.
The ENs’ transmissions are not addressed to any particular GW, but rather receivedand forwarded to the NS by all GWs in the coverage range of the transmitter. We notethat commercial GWs (e.g., [11]) support multiple parallel reception chains, which makeit possible to decode multiple overlapping signals, provided that they use different SFs
28_____________________________________________________________________________________
LoRaWAN: current status and research directions

and have sufficient received powers, as explained in Sec. 2.2. However, the GWs do notsupport full-duplex transmission, so that, at any given time, they can either transmit orreceive.
Duplicate packets are dropped by the NS, which can use side information (e.g., thereceived signal strength) passed along by the GWs to rank the GWs to be used for possibleDL transmission to the EN.
The standard also defines the frequency bands, power, and Duty Cycle (DC) restric-tions that apply to the different regions. Tab. 1 shows the configuration mandated forthe European region, which entails three default bidirectional channels that shall be im-plemented in every EN, and a fourth channel reserved for DL transmissions only. Wenote that, according to the ETSI EN300.220 regulations, the first three channels sharethe same DC limitation. Indeed, the regulations limit to 36 seconds per hour the totaltransmission time of a device transmitting in the frequency band from 868.0 MHz to 868.6MHz, which corresponds to a DC limit of 1%. We remark that this limit applies to theaggregate transmission time in this subband, i.e., the DC constraint is shared among thethree channels. Conversely, the fourth channel falls in a different frequency range, forwhich the DC limit is relaxed to 10%.
Table 1: Available LoRaWAN channels in Europe (see [12])
Frequency [MHz] Use Duty Cycle
868.1 UL/DL 1%, shared868.3 UL/DL 1%, shared868.5 UL/DL 1%, shared869.525 DL 10%, dedicated
3.1 Performance analysis when varying the system parameters
The performance of LoRaWAN networks has been widely studied in the literature, in thelast few years [13, 14]. Most studies assume UL-only traffic, focusing on pure monitoringscenarios. Under these assumptions, LoRaWAN is proved to be able to support hundredsof devices, spread over an area of several square kilometres, that generate traffic withinter-packet periods that vary from 30 minutes to 24 hours, for an aggregate traffic ofup to 0.8 packet/s, with a reliability of about 95% with a single GW. The capacity ofthe system can be further extended by deploying multiple GWs and/or adopting smartstrategies to assign the SFs to the different ENs [15]. Also, advanced Adaptive Data Rate(ADR) algorithms can further improve the performance [16].
Interestingly, the presence of DL traffic (including ACKs) is a game changer. Asobserved in some recent studies, indeed, the use of confirmed traffic (which requiresACKs to be returned by the NS) may enhance the data collection capabilities of thenetwork as long as the overall load is light (less than 0.8 packet/s, according to [17]),but can yield significant performance degradation for higher loads, thus reducing thesystem scalability. Furthermore, it has been observed that, in scenarios with a mixtureof unconfirmed (UL-only) and confirmed traffic, the unconfirmed traffic is particularlypenalized, since a number of packets are dropped because of interference at the GW,
_____________________________________________________________________________________ CNIT Technical Report-05 ꟷ Internet of Things: Technologies, Challenges and Impact
29

collision with the transmission of DL ACKs (which are usually prioritized over receptions),or unavailability of free receive paths at the GW.
Some of these inefficiencies can be alleviated by appropriately changing some systemsettings. A first clear advantage is obtained by relaxing the DC constraint at the GW,which may prevent the transmission of ACKs for successfully received UL packets thatrequire confirmation. Note that, while relaxing the DC constraint of a device wouldviolate the regulations, a similar effect can be lawfully obtained by deploying multipleGWs to be used by the NS for DL transmissions in a load-balancing manner, so as toeffectively divide the off time required by the regulations among multiple GWs.
As mentioned, another cause of packet losses is the collision of UL and DL transmis-sions. In particular, a GW may get a DL packet from the NS to be forwarded to anEN, while busy receiving one (or more) UL transmission(s). In this case, the standardbehavior requires the GW to interrupt any ongoing reception, in order to transmit the DLpacket. This is indeed meaningful, considering that a missed ACK would determine theretransmission of a packet that was already correctly delivered to the NS. On the otherhand, giving priority to the ongoing reception, hence deferring the ACK transmission tothe second receive window (if available), may potentially improve the system capacity.This option has been investigated in [17], where it has been observed that it may indeedimprove the performance of both confirmed and unconfirmed traffic in mixed traffic sce-narios. However, this ACK-prioritization option may also lead to congestion in the DLchannel, if the amount of confirmed traffic is significant. A possible workaround suggestedby the authors in [17] consists in the definition of two classes for the confirmed traffic,namely strongly-confirmed and loosely-confirmed. The underlying idea is that applicationsthat need an explicit feedback from the NS should send strongly-confirmed packets, whilethe loosely-confirmed packets can be used whenever the application’s goal is to deliverits packets to the NS, so that ACKs are useful to avoid useless retransmissions, but theirreception is not actually critical for the application per se. Clearly, the transmission ofACKs for strongly-confirmed packets should be prioritized over reception, while the otherACKs could be sent only if the GW is idle.
Yet another approach to mitigate the bottleneck effect due to the DC limitations ofthe GW is to change the standard setting of the ACK mechanism. According to thecurrent LoRaWAN specifications, whenever the NS sends an ACK in response to a suc-cessfully received confirmed packet, the ACK should be either transmitted in the firstreceive window (RX1), matching the channel and SF of the UL packet, or in the secondreceive window (RX2), using the channel reserved to DL transmissions and transmittingwith the lowest bitrate, corresponding to SF = 12, so as to increase the probability ofcorrect reception of the ACK. However, this approach yields longer transmission times ofACKs, which will rapidly consume the DC budget at the GW. A more efficient solutionmay consist in adopting an ADR scheme also for ACK transmissions. A possible imple-mentation may consist in simply using the same SF of the UL transmission also for theACKs sent in RX2, or in increasing by a certain factor such an SF to gain robustnessto possible asymmetries in the channel gains, and/or in the receiver sensitivities. Asobserved in [17], this simple solution may actually bring significant performance gains, inparticular in combination with the prioritization of the reception over the transmissionof ACKs.
30_____________________________________________________________________________________
LoRaWAN: current status and research directions

EN
Network Server
Application ServerJoin Server
Figure 4: The LoRa network
4 LoRaWAN networking
4.1 LoRaWAN backend
Fig. 4 offers an overview of a LoRaWAN network that, in addition to the three elementsalready mentioned in Sec. 3, includes two additional servers for security and data delivery(the Join Server and the Application Server). We note that the only elements that belongto the core network of a LoRaWAN operator are the NS and the GWs.
As mentioned, the NS is responsible for the MAC Layer and the radio resource man-agement. In particular, it assigns the SFs to the ENs, manages the band in which theEN should work, and so on, using a control link (shown in red in Fig. 4) encrypted withsession keys, which are obtained via the Join Server.
The Application Server is responsible for the services (down to the raw data) associatedwith an EN, using a data link (shown in blue in Fig. 4), which is also encrypted usingsession keys provided by the Join Server.
It must be noted that the keys encrypting the data link and the control link aredifferent by design and specific to each EN. As a consequence, an NS cannot access theuser data. Furthermore, even if the keys of an EN are compromised, the security of theother ENs would be unaffected.
We should remark that the Join Server is not necessarily owned by the network opera-tor but rather, and more commonly, owned and run by a third party, trusted by both thenetwork operator and the owners of the ENs. Furthermore, different ENs may refer todifferent Join Servers. The Join Server is actually at the core of the security architectureof the LoRaWAN network as it stores the keys specific to an EN, from which session keysare derived and handed over to the NS and the Application Server. The Join Server canbe compared to a certification authority issuing certificates for the usual web.
_____________________________________________________________________________________ CNIT Technical Report-05 ꟷ Internet of Things: Technologies, Challenges and Impact
31

1
1
2
2
1
2
EN1
Network C Server
Network B Server
Home Network Server
Join Server
Application Server
Figure 5: Passive roaming
A final note is about the “master keys” for both the signaling and the user datatransfer: the EN manufacturer is responsible for storing them in a secure way in the ENand getting them to a trusted Join Server, once again in a secure way, not using anyLoRaWAN network.
4.2 The LoRaWAN global roaming
Roaming in LoRaWAN refers to the possibility for an EN to connect to the Home Network(the network which manages the EN, its subscription, billing, etc.) via another network,called Foreign Network and run by another operator. Roaming agreements with relatedcharging policies for ENs when in Foreign Networks must be in place for the roaming towork.
There are two types of Roaming in LoRaWAN:
1. Passive Roaming;
2. Active Roaming.
Passive Roaming is illustrated in Fig. 5. In this case we have three networks whose ge-ographical coverage areas are, at least partially, overlapping. In Fig. 5 the Home Networkis depicted in green, in all the three components: the NS, the GWs, and a target EN.There are then two Foreign Networks, depicted in red and blue, that are supposed to haveroaming agreements with the Home Network. As we can see from Fig. 5, the GWs arecovering the same geographical area so that there can be reliable links from the EN to (atleast) one GW of any of the three networks. The packet sent by the EN can be collectedby both the Home and Foreign Network’s GWs and, according to the operational mode
32_____________________________________________________________________________________
LoRaWAN: current status and research directions

for Passive Roaming, is just relayed, without taking any further action, to the HomeNetwork Server. The Home Network Server, then, is able to select the version of thepacket that is received with the best quality from any of the GWs and uses the selectedGW for a possible downlink transmission to the EN and to run the Adaptive Data Ratealgorithm.
There are several benefits of Passive Roaming:
• the EN sees a dense network even if its Home Network is not really dense, withbenefit for the battery lifetime since most likely the Adaptive Data Rate algorithmwill select lower SFs;
• there will be less overall interference in the area, since most of the nodes will geta low SF and a low transmit power (we recall that - although often neglected inacademic papers - LoRaWAN supports power control);
• the overall Capital Expenditure will be lower, since each operator can install fewerGWs, without compromising the Quality of Service.
It is important to highlight that Passive Roaming is possible in LoRaWAN becausethe GWs are stateless and just relay packets. This is not the case for example for NB-IoT.It is also important to highlight that, in the case of Passive Roaming, the EN is controlledby the Home Network, as far as the Layer 2 protocol is concerned (for example, MACcommands are issued by the Home Network Server).
Active Roaming (available for networks and ENs supporting the version 1.1 and aboveof the LoRaWAN specifications) is very similar to the usual roaming for cellular wirelessnetworks. In this case, the Layer 2 protocol control is handed over by the Home Networkto another network, often called Visited Network.
Actually, the two types of roaming can be combined as shown in Fig. 6, where NetworkB (depicted in blue) represents the Visited Network, while Network C (depicted in red)and Network D (depicted in violet) support Passive Roaming with the Visited NetworkB. The Layer 2 protocol controller (including the Adaptive Data Rate algorithm and thepower control) in this case is the Network Server of Network B, while the Home NetworkServer (called Anchor Network Server) is still in charge of the security and the deliveryof the user data to the Application Server.
In conclusion, LoRaWAN provides multiple and flexible roaming modes, enablingdifferent business models. A particularly important business model, which is gainingmomentum, corresponds to a large organization that owns the Home Network Server andthe Application Server for its devices, which are always in Passive Roaming on othernetworks. This business model enables such an organization to have full control over itsown devices and their specific characteristics without actually entirely owning the physicalinfrastructure; the full control of the devices through the aforementioned Network Server,and especially the Application Server, allows for the provision of controlled and unifiedaccess to the services provided by the ENs of the organization.
4.3 The LoRaWAN IP networking
It is well known that the actual definition of “Internet of Things” involves the connectionof the “Things” to the Internet. As a consequence, any communication system for the
_____________________________________________________________________________________ CNIT Technical Report-05 ꟷ Internet of Things: Technologies, Challenges and Impact
33

1
1
2
EN1
Network D Server(forwarding Network Server)
(controlling gateways)
Network C Server(forwarding Network Server)
(controlling gateways)
Network B Server(L2 controller)
Home Network Server(anchor)
Join Server
Application Server
ActiveRoaming
Passive
Roaming
Figure 6: Active and passive roaming
Internet of Things must support the IP (Internet Protocol) down to the “Things.” Forthe “plain” LoRaWAN architecture, this is actually not true because, in most cases, thedata transport from the Application Server is done via the Message Queueing TelemetryTransport (MQTT) protocol [18], in which the node is identified via a “topic” of theMQTT protocol rather than an IP address.
However, the successful work of the IETF “LPWAN Working Group” led to the devel-opment of the Static Header Compression Protocol (SCHC, pronounced “chic”), enablingend–to–end IPv6 connectivity for the ENs in a generic Low Power Wide Area Network(LPWAN), such as LoRaWAN. It must be remarked that the SCHC protocol works aswell for other LPWANs, such as SigFox and NB-IoT, paving the way for an effectiveinteroperability between, e.g., LoRaWAN and NB-IoT.
SCHC is actually a compression and segmentation protocol and is not the first onedeveloped by IETF, the most important predecessors being ROHC [19] and 6LoWPAN[20]. The need for a new compression protocol stems from the fact that 6LoWPAN relieson some specific mechanisms of the IEEE 802.15.4 standard, which are not supportedby the LPWANs, while ROHC relies on a dynamic exchange of information between thesource and the destination in order to build the best compression rules and this is againnot possible (or too heavy) in LPWANs.
The main characteristic of SCHC is the fact that it is a “static” and stateless protocol.The rules for compression (and decompression) are set before the EN enters the networkand are stored in the memory of the EN and the NS. It is not possible to add or replaceany rule after the EN has been finally commissioned. This enables a strong compres-sion, relying on the fact that the set of messages to and from the ENs is very limited(for example, for a temperature-monitoring sensor, the messages are probably limited to“read the temperature,” “send an alarm in case the temperature is above/below a certainthreshold,” and very few others).
34_____________________________________________________________________________________
LoRaWAN: current status and research directions

LoRaWAN
SCHC
IPv6
UDP
CoAP
Gateway Network Server
SCHC
IPv6
Application Server
IPv6
UDP
CoAP
Figure 7: The protocol stacks in the different nodes when using SCHC.
Fig. 7 illustrates a possible architecture for the use of the Constrained ApplicationProtocol (CoAP) in LoRaWAN networks. CoAP is a service layer protocol, designedby the IETF Constrained RESTful Environments Working Group to ease the design ofweb-based applications in resource-constrained internet devices. As it can be seen fromthe figure, CoAP relies on the UDP and IPv6 protocols, whose (typically long) headersare compressed by SCHC before transmission over LoRaWAN.
5 Satellite based LoRaWAN networks
In the last few years satellite communications for the Internet of Things has become ahot topic for both industry and academia. In [21], an overview is provided on this topic.Clearly, the interest in such a type of connectivity for the Internet of Things is triggeredby the need/opportunity to provide IoT services in areas in which it is not economically ortechnically viable to provide them via terrestrial networks. Examples include the oceansand the rural areas. LoRaWAN is addressed in [21] as one of the systems capable ofproviding IoT connectivity via satellite.
The types of satellites are typically Low Earth Orbit (LEO) satellites, whose orbitis about 500-600 km above the earth. LEO constellations for LoRaWAN connectivityare already in a pre–commercialization phase; some satellites have already been launchedand the connectivity has been tested by companies like Lacuna Networks, supported bythe European Space Agency, and Semtech, the provider of the chips for LoRa ENs andGateways. Companies like Lacuna Networks are taking advantage of the trend to use(relatively) low cost CubeSat satellites.
Unfortunately, while IoT satellite networks are undoubtedly interesting from boththe commercial and the technical point of view, there are not so many technical detailsavailable in the literature. It is clear that the link from the ENs to the satellites must beof the same type (same type of modulation and coding at least) as that of the terrestrialnetworks. There are multiple reasons for this, including:
1. economical: the market for purely satellite IoT is not large enough to drive downthe costs of the components;
2. regulatory: to re-use for the satellite network existing chipsets originally intendedfor the terrestrial LoRa links, ENs must use the same bands allocated for the terres-trial networks: the EN, as far as the regulatory framework is concerned, basically“pretends” to transmit to a terrestrial infrastructure but the satellites are “smart”enough to be able to collect the packets from these nodes.
_____________________________________________________________________________________ CNIT Technical Report-05 ꟷ Internet of Things: Technologies, Challenges and Impact
35

In the architecture of these types of networks, the link from the satellites (acting as flyinggateways) to the Network Server is based on specific satellite bands and modulations.
The main challenge at the architectural level is how to provide connectivity from thesatellites to the terrestrial ENs. As a matter of fact, the ENs are regular terrestrial nodesbut the satellite cannot use the bands allocated for terrestrial communications. A clearsolution to this problem – to the best of the authors’ knowledge – is still lacking or has notyet been disclosed by the companies that are going to offer the LoRaWAN satellite ser-vice. Moreover, one needs to take into account that, most likely, the LoRaWAN protocolcannot accommodate the delays which are typical of satellite networks. As a consequence,modifications in the protocol could be needed, which however would require a reconfigura-tion of the ENs parameters in case of roaming into terrestrial networks. Such a roaming,on the other hand, is likely needed in case of mobile LoRaWAN nodes connected to asatellite network that transit in a densely populated area. As a matter of fact, a satellitebeam will likely “illuminate” (i.e., cover) a wide area. In urban environments, such anarea may contain thousands of LoRa nodes, and the satellite gateway will receive all thepackets generated by such nodes (and gateways) in the illuminated area, irrespective ofwhether they belong to a terrestrial or satellite network. If the number of such nodes istoo large, the satellite gateway may be unable to decode the messages coming from theENs of its own network because of the interference produced by the other nodes in thearea. Therefore, these satellite LoRaWAN networks seem to be able to work only whenthe covered are contain a limited number of LoRaWAN nodes. In the authors’ opinion,this problem can be solved only by letting the mobile nodes of the LoRaWAN satellitenetwork roam into the terrestrial network, when needed.
Summarizing the above discussion, one can see that there are conflicting requirements,and it is not clear how they can be solved in LoRaWAN satellite networks (which are areality), for example:
1. how to implement the link of the satellite networks toward the ENs;
2. how to have a LoRaWAN certified EN (i.e., obeying the LoRaWAN specificationsas set by the LoRa Alliance) working in a satellite LoRaWAN network, if one takesinto account the delays;
3. how the satellite gateway can survive the huge interference it collects when flyingover areas with terrestrial LoRaWAN networks, taking into account that the satellitebeam will most likely collect the transmissions of all the terrestrial ENs connectedto tens or hundreds of terrestrial gateways for the same area.
These issues, which are mostly at the network/architectural level, compound with theissue of the link physical layer performance. In [22], the authors (one of whom is withInmarsat, a leading satellite company which invested in Actility, the company with thelargest share in the LoRaWAN network server market) call for a redesign of the LoRademodulator in the satellite, taking into account the impairments coming, e.g., from theDoppler effects. However, the re-design provided in [22] does not take into account some“tricky” details in the LoRa modulation chain such as the data whitener, etc. Withoutthe full cooperation of Semtech, owning the intellectual property of the complete LoRamodulation chain, it looks then very hard to deploy such a receiver in an FPGA to beplaced in the satellite (or, as [22] suggests, in a terrestrial site where we suppose that the
36_____________________________________________________________________________________
LoRaWAN: current status and research directions

signal received from the satellite is relayed). On the other hand, relying on commercialoff–the–shelf chipsets does not look possible because of the issues highlighted in [22], asit looks hard to expect that a satellite version of the chipset for the gateway is releasedby Semtech since the market would be too small to justify the investment.
As a conclusion for this section, we can say that, while promising as a concept, Lo-RaWAN satellite networks pose a number of problems, both on the commercial and onthe technical side, which may prevent their adoption in the near future.
6 Conclusions
This chapter has provided a general introduction to the LoRaWAN architecture andprotocols, dwelling upon its main features, such as the chirp modulation at the physicallayer, the set of tuneable parameters at the MAC layer, and the roaming among networksmanaged by different operators.
From this analysis, it appears clearly that LoRaWAN, like other LPWAN systems,fills a gap in the arena of wireless communication technologies, providing a very flexible,secure, energy efficient, easy to deploy, and relatively low cost means to connect a multi-tude of nodes with low traffic demands. Furthermore, the roaming mechanisms can favorthe adoption of this technology, by reducing the capital expenditure for its deployment,while improving the coverage and the quality of service provided to the ENs.
Such features have attracted the attention of both the academic and the industrycommunities, and the recent literature has been enriched by a number of studies aimed atinvestigating the challenges and the opportunities provided by this interesting technology.
These studies have revealed some subtle interdependencies among the tuneable pa-rameters of the system, whose standard settings may actually result in suboptimal per-formance for some application scenarios, in particular in the presence of confirmed traffic.Furthermore, when considering applications that require some downlink traffic, the DCconstraint of the GWs may become a bottleneck that limits the capacity of the system.This opens the way to the analysis of alternative frequency-sharing mechanisms, in par-ticular based on Listen-Before-Talk (LBT) techniques that can be used in place of theDC regulations. Such techniques are typically considered for short-range wireless tech-nologies, but are deemed unsuitable for LPWAN systems, which have coverage ranges inthe order of several kilometers and a star topology, conditions that exacerbate mutualinterference and hidden node problems. Nonetheless, some recent studies have provedthat the smart combination of LBT, DC, and rate-adaptation techniques can effectivelyenlarge the LoRaWAN capacity [23, 24].
In a multi-GW scenario, we can expect better performance for both UL and DL traffic,provided that each EN is covered by more than one GW and the NS wisely distributesthe load among such GWs, thus alleviating the DC constraint. On the other hand, thedegrees of freedom in the system configuration will also considerably increase with thenumber of GWs, making the setting of the system parameters more difficult.
These results motivate the development of accurate mathematical models of the systemthat can capture such interdependencies and provide accurate performance estimates, soas to enable a more accurate and informed network planning.
As a final consideration, we observe that the adoption of LPWAN technologies, in-cluding LoRaWAN, is slowed down by the wariness of the stakeholders in betting on one
_____________________________________________________________________________________ CNIT Technical Report-05 ꟷ Internet of Things: Technologies, Challenges and Impact
37

specific technology as the possible winner in the race to conquer the market. In thisrespect, the SCHC protocol, facilitating the interconnection among the different LPWANtechnologies, can act as a catalyst for the massive deployment of such systems.
References
[1] L. Vangelista, A. Zanella, and M. Zorzi, “Long-range IoT technologies: The dawnof LoRaTM,” in Future access enablers of ubiquitous and intelligent infrastructures.Springer, 2015, pp. 51–58.
[2] A. Biral, M. Centenaro, A. Zanella, L. Vangelista, and M. Zorzi, “The challengesof M2M massive access in wireless cellular networks,” Digital Communications andNetworks, vol. 1, no. 1, pp. 1–19, Feb. 2015.
[3] Bertrik Sikken, “Decoding LoRa,” https://revspace.nl/DecodingLora, online; ac-cessed May 20, 2020.
[4] C. Goursaud and J.-M. Gorce, “Dedicated networks for IoT: PHY/MAC state of theart and challenges,” EAI Endorsed Transactions on Internet of Things, vol. 1, no. 1,pp. 1–11, Oct. 2015.
[5] L. Vangelista, “Frequency shift chirp modulation: the LoRa modulation,” IEEESignal Processing Letters, vol. 24, no. 12, pp. 1818–1821, Dec. 2017.
[6] M. Chiani and A. Elzanaty, “On the LoRa modulation for IoT: Waveform propertiesand spectral analysis,” IEEE Internet of Things Journal, vol. 6, no. 5, pp. 8463–8470,May 2019.
[7] T. Elshabrawy and J. Robert, “Closed-form approximation of LoRa modulation BERperformance,” IEEE Communications Letters, vol. 22, no. 9, pp. 1778–1781, Jun.2018.
[8] D. Croce, M. Gucciardo, S. Mangione, G. Santaromita, and I. Tinnirello, “Impact ofLoRa imperfect orthogonality: Analysis of link-level performance,” IEEE Commu-nications Letters, vol. 22, no. 4, pp. 796–799, Jan. 2018.
[9] M. A. Erturk, M. A. Aydın, M. T. Buyukakkaslar, and H. Evirgen, “A survey onLoRaWAN architecture, protocol and technologies,” Future Internet, vol. 11, no. 10,pp. 1–34, Oct. 2019.
[10] M. Centenaro, L. Vangelista, A. Zanella, and M. Zorzi, “Long-range communicationsin unlicensed bands: The rising stars in the IoT and smart city scenarios,” IEEEWireless Communications, vol. 23, no. 5, pp. 60–67, Nov. 2016.
[11] Semtech Corporation, SX1301 datasheet, June 2014.
[12] “LoRaWAN Regional parameters v1.1, LoRa Alliance,” https://lora-alliance.org/resource-hub/lorawanr-specification-v11, online; accessed May 20,2020.
38_____________________________________________________________________________________
LoRaWAN: current status and research directions

[13] M. Centenaro, L. Vangelista, and R. Kohno, “On the impact of downlink feedbackon LoRa performance,” in IEEE 28th Annual International Symposium on Personal,Indoor, and Mobile Radio Communications (PIMRC). IEEE, 2017, pp. 1–6.
[14] V. Di Vincenzo, M. Heusse, and B. Tourancheau, “Improving downlink scalability inLoRaWAN,” in IEEE International Conference on Communications (ICC). IEEE,2019, pp. 1–7.
[15] J.-T. Lim and Y. Han, “Spreading factor allocation for massive connectivity in LoRasystems,” IEEE Communications Letters, vol. 22, no. 4, pp. 800–803, Jan. 2018.
[16] N. Benkahla, H. Tounsi, S. Ye-Qiong, and M. Frikha, “Enhanced ADR for LoRaWANnetworks with mobility,” in 15th International Wireless Communications & MobileComputing Conference (IWCMC). IEEE, 2019, pp. 1–6.
[17] D. Magrin, M. Capuzzo, and A. Zanella, “A thorough study of LoRaWAN perfor-mance under different parameter settings,” IEEE Internet of Things Journal, vol. 7,no. 1, pp. 116–127, Jan. 2020.
[18] “ISO/IEC 20922:2016 [ISO/IEC 20922:2016] information technol-ogy — message queuing telemetry transport (MQTT) v3.1.1,”https://www.iso.org/standard/69466.html, online; accessed May 20, 2020.
[19] https://datatracker.ietf.org/wg/rohc/charter/, online; accessed May 20, 2020.
[20] C. Bormann, Z. Shelby, “6LoWPAN: the wireless embedded Internet,” John Wiley& Sons, vol. 43, 2011.
[21] Z. Qu, G. Zhang, H. Cao, and J. Xie, “LEO satellite constellation for Internet ofThings,” IEEE Access, vol. 5, pp. 18 391–18 401, Aug. 2017.
[22] G. Colavolpe, T. Foggi, M. Ricciulli, Y. Zanettini, and J.-P. Mediano-Alameda, “Re-ception of LoRa signals from LEO satellites,” IEEE Transactions on Aerospace andElectronic Systems, vol. 55, no. 6, pp. 3587–3602, Apr. 2019.
[23] J. Ortın, M. Cesana, and A. Redondi, “Augmenting LoRaWAN performance withlisten before talk,” IEEE Transactions on Wireless Communications, vol. 18, no. 6,pp. 3113–3128, Apr. 2019.
[24] D. Zucchetto and A. Zanella, “Uncoordinated Access Schemes for the IoT: Ap-proaches, Regulations, and Performance,” IEEE Communications Magazine, vol. 55,no. 9, pp. 48–54, Sep. 2017.
_____________________________________________________________________________________ CNIT Technical Report-05 ꟷ Internet of Things: Technologies, Challenges and Impact
39


LoRaWAN: a Deep Dive in a Large Scale Deploymentand in Radio Access Optimization Strategies
Giuseppe Bianchi1,2, Francesca Cuomo1,3, Domenico Garlisi1,4, Patrizio Pisani5
and Ilenia Tinnirello1,4
1Consorzio Nazionale Interuniversitario per le Telecomunicazioni (CNIT)
2University of Roma ”Tor Vergata”, Italy
3University of Rome ”La Sapienza”, Italy
4University of Palermo, Italy
5UNIDATA S.P.A., Italy
Abstract: Low-Power Wide Area Networks (LPWANs) represent one key enablingtechnology for the Internet of Things (IoT). LPWAN capabilities are long range, deep pen-etration, and ultra-low power consumption. Among the LPWAN emerging technologies,LoRaWAN (Long Range Wide Area Network) is a successful network infrastructure forultra-low power device communication based on Long Range (LoRa) modulation, patentedby Semtech. LoRa exploits free ISM bands and has been conceived for low power consump-tion (life device up to 10 years) and low data rate applications. LoRaWAN guaranteedeasy deployment, indeed a single gateway can cover up to several kilometers. In this chap-ter, we present and discuss the lessons learned from a real-world LoRaWAN deploymentcarried out by the UNIDATA regional operator in a large terrestrial area. After presentingthe basic LoRa modulation features, we discuss the LoRaWAN architecture and how thenetwork performance are affected by radio access settings and the gateways deployment.We then present the platform designed for data collection and analytics and some statis-tics gathered in the first year of operation. We then discuss different strategies able tooptimize the global network performance. To this aim: i) we define an algorithm to opti-mize LoRa Data Rate allocation along the nodes, in single and multi gateway scenarios;ii) we propose a methodology to process LoRaWAN packets and perform devices profiling;iii) we propose a methodology to predict the radio space utilization.
1 Introduction
IoT devices and applications are playing a crucial role in the human everyday life, theyare used to deploy smart environments where people live. Thanks to the IoT paradigmhomes, buildings, and industries are connected together to apply the smart cities concept.Providing intelligence to these environments means enabling a broad set of operations,such as collecting data, triggering alarms, and reconfiguring smart objects. According to
_____________________________________________________________________________________ CNIT Technical Report-05 ꟷ Internet of Things: Technologies, Challenges and Impact
41

the IoT Analytics forecast of 2018 [1], the market for IoT has seen an unexpected accel-eration in the last years. Currently, the number of connected devices exceeds 17 billions,and the number of IoT devices is 7 billions. We expected that the number of interactingdevices, based on heterogeneous architectures and capabilities, can be as high as thou-sands of devices, thus leading to significant volumes of data potentially streamed througha radio interface to an optimization/intelligence application. We need technologies andIoT network architecture capable of managing these amount of data information, withcharacteristics of scalability and efficiency.
In the context of IoT applications, a promising technology for supporting radio con-nectivity in wide coverage network is LoRaWAN [2]. LoRaWAN is a new LPWAN tech-nology which enables power efficient wireless communications over very long distances.LoRaWAN uses LoRa modulation [3] and form one-hop networks where every node canreach directly one (or more) internet connected sink nodes. LoRaWAN works on scientificand medical (ISM) radio bands and in following the frequency plan provided in [4]. Forthe European region, the applied frequency plan is EU863-870, it provides 8 channelsand 7 data rates. In this chapter we present a real LoRaWAN deployment in Italy, andwe study real scalability problems related to the LoRaWAN deployment. The chaptersections are organized as follows: Section 2 presents the technology and the network archi-tecture. Section 3 describes the target LoRaWAN large scale scenario used in our studyand provides LoRa modulation features that can be exploited to improve network opti-mization. According with the amount of devices and generated data of the IoT scenarios,the Section 4 presents the scalability problem and three different approaches to improvethe network performances, namely: i) the ’capture aware water filling’ algorithm to op-timize LoRa devices parameters, ii) a Machine Learning (ML) algorithm for LoRaWANdevices profiling, and iii) a ML algorithm to predict channel usage and perform networkoptimization.
2 What is LoRaWAN?
Figure 1: LoRaWAN network architecture.
LoRaWAN includes a simple network architecture, represented by a star-of-stars topol-ogy, able to connect thousands of End Devices (EDs) to Gateways (GWs), in an area offew kilometres, with very minimal maintenance. Figure 1 presents the LoRaWAN net-work architecture. Any ED is not strictly associated to a specific GW but, conversely,can interact with any reachable one. Communication starts with EDs sending packets
42_____________________________________________________________________________________
LoRaWAN: a Deep Dive in a Large Scale Deployment and in Radio Access Optimization Strategies

to GWs which, in turn, forward them to the Network Server (NS). NS is responsible forprocessing packets, eliminating duplicated packets, and forwarding information data tothe IoT applications server and to the Network Controller (NC). The NC is the noderesponsible for the network configurations. While LoRa defines the physical layer and isa proprietary technology, LoRaWAN entails the overall networking, the Medium AccessControl (MAC); furthermore, LoRaWAN deals also with Applications Servers, Security,Firmware Update Over the Air [2].
2.1 LoRa Modulation
LoRa has been proposed by Semtech [3] and is a spread spectrum modulation techniquederived from Chirp Spread Spectrum (CSS) technology. LoRa implements a CSS modu-lation that uses the entire wideband linear frequency to modulate chirp pulses. In LoRa,EDs support multi-rate by exploiting six different Spreading Factors (SF), from 7 to12. The selection of the SF has an impact on duration and delivery probability of thegenerated packet. Communication on different SFs in the same channel are in principleorthogonal [5]. The SF defines two fundamental values: i) the number of chips containedin each symbol, that is N = 2SF , ii) the number of raw bits that can be encoded by thatsymbol that is equal to SF. The LoRa Data Rate (DR) depends on the Bandwidth (BW )in Hz, the Spreading Factor sf and the Coding Rate (CR) as:
DR = sf · BW2sf· CR (1)
where the symbols/sec are given by BW/2sf with sf ∈ {7− 12} and the channel codingrate CR is 4/(4 +RDD) with the number of redundancy bits RDD = 1, · · · , 4.The symbol duration (sec) is calculated as follow:
Tsym = 2sf/BW (2)
LoRa devices use a high SF when the signal is weak or there is a strong interference inthe adopted channel. Using a high SF means a longer symbol duration and a consequentlonger Time on Air (ToA). The selection of the DR is a trade-off between communica-tion range and packet duration. Packets transmitted within different SFs, in principle,generate few interference with each other. To maximize both battery life of the EDs andoverall network capacity, the LoRaWAN can manage the DR and RF output for each EDindividually by means of an recommended ADR scheme [6]. This mechanism determinesthe transmission parameters (SF and transmit power) of the ED based on the estimationof the link budget in the uplink and the threshold of the Signal to Noise Ratio (SNR)for decoding the packet correctly at the current DR. In LoRaWAN, the system capac-ity can be kept large since the receiver can detect multiple simultaneous transmissionsby exploiting the orthogonality when different SFs are used. Moreover, if the multiplesimultaneous transmissions are generated with the same SF, a low difference in the signalstrength (few dB values) can generate a channel capture effect that ensures the correctreception of the stronger signal. Although the presence of different SFs and the relaxedchannel capture effect, the LoRaWAN performance suffers when the network scales andthe parameters are not correctly tuned.
The limits and the performance expectations for LoRaWAN have been studied inthe papers [7], [8] and [9]. The work in [7] provides an overview of the capabilities
_____________________________________________________________________________________ CNIT Technical Report-05 ꟷ Internet of Things: Technologies, Challenges and Impact
43

and limitations of LoRaWAN. Voigt et al. in [9], through simulations based on realexperimental data, show the effects of the interference on performance of a LoRa network.Scalability issues in the LoRa system are analyzed in [10][11][12]. In the next Section, weshow a real large scale LoRaWAN deployment and we study performance limits of thenetwork.
3 LoRaWAN large scale scenario by UNIDATA oper-ator
Figure 2: LoRaWAN GWs deployment around the Roma city area.
A quite spread LoRaWAN network deployed on Italy is the one of UNIDATA. UNIDATAprovides IoT solutions applied in Smart City, Smart Building, Smart Metering and manyother smart applications. The main application services provided by the current networkare: i) water metering, ii) energy consumption metering, iii) management of parking slots;iv) GPS tracking, v) smart road lightning. The UNIDATA LoRaWAN network alreadyreaches millions of people in Italy, the Figure 2 shows the current GWs deployment in theRome city region. More specifically, in the whole Italy territory, the complete networkinvolves 1862 installed EDs, and 138 installed GWs. Currently, the total amount ofdevices that results present in the network is 89.528 (much higher than the ones man-aged by UNIDATA). In the 2019 the network has collected 372.119.877 packets(2,25% are generated from EDs registered with UNIDATA).
The GWs are connected to the NS operator, located in Rome at the operator data-center, where also the database is deployed. The database contains several indexes,each one representing a particular flow of information gathered from the network. Forinstance, there are flows representing uplink and downlink packets, information exchanged
44_____________________________________________________________________________________
LoRaWAN: a Deep Dive in a Large Scale Deployment and in Radio Access Optimization Strategies

Jan Feb Mar Apr May Jun Jul Aug Sep Oct Nov
Time [date] 2019
0
1000
2000
3000
4000
Num
pac
kets
for
wee
k
(a)
Jan Feb Mar Apr May Jun Jul Aug Sep Oct Nov
Time [date] 2019
0
20
40
60
80
100
Num
pac
kets
for
wee
k [%
]
SF7SF8SF9SF10SF11SF12
(b)
Figure 3: LoRaWAN network with 300 water metering. Number of received packets perweek in a period of 1 year (a), and percentage of packets belonging to each SFs for thesame period (b).
between GW and the NS, or between EDs and NS, or packets which have been de-duplicated because they have been received several times. The latter case happens whendifferent GWs insist in the same geographic area and packets reach the NS from thesedifferent GWs. UNIDATA manages the network by UniOrchestra, a suite for creatingand managing IoT LoRaWAN networks and services.
3.1 Performance behavior in large scale scenario
As an example of application provided by LoRaWAN, we considered a sensor networkpresent in a city in the north of Italy and served by the UNIDATA. The network provideswater metering for 300 real consumers. Each water counter is equipped with a LoRaWANmodule that forwards the measurement around 18 times per week. Two GWs cover thewhole area where the 300 water meters are. Packets, sent by the water meters, areforwarded by the GWs to the operator NS. Each received packet is processed by theNS, the payload message is sent to the application service, while the device radio linkinformation are forwarded to the operator NC.
Figure 3(a) shows the number of received packets week by week in a period of 1 year.The NC implements the recommended LoRaWAN ADR algorithm [6] that estimates thebest SF and transmission power values for each ED according to the measure Signalto Noise Ratio (SNR). To determine the optimal DR, the NC collects statistics on thepackets received by the NS in the uplink. For example, the 10 most recent uplinks. Thesemeasurements contain the frame counter and the SNR value related to the best GW, theone receiving the package with a value of greater SNR. For each measurement the NCcalculates the so-called “margin”, which is the measured SNR minus the required SNRto demodulate a message given the DR. This margin is used to determine how much it ispossible to increase the DR (when BW and CR are fixed this mean to decrease the SF)or to reduce the transmit power (if the SF is already the lowest one). For instance, whenthe network receives a message with DR SF12BW125 (SF=12 and BW=125) and SNR is5 dB, the resulting margin is 25 dB (required SNR at SF=12 is -20 dB [6]). This is more
_____________________________________________________________________________________ CNIT Technical Report-05 ꟷ Internet of Things: Technologies, Challenges and Impact
45

enough for the LoRa demodulation, it is the possible to improve the performance in termsof airtime, by increasing the DR, and in terms of energy by decreasing the transmissionpower. If we increase the DR to SF7BW125 we still have a margin of 12.5 dB (requiredSNR at SF=7 is -7.5 dB [6]), this new configuration reduce the ToA value, ensuring minorenergy consumption and collision probability. We could even lower the transmit powerto save even more energy and cause less interference. Figure 3(b) shows the percentageof nodes for each SF related to the transmissions in Figure 3(a). At the starting momentthe ADR was disabled and from the Figure we can notice that all nodes used SF12. TheADR has been enabled in March, but the margin is kept high for the next 3 months (upto June). In this period only two SFs were used, SF7 for nodes with an higher SNR andSF12 for the others. From July, the margin has been reduced and the nodes are moreequally distributed among the SFs.
3.2 Capacity of LoRa Cells and channel effects
This sub section will present a study of the capacity of a LoRa cell and the impact ofthe channel effects on the capacity. The medium access in a LoRa cell works as a non-slotted Aloha system. Under Poisson packet arrivals, it is possible to model the cellthroughput as G · e−2G, being G the normalized load offered to the cell. The probabilityof correctly receiving a packet transmission, which is a typical metric considered forcharacterizing LoRaWAN systems, often called Data Extraction Rate (DER), is given bye−2G. Since different SF are available, the system works as the super-position of multiplecoexisting (but independent) Aloha systems, each one experiencing the load due to thenodes employing a given SF. Let nsf be the total number of EDs in the cell employing aSF equal to sf (with sf ∈ {7, 12}). The time interval required for transmitting a packet isgiven by the sum of the preamble time, which lasts mph symbol times Tsym as in (2), andpayload transmission time. Since each symbol time codes sf bits and a channel codingwith rate CR = 4/(4 + RDD) is applied, the time ToAsf required for transmitting overthe air a packet of P bytes with spreading factor sf can be expressed as:
ToAsf = (mph + d 8P
4sfe · (4 +RDD)) · Tsym (3)
Assuming that every ED generates packets with a source rate of s pkt/s, the normalizedload using spreading factor sf can be expressed as Gsf = nsf · s · ToAsf . The total cell
capacity results equal to∑12k=7Gke
−2Gk and can dramatically decrease (down to zero) asthe loads Gsf increase.
Figure 4(a) compares the DER performance of an Aloha system (lines) with theresults obtained by simulating a LoRa cell (points) as a function of the offered load.Simulations have been obtained by using the public available LoRaSim simulator [13],while the offered load is expressed by the number of EDs transmitting in the cell at asource rate of 1 packet every 90sec, with a packet size of 20 bytes. LoRaSim is a custom-build discrete event simulator implemented in Python, other configuration parametersused for the result in this chapter are reported in Table 1. All the nodes are configuredwith the same SF and different curves refer to settings which vary from SF 7 to SF 12.From the Figure, we can notice that the Aloha model well describes the system behavior.The performance degrade significantly using high spreading factors because larger ToAs
46_____________________________________________________________________________________
LoRaWAN: a Deep Dive in a Large Scale Deployment and in Radio Access Optimization Strategies

0 500 1000 1500 2000
Nodes number
0
0.2
0.4
0.6
0.8
1
Dat
a E
xtra
ctio
n R
ate
LoRaSim SF = 7LoRaSim SF = 8LoRaSim SF = 9LoRaSim SF = 10LoRaSim SF = 11LoRaSim SF = 12
ALOHA SF = 7 ALOHA SF = 8 ALOHA SF = 9 ALOHA SF = 10 ALOHA SF = 11 ALOHA SF = 12
(a)
0 500 1000 1500 2000
Nodes number
0
0.2
0.4
0.6
0.8
1
Dat
a E
xtra
ctio
n R
ate
LoRaSim SF = random(7,12)LoRaSim SF = random(7,12) + CC ALOHA SF = random(7,12)Formula SF = random(7,12) + CC
(b)
Figure 4: DER as a function of the number of EDs transmitting for each SF. Case ofa single SF used for all the EDs in comparison with Aloha formula (a). Case with EDsuniformly distributed among all the SFs (b), without channel capture and with channelcapture (+ CC).
Parameter Value Parameter ValueCarrier Frequency (MHz) 868.3 Bandwidth (kHz) 125Code Rate (CR) 4/5 TXPower 14 dBm
Path loss values η = 2.9, σ2 = 0, Lpl(40m) −66 dB
Table 1: Simulation parameters.
correspond to higher load conditions. For instance, with 500 EDs, the DER is almostzero for sf = 11 or sf = 12, while it is still above 0.5 for sf = 7.
Capture-Effect LoRa modulation is very robust to Gaussian noise, but also to self-interference due to colliding transmitters [10]. Indeed, in case of collisions between twoor more transmitters, a Signal to Interference Ratio (SIR) value of just very few dBs(actually, as little as 1 dB for all the SFs in the experiments described in [14], versus the6 dB specified in [3]) is enough for correctly demodulating the strongest colliding signal.This phenomenon, called “channel capture”, has a strong impact on the scalability ofLoRa technology, because the deployment of multiple GWs can significantly boost thecapture probability and thus the overall network capacity.
A simple approximation of the throughput improvement due to channel capture canbe obtained by considering that in most practical cases, a target ED collides with asingle interfering signal at time. This assumption is reasonable when the cell works instable conditions and collisions involving multiple overlapping packets are rare or have adominant contribution in the interfering power. Under this approximation, a target EDemploying a given spreading factor sf is actually competing with a fraction of the totalload Gsf . In [15] is presented a simplified model for a circular ring radius cell, transmitteris located at distance r from the gateway, and interfering nodes in a circular ring delimitedby a distance α · r.
Neglecting the effect of random fading and assuming an attenuation law of type r−η,
_____________________________________________________________________________________ CNIT Technical Report-05 ꟷ Internet of Things: Technologies, Challenges and Impact
47

all the interfering nodes at distance higher than α · r, with α = 10SIR/10η > 1, do notprevent the correct demodulation of signal of the target ED. The smaller the α coefficient,the lower the competing load is. Therefore, the cell throughput in presence of channelcapture can be obtained by generalizing the Aloha results as:
Sc(Gsf ) = 2π
∫ R/α
0
δsfe−2α2r2
R2 Gsf r · dr + δsf (πR2 − πR2/α2)e−2·Gsf (4)
where δsf = Gsf/(πR2) is the density of load offered to spreading factor i and R the cell
radius. The DER is simply given by Sc(Gsf )/Gsf .Figure 4(b) shows the DER achieved with (red curve) and without (black curve)
capture effects as a function of the number of EDs in the cell, for a capture SIR thresholdof 1 dB (power ratios are higher than 1 dB to generate a capture effect). Each ED isconfigured on a randomly chosen SF between 7 and 12. Simulation results are plottedusing points, while the analytic results are reported by lines. Simulation results matchpretty well the upper bound provided by our model, although we ignore accumulation ofinterference generated by multiple packets.
Interference inter-SF In reality, different SFs are not perfectly orthogonal: it mayhappen that the reception of a target packet transmitted with a given SF is preventedby an overlapping packet transmitted with a different SF, when the SIR is lower thana rejection threshold (power ratios are lower than the threshold to generate a collision).In [14], it has been experimentally shown that the rejection thresholds are almost inde-pendent on the SF of the interfering ED and vary in the range between -10dB (for targetpackets transmitted at SF 7) and -25dB (for target packets transmitted at SF 12). Forsimplicity, in the following we refer to a constant inter-SF rejection threshold of -16dB.Because of imperfect orthogonality, a target ED working on SF sf at a generic distancer will compete not only with the load Gsf = nsf · s · ToAsf offered to the same SF, butalso with a fraction of the load G−sf working with a SF different from sf , correspondingto the EDs closer to the gateway. For a given rejection threshold SIR, only EDs placedin a cell sub-region delimited by a radius β · r, with β = 10SIR/10η < 1 can interfere withthe target ED while transmitting with a different SF. Since such a fraction depends onthe distance r and since the number of target EDs grows proportionally to r in case ofdevices uniformly placed within the cell, the average success rate DER(sf) for a generictarget ED working on SF sf can be written as:
e−2Gsf ·∫ R
0
e−β2r2
R2
∑k 6=sf nks·(ToAk+ToAsf ) 2r
Rdr (5)
where each term e−β2r2
R2 nks·(ToAk+ToAsf ) is the probability that no transmission at SF khas been started in the interval ToAk before the starting of the target packet, and noother one is originated during the following packet transmission time ToAsf . It follows,that in stable conditions, when the load offered to each SF is lower than 0.5, we have:
DER(sf) = e−2Gsf e−β2/2
∑k nk·s·(ToAk+ToAsf ) (6)
In other words, the total load Lsf competing with the target ED is not only Gsf , but also
a fraction β2
2ToAk+ToAsf
2·ToAk of the load Gk offered by each different SF k (with k 6= sf).
48_____________________________________________________________________________________
LoRaWAN: a Deep Dive in a Large Scale Deployment and in Radio Access Optimization Strategies

4 LoRaWAN scalability problems and solutions
In the previous Section we introduced a real LoRaWAN deployment and we showed howthe performance suffers when the network scales and the parameters are not correctlytuned. However, network capacity can be boosted through an aware EDs pa-rameters configuration that take into account LoRa channel effects presentedbefore. Network optimization can be reached by an aware SF allocation thatsupporting load balancing, as well applying device profiling and predictionschemes based on ML. The idea is to understand EDs network conditions and choosecontext aware algorithm to maximize network performance. In this section we presentpossible solutions to address the scalability issue of the network based on three differ-ent approaches: i) balancing of the SFs allocation, ii) profiling of the ED behavior, iii)predicting channels’ utilization.
4.1 Algorithm to optimize LoRa parameters (SF balancing)
A critical aspect in LoRaWAN networks is represented by the configuration of the channelsemployed by different GWs (multiple channels can be supported by the same gateway)and by the allocation of SFs to different devices. The SFs allocation has an impact on thedistance at which the ED can be located and on the robustness of the radio link in presenceof fading. On the other side, the ToA spent by packets sent at different SFs canbe significantly different (being the ratio between the minimum and the maximumpossible ToA about 25). It follows that SFs allocation has also an impact on thesystem load. A detailed analysis of the impact of different configuration choices for SFstaken by both the EDs and the network is presented in [16]. The selection of the optimumSF for each device is a function of the ADR. ADR should be enabled whenever an EDhas sufficiently stable RF conditions. The recent literature also concentrated on the ADRmechanisms. In [17] is present a strategy, named EXPLORA-AT for implementing asuitable ADR in LoRaWAN systems. The key idea was to assign the SFs to the EDs ina way that assures an equal time-on-air occupation to all the available SFs. In the restof the subsection, we first present the optimum values of SFs balancing when captureeffect and interference inter-Sf exist, and after we present an algorithm to optimize thisallocation [15].
Optimal SF Balancing The problem of spreading factor allocation in a network with Ntotal EDs can be modeled by the choice of n7, n8, · · · , n12, i.e. the choice of the numberof EDs using each available spreading factor, with the constraint that
∑sf nsf = N .
A possible optimization criterion is to maximize the average data extraction rate:
E[DER] =
∑11k=7 nke
−2nk·s·ToAk
N(7)
If we replace n12 with N −∑11k=7 nk and null all the derivatives ∂E[DER]
∂nsfwith respect to
a generic nsf with sf 6= 12, we obtain:
e−2nsf ·s·ToAsf (1−2nsf ·s·ToAsf )−e−2(N−∑11k=7 nk)·s·ToA12 · [1−2(N −
11∑k=7
nk) ·s ·ToA12] = 0
(8)
_____________________________________________________________________________________ CNIT Technical Report-05 ꟷ Internet of Things: Technologies, Challenges and Impact
49

20 40 60 80 100
# nodes SF11
0
0.1
0.2
0.3
0.4
0.5
Dat
a E
xtra
ctio
n R
ate
1/110 pkt/sec Ort. SFs1/110 pkt/sec Not Ort. SFs1/70 pkt/sec Ort. SFs
1/70 pkt/sec Not Ort. SFs1/30 pkt/sec Ort. SFs1/30 pkt/sec Not Ort. SFs
(a) (b)
Figure 5: DER as a function of the number of EDs when only 2 SFs are used, sf = 11and sf = 12 (a) and when 3 SFs are used sf = 10, sf = 11 and sf = 12 (b).
By relaxing the constraint of an integer number of end devices per each spreading factor,i.e. by permitting real values for each ni, from the previous equation, it is evident thatthe solution nsfToAsf = n12ToA12 ∀sf , can be a maximum or a minimum because itnulls all the derivatives. By solving for all the SFs and considering the constraint on thetotal number of EDs, we have:
n∗sf =ToA12
ToAsf
N∑12k=7 ToA12/ToAk
∀sf (9)
If we assume a network working in stable conditions and therefore 1− 2nsf · s · ToAsf isgreater than zero, the solution n∗ = [n∗7, n
∗8, · · ·n∗12] is a maximum. For very high loads,
when 1−2nsf ·s ·ToAsf < −1, the solution n∗ becomes a minimum. In such a condition,it is interesting to see that E[DER] exhibits other maximization solutions, which areobtained by enforcing a normalized offered load equal to 0.5 (i.e. nsf = 0.5
s·ToAsf ) in all
the SFs except one sf = sf , in which all the residual N −∑11k=7,k 6=sf nk are allocated. In
other words, for high load conditions, E[DER] is maximized by leaving one SF working in
unstable conditions (and in particular, the optimal choice is sf = 12), and by optimizingthe load of all the remaining SFs by setting Gsf = 0.5.
Figure 5 visualizes the previous considerations in a system with two (5(a), continueslines) or three (5(b), orange surface) available SFs and a total number N of EDs equalto 100. When only two SFs are available (sf = 11 and sf = 12), the optimal number ofnodes configured on each SF can be determined by studying a single variable function.In the figure 5(a) we can immediately recognize that the point which nulls the derivativeof DER(n11) is given by the solution of the equality n11ToA11 = n12ToA12, that isn11=64 nodes, being ToA12 about twice as ToA11 as results from (2) and (3). As thesource rate employed by all the nodes increases, the point changes from a maximum to aminimum point (yellow curve). For high load conditions, the optimal choice is to fix theload for one of the two SF and let the other one become congested (that is n11=21 nodesin figure 5(a) when source rate is 1/30 pkt/sec). Since the number of stations workingin stable conditions are maximized when G11 = 0.5 (rather than G12 = 0.5), the global
50_____________________________________________________________________________________
LoRaWAN: a Deep Dive in a Large Scale Deployment and in Radio Access Optimization Strategies

maximum is reached when n11 = 0.5/(s · ToA11). The figure 5(b) shows a 3D plot whenan additional SF is considered (sf = 10), for a source rate s = 1/90pkt/sec. Also in thiscase, the vector [n10, n11] which nulls the derivative can be easily recognized (n10=56 andn11=28 for the orthogonal SFs scenario).
The optimization criteria can be extended in presence of inter-SF interference. In suchas case, we have:
E[DER] =
∑12sf=7 nsfe
−2nsf ·s·ToAsf−∑12k 6=sf
β2
2 nk·s·(ToAk+ToAsf )
N(10)
If we replace again n12 with N −∑11l=7 nl and compute the derivatives ∂E[DER]
∂nsfwith
respect to a generic nsf with sf 6= 12, we obtain:
e−2Lsf [1− nsf · s(2 · ToAsf −β2
2nsf · (ToA12 + ToAsf )]+
e−2Lk11∑
k 6=sf
β2
2nk · s [−(ToAk + ToAsf ) + (ToAk + ToA12)] +
e−2L12 [−1 + (N −11∑l=7
nl) · s(−β2
2· (ToA12 + ToAsf ) + 2 · ToA12)] (11)
By permitting real values for each nk, it is easy to show that the vector of unknown
allocations [n∗7, n∗8 · · ·n∗11] for which Lk = Lsf = L12 ∀k nulls all the derivatives ∂E[DER]
∂nsf
with respect to a generic nsf . Indeed, in such a case we can simplify the exponentialterms from the previous expression and note that the sum of all the other terms is equalto L12−Lsf , which in turns is equal to zero. To find the optimal allocations it is requiredto solve a linear system in the unknown variables n7, n8, · · ·n11. It can be easily shownthat each component of the system solution can be written as:
n∗sf =ToA12
ToAsf
N − β2
4 N[∑12
k=7(ToAsfToAk
− 1) + 2]
∑12k=7
ToA12
ToAk(1− β2
2 )∀sf (12)
Such an expression coincides with the one derived in the previous section when β is equalto zero (i.e. in absence of inter-SF interference). Figure 5 also shows the effects of inter-SF interference on the average DER and on the optimal load allocations across SFs.In particular, the dashed lines in figure 5(a) refers to a cell with two SFs, in which thethreshold for rejecting inter-SF interference is equal to -10dB. We can see that the optimalload allocations are now achieved by increasing the number of nodes on SF 11 (from 64to 70). Similarly, in the red surface in figure 5(b), the optimal load allocations acrossthree SFs is shifted towards an increased number of stations on the highest possible rate.Obviously, the DER achieved under optimal allocations is lower than the one achievedwithout inter-SF interference.
More generally, load balancing can be achieved by updating the proportion betweenthe number of EDs that can be allocated on each SF as derived in equation 12. Table2 summarizes the load balancing results in the case of orthogonal and non-orthogonal
_____________________________________________________________________________________ CNIT Technical Report-05 ꟷ Internet of Things: Technologies, Challenges and Impact
51

SF 7 8 9 10 11 12ToA [msec] 49.41 90.62 164.86 329.73 659.46 1187.84Psf [%], orth. 47.02 25.85 14.36 7.18 3.59 2.02Psf [%], not orth. 50.75 26.98 14.07 0.060 0.019 0.002
Table 2: ToA (in ms) as a function of SFs when payload size is 20 byte and coding rateis 4/5; resulting optimal percentages Psf in accordance to optimal load allocation
SFs. In this last case, the rejection threshold has been configured to −16dB. For non-orthogonal SFs, the portion of EDs transmitting at SF 7 increases, while the allocationsperformed at SF 11 and SF 12 are reduced to almost zero.
This result can be used the ADR algorithm, it should be used the optimal percentagesPsf to improve the network performance. The idea is addressed by EXPLoRa algorithm[17].
EXPLoRa proposes two different variants: a basic solution, called EXPLoRa-SF,and an enhanced approach named EXPLoRa-Air Time (EXPLoRa-AT). This approachstarts from the remark that a rate adaptation strategy merely based on link-level bud-get/measurements, such as the recommended ADR defined by the LoRa Alliance [2],cannot take advantage of the (quasi) orthogonal nature of different SFs. For an extremeexample, if all network devices are very close to the gateway, they will all select sf = 7,thus congesting such SF, while all the remaining SFs will remain “empty”. Better alloca-tion strategy consists in “forcing” some devices to operate with a higher than necessarySF, thus spending a higher ToA, but gaining from a better allocation of load among theavailable SF-induced “channels”.
The goal of EXPLoRa-SF was to show that performance can increase by distributingusers on different SFs. Under EXPLoRA-SF the nodes are equally split between SF sub-channels: although some nodes transmit with a ToA higher than necessary, the reductionon the data rate is compensated by the reduction of the interference caused by simultane-ous transmissions from the other nodes. EXPLoRa-AT introduced an allocation strategythan equally splitting the nodes among different SFs, it equally balances the total ToAspent on each SF. The number of nodes in each SF follows the proportion reported inTable 2, row orthogonal.
The effects of load balancing on the proportion of EDs working on the same SF isdepicted in Figure 6(a) for the orthogonal case. We can easily recognize that about onehalf of the nodes, colored in black, are using sf = 7 and all the other EDs follow theoptimal Psf (sf) proportions.
However, the position of nodes employing the same SF plays a further crucial role,especially due to the fact that LoRa has a somewhat unexpected capability to captureand correctly demodulate a signal even in the presence of a significant interference. Allthese aspects are jointly accounted in the EXPLoRa-Capture (EXPLoRa-C) algorithm[15], where a sequential allocations in different circular rings is performed. The idea is tochoose the SF to be used by each ED.
The first interesting aspect of the EXPLoRa-C is the possibility to implement the loadbalance criterion in terms of “sequential waterfilling”. For facilitating the selection of adata rate compatible with the link budget, EDs are ordered according to their RSSI value(from the highest to the lowest) and SF allocations are performed sequentially (from thehighest rate sf = 7 to lowest rate sf = 12). This procedure ensures to take the advantage
52_____________________________________________________________________________________
LoRaWAN: a Deep Dive in a Large Scale Deployment and in Radio Access Optimization Strategies

-1.5 -1 -0.5 0 0.5 1 1.5
Meters #104
-1
-0.5
0
0.5
1
Met
ers
#104
SF = 7SF = 8SF = 9SF = 10SF = 11SF = 12
(a)
-1.5 -1 -0.5 0 0.5 1 1.5
Meters #104
-1
-0.5
0
0.5
1
Met
ers
#104
SF = 7SF = 8SF = 9SF = 10SF = 11SF = 12
(b)
Figure 6: Nodes position and allocated SF with EXPLoRa-AT (a) and EXPLoRa-C (b),in single gateway cell.
of the channel capture.The basic idea of this extension, is exploiting the ”spatial” dimension for reducing the
effective load experienced on each SF. For a single cell system, this corresponds to spreadthe EDs working on a given SF within the cell, in order to increase the probability thatcolliding signals are received with a power ratio higher than the capture threshold. Notethat this is generally different from allocating SFs sequentially to the EDs as a functionof their ordered RSSI values, because such an allocation could assign the same SF tonodes with similar RSSI values. In other words, EDs employing the same SF should beat different distances from the gateway, rather than concentrated in a circular ring. Fora multi-cell system, the spatial dimension can benefit from the availability of multiplegateways: nodes at a similar distance from the closest gateway could indeed be receivedwith very different RSSIs from the neighbor gateways, thus resulting in a good captureprobability at a different gateway.
In order to map these considerations into a new allocation strategy, the algorithmintroduces the concept of distance between EDs, taking into account both the differencebetween the RSSIs at the closest gateway, and difference in the set of gateways in theircoverage area. The basic idea of EXPLoRa-C is still based on a sequential allocation ofSFs, equally sharing the ToA spent at different SFs, but the allocation is performed inmultiple rounds, by skipping in each round the decision on nodes which are at a smalldistance from the previous decision.
In case of M gateways, GW1, GW2, . . . GWM , are deployed in a network with N nodes,EXPLoRa-C is executed M times. All the EDs are organized into M sets and ordered as afunction of the RSSI value perceived by the closest gateway. For each set, EXPLoRa-C isexecuted by considering the total number of allocations on each SF as equal to Psf (sf)·Nm(with m ∈ [1,M ]). Moreover, the concept of distance between EDs is extended by alsoconsidering the neighbor gateways. In case nodes have RSSI values whose difference islower than the capture threshold but the set of GWs in range is difference, they can stillbe configured on the same SF.
In the following, we present the performance evaluation of EXPLoRa-C by using
_____________________________________________________________________________________ CNIT Technical Report-05 ꟷ Internet of Things: Technologies, Challenges and Impact
53

0 1000 2000 3000 4000
Nodes number
0
0.2
0.4
0.6
0.8
1
Dat
a E
xtra
ctio
n R
ate
EXPLoRa-CRAND-ATEXPLoRa-ATEXPLoRa-SFLoRaWAN
(a)
0 2000 4000 6000 8000
Nodes number
0
0.2
0.4
0.6
0.8
1
Dat
a E
xtra
ctio
n R
ate
SF EXPLoRa-CSF LoRaWANSF RAND-ATSF EXPLoRa-AT
(b)
Figure 7: DER as a function of the EDs numbers in presence of channel capture, com-parison among EXPLORA-C, RAND-AT, EXPLoRa-AT, EXPLoRa-SF and LoRaWAN,when we consider single cell (a), and multi-gateway scenario (b).
the LoRaSim simulation framework, in both the single cell and multi-gateway scenar-ios. Simulation parameters are reported in table 1, and channel capture is enabled. Thesimulation uses a cell dimensions, namely a radius R, of 12 km. It represents an uncon-strained deployment. Indeed, for the unconstrained deployment any node can use any SF,because with the considered propagation model and transmission power entails a RSSIat the cell edge that is enough for using sf = 7, i.e. the highest rate. We comparethe results obtained by performing completely random allocations or by using differentvariants of EXPLoRa and the LoRaWAN recommenced scheme. Figure 7(a) plots theaverage DER achieved in the unconstrained deployment and a varying number of EDs(from 100 to 4000), which are uniformly placed within the cell area. We assume thatSFs are perfectly orthogonal and do not interfere each other. From the figure, we canobserve that just equalling splitting the EDs across all the available SFs is not a goodstrategy: indeed, EXPLoRa-SF achieves performance which are worse or almost equiva-lent to the LoRaWAN legacy scheme. This is due to the load experienced on sf = 12,which can reach unstable conditions even with a few hundreds of EDs. Specifically, whens = 1pk/90 sec, the normalized load offered on sf = 12 by each node is equal to 0.0132(ToA12 = 1.19 sec) and therefore it is enough that n12 is equal to 40 nodes (i.e. the totalnumber of EDs N is equal to 6 ·n12 = 240) to work in unstable conditions. In the case ofLoRaWAN, since the link budget is not a constraint, all the EDs are always configuredfor working with sf = 7, with a waste of cell capacity.
Conversely, EXPLoRa-AT is able to optimize such a capacity, by equally sharing thenormalized offered load on each available SF. However, by also optimizing the possibilityto achieve channel captures in case of collisions, EXPLoRa-C can further improve theaverage DER, especially in high load conditions. Since in this scenario all the nodes canbe served at the highest data rate, the performance achieved under a completely randomSF assignment (named RAND-AT in the Figure) which obeys to the Psf (sf) proportions(i.e. randomly chooses Psf (sf) · N nodes for using a given SF) are equal to the onesachieved with EXPLoRa-C. We could argue that boosting the capture effects can result
54_____________________________________________________________________________________
LoRaWAN: a Deep Dive in a Large Scale Deployment and in Radio Access Optimization Strategies

-130 -120 -110 -100 -90 -80
RSSI MEAN [dBm]
0
5
10
15
20
25
CD
F fo
r 26
8 E
D [%
]
(a)
0 2000 4000 6000 8000
Message Rate [packets/day]
0
0.2
0.4
0.6
0.8
1
Dat
a E
xtra
ctio
n R
ate
EXPLoRa-CLoRaWAN
(b)
Figure 8: For the 300 devices real LoRaWAN network, CDF of the RSSI mean (a), andperformance comparison in terms of DER for EXPLoRa-C and LoRaWAN schemes (b).
in unfair performance between EDs. However, we find that the capture effect improvesthe DER experienced by some nodes without degrading the performance of the otherones involved into the collisions.
For assessing EXPLoRa-C performance in a multi-gateway scenario, we considereda regular grid, in which gateways are placed at regular distances and border effects areneglected. The scenario corresponding to the regular grid is given by a topology with25 gateways, regularly placed with a distance of 12 km from the neighbors. The averageDER is presented in figure 7(b) as a function of the number of EDs placed in the wholenetwork (up to 8000 nodes). In this case, EXPLoRa-C provides not only the optimalresults, but also a gain on the random allocations implemented by RAND-AT. The gainin comparison to EXPLoRa-AT is about 38%, and 8% in comparison with recommendedLoRaWAN ADR.
Application in real scenario In order to test the EXPLoRa-C scheme in a real Lo-RaWAN deployment, we considered the real sensor network deployment presented in theSubsction 3.1. The evaluation result uses the network database to retrieve the behaviourof the devices in a range period of 1 year, specifically, it was extracted the RSSI meanvalue for each device and SF assigned by the LoRaWAN ADR. Figure 8(a) shows Cu-mulative Distribution Function (CDF) of the RSSI for the 300 devices present in thenetwork. The RSSI mean and the SF values, assigned by the LoRaWAN ADR, it wasused to recreate the scenario by using the LoRaSim simulator. To reproduce the applica-tion scenario it was also set a σ2 variance of 6 to account the path loss shadowing. Figure8(b) shows the DER for both EXPLoRa-C and LoRaWAN schemes when the messagerate increase from 18 to 8000 packets per day. From the Figure we can observe thatEXPLoRa-C gets better performance than LoRaWAN, especially when the message rateincreases. In case of a message rate of 8000 packets per day, EXPLoRa-C gets a DER of5% greater than LoRaWAN.
_____________________________________________________________________________________ CNIT Technical Report-05 ꟷ Internet of Things: Technologies, Challenges and Impact
55

4.2 LoRaWAN End Device profiling
How see before, the estimation of the ED radio condition potentially helping the networkplanning. In this direction, a possible strategy can be to apply device profiling relatedto the utilization of wireless resources in the LoRaWAN networks. In [18] it is proposeda methodology to process LoRaWAN packets and perform profiling of the IoT devices.Specifically, the work uses the k-means algorithm to group devices according to their radioand network behaviour.
More in generally, the approach can be help to: i) monitor the system behaviour andcapture anomalies; ii) optimize the network planning; iv) identify different spaces whereservice provision can be enhanced, that is, new radio resources, more suitable parametersettings, different configurations of the IoT devices and services. This technique allow theclustering of EDs into ”activity groups”, which consist of ED which tend to have similaractivity profiles.
The work uses the k-means algorithm which is a partitional clustering algorithm [19]and, as such, given a dataset S = {x1, . . . ,xn} of n observations, it partitions the datainto k non-overlapping clusters, i.e. S = {S1, . . . , Sk} such that Si ∩ Sj = ∅ if i 6= j and∪ki=1Si = S. k-means finds a (sub-)optimal partition of the data in such a way that theintra-cluster variance or Within-Clusters Sum of Squares (WCSS) is minimized:
WCSS =∑k
i=1
∑x∈Si‖x− c(i)‖2 (13)
where c(i) is the centroid for cluster i, defined as the center of mass of the cluster itself.Despite its simplicity, the number of clusters k to be returned is a parameter that
must be tuned by the end-user and finding a suitable value is strictly problem and data-dependent and hardly known a-priori. Typically, one tries several k candidates and selectsthe best value by studying the objective function in Eq. (13) and/or by means of internalvalidation indices [20]. Common strategies include: i) The Elbow Plot [21] that consistsin plotting the WCSS as function of k and choose the first k value corresponding to thepoint where the curve become flat. ii) The Davies-Bouldin Index [22] that measures theintra-cluster separation against the inter-cluster variance, the Davies-Bouldin index is notbounded within a specific range; however, the closer to 0, the better. iii) The SilhouetteScore [23] that quantifies how-well each pattern has been assigned to its own cluster,conversely to the Davies-Bouldin index, the silhouette score is by definition bounded inrange [−1,+1]: the closer to +1, the better.
This subsection presents an application of the k-means algorithm to the LoRaWANreal deployment introduced in Section 3. All the studies have been developed over thedatabase ”pre-deduplication” index; in such a way we are sure that all traffic analyzed iscoming from the EDs to the NS, passing through different GWs. A subset of the databasepacket fields has been extracted and pre-processed and they will represent the featuresfor the profiling analysis performed.
The goal of the work is to cluster (group) EDs according to the their behaviour. Thedataset used in the analysis regards 12 months of activity over the entire LoRaWANdeployment network (January-Dicember 2019). From the initial dump of the database,packets having null device identifier have been discarded: these packets correspond todevices which are either not managed by the operator. In order to properly feed thek-means algorithm, the following pre-processing steps have been performed: i) packets
56_____________________________________________________________________________________
LoRaWAN: a Deep Dive in a Large Scale Deployment and in Radio Access Optimization Strategies

0
2
4
WCS
S
1e8
0.6
0.8
1.0
Silhou
ette
2.5 5.0 7.5 10.0 12.5 15.0 17.5 20.0K
0.2000.2250.2500.2750.3000.3250.3500.375
Davies-Bou
ldin in
dex
Figure 9: WCSS, Silhouette and Davies-Bouldin indices as function of k.
have been grouped by device; ii)each device has been mapped into an 7-length real-valuedvector containing the following statistics amongst its packets: the error rate (elaboratedvia the FCNT field, that is a counter increasing for each packet sent from ED), the averagevalues of: SNR; RSSI; packet size; and inter-arrival time (i.e., number of hours betweentwo packets), the mode values of: channel frequency; and SF. Amongst the available fieldsinside a LoRaWAN ED packet, they depict the radio aspect of the EDs. Thanks to thispre-processing stage, the considered devices have been cast into a 7 columns real-valuedmatrix, suitable for being processed by the k-means, where each row represents an ED.
To evaluate the best k value, we considered several candidates k = {2, 3, . . . , 20}and Figure 9 shows the Davies-Bouldin Index, the Silhouette Index and the WCSS asfunction of k. By jointly considering the three indices, a suitable value of k? = 7 has beenchosen; indeed, the Silhouette is rather high (> 0.9), the Davies-Bouldin index reachesits minimum value (< 0.2) and k = 7 lies pretty much towards the end of the WCSSelbow, which can be easily seen for k ∈ [3, 7]. For the chosen k?, we further analyzed theclustering solution as returned by k-means.
Specifically, for each cluster, we considered the behaviour of its ’most central’ element(i.e., the element closest to the centroid) and Figures 10–11 show their most characteristicfeatures. Figure 10 shows the PDF of the RSSI for the ’most central’ elements of the 7different clusters. Figure 11 shows the bar plot for the error rate values (Fig. 11(a)) andthe number of packets sent (Fig. 11(b)).
In all figures, device IDs have been anonymized and replaced by the ID of their re-spective cluster (reported in the figures legend) and marked with a unique color whichconsistently spans across Figures 10–11. For the sake of readability, legends are notincluded in Figure 11.
By looking at Figure 10, three clear-cut profiles emerge in terms of RSSI, they arebounded by RSSI ≈ −100 and RSSI ≈ −70: the leftmost part of the spectrum sees
_____________________________________________________________________________________ CNIT Technical Report-05 ꟷ Internet of Things: Technologies, Challenges and Impact
57

−120 −100 −80 −60 −40RSSI
0.00
0.02
0.04
0.06
0.08
0.10
0.12
0.14
0.16
0.18
Cluster 1Cluster 2Cluster 3Cluster 4Cluster 5Cluster 6Cluster 7
Figure 10: PDF of the RSSI for the ’most central’ elements for the 7 clusters.
0
20
40
60
80
100
Erro
r Rat
e [%
]
94.68 99.92
39.33
64.0947.72
20.884.78
(a)
20k
40k
60k
21
35084
68383
648617961
34579
5605
Pack
ets
0 (b)
Figure 11: Error rate (a) and number of packet sent (b) for the ’most central’ elementsfor the 7 clusters.
cluster 1 and 3 as the most prominent ones, whereas the rightmost part is dominated bycluster 2. All other clusters lie in the middle part of the spectrum. Figure 11 also showscompletely different behaviours amongst the 7 clusters.
A interesting analysis consists in jointly considering these behaviours, which has beenused as guideline to further characterize the radio properties of the devices belongingto each group. Notably, field-experts at the network operator recognized some deviceshaving precisely the characteristics presented in these histograms (e.g., the device with alarge number of packets sent is, actually, a device which sends about three packets per day,so these clustering results are indeed in line with the network behaviour). At the sametime, the cluster analysis was capable to find anomalies inside the network: for example,cluster 1 represents a set of devices which have high error rate (Figure 11(a)) and smallnumber of packets sent (Figure 11(b)). This, along with low RSSI values (Figure 10),
58_____________________________________________________________________________________
LoRaWAN: a Deep Dive in a Large Scale Deployment and in Radio Access Optimization Strategies

Figure 12: Sensor device representation in terms of SNR, ERROR RATE, and SF.
identifies a misbehaving of such devices.To better show the potential of the k-means algorithm applied to the real deployment,
Figure 12 shows the cluster representation of the water metering network devices presentedin the Subsection 3.1, the 3D plot is related to the ERROR RATE, SF and SNR axis.Each cluster is represented by a different color. The Figure shows how 7 different clusterswell map the current position of the the devices in the relative representation.
How see in the previous Subsection, the SF balancing is a critical operation in theLoRaWAN network, and is possible use balancing algorithm that starting to the radiocharacteristics find the best balancing among the EDs, in terms of how many and whichEDs distributed for each SF. The clustering algorithm, presented in this Subsection, canbe help to evaluate which EDs chose for the candidate SF.
4.3 Prediction of LoRaWAN network activity
Another optimization strategy presented in this chapter is the possibility to predict the be-havior of the LoRaWAN scenario, the idea is to anticipate future problem in the network,and perform actions to avoid them. In fact, the knowledge of future device transmissionschemes could facilitate the evaluation of the optimal network operating parameters. Forexample, foreseeing circumstances of saturation peaks in the radio space, we could perform(”in advance”) changing of the radio parameters, and thus avoiding future malfunctionsand interruptions of the services connected to the applications.
The idea is to study, design and implement an algorithm capable of forecast theLoRaWAN network activities in terms of: i)periods of node activity, ii) percentage ofusage for each channel/SF combination. In this section, we show an algorithm able topredict whether the radio channel, at a certain frequency/SF combination, will be busyor free at a specific time in the future and, if busy, what traffic intensity will be present(number of LoRaWAN packets).
This sort of problem can be modeled as a time series problem, where the channelusage statistics can be converted into a timebased sequence. Prediction of time series isa well-studied problem in the literature and multiple solutions have been published in
_____________________________________________________________________________________ CNIT Technical Report-05 ꟷ Internet of Things: Technologies, Challenges and Impact
59

230 240 250 260 270 280Frame counter
0
4
8
12
16
20
24
Inte
rarri
val t
ime
[hou
rs]
Figure 13: Pattern of the inter arrival time for the LoRaWAN water metering device
order to deal with this specific type of problem. More specifically, the our problem hasbeen modeled as a time series problem in which each fixed interval of use of the channelis treated as a sequence of occupied and free slots [24]. According with the literature, oneof the most effective solution methods is represented by the Long Short-Term MemoryNeural Networks (LSTM) [25], these are Recurrent Neural Networks (RNN) [26] withbackward feedback propagation, which allow information to persist over time.
It is important to notice that the LSTM cell has two inputs and two outputs. Asinput it takes the input of the system and the previous state, just like the feedback loopof the vanilla RNN. As output it has the output of the system and the current state ofthe cell. Another fundamental characteristic about RNNs is that they possess the abilityto be Multiple Input Multiple Output (MIMO). In the our problem we will use manyto one configuration, we will use an input sequence to predict the next element of thesequence. In this section we present an application of the LSTM network to the watermetering deployment to predict channel usage, indeed for these commercial devices noinformation about the transmission time are present. To obtain the input sequence to befed to the LSTM network, we started from the fields of the LoRaWAN packets saved inthe database. However a preprocessing of the series is needed before to fed the LSTM.
Before, we addressed an analysis of the transmission pattern of the network devices,it was deduced that the devices send the packets with a structure that is the combinationof two different component, a regular part and a not regular part. Figure 13 shows adetail of the transmissions of a device, the x axis show frame counter of each packet, yaxis shows the difference time respect the last packet time, or the inter arrival time. Fromthe Figure 13, we can notice that regular part has a cycle of 9 packets, where the first7 present an inter arrival time of 12 hours. While last 2 packets present a less temporaldistance, but their inter arrival time distance sum is equal to 12 hours (4 and 8 in the caseof the Figure). The inter arrival times of the eighth and ninth packet remain constantover time for the same device, but differ from device to device. The Figure also showsa case due to the lack of a packet that has not been received by the NS (at 258 framecounter value). The transmission pattern also has a not regular part, the study carriedout has allowed to find the occasional existence of split times that do not respect theregular pattern, but which however have a certain repeated characteristic. Randomly one
60_____________________________________________________________________________________
LoRaWAN: a Deep Dive in a Large Scale Deployment and in Radio Access Optimization Strategies

FDEA
FB75
FE12
FDA4
FD1D
FD0F
F714
FDF2
Devices [dev_eui]
048
1216202428
Inte
rarri
val t
ime
[hou
rs] 95%
93%94%96%95%95%94%
95%
(a)
0 50 100 150 200Time Error [minutes]
0
20
40
60
80
100
Num
ber o
f pac
kets
[%]
(b)
Figure 14: Frequency analysis for the inter arrival time for a sub set of water meteringdevices (a). Histogram of the error prediction for entire data set (300 devices) (b).
of the packets of the regular pattern can be replaced by two or more packets. The Figure13 shows one of these situations (at 275 and 276 frame counter values).
To be sure that the pattern found comprehensively represents the behavior of the entireset of devices, a frequency analysis of the split times was made, Figure 14(a) shows thefrequencies of the most frequent inter arrival times for a subgroup of devices (each deviceis represented with a different bar). Each bar has three different colored components, theheight of which is equal to the inter arrival time value considered. From the figure, wecan see that all the devices have a 12-hour inter arrival time, and two other values, thesum of these two is 12 hours, but they are different from device to device. For all devices,the sum of the occurrences of these 3 split inter arrival times represents more than 92%of the entire set of samples (the exact value is shown above each bar).
Figure 15 shows the inter arrival time series of 5 devices in succession (blue triangular).From the Figure it is easy to notice that the 12 hour (720 minutes) samples are commonto all devices, while the other two inter arrival time is different in each device. In thefigure, the isolated points (6 hour) represent the irregular parts of the sequence, that hasbeen processed to better fit the prediction algorithm.
How see in the ED pattern study, time series of the distances between two successivereceived packets can present gaps, because not all the packets are correctly received (dueto the channel fading and shadowing). The result is time series with non-continuous data,where, in a completely random way, parts of the sequence may be missing. Furthermore,when we are in the presence of highly corrupt time series, due to the absence of packets,it may be difficult or impossible to find a preprocessing function capable of correcting thesequence, these series can not be used for the learning process of the prediction model.For these devices, the forecast could be made using models obtained with devices of thesame behavior profile. In other words, by using a subgroup of devices, we create modelsthat are valid for all devices that have the same operating profile.
Prediction algorithms require a learning phase, in which the inter arrival time seriesis used for the generation of a model to be used later for the forecasting phase. We used
_____________________________________________________________________________________ CNIT Technical Report-05 ꟷ Internet of Things: Technologies, Challenges and Impact
61

0 200 400 600 800 1000 1200Frame counter
0
100
200
300
400
500
600
700
Inte
rarri
val t
ime
[hou
rs]
ObservedPredicted
Figure 15: Qualitative result of the LSTM prediction for the test data set.
a subgroup of devices to generate a model capable of processing forecasts for all deviceson the network. For the learning and for the forecasting phase, it is necessary to createa sequence of observations called features, features are used to predict future observationcalled target. Clearly, a single feature per sample is not enough to teach the model anabstraction that recognizes patterns never seen before. In order to create the featuresseries, a data structure is used through a sliding window. Each input of the model is aseries, in which each cell will represent the inter arrival time value as a feature, while thelast column will be the target to be predicted (in the testing phase, the target will beused separately in comparing the predictions with the actual results). In the next row,the previous target is moved to the last feature column in order to insert the new target.
Following this approach, an LSTM neural network model was created with a manyinput and a single output, the model hold a single internal layer that has 120 hidden nodes.First, we training the model with a sequence retrieved from 100 ED (selected in randomway) and we use the remaining EDs to test the model. Figure 15 shows a qualitativeevaluation of the test results. The blue triangles represent the observed values, while thered stars represent the predicted inter arrival time values. As you can see from the Figure,for each device, the star markers mostly gather near the blue triangles.
In order to better show the results on the entire data set, a histogram of the vectorof the forecast errors was made. Figure 14(b) shows the histogram of the vector of theerrors of prediction of the complete sequence, from the figure it is possible to notice thatmore than 85% of the errors of prediction remain within 30 minutes.
5 Conclusion
In this chapter we have presented a LoRaWAN large scale scenario where LoRa modu-lation features are been exploited to improve network optimization. Network scalabilityissues are analyzed and three different approaches to improve the network performanceshas been presented. First, we present EXPLoRa-C, a ’capture aware water filling’ algo-rithm to optimize LoRa devices parameters, where the the modulation channel effects areconsidered. Second, we present an application of the k-means ML algorithm to profile
62_____________________________________________________________________________________
LoRaWAN: a Deep Dive in a Large Scale Deployment and in Radio Access Optimization Strategies

network devices. The clustering results are suitable groups of devices sharing similar be-haviour. Third, we present an optimization strategy based on LSTM network algorithmto predict devices behavior and prevent future problems.
Extracted devices information via ML algorithms, clustering and prediction, are usedby the optimization strategy that fit best parameters tuning. For example, is possibleuse balancing algorithm that starting to the extracted devices information find the bestbalancing among the EDs, in terms of how many and which EDs distributed for each SF.
All the presented solutions are been tested in the real LoRaWAN deployment, ad-dressed by the Italy operator UNIDATA, that in the 2019 has collected 372.119.877 pack-ets (2,25% are generated from EDs registered with the operator).
Acknowledgement
We thank UNIDATA S.p.A. who provided insight and expertise that greatly assisted ourresearch. Part of the activities are related to the AMORE (Advanced Manufacturing emicroelettronica per Ottimizzare le REti wireless delle cose) project. KETs, POR FESRLazio 2014-2020.
References
[1] Zana Diaz Williams Eugenio Pasqua Saverio Romeo Raquel Artes Matt WopataKnud Lasse Lueth, Padraig Scully. State of the iot & short-term outlook. 2018.
[2] Sornin, N., Yegin, A., et al. LoRaWAN 1.1 Specification. https://lora-alliance.org/resource-hub/lorawantm-specification-v11, 2017.
[3] Semtech. LoRa. EP2763321 from 2013 and U.S. Patent 7,791,415 from 2008.
[4] LoRa Alliance Technical CommitteeRegional Parameters Workgroup. LoRaWAN R©Regional Parameters RP002-1.0.0. https://lora-alliance.org/resource-hub/
lorawanr-regional-parameters-rp002-100, 2019.
[5] Daniele Croce, Michele Gucciardo, Ilenia Tinnirello, Domenico Garlisi, and StefanoMangione. Impact of spreading factor imperfect orthogonality in lora communica-tions. pages 165–179, 2017.
[6] Revision 1.0 Semtech Corporation. LoRaWAN – simple rate adaptation recom-mended algorithm, 2016.
[7] F. Adelantado, X. Vilajosana, P. Tuset-Peiro, B. Martinez, J. Melia-Segui, andT. Watteyne. Understanding the limits of lorawan. IEEE Communications Mag-azine, 55(9):34–40, 2017.
[8] Juha Petajajarvi, Konstantin Mikhaylov, Marko Pettissalo, Janne Janhunen, andJari Iinatti. Performance of a low-power wide-area network based on lora technology:Doppler robustness, scalability, and coverage. International Journal of DistributedSensor Networks, Vol. 13:1–16, 03 2017.
_____________________________________________________________________________________ CNIT Technical Report-05 ꟷ Internet of Things: Technologies, Challenges and Impact
63

[9] Thiemo Voigt, Martin Bor, Utz Roedig, and Juan Alonso. Mitigating inter-networkinterference in lora networks. In Proceedings of the 2017 Int. Conf. on EmbeddedWireless Systems and Networks, EWSN ’17, pages 323–328, 2017.
[10] Martin C. Bor, Utz Roedig, Thiemo Voigt, and Juan M. Alonso. Do LoRa Low-Power Wide-Area Networks Scale? In 19th ACM Int. Conf. on Modeling, Analysisand Simulation of Wireless and Mobile Systems, MSWiM ’16, pages 59–67, 2016.
[11] Orestis Georgiou and Usman Raza. Low Power Wide Area Network Analysis: CanLoRa Scale? IEEE Wireless Communications Letters, 2017.
[12] K. Mikhaylov, Juha Petajajarvi, and Tuomo Hanninen. Analysis of capacity andscalability of the lora low power wide area network technology. In 22th EuropeanWireless Conference, pages 1–6, 2016.
[13] LoRaSim is a discrete-event simulator based on SimPy for sim-ulating collisions in LoRa networks and to analyse scalability.http://www.lancaster.ac.uk/scc/sites/lora/.
[14] D. Croce, M. Gucciardo, S. Mangione, G. Santaromita, and I. Tinnirello. Impact oflora imperfect orthogonality: Analysis of link-level performance. IEEE Communica-tions Letters, 22(4):796–799, 2018.
[15] D. Garlisi I. Tinnirello G. Bianchi, F. Cuomo. Capture aware sequential waterfillingfor lorawan adaptive data rate, arXiv:1907.12360, [cs.NI], Nov 2019.
[16] S. Li, U. Raza, and A. Khan. How agile is the adaptive data rate mechanism of lo-rawan? pages 206–212 – IEEE Global Communications Conference (GLOBECOM),Dec 2018.
[17] F. Cuomo, M. Campo, A. Caponi, G. Bianchi, G. Rossini, and P. Pisani. Explora:Extending the performance of lora by suitable spreading factor allocations. In 2017IEEE 13th International Conference on Wireless and Mobile Computing, Networkingand Communications (WiMob), pages 1–8, 2017.
[18] Jacopo Maria Valtorta, Alessio Martino, Francesca Cuomo, and Domenico Garlisi.A clustering approach for profiling lorawan iot devices. In Ioannis Chatzigiannakis,Boris De Ruyter, and Irene Mavrommati, editors, Ambient Intelligence, pages 58–74,Cham, 2019. Springer International Publishing.
[19] Anil K Jain, M Narasimha Murty, and Patrick J Flynn. Data clustering: a review.ACM computing surveys (CSUR), 31(3):264–323, 1999.
[20] Alessio Martino, Antonello Rizzi, and Fabio Massimo Frattale Mascioli. Distancematrix pre-caching and distributed computation of internal validation indices in k-medoids clustering. In 2018 International Joint Conference on Neural Networks(IJCNN), pages 1–8, 2018.
[21] Robert L. Thorndike. Who belongs in the family? Psychometrika, 18(4):267–276,1953.
64_____________________________________________________________________________________
LoRaWAN: a Deep Dive in a Large Scale Deployment and in Radio Access Optimization Strategies

[22] David L Davies and Donald W Bouldin. A cluster separation measure. IEEE Trans-actions on Pattern Analysis and Machine Intelligence, PAMI-1(2):224–227, 1979.
[23] Peter J Rousseeuw. Silhouettes: a graphical aid to the interpretation and validationof cluster analysis. Journal of computational and applied mathematics, 20, 1987.
[24] Jorge Luis. Hernandez Villapol. Spectrum Analysis and Prediction Using Long Short-Term Memory Neural Networks (LSTMs) and Cognitive Radios. thesis, December2017; Denton, Texas. (https://digital.library.unt.edu/ark:/67531/metadc1062877/:accessed May 28, 2020), University of North Texas Libraries.
[25] F. A. Gers, J. Schmidhuber, and F. Cummins. Learning to forget: Continual predic-tion with lstm. Neural Computation, 2000.
[26] Christian W. Omlin and C. Lee Giles. Constructing deterministic finite-state au-tomata in recurrent neural networks. 1996.
_____________________________________________________________________________________ CNIT Technical Report-05 ꟷ Internet of Things: Technologies, Challenges and Impact
65


Wide Area Transmission Technologies for IoT
Andrea Abrardo, Giacomo Peruzzi, Alessandro Pozzebon
Department of Information Engineering and Mathematics
University of Siena, Siena, Italy
Abstract: In this paper, the state of the art of Wide Area transmission technologies forIoT along with their application scenarios and requirements is discussed. In particular,the paper considers the main existing technologies, both license-based (i.e., cellular) andlicense-free (e.g., LoRaWAN and other Sub-GHz technologies). Then, future trends areanalyzed, discussing in particular the advantages expected to be brought by the introductionof the upcoming 5G cellular technology in the Internet of Things (IoT) context, with thepossibility of exploiting the edge computing paradigm and the slicing concept. In thesecond part of the paper, the advantages and drawbacks of the two main technologicalframeworks (e.g., licensed and license-free) are examined according to the different systemrequirements. Finally, two specific use cases are presented which are currently enabled byLoRa modulation.
1 Introduction
The Internet of Things (IoT) has become a promising, valuable and robust paradigmthroughout the recent years [1]. Indeed, the IoT is a hot topic nowadays either from aresearch point of view and from an application perspective as well: from smart cities toenvironmental monitoring, from home automation to the migration towards the Industry4.0 domain, from healthcare to smart agriculture, from intelligent transportation systemsto autonomous vehicles. All these scenarios are characterized by the presence of dumbobjects of broad purpose (e.g., sensor nodes, vehicles, domestic appliances, industrialmachineries and so on) with Internet connectivity and computational capabilities so as itis possible to control them and, at the same time, to receive notices from them.
Ideally, IoT devices should be designed to satisfy the following characteristics: highcoverage, low cost and low power. Sadly, though, a simultaneous achievement of thesefeatures is tough or nearly impossible, hence a trade-off has to be reached in most ofthe cases. The application scenario determines which of the aforesaid features should befulfilled the most: a pervasive monitoring infrastructure requires cheap sensor nodes, realtime monitoring needs high coverage besides a relevant amount of data to be streamedwhile for devices relying only on batteries as source of energy to be as low power aspossible is mandatory.
The Mobility Report issued by Ericsson in June 2019 [2] foresees that wide-area IoTdevices, numbering at about one billion and representing a little more than one-tenthof all IoT deployments today, will grow consistently to reach 4.5 billion devices by 2024.
_____________________________________________________________________________________ CNIT Technical Report-05 ꟷ Internet of Things: Technologies, Challenges and Impact
67

Short-range IoT devices, based on Bluetooth, ZigBee and 6LoWPAN or IPv6 technologies,represent about 90 percent of deployments today but they are growing at a much slowerrate to reach 18 billion devices by 2024. Hence, despite short-range IoT devices are goingto continue to exist in the market in the foreseeable future, a major attention will begiven to wide-area IoT devices that are going to see an exponential growth.
Wide-area IoT is in general characterized by low power devices transmitting infre-quent short bursts of data over a low-power wide area network (LPWAN). These devicestypically do not have any external power supply (i.e., they run on batteries and they areinstalled in areas where frequent batteries substitution is an ineffective option). Accord-ingly, they are expected to be very power efficient. LPWANs can work in both licensedand unlicensed spectrum. Two of the most common LPWAN technologies that work inunlicensed spectrum are Sigfox [3] and Long-Range Wide Area Network (LoRaWAN) [4],while those working in licensed spectrum are narrowband (NB)-IoT [5] and LTE-M [6] orLTE machine type communication, sometimes referred-to as Cat-M1, both of which arespecified by 3GPP in Release 13 and are generally known as cellular IoT. It is expectedthat LPWANs deployments based on unlicensed spectrum technologies will continue toexist and proliferate, despite at a much lower rate than cellular IoT, particularly with thedevelopment of 5G cellular systems [7].
Realizing the full IoT vision can only be achieved through the integration of differenttechnologies. In particular, LPWAN technologies in the unlicensed spectrum are expectedto address many of the requirements of massive IoT communications (e.g., low-cost de-vices with low energy consumption, extended coverage areas, high scalability for effectiveand fee-free deployment). On the other hand, IoT solutions in the licensed approvedspectrum bands can become fundamental for massive to critical IoT use cases, wherestringent requirements in terms of latency and reliability are present. This is particu-larly true when we consider the forthcoming 5G cellular system, that aims at addressingthe requirements of a wide range of heterogeneous applications within a single network,exploiting the concept of network slicing [8, 9] and network virtualization [10, 11]. Asan example, next generation 5G mobile networks are envisaged to ensure the presenceof a massive number of devices and new services such as enhanced Mobile Broadband(eMBB), massive Machine-Type Communications (mMTC), traffic control and industrialcontrol (Drone/Robot/Vehicle) and tactile Internet etc., so that critical communicationsand network operations can be efficiently supported. Moreover, cellular communicationmay exploit the security mechanism of existing cellular networks which are based on pro-tecting basic connectivity and privacy of end-users, thus allowing to ensure an enhancedsecurity mechanism addressing issues on authentication, authorization, and accounting(AAA) for heterogeneous interconnected IoT devices.
In this paper we discuss the state of the art of Wide Area transmission technologiesemployed within the context of different IoT application scenarios. In particular, referringto the existing technologies, we consider both license-based (i.e., cellular) and license-free(e.g., LoRaWAN and other Sub-GHz technologies). Then, future trends are analyzed,discussing in particular the expected advantages to be brought by the introduction of theupcoming 5G cellular technology in the IoT context, with the possibility of exploiting theedge computing paradigm and the slicing concept. In the second part of the paper, theadvantages and drawbacks of the two main technological frameworks (e.g., licensed andlicense-free) are examined according to the different system requirements. Finally, two
68_____________________________________________________________________________________
Wide Area Transmission Technologies for IoT

specific use cases are presented considering either their current development and theirconceivable system requisites evolution due to 5G entrance within IoT communicationtechnology framework.
This paper is drawn up as follows. In Section 2 several IoT scenarios are reviewed.Section 3 presents current IoT enabling technologies while Section 4 shows the upcomingones. Section 5 reports a technologies comparison together with a glance to research chal-lenges and future directions. Section 6 shows two common use cases which are currentlyenabled by LoRa modulation. Then, a discussion about the architectural transformationsthat will be entailed by the imminent advent of 5G, is provided. Finally, Section 7 reportsconclusions and final remarks.
2 IoT Application Scenarios
LPWANs are massively employed within lots of operating scenarios. Most of the times,they are exploited for monitoring issues. Hereinafter, the main scenarios, along with someexamples, are reported.
Smart Cities
There is a huge number of applications which aim at improving and enhancing the qualityand lifestyle for city residents through gathering information which are relevant to theirneeds [12, 13]. As an example, a typical LPWAN for smart cities has sensor nodes deployedwithin the urban environment so as to monitor the occurrence and the extent of events inorder to prevent car crashes, to safeguard inhabitants health, to efficiently manage assetsand resources or to enhance the performances and the quality of urban services.
A typical municipal service that can take great advantage by the introduction of IoTis represented by waste management. As an example, in [14] a waste management andmonitoring system based on LPWANs is presented. More specifically, a sensor node forthe monitoring of the filling level of trashbins is developed. Indeed, having a preciseknowledge of this quantity permits to better organize the depletion procedures. Anotherparameter that is recognized to be very important in the urban environment context isrepresented by the level of air pollutants. In [15, 16] two wireless sensor networks for widearea monitoring of air pollution are presented. However, even though the previous workson smart cities mainly rely on a single enabling standard, different IoT communicationtechnologies may suit just as well [17]. More generally, the smart city scenario includesa wide range of applications, such as structural health, video surveillance, monitoring ofparking spaces [18, 19], noise urban maps, smart lighting [20, 21], and many others [22].Hence, they can be characterized by a wide range of requirements in regard of tolerabledelay, data throughput, update frequency. Nevertheless, they are all nearly always cate-gorized as massive IoT application scenarios, since they do not require stringent latencyand reliability requirements.
Environmental Monitoring
The communication devices for this category of applications typically require very lowpower operation but, since they can also be deployed over very large areas, they may
_____________________________________________________________________________________ CNIT Technical Report-05 ꟷ Internet of Things: Technologies, Challenges and Impact
69

require very long communication range. This context encompasses many scenarios andsome of them may overlap, for instance, with smart cities paradigms or transports andlogistics as it is shown in [23] where an LPWAN is proposed for environmental monitor-ing of a high-speed rail station whose parameters of interest are temperature, humidity,luminance, and noise. In addition, similar networks for remote monitoring proved to bea reliable choice even in hostile environments as the marine one [24].
In some situations, environmental monitoring may require a network infrastructurecomposed by sensor nodes that are able to move within the monitored area. To this end,an interesting proposal is the one set forth in [25] where an LPWAN for environmentalmonitoring composed by unmanned aerial vehicles equipped with sensors and transceiversis proposed.
Another typical scenario for environmental monitoring envisages the evaluation of bothair and water quality taken as indicators of ambience wholesomeness. To this regard, thestudy in [26] proposes a full IoT solution, while [27] shows a patented system for a watermonitoring system.
Finally, another typical environmental monitoring scenario is given by the collectionof meteorological parameters. In [29] a solution is proposed, in which a set of remotelyavailable sensors forward meteorological data to the Internet.
The aforementioned scenarios are characterized by very loose constraints in terms oftolerable delay, updated frequency, data rate and, in many cases, packet loss ratio as well[22]. As such, they can fall in the category of massive IoT, but by no means they can becategorized as critical IoT scenarios.
Smart Agriculture
Farmers and breeders may capitalise on LPWANs and IoT technologies since they couldenable the tracking of the conditions and of the health of cattle alongside sending datarelated to soil (e.g., temperature and humidity) so as to control fertilising procedures orirrigation systems as well. Such a task may be fulfilled as suggested in [30], where anIoT smart water management platform for irrigation control is presented. Other inter-esting applications in this context are presented in [31] and [32], where different baselinetechnologies are respectively proposed, or even in [33] where a monitoring system for avineyard based on cellular technologies is set up. Finally, [34] shows a smart agricultureinformation system which operates thanks to cellular technologies.
Energy efficiency is perhaps the most important aspect of this scenario, in particularwhen most IoT devices are battery powered and are expected to be operational for a verylong period without human intervention. On the other hand, no stringent requirementsin terms of latency and data rate are required for this scenario.
Transports, Tracking and Logistics
IoT market received a huge contribution due to the development of LPWANs for trans-ports and logistics monitoring. Thanks to the enabling technologies it is feasible to trackvehicles (e.g., from cars or buses to boats and trains) and mobile assets shipped all overthe world (e.g., parcels, luggage, crates, containers and packages).
Tracking systems for public transport can be implemented by means of modulationsenabling LPWANs rather than the classic GPS techniques as it is shown in [35]: trans-
70_____________________________________________________________________________________
Wide Area Transmission Technologies for IoT

mitters are installed onto buses and receivers are set up onto bus stops. Hence, thecommunication takes place whenever a bus enters in an area covered by the signal emit-ted from the bus stop. Indeed, in urban areas having dense bus stops, a real time trackingcould be accomplished avoiding standard GPS thus lowering devices costs.
Tracking could be also a topic which can be considered in a broader sense. Indeed,most of the time vehicles or assets are subject to tracking. However, also runners involvedin cross country races may be tracked by making use of LPWAN networks [36].
One of the fundamental requirements for this class of applications is global coverageand mobility. As such, despite the aforementioned related works deal with non cellulartechnologies since they have been proposed as an efficient and low cost solution in somecases, it is expected that LPWAN cellular communications will represent the most viableoption. Indeed, an instance of tracking by exploiting cellular technology can be retrievedin [37].
Industrial Monitoring
Unlike the previous IoT scenarios, the Industrial Internet of Things (IIoT) (especially inprocess monitoring and control) requires in general very stringent requirements in termsof both latency and reliability [38]. As a matter of fact, manufacturing industries were oneof the pioneers in adopting Time Sensitive Networking (TSN) technology through wiredconnections. At the same time, they have seized Machine to Machine (M2M) connectivityfor decades to enhance supply chain efficiency whilst, nowadays, it is exploited to monitordevices as well as to signal and prevent faults. An example of fault in industrial plantscould be chemical emissions and an instance of this type of fault detection is shown in[39]. Another study [40] considers wearable sensor nodes for environmental monitoringwhose target is to supervise the concentration of harmful gases in industrial plants. Alsomachine vibrations could be a phenomenon to be monitored within industrial contexts: asolution could be to set up a hybrid network infrastructure enabled by both non-cellularand cellular technologies [41]: the former conveys data from sensor nodes to the gatewayswhile the latter is in charge of forwarding such data to the Internet. Moreover, cellu-lar technologies may also enable the monitoring of water level in industrial tanks [42].On the other hand, in this application scenario several new challenging aspects emerge:thousands of nodes generate GB/s of aggregate data (massive capacity), automation pro-cesses set very stringent requirements in terms of reliability (up to the order of 10-9),communication latency and jitter (less than 100µs and about 1µs, respectively), energymanagement of the nodes can be over-constrained (e.g., battery-less devices). All theseaspects lead to system requirements that cannot be fulfilled by current and near-futurewireless technologies, such as the ones defined in the 5G standard. In fact, the currenttrend to satisfy such requirements, based on cell densification, massive MIMO transmis-sion, and the exploitation of higher frequency bands, is not enough. The IMT-2030,namely the ”connectivity beyond 5G”, is already defining the requirements for the futureconnectivity that must satisfy simultaneously the ultra-low-latency, ultra-massive andultra-reliability requirements, while maintaining an affordable complexity and low energyconsumption. To tackle these objectives, a technological and design paradigm shift isneeded.
_____________________________________________________________________________________ CNIT Technical Report-05 ꟷ Internet of Things: Technologies, Challenges and Impact
71

Smart Healthcare
The IoT potentialities are expected to strongly impact and influence the medical andhealthcare system [43]. In particular, IoT in healthcare can be seen as a viable meanfor facilitating the process of collecting patient data and providing an insurmountablequantity of data that can be used to advance scientific studies in disease cures, diagnosis,etc. To this regard, in [44, 45] low power wearable devices equipped with sensors areproposed to serve as data sourcing platforms for doctors and service providers. In [46, 47],the main enabling technologies (either licensed-based and licensed-free), challenges andopportunities for smart healthcare and remote healthcare monitoring are surveyed. Theauthors claim that multiple sensors for detecting vital parameters (e.g., respiratory rate,heart rate, blood pressure, body temperature and so on) could be part of an LPWANthat stores such data into a cloud on which machine learning algorithms are appliedso that medical staff may take advantage by. Some interesting solutions for monitoringvital parameters, detecting falls on elderly people (and many other criteria) based on non-cellular and cellular technologies, respectively, are presented in [48, 49, 50]. Moreover, [51]proposes a way so to set up smart hospitals solely relying on cellular enabling technologies.
In smart healthcare scenarios, relatively low latency in the order of few seconds aregenerally needed while stringent requirements in terms of data rate and update frequencycan be needed in some cases (e.g., real-time emergency response and remote diagnostics).
Vehicular Communications
Intelligent transportation systems (ITS) are used to ensure that the transportation net-work is efficiently monitored and controlled [52, 53]. In particular, ITS aims at ensuringthat system reliability, availability, efficiency and safety of the transportation networkare guaranteed. Despite there are some solutions for implementing vehicular monitoringplatforms base on non-cellular LPWANs [54], this is a typical application scenario wherethe advent of 5G, and beyond 5G cellular communication systems, will play a fundamen-tal role, particularly with the view of on-going potential development in autonomous cars(i.e., self-driving cars). Indeed, in this case, ultra reliable and low latency communicationsare mandatory [55, 56, 57, 58, 59, 60].
3 Current IoT Enabling Technologies
These technologies can make use of the spectrum belonging to the unlicensed ISM bandsor to the licensed cellular spectrum. In the first case, their carrier frequencies are regiondepending. Therefore, hardware devices must be thoroughly chosen bearing in mind theplace in which the network will be deployed. Moreover, for such technologies some of thestandards are free whilst some other may require subscription fees. Finally, at the end ofthis Section, Table 1 recaps some of the previously mentioned related works highlightingthe relative operating scenarios and enabling technologies.
3.1 Sigfox
Sigfox is a French company founded more than 10 years ago and Sigfox networks arepresently operating all over the world. Commonly with other IoT technologies, also
72_____________________________________________________________________________________
Wide Area Transmission Technologies for IoT

Sigfox networks work within the Sub-GHz spectrum. Users have to pay a subscriptionwhich offers different plans. The network topology is a star one enabling both uplinksand downlinks. Sigfox is characterized by a small size payload (i.e., at most 12B) thatturns to be a major drawback, and a limited number of possible transmitting packetsper day, depending on the subscription plan. Sigfox also offers a network infrastructureand a cloud service to retrieve, and possibly analyze, the transmitted data. In doing so,users have only to concern about the sensor nodes since all the network side is in chargeof Sigfox itself. It operates within ISM bands requiring very narrow band (i.e., only100Hz) and providing very slow data-rates (i.e., only 100 bps). Sigfox takes advantage ofthe Binary Phase Shift Keying (BPSK) modulation and of the Random Frequency TimeDivision Multiple Access (RFTDMA) technique to access the channel.
3.2 Ingenu
At its release, more than a decade ago, Ingenu was an innovative technology in the LP-WANs scenery. It utilizes higher ISM frequencies than Sigfox. Indeed, it operates at2.4GHz that is the same frequency of WiFi or Bluetooth. The advantage of this bandis that it is globally available, so that developers do not have to consider in what regionstheir products will be deployed, differently from Sigfox. Moreover, 2.4GHz band offersbroader bandwidth than sub-GHz ISM bands. Along with the Differential Binary PhaseShift Keying (D-BPSK) modulation, the core of the Ingenu LPWAN is its proprietaryand patented technology: the Random Phase Multiple Access (RPMA) [61]. It is both aphysic and Medium Access Control (MAC) layer especially developed by Ingenu to satisfythe requirements of an LPWAN: extended battery lifetime, robustness towards interfer-ence and wide coverage and high capacity since a single RPMA access point may coverup to 450 km2 and may handle up to 530000 messages per hour. RPMA is also capable toaddress, among many other features, bi-directional communication and broadcast trans-mission. Ingenu has built the first wireless Machine Network: the largest IoT networkin the world dedicated to connectivity for machines, that has been set up in more than30 cities (most of them in the US). Moreover, similarly to Sigfox, Ingenu provides all thenetwork infrastructure.
3.3 Weightless
Weightless comprises a set of wireless standards for LPWAN conceived for exchangingdata between sensor nodes and base stations [62]. It has been managed by the EnglishWeightless Special Interest Group since 2012. At its early days, three standards werereleased (i.e., Weightless-P, Weightless-N, Weightless-W): two of them were deprecated infavour of the remaining one. Weightless-N provided only for uplinks, hence it was a mono-directional communication standard. Weightless-W was intended to operate within theunused frequencies belonging to the TV bands (i.e., 470÷790MHz). Weightless-P is theonly surviving standard, indeed it is simply named as Weightless, since it is bi-directional,it needs a narrow band to run and it exploits all the frequencies belonging to the ISMunlicensed sub-GHz bands (i.e., 163MHz, 433MHz, 470MHz, 780MHz, 868MHz,915MHz and 923MHz). In addition, Weightless is also an open standard that makesuse of both the Gaussian Minimum Shift Keying (GMSK) and the Offset Quadrature
_____________________________________________________________________________________ CNIT Technical Report-05 ꟷ Internet of Things: Technologies, Challenges and Impact
73

Phase Shift Keying (OQPSK) modulations and of the Time-Division Multiple Access(TDMA) scheme to access the communication channel.
3.4 LoRa
Long Range (LoRa) modulation is a patented digital wireless communication standarddeveloped in 2012 and owned by the American company Semtech. It is based on the ChirpSpreading Spectrum (CSS) modulation and exploits the Additive Links On-Line HawaiiArea (ALOHA) technique to access the communication channel (i.e., transmission mayoccur at any time). Nowadays it is managed and controlled by the LoRa Alliance whichis a consortium made up by over 500 companies dealing both with hardware and soft-ware. Such an institution also released the Long Range Wide Area Network (LoRaWAN)standard (i.e., a communication protocol referring to the MAC layer which is based ontothe LoRa modulation). In contrast with the proprietary nature of the modulation bywhich Semtech receives royalties from chip vendors that sell LoRa modules, LoRaWANspecification is openly available. LoRaWAN is not the only network built on top of theLoRa modulation. Indeed, Link Labs has developed a competing LoRa based LPWAN.
LoRa is a long range wireless communication technology, with coverage ranging fromfew kilometers in urban areas, up to tens kilometers in rural environments. Similarly to theother LPWAN technologies, LoRa is designed for single-hop communications within startopologies networks. Nevertheless, there exists a recent study that shows the feasibilityof a mesh network by means of this modulation [63].
3.5 Cellular IoT
Two cellular IoT technologies, namely narrow-band IoT (NB-IoT) and LTE-M, havebeen designed within the 3GPP release 13 standardization activity. Such technologies aredeployed as part of the LTE network today and are expected to work with 5G networksin the future using the non-standalone (NSA) architecture, where the legacy LTE corenetwork is used for control-plane functionality such as initial access, paging, and mobility,while the radio access network (RAN) functionalities are carried out through the 5G NR[28]. However,, as dictated by the 3GPP Release 15 (i.e., the first 5G standard), inthe first phase the radio interface will still be LTE-based, while the core network willbe 5G service based architecture (SBA). The two cellular technologies are similar, inthat they are both designed with the aim of supporting low device complexity, massiveconnection density, low device power consumption, low latency and extended coverage.The main difference is that LTE-M supports mobility, higher bandwidth (1.4 MHz) anddata rates (up to 1 Mbps), whereas NB-IoT supports 180 KHz bandwidth (one resourceblock of LTE) with data rates lower than 100 kbps, and it does not support mobility. Onthe other hand, NB-IoT works at lower frequency bands making it excellent for indooruses. Finally, NB-IoT has much higher latency (i.e., from 1.5 to 10 s versus 50-100 msof LTE-M). Given that, it is clear that such cellular technologies can be considered thelicensed counterparts to unlicensed LPWAN technologies, in that they are designed forapplications with no stringent requirement in terms of latency and data rate. In otherterms, all the aforementioned technologies are suitable for massive IoT while they cannotsupport critical IoT scenarios.
74_____________________________________________________________________________________
Wide Area Transmission Technologies for IoT

Tab
le1:
lite
ratu
rere
vie
wre
cap
sort
edou
tby
oper
atin
gsc
enar
ios
and
enab
lin
gte
chn
olog
ies.
Tech
nologies
Opera
tingScenarios
Sm
art
Envir
onm
enta
lS
mar
tT
ran
spor
ts,
Tra
ckin
gIn
du
stri
alS
mar
tV
ehic
ula
rC
itie
sM
onit
orin
gA
gric
ult
ure
and
Log
isti
csM
onit
orin
gH
ealt
hca
reC
omm
un
icat
ion
s
Sig
fox
[29]
[32]
Inge
nu
[20]
[27]
Wei
ghtl
ess
[18]
LoR
a
[14]
[23]
[24]
[25]
[30]
[31]
[23]
[35]
[36]
[39]
[41]
[48]
[54]
[15]
[23]
[64]
NB
-IoT
[16]
[34]
[41]
[42]
[49]
[51]
[60]
[19]
[21]
LT
E-M
[33]
[37]
[45]
[37]
[50]
[59]
_____________________________________________________________________________________ CNIT Technical Report-05 ꟷ Internet of Things: Technologies, Challenges and Impact
75

4 Upcoming IoT Enabling Technologies
The possibility of implementing critical IoT scenarios together with massive IoT is rec-ognized as one of the fundamental step towards the full realization of the IoT vision,including the full range of application scenarios. Among them, communication withvehicles for self-driving cars, industrial automation and process control, critical health-care including tactile Internet for tele-surgery, augmented and virtual reality for gaming,tourism, teaching, etc., call for the broad implementation of the 5G vision where a singlenetwork may provide a wide set of use cases. Comparing with existing unlicensed optionsfor IoT, there is an urgent need for supporting ultra-reliable and low latency (URLLC)communications, or critical communications. To this aim, 3GPP release 15 [65] and 16[66] have defined solutions for new radio (NR) at both the physical layer and upper layersto reduce latency and improve system reliability.
The main innovations brought by 5G with respect to 4G are represented by: (i) Thedefinition of a flexible frame structure, with shorter slots for low latency transmissions;(ii) Non-slot based scheduling and mini-slot scheduling, where URLLC traffics can bescheduled within shorter version of slots; (iii) Semi-persistent scheduling for downlinktransmissions, where a gNB may transmit a packet towards the device without send-ing the information about the scheduling decision (grant mechanism); (iv) Grant freetransmission in the uplink, where a device can transmit towards the gNB without thesending request/grant mechanism; (v) Multiplexing of URLLC and eMBB, where an ur-gent URLLC packet can be scheduled occupying resources already assigned to eMMBwithout waiting for the next scheduling opportunity; (vi) Enhancement of the downlinkphysical control channel to increase reliability (e.g., by repetition); (vii) Enhancementsof acknowledgement mechanism, to reduce the latency for URLLC traffics.
At the same time, the Release 16 working activity is elaborating the possibility ofextending 5G spectrum allowing access to shared and unlicensed spectrum with the goalof providing more capacity, higher spectrum utilization, and new deployment scenarios.It will benefit mobile operators with licensed spectrum, but also create opportunities forthose without licensed spectrum to take advantage of 5G technologies.
The aforementioned innovations allows to increase the flexibility of the radio accessnetwork (RAN), thus opening the way for the implementation of a network that cancope with the requirements of different application scenarios, such as those categorized asmassive and critical IoT. Moreover, 5G allows to implement virtual networks (i.e., networkslicing), in order to provide connectivity more adjusted to specific needs. The creationof virtual programmable networks will increase the service agility that is the possibilityof re-configuring a part of the network by applying, for example, different latency orprioritizing them in the connection to the network so that they cannot be affected bypossible overloads of the mobile network (e.g., for guaranteeing reliability and latency).
5 Technology Comparison and Research Challenges
In this Section we aim at providing useful guidelines for the selection of the most properIoT technology, comparing in particular cellular (i.e., licensed) and unlicensed technolo-gies, given the current maturity level of the different options. As a matter of fact, 5Gpromises to represent a sort of panacea in the next future, but, for the time being, NB-
76_____________________________________________________________________________________
Wide Area Transmission Technologies for IoT

IoT is the only licensed IoT communications technology available on the market. Hence,given the current situation, the application scenario is the main discriminant and in mostof the cases it is the one that dictates the technology to exploit.
For instance, adopting cellular-based solutions is quite inconvenient whenever a multi-tude of sensor nodes have to be deployed since such a choice entails pretty high subscrip-tion costs due to the high number of SIMs to be bought and maintained. On the otherhand, adopting unlicensed technologies (e.g., LoRa) and providing Internet connectivityto the gateways by means of cellular solutions, in case no WiFi or Ethernet facilities areavailable, could be a bold move since it is expected that far less gateways than sensornodes are required.
On the contrary, in situations in which a high data-load has to be sent and receivedavoiding data losses, or in real-time applications as well, cellular technologies definitelysuit better. Indeed, due to the fact that they exploit licensed frequencies and since theylean on robust and tested network infrastructures (i.e., the cellular ones), achieving nodata loss and real-time data streams is smoothly feasible. On the other hand, since telecomoperators have not provided so far ad-hoc price plans for IoT users, adopting cellularsolutions might result in pretty high running costs. Moreover, existing communicationstandards are often too energy demanding for sensor nodes lacking of renewable sourcesof power.
Given the above, what will the future hold for IoT communication technologies?Which one will prevail amid licensed-free and licensed-based solutions? Albeit thereis a significant hype on 5G, will it revolutionize the current technology framework? Howunlicensed solutions will keep up to it? Without the necessity of staring at the crystalball, 5G will surely break the equilibria that implicitly have been formed so far since itsspecifications ensure global coverage, high data-rates, low power consumption and ad-hocprice plans for different slices of the network. With regard to coverage, non cellular com-munications cannot compete with cellular ones and this is one of the most valuable prosof 5G. However, LoRaWAN standard is on its way to face and bridge such a gap. Indeed,quite recently two different projects [67, 68] have been started with the aim to enable LoRasatellite connectivity. The basic idea is to employ PocketQubes (i.e., 5x5x5 cm satellites)acting as LoRa gateways or repeaters. In particular, [67] exploits LoRa modulation onlicensed frequencies (so, sensor nodes have to be re-designed in order to transmit in thosebands and users have to pay a fee to broadcast in such a spectrum), while [68] proposesa solution where the same ISM bands of the LoRaWAN standard are exploited for com-municating with the satellites, even if users have to pay for each transmitted messagetowards the space.
6 Two LoRa-based use cases
In the following, we go into much details in the description of two use cases that havebeen developed at the Department of Information Engineering and Mathematical Sciences(DIISM) of the University of Siena. The first one belongs to a Smart City scenario anddeals with smart waste management [14, 64]. In particular, it faces the problem of solidwaste monitoring by using an innovative IoT node architecture so as to monitor the fillingof garbage bins spread all over the city. The second one falls both in the environmentalmonitoring scenario as well as the paradigm of Industry 4.0 for seafarms [24]. More
_____________________________________________________________________________________ CNIT Technical Report-05 ꟷ Internet of Things: Technologies, Challenges and Impact
77

specifically, it consists in providing an IoT solution for remote monitoring of overboard sea farms.
Concerning the first use case, the system requirements for what concerns the sensing platforms (i.e., the so-called ”Smart Bins”) can be summarized as follows: (i) Long transmission range; (ii) Very low per unit cost, owing to the massive number of required nodes; (iii) Low frequency update; (iv) Very low power consumption.
The system designed for fulfilling all the above requirements is based on a city-scale LoRaWAN network infrastructure, allowing transmission ranges of nearly 1.5 km in the considered urban environments of the cities of Florence and Siena, Italy.
The architecture of the sensor nodes used for this application is very simple as well. It includes a low power microcontroller (i.e., an ATtiny84 produced by Microchip) driving a LoRa transceiver (i.e., an RFM95 produced by HopeRF embedded in a breakout board produced by Adafruit) that are both powered by a battery pack (i.e., 4 AA lithium batteries providing 6 V and 4800 mAh) passing through a 5 V voltage regulator (i.e., a A7805 produced by Texas Instrument). Three sensors are integrated in the module: an ultrasonic distance sensor for the trash level detection, a temperature sensor and a tilt sensor for overturning detection. This system features a very low cost thanks to the reduced number of electronic components. Duty-cycling policies are actuated at a microcontroller level, thus allowing to notably reduce power consumption and to increase the node life time up to a couple of years. The prototype of the sensor node is shown in Fig. 1a, while in Fig. 1b it was housed within an IP56 box during some laboratory tests simulating its usage inside real trash bins.
(a) (b)
Figure 1: Sensor node for smart waste management: (a) prototype of the sensor node without batteries and antenna, (b) laboratory tests inside a real trash bin.
The second use case has slightly different system requirements. The main difference concerns the number of involved nodes, that in this case is limited to few units. The other requirements are similar, including the very low power consumption, since even though the seamark buoy (which is exploited to install all the elements composing the sensor node) can be exploited to install photovoltaic cells for energy harvesting, such a technique is specifically adopted for running the required sensors (which are non-standard
78_____________________________________________________________________________________
Wide Area Transmission Technologies for IoT

ones due to their operating environment) rather than for the transmitting electronics that,instead, was designed to be battery powered.
Also in this case, we adopted a LoRaWAN network infrastructure. The main goal isthat of conveying a bunch of environmental parameter from offshore to ashore, which areboth related to air and sea, so as to remotely monitor the overboard productive plants aswell as fish wholesomeness. Such data are sampled by employing suitable sensors (e.g.,marine temperature probes and current meters) that are installed on board of seamarkbuoys. These sensors are managed by an ad-hoc control system which is connected toa tailor-made RS232-LoRaWAN interface (see Fig. 2) whose purpose is to arrange datacoming from sensors in LoRaWAN packets and to broadcast such information ashore bycovering an 8.33 km distance. Test results proved the feasibility and the robustness of theproposed solution [24]. Hence, two gateways (see Fig. 3) were positioned ashore in orderto establish a space diversity scheme so as to enhance the delivery reliability.
Figure 2: RS232-LoRaWAN interface.
In order to fulfill the very low power consumption requirement, we adopted the fol-lowing extremely low power components: an STM32L073 microcontroller produced bySTMicroelectronics and an RFM95 LoRa transceiver manufactured by HopeRF and mis-cellaneous low power electronics. Finally, the system is powered by a 3600mA lithiumions battery providing 4.2V ensuring nearly 500 days lifetime.
The rationale behind the choice of LoRa in both scenarios can be traced back to theconsiderations drawn in the previous Section. In particular, as for the first scenario, thenumber of nodes is very high and hence, adopting cellular solutions might result in prettyhigh running costs (as long as telecom operators do not provide ad-hoc price plans forIoT users). Moreover, existing cellular solutions are still too energy demanding, whereasLoRa allows to design ad-hoc architectures specifically tailored to save energy, that wasone of the main requirements for both scenarios. On the other hand the situation can
_____________________________________________________________________________________ CNIT Technical Report-05 ꟷ Internet of Things: Technologies, Challenges and Impact
79

Figure 3: Gateways and their antennas in the installation site.
drastically change in the next future, and hence both systems could be easily re-designedto encompass cellular communications. In particular, the second scenario could takegreat advantage from the use of a cellular solution since we could avoid deploying ashoregateways for providing connection to the Internet.
7 Conclusions
The aim of this paper was to propose a short survey on the state-of-the-art of longrange data transmission technologies, both license-based (i.e., cellular) and license-free(e.g., LoRaWAN and other Sub-GHz technologies), along with their application scenariosand requirements. Due to the upcoming introduction of 5G cellular technologies, allthese scenarios are expected to undergo a rapid change in their operating principles andtechnological layout. It is clear that this change is strictly dependent on the systemrequirements of each specific application. Hence, we have analyzed the future trends,discussing in particular the advantages expected to be brought by 5G with the possibilityof exploiting the edge computing paradigm and the slicing concept. Finally, two specificuse cases developed at the Department of Information Engineering and MathematicalSciences (DIISM) of the University of Siena are presented, discussing the rationale forchoosing LoRa as the communication technology.
80_____________________________________________________________________________________
Wide Area Transmission Technologies for IoT

References
[1] Palattella, M. R., Dohler, M., Grieco, A., Rizzo, G., Torsner, J., Engel, T., & Ladid,L. (2016). Internet of things in the 5G era: Enablers, architecture, and businessmodels. IEEE Journal on Selected Areas in Communications, 34(3), 510-527.
[2] Ericsson report 2019: https://www.ericsson.com/en/mobility-report/reports Ac-cessed on 10 February 2020.
[3] Sigfox. Online Availability: htpp://www.sigfox.com. Accessed on 10 February 2020.
[4] de Carvalho Silva, J., Rodrigues, J. J., Alberti, A. M., Solic, P., & Aquino, A. L.(2017, July). LoRaWAN—A low power WAN protocol for Internet of Things: Areview and opportunities. In 2017 2nd International Multidisciplinary Conference onComputer and Energy Science (SpliTech) (pp. 1-6). IEEE.
[5] Popli, S., Jha, R. K., & Jain, S. (2018). A survey on energy efficient narrowbandinternet of things (NBIoT): Architecture, application and challenges. IEEE Access,7, 16739-16776.
[6] Ikpehai, A., Adebisi, B., Rabie, K. M., Anoh, K., Ande, R. E., Hammoudeh, M.,Gacanin, H., & Mbanaso, U. M. (2018). Low-power wide area network technologiesfor internet-of-things: A comparative review. IEEE Internet of Things Journal, 6(2),2225-2240.
[7] Agiwal, M., Roy, A., & Saxena, N. (2016). Next generation 5G wireless networks: Acomprehensive survey. IEEE Communications Surveys & Tutorials, 18(3), 1617-1655.
[8] Foukas, X., Patounas, G., Elmokashfi, A., & Marina, M. K. (2017). Network slicingin 5G: Survey and challenges. IEEE Communications Magazine, 55(5), 94-100.
[9] Zhang, H., Liu, N., Chu, X., Long, K., Aghvami, A. H., & Leung, V. C. (2017). Net-work slicing based 5G and future mobile networks: mobility, resource management,and challenges. IEEE communications magazine, 55(8), 138-145.
[10] Feng, J., Zhang, Q., Dong, G., Cao, P., & Feng, Z. (2017, March). An approach to 5Gwireless network virtualization: Architecture and trial environment. In 2017 IEEEWireless Communications and Networking Conference (WCNC) (pp. 1-6). IEEE.
[11] Abdelwahab, S., Hamdaoui, B., Guizani, M., & Znati, T. (2016). Network functionvirtualization in 5G. IEEE Communications Magazine, 54(4), 84-91.
[12] Gea, T., Paradells, J., Lamarca, M., & Roldan, D. (2013, July). Smart cities asan application of internet of things: Experiences and lessons learnt in barcelona. In2013 Seventh International Conference on Innovative Mobile and Internet Servicesin Ubiquitous Computing (pp. 552-557). IEEE.
[13] Jin, J., Gubbi, J., Marusic, S., & Palaniswami, M. (2014). An information frameworkfor creating a smart city through internet of things. IEEE Internet of Things journal,1(2), 112-121.
_____________________________________________________________________________________ CNIT Technical Report-05 ꟷ Internet of Things: Technologies, Challenges and Impact
81

[14] Cerchecci, M., Luti, F., Mecocci, A., Parrino, S., Peruzzi, G., & Pozzebon, A. (2018).A low power IoT sensor node architecture for waste management within smart citiescontext. Sensors, 18(4), 1282.
[15] Rossi, M., & Tosato, P. (2017, July). Energy neutral design of an IoT system for pollu-tion monitoring. In 2017 IEEE Workshop on Environmental, Energy, and StructuralMonitoring Systems (EESMS) (pp. 1-6). IEEE.
[16] Duangsuwan, S., Takarn, A., & Jamjareegulgarn, P. (2018, September). A Devel-opment on Air Pollution Detection Sensors based on NB-IoT Network for SmartCities. In 2018 18th International Symposium on Communications and InformationTechnologies (ISCIT) (pp. 313-317). IEEE.
[17] Pham, T. L., Nguyen, H., Nguyen, H., Bui, V., & Jang, Y. M. (2019, October). LowPower Wide Area Network Technologies for Smart Cities Applications. In 2019 In-ternational Conference on Information and Communication Technology Convergence(ICTC) (pp. 501-505). IEEE.
[18] https://www.nwave.io/parking-technology Accessed on 17 March 2020.
[19] Shi, J., Jin, L., Li, J., & Fang, Z. (2017, September). A smart parking system basedon NB-IoT and third-party payment platform. In 2017 17th International Symposiumon Communications and Information Technologies (ISCIT) (pp. 1-5). IEEE.
[20] Myers, T. J., Werner, D. T., Sinsuan, K. C., Wilson, J. R., Reuland, S. L., Singler,P. M., & Huovila, M. J. (2013). U.S. Patent No. 8,477,830. Washington, DC: U.S.Patent and Trademark Office.
[21] Zhao, L., Gao, Q., Wang, R., Fang, N., Jin, Z., Wan, N., & Xu, L. (2018, June).Intelligent Street Light System Based on NB-IoT and Energy-saving Algorithm. In2018 3rd International Conference on Smart and Sustainable Technologies (SpliTech)(pp. 1-6). IEEE.
[22] Zanella, A., Bui, N., Castellani, A., Vangelista, L., & Zorzi, M. (2014). Internet ofthings for smart cities. IEEE Internet of Things journal, 1(1), 22-32.
[23] Li, W., Liu, G., & Choi, J. (2019). Environmental monitoring system for intelligentstations. Concurrency and Computation: Practice and Experience, e5131.
[24] Parri, L., Parrino, S., Peruzzi, G., & Pozzebon, A. (2019). Low Power Wide AreaNetworks (LPWAN) at Sea: Performance Analysis of Offshore Data Transmissionby Means of LoRaWAN Connectivity for Marine Monitoring Applications. Sensors,19(14), 3239.
[25] Tarab, H. (2018). Real Time Performance Testing of LoRa-LPWAN Based Environ-mental Monitoring UAV System.
[26] Doni, A., Murthy, C., & Kurian, M. Z. (2018). Survey on multi sensor based air andwater quality monitoring using IoT. Indian J. Sci. Res, 17(2), 147-153.
82_____________________________________________________________________________________
Wide Area Transmission Technologies for IoT

[27] Sinsuan, K. C., Myers, T. J., Cohen, L. N., Werner, D. T., Hughes, M., Boesel,R. W., & Singler, P. M. (2014). U.S. Patent No. 8,831,069. Washington, DC: U.S.Patent and Trademark Office.
[28] E. Dahlman, S. Parkvall, J. Skold, ”5G NR, The Next Generation Wireless AccessTechnology,” Academic Press, 2018.
[29] Joris, L., Dupont, F., Laurent, P., Bellier, P., Stoukatch, S., & Redoute, J. M. (2019).An Autonomous Sigfox Wireless Sensor Node for Environmental Monitoring. IEEESensors Letters, 3(7), 01-04.
[30] Kamienski, C., Soininen, J. P., Taumberger, M., Dantas, R., Toscano, A., SalmonCinotti, T., Filev Maia, R., & Torre Neto, A. (2019). Smart water managementplatform: Iot-based precision irrigation for agriculture. Sensors, 19(2), 276.
[31] Davcev, D., Mitreski, K., Trajkovic, S., Nikolovski, V., & Koteli, N. (2018, June). IoTagriculture system based on LoRaWAN. In 2018 14th IEEE International Workshopon Factory Communication Systems (WFCS) (pp. 1-4). IEEE.
[32] Zhang, X., Andreyev, A., Zumpf, C., Negri, M. C., Guha, S., & Ghosh, M. (2017,May). Thoreau: A subterranean wireless sensing network for agriculture and theenvironment. In 2017 IEEE Conference on Computer Communications Workshops(INFOCOM WKSHPS) (pp. 78-84). IEEE.
[33] https://www.bce.ca/news-and-media/releases/show/Bell-Huawei-and-BeWhere-bring-new-Internet-of-Things-solution-to-Ontario-winery-1 Accessed on 17 March2020.
[34] Yao, Z., & Bian, C. (2019). Smart Agriculture Information System Based on CloudComputing and NB-IoT. DEStech Transactions on Computer Science and Engineer-ing, (cisnrc).
[35] James, J. G., & Nair, S. (2017, November). Efficient, real-time tracking of pub-lic transport, using LoRaWAN and RF transceivers. In TENCON 2017-2017 IEEERegion 10 Conference (pp. 2258-2261). IEEE.
[36] Sendra, S., Romero-Dıaz, P., Garcıa-Navas, J. L., & Lloret, J. (2019). LoRa-BasedSystem for Tracking Runners in Cross Country Races.
[37] Driusso, M., Marshall, C., Sabathy, M., Knutti, F., Mathis, H., & Babich, F. (2016).Vehicular position tracking using LTE signals. IEEE Transactions on Vehicular Tech-nology, 66(4), 3376-3391.
[38] Da Xu, L., He, W., & Li, S. (2014). Internet of things in industries: A survey. IEEETransactions on industrial informatics, 10(4), 2233-2243.
[39] Addabbo, T., Fort, A., Mugnaini, M., Parri, L., Parrino, S., Pozzebon, A., & Vig-noli, V. (2018, April). An IoT framework for the pervasive monitoring of chemicalemissions in industrial plants. In 2018 Workshop on Metrology for Industry 4.0 andIoT (pp. 269-273). IEEE.
_____________________________________________________________________________________ CNIT Technical Report-05 ꟷ Internet of Things: Technologies, Challenges and Impact
83

[40] Antolın, D., Medrano, N., Calvo, B., & Perez, F. (2017). A wearable wireless sensornetwork for indoor smart environment monitoring in safety applications. Sensors,17(2), 365.
[41] Gao, S., Zhang, X., Du, C., & Ji, Q. (2019). A Multichannel Low-Power Wide-Area Network With High-Accuracy Synchronization Ability for Machine VibrationMonitoring. IEEE Internet of Things Journal, 6(3), 5040-5047.
[42] Anand, S., & Regi, R. (2018, February). Remote monitoring of water level in indus-trial storage tanks using NB-IoT. In 2018 International Conference on Communica-tion information and Computing Technology (ICCICT) (pp. 1-4). IEEE.
[43] Pasluosta, C. F., Gassner, H., Winkler, J., Klucken, J., & Eskofier, B. M. (2015).An emerging era in the management of Parkinson’s disease: wearable technologiesand the internet of things. IEEE journal of biomedical and health informatics, 19(6),1873-1881.
[44] Laplante, P. A., & Laplante, N. (2016). The internet of things in healthcare: Potentialapplications and challenges. It Professional, 18(3), 2-4.
[45] Shakhakarmi, N. (2015). Next generation wearable devices: smart health monitoringdevice and smart sousveillance hat using Device to Device (D2D) communicationsin LTE assisted networks. WSEAS Transactions on Communications, 14(2), 25-51.
[46] Baker, S. B., Xiang, W., & Atkinson, I. (2017). Internet of things for smart health-care: Technologies, challenges, and opportunities. IEEE Access, 5, 26521-26544.
[47] Olatinwo, D. D., Abu-Mahfouz, A., & Hancke, G. (2019). A Survey on LPWANTechnologies in WBAN for Remote Health-Care Monitoring. Sensors, 19(23), 5268.
[48] Catherwood, P. A., Rafferty, J., McComb, S., & McLaughlin, J. (2018, July). LP-WAN wearable intelligent healthcare monitoring for heart failure prevention. In Pro-ceedings of the 32nd International BCS Human Computer Interaction Conference 32(pp. 1-4).
[49] Manatarinat, W., Poomrittigul, S., & Tantatsanawong, P. (2019, July). Narrowband-Internet of Things (NB-IoT) System for Elderly Healthcare Services. In 2019 5th In-ternational Conference on Engineering, Applied Sciences and Technology (ICEAST)(pp. 1-4). IEEE.
[50] Croock, M. S. (2014). LTE Based E-Health Monitoring System. IRAQI JOURNALOF COMPUTERS, COMMUNICATION AND CONTROL & SYSTEMS ENGI-NEERING, 14(2), 37-45.
[51] Zhang, H., Li, J., Wen, B., Xun, Y., & Liu, J. (2018). Connecting intelligent thingsin smart hospitals using NB-IoT. IEEE Internet of Things Journal, 5(3), 1550-1560.
[52] Talcott, C. (2008). Cyber-physical systems and events. In Software-Intensive Systemsand New Computing Paradigms (pp. 101-115). Springer, Berlin, Heidelberg.
84_____________________________________________________________________________________
Wide Area Transmission Technologies for IoT

[53] Yongfu, L., Dihua, S., Weining, L., & Xuebo, Z. (2012, July). A service-orientedarchitecture for the transportation cyber-physical systems. In Proceedings of the31st Chinese Control Conference (pp. 7674-7678). IEEE.
[54] Santa, J., Sanchez-Iborra, R., Rodriguez-Rey, P., Bernal-Escobedo, L., & Skarmeta,A. F. (2019). LPWAN-based vehicular monitoring platform with a generic IP networkinterface. Sensors, 19(2), 264.
[55] Al-Shehri, S., Loskot, P., & Hirsch, M. J. (2020). Localization Enhanced MobileNetworks. In Mobile Computing. IntechOpen.
[56] Afaq, M., Iqbal, J., Ahmed, T., Islam, I. U., Khan, M., & Khan, M. S. (2020).Towards 5G network slicing for vehicular ad-hoc networks: An end-to-end approach.Computer Communications, 149, 252-258.
[57] Shen, X., Fantacci, R., & Chen, S. (2020). Internet of Vehicles. Proceedings of theIEEE, 108(2), 242-245.
[58] Hayes, M., & Omar, T. End to End VANET/IoT Communications A 5G SmartCities Case Study Approach.
[59] Chen, S., Hu, J., Shi, Y., & Zhao, L. (2016). LTE-V: A TD-LTE-based V2X solutionfor future vehicular network. IEEE Internet of Things journal, 3(6), 997-1005.
[60] Petrov, V., Samuylov, A., Begishev, V., Moltchanov, D., Andreev, S., Samouylov, K.,& Koucheryavy, Y. (2017). Vehicle-based relay assistance for opportunistic crowd-sensing over narrowband IoT (NB-IoT). IEEE Internet of Things journal, 5(5), 3710-3723.
[61] RPMA. RPMA Technology for the Internet of Things. Ingenu, Tech. Rep. 2016.
[62] Online Availability: http://www.weightless.org Accessed on 10 February 2020.
[63] Abrardo, A., & Pozzebon, A. (2019). A multi-hop LoRa linear sensor network forthe monitoring of underground environments: the case of the Medieval Aqueductsin Siena, Italy. Sensors, 19(2), 402.
[64] Addabbo, T., Fort, A., Mecocci, A., Mugnaini, M., Parrino, S., Pozzebon, A., &Vignoli, V. (2019, March). A LoRa-based IoT Sensor Node for Waste ManagementBased on a Customized Ultrasonic Transceiver. In 2019 IEEE Sensors ApplicationsSymposium (SAS) (pp. 1-6). IEEE.
[65] https://www.3gpp.org/release-15 Accessed on 10 February 2020.
[66] https://www.3gpp.org/release-16 Accessed on 10 February 2020.
[67] https://fossa.systems Accessed on 10 February 2020.
[68] https://lacuna.space/company/ Accessed on 10 February 2020.
_____________________________________________________________________________________ CNIT Technical Report-05 ꟷ Internet of Things: Technologies, Challenges and Impact
85


Enabling technologies for the Internet of Vehicles:standards, research and open challenges
Claudia Campolo, Antonella Molinaro
University Mediterranea of Reggio Calabria
Abstract: The recent technological advancements in the field of sensing, automation,computing and communication technologies for vehicles are revolutionizing transportationsystems on a global scale, while fostering large investments in the automotive market.Vehicles, as multi-faceted objects equipped with on board sensors like cameras, radars, po-sitioning receivers, and with storage and processing capabilities, are becoming quite rightlyelements of the Internet of Things (IoT). The Internet of Vehicles (IoV) ecosystem rep-resents a prominent instantiation of the IoT, aimed at enabling smart, efficient and greentraffic management, intelligent vehicle control, safe, comfortable and pleasant driving andtraveling experience. The first step for the IoV is to make vehicles connected and able tointeract with nearby/remote people and objects, and among each other, thanks to vehicle-to-everything (V2X) communication technologies. By leveraging efficient air interfaces,a wide range of allocated frequencies, advanced transceivers, multiple radio access tech-nologies, as well as cutting-edge network softwarization principles, fifth generation (5G)systems intend to guarantee ultra-low latency, ultra-high reliability, and high-data rateV2X connectivity. Further promising paradigms and technologies in the IoT and futureInternet research arena can contribute to address the needs of vehicular applications. Thischapter will describe the IoV status quo, by analyzing the V2X application requirementsand the main enabling communications technologies; research challenges and opportuni-ties related to edge computing, virtualization, artificial intelligence, and other IoV enablerswill also be part of this chapter.
1 Introduction
Nowadays, modern vehicles carry on board high-speed processors, high-capacity memorystorage, and a multitude of sensors, ranging from side collision radars to global positioningsystem (GPS) and cameras, which monitor the internal state of the vehicle and its closesurroundings. Thanks to on board radio transceivers, vehicles can autonomously exchangetheir kinematics parameters, sensed data, and driving intentions with neighboring vehiclesand coordinate their maneuvers in (semi-)autonomous driving settings, or they can senddiagnostics and maintenance information to the cloud servers of manufacturers. Vehiclescan as well provide navigation services and other traffic telematics applications, along withon-demand video streaming and online Internet access to passengers. In short, a vehicle,being equipped with vehicle-to-everything (V2X) connectivity, can exchange data withother communicating entities in its surrounding and becomes an essential element of theInternet of Vehicles (IoV) vision, one of the most prominent instantiation of the Internetof Things (IoT).
_____________________________________________________________________________________ CNIT Technical Report-05 ꟷ Internet of Things: Technologies, Challenges and Impact
87

The ultra-low latency (below 1ms), high-throughput (higher than 1Gbps) and highreliability (close to 100%) requirements of emerging V2X applications, coupled with thehigh speed and the massive amount of vehicles generating data on the road, severely callinto question the current capabilities of available communication technologies. Althoughmore than 20 years passed since a dedicated spectrum was allocated to vehicular com-munications in 1999, the decision about the technology for V2X communications is stillunder debate. Connectivity is not the only concern: automotive applications also requireaccess to computing and storage facilities to respectively process a large amount of data(e.g., vehicle diagnostics, traffic information, high-definition maps) and cache them, inmost cases, as close as possible to where they are generated and likely consumed.
The fifth generation (5G) system appears as the most prominent solution to addressthe daunting challenges of the vehicular ecosystem. Its highly flexible and programmableend-to-end communication, networking, and computing infrastructure can provide in-creased performance in terms of throughput, latency, reliability, capacity, and mobil-ity support, while meeting diversified requirements from multiple services. However,the complexity of the IoV landscape spans other domains and goes beyond what 5Gtechnologies can provide. Indeed, other approaches emerging in the future Internet andIoT realms, e.g., virtualization, software-defined networking (SDN), artificial intelligence,information-centric networking (ICN), Social IoT (SIoT), may be required to facilitateservice provisioning to and from connected and intelligent vehicles.
In such a context, this chapter aims to provide the following main contributions:
• to introduce vehicular applications by especially dissecting the demands of the mostcritical ones, i.e., those related to advanced driving (Section 2);
• to provide an overview of the main V2X communication technologies, with a specialfocus on IEEE 802.11 and cellular-based connectivity solutions (Section 3);
• to analyze cloud computing and its evolution towards edge computing and cachingas key enablers of the IoV concept (Section 4);
• to debate the role of virtualization technologies, as initially conceived in IoT, toaugment and abstract also vehicular devices (Section 5);
• to argue about the potential of the SDN philosophy in IoV to go well beyondtraditional routing (Section 6);
• to analyze the potential of Artificial Intelligence (AI) techniques in IoV (Section 7);
• to unveil the benefits of adding the social dimension to connected vehicles (Section8).
Such targets will be pursued by analysing the IoV status quo and identifying themain intriguing research directions, by scanning the findings of some of the works of theauthors, whenever possible, and of the latest literature and standardization progress.
88_____________________________________________________________________________________
Enabling technologies for the Internet of Vehicles: standards, research and open challenges

2 Vehicular applications
Vehicular applications cover a plethora of use cases that are typically classified accordingto their purpose and minimum demands [1]. The 5G Automotive Association (5GAA)1,which brings together the major telecommunications operators, automotive industries,and chip manufacturers, grouped V2X use cases in four categories: (i) Safety, targetingthe reduction of the frequency and severity of vehicle collisions through the exchangeof warnings; (ii) Convenience, providing services to manage the health of vehicles, likediagnostics and software updates; (iii) Vulnerable Road User (VRU), aiming at ensuringsafe interactions between vehicles and other non-vehicle road users; (iv) Advanced driv-ing assistance, sharing similar objectives with safety use cases, but aiming to supportautonomous and semi-autonomous vehicle operation.
The last category exhibits the strictest delivery requirements. Within the Third Gen-eration Partnership Project (3GPP) this category is further classified as follows [2]: (i) Ve-hicles platooning, enabling the dynamic formation of a group of vehicles travelling togetherwith short inter-vehicle distances; (ii) Advanced driving, where vehicles coordinate theirtrajectories and maneuvers by sharing with other vehicles in proximity both data obtainedfrom local sensors and driving intentions; (iii) Extended sensors, enabling the exchangeof raw/processed sensor data or live videos among vehicles, Road Side Units (RSUs), andVRUs, (iv) Remote driving, allowing a remote driver or a cloud application to tele-operatea (private or public) vehicle, when passengers cannot drive themselves (e.g., impaired peo-ple) or when the vehicle is located in a dangerous or uncomfortable environment (e.g.,earthquake-affected region, road construction work zone).
The requirements for such services get stricter as the degree of vehicle automationincreases: e.g., latency requirements pass from 100 ms for information sharing in case ofadvanced driving, to 5 ms for remote driving. Remote driving also requires very highreliability in the order of 99.999 (five nines) percent. Besides connectivity, these V2Xapplications also need computing resources, e.g., for developing remote vehicle controlsystems, for the analysis and aggregation of sensor/video data retrieved from vehiclesand other sources. This will be clarified in the following Sections.
3 V2X communication technologies
Connectivity is the first step to make a vehicle part of the IoV. Furthermore, V2Xconnectivity plays a pivotal role to minimize the environmental impact of transportationand improve traffic efficiency, support cooperative automated driving, enhance road safetyand make the traveling experience more pleasant.
In the following, the main candidate technologies enabling V2X connectivity will bepresented.
3.1 V2X connectivity options
The term V2X communication collectively gathers multiple types of interactions in the ve-hicular ecosystem. In 3GPP documents [3] the following modes are considered: vehicle-to-vehicle (V2V) communications directly established between vehicles in proximity of each
1http://5gaa.org/
_____________________________________________________________________________________ CNIT Technical Report-05 ꟷ Internet of Things: Technologies, Challenges and Impact
89

other; vehicle-to-infrastructure (V2I) between vehicles and nearby roadside infrastructure,such as RSUs in traffic lights or eNodeBs; vehicle-to-pedestrian (V2P) between vehiclesand VRUs, including e.g., pedestrians, motorcyclists, bikers, roller skaters, wheelchairs;vehicle-to-network (V2N) allowing vehicles to interact with remote communication enti-ties (e.g., a cloud server) reachable through the cellular infrastructure.
Besides interacting with on-board sensors, with passengers and their smart devices,with other vehicles and RSUs on ground, vehicles can also exchange data with space andaerial platforms (e.g., satellites, drones). Vehicle-to-drone (V2D) communications areinvestigated in [4]. Drones can help vehicles acquire data from wider geographic areas[5]; they can carry mobile base stations to fill the gap of short-range connections, whilecomplementing the coverage of terrestrial base stations [6].
In addition, IoV is expected to be integrated with other IoT systems, such as smarthomes, smart cities, smart grids, hence new types of interactions will be supported, suchas vehicle-to-grid (V2G), vehicle-to-home (V2H) [7], and so on.
3.2 IEEE 802.11
IEEE 802.11 initially elicited the interest of the industrial and academic community,due to operation simplicity and native support for V2V communications in a distributedmanner. The IEEE 802.11p amendment, now part of the IEEE 802.11 standard [8], wasconceived as an enhancement of the IEEE 802.11a, with physical (PHY) and mediumaccess control (MAC) layers’ settings and procedures properly adjusted to support out-door communications under high speed mobility. It was complemented by the IEEE 1609family of standards [9], collectively referred to as Wireless Access in Vehicular Environ-ment (WAVE), including the architecture, management structure, security, and physicalaccess for wireless vehicular networks.
Worldwide field trials have demonstrated the .11p feasibility of supporting basic safetyapplications (e.g., emergency brake light, stationary vehicle warning) [10] in low congestedscenarios. Nevertheless, this technology suffers from poor performance under high trafficdensity, so it cannot fulfill the strict requirements for very low latency and high-bandwidthof advanced V2X applications. Such limitations are mainly due to a basic PHY layer andto the lack of a protection mechanism from interference and collisions, especially forbroadcast communications, at the MAC layer, as ruled by the distributed carrier sensingmultiple access with collision avoidance (CSMA/CA) protocol [10].
Many attempts to improve the IEEE 802.11 performance can be found in the literature.Among them, in [11] the authors propose to leverage full duplex (FD) radios on boardto enable collision detection of broadcast packets while transmitting. The reliability ofbroadcast communications can be improved by recovering from packet losses via informed,other than blind, retransmissions.
Recently, a new IEEE study group, named IEEE 802.11 Next Generation V2X (NGV),now preparing the IEEE 802.11bd amendment, has been created to investigate evolvedPHY technologies, such as multiple input multiple output (MIMO) and advanced codingtechniques, in order to enhance the .11p coverage and throughput [12].
90_____________________________________________________________________________________
Enabling technologies for the Internet of Vehicles: standards, research and open challenges

3.3 Cellular-V2X
The previous role of IEEE 802.11 as the de-facto standard for V2X communications hasbeen undermined by the cellular technology, powerfully entering the automotive domain.As argued in the seminal work of the authors in [13], cellular-based V2X communicationscan adequately cope with the demands of vehicular applications, thanks to the ubiquitousdeployed infrastructure, its centralized organization and mature industrial foundation, aswell as to the support for V2V communications, even out-of-the coverage of a base station,and for multicast/broadcast message dissemination.
The first stage of 3GPP specifications of what is referred to as cellular-V2X (C-V2X)was completed in June 2017 for Release 14, with further refinements included in Release 15in 2019. C-V2X is a unified technology that allows vehicles to communicate with nearbyand remote entities, and guarantees full coverage and service continuity. Its specificationsspan the radio access network (RAN) as well as the core network (CN) segments.
RAN. Modifications over the RAN encompass the conventional long term evolu-tion (LTE)-Uu and the PC5 radio interfaces. The former is leveraged for uplink/downlinkV2N communications and operates in the licensed spectrum. The latter is meant for directlocalized interactions (e.g., V2V, V2P, V2I) in the unlicensed 5.9 GHz band. Most of the3GPP efforts focused on the PC5 customization to match the vehicular applications’ re-quirements. In particular, two communications modes have been specified, namely Mode3 or scheduled, and Mode 4 or autonomous. In Mode 3, operating only in-coverage of aneNodeB, the radio resource allocation is supervised by the network, without specifying agiven algorithm, which is left open to the operators. In Mode 4, a pool of pre-configuredresources can be accessed by vehicles in an autonomous manner, also in out-of coverage ofan eNodeB conditions (e.g., in urban canyons, tunnels). The allocation scheme relies ona sensing mechanism aimed at identifying the less interfered resources as potential candi-dates for transmission. This is coupled with a semi-persistent scheduling (SPS) scheme,which reserves the same resources for multiple transmissions, and well suits the periodicnature of broadcast messages exchanged among vehicles in the one-hop neighborhood,i.e., Cooperative Awareness Messages (CAMs) [14].
CN. Architectural enhancements have been specified to manage V2X communica-tions, with the introduction of two new entities. The V2X Control Function is responsiblefor the V2X policy provisioning and parameters configuration over the PC5 (in- and out-of-coverage) and the LTE-Uu interfaces. The V2X Application server (AS) has a widerange of functionalities, including the reception of uplink unicast data from vehicular UserEquipments (VUEs), VRUs, RSUs, and the data delivery to VUEs in a target area byunicast and/or multicast transmissions.
5G and beyond evolution. C-V2X kept evolving in the last couple of years inorder to be aligned with the 5G new radio (NR) specifications, with enhancements forRelease 16 to be issued by early 2020. Envisioned radio interface modifications havethe main objectives (i) to introduce new/flexible waveforms and numerologies to sup-port the most challenging V2X applications’ demands, and (ii) to improve Modes 3 and4 in order to support peculiar V2X traffic patterns, such as aperiodic traffic [15] andunicast/multicast/groupcast (besides broadcast) communications [12]. Non broadcastcommunication primitives are particularly indicated for platooning applications, wherecommunications must be confined with the platoon. Improvements of the autonomousmode are also suggested for such application, so that resources can be allocated to vehi-
_____________________________________________________________________________________ CNIT Technical Report-05 ꟷ Internet of Things: Technologies, Challenges and Impact
91

cles with the help of other vehicles, e.g., a vehicle in the middle of the platoon that canbetter measure the channel conditions, or the platoon leader, as preliminarily argued inthe work in [16] anticipating Release 16.
The effectiveness and reliability of the 5G NR features at the PHY layer have been in-vestigated in [17], [18], also with comparison with IEEE 802.11bd. Early but encouragingresults about the impact of a flexible numerology in the autonomous resource allocationmode can be also found in the work of the authors in [19].
Other technologies and concepts lie under the 5G-and-beyond umbrella, althoughnot yet prioritized by 3GPP, but which will be likely included in Release 17. Amongthem there is the usage of frequencies above 6 GHz (millimeter waves). Such frequenciespromise larger bandwidth and higher throughput, which can be particularly appealingfor: (i) V2V communications between very close vehicles, e.g., to support extended sen-sor applications in high-density platoons, and (ii) V2I communications for rapid bulkdata transfer to/from a RSU (e.g., for real-time high-definition map download, objectdetection and recognition). The harsh propagation environment may, however, hampersuch benefits. Challenges arise, for example, due to the overhead for the beam trainingunder high mobility and the blockage effect by e.g., pedestrian bodies [20], [21].
The FD technology is another prominent beyond-5G solution. In [22] the authorshave demonstrated that FD on board capabilities can improve the performance of theautonomous mode, by letting vehicles adapt the probability of keeping a given resourceaccording to the level of interference detected while transmitting.
Other enhancements are planned by 3GPP at the architectural level. As the 5G CNdesign in Release 16 is progressing towards a network of functions, it is under discussionwhether a C-V2X architecture, simpler than the one designed in Release 14, can bedeveloped by using some of the available 5G Network Functions (NFs).
3.4 Other connectivity options
Although cellular connectivity is considered as the main option to enable V2X interac-tions, for the sake of completeness it is worth mentioning that other technologies gainingmomentum in the IoT landscape could be exploited in the vehicular domain, for at least asubset of V2X services. Indeed, we expect IoV to be supported by a mash-up of differentconnectivity solutions.
Among short-range technologies, Bluetooth has been considered in [1]. For instance,the work in [23] suggests the usage of Bluetooth to detect VRUs. Low-powered, low-costtransmitters Bluetooth Low Energy (LE) devices can be easily installed into a bicycle andnotify nearby Bluetooth LE devices of their presence. However, due to the very limitedcommunication range (around 50 meters), Bluetooth would hardly match the needs ofgeneralized V2X communications.
Also Visible Light Communications (VLC) gained attention as an alternative to the ex-isting radio frequency (RF) based vehicular communications. Such an attention is mainlyfueled by the need to reduce the load on the crowded wireless channel [24], through a rela-tively simple and energy-efficient system. The same light is used for both illumination andas a data carrier. Although VLC can provide high throughput (in the order of 10 Gbps),its operation is limited to line of sight communications. This prevents eavesdropping.
On the other hand, Low Power-Wide Area Network (LP-WAN) technologies, in par-ticular Long Range Wide Area Network (LoRaWAN), have attracted the interest of au-
92_____________________________________________________________________________________
Enabling technologies for the Internet of Vehicles: standards, research and open challenges

tomotive stakeholders due to the long coverage range and high scalability. They couldoffer a valuable option for small message delivery with low throughput, such as eventnotifications or vehicle diagnostics and monitoring messages [25].
4 Vehicular cloud computing
With the proliferation of smart and autonomous vehicles equipped with a massive num-ber of sensors and human computer interaction devices, several vehicular applicationscan rely on the continuous retrieval and manipulation of big amounts of data, collectedfrom vehicles themselves, road-side sensors, infrastructure nodes and other sources. Anautonomous vehicle is envisaged to generate 1 GB data for every second and, on average,30 TB data per day. Such data can be exploited by different stakeholders (i.e., the driver,the municipality, the road transportation authority, etc.) and used for short-term andlong-term, real-time and non real-time decision taking. For instance, collected data canhelp to predict congested urban areas and to detect anomalous situations in real-time.
The conventional approach is to transfer data, retrieved by on board sensors, to thecloud through V2X connectivity. Storing and processing data in the cloud is adequate forsome V2X use cases, but this may be both unreliable and slow for other more demandinguse cases (e.g., augmenting the driver’s visual perception), due to the long and fluctuatingdelay to the cloud. Moreover, the massive amount of data to be processed may challengethe virtually unlimited capabilities of cloud platforms. In this view, the multi-access edgecomputing (MEC) paradigm, by offering cloud-like resources (i.e., storage, processing) atthe network edge [26], can offload the core network and enable V2X applications to benefitfrom reduced access latency. Moreover, edge-based vehicular applications can benefit fromadditional (context) information that is not directly available to the participating vehicles,e.g., via data fusion from multiple available sources.
The added value of MEC in V2X environments has been recognized by the 5GAA [27]and by the European Telecommunications Standards Institute (ETSI), as well as inves-tigated in the literature [28]. In particular, the ETSI document in [29] analyses relevantV2X use cases and identifies the new requirements, features and functions, with special at-tention on the support of vehicle mobility and its impact on service provisioning. Indeed,compared to other vertical markets, the automotive domain adds a layer of complexityto the computation offloading at the edge. It may entail the migration of applicationservices from one MEC server to another, in response to vehicles’ mobility, so to ensurethe shortest latency and the best edge service provisioning. Moving services closer to theend-users may cause, as a side effect, performance degradation and even interruption ofongoing services during the migration procedures [30].
Not only RSUs and eNodeBs can act as edge nodes, but the vehicles themselves, eitherin moving or parking states, can establish a vehicular cloudlet and share their computingresources with the requesting neighboring vehicles [31]. In so doing, the cloud-to-thingscontinuum vision can be enabled also in the IoV domain, where edge and deep edgefacilities will complement the remote cloud capabilities in a synergic manner.
Caching contents at the edge is a further facilitator of IoV. Indeed, contents requestedand generated in IoV are typically characterized by a temporal and spatial scope [32].Moreover, some contents, such as map download and over-the-air software updates, canbe popular, hence requested repeatedly by multiple users. Such peculiarities motivated
_____________________________________________________________________________________ CNIT Technical Report-05 ꟷ Internet of Things: Technologies, Challenges and Impact
93

several studies, which were scanned in the pioneering work of the authors in [32] and, morerecently, in [33], which propose ICN for content discovery and delivery in the vehicularand edge domains, in analogy to what has been also proposed for the IoT [34], [35].V2X communications privilege the content (e.g., accident notification; stationary vehiclewarning; road works warning) rather than the identity of the communication endpoints.The ICN native in-network caching capability, its support for multicast and multipathforwarding, coupled with a provider-independent naming scheme, well suit IoV wherevehicles are interested in the content itself and not in its provenance.
5 The role of virtualization in IoV
Vehicles, acting as computers on wheels and as moving sensors, are allowed to be partof a complex ecosystem as a special kind of connected things. Vehicular devices canbe augmented with a degree of intelligence and cognitiveness, which is enabled by avirtualization layer, typical of next-generation IoT architectures. This layer is able toabstract vehicular devices and their capabilities.
Virtualization is a well known concept in the IoT domain [36]. A virtual object consistsof the semantic uniform description of the related physical object, of its resources (e.g.,memory, storage, processing) and its capabilities (e.g., sensing, actuation, computing),which are abstracted into a set of attributes. This facilitates the creation and compositionof services at the application layer.
The virtualization of vehicular devices is still in its infancy, but the success of thevirtual object concept, today available in commercial IoT-cloud platforms (e.g., AmazonWeb Services IoT2) and further revamped by the digital twin concept [37], can greatlycontribute to the widespread and quick deployment of virtualization in the IoV domain.
The work in [38] leverages the Docker platform3 as a container virtualization tech-nology. It aims to virtualize vehicular on board units (OBUs), by assigning to differenton-board devices a container, which is well isolated from the others and is in charge of han-dling the functionalities of the corresponding physical devices (i.e., camera, infotainmentsystem). The solution proposed in [39] targets similar objectives, with the main differencethat the virtual OBU (V-OBU) is hosted in MEC facilities, with the aim of offloadingprocessing from the vehicle and serving data-access requests. This deals with potentialdisconnection periods of vehicles, saves radio resources when accessing the physical OBU,and improves data processing performance. The idea of a virtual vehicle is further elab-orated in the work in [30], where, similarly to [38], Docker is chosen as a virtualizationplatform, and the issue of mobility of the virtualized vehicular service is investigated.
Besides vehicles, also drones and road-side infrastructure nodes, e.g., a traffic light,can be virtualized.
The simple object-based resource model provided by the Open Mobile Alliance (OMA)Lightweight Machine-to-Machine (LwM2M) [40] can be used for the semantic descriptionof the vehicle as an object. This is the approach followed in [41] to model the smart-phone when mobility-related data are exploited in an interoperable manner by multi-ple stakeholders. Different application-layer messaging protocols investigated in the IoT
2https://aws.amazon.com/iot-core/features/?nc1=h ls3https://www.docker.com/
94_____________________________________________________________________________________
Enabling technologies for the Internet of Vehicles: standards, research and open challenges

realm, e.g., Message Queue Telemetry Transport (MQTT), Constrained Application Pro-tocol (CoAP), Hyper-text Transfer Protocol (HTTP), can enable the interaction betweenthe physical object and its virtual counterpart. The effectiveness of such protocols inthe vehicular context was preliminarily investigated in [42]. There, CoAP is shown tooutperform the other two solutions by ensuring shorter latency and higher throughput,under the considered settings.
6 Software-defined IoV
Managing communication, networking and computing resources in IoV is a tough task,which is becoming more challenging with the increased number of radio access technologies(RATs) today available in connected cars, due to the variety of heterogeneous applicationsprovided on the road and to the dynamicity of the environment.
The SDN paradigm breaks the vertical integration of traditional networks by separat-ing the control plane (CP) from the user plane (UP). In doing so, network devices becomesimple forwarding devices, and the control logic, which determines how data traffic flowsshould be treated in the network, is implemented in a logically centralized entity, thecontroller, that has a global view of the network.
In the IoV domain, SDN allows the remote configuration of network elements andon demand resource reservation for safety-critical V2X applications. It can steer trafficthrough the set-up of automatically configured paths for load balancing or traffic prior-itization purpose or to react to network failures and changing conditions (e.g., due tointermittent roadside connectivity or to mobility) [43]. Taking forwarding decisions byleveraging global information collected by the SDN controller from multiple sources cansignificantly improve multi-hop V2X data dissemination [44].
SDN can deliver multiple applications in an isolated manner, while guaranteeing theirperformance requirements, e.g., by leveraging different RATs/channels, configuring dis-joint routing paths, filtering traffic classes at some intermediate nodes. This capabilityparticularly fits the network slicing concept, proposed to fulfill conflicting requirementsof 5G use cases in a flexible and holistic manner, as analysed in [45]. It configures NFs,network applications, specific radio access settings and underlying computing resourcesto specific service needs on a common programmable end-to-end network infrastructure,where CP and UP NFs are logically isolated. In our early work in [46], we advocated net-work slicing as a prominent solution to enable the simultaneous support of heterogeneousV2X applications.
The open programmability and the logically centralized knowledge and control fea-tures of the SDN paradigm offer an attractive means to orchestrate other functions besidesrouting, which are developed as network applications [47]. Some of these functions in-clude e.g., setting the transmission power levels to control vehicle interference, enforcingsecurity policies, supporting network selection, enabling caching decisions and placementof computation tasks along the cloud-to-things continuum [48].
_____________________________________________________________________________________ CNIT Technical Report-05 ꟷ Internet of Things: Technologies, Challenges and Impact
95

7 Artificial intelligence in IoV
IoV will need not only communication, processing and storage, but also learning capabil-ities. Indeed, AI and, in particular, machine learning (ML) methods can assist key tasksof intelligent vehicles by extracting knowledge from information-rich data [49]. Thesemethods can be leveraged to enhance autonomous driving operations, for instance byproducing accurate models of the surrounding environment from the cooperative sensingdata, and deriving effective manoeuvring strategies accordingly [50]. By means of ML,vehicles can identify crucial data to be exchanged for cooperative driving purposes, withefficient network resources utilization. Making ML-assisted decisions may also improveradio resource management algorithms [51].
Applying existing ML methods to IoV raises some challenges, which are mainly relatedto the distributed nature of data produced by multiple sources and to the hard to bepredicted vehicular dynamics. Theses issues pave the way to distributed learning methods.The decision about where to run ML algorithms (i.e., on board the vehicle, at the edge, orin the cloud) is another open issue to be addressed [49]. The edge AI concept is mentionedamong the top 10 strategic technology trends in 2019 by Gartner4.
ML techniques support the orchestration of edge resources concerning, among others,the decision about the proper placement of computing functionalities along the cloud-to-vehicle continuum [52]. Indeed, optimization problems often assume that few keyparameters are known, but actually some of them are difficult to obtain and are subjectto dynamic variations, e.g., due to fluctuations of the wireless channel and vehicle mobility.In [53] a relocation policy for applications in the MEC environment is proposed which isbased on deep reinforcement learning.
8 Social IoV
Next-generation IoT architectures are expected to realize the radical IoT paradigm shiftfrom connected things to connected and intelligent things. In such an evolution path, theSIoT paradigm [54] is expected to play a pivotal role, since it aims to provide devices withintelligence and awareness to socialize with each other, as humans do. Social relationshipsare created without the human intervention, based on shared context and mutual interests(e.g., devices are located in the same place, they are owned by the same user, or theyfrequently meet each other). Establishing social relationships among objects has thepotential to facilitate information/service discovery when the IoT is made of a hugenumber of heterogeneous nodes.
The extension of this paradigm to the IoV domain has been preliminarily investigatedin [55] and further analyzed in [56] and references therein. The autonomous establishmentof inter-object social links particularly fits the vehicular environment, in which machine-to-machine (M2M) interactions are dominant. V2X entities themselves can proactivelyrequest and consume data, seamlessly to the drivers, by exploiting the created socialrelationship, such as vehicles belonging to the same automaker, or frequently travelingalong the same road segment. The ultimate goal can be e.g., improving the road safetyor the traveling experience. Minimizing the interactions between the driver and the on-
4https://www.gartner.com/en/documents/3956137/hype-cycle-for-edge-computing-2019
96_____________________________________________________________________________________
Enabling technologies for the Internet of Vehicles: standards, research and open challenges

Figure 1: Next-generation IoV reference architecture.
board devices has also the non-negligible side benefit of reducing the driver distractionsand the risk of fatalities on the road [43].
9 Conclusions
In this chapter, we presented a concise but exhaustive analysis of the main IoV enablers.The review encompasses both the most consolidated technologies, i.e., the two main-stream V2X connectivity solutions, and groundbreaking solutions and paradigms, still intheir infancy in the IoV domain, such as artificial intelligence, virtualization and networksoftwarization, cloud computing evolution. A reference next-generation IoV architecture,resulting from the mash-up of the aforementioned technologies, is graphically sketched inFig. 1. Such technologies hold several promises, but several open issues still lie ahead forpractically deploying each of them.
It is convincement of the authors that the full potential of IoV can be only disclosedby fostering synergies among heterogeneous fields with the efforts of the entire researchcommunity.
References
[1] Z. MacHardy, A. Khan, K. Obana, and S. Iwashina, “V2X access technologies: Reg-ulation, research, and remaining challenges,” IEEE Comm. Surveys & Tutorials,vol. 20, no. 3, pp. 1858–1877, 2018.
[2] “3GPP TR 22.186 v16.2.0, Technical specification group services and system aspects.enhancement of 3GPP support for V2X scenarios. Release 15,” June 2019.
_____________________________________________________________________________________ CNIT Technical Report-05 ꟷ Internet of Things: Technologies, Challenges and Impact
97

[3] “3GPP TR 22.185 v15.0.0, Service requirements for V2X services; Release 15,” June2018.
[4] W. Shi, H. Zhou, J. Li, W. Xu, N. Zhang, and X. Shen, “Drone assisted vehicularnetworks: Architecture, challenges and opportunities,” IEEE Network, vol. 32, no. 3,pp. 130–137, 2018.
[5] W. Xu, H. Zhou, N. Cheng, F. Lyu, W. Shi, J. Chen, and X. Shen, “Internet ofvehicles in big data era,” IEEE/CAA Journal of Automatica Sinica, vol. 5, no. 1,pp. 19–35, 2017.
[6] S. Mignardi, C. Buratti, A. Bazzi, and R. Verdone, “Trajectories and resource man-agement of flying base stations for C-V2X,” Sensors, vol. 19, no. 4, p. 811, 2019.
[7] L.-M. Ang, K. P. Seng, G. K. Ijemaru, and A. M. Zungeru, “Deployment of IoV forsmart cities: applications, architecture, and challenges,” IEEE Access, vol. 7, pp.6473–6492, 2018.
[8] “IEEE Std. 802.11-2012: “IEEE Standard for Information technology - Part 11:Wireless LAN Medium Access Control (MAC) and Physical Layer (PHY) Specifica-tions,” 2012.
[9] C. Campolo and A. Molinaro, “Multichannel communications in vehicular ad hocnetworks: a survey,” IEEE Communications Magazine, vol. 51, no. 5, pp. 158–169,2013.
[10] C. Campolo, A. Molinaro, and R. Scopigno, “From today’s VANETs to tomorrow’splanning and the bets for the day after,” Vehicular Communications, vol. 2, no. 3,pp. 158–171, 2015.
[11] C. Campolo, A. Molinaro, A. O. Berthet, and A. Vinel, “Full-duplex radios forvehicular communications,” IEEE Communications Magazine, vol. 55, no. 6, pp.182–189, 2017.
[12] G. Naik, B. Choudhury, and J.-M. Park, “IEEE 802.11 bd & 5G NR V2X: Evolutionof radio access technologies for v2x communications,” IEEE Access, 2019.
[13] G. Araniti, C. Campolo, M. Condoluci, A. Iera, and A. Molinaro, “LTE for vehicularnetworking: a survey,” IEEE communications magazine, vol. 51, no. 5, pp. 148–157,2013.
[14] ETSI EN 102 637-2 v1.3.1, “ITS; Vehicular Communications; Basic Set of Applica-tions; Part 2: Specification of Cooperative Awareness Basic Service,” 2014.
[15] C. Campolo, A. Molinaro, A. O. Berthet, and A. Vinel, “On latency and reliabilityof road hazard warnings over the Cellular V2X sidelink interface,” IEEE Communi-cations Letters, 2019.
[16] C. Campolo, A. Molinaro, G. Araniti, and A. O. Berthet, “Better platooning controltoward autonomous driving: An LTE device-to-device communications strategy thatmeets ultralow latency requirements,” IEEE Vehicular Technology Magazine, vol. 12,no. 1, pp. 30–38, 2017.
98_____________________________________________________________________________________
Enabling technologies for the Internet of Vehicles: standards, research and open challenges

[17] W. Anwar, A. Traßl, N. Franchi, and G. Fettweis, “On the reliability of NR-V2Xand IEEE 802.11 bd,” in IEEE PIMRC 2019.
[18] W. Anwar, N. Franchi, and G. Fettweis, “Performance evaluation of next generationV2X communication technologies: 5G NR V2V Vs IEEE 802.11 bd,” in IEEE VTC-Fall 2019.
[19] C. Campolo, A. Molinaro, F. Romeo, A. Bazzi, and A. O. Berthet, “5G NR V2X:On the impact of a flexible numerology on the autonomous sidelink mode,” in IEEE5G World Forum, 2019.
[20] J. Choi et al., “Millimeter-wave vehicular communication to support massive auto-motive sensing,” IEEE Comm. Mag., vol. 54, no. 12, pp. 160–167, 2016.
[21] M. Giordani, A. Zanella, and M. Zorzi, “Millimeter wave communication in vehicularnetworks: Challenges and opportunities,” in 2017 6th International Conference onModern Circuits and Systems Technologies (MOCAST). IEEE, 2017, pp. 1–6.
[22] C. Campolo, A. Molinaro, F. Romeo, A. Bazzi, and A. O. Berthet, “Full duplex-aidedsensing and scheduling in Cellular-V2X Mode 4,” in Proc. of the 1st ACM MobiHocWorkshop on Technologies, mOdels, and Protocols for Cooperative Connected Cars,2019, pp. 19–24.
[23] J. J. Anaya, E. Talavera, D. Gimenez, N. Gomez, J. Felipe, and J. E. Naranjo,“Vulnerable road users detection using V2X communications,” in 2015 IEEE 18thInternational Conference on Intelligent Transportation Systems. IEEE, 2015, pp.107–112.
[24] A.-M. Cailean and M. Dimian, “Current challenges for visible light communicationsusage in vehicle applications: A survey,” IEEE Communications Surveys & Tutorials,vol. 19, no. 4, pp. 2681–2703, 2017.
[25] R. Sanchez-Iborra, J. Sanchez-Gomez, J. Santa, P. J. Fernandez, and A. F. Skarmeta,“IPv6 communications over LoRa for future IoV services,” in 2018 IEEE 4th WorldForum on Internet of Things (WF-IoT). IEEE, 2018, pp. 92–97.
[26] T. Taleb, K. Samdanis, B. Mada, H. Flinck, S. Dutta, and D. Sabella, “On multi-access edge computing: A survey of the emerging 5g network edge cloud architectureand orchestration,” IEEE Communications Surveys & Tutorials, vol. 19, no. 3, pp.1657–1681, 2017.
[27] “5G Automotive Association (5GAA) - Toward fully connected vehicles: Edge com-puting for advanced automotive communications,” December 2017.
[28] F. Giust, V. Sciancalepore, D. Sabella, M. C. Filippou, S. Mangiante, W. Feath-erstone, and D. Munaretto, “Multi-access Edge Computing: The driver behind thewheel of 5G-connected cars,” IEEE Communications Standards Magazine, vol. 2,no. 3, pp. 66–73, 2018.
[29] “ETSI - Multi-access Edge Computing (MEC); Study on MEC Support for V2X UseCases,” September 2018.
_____________________________________________________________________________________ CNIT Technical Report-05 ꟷ Internet of Things: Technologies, Challenges and Impact
99

[30] C. Campolo, A. Iera, A. Molinaro, and G. Ruggeri, “MEC support for 5G-V2Xuse cases through docker containers,” in 2019 IEEE Wireless Communications andNetworking Conference (WCNC). IEEE, 2019, pp. 1–6.
[31] R. A. Dziyauddin, D. Niyato, N. C. Luong, M. A. M. Izhar, M. Hadhari, and S. Daud,“Computation offloading and content caching delivery in vehicular edge computing:A survey,” arXiv preprint arXiv:1912.07803, 2019.
[32] M. Amadeo, C. Campolo, and A. Molinaro, “Information-centric networking for con-nected vehicles: a survey and future perspectives,” IEEE Communications Magazine,vol. 54, no. 2, pp. 98–104, 2016.
[33] H. Khelifi, S. Luo, B. Nour, H. Moungla, Y. Faheem, R. Hussain, and A. Ksen-tini, “Named data networking in vehicular ad hoc networks: State-of-the-art andchallenges,” IEEE Communications Surveys & Tutorials, 2019.
[34] M. Amadeo, G. Ruggeri, C. Campolo, and A. Molinaro, “IoT services allocationat the edge via named data networking: From optimal bounds to practical design,”IEEE Transactions on Network and Service Management, vol. 16, no. 2, pp. 661–674,2019.
[35] M. Amadeo, C. Campolo, G. Ruggeri, A. Molinaro, and A. Iera, “SDN-managed pro-visioning of named computing services in edge infrastructures,” IEEE Transactionson Network and Service Management, vol. 16, no. 4, pp. 1464–1478, 2019.
[36] M. Nitti, V. Pilloni, G. Colistra, and L. Atzori, “The virtual object as a major elementof the Internet of Things: a survey,” IEEE Communications Surveys & Tutorials,vol. 18, no. 2, pp. 1228–1240, 2015.
[37] A. El Saddik, “Digital twins: The convergence of multimedia technologies,” IEEEMultiMedia, vol. 25, no. 2, pp. 87–92, 2018.
[38] R. Morabito, R. Petrolo, V. Loscri, N. Mitton, G. Ruggeri, and A. Molinaro,“Lightweight virtualization as enabling technology for future smart cars,” in 2017IFIP/IEEE Symposium on Integrated Network and Service Management (IM).IEEE, 2017, pp. 1238–1245.
[39] J. Santa, P. J. Fernandez, J. Ortiz, R. Sanchez-Iborra, and A. F. Skarmeta, “SUR-ROGATES: Virtual OBUs to foster 5G vehicular services,” Electronics, vol. 8, no. 2,p. 117, 2019.
[40] “Open Mobile Alliance, Lightweight Machine to Machine Technical SpecificationCore; v1 1-20180612-c,” 2018.
[41] C. Campolo, D. Cuzzocrea, G. Genovese, A. Iera, and A. Molinaro, “An OMAlightweight M2M-compliant MEC framework to track multi-modal commuters forMaaS applications,” in 2019 IEEE/ACM 23rd International Symposium on Dis-tributed Simulation and Real Time Applications (DS-RT). IEEE, 2019, pp. 1–8.
[42] Z. Laaroussi, R. Morabito, and T. Taleb, “Service provisioning in vehicular net-works through edge and cloud: an empirical analysis,” in 2018 IEEE Conference onStandards for Communications and Networking (CSCN). IEEE, 2018, pp. 1–6.
100_____________________________________________________________________________________
Enabling technologies for the Internet of Vehicles: standards, research and open challenges

[43] C. Campolo, A. Molinaro, and A. Iera, “A reference framework for social-enhancedvehicle-to-everything communications in 5G scenarios,” Computer Networks, vol.143, pp. 140–152, 2018.
[44] S. Din, A. Paul, and A. Rehman, “5G-enabled hierarchical architecture for software-defined intelligent transportation system,” Computer Networks, vol. 150, pp. 81–89,2019.
[45] S. Zhang, “An overview of network slicing for 5G,” IEEE Wireless Communications,vol. 26, no. 3, pp. 111–117, 2019.
[46] C. Campolo, A. Molinaro, A. Iera, and F. Menichella, “5G network slicing for vehicle-to-everything services,” IEEE Wireless Communications, vol. 24, no. 6, pp. 38–45,2017.
[47] K. Z. Ghafoor, L. Kong, D. B. Rawat, E. Hosseini, and A. S. Sadiq, “Quality of serviceaware routing protocol in software-defined internet of vehicles,” IEEE Internet ofThings Journal, vol. 6, no. 2, pp. 2817–2828, 2018.
[48] R. D. R. Fontes, C. Campolo, C. E. Rothenberg, and A. Molinaro, “From theoryto experimental evaluation: Resource management in software-defined vehicular net-works,” IEEE Access, vol. 5, pp. 3069–3076, 2017.
[49] J. Zhang and K. B. Letaief, “Mobile edge intelligence and computing for the internetof vehicles,” Proceedings of the IEEE, 2019.
[50] A. E. Sallab, M. Abdou, E. Perot, and S. Yogamani, “Deep reinforcement learningframework for autonomous driving,” Electronic Imaging, vol. 2017, no. 19, pp. 70–76,2017.
[51] H. Ye et al., “Machine learning for vehicular networks: Recent advances and appli-cation examples,” IEEE Veh. Tech. Mag., vol. 13, no. 2, pp. 94–101, 2018.
[52] Z. Ning, P. Dong, X. Wang, J. J. Rodrigues, and F. Xia, “Deep reinforcement learningfor vehicular edge computing: An intelligent offloading system,” ACM Transactionson Intelligent Systems and Technology (TIST), vol. 10, no. 6, pp. 1–24, 2019.
[53] F. De Vita, G. Nardini, A. Virdis, D. Bruneo, A. Puliafito, and G. Stea, “Using deepreinforcement learning for application relocation in multi-access edge computing,”IEEE Communications Standards Magazine, vol. 3, no. 3, pp. 71–78, 2019.
[54] L. Atzori, A. Iera, and G. Morabito, “SIoT: Giving a social structure to the internetof things,” IEEE communications letters, vol. 15, no. 11, pp. 1193–1195, 2011.
[55] M. Nitti, R. Girau, A. Floris, and L. Atzori, “On adding the social dimension to theinternet of vehicles: Friendship and middleware,” in 2014 IEEE International BlackSea Conference on Communications and Networking (BlackSeaCom). IEEE, 2014,pp. 134–138.
[56] K. M. Alam, M. Saini, and A. El Saddik, “Toward Social Internet of Vehicles: Con-cept, architecture, and applications,” IEEE Access, vol. 3, pp. 343–357, 2015.
_____________________________________________________________________________________ CNIT Technical Report-05 ꟷ Internet of Things: Technologies, Challenges and Impact
101


A Machine Learning Based Non-Orthogonal MultipleAccess Scheme for IoT Communications
authors Romano Fantacci, and Benedetta Picano
Universita degli Studi di Firenze
Abstract: The ever increasing diffusion of the IoT devices, able to interact and exchangedata with the surrounding environment, is exponentially growing, giving rise to ubiquitousand intelligent ecosystems capable of data gathering and usually requiring low latency pro-cessing of time. As a consequence, efficient multiple access schemes have to be identifiedto handle a usual massive access of IoT devices to a local computation node accordingto the emerging edge computing paradigm to lower latency and network congestion. Thischapter deals with the application of a machine learning technique, specifically an echostate (ESN) machine learning framework is considered. A key challenge in our problemformulation is that we assume that our ESN has not any a priori information on thenumber and behavior of IoT devices, i.e., on when to transmit and when not to. Thegoal of the considered ESN is to perform an effective channel access strategy for a siglecarrier two power levels non-orthogonal multiple access (NOMA) scheme with the aimat maximizing the sum throughput and minimizing the mean packet access delay amongall the IoT devices. Performance comparisons with a basic, i.e., without resorting to theuse of a machine learning approach, NOMA scheme are presented in order to highlightthe advantages of the proposed solution. In addition to this, simulation results are alsoprovided to validate the obtained analytical predictions.
1 Introduction
The unexpected growth of the internet of things (IoT) applications and the forthcomingfifth generation (5G) has opened the door to an unprecedented connectivity demand fromsmart devices [1, 2]. Recently, with the advent of the promising edge computing paradigm,computation and data storage is moved close to the end-devices, limiting latency andnetwork congestion. In such a landscape, IoTs channel access schemes represent a crucialissue in the network resource management. In this regards, the improvement of therandom access techniques have appeared as an attractive solution to make possible IoTdevices communications with a reduced signaling overhead and high spectral efficiency.Towards this end, in 5G and beyond 5G cellular communication systems, the use of non-orthogonal multiple access (NOMA) schemes has emerged as a promising technique toenhance throughput performance and improve the spectral efficiency. The basic principleof NOMA is to allow a simultaneous network access to multiple IoT devices over sameradio resources with a low inter-IoT device interference.
In particular, NOMA superposes the different IoT devices signals in the power domainand, on the basis of the use of the successive interference cancellation (SIC) method at
_____________________________________________________________________________________ CNIT Technical Report-05 ꟷ Internet of Things: Technologies, Challenges and Impact
103

Figure 1: Artificial Intelligence classification
the receiver side, the exploitation of the same spectrum for all the users is allowed [3].Hence, the clever combination of the simplicity of S-ALOHA technique with the highthroughput performance achieved with the NOMA approach due to its capability to re-solve access collisions by the use of the SIC scheme makes the S-Aloha NOMA (SAN)scheme an efficient solution to enable communications of low complexity IoT devices.Moreover, a transmission scheme able to dynamically adapt the access policy on the basisof the surrounding network conditions is suitable in the networks due the natural timeevolution of the network environment. Therefore, as direct consequence of the ever in-creasing dynamic behavior of the modern wireless networks, the necessity for flexible andadaptive frameworks is rapidly becoming essential. During years, many approaches andstudies have been proposed to improve the management of the random channel contentionpolicies. In this regards, the a priori knowledge about the number of devices is a criticalaspect of the majority of the effective solutions presented in literature. In such a context,the machine learning (ML) has recently received attention as powerful and promisingtool to provide effective solutions for a wide range of wireless networks problems, amongwhich the access ones. In this regards, it is important to note that there exist severalML methods capable of adapting to the network behavior, without the necessity of theknowledge about the number of devices contending on the shared channel. Such condi-tion justifies the investigation of some ML techniques in reference to the random accessproblem, since they may represent promising approaches. Generally speaking, the MLincludes a wide class of different methods and approaches for different problems, suchas prediction, classification and clustering. Moreover, the ML is a specialization of themore wide artificial intelligence (AI) field, as represented in Figure 1. Although the AIresearch branch focuses on giving a sort of cognitive abilities to the machines, the MLrepresents the area of the AI which aims at analyzing and understanding patterns beyonddata. Roughly speaking, the ML, in its turn, can be differentiated among the following
104_____________________________________________________________________________________
A Machine Learning Based Non-Orthogonal Multiple Access Scheme for IoT Communications

main paradigms [4, 5, 6, 7, 8, 9]
• Supervised learning, in which the algorithms are used to map inputs in the outputs,on the basis of some input-output pairs example, properly labeled. The goal of thisapproach is the accurate mapping approximation, aiming at predicting the outputson the given new inputs;
• Unsupervised learning, which is a self-organized approach, typically used to recog-nize patterns in data, without any prior labeling, classification, or clustering mech-anism;
• Reinforcement learning, which focuses on decision making policies, taken in order tomaximize a reward function contextualized to an environment, typically representedby a Markov decision process.
Within the unsupervised learning, artificial neural networks (ANNs) have gained atten-tion as solution to better understand the hidden features of data and mapping functions,allowing good approximations and accurate predictions. During years, many differentANNs types have been proposed and studied, diverse in weakness and strengths. Amongthese, the recurrent neural networks (RNNs) are the the closest model to the biologi-cal brains functioning [10]. Despite the effectiveness of the RNNs [11], one weak aspectis constituted by their complexity in terms of training and structure, which make theirapplication critical in several contexts, especially in relation to the limited computationcapabilities and power constraints, typical of the IoT devices. This chapter aims at ex-hibiting the application of a particular type of RNNs, i.e., the echo state networks (ESNs),highly applicable to several problem scenarios, due to their intrinsic simplicity in trainingand structure [11], to the random access problem within a SAN system. Therefore, thecontribution of this chapter can be summarized as follows
• Application of a ESN to enhance the performance of a SAN with two power levels,without the a priori knowledge about the number of the devices in the network;
• The performance validation and comparison of the proposed ESN with the tradi-tional SAN. Furthermore, the behavior of the ESN has been tested also in terms ofaccuracy in comparison to other methods.
The rest of the chapter has the following structure. In the Section 2, an in-depth reviewof the related literature is detailed. A wide overview about the main ANNs classes isproposed in Section 3. Furthermore, the Section 4 presents the system model charac-terization and the chapter objectives. Section 5 describes the framework proposed anddetails the strategy behavior. Then, in Section 6 the access delay analysis is presentedand the goodness of the proposed framework is validated. Finally, the conclusions aredrawn in Section 7.
2 Related Works
The SAN contextualization to the next generation networks has been studied in manypapers. Paper [12] investigates the application of the SAN scheme in comparison to thecarrier sensing multiple access with collision avoidance within the context of the machine
_____________________________________________________________________________________ CNIT Technical Report-05 ꟷ Internet of Things: Technologies, Challenges and Impact
105

to machine communications in the IoT networks. The paper exhibits the improvementsdue to an enhanced version of the S-Aloha, in which the receiver adaptively learns thenumber of active device through the multi-hypothesis testing. Similarly, the paper [13]promotes the application of the SAN for the 5G IoT networks and shows the benefitsimplied by the regulation on the transmission power levels and the number of signals forone slot using a SIC receiver.
Paper [14] proposes an uncoordinated random access protocol which takes into accountthe limited-power requirements of the IoT devices, discussing a flexible frame structurefor the proposed protocol. Furthermore, a multiple hypotheses testing analysis is pro-posed to identify the number of active IoT devices, on the basis of which the SIC powerlevels is properly adjusted. Differently, a novel random access protocol for the massivemachine-type communications, based on the S-Aloha scheme, is proposed in [15], consid-ering characteristics of the physical aspects such as the channel effects and the numberof antennas. In addition, in order to provide energy efficient synchronization betweenthe base station and the active users, in paper [15] a beacon phase is added at the be-ginning of each phase. Then, the access control barring technology and the transmissionacknowledgment are adopted during the beacon phase, enhancing the flexibility and thereliability of the scheme.
As regards the ESNs, authors in [16] propose the binary particle swarm optimizationmethod to determine the suitable matrix weight as connection between the ESN reservoirneurons and the output layer and to provide a time series prediction, while in paper [17]the ESN prediction accuracy in order to perform mobile communication traffic forecast-ing is improved by using complex network structures such as small worlds topologies.Similarly to [16], authors in [18] focus on the optimization of the ESN on the basis ofthe particle swarm optimization, performing both the single and the multi-objective op-timizer structure. Differently, the paper [19] formulates a new learning algorithm basedon the regularization method, providing a stable solution to the approximation functionguaranteeing a good tradeoff between accuracy and smoothness. Furthermore, authorsin [20] apply the ESN to the problem of the power supply prediction, by exhibiting thehigh performance reached by the ESN in forecasting temporal series. Likewise, paper [21]aims at predicting the network traffic levels, in order to guarantee quality of service byplanning resource allocation, congestion control and so on. Within this context, the ESNplays a crucial role, by avoiding long learning processes.
Differently, during years, other ML techniques have been extensively applied to thenetworks problems strictly related to the access protocols. Specifically, in paper [22] theauthors propose the joint optimization of both the resource allocation and the power con-trol aspects, on the basis of the Multi-Armed Bandit strategy, by assuming the NOMAscheme and the SIC technology. In addition, paper [22] investigates the trade-off be-tween the exploration and the exploitation phase of the ML solution which has beenapplied in a distributed manner. The Q-learning as been applied in paper [23] focusingon both the machine-to-machine (M2M) and human-to-human (H2H) communications.The paper aims at designing an novel random access channel scheme to control the M2Mtraffic limiting its impact on the cellular network taken into analysis. Within this land-scape, the Q-learning access scheme promoting interaction between the M2M and theH2H communication scheme is presented, assuming a S-Aloha scheme. A Q-learning ran-dom access approach has been adopted also by [24], in which the energy efficiency of the
106_____________________________________________________________________________________
A Machine Learning Based Non-Orthogonal Multiple Access Scheme for IoT Communications

Figure 2: Neural network chart
update Q-value procedure and the storing process is the main objective, together withthe minimization of the energy consumption of the whole M2M communication systemconsidered. The support vector machine is applied in [25], in which the problem of thespectrum scarcity in relation to the interference among primary and secondary users isaddressed. In this paper the ML is contextualized to the MAC identification, in order tochange the users transmission parameters to improve the spectral efficiency. Deep rein-forcement learning is adopted in [26], in which the usage of the same slot from differentaccess protocol is taken in exam. More in depth, the agents of the proposed scheme doesnot have an a priori knowledge about the access scheme of the other networks but, onthe basis of successive sampling, they learn the optimal transmission policy despite thepresence of the external networks. In paper [27] authors propose the automation of theMAC protocols design on the basis of the machine perspective, particularly suitable forindustrial applications and environments.
3 Artificial Neural Networks
The ANNs has recently become a wide-spread tool to provide effective solutions to alarge class of problems, such as image classification, clustering, identification of trendsdata patterns, natural language processing, and recognition to name a few [4, 5, 6, 7, 8,9]. Despite the massive application of the ANN in many different fields, the search for
_____________________________________________________________________________________ CNIT Technical Report-05 ꟷ Internet of Things: Technologies, Challenges and Impact
107

systematic procedures to strongly simplify the ANN development phase [4, 5, 6, 7, 8, 9]does not stop. Therefore, the ANNs provide a powerful and flexible tool to solve awide variety of complex and nonlinear problems, justifying their extensive and traversalapplications in different research areas. Exactly the way the human brain learns, theANNs are able to learn by examples. Furthermore, ANNs can also be designed for specificcontexts and to have a structure tailor-made for the considered application. The ANNshave numerous similarities with the human brain behavior; they both require a sort ofdynamic adjustments of the synaptic connections [4, 5, 6, 7, 8, 9].
There exist many different types of ANNs, typically grouped on the basis of the ANNstructure. In general terms, the topology of the ANN determines its behavior and itssuitability for the application to different contexts. Therefore, diverse ANNs operate indifferent ways achieving different outcomes. The crucial point here is that ANNs aredesigned taking inspiration from how neurons in the brain work. As consequence, theylearn more and improve more by increasing the data and their usage. In this sense,one of the key aspect of the ANNs in comparison to other traditional machine learningapproaches is that the ANNs have the ability to dramatically improve performance asdata as application grows.
Roughly speaking, a ANN consists of a large number of units which operate in aparallel way and are arranged in tiers. The input information arrives at the first tierand from that, the information crosses the network tier by tier, until it reaches the finaltier which returns the outcome. The units belonging to different tiers are connected tothe units of the previous and successive tier. Furthermore, through a process of weightsadjustments, different levels of importance are assigned to the information crossing thenetwork, in order to reach the desired output.
The life-cycle of the ANN can be characterized by two phases: the learning and theoperating period. The information patterns cross the network via the input layer, whichforward the information to the hidden units, and these in turn arrive at the outputunits. This wide spread model is namely as feed forward network as depicted in Figure 2.Each unit receives inputs from the units belonging to the previous layer, and the inputsare multiplied by the weights of the connections they cross. Each unit sums up all theinputs it receives and, considering the simplest networks, if the sum is more than a fixedthreshold value, the unit triggers the units of the next level to whom they are connected.As previously anticipated, on the basis of its structure, the ANN exhibits strengths andweakness aspects. Therefore, there exist many kinds of ANNs. In addition to the feedforward ANN can be mentioned also the following ANN main structures [4, 5, 6, 7, 8, 9]
• Perceptron: The most straightforward neural model which takes and sums theinputs, applies activation function and sends the data to the output layer. Theoutput function of this model in its simplest form can be expressed by
y = sgn
( 2∑i=1
wixi + θ
), (1)
with wi are the weights, xi represents the input and θ is the bias.
sgn(s) =
{1, if s > 0
−1, otherwise.(2)
108_____________________________________________________________________________________
A Machine Learning Based Non-Orthogonal Multiple Access Scheme for IoT Communications

• Radial Basis Function Neural Network: Such neural networks are formedby two levels, and in the inner layer the features are combined using the radialbasis function. This class of ANNs works well in classification and decision makingprocesses. The corresponding output can be expressed as
y =2∑
i=1
wihi(x), (3)
where
h(x) = exp
(− (x− c)2
r2
), (4)
• Deep Feed Forward: This type of ANNs is the same of the Perceptron, but itexhibits a larger number of inner units. The output, in its simplest form, can beexpressed as in (1) and (2).
• Convolutional Neural Network: is formed by one or more convolutional layers,which means that before passing the result to the next layer, the convolutional layerperforms a convolution on the input. According to [28], the convolutional operationfor each layer can be expressed as
F (a, b) =∑c
∑u,v
ic(x, y) · ekl (u, v), (5)
where ic(x, y) represents the input tensor, while ekl is the convolutional kernel kl ofthe l-th layer [28].
• Recurrent Neural Network: In this type of ANN the output of a layer is savedand fed back to the input. Such step significantly helps for predicting the outcomeof the layer. As detailed in [29], the two main equations for this type of networksat each time step on the forward pass, are the following
h(t) = σ(Whxx(t) +Whhh(t−1) + bh), (6)
andy(t) = softmax(W yhh(t) + by), (7)
in which Whx is the weights matrix between the input and the hidden layer, whileWhh represents the matrix of recurrent weights between the hidden layer and itselfat adjacent time steps [29]. Furthermore, vectors bias are expressed by bh and by.
As it is straightforward to deduce, different structures imply different strengths and weak-nesses, which make the diverse ANNs types suitable or not on the basis of the problemaddressed. In the Section 5 the ESN is presented and characterized in relation to theproposed problem scenario, object of study.
4 System Model
In accordance with Figure 3, the considered scenario consists of hierarchical networkarchitecture, represented by one edge node (EN) on the top layer, assumed here locatedat the base station (BS) site 1 of the cellular 5G network, and J IoTDs at the bottom
1Hereafter, for the reader convenience, the terms EN and BS are used interchangeably
_____________________________________________________________________________________ CNIT Technical Report-05 ꟷ Internet of Things: Technologies, Challenges and Impact
109

Figure 3: System Scenario
layer. The J IoTDs need to access the EN in order to obtain packet computation beforea deadline, expressed by d. Due to the greater time required by the communicationtime, that spent in computation is negligible in comparison to the first. Furthermore,we assume that IoTDs share a same communication channel to access the EN facilitiesaccording to the SAN scheme as in [30]. In the shared channel (uplink) time is assumeddivided into slots of a constant size with each slot equal to one packet transmission time.Without loss of generality of our proposal, we focus on a SAN scheme based on a singlecarrier NOMA technique, however, the proposed methodology can be easily extendedto different NOMA alternatives [31]. More in depth, the uplink NOMA is consideredcompliant with [32], in which we assume that the J IoTDs are clustered in two groups,identifying the transmitter power level classes f1 and f2, with f1 > f2, hereafter usedinterchangeably to refer at the power levels and the corresponding clusters. Similarly, J ′
and J ′′ express the number of IoTDs belonging to the two power levels. In particular, wesuppose here that IoTDs exploit channel inversion2 on the basis of the received downlinkreference signal sent out by the BS at the beginning of each IoTDs access period toproperly select the power level [33]. According to this, each IoTD accesses the sharedchannel by selecting one of the two power levels as in [31] and the BS (i.e., the EN) is ableto separate and detect packets simultaneously transmitted on the same slot with differentpower levels by means of the use of a SIC receiver as outlined in [31, 33]. We have assumedthat each IoTD performs the channel inversion, i.e., selects the appropriate power levelonly when it becomes active and that channel conditions remain the same during its
2This is done under the assumption of a channel reciprocity.
110_____________________________________________________________________________________
A Machine Learning Based Non-Orthogonal Multiple Access Scheme for IoT Communications

operating time [32]. Furthermore, we make the abstraction of assuming a transmissionattempt as a successful (i.e., associated packet correctly detected) whenever only one IoTDbelonging to the cluster f1, individually accesses the shared channel, independently fromthe number of transmission attempts of IoTDs belonging to the cluster f2 on the sameslot. Conversely, due to the NOMA-SIC technology, if a collision occurs at the power levelf1, the detection of packets transmitted with lower level f2 is denied, despite the absenceof collisions. Furthermore, we assume that each IoTD can hold only one packet and theoutcome of any access attempt is immediately known at the end of the packet transmissiontime by receiving a positive/negative acknowledgement (ACK/NACK) message by the BS.Finally, we have assumed to adopt the Delayed First Transmission (DFT) approach asin [34, 35], according to which the same transmission probability is considered for all thepackets to be sent out by the IoTDs, whether first or next transmission attempts. As aconsequence, a newly arriving packet at a given IoTD has to wait for the same randombackoff period as any other packet involved in collisions. A further discussion about theformal parts of the proposed model is provided in the next section.
Figure 4: ESN Framework
5 Echo State Network
The general idea behind the ESN is the prediction of an output, on the basis of a giveninput signal, in reference to an output target ytarget, in order to minimize the gap betweenthe input and the target values. More in details, the main problem here is to learn a modelwith output y, lowering the difference between y and ytarget as much as possible. In formal
_____________________________________________________________________________________ CNIT Technical Report-05 ꟷ Internet of Things: Technologies, Challenges and Impact
111

terms, the objective is the minimization of the error E(y,ytarget) along a discrete timeperiod T , in which the error can be defined as [10]
E(y,ytarget) =1
S
S∑h=1
√√√√( 1
T
T∑q=1
(yi(q)− ytargeti (q)
)2
, (8)
where S is the number of the samples considered. Aiming at increasing as much aspossible the successful transmissions, the values pt1 and pt2 of the access probability ofthe IoTDs sharing the same channel are forecast. More in depth, the ESN application isperformed to predict both the pt1 and pt2 values. The ESN, drawn in Figure 4, runs atthe EN level, and its structure is characterized by the following features [10]
• neurons randomly connected;
• sparse connection links;
• large number of neurons;
• low in energy and time demand.
It is important to highlight here that the ESN application is motivated by its efficiency interms of low computation time and energy cost [10]. The low computational complexitynature of the ESN finds its motivation in the usage of the reservoir module. In thiscontext, the main benefit is by fixing the reservoir, performing training only at the non-recurrent stage. In detail, the ESN is formed by three main parts: the input weight matrixI, the reservoir weight matrix R, and the matrix W of the output weights. Let xq×1 bethe input vector, supposing the reservoir weight matrix updating rule given by [10]
rm×1(q) = tanh(Wm×qin xq×1(q) + Wm×1
r (q − 1)), (9)
where rm×1 is a vector of internal units in the reservoir part, while Wm×qin represents the
weights matrix associated to the connections existing between the input layer and thereservoir level. Finally, the Wm×1
r (q − 1) is the recurrent weights matrix. Let v(q) bethe output vector and Wq×m
out the weight matrix associated to the connection between thereservoir and the output layer. Therefore, the relationship between the reservoir and theoutput level is the following
v(q) = Wq×mout rm×1(q). (10)
For a deeper discussion about the theoretical models involved in the ESN framework, wesuggest to refer to [10]
5.1 An Algorithm Example
The proposed framework, summarized in Figure 5.1, which runs at the EN site, summa-rized in the following steps
1. On the basis of the outcome of the access attempts performed on the basis of theaccess probability predictions for the two clusters, the algorithm updates the pt1and pt2 values.
112_____________________________________________________________________________________
A Machine Learning Based Non-Orthogonal Multiple Access Scheme for IoT Communications

Figure 5: Algorithm example behavior.
2. The associated BS sends out their values embedded in the downlink ACK/NACKmessages to all the IoTDs3.
3. Repeat 1)-3) at each slot.
6 Access Scheme Analysis
The aim of this Section, is the throughput and delay analysis of the proposed ESN-SANscheme under the assumption of a given number of IoTDs always active, which is useful tostudy the limits of the proposed solution under different system contexts. The throughputdelay performance of a basic SAN scheme, and for the case of the use of deep learningmethod based on that proposed in [36], are also presented here for comparisons purposes.
As stated before, in order to make affordable our performance analysis due the highnumber of IoTDs sharing the common access channel to the EN, we have resorted to theuse of the DFT model [34, 37]. According to the assumed working conditions, we havethat the number of IoTDs contenting for accessing the shared uplink channel is fixed ateach slot beginning, i.e., whenever an IoTD obtains a successful transmission attempt, anew packet transmission attempt is started on the next slot by the same or a differentIoTD, i.e., the IoTDs number having their buffer full is constant on a slot basis. Aspreviously presented in Section 4, we refer our analysis to the case of a SAN scheme withtwo power levels, i.e., f1, f2, with f1 > f2 and considering always as a success any IoTDindividual access with transmission power f1 whatever the outcome of the transmissionattempt by IoTDs with power level f2, i.e, success or collision. Hence, the probabilitythat the transmission delay xd1
of a packet generated at a given IoTD, enabled to use thepower level f1, is equal to l slots is
P{xd1= l} = pt1(1− pt1)J
′−1{1− pt1(1− pt1)J′−1}l−1, (11)
where p denotes the access probability for any IoT device belonging to the cluster f1having cardinality, i.e., the number of elements belonging to it, equals to J ′.
From (11), we have that xd1results to be geometrically distributed with parameter
τ = pt1(1 − pt1)J′−1, depending on the pt1 value and the number of IoTDs using the
power level f1. Here, a parameter of interest is the mean packet access delay xd1and its
3Note that in the case of idle uplink slots ACK/NACK messages are not sent out, hence, the pt1 andpt2 values remain the same as in the previous update.
_____________________________________________________________________________________ CNIT Technical Report-05 ꟷ Internet of Things: Technologies, Challenges and Impact
113

P{xd1= l} = pt2(1− pt2)J
′′−1[(1− pt1)J′+ J ′pt1(1− pt1)J
′−1]
{1− pt2(1− pt2)J′′−1[(1− pt1)J
′+ J ′pt1(1− pt1)J
′−1]}l−1(13)
reciprocal representing the SAN throughput η1 for the power level f1. In particular, xd1
results to be
xd1 =1
pt1(1− pt1)J′−1 (12)
hence, η1 = J ′/xd1 . Similarly, for the cluster transmitting with power f2, we have (13),and xd2
given by:
xd2 =1
pt2(1− pt2)J′′−1[(1− pt1)J′ + J ′pt1(1− pt1)J′−1](14)
with η2 = J ′′/xd2 .For a classical two power levels SAN scheme, pt1 and pt2 are a priori specified and,
usually, fixed values. Conversely, in the case of the deep Q-reinforcement learning (DRL)approach the corresponding access probability are derived on a slot basis accordinglyto a specific procedure detailed later. We would like to stress again that, as evidentin (13), a successful transmission attempt on the power level f2 strongly depends on thetransmission attempt outcome on the power level f1.
In the case of the DLR approach the corresponding access probability are derivedaccordingly to the procedure detailed later. We would like to stress again that, as it isevident in equation (13), a successful transmission attempt on the power level f2 strictlydepends on the transmission attempt (if any) outcome on the power level f1.
In order to validate the goodness of the proposed approach, we have resorted toextensive numerical simulation aiming at deeply investigating the actual performance ofthe ESN based framework. The performance improvements under the assumed workingcondition are evident in Figure 6, where the reached SAN sum throughput is depictedfor the whole system, i.e., for the two power levels. Therefore, the figure provides thethroughput performance reached by the classical two power levels SAN scheme with fixedaccess probability values set as pt = pt2 = 1
K [34, 37, 35] and J ′ = J ′′. The advantagesintroduced by the ESN are clearly evident in Figure 6, in which the devices reach greaterthroughput levels in comparison to the considered conventional SAN scheme. As knownfrom the literature [37], the figure confirms that for the conventional SAN scheme themaximum throughput value is reached when the number of active IoTDs is equal to K.However, it is also evident in the figure that when the IoTDs number changes deviatingfrom the optimum values the throughput performance significantly decreases. Differently,the ESN is able to dynamically rule the access probability on the basis of the systemcontext, i.e., the number of IoTDs, keeping high throughput levels. Furthermore, we canalso note in Figure 6 that the ESN approach outperforms the traditional SAN alternative.Furthermore, Figure 6 and Figure 6 depict the delay performance by considering both theclusters f1 and f2. Also in this case, the improvements due to the application of the ESNare evident, both in terms of maximum number of supported IoTDs simultaneously activeunder a fixed maximum mean access delay constraint or, equivalently, as the minimum
114_____________________________________________________________________________________
A Machine Learning Based Non-Orthogonal Multiple Access Scheme for IoT Communications

Figure 6: Two power levels SAN scheme sum throughput comparisons.
Figure 7: Mean Access Delay for the two power levels SAN scheme - cluster f1.
_____________________________________________________________________________________ CNIT Technical Report-05 ꟷ Internet of Things: Technologies, Challenges and Impact
115

Figure 8: Mean Access Delay for the two power levels SAN scheme - cluster f2.
Figure 9: Outage probability for cluster f1.
116_____________________________________________________________________________________
A Machine Learning Based Non-Orthogonal Multiple Access Scheme for IoT Communications

Figure 10: Outage probability for cluster f2.
mean access delay value guaranteed for specified number of especially for high numbers ofIoTDs simultaneously active. In particular, these advantages become even more evidentwhen the number of IoTDs simultaneously active is high.
Furthermore, it is important to stress that if we remove the assumed working conditionand consider each IoTD independently active with probability φ, roughly speaking, thenumber of IoTDs handled by the proposed ESN-SAN scheme for each power level hasto be considered 1/φ times higher for specified performance target values (i.e., maximumsum throughput or mean access delay). For example, from Figure 6, by assuming a targetvalue for xd1
of 150 slots and φ = 0.1 , the overall number of IoTDs handled by the clusterf1 results to be 400 that highlights the effectiveness of the proposed ESN-SAN schemein facing IoTDs access in 5G and B5G cellular networks. Figure 7 and Figure 8 showthe delay complementary cumulative probability distribution, hereafter referred as outageprobability, i.e. the probability that the delay is greater than a target value, by varyingthe mean number of packets that a device has to wait before a successful transmission, fora number of IoTDs equals to 20. As it is straightforward to note from both the Figures,the ESN reaches lower levels of outage probability in comparison to the classical SANscheme, for both the power levels f1 and f2.
7 Conclusion
The chapter has shown the potentialities of the application of the ESN method contextu-alizing its application to the two levels SAN scheme access problem. The performance of
_____________________________________________________________________________________ CNIT Technical Report-05 ꟷ Internet of Things: Technologies, Challenges and Impact
117

the ESN-SAN framework has been tested in terms of mean packet access delay and sumthroughput. Computer simulations and performance comparisons with a classical SANscheme and with an alternative ML based approach are also presented to validate thegoodness of our analysis and the better behavior of the proposed method in handling amassive IoTDs access in future 5G or B5G cellular networks. Interesting open issues andfuture work directions may consist of moving the ML techniques such as the ESN or themore general deep learning approaches on the devices, despite than on the central unit.This change of vision introduces several challenges which include greater convergence timeand possible unstable devices behaviors, that need to be investigated.
References
[1] R. Mitra and D. Agrawal, “5g mobile technology: A survey,” ICT Express, vol. 1, 012016.
[2] Q.-V. Pham, F. Fang, V. N. Ha, M. Jalil Piran, M. Le, L. B. Le, W.-J. Hwang, andZ. Ding, “A survey of multi-access edge computing in 5g and beyond: Fundamentals,technology integration, and state-of-the-art,” 2019.
[3] J. Datta and H. Lin, “Detection of uplink noma systems using joint sic and cyclic freshfiltering,” in 2018 27th Wireless and Optical Communication Conference (WOCC),pp. 1–4, April 2018.
[4] M. Kumar and S. Dargan, “A survey of deep learning and its applications: A newparadigm to machine learning,” Archives of Computational Methods in Engineering,pp. 1–22, June 2019.
[5] P. N. Druzhkov and V. D. Kustikova, “A survey of deep learning methods andsoftware tools for image classification and object detection,” Pattern Recognitionand Image Analysis, vol. 26, pp. 9–15, Jan 2016.
[6] E. M. Azoff, Neural Network Time Series Forecasting of Financial Markets. USA:John Wiley & Sons, Inc., 1st ed., 1994.
[7] H. B. Demuth, M. H. Beale, O. De Jess, and M. T. Hagan, Neural Network Design.Stillwater, OK, USA: Martin Hagan, 2nd ed., 2014.
[8] K. Rungta, TensorFlow in 1 Day: Make your own Neural Network. Publishdrive,May 2019.
[9] N. Shukla, Machine Learning with TensorFlow. USA: Manning Publications Co.,1st ed., 2018.
[10] H. Peng, C. Chen, C.-C. Lai, L.-C. Wang, and Z. Han, “A predictive on-demandplacement of uav base stations using echo state network,” 2019 IEEE/CIC Interna-tional Conference on Communications in China (ICCC), Aug 2019.
[11] M. Chen, U. Challita, W. Saad, C. Yin, and M. Debbah, “Artificial neural networks-based machine learning for wireless networks: A tutorial,” IEEE CommunicationsSurveys Tutorials, vol. 21, pp. 3039–3071, Fourthquarter 2019.
118_____________________________________________________________________________________
A Machine Learning Based Non-Orthogonal Multiple Access Scheme for IoT Communications

[12] A. Mazin, M. Elkourdi, and R. D. Gitlin, “Comparison of slotted aloha-noma andcsma/ca for m2m communications in iot networks,” in 2018 IEEE 88th VehicularTechnology Conference (VTC-Fall), pp. 1–5, Aug 2018.
[13] E. Balevi and R. D. Gitlin, “A random access scheme for large scale 5g/iot applica-tions,” in 2018 IEEE 5G World Forum (5GWF), pp. 452–456, July 2018.
[14] M. Elkourdi, A. Mazin, and R. D. Gitlin, “Slotted aloha-noma with mimo beamform-ing for massive m2m communication in iot networks,” in 2018 IEEE 88th VehicularTechnology Conference (VTC-Fall), pp. 1–5, Aug 2018.
[15] Q. He, Z. Chen, T. Q. S. Quek, Z. Chen, and S. Li, “A novel cross-layer protocolfor random access in massive machine-type communications,” in 2018 IEEE Interna-tional Conference on Communications Workshops (ICC Workshops), pp. 1–6, May2018.
[16] S. Wu, Z. Wang, and D. Ling, “Echo state network prediction based on backtrackingsearch optimization algorithm,” in 2019 IEEE 3rd Information Technology, Network-ing, Electronic and Automation Control Conference (ITNEC), pp. 661–664, March2019.
[17] P. Yu, L. Miao, and G. Jia, “Clustered complex echo state networks for traffic fore-casting with prior knowledge,” in 2011 IEEE International Instrumentation and Mea-surement Technology Conference, pp. 1–5, May 2011.
[18] N. Chouikhi, R. Fdhila, B. Ammar, N. Rokbani, and A. M. Alimi, “Single- and multi-objective particle swarm optimization of reservoir structure in echo state network,”in 2016 International Joint Conference on Neural Networks (IJCNN), pp. 440–447,July 2016.
[19] Yong Song, Yibin Li, Qun Wang, and Caihong Li, “Multi-steps prediction of chaotictime series based on echo state network,” in 2010 IEEE Fifth International Confer-ence on Bio-Inspired Computing: Theories and Applications (BIC-TA), pp. 669–672,Sep. 2010.
[20] Yu Litao, Han Aoyang, Wang Li, Jia Xu, and Zhang Zhisheng, “Short-term load fore-casting model for metro power supply system based on echo state neural network,”in 2016 7th IEEE International Conference on Software Engineering and ServiceScience (ICSESS), pp. 906–909, Aug 2016.
[21] O. A. Adeleke, “Echo-state networks for network traffic prediction,” in 2019 IEEE10th Annual Information Technology, Electronics and Mobile Communication Con-ference (IEMCON), pp. 0202–0206, Oct 2019.
[22] M. A. Adjif, O. Habachi, and J. Cances, “Joint channel selection and power controlfor noma: A multi-armed bandit approach,” in 2019 IEEE Wireless Communicationsand Networking Conference Workshop (WCNCW), pp. 1–6, April 2019.
[23] L. M. Bello, P. Mitchell, and D. Grace, “Application of q-learning for rach accessto support m2m traffic over a cellular network,” in European Wireless 2014; 20thEuropean Wireless Conference, pp. 1–6, May 2014.
_____________________________________________________________________________________ CNIT Technical Report-05 ꟷ Internet of Things: Technologies, Challenges and Impact
119

[24] N. A. Shinkafi, L. M. Bello, D. S. Shu’aibu, and I. Saidu, “Energy efficient learningautomata based qlrach (eela-rach) access scheme for cellular m2m communications,”in 2019 2nd International Conference of the IEEE Nigeria Computer Chapter (Nige-riaComputConf), pp. 1–6, Oct 2019.
[25] S. Hu, Y. Yao, and Z. Yang, “Mac protocol identification using support vector ma-chines for cognitive radio networks,” IEEE Wireless Communications, vol. 21, pp. 52–60, February 2014.
[26] Y. Yu, T. Wang, and S. C. Liew, “Deep-reinforcement learning multiple access forheterogeneous wireless networks,” in 2018 IEEE International Conference on Com-munications (ICC), pp. 1–7, May 2018.
[27] H. B. Pasandi and T. Nadeem, “Challenges and limitations in automating the designof mac protocols using machine-learning,” in 2019 International Conference on Ar-tificial Intelligence in Information and Communication (ICAIIC), pp. 107–112, Feb2019.
[28] A. Khan, A. Sohail, U. Zahoora, and A. S. Qureshi, “A survey of the recent archi-tectures of deep convolutional neural networks,” CoRR, vol. abs/1901.06032, 2019.
[29] Z. C. Lipton, “A critical review of recurrent neural networks for sequence learning,”CoRR, vol. abs/1506.00019, 2015.
[30] M. Elkourdi, A. Mazin, E. Balevi, and R. D. Gitlin, “Enabling slotted aloha-nomafor massive m2m communication in iot networks,” in 2018 IEEE 19th Wireless andMicrowave Technology Conference (WAMICON), pp. 1–4, April 2018.
[31] X. Shan, H. Zhi, P. Li, and Z. Han, “A survey on computation offloading for mobileedge computing information,” in 2018 IEEE 4th International Conference on BigData Security on Cloud (BigDataSecurity), IEEE International Conference on HighPerformance and Smart Computing, (HPSC) and IEEE International Conference onIntelligent Data and Security (IDS), pp. 248–251, May 2018.
[32] M. S. Ali, H. Tabassum, and E. Hossain, “Dynamic user clustering and power al-location for uplink and downlink non-orthogonal multiple access (noma) systems,”IEEE Access, vol. 4, pp. 6325–6343, 2016.
[33] P. Mach and Z. Becvar, “Mobile edge computing: A survey on architecture and com-putation offloading,” IEEE Communications Surveys Tutorials, vol. 19, pp. 1628–1656, thirdquarter 2017.
[34] A. Mutairi, S. Roy, and G. Hwang, “Delay analysis of ofdma-aloha,” IEEE Trans-actions on Wireless Communications, vol. 12, pp. 89–99, January 2013.
[35] L. Kleinrock and S. Lam, “Packet switching in a multiaccess broadcast channel:Performance evaluation,” IEEE Transactions on Communications, vol. 23, pp. 410–423, April 1975.
[36] Y. Yu, T. Wang, and S. C. Liew, “Deep-reinforcement learning multiple access forheterogeneous wireless networks,” in 2018 IEEE International Conference on Com-munications (ICC), pp. 1–7, May 2018.
120_____________________________________________________________________________________
A Machine Learning Based Non-Orthogonal Multiple Access Scheme for IoT Communications

[37] F. Tobagi, “Analysis of a two-hop centralized packet radio network - part i: Slottedaloha,” IEEE Transactions on Communications, vol. 28, pp. 196–207, February 1980.
_____________________________________________________________________________________ CNIT Technical Report-05 ꟷ Internet of Things: Technologies, Challenges and Impact
121


Resources virtualization and task offloadingtowards the Edge in the IoT
Giovanni Merlino1 and Virginia Pilloni2
1 Department of Engineering, University of Messina, ItalyCINI, Smart Cities and Communities Lab, Research Unit of Messina, [email protected]
2 Department of Electrical and Electronic Engineering, University of Cagliari, ItalyCNIT, Research Unit of Cagliari, [email protected]
Abstract: A significant role in the Internet of Things (IoT) will be played by mobile andlow-cost devices, able to autonomously orchestrate workloads and share resources to meettheir assigned application requirements. To increase efficiency, a recent trend promotespushing computation from the remote Cloud as close to data sources as possible: thisis the concept behind the Fog and Edge computing paradigms. Accordingly, distributedorchestration of node-hosted resources, so as to implement intelligent and fair allocationmechanisms, ensure the achievement of better performance at a lower network latency.Focusing on the aforementioned scenario, this Chapter presents a middleware architecturethat relies on equipping co-located smart Edge and Fog devices with agents that virtualizereal objects’ features, resources and services. Thanks to an appropriate and fine-grainedassessment of different combinations of offloading patterns, the middleware allows for aflexible and dynamic binding of the requested application workload to the physical IoTresources, in other terms an environment suitable for workload engineering.
1 Introduction
The age of post-Clouds is already here, where unprecedented volume and variety of dataare generated by things at the edge of networks, and many applications are being deployedon the edge networks to consume these Internet of Things (IoT) data. Some of theapplications may require very short response times, some may convey personal data, andothers may generate vast amounts of data. Cloud-based service models alone are notsuitable for these applications.
Novel challenges are surfacing for advanced IoT services, also stemming from recentdata production/consumption - and mobility - patterns, such as strict latency, constrainednetwork bandwidth, constrained devices, uninterrupted services with intermittent connec-tivity, privacy and security due to the IoT environmental changes.
To address such challenges, the integration of Edge computing and IoT has emergedas a promising solution, often describing Fog computing as a paradigm to advance andsupport analytics [1].
Albeit, hidden behind that, lies the assumption that moving data closer to the siteof its processing provides a definitive answer to most aforementioned issues. Whereas a
_____________________________________________________________________________________ CNIT Technical Report-05 ꟷ Internet of Things: Technologies, Challenges and Impact
123

suitably more general framework, to interpret and distill those challenges, consists of aset with fuzzy, ever-evolving boundaries for both data and workloads.
Thus, in more prescriptive terms, workloads need to be considered, as it happens withdata, suitable for being parceled out and dispatched where needed, as well as moved else-where when required [2], better capturing this notion under the “offloading” [3] umbrellaterm.
This is particularly applicable in the presence of virtualization primitives, such aVirtual Machines or, more recently - and effectively in the IoT space, containers - inany case, self-contained units of (work)load that can be shifted around, across suitableinfrastructure, almost effortlessly.
In a sense, even (owned and/or leased) infrastructure is morphing toward an heteroge-neous spectrum of resources’ sheer capabilities and arrangements, interaction and servicemodels, ownership granularity and trustiness properties.
Thus, task offloading cannot just be seen as (yet another) useful implement in thetoolbox of the DevOps community, i.e., in the service of software engineering alone, butalso as the mechanism of choice to maximize use of, and value extraction from, glob-ally distributed and decentralized infrastructure, especially when coupled with (suitable)resource virtualization schemes.
In terms of the categories of use cases where the impact of this perspective may behigher and its applicability more natural, any IoT-sourced data pipeline belonging to,e.g., the stream-processing layer of a lambda architecture [4], is amenable to be enhanced,or even rearranged, on the basis of the virtualization primitives and offloading patternshere proposed.
The remainder of this Chapter is organized as follows. Section 2 provides a descrip-tion of the reference architecture and of the problem addressed. Section 3 presents thefunctionalities required to manage virtualization-related processes in the middleware. Sec-tion 4 describes the proposed offloading strategy, whereas Section 5 presents a resourceallocation algorithm that enables a fair and efficient distribution of resources among thenetwork objects while ensuring that the required quality of information is achieved. InSection 6 some key use cases are presented and discussed. Conclusions and further chal-lenges are outlined in Section 7.
2 Problem Statement and Architecture
Among core challenges arising from the other half of this conceptual framework, i.e.,data production/consumption, especially source and/or sinks, such as (typically IoT-hosted) sensors and/or actuators, lies the need to provide a more powerful and completeabstraction model, by including these inputs/outputs (I/O) among resources that shouldbe shared according to demand and in compliance with multi-tenancy [5] requirements.
In particular, that translates into exposing resources as abstract handles (e.g., URIs,subject to availability of RESTful interfaces), possibly enhanced through semantic mod-eling [6], or through deeper, virtualization-level [7], techniques and primitives.
Indeed, workload (i.e., service) mobility is by definition deeply coupled with datamobility, as one cannot (easily) be moved around without also considering shifting theother. Also, data sources (and/or sinks) are especially important in this context, asproducers (and/or consumers) of data for the services to process.
124_____________________________________________________________________________________
Resources virtualization and task offloading towards the Edge in the IoT

VO
Edge VO
I/O device
IoT node
I/O device
IoT node
I/O device
Virtual I/O dev.
VN
Edge VO
Virtual I/O dev.
VN
Virtual I/O dev.
VN
Virtual I/O dev.
VN
Hardware layer
Cloud layer V
irtualizatio
nlayer
Edge layer
VO
Virtual I/O dev.
VN
Figure 1: Architecture. Edge VO can actually be implemented either on a gateway orany other connected device: more in general, everywhere across to Cloud-to-Edge-to-Fogcontinuum
Moreover, from a software engineering perspective as well, it makes sense to addressboth categories under a unified, cohesive (programming and usage) model.
To proceed with the outline of this model, some definitions need to be introduced:
• The Virtual Object (VO) [8] represents the virtual counterpart of one or more realobjects, and as such it inherits all their services, features and information mapping.As such, a VO is a digital representation of its counterpart, encapsulating the cor-responding description and carrying all metadata required for the lifecycle of itshosted activities to be managed.
• An IoT node is any computing unit that hosts physical I/O devices as well as somelogic.
• An I/O device is an entity (such as a sensor) that can be exported and attachedbut might not itself be programmed.
• We define a virtual I/O device [9] as an instance of a developer-friendly (e.g.,pseudo-filesystem-based, or key-value store-based) interface, abstracting I/O prim-itives from the underlying I/O device, either in its entirety or as a subset or evensuperset (that is, a logical grouping of several I/O devices). The aforementionedinterface can expose a remote I/O device as if it were local to its consumer, throughe.g., a messaging system suitable for remoting I/O resources, i.e., a (brokered) dual(publish-subscribe plus remote procedure calls) bus [9].
_____________________________________________________________________________________ CNIT Technical Report-05 ꟷ Internet of Things: Technologies, Challenges and Impact
125

• A virtual IoT node (VN) [9] is a self-contained and isolated environment that mightbe instantiated on top of either the datacenter-level infrastructure or a physical IoTnode at the Edge. A VN can host logic and have attached virtual I/O devices, akinto an actual node.
As described in Fig. 1, VOs include two types of virtual entity, the VNs and the virtualI/O devices, that are the virtual counterparts of IoT nodes and I/O devices respectively.A VO description, and therefore its capabilities, change dynamically whenever a change inits (backing) IoT nodes or I/O devices is experienced (e.g., updated geographic location,a change in the amount of available resource, new services provided).
Categorizing a virtual I/O device as a distinct entity with respect to a VN introducesan essential abstraction, separating the virtualization of computing/storage resources from(typically) transducer-backed I/O ones. In particular, the ability to mediate, filter, vir-tualize, remote, and more in general address the latter, with their unique properties andbehavior, separately from the former, provides higher flexibility in designing and assem-bling the infrastructure, and thus the services, of choice, whilst at the same time providinga more focused scope in the design and implementation of enabling (virtualization) mech-anisms. Indeed, this approach provides a finer granularity, and a higher degree of freedom,over one of the core benefits provided by virtualization: the multiplexing property.
3 Virtualization
IoT scenarios are characterized by heterogeneous objects, which typically communicateusing different languages. Therefore, in order for them to cope with heterogeneity-relatedissues and be able to interoperate and cooperate, they need to rely on a middleware thatprovides them with a common hardware abstraction layer, as well as access and commu-nication functionalities [10]. This is made possible thanks to the use of ontologies andsemantic description languages, which are used to define objects’ characteristics, location,resources, services, and parameters related to the quality of service and information en-sured [11]. Indeed, virtualization enables the acquisition, analysis and interpretation ofinformation about the context across heterogeneous platforms. Furthermore, it supportsservice discovery and mash-up, efficient self-management and mobility management.
According to this vision, the virtualization layer introduced in Section 2 is in charge ofcreating, maintaining, coordinating and deleting VOs and the virtual IoT nodes and I/Odevices that constitute them. Accordingly, the VO instance lifecycle can be described asfollows
1. Creation: whenever a new object is detected, it is associated with a new VO in-stance [12], based on the information it provides about the virtual IoT nodes andI/O devices it manages, resources it exposes and services it can deliver. This infor-mation is then translated into a semantic language that is understandable by theother objects that belong to the system.
2. Maintenance and coordination: during the whole VO instance lifecycle, correct andefficient management and interoperation with the other instances need to be en-sured by specific mechanisms. This includes prevention and resolution of conflicts
126_____________________________________________________________________________________
Resources virtualization and task offloading towards the Edge in the IoT

Application Service
QoS/QoIRequirement
Virtual Object
IoT Node
Virtual IoT Node
I/O Device
Virtual I/O Device
Non-ICT ObjectLocation
Time
Resource
subdividesInto
requires
managesmanages
exposes
exposes
delivers
deliversensures
virtualizes
virtualizes
monitors
includes
monitors/controlshas
has
has
isAssociatedWith
Figure 2: Information model
and instabilities deriving from concurrent invocations of the same VO and/or asso-ciated virtual nodes and I/O devices). Furthermore, the VO characteristics changedynamically whenever a change in its related IoT nodes or I/O devices is experi-enced (e.g. new geographic location, a change in the amount of available resource,new services provided).
3. Deletion: VOs have to be deleted when they are not being used anymore, i.e. whentheir associated IoT nodes and/or I/O devices are not reachable any longer.
To better describe the relationships among VOs, virtual nodes, virtual I/O devicesand their real counterparts, i.e. IoT nodes and I/O devices, Fig. 2 introduces the referenceinformation model for the system proposed in this Chapter.
It is modeled using as reference the information model proposed by the iCore FP7project, where the concept of VO was first introduced [13]. The information modeldescribes in graphic form the VO instance lifecycle introduced above. Specifically, VOsare associated with virtual nodes and I/O devices, which expose Resources that are used todeliver Services according to specific Quality of Service (QoS) and Quality of Information(QoI) requirements.
Note that services are the atomic functionalities that compose Applications. Furtherdetails about the efficient allocation of resources for service delivery will be provided inthe following Sections. Several ontologies have been proposed in the literature to modelmeasurement and post-measurement transformation of observations, which characterizevirtual IoT nodes, virtual I/O devices, resources and QoS/QoI requirements. Some ex-amples are the Sensor Model Language (SensorML) [14], the Semantic Sensor Network(SSN) and the Sensor, Observation, Sample and Actuator (SOSA) [15] ontologies. Ser-
_____________________________________________________________________________________ CNIT Technical Report-05 ꟷ Internet of Things: Technologies, Challenges and Impact
127

vices can be modeled using the most common Web service languages, such as UnifiedService Description Language (USDL), Web Service Definition Language (WSDL), andWeb Application Description Language (WADL) [16].
The QoS/QoI requirement block represents the characterization, in terms of somesalient attributes represented in the form of metadata, of the goodness of the data col-lected, processed and flowing through a network [17][18]. QoI concerns the informationthat meets a specific user’s needs at a specific time, place, physical location, and so-cial setting. Some examples of QoI requirements are data sampling rate, precision, andprovenance.
The non-ICT object block, which is inherited from the iCore information model, rep-resents an object that is not provided with communication capabilities and that can onlybe virtualized if it is monitored by at least an I/O device (e.g. a door, a room).
Object mobility is supervised by the Location and Time blocks. The Location defines,either through coordinates or description (e.g. using the GeoNames ontology [19]), theposition of a non-ICT object, an I/O device or an IoT node, which can be either staticor mobile. The Time, defined in terms of date and time range, is associated with theLocation. This association ensures the ability to know at any time when a particular IoTnode, I/O device or non-ICT object is available, when it is possible to refer to it, andwhen the last time it was updated is.
As it will be better explained in the following Section, depending on the capabilitiesof the IoT nodes and I/O devices available, and on the application to be provided, theVO processes are run in the Cloud, gateway or on the physical devices. Scenarios wherethe VO services are distributed among these locations are also possible. Whenever anapplication request is received by the system, the virtualization layer dynamically mapsthe services that are required to deliver such application to the appropriate VOs, whichtake charge of their accomplishment by involving the relevant IoT nodes and I/O devices.
4 Offloading
The decentralized approach presented in this Chapter has the advantage of handling I/Odevices and IoT nodes locally, without necessarily having to offload all the managementburden to the Cloud [20]. This is possible especially when all or some of the VO func-tionalities are implemented in the Edge VOs. Indeed, since nodes that are located closeto each other are often required to cooperate, for example when they are requested tomonitor a specific area, they can be able to form a connected group relying on short-rangecommunication technologies. In such a scenario, IoT nodes reside in the same area andare characterized by sufficient computational power and energy. The management processcan be distributed among Edge VOs that are installed directly on the involved IoT nodesor an intermediate gateway, in such a way that the management of resources is as closeas possible to the point where they are used. Accordingly, the communication betweenVOs and IoT nodes does not pass through the Internet network, i.e., it does not introduceoverhead outside of the local network, and it is faster, characterized by lower latency, lessexpensive from an energy point of view, and incurs in no connectivity issues.
If the IoT nodes that are required to cooperate are not in the same area, but theyare located in different places and at a significant distance, their communication can takeplace only through the Internet. In this case, there’s no advantage of managing them
128_____________________________________________________________________________________
Resources virtualization and task offloading towards the Edge in the IoT

Figure 3: Portion of semantic description for a VO to be able to respond to the query ofthe running example
locally. Hence, the management process is carried out in the Cloud. Although the Cloudis characterized by greater resources, communication between VOs and IoT nodes has topass through the Internet. Since VOs have to be frequently updated about the status andavailable resources of IoT nodes, so that inconsistencies are avoided, having VOs locatedremotely from IoT nodes would increase the amount of resource needed to synchronizethem. Furthermore, higher latency is experienced. Therefore, the first solution, whenapplicable, is preferable.
It is evident that the choice of offloading strictly depends on the deployed application,i.e., on the correspondence between the services to be delivered and the relative positionof the VOs that can provide them. When a new service has to be performed, the virtu-alization layer searches, among the available VO instances, those that have virtual IoTnodes and/or virtual I/O devices that can deliver it, also considering service requirements,e.g. in terms of QoS/QoI, location and time. To this end, the semantic description of theelements of the system becomes vital to implement effective search functionality. As aresult, for each requested service k, a group of VOs capable of performing it is identified.
It is, therefore, crucial to decide how they should contribute to the execution of thisservice while considering the required QoS/QoI level. In the following, we consider thatthe target QoS/QoI level corresponds to a comprehensive reference service execution
frequency F refk . Note that the proposed solution can be generalized to other QoS/QoIrequirements.
To explain the process more clearly, a running example is here outlined: supposethat a request was received for the evaluation, every minute, of human presence insideoffice A, with an error no higher than 99%, minimizing processor usage. Accordingly, thevirtualization layer analyses the request and determines the VO instances that can respond
_____________________________________________________________________________________ CNIT Technical Report-05 ꟷ Internet of Things: Technologies, Challenges and Impact
129

to it. Hence, the virtualization layer starts searching for VO instances characterized byparameters equal to those described in Fig. 3. Suppose that the virtualization layer findsthree VOs that match the queried one, which correspond to the following virtual I/Odevices: a PIR (Passive Infra-Red) sensor, which captures human movements; a camera,which uses pattern recognition to detect human faces; and a thermal sensor, which detectsbody heat. The fact that the same service can be provided by such heterogeneous devicesusing so different functionalities, is completely transparent to the virtualization layer,which can manage all of them simply by managing their VOs and related attributes.At this stage, the virtualization layer sends a request for human presence detection toone of the VOs, including also the required frequency F ref = 1/60 Hz, and the resourceusage to be minimized, i.e., processor usage. The VOs can then start negotiating to findthe optimal frequency assignment strategy, using the approach described in Section 5,regardless of their location concerning their corresponding virtual I/O devices. Indeed,since VOs are virtually directly connected between one another, they could negotiate evenif one was located in the I/O device, one in an intermediate gateway and one in the Cloud,as it is better explained in Section 2.
5 Resource Allocation
It is evident from the considerations of the previous Sections that assessing the amountof resource available to deliver a specific set of services and allocating them efficientlyis crucial for the system not to run into resource starvation. In particular, the resourceallocation strategy presented in this Chapter is based on a fair distribution of serviceworkload among the nodes that can deliver it. This means that nodes with greateravailable resources can take on more workload compared to nodes with lower resources.This prevents situations where some nodes are stuck due to a lack of residual resources,while others are underloaded.
This Section first presents (Subsection 5.1) an analysis of the most critical resourcesfor IoT systems, providing, for each resource type, a model that measures the impact ofservice workload compared with the amount of resource that is available. Accordingly,an efficient and fair resource allocation model is presented in Subsection 5.2.
5.1 Resource Model
5.1.1 Lifetime
As defined in [21], the lifetime of a node is the time until its full functionality cannotbe ensured anymore due to node battery depletion. Therefore, the lifetime of the nodeassociated with VO i at time t is defined as
τ lftmi =Eresi∑
k Ecik · fik
(1)
where Eresi is its residual energy, Ecik is the energy consumed by the node associated withVO i to perform service k, and fik is the frequency at which VO i performs service k.This means that the lifetime of a node depends on the frequency at which the servicesassigned to it are performed.
130_____________________________________________________________________________________
Resources virtualization and task offloading towards the Edge in the IoT

5.1.2 Storage Capacity
The storage capacity of a node decreases according to the frequency at which data arestored in it and to the amount of data stored. Analogously to the definition of nodelifetime, we define the storage capacity depletion time of the node associated with VO ias
τstori =Mresi∑
kDk · fik(2)
with Mresi residual memory expressed in bits, and Dk amount of data to be stored for
service k. Note that residual memory can change over time, not only because of its usagebut also because its stored data can be moved to another location.
5.1.3 Processor
The processor occupancy is measured as the ratio between the processing speed requiredto execute a service before its deadline and the available processing speed. If service k isperformed at a frequency fik, this means that the total processor occupancy of the nodeassociated with VO i can be defined as
Θproci =
∑k
1
Sproci
· Ninstrk · fiktdlk
(3)
where N instrk is the number of instructions that need to be processed to perform service
k, tdlk is service k’s deadline, and Sproci is the processing speed for the node associatedwith VO i. Note that tdlk cannot be higher than the amount of the time between twosubsequent executions of service k, and is part of the QoS/QoI requirements for servicek.
5.1.4 Bandwidth
Analogously to the analysis made for the processor occupancy, and considering that thebandwidth needed by the node associated with VO i to transmit the output data forservice k is proportional to its bitrate Dk/t
dlk and to the frequency fik at which service k
is executed, we define the bandwidth occupancy as
ΘBWi =
∑k
1
Bavi· Dk · fik
tdlk(4)
where Bavi is the bandwidth available for i.
5.2 Fair Resource Allocation Strategy
The equation that describes the use of the R set of resources of VO i for the K set ofservices can be generalized as
Θi(K) =1
τ lftmi
+1
τstori
+ Θproci + ΘBW
i =∑r∈R
θir(K) =∑r∈R
∑k∈K
Rikr · fik (5)
_____________________________________________________________________________________ CNIT Technical Report-05 ꟷ Internet of Things: Technologies, Challenges and Impact
131

START
Allocate service
𝑘∗ with reference
frequency 𝐹𝑘∗𝑟𝑒𝑓
Select the set Λ𝑘∗ of the
VOs associated to
service 𝑘∗
Is 𝑓𝑖𝑘∗ computed
for all the VOs in
Λ𝑘∗?
Start executing service
𝑘∗ according to the
computed 𝑓𝑖𝑘∗ values
ENDY
N
Compute 𝑓𝑖𝑘∗ as in
Eq. 8
Is 𝑓𝑖𝑘∗ < 0?
Delete 𝑖 from Λ𝑘∗ and
delete all the previously
computed 𝑓𝑖𝑘∗ values
Y
N
Figure 4: Flowchart of the proposed resource allocation strategy
with
Rikr =
Ecik/E
resi , if r = lifetime
Dk/Mresi , if r = storage
N instrk /(Sproci · tdlk ), if r = processing
Dk/(Bavi · tdlk ), if r = bandwidth
Whenever a new service k∗ needs resources to be allocated for its execution, a fre-quency of execution is assigned to each VO i that is associated with that service, i.e. theVOs that belong to the set Λk∗ . To ensure a fair distribution of resources, such frequencyof execution fik∗ needs to fulfill the following conditions∑
r∈R
αr · (Rik∗r · fik∗ + θir(K)) =∑r∈R
αr (Rjk∗r · fjk∗ + θjr(K)) ∀{i, j} ∈ Λk∗∑j∈Λk∗
fjk∗ = F refk∗∑r∈R
αr = 1 ∀i ∈ Λk∗
(6)
where F refk∗ =∑j fjk∗ is the reference frequency that has to be ensured according to the
QoS/QoI requirements, and αr > 0 is a normalized weighting factor that is used by the
132_____________________________________________________________________________________
Resources virtualization and task offloading towards the Edge in the IoT

system to weigh the impact of resource usage differently according to its needs. If, forinstance, the system needs to save storage capacity more than the other resources, itsweighting factor is set higher than the others. The first condition ensures that resourcesare fairly shared among the VOs in Λk∗ . The second condition ensures that the qualityrequirements are fulfilled.
The first condition can be reformulated to make fjk∗ explicit
fjk∗ =1∑
r∈R αr ·Rjk∗r·∑r∈R
αr (Rik∗r · fik∗ + θir(K)− θjr(K)) (7)
Substituting it in the second condition, it is possible to define it as
fik∗ =1∑
j∈Λk∗1∑
r∈R αr·Rjk∗r
·F refk∗∑
r∈R αr ·Rik∗r+
∑j∈Λk∗
∑r∈R αr · (θjr(K)− θir(K))∑r∈R αr ·Rik∗r
(8)It may happen that Eq. 8 is fulfilled for values of fik∗ < 0. This means that the
corresponding VO is already consuming much more resources than the other VOs andthere are no physically possible values of fik∗ that would lead it to a resource consumptionthat is comparable to that of the other VOs. Therefore, fik∗ is set to 0 for that VO andthe resource allocation is started again considering the remaining VOs in Λk∗ .
Fig. 4 summarizes in graphical form the main steps of the resource allocation mecha-nism.
6 Key Use Cases
In this Section, some key use cases will be presented and discussed to better clarify thewhole process of resource allocation and offloading.
The reference scenario is depicted in Fig. 5. The application that the system is requiredto execute is identifying when a specific user is at home, at work, or going at home orwork, in order to switch on the air conditioner and set it correctly so that the temperatureis correct when the user gets in. Therefore, the basic services are three:
Use case 1: Identifying the user’s position: this is done thanks to the PIR sensor at home,the Bluetooth beacon at work and the GPS of the phone. The objective, inthis case, is to optimize the nodes’ lifetime. The reference frequency is 1sample every 2 minutes, i.e. F ref1 = 0.0083 Hz.
Use case 2: Measuring the temperature at home: temperature sensors are used for thispurpose. These sensors do not have a network interface and are directlyconnected to a sink through a wire. The sink is also their gateway to com-municate with the Cloud. The objective is to optimize nodes’ lifetime. Thereference frequency is 1 sample every 5 minutes, i.e. F ref2 = 0.0033 Hz.
Use case 3: Measuring the temperature at work: temperature sensors are used in this caseas well. However, sensors are equipped with a Bluetooth network interface,through which they can communicate with a gateway that connects themwith the Cloud. The objective is to optimize nodes’ lifetime and bandwidth.
_____________________________________________________________________________________ CNIT Technical Report-05 ꟷ Internet of Things: Technologies, Challenges and Impact
133

Figure 5: Use case scenario
The reference frequency is again 1 sample every 5 minutes, i.e. F ref3 = 0.0033Hz.
The resources available for the nodes and required for the considered services aredescribed in Table 1.
6.1 Use Case 1
Regardless of the fact that the IoT nodes involved in this use case can host some VOfunctionalities or not, they are all located in different places. For this reason, the resourceallocation can be performed neither locally or on the Edge, but it has to be offloaded to
Device Location Provided Rik∗1 θi1(K) Rik∗4 θi4(K)service
BT beacon 1 Office 1 1 0.002 0 NA NAGPS 1 User (mobile) 1 0.004 0.75 NA NAPIR sensor 1 Home 1 0.001 0 NA NATemperature sensor 1 Home 2 0.001 0 NA NATemperature sensor 2 Home 2 0.0007 0 NA NATemperature sensor 3 Home 2 0.005 0 NA NATemperature sensor 4 Office 3 0.002 0 0.1 0Temperature sensor 5 Office 3 0.003 0 0.08 0
Table 1: Description of resources available for the nodes and required for the services forthe reference scenario
134_____________________________________________________________________________________
Resources virtualization and task offloading towards the Edge in the IoT

Device fi1 [Hz] Θiniti [Hz] Θfinal
i [Hz]BT beacon 1 0.028 0 5.55e-6GPS 1 0 0.75 0.75PIR sensor 1 0.056 0 5.55e-6
Table 2: Result of the resource allocation for use case 1
Device fi2 [Hz] Θiniti [Hz] Θfinal
i [Hz]Temperature sensor 1 0.0013 0 1.27e-6Temperature sensor 2 0.0018 0 1.27e-6Temperature sensor 3 0.0002 0 1.27e-6
Table 3: Result of the resource allocation for use case 2
the Cloud.The system retrieves from the VOs the information required for resource allocation
and computes fi1. The results are reported in Table 2, where Θiniti and Θfinal
i measurerespectively the use of resources before and after service 1 has been allocated. Since theresource consumption for GPS 1 is already high and service 1 does not require a highamount of resources, there are no feasible values of fi1 for it. Therefore, the resourceallocation involves only BT beacon 1 and PIR sensor 1.
6.2 Use Case 2
In this use case the I/O devices, i.e. the temperature sensors, do not have a networkinterface and rely upon the sink which serves as a gateway towards the Cloud for all ofthem. Consequently, their VOs reside in the gateway itself. Therefore, even though theyare located close to each other and resource allocation can be performed locally, theirVOs’ information is stored on the gateway. For this reason, resources are allocated bythe gateway, i.e. on the Edge, and the result is used to set the sensors appropriately.
The results are shown in Table 3. Remind that Θiniti and Θfinal
i measure respectivelythe use of resources before and after service 2 has been allocated. Also in this case,since the reference frequency and the amount of resource required is low, the total use ofresources remains low even after the resources have been allocated.
6.3 Use Case 3
The temperature sensors used in this use case are IoT nodes with computational capa-bilities. For this reason, their VOs reside in the physical node. The resource allocationcan be performed by the nodes, which can communicate directly, e.g. using short-rangedevice-to-device communication, to find the optimal frequency value.
This use case has the objective of optimizing two types of resources, namely lifetimeand bandwidth. For this reason, αr should be set considering which resource type is morecritical for the system. Fig. 6 and Fig. 7 respectively show how resulting frequency andresource usage for different resource types change when αr changes. It is evident thatwhen α1 is low (i.e. α4 is high) the impact of the bandwidth on resource allocation ishigher. Therefore, the optimization is more effective on bandwidth usage, which at the
_____________________________________________________________________________________ CNIT Technical Report-05 ꟷ Internet of Things: Technologies, Challenges and Impact
135

0 0.2 0.4 0.6 0.8 1
1
1.3
1.4
1.5
1.6
1.7
1.8
1.9
2f [H
z]
10-3
Temperature sensor 4
Temperature sensor 5
Figure 6: Resulting frequency for different values of α1, for use case 3
0 0.2 0.4 0.6 0.8 1
1
2.5
3
3.5
4
4.5
5
5.5
6
i1 [
Hz]
10-6
Temperature sensor 4
Temperature sensor 5
(a) Lifetime
00.20.40.60.81
4
1
1.2
1.4
1.6
1.8
2
2.2
i4 [
Hz]
10-4
Temperature sensor 4
Temperature sensor 5
(b) Bandwidth
Figure 7: Resulting resource usage differentiated by resource type for use case 3, consid-ering different values of αr
136_____________________________________________________________________________________
Resources virtualization and task offloading towards the Edge in the IoT

end of the allocation is equal for both nodes. On the other end, when α1 is high (i.e. α4
is low) the impact of the lifetime on resource allocation is higher. Since service 3 requiresmore bandwidth usage than lifetime usage (see Table 1), the impact of lifetime usage onresource allocation remains quite low until α1 is higher than 0.8. This is also confirmedby Fig. 6, where values of α1 > 0.9 correspond to a higher frequency for temperaturesensor 4, which has higher bandwidth usage, compared to temperature sensor 5, whichhas higher lifetime usage.
7 Conclusions and challenges
In order to efficiently control and manage the allocation of services to the heterogeneousresource-constrained objects that characterize the IoT, this Chapter proposed a middle-ware architecture that makes use of virtualization and offloading mechanisms to flexiblyand dynamically orchestrate a fair distribution of applications’ workload.
Among key challenges, the choice of the ontology to be used for semantic descriptionis crucial for an effective and efficient selection of the VOs that can respond to a specificquery, whilst at the same time compatible with current user demand in terms of multi-tenancy requirements.
Which node coordinates the resource allocation is still to be decided, also takinginto account that resource allocation can constitute a not-negligible workload by itself,depending on how it is managed. One strategy to reduce this burden is using a distributedapproach, at least when any fallback, such as a centralized (e.g., Cloud-side) coordination,turns out to be unavailable, or undesirable. Indeed, the resource allocation strategydescribed in Section 5 is particularly suitable for distributed negotiation mechanisms suchas consensus algorithms. The use of the most appropriate resource allocation strategymay be also selected from time to time considering the impact of different algorithms ondifferent resource types, considering the ones that are selected to be optimized.
References
[1] F. Bonomi, R. Milito, P. Natarajan, and J. Zhu, Fog Computing: A Platform forInternet of Things and Analytics. Cham: Springer International Publishing, 2014,pp. 169–186.
[2] G. Merlino, R. Dautov, S. Distefano, and D. Bruneo, “Enabling Workload Engineer-ing in Edge, Fog, and Cloud Computing through OpenStack-based Middleware,”ACM Transactions on Internet Technology, vol. 19, no. 2, 2019.
[3] H. Flores, Xiang Su, V. Kostakos, A. Y. Ding, P. Nurmi, S. Tarkoma, P. Hui, andY. Li, “Large-scale offloading in the Internet of Things,” in 2017 IEEE Interna-tional Conference on Pervasive Computing and Communications Workshops (Per-Com Workshops), March 2017, pp. 479–484.
[4] M. Kiran, P. Murphy, I. Monga, J. Dugan, and S. S. Baveja, “Lambda architecturefor cost-effective batch and speed big data processing,” in 2015 IEEE InternationalConference on Big Data (Big Data), 2015, pp. 2785–2792.
_____________________________________________________________________________________ CNIT Technical Report-05 ꟷ Internet of Things: Technologies, Challenges and Impact
137

[5] S. Cherrier, Z. Movahedi, and Y. M. Ghamri-Doudane, “Multi-tenancy in decen-tralised IoT,” in 2015 IEEE 2nd World Forum on Internet of Things (WF-IoT),Dec 2015, pp. 256–261.
[6] S. Alam, M. M. R. Chowdhury, and J. Noll, “SenaaS: An event-driven sensor virtu-alization approach for Internet of Things cloud,” in 2010 IEEE International Con-ference on Networked Embedded Systems for Enterprise Applications, Nov 2010, pp.1–6.
[7] M. Samaniego and R. Deters, “Supporting iot multi-tenancy on edge devices,” in 2016IEEE International Conference on Internet of Things (iThings) and IEEE GreenComputing and Communications (GreenCom) and IEEE Cyber, Physical and SocialComputing (CPSCom) and IEEE Smart Data (SmartData), Dec 2016, pp. 66–73.
[8] A. Somov, C. Dupont, and R. Giaffreda, “Supporting smart-city mobility with cog-nitive Internet of Things,” in 2013 Future Network & Mobile Summit. IEEE, 2013,pp. 1–10.
[9] D. Bruneo, S. Distefano, F. Longo, G. Merlino, and A. Puliafito, “I/Ocloud: Addingan IoT dimension to cloud infrastructures,” Computer, vol. 51, no. 1, pp. 57–65,2018.
[10] A. H. Ngu, M. Gutierrez, V. Metsis, S. Nepal, and Q. Z. Sheng, “IoT middleware: Asurvey on issues and enabling technologies,” IEEE Internet of Things Journal, vol. 4,no. 1, pp. 1–20, 2016.
[11] M. Nitti, V. Pilloni, G. Colistra, and L. Atzori, “The virtual object as a major elementof the Internet of Things: a survey,” IEEE Communications Surveys & Tutorials,vol. 18, no. 2, pp. 1228–1240, 2015.
[12] iCore, “D3.1: Virtual Object Requirements and Dependencies,” 2012.
[13] P. Vlacheas, R. Giaffreda, V. Stavroulaki, D. Kelaidonis, V. Foteinos, G. Poulios,P. Demestichas, A. Somov, A. R. Biswas, and K. Moessner, “Enabling smart citiesthrough a cognitive management framework for the Internet of Things,” IEEE com-munications magazine, vol. 51, no. 6, pp. 102–111, 2013.
[14] O. OGC, “SensorML: Model and XML Encoding Standard,” Doc No. OGC, pp.12–000, 2014.
[15] K. Janowicz, A. Haller, S. J. Cox, D. Le Phuoc, and M. Lefrancois, “SOSA: Alightweight ontology for sensors, observations, samples, and actuators,” Journal ofWeb Semantics, vol. 56, pp. 1–10, 2019.
[16] M. Klusch, P. Kapahnke, S. Schulte, F. Lecue, and A. Bernstein, “Semantic webservice search: a brief survey,” KI-Kunstliche Intelligenz, vol. 30, no. 2, pp. 139–147,2016.
[17] C. Bisdikian, L. M. Kaplan, and M. B. Srivastava, “On the quality and value ofinformation in sensor networks,” ACM Transactions on Sensor Networks (TOSN),vol. 9, no. 4, p. 48, 2013.
138_____________________________________________________________________________________
Resources virtualization and task offloading towards the Edge in the IoT

[18] V. Pilloni, L. Atzori, and M. Mallus, “Dynamic involvement of real world objects inthe IoT: A consensus-based cooperation approach,” Sensors, vol. 17, no. 3, p. 484,2017.
[19] S. A. U. Nambi, C. Sarkar, R. V. Prasad, and A. Rahim, “A unified semantic knowl-edge base for IoT,” in 2014 IEEE World Forum on Internet of Things (WF-IoT).IEEE, 2014, pp. 575–580.
[20] M. Dıaz, C. Martın, and B. Rubio, “State-of-the-art, challenges, and open issues inthe integration of Internet of Things and cloud computing,” Journal of Network andComputer applications, vol. 67, pp. 99–117, 2016.
[21] H. Yetgin, K. T. K. Cheung, M. El-Hajjar, and L. H. Hanzo, “A survey of networklifetime maximization techniques in wireless sensor networks,” IEEE Communica-tions Surveys & Tutorials, vol. 19, no. 2, pp. 828–854, 2017.
_____________________________________________________________________________________ CNIT Technical Report-05 ꟷ Internet of Things: Technologies, Challenges and Impact
139


Security and privacy in the IoT: how to enforcestandard communication technologies with efficientand flexible mechanisms
Antonio Suriano, Domenico Striccoli, Giuseppe Piro, Antonio Antenore,Gennaro Boggia
DEI, Politecnico di Bari. Via Orabona 4, Bari, Italy
CNIT, Consorzio Nazionale Interuniversitario per le Telecomunicazioni
Abstract: The revolutionary Internet of Things paradigm successfully enabled theinteraction among smart objects pervasively diffused across the Internet. From the be-ginning, communication technologies and open standards already provided baseline tech-niques able to offer security and privacy, also in constrained environments. But, whiledata confidentiality and data integrity were immediately tackled with robust cryptosystems,authentication and key management have been frequently covered with superficiality. Notonly: fine-grained authorization and anomaly and intrusion detection services have beengenerally ignored in most cases. As a consequence, the worldwide scientific communitydedicated a high attention to the design, the implementation, and the evaluation of newaddressing these open issues, while taking care about the new requirements characteriz-ing the emerging Internet of Things scenarios and the related security risks and threats.This contribution starts by providing a new set of Internet of Things-oriented defini-tions of security services and highlights the impact that their implementation may haveon the behavior of standardized communication protocols (i.e., computational complexityin constrained environments, energy consumption, and so on). Then, it presents someinteresting approaches emerged in the recent scientific literature, addressing the uncoveredsecurity services. In summary, they include: key management protocols based on ImplicitCertificates and Blockchain, Attribute-Based Access Control in multi-domain and multi-authority ecosystems, anomaly and intrusion detection mechanisms based on machinelearning.
1 Introduction
The Internet of Things (IoT) is an emerging and promising technology which tends torevolutionize the global world through connected physical objects, that can be fruitfullyemployed to enhance the quality of everyday life. For this reason, IoT is massively presentin several application scenarios, including health and environmental monitoring, home au-tomation, smart mobility, industry applications, etc. [1]. The wide variety of public andprivate environments where IoT devices are employed, together with the evergrowingnumber of connected devices, unavoidably poses critical security concerns, in terms ofprivacy, authentication (AuthN) and recovery from attacks, that need to be effectively
_____________________________________________________________________________________ CNIT Technical Report-05 ꟷ Internet of Things: Technologies, Challenges and Impact
141

managed [2]. This challenging task is even more complicated by the spread of communica-tion technologies and approaches proposed for IoT devices, ranging from low power widearea networks (LPWAN) solutions such as SigFox, LoRa, WiFi, Zigbee, Ingenu-RPMA,Weightless and NB-IoT, to 5G New Radio (NR) technology in enhanced Machine TypeCommunication (eMTC), Bluetooth Low Energy (BLE) and DASH7 [3,4].
Nevertheless, while data confidentiality and data integrity were immediately tackledwith robust cryptosystems, authentication and key management have been frequently cov-ered with superficiality. Not only: fine-grained authorization and anomaly and intrusiondetection services have been generally ignored in most cases. Accordingly, high attentionmust be paid to design, implementation and evaluation of new schemes that address theseopen issues, at the same time taking into account the new requirements characterizingthe emerging IoT scenarios with their security risks and threats. The goal of this con-tribution is to provide a new set of IoT-oriented definitions of security services, pointingout the impact that their implementation may have on the behavior of standardized com-munication protocols. Then, some interesting approaches emerged in the recent scientificliterature are presented, addressing the uncovered security services. They include keymanagement protocols based on Implicit Certificates and Blockchain, Attribute-BasedAccess Control in multi-domain and multi-authority ecosystems, anomaly and intrusiondetection mechanisms based on machine learning.
The reminder of this chapter is organized as follows. Section 2 provides an overview ofemployed technologies, focusing on the related security services. Sections 3 and 4 analyzethe main authentication and access control schemes, respectively. Section 5 provides anoverview of anomaly and intrusion detection schemes. Section 6 concludes this chapter.
2 Security in reference technologies for the IoT
IoT reference technologies can be classified according to the transmission range, dependingon whether their communication range is short or medium-long. Based on this classifica-tion, each technology will be discussed from a security perspective in what follows.
2.1 Short-range technologies
Wi-Fi IEEE 802.11 is a standard for Wireless LAN (WLAN) (interoperable standard-compliant implementations are referred to as Wi-Fi). IEEE 802.11i [5] specifies securitystandards for IEEE 802.11 LANs. The original specifications include a set of security fea-tures for privacy and authentication that were quite weak. Specifically, the first algorithmwas the Wired Equivalent Privacy (WEP) [6], that however contained major weaknesses.Subsequently, the 802.11i task group developed a set of capabilities to overcome the issuesof WEP and the Wi-Fi Alliance promulgated the Wi-Fi Protected Access (WPA) [6] asa Wi-Fi standard. This is a set of security mechanisms that eliminated most of the secu-rity issues and was based on the original version of the 802.11i standard. The followingversions of WPA, i.e. WPA2 and WPA3 have been proposed to solve the security issuesof WPA, that no longer was able to provide sufficient security to protect consumers orenterprise Wi-Fi networks. The final form of the 802.11i standard is referred to as Ro-bust Security Network (RSN), that defines different security services, i.e., authentication,access control and privacy with message integrity. There are two versions of WPA2, Per-
142_____________________________________________________________________________________
Security and privacy in the IoT: how to enforce standard communication ...

sonal and Enterprise; the main difference is the authentication phase, since the first usespre-shared keys (PSK) and is designed for home use, while the second uses IEEE 802.1Xto offer enterprise-grade authentication through the Extensible Authentication Protocol(EAP). WPA3 was released to overcome some WPA2 limitations; it also encompassesWPA3-Personal and WPA3-Enterprise versions. It makes it mandatory to use ProtectedManagement Frames (PMF), optional for WPA2, and requires a longer encryption keyin the enterprise version. Moreover, WPA3 introduces the Simultaneous Authenticationof Equals (SAE) to replace WPA2’s PSK exchange protocol. Furthermore, it leverageson a standardized mechanism (Certified Easy Connect) to simplify the provisioning andconfiguration of IoT devices.
ZigBee Security services for ZigBee include methods for key establishment, key trans-port, frame protection and device management [7]. The level of security provided by theZigBee architecture strictly depends on the correct and safe management of the symmet-ric keys, on the protection mechanisms adopted, and on the proper implementation of thecryptographic mechanisms and the associated security policies. As a consequence, trustin the security architecture reduces to trust in the secure initialization and installationof keys and to trust in the secure management of keys. ZigBee exploits the AdvancedEncryption Standard - Counter with Cipher Block Chaining - Message AuthenticationCode (AES-CCM), as stated in [8]. The offered security services are authentication, con-fidentiality and integrity, according to the chosen security level. The ZigBee architectureincludes security mechanisms at two layers of the protocol stack: the network layer andthe application support sublayer. They are responsible for the secure transport of theirrespective frames. The latter provides also services for the establishment and mainte-nance of security relationships. Finally, the ZigBee Device Object manages the securitypolicies and configuration of a device.
Bluetooth Low Energy Bluetooth Low Energy (LE) is a wireless personal area net-work (WPAN) technology based on the IEEE 802.15.1 standard. According to [9], Blue-tooth is susceptible to general wireless networking threats (e.g., DoS attacks, eavesdrop-ping, man-in-the-middle, message modification, etc.) plus security vulnerabilities in Blue-tooth implementations and specifications. The security services targeted by the Bluetoothspecifications are: pairing/bonding, authentication, authorization and confidentiality, andmessage integrity. Pairing can be obtained by creating one or more shared secret keysand storing them for use in subsequent connections to form a trusted device pair. To thisend, the AES algorithm is adopted. Authentication is obtained by verifying the identityof communicating devices based on their Bluetooth address. To this end, the AES-CCMalgorithm is used [9]. The standard proposes (from version 2.1) 4 security modes thesecurity procedures are initiated with, before or after physical and logical link setup.Authorization and confidentiality are obtained by allowing the control of resources byensuring that a device is authorized to use a service before permitting it to do so. Finally,message integrity is obtained by preventing information compromise, ensuring that onlythe authorized devices can access and view transmitted data, and verifying that a mes-sage sent between two Bluetooth devices has not been altered in transit. The encryptionalgorithm used is the AES-CCM.
_____________________________________________________________________________________ CNIT Technical Report-05 ꟷ Internet of Things: Technologies, Challenges and Impact
143

2.2 Medium-long range technologies
SigFox SigFox is a technology aiming to build wireless networks to connect low powerobjects in IoT scenarios. For its technology, security is highly important. The key aspectis that security comes with devices: between the connected devices and the SigFox cloudthere is an end-to-end authentication method based on a secret key. The secret key isstored in a non-accessible memory associated with a visible and specific ID stored in a readonly memory. This secret key is used by messages sent by devices to create a signature,that is unique for each message, and that will authenticate the sender. Furthermore, theSigFox base stations are connected with the SigFox cloud through a point-to-point linkusing an encrypted Virtual Private Network (VPN). At the chain end, the user platformsare connected to the SigFox cloud using HTTPS encrypted interfaces [10]. SigFox usesan authentication method that exploits a symmetrical authentication key [11].
LoRa Long Range (LoRa) is a low power wide area network (LPWAN) technology,developed by the LoRa Alliance [12]. LoRaWAN specifications define two layers of cryp-tography: a unique 128-bit Network Session Key shared between the end device andnetwork server and a unique 128-bit Application Session Key (AppSKey) shared end-to-end at the application level. LoRaWAN security targets a full end-to-end encryptionfor IoT applications. The security framework has been designed to offer the followingsecurity services: mutual authentication, integrity protection and confidentiality. Mutualauthentication is established between a LoRA end device and the network as a part ofthe network joining procedure. This ensures that only genuine and authorized deviceswill be joined to genuine authentic networks. To this end, a symmetrical authenticationkey is exploited [11]. Furthermore, messages are authenticated, protected and encryptedat both MAC and application layers, thus ensuring that network traffic cannot be alteredand is coming from a legitimate device. Security in LoRaWAN is based on the AEScryptographic primitive.
Narrowband Internet of Things NarrowBand Internet of Things (NB-IoT) is a LP-WAN technology standard developed by 3GPP to enable a wide range of cellular devicesand services. The security requirements of NB-IoT are similar to those of traditionalIoT, but there are many differences mainly due to the hardware equipment. The algo-rithms that should be adopted are data encryption, identity authentication and integrityverification. The most frequently used cryptographic mechanisms include random keypre-allocation, deterministic key pre-allocation and password based on identity [13]; fur-thermore, in this technology the authentication is mutual, i.e., the device authenticatesto the network and vice versa [11].
Enhanced Machine Type Communication Enhanced Machine Type Communica-tion (eMTC), also called as LTE Cat-M1, or CAT-M, is a LPWAN technology introducedby 3GPP with the Release-13 of the LTE standard. This technology is an enhance-ment for LTE networks to support MTC for the IoT. LTE systems provide security byintegrating different security algorithms, such as mutual authentication, integrity and en-cryption [14]; however, in addition to security for communications, most of the e-MTCapplications require security for data. Some solutions, as proposed in [14], are the uti-lization of new mechanisms to achieve a higher level of security (e.g., the operation of
144_____________________________________________________________________________________
Security and privacy in the IoT: how to enforce standard communication ...

e-MTC applications could be restricted only to authenticated devices), the exploitation ofphysical-layer security adopting radio-frequency fingerprinting, and the use of asymmetricsecurity schemes.
5G New Radio 5G New Radio (NR) is a radio access technology developed by 3GPPfor the 5G mobile network. The 5G NR network is expected to cater for massive andcritical IoT scenarios, as the demand for machine type communication is rapidly growing[15]. The most important security features are the primary authentication and the keyagreement. The goal of these procedures is to enable mutual authentication between theUE and the network and provide keying material that can be used between the UE andthe serving network in subsequent security procedures [16,17].
Ingenu-RPMA Ingenu Random Phase Multiple Access (RPMA) technology is de-signed specifically and exclusively for wireless machine-to-machine communication [18].This technology addresses six security services: message confidentiality, message integrityand replay protection, mutual authentication, device anonymity, authentic firmware up-grade, and secure multicast. In particular, the authentication scheme provides for mutualauthentication [11].
DASH7 DASH7 is a long range low power wireless technology, and is an extensionof active Radio-Frequency Identification (RFID), where communication can take placedirectly between devices and can be also used for non-RFID applications [15]. As stated in[19], the security in DASH7 is organized in the network layer and is similar to the securityof IEEE 802.15.4 [20], using AES-Cypher Block Chaining (AES-CBC) for authenticationand AES-CCM for authentication and encryption.
Weightless Weightless is a set of LPWAN open wireless technologies adopted in publicor private networks with end devices with IoT requirements [21]. Weightless securityaims to provide adequate protection for a variety of use cases. Its goal is to guaranteethe authenticity, integrity and confidentiality of user and control data. AES-128/256 isthe algorithm used for the encryption and authentication of both the terminal and thenetwork, that guarantees integrity while temporary device identifiers offer anonymity formaximum security and privacy. Over-the-air (OTA) security key negotiation or replace-ment is possible, while a future-proof cipher negotiation scheme with a minimum keylength of 128 bits protects long term investment in the network integrity. Weightlessoffers also mutual authentication with trusted third party.
The security services addressed by the IoT reference technologies are summarized inTable 1.
3 Authentication techniques and Key Management inIoT
Authentication is the process of determining whether someone or something is who orwhat it is declared to be. It is of great importance the implementation of distributed iden-tity and trust management strategies in IoT scenarios, where a huge number of devices
_____________________________________________________________________________________ CNIT Technical Report-05 ꟷ Internet of Things: Technologies, Challenges and Impact
145

TECHNOLOGY SECURITY COVERAGESERVICES RANGE
SigFox AuthN, Confidentiality and Integrity Medium-longLoRa AuthN, Confidentiality and Integrity Medium-longWi-Fi AuthN, Confidentiality, Short
Port-based Access Control and IntegrityZigbee AuthN, Confidentiality, Short
Access Control List and IntegrityNB-IoT AuthN, Confidentiality and Integrity Medium-longE-MTC AuthN, Confidentiality and Integrity Medium-long
5G New Radio AuthN, Confidentiality and Integrity Medium-longBluetooth LE Pairing, AuthN, Service-level Authorization, Short
Confidentiality and IntegrityIngenu-RPMA AuthN, Confidentiality, Medium-long
Integrity, device anonimity, replayprotection and authentic firmware upgrades
DASH-7 AuthN, Confidentiality and Integrity Medium-longWeightless AuthN, Confidentiality and Integrity Medium-long
Table 1: Security services offered by the reference IoT technologies
must be authenticated and carry out trusted communications. The classical authentica-tion process consist of three steps: (i) obtaining the required authentication process (e.g.,a password); (ii) analyzing data (e.g., compare the received password with the stored one);and (iii) determining if they are really associated with the original ones (e.g., confirm ifthey are the same). Authentication techniques must be accompanied by mechanisms ofsecure data exchange through cryptographic keys. Accordingly, a secure managementof such keys is a major aspect in IoT environments, where scalability is a critical issuebecause of the potentially huge number of connected devices [22]. The different KeyManagement Protocols (KMPs) proposed in the recent literature aim to tackle this prob-lem, by proposing strategies for secure key management (i.e., their generation, exchange,storage, distribution and replacement) and the related cryptographic and authenticationschemes adopted.
This section presents a taxonomy of different IoT authentication schemes, that havebeen classified by the scientific literature into different criteria, including authenticationfactors, use of tokens, authentication architectures, and hardware-based schemes [23]. Forwhat concerns KMPs, they are mostly based on asymmetric (or public key) cryptography,that is suitable for resource-constrained devices because it is scalable and with low com-putational complexity and overhead because of the small amount of data (the keys) tobe encrypted. The main challenges in this context are mainly related to the optimizationof the cryptography protocols to match the requirements of scalability, the adoption ofhardware-based solutions to face the problem of the high computational effort peculiarof asymmetric cryptography, and the adoption of novel technologies, like blockchains, toensure a high security level in IoT [22].
146_____________________________________________________________________________________
Security and privacy in the IoT: how to enforce standard communication ...

3.1 Authentication Factors
An authentication factor is a category of credentials that aims to verify that an entityinvolved in a communication or requesting access to a system is who, or what, it is declaredto be. Identity-based authentication schemes can utilize one, more, or a combination ofhash and symmetric or asymmetric cryptographic algorithms. Typical schemes don’t fitwell in constrained environments for IoT, thus new approaches are needed. Some worksuse identity-based public key cryptosystem and identity-based aggregate signature. Suchkinds of approaches are often applied to vehicular communications [24], because of theirsecurity and privacy-preserving requirements, and in smart grid scenarios [25]. The citedstudies develop smart grid authentication scheme (SGAS) and smart grid key management(SGKM) protocols, so that different kinds of attacks (e.g., brute force, replay, man-in-the-middle, etc.) can be prevented.
3.2 Use of Tokens
A token is a piece of data created by the authentication server to uniquely identify a user ora device [26]. An authentication scheme is called token-based if the authentication methoduses a token. Token-based authentication schemes can be further distinguished into softand hard token-based schemes. Representative examples of token-based approaches canbe found in [27, 28]. In [27] the authentication protocol, is payload-based. It is ableto detect the attacks based on the cluster formation between neighbouring nodes andtheir nearest cluster head in a Internet of Sensors (IoS) scenario. In [28] the token-based authentication is based on the use of nonces, that are resistant to different attacks(e.g., man-in-the-middle, replay, impersonation, etc.). This approach is used to guaranteemutual authentication in a wireless sensor network (WSN). On the other side, non-tokenbased authentication involves the use of the credentials (username, password) each timethere is a need to exchange data. An example of such approach is found in [29], wherethe authentication scheme is implemented on existing Internet standards, especially theDatagram Transport Layer Security (DTLS), and applied it in a machine-to-machine(M2M) scenario.
3.3 Authentication Architecture
The authentication architecture can be distributed, if it uses a distributed authentica-tion method between the communicating parties, or centralized, if it uses a centralizedserver or a trusted third party to deliver and manage the credentials used for the au-thentication. In both cases, the authentication architecture can be hierarchical, wherea multi-level architecture is used to handle the authentication procedure, or flat, whereno hierachical structure is used to manage the authentication procedure. The proposalin [30] is an example of a distributed approach used for privacy-preserving authentica-tion in Vehicular ad hoc networks (VANETs) for the Internet of Vehicles (IoV) use case.The proposed protocol is based on a technique based on multiple trusted authority andone-time identity-based aggregate signature (OTIBAS), and multiplicative secret shar-ing (MSS). This approach promises to be more practical, since it requires only realistictamper-proof devices (TPD).
_____________________________________________________________________________________ CNIT Technical Report-05 ꟷ Internet of Things: Technologies, Challenges and Impact
147

3.4 Key management protocols for authentication procedures
Let us consider a scenario in which two entities want to communicate with each other.Three different authentication procedures can take place: (i) One-way Authentication, ifonly one entity will authenticate itself to the other, while the other still remains unau-thenticated; (ii) Two-way Authentication, if both the entities authenticate each other; and(iii) Three-way Authentication, if there is also a central authority that authenticates thetwo parties separately and then helps them to mutually authenticate themselves. One ofthe main concerns in authentication procedures is the management of the keys involvedin the process. Several protocols and strategies, the so called KMPs, have been proposedin the recent literature to tackle this issue [22]. A first classification of them is performedon the basis of the methodology adopted for the secure delivery of the keys, that canbe based on key transport mechanisms to securely transfer a secret key generated byone party to all the other parties, or it is derived by all the parties as a function of acommon information. Another classification of KMPs can be done on the basis of thecryptographic primitive adopted by the protocol, that determines the way the keys aremanaged. Schemes tackling this issue are focused on the pre-distribution of a symmetrickey which is shared among all the parties, or schemes based on an asymmetric key thatfollow the rules of Public Key Cryptography (PKC) and ensure confidentiality, authen-tication, non-repudiation and integrity, but require high computational effort [22]. Oneof the goals of authentication mechanisms is to bind the key(s) with the identity of adevice. It is noteworthy that some protocols provide implicit authentication, some othersnot. The authentication mechanisms can adopt identity-based authentication, PKI, orcertificate-based authentication [22].
Among the certificate-based authentication schemes, an interesting approach is pre-sented in [31]. This study addresses the problem of public key authentication and keyagreement by exploiting implicit certificates. The authors propose a KMP that inte-grates implicit certificates with a standard elliptic curve Diffie-Hellman exchange, andperforms authentication and key derivation. This approach, when applied to sensor net-works, guarantees maximal airtime savings and efficient protection against replay attacks.Another promising approach for key management in IoT scenarios is the use of blockchains,as testified by [32, 33]. In [32] the potential of the blockchain technology is discussed toprovide IoT security. In [33] a key agreement methodology integrating the blockchaintechnology is proposed for the IoT scenario. Blockchain is used to store X.509 certificatesrelated to the initial fixed public keys of devices, to publish new ephemeral public keys,and to help the verification of the authenticity of ephemeral public keys without sendingsignatures and additional X.509 certificates. In this way a low communication overhead,a limited energy consumption and acceptable latencies are guaranteed.
3.5 Hardware-based schemes
In some cases, the authentication process might require the use of physical characteristicsof the hardware itself. Based on this concept, the authentication process can be:
• Implicit hardware-based : it uses the physical characteristics of the hardware toenhance the authentication such as Physical Unclonable Function (PUF) or TrueRandom Number Generator (TRNG).
148_____________________________________________________________________________________
Security and privacy in the IoT: how to enforce standard communication ...

• Explicit hardware-based : it is based on the use of a Trusted Platform Module (TPM),that is a chip that stores and processes the keys used for hardware authentication.
Examples of hardware-based approaches are [29,34,35]. The hardware-based approachpresented in [34] uses a hardware fingerprint to authenticate IoT devices with its PUFs.A software model of the PUF is also derived through Machine Learning based attackson PUF. Other PUF-based algorithms for IoT devices are presented and implemented in[35]. They use PUF-based elliptic curve for device enrollment, authentication, decryption,and digital signature. In [29] the proposed authentication scheme is based on the RSAalgorithm with the use of Trusted Platform Module (TPM).
A schematic representation of the different authentication approaches described aboveis summarized in Table 2.
Approach Use Case Communication WorkTechnologies
Identity-based Vehicularcommunications not specified [24]
Smart Grid not specified [25]Token-based IoS not specified [27]
WSN not specified [28]Non-token based M2M not specified [29]
Implicit Certificates WSN IEEE 802.15.4 [31]Blockchain-based generic IoT Wi-Fi [33]
Distributed IoV not specified [30]Hardware-based generic IoT ZigBee [34]
not specified [35]not specified [29]
Table 2: Approaches used in the scientific literature
4 Access control techniques in IoT
Traditional access control models have focused on closed systems where all users are knownand primarily utilize a server-side reference authorization entity within the system. Thecomplexity and the heterogeneity of an IoT environment collapse the entire authoriza-tion architecture exploited until now. Most of the IoT technologies do not implementfine-grained access control mechanisms directly into the standard. In fact, they rely onan on-off mechanism in which authentication and authorization are coupled together. In-deed, the models that will be described in the sequel are frequently implemented in theupper layers of the protocol stack. Recent works such as [36] highlight that the recentresearch trend is moving towards the design of approaches that embrace the decouplingbetween authorization and authentication, a fine-grained authorization, the protectionagainst collusion attacks, a time-limited authorization, the protection of user privacy,the revocation access rights and the support of offline authorization. According to [37],existing approaches can be classified in Role-Based Access Control (RBAC), Attribute-
_____________________________________________________________________________________ CNIT Technical Report-05 ꟷ Internet of Things: Technologies, Challenges and Impact
149

Based Access Control (ABAC), Usage CONtrol (UCON), Capability-Based Access Con-trol (CapBAC), Organizational-Based Access Control (OrBAC), and other models. Thefollowing subsections provide an analysis of some innovative studies and models designedin the access control security field. Then a brief classification of some innovative accesscontrol schemes can be found in Table 3.
4.1 Role-Based Access Control (RBAC) models
RBAC relies on the pair role/permission according to which users inherit the permis-sions assigned to the roles they have. Roles are often structured hierarchically, so thatthe inheritance of permission between different roles is clearly defined. An explanationof RBAC models and concepts can be found in [38]. Specifically, a RBAC-based modelhas four principal components: users, roles, permissions and sessions. Firstly, each userreceives one or more roles, that are named job functions within the organization, and thatdescribe the authority and responsibility conferred on a member of the roles; this is calledUser Assignment relationship. Usually, each role can receive one or more permissions,and this is called as the Permission Assignment relationship. Finally, a user may estab-lish one or more sessions in which he/she can activate a subset of roles he/she belongsto. Moreover, advanced models introduce features like Role Hierarchies and constraints.Using an RBAC approach a security administrator assigns the appropriate permissionsfor the role according to the characteristics and context of IoT devices, and specifies anappropriate range for a user according to his role. This kind of model allows sophisti-cated context-based services and a dynamic rights management [37]. An extension oftraditional RBAC systems can be integrated in medical environments based on IEEE802.15.4, where context-aware capabilities are exploited in a complete distributed accesscontrol architecture. In this approach a two-layer context-aware role-based access systemis used. It encompasses a data layer that comprises all the information required for accesscontrol decisions and an engine layer that manages the access control decisions on thedisclosure of medical data or on the access to the sensors of a Patient Area Network [39].
4.2 Attribute-Based Access Control (ABAC) models
ABAC is an access control technique where resource access is granted depending on theattributes of subjects, objects, actions and the environment related to a request. Policiesand access requests are defined in terms of required and owned attribute. The access rightto a resource is determined by comparing the attributes in the request with the attributesin the policy. ABAC models often provides constructs to combine policies authored bydifferent stakeholders and mechanisms to solve conflicts that can arise from these poli-cies [40]. More in detail, the logical actors involved in an ABAC model are: AttributeAuthorities (AA), Policy Enforcement Point (PEP), Policy Decision Point (PDP), andPolicy Administrator Point (PAP). AA is responsible for binding attributes to an entity ofinterest; PEP manages the authorization request and enforces the corresponding decisions;PDP is responsible for evaluating the applicable policies and making the authorizationdecision; PAP creates and manages the access control policies. ABAC can be integratedwithin larger frameworks in order to achieve mutual authentication between user andnodes (e.g. ECC-based authentication) and fine-grained access control in Wireless Sensor
150_____________________________________________________________________________________
Security and privacy in the IoT: how to enforce standard communication ...

Networks (WSNs) [37]. According to [39], ABAC is more suitable and used in environ-ments encompassing constrained devices; in fact, ABAC can also be built in REST-basedarchitectures of low powered devices and CoAP clients [37]. On the same line, an ABACscheme can be implemented to address the lightweight, scalability, decentralization, policydistribution and management requirements in a REST-based environment [41]. Moreover,incorporating a semantic model (e.g an ontology) this approach enables new applicationsto be developed independently from the concrete environment so that the supported pro-tocol suite can be amplified. Exploiting the benefits of the Software Defined Network(SDN) technology in Intelligent Transportation Systems (ITS), ABAC can enable a com-plete distributed approach for authentication and authorization purposes. This approachdeploys PAP in the cloud, whereas the other components of the access control systemare deployed in edge of the network [39]. ABAC is also suitable for the Fog Comput-ing paradigm in IoT for healthcare systems, where all the access control components arespread through the cloud, fog and sensing layers. The main benefits of the distribu-tion are to minimize latency and improve availability while preserving data security [42].A multi-authority access control scheme for IoT can be suitable also for federated andcloud-assisted Cyber-Physical Systems [36]. The approach is based on the ABAC logicand realized through the decentralized multi-authority ciphertext policy attribute-basedencryption algorithm. Several security issues can be found, like the decoupling betweenauthentication and authorization, fine-grained, offline, and time-limited authorization,protection against collusion attacks, access rights revocation, and user privacy [42].
4.3 Usage CONtrol (UCON) models
Similarly to ABAC, UCON allows the definition of resource access policies through sub-jects and objects attributes and constraints regarding the environment. Moreover, itallows the specification of two additional properties that are mutability of attributes andcontinuity of decision [43]. More specifically, there are six principal components: subjectsand their attributes, objects and their attributes, rights, authorizations, obligations andconditions. An authorization grants or denies an access based on the subject and objectattributes, obligations are actions that have to be performed during an access and con-ditions are constraints linked to environment’s state, which are uncorrelated to actors’attributes. Moreover, the most important difference between UCON and the other accesscontrol techniques in IoT is the possibility to specify the previous cited properties of mu-tability and continuity, i.e., object attributes can be modified as a result of an access, andan access policy can be enforced not only before the access but also during the period inwhich the access is performed. UCON in IoT can allow a cross-layer access control basedon fuzzy theory that concerns in a network layer modeling, the approach gives the role ofsubject in the usage control to a service in the application layer, and defines the objectas a device in the sensing layer [39]. Based on UCON integrated with Capability-BasedAccess Control, an hybrid access control model in IoT scenarios and cloud computing canbe built, as shown in [44]. The architecture is built based on SDN and Network FunctionVirtualization (NFV); it allows to authorize legitimate IoT entities to access resourcesand to ensure better security of these networks. The proposed architecture integratesboth authorization and authentication capabilities, so that authorized IoT devices andusers can not only access the required data based on the level of trust, but they areauthenticated as well.
_____________________________________________________________________________________ CNIT Technical Report-05 ꟷ Internet of Things: Technologies, Challenges and Impact
151

4.4 Capability-Based Access Control (CapBAC) models
CapBAC models are based on a ticket, or token, held by some entity which grants certainpermissions. Usually, it relies on an Access Control Matrix , which can be seen as anevolved Access Control List (ACL) [45]. More in detail, the CapBAC architecture ele-ments are: a resource that will be accessed, an authorization capability that details thegranted rights, a capability revocation able to inform the service in charge of managingthe resource that specific capabilities have to be considered no more valid, a PDP thatmanages resource access request validation, a resource manager that is the service thatchecks the acceptability of the capability token received along to the resource request,and a revocation service that manages the capability revocations. The combination ofACL, CapBAC, RBAC, Organizational-Based Access Control (explained in the next sub-section), ABAC and UCON produces an authorization scheme which is transparent, userfriendly, fully decentralized, scalable, fault tolerant and compatible with a wide range ofaccess control models that can also leverage on Blockchain-based architecture for IoT ac-cess authorizations [39]. For IoT enabled healthcare in a WiFi and Bluetooth Low Energynetwork the integration of RBAC, ABAC and CapBAC can provide a fine-grained andflexible authorization scheme. This approach is aimed to generate the least number ofpolicies that need to be managed, in fact the parameterization of capabilities allows pol-icy specifications to be applied to multiple user-thing relationships without more policydevelopment, while the use of attributes provides a fine-grained control [46].
4.5 Organizational-Based Access Control (OrBAC) models
OrBAC has been developed in order to extend RBAC in the implementation of a moreflexible approach and a new abstraction layer. Each security policy is defined for andby one or more organizations. Thus, the policies are completely parameterized to givethe possibility of handling simultaneous several security policies associated with differentorganizations. Specifically, the most important entity is the Organization that can beseen as an organized group of active entities, i.e. subjects or entities playing a specificrole. Moreover, a Subject is an active entity while the entity Object mainly covers inac-tive entities such as data files or records. Security policies specify the authorized accessto inactive entities by active entities and regulate the actions carried out in the systemby a set of permissions, prohibitions, obligations and recommendations. Each of theseelements define a relationship between the main components of OrBAC that are Organi-zation, Role (that is how organization is employing subject) Context, View (that refersto how Organization is using objects) and Activity (that specifies how organization isperforming actions) [47]. An example of hybrid centralized-distributed approach is foundin [39], where a cross-domain access control for IoT environment is designed. It relieson abstraction layers that distribute processing between constrained and less constraineddevices, indeed the model is based on the partitioning of the access control process intofunctional layers depending on the capabilities offered to each one [39]. Deployed onABAC and OrBAC is the Pervasive-Based Access Control that exploits the abstractionconcept of OrBAC and the concept of attributes of ABAC [48]. It also introduces a col-laborative layer that may rely on distributed structure based on blockchain. The resultis a proactive, multi-layer model that enables the smart use of attributes and existingabstract entities [48].
152_____________________________________________________________________________________
Security and privacy in the IoT: how to enforce standard communication ...

Approach Use case Communication WorkTechnologies
RBAC Medical environment IEEE 802.15.4 [39]ABAC generic IoT not specified [37,41]
Healtcare Systems not specified [42]Smart Home ZigBee [39]
Intelligent Trasporation Systems not specified [39]Multi-authority federated platforms not specified [36]
UCON generic IoT not specified [39,44]CapBAC generic IoT not specified [39]
Healthcare Systems WiFi, BLE [46]OrBAC generic IoT not specified [39,48]
OAuth-based generic IoT IEEE 802.15.4 [39]generic IoT not specified [49]
UMA-based IoT devices and Intelligent agents not specified [39]Trust-Based Environment Monitoring not specified [39]SDN-based Smart Home not specified [50]Social-based generic IoT not specified [39]
Table 3: Some innovative access control schemes in IoT
4.6 Other models
There are several studies about the integration and the extension of well-known accesscontrol schemes into IoT environments. Examples are Extensible Access Control MarkupLanguage (XACML) and User-Managed Access (UMA), which derives from the OpenAuthorization (OAuth) 2.0 framework. These schemes are already employed in otherscenarios, but they have also been extended for IoT environments [37]. The OAuthmodeling into IoT is often based on the lightweight protocol utilization (e.g. MQTT3.1 or CoAP) through authorization delegation to third party entity. The behaviourof this approach in IEEE 802.15.4 networks shows that this scheme can increase theenergy consumption, but other issues, like memory footprint and dynamic configurationcapabilities, make the implementation of this kind of framework preferable. Moreover,a scheme that tries to make access control policies independently from the nature ofthe IoT entities can allow an easy migration of the policy concept to communicationamong agents and a better management of different roles and permissions [39]. An UMA-based model can also provide a unified access control scheme for an heterogeneous hybridarchitecture of IoT devices and intelligent agents [39]. A flexible authentication andauthorization framework for IoT leveraging OAuth, different token formats, and the IoTprotocol suite can be designed as testified in [49]. The core element in this approachis the gateway that is in charge of implementing OAuth authorization functionalitiesand collects data taking into account the limited capabilities of constrained devices. Asolution based on cryptographic protection can achieve access control, but it createsoverhead in terms of time and energy consumption. For this reason a Fuzzy approachof trust management can meet the IoT requirements. An energy efficient solution canbe found by joining the Trust-Based Access Control paradigm with the notion of trust
_____________________________________________________________________________________ CNIT Technical Report-05 ꟷ Internet of Things: Technologies, Challenges and Impact
153

levels for identity management [39]. An access control in smart home environments basedon REST architecture can also be realized based on existing social structures and ACL.In such approach, policy configurations are automatically assigned to users based on thesocial relationship between the home owner and the user, which is inferred based on asocial network graph information or phone usage information [39]. Static and dynamicaccess control schemes based on the SDN framework can also be found to enhance thesmart home IoT security [50]. This approach allows the manufacturers to enforce theleast privileged policy for IoT, to reduce the risk associated with exposing IoT to theInternet and enables users to customize IoT access based on social and contextual needs(e.g. allowing only LAN access to the IoT through the user mobile terminal), to reducethe attack surface within the network.
5 Anomaly and intrusion detection techniques in IoT
Intrusion Detection System (IDS) in IoT is a very hot topic on which several researchgroups are working on; in fact, a huge amount of approaches and architectures exists onthis topic. IDSs are mainly categorized into Host IDSs (HIDS), designed to be imple-mented on a single system, and Network IDSs (NIDSs) that gather information aboutincoming and outgoing traffic from the network, to protect a system from intrusions thatcould harm it. In an IoT environment NIDSs are seen as more suitable for effectiveanomaly detection. This is counterbalanced by the excess of resource consumption re-quired, which is a disadvantage if seen on resource constrained IoT nodes [51]. Moreover,different detection techniques are developed, based on several attack types and networklayers, but none of them appears to be comprehensive in terms of attack type detected,wireless technologies, and networking layers. In addition, due to the open and insecurephysical layer, implementing an IDS on any IoT node itself can never guarantee its re-liability. According to [51] the main goals common to the majority of IDSs developedfor IoT are high performance in terms of true positive and false negative, a lightweightimplementation and a real time anomaly and intrusion detection. Due to the enormousnumber of studies on this topic in the following sections an overview of innovative detec-tion techniques is given, then an analysis of architectural features of IDSs is presentedand finally a summary is presented in Table 4, that shows the researching trend of IDSsin IoT in terms of detection types, technologies and architectures.
5.1 Detection types
Different types of anomaly detection exist, each with pros and cons in terms of accuracy,detected attacks and feasibility on constrained IoT nodes. Due to heavy resource require-ments of typical existing detection methods, that are not well suited to the constrainedresources of IoT embedded devices, several adapted (but also novel) approaches have beenproposed in literature [52]. Specifically, detection techniques can be classified in misuse,anomaly, specification and hybrid approaches.
154_____________________________________________________________________________________
Security and privacy in the IoT: how to enforce standard communication ...

5.1.1 Misuse detection techniques
Misuse detection techniques deal with monitoring activities such as network traffic orsystem-level actions that are compared to signatures within a database of malicious codepatterns and intrusions, to detect well-known attacks. Misuse techniques are difficult toadapt in the IoT scenarios, due to the resource constraints of the involved devices thatmake infeasible the storage of an exhaustive database of signatures. This explains whythese techniques are mostly seen within centralized architectures, which provide greaterresilience against subversion, but could maintain an incomplete vision of network activityif the architecture is not well organized. Moreover, the ever increasing prominence ofzero-day attacks in IoT networks nullifies their effectiveness. Several optimized patternmatching algorithms have been designed for IoT, often implemented through a remoteNIDS [52, 53]. For Bluetooth and 6LoWPAN technologies auxiliary shifting method andthe early decision scheme successfully reduce the workload by skipping a large numberof unnecessary matching operations [52]. Moreover and IDS can be combined with othersecurity modules such as an Intrusion Preventions System (IPS) or a Network SecurityMonitoring (NSM) in order to fit better in IoT environment. A framework capable ofdetecting Denial of Service (DoS) attacks in 6LoWPAN-based networks can also be de-veloped [53].
5.1.2 Anomaly detection techniques
In anomaly-based intrusion detection systems, a normal data pattern is created based ondata from normal users, and is then compared with current data patterns. Specifically, thecurrent activity is compared against an activity model, and gaps between current activityand the model are classified as ambiguous, to provide an online way to detect anoma-lies. Anomaly-based detection methods are attractive in IoT due to their smaller memoryfootprint, and are proved to be more effective on typical constrained IoT protocols. Ananomaly detection IDS can rely on several strategies, such as data mining, protocol, pay-load, signal processing or statistical models, to detect intrusions [54]. Anomaly detectiontechniques in IoT are often designed based on power usage of devices such as a systembased on energy consumption and battery exhaustion monitoring in ZigBee network inwhich energy consumed by the nodes in normal behaviour is used to build a model. Onthe same line, smart hardware can be used to optimize the detection, for example the ex-ploitation of smart batteries to create a model, but a tradeoff between the battery chargelife and the device performance must always be found. Leveraging the trust managementconcerning the monitoring of activities in a network, a network trust based IDS for WSNcan be developed. This approach builds a trust regulation table which is used as thebaseline threshold for detecting several attacks [52]. Moreover, the monitoring of thenumber of packets shared between nodes in 6LoWPAN networks allows wormhole detec-tion. In this scheme, the router is used for heavy processes, while the IoT nodes collectneighbor information. Another interesting lightweight approach is the feature selectionby bit-pattern [53]. A direct representation of the feature space for the discriminationfunction can be used, where the detector can make a fast packet classification decision.Another interesting approach consists of a high performance, real time IDS that exploitsComplex Event Processing (CEP), which has the benefit of an ability to identify complexpatterns via real-time data processing [54].
_____________________________________________________________________________________ CNIT Technical Report-05 ꟷ Internet of Things: Technologies, Challenges and Impact
155

5.1.3 Specification based techniques
This approach combines attributes of anomaly and misuse detection, and is advantageousbecause of a high accuracy, even if it introduces a delay in the creation of a signaturedue to the human interaction, which causes the process not to be timely and cannotbe suitable for IoT [52]. The detection of anomalous activity derives from a pre-definedmodel, based on explicit policies that determine the normal behavior of the system. Thesesecurity specifications are designed based on the applications and system-specific securityparameters. Thus, operating patterns that are not included in the system normal behaviorare considered as an anomaly or security violation. To detect sinkhole attacks and toautomatically isolate malicious nodes, each node can act as a monitoring node to monitorthe operation of all of its neighbors [53]. To this end, the network is divided in severalclusters and data are periodically sent to the IDS agents [54]. A finite state machinecan also be used to model the system state. Each IoT node detects intrusions from localtrace and neighboring IDS agents cooperatively participate in global intrusion detectionactions when an anomaly is detected.
5.1.4 Hybrid based techniques
IoT technologies are wide and varied, and the classification of detection techniques andtechnologies can be difficult. A possible path to be followed is the combination of some ofthe abovementioned techniques. Accordingly, different IDSs can be integrated with theaim to maximize the advantages and minimize the limitations of the single mechanisms[53–56]. A specification-based IDS in the IoT nodes can be combined with an anomaly-based IDS in the root node in 6LoWPAN network. The main feature of this system is thereduction in the number of communication messages due to the lack of additional controlmessages, and the applicability of this system to large-scale networks [54]. Designingmanually a specific hybrid technique for each IoT application, protocol and technologyis infeasible, so intelligent techniques focused on Machine Learning (ML) and ArtificialIntelligence, specifically on Deep Learning (DL) algorithms, have been adopted to designoptimal IDS for IoT, such as a Supervised Fuzzy C-Means IDS or a self-learning IDSusing Autoencoders (AE), that automatically learns new attacks [53]. The huge numberof ML algorithms can be combined into innovative technologies already integrated inIoT, such as an SDN-based IDS leveraging Restricted Boltzman machine (RBM) or DeepNeural Network (DNN), in which the IDS analyzes the traffic over the controller, or aLong-Short Term Memory (LSTM) integrated with a Recurrent Neural Network (RNN).Moreover, in the Industrial IoT scenario, a Deep Auto Encoder (DAE) can determine thehyper-parameters of a DNN [55]. Goals and challenges of this kind of IDS and a report ofthe most common databases adopted to test and validate these approaches can be foundin [56].
5.2 Architecture types
A variety of IDS architectures exist. Therefore, it is necessary to evaluate the correctarchitectural implementation that can exploit better the detection capabilities providedby the approaches described in the previous sections. According to the classificationpresented in [52], an IDS can be:
156_____________________________________________________________________________________
Security and privacy in the IoT: how to enforce standard communication ...

Detection type Architecture Communication WorkTechnologies
Misuse Centralized BLE [52]Centralized not specified [53]
Anomaly Centralized ZigBee [52]Distributed BLE, WiFi [52]Distributed not specified [52]Hierarchical not specified [53]Centralized not specified [53]Distributed BLE [54]
Specification Hierarchical not specified [54]Distributed not specified [53]
Hybrid Hierarchical not specified [54]Distributed not specified [53,55]
Table 4: A summary of innovative IDSs in IoT environment
• Centralized: Centralized IDSs monitor an IoT system from a single location andprocess data on an external agent. This has the advantage of not imposing anoverhead on the sensing nodes. Moreover these systems do not create additionalpoints for subversion and allow for greater depth of processing. However, by movingthe data analysis to an external device, they create a single possible point of failure[52].
• Distributed: In a distributed IDS, each physical object contributes to the IDSwork and implements a part of intrusion detection routine. Moreover, these IDSsmust meet the resource constraints of the IoT nodes [53]. A common approach isthe implementation of an anomaly detection system employing a distributed archi-tecture but in a watch-dog based manner, that is, a subset of the network nodeshave to monitor the other nodes [52].
• Hierarchical: Hierachiacal architectures are IDSs in which some nodes have agreater responsibility for processing than others. Decentralized architectures areoften grouped under hierarchical architectures. Such systems fit very well acrosslarge and heterogeneous IoT networks, although there are many issues which mustbe considered regarding the system complexity [52].
6 Conclusions
In this contribution the most representative Internet of Things-oriented definitions of secu-rity services have been presented, highlighting the impact of their implementation on thealready standardized communication protocols. In addition, some interesting approaches,protocols and schemes peculiar of the IoT scenarios have been analyzed, addressing theuncovered security services and taking into account authentication, authorization, keymanagement and intrusion detection mechanisms, to provide an overview of the secu-rity services that can be developed or adapted to different IoT-based architectures and
_____________________________________________________________________________________ CNIT Technical Report-05 ꟷ Internet of Things: Technologies, Challenges and Impact
157

multi-domain/multi-authority ecosystems.
References
[1] N. Neshenko, E. Bou-Harb, J. Crichigno, G. Kaddoum, and N. Ghani, “DemystifyingIoT Security: An Exhaustive Survey on IoT Vulnerabilities and a First EmpiricalLook on Internet-Scale IoT Exploitations,” IEEE Communications Surveys & Tuto-rials, vol. 21, no. 3, pp. 2702–2733, thirdquarter 2019, doi: 10.1109.
[2] V. Hassija, V. Chamola, V. Saxena, D. Jain, P. Goyal, and B. Sikdar, “A Sur-vey on IoT Security: Application Areas, Security Threats, and Solution Archi-tectures,” IEEE Access, vol. 7, pp. 82 721–82 743, Jun. 2019, doi: 10.1109/AC-CESS.2019.2924045.
[3] M. M. Alam, H. Malik, M. I. Khan, T. Pardy, A. Kuusik, and Y. Le Moullec,“A Survey on the Roles of Communication Technologies in IoT-Based PersonalizedHealthcare Applications,” IEEE Access, vol. 6, pp. 36 611–36 631, Jul. 2018, doi:10.1109/ACCESS.2018.2853148.
[4] L. Chettri and R. Bera, “A Comprehensive Survey on Internet of Things (IoT)Towards 5G Wireless Systems,” IEEE Internet of Things Journal, pp. 1 – 18, Oct.2019, doi: 10.1109/JIOT.2019.2948888.
[5] I. S. Association, “IEEE Standard for Information technology—Telecommunicationsand information exchange between systemsLocal and metropolitan area net-works—Specific requirements,” Nov. 2016, part 11: Wireless LAN Medium AccessControl (MAC) and Physical Layer (PHY) Specifications.
[6] A. H. Lashkari, M. Mansoor, and A. S. Danesh, “Wired equivalent privacy (WEP)versus Wi-Fi protected access (WPA),” 2009 International Conference on SignalProcessing Systems, pp. 445–449, 2009.
[7] Z. Alliance, “ZigBee Specification,” Aug. 2015, zigBee Document 05-3474-21.
[8] W. R. L. Xueqi Fan, Fransisca Susan and S. Li, “Security Analysis of Zigbee,” May2017.
[9] J. Padgette, J. Bahr, M. Batra, M. Holtmann, R. Smithbey, L. Chen, and K. Scar-fone, “Guide to Bluetooth Security,” NIST Special Publication 800-121, May 2017.
[10] https://www.sigfox.com/. Last accessed: 8 Jan., 2019.
[11] J. P. S. Sundaram, W. Du, and Z. Zhao, “A Survey on LoRa Networking: ResearchProblems, Current Solutions and Open Issues,” IEEE Communications Surveys &Tutorials, Oct. 2019, doi: 10.1109/COMST.2019.2949598.
[12] https://lora-alliance.org/. Last accessed: 8 Jan., 2019.
[13] M. Chen, Y. Miao, Y. Hao, and K. Hwang, “Narrow band internet of things,” IEEEAccess, vol. 5, pp. 20 557–20 577, Oct. 2017.
158_____________________________________________________________________________________
Security and privacy in the IoT: how to enforce standard communication ...

[14] H. Shariatmadari, R. Ratasuk, S. Iraji, A. Laya, T. Taleb, R. Jantti, and A. Ghosh,“Machine-type communications: current status and future perspectives toward 5Gsystems,” IEEE Communications Magazine, pp. 10–17, Sep. 2015.
[15] G. A. Akpakwu, B. J. Silva, G. P. Hancke, and A. M. Abu-Mahfouz, “A Survey on 5GNetworks for the Internet of Things: Communication Technologies and Challenges,”IEEE Access, vol. 6, pp. 3619–3647, 2018, doi: 10.1109/ACCESS.2017.2779844.
[16] https://www.3gpp.org/release-15. Last accessed: 8 Jan., 2019.
[17] ETSI, “5G; Security architecture and procedures for 5G System (3GPP TS 33.501version 15.1.0 Release 15),” Jul. 2018.
[18] https://www.ingenu.com/. Last accessed: 8 Jan., 2019.
[19] M. Weyn, G. Ergeerts, R. Berkvens, B. Wojciechowski, and Y. Tabakov, “DASH7alliance protocol 1.0: Low-power, mid-range sensor and actuator communication,”2015 IEEE Conference on Standards for Communications and Networking (CSCN),pp. 54–59, Dec. 2015.
[20] N. Sastry and D. Wagner, “Security considerations for IEEE 802.15. 4 networks,”Proceedings of the 3rd ACM workshop on Wireless security, pp. 32–42, Oct. 2004.
[21] http://www.weightless.org/. Last accessed: 8 Jan., 2019.
[22] M. Malik, M. Dutta, and J. Granjal, “A Survey of Key Bootstrapping ProtocolsBased on Public Key Cryptography in the Internet of Things,” IEEE Access, vol. 7,pp. 27 443–27 464, 2019, doi: 10.1109/ACCESS.2019.2900957.
[23] M. El-hajj, M. Chamoun, A. Fadlallah, and A. Serhrouchni, “Taxonomy ofauthentication techniques in Internet of Things (IoT),” pp. 67–71, 2017, doi:10.1109/SCORED.2017.8305419.
[24] L. Zhang, C. Hu, Q. Wu, J. Domingo-Ferrer, and B. Qin, “Privacy-preserving vehic-ular communication authentication with hierarchical aggregation and fast response,”IEEE Transactions on Computers, vol. 65, no. 8, pp. 2562–2574, Aug. 2015.
[25] H. Nicanfar, P. Jokar, and V. C. Leung, “Smart grid authentication and key manage-ment for unicast and multicast communications,” 2011 IEEE PES Innovative SmartGrid Technologies, pp. 1–8, Nov. 2011.
[26] T. Nandy, M. Y. I. B. Idris, R. M. Noor, M. L. M. Kiah, L. S. Lun, N. B. A. Juma’at,I. Ahmedy, N. A. Ghani, and S. Bhattacharyya, “Review on Security of Internet ofThings Authentication Mechanism,” IEEE Access, vol. 7, pp. 151 054–151 089, Oct.2019, doi: 10.1109/ACCESS.2019.2947723.
[27] M. Jan, P. Nanda, M. Usman, and X. He, “PAWN: a payload-based mutual au-thentication scheme for wireless sensor networks,” Concurrency and Computation:Practice and Experience, vol. 29, no. 17, 2017.
_____________________________________________________________________________________ CNIT Technical Report-05 ꟷ Internet of Things: Technologies, Challenges and Impact
159

[28] M. Turkanovic, B. Brumen, and M. Holbl, “A novel user authentication and keyagreement scheme for heterogeneous ad hoc wireless sensor networks, based on theInternet of Things notion,” Ad Hoc Networks, vol. 20, pp. 96–112, Sep. 2014.
[29] T. Kothmayr, C. Schmitt, W. Hu, M. Brunig, and G. Carle, “A DTLS based end-to-end security architecture for the Internet of Things with two-way authentication,”37th Annual IEEE Conference on Local Computer Networks-Workshops, pp. 956–963, 2012.
[30] L. Zhang, Q. Wu, J. Domingo-Ferrer, B. Qin, and C. Hu, “Distributed aggre-gate privacy-preserving authentication in VANETs,” Distributed aggregate privacy-preserving authentication in VANETs, vol. 18, no. 3, pp. 512–526, Jul. 2016.
[31] S. Sciancalepore, G. Piro, G. Boggia, and G. Bianchi, “Public key authentication andkey agreement in IoT devices with minimal airtime consumption,” IEEE EmbeddedSystems Letters, vol. 9, no. 1, pp. 1–4, Mar. 2016.
[32] S. M. Muzammal and R. K. Murugesan, “A study on secured authentication andauthorization in internet of things: Potential of blockchain technology,” in Advancesin Cyber Security (ACeS 2019), vol. 1132, Jan. 2020, pp. 18–32.
[33] P. Tedeschi, G. Piro, and G. Boggia, “When Blockchain Makes Ephemeral Keys Au-thentic: a Novel Key Agreement Mechanism in the IoT World,” 2018 IEEE GlobecomWorkshops (GC Wkshps), pp. 1–6, 2018.
[34] D. Mukhopadhyay, “PUFs as promising tools for security in Internet of things,”IEEE Design & Test, vol. 33, no. 3, pp. 130–115, Jun. 2016.
[35] J. R. Wallrabenstein, “Practical and secure IoT device authentication using physicalunclonable functions,” 2016 IEEE 4th International Conference on Future Internetof Things and Cloud (FiCloud), pp. 99–106, Aug. 2016.
[36] S. Sciancalepore, G. Piro, D. Caldarola, G. Boggia, and G. Bianchi, “On the designof a decentralized and multiauthority access control scheme in federated and cloud-assisted cyber-physical systems,” IEEE Internet of Things Journal, vol. 5, no. 6, pp.5190–5204, Dec. 2018, doi: 10.1109/JIOT.2018.2864300.
[37] L. Cruz-Piris, D. Rivera, I. Marsa-Maestre, E. D. L. Hoz, and J. R. Velasco, “Access Control Mechanism for IoT Environments Based on Modelling Communica-tion Procedures as Resources,” Sensors, vol. 18, no. 3, pp. 1–21, Mar. 2018, doi:10.3390/s18030917.
[38] R. S. Sandhu, E. J. Coyne, H. L. Feinstein, and C. E. Youman, “Role-basedaccess control models,” Computer, vol. 29, no. 2, pp. 38–47, Feb. 1996, doi:10.1109/2.485845.
[39] S. Ravidas, A. Lekidis, F. Paci, and N. Zannone, “Access control in internet-of-things: A survey,” Journal of Network and Computer Applications, vol. 144, pp. 79– 101, 2019, doi: 10.1016/j.jnca.2019.06.017.
160_____________________________________________________________________________________
Security and privacy in the IoT: how to enforce standard communication ...

[40] E. Yuan and J. Tong, “Attributed based access control (abac) for web services,” inIEEE International Conference on Web Services (ICWS’05), July 2005, p. 569, doi:10.1109/ICWS.2005.25.
[41] G. Fedrecheski, L. C. C. De Biase, P. C. Calcina-Ccori, and M. K. Zuffo, “Attribute-based access control for the swarm with distributed policy management,” IEEETransactions on Consumer Electronics, vol. 65, no. 1, pp. 90–98, Feb. 2019, doi:10.1109/TCE.2018.2883382.
[42] S. Alnefaie, A. Cherif, and S. Alshehri, “Towards a distributed access con-trol model for iot in healthcare,” in 2019 2nd International Conference onComputer Applications Information Security (ICCAIS), May 2019, pp. 1–6,doi:10.1109/CAIS.2019.8769462.
[43] X. Zhang, F. Parisi Presicce, R. Sandhu, and J. Park, “Formal model and policyspecification of usage control,” ACM Trans. Inf. Syst. Secur., vol. 8, pp. 351–387,Nov. 2005, doi: 10.1145/1108906.1108908.
[44] A. Lohachab and Karambir, “Next generation computing: Enabling multilevel cen-tralized access control using ucon and capbac model for securing iot networks,” Feb.2018, pp. 159–164, doi: 10.1109/IC3IoT.2018.8668191.
[45] S. Gusmeroli, S. Piccione, and D. Rotondi, “A capability-based security approachto manage access control in the internet of things,” Mathematical and ComputerModelling, vol. 58, no. 5, pp. 1189 – 1205, 2013, doi : 10.1016/j.mcm.2013.02.006.
[46] S. Pal, M. Hitchens, V. Varadharajan, and T. Rabehaja, “On design of a fine-grainedaccess control architecture for securing iot-enabled smart healthcare systems,” Nov.2017, pp. 432–441, doi :10.1145/3144457.3144485.
[47] A. Kalam, R. Baida, P. Balbiani, S. Benferhat, F. Cuppens, Y. Deswarte, A. Miege,C. Saurel, and G. Trouessin, “Organization based access control,” July 2003, pp. 120– 131, doi: 10.1109/POLICY.2003.1206966.
[48] S. El Bouanani, M. A. El Kiram, O. Achbarou, and A. Outchakoucht, “Pervasive-based access control model for iot environments,” IEEE Access, vol. 7, pp. 54 575–54 585, 2019, doi: 10.1109/ACCESS.2019.2912975.
[49] S. Sciancalepore, G. Piro, D. Caldarola, G. Boggia, and G. Bianchi, “Oauth-iot: Anaccess control framework for the internet of things based on open standards,” July2017, doi: 10.1109/ISCC.2017.8024606.
[50] M. Al-Shaboti, I. Welch, A. Chen, and M. A. Mahmood, “Towards secure smarthome iot: Manufacturer and user network access control framework,” in 2018 IEEE32nd International Conference on Advanced Information Networking and Applica-tions (AINA), May 2018, pp. 892–899, doi: 10.1109/AINA.2018.00131.
[51] S. Hajiheidari, K. Wakil, M. Badri, and N. J. Navimipour, “Intrusion detection sys-tems in the internet of things: A comprehensive investigation,” Computer Networks,vol. 160, pp. 165 – 191, 2019, doi: 10.1016/j.comnet.2019.05.014.
_____________________________________________________________________________________ CNIT Technical Report-05 ꟷ Internet of Things: Technologies, Challenges and Impact
161

[52] E. Benkhelifa, T. Welsh, and W. Hamouda, “A Critical Review of Practices andChallenges in Intrusion Detection Systems for IoT: Toward Universal and ResilientSystems,” IEEE Communications Surveys Tutorials, vol. 20, no. 4, pp. 3496 – 3509,Fourthquarter 2018, doi: 10.1109/COMST.2018.2844742.
[53] A. Tabassum, A. Erbad, and M. Guizani, “A survey on recent approaches in in-trusion detection system in iots,” in 2019 15th International Wireless Communi-cations Mobile Computing Conference (IWCMC), June 2019, pp. 1190–1197, doi:10.1109/IWCMC.2019.8766455.
[54] M. F. Elrawy, A. Awad, and H. Hamed, “Intrusion detection systems for iot-basedsmart environments: a survey,” vol. 7, Dec. 2018, doi: 10.1186/s13677-018-0123-6.
[55] M. Ugurlu and I. Dogru, “A survey on deep learning based intrusion detection sys-tems,” in 2019 4th International Conference on Computer Science and Engineering(UBMK), Sep. 2019, pp. 223–228, doi: 10.1109/UBMK.2019.8907206.
[56] K. Costa, J. Papa, C. Lisboa, R. Munoz, and V. Albuquerque, “Internet of things: Asurvey on machine learning-based intrusion detection approaches,” Computer Net-works, vol. 151, Jan. 2019, doi: 10.1016/j.comnet.2019.01.023.
162_____________________________________________________________________________________
Security and privacy in the IoT: how to enforce standard communication ...

Abstract: The Social Internet of Things represents a distinctive paradigm for the realization of IoT solutions which relies on the integration of social networking technologies with machine-to-machine communications. Accordingly, objects are capable of interacting in a social way with external services to improve the efficiency and the trust in the communications. As a result, a social network involving objects, services and humans is created, which supports the social network nodes communications and the deployment of IoT applications. Whereas these are the major features, not all the research groups that work in this area converge on the same vision. In this article, we discuss the different views to highlight the common features and understand the rationales behind each view. We then present the major technologies involved in the implementation of this paradigm and the applications that are enabled. The paper concludes discussing the current challenges and the future directions.
_____________________________________________________________________________________ CNIT Technical Report-05 Internet of Things: Technologies, Challenges and Impact
163

silos effect
social networksInternet of Things exploiting the potentialities of social networking technologies to develop a decentralized approach to foster the interactions among objects that belong to communities of trillions of members
social networks among IoT objects
164_____________________________________________________________________________________
The Social Internet of Things: a Survey

Social Web of Objects
_____________________________________________________________________________________ CNIT Technical Report-05 Internet of Things: Technologies, Challenges and Impact
165

Social Internet of Things SIoT
Social Internet of Vehicle SIoV
166_____________________________________________________________________________________
The Social Internet of Things: a Survey

Social Internet of Industrial Things SIoIT
E-Health systems
Large-scale Smart Environments
Social Internet of Virtual Objects
_____________________________________________________________________________________ CNIT Technical Report-05 Internet of Things: Technologies, Challenges and Impact
167

168_____________________________________________________________________________________
The Social Internet of Things: a Survey

Table I. Major technologies exploited for the design and implementation of the SIoT solution and main benefits.
_____________________________________________________________________________________ CNIT Technical Report-05 Internet of Things: Technologies, Challenges and Impact
169

170_____________________________________________________________________________________
The Social Internet of Things: a Survey

_____________________________________________________________________________________ CNIT Technical Report-05 Internet of Things: Technologies, Challenges and Impact
171

friends
172_____________________________________________________________________________________
The Social Internet of Things: a Survey

_____________________________________________________________________________________ CNIT Technical Report-05 Internet of Things: Technologies, Challenges and Impact
173

http://social-iot.org
channels. read key write keywrite key
read key
channel
http://social-iot.org
Socialite
174_____________________________________________________________________________________
The Social Internet of Things: a Survey

Real World Level
Virtualization LevelSocial
Virtual Objects software agenttemplate
_____________________________________________________________________________________ CNIT Technical Report-05 Internet of Things: Technologies, Challenges and Impact
175

micro engines
channels
176_____________________________________________________________________________________
The Social Internet of Things: a Survey

_____________________________________________________________________________________ CNIT Technical Report-05 Internet of Things: Technologies, Challenges and Impact
177

mass adoption
virtual users
178_____________________________________________________________________________________
The Social Internet of Things: a Survey

_____________________________________________________________________________________ CNIT Technical Report-05 Internet of Things: Technologies, Challenges and Impact
179

IEEE Internet of Things Journal
IEEE Communications Letters
Computer Networks
Ph.D. dissertationACM
World Wide Web Conf.ACM
Workshop on Context Discovery and Data Mining
The Internet of Things
IEEE PERCOM
IFAC (International Federation of Automatic Control)
IFIP International Conference on Advances in Production Management Systems
2017 international symposium on wireless communication systems (ISWCS)
180_____________________________________________________________________________________
The Social Internet of Things: a Survey

IEEE Internet of Things Journal
2014 IEEE 10th International Conference on Wireless and Mobile Computing, Networking and Communications (WiMob)
Leveraging social notions to improve ID-to-locator mapping in IoT identity oriented networks 2018 IEEE 4th World Forum on Internet of Things (WF-IoT). IEEE
IEEE Communications Magazine
IEEE Networks
IEEE Access
Computers and Electrical Engineering
IEEE Internet Things J.
IEEE Access
IEEE 3rd World Forum on Internet of Things (WF-IoT)
FutureGeneration Computer Systems
21stAnnual IEEE International Symposium on Personal, Indoor and Mobile Radio Communications
IEEE3rd World Forum on Internet of Things (WF-IoT)
_____________________________________________________________________________________ CNIT Technical Report-05 Internet of Things: Technologies, Challenges and Impact
181

Proc. of 16th IEEE International Conference on Mobile Data Management
IEEE Internet of Things Journal
IEEE Internet of Things Journal
IEEE Internet of Things Journal
182_____________________________________________________________________________________
The Social Internet of Things: a Survey

Software Defined Fog/Edge Networking for Internet ofVehicles: a Services-Oriented Reference Architecture
Michele Bonanni, Francesco Chiti and Romano Fantacci
Department of Information Engineering
University of Florence, via di Santa Marta 3, I-50139 ITALY
Abstract: This chapter addresses an innovative architectural concept by integrating Soft-ware Defined Networking (SDN) and Network Function Virtualization (NFV) paradigms,together with Mobile Fog/Edge Computing (MFEC). In addition, we applied this refer-ence architectural model to the Internet of Vehicles (IoV) domain by addressing complexmobile Intelligent Transportation Services (ITSs) with stringent temporal and spatial re-quirements. To this purpose, we design the vehicular communications ecosystem accordingto a 5G vision, as it supports both Vehicle-to-Vehicle (V2V) and Vehicle-to-Infrastructure(V2I) links by means of the cellular-enabled Vehicle-to-Everything (V2X) interface. Inparticular, we focus on a generalized SDN-controlled handover which is capable to handlecomplex traffic patterns, i.e., supporting groups of mobile nodes, geocast information deliv-ering, and even the involvement of multiple eNBs. The idea behind our proposal is to pro-vide a complete ITS migration that seamlessly allows to move the virtualized service (i.e.,a VNF), requested by some vehicles, towards the most suited Fog/Edge Server (FESs).Finally, a strategy, called Swapping Migration, that can optimize both the resource uti-lization and availability, together with the Quality of Service and Experience (QoSE), hasbeen introduced. This could enable innovative services like complex and composite routeplanner, autonomous driving, Tactile Internet (TI) inspired vehicles controlling in a greenmobility perspective.
1 Introduction and State of Art
The ever-increasing number of vehicles and their densification within typical mega-citiespose a remarkable challenge to the automotive industry and to public administrationsin order to provide transportations safety and efficiency in a Smart City by relyingon smart cars [2]. To this purpose, the emphasis should be put on group intelligence,rather than on individual capabilities of a device, which is, in fact, constrained and notable to face time-varying and unpredictable operative conditions. Recently, informationand communication technologies (ICTs) have been regarded as the way to lead vehic-ular networks toward a revolutionary road. Connecting vehicles via Vehicular Ad-hocNetworks (VANET) represented an early attempt to support this vision, where closervehicles are allowed to communicate with each other via Vehicle-to-Vehicle (V2V) orVehicle-to-Infrastructure (V2I) interfaces to notify or collect traffic-related information,respectively [6][7]. Thanks to their high data rates and low latency communications, 5G
_____________________________________________________________________________________ CNIT Technical Report-05 ꟷ Internet of Things: Technologies, Challenges and Impact
183

Cellular Networks (CNs) represent a promising enabling technology for VANETs, andthe standardisation of the Vehicle-to-Everything (V2X) interface is paving the floor foradvanced vehicular services [13]. To extend VANETs capabilities, the Internet of Ve-hicles (IoV) concept has been proposed to network federate vehicles by heterogeneouscommunication systems with the aim at providing complex applications, mainly vehicle(automated) driving, urban traffic management, or even logistics [20]. IoV represents atypical application of Internet of Things (IoT) technology in Intelligent TransportationSystems (ITS) which allows data collecting and information sharing about vehicles, roadsand their surroundings [24]. Differently from IoT, whose main objective is the data-awareness of connected things, the IoV is mainly focused on the integration of vehiclesand humans. Based on the cooperation and communication, IoV can handle and processa large amount of data to improve the sustainability of complex vehicular applications,which can be classified as 1) Active road safety applications, 2) Traffic efficiency andmanagement applications and 3) Infotainment applications [1].
1. Active road safety applications: applications mainly employed to decrease the prob-ability of traffic accidents and the loss of life.
2. Traffic efficiency and management applications: applications used to improve thevehicle traffic flow, traffic coordination and traffic assistance.
3. Infotainment applications: applications focused on infotainment that can be obtainfrom locally or globally based services.
In addition, it is required a paradigm shift from the traditional Cloud Computing (CC)oriented toward hybrid architectures integrating Fog Computing (FC) and Networking(FCN) to support real-time and location-aware processing and control [12]. In particular,FCN relies on a set of Fog Servers (FSs)/Fog Nodes(FNs) generally deployed closer to theend users and able to provide ad hoc and opportunistic services, i.e., personalised in time,space, clients’ profile and, above all, context. As a consequence, FCN avoids to uploadall the vehicles and sensors data to a remote data center and therefore, communicationlatencies and network congestions are reduced. One of the most important challenges tobe faced when CN technology is adopted in this scenario is the specific vehicular mobilitypatterns. This requires more complex and effective handover policies, where not onlyusers, but also services are transferred among cells, to maintain service continuity andreal-time requirements. Network Function Virtualization (NFV) is a disruptive paradigmaccording to which, network functions become software applications, i.e., Virtual NetworkFunctions (VNFs), that can be instantiated on generic servers by means of Virtual Ma-chines (VMs) or containers. The latter approach only virtualises the Operating System(OS) without the need of a hypervisor; containers are consequently lighter than VM andpresent benefits in terms of boot-time and migration-time. VNFs can be dynamicallycreated/destroyed, migrated from one physical device to another and, finally, composedtogether to offer innovative services. This approach, previously introduced in CC, stillrepresents an open issue within the IoV [8] for what the vehicular VNFs placement andmigration among FSs are concerned. Specifically, the reference network architecture re-quires a decoupling from Data Plane (DP) and Control Plane (CP) to allow a Controllerto get a comprehensive view of the underlying network, and, hence, to apply specificpolicies, according to the Software Defined Networking (SDN) approach [18]. When SDN
184_____________________________________________________________________________________
Software Defined Fog/Edge Networking for Internet of Vehicles: a ...

is applied to IoV scenarios, it can provide several benefits in terms of re-programmability,agility, scalability, elasticity and flexibility. Moreover, it allows the automatic and fastdevelopment of network applications and complex services. The potential benefits of theSDN and FC application to the IoV scenario, especially with cellular connectivity, havebeen addressed in the literature. Firstly, an architecture, integrating FC and CC man-aged by SDN in order to reduce IoV latencies and support mobility, is proposed in [5].The authors in [14] presented a framework for vehicular CC in which vehicles togetherform a Cloud resource unit. This is used to handle a network slice at the WiFi AccessPoint (AP) in a densely crowded environment. Moreover, a methodology to share band-width and transmission opportunities of an AP dedicated to different slices is proposed.Khakimov et al. combined SDN and FC approaches in IoT ecosystem oriented frame-work in [17], where resources available in the OpenFlow Switches are not only used forforwarding functions but also for providing some limited services. A protocol architecturefor SDN based IoV, which allows data packets forwarding over V2V and V2X links, isproposed in [22]. Iqbal et al. presented in [15] a data analytic framework at the FogLayer of IoV reference model able to offer context-aware real-time and batch services atthe network edge. A scheme to support seamless handover between different computa-tion APs is presented in [10], which implicitly supports task pre-migration mechanismswhen the handover is expected to happen, but it is limited to low-to-medium mobilitypatterns. In [3], the SDN paradigm is applied to mobile networks in order to efficientlymanage mobility in the context of 5G or evolved LTE. A comprehensive overview of themigration techniques and a real Fog testbed is addressed in [19]. Li et al. proposed in [23]a QoS-aware approach based on the existing handover procedures to support real-timeservices, applying the service migration in a FC enabled cellular network under restric-tive hypotheses. In particular, each FS is associated with only one Base Station (BS),while its computation and storage resources are always considered sufficient. In addition,the downtime in the pre-copy migration scheme keeps constant when data rate increases.Finally, an approach for VNFs placement and deployment a hybrid Cloud/Fog networkis defined and discussed in [25], but without any migration scheme.
It is worth noting that most of the existing investigations only propose strategies tooptimise the service latency under specific time constraints, without properly consideringthe potentialities of service migration in IoV environment, or limiting it to simplified sce-narios. To face the above introduced problem, in Sec.3, we propose a framework, calledMist Computing (since applications condense from the FSs directly onto the user path),to support innovative time-space constrained services for a group of (semi) automatedvehicles in dynamic scenarios. More in details, the main contributions of this chapterinclude: (1) the design of an architecture for vehicular communication which combinesSDN, NFV and FC and to enable the service migration; (2) a proactive handover based onSDN; (3) a Service Management and Orchestrator implementation; (4) a swapping migra-tion scheme, enhancing the existing IoV service migration strategies; and (5) a detailedperformance evaluation of the proposed scheme, as well as, a comparison with severalbenchmarks, are carried out in Sec. 4, by means of numerical simulations performed overrealistic scenarios in terms of end-to-end (e2e) delay, reliability and resources utilizationat the FSs.
The chapter is organized as it follows. Section II introduces the most importanttechnologies involved in the Mist Computing approach. Specifically, the concepts of FC,
_____________________________________________________________________________________ CNIT Technical Report-05 ꟷ Internet of Things: Technologies, Challenges and Impact
185

SDN, NFV and VM and Container Migration are reviewed. Moreover, two specific openissues are detailed. Section III describes the proposed model together with its behaviour.Analysis and discussion of the results are given in Section IV. Finally, Section V concludesthe chapter.
2 Background knowledge
In this Section the most important concepts needed to understand our proposed approachare reviewed.
2.1 Fog Computing
FC is a decentralized architecture in which the resources are placed in a location betweenthe data source and the Cloud [16]. The data produced by devices are not directlyuploaded to the Cloud but are pre-processed by small data center placed close to the end-user. The intermediate network level created by the FC approach leads to the followingmain advantages:
• Less core network traffic: FC reduces the traffic between the IoT devices andthe Cloud.
• Latency reduction: FC reduces latency between the data source and the process-ing center.
• Cost saving of external network: the cost for a fast Cloud data upload can beavoided.
• Better security: FNs can be protected using same procedures followed in ITenvironment.
• Better privacy: Users data are analysed locally instead of sending them to theCloud.
• Development of new services: given the low latency and the proximity of FSs,it is possible to provide services with strong temporal and/or spatial constrained.
A typical FC architecture is composed of three layers, as shown in Fig. 1. The Edge-Layer (EL) includes all the smart devices (Edge devices) of an IoT architecture. In thislayer, data generated by the IoT devices are directly processed by the devices itself or areforwarded to the FNs within the Fog-Layer (FL). The Fog-Layer is composed of a numberof powerful servers that receive and pre-process data from the underlying level. Finally,if further analysis are needed, the FNs upload the data into the Cloud. The Cloud-Layer(CL) is the central endpoint of the FC architecture and it collects all the data withoutany stringent temporal or spatial requirements that need further processing.
IoV represents a typical application of IoT technology in a mobility scenario, whichallows data gathering and information sharing about vehicles, pedestrians, roads and theirsurroundings. In this context, FC approach can be efficiently used to provide vehicularapplications or services (e.g. autonomous driving, forward/backward collision warnings,
186_____________________________________________________________________________________
Software Defined Fog/Edge Networking for Internet of Vehicles: a ...

Figure 1: Fog Architecture
lane change assistance) to end users. FNs can be implemented in Road Side Units (RSUs)or Base Stations (BSs) and can host services with strict latency constraints. Instead,traffic efficiency and management applications, together and comfort and infotainmentservices, which do not have stringent requirements, can be directly executed into theCloud.
2.2 Software Defined Networking
SDN is a new network architecture which introduce a clear separation between the CPand the DP w.r.t the traditional network, as shown in Fig. 2 [4]. This separation allows toget a complete view of the underlying network which can be used to solve some problemspresent into the traditional network:
• difficult monitoring of large network;
• complex implementation of new management policies due to the presence of manyproprietary protocols.
The CP represents the network intelligence and contains one or more distributed routingprotocols which are used to discover the best path from a source to a destination. TheDP processes incoming packets in accord with the results obtained by the CP and, if apacket matches a routing flow entry, it is forwarded on the physical port that leads tothe next device on the path. As shown in Fig. 3, in a SDN network, the DP is composedof forwarding devices, also known as Switches, whereas the CP is implemented in oneo more servers, known as SDN controllers. The more important characteristic of thenetwork devices in an SDN network is that these devices perform a simple forwardingfunction, without embedded software to make autonomous decision. The SDN controllermaps the service requests coming from the AppP, into specific commands and directives to
_____________________________________________________________________________________ CNIT Technical Report-05 ꟷ Internet of Things: Technologies, Challenges and Impact
187
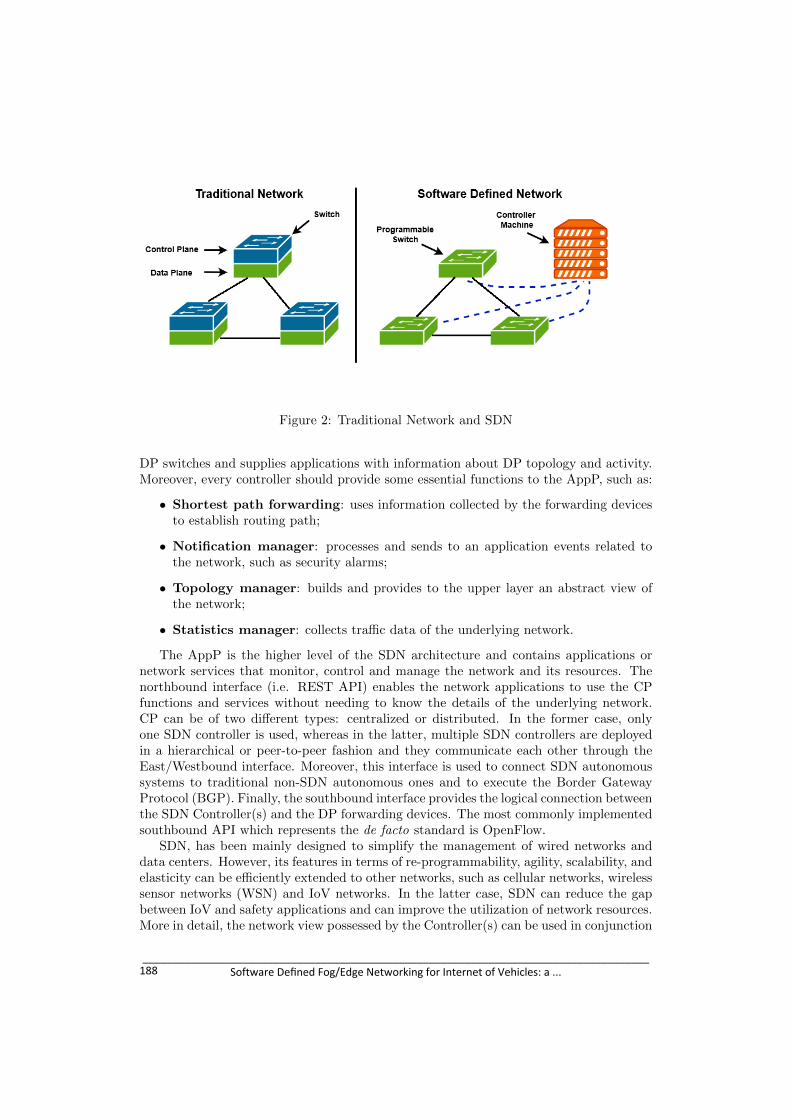
Figure 2: Traditional Network and SDN
DP switches and supplies applications with information about DP topology and activity.Moreover, every controller should provide some essential functions to the AppP, such as:
• Shortest path forwarding: uses information collected by the forwarding devicesto establish routing path;
• Notification manager: processes and sends to an application events related tothe network, such as security alarms;
• Topology manager: builds and provides to the upper layer an abstract view ofthe network;
• Statistics manager: collects traffic data of the underlying network.
The AppP is the higher level of the SDN architecture and contains applications ornetwork services that monitor, control and manage the network and its resources. Thenorthbound interface (i.e. REST API) enables the network applications to use the CPfunctions and services without needing to know the details of the underlying network.CP can be of two different types: centralized or distributed. In the former case, onlyone SDN controller is used, whereas in the latter, multiple SDN controllers are deployedin a hierarchical or peer-to-peer fashion and they communicate each other through theEast/Westbound interface. Moreover, this interface is used to connect SDN autonomoussystems to traditional non-SDN autonomous ones and to execute the Border GatewayProtocol (BGP). Finally, the southbound interface provides the logical connection betweenthe SDN Controller(s) and the DP forwarding devices. The most commonly implementedsouthbound API which represents the de facto standard is OpenFlow.
SDN, has been mainly designed to simplify the management of wired networks anddata centers. However, its features in terms of re-programmability, agility, scalability, andelasticity can be efficiently extended to other networks, such as cellular networks, wirelesssensor networks (WSN) and IoV networks. In the latter case, SDN can reduce the gapbetween IoV and safety applications and can improve the utilization of network resources.More in detail, the network view possessed by the Controller(s) can be used in conjunction
188_____________________________________________________________________________________
Software Defined Fog/Edge Networking for Internet of Vehicles: a ...

Figure 3: SDN Architecture
with a vehicle traffic prediction model to optimize the data routing between vehicles,pedestrians and infrastructure. In this scenario, Controller(s) has to respond quickly tonetwork changes, thus a combination of SDN and FCN is needed. It is important to pointout that the design of a vehicular network architecture, which can combine these twoparadigms in a wireless scenario, raises two open issues that should be addressed.
The first one is the mapping of the software defined devices into the FCN architec-ture. In the IoV perspective, the FCN architecture is composed of many FSs/FNs, whosemain objective is to quickly process data coming from IoV devices and to immediatelyprovide results. Thus, it can be assumed that part of the SDN Application Plane (AppP)is located into the FSs. The remaining part, which includes applications/services notreal-time may be placed into the Cloud. The SDN Controllers do not have a fixed posi-tion, therefore they can be implemented on the same FSs that already host the networkapplications or can be placed in other servers far from the access network. According tothe first approach, Controllers can quickly manage the forwarding devices, but since theyare placed closer to the end-devices, they can only be aware of a limited part of the net-work and therefore a distributed CP is needed. With the latter one, instead, Controllershave a complete view of the underlying network, but the latencies introduced are higherthan in the former case and it can be unacceptable for real-time services. A possiblesolution is to merge the previous two cases in a hierarchical architecture in which, (i) alower and distributed CP manage small areas and quickly answer to applications withstringent temporal constraints and, (ii) an upper and more centralized Controllers handlethe communication among the underlying Controllers and between them and the Cloud.Since there are no specific requirements, the IoV devices can be used as forwarding devices
_____________________________________________________________________________________ CNIT Technical Report-05 ꟷ Internet of Things: Technologies, Challenges and Impact
189

becoming both data source and Switch. Edge devices together with the gateway/accesspoint, usually use a wireless channel to communicate among each other. However, al-though SDN and OpenFlow work efficiently in wired network, the integration of thesenew concepts over a wireless link represents the second open issue that needs to be ad-dressed. Two feasible solution could be implemented, namely, (i) the use of the gatewayas a proxy which translates the OpenFlow commands in messages that can travel on awireless channel, or (ii) directly enabling the OpenFlow protocol over wireless links.
In conclusion, it can be pointed out that the FCN can host different layers of theSDN architecture, but the correct mapping between the software defined devices and theFSs still represents an open issue. Indeed, in the resulting Software Defined Fog Network(SDFN), the devices may simultaneously belong to different SDN layers. Moreover, al-though the DP of an SDN could be extended until the edge network, an OpenFlow versionwhich can transit on a wireless channel has not been yet implemented.
2.3 Network Function Virtualization
NFV can be defined as the separation process of the network functions (i.e. Network Ad-dress Translation (NAT), firewalling, intrusion detection, Domain Name Service (DNS))from proprietary hardware appliances. The core of NFV is composed of VNFs that han-dle specific network functions [11]. A VNF can run on VM or container on commercialoff-the-shelf (COTS) servers.
A VM can be defined as a virtual environment which emulates the behaviour of aphysical machine. The hosting machine shares its hardware resources (RAM, CPU, GPUand Hard disk/SSD) with the VMs, allowing their simultaneously execution. The com-ponent that orchestrates the physical resources for the VMs and allows its coexistence isknown as Hypervisor. Differently by the VMs, containers do not virtualize the underlyinghardware but share the same OS, the kernel, the network connection and the libraries.Moreover, the instances are executed inside a separate space, guaranteeing a reduction ofthe CPU consumption.
Multiple VNFs can be combined or connected together (VNF service chaining) tocreate end-to-end services. As shown in Fig 4, the NFV framework mainly consists ofthree domains of operation:
• Virtualized network functions: set of VNFs, that run over the NFVI. A VNFmay be composed of one or more VNF components (VNFC), each of which imple-ments a VNF functionality.
• NFV infrastructure (NFVI): comprises the hardware and software resourcesthat create the environment on which VNFs are deployed. NFVI virtualizes physicalcomputing, storage, and networking and places them into resource pools. Thevirtualization is the most important operation in the NFVI domain, because itabstracts the hardware resources and guarantees the life-cycle independence betweenthe VNFs and the underlying hardware.
• NFV management and orchestration (MANO): manage the software/hardwareresources and the life-cycle of VNF instances on top of the NFVI. Examples includeVNF instance creation, VNF service chaining, monitoring and shutdown.
190_____________________________________________________________________________________
Software Defined Fog/Edge Networking for Internet of Vehicles: a ...

Figure 4: High level NFV framework
If the NFV concept is implemented efficiently, it can bring several of benefits comparedwith the traditional networking approach. The most important ones are: (i) reductionof the Operating Expense (OPEX) and the Capital Expenditure (CAPEX), (ii) fasterdeployment of new innovative services at lower risk and, (iii) higher flexibility and agility,by scaling up and down the services and their resources.
In the IoV scenario, NFV can improve network flexibility, while increasing the networkresources consumption. More in detail, it can distribute vehicular applications and ser-vices and can dynamically manage the VNF resources according to the end user’s servicerequests and the vehicle traffic evolution. As previously mentioned, VNFs can run in VMsor containers on COTS server or into the Cloud, thus a scenario that combines NFV andFCN has to be considered. Moreover, NFV can cooperate with SDN to effectively achievethe service chaining technique and then provide more complex services to end users.
2.4 Virtual machines and Containers Migration
As explained in the previous Section, the NFV can bring many benefits to the networkoperator. Furthermore, since the network functions are implemented through VMs orcontainers on standard server, it is possible to move them from one physical machine toanother one depending on the needs. This procedure, known as migration, brings highflexibility and adaptability to the network and it is mainly implemented in the Cloud butcan be extended to the Fog environments [9]. The most relevant characteristics that haveto be considered when the migration is applied in Fog scenarios are:
_____________________________________________________________________________________ CNIT Technical Report-05 ꟷ Internet of Things: Technologies, Challenges and Impact
191

• Fog environments are composed of heterogeneous devices with different capabilities,resources and operating system. Hence, a virtualization platform which can run ondifferent devices is needed.
• Unlike the Cloud approach, FSs are interconnected through wide area network(WAN) and therefore the packet transmission is subject to higher delays and lowerthroughputs.
• The migration time is an important parameter that has to be considered in the Fognetwork because its prolonged duration can degrade the overall migration perfor-mance.
• The hardware resources of FSs are limited and lower than the resources of a Clouddata center.
Figure 5: Cold Migration
The migration techniques may be either stateless or stateful. The former simply startswith setting up a new container on the destination node and quitting the old containeron the source node. The latter, instead, moves the memory pages and the executionstate from the source to the destination. Therefore, the new container starts exactly fromwhere the old container stopped. The stateful techniques may be further categorized intotwo other classes known as cold and live migration.
As shown in Fig. 5, the cold migration executes the following steps:(i) stops theVM/container to ensure that it will no longer change the state; (ii) dumps the entirestate and transfers it to destination leaving the source VM/container stopped; and (iii)resumes the VM/container at destination only when all the state has been correctly trans-ferred. The main consequence of this procedure is that the time required to perform themigration, called migration time, is equal to the downtime, which is the time interval dur-ing which the VM/container is not running. To avoid this drawback two live migration
192_____________________________________________________________________________________
Software Defined Fog/Edge Networking for Internet of Vehicles: a ...

techniques have been proposed. The first, known as Pre-copy migration or iterative mi-gration transfers, through multiple iterations, the execution state and the memory pagesmodified during the previous iteration, also known as dirty pages, to the destination nodebefore the stopping of the source VM/container. Then, like the cold migration, a finaldump is performed and the last modified pages along with the changes in the execu-tion state are transferred to the destination where the VM/container will be eventuallyresumed.
Figure 6: Pre-copy Migration
As specified in Fig. 6, the downtime is lower than the total migration time and gen-erally is lower than the downtime of the cold migration scheme. This is primarily due tothe nature of their dumps. The dump in cold migration includes all the memory pagesand the execution state, whereas in pre-copy migration it contains only the memory pagesmodified during the previous iteration along with the last modification in the executionstate. Hence, since less data are transferred in pre-copy migration during the sourceVM/container suspension, the total downtime is reduced. The main drawback of thisapproach, that can increase the downtime, is the number of dirty pages. In fact, a largepage dirtying rate increases the quantity of dirty pages that have to be transferred eachtime and, consequently, the time to forward them to the destination node. The secondlive migration technique that reduces the cold migration downtime and allows to per-form part of the migration process without stop the source VM/container is known as,post-copy migration. This approach first stops the VM/container on the source node andtransfers the execution state to the destination, thus the new VM/container can resumeits execution from there. Only after this step, all the memory pages can be copied tothe destination machine through different techniques. One of these, called lazy migrationtransfers the memory pages only when the resumed VM/container cannot find them atthe destination server. As shown in Fig. 7, if the requested memory page are not present,the VM/container generates a page fault and contacts the page server on the source node.This server then transfers the faulted pages to the destination.
The post-copy migration presents a downtime lower than the cold migration downtimeand comparable with that of pre-copy migration. This is mainly due to the dump phase,because only the execution state without any memory pages is transferred. Differently bythe pre-copy solution, the performance of this live migration technique does not dependof the page dirtying rate but it is subject to a non-immediately availability of the memorypages at the destination node that may be unacceptable for time-constrained services.
_____________________________________________________________________________________ CNIT Technical Report-05 ꟷ Internet of Things: Technologies, Challenges and Impact
193

Figure 7: Post-copy Migration
Migration techniques can be applied to wireless network, and especially to IoV networkto maintain low latencies between Client and Server and obtain a higher Quality ofExperience. The main idea, which represents the basis of the Mist Computing approach,is to use the migration concept to move the user’s service(s) from one server to anotherwhen it is needed. More details of our approach are described in the following Section.
3 Overall System Architecture and Service Manage-ment Model
The proposed Mist Computing architecture, combining FC, SDN and NFV concepts, isdepicted in Fig. 8, where it is evident the classical three-layer arrangement (DP, CP, andAppP). The building elements have been properly adapted to the vehicular ecosystemrequirements, where the wireless access is provided by the LTE Advanced access network.In particular, it involves specific APs (i.e., eNodeBs), but, unlike to the classical LTEarchitecture, in which they are directly connected to the Mobility Management Entity(MME) and the Serving Gateway (SGW), they are paired with an OF Switch.
In our vision, the several entities that compose the LTE CN are virtualized in VNFsand are placed into the Cloud. The routing of data and signalling traffic is still IP-basedbut is managed by one or more SDN Controllers. The VNFs that are involved in thehandover procedure can access to the SDN Controller(s), modify the data flow from oneeNB to another one, and achieve both hard and soft handover, as introduced in [21].
The SDN principle gives to the Controller(s) a complete network view to optimallymanage the system in terms of (i) traffic flows forwarding and (ii) ad hoc deploymentof innovative applications and algorithms without modifying the devices fabric. In theproposed architecture, DP is comprised of eNBs and OF Switches, the latter only beingconnected to the CP through the OpenFlow protocol. FSs belong to an intermediatelevel, called Fog Plane (FP), as represented in Fig. 8; they are connected to OF Switchesand pre-loaded with the application’s images provided by the Service Provider (SP),which usually adopt Operational and Business Support Systems (OSS/BSS). Accordingto a publish & subscribe pattern, vehicles select a specific service to be personalised
194_____________________________________________________________________________________
Software Defined Fog/Edge Networking for Internet of Vehicles: a ...

Figure 8: Mist Computing architecture, highlighting actors and interfaces of vehicularecosystem.
which is executed a specific container. In our approach, Controller(s) have additionalcapabilities to support generalised handover related to a group rather than individualmobility, if compared with the features available on MMEs and eNBs of traditional 4Gcellular system [21].
The handover VNF running on the Controller acts as a proxy between the eNB andthe CN (MME, S-GW, etc.) and collects data from vehicles. In particular, the eNB sendshandover requests to the aforementioned VNF, which will adequately manage them. Incase of INTRA-MME/SWG handover with enabled X2 interface, it will only captureinformation without directly acting on the handover procedure. If the X2 interface isnot enabled, the handover VNF will manage the procedure without contacting the CNentities and it will use the SDN Controller to modify data flow towards the destinationeNB. Finally, if the handover is INTER-MME or INTER-MME/SGW, the VNF willtransparently forward the request to the CN, which will manage the handover as in LTEAdvanced. In this way, the overall traffic overhead and latencies are reduced and the SDNController can intercept vehicles that are about to perform the handover.
Furthermore, all the network information owned by the Controller is used to performthe service migration. This involves the adoption of a Vehicular Functions and ServicesManagement and Orchestrator (VFS MANO), able to both manage FSs resources and
_____________________________________________________________________________________ CNIT Technical Report-05 ꟷ Internet of Things: Technologies, Challenges and Impact
195

create, delete and migrate the vehicular services (e.g., autonomous driving, remote driv-ing, pre-crash warning, platooning). The service migration aims at maintaining servicesclose to the users, then minimising the latency between the currently associated eNB andthe FS hosting the service.
The Mist Computing approach relies on the service migration concept to offload theuser’s service(s) from one FS to another one, in accordance with the vehicle’s path, whichhas been previously predicted and processed. However, it requires an additional delayto transfer service status (usually a file or a page) to the target FS. Thus, when thisinformation is not negligible, the delay may become quite larger, so that the servicemigration should not be performed every time a vehicles initiates a handover, as pointedout in [19].
In this chapter, the benefits provided by a correct service migration to a vehicularnetwork are investigated. To this purpose, we analyse two schemes, that is, no migration(Scheme 1) and the proposed optimized pre-copy migration for mobile scenarios (Scheme2). Since both of them are not able to properly support services with hard time con-straints, we propose a swapping migration scheme (Scheme 3) in which service migrationis performed to both optimise the overall delay and the services availability at each FS.In both Scheme 1 and 2, a service requested by a vehicle is placed in a FS able to satisfythe QoS requirements. If no FSs are available, that request is rejected or redirected toCC. Scheme 1 is considered as benchmark in which no service migration is pro-activelyperformed while the vehicles are moving. In order to guarantee the service continuity, thevehicles maintain the connection with the FS where the requested service is running ona container. Consequently, the e2e latency, which includes the propagation, transmissionand queuing delay, becomes larger as the car moves away from the FS that is hostingthe service. In scheme 2, our optimized pre-copy migration mechanism is considered. Inorder to select the best FS to perform the service migration on, the VFS MANO predictsvehicle(s) position(s): it is usually based on the previously evaluated journey since thisrepresents the core service for a traffic navigation application, which is also regularly up-dated by the underlying tracking service. Once obtained the vehicle path and the eNBslist along it, the VFS MANO applies the Djkstra algorithm over the network view ownedby the SDN Controller to evaluate the best FS to migrate the service. Then the VFSMANO starts a pre-copy container migration by means of an iterative pre-dumping phaseon the selected FS. Resorting to the SDN Controller, the VFS MANO can track the vehi-cle position and activate the last phase of the pre-copy migration when it is close enoughto the target FS, while performing the handover. Differently from the pre-copy migrationconventionally used for mobile networks [23], in which the entire migration starts whenthe vehicle connects to the new eNB, in this optimized scheme only the last phase of thepre-copy migration is executed during the handover, therefore, the overall downtime isreduced. In particular, this delay is composed of the handover downtime and migrationdowntime. In Scheme 2, both are overlapped and, thus, the total downtime is lower thanthe conventional approach. The main drawbacks of this solution is the scalability: whenthe service requests are more than resources available in all the FSs, the system drops newrequests or redirects them to CC, hence, increasing the service outage or the e2e delay,respectively. In Scheme 3, we propose an optimisation of the Scheme 2, called swapping-migration, which is activated only if it is necessary to free up resources on a certain FS tobe used for another container. The active container releasing consists in migrating it to
196_____________________________________________________________________________________
Software Defined Fog/Edge Networking for Internet of Vehicles: a ...

another appropriate FS capable of hosting the service, without degrading its performancebut guaranteeing QoS requirements. Specifically, the VFS MANO is aware of the con-tainers/services distribution within FSs, together with the resources needed to satisfy theQoS requirements. Moreover, by interacting with the SDN Controller, the VFS MANOgets a complete view of the underlying network features so that it can: (1) evaluate thebest target FS to migrate the active container in order to free up resources to host a newservice and, (2) avoid that the migration could not match the QoS requirements of therunning service.
4 Results Analysis
The integrated management approach presented in Sec. 3 has been evaluated by meansof numerical simulations resorting to (i) an ad hoc Python 3 framework to model thecontainer migration and the VFS MANO, (ii) the Simulation of Urban MObility (SUMO)to generate vehicular traffic and (III) the Mininet WiFi to emulate the Software DefinedWireless Network.
The test scenario is composed of 20 eNBs, 30 FSs, 20 Switches OF, 1 SDN Controllerand 1 VFS MANO, representing a realistic urban case study, with 2500 vehicles over thisarea. To allow service migration, FSs has been supposed to be connected via high-capacitylinks, such as based on fiber or millimeter-wave.
Table 1: Parameters adopted in simulations.
Parameter Value
Coverage of the urban area 150 km2
Total number of vehicle 2500Link speed for upstream and downstream in FN 1 Gbps
Resources needed by the vehicular services 10−100 MbitsMaximum number of containers in a FS 500
Coverage for a single eNB 8 km2
Number of eNB 20Number of FS 30
Number of OpenFlow Switch 20Number of SDN Controller 1Number of VFS MANO 1
Handover interruption time 10 ms
Table 2: Number of requests.
Level of services demand Value
Low 0−5000Medium 5000−10000High 10000−15000
The eNBs maximum coverage radius is 8 km, while the length of the wired links(dotted lines in Fig. 8) does not exceed 15 km and with a capacity of 1Gbps. Moreover,there are 30 services offered by the VFS SP, which are different in terms of the resources(RAM, CPU) requested for their execution, whereas FSs are characterised in terms of
_____________________________________________________________________________________ CNIT Technical Report-05 ꟷ Internet of Things: Technologies, Challenges and Impact
197

available resources so that they can accommodate only a variable number of containersand services. More in detail, the size of each container hosting the service is comprisedof 10 to 100 Mbits and the maximum number of containers that a server can host is 500.The maximum number of service requests is 15000, in order to saturate the resourcesavailable on the FSs and verify our approach. OF Switches interconnecting eNBs andFSs are managed by the SDN Controller, which dynamically modifies the flow rules. Allthe simulation parameters are summarised in Table 1.
Figure 9: Average e2e service completion latency for different transmission capacities andservice request rates.
Vehicles trajectories are randomly generated, and, in our optimized pre-copy migra-tion scheme, they are shared with the eNBs estimation application running on the SDNController, in order to evaluate the probable eNBs along with them. The VFS MANO,in turn, uses this results (i) to point out the possible FSs on which to migrate the service(provided that they have enough resources), (ii) to load on those FS the proper contain-ers, (iii) to activate the pre-copy migration and, (iv) to execute the last phase of thepre-copy migration when the vehicle is about to perform the handover to the target eNB,which represents the last eNB after which the e2e latency is greater than the service delayconstraint. In particular, the latter procedure is initiated by the VFS MANO monitoringthe vehicles movements through the SDN Controller. Finally, as described in Sec. 3, toovercome some limitations of the optimised pre-copy migration, the swapping-migrationscheme is introduced. These proposed solutions (with or without container swapping) arebesides compared in terms of service e2e latency, resource allocation and service outage
198_____________________________________________________________________________________
Software Defined Fog/Edge Networking for Internet of Vehicles: a ...

w.r.t. a static vehicular services placement over FSs, for different values of capacity andservice requests, as shown in Table 2.
Figure 10: Average normalised resource utilisation per FS.
In Fig. 9, the average e2e service completion latency for the considered three Schemeswith different transmission capacities and services request rates, is sketched. It is worthpointing out that in general delay decrease as the transmission capacity of the Fog networkincreases, since higher bitrate leads to shorter packet transmission time, which reducesthe packet queuing delay in the forwarding devices and results in the smaller e2e delay.However, the three Schemes behave in a different way at the increasing of vehicular servicerequest rate, as it causes both a decrease of available resources in the FSs and a moreintense use of the traditional CC, therefore, a worsening of the e2e delay performance. Theoptimised pre-copy migration (Scheme 2 or migration without swapping) outperforms theone without migration support, especially for low transmission capacity, since the serviceis deployed along the trajectory of the requesting vehicle and the overall delay is keptlow. In both cases, if the resources available in the FSs are not enough to host a newservice, the CC approach is applied, causing an increase of the latency. The swappingoriented Scheme 3 follows the same procedure of the optimised pre-copy migration but,if resources are limited, it tries to satisfy the request using the FC instead of the CC.As explained in Sec. 3, this is performed by migrating an active container to anotherFS without degrading its performance or violating QoS requirements; once the migrationis completed, some resources of the selected FS are released for hosting new services.Even though this procedure requires some additional latency to be accomplished, theaverage e2e delay remains lower than the previous two approaches, especially for highservice request rate. From Fig. 10 it is evident that the swapping-migration increasesthe normalised resources utilisation (η) within FSs of about 13%, w.r.t. the migration
_____________________________________________________________________________________ CNIT Technical Report-05 ꟷ Internet of Things: Technologies, Challenges and Impact
199
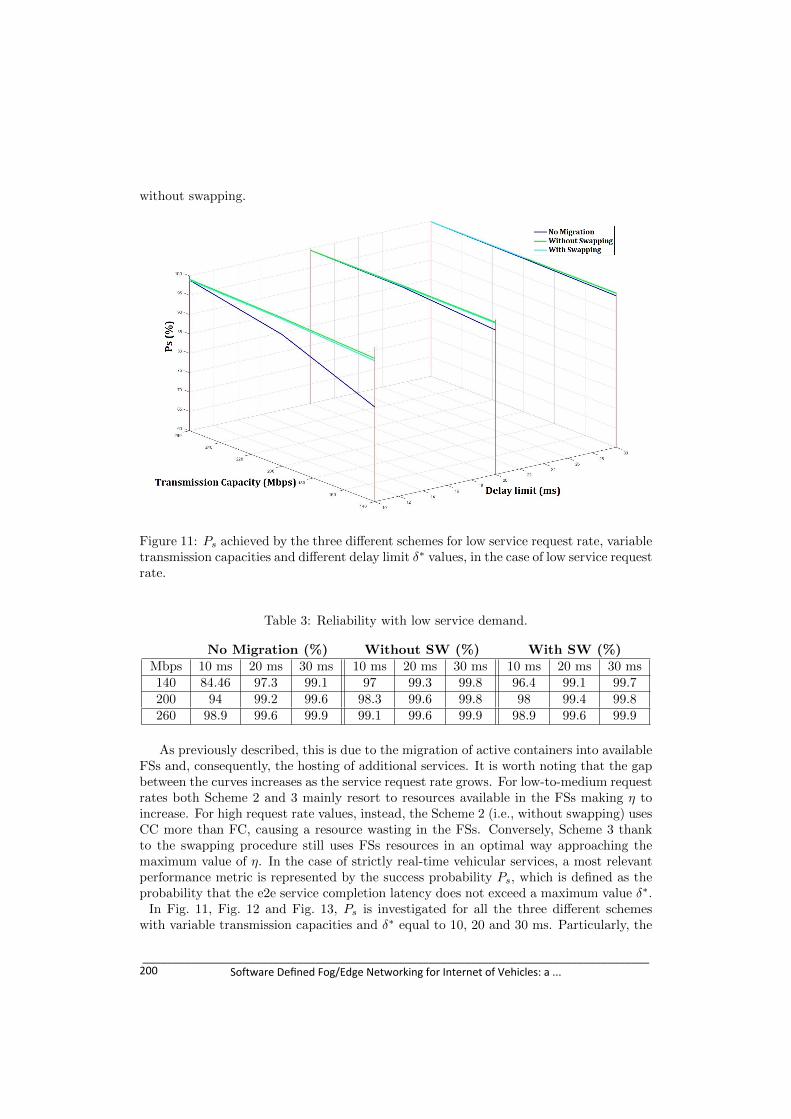
without swapping.
Figure 11: Ps achieved by the three different schemes for low service request rate, variabletransmission capacities and different delay limit δ∗ values, in the case of low service requestrate.
Table 3: Reliability with low service demand.
No Migration (%) Without SW (%) With SW (%)Mbps 10 ms 20 ms 30 ms 10 ms 20 ms 30 ms 10 ms 20 ms 30 ms140 84.46 97.3 99.1 97 99.3 99.8 96.4 99.1 99.7200 94 99.2 99.6 98.3 99.6 99.8 98 99.4 99.8260 98.9 99.6 99.9 99.1 99.6 99.9 98.9 99.6 99.9
As previously described, this is due to the migration of active containers into availableFSs and, consequently, the hosting of additional services. It is worth noting that the gapbetween the curves increases as the service request rate grows. For low-to-medium requestrates both Scheme 2 and 3 mainly resort to resources available in the FSs making η toincrease. For high request rate values, instead, the Scheme 2 (i.e., without swapping) usesCC more than FC, causing a resource wasting in the FSs. Conversely, Scheme 3 thankto the swapping procedure still uses FSs resources in an optimal way approaching themaximum value of η. In the case of strictly real-time vehicular services, a most relevantperformance metric is represented by the success probability Ps, which is defined as theprobability that the e2e service completion latency does not exceed a maximum value δ∗.
In Fig. 11, Fig. 12 and Fig. 13, Ps is investigated for all the three different schemeswith variable transmission capacities and δ∗ equal to 10, 20 and 30 ms. Particularly, the
200_____________________________________________________________________________________
Software Defined Fog/Edge Networking for Internet of Vehicles: a ...

Figure 12: Ps achieved by the three different schemes for medium service request rate,variable transmission capacities and different delay limit δ∗ values, in the case of mediumservice request rate.
Table 4: Reliability with medium service demand.
No Migration(%) Without SW (%) With SW (%)Mbps 10 ms 20 ms 30 ms 10 ms 20 ms 30 ms 10 ms 20 ms 30 ms140 70.1 82.4 92.2 76.83 88.7 96.8 88.49 95.1 99.2200 75.5 87.2 95.2 79.1 90 97.1 90.3 97.4 99.3260 80.2 90.2 97.4 80.3 90.2 97.4 92.1 99.1 99.6
three figures show the evolution of the Ps in case of low, medium and high service requestrate, respectively. For a better understanding, the results obtained are also summarizedin table 3, 4 and 5.
In all three figures, the Ps increases as the transmission capacity in the Fog Networkincreases. For low request demand, Fig.11, the migration with and without swapping hasabout the same performance, keeping the probability higher than 96.4% for all the threelatency levels. The approach without migration, instead, needs an higher transmissioncapacity or a lower delay constraint to achieve the same performance. For medium andhigh service request rate, Fig.12 and Fig.13, it is evident that the swapping-migrationscheme always outperforms the other ones, with a more remarkable gain in the case ofboth low delay constraints δ∗ and transmission capacities.
_____________________________________________________________________________________ CNIT Technical Report-05 ꟷ Internet of Things: Technologies, Challenges and Impact
201

Figure 13: Ps achieved by the three different schemes for high service request rate, variabletransmission capacities and different delay limit δ∗ values, in the case of high servicerequest rate.
Table 5: Reliability with high service demand.
No Migration(%) Without SW (%) With SW (%)Mbps 10 ms 20 ms 30 ms 10 ms 20 ms 30 ms 10 ms 20 ms 30 ms140 64.32 75.3 85.4 67.62 79.2 90.1 79.6 90.1 97.7200 67.2 78.2 87.7 68.5 79.5 90.3 81.4 92.3 99.2260 69.9 79.6 90.8 69.9 79.6 90.8 84.5 96.4 99.4
In Fig.12, the swapping-migration scheme achieves the maximum probability of 99.6%,when the maximum delay limit is set to 30 ms and the transmission capacity is 260 Mbps,whereas, the other two schemes achieve a maximum value that not exceed 97.4%. In Fig.13it is possible to notice that for high service request rate, when the δ∗ is equal to 10 msand capacity assumes the lower value, the scheme with swapping achieves a maximum Ps
value of about 80% which is considerably higher than the no swapping and static schemesof 16% and 20%, respectively. Vice versa, if the delay limit is set up to 30 ms and thetransmission capacity is the maximum attainable, the Ps of the swapping scheme is about99,4%, while that of the other two approaches does not exceed the 91%.
202_____________________________________________________________________________________
Software Defined Fog/Edge Networking for Internet of Vehicles: a ...

5 Conclusions
In this chapter, we proposed a vehicular services oriented framework to provide mobilereal-time applications. To this end, we derived a general network architecture based onLTE Advanced technology, which properly combines the innovative concepts of SDN, NFVand FC. To address these specific services issues, various service migration approacheshave been evaluated and a near optimal procedure, called swapping-migration, is intro-duced. In particular, in our scheme, the VFS MANO cooperates with the SDN Controllerto both predict the best FSs on which pre-migrates the service and the time instant inwhich to start the final phase of the pre-migration. Moreover, in order to maximisethe FSs resources utilisation, the proposed scheme performs active services additionalmigrations between FSs. The performance of this approach, compared with other onesavailable in the literature, has been evaluated in terms of e2e service completion delay,outage probability and resource allocation by means of realistic simulations over an urbanarea. All the tests pointed out that the proposed swapping-migration scheme outperformsthe alternatives especially for high service request rate and low capacity, since it alwayskeeps the service topologically close to the requesting users, while optimising the use ofthe Fog Network. As future developments, we are planning to apply Machine Learning(ML) techniques running on collected dataset to perform accurate vehicular traffic andservice request predictions with the aim of deriving optimal policies (usually in the Re-inforcement Learning (RL) class), which can be implemented into the VFS MANO toimprove the service migration. With reference to this aspect, advanced migration proce-dures could be investigated and their performance tested in vehicle scenarios. Anotherinteresting topic to be addressed is concerned with the overall reliability since the VFSMANO and the SDN Controller represent a single point of failure, so that a distributedCP and multiple VFS MANOs need to be considered in future design.
References
[1] 2011. Vehicular networking: A survey and tutorial on requirements, architectures,challenges, standards and solutions - IEEE communications surveys & tutorials,13(4), 584-616.
[2] 2014. Connected Vehicles: Solutions and Challenges - IEEE Internet of Things Jour-nal, 1(4), 289-299.
[3] 2014. Handover management in SDN-based mobile networks - 2014 IEEE GlobecomWorkshops (GC Wkshps), 194-200.
[4] 2014. Software-defined networking: A comprehensive survey - Proceedings of theIEEE, 103(1), 14-76.
[5] 2016. A novel load balancing strategy of software-defined cloud/fog networking in theInternet of Vehicles - China Communications, 13(2), 140-149.
[6] 2016. Connected-Vehicles Applications Are Emerging [Connected Vehicles] - IEEEVehicular Technology Magazine, 11(1), 25-96.
_____________________________________________________________________________________ CNIT Technical Report-05 ꟷ Internet of Things: Technologies, Challenges and Impact
203

[7] 2016. Interworking of DSRC and Cellular Network Technologies for V2X Communi-cations: A Survey - IEEE Transactions on Vehicular Technology, 65(12), 9457-9470.
[8] 2016. Providing flexible services for heterogeneous vehicles: an NFV-based approach- IEEE Network, 30(3), 64-71.
[9] 2017. A critical survey of live virtual machine migration techniques - Journal of CloudComputing, 6(1), 23.
[10] 2017. Follow me fog: Toward seamless handover timing schemes in a fog computingenvironment - IEEE Communications Magazine, 55(11), 72-78.
[11] 2017. Network functions virtualization: An overview and open-source projects - 2017IEEE Second Ecuador Technical Chapters Meeting (ETCM), 1-6.
[12] 2017. Vehicular Fog Computing: Architecture, Use Case, and Security and ForensicChallenges - IEEE Communications Magazine, 55(11), 105-111.
[13] 2018. 5G for Vehicular Communications - IEEE Communications Magazine, 56(1),111-117.
[14] 2018. Congestion mitigation in densely crowded environments for augmenting qos invehicular clouds - Proceedings of the 8th ACM Symposium on Design and Analysisof Intelligent Vehicular Networks and Applications, 49-56.
[15] 2018. Context-aware data-driven intelligent framework for fog infrastructures in In-ternet of vehicles - IEEE Access, 6, 58182-58194.
[16] 2018. Fog computing architecture, evaluation, and future research directions - IEEECommunications Magazine, 56(5), 46-52.
[17] 2018. IoT-fog based system structure with SDN enabled - Proceedings of the 2ndInternational Conference on Future Networks and Distributed Systems, 62.
[18] 2018. Software-Defined and Fog-Computing-Based Next Generation Vehicular Net-works - IEEE Communications Magazine, 56(9), 34-41.
[19] 2019. Container Migration in the Fog: A Performance Evaluation - Sensors,19(7):1488.
[20] 2019. Internet of Autonomous Vehicles: Architecture, Features, and Socio-Technological Challenges - IEEE Wireless Communications, 26(4), 21-29.
[21] 2019. Mobility Management for Intro/Inter Domain Handover in Software-DefinedNetworks - IEEE Journal on Selected Areas in Communications, 37(8): 1739-1754.
[22] 2019. SD-IoV: SDN enabled routing for internet of vehicles in road-aware approach- Journal of Ambient Intelligence and Humanized Computing, 1-16.
[23] 2019. Service Migration in Fog Computing Enabled Cellular Networks to SupportReal-Time Vehicular Communications - IEEE Access, 7, 13704-13714.
204_____________________________________________________________________________________
Software Defined Fog/Edge Networking for Internet of Vehicles: a ...

[24] 2019. Vehicular Ad Hoc NETworks versus Internet of Vehicles-A Comparative View- 2019 International Conference on Networking and Advanced Systems (ICNAS), 1-6.
[25] 2019. VNF placement optimization at the edge and cloud - Future Internet, 11(3),69.
_____________________________________________________________________________________ CNIT Technical Report-05 ꟷ Internet of Things: Technologies, Challenges and Impact
205


IoT-enabled Smart Monitoring and Optimization forIndustry 4.0
Luca Davoli, Laura Belli, Gianluigi Ferrari
Internet of Things (IoT) Lab, University of Parma & things2i s.r.l.
CNIT, Research Unit of Parma
Abstract: In the last decades, forward-looking companies have introduced Internet ofThings (IoT) concepts in several industrial application scenarios, leading to the so-calledIndustrial IoT (IIoT) and, restricting to the manufacturing scenario, to Industry 4.0.Their ambition is to enhance, through proper field data collection and analysis, the pro-ductivity of their facilities and the creation of real-time digital twins of different industrialscenarios, aiming to significantly improve industrial management and business processes.Moreover, since modern companies should be as “smart” as possible and should adaptthemselves to the varying nature of the digital supply chains, they need different mech-anisms in order to (i) enhance the control of the production plant and (ii) comply withhigh-layer data analysis and fusion tools that can foster the most appropriate evolutionof the company itself (thus lowering the risk of machine failures) by adopting a predic-tive approach. Focusing on the overall company management, in this chapter we presentan example of a “renovation” process, based on: (i) digitization of the control qualityprocess on multiple production lines, aiming at digitally collecting and processing infor-mation already available in the company environment; (ii) monitoring and optimizationof the production planning activity through innovative approaches, aiming at extendingthe quantity of collected data and providing a new perspective of the overall current statusof a factory; and (iii) a predictive maintenance approach, based on a set of heterogeneousanalytical mechanisms to be applied to on-field data collected in different production lines,together with the integration of sensor-based data, toward a paradigm that can be denotedas Maintenance-as-a-Service (MaaS). In particular, these data are related to the opera-tional status of production machines and the currently available warehouse supplies. Ouroverall goal is to show that IoT-based Industry 4.0 strategies allow to continuously collectheterogeneous Human-to-Things (H2T) and Machine-to-Machine (M2M) data, which canbe used to optimize and improve a factory as a whole entity.
1 Introduction
The wide adoption of Internet of Things (IoT) technologies has lead to a greater con-nectivity in industrial systems, i.e., to the paradigm of Industrial IoT (IIoT). The recentliterature provides several relevant definitions for IIoT, which can be summarized as a col-lection of Smart Objects (SOs), cyber-physical assets, together with generic informationtechnologies and Cloud or Edge Computing platforms allowing real-time and intelligent
_____________________________________________________________________________________ CNIT Technical Report-05 ꟷ Internet of Things: Technologies, Challenges and Impact
207

access, collection, analysis, and exchange of information related to processes, products orservices, within the industrial environment. The main objective of IIoT is to optimize theoverall production value in terms of service delivery and productivity, cost reduction, en-ergy consumption, and the definition of the build-to-order cycle [5]. Related to IIoT, therecent concept of Industry 4.0 identifies the ongoing fourth industrial revolution focusingon the manufacturing industry scenario and can be considered as a subset of IIoT. Theterms IIoT and Industry 4.0 are often used as synonyms; however, there is a differencebetween them.
Industry 4.0 has been initially proposed to describe the developing German economy in2011 [30, 37] and mainly focuses on the manufacturing industry. IIoT was first introducedin 2012 as industrial Internet entailing the adoption of IoT in general industrial context(both manufacturing and non manufacturing). This definition is backed by the IndustrialInternet Consortium, which was formed in 2014 with the support of Cisco, IBM, GE, Intel,and AT&T. The primary actors in Industry 4.0 are academic institutions, whereas IIoTis more business-oriented and mostly driven by private companies and some academicinstitutions [1]. Both IIoT and Industry 4.0 aim at making systems robust, faster, andsecure, and are characterized by the extensive use of Cyber Physical Systems (CPSs),digital twins, and heterogeneous data collection.
CPSs can be considered as the core of Industry 4.0, being focused on sensors andactuators, and, through the integration of computing, communication, and control, pro-viding dynamic control, information feedback, and real-time sensing for complex systems.Hence, CPSs allow to fulfill the dynamic requirements of industrial production and im-prove the effectiveness and efficiency of the entire industry. Digital twins, instead, aremore focused on the definition of a physical system’s digital copy, in order to perform real-time optimization: this is done by creating virtual models of physical objects in virtualspace, in order to simulate their real behaviors and provide feedback [36]. As a result,being more focused on models and data, digital twins enable companies to detect andquickly predict physical issues, and optimize processes. In the end, for both CPSs anddigital twins, the physical part senses and collects data, and executes decisions based onthe digital part, while this latter process and analyzes, thus making decisions [17]. Nev-ertheless, it is important to highlight that not every system that has entities in the cyberspace corresponds to a CPS, since often cyber dynamics are not just a replica of someoperational variables in the digital space (e.g., in the Cloud). In the context of CPSs anddigital twins, communications play a key role, as efficient information flows from physicaland cyber spaces is critical.
Hence, the Industry 4.0 leverages the integration of a set of complementary technolo-gies and paradigms, including Enterprise Resource Planning (ERP), Internet of Things(IoT), Cloud Computing, and so on. Hence, the first change in industrial scenarios in-troduced by the Industry 4.0 corresponds to an advanced digitization process that, incombination with Internet-based and future-oriented technologies (including, as an ex-ample, Smart Objects (SOs) deployment), favors the vision of a production factory as amodular and efficient manufacturing system, in which products control their own manu-facturing process.
In Figure 1, we show the main modules of an Industry 4.0-oriented infrastructure,which relies on a set of data sources, including: data provided by industrial machines;data collected by externally deployed IoT devices; information manually provided by
208_____________________________________________________________________________________
IoT-enabled Smart Monitoring and Optimization for Industry 4.0

Data Collection DataPresentation
Actuation Analytics Report Management
Engine
Smart Factory Framework
Data Storage
Data Sources
Industrial MachinesIoT devicesOperators' inputsOther softwares
Figure 1: Industry 4.0 modules.
operators and employees in the company; and digital data imported from other third-party services, or pre-existent ERP. The framework building this Industry 4.0 scenarioleverages the following main modules.
• A data collection module, integrating data from different sources and storing themin a coherent way, in order to efficiently perform queries and analyses.
• A data presentation module, devoted to the presentation of processed data to end-users, thus relying on clear and effective User Interfaces (UIs), in order to highlight-ing useful information.
• A customized engine logic, processing the collected raw data and performing differ-ent analyses in order to extract a higher knowledge level of the factory system.
• Different high-layer interaction modules, in which processed information can beemployed to perform actuation tasks on industrial processes, as well as being pre-sented in analytic reports or being employed to support factory employees in theiractivities, such as production planning, organization, optimization, and so on.
In this work, a description of the process, based on the Industry 4.0 IoT-oriented paradigmand implemented in a generic company C, in order to improve its “performance” in theoverall departments, is presented. More in detail, we consider a realistic use case wherecompany C is a successful company producing hoses, which follows high-quality standardsfor its products and services, and drives its constant attention to technological innovationand modern research, in order to continuously improve each stage of production andorganization activities.
Even if the company C has defined a systematic and precise protocol to manage thequality of produced hoses and plan the activities on the production lines, these taskscannot be considered smart, since they (i) do not involve any digitalized information andare performed through the usage of paper forms hand-written by operators, (ii) do not
_____________________________________________________________________________________ CNIT Technical Report-05 ꟷ Internet of Things: Technologies, Challenges and Impact
209

include any IoT-related technology to automatically collect data from industrial machines,and (iii) do not have a foundation of data that can be analyzed, in order to optimize andcontrol the factory system has a whole. As a last consideration, the company C alreadyrelies on an ERP system, but not all processes are managed in a “smart” way.
In this work, the possible renovation steps for a company C, through the introductionof modern technologies in the business processes in both control quality and productionplanning tasks, are presented and discussed. The renovation process can be seen as basedon the following applications: (i) the first application, denoted as SmartFactory, is a Web-based tool that has been developed in order to improve the production monitoring and thecontrol quality activities; (ii) the second application corresponds to the introduction ofplanning capabilities aiming at supporting the production planning staff in the complexactivity of scheduling the manufacturing orders on the production lines proper of thecompany C; and (iii) the third application relies on the introduction of an IoT-orientedinfrastructure, to improve and enhance the overall activities in the company C. We thenconclude discussing the introduction of predictive optimization-oriented approaches, tolower factory employees’ risks and plant faults.
The rest of this work is organized as follows. In Section 2, a brief analysis on thecontext of Industry 4.0 is given, while in Section 3 a set of guidelines for the digitization ofa target factory are presented. Section 4 is devoted to the analysis of different approachesto be applied for the monitoring of production lines and machines, while in Section 5 thepositive impact of predictive optimization is discussed. Finally, in Section 6 conclusionsare drawn.
2 Related Works and Motivations
The Industry 4.0 concept has recently gained particular attention, as it encompasses a het-erogeneous set of research fields, being closely related not only to IoT, CPS, Informationand Communications Technologies (ICT), and Cloud Computing, but also to EnterpriseArchitecture (EA) and Enterprise Integration (EI).
The work in [21] represents one of the first review on the content, scope, and findingsof Industry 4.0 in ICT-oriented scenarios. In [21], the authors identify 5 main researchcategories: (i) concept and perspectives of Industry 4.0; (ii) CPS-based Industry 4.0;(iii) interoperability of Industry 4.0; (iv) key technologies of Industry 4.0; and (v) smartfactory and manufacturing. In [24], it is highlighted how the benefits brought by Indus-try 4.0 are not available only to large companies, but they are accessible and attractivealso for Small and Medium Enterprises (SMEs). More in detail, the authors of [21] adoptthe definition provided in [16], considering Industry 4.0 as “a new approach for control-ling production processes by providing real-time synchronization of flows and by enablingthe unitary and customized fabrication of products.” Finally, the authors conclude thatapplications are mostly related to monitoring of production processes and to the improve-ment of current capabilities and flexibility, through the introduction of new technologies,such as Cloud Computing and Radio-Frequency IDentification (RFID). However, at thesame time, most of the possible opportunities (e.g., CPS, Machine-to-Machine (M2M),Big Data, or collaborative robots) are under-exploited, if not ignored, by SMEs.
Another key point is that the evolution process transforming a traditional companyinto a “smart industry” is generally smooth. One of the first steps relates to the digiti-
210_____________________________________________________________________________________
IoT-enabled Smart Monitoring and Optimization for Industry 4.0

zation (or digital transformation process) which has been identified as one of the majortrends changing society and business. Digitization, in fact, leads to changes in the compa-nies in both organizational and operational environments through the introduction of newtechnologies. In [27, 45], it is highlighted how the changes introduced by the digitizationcover different levels in a factory, such as: (i) the process level, in which processes areoptimized reducing manual steps and adopting new digital tools; (ii) the organizationallevel, where obsolete practices are discarded and new services are integrated; (iii) thebusiness domain level, in which value chains and roles inside ecosystems are changed; and(iv) the societal level (e.g., changing type of work). Moreover, in [14, 28], it is shown thatreplacing paper and manual processes with software-based solutions allows to automati-cally and quickly collect data that can be adopted to better understand the risk causesand the process performance. Finally, in [15, 40] the authors highlight the importance ofUser Interfaces (UIs) which a digitization process has to be equipped with, where real-time reports and dashboards on digital process performance allow managers to addressproblems before they become critical.
The current advancements in IoT, together with the development of new cost-effectiveand high-performance wireless communication systems, allow to connect devices and ob-jects, thus giving them the possibility to share information related to the surroundingenvironment. This enables the creation of effective CPSs which can continuously monitorand control the environment in the industrial domain. Therefore, the second phase thatcan transform a traditional company into a smart industry is the introduction of newIoT technologies, in order to collect data inside the factory and monitor processes. Thisparadigm is also denoted as Industrial IoT (IIoT), which an example of is provided in [12],where it is highlighted how the general assessment of the machine operational conditionis crucial for a smart and efficient industrial processes management. In [12], a prognosticapproach to the detection of incipient faults of rotating machines, by means of their vi-brational status monitoring, is proposed. Another IIoT-based solution is described in [8],where a particular mechanism, specifically designed to enable a pervasive monitoring ofindustrial machinery through battery-powered IoT sensing devices, is presented: the in-dustrial scenario covered a time period of two months and was based on thirty-three IoTsensing devices performing advanced temperature and vibration monitoring tasks, whileevaluating transmission delays and system operating life time through power consumptionmeasures. The adopted IoT protocols guarantee that each node is reachable through IPaddressing with an acceptable delay.
Another IIoT example is proposed in [23], in which the application of Low-PowerWide-Area Networks (LPWANs) in an industrial scenario is proposed. More in detail,the authors focus their work on the open LoRaWAN network standard [34], thus proposinga comparison with the IEEE 802.15.4 network protocol, which is another IoT protocolwidely adopted in the industrial context. The authors conclude that LoRaWAN representsa strongly viable opportunity, providing high reliability and timeliness, while ensuring verylow energy consumption.
After the digitization and monitoring through IIoT technologies phases, the last stepfor a smart industry is related to optimization of the company processes, leveraging theanalysis of the collected information. In [29], the authors observe how the widespreadadoption of IoT technologies is enabling a faster and more informative sensing, generatingdata abundance, more than ever. At the same time, technology advances provide also
_____________________________________________________________________________________ CNIT Technical Report-05 ꟷ Internet of Things: Technologies, Challenges and Impact
211

the computational resources needed to process this large amount of data, transformingthem into actionable information in a reasonably short time. A critical overview of trendscharacterizing the industrial process monitoring activity since its appearance (almost 100years ago) is provided, showing how this task has changed, from simple statistical analysis,to detection and, finally, to diagnosis and prognosis.
3 Digitization
3.1 Organization of the Company C
In order to discuss the evolution of a traditional company to an Industry 4.0-organizedsmart company, consider that the production activity of a generic company C is dividedinto N departments, each performing a specific production activity. Each produced ar-ticle crosses consecutive departments, where semi-finished goods are manufactured withdifferent machines’ configurations, among the production processes of several articles.Moreover, each department has a variable number of lines LN that can work simultane-ously.
The three main classes of actors operating in the company C and involved in theactivities are the following.
• Production Scheduling Managers (PSMs): they are in charge of controllingand organizing the production schedule of all lines available in the factory, takinginto account the stock policy and the commissions placed from customers.
• Quality Inspectors (QIs): they are responsible to perform continuous checks onproducts and semi-finished products directly on the production lines in the factory,in order to guarantee conformity to quality standards. Then, QIs follow the scheduledefined by PSMs and move between lines, in order to inspect the production process.
• Line Operators (LOs): they are responsible for preparing and activating theproduction machines on the production lines, following the schedule. During theproduction, LOs take measurement to monitor the production, thus also performingquality checks on the hoses, which are then validated by QIs.
Moreover, consider that the company C has defined a precise protocol to follow in thehoses production process. More in detail, after the definition of the schedule for eachline, performed by PSMs, each article to be produced is separated into a set of D Man-ufacturing Orders (MOs), one per department involved in the productive process. EachMO is then assigned to a specific line in the factory. In this way, a LO working on aproduction line is guaranteed to have a daily activity (namely, a list of MOs) to performon the line which he/she is responsible for. The manufacturing monitoring task of thecompany C is performed through the use of MO Forms (MOFs) printed on paper sheets.Each department in C has a specific MOF layout, in terms of input information typesand number of sections. Some of the sections are descriptive, aiming at showing someimportant information for the manufacturing process (i.e., configurations, measures, cus-tomizations); other sections are instead input sections that should be filled by LOs orQIs during the production with department-specific data or measurements. The possible
212_____________________________________________________________________________________
IoT-enabled Smart Monitoring and Optimization for Industry 4.0

Manufacturing Order Form
Header
Manufacturing Order Description
Quality Checks
Logs and Measurements
DescriptiveSections
LOs
QCs
PMs
Figure 2: MOFs structure.
section types that can be identified for the production quality control of the company Care described in the following and depicted in Figure 2.
The Header section simply identifies the MOF type, among the available ones, throughthe title together with a start date and an order alphanumeric code. The Manufactur-ing Order Description section is another part containing a list of textual informationdescribing the steps needed for order completion and machine configuration. The Logand Measurements is the part that has to be filled by LOs with the quantity of producedproducts, the quantity of raw materials employed on the line, the development status ofa order (if it requires multiple work shifts) and all other measurements that are requiredduring the production. The Quality Checks section contains the results of data surveysperformed during the production process, in order to verify that the products complywith the required standards. This section can have a different layout depending on theMOF type, as different production articles require specific quality checks. This sectionis periodically filled out by QIs. The protocol adopted by the company C in order tomonitor the productive process is based on the following daily steps.
1. Each morning, the PSM staff prints the MOFs corresponding to the MOs plannedfor the current work day and distributed to all factory departments, on each de-partment’s production line.
2. Each LO starts his/her work and, during the shift, fills out all MOFs received byhis/her department supervisor.
3. Each QI starts his/her work and, moving among the lines, he/she periodically com-pletes the quality section of the MOFs.
4. In the evening, each department supervisor collects the MOFs and delivers them tothe PSM staff. Finally, all paper sheets are manually scanned and stored as digitalimages, where inputs are only hand-written.
The production planning of the company C is an extremely important and time-consuming task, as it strongly affects both results and performance of the subsequent
_____________________________________________________________________________________ CNIT Technical Report-05 ꟷ Internet of Things: Technologies, Challenges and Impact
213

activities. The planning, on one side, should fulfill the customer requirements and, on theother side, should try to efficiently use both machines and human resources on the lines.This activity, in the company C, is performed by the PSM staff and managed throughthe use of virtual spreadsheets, with different layouts and rules depending on the specificdepartment. An example of structure spreadsheet is shown in [2].
A manual process for the planning activity can be extremely complicated and time-consuming for the PSMs, since it requires to take into account several factors (such ascustomers’ orders, machine configurations and delay, employees availability), and is notexempt from possible errors during data insertion. A complete description of aspectsrelated to digitization of control quality and planning processes in a real company areprovided in [2]—in the following subsection, only some aspects are highlighted abiding bya general perspective.
3.2 Digital Quality Control
In order to replace the use of paper-based MOFs, the company C has integrated in itsworkflow a smart Web-based application, here denoted as SmartFactory, allowing to:
• collect data, related to the production, in a fast and easy way;
• get rid of costs related to the print-scanning process;
• facilitate the work of QIs and LOs in the different departments, through the adoptionof both mobile devices (e.g., tablets) and PCs;
• efficiently manage updates and changes in the production process;
• save digital data through integration with the company IT and ERP systems.
The SmartFactory application, after a login process authenticating and authorizingusers, should present different views for PSMs, QCs and LOs. This login phase can lever-age on pre-existent technologies, like the operators’ personal Near Field Communication(NFC) badges, if they are already employed in the company C to access to the buildings.After the login phase, SmartFactory can redirect the user to a separate home page, cus-tomized depending on his/her role with a custom data visibility and privileges on differentmodules (namely, Read-Only, RO, and Read-Write, RW). As an example, LOs can writeon the Logs and Measurements section, and have RO privileges on the Quality Checkssection.
Another essential feature required by the process of digitization of company C, is tosimply find data of interest. For this reason, SmartFactory should include a researchfunctionality for both QIs and PSMs allowing them to find, in real-time, data relatedto orders (both in production and historical). Another important functionality is thepossibility to show orders requiring a supervision from the PSMs, in a separate andspecific application view.
3.3 Digital Planning Management
The planning activity is generally assigned to highly qualified staff, with a deep knowl-edge of all mechanisms regulating the whole company workflow, from provision office
214_____________________________________________________________________________________
IoT-enabled Smart Monitoring and Optimization for Industry 4.0

to sales department. Since a second stage of the digitization process in a generic com-pany C should include the production planning department, with the aim of replacingthe spreadsheet-based method, the SmartFactory application should include a Web-basedplanning tool allowing to: (i) simplify and speed up the planning process for PMs; (ii) hidethe complexity behind planning allocation calculations; and (iii) avoid planning errors.Moreover, this SmartFactory application’s module is only used by PSMs through a PCand is integrated with the company IT and ERP systems through a software extensionable to store all data related to the planning activity, which are not already registered.More in detail, the planning tool can include several modules. The Scheduling SuggestionsModule is responsible for accessing the ERP system and retrieving, for the PSMs, a listof articles to be produced, thus representing the starting point onto which work. TheShifts Manager Module allows to manage all information related to LOs’ shifts, such asthe hours availability in the department of interest. Then, the Planning Events Modulemanages the Graphical User Interface (GUI) replacing the virtual spreadsheet used byPSMs, and allowing them to drag-and-drop manufacturing orders on a calendar-basedview, in which columns show the working days and rows represent the production lines inthe department subject to the planning activity (hence with representation similar to thespreadsheets ones). The SmartFactory application is also responsible for calculating thereal duration of a MO event once it is placed on a specific cell. This calculation is per-formed considering: (i) the requested length of the hose; (ii) the production line’s velocity,retrieved analyzing historical data from the ERP; (iii) the shift duration planned for thespecific day; and (iv) configurations and setup delays. Finally, the Production ManagerModule stores data inserted by PSMs and manages the interaction with the company C’sERP system, in order to move planned events to the production system, making digitalMOs visible also in the quality control part of the SmartFactory application.
3.4 Main Advantages
The overall architecture of the SmartFactory application, with reference to the modulespreviously highlighted and their interactions, is shown in Figure 3.
It can be easily estimated that a first (and tangible) effect of the introduction ofthe SmartFactory application in a generic company C can be related to time savingaspects, due to the fact that forms are no longer printed on paper sheets nor manuallyscanned. Even the way to insert data from different actors may be certainly simplified,since SmartFactory allows a simultaneous access to MOFs, permitting QIs, LOs, andPSMs to input and view data on the same production order without interfering with eachother. Another important aspect to be considered is the quantity of structured data, madeavailable by the adopted digitization revolution, that are continuously collected and canbe employed to monitor the status of the production in real-time, but also constitute abasis for further analysis. The last advantage is related to the reduction of errors andfaulty products, as non-regular behaviors can be detected and recorded in real-time forfurther performance analysis.
Furthermore, with regard to the planning functionality that can be introduced in theSmartFactory application, the first advantage relates to the reduction of the number ofhours directly spent by PSMs for the MOs’ scheduling activity, but it is important toconsider also the reduction of time needed to train a new person dedicated to planningactivities. In fact, having the SmartFactory application hiding all aspects related to MOs’
_____________________________________________________________________________________ CNIT Technical Report-05 ꟷ Internet of Things: Technologies, Challenges and Impact
215

Smart Factory Application
SmartFactory ERP addons
Login Module
NFC connector
MOF ManagerModule
Scheduling Suggestion Module
Shifts Manager Module
User Interface
ERP
Figure 3: SmartFactory application overview.
duration calculations and providing the user with all required information in single view,a strong simplification of the work of PSMs is obtained, making possible for the companyto assign this activity also to other people, with a minimized learning phase. Finally, thecomplete digitization and automation of the planning process allows to make the completecompany plan available to all interested users.
4 Monitoring
On the basis of the concepts highlighted in Section 3, it has been clarified how a genericcompany C may benefit from a proper planning and quality control methodology, in orderto improve its productivity and lower downtime and errors in resource allocation [44].Looking at the company C as a step-by-step production chain, it is clear that data, onthe basis of which planning is performed, should be as accurate and delivered on-time aspossible.
This can be carried out in several ways. A first approach consists in extending thefunctionalities of the software tools described in Section 3, in order to create a frameworkof cooperating tools which also includes other aspects of the company C’s management.More in detail, the proposed planning tool can be integrated with a more general Cus-tomer Relationship Management (CRM) tool, aiming at managing information related tocustomers orders and due dates, products’ stock levels, and planned activities, as shownin Figure 4. As a second step, the company C’s software framework can be extendedwith a Supply Chain Management (SCM) tool, allowing operators to have a clear rep-resentation of the status of the working supply chain, through the use of a dashboardshowing running activities, production delays, warnings, and alarms related to working
216_____________________________________________________________________________________
IoT-enabled Smart Monitoring and Optimization for Industry 4.0

PLANNINGCRM SCM
Figure 4: Industry 4.0 monitoring with sensors on production machines, and planningand reporting dashboards.
machinery. This framework is generally built on top of a set of microservices, with itseffectiveness strictly related to the quality of information collected from the companyenvironment. This entails the introduction of IoT technologies, with the deploymentof sensor networks—preferably Wireless Sensor Networks (WSNs) [19]—directly insidethe factory environments and around each production machine, even involving differentcommunication and processing technologies, in order to cover different needs [20].
In the case of a production machine characterized, for its internal manufacturing, byvibrations of some kind, it can be possible to equip the machine itself with some “sensingnode” composed by a sensing element (e.g., a vibration sensor) connected with a 1-wirelink to a “core” module, in charge of processing the incoming data (either analog or dig-ital) and of doing additional tasks based on data themselves, such as sending the data toan upper-layer data collector, as well as internally storing the collected data for furtheranalysis and as a safe backup. Even though this approach is general, the communicationparadigm adopted for the harvested data forwarded to upper-layer systems may be ad-dressed based on the specific characteristics representing the industrial environment inwhich the production machine is placed, as shown in Figure 4. In other words, this sens-ing module can forward its collected data through an IEEE 802.3 (Ethernet) connection,if this protocol is available and useful on the production line, as well as taking advantageof the availability of an IEEE 802.11 (Wi-Fi) connection, which several sensing nodes canattach to and participate as IEEE 802.11 clients.
As can be easily understood, a sensing node can be equipped with various types ofsensors, able to detect different situations. An example can be a camera-based monitoringsystem, in which the sensor is video and its goal is to monitor a particular part of theproduction machine, as shown in Figure 5. In this scenario, the monitoring device providesseveral degrees of freedom, meaning that it can be customized with different setups andconfigurations (e.g., different types of cameras) based on the task that the IoT node shouldperform. In case the IoT system has to monitor with a certain accuracy a specific (andlimited in space) region of the overall environment, then the camera should be chosen withcertain characteristics (e.g., a High Quality (HQ) camera with an adequate frame ratio).If, instead, the IoT camera has to monitor with lower accuracy, then it can be a LowQuality (LQ) camera, thus lowering the overall price of the Industry 4.0 monitoring node.
_____________________________________________________________________________________ CNIT Technical Report-05 ꟷ Internet of Things: Technologies, Challenges and Impact
217

Alerting ManagementKey Performance Indicators (KPIs)Management
Storage Management
Figure 5: Industry 4.0 monitoring with camera sensors, vehicle positioning, and perfor-mance dashboards.
Obviously, these considerations certainly affect the core component of the sensing device,since it has to be defined on the basis of the need of analyzing a video stream, as well asa single frame taken by the camera. Moreover, in the case of a precise monitoring task,the processing element should perform proper processing, thus requiring a high amountof volatile memory (e.g., RAM), as well as a suitable Operating System, OS (possiblya real-time OS, RTOS). If monitoring should be less accurate, then processing can becarried out with more commercial (and less specialized) hardware.
Another way to monitor a machine involved in an Industry 4.0-oriented renovationprocess can be the definition and deployment of a network of IoT nodes organized witha proper topology, targeting the optimization of the communications inside the networkitself and the reachability of the information from outside the network. An illustrativecase study is given by a monitoring network composed by sensing nodes involving anon-field sensor, harvesting data from both the machine and the environment (as shownin Figure 4), and a processing module enabling the overall device to join and participateto a Bluetooth Low Energy (BLE)-based network [13]. Looking at topological level, inthis scenario each sensing node acts as a BLE slave, while in the production plant a BLEmaster should be elected to own and manage the BLE network and, in turn, to collectdata from its slaves. The BLE network topology can be selected depending on the needsand environment.
Another monitoring activity that an Industry 4.0-targeting company may consider isto exploit the possibilities “natively provided” by its production machines. The mostrelevant one is to access the Programmable Logic Controllers (PLCs) [3] managing theproduction machines, in order to collect (hopefully in a real-time mode) the productiondata exposed by the machine itself. This can be performed equipping each machine
218_____________________________________________________________________________________
IoT-enabled Smart Monitoring and Optimization for Industry 4.0

with a properly made “collector” node, composed of (i) a processing entity, in charge ofcollecting, storing, and forwarding on-field collected data to external—and high-layer—Supervisory Control and Data Acquisition (SCADA) systems [4]; and (ii) an on-fieldnetwork interface, able to directly talk with the production machine. In relation to thelatter component, the evolution that has taken place in the field of real-time productiondata collection, allows the company C to extend its on-field interfaces to support multiplecommunication protocols, ranging from ModBus (either through RS-485 or RS-232 cables)to Ethernet and CANBus [18]. Otherwise, if the data generated from the productionmachine needs to be restricted to a small amount of bytes (e.g., because they representonly an aggregated metric processed a few times in a certain time period), then thegeneric company C can consider to use some properly M2M-defined SIM cards, generallyenabled to support a fixed traffic amount and low speed, but acceptable for this kind ofindustrial scenarios. With regard to wired technologies (such as ModBus, CANBus, andIndustrial Ethernet), it is worth to specify that ModBus can be used as both fieldbus-and controller-level protocol, meanwhile CANBus is usually employed as fieldbus protocolonly [39]. Moreover, both protocols work at application layer, leaving the possibility toadopt different low-level physical protocols (e.g., wired technologies, such as RS485 [41],but also wireless ones, such as the uprising 5G [25, 22]) for transmitting information onthe field.
It is important to underline that M2M is related not only to cellular communications,but it generally identifies the interaction between heterogeneous smart devices, thus beingone of the IoT’s pillars. M2M can enable machines in the company C to exchange messagesto each other, in order to achieve a predefined objective, to provide a specific service, or tocomplete a task [11, 6]. Abiding by this paradigm on monitoring devices in the companyC’s environment and making communication flows to converge in “collector” nodes, allowsto create a M2M services layer, which can interact with SCM and planning tools. This canbe useful in: (i) identifying problems, errors or breakdowns to be reported to operators;(ii) providing a real-time monitoring of company machinery status; and (iii) reducing thequantity of input required to operators working on production lines (e.g., during qualitycontrol activities).
Finally, for the company C it can be interesting to collect, in addiction to M2M-related data from the production machines, also data related to the interactions betweenemployees and machines and, in general, with the industrial environment, in a Human-to-Machine (H2M)-oriented way. In this scenario, one could consider the introduction oflocalization-aware infrastructures for the sake of safety and security of the employees intheir work environment. In detail, it can be advisable the adoption of on-board precisetracking technologies (e.g., based on Ultra-WideBand (UWB) technology [33]) on indus-trial vehicles which are in charge of moving materials (e.g., from warehouse to productionlines, as well as among production plants). In this way, as shown in Figure 5, the re-sulting benefit is two-fold: on one hand, it is possible to plan vehicles’ trajectories, thusbetter managing the good movements; on the other hand, workers can be aware of theirsurrounding vehicles’ positions, thus increasing their safety and security. In order to im-prove these risk avoidance measures, the company C can define the adoption of additionalsensors (e.g., proximity sensors) directly on the vehicles, thus reducing even further (and,hopefully, completely avoiding) accidents involving humans and/or fixed obstacles (e.g.,shelving).
_____________________________________________________________________________________ CNIT Technical Report-05 ꟷ Internet of Things: Technologies, Challenges and Impact
219

IEEE 802.15.4 (2.4GHz)Physical
Data Link
Network
Transport
Session
Presentation
Application
ISO/OSI
NetworkAccess
IP
TCP
Application
TCP/IP
IEEE 802.15.4
TDMA, Channel Hopping
Redundant PathsMesh Networks
Auto-Segmented transferof large datasets.
Reliable Stream Transport
Command Oriented.Predefined Data Types and
Application Procedures
WirelessHART (2.4GHz)
IEEE 802.15.4 (2.4GHz)
IEEE 802.15.4
Upper Data Link ISA100.11a
6LoWPAN(IETF RFC 4944)
UDP(IETF RFC 768)
ISA Native and LegacyProtocols (Tunneling)
ISA100.11a
Figure 6: Layered stacks view of WirelessHART and ISA100.11a protocols.
As a conclusion, it is quite clear how, among all cited communication technologies, thewireless ones represent an essential business enabler for the industrial world, because oftheir reliability, fast deployment, flexibility, cost effectiveness, and capacity to be adequatein (i) pulling data from deployed devices and (ii) sending supervisory control commandsto working machinery (e.g., open/close to a valve and start/stop to an actuator) [38]. Tothis end, the evolving SCADA technology continues to take advantage of emerging tech-nologies at different layers, with the drawback of deploying various heterogeneous andfragmented wireless platforms. This is also due to a limited number of certified wirelessinstrumentation devices complying with WirelessHART or ISA100.11a [26, 10] specifi-cations, whose layered protocol structures are shown in Figure 6 and directly comparedwith the 7-layer Open System Interconnect (OSI) model and TCP/IP protocol stack.
On the basis of their coverage area, industrial wireless technologies can be classifiedinto three main categories: (i) WSNs, including ISA100.11a, WirelessHART, ZigBee,and IPv6 over Low-power Wireless Personal Area Network (6LoWPAN); (ii) backbonenetworks, dominated by IEEE 802.11a/b/g/n/ac protocol; and (iii) backhaul networks,involving Ultra High Frequency (UHF) radio and evolving toward 4G Long-Term Evolu-tion (LTE)/5G, satellite, and microwave technologies. Referring to the ISA100 standard,wireless applications can be grouped into three classes: monitoring, control, and safety.As shown in Figure 7, wireless technologies should be used for noncritical control (Class 2and Class 3) and monitoring (Class 4 and Class 5) applications, while safety applications,devoted to always-critical emergency situations, should be handled by certainly-availableand reliable wired technologies.
220_____________________________________________________________________________________
IoT-enabled Smart Monitoring and Optimization for Industry 4.0

Classification
Class 0: Emergency action (always critical)
Class 1: Closed-loop regulatory control (often critical)
Class 2: Closed-loop supervisory control (usually not critical)
Class 3: Open-loop control (human in the loop)
Class 4: Alerting (short-time operational consequence, e.g.,event-based maintenance)
Class 5: Logging and downloading/uploading (no immediateoperational consequence, e.g., history collection, sequence ofevents, preventive maintenance)
Application
Safety
Control
Monitoring
Wire
less
Techno
logies
Figure 7: Wireless application classification.
5 Predictive Optimization
The techniques previously shown in Section 3 and Section 4 can be used by the companyC to collect data from different (and heterogeneous) sources, targeting a more accurateoverall situation monitoring of the company itself. As widely known, in the last yearsthere is an increasing interest on the use of the large amount of data which can be col-lected in these scenarios, in order to extract relevant information. As shown in Figure 8,most companies have only recently started to take advantage of the possibilities intro-duced by both on-premise and far-from-home storage and processing mechanisms (e.g.,Edge Computing, Fog Computing, Cloud Computing) for their large amount of collecteddata [31, 42].
Focusing on digitization activities, the quality control and planning tasks described inSection 3 can be enhanced giving to the technical departments more precise informationthat can help the staff in improving the planning of the activities to be performed insidethe factory. These activities include, for example, the estimation of the warehouse stocksutilization over a certain time period (as well as on multiple time periods, for the sakeof comparison), either predicting how a specific material employed during the productionof hoses will be entirely consumed, as well as highlighting possible misuses or excessiveutilization. The final goal is to optimize the use of resources, avoiding, or at least reducing,the waste of materials (which also has a relevant financial impact for the company C).
The data collected from the production machines can be exploited to forecast theproductivity level of a certain product over a particular time interval. This, for sure,may help to optimize the utilization of materials required by an employee from the ware-house. The analysis of the on-field production data allows to optimize the maintenanceof the production machines. In detail, the ability to collect data from production ma-chines allows to timely perform specific part replacement before its actual fault. This canhappen in two ways: (i) the part will be replaced in a preemptive way [7], knowing itsexact lifetime; or (ii) the replacement will happen following a predictive approach [35, 9],based on a more accurate information processing and analysis, involving a more compre-hensive dataset (possibly composed by heterogeneous data regarding different aspects of
_____________________________________________________________________________________ CNIT Technical Report-05 ꟷ Internet of Things: Technologies, Challenges and Impact
221
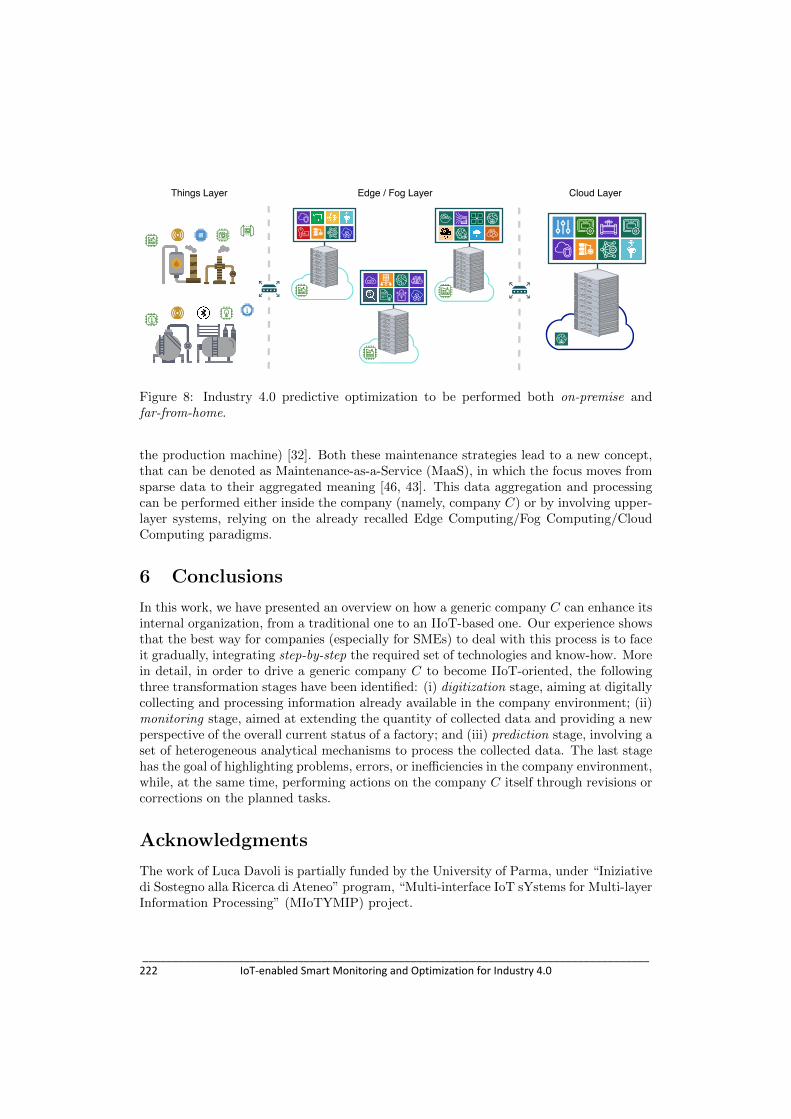
Things Layer Edge / Fog Layer Cloud Layer
Figure 8: Industry 4.0 predictive optimization to be performed both on-premise andfar-from-home.
the production machine) [32]. Both these maintenance strategies lead to a new concept,that can be denoted as Maintenance-as-a-Service (MaaS), in which the focus moves fromsparse data to their aggregated meaning [46, 43]. This data aggregation and processingcan be performed either inside the company (namely, company C) or by involving upper-layer systems, relying on the already recalled Edge Computing/Fog Computing/CloudComputing paradigms.
6 Conclusions
In this work, we have presented an overview on how a generic company C can enhance itsinternal organization, from a traditional one to an IIoT-based one. Our experience showsthat the best way for companies (especially for SMEs) to deal with this process is to faceit gradually, integrating step-by-step the required set of technologies and know-how. Morein detail, in order to drive a generic company C to become IIoT-oriented, the followingthree transformation stages have been identified: (i) digitization stage, aiming at digitallycollecting and processing information already available in the company environment; (ii)monitoring stage, aimed at extending the quantity of collected data and providing a newperspective of the overall current status of a factory; and (iii) prediction stage, involving aset of heterogeneous analytical mechanisms to process the collected data. The last stagehas the goal of highlighting problems, errors, or inefficiencies in the company environment,while, at the same time, performing actions on the company C itself through revisions orcorrections on the planned tasks.
Acknowledgments
The work of Luca Davoli is partially funded by the University of Parma, under “Iniziativedi Sostegno alla Ricerca di Ateneo” program, “Multi-interface IoT sYstems for Multi-layerInformation Processing” (MIoTYMIP) project.
222_____________________________________________________________________________________
IoT-enabled Smart Monitoring and Optimization for Industry 4.0

References
[1] Mohammad Aazam, Sherali Zeadally, and Khaled A Harras. “Deploying fog com-puting in industrial internet of things and industry 4.0”. In: IEEE Transactionson Industrial Informatics 14.10 (2018), pp. 4674–4682. doi: 10.1109/TII.2018.2855198.
[2] Laura Belli et al. “Toward Industry 4.0 with IoT: Optimizing Business Processesin an Evolving Manufacturing Factory”. In: Frontiers in ICT 6 (2019), p. 17. issn:2297-198X. doi: 10.3389/fict.2019.00017.
[3] William Bolton. Programmable Logic Controllers. 4th ed. Newnes, 2015. 292 pp.isbn: 978-0-7506-8112-4.
[4] Stuart A Boyer. SCADA: Supervisory Control And Data Acquisition. 4th ed. Inter-national Society of Automation, 2009. 257 pp. isbn: 978-1-9360-0709-7.
[5] Hugh Boyes et al. “The industrial internet of things (IIoT): An analysis framework”.In: Computers in Industry 101 (2018), pp. 1–12.
[6] Jim Brodie Brazell et al. M2M: the wireless revolution. Tech. rep. 2005.
[7] Donato Catenazzo, Brendan O’Flynn, and Michael Walsh. “On the Use of Wire-less Sensor Networks in Preventative Maintenance for Industry 4.0”. In: 2018 12thInternational Conference on Sensing Technology (ICST). Limerick, Ireland, Dec.2018, pp. 256–262. doi: 10.1109/ICSensT.2018.8603669.
[8] Federico Civerchia et al. “Industrial Internet of Things Monitoring Solution for Ad-vanced Predictive Maintenance Applications”. In: Journal of Industrial InformationIntegration 7 (2017), pp. 4–12. issn: 2452-414X. doi: 10.1016/j.jii.2017.02.003.
[9] Michele Compare, Piero Baraldi, and Enrico Zio. “Challenges to IoT-enabled Pre-dictive Maintenance for Industry 4.0”. In: IEEE Internet of Things Journal (2019),pp. 1–1. issn: 232-2541. doi: 10.1109/JIOT.2019.2957029.
[10] Marcio S. Costa and Jorge L. M. Amaral. Analysis of wireless industrial automa-tion standards: ISA-100.11a and WirelessHART. https://tinyurl.com/isa100whart.Accessed: 2020-04-05. Nov. 2012.
[11] Mathias Santos De Brito et al. “Towards programmable fog nodes in smart fac-tories”. In: 2016 IEEE International Workshops on Foundations and Applicationsof Self* Systems (FAS* W). IEEE. Augsburg, Germany, 2016, pp. 236–241. doi:10.1109/FAS-W.2016.57.
[12] Giuseppe Dinardo, Laura Fabbiano, and Gaetano Vacca. “A Smart and IntuitiveMachine Condition Monitoring in the Industry 4.0 Scenario”. In: Measurement 126(2018), pp. 1–12. issn: 0263-2241. doi: 10.1016/j.measurement.2018.05.041.
[13] Carles Gomez, Joaquim Oller, and Josep Paradells. “Overview and Evaluation ofBluetooth Low Energy: An Emerging Low-Power Wireless Technology”. In: Sensors12.9 (2012), pp. 11734–11753. issn: 1424-8220. doi: 10.3390/s120911734.
[14] Mark Huberty. “Awaiting the Second Big Data Revolution: From Digital Noise toValue Creation”. In: Journal of Industry, Competition and Trade 15.1 (Mar. 2015),pp. 35–47. issn: 1573-7012. doi: 10.1007/s10842-014-0190-4.
_____________________________________________________________________________________ CNIT Technical Report-05 ꟷ Internet of Things: Technologies, Challenges and Impact
223

[15] Marika Miriam Iivari et al. “Toward Ecosystemic Business Models in the Contextof Industrial Internet”. In: Journal of Business Models 4.2 (2016), pp. 42–59. issn:2246-2465. doi: 10.5278/ojs.jbm.v4i2.1624.
[16] Dorothee Kohler and Jean-Daniel Weisz. Industrie 4.0: Les Defis de la Transforma-tion Numerique du Modele Industriel Allemand. La Documentation francaise Paris,2016. 176 pp. isbn: 978-2-1101-0210-2.
[17] C. Koulamas and A. Kalogeras. “Cyber-Physical Systems and Digital Twins in theIndustrial Internet of Things”. In: Computer 51.11 (Nov. 2018), pp. 95–98. issn:1558-0814. doi: 10.1109/MC.2018.2876181.
[18] Wolfhard Lawrenz. CAN System Engineering. From Theory to Practical Applica-tions. 2nd ed. Springer-Verlag London, 2013. 353 pp. isbn: 978-1-4471-5612-3.
[19] Xiaomin Li et al. “A Review of Industrial Wireless Networks in the Context ofIndustry 4.0”. In: Wireless Networks 23.1 (Jan. 2017), pp. 23–41. issn: 1572-8196.doi: 10.1007/s11276-015-1133-7.
[20] Chun-Cheng Lin et al. “Key Design of Driving Industry 4.0: Joint Energy-EfficientDeployment and Scheduling in Group-Based Industrial Wireless Sensor Networks”.In: IEEE Communications Magazine 54.10 (Oct. 2016), pp. 46–52. issn: 1558-1896.doi: 10.1109/MCOM.2016.7588228.
[21] Yang Lu. “Industry 4.0: A Survey on Technologies, Applications and Open ResearchIssues”. In: Journal of Industrial Information Integration 6 (2017), pp. 1–10. issn:2452-414X. doi: 10.1016/j.jii.2017.04.005.
[22] M. Luvisotto et al. “Real-time Wireless Extensions of Industrial Ethernet Net-works”. In: 2017 IEEE International Conference on Industrial Informatics (IN-DIN). Emden, Germany, Nov. 2017, pp. 363–368. doi: 10.1109/INDIN.2017.
8104799.
[23] Michele Luvisotto et al. “On the Use of LoRaWAN for Indoor Industrial IoT Appli-cations”. In: Wireless Communications and Mobile Computing 2018 (2018). issn:1530-8669. doi: 10.1155/2018/3982646.
[24] Alexandre Moeuf et al. “The Industrial Management of SMEs in the Era of Industry4.0”. In: International Journal of Production Research 56.3 (2018), pp. 1118–1136.doi: 10.1080/00207543.2017.1372647.
[25] A. Neumann et al. “Towards Integration of Industrial Ethernet with 5G Mobile Net-works”. In: 2018 IEEE International Workshop on Factory Communication Systems(WFCS). Imperia, Italy, June 2018, pp. 1–4. doi: 10.1109/WFCS.2018.8402373.
[26] Mark Nixon. A Comparison of WirelessHART and ISA100.11a. Tech. rep. Accessed:2020-04-04. Emerson Process Management, Sept. 2012, pp. 1–39. url: https://www.emerson.com/documents/automation/white-paper-a-comparison-of-
wirelesshart-isa100-11a-en-42598.pdf.
[27] Paivi Parviainen et al. “Tackling the Digitalisation Challenge: How to Benefitfrom Digitalisation in Practice”. In: International Journal of Information Systemsand Project Management 5.1 (2017), pp. 63–77. issn: 2182-7788. doi: 10.12821/ijispm050104.
224_____________________________________________________________________________________
IoT-enabled Smart Monitoring and Optimization for Industry 4.0

[28] Sarah Quinton and Lyndon Simkin. “The Digital Journey: Reflected Learningsand Emerging Challenges”. In: International Journal of Management Reviews 19.4(2016), pp. 455–472. doi: 10.1111/ijmr.12104.
[29] Marco S. Reis and Geert Gins. “Industrial Process Monitoring in the Big Data-Industry 4.0 Era: from Detection, to Diagnosis, to Prognosis”. In: Processes 5.3(2017), p. 35. issn: 2227-9717. doi: 10.3390/pr5030035.
[30] Vasja Roblek, Maja Mesko, and Alojz Krapez. “A Complex View of Industry 4.0”.In: SAGE Open 6.2 (2016), pp. 1–11. doi: 10.1177/2158244016653987.
[31] Radhya Sahal, John G. Breslin, and Muhammad Intizar Ali. “Big Data and StreamProcessing Platforms for Industry 4.0 Requirements Mapping for a Predictive Main-tenance Use Case”. In: Journal of Manufacturing Systems 54 (2020), pp. 138–151.issn: 0278-6125. doi: 10.1016/j.jmsy.2019.11.004.
[32] Erim Sezer et al. “An Industry 4.0-Enabled Low Cost Predictive Maintenance Ap-proach for SMEs”. In: 2018 IEEE International Conference on Engineering, Tech-nology and Innovation (ICE/ITMC). Stuttgart, Germany, June 2018, pp. 1–8. doi:10.1109/ICE.2018.8436307.
[33] Kazimierz Siwiak. “Ultra-Wide Band Radio: Introducing a New Technology”. In:IEEE VTS Vehicular Technology Conference, Spring 2001. Proceedings (Cat. No.01CH37202). Vol. 2. Rhodes, Greece, Greece, May 2001, pp. 1088–1093. doi: 10.1109/VETECS.2001.944546.
[34] Nicholas Sornin et al. LoRaWAN Specification. https://tinyurl.com/loraspecv10.Accessed: 2019-01-27. Jan. 2015.
[35] Lukas Spendla et al. “Concept of Predictive Maintenance of Production Systemsin Accordance with Industry 4.0”. In: 2017 IEEE International Symposium on Ap-plied Machine Intelligence and Informatics (SAMI). Herl’any, Slovakia, Jan. 2017,pp. 405–410. doi: 10.1109/SAMI.2017.7880343.
[36] Fei Tao et al. “Digital Twins and Cyber–Physical Systems toward Smart Manufac-turing and Industry 4.0: Correlation and Comparison””. In: Engineering 5.4 (2019),pp. 653–661. issn: 2095-8099. doi: 10.1016/j.eng.2019.01.014.
[37] Birgit Vogel-Heuser and Dieter Hess. “Guest Editorial Industry 4.0—-Prerequisitesand Visions”. In: IEEE Transactions on Automation Science and Engineering 13.2(Apr. 2016), pp. 411–413. issn: 1558-3783. doi: 10.1109/TASE.2016.2523639.
[38] Soliman A. Al-Walaie. Industrial wireless evolution - The next-generation processautomation wireless technology. https://www.isa.org/intech/20151001/. Accessed:2020-04-03. Sept. 2015.
[39] S. Wang et al. “An Integrated Industrial Ethernet Solution for the Implementationof Smart Factory”. In: IEEE Access 5 (Nov. 2017), pp. 25455–25462. doi: 10.1109/ACCESS.2017.2770180.
[40] Andreas Wank et al. “Using a Learning Factory Approach to Transfer Industrie4.0 Approaches to Small- and Medium-sized Enterprises”. In: Procedia CIRP 54(2016). 6th CIRP Conference on Learning Factories, pp. 89–94. issn: 2212-8271.doi: 10.1016/j.procir.2016.05.068.
_____________________________________________________________________________________ CNIT Technical Report-05 ꟷ Internet of Things: Technologies, Challenges and Impact
225

[41] Xuepei Wu and Lihua Xie. “Performance Evaluation of Industrial Ethernet Pro-tocols for Networked Control Application”. In: Control Engineering Practice 84(2019), pp. 208–217. issn: 0967-0661. doi: 10.1016/j.conengprac.2018.11.022.
[42] Jihong Yan et al. “Industrial Big Data in an Industry 4.0 Environment: Challenges,Schemes, and Applications for Predictive Maintenance”. In: IEEE Access 5 (2017),pp. 23484–23491. issn: 2169-3536. doi: 10.1109/ACCESS.2017.2765544.
[43] Theodore Zahariadis et al. “Preventive Maintenance of Critical Infrastructures using5G Networks Drones”. In: 2017 IEEE International Conference on Advanced Videoand Signal Based Surveillance (AVSS). Lecce, Italy, Aug. 2017, pp. 1–4. doi: 10.1109/AVSS.2017.8078465.
[44] Ray Y. Zhong et al. “Intelligent Manufacturing in the Context of Industry 4.0: AReview”. In: Engineering 3.5 (2017), pp. 616–630. issn: 2095-8099. doi: 10.1016/J.ENG.2017.05.015.
[45] Alfred Zimmermann et al. “Adaptive Enterprise Architecture for Digital Transfor-mation”. In: Advances in Service-Oriented and Cloud Computing. Ed. by AntonioCelesti and Philipp Leitner. Taormina, Italy: Springer International Publishing,2016, pp. 308–319. isbn: 978-3-319-33313-7. doi: 10.1007/978-3-319-33313-7_24.
[46] Marian Zoll, Daniel Jack, and Marcus Vogt. “Evaluation of Predictive Maintenance-as-a-Service Business Models in the Internet of Things”. In: IEEE InternationalConference on Engineering, Technology and Innovation (ICE/ITMC). Stuttgart,Germany, June 2018, pp. 1–9. doi: 10.1109/ICE.2018.8436272.
226_____________________________________________________________________________________
IoT-enabled Smart Monitoring and Optimization for Industry 4.0

A Flexible Mobility System based on Small and Low-emission Vehicles for Smart and Green Mobility
Silvia Ullo1,*, Mariano Gallo1, Maurizio Di Bisceglie1, Carmela Galdi1, Mario Marinelli1,
Luigi Glielmo1, Giovanni Palmieri1, Pietro Amenta2, Antonella Ferrara3, Michele Ferrucci4, Gianpaolo Romano4, Mariarosaria Russo5, Marco De
Angelis6
1University of Sannio, Department of Engineering
Piazza Roma, 21, 82100 Benevento, ITALY email: [email protected], [email protected], [email protected],
[email protected], , [email protected], [email protected], [email protected]
2University of Sannio, Department of Law, Economics, Management and
Quantitative Methods Piazza Arechi II, 82100 Benevento, ITALY
email: [email protected]
3University of Pavia, Department of Industrial and Information Engineering Via A. Ferrata, 5, 27100 Pavia, ITALY
email: [email protected]
4CIRA - Centro Italiano Ricerche Aerospaziali Via Maiorise, 81043 Capua (CE), ITALY
email: [email protected], [email protected]
5KES S.r.l. Via Mario Vetrone, 82100 Benevento, ITALY
email: [email protected]
6Consorzio iCampus Via Acquasanta, 31, 84131 Salerno, ITALY
email: [email protected]
Abstract: The environmental impact of transportation systems is considered a crucial point when new solutions must be adopted to enhance life quality in urban areas. All countries are seriously supporting and adopting green
_____________________________________________________________________________________ CNIT Technical Report-05 ꟷ Internet of Things: Technologies, Challenges and Impact
227

transportation systems according to increasingly stringent environmental quality targets. In this context, this paper introduces an innovative mobility system based on small and low-emission vehicles aimed to spread Mobility as a Service (MaaS) paradigm. The proposed system is based on a connected heterogeneous intelligent and personalized architecture integrated within an Intelligent Transportation System (ITS) framework. We assume the mobility as no longer a product, but the interconnection of different transport modes to find the best alternative based on comfort and convenience. As a result, this mobility system will provide a service with intermediate features between the private car and transit systems without fixed-scheduling and fixed-routes.
1. Introduction Urban and extra-urban mobility management is becoming highly complex when considering the main external impacts linked to traffic congestion, air pollution, noise and accidents. If these impacts are neglected, it results in a loss of efficiency, increasing costs of public and private resources, and an unacceptable level of costs for sustainability. According to the White Paper [1], the European Commission is setting up increasingly stringent environmental quality targets, such as a 60% reduction for transport emissions within 2050. Consequently, all governments should set up a broader range of leverages, policies, adoption of state-of-the-art technologies, revised economic models, tax incentives and contributions to driving investment towards new sustainable, intermodal and innovative mobility systems. In particular, the White Paper specifies the main strategies to be adopted like the improvement of vehicles’ energy efficiency and more efficient use of transport modes, considering Intelligent Transportation Systems for information to users and traffic management. Moreover, strategies for urban transport and commuting involve the gradual elimination of conventional fuel vehicles, encouraging the use of smaller, lighter and specialized passenger cars, and the increase of collective transport demand. In 2014, the Italian Ministry of Infrastructure and Transport adopted the National Plan for Intelligent Transport Systems (ITS) [2]. It pushes towards
228_____________________________________________________________________________________
A Flexible Mobility System based on Small and Low-emission Vehicles for ...

ITS solutions such as multimodal mobility systems by integrating local public transport with private and alternative modes. According to these main objectives, we aim to give a significant contribution to the way of reducing pollutant emissions by aligning with some of the strategies outlined by the European Commission and the Italian Government. We propose an ITS framework for information and traffic management to promote the use of low emission and small-sized vehicles integrated with the collective transport system. The proposed framework pushes more and more towards Smart Mobility, including Mobility as a Service (MaaS) and the reduction of private cars for collective transport systems. A new formulation of real-time services is given: through a mobile device application the user is able to book a mobility service to reach the desired destination by using a vehicle close to his/her position. The system will identify travel times based on the most convenient routes and known congestion conditions and indicate one or more possible travel alternatives obtained by integrating existing mobility services from an intermodal perspective. The target is to design and develop a mobility-oriented ITS framework equipped with sensors, acquisition devices and transmission system. The proposed framework is able to obtain and process a wide information base, in order to integrate it into a MaaS. Using Big Data Analytics methodologies and Machine Learning techniques, it will discover, extract, expose, share, and connect, in a fast and effective way, high frequency updated information to users, who can interact with the system through a simple mobile application. In [3] and [4] a project proposal based on these concepts (NETCHIP project) is described.
The paper is structured as follows. In Section 2, we frame the work in the MaaS paradigm. The transport system model is introduced in Section 3. The overall architecture of the system is described in Section 4. The issues related to data analysis, transmission, collection and security are studied in Section 5. Section 6 concludes.
2. The Mobility-as-a-Service paradigm In the last twenty years, mobility is changing the classical form of separated services among different transport modes towards a new concept based on a single mobility service accessible on demand. This new mobility paradigm,
_____________________________________________________________________________________ CNIT Technical Report-05 ꟷ Internet of Things: Technologies, Challenges and Impact
229

known as Mobility-as-a-Service (MaaS), provides a list of mobility options obtained as a combination of local public transport, ride-, car- or bike-sharing, taxi or car rental. Thus, assuming a system where mobility is no longer a product but the interconnection of existing transport systems, we propose an innovative MaaS prototype which aims to find the best alternative based on comfort and convenience, by selecting paths and costs that are no longer standardized on a predefined line but flexible to user needs. The main aim is to design an innovative flexible transit service, with similar features of a Paratransit system [5]. The Paratransit class includes several mobility services like the followings: Car Sharing: this system provides that users can use shared cars and
hence no owners, typically in urban areas, by paying a fare based on their usage time and kilometres travelled.
Taxi: this service is practically present in all medium-large cities of the world and is very similar to personal cars, in terms of flexibility in time and space; it is characterized by high fares so that its use is limited to occasional trips.
Dial-a-ride: these systems are very similar to classic bus systems. This is a service, usually carried out with small size vehicles and with variable frequency, in which the user usually books the trip in advance (from the day before to 4-6 hours before) indicating the origin, destination and time desired beginning or ending journey. The service is organised to meet most user requests. Dial-a-ride system also includes route diversion services; these are traditional bus line services that can, however, deviate from the predetermined route to collect users in low-demand areas.
Jitneys: these systems are commonly used in developing countries and consist of cars or minivan (from 5 to 15 seats), owned by privates, who operate on fixed routes, in some cases with small route deviations, which pick up and leave users along the route, often with no fixed stops. No reservation service is provided.
The MaaS-based system is able to find different rides between an origin-destination pair using public transportation services already present in the user urban area. As a result, this mobility system will provide a service with intermediate features between the private car and the fixed-scheduling and fixed-routes transit systems. Moreover, the overall management system requires the use of road traffic simulation models which allow calculating network performances (travel
230_____________________________________________________________________________________
A Flexible Mobility System based on Small and Low-emission Vehicles for ...

times, average speed, etc.). The obtained information is used to organize and manage in real-time vehicles travelling in the road network (paths to follow, users to withdraw, etc.), using dynamic routing algorithms. The end-user will interact with the system using a mobile application through the following main steps: 1. the user is geo-located, and he/she selects the desired destination; 2. the system computes the available multimodal routes and delivers them
to the user, providing paths and prices attributes; 3. the user selects one of the provided alternatives and completes the
procedure with payment by credit card: the system state will not change until the end of the procedure.
Behind such a service, a control strategy, based on some optimization criteria, is required to find different ride solutions (the fastest, the cheapest, the most comfortable). In this “active” approach, the user can reserve his/her seat on the ride and the system will coordinate the available vehicles according to the selected solution. The chosen solution enables the automatic procedures of real-time seat reservation and real-time routing of the involved services. The different ride solutions with their different prices are the output of complex mathematical problems that should be solved in a very short time to guarantee a real-time service. Thus, to reduce the computational complexity, the control and optimization strategy is made of two different hierarchical tasks. The first one, at the high level, is to identify the starting and ending points that the involved vehicle must travel between. Then, the proposed solutions are integrated with the public transport system. It could be possible to obtain solutions that require the use of public transport in order to reach the starting and/or ending point of the ride performed by a vehicle of the fleet. For this reason, it is not guaranteed that the starting and ending points performed by the vehicle of the fleet will coincide with the origin and destination points as requested by the user. Once the starting and ending points are computed, at the lower level, the control strategy is responsible for computing the shortest path (in terms of total travel time), the cheapest path (in terms of ride price) and the most convenient path (in terms of walking distance). The proposed service is designed to serve urban areas. Figure 1 shows a qualitative chart that frames the proposed system in the different classes of road transit systems. The proposed system is characterized by high flexibility, slightly lower than the one offered by the taxi, but with costs
_____________________________________________________________________________________ CNIT Technical Report-05 ꟷ Internet of Things: Technologies, Challenges and Impact
231

considerably lower than the taxi service, although higher than the traditional bus lines.
Figure 1. The proposed system
3. The transport system model The system management requires road traffic simulation models to evaluate network performances and provide up-to-date information to users. To this aim, we formulate a new hybrid model of the transportation system that can be regarded as a micro-macro model. In the literature, three different classes of road traffic models are generally considered: macroscopic models, where traffic flows are assimilated to a fluid using
hydrodynamics relationships and provide an aggregate representation of
232_____________________________________________________________________________________
A Flexible Mobility System based on Small and Low-emission Vehicles for ...

traffic conditions. Examples are the well-known Cell Transportation Model (CTM) [6]-[7] or the recent Variable Length Model (VLM) [8];
microscopic models, which simulate single-vehicle dynamics and its interaction with surrounding vehicles [9];
mesoscopic models [10]-[11], which combine the macroscopic flow dynamics description with the microscopic interaction of packets made up of vehicles with homogenous characteristics.
The road network, where the flexible public transport system will serve users’ requests, is modelled as a graph consisting of nodes and arcs. The spatial and temporal resolution of the transport network model (i.e., for instance, the number of flow transmission cells in which each arc is split) depends on the data which can be acquired in real-time. The model is used to make predictions about traffic flow dynamics, and it is re-initialized whenever new data are acquired to obtain simulations as reliable as possible. Once formulated, the model is also validated using historical data. The macroscopic model is used as the basis for the decision-making process to find the best alternatives based on criteria such as comfort, economic convenience, and minimum arrival time at the destination. The vehicles’ dynamics in the flexible public transport system are simulated using a microscopic modelling approach. Each vehicle is considered as an agent with its characteristics in the dynamic network assignment to obtain a resulting coordinated behavior in order to reach the quality of service and emissions’ reduction objectives. In the overall modelling approach, vehicles are simulated as embedded in the macroscopic traffic flow, which motivates the use of the term “micro-macro” [12, 13] for the proposed model. After designing the overall urban traffic model, the implementation of control strategies is made using a simplified urban traffic model to predict traffic flows in a short time and to ensure real-time application. The simplified model is validated using comparative simulations. Reduced Model Design is a modelling activity in which some details or some dynamics of complete simulation models are neglected without loss of the desired information. This process requires an accurate study of the complete model in order to understand which detail or which dynamics could be neglected without generating a significant error. The reduction process should be validated with parallel simulations between the complete and the reduced model to compare the evolution of the two models and check the prediction error. The micro-macro model is used as a tool in the decision-making process aimed to propose different multimodal transport alternatives to the user. The
_____________________________________________________________________________________ CNIT Technical Report-05 ꟷ Internet of Things: Technologies, Challenges and Impact
233

alternatives are formulated by the decision-making module based on the different criteria specified by the user when requesting the service. Criteria can include comfort, affordability, time to reach the destination, but also the smallest volume of environmentally harmful emissions, with the aim of encouraging more eco-friendly behavior among users. The main system management features of the transport system model are the followings: Road network data retrieval. As far as the transport system model is
concerned, it is expected to receive information on actual traffic conditions from the sensors when they are available. Such data sending will result in a re-initialization of model state variables so as to keep the model as close to reality as possible. Sensors are expected to send data synchronously or asynchronously depending on their nature.
Steady-state management. In the absence of service requests, the micro-macro model of the transport system will work in real-time, remaining synchronized with the physical traffic system.
User requests management. The transport system model will receive a service request when an interested user sends a "query" to the system itself. The interface module with the transport system model will have to extract information from the query, such as the origin-destination pair, and the user-selected criteria among those available. Such information is sent from the interface module to the transport system model.
Solutions generation management. The transport system model, after a service request, generates a temporary instance to compute as fast as possible the various eligible solutions according to the user-selected criteria. The identified solutions (i.e., optimal paths) are sent to the decision module in a predetermined format (e.g., sequences of network graph nodes and arcs indices). At the decision-making level, these solutions can be then compared and integrated with those based on other available transport modes in the geographic area (urban trains, subway, urban buses, etc.). The aim is to offer multimodal solutions to the user if more convenient than the unimodal ones elaborated by the micro-macro model.
Finally, the micro-macro model may also receive a service request directly from a vehicle monitoring module. This can occur whenever unexpected events (incidents, work in progress, etc.) happen at the time a certain solution is proposed by the micro-macro model to the decision-making module (and then accepted by the user). In this case, the values previously
234_____________________________________________________________________________________
A Flexible Mobility System based on Small and Low-emission Vehicles for ...

computed exceed a predetermined threshold and, thus, the model is helpful for the decision-making module in evaluating re-routing solutions and/or suggesting multimodal alternatives to users already travelling.
4. The overall system architecture The system architecture is designed by defining new methodologies for data transmission and gathering. The system design is mainly based on the implementation of two parts: 1. a system for collecting and transmitting data from the served area and
vehicles, equipped with intelligence able to detect patterns and provide real-time results;
2. a cloud-based infrastructure for the propagation of services to end-user and administrators.
From a transportation point of view, the system is able to: monitor traffic conditions, with ground sensors and vehicles used as
probes; estimate real-time traffic conditions based on historical data and in
conjunction with the traffic monitoring system; collect real-time user requests, in terms of origin-to-destination trips,
desired departure time or arrival time, and other specifications could be provided;
monitor the position of vehicles on the network, their routes, occupancy status and service availability;
elaborate user requests in real-time by assigning to each request a path, possibly intermodal, that involves one or more trip segments served by the system;
offer travel prices to the user that are dynamically calculated according to the available demand and supply in the required time window and subject to other user specifications;
complete the service purchase agreement and manage payments with money-less services (credit cards, Paypal, etc.);
elaborate and send information in real-time to vehicle drivers about user origin-destination pair, users to be served along the selected route, taking into account traffic conditions obtained by the monitoring system;
manage vehicles’ refueling based on estimated consumption without service interruption;
gather user feedback on service;
_____________________________________________________________________________________ CNIT Technical Report-05 ꟷ Internet of Things: Technologies, Challenges and Impact
235

provide to public administration (municipality) data on traffic monitoring, service effectiveness, and reduction of external costs obtained by the service adoption.
Traffic monitoring and data acquisition are set up by using a sensors network. Sensors represent an important task since they are necessary for surveying in real-time the state of the system. The sensors network is composed by (ground) fixed sensors (e.g., inductive loop detectors, radars, etc.) and mobile sensors (e.g., probe vehicles). The latter ones can be provided using the vehicles of the service [14]-[18]. Other methods for transportation monitoring can also include Unmanned Aerial Vehicles (UAVs) and satellites. Especially, UAVs have several advantages over traditional traffic sensors, such as zero impact on ground traffic, good maneuverability, wide field of view. Moreover, considering the recent price reduction of UAV products, these devices are becoming prominent in transportation safety, planning and operations. Among UAV-based application, vehicle detection is possible to execute traffic monitoring [19]. The functional architecture focuses mainly on the specification and implementation of the data analysis module. A possible framework is reported in Figure 2. We use the Complex Event Processing (CEP), a technique for continuous data flow processing, in order to infer new knowledge and to provide support for early actions. Therefore, the analysis system can process online incoming data, as well as store them for offline processing.
236_____________________________________________________________________________________
A Flexible Mobility System based on Small and Low-emission Vehicles for ...

Figure 2. A possible functional framework [3]
The analysis process requires the definition of patterns already classified and determined, for example, by a predictive algorithm using training datasets. The latter represents an analytical model which acts as input to the Complex Event Processing system. Finally, a dashboard-based user interface displays the collected data time sequence and results to the analyst. From a data transmission and acquisition point of view, the system is able to: provide appropriate connectivity solutions to the identified data
requirements; ensure high reliability; transmit and receive data from LPT vehicles; ensure high scalability to include future city expansions.
The Big Data Analytics system is intended to provide end-users with an easy-to-use tool for examining resource availability data (available vehicles,
_____________________________________________________________________________________ CNIT Technical Report-05 ꟷ Internet of Things: Technologies, Challenges and Impact
237

traffic flows, etc.) and developing strategies that involve all concerned stakeholders (producers, consumers, institutional bodies, etc.), who are in charge of adopting solutions for achieving sustainable mobility goals.
5. Data collecting, analysis, transmission and security
The system is intended to correlate, analyze and synthesize large amounts of data using dataset integration, to enable data coming from different sources, shared within users’ communities and referred to identical objects or object correlated in a complex way, to point out their qualities. An important aspect is the business branch referred to the “renting” of the whole system architecture using a cloud approach: an innovative instrument of route analysis for companies that manage micro-transit systems, using the predictive modelling, and optimizes routes for other companies, or using just a part of the IoT architecture and transmission. Datasets that interact with the Decision Support System, representing the system inputs, can be divided into: Traffic data: collected through sensors already on the road network or
available in the Open Data online repository concerning average vehicle flows along certain roads, the average density of road sections, congestion level, speed, average number of vehicles passing through an area.
Environmental data: collected through existing control units or via APIs related to both atmospheric parameters (e.g., temperature, humidity, rainfall) and pollutant parameters (e.g., PM10, benzene, carbon monoxide, nitrogen dioxide).
Public transport data: collected through direct interaction with transport companies or using Istat and Open Data repositories concerning the number and type of available means of transport, routes and stops, user basin, number of subscribers, the volume of demand and supply, presence of car and bike-sharing.
Urban data: collected through direct interaction with Public Administrations and the implementation of linking APIs with cartographic systems to delineate the induced characterization of a given area, such as the presence of schools, hospitals, main link roads, presence of commercial activities and transit restrictions;
Means of transport data: collected through devices installed on board of the means of transport, they are able to provide information
238_____________________________________________________________________________________
A Flexible Mobility System based on Small and Low-emission Vehicles for ...

regarding the position of the vehicle, fuel consumption, distance travelled, and any anomalies related to the vehicle.
We propose to use transmission technologies considering up-to-date network architectures and communication protocols taking into account sensors network critical issues. Some technologies which are not yet widely used at the application level such as LORA Wan, Wi-Fi, Wi-Fi-HaLow, 6LowPAN, Bluetooth Low Energy, 4G-LTE, NB-IoT can be considered. More innovative communication technologies, such as 5G, can be analyzed. Considering the involved application scenarios, the 5G offers greater bandwidth, reduced latency and less packet loss compared to existing transmission technologies. Additionally, the 5G is able to support up to one million concurrent connections per square kilometer, enabling a variety of services such as those that could be offered by advanced systems for a Smart City [20], [21]. Moreover, in the future activities the new paradigm, called fog computing, will be considered. Although many technologies, such as multiple-input and multiple-output (MIMO), are necessary to enhance capacity in the fourth-generation era, it is not economically feasible to deploy such technologies in the fifth generation. The fog expands cloud computing and services on the edge of the network and produces data, computing, storage, and application services to users that can be on the edge of the networks such as access points, and therefore it is a perfect substitute as a candidate technology for networks that exceed 5G, where the cloud is to be deployed among the client's devices. Besides this, fog and Software Define Networking (SDN) based architectures are estimated as efficient systems to be employed specifically for vehicular environments, that is the case of our project [22], [23]. The proposed system aggregates information coming from several sources, including sensors network, with the aim of building decisions support models for better mobility management. Consequently, the communication technologies should transmit in real-time a big quantity of data from/to vehicles, users, control centre and infrastructures, and supported by simulations [24]-[29]. Thus, heterogeneous data coming from the sensors network are used to build the prediction model of the state of the system [30]. The prediction model should provide timely information to operators, control systems and users about urban mobility flows. Unfortunately, data diversity makes the construction of the prediction model particularly complex, since it requires a data flow management system characterized by
_____________________________________________________________________________________ CNIT Technical Report-05 ꟷ Internet of Things: Technologies, Challenges and Impact
239

complex structures due to the heterogeneity of sources. However, the data fusion process from multiple sources could give better accuracy, greater robustness and confidence in traffic flow estimation. One of the main challenges of fusing multi-source data comes from the fact that different sources usually provide information at different spatio-temporal resolutions. A solution to this complexity in building the prediction model is the use of state-space, both static and dynamic, models like the Kalman filter [31], well-known for its predictive capacity [32]. Specifically, the model is considered dynamic when the traffic-related variables vary over time. The goal is to compute traffic control measures based on the forecast provided by the model. Moreover, based on new data acquired by the monitoring system, it will be possible to apply correction techniques aimed at reducing the prediction error. Alternatively, artificial neural network (ANN)-based models [33]-[34] represent a good solution among the machine learning techniques [35]-[38], especially for short-term forecasting. Artificial neural networks are particularly versatile in managing vast amounts of data and allow complexity management since not based on linear forms as Kalman filters. Thus, ANNs can be adopted with confidence for rapidly forecasting traffic flows in transportation networks when explicit relationships between flows are not necessary. However, in the domain of neural networks, hybrid methods are necessary to combine static and dynamic networks, also taking into account spatial and temporal data dependency structures. Regarding the analysis of correlations of a large amount of data from heterogeneous sources (e.g., air pollution data from the local environmental sensor network, traffic data coming both from fixed detection devices and intravehicular sensors, meteorological data), Big Data Analytics approaches should be used together with pre-processing techniques of raw data. Data correlation analysis aims to extrapolate forecasting models based on the local correlation of pollution, transport and meteorological variables, given a certain geographical area of interest, and based on a highly available number of local data sources sufficiently dense and reliable enough to build a temporally deep database. Using statistical methodologies, the cross-domain correlation among data can be investigated to select the key features that best fit the analysis requirements. Moreover, Data Mining and Machine Learning techniques and methodologies are necessary to find and report anomalies in traffic conditions or forecast local pollution at a short-medium term.
240_____________________________________________________________________________________
A Flexible Mobility System based on Small and Low-emission Vehicles for ...

The security for a sensors network is important because the validity of the collected data is a fundamental premise to have decisions support models based on real data. In particular, the collected data must be: a. attributable with certainty to a specific sensor, because the information
is strictly related to the road network; b. immutable by external attacks, because data must be authentic; c. not readable by unauthorized users, because the reported information
may be sensitive (e.g., people or vehicles location). All the possible risks or attacks scenarios should be analyzed, identifying for each case the possible remedies, and functional/operational requirements for the data communication system should also be defined. The final aim is to define a set of guidelines which allow the identification of security and data communication technologies during the designing phase. Another goal is to define the right protocol for monitoring data communication, with a focus on the ciphering methods to assure efficient access and manipulation of the collected data. The proposed system operates in a contest with data coming from several different sources and all these sources are classified. Finally, the way the digital identity services are interconnected with the sensors network and the interconnection of sensors networks in one unique system is another important aspect.
6. System performance assessment
The performance of the proposed system has to be properly monitored and evaluated from different points of view. Five main areas of evaluation can be identified:
1. effectiveness; 2. efficiency; 3. quality; 4. environment; 5. financial sustainability.
For each of these areas, a set of Key Performance Indicators (KPIs) can be defined to measure system performance. Some of these indicators can also be evaluated in the forecasting phase, in order to guide the design of the system, while others need to be monitored during the system operations, to improve the management phase.
_____________________________________________________________________________________ CNIT Technical Report-05 ꟷ Internet of Things: Technologies, Challenges and Impact
241

Table 1 describes the main indicators that can be used for each area. The list is not exhaustive: the need for other indicators may arise after the implementation of the system.
Table 1. Main Key Performance Indicators (1/2) Area of evaluation
Indicator Description Before After
Effectiveness
Users/day It measures the average number of daily users of the system. Data are obtained directly from the centralized management system.
X
Modal share It measures the percentage, on a daily basis, of trips using the system, compared to total trips.
X
Transit share It measures the percentage, on a daily basis, of trips using the system, compared to trips on the transit system.
X
Efficiency
Cost per passenger-km
It measures the average cost to the operator in relation to the passenger-km transported, on a monthly or annual basis. It can be calculated as a function of the production cost of the service and the total number of kilometers that passengers have travelled onboard the system.
X
Cost per veh-km
It measures the average cost to the operator in relation to the km travelled, on a monthly or annual basis. It can be calculated on the basis of the production cost of the service and the total number of km travelled by the vehicles in the system, including km without passengers on board.
X
Passenger-km/veh-km
It measures the ratio between passenger-km and vehicle-km, on a daily, monthly or annual basis.
X
242_____________________________________________________________________________________
A Flexible Mobility System based on Small and Low-emission Vehicles for ...

Table 1. Main Key Performance Indicators (2/2) Area of evaluation
Indicator Description Before After
Quality
Average waiting service time
It measures the average waiting time of the users who have requested the service, in order to have the booking confirmation.
X
Average departure delay
It measures the average delay that the users experience in relation to the scheduled time of departure.
X
Average arrival delay
It measures the average delay that the users experience in relation to the scheduled time of arrival.
X
Environment
CO2 emissions saved
Estimation of CO2 saved with the implementation of the system. The calculation of this indicator requires accurate forecast models and assumptions to be verified also with user surveys.
X X
PM emissions saved
Idem, related to Particulate Matter. X X
Financial sustainability
Revenue/cost ratio
It calculates the ratio between revenues from the sale of the service and its total costs, on an annual basis. This indicator must be estimated in advance and recorded during the operation phase of the system. Preventive estimation requires the implementation of accurate forecasting models.
X X
In addition to these indicators, others should be added concerning the performance of the technological components of the system, from the point of view of reliability, security and protection of personal data.
_____________________________________________________________________________________ CNIT Technical Report-05 ꟷ Internet of Things: Technologies, Challenges and Impact
243

7. Conclusions
The paradigm of Mobility as a Service (MaaS) is increasingly emerging as a possible alternative to reduce congestion, land use and external impacts of transport systems. Research in this field is necessarily interdisciplinary because it requires expertise in many areas: from transport systems engineering to operational research, from big data analysis to communication and management technologies, from automation processes to environmental and traffic monitoring methodologies. In this work, preparatory to the proposal of future research initiatives, an attempt has been made to identify the main components of the system, their interconnections, the problems that need to be addressed and resolved, as well as the opportunities and perspectives that this research topic can offer.
References: [1] European Commission, White Paper. Roadmap to a Single European
Transport Area - Towards a competitive and resource efficient transport System, COM(2011), Brussels, 2011.
[2] Ministero delle Infrastrutture e dei Trasporti, Piano di Azione Nazionale sui Sistemi Intelligenti di Trasporto (ITS), 2014.
[3] M. Gallo, S. Ullo, P. Amenta, G. Palmieri, A. Ferrara, M. Ferrucci, M. Russo, M. De Angelis “A Flexible Mobility System based on CHIP Architectures: the NETCHIP Research Project,” Proceedings of 2018 IEEE International Conference on Environmental and Electrical Engineering and 2018 IEEE Industrial and Commercial Power Systems Europe (EEEIC/I&CPS Europe), pp. 602-607, 2018.
[4] S. Ullo, M. Gallo, G. Palmieri, P. Amenta, M. Russo, G. Romano, M. Ferrucci, A. Ferrara, M. De Angelis, Application of Wireless Sensor Networks to Environmental Monitoring for Sustainable Mobility. Proceedings of 2018 IEEE International Conference on Environmental Engineering, 2018.
[5] V.R. Vuchic, Urban Transit Systems and Technology, John Wiley & Sons, Inc., 2007.
[6] C. Daganzo, “The cell transmission model: a dynamic representation of highway traffic consistent with the hydrodynamic theory,” Transportation Research Part B, vol. 28, pp. 269-287, 1994.
[7] C. Daganzo, “The cell transmission model, Part II: Network traffic,” Transportation Research Part B, vol. 29, pp. 79-93, 1995.
244_____________________________________________________________________________________
A Flexible Mobility System based on Small and Low-emission Vehicles for ...

[8] C. Canudas-de-Wit, and A. Ferrara, “A Variable-Length cell road traffic model: Application to ring road speed limit optimization,” 2016 IEEE 55th Conference on Decision and Control (CDC), Las Vegas, NV, pp. 6745-6752, 2016.
[9] Q. Yang, and H.N. Koutsopoulos, “A microscopic traffic simulator for evaluation of dynamic traffic management systems,” Transportation Research Part C, vol. 4, pp. 113-129, 1996.
[10] E. Cascetta, and G.E. Cantarella, “A day-to-day and within-day dynamic stochastic assignment model,” Transportation Research Part A, vol. 25, pp. 277–291, 1991.
[11] M. Di Gangi, and A. Polimeni, “A Model to Simulate Multimodality in a Mesoscopic Dynamic Network Loading Framework,” Journal of Advanced Transportation, vol. 2017, art. no. 8436821, pp. 1-16, 2017.
[12] J. Lebacque, J. Lesort, and F. Giorgi, “Introducing buses into first-order macroscopic traffic flow models,” Transportation Research Record, vol. 1644, pp. 70-79, 1998.
[13] G. Piacentini, P. Goatin, and A. Ferrara, “Traffic control via moving bottleneck of coordinated vehicles,” 15th IFAC Symposium on Control in Transportation Systems (CTS 2018), Savona, Italy, June 6-8, 2018.
[14] L. D’Acierno, A. Cartenì, and B. Montella, “Estimation of urban traffic conditions using an Automatic Vehicle Location (AVL) System,”. European Journal of Operational Research, vol. 196, pp. 719-736, 2009.
[15] G.A. Klunder, H. Taale, L. Kester, and S. Hoogendoorn, “Improvement of network performance by in-vehicle routing using floating car data,” Journal of Advanced Transportation, vol. 2017, art. no. 8483750, pp. 1-16, 2017.
[16] P.B.C. van Erp, V.L. Knoop, and S. Hoogendoorn, “Macroscopic traffic state estimation: understanding traffic sensing data-based estimation errors,” Journal of Advanced Transportation, vol. 2017, art. no. 5730648, pp. 1-11, 2017.
[17] X. Yang, Y. Lu, and W. Hao, “Origin-destination estimation using probe vehicle trajectory and link counts”, Journal of Advanced Transportation, vol. 2017, art. no. 4341532, pp. 1-18, 2017.
[18] M. Carminati, O. Kanoun, S. L. Ullo and S. Marcuccio, “Prospects of Distributed Wireless Sensor Networks for Urban Environmental Monitoring," in IEEE Aerospace and Electronic Systems Magazine, vol. 34, no. 6, pp.44-52, 1 June 2019.
[19] Y. Xu, G. Yu, Y. Wang, X. Wu, and Y. Ma, “Car Detection from Low-Altitude UAV Imagery with the Faster R-CNN,” Journal of Advanced Transportation, vol. 2017, art. no. 2823617, pp. 1-10, 2017
_____________________________________________________________________________________ CNIT Technical Report-05 ꟷ Internet of Things: Technologies, Challenges and Impact
245

[20] N. Hassan, K. A. Yau and C. Wu, "Edge Computing in 5G: A Review," in IEEE Access, vol. 7, pp. 127276-127289, 2019.
[21] Y. Ai, M. Peng, and K. Zhang, “Edge computing technologies for Internet of Things: a primer”, Digital Communications and Networks, Volume 4, Issue 2, 2018, Pages 77-86,
[22] A. Baktayan, M. Na, S. Alhomdy, “Fog Computing for Network Slicing in 5G Networks: An Overview”, Journal of Telecommunications System & Management, Volume 7, Issue 2, pp. 1-13, 2018.
[23] S. Aggarwal, N. Kumar, “ Fog Computing for 5G-Enabled Tactile Internet: Research Issues, Challenges, and Future Research Directions”. Mobile Netw Appl (2019).
[24] J.J. Fernández-Lozano, M. Martín-Guzmán, J. Martín-Ávila, and A. García-Cerezo, “A Wireless Sensor Network for Urban Traffic Characterization and Trend Monitoring,” Sensors, vol. 15, pp. 26143-26169, 2015.
[25] W.D. Jones, “Forecasting Traffic Flow,” IEEE Spectrum, vol. 38, pp. 90-91, 2001.
[26] Y. Zhao, “Mobile phone location determination and its impact on intelligent transportation systems,” IEEE Transactions on Intelligent Transportation Systems, vol. 1, pp. 55-64, 2000.
[27] J. Mathew, and P.M. Xavier, “A Survey on Using Wireless Signals for Road Traffic Detection,” International Journal of Research in Engineering and Technology, vol. 3, pp. 97-102, 2014.
[28] A. Janecek, D. Valerio, K.A. Hummel, F. Ricciato and H. Hlavacs, “The Cellular Network as a Sensor: From Mobile Phone Data to Real-Time Road Traffic Monitoring,” IEEE Transactions on Intelligent Transportation Systems, vol.16, pp. 2551-2572, 2015.
[29] J.F. Raquet, M.M. Miller, and T.Q. Nguyen, “Issues and Approaches for Navigation Using Signals of Opportunity,” Proceedings of the 2007 National Technical Meeting of The Institute of Navigation, San Diego, CA, January 2007, pp. 1073-1080, 2007.
[30] A. Nantes, D. Ngoduy, A. Bhaskar, M. Miska, and Edward Chung, “Real-time traffic state estimation in urban corridors from heterogeneous data,” Transportation Research Part C, vol. 66, pp. 99-118, 2016.
[31] J. Durbin, and S.J. Koopman, Time Series Analysis by State Space Methods: Second Edition, Oxford Statistical Science Series, 2012.
[32] S. Galit, C. Kenneth, and J. Lichtendahl, Practical Time Series Forecasting with R, Axelrod Schnall Publishers. 2 edition, 2016.
246_____________________________________________________________________________________
A Flexible Mobility System based on Small and Low-emission Vehicles for ...

[33] K.-L. Du, and M.N.S. Swamy, Neural Networks and Statistical Learning, Springer, 2014.
[34] G. De Luca, and M. Gallo, “Artificial Neural Networks for forecasting user flows in transportation networks: literature review, limits, potentialities and open challenges,” Proceedings of 2017 5th IEEE International Conference on Models and Technologies for Intelligent Transportation Systems, Naples, Italy, 26-28 June 2017, pp. 919-923, 2017.
[35] A. Azzalini, and B. Scarpa, Data Analysis and Data Mining, Oxford University Press, 2012.
[36] B. Efron, and T. Hastie, Computer Age Statistical Inference, Cambridge University Press, 2016.
[37] T. Hastie, R. Tibshirani, and J. Friedman, The elements of statistical learning, 2nd ed., Springer, 2008.
[38] T. Hastie, R. Tibshirani, and M. Wainwright, Statistical learning with sparsity, 2nd ed., CRC, 2015.
_____________________________________________________________________________________ CNIT Technical Report-05 ꟷ Internet of Things: Technologies, Challenges and Impact
247

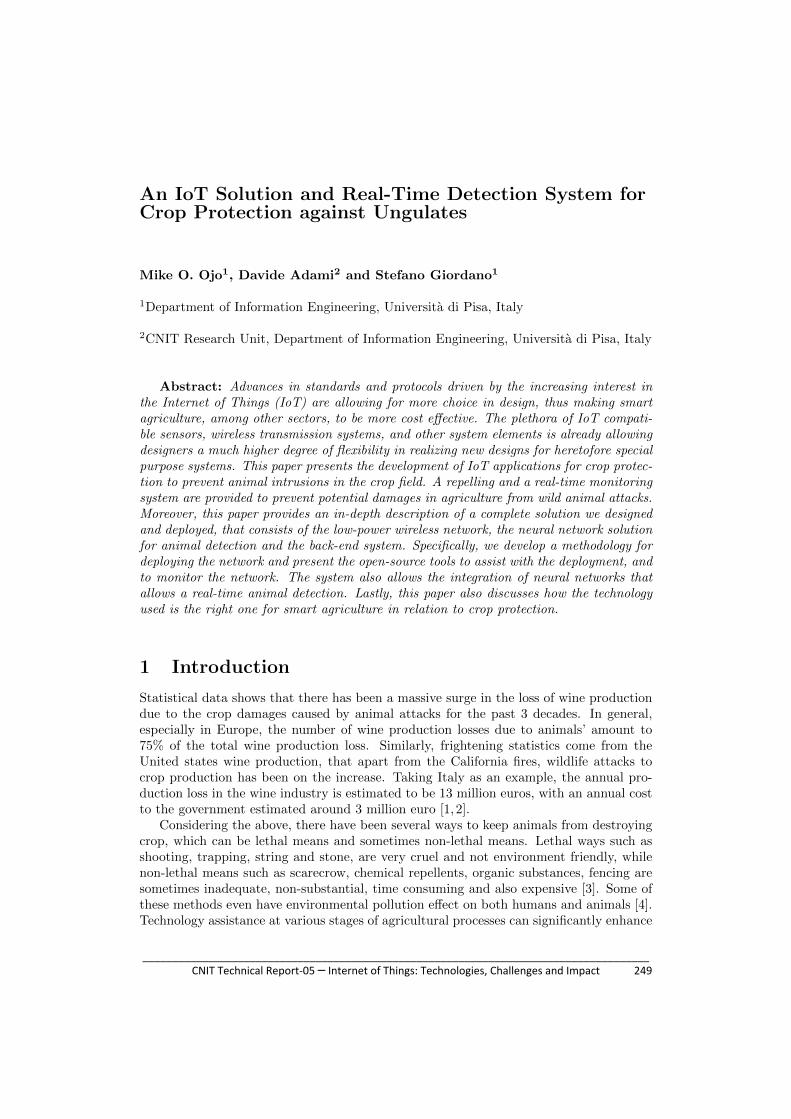
An IoT Solution and Real-Time Detection System forCrop Protection against Ungulates
Mike O. Ojo1, Davide Adami2 and Stefano Giordano1
1Department of Information Engineering, Universita di Pisa, Italy
2CNIT Research Unit, Department of Information Engineering, Universita di Pisa, Italy
Abstract: Advances in standards and protocols driven by the increasing interest inthe Internet of Things (IoT) are allowing for more choice in design, thus making smartagriculture, among other sectors, to be more cost effective. The plethora of IoT compati-ble sensors, wireless transmission systems, and other system elements is already allowingdesigners a much higher degree of flexibility in realizing new designs for heretofore specialpurpose systems. This paper presents the development of IoT applications for crop protec-tion to prevent animal intrusions in the crop field. A repelling and a real-time monitoringsystem are provided to prevent potential damages in agriculture from wild animal attacks.Moreover, this paper provides an in-depth description of a complete solution we designedand deployed, that consists of the low-power wireless network, the neural network solutionfor animal detection and the back-end system. Specifically, we develop a methodology fordeploying the network and present the open-source tools to assist with the deployment, andto monitor the network. The system also allows the integration of neural networks thatallows a real-time animal detection. Lastly, this paper also discusses how the technologyused is the right one for smart agriculture in relation to crop protection.
1 Introduction
Statistical data shows that there has been a massive surge in the loss of wine productiondue to the crop damages caused by animal attacks for the past 3 decades. In general,especially in Europe, the number of wine production losses due to animals’ amount to75% of the total wine production loss. Similarly, frightening statistics come from theUnited states wine production, that apart from the California fires, wildlife attacks tocrop production has been on the increase. Taking Italy as an example, the annual pro-duction loss in the wine industry is estimated to be 13 million euros, with an annual costto the government estimated around 3 million euro [1, 2].
Considering the above, there have been several ways to keep animals from destroyingcrop, which can be lethal means and sometimes non-lethal means. Lethal ways such asshooting, trapping, string and stone, are very cruel and not environment friendly, whilenon-lethal means such as scarecrow, chemical repellents, organic substances, fencing aresometimes inadequate, non-substantial, time consuming and also expensive [3]. Some ofthese methods even have environmental pollution effect on both humans and animals [4].Technology assistance at various stages of agricultural processes can significantly enhance
_____________________________________________________________________________________ CNIT Technical Report-05 ꟷ Internet of Things: Technologies, Challenges and Impact
249

the crop yield [5].The use of Ultrasound emission is an excellent system to repel animals, without simul-
taneously disturbing humans. Animals generally have a sound sensitive threshold that isfar higher than humans. They can hear sounds having lower frequencies with respect tohuman ear. For instance, while the audible range for humans is from 64Hz – 23KHz, thecorresponding range of cows, sheep, dogs and cats is 23Hz – 35KHz, 10Hz – 30KHz,67Hz – 45KHz and 45Hz – 64KHz respectively.
Researchers have shown that generating ultrasounds within the critical perceptiblerange causes animals to be disturbed, thus making them to move away from the soundsource. At the same time, these ultrasounds are not problems to the human ear evenwhen the frequency range is beyond the human ear. The human eardrum has a far lowerspecific resonant frequency than animals and cannot vibrate at ultrasound frequency. Hu-man ear can perceive sounds up to 23KHz frequency.
Our proposed method for protecting crops from animal attacks is based on the gener-ation of ultrasounds and utilizes IoT technology for providing a system with repelling andmonitoring capabilities. IoT technologies are no longer buzz phrases or hypes, as theyhave found real life applications, such as in our case, smart agriculture.
The emergence of IoT is a phenomenon that owes to the conjunction of several factors
BA
C D
Figure 1: (A) wild boar in a vineyard, (B) wild boar (C) roe deer (D) fallow deer
such as inexpensive devices [6], low-power wireless technologies, availability of cloud datacenters for storage and processing, management frameworks for dealing with unstructureddata, high performance computing resources computational intelligence algorithms to dealwith this enormous amount of data. Among different and various wireless technologiesfor the IoT, LoRa and LoRaWAN, global de facto standards of Low-Power Wide AreaNetworks (LPWAN) are gaining significant interest and positive momentum thanks to
250_____________________________________________________________________________________
An IoT Solution and Real-Time Detection System for Crop Protection against Ungulates

their excellent features in covering long distances and in large scaling with low cost andhigh energy efficiency.
Moreover, with the upsurge of machine learning, deep learning algorithms have beenextensively used in agriculture-related applications [7]. Real-time detection in agricultureis one of the most effective ways in helping farmers and agronomists in their decisionmaking processes and management skills. This paper presents an animal repelling anddense real-time monitoring solution based on IoT technology to address the problems ofcrop damages especially vineyard in the Tuscany region of Italy. Figure 1 shows the mostcommon ungulates in Tuscany region affecting crop production.
The main contributions of this article are:
1. We provide a thorough, complete and “brutally honest” description of the designand deployment of a real-time animal detection and repelling system.
2. We provide a methodology for deploying network and software infrastructures forsuch type of IoT applications.
3. We contribute with open source software to perform pre-deployment tests, managethe network, and store/display information about the status of IoT and networkdevices.
The rest of this paper is organized as follows. Section 2 describe the state-of-the-artand the related works. Section 3 describes the overall system architecture, whereas thenetwork deployment is discussed in Section 4. Section 5 highlights the lessons learnt andfinally, Section 6 provides some final remarks.
2 Background and Related Works
In this section, we present a short overview of the current activities related to smartagriculture applications deployments focusing on crop production. Next, we provide somebackground about LoRa and LoRaWAN, the wireless network technologies adopted in ourapplication.
2.1 Smart Agriculture
The work in [8] proposed a model to measure the crop productivity and anticipate thepotential problems. The proposed model combines a short and medium wireless networkrange system with a prediction engine to anticipate crop productivity dysfunctions pro-actively. Muangprathub et.al [9] proposed a system for watering agricultural crops basedon wireless sensor network. The proposed method introduced a control system using nodesensors in the crop field with data management via smart-phone and a web application.The model also utilized data mining to analyze the data for predicting suitable temper-ature, humidity, and soil moisture for optimal future management of crops growth. Thework in [10] developed an e-Agriculture application based on the KM-knowledge base tomonitor crop productivity.The work in [11] presented an integrated approach in the field of IoT for smart Agriculturebased on low power devices and open source systems for repelling and monitoring system
_____________________________________________________________________________________ CNIT Technical Report-05 ꟷ Internet of Things: Technologies, Challenges and Impact
251

for crop protection against animal attacks and weather conditions. Nobrega et.al [12] pro-posed an animal behaviour monitoring platform based on IoT technologies. It includesan IoT network for gathering data, a cloud platform which incorporates machine learningfeatures. The work in [13] presented a real-time rice crop monitoring system to increaseits productivity. Chen et.al [14] proposed a low-cost agri talk IoT-based platform for theprecision farming of soil cultivation.
To compare related works, and also highlight opportunities and gaps, we introduce inTable 1 considering four elements, namely (1) communication technologies (2) Data Anal-ysis (3) Data display (4) Application purpose. Some researchers are working with variouswireless technologies in agriculture, but we observed the lack of studies on applying LoRain a practical and reproducible way.
Table 1: Related Work Comparison
ArticleCommunication
TechnologyData
AnalysisData
DisplayApplication
[8] LoRaNeural
NetworkYes
Arugulacultivation
[9] WSN Data Mining Yes N/A[10] 3G, WIFI N/A No N/A[11] 6lowPAN N/A No wine protection
[12] 3GDecision tree,KNN, SVM
Nosheep
monitoring[13] GSM N/A Yes rice production
[14] 4Grandom
forest-basedYes Soil cultivation
2.2 LoRa and LoRaWAN Basics
In this section, the structure and main parameters of LoRa and LoRaWAN are brieflypresented. LoRa is very robust over a long distance due to Chirp Spreading Spectrum(CSS), where the physical channel is logically separated by the spreading factors (SF) dueto their orthogonality. The carrier frequency varies over a designated amount of time,thus achieving low power and long-range communication links [15].
2.2.1 Network Structure
A network structure based on LoRa technology consists of four individual layers namelythe end devices, the gateway, the network server and the application server. A briefdescription of each layer is highlighted below:
� LoRa End Nodes are devices embedded with LoRa chips. There are 3 classes ofend-devices: Class A (for All), B (for Beacon) and C (for Continuously listening),each associated with a different operating mode. The devices broadcast their sensorvalues to all gateways in all range which forward data packets to a single networkserver over an IP based network.
252_____________________________________________________________________________________
An IoT Solution and Real-Time Detection System for Crop Protection against Ungulates

� LoRa Gateways are intermediate devices running an operating system that for-wards data packets coming from the end nodes to a network server over an IP-basedbackhaul network. In a LoRaWAN deployment, there can be multiple gateways re-ceiving data packets from a LoRa end device.
� LoRa Network Server perform a lot of functions such as filtering redundantpackets, performing adaptive rate, performing security checks and generally man-ages the network. For example, it knows about active nodes, and when a new LoRaend node joins the network.
� LoRa Application Server is responsible for encryption, decryption, and process-ing of data from the network server. The application server allows users to accessand manage the gateway, nodes and applications.
2.2.2 LoRa Main Parameters
The LoRa technology is defined by the main parameters which are spreading factor,bandwidth and code rate. It is possible to configure different LoRa parameters in orderto adapt the technology to the working scenario. We briefly describe each parameterbelow:
� Bandwidth (BW) is the range of transmission frequencies varying between 7.8kHzand 500kHz. The more the bandwidth value, the more the transmitted data, thusreducing transmission time and resulting in lower sensitivity.
� Spreading factor (SF) characterizes the number of bits sent in each LoRa symbol.SF take values between 7 and 12 resulting in different time-on-air (ToA), thus,varying receiver sensitivity. Having a higher SF such as SF = 12 denotes longerrange with low bit rate and better receiver sensitivity. The relationship betweenthe LoRa transmission (ToA) and the used LoRa parameters is denoted as ToA =2SF /BW .
� Code Rate (CR) is related to the number of redundant bits used to improve thepacket error rate in the presence of noise and interference. The possible values ofCR are 4/5, 4/6, 4/7 and 4/8. A lower coding rate results in better robustness atthe expense of increased transmission time and high energy consumption.
� Transmission Power (TP) is also an essential LoRa parameter varying fromregion to region. In Europe for example, with 863 − 870MHz, the TP can be2dBm, 6dBm, 8dBm, 12dBm, and 14dBm.
LoRa MAC layer is basically an ALOHA protocol that is controlled by the networkserver. The gateway can receive from multiple end devices simultaneously. Vangelista [16]pointed out that the number of transmitting devices that can be received by the gatewaysimultaneously is limited to 9 due to the orthogonality of transmission sub-bands andquasi-orthogonality of the spreading factors. Moreover, the end devices have to respectthe regulatory restrictions with a duty cycle of less than e.g. 1% in each of the European(EU) 868MHz bands.
_____________________________________________________________________________________ CNIT Technical Report-05 ꟷ Internet of Things: Technologies, Challenges and Impact
253

3 System Architecture
In this section, we present the architecture of the overall system (see Figure 2), whichconsists of three main components: the ultrasound repeller device, the real-time detectionsystem and the back-end system.
LoRa
Gateway
Multi-platform
management
system
IoT Cloud
Wild boar
vineyard
Repeller device + Neural
Network System
Lora signal
Figure 2: System Architecture
3.1 Ultrasound Repeller Device
The Natech Escape [17] is an IoT development board that provides animal repelling ca-pabilities through the generation of ultrasounds. Specifically, the Natech Escape boarduses a ATSAMD21G18A 32-bit ARM Cortex® M0+ core architecture clocked at 48MHzand paired with 32KB of RAM and 512KB of flash. It also features a LoRa moduleRN2483A and xbee radio module supported by the LoRaWAN and IEEE 802.15.4 stan-dard respectively. All the pins of the micro-controller are exposed, allowing a developerto interface sensors and actuators over digital and analog interfaces. The device uses asolar panel along with LiPo batteries that are charged with a battery recharging system.The battery recharging system is equipped with a Pulse-width modulation (PWM) chargeregulator that ensures the highest possible output for off-grid applications, making it anautonomous device able to work even in periods of partial or total darkness. Figure 3shows the Natech Esacpe board in an enclosure with the lid open.
To improve the energy efficiency of the device, we made use of a Passive InfraredSensor (PIR) sensor (see Section 4.1.1), which activates the driver responsible for the ul-trasound generation and as well as the networking communication only when an animal is
254_____________________________________________________________________________________
An IoT Solution and Real-Time Detection System for Crop Protection against Ungulates

Figure 3: The repeller device encased in an enclosure
detected. The tweeter in the device is capable of generating ultrasound signals at pressureclose to 110dB SPL in ∼1m distance and in a wide band of 18kHz − 27kHz that allowsus to tune the device according to the animal that is desired to be repelled. The NatechEscape device can be equipped with two different kinds of lenses: (1) the long range lens,which is used for border protection and (2), the wide range lens, which is used for areaprotection. To transmit, process and store the information retrieved by the device, weare using a Proxy software that collects the “activities”, i.e. animal detected events, andtransmits this information via LoRa first to the LoRa gateway, and then to the back-endsystem. The Natech Escape board will be exposed to direct sunlight, freezing tempera-tures, dust and rain. Therefore all device and sensors are protected by an enclosure withinternal protection 65 (IP65) rating1.
As of the Operating System (OS), we make use of an open source solution calledRIOT [18], which offers a lot of features like, multi-threading, efficient network stack andmemory allocation. Our decision for adopting RIOT OS is based on the viable character-istics it offers to the IoT community. The RIOT OS was released in 2013 and it is basedon the microkernel architecture which makes it perfect for real-time use cases. As regardsto Networking, RIOT OS uses a network stack that is based on IP with support of IEEE802.15.4, 6LoWPAN, IPv6, RPL, UDP and CoAP. As for the Programmability, it usesa C/C++ syntax with support of multiple threads and a memory passing inter-processcommunication (IPC) among the threads. The performance evaluation of RIOT OS hasbeen demonstrated in [19]. In our implementation, we exploited the features of RIOT OSmentioned above by adding one thread for the detection using a PIR and transmittinga message to the LoRa gateway through the LoRa module. Another thread is used forcommunicating with the neural network system, through the xbee radio by exchangingUDP messages that will be discussed later in this article. Figure 4 shows the natechescapeultrasound device used as a virtual fence.
1Totally dust tight and protection against low pressure water jets in all direction
_____________________________________________________________________________________ CNIT Technical Report-05 ꟷ Internet of Things: Technologies, Challenges and Impact
255

Figure 4: Ultrasound as a virtual fence
3.2 Real-Time Animal Detection System
Object detection and recognition is a common term for computer vision techniques aimedat detecting and recognizing objects in pictures or videos. Deep learning methods arealready used widely in real time object detection. Real time smart solutions inspired fromdeep learning, must possess key capabilities such as energy efficiency, affordable and smallform factor, as well as fine balance between accuracy and power consumption. Recentobject detection and recognition techniques are mostly established on the utilization ofconvolutional networks (CNN). There are three main methods in the field of deep learning-based object detection and recognition: Single Shot Detector (SSD), Faster Region CNN(F-RCNN) and You Only Look Once (YOLO).
The YOLO method [20], [21] deals with the classification and the localization as aregression problem. A YOLO network directly performs regression to detect targets inthe image without region proposal network, hence it is fast and can be implemented inreal-time applications. The state-of-art version (YOLOv3) [21] not only has high detectionaccuracy and speed, but also performs well with detecting small targets. Optimizationof the YOLOv3 model parameters reduces the computational complexities and thus isneeded to deploy it on edge devices such as Nvidia Jetson Nano and Raspberry Pi [6].
In this article, we make use of the OpenCV deep neural network library to performobject detection and recognition. We opt for YOLOv3-tiny model as the classifier andlocalizer, because it is light-weight, fast-speed compared to YOLOv3 which requires alot more processing power making YOLOv3-tiny the ideal model for our proposed frame-work. YOLOv3-tiny is said to produce better accuracy and frame rate than YOLOv3 onembedded platforms. In our work, we deployed the YOLOv3-tiny algorithm on embeddedplatforms such as Raspberry Pi (hereinafter, RPi) 3B+ with Intel Movidius Neural Com-puting Stick (NCS) and Nvidia Jetson Nano. Table 2 shows a comparison between themain specifications of the selected embedded hardware while Figure 5 shows the differenthardware platforms that are considered.
256_____________________________________________________________________________________
An IoT Solution and Real-Time Detection System for Crop Protection against Ungulates

Figure 5: The analyzed embedded platforms: RPi 3B+ with Intel Movidius NCS on theleft and Nvidia Jetson Nano on the right
Table 2: Main specifications of the platforms investigated in this study
Features Intel Movidius NCS Jetson Nano
Size 73 × 26 mm 73 × 45 mm
HW Accelerator Myriad 2 VPU128-core NVIDIA
Maxwell GPU
CPU N.AQuad-core ARM A57 @
1.43GHzMemory 4GB LPDDR3 4GB LPDDR4
Nominal Power 1W 5/10WWeight 18g 140g
Peak Performance 100GFLOPs 472GFLOPs
3.2.1 Data Set Description
We consider two popular ungulates (wild boar and deer) in the Tuscany region of Italy inour study. Image acquisition was conducted systematically in various areas of the regionusing a digital camera with 20 megapixels during different times and days of June toAugust.
3.2.2 Hardware Description
Edge-AI (Artificial Intelligence) consists of performing computations locally on an em-bedded system in real-time. Since the training process requires a lot more computationalpower as compared to the inference process, it cannot be performed on the embeddedplatform in a reasonable amount of time, but a high performance computing (HPC) sys-tem. The HPC system used for training was equipped with an NVIDIA RTX 2080Ti GPU
_____________________________________________________________________________________ CNIT Technical Report-05 ꟷ Internet of Things: Technologies, Challenges and Impact
257

with CUDA 10 and 64GB of DDR4 SDRAM. This GPU model features 544 Tensor Cores,an NVIDIA technology specifically designed to boost matrix multiplication performance,thus able to speed up the training process of deep learning models. For the embeddedimplementation of the model, to improve real-time performance, two different hardwareplatforms have been considered: RPi 3B+ with Intel Movidius NCS and Nvidia JetsonNano.
3.2.3 Methodology
YOLOv3-tiny, as already introduced, makes use of only convolutional layers, making ita fully convolutional network that can accept inputs of different sizes during and aftertraining. It can be divided into two main blocks: the first one is the feature extractor orbackbone dubbed darknet-19. Its principal and fundamental role are to extract featuresin a hierarchical fashion starting from raw pixels coming from the input layer. Indeed,the extracted representations are later used as starting points by the other modules of thenetwork. On the other hand, the second block of the YOLOv3-tiny architecture analyzesthe produced backbone representations, and it predicts position and class of belonging ofthe different objects present in the input raw image.
At first, we processed raw data as shown in the data set description. The raw dataare stored in PNG format, acquired from the test site. We used n = 600 sample images,and in order to speed up the label generation, we used an extensive and accurate versionof YOLOv3 known as YOLOv3-spp, pre-trained on the COCO data set, to create a draftof the ground truth labels. Each image was resized and normalized. Using transferlearning, we started our training from a pre-trained backbone of the original model.That greatly speeds up the training, drastically reducing the number of training samplesrequired to achieve a high level of accuracy. All training was carried out on the HPCsystem described above. After training, the model was deployed on the different hardwareplatforms presented in the hardware description section. We compared the performanceof the hardware used in terms of absorbed power and frame rate. The Jetson Nano is themost performing platform, being able to reach 12 frames per second (fps), while the RPi3B+ with Intel Movidius NCS was able to reach a 8 fps.
3.3 Back-end System
This section illustrates our back-end system. Our system consists of a LORaWAN networkfor data transmission between the Natech Escape devices and the back-end cloud services.Monitoring data about the status of Natech Escape devices are periodically generated andtransmitted to the LoRa gateway, and to a LoRa Network Server in The Things Network(TTN). The TTN is an open platform for registration of LoRaWAN devices (IoT nodes)and gateways. It has an implementation of all needed back-end services for LoRaWANgateway operation i.e., all functions needed for the data and the transport layer, alongwith all required security layer.
To get and store the data in our monitoring platform, we first need to create the devicein the TTN console and register the devices. Then, we use a monitoring application thathas been developed on a Docker with 4 containers. A Node-Red2 is used to retrieve packets
2nodered.org
258_____________________________________________________________________________________
An IoT Solution and Real-Time Detection System for Crop Protection against Ungulates

from the TTN temporary data storage and to store them in our time-series database(InfluxDB 3). In fact, we opted for two different databases: InfluxDB and MongoDB. Thefirst database is a scalable database for storing metrics, events, and real-time analyticswhile the second database is classified as NoSQL database, and commonly used becauseof its support for unstructured data. Therefore, the packet payload and metadata areretrieved by an application developed in a Node-RED server and stored in 2 databases:
� InfluxDB which is then used to produce Grafana4 monitoring dashboards;
� MongoDB which stores raw data about the devices (i.e. GPS coordinates) to gen-erate reports using python scripts.
The monitoring dashboard provided by InfluxDB and Grafana offers a useful insightto drive the experiment without high maintenance cost. The Node-Red server and thedatabases are running in the cloud and are accessible remotely for flexibility purposes.
4 Network Deployment and Modes of Operation
The deployment consists in a virtual fence of poles, where each pole is a full, autonomous,networked real-time animal detection and repelling system. So far, our testbed consistsof 10 poles deployed through the San Rossore Park in Tuscany that leverage the state-of-the-art LoRaWAN network technology to communicate with a LoRa gateway. Each poleis equipped with two Natech Escape devices, each of them equipped with a Lora moduleRN2483A, xbee radio module and a PIR. All devices were calibrated at the manufacturerfacilities prior to deployments. Data is pushed to the cloud in real-time. The real-timeanimal detection system is also mounted on the same pole of the Natech Escape devices.The activity is being transmitted from the repeller devices to the LoRa gateway in aperiodic manner. We make use of a commercial gateway embedded with LoRa capabilities,developed for outdoor use. The LoRa gateway is connected to a satellite gateway thatprovides connectivity with the Internet and finally to the TTN network server.
Our tested operates using the TTN, its gateway forward traffic to the EU TTN networkserver, formatted in a predefined format (e.g. JSON, XML etc.), and then transmitted tothe database system and the presentation Graphical User Interface system. Our gatewayperforms a Cyclic redundancy check (CRC): if CRC is valid, the gateway forwards thepacket to the TTN server, otherwise, it drops the packet. Both the database and thepresentation systems are Time Series based tools, which means that the storage andthe presentation of the data is based on time. The back-hauling of the gateway canbe obtained via satellite communication. Moreover, the devices/networks must be ableto run “on their own” without any obligatory user intervention. They must be able towithstand important weather conditions, self-heal in case of environmental changes, andrun for several years without human intervention.
As this implementation is critical for agriculture, we had to make sure that the repellerdevices will operate for a long time before maintenance will be required. Our system usestwo 3.7V rechargeable batteries with a capacity of 4200mAh as the power source andsupports charging by both power adapter and a 25W solar panel. The batteries were
3https://www.influxdata.com/4https://grafana.com/
_____________________________________________________________________________________ CNIT Technical Report-05 ꟷ Internet of Things: Technologies, Challenges and Impact
259

tested every four days in order to guarantee the effectiveness of the solar power chargingboard.
4.1 Operational Mode
In this section, we show how the operation can be performed in two different modesnamely (1) Detection through PIR and (2) Detection through Camera.
4.1.1 Detection through PIR
When a movement is detected through the PIR sensor, the SAMD21 microprocessor sendsan “activity” message to the embedded system (RPi with Intel Movidus NCS or JetsonNano) through the xbee radio. Note that, the embedded system is also equipped withthe xbee radio, which makes it to be embedded with IEEE 802.15.4 capabilities. Theembedded system activates the camera, then executes its deep learning algorithms toidentify the target, and if an animal is detected, it sends back a message to the NatechEscape including the type of ultrasound to be generated according to the category of theanimal. The “activity” message is also transmitted from the repeller device via LoRa tothe LoRa gateway, which then forwards the packet to the TTN server.
4.1.2 Detection through Camera
In this case, the PIR sensor is not used and the real-time animal detection system on theembedded system is executed when the camera detects a target. Based on the categoryof animal detected, the embedded system sends a message, with the ultrasound waveformto be generated, to the Natech Escape through the IEEE 802.15.4 interface. Moreover,based on the operation sent to the Natech Escape device, the activity is then transmittedfrom the repeller devices via Lora to the LoRa gateway, which then forwards the packetto the TTN server.
5 Lessons Learnt
The most important lesson learnt is that IoT is the right technology for this precisionagriculture application, and that using it makes a huge monetary difference. Moreover,as seen throughout this work, IoT technology is ready for this type of application. Westrongly believe that the combination of technologies demonstrated through this work isthe right one for a large number of “Smart Agriculture” applications. We hope that thepresent article can guide end users put together the right technical solution.
The main outcome of this work is a perfectly working end-to-end low-power wirelesssensor systems, built from commercial off-the-shelf components, but also custom designedand devloped devices, such as the ultrasound repeller and detection system elements. Onedecade ago, Langendoen et al [22] wrote a foundational paper listing everything that wentwrong in a precision agriculture deployment similar to our project, which include boardfailure, batteries running out etc. So what went right this time, is that the field of low-power wireless has evolved substantially, and has radically changed in that decade. IoTtechnology has successfully transitioned from the academic to the commercial world.
260_____________________________________________________________________________________
An IoT Solution and Real-Time Detection System for Crop Protection against Ungulates

6 Conclusions
This article provided an in-depth technical description of the Natech Escape repellerdevice, the real-time animal detection system and lastly the back-end system. We showedthe integration of a neural network to the system allowing a real time animal detection. Wealso showed how data is pushed to the cloud in real-time, thus making it accessible to thescientific community in real-time. We hope this article can be informative to the scientificcommunity by providing testing feedback and limitations and also the agronomists bydescribing a solution that works.
References
[1] N. Squires, “Tuscan wine makers back cull of 250,000 wild boar anddeer.” 2016. Accessed on: February 26, 2020 [Online]. Available:https://www.telegraph.co.uk/news/worldnews/europe/italy/12105887/Tuscan-wine-makers-back-cull-of-250000-wild-boar-and-deer.html
[2] A. Amici, F. Serrani, C. M. Rossi, and R. Primi, “Increase in crop damage caused bywild boar (sus scrofa l.): the “refuge effect”,” Agronomy for sustainable development,vol. 32, no. 3, pp. 683–692, 2012.
[3] S. Wang, P. Curtis, and J. Lassoie, “Farmer Perceptions of Crop Damage by Wildlifein Jigme Singye Wangchuck National Park, Bhutan” - In Wildlife Society Bulletin,Vol.34, No.2, pp. 359-365, 2006.
[4] B. Hamrick, T. Campbell, B. Higginbotham, and S. Lapidge, “Managing an invasion:effective measures to control wild pigs,” 2011.
[5] A. R. Tiedemann, T. Quigley, L. White et al., “Electronic (fenceless) control oflivestock.” Res. Pap. PNW-RP-510. Portland, OR: US Department of Agriculture,Forest Service, Pacific Northwest Research Station, vol. 510, 1999.
[6] M. O. Ojo, S. Giordano, G. Procissi, and I. N. Seitanidis, “A review of low-end,middle-end, and high-end IoT devices,” IEEE Access, vol. 6, pp. 70 528–70 554, 2018.
[7] A. Kamilaris and F. X. Prenafeta-Boldu, “Deep learning in agriculture: A survey,”Comput. Electron. Agricult., vol. 147, pp. 70–90, Apr. 2018.
[8] U. J. L. dos Santos, G. Pessin, C. A. da Costa, and R. da Rosa Righi, “AgriPrediction:A proactive Internet of Things model to anticipate problems and improve productionin agricultural crops” - In Computers and electronics in agriculture, 161, 202-213,2019.
[9] J. Muangprathub, N. Boonnam, S. Kajornkasirat, N. Lekbangpong, A. Wanichsom-bat & P. Nillaor “IoT and agriculture data analysis for smart farm” - In Computersand electronics in agriculture, 156, 467-474, 2019.
[10] I. Mohanraj, K. Ashokumar, & J. Naren “Field monitoring and automation usingIOT in agriculture domain” - In Procedia Computer Science, 93, 931-939, 2019.
_____________________________________________________________________________________ CNIT Technical Report-05 ꟷ Internet of Things: Technologies, Challenges and Impact
261

[11] S. Giordano, I. Seitanidis, M. Ojo, D. Adami and F. Vignoli, F. 2018 IoT solutions forcrop protection against wild animal attacks. In 2018 IEEE International Conferenceon Environmental Engineering (EE) (pp. 1-5). IEEE.
[12] L. Nobrega, A. Tavares, A. Cardoso, and P. Goncalves, “Animal monitoring based onIoT technologies,” in 2018 IoT Vertical and Topical Summit on Agriculture-Tuscany(IOT Tuscany). IEEE, 2018, pp. 1–5.
[13] N. Sakthipriya, “An effective method for crop monitoring using wireless sensor net-work,” Middle-East Journal of Scientific Research, vol. 20, no. 9, pp. 1127–1132,2014.
[14] W. L. Chen, Y. B. Lin, Y. W. Lin, R. Chen, J. K. Liao, F. L. Ng, Y. Y. Chan,Y. C. Liu, C. C. Wang, C. H. Chiu and T. H. Yen, “Agritalk: IoT for precision soilfarming of turmeric cultivation,” IEEE Internet of Things Journal, vol. 6, no. 3, pp.5209–5223, 2019.
[15] F. Adelantado, X. Vilajosana, P. Tuset-Peiro, B. Martinez, J. Melia-Segui, andT. Watteyne, “Understanding the limits of LoRaWAN,” IEEE Communications mag-azine, vol. 55, no. 9, pp. 34–40, 2017.
[16] L. Vangelista, A. Zanella, and M. Zorzi, “Long-range IoT technologies: The dawnof LoRa�,” in Future access enablers of ubiquitous and intelligent infrastructures.Springer, 2015, pp. 51–58.
[17] Natech Home Page, Accessed on: February 26, 2020 [Online]. Available:https://www.natechescape.com/
[18] E. Baccelli, C. Gundogan, O. Hahm, P. Kietzmann, M. S. Lenders, H. Petersen,K. Schleiser, T. C. Schmidt, and M. Wahlisch, “RIOT: an open source operatingsystem for low-end embedded devices in the IoT,” IEEE Internet of Things Journal,vol. 5, no. 6, pp. 4428–4440, 2018.
[19] M. Ojo, D. Adami, and S. Giordano, “Performance evaluation of energy saving MACprotocols in WSN operating systems,” in Performance Evaluation of Computer andTelecommunication Systems (SPECTS), 2016 International Symposium on. IEEE,2016, pp. 1–7.
[20] J. Redmon, S. Divvala, R. Girshick, and A. Farhadi, “You only look once: Unified,real-time object detection,” in Proc. IEEE Conf. Comput. Vis. Pattern Recognit.,Jun. 2016, pp. 779–788.
[21] J. Redmon and A. Farhadi, “YOLOv3: An incremental improvement”2018, arXiv:1804.02767. Accessed on: February 26, 2020 [Online]. Available:https://arxiv.org/abs/1804.02767/
[22] K. Langendoen, A. Baggio, and O. Visser, “Murphy loves potatoes: Experiencesfrom a pilot sensor network deployment in precision agriculture,” in Proceedings20th IEEE international parallel & distributed processing symposium. IEEE, 2006,pp. 8–pp.
262_____________________________________________________________________________________
An IoT Solution and Real-Time Detection System for Crop Protection against Ungulates