Air Quality Technical Report Addendum - Colorado ...
286
Air Quality Technical Report Addendum Prepared For: Federal Highway Administration Colorado Department of Transportation Prepared By: 707 17 th Street, Suite 2300 Denver, CO 80202 August 2011
-
Upload
khangminh22 -
Category
Documents
-
view
0 -
download
0
Transcript of Air Quality Technical Report Addendum - Colorado ...
Air Quality Technical Report Addendum
Prepared For: Federal Highway Administration
Colorado Department of Transportation
Prepared By:
707 17th Street, Suite 2300
Denver, CO 80202
August 2011

i
Final EIS August 2011 Technical Memorandum: Air Quality Addendum
TABLE OF CONTENTS
1.0 Summary ................................................................................................................................. 1
2.0 Description of Preferred Alternative and Phase 1 ................................................................... 5
3.0 Affected Environment .............................................................................................................. 7
3.1 Regulatory Framework ........................................................................................................ 7
3.1.1 Transportation Conformity ............................................................................................ 7
3.2 Existing Conditions ............................................................................................................ 10
3.3 Air Quality Monitoring Data ............................................................................................... 11
3.3.1 Criteria Pollutants and Critical Pollutant Data Trends ................................................. 12
3.4 Methodology ...................................................................................................................... 13
3.4.1 Corridor Analysis ........................................................................................................ 13
3.4.2 Attainment/Maintenance Areas ................................................................................... 14
3.4.3 Project Level CO Analysis .......................................................................................... 14
3.4.4 Project Level PM10 Analysis ........................................................................................ 16
3.4.5 Project Level MSAT Analysis ...................................................................................... 16
3.4.6 Class I Federal Areas and Nitrogen Deposition .......................................................... 21
4.0 Environmental Consequences .............................................................................................. 23
4.1 Corridor Analysis ............................................................................................................... 23
4.2 Attainment/Maintenance Area Analysis ............................................................................. 26
4.2.1 Fort Collins Attainment/Maintenance Area for CO ...................................................... 26
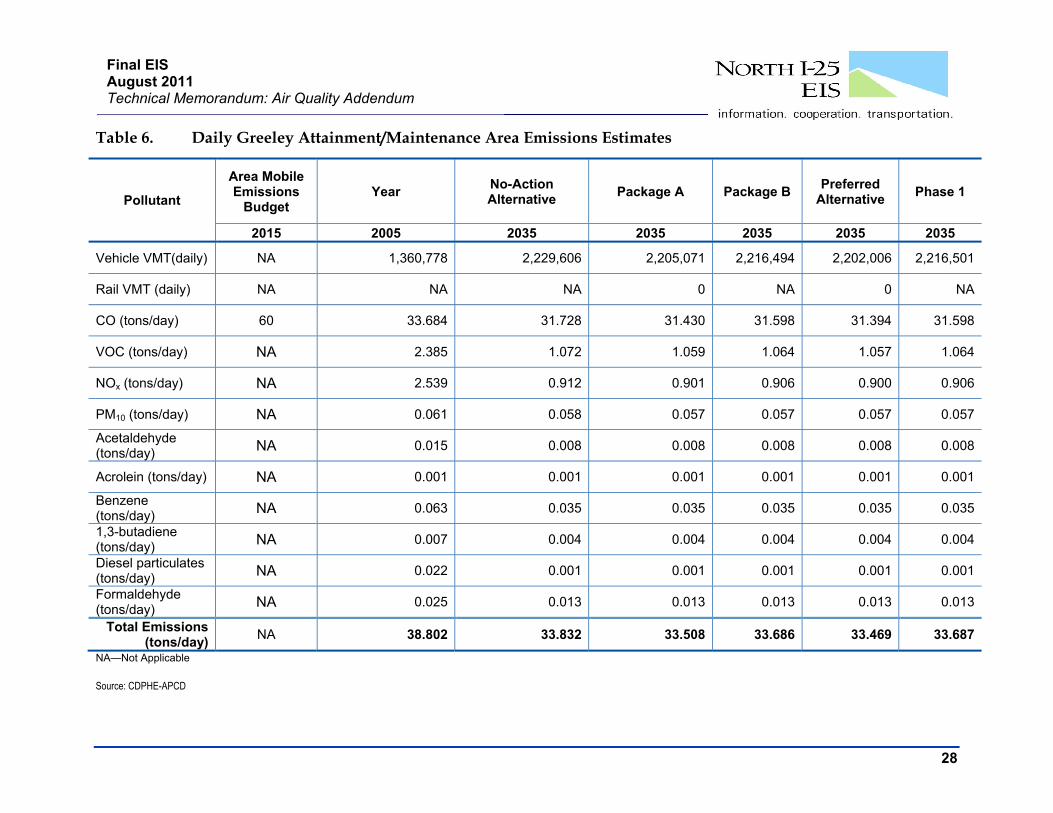
4.2.2 Greeley Attainment/Maintenance Area For CO .......................................................... 26
4.2.3 Longmont Attainment/Maintenance Area For CO ....................................................... 29
4.2.4 Denver Attainment/Maintenance Areas For Ozone and PM10 .................................... 29
4.2.5 Denver Attainment/Maintenance Areas For CO ......................................................... 29
4.2.6 Project-Level CO Analysis .......................................................................................... 33
4.2.7 Project-Level PM10 Analysis ........................................................................................ 34
4.2.8 Project-Level MSAT Analysis ..................................................................................... 46
4.2.9 Indirect Effects ............................................................................................................ 49
4.2.10 Cumulative Impacts .................................................................................................. 54
4.3 Project Phasing and Regional Conformity ......................................................................... 57
5.0 Mitigation Measures .............................................................................................................. 58
6.0 References ............................................................................................................................ 60
APPENDICES
Appendix A. CO Hot Spot Analysis
Appendix B. Traffic
ii
Final EIS August 2011 Technical Memorandum: Air Quality Addendum
LIST OF FIGURES
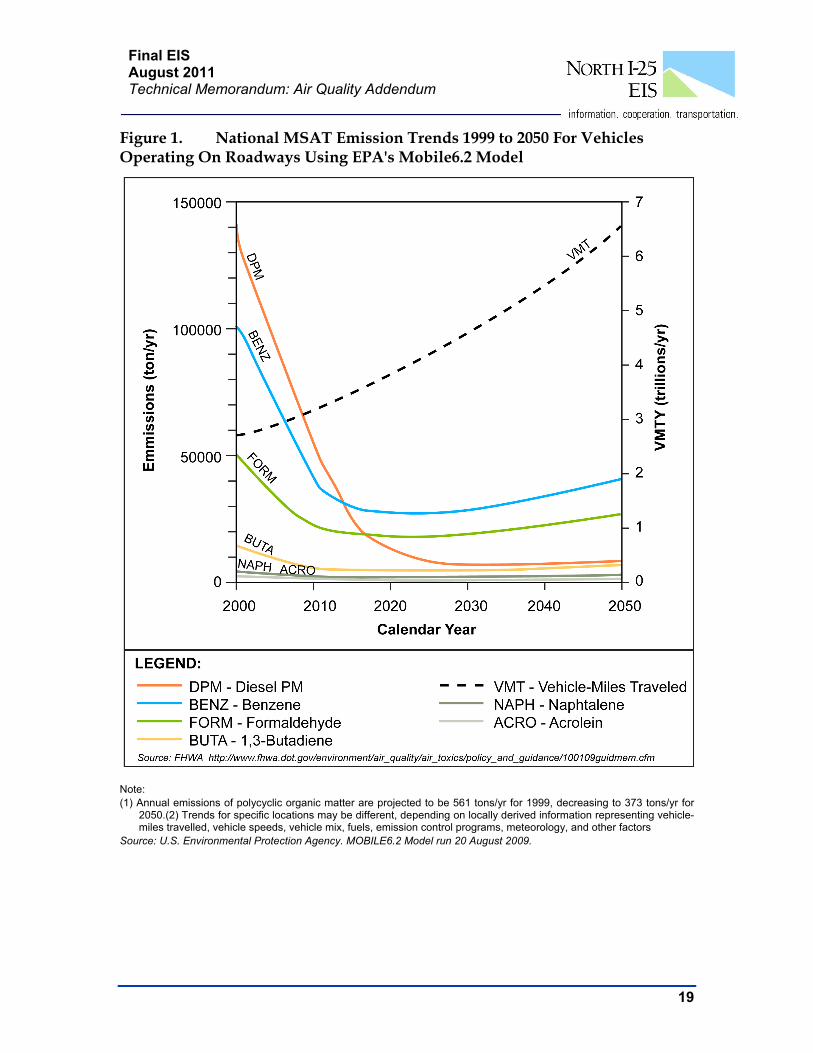
Figure 1. National MSAT Emission Trends 1999 to 2050 For Vehicles Operating On Roadways Using EPA's Mobile6.2 Model ........................................................... 19
LIST OF TABLES
Table 1. National Ambient Air Quality Standards for Criteria Pollutants .............................. 9
Table 2. 2009 to 2010 Criteria Pollutant Monitoring Station Data ..................................... 12
Table 3 Uniform Rate of Progress for Each Colorado Class I Area ................................. 23
Table 4 Daily Region-Wide Total Mobile Source Emissions Estimates ............................ 24
Table 5. Daily Fort Collins Attainment/Maintenance Area Emissions Estimates ............... 27
Table 6. Daily Greeley Attainment/Maintenance Area Emissions Estimates .................... 28
Table 7. Daily Longmont Attainment/Maintenance Area Emissions Estimates ................. 30
Table 8. Daily Denver Attainment/Maintenance Area Emissions Estimates ..................... 31
Table 9. Daily Denver Attainment/Maintenance Area Emissions Estimates (CO area) .................................................................................................................... 32
Table 10. Results of Hot Spot Analyses for Carbon Monoxide ........................................... 33
Table 11. 2009 Maximum 24-Hour Particulate Matter Concentrations ................................ 37
Table 12. Fugitive Dust Emissions ...................................................................................... 38
Table 13. Characteristics of SH 7 BRT ( or Express Bus) Station and Parking Facility ................................................................................................................. 39
Table 14. Comparison of PM10 Dispersion Model Data at SH 7 BRT Station and Parking Lot and Thornton Parkway RTD Facility ................................................. 40
Table 15. North I-25 Commuter Rail Maintenance Yard ..................................................... 43
Table 16. Comparisons of Commuter Rail Maintenance Yard North I-25 to FasTracks Fox North Rail Maintenance Yard ...................................................... 43
Table 17. Comparisons of Physical Attributes of the RTD Commuter Bus Maintenance Facility in Commerce City to Greeley Bus and BRT Maintenance Facility ............................................................................................ 45
Table 18. Comparison of Commerce City RTD and Greeley Maintenance Facility ............. 46
Table 19. MSAT Emissions (tons per year) by Package ..................................................... 46
Table 20. Sensitive Land Uses Affected by the Preferred Alternative ................................. 49
Table 21. Summary of Express Bus Indirect Effects for Phase 1 ........................................ 51
Table 22. Statewide Ammonia Emissions ........................................................................... 52
Table 23. Statewide SO2 Emissions .................................................................................... 52
Table 24. Statewide NOx Emissions .................................................................................... 53
Table 25. Colorado Highway Emissions .............................................................................. 56

1
Final EIS August 2011 Technical Memorandum: Air Quality Addendum
1.0 SUMMARY The Federal Highway Administration (FHWA) and the Colorado Department of Transportation (CDOT) are evaluating multi-modal transportation improvements along approximately 61 miles of the Interstate 25 (I-25) corridor from the Fort Collins-Wellington area to Denver.
The Draft Environmental Impact Statement (DEIS) evaluated the base year 2001, interim year 2015, and the design/planning year 2030 for each alternative: No-Action, Package A, and Package B. The 2015 scenarios were hypothetical in that they consisted of the full build-out of the proposed transportation systems.
The Final Environmental Impact Statement (FEIS) updated transportation networks to include the base year 2005 and 2035 No-Action, 2035 Package A, 2035 Package B, 2035 Preferred Alternative, and 2035 Phase 1 scenarios. Normally the FEIS should replicate the analyses performed in the DEIS, with the updated interim year changing to 2020 or 2022. However upon consideration, analysis of an interim year did not seem to be appropriate because this project is anticipating true build-out far beyond 2035. The initial set of project improvements identified in Phase 1 is not funded until late in the current planning cycle. The first Phase 1 construction projects are not foreseen to occur until about 2030 to 2035. In addition, the final phases of the North I-25 project may not be completed until 2075 due to funding constraints. Therefore, after consultation with FHWA and CDOT, it was determined that an interim year would not be included. However, for the carbon monoxide (CO) hot spot analysis, an interim scenario (No-Action 2035) was included to show meaningful phasing information. This interim year scenario includes analysis at a worst operating intersection (Harmony Road and I-25) representing the unbuilt portion of the corridor (non Phase 1).
This document is an addendum to the previous Air Quality Technical Report, prepared by Jacobs Engineering in 2008, which provides an overall analysis of potential regional and local air quality impacts. The results are summarized below.
Corridor Emission Analysis
Regional VMT measured over the regional study area would increase approximately 80 percent between 2005 and 2035. Regional analyses of total criteria pollutants show reductions in total emissions between 2005 and 2035: CO decreases 12 percent, VOC decreases 55 percent, NOx decreases 76 percent, and PM10 decreases 1 percent. Criteria pollutant emissions for all of the 2035 Build Alternatives (Package A, Package B, the Preferred Alternative, and Phase 1) would average about 1 percent higher than the 2035 No-Action emissions. Package B and Phase 1 would generate slightly fewer criteria pollutant emissions than Package A or the Preferred Alternative due to proposed rail transit improvements for Package A and the Preferred Alternative. For MSATs, the emissions would be relatively the same for all of the Build Alternatives. The substantial reductions in pollutant

2
Final EIS August 2011 Technical Memorandum: Air Quality Addendum
concentrations between 2005 and 2035 are due primarily to future emissions controls and low-sulfur fuels.
MSAT emissions would be reduced between 51 percent and 57 percent for acetaldehyde, acrolein, benzene, 1,3-butadiene, and formaldehyde between 2005 and the 2035 No-Action Alternative. DPM was reduced by over 93 percent during that same timeframe. PM10 emissions reductions are much less than reductions in DPM emissions because PM10 is made up of more components than DPM, including gasoline and diesel engine exhaust and evaporative emissions, brake wear, tire wear, and road dust.
Forecasted emissions for MSATs would in all cases be increased between No-Action levels in 2035 and those predicted for the Preferred Alternative and Phase 1. On a percentage basis, the increases are less than one percent for benzene and acrolein. Acetaldehyde and 1,3 butadiene would both increased between one percent and two percent. For formaldehyde, percent increases would be highest with diesel particulates: 5.8 percent with the Preferred Alternative and 4.8 percent for Phase 1. Phase 1 emissions would be slightly higher than the Preferred Alternative for two pollutants: benzene and formaldehyde. The reason for this is that the vehicle mix for the Preferred Alternative would include more heavy trucks, because it would have more travel on freeways.
Attainment/Maintenance Areas
Fort Collins Area: The Preferred Alternative 2035 total CO emissions would be about 0.436 to 1.971 tons more than the other Build alternatives in 2035. This increase would be attributed in part to the vehicle VMT since increased VMT is directly linked to increased emissions.
Greeley Area: A comparison shows that Package B and Phase 1 within the Greeley SIP area would contribute more emissions of CO than Package A and the Preferred Alternative. The higher emissions would be due to corresponding higher VMT.
Longmont Area: A comparison shows that Package A and the Preferred Alternative within the Longmont SIP area would contribute more emissions of COthan Package B and Phase 1. The higher emissions would be due to corresponding higher VMT associated with Package A and the Preferred Alternative.
Denver Ozone and PM10 Area: A comparison shows that Package A and Package B within the Denver ozone and PM10 SIP areas would contribute more overall criteria pollutant emissions than the Preferred Alternative and Phase 1. The higher emissions would be due to corresponding higher VMT associated with Package A and Package B.
Denver CO Area: A comparison shows that Package A and the Preferred Alternative within the Denver CO SIP area would contribute more CO emissions than Package B and Phase 1. This increase would be attributed in part to the commuter rail component associated with Package A and the Preferred Alternative.
3
Final EIS August 2011 Technical Memorandum: Air Quality Addendum
Project Level Analyses
Mobile Source Air Toxic Results
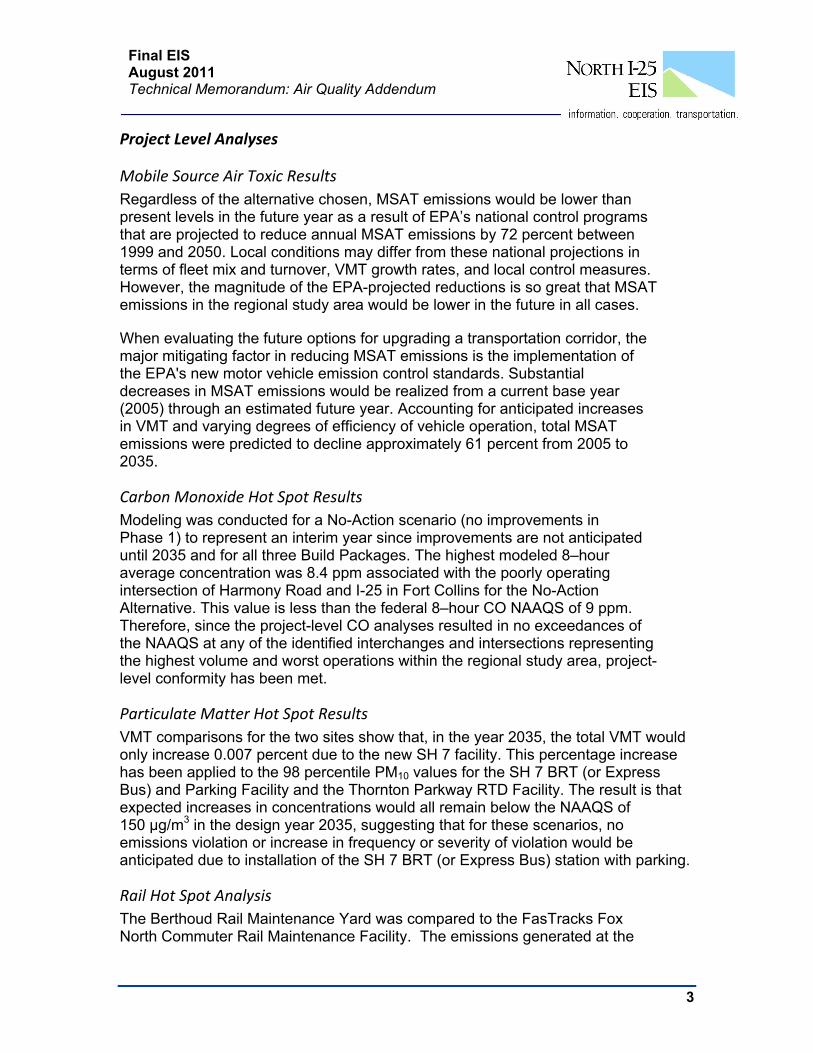
Regardless of the alternative chosen, MSAT emissions would be lower than present levels in the future year as a result of EPA’s national control programs that are projected to reduce annual MSAT emissions by 72 percent between 1999 and 2050. Local conditions may differ from these national projections in terms of fleet mix and turnover, VMT growth rates, and local control measures. However, the magnitude of the EPA-projected reductions is so great that MSAT emissions in the regional study area would be lower in the future in all cases.
When evaluating the future options for upgrading a transportation corridor, the major mitigating factor in reducing MSAT emissions is the implementation of the EPA's new motor vehicle emission control standards. Substantial decreases in MSAT emissions would be realized from a current base year (2005) through an estimated future year. Accounting for anticipated increases in VMT and varying degrees of efficiency of vehicle operation, total MSAT emissions were predicted to decline approximately 61 percent from 2005 to 2035.
Carbon Monoxide Hot Spot Results
Modeling was conducted for a No-Action scenario (no improvements in Phase 1) to represent an interim year since improvements are not anticipated until 2035 and for all three Build Packages. The highest modeled 8–hour average concentration was 8.4 ppm associated with the poorly operating intersection of Harmony Road and I-25 in Fort Collins for the No-Action Alternative. This value is less than the federal 8–hour CO NAAQS of 9 ppm. Therefore, since the project-level CO analyses resulted in no exceedances of the NAAQS at any of the identified interchanges and intersections representing the highest volume and worst operations within the regional study area, project-level conformity has been met.
Particulate Matter Hot Spot Results
VMT comparisons for the two sites show that, in the year 2035, the total VMT would only increase 0.007 percent due to the new SH 7 facility. This percentage increase has been applied to the 98 percentile PM10 values for the SH 7 BRT (or Express Bus) and Parking Facility and the Thornton Parkway RTD Facility. The result is that expected increases in concentrations would all remain below the NAAQS of 150 µg/m3 in the design year 2035, suggesting that for these scenarios, no emissions violation or increase in frequency or severity of violation would be anticipated due to installation of the SH 7 BRT (or Express Bus) station with parking.
Rail Hot Spot Analysis
The Berthoud Rail Maintenance Yard was compared to the FasTracks Fox North Commuter Rail Maintenance Facility. The emissions generated at the

4
Final EIS August 2011 Technical Memorandum: Air Quality Addendum
Fox North facility would be well below the PM10 NAAQs. The Berthoud Rail Maintenance Yard services a much smaller engine fleet and would thus be less than the NAAQs and unlikely to cause or contribute to any new localized PM10 violations or increase the frequency or severity of any existing violations.
Commuter Bus and BRT Hot Spot Analysis
The 98 percentile maximum PM10 concentration would remain below the NAAQS of 150 µg/m3 in the design year 2035 at the proposed Greeley facility. This suggests that for these scenarios, no emissions violation or increase in frequency or severity of violation are anticipated due to operations at the Greeley Bus or BRT Maintenance Facility.
Uncontrolled and controlled dust emissions were calculated for the No Build, Package A, Package B, Preferred Alternative, and Phase 1. Total VMT for each alternative within the study area were used for the calculations. In addition, default values for other inputs such as silt content, vehicle weight, and control efficiency were obtained from the AP-42 Fifth Edition. As shown in Table 12, fugitive dust emissions would be approximately 0.01 percent higher for all Build Alternatives compared to the No Build alternative. Although dust emissions are anticipated to be slightly higher compared to the No-Action Alternative, the increase is not expected to cause an exceedance of the NAAQS.
Indirect Effects
Nitrogen Deposition Results
Averaged future 2035 Build Alternative (Package A, Package B, the Preferred Alternative, and Phase 1) projections of these nitrogen emissions from transportation would decrease approximately 76 percent, or roughly 46,074 tons per year compared to current baseline 2005 conditions (see Table 4, for all 2035 alternatives). However, based on calculations from FHWA, ammonia emissions would increase 78 percent or 870 tons per year. The dominant source of ammonia emissions is generated from area sources, including agricultural livestock and crop production. Agricultural uses are decreasing due to urbanization in the study area. However, ammonia emissions from mobile sources increase due to VMT increasing in the corridor and emissions rates from mobile sources (in terms of ammonia per mile of driving) also increase slightly. Ammonia is a by-product of catalytic converter systems on vehicles to reduce NOx emissions. Therefore, as more on-road and non-road vehicles are equipped with catalytic converters, ammonia emissions from the average vehicle will increase somewhat. Package A and the Preferred Alternative are estimated to have higher VMT compared to Package B or Phase 1 (see Table 3). Therefore, since these alternatives would have more on-road and non-road vehicles likely to be equipped with catalytic converters, ammonia emissions are anticipated to be marginally higher for Package A and the Preferred Alternative, as listed below:
5
Final EIS August 2011 Technical Memorandum: Air Quality Addendum
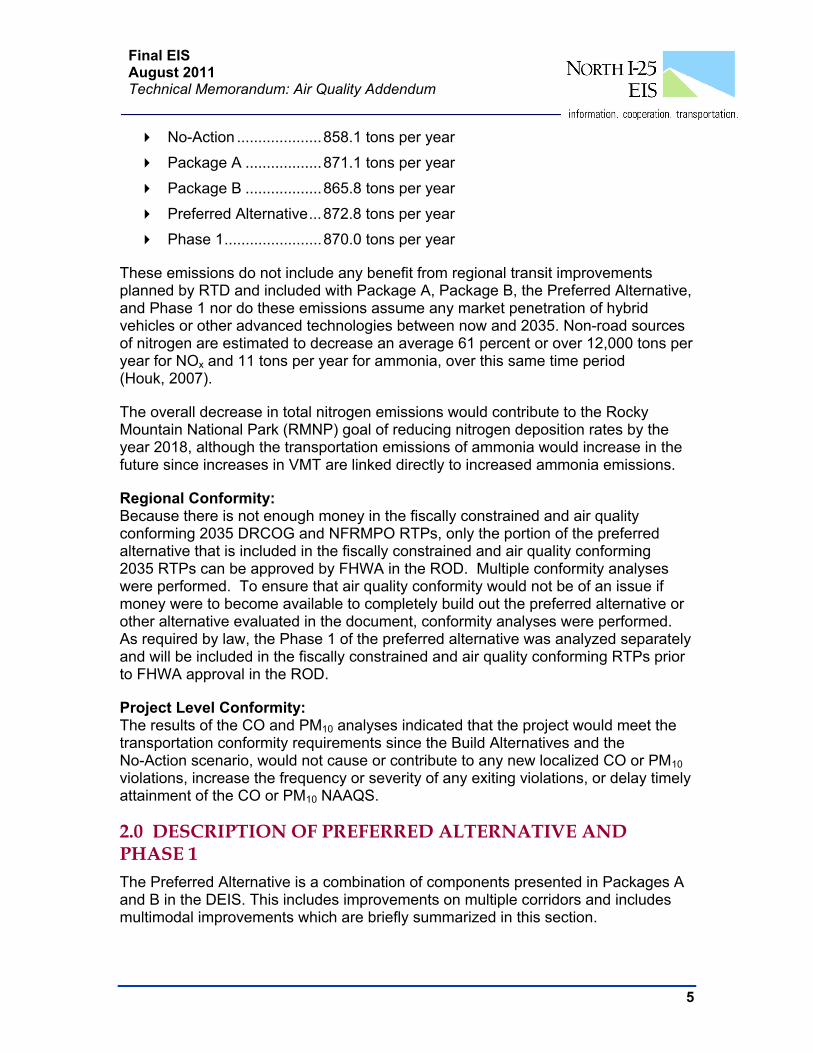
No-Action .................... 858.1 tons per year
Package A .................. 871.1 tons per year
Package B .................. 865.8 tons per year
Preferred Alternative ... 872.8 tons per year
Phase 1 ....................... 870.0 tons per year
These emissions do not include any benefit from regional transit improvements planned by RTD and included with Package A, Package B, the Preferred Alternative, and Phase 1 nor do these emissions assume any market penetration of hybrid vehicles or other advanced technologies between now and 2035. Non-road sources of nitrogen are estimated to decrease an average 61 percent or over 12,000 tons per year for NOx and 11 tons per year for ammonia, over this same time period (Houk, 2007).
The overall decrease in total nitrogen emissions would contribute to the Rocky Mountain National Park (RMNP) goal of reducing nitrogen deposition rates by the year 2018, although the transportation emissions of ammonia would increase in the future since increases in VMT are linked directly to increased ammonia emissions.
Regional Conformity: Because there is not enough money in the fiscally constrained and air quality conforming 2035 DRCOG and NFRMPO RTPs, only the portion of the preferred alternative that is included in the fiscally constrained and air quality conforming 2035 RTPs can be approved by FHWA in the ROD. Multiple conformity analyses were performed. To ensure that air quality conformity would not be of an issue if money were to become available to completely build out the preferred alternative or other alternative evaluated in the document, conformity analyses were performed. As required by law, the Phase 1 of the preferred alternative was analyzed separately and will be included in the fiscally constrained and air quality conforming RTPs prior to FHWA approval in the ROD.
Project Level Conformity: The results of the CO and PM10 analyses indicated that the project would meet the transportation conformity requirements since the Build Alternatives and the No-Action scenario, would not cause or contribute to any new localized CO or PM10 violations, increase the frequency or severity of any exiting violations, or delay timely attainment of the CO or PM10 NAAQS.
2.0 DESCRIPTION OF PREFERRED ALTERNATIVE AND PHASE 1 The Preferred Alternative is a combination of components presented in Packages A and B in the DEIS. This includes improvements on multiple corridors and includes multimodal improvements which are briefly summarized in this section.

6
Final EIS August 2011 Technical Memorandum: Air Quality Addendum
The Preferred Alternative would widen I-25 with general purpose lanes and Tolled Express Lanes (TEL) (lanes restricted to high-occupant vehicles and tolled single occupant vehicles). Access to the TELs would be provided via slip ramps connecting the general purpose lanes. Carpool lots would be located near many interchanges along the I-25 corridor to serve HOV users of the TELs. Substandard interchanges along the corridor would be reconstructed. No new interchange locations have been identified for this FEIS.
The Preferred Alternative would also provide express bus service, commuter bus service, and commuter rail service. Express bus service would connect northern Colorado communities to downtown Denver and to DIA, utilizing the express lanes along I-25. Commuter bus service would be provided along US 85 connecting Greeley to downtown Denver. Queue jumps are bus-only lanes at signalized intersections that provide an opportunity for buses to pass stopped vehicles queued at the intersection. Commuter bus station locations identified in Package A of the DEIS would remain the same in the Preferred Alternative. Commuter rail transit service would be provided from Fort Collins to the anticipated FasTracks North Metro end-of-line. Stations would be at the same locations as for the commuter rail service included in Package A of the DEIS but the number of parking spaces has slightly changed. The rail line would be largely single-track with passing tracks in four locations.
Lastly, the Preferred Alternative would provide grade separated crossings, retaining walls, water quality ponds, drainage structures, and improvements to frontage roads, maintenance roads, and maintenance facilities.
The availability of funding will impact the timing and phasing of construction of the Preferred Alternative. Therefore, a phased Record of Decision (ROD) will be required. This phased ROD approach enables FHWA and FTA to meet their federal obligations while addressing the needs of the area on a broad scale. Phase 1 components include the following:
Widening I-25 between SH 66 and SH 56 with one TEL in each direction.
Widening I-25 between SH 392 and SH 14 - would initially be used as continuous accel/decel lanes but would ultimately become part of the general purpose lanes.
Widening I-25 between 120th Avenue and approximately US 36—one buffer-separated TEL in each direction.
Interchange replacement and upgrades—SH 14, Prospect, SH 56, CR 34, and SH 7 would be constructed to their ultimate configurations. SH 392 and 84th Avenue would be completed as part of a separate project.
Six carpool lots at I-25 interchanges.
Commuter rail right-of-way preservation—All right-of-way necessary to construct the ultimate commuter rail configuration would be purchased as part of Phase 1.

7
Final EIS August 2011 Technical Memorandum: Air Quality Addendum
Initial I-25 Bus—Regional bus service connecting Fort Collins and Greeley to downtown Denver and DIA would be initiated. Four transit stations would be constructed as part of Phase 1 and 27 buses would be purchased.
Commuter Bus—Commuter bus along US 85 connecting Greeley to downtown Denver would be implemented in Phase 1. This would include construction of five stations, 17 queue jumps/transit signal priority intersections and the purchase of five buses.
Chapter 2.0 Alternatives, of the FEIS describes the Preferred Alternative and Chapter 8.0 Project Phasing describes Phase 1 in more detail.
3.0 AFFECTED ENVIRONMENT
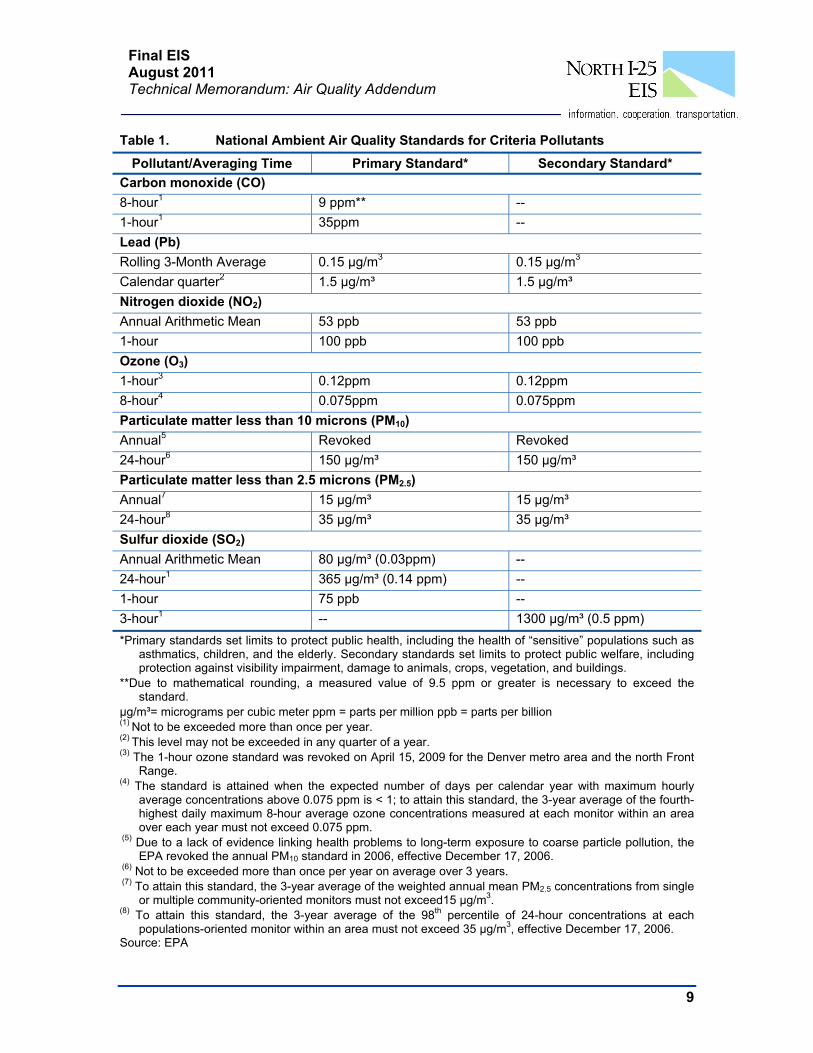
3.1 REGULATORY FRAMEWORK The Clean Air Act and its amendments led EPA to establish NAAQS for each of six criteria pollutants to protect the public from the health hazards associated with air pollution. The six criteria pollutants are CO, lead, nitrogen dioxide, ozone, particulate matter, and sulfur dioxide. NAAQS for these criteria pollutants were established based on known human health effects and measurable, health-related threshold values. Table 1 summarizes the revised standards due to regulatory changes since the DEIS.
3.1.1 Transportation Conformity Transportation conformity, as a provision of the Clean Air Act (as amended in 1990), helps to ensure that transportation funds go to projects that are consistent with local air quality goals outlined in the State Implementation Plan (SIP). Conformity applies to regionally significant and federally funded projects located in designated non-attainment or attainment/maintenance areas. Conformity regulations require that these actions be included in a fiscally constrained and air quality conforming Regional Transportation Plan (RTP), Transportation Improvement Program (TIP), and the proposed project will not cause or contribute any new violation of the NAAQS. The SIP identifies the allowable on-road emissions levels to attain the air quality standards as an emissions budget. These budgets act as a cap on emissions and represent the "holding capacity" of the area. The motor vehicle emissions budget that is explicitly identified in the six project area SIPs has been used in the transportation conformity process to cap the emissions allowed by motor vehicles on the corridor transportation network as planned.
The estimated cost of the North I-25 proposed project exceeds the current available or planned funding contained in the 2035 Metro Vision Regional Transportation Plan (2035 MVRTP) (DRCOG 2007) and the North Front Range 2035 RTP. Therefore, this project will be implemented in phases when funding becomes available. Details of the phasing components are summarized in Chapter 8.0 Project Phasing of the FEIS.
8
Final EIS August 2011 Technical Memorandum: Air Quality Addendum
Because there is not enough money in the fiscally constrained and air quality conforming 2035 DRCOG and NFRMPO RTPs, only the portion of the preferred alternative that is included in the fiscally constrained and air quality conforming 2035 RTPs can be approved by FHWA in the ROD. Multiple conformity analyses were performed. To ensure that air quality conformity would not be an issue if money were to become available to completely build out the preferred alternative or other alternative evaluated in the document, conformity analyses were performed. As required by law, the Phase 1 of the preferred alternative was analyzed separately and will be included in the fiscally constrained and air quality conforming RTPs prior to FHWA approval in the ROD.
9
Final EIS August 2011 Technical Memorandum: Air Quality Addendum
Table 1. National Ambient Air Quality Standards for Criteria Pollutants
Pollutant/Averaging Time Primary Standard* Secondary Standard*
Carbon monoxide (CO)
8-hour1 9 ppm** --
1-hour1 35ppm --
Lead (Pb)
Rolling 3-Month Average 0.15 µg/m3 0.15 µg/m3
Calendar quarter2 1.5 µg/m³ 1.5 µg/m³
Nitrogen dioxide (NO2)
Annual Arithmetic Mean 53 ppb 53 ppb
1-hour 100 ppb 100 ppb
Ozone (O3)
1-hour3 0.12ppm 0.12ppm
8-hour4 0.075ppm 0.075ppm
Particulate matter less than 10 microns (PM10)
Annual5 Revoked Revoked
24-hour6 150 µg/m³ 150 µg/m³
Particulate matter less than 2.5 microns (PM2.5)
Annual7 15 µg/m³ 15 µg/m³
24-hour8 35 µg/m³ 35 µg/m³
Sulfur dioxide (SO2)
Annual Arithmetic Mean 80 µg/m³ (0.03ppm) --
24-hour1 365 µg/m³ (0.14 ppm) --
1-hour 75 ppb --
3-hour1 -- 1300 µg/m³ (0.5 ppm)
*Primary standards set limits to protect public health, including the health of “sensitive” populations such as asthmatics, children, and the elderly. Secondary standards set limits to protect public welfare, including protection against visibility impairment, damage to animals, crops, vegetation, and buildings.
**Due to mathematical rounding, a measured value of 9.5 ppm or greater is necessary to exceed the standard.
µg/m³= micrograms per cubic meter ppm = parts per million ppb = parts per billion (1) Not to be exceeded more than once per year. (2) This level may not be exceeded in any quarter of a year. (3) The 1-hour ozone standard was revoked on April 15, 2009 for the Denver metro area and the north Front
Range. (4) The standard is attained when the expected number of days per calendar year with maximum hourly
average concentrations above 0.075 ppm is < 1; to attain this standard, the 3-year average of the fourth-highest daily maximum 8-hour average ozone concentrations measured at each monitor within an area over each year must not exceed 0.075 ppm.
(5) Due to a lack of evidence linking health problems to long-term exposure to coarse particle pollution, the EPA revoked the annual PM10 standard in 2006, effective December 17, 2006.
(6) Not to be exceeded more than once per year on average over 3 years. (7) To attain this standard, the 3-year average of the weighted annual mean PM2.5 concentrations from single
or multiple community-oriented monitors must not exceed15 µg/m3. (8) To attain this standard, the 3-year average of the 98th percentile of 24-hour concentrations at each
populations-oriented monitor within an area must not exceed 35 µg/m3, effective December 17, 2006. Source: EPA
10
Final EIS August 2011 Technical Memorandum: Air Quality Addendum
Project Level (Hot Spot) Conformity
At the project level, CDOT is most concerned with CO since it is directly emitted from the tail pipes of motor vehicles. PM10 emissions are also a local project concern, often derived from motor vehicle exhaust. However, most PM10 in the atmosphere is generated as fugitive dust – fine dust created by vehicle re-entrainment of excess roadside sand and disturbed ground surfaces from both farming and construction. Conformity at the project-level requires “hot spot” analysis if an area is “nonattainment” or “maintenance” for carbon monoxide (CO) and/or particulate matter. In general, projects must not cause the CO or PM standard to be violated, and in “nonattainment” areas the project must not cause any increase in the number and severity of violations. If a known CO or PM violation is located in the project vicinity, the project must include measures to reduce or eliminate the existing violation(s) as well.
3.2 EXISTING CONDITIONS In accordance with the Clean Air Act, EPA requires all states to submit a State Implementation Plan (SIP) to address all areas that do not comply with the National Ambient Air Quality Standards (NAAQS). A SIP contains the set of actions or control measures that the state plans to implement to meet NAAQS. Non-attainment areas contain one or more pollutants levels that are in violation of NAAQS.
Effective November 20, 2007, the EPA designated the Denver metro area and the North Front Range as a non-attainment area for 8-hour ozone (O3). The new ozone non-attainment status requires regions to submit an enforceable State Implementation Plan (SIP) outlining steps regions will take to maintain compliance with the ozone standard. A plan to reduce ozone concentrations was developed by the Colorado Department of Public Health and Environment (CDPHE) Air Pollution Control Division (APCD), along with the Regional Air Quality Council (RAQC), Denver Regional Council of Governments (DRCOG), and the North Front Range Metropolitan Planning Organization (NFRMPO) which was submitted to EPA in July 2009. Control measures outlined in the SIP to reduce ozone concentrations include:
Revisions to Regulation No. 11 (adopted March 2008)—tightened tailpipe emissions standards for VOCs, CO, and NOx used to pass or fail program eligible vehicles in the Denver Metro Area. Vehicles subject to the Automobile Inspection and Readjustment (AIR) program are inspected on a two-year cycle.
Reid Vapor Pressure (RVP)—A request for EPA to strengthened the RVP requirement from 9.0 pounds per square inch to 7.8 psi.
Revisions to Regulation No. 7—expand source-category VOC emissions control requirements to include all ozone non-attainment areas in the state, including the entire Denver/North Front Range non-attainment area.
11
Final EIS August 2011 Technical Memorandum: Air Quality Addendum
Revisions to Regulation No. 3—Air Pollutant Emission Notices (APEN) and permit exemptions will be removed or revised to develop an inventory of emissions from source categories where actual emissions are anticipated to exceed reporting thresholds.
In March 2008, EPA lowered (strengthened) the NAAQS for the 8-hour ozone standard from 0.08 ppm to 0.075 ppm. Ambient air quality data for the years 2005 to 2007 were collected from monitoring stations. In July 2007, there were exceedances of the 8-hour ozone standard recorded which violated the NAAQS of 0.08ppm. Therefore, EPA designated this area as a non-attainment area.
In 2004, USEPA determined particulate matter under 2.5 micrometers in size (PM2.5) within the Denver Metro area and the North Front Range had met the 1997 air quality standards; therefore, designating the Denver metro area and north Front Range as an attainment area. In 2006, USEPA strengthened the 24-hour PM2.5 standard from 65 micrograms per cubic meter (µg/m³) to 35 µg/m³. Due to the lack of evidence linking health problems to long-term exposure to coarse particle pollutions, the EPA revoked the annual PM10 standard in 2006. Modeling of PM2.5 emissions was not conducted since the Denver Metro area and the North Front Range are designated as attainment areas. Precursors of PM2.5 include NOx and VOC which were modeled for this project.
The Denver Metro area and North Front Range are designated as a carbon monoxide (CO) attainment/ maintenance area. The Denver Metro area is also in attainment/maintenance for particulate matter under 10 micrometers in size (PM10). All other criteria pollutants in these areas are in attainment and not considered pollutants of concern. In addition, the portions of the regional study area located outside of the Denver Metro area and North Front Range are designated as attainment areas for all criteria pollutants. Criteria pollutants in attainment areas are not considered pollutants of concern.
3.3 AIR QUALITY MONITORING DATA Based on 2009 and 2010 data, there are 19 active air quality monitoring stations located in the regional study area. Table 2 summarizes the most current monitoring station locations and monitored mobile source related criteria pollutants. Carbon monoxide, NOx, ozone, PM10, PM2.5, total suspended particulate matter approximately 40 microns in diameter (TSP), lead, and sulfur dioxide are monitored in the general area. Lead and sulfur dioxide are generally considered to be industrial pollutants and are not included in Table 2.

12
Final EIS August 2011 Technical Memorandum: Air Quality Addendum
Table 2. 2009 to 2010 Criteria Pollutant Monitoring Station Data
Monitoring Stations Criteria Pollutants County Site Name Location CO NO2 O3 PM10 PM2.5 TSPAdams Commerce City 7101 Birch St. X X Welby 78th Ave. & Steele St. X X X X Boulder Boulder 2440 Pearl St. X X Boulder 2102 Athens St. X Boulder 1405 ½ S. Foothills
Hwy X
Longmont 350 Kimbark St. X X Longmont 440 Main St. X Denver Denver CAMP 2105 Broadway X X X X Denver Firehouse #6 1300 Blake St. X Denver Visitors
Center 225 W Colfax Ave. X
Denver 2325 Irving Street X X Denver 4650 Columbine Street X Larimer Fort Collins 251 Edison St. X X Fort Collins 708 S Madison St. X X Fort Collins 3416 La Porte Ave X Weld Greeley 1516 Hospital Rd. X X Greeley 3101 35th Ave. X Greeley 905 10th Ave. X Platteville 1004 Main St. X Source: CDPHE-APCD, Colorado Annual Monitoring Network Plan 2009 - 2010 (June 30, 2009). CAMP—Continuous Ambient Monitoring Program O3—ozone TSP—total suspended particulates
3.3.1 Criteria Pollutants and Critical Pollutant Data Trends Ozone concentrations have fluctuated and currently remain above the national standard. Concentrations at monitoring stations throughout the regional study area returned to levels below the 8-hour standard concentrations after the 2003 peak. However, concentrations remained above the 8-hour standard after the 2005 peak. In 2006, Fort Collins added a new monitoring station to monitor ozone concentrations (3416 La Porte Avenue). This monitoring station had the highest concentrations of ozone from 2006 to 2008 within the North Front Range.
Carbon monoxide emissions rates have been steadily declining over the past 10 years due to improvements in vehicle engine emission controls, motor efficiency, and fuel composition. However, traffic volumes due to increasing population and travel trips are continuing to rise over time. Ambient monitoring levels for CO concentrations within the regional study area have remained below 9 ppm since 2005. The highest 2008 readings for 8-hour CO in the regional study area were 3.0 ppm, 2.7 ppm, and 3.1 ppm for monitors located in Fort Collins, Longmont, and Denver CAMP, respectively.

13
Final EIS August 2011 Technical Memorandum: Air Quality Addendum
3.4 METHODOLOGY The North I-25 corridor air quality methodology was coordinated with the CDPHE-APCD, the U.S. Environmental Protection Agency (EPA), Colorado Department of Transportation (CDOT) Region 4 and Environmental Programs Branch, Federal Highway Administration (FHWA) and local agency stakeholders during the DEIS. Continued coordination with these agencies was conducted for the FEIS.
EPA’s Motor Vehicle Emission Simulator (MOVES) model was released in December 2009. However, this model has not been approved for use in air quality impact analyses for projects. FHWA and CDOT have agreed that the MOVES model will not be used for this air quality analysis because modeling guidance for project analysis will not likely be required prior to the ROD. The EPA MOBILE 6.2 model incorporates modifications to account for the influences of roadway characteristics (links) and vehicle speed used in the air quality analysis for the DEIS and will be used for this updated air quality analysis for the FEIS. The CDPHE-APCD modeled tailpipe emissions for the regional and attainment/maintenance areas using EPA approved model MOBILE 6.2.
Emission quantities of the criteria pollutants of CO, VOCs, NOx, and PM10, as well as the primary six mobile source air toxics (MSATs) were estimated for each alternative in the FEIS. For PM10 emissions, MOBILE6.2 does not account for re-entrained road dust; only tire wear and brake wear emissions. Modeling of PM2.5 emissions was not conducted since the Denver Metro area and the North Front Range are in attainment. Precursors of PM2.5 include NOx and VOC which were modeled for this project. Roadway facility classifications included expressway, freeway, arterial, connector links, and ramps and queue jumps. Bus-generated emissions were not considered to be regionally significant because the maximum daily circulation volume for the Build Alternatives (Package A commuter and feeder buses, Package B BRT and feeder buses, Preferred Alternative commuter, express, and feeder buses, or Phase 1 express and commuter buses) would be less than 60 buses. No more than 6 idling buses (40 seconds per stop) would be present at any one station, at any peak or non-peak traffic hour. Rail-generated emissions for Package A, the Preferred Alternative, and Phase 1 were calculated separately using emissions factors provided by RTD, and added to the calculated vehicle emissions burden totals (see Table 4 – Table 8). Larger parking lot generated emissions are addressed under project-level analyses.
Fugitive dust generated from on-road vehicle entrainment of roadway dust and construction generated emissions were not included in these calculations.
3.4.1 Corridor Analysis Regional analyses incorporate the entire existing and proposed roadway network within the regional study area boundary.
Emissions from mobile sources for various air pollutants within the entire regional study area were estimated for the existing condition (Year 2005), the No-Action Alternative
14
Final EIS August 2011 Technical Memorandum: Air Quality Addendum
(2035), Package A (2035), Package B (2035), Preferred Alternative (2035), and Phase 1 (2035). The existing condition year is the year that the travel demand models were calibrated (see Travel Demand Traffic Technical Report (Jacobs, 2011) for more detail). Future emissions were based on anticipated traffic levels for each alternative for the design year 2035 (see Table 4). Emissions levels included winter-summer seasonal influence, expected vehicle types, and traffic composition. Portions of all six SIP areas were included within this evaluation.
Information for Phase 1 is provided throughout the rest of this section because that is the only portion of the Preferred Alternative that is on the two Regional Transportation Plans. For more information about Phase 1, see Section ES.7 Executive Summary or Chapter 8.0 Phasing of the FEIS.
Travel demand forecasting completed for the FEIS generated a calculation of vehicle-miles traveled for the regional study area. The traffic network was evaluated by roadway linkages (as described in Chapter 4 Transportation of the FEIS) and found an influence from proposed project changes on traffic volume of 5 percent or more around the primary travel corridors of US 287, I-25, and US 85.
3.4.2 Attainment/Maintenance Areas
Emissions for various air pollutants within each attainment/maintenance area were estimated to provide a comparison against important mobile source air quality area pollutant emission burdens calculated by local planning and air quality agencies for each SIP area. These emission calculations are similar to the attainment/maintenance area conformity modeling and include the North I-25 regional study area. Comparisons are meant to compare emissions generated among the project alternatives.
Future emissions were based on traffic distributions, speeds and volumes for each component located in each of the attainment/maintenance areas. Emissions levels included seasonal influences, vehicle types and traffic composition.
3.4.3 Project Level CO Analysis Quantitative CO dispersion modeling was conducted at five signalized interchange and intersection localities where traffic volumes were high and operational levels of service were deficient in the future. At least one representative CO hot spot analysis was conducted in each of the attainment/maintenance areas.
The CAL3QHC model was used to estimate CO concentrations at poorly operating signalized intersections to simulate worst-case localized air pollutant emissions at points where vehicles congregate, incorporating idling emissions and start-stop traffic conditions. High volume intersections and interchanges within the project area affected by Package A, Package B, the Preferred Alternative and Phase 1 traffic conditions, and operating with unacceptable levels of congestion (LOS D or worse) were selected through consultation with CDPHE-APCD, EPA, and FHWA for project-level “hot spot” analysis during the DEIS. Consultation was conducted with CDOT
15
Final EIS August 2011 Technical Memorandum: Air Quality Addendum
and CDPHE-APCD for the FEIS. The same intersections were modeled since these remain the worst operating intersections.
Harmony Road and I-25 [Package A and Preferred Alternative] (Fort Collins SIP)
Evans Bus Station at 31st Street and US 85 [Package A, Package B, Preferred Alternative, and Phase 1] (Greeley SIP)
Sugar Mill Transit Station at SH 119 and County Line Road [Package A and Preferred Alternative] (Longmont SIP)
SH 7 and I 25 [Package A, Preferred Alternative, and Phase 1] (Denver SIP)
Thornton Parkway and I-25 [Package A, Preferred Alternative, and Phase 1] (Denver SIP)
In addition, modeling was conducted for a No-Action scenario (no improvements in Phase 1) to represent an interim year since improvements are not anticipated until 2035.
Traffic volumes at these intersections are among the highest in their respective corridors and SIP areas. All the above intersections experience current congestion at peak hours. These intersections and interchanges would continue to experience congestion in the future under the No-Action Alternative, Package A, Package B, Preferred Alternative or Phase 1. Each location was modeled for the proposed 2035 traffic volumes, number of through lanes, turning lanes, and signalization.
Motor vehicle emissions rates for 2005 were combined with projected 2035 peak-hour traffic volumes at each intersection to utilize the highest emissions rate with the highest traffic volumes, to represent the worst-case modeling conditions for future years (see Table 4).
Inputs for the model included projected traffic volumes, motor vehicle emission rates, roadway geometries, traffic signal timing and worst-case meteorological conditions. The CDPHE-APCD provided the motor vehicle emission rates (composite running emissions and idle) using EPA’s MOBILE6.2 emission factor model. Inputs for the MOBILE6.2 model included vehicle mix, running speeds, ambient temperature, and vehicle hot/cold start operating percentages. The CDPHE-APCD also provided idle motor vehicle emission rates using the MOBILE6.2 emission factor model and an EPA method for estimating idle emissions from composite emissions. Copies of model input/output data and emission factors are included in Appendix A. Traffic data can be found in Appendix B.
Worst-case meteorological conditions included low wind speed (1 meter/second) and atmospheric stability class D. The CAL3QHC model determines the worst-case wind direction by selecting the wind direction that results in the highest CO concentration at each receptor. Per EPA guidance, receptors were modeled 20 feet from the edge of the outside travel lane on the queue links at the selected intersections. Receptors
16
Final EIS August 2011 Technical Memorandum: Air Quality Addendum
located according to EPA guidance represent worst-case locations for modeling possible violations of federal CO standards.
3.4.4 Project Level PM10 Analysis This section summarizes the results of two separate PM10 analyses. First, a qualitative analysis was performed for the portions of the project within the Denver PM10 maintenance area, where the Clean Air Act transportation conformity requirements apply. Second, a similar analysis was performed for elements of the project located outside of the PM10 maintenance area, for purposes of characterizing the likely impacts of these aspects of the project.
PM10 CONFORMITY ANALYSIS
The conformity analysis followed the guidelines presented in the Transportation Conformity Guidance for Qualitative Hot-Spot Analyses in PM2.5 and PM10 Non-attainment and Maintenance Areas (2006). The following elements were included in the PM10 hot-spot analysis:
Description of proposed project
Description of the type of PM10 emissions
Contributing Factors
Description of analysis years
Description of existing conditions
Description of changes resulting from project
Description of analysis method chosen
Professional Judgment of Impact
Discussion of any mitigation measures
Conclusion on how project meets 40 CFR 93.116 and 93.123.
The PM10 qualitative hotspot analysis was conducted for the worst-case transit station and parking facility within the regional study area (located within the Denver PM10 attainment/maintenance area), along with the worst-case traffic location. Where regional SIP modeling exists, the analyses used comparisons of nodal emissions estimated values for future years. The commuter rail comparative analysis incorporated dispersion modeling and analysis undertaken for a nearby transit project. The Regional Transportation District (RTD) sourced emissions factors were used by that project.
3.4.5 Project Level MSAT Analysis A basic quantitative analysis of mobile source air toxic (MSAT) emissions from the regional study area of the proposed project was completed using the latest version of the EPA’s mobile emission factor model (MOBILE6.2) as discussed in Section
17
Final EIS August 2011 Technical Memorandum: Air Quality Addendum
3.4.1 Regional Analysis. The local study area used for this traffic analysis includes all major roadways potentially affected by the proposed new transportation facility. Specific emissions levels for each transit station along these rail and bus routes were not evaluated in this study.
Project level MSAT analyses was conducted for bus maintenance facilities using emission factors generated specifically for bus emissions through diesel research conducted by the California Air Resources Board (Ayala, 2003). Overall VMT relationships among packages were utilized to estimate future trends in MSAT emissions.
Controlling air toxic emissions became a national priority with the passage of the Clean Air Act Amendments (CAAA) of 1990, whereby Congress mandated that the EPA regulate 188 air toxics, also known as hazardous air pollutants. The EPA has assessed this expansive list in their latest rule on the Control of Hazardous Air Pollutants from Mobile Sources (Federal Register, Vol. 72, No.37, page 8430, February 26, 2007) and identified a group of 93 compounds emitted from mobile sources that are listed in their Integrated Risk Information System (IRIS) (http://www.epa.gov/ncea/iris/index.html). In addition, EPA identified seven compounds with significant contributions from mobile sources that are among the national and regional-scale cancer risk drivers from their 1999 National Air Toxics Assessment (NATA) (http://www.epa.gov/ttn/atw/nata1999/). These components are acrolein, benzene, 1,3-butadiene, diesel particulate matter plus diesel exhaust organic gases (diesel PM), formaldehyde, naphthalene, and polycyclic organic matter. While FHWA considers these the priority mobile source air toxics, the list is subject to change and may be adjusted in consideration of future EPA rules.
The 2007 EPA rule mentioned above requires controls that will dramatically decrease MSAT emissions through cleaner fuels and cleaner engines. According to an FHWA analysis using EPA’s MOBILE6.2 model, even if vehicle activity (vehicle-miles traveled, VMT) increases by 145 percent as assumed, a combined reduction of 72 percent in the total annual emission rate for the priority MSAT is projected from 1999 to 2050, as shown in Figure 1.
Unavailable Information for Project Specific MSAT Impact Analysis
In FHWA's view, information is incomplete or unavailable to credibly predict the project-specific health impacts due to changes in MSAT emissions associated with a proposed set of highway alternatives. The outcome of such an assessment, adverse or not, would be influenced more by the uncertainty introduced into the process through assumption and speculation rather than any genuine insight into the actual health impacts directly attributable to MSAT exposure associated with a proposed action.
The EPA is responsible for protecting the public health and welfare from any known or anticipated effect of an air pollutant. They are the lead authority for administering the Clean Air Act and its amendments and have specific statutory obligations with respect to hazardous air pollutants and MSAT. The EPA is in the continual process

18
Final EIS August 2011 Technical Memorandum: Air Quality Addendum
of assessing human health effects, exposures, and risks posed by air pollutants. They maintain the Integrated Risk Information System (IRIS), which is "a compilation of electronic reports on specific substances found in the environment and their potential to cause human health effects" (EPA, http://www.epa.gov/ncea/iris/index.html). Each report contains assessments of non-cancerous and cancerous effects for individual compounds and quantitative estimates of risk levels from lifetime oral and inhalation exposures with uncertainty spanning perhaps an order of magnitude.
Other organizations are also active in the research and analyses of the human health effects of MSAT, including the Health Effects Institute (HEI). Two HEI studies are summarized in Appendix D of FHWA's Interim Guidance Update on Mobile Source Air Toxic Analysis in NEPA Documents. Among the adverse health effects linked to MSAT compounds at high exposures are cancer in humans in occupational settings; cancer in animals; and irritation to the respiratory tract, including the exacerbation of asthma. Less obvious is the adverse human health effects of MSAT compounds at current environmental concentrations (HEI, http://pubs.healtheffects.org/view.php?id=282) or in the future as vehicle emissions substantially decrease (HEI, http://pubs.healtheffects.org/view.php?id=306).
19
Final EIS August 2011 Technical Memorandum: Air Quality Addendum
Figure 1. National MSAT Emission Trends 1999 to 2050 For Vehicles Operating On Roadways Using EPA's Mobile6.2 Model
Note: (1) Annual emissions of polycyclic organic matter are projected to be 561 tons/yr for 1999, decreasing to 373 tons/yr for
2050.(2) Trends for specific locations may be different, depending on locally derived information representing vehicle-miles travelled, vehicle speeds, vehicle mix, fuels, emission control programs, meteorology, and other factors
Source: U.S. Environmental Protection Agency. MOBILE6.2 Model run 20 August 2009.
20
Final EIS August 2011 Technical Memorandum: Air Quality Addendum
The methodologies for forecasting health impacts include emissions modeling; dispersion modeling; exposure modeling; and then final determination of health impacts - each step in the process building on the model predictions obtained in the previous step. All are encumbered by technical shortcomings or uncertain science that prevents a more complete differentiation of the MSAT health impacts among a set of project alternatives. These difficulties are magnified for lifetime (i.e., 70 year) assessments, particularly because unsupportable assumptions would have to be made regarding changes in travel patterns and vehicle technology (which affects emissions rates) over that time frame, since such information is unavailable. The results produced by the EPA's MOBILE6.2 model, the California EPA's Emfac2007 model, and the EPA's DraftMOVES2009 model in forecasting MSAT emissions are highly inconsistent. Indications from the development of the MOVES model are that MOBILE6.2 significantly underestimates diesel particulate matter (PM) emissions and significantly overestimates benzene emissions.
Regarding air dispersion modeling, an extensive evaluation of EPA's guideline CAL3QHC model was conducted in an NCHRP study (http://www.epa.gov/scram001/dispersion_alt.htm#hyroad), which documents poor model performance at ten sites across the country - three where intensive monitoring was conducted plus an additional seven with less intensive monitoring. The study indicates a bias of the CAL3QHC model to overestimate concentrations near highly congested intersections and underestimate concentrations near uncongested intersections. The consequence of this is a tendency to overstate the air quality benefits of mitigating congestion at intersections. Such poor model performance is less difficult to manage for demonstrating compliance with National Ambient Air Quality Standards for relatively short time frames than it is for forecasting individual exposure over an entire lifetime, especially given that some information needed for estimating 70-year lifetime exposure is unavailable. It is particularly difficult to reliably forecast MSAT exposure near roadways, and to determine the portion of time that people are actually exposed at a specific location.
There are considerable uncertainties associated with the existing estimates of toxicity of the various MSAT, because of factors such as low-dose extrapolation and translation of occupational exposure data to the general population, a concern expressed by HEI (http://pubs.healtheffects.org/view.php?id=282 ). As a result, there is no national consensus on air dose-response values assumed to protect the public health and welfare for MSAT compounds, and in particular for diesel PM. The EPA (http://www.epa.gov/risk/basicinformation.htm#g ) and the HEI (http://pubs.healtheffects.org/getfile.php?u=395) have not established a basis for quantitative risk assessment of diesel PM in ambient settings.
There is also the lack of a national consensus on an acceptable level of risk. The current context is the process used by the EPA as provided by the Clean Air Act to determine whether more stringent controls are required in order to provide an ample margin of safety to protect public health or to prevent an adverse environmental effect for industrial sources subject to the maximum achievable control technology standards, such as benzene emissions from refineries. The decision framework is a
21
Final EIS August 2011 Technical Memorandum: Air Quality Addendum
two-step process. The first step requires EPA to determine a "safe" or "acceptable" level of risk due to emissions from a source, which is generally no greater than approximately 100 in a million. Additional factors are considered in the second step, the goal of which is to maximize the number of people with risks less than 1 in a million due to emissions from a source. The results of this statutory two-step process do not guarantee that cancer risks from exposure to air toxics are less than 1 in a million; in some cases, the residual risk determination could result in maximum individual cancer risks that are as high as approximately 100 in a million. In a June 2008 decision, the U.S. Court of Appeals for the District of Columbia Circuit upheld EPA's approach to addressing risk in its two step decision framework. Information is incomplete or unavailable to establish that even the largest of highway projects would result in levels of risk greater than safe or acceptable.
Because of the limitations in the methodologies for forecasting health impacts described, any predicted difference in health impacts between alternatives is likely to be much smaller than the uncertainties associated with predicting the impacts. Consequently, the results of such assessments would not be useful to decision makers, who would need to weigh this information against project benefits, such as reducing traffic congestion, accident rates, and fatalities plus improved access for emergency response, that are better suited for quantitative analysis.
In FHWA's view, information is incomplete or unavailable to credibly predict the project-specific health impacts due to changes in MSAT emissions associated with a proposed set of highway alternatives. The outcome of such an assessment, adverse or not, would be influenced more by the uncertainty introduced into the process through assumption and speculation rather than any genuine insight into the actual health impacts directly attributable to MSAT exposure associated with a proposed action.
3.4.6 Class I Federal Areas and Nitrogen Deposition Combustion of fossil fuels, such as petroleum and coal, generates emissions that form NOx in the atmosphere and is the major contributor to nitrogen deposition. Agricultural releases of nitrogen are primarily in the form of NH3 from fertilizer manufacturing, livestock production activities, and cultivation of various crops. Ammonia is also emitted from vehicle catalytic converters. Both NOx and ammonia are evaluated here because they contribute to nitrogen deposition in the project area.
Nitrogen deposition is a growing concern not only in Rocky Mountain National Park but also in sensitive mountain environments all along the Front Range. NOx and ammonia (NH3) can be transported long distances and eventually are deposited on land and water through precipitation in wet deposition or as gases and particles in dry deposition. This process is known as nitrogen deposition. The transport of these pollutants typically occurs from the west to the east. However, large snowfall events east of the Continental Divide, associated with easterly upslope flow, can bring pollutants from the Front Range urban corridor and eastern plains. Further, localized
22
Final EIS August 2011 Technical Memorandum: Air Quality Addendum
upslope flows from the morning heating of the east-facing slopes can also transport pollutants from the Denver-Boulder-Fort Collins urban area. The morning heating can also trigger convective rain shower leading to precipitation events in the park which contributes to wet deposition. Therefore, emissions from the Front Range are also a large contributor to nitrogen deposition in the RMNP. The Colorado Front Range area experienced a rapid population growth from 1980 to 2000. In addition, the Rocky Mountain National Park (RMNP) has over 3 million visitors per year and the community of Estes Park borders the RMNP which also attracts many visitors. Majority of these travels arrive by gasoline and diesel powered vehicles which contributes to the NOx emissions deposited in the Park. As a result of population increases and recreational use, emissions from point and mobile sources were responsible for most of the emission increases.
Visibility
Under the 1977 amendments to the Clean Air Act (CAA), Congress set national goals for visibility as “the prevention of any future, and the remedying of any existing, impairment of visibility in mandatory Class I Federal areas which impairment results from manmade air pollution” (CDPHE-APCD, 2007). The federal visibility regulations (40 CFR Part 51 Subpart P —Visibility Protection 51.300—309), which were divided into two phases, were set forth to determine existing impairment in each of the Class I areas, how to remedy such impairment, and how to establish goals to restore visibility to “natural conditions” by the year 2064. The first phase addresses Reasonably Attributable Visibility Impairment (RAVI) impacts in Class I areas by evaluating source specific visibility impacts, or plume blight, from individual sources or small groups of sources. In 1999, another section (second phase) was added to the CAA amendments to address Regional Haze which focuses on the overall decreases in visual range, clarity, color, and ability to discern texture and details in Class I areas. EPA finalized the Regional Haze Rule (RHR) requiring states to adopt a State Implementation Plan (SIP) to address visibility impairment in Class I areas. Colorado has developed a SIP and has set the initial planning period (2007- 2018) as the “foundation plan”.
The RHR requires that Class I areas establish goals to improve visibility for the most impaired (20% worst) days over the period of the implementation plan and ensure no degradation in visibility for the least impaired (20% best) days over the same period to ultimately meet the National Visibility Goal established by Congress by 2064 [40 CFR 51.308(d)]. Tracking of visibility conditions in terms of the haze index (HI) metric is expressed in the deciview (dv) unit.
As shown in Table 3, baseline conditions are the worst at the RMNP (13.83 dv) compared to the other Class I areas. In order to achieve natural conditions by 2064, a calculation of a uniform rate of progress (UPG) is used. The amount of visibility improvement needed per year over the 60-year period is multiplied by the number of years in the initial planning period (14 years). This will determine the uniform progress needed by 2018 (initial planning year) to be on the path to achieving natural visibility conditions by 2064. The 2064 visibility goal for the RMNP is 7.24 dv.

23
Final EIS August 2011 Technical Memorandum: Air Quality Addendum
In order to establish these goals, states are required to inventory emissions from pollutants that are reasonably anticipated to cause or contribute to visibility impairment in any Class I area [40 CFR 51.308(d)(4)(v)]. Section 4.0 summarizes regional and project emissions as a result of this project and the indirect effects to the RMNP.
Table 3 Uniform Rate of Progress for Each Colorado Class I Area
Baseline Summary of Best and Worst Days in Haze Index Metric Baseline Period (2000-2004)
Mandatory Class I Federal Area
20% Worst Days 20% Best
Days
Baseline Condition (Deciview)
2018 Uniform Progress
Goal (Deciview)
2018 Goal Delta
(Deciview)
2064 Natural
Conditions (Deciview)
2064 Delta
(Baseline 2064 NC) (Deciview)
Baseline Condition (Deciview)
Great Sand Dunes National Park and Preserve
12.78 11.35 1.43 6.66 6.12 4.50
Mesa Verde National Park
13.03 11.59 1.44 6.83 6.20 4.32
Mount Zirkel and Rawah Wilderness Area
10.52 9.56 0.96 6.14 1.08 1.61
Rocky Mountain National Park
13.83 12.29 1.54 7.24 6.59 2.29
Black Canyon of the Gunnison National Park, Weminuche and La Garita Wilderness Areas
10.33 9.38 0.95 6.24 4.09 3.11
Eagle Nest, Flat Tops, Maroon Bells—Snowmass and West Elk Wilderness Areas
9.61 8.89 0.72 6.54 3.07 0.70
Source: Colorado Visibility and Regional Haze State Implementation Plan for the Twelve Mandatory Class I Federal Areas in Colorado, 2007.
4.0 ENVIRONMENTAL CONSEQUENCES
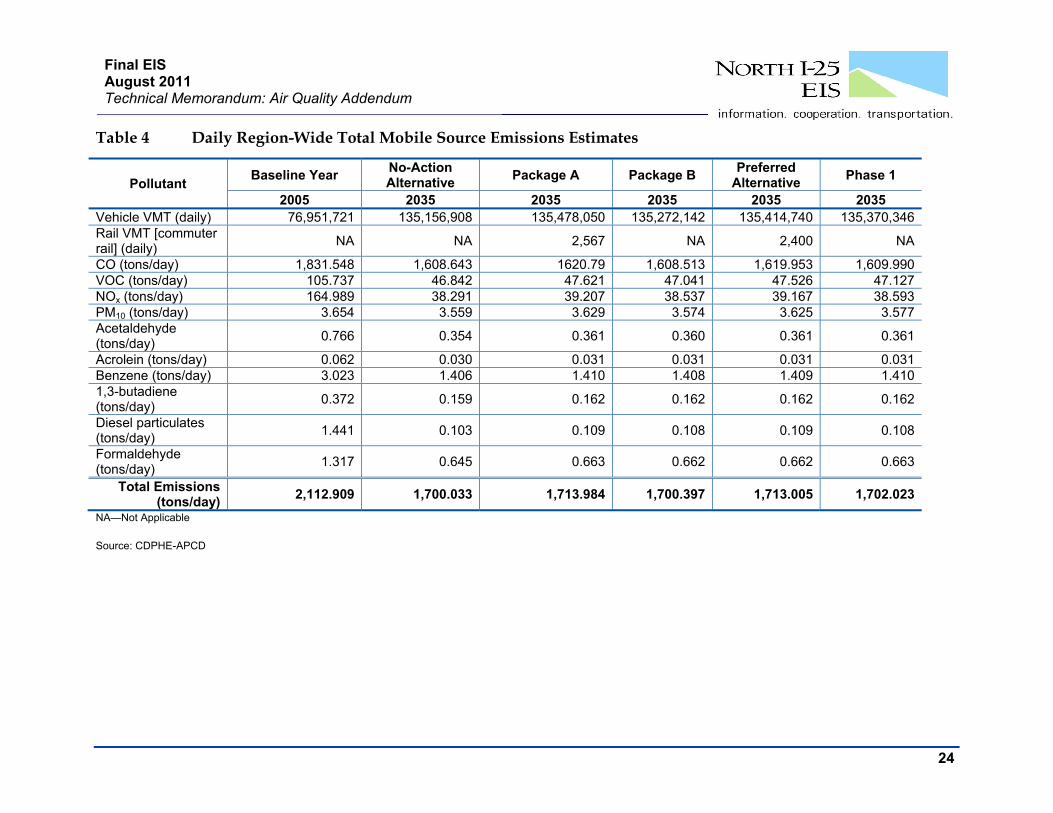
4.1 CORRIDOR ANALYSIS Results tabulated in Table 4 illustrate the trend of decreasing criteria pollutant emissions with increasing VMT in future years. The reason for this is increasing controls on the vehicle sources. Regional VMT measured over the regional study area would increase approximately 80 percent between 2005 and 2035. Regional analyses of total criteria pollutants show reductions in total emissions between 2005 and 2035 although the difference is more pronounced in some cases than others:
24
Final EIS August 2011 Technical Memorandum: Air Quality Addendum
Table 4 Daily Region-Wide Total Mobile Source Emissions Estimates
Pollutant Baseline Year
No-Action Alternative
Package A Package B Preferred
Alternative Phase 1
2005 2035 2035 2035 2035 2035 Vehicle VMT (daily) 76,951,721 135,156,908 135,478,050 135,272,142 135,414,740 135,370,346Rail VMT [commuter rail] (daily)
NA NA 2,567 NA 2,400 NA
CO (tons/day) 1,831.548 1,608.643 1620.79 1,608.513 1,619.953 1,609.990VOC (tons/day) 105.737 46.842 47.621 47.041 47.526 47.127NOx (tons/day) 164.989 38.291 39.207 38.537 39.167 38.593PM10 (tons/day) 3.654 3.559 3.629 3.574 3.625 3.577Acetaldehyde (tons/day)
0.766 0.354 0.361 0.360 0.361 0.361
Acrolein (tons/day) 0.062 0.030 0.031 0.031 0.031 0.031Benzene (tons/day) 3.023 1.406 1.410 1.408 1.409 1.4101,3-butadiene (tons/day)
0.372 0.159 0.162 0.162 0.162 0.162
Diesel particulates (tons/day)
1.441 0.103 0.109 0.108 0.109 0.108
Formaldehyde (tons/day)
1.317 0.645 0.663 0.662 0.662 0.663
Total Emissions (tons/day)
2,112.909 1,700.033 1,713.984 1,700.397 1,713.005 1,702.023
NA—Not Applicable
Source: CDPHE-APCD

25
Final EIS August 2011 Technical Memorandum: Air Quality Addendum
CO decreases 12 percent, VOC decreases 55 percent, NOx decreases 76 percent, and PM10 decreases 1 percent.
Package A, Package B, the Preferred Alternative, and Phase 1 2035 criteria pollutant emissions would average about 1 percent higher than the 2035 No-Action emissions. Package B and Phase 1 would generate slightly fewer criteria pollutant emissions than Package A or the Preferred Alternative due to proposed transit improvements for Package A and the Preferred Alternative.
The differences in annual regional total emissions between the 2035 No-Action and the Build Alternatives (Package A, Package B, the Preferred Alternative and Phase 1) is less than 1 percent or approximately 13.95, 0.364, 12.97, and 5.118 tpd, respectively. The total pollutant emissions increases are attributed primarily to the 1 percent higher year 2035 VMT for Package A, Package B, the Preferred Alternative, and Phase 1.
Total 2035 emissions for Package A and the Preferred Alternative would be 13.59 and 10.89 tons per day (tpd), respectively, more than total emissions for Package B and Phase 1. Approximately 8.40 and 7.86 tpd would be emissions from the commuter rail components for Package A and the Preferred Alternative. Because ozone emissions are a regional pollutant created from photochemical reactions between NOx and VOCs in the atmosphere, localized sources of these ozone precursors are not easily related to direct ozone effects within the regional study area. Ozone is also created from emissions from non-mobile sources such as lawn mowers, small engine equipment, and industrial sources. Ozone concentration is highly susceptible to weather conditions, such as local upslope winds or regional upper level wind patterns. Because ozone is a regional-scale pollutant, the conformity rule does not require analysis of ozone at the project level. However, the conforming TIP or RTP do not include regional ozone analyses that include Package A, Package B, or the Preferred Alternative. Only Phase 1 improvements are included in the RTP.
MSAT emissions would be reduced between 51 percent and 57 percent for acetaldehyde, acrolein, benzene, 1,3-butadiene, and formaldehyde between 2005 and the 2035 No-Action Alternative. Diesel particulate matter (DPM) were reduced by over 93 percent during that same timeframe. PM10 emissions reductions shown in Table 4 are much less than reductions in DPM emissions because PM10 is made up of more components than DPM, including gasoline and diesel engine exhaust and evaporative emissions, brake wear, tire wear and road dust.
Forecasted emissions for MSATs would in all cases be increased between No-Action levels in 2035 and those predicted for the Preferred Alternative and Phase 1. On a percentage basis, the increases are less than one percent for benzene and acrolein. Acetaldehyde and 1,3 butadiene would both increased between one percent and two percent. For formaldehyde, percent increases would be highest with diesel particulates: 5.8 percent with the Preferred Alternative and 4.8 percent for Phase 1. Phase 1 emissions would be slightly higher than the
26
Final EIS August 2011 Technical Memorandum: Air Quality Addendum
Preferred Alternative for two pollutants: benzene and formaldehyde. The reason for this is that the vehicle mix for the Preferred Alternative would include more heavy trucks, because it would have more travel on freeways.
4.2 ATTAINMENT/MAINTENANCE AREA ANALYSIS The following tables show emissions levels for the criteria and MSAT pollutants by SIP (attainment/maintenance) area. In general, emissions from each SIP area mimic the regional trend of decreasing pollutant emissions from current 2005 levels to the year 2035. Emissions budgets calculated by the various metropolitan planning organizations and published by CDPHE-APCD in the SIP maintenance plan revisions are projected to planning years in the future. Not all planning organizations have updated their plans to a consistent planning year, therefore; emissions budgets listed in the following SIP area data tables may be for different years.
4.2.1 Fort Collins Attainment/Maintenance Area for CO Package A, Package B, the Preferred Alternative, and Phase 1 2035 components within the Fort Collins SIP area would generate between 18 and 20 percent fewer total emissions than are estimated for the baseline condition in 2005. The 2035 total CO emissions for Package A, Package B, the Preferred Alternative, and Phase 1 would range between 60.679 to 62.649 tons per day, less than the Fort Collins CO attainment/maintenance plan emissions budget attributed to mobile sources for 2015 (see Table 5). The Preferred Alternative 2035 total CO emissions would be about 0.436 to 1.971 tons more than the other Build alternatives in 2035. This increase would be attributed in part to the vehicle VMT since increased VMT is directly linked to increased emissions anticipated to increase above existing freight emissions. Package B would have the lowest CO emissions, resulting from lower emission rates associated with less congestion (lower emissions rates) and with more freeway traffic (VMT) distribution.
4.2.2 Greeley Attainment/Maintenance Area For CO Package A, Package B, the Preferred Alternative, and Phase 1 2035 components within the Greeley SIP would generate between 13 and 14 percent fewer total emissions than are estimated for the baseline condition in 2005. The 2035 total CO emissions for Package A, Package B, the Preferred Alternative, and Phase 1 would be 31.43, 31.60, 31.39, and 31.60 tons, respectively, less than the estimated Greeley CO attainment/maintenance plan emissions budget attributed to mobile sources for 2015 (see Table 6).
A comparison shows that Package B and Phase 1 within the Greeley SIP area would contribute more emissions of CO than Package A and the Preferred Alternative. The higher emissions would be due to corresponding higher VMT.

27
Final EIS August 2011 Technical Memorandum: Air Quality Addendum
Table 5. Daily Fort Collins Attainment/Maintenance Area Emissions Estimates
Pollutant Area Mobile Emissions
Budget
Baseline Year No-Action Alternative
Package A Package B Preferred Alternative
Phase 1
2015 2005 2035 2035 2035 2035 2035
Vehicle VMT(daily) NA 2,856,687 4,181,220 4,243,464 4,232,612 4,275,237 4,260,610
Rail VMT (daily) NA NA NA 415 NA 400 NA
CO (tons/day) 94 70.616 59.857 62.213 60.679 62.649 61.177
VOC (tons/day) NA 5.077 2.030 2.138 2.052 2.145 2.062
NOx (tons/day) NA 5.509 1.736 1.854 1.761 1.8661 1.777
PM10 (tons/day) NA 0.126 0.108 0.1179 0.109 0.1186 0.110
Acetaldehyde (tons/day) NA 0.032 0.015 0.015 0.015 0.015 0.015
Acrolein (tons/day) NA 0.003 0.001 0.001 0.001 0.001 0.001
Benzene (tons/day) NA 0.134 0.067 0.068 0.068 0.068 0.068
1,3-butadiene (tons/day) NA 0.016 0.007 0.007 0.007 0.007 0.007
Diesel particulates (tons/day) NA 0.044 0.002 0.002 0.002 0.002 0.002
Formaldehyde (tons/day) NA 0.053 0.024 0.025 0.025 0.025 0.025
Total Emissions (tons/day)
NA 81.609 63.847 66.441 64.719 66.898 65.245
NA—Not Applicable
Source: CDPHE-APCD
28
Final EIS August 2011 Technical Memorandum: Air Quality Addendum
Table 6. Daily Greeley Attainment/Maintenance Area Emissions Estimates
Pollutant
Area Mobile Emissions
Budget Year
No-Action Alternative
Package A Package B Preferred
Alternative Phase 1
2015 2005 2035 2035 2035 2035 2035
Vehicle VMT(daily) NA 1,360,778 2,229,606 2,205,071 2,216,494 2,202,006 2,216,501
Rail VMT (daily) NA NA NA 0 NA 0 NA
CO (tons/day) 60 33.684 31.728 31.430 31.598 31.394 31.598
VOC (tons/day) NA 2.385 1.072 1.059 1.064 1.057 1.064
NOx (tons/day) NA 2.539 0.912 0.901 0.906 0.900 0.906
PM10 (tons/day) NA 0.061 0.058 0.057 0.057 0.057 0.057
Acetaldehyde (tons/day) NA 0.015 0.008 0.008 0.008 0.008 0.008
Acrolein (tons/day) NA 0.001 0.001 0.001 0.001 0.001 0.001
Benzene (tons/day) NA 0.063 0.035 0.035 0.035 0.035 0.035
1,3-butadiene (tons/day) NA 0.007 0.004 0.004 0.004 0.004 0.004
Diesel particulates (tons/day) NA 0.022 0.001 0.001 0.001 0.001 0.001
Formaldehyde (tons/day) NA 0.025 0.013 0.013 0.013 0.013 0.013
Total Emissions (tons/day)
NA 38.802 33.832 33.508 33.686 33.469 33.687
NA—Not Applicable
Source: CDPHE-APCD
29
Final EIS August 2011 Technical Memorandum: Air Quality Addendum
4.2.3 Longmont Attainment/Maintenance Area For CO Package A, Package B, the Preferred Alternative, and Phase 1 2035 components within the Longmont SIP would generate between 25 and 28 percent fewer total emissions than are estimated for the baseline condition in 2005. The 2035 total CO emissions for Package A, Package B, the Preferred Alternative, and Phase 1 would be 23.03, 22.43, 23.170, and 22.39 tons, respectively, less than the Longmont CO attainment/maintenance plan emissions budget attributed to mobile sources for 2020 (see Table 7).
A comparison shows that Package A and the Preferred Alternative within the Longmont SIP area would contribute more emissions of CO than Package B and Phase 1. The higher emissions would be due to corresponding higher vehicle and rail VMT associated with Package A and the Preferred Alternative.
4.2.4 Denver Attainment/Maintenance Areas For Ozone and PM10 Package A, Package B, the Preferred Alternative, and Phase 1 2035 components within the Denver ozone and PM10 SIPs would generate approximately 24 percent fewer total emissions than are estimated for the baseline condition in 2005 (see Table 8). The 2035 average VOC and NOx emissions differ by approximately 0.04 tons between the Build Alternatives. The emissions would be less than the Denver attainment/maintenance plan emissions budget attributed to mobile sources for 2020.
The 2035 total PM10 emissions for Package A, Package B, the Preferred Alternative, and Phase 1 would be 2.915, 2.913, 2.912, and 2.912 tons, respectively. The emissions would be less than the Denver PM10 attainment/maintenance plan emissions budget attributed to mobile sources for 2020.
A comparison shows that Package A and Package B within the Denver ozone and PM10 SIP area would contribute more overall criteria pollutant emissions than the Preferred Alternative and Phase 1. The higher emissions would be due to corresponding higher VMT associated with Package A and Package B.
4.2.5 Denver Attainment/Maintenance Areas For CO Package A, Package B, the Preferred Alternative, and Phase 1 2035 components within the Denver CO SIP would generate 24 percent fewer total emissions than are estimated for the baseline condition in 2005. The 2035 total CO emissions for Package A, Package B, Preferred Alternative, and Phase 1 would range between 1204.84 to 1206.17, less than the Denver CO attainment/maintenance plan emissions budget attributed to mobile sources for 2021 (see Table 9).
A comparison shows that Package A and the Preferred Alternative within the Denver CO SIP area would contribute more CO emissions than Package B and Phase 1. This increase would be attributed in part to the commuter rail component associated with Package A and the Preferred Alternative.

30
Final EIS August 2011 Technical Memorandum: Air Quality Addendum
Table 7. Daily Longmont Attainment/Maintenance Area Emissions Estimates
Pollutant
Area Mobile Emissions
Budget Baseline Year
No-Action Alternative
Package A Package B Preferred
Alternative Phase 1
2020 2005 2035 2035 2035 2035 2035
Vehicle VMT(daily)
NA 1,228,313 1,986,785 1,932,519 1,969,994 1,927,143 1,966,115
Rail VMT (daily) NA NA NA 350 NA 420 NA
CO (tons/day) 43.00 28.725 22.801 23.03 22.430 23.170 22.386
VOC (tons/day) NA 1.635 0.615 0.6704 0.612 0.6823 0.611
NOx (tons/day) NA 2.188 0.480 0.5423 0.483 0.555 0.482
PM10 (tons/day) NA 0.051 0.051 0.0567 0.051 0.058 0.051
Acetaldehyde (tons/day) NA 0.012 0.004 0.004 0.004 0.004 0.004
Acrolein (tons/day) NA 0.001 0.000 0.000 0.000 0.000 0.000
Benzene (tons/day) NA 0.048 0.019 0.018 0.018 0.018 0.018
1,3-butadiene (tons/day) NA 0.006 0.002 0.002 0.002 0.002 0.002
Diesel particulates (tons/day)
NA 0.016 0.001 0.001 0.001 0.001 0.001
Formaldehyde (tons/day) NA 0.020 0.007 0.008 0.008 0.008 0.008
Total Emissions (tons/day)
NA 32.702 23.981 24.333 23.611 24.499 23.564
NA—Not Applicable
Source: CDPHE-APCD
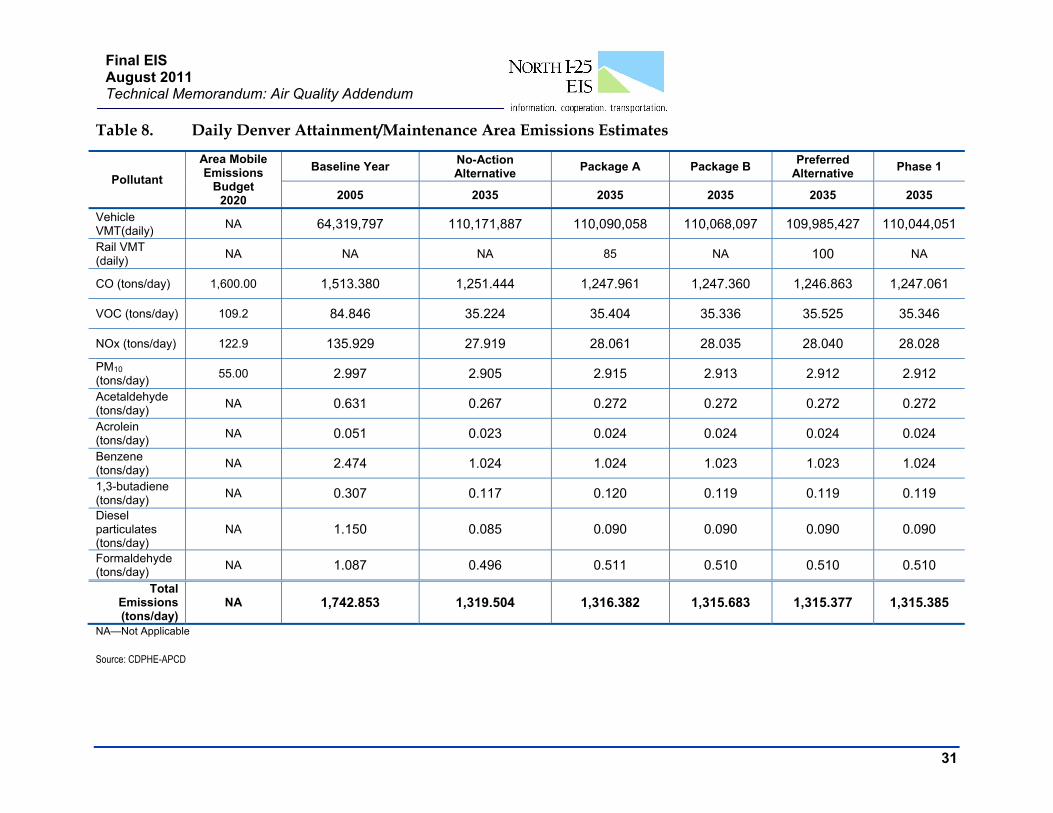
31
Final EIS August 2011 Technical Memorandum: Air Quality Addendum
Table 8. Daily Denver Attainment/Maintenance Area Emissions Estimates
Pollutant
Area Mobile Emissions
Budget 2020
Baseline Year No-Action Alternative
Package A Package B Preferred
Alternative Phase 1
2005 2035 2035 2035 2035 2035
Vehicle VMT(daily)
NA 64,319,797 110,171,887 110,090,058 110,068,097 109,985,427 110,044,051
Rail VMT (daily)
NA NA NA 85 NA 100 NA
CO (tons/day) 1,600.00 1,513.380 1,251.444 1,247.961 1,247.360 1,246.863 1,247.061
VOC (tons/day) 109.2 84.846 35.224 35.404 35.336 35.525 35.346
NOx (tons/day) 122.9 135.929 27.919 28.061 28.035 28.040 28.028
PM10 (tons/day)
55.00 2.997 2.905 2.915 2.913 2.912 2.912
Acetaldehyde (tons/day)
NA 0.631 0.267 0.272 0.272 0.272 0.272
Acrolein (tons/day)
NA 0.051 0.023 0.024 0.024 0.024 0.024
Benzene (tons/day)
NA 2.474 1.024 1.024 1.023 1.023 1.024
1,3-butadiene (tons/day)
NA 0.307 0.117 0.120 0.119 0.119 0.119
Diesel particulates (tons/day)
NA 1.150 0.085 0.090 0.090 0.090 0.090
Formaldehyde (tons/day)
NA 1.087 0.496 0.511 0.510 0.510 0.510
Total Emissions (tons/day)
NA 1,742.853 1,319.504 1,316.382 1,315.683 1,315.377 1,315.385
NA—Not Applicable
Source: CDPHE-APCD

32
Final EIS August 2011 Technical Memorandum: Air Quality Addendum
Table 9. Daily Denver Attainment/Maintenance Area Emissions Estimates (CO area)
Pollutant
Area Mobile Emissions
Budget 2020
Baseline Year
No-Action Alternative
Package A Package B Preferred
Alternative Phase 1
2005 2015 2035 2035 2035 2035
Vehicle VMT(daily) NA 62,004,903 106,396,435 106,376,899 106,315,567 106,279,595 106,290,868
Rail VMT (daily) NA NA NA 85 NA 100 NA
CO (tons/day) 1,600.00 1,459.400 1,208.005 1,206.171 1,205.140 1205.15 1,204.836
VOC (tons/day) 109.2 81.837 34.081 34.270 34.191 34.195 34.200
NOx (tons/day) 122.9 131.454 27.018 27.148 27.113 27.128 27.105
PM10 (tons/day) 55.00 2.892 2.808 2.817 2.814 2.815 2.813
Acetaldehyde (tons/day) NA 0.609 0.259 0.263 0.263 0.263 0.263
Acrolein (tons/day) NA 0.049 0.023 0.023 0.023 0.023 0.023
Benzene (tons/day) NA 2.387 0.990 0.991 0.990 0.989 0.990
1,3-butadiene (tons/day) NA 0.296 0.113 0.116 0.115 0.115 0.115
Diesel particulates (tons/day)
NA 1.111 0.084 0.087 0.087 0.087 0.087
Formaldehyde (tons/day) NA 1.049 0.482 0.495 0.494 0.494 0.494
Total Emissions (tons/day)
NA 1,681.082 1,273.862 1,272.381 1,271.230 1,271.259 1,270.926
NA—Not Applicable
Source: CDPHE-APCD

33
Final EIS August 2011 Technical Memorandum: Air Quality Addendum
4.2.6 Project-Level CO Analysis The highest modeled 8–hour average concentration was 8.4 ppm associated with the poorly operating intersection of Harmony Road and I-25 in Fort Collins for the No-Action Alternative. This value is less than the federal 8–hour CO NAAQS of 9 ppm. See Table 10. Therefore, since the project-level CO analyses resulted in no exceedances of the NAAQS at any of the identified interchanges and intersections representing the highest volume and worst operations within the regional study area, project-level conformity has been met for CO.
Table 10. Results of Hot Spot Analyses for Carbon Monoxide
Location Alternative
2035 Traffic Volume
(vpd)
NAAQS 1-hour
Standard CO2
Maximum 1-Hour CO
Con- centration2
NAAQS 8-hour
Standard CO2
Maximum 8-Hour CO
Con- centration2
Harmony Road and I-251
No-Action 64,850 35 ppm 15.1 9 ppm 8.4
Harmony Road and I-251
Package A 67,050 35 ppm 11.8 9 ppm 6.6
Harmony Road and I-251
Package B 67,550 35 ppm 10.8 9 ppm 6.8
Harmony Road and I-251
Preferred Alternative
64,950 35 ppm 12.8 9 ppm 7.2
Evans Bus Station, 31st and US 85**
Package A 48,900 35 ppm 7.1 9 ppm 4.3
Evans Bus Station, 31st and US 85
Preferred Alternative and Phase 1
54,050 35 ppm 8.8 9 ppm 5.2
Sugar Mill Rail Station Site E1 **
Package A 40,750 35 ppm 13.3 9 ppm 7.2
Sugar Mill Rail Station Site E1
Preferred Alternative
63,600 35 ppm 12.8 9 ppm 6.9
SH 7 and I-251
Package A 67,400 35 ppm 10.3 9 ppm 6.2
SH 7 and I-251
Package B 71,300 35 ppm 11.5 9 ppm 6.9
SH 7 and I-251
Preferred Alternative
71,100 35 ppm 9.0 9 ppm 5.5
SH 7 and I-251
Phase 1 67,350 35 ppm 8.8 9 ppm 5.4

34
Final EIS August 2011 Technical Memorandum: Air Quality Addendum
Table 10. Results of Hot Spot Analyses for Carbon Monoxide
Location Alternative
2035 Traffic Volume
(vpd)
NAAQS 1-hour
Standard CO2
Maximum 1-Hour CO
Con- centration2
NAAQS 8-hour
Standard CO2
Maximum 8-Hour CO
Con- centration2
Thornton Parkway and I-25
Package A 41,850 35 ppm 13.8 9 ppm 7.7
Thornton Parkway and I-25
Package B 42,800 35 ppm 14.1 9 ppm 7.9
Thornton Parkway and I-25
Preferred Alternative and Phase 1
44,650 35 ppm 12.8 9 ppm 7.1
1 Includes traffic operations associated with egress/ingress at transit stations. **re-modeled with revised emission and idling factors. Parts per million concentration
4.2.7 Project-Level PM10 Analysis PM10 CONFORMITY ANALYSIS
4.2.7.1 DESCRIPTION OF PROPOSED PROJECT A description of the North I-25 project is provided in Chapter 1 Purpose and Need and Chapter 2 Alternatives of the FEIS.
The conformity regulations require a PM hotspot analysis for “projects of air quality concern,” which are defined in 40 CFR 93.123(b)(1). This project is considered a project of air quality concern under 93.123(b)(1)(iii), “new bus and rail terminals and transfer points that have a significant number of diesel vehicles congregating at a single location.”
4.2.7.2 DESCRIPTION OF THE TYPE OF PM10 EMISSIONS The hot spot analysis was based on directly emitted emissions from vehicles, including tailpipe, brake wear, and tire wear. Re-entrained road dust is also addressed in this analysis as required by USEPA and FHWA guidance.
Construction related PM10 emissions were not included in this hot spot analysis because these emissions would be considered temporary since construction on any one phase would last less than 5 years (40 CFR 93.123[c][5]). Secondary PM10 precursor emissions would be associated with regional impacts and, therefore, are not required to be included in the hot spot analysis.
Interagency consultation was conducted in September 2004, July 2006, and March 2007 with CDPHE-APCD, EPA, FHWA, FTA, and CDOT/EPB. It was determined that a PM2.5 hot spot analysis would not be required since the Denver Metro area and the North Front Range are designated as attainment areas.
35
Final EIS August 2011 Technical Memorandum: Air Quality Addendum
Precursor emissions of PM2.5 include NOx and VOC which were estimated for this project elsewhere in this document.
4.2.7.3 CONTRIBUTING FACTORS PM10 is one of the air quality criteria pollutants outlined in the CAA that is generated, in part, by motor vehicles. PM10 is a pollutant of concern in the Denver attainment/maintenance area. Although this analysis addresses emissions generated by mobile sources, area and point source PM10 emissions in the Denver area include the Denver International Airport, Buckley Air Force Base, a large oil refinery complex, four power generation plants, and other industrial sources. Existing conditions of air quality in the project area are presented in section 3.5.2.
Emissions from mobile sources within the entire regional study area and the attainment/maintenance areas were estimated for existing and future conditions. The existing condition year (2005) is the year that the travel demand models were calibrated (see Travel Demand Traffic Technical Report (Jacobs, 2011) for more detail). Future emissions were based on anticipated traffic levels, traffic distributions, and speeds. Emissions levels included winter-summer seasonal influence, expected vehicle types, and traffic composition.
Travel demand forecasting completed for the FEIS generated a calculation of vehicle-miles traveled for the regional study area (see Chapter 4 Transportation of this FEIS).
Some PM10 particles are formed by eroded natural surface rock and soil material and enter the air through a variety of actions including "entrainment" into the atmosphere by wind-blown dust. This is particularly important to the Denver Metro Area because it is situated within a low-lying basin where atmospheric temperature inversions trap entrained dust and other pollutants underneath a ceiling of overriding cold air. This frequent condition creates stagnant air within the Denver Metro Area and acts to concentrate pollutants. Counteracting this condition, Denver also experiences very strong westerly winds that effectively disperse pollutants. These same winds accelerate entrainment of exposed dust and sand.
Particles from winter road sanding, brake and tire wear, pavement wear, and other vehicle degenerative processes contribute to PM10. Fugitive dust is one of the major contributors of PM10 in the regional study area. Fugitive dust is mainly dust from roads, fields and construction sites. Mobile sources of fugitive dust includes road dust generated from vehicle entrainment of excess roadside sand, as well as non-roadway vehicle dust contributed from motorized vehicles that typically operate off-road, such as farming equipment, recreational vehicles, construction equipment, and airport vehicles. The primary vehicular emissions source of PM10 comes from diesel engines which are critical to both the transit and transportation freight industries.
36
Final EIS August 2011 Technical Memorandum: Air Quality Addendum
The CDPHE–APCD enforces several regulations through the auspices of the Air Quality Control Commission (AQCC) to reduce particulate emissions from mobile sources as control strategies and contingency measures for non-attainment areas, including gas and diesel motor vehicle inspections and maintenance programs (Regulations 11 and 12) and street-sanding and sweeping standards to clean up winter sanding operations and excess roadside sand accumulations (Regulation 16).
4.2.7.4 DESCRIPTION OF ANALYSIS YEARS The analysis year examined needs to be the year that the peak emissions from the project are expected. The current adopted transportation plan (20 years) in the Denver metro area and the North Front Range area are the 2035 MVRTP (December 2007) and The North Front Range 2035 Regional Transportation Plan (2035 NFRRTP) (December 2007), respectively.
The Colorado PM10 maintenance plan presents emission inventories through 2030 which shows a trend of increasing mobile sources emissions. The maintenance plan does not cover years beyond 2030. However, based on the trend of emissions, it is assumed that emissions will continue to increase through 2035. Therefore, 2035 was selected as the year with peak PM10 emissions and the highest PM10 background concentrations for the PM10 hot spot analysis.
4.2.7.5 DESCRIPTION OF EXISTING CONDITIONS The daily VMT for the existing conditions (2005) within the regional study area is approximately 30 million miles.
A survey of PM10 levels recorded from monitoring stations within the regional study area for the years 2005 to 2008 shows that there have not been any exceedances of the annual or 24-hour PM10 NAAQS from monitoring stations within the Denver metro and northern Front Range areas. The annual average PM10 standard was revoked by the EPA in December 2006. Therefore, only the 24-hour maximum concentrations recorded at area monitoring stations in 2009 have been listed in Table 11.
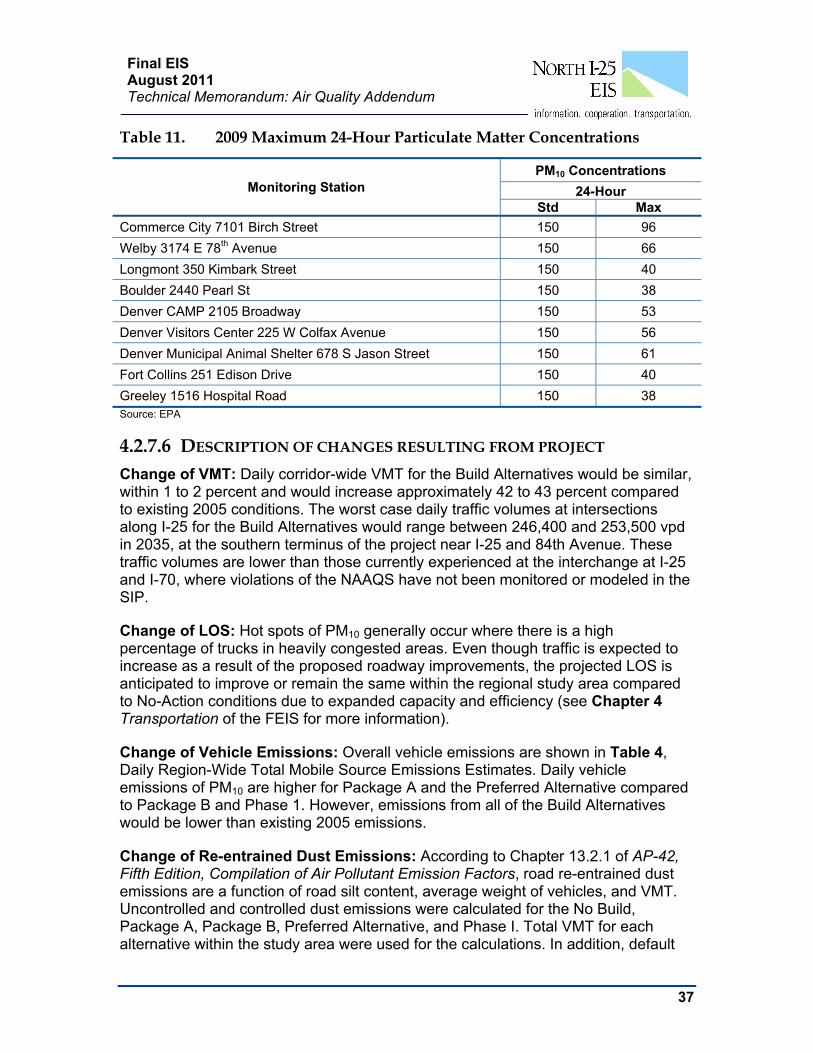
37
Final EIS August 2011 Technical Memorandum: Air Quality Addendum
Table 11. 2009 Maximum 24-Hour Particulate Matter Concentrations
Monitoring Station PM10 Concentrations
24-Hour Std Max
Commerce City 7101 Birch Street 150 96
Welby 3174 E 78th Avenue 150 66
Longmont 350 Kimbark Street 150 40
Boulder 2440 Pearl St 150 38
Denver CAMP 2105 Broadway 150 53
Denver Visitors Center 225 W Colfax Avenue 150 56
Denver Municipal Animal Shelter 678 S Jason Street 150 61
Fort Collins 251 Edison Drive 150 40
Greeley 1516 Hospital Road 150 38 Source: EPA
4.2.7.6 DESCRIPTION OF CHANGES RESULTING FROM PROJECT Change of VMT: Daily corridor-wide VMT for the Build Alternatives would be similar, within 1 to 2 percent and would increase approximately 42 to 43 percent compared to existing 2005 conditions. The worst case daily traffic volumes at intersections along I-25 for the Build Alternatives would range between 246,400 and 253,500 vpd in 2035, at the southern terminus of the project near I-25 and 84th Avenue. These traffic volumes are lower than those currently experienced at the interchange at I-25 and I-70, where violations of the NAAQS have not been monitored or modeled in the SIP.
Change of LOS: Hot spots of PM10 generally occur where there is a high percentage of trucks in heavily congested areas. Even though traffic is expected to increase as a result of the proposed roadway improvements, the projected LOS is anticipated to improve or remain the same within the regional study area compared to No-Action conditions due to expanded capacity and efficiency (see Chapter 4 Transportation of the FEIS for more information).
Change of Vehicle Emissions: Overall vehicle emissions are shown in Table 4, Daily Region-Wide Total Mobile Source Emissions Estimates. Daily vehicle emissions of PM10 are higher for Package A and the Preferred Alternative compared to Package B and Phase 1. However, emissions from all of the Build Alternatives would be lower than existing 2005 emissions.
Change of Re-entrained Dust Emissions: According to Chapter 13.2.1 of AP-42, Fifth Edition, Compilation of Air Pollutant Emission Factors, road re-entrained dust emissions are a function of road silt content, average weight of vehicles, and VMT. Uncontrolled and controlled dust emissions were calculated for the No Build, Package A, Package B, Preferred Alternative, and Phase I. Total VMT for each alternative within the study area were used for the calculations. In addition, default

38
Final EIS August 2011 Technical Memorandum: Air Quality Addendum
values for other inputs such as silt content, vehicle weight, and control efficiency were obtained from the AP-42 Fifth Edition. As shown in Table 12, fugitive dust emissions would be approximately 0.01 percent higher for all Build Alternatives compared to the No Build alternative. Although dust emissions are anticipated to be slightly higher compared to the No-Action Alternative, the increase is not expected to cause an exceedance of the NAAQS.
Table 12. Fugitive Dust Emissions
Alternative Uncontrolled Emissions (tons/day)
Uncontrolled Emissions (tons/day)
No Build 90.5 90.5 Package A 91.1 91.1 Package B 90.9 90.9 Preferred Alternative 91.2 91.2 Phase I 91.1 91.1
Note that the total emissions are representative of the study area to show a worst case scenario. However, the controlled emissions would be lower since regulation 16 only controls fugitive dust emissions within the DRCOG PM10 maintenance area.
4.2.7.7 DESCRIPTION OF ANALYSIS METHOD CHOSEN Consultation with CDPHE-APCD, EPA, and FHWA, CDOT/EPB, and FTA was conducted in September 2004, July 2006, and March 2007, and determined that the project-level hot spot analysis would be conducted at a worst-case transit station parking facility within the regional study area and a comparative analysis for the proposed bus and rail maintenance facilities located outside of the Denver PM10 attainment/maintenance area.
The following two methods were chosen for the PM10 hot spot analysis as outlined in Section 4.1 of the March 2006 USEPA/FHWA guidance: air quality studies for the proposed project location and comparison to another location with similar characteristics.
The intention of these project-level qualitative analyses is to assess whether the project would be likely to cause or contribute to any new localized PM10 violations or increase the frequency or severity of any existing violations (40 CFR 93.116).
Air Quality Studies for the Proposed Project
Only the southernmost segment of the 61-mile long regional study area, including Package A commuter rail, Package B new BRT-express lanes, Preferred Alternative express and commuter bus, Phase 1 commuter bus, and station facilities associated with each package, is located in the Denver attainment/maintenance area for PM10.
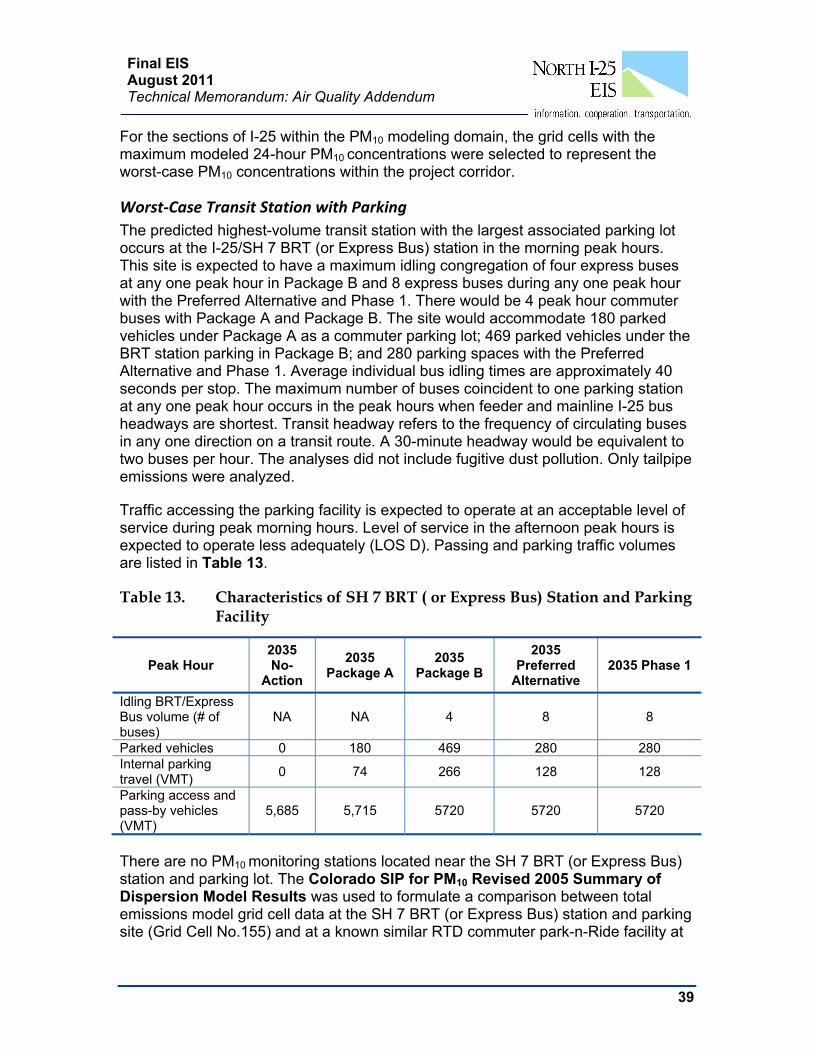
39
Final EIS August 2011 Technical Memorandum: Air Quality Addendum
For the sections of I-25 within the PM10 modeling domain, the grid cells with the maximum modeled 24-hour PM10 concentrations were selected to represent the worst-case PM10 concentrations within the project corridor.
Worst‐Case Transit Station with Parking
The predicted highest-volume transit station with the largest associated parking lot occurs at the I-25/SH 7 BRT (or Express Bus) station in the morning peak hours. This site is expected to have a maximum idling congregation of four express buses at any one peak hour in Package B and 8 express buses during any one peak hour with the Preferred Alternative and Phase 1. There would be 4 peak hour commuter buses with Package A and Package B. The site would accommodate 180 parked vehicles under Package A as a commuter parking lot; 469 parked vehicles under the BRT station parking in Package B; and 280 parking spaces with the Preferred Alternative and Phase 1. Average individual bus idling times are approximately 40 seconds per stop. The maximum number of buses coincident to one parking station at any one peak hour occurs in the peak hours when feeder and mainline I-25 bus headways are shortest. Transit headway refers to the frequency of circulating buses in any one direction on a transit route. A 30-minute headway would be equivalent to two buses per hour. The analyses did not include fugitive dust pollution. Only tailpipe emissions were analyzed.
Traffic accessing the parking facility is expected to operate at an acceptable level of service during peak morning hours. Level of service in the afternoon peak hours is expected to operate less adequately (LOS D). Passing and parking traffic volumes are listed in Table 13.
Table 13. Characteristics of SH 7 BRT ( or Express Bus) Station and Parking Facility
Peak Hour 2035 No-
Action
2035 Package A
2035 Package B
2035 Preferred
Alternative 2035 Phase 1
Idling BRT/Express Bus volume (# of buses)
NA NA 4 8 8
Parked vehicles 0 180 469 280 280 Internal parking travel (VMT)
0 74 266 128 128
Parking access and pass-by vehicles (VMT)
5,685 5,715 5720 5720 5720
There are no PM10 monitoring stations located near the SH 7 BRT (or Express Bus) station and parking lot. The Colorado SIP for PM10 Revised 2005 Summary of Dispersion Model Results was used to formulate a comparison between total emissions model grid cell data at the SH 7 BRT (or Express Bus) station and parking site (Grid Cell No.155) and at a known similar RTD commuter park-n-Ride facility at
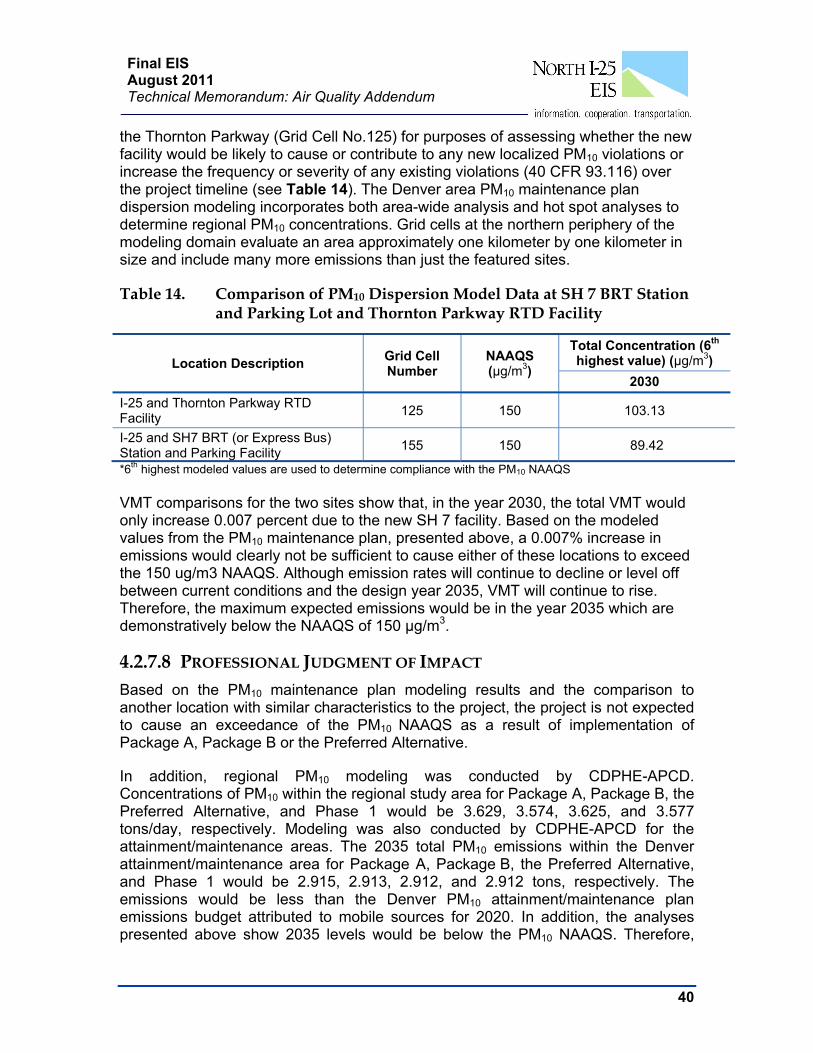
40
Final EIS August 2011 Technical Memorandum: Air Quality Addendum
the Thornton Parkway (Grid Cell No.125) for purposes of assessing whether the new facility would be likely to cause or contribute to any new localized PM10 violations or increase the frequency or severity of any existing violations (40 CFR 93.116) over the project timeline (see Table 14). The Denver area PM10 maintenance plan dispersion modeling incorporates both area-wide analysis and hot spot analyses to determine regional PM10 concentrations. Grid cells at the northern periphery of the modeling domain evaluate an area approximately one kilometer by one kilometer in size and include many more emissions than just the featured sites.
Table 14. Comparison of PM10 Dispersion Model Data at SH 7 BRT Station and Parking Lot and Thornton Parkway RTD Facility
Location Description Grid Cell Number
NAAQS (µg/m3)
Total Concentration (6th highest value) (µg/m3)
2030
I-25 and Thornton Parkway RTD Facility
125 150 103.13
I-25 and SH7 BRT (or Express Bus) Station and Parking Facility
155 150 89.42
*6th highest modeled values are used to determine compliance with the PM10 NAAQS
VMT comparisons for the two sites show that, in the year 2030, the total VMT would only increase 0.007 percent due to the new SH 7 facility. Based on the modeled values from the PM10 maintenance plan, presented above, a 0.007% increase in emissions would clearly not be sufficient to cause either of these locations to exceed the 150 ug/m3 NAAQS. Although emission rates will continue to decline or level off between current conditions and the design year 2035, VMT will continue to rise. Therefore, the maximum expected emissions would be in the year 2035 which are demonstratively below the NAAQS of 150 µg/m3.
4.2.7.8 PROFESSIONAL JUDGMENT OF IMPACT Based on the PM10 maintenance plan modeling results and the comparison to another location with similar characteristics to the project, the project is not expected to cause an exceedance of the PM10 NAAQS as a result of implementation of Package A, Package B or the Preferred Alternative.
In addition, regional PM10 modeling was conducted by CDPHE-APCD. Concentrations of PM10 within the regional study area for Package A, Package B, the Preferred Alternative, and Phase 1 would be 3.629, 3.574, 3.625, and 3.577 tons/day, respectively. Modeling was also conducted by CDPHE-APCD for the attainment/maintenance areas. The 2035 total PM10 emissions within the Denver attainment/maintenance area for Package A, Package B, the Preferred Alternative, and Phase 1 would be 2.915, 2.913, 2.912, and 2.912 tons, respectively. The emissions would be less than the Denver PM10 attainment/maintenance plan emissions budget attributed to mobile sources for 2020. In addition, the analyses presented above show 2035 levels would be below the PM10 NAAQS. Therefore,

41
Final EIS August 2011 Technical Memorandum: Air Quality Addendum
regional and attainment/maintenance area emissions would be well below the PM10 NAAQS and the emissions budget as a result of this project.
4.2.7.9 DISCUSSION OF MITIGATION MEASURES The results of the hot spot analysis concluded no exceedances to the PM10 standard are likely as a result of the Preferred Alternative or Phase 1 improvements. However, best management practices (BMPs) will be implemented to reduce air quality effects.
Details of the regional PM10 control measures are presented in Section 5.0, Mitigation Measures. In addition, the following BMPs will be implemented to reduce PM emissions.
Routing existing traffic away from populated areas (e.g., truck restricted zone)
Replace a significant number of older buses with cleaner busses (e.g., those meeting 2007 heavy-duty diesel standards, as practical, hybrid-electric vehicles, etc.)
Prepare street cleaning and site watering plans to be followed during construction
CDOT has also developed an Air Quality Action Plan which will generate programmatic emission reduction mitigation solutions statewide. Most of these programs are planned. However, two pilots testing effectiveness of particulate emissions reduction programs are in progress: diesel particulate matter reductions through an Off-road Diesel Vehicle Retrofit Demonstration Project installing test maintenance vehicles with DOC filters and particulate emissions reductions through Engines Off! Colorado a statewide outreach program to provide communities, individuals and local governments with web-based idling restriction strategies, emissions reduction education, and idling ordinance tool-kits.
4.2.7.10 CONCLUSION ON HOW PROJECT MEETS CONFORMITY
REGULATIONS FOR HOT-SPOTS (40 CFR 93.116 AND 93.123) Based on the analyses discussed above, the lack of monitor violations or exceedances, and the anticipated implementation of mitigation BMPs and existing TCMs, the North I-25 corridor project is not anticipated to cause any new or worsen the existing violations of NAAQS. The Denver metro area is currently in attainment of the PM10 NAAQS; thus, this project, by definition, will not delay attainment of the NAAQS. Therefore, the project meets the conformity requirements in 40 CFR 93.116 and 91.123 for PM10.

42
Final EIS August 2011 Technical Memorandum: Air Quality Addendum
PM10 ANALYSIS FOR ELEMENTS OF THE PROJECT NOT SUBJECT TO CONFORMITY
Comparison to Another Location with Similar Characteristics The Berthoud Rail Maintenance Yard and Greeley Maintenance facility are located outside of the PM10 maintenance area. Therefore, conformity does not apply. However, these sites were used for the following analyses to report likely PM10
effects for purposes of the FEIS document. Rail Hot Spot Analysis The North Fort Collins and Berthoud Rail Maintenance Facility were used in the comparative analysis conducted for the Draft EIS. However, the North Fort Collins Rail Maintenance Facility is not included in the Preferred Alternative and therefore will not be assessed in this analysis for the FEIS. The Berthoud Rail Maintenance Facility is assessed in the FEIS and emissions are compared to the FasTracks Fox North Commuter Rail Maintenance Facility.
The Berthoud Rail commuter rail maintenance yard was delineated to a conceptual level of design. Although yard site functions and general operational capacities have been identified, site specific track layout and rail operations and repair schedules have not yet been defined.
Emissions that would occur for the future years of the Preferred Alternative were estimated using the operational data for DMU trains. Each DMU train car would be individually powered by multiple onboard engines (three heavy duty diesel engines per train car).Emissions were calculated using the total miles traveled per DMU train, the number of cars per train, and the number of trains entering and exiting the facility per day. Emission factors used for each DMU engine were obtained from the RTD Commuter Rail Maintenance Facility (CRMF) EA that was prepared in July 2009. Emissions factors used in the RTD CRMF EA were derived from USEPA’s MOBILE6.2 program for heavy duty diesel trucks.
This analysis was based on directly emitted PM10 emissions from tailpipe, break wear, and tire wear. Re-entrained road dusts were not included in the analysis, assuming that the operation of DMU and vehicles within the facility would not cause significant fugitive dust emissions.
Table 15 summarizes the maintenance yard operations for the Berthoud Rail Yard. The emissions generated at this site are well below the PM10 NAAQS for the maximum predicted 24-hour and annual emissions levels. Therefore, it is unlikely that emissions from this facility would cause or contribute to any new localized PM10 violations or increase the frequency or severity of any existing violations.
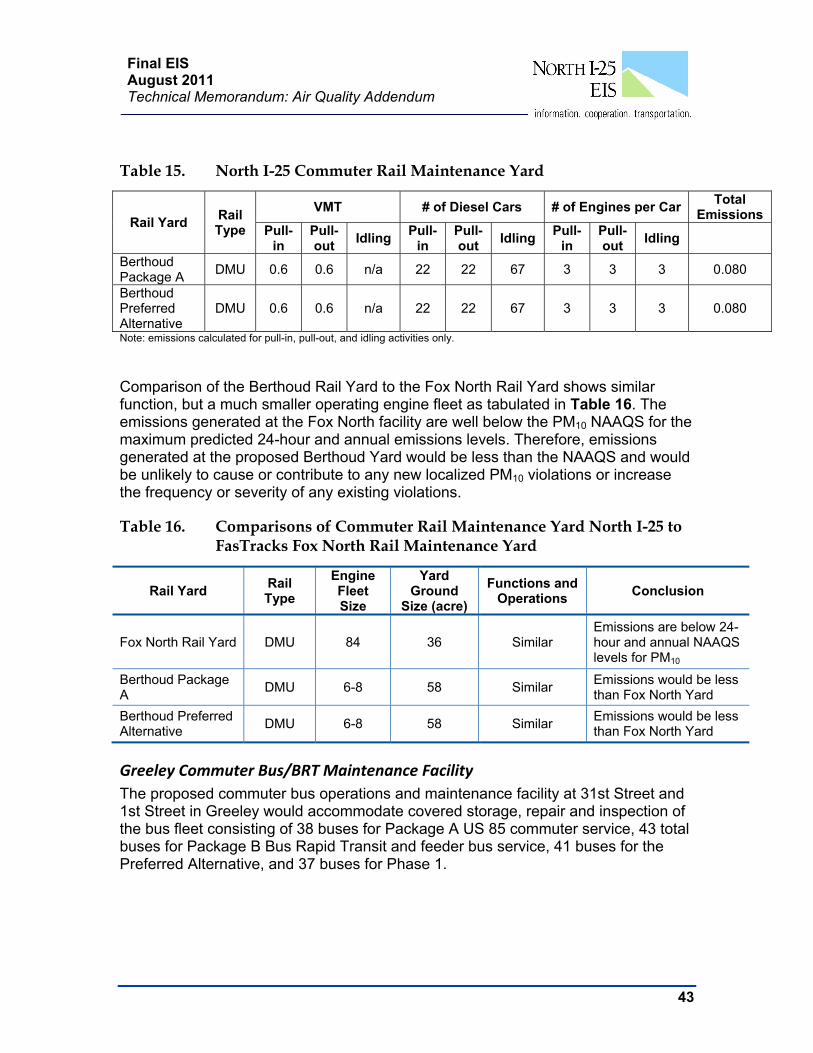
43
Final EIS August 2011 Technical Memorandum: Air Quality Addendum
Table 15. North I-25 Commuter Rail Maintenance Yard
Rail Yard Rail Type
VMT # of Diesel Cars # of Engines per CarTotal
Emissions Pull-
in Pull-out
Idling Pull-
in Pull-out
Idling Pull-
in Pull-out
Idling
Berthoud Package A
DMU 0.6 0.6 n/a 22 22 67 3 3 3 0.080
Berthoud Preferred Alternative
DMU 0.6 0.6 n/a 22 22 67 3 3 3 0.080
Note: emissions calculated for pull-in, pull-out, and idling activities only.
Comparison of the Berthoud Rail Yard to the Fox North Rail Yard shows similar function, but a much smaller operating engine fleet as tabulated in Table 16. The emissions generated at the Fox North facility are well below the PM10 NAAQS for the maximum predicted 24-hour and annual emissions levels. Therefore, emissions generated at the proposed Berthoud Yard would be less than the NAAQS and would be unlikely to cause or contribute to any new localized PM10 violations or increase the frequency or severity of any existing violations.
Table 16. Comparisons of Commuter Rail Maintenance Yard North I-25 to FasTracks Fox North Rail Maintenance Yard
Rail Yard Rail Type
Engine Fleet Size
Yard Ground
Size (acre)
Functions and Operations
Conclusion
Fox North Rail Yard DMU 84 36 Similar Emissions are below 24-hour and annual NAAQS levels for PM10
Berthoud Package A
DMU 6-8 58 Similar Emissions would be less than Fox North Yard
Berthoud Preferred Alternative
DMU 6-8 58 Similar Emissions would be less than Fox North Yard
Greeley Commuter Bus/BRT Maintenance Facility
The proposed commuter bus operations and maintenance facility at 31st Street and 1st Street in Greeley would accommodate covered storage, repair and inspection of the bus fleet consisting of 38 buses for Package A US 85 commuter service, 43 total buses for Package B Bus Rapid Transit and feeder bus service, 41 buses for the Preferred Alternative, and 37 buses for Phase 1.
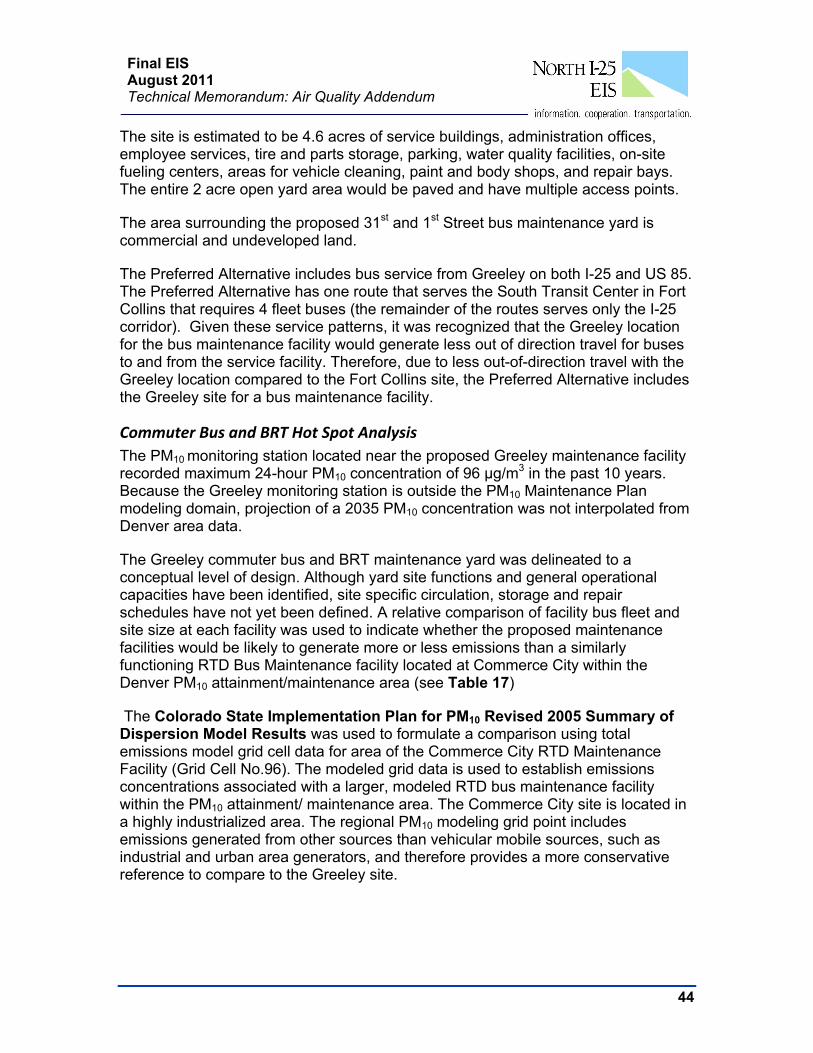
44
Final EIS August 2011 Technical Memorandum: Air Quality Addendum
The site is estimated to be 4.6 acres of service buildings, administration offices, employee services, tire and parts storage, parking, water quality facilities, on-site fueling centers, areas for vehicle cleaning, paint and body shops, and repair bays. The entire 2 acre open yard area would be paved and have multiple access points.
The area surrounding the proposed 31st and 1st Street bus maintenance yard is commercial and undeveloped land.
The Preferred Alternative includes bus service from Greeley on both I-25 and US 85. The Preferred Alternative has one route that serves the South Transit Center in Fort Collins that requires 4 fleet buses (the remainder of the routes serves only the I-25 corridor). Given these service patterns, it was recognized that the Greeley location for the bus maintenance facility would generate less out of direction travel for buses to and from the service facility. Therefore, due to less out-of-direction travel with the Greeley location compared to the Fort Collins site, the Preferred Alternative includes the Greeley site for a bus maintenance facility.
Commuter Bus and BRT Hot Spot Analysis
The PM10 monitoring station located near the proposed Greeley maintenance facility recorded maximum 24-hour PM10 concentration of 96 µg/m3 in the past 10 years. Because the Greeley monitoring station is outside the PM10 Maintenance Plan modeling domain, projection of a 2035 PM10 concentration was not interpolated from Denver area data.
The Greeley commuter bus and BRT maintenance yard was delineated to a conceptual level of design. Although yard site functions and general operational capacities have been identified, site specific circulation, storage and repair schedules have not yet been defined. A relative comparison of facility bus fleet and site size at each facility was used to indicate whether the proposed maintenance facilities would be likely to generate more or less emissions than a similarly functioning RTD Bus Maintenance facility located at Commerce City within the Denver PM10 attainment/maintenance area (see Table 17)
The Colorado State Implementation Plan for PM10 Revised 2005 Summary of Dispersion Model Results was used to formulate a comparison using total emissions model grid cell data for area of the Commerce City RTD Maintenance Facility (Grid Cell No.96). The modeled grid data is used to establish emissions concentrations associated with a larger, modeled RTD bus maintenance facility within the PM10 attainment/ maintenance area. The Commerce City site is located in a highly industrialized area. The regional PM10 modeling grid point includes emissions generated from other sources than vehicular mobile sources, such as industrial and urban area generators, and therefore provides a more conservative reference to compare to the Greeley site.
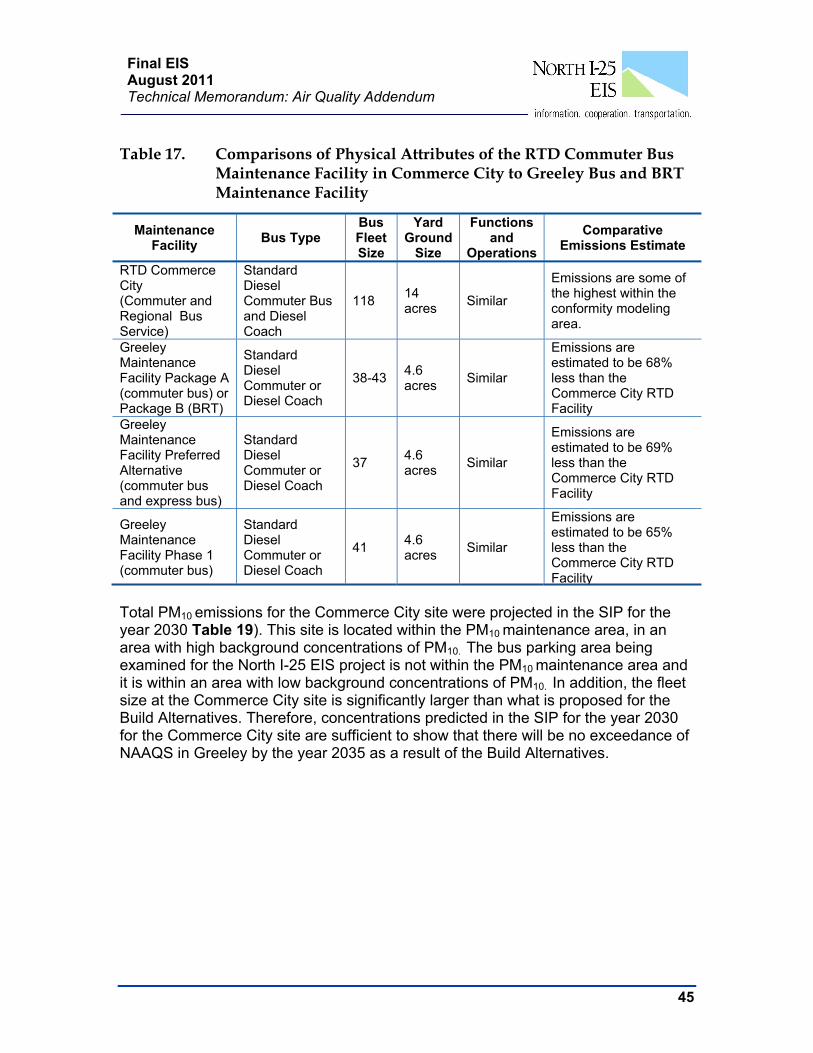
45
Final EIS August 2011 Technical Memorandum: Air Quality Addendum
Table 17. Comparisons of Physical Attributes of the RTD Commuter Bus
Maintenance Facility in Commerce City to Greeley Bus and BRT Maintenance Facility
Maintenance Facility
Bus Type Bus Fleet Size
Yard Ground
Size
Functions and
Operations
Comparative Emissions Estimate
RTD Commerce City (Commuter and Regional Bus Service)
Standard Diesel Commuter Bus and Diesel Coach
118 14 acres
Similar
Emissions are some of the highest within the conformity modeling area.
Greeley Maintenance Facility Package A (commuter bus) or Package B (BRT)
Standard Diesel Commuter or Diesel Coach
38-43 4.6 acres
Similar
Emissions are estimated to be 68% less than the Commerce City RTD Facility
Greeley Maintenance Facility Preferred Alternative (commuter bus and express bus)
Standard Diesel Commuter or Diesel Coach
37 4.6 acres
Similar
Emissions are estimated to be 69% less than the Commerce City RTD Facility
Greeley Maintenance Facility Phase 1 (commuter bus)
Standard Diesel Commuter or Diesel Coach
41 4.6 acres
Similar
Emissions are estimated to be 65% less than the Commerce City RTD Facility
Total PM10 emissions for the Commerce City site were projected in the SIP for the year 2030 Table 19). This site is located within the PM10 maintenance area, in an area with high background concentrations of PM10. The bus parking area being examined for the North I-25 EIS project is not within the PM10 maintenance area and it is within an area with low background concentrations of PM10. In addition, the fleet size at the Commerce City site is significantly larger than what is proposed for the Build Alternatives. Therefore, concentrations predicted in the SIP for the year 2030 for the Commerce City site are sufficient to show that there will be no exceedance of NAAQS in Greeley by the year 2035 as a result of the Build Alternatives.

46
Final EIS August 2011 Technical Memorandum: Air Quality Addendum
Table 18. Comparison of Commerce City RTD and Greeley Maintenance Facility
Location Description Grid Cell Number
NAAQS PM10 (µg/m3)
Total PM10 Concentration (6th highest value) (µg/m3)
2030 Commerce City RTD Maintenance Facility
96 150 149.85
Greeley Bus Maintenance Facility (Proportional emissions) Packages A and B
NA 150 57.29
Greeley Bus Maintenance Facility (Proportional emissions) Preferred Alternative
NA 150 55.50
Greeley Bus Maintenance Facility (Proportional emissions) Phase 1
NA 150 62.66
*Total PM10 concentration projected for 2030
4.2.8 Project-Level MSAT Analysis Table 19 describes the MSAT emissions associated with the No-Action, Package A, Package B, the Preferred Alternative, and Phase 1. The Build Alternatives would generate between 1.3% and 1.5%,higher emissions than the No-Action Package in the year 2035. The MSAT emissions in the year 2005 base case were much higher than any of the Build or No-Action cases in the year 2035. This is reflective of the overall national trend in MSATs as previously described.
Table 19. MSAT Emissions (tons per year) by Package
Pollutant 2005 2035
Existing No-Action Package A Package B Preferred Alternative
Phase 1
Vehicle VMT (Daily)
76,951,721 135,156,908 135,478,050 135,272,142 135,414,740 135,370,346
Acetaldehyde 279.59 129.21 131.765 131.4 131.765 131.765
Acrolein 22.63 10.95 11.315 11.315 11.315 11.315
Benzene 1103.395 513.19 514.65 513.92 514.285 514.65
1,3-Butadiene 135.78 58.035 59.13 59.13 59.13 59.13 Diesel Particulates
525.965 37.595 39.785 39.42 39.785 39.42
Formaldehyde 480.705 235.425 241.995 241.63 241.63 241.995 Total
Emissions (Tons/year)
2548.065 984.405 998.64 996.815 997.91 998.275

47
Final EIS August 2011 Technical Memorandum: Air Quality Addendum
Regardless of the alternative chosen, MSAT emissions would be lower than present levels in the future year as a result of EPA’s national control programs that are projected to reduce annual MSAT emissions by 72 percent between 1999 and 2050. Local conditions may differ from these national projections in terms of fleet mix and turnover, VMT growth rates, and local control measures. However, the magnitude of the EPA-projected reductions is so great that MSAT emissions in the regional study area would be lower in the future in all cases.
When evaluating the future options for upgrading a transportation corridor, the major mitigating factor in reducing MSAT emissions is the implementation of the EPA's new motor vehicle emission control standards. Substantial decreases in MSAT emissions would be realized from a current base year (2005) through an estimated future year. Accounting for anticipated increases in VMT and varying degrees of efficiency of vehicle operation, total MSAT emissions were predicted to decline approximately 61 percent from 2005 to 2035.
The MSATs from mobile sources, especially benzene, have dropped dramatically since 1995, and are expected to continue dropping. In addition, Tier 2 automobiles that were introduced in model year 2004 would continue to help reduce MSATs. Diesel exhaust emissions have been falling since the early 1990s with the passage of the CAA amendments. The CAA amendments provided for improvement in diesel fuel through reductions in sulfur and other components.
The Urban Air Toxics Pilot Program in Denver monitored three locations, all of which are within the regional study area: the downtown Denver CAMP, Swansea Station located at 4650 Columbine Street in metro Denver, and Welby Station located near 78th Avenue and Steele Street in the heart of the Platte River industrial district. Although not all MSATs were monitored at these sites, acetaldehyde, benzene, 1,3-butadiene, and formaldehyde were sampled during the period of May 2002 through April 2003 and were detected 90 percent or more of the time at all three monitoring locations.
Calculated regional MSAT emissions associated with Package A, Package B, the Preferred Alternative and Phase 1 would be 14.24, 12.4, 13.5, and 13.87 tons per year, respectively, more than the No-Action Alternative by the design year of 2035. Decreases from the base year would be substantial even with the associated increase in VMT in the regional travel study area because the build alternatives would reduce congestion which in turn would reduce emissions. Some sensitive receptors do exist but their exposure will decrease by the 2035 design year and beyond. These receptors include homes, schools, churches and community centers.
Summary of MSAT Analysis Findings
The localized increases in MSAT concentrations would likely be most pronounced along the roadway sections with the highest VMT. Potential impacts from MSATs are greatest near highly developed residential areas and major intersections. In general, emissions would be higher (compared to No-Action) as roadways move closer to receivers. However, with implementation of the build alternative (higher speeds and

48
Final EIS August 2011 Technical Memorandum: Air Quality Addendum
less congestion), emissions would be lower. On a regional basis, EPA’s vehicle and fuel regulations, coupled with fleet turnover, would over time cause substantial reductions that, in almost all cases, would cause region-wide MSAT levels to be substantially lower than today.
Package A
The air quality emissions from Package A commuter rail and bus service would be incrementally neutral. Diesel emissions generated by rail locomotion (DMU) and diesel-operated transit bus engines are anticipated to be less than current operating levels due to introduction of Tier III and IV low-sulfur fuels and diesel engine emission controls. Transit service would remove an estimated 6,100 vehicles daily from the roadway network in the year 2035. The commuter bus and feeder systems will provide roughly 1,600 daily riders with service between various northern Front Range sites to Denver and DIA. However, the reduction associated with vehicles removed from the roadways by Package A transit options would account for approximately 0.01 percent of the total regional study area VMT.
Package B
Air quality emissions from Package B BRT and feeder bus service would occur from diesel emissions generated by buses running in the dedicated transit lane. Diesel emission levels would be anticipated to be less than those currently experienced on buses in use in the regional study area, due to introduction of Tier III and IV low-sulfur fuels and diesel engine emission controls. Transit service would remove an estimated 10,200 vehicles daily from the roadway network in the year 2035. However, the reduction associated with vehicles removed from the roadways by Package B transit options would account for approximately 0.02 percent of the total study area VMT.
Preferred Alternative
The air quality emissions from the Preferred Alternative express bus service and commuter rail and bus service would be incrementally neutral. Diesel emissions generated by rail locomotion (DMU) and diesel-operated bus engines are anticipated to be less than current operating levels due to introduction of Tier III and IV low-sulfur fuels and diesel engine emission controls. Transit service would remove an estimated 11,500 vehicles daily from the roadway network in the year 2035. However, the reduction associated with vehicles removed from the roadways by the Preferred Alternative transit options would account for approximately 0.02 percent of the total regional study area VMT.
Phase1
The air quality emissions from Phase 1 commuter bus service would occur from diesel emissions generated by buses running in the dedicated transit lane. Diesel emission levels would be anticipated to be less than those currently experienced on buses in use in the regional study area, due to introduction of Tier III and IV low-sulfur fuels and diesel engine emission controls. Transit service would remove an

49
Final EIS August 2011 Technical Memorandum: Air Quality Addendum
estimated 6,300 vehicles daily from the roadway network in the year 2035. However, the reduction associated with vehicles removed from the roadways by Phase 1 transit options would account for 0.01 percent of the total regional study area VMT.
4.2.9 Indirect Effects Indirect effects are reasonably foreseeable and can be linked together and extended to estimate further consequences. The most apparent link to air quality is incremental population growth, land use, and development changes caused as a result of the North I-25 corridor project. These growth and development changes would affect traffic and traffic patterns which would then affect air quality. In areas of anticipated transit oriented development air quality would be anticipated to improve due to more efficient travel patterns. This improvement would be more noticeable with Package A and the Preferred Alternative than Package B and Phase 1.
Commuter rail and BRT or Express Bus stations would result in local increases of some pollutants due to increasing emissions from transit vehicles themselves and from automobile, truck and bus traffic accessing the stations. These emissions would be greater than with the No-Action Alternative at these particular locations, but in no cases would there be exceedances of the NAAQS.
Table 20 shows the stations with residential or other sensitive land uses that could be affected by these localized increases in emissions as a result of the Preferred Alternative.
Table 20. Sensitive Land Uses Affected by the Preferred Alternative
Transit Station Location Sensitive Land Uses in the Vicinity Fort Collins Downtown Transit Center Rail Station: BNSF and Maple Street
Residential, church and educational land uses within 600 feet.
CSU Commuter Rail Station: Mason Street south of University Avenue and north of West Pitkin
Church and college residential and uses within 600 feet of the commuter rail.
South Fort Collins Transit Center Commuter Rail Station [I-25 between SH 14 and SH 60]: Mason Street and West Fairway Lane
Commuter rail station would be 500 feet from residential areas.
North Loveland Commuter Rail Station: BNSF and 29th Street
Commuter rail station would be 100 feet from residential development and 600 feet from school and church facilities.
Downtown Loveland Commuter Rail Station: BNSF and approximately 6th Street
Commuter rail station would be 700 feet from residential, school, community health, and church facilities.
Berthoud Commuter Rail Station: east of BNSF and north of SH 56
Commuter rail station would be 100 feet from residential land uses.
North Longmont Commuter Rail Station: East of BNSF and north of SH 66
Commuter rail station would be 100 feet from residential land uses.
Longmont at Sugar Mill Commuter Rail Station: north of alignment and south of Rogers Road
Commuter rail station would be 1,000 feet from residential land uses.
50
Final EIS August 2011 Technical Memorandum: Air Quality Addendum
Table 20. Sensitive Land Uses Affected by the Preferred Alternative
Transit Station Location Sensitive Land Uses in the Vicinity I-25 and WCR 8 Commuter Rail Station: I-25 and WCR 8
No sensitive land uses in close proximity. Nearest sensitive land use is 2,300 feet from site.
Berthoud Commuter Rail Maintenance Facility: CR 46 and US 287
Scattered residential land use within 100 feet of the maintenance facility. No other sensitive land uses in area.
Greeley Commuter Bus Station: US 85 and D Street
Commuter bus facilities would be 300 feet from residential area and community facility.
South Greeley Commuter Bus Station: US 85 and US 34 interchange on the southwest corner of 26th Street and 9th Avenue
Commuter bus facilities would be 100 feet from closest residential land use. Most sensitive land use areas are located more than 1,100 feet from site.
Evans Commuter Bus Station: US 85 and 42nd Street
Commuter bus facilities would be 100 feet from residential areas and church facilities.
Platteville Commuter Bus Station: US 85 and SH 66
Commuter bus facilities would be 300 feet from sensitive land use areas.
Fort Lupton Commuter Bus Station: US 85 just south of 14th Street
Commuter bus facilities would be 850 feet from sensitive land use areas.
Greeley Bus Maintenance Facility: 31st Street and 1st Avenue
Commuter bus facilities would be 700 feet from residential areas and church facilities.
South Fort Collins Transit Center Express Bus Station (I-25 between SH 14 and SH 60): west of US 287 and north of Fairway Lane
Commuter Express Bus facilities would be 500 feet from residential areas.
I-25 and Harmony Road Express Bus Station: I-25 and Harmony Road
No sensitive land use areas in close proximity. Nearest residential development 2,000 feet from site.
Windsor Express Bus Station: located southeast of I-25 and SH 392
Commuter Express Bus facilities would be 500 feet from residential areas.
Crossroads Express Bus Station: Site M is located southwest of I-25 and Crossroads Boulevard
No sensitive land use areas within 1/2 mile proximity.
US 34 and SH 257 Express Bus Station: US 34 and SH 257
No residential areas in close proximity.
West Greeley Express Bus Station: US 34 (Business Loop) and 83rd Avenue
Commuter Express Bus facilities would be 100 feet from residential areas.
Berthoud Express Bus Station: I-25 and SH 56. Commuter Express Bus facilities would be 600 feet from residential areas.
Firestone Express Bus Station: I-25, south of SH 119.
Commuter Express Bus facilities would be less than 300 feet from residential areas.
Frederick/Dacono Express Bus Station: I-25, ½ mile north of SH 52
No sensitive land use areas within ½ mile proximity.
I-25 and SH 7 Express Bus Station: Site C is located on the southwest corner of the I-25 and SH 7 interchange
Both commuter Express Bus facilities would be less than 100 feet from the closest sensitive land use.
Commuter rail and Express Bus stations would result in local increases of some pollutants due to increasing emissions from transit vehicles themselves and from automobile, truck and bus traffic accessing the stations. These emissions would be

51
Final EIS August 2011 Technical Memorandum: Air Quality Addendum
greater than with the No-Action Alternative at these particular locations, but in no cases would there be exceedances of the NAAQS.
Table 21 shows the stations with residential or other sensitive land uses that could be affected by these localized increases in emissions as a result of Phase 1.
Table 21. Summary of Express Bus Indirect Effects for Phase 1
BRT Station Location Sensitive Land Uses in the Vicinity
I-25 and Harmony Road Express Bus Station: I-25 and Harmony Road
No sensitive land use areas in close proximity. Nearest residential development 2,000 feet from site.
West Greeley Express Bus Station: US 34 (Business Loop) and 83rd Avenue
Commuter Express Bus facilities would be 100 feet from residential areas.
Greeley Downtown Transfer Center Express Bus Station: Downtown Greeley between 9th Avenue and 8th Avenue on 7th Street
Commuter Express Bus facilities would be greater than 1,000 feet from residential areas.
Firestone Express Bus Station: I-25, south of SH 119. Commuter Express Bus facilities would be less than 300 feet from residential areas.
I-25 and SH 7 Express Bus Station: Two sites: Site E Is east of I-25 and ½ mile north of SH 7 Site C is located on the southwest corner of the I-25 and SH 7 interchange
Both commuter Express Bus facilities would be less than 100 feet from the closest sensitive land use.
Nitrogen Deposition
Another indirect air quality effect could be the continued conversion of agricultural land use, which is the dominant source of ammonia along the Front Range, to residential and commercial uses would act to lessen overall nitrogen deposition effects to the Rocky Mountain Park and other sensitive environments in the future.
Existing ammonia emissions within the State of Colorado are presented in Table 22 and Table 24). In addition, emissions of nitrate and sulfate are presented since, when combined with ammonia, can form nitrate and sulfate aerosols that contribute to regional haze (see Table 23 and Table 24)
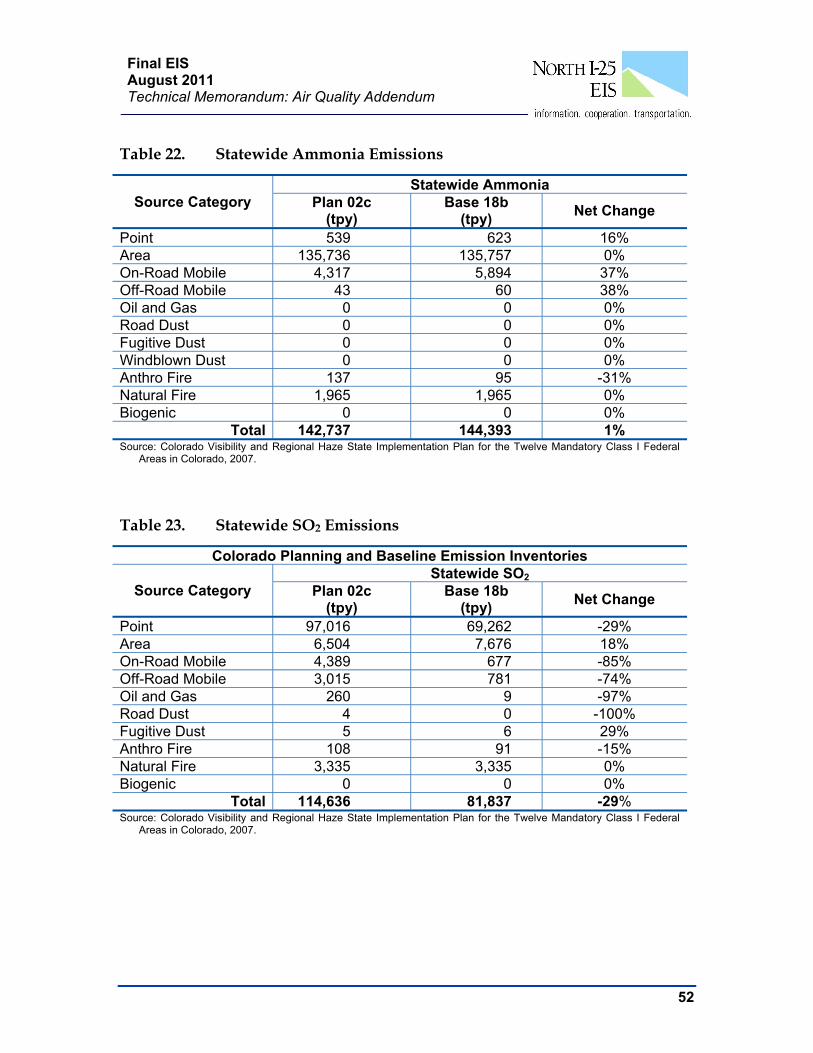
52
Final EIS August 2011 Technical Memorandum: Air Quality Addendum
Table 22. Statewide Ammonia Emissions
Source Category Statewide Ammonia
Plan 02c (tpy)
Base 18b (tpy)
Net Change
Point 539 623 16% Area 135,736 135,757 0% On-Road Mobile 4,317 5,894 37% Off-Road Mobile 43 60 38% Oil and Gas 0 0 0% Road Dust 0 0 0% Fugitive Dust 0 0 0% Windblown Dust 0 0 0% Anthro Fire 137 95 -31% Natural Fire 1,965 1,965 0% Biogenic 0 0 0%
Total 142,737 144,393 1% Source: Colorado Visibility and Regional Haze State Implementation Plan for the Twelve Mandatory Class I Federal
Areas in Colorado, 2007.
Table 23. Statewide SO2 Emissions
Colorado Planning and Baseline Emission Inventories
Source Category Statewide SO2
Plan 02c (tpy)
Base 18b (tpy)
Net Change
Point 97,016 69,262 -29% Area 6,504 7,676 18% On-Road Mobile 4,389 677 -85% Off-Road Mobile 3,015 781 -74% Oil and Gas 260 9 -97% Road Dust 4 0 -100% Fugitive Dust 5 6 29% Anthro Fire 108 91 -15% Natural Fire 3,335 3,335 0% Biogenic 0 0 0%
Total 114,636 81,837 -29% Source: Colorado Visibility and Regional Haze State Implementation Plan for the Twelve Mandatory Class I Federal
Areas in Colorado, 2007.
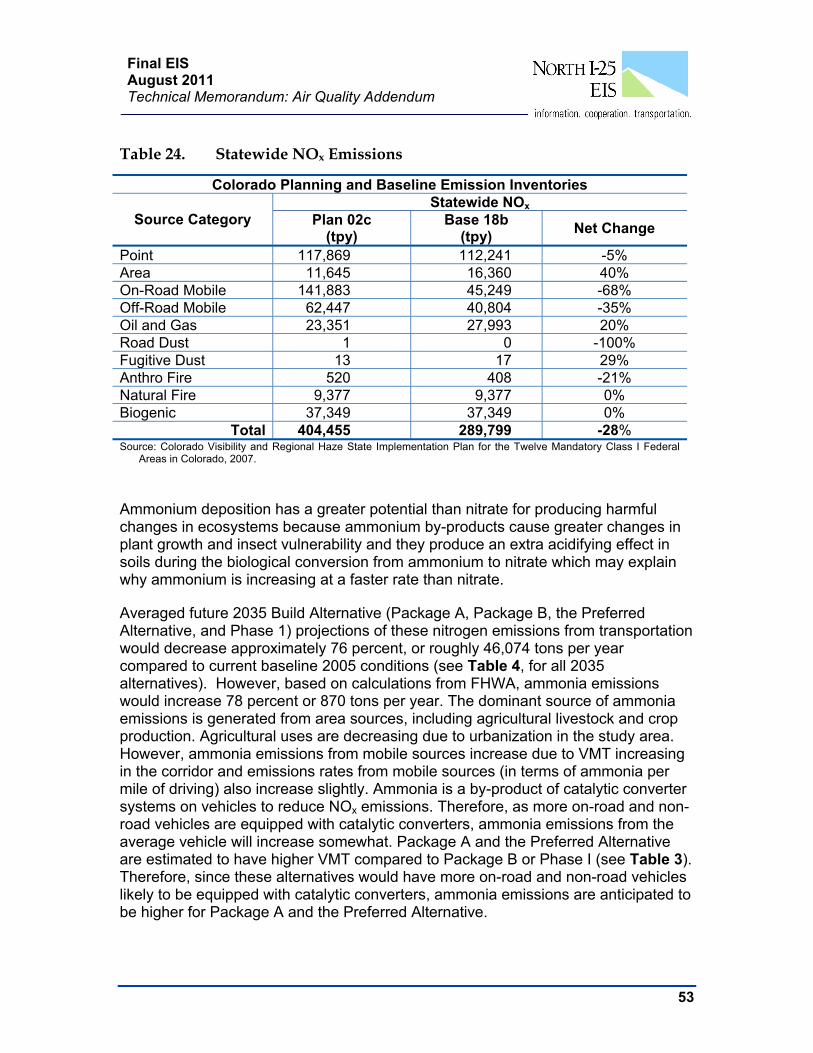
53
Final EIS August 2011 Technical Memorandum: Air Quality Addendum
Table 24. Statewide NOx Emissions
Colorado Planning and Baseline Emission Inventories
Source Category Statewide NOx
Plan 02c (tpy)
Base 18b (tpy)
Net Change
Point 117,869 112,241 -5% Area 11,645 16,360 40% On-Road Mobile 141,883 45,249 -68% Off-Road Mobile 62,447 40,804 -35% Oil and Gas 23,351 27,993 20% Road Dust 1 0 -100% Fugitive Dust 13 17 29% Anthro Fire 520 408 -21% Natural Fire 9,377 9,377 0% Biogenic 37,349 37,349 0%
Total 404,455 289,799 -28% Source: Colorado Visibility and Regional Haze State Implementation Plan for the Twelve Mandatory Class I Federal
Areas in Colorado, 2007.
Ammonium deposition has a greater potential than nitrate for producing harmful changes in ecosystems because ammonium by-products cause greater changes in plant growth and insect vulnerability and they produce an extra acidifying effect in soils during the biological conversion from ammonium to nitrate which may explain why ammonium is increasing at a faster rate than nitrate.
Averaged future 2035 Build Alternative (Package A, Package B, the Preferred Alternative, and Phase 1) projections of these nitrogen emissions from transportation would decrease approximately 76 percent, or roughly 46,074 tons per year compared to current baseline 2005 conditions (see Table 4, for all 2035 alternatives). However, based on calculations from FHWA, ammonia emissions would increase 78 percent or 870 tons per year. The dominant source of ammonia emissions is generated from area sources, including agricultural livestock and crop production. Agricultural uses are decreasing due to urbanization in the study area. However, ammonia emissions from mobile sources increase due to VMT increasing in the corridor and emissions rates from mobile sources (in terms of ammonia per mile of driving) also increase slightly. Ammonia is a by-product of catalytic converter systems on vehicles to reduce NOx emissions. Therefore, as more on-road and non-road vehicles are equipped with catalytic converters, ammonia emissions from the average vehicle will increase somewhat. Package A and the Preferred Alternative are estimated to have higher VMT compared to Package B or Phase I (see Table 3). Therefore, since these alternatives would have more on-road and non-road vehicles likely to be equipped with catalytic converters, ammonia emissions are anticipated to be higher for Package A and the Preferred Alternative.
54
Final EIS August 2011 Technical Memorandum: Air Quality Addendum
These emissions do not include any benefit from regional transit improvements planned by RTD and the Package A, Package B, the Preferred Alternative, and Phase 1 nor do these emissions assume any market penetration of hybrid vehicles or other advanced technologies between now and 2035. Non-road sources of nitrogen are estimated to decrease an average 61 percent or over 12,000 tons per year for NOx and 11 tons per year for ammonia, over this same time period (Houk, 2007).
The overall decrease in total nitrogen emissions would contribute to the RMNP goal of reducing nitrogen deposition rates by the year 2018, although the transportation emissions of ammonia would increase in the future since increases in VMT are linked directly to increased ammonia emissions.
4.2.10 Cumulative Impacts The issue of global climate change is an important national and global concern that is being addressed in several ways by the Federal government. The transportation sector is the second largest source of total greenhouse gases (GHGs) in the U.S., and the greatest source of carbon dioxide (CO2) emissions—the predominant GHG. In 2004, the transportation sector was responsible for 31 percent of all U.S. CO2 emissions. The principal anthropogenic (human-made) source of carbon emissions is the combustion of fossil fuels, which account for approximately 80 percent of anthropogenic emissions of carbon worldwide. Almost all (98 percent) of transportation-sector emissions result from the consumption of petroleum products such as gasoline, diesel fuel, and aviation fuel.
According to the EPA, the largest source of CO2 emissions globally is fossil fuel combustion, such as coal, oil and gas in power plants, automobiles, industrial facilities, and other sources.
Recognizing this concern, FHWA is working nationally with other modal administrations through the DOT Center for Climate Change and Environmental Forecasting to develop strategies to reduce transportation's contribution to greenhouse gases - particularly CO2 emissions - and to assess the risks to transportation systems and services from climate changes.
At the state level, there are also several programs underway in Colorado to address transportation GHGs. The Governor’s Climate Action Plan, adopted in November 2007, includes measures to adopt vehicle CO2 emissions standards and to reduce vehicle travel through transit, flex time, telecommuting, ridesharing, and broadband communications. CDOT issued a policy Directive on Air Quality in May 2009. This Policy Directive was developed with input from a number of agencies, including the State of Colorado's Department of Public Health and Environment (CDPHE), the U.S. Environmental Protection Agency (EPA), the Federal Highway Administration (FHWA), the Federal Transit Administration (FTA), the Denver Regional Transportation District (RTD), the Denver Regional Air Quality Council (RAQC). This Policy Directive addresses unregulated mobile source air toxics (MSAT) and
55
Final EIS August 2011 Technical Memorandum: Air Quality Addendum
greenhouse gases (GHG) produced from Colorado’s state highways, interstates, and construction activities.
As a part of CDOT’s commitment to addressing MSATs and GHGs, some of CDOT’s program-wide activities include:
1. Developing truck routes/restrictions with the goal of limiting truck traffic in proximity to facilities, including schools, with sensitive receptor populations.
2. Continue researching pavement durability opportunities with the goal of reducing the frequency of resurfacing and/or reconstruction projects.
3. Developing air quality educational materials, specific to transportation issues, for citizens, elected officials, and schools.
4. Offering outreach to communities to integrate land use and transportation decisions to reduce growth in vehicle miles traveled (VMT), such as smart growth techniques, buffer zones, transit-oriented development, walkable communities, access management plans, etc.
5. Committing to research additional concrete additives that would reduce the demand for cement.
6. Expanding Transportation Demand Management (TDM) efforts statewide to better utilize the existing transportation mobility network.
7. Continuing to diversify the CDOT fleet by retrofitting diesel vehicles, specifying the types of vehicles and equipment contractors may use, purchasing low-emission vehicles, such as hybrids, and purchasing cleaner burning fuels through bidding incentives where feasible. Incentivizing is the likely vehicle for this.
8. Exploring congestion and/or right-lane only restrictions for motor carriers.
9. Funding truck parking electrification (note: mostly via exploring external grant opportunities)
10. Researching additional ways to improve freight movement and efficiency statewide.
11. Committing to incorporating ultra-low sulfur diesel (ULSD) for non-road equipment statewide.
12. Developing a low-VOC emitting tree landscaping specification.
Because climate change is a global issue, and the emissions changes due to project alternatives are very small compared to global totals, the GHG emissions associated with the alternatives were not calculated. Because GHGs are directly related to energy use, the changes in GHG emissions would be similar to the changes in energy consumption presented in section 3.21 of the FEIS. The relationship of current and projected Colorado highway emissions to total global CO2 emissions is presented in Table 25. Colorado highway emissions are expected to increase by

56
Final EIS August 2011 Technical Memorandum: Air Quality Addendum
4.7% between now and 2035. The benefits of the fuel economy and renewable fuels programs in the 2007 Energy Bill are offset by growth in VMT; the draft 2035 statewide transportation plan predicts that Colorado VMT will double between 2000 and 2035. Table 25 also illustrates the size of the project corridor relative to total Colorado travel activity.
Table 25. Colorado Highway Emissions
Global CO2 emissions,
2005, million metric tons
(MMT)1
Colorado highway CO2 emissions, 2005, MMT2
Projected Colorado 2035 highway CO2
emissions, MMT2
Colorado highway
emissions, % of global total
(2005) 2
Project corridor VMT, % of
statewide VMT (2005)3
27,700 29.9 31.3 0.108% 2.84%
1) EIA, International Energy Outlook 2007 2) Calculated by FHWA Resource Center 3) Average of Build Alternatives; Statewide VMT was 47.9 billion in 2005, based on the Colorado Department of Transportation’s Fact Book 2006 –2007, Transportation Facts (CDOT 2007). %=percent CO2=carbon dioxide MMT=million metric tons VMT=vehicle miles traveled
There are several communities in the North I-25 corridor who have adopted policies and/or plans to address GHG emissions. Below is a summary of the policy and plans for the City of Denver, Fort Collins, and Boulder. The City and County of Denver has developed a Climate Action Plan to address GHG emissions. In order for the entire Denver community to be below 1990 levels by the year 2012 and 2020, an absolute reduction of 10 and 25 percent, respectively, will be needed. This is equivalent to an annual reduction of 1.8 million and 4.4 million metric tons of CO2e, respectively. Note when GHG emissions are summed for an inventory, they are commonly referred to as CO2e, indicating that the gases have been converted to CO2-equivalent. Transportation sector initiatives to reduce GHG emissions in Denver include: statewide pay-as-you-drive auto insurance, western states vehicle feebate system, law to require the availability of low rolling resistance replacement tires, RTD use of biodiesel, increase federal CAFÉ (corporate average fuel economy), adopt California’s clean car program, and adopt a statewide renewable fuels standard. The City of Fort Collins has developed a Climate Action Plan to help reduce GHG emissions. The intent is to reduce GHG emissions by the end of 2012 to a level not to exceed 2,466,000 tons of CO2. This will be achieved by the City implementing measures to reduce VMT, which in turn would reduce GHG emissions. It is estimated that 5 to 10 percent of automobile trips can be moved to non-motorized transport which would reduce the total VMT by 1 percent by 2012. There are several transit projects proposed within the Denver Metro area. The Mason corridor transit system will serve as the backbone for enhanced transit system in Fort Collins. The
57
Final EIS August 2011 Technical Memorandum: Air Quality Addendum
City anticipates the Bus Rapid Transit element to be completed by 2011. The proposed transit improvements for the North I-25 corridor will also reduce some automobile trips which in turn will reduce GHG emissions In 2004, WSP Environment & Energy (formerly Econergy International) worked with the City of Boulder to develop an economy-wide GHG inventory. At this time, the 1990 baseline GHG emissions were established. However, the 1990 baseline inventory was reexamined to ensure it was still an accurate representation of the city’s 1990 GHG inventory. The inventory is based on predominant greenhouse gases, carbon dioxide and methane, which is represented as metric tons of CO2e. The updated 1990 baseline GHG emissions is roughly 80,000 CO2e below the baseline established in 2004. The City’s GHG goal is to reduce economy-wide emissions to a level that is 7% below the net 1990 baseline GHG emission, by the end of 2012.
There are three types of strategies for achieving emissions reductions in the transportation sector: increase vehicle fuel efficiency, switch to a less carbon-intensive fuel, and reduce VMT. WSP Environment & Energy (formerly Econergy) has performed a preliminary analysis of several emissions mitigation programmatic approaches which are listed below:
Provide administrative support to Boulder County to enact a feebate program for vehicles.
Develop grant program to promote the sale of E30 (30% ethanol/70% gasoline blend) and biodiesel at participating gas stations.
Develop a battery leasing program
Develop an ethanol-rating system based on supply-chain carbon emissions
4.3 PROJECT PHASING AND REGIONAL CONFORMITY Regional Conformity: Because there is not enough money in the fiscally constrained and air quality conforming 2035 DRCOG and NFRMPO RTPs, only the portion of the preferred alternative that is included in the fiscally constrained and air quality conforming 2035 RTPs can be approved by FHWA in the ROD. Multiple conformity analyses were performed. To ensure that air quality conformity would not be an issue if money were to become available to completely build out the Preferred Alternative or other alternative evaluated in the document, conformity analyses were performed. As required by law, the Phase 1 of the Preferred Alternative was analyzed separately and will be included in the fiscally constrained and air quality conforming RTPs prior to FHWA approval in the ROD.
Project Conformity: The results of these analyses indicated that the project would meet the transportation conformity requirements since the Build Alternatives and the No-Action scenario, would not cause or contribute to any new localized CO or PM10
violations, increase the frequency or severity of any exiting violations, or delay timely attainment of the CO or PM10 NAAQS.

58
Final EIS August 2011 Technical Memorandum: Air Quality Addendum
5.0 MITIGATION MEASURES Regional and local agency strategies that could be used to reduce criteria pollutant and mobile source toxics emissions, especially diesel particulate matter from existing diesel engines, include but are not limited to: tailpipe retrofits, closed crankcase filtration systems, clean fuels, engine rebuild and replacement requirements, contract requirements, anti-idling ordinances and legislation, truck stop electrification programs, and aggressive fleet turnover policies. Implementation of a vehicle purchase/recycle program would also help to reduce air pollution within the regional study area by reducing highly polluting vehicles off the road. Air quality impacts are not anticipated to result from this project. Therefore, mitigation measures would not be required.
The follow mitigation measures are recommended to mitigate potential air quality emissions from commuter rail:
New rail vehicles will be required to meet Tier 3 and Tier 4 standards.
Alternative bus fleet vehicle selections will be investigated for more energy and emissions efficient vehicles, such as hybrids, electric buses, etc.
The following mitigation measures are recommended for construction activities associated with any of the Build Alternatives.
An air quality mitigation plan will be prepared describing all feasible measures to reduce air quality emissions from the project. CDOT staff must review and endorse construction mitigation plans prior to work on a project site.
Acceptable options for reducing emissions could include use of late model engines, low-emission diesel products, alternative fuels, engine retrofit technology, and after-treatment products.
The contractor will ensure that all construction equipment is properly tuned and maintained.
Idling time will be minimized to 10 minutes—to save fuel and reduce emissions.
An operational water truck should be on site at all times. Water will be applied to control dust as needed to prevent dust impacts off site.
There will be no open burning of removed vegetation. Vegetation should be chipped or delivered to waste energy facilities.
Existing power sources or clean fuel generators will be utilized rather than temporary power generators.
A traffic plan will be developed to minimize traffic flow interference from construction equipment movement and activities. The plan may include advance public notice of routing, use of public transportation, and satellite
59
Final EIS August 2011 Technical Memorandum: Air Quality Addendum
parking areas with a shuttle service. Operations affecting traffic for off-peak hours will be scheduled whenever reasonable.
Obstructions of through-traffic lanes will be minimized. A flag person will be provided to guide traffic properly minimizing congestion and to ensure safety at construction sites.
These improvement measures would be enacted along with the project phases for which the measures are relevant. The CDPHE-APCD enforces several regulations through the auspices of the Air Quality Control Commission (AQCC) to reduce particulate emissions from mobile sources as control strategies and contingency measures for non-attainment areas, including gas and diesel motor vehicle inspections and maintenance programs (Regulations 11 and 12) and street-sanding and sweeping standards to clean up winter sanding operations and excess roadside sand accumulations (Regulation 16).
Non‐Transportation‐Related Mitigation
According to EPA, it is important to reduce both NOx and NH3 emissions. However, a reduction of 1 ton of ammonia is more effective than a 1 ton reduction of NOx. While there are more NOx emissions along the Front Range and NH4 and NO3 contribute approximately 50 percent to the mass of nitrogen deposited at monitoring stations within the RMNP, a 1 ton reduction of ammonia should have a greater benefit. As discussed in Sections 3.4.5 and 4.3.9, ammonia emissions are generated mostly from agricultural livestock and crop production. Although there are no agricultural uses associate with this project, implementing best management practices (BMPs) for agricultural production could help to reduce ammonia emissions.
The following improvement measures were identified which could be applicable to other agricultural projects in the area that others could implement to help reduce ammonia emissions within the regional study area:
Choose a nitrogen fertilizer appropriate for a given cropping system that will have the lowest nitrogen volatilization on the soil type to which it is applied.
Incorporating fertilizer or manure as soon as possible into the soils will greatly reduce ammonia volatilization, minimize the loss of ammonia, and make more applied nitrogen available for plants.
Properly store and manage commercial fertilizer to minimize emissions of ammonia from leaks, spills, or other problems.
The use of feed additive and supplemental hormones in animal production has proven to greatly improve nutrient utilization, resulting in more efficient milk and meat production. Use of these products may decrease nitrogen excretion per day and/or reduce the total number of days on feed, thereby reducing overall nitrogen excretion and subsequent ammonia volatilization.
Ammonia volatilization occurs soon after manure is deposited on barn floors. BMPs should be implemented such as scraping and flushing the floors and

60
Final EIS August 2011 Technical Memorandum: Air Quality Addendum
alleyways, drying manure and cooling barn temperatures, installing filters/scrubbers on air exchange systems, etc.
Areas such as lawns, open spaces, parks, and golf courses require large amounts of water as well as significant amounts of fertilizers to help them stay green. Therefore, appropriate fertilizers should be applied and BMPs for re-treatment of wastewater run-off should be implemented.
6.0 REFERENCES Colorado Department of Public Health (CDPHE) - Air Pollution Control Division
(APCD). June 30, 2009. Colorado Annual Monitoring Network Plan 2009 - 2010.
CDPHE - APCD. December 21, 2007.Colorado Visibility and Regional Haze State Implementation Plan for the Twelve Mandatory Class I Federal Areas in Colorado
CDPHE - APCD, CDOT, NFRMPO, and DRCOG, Regional Transportation Model Discussion, November 17, 2009
City of Fort Collins, Air Quality Plan, Summer 2004
City of Fort Collins, Climate Action Plan, December 2008.
City of Boulder, Office of Environmental Affairs Climate Action Program (CAP) Assessment, 2009.
City of Denver, Climate Action Plan, October 2007.
Denver Regional Council of Governments (DRCOG). January 20, 2010. 2009 Amendment Cycle 2 DRCOG Conformity Determination (CO, PM10, and 1-hour Ozone) for the Amended Fiscally Constrained 2035 Regional Transportation Plan and the Amended 2008—2013 Transportation Improvement Program.
Denver Regional Council of Governments (DRCOG). March 19, 2008. 2008—2013 Transportation Improvement Program.
North Front Range Metropolitan Planning Organization. December 2007. 2035 Regional Transportation Plan.
Colorado Department of Public Health (CDPHE) - Air Pollution Control Division (APCD). August 2009. 2008 Air Quality Data Report.
Colorado Department of Public Health (CDPHE). 2006b. Colorado 2002 Ammonia Emissions Inventory. Curtis Taipale. Air Pollution Control Division.
61
Final EIS August 2011 Technical Memorandum: Air Quality Addendum
Colorado Department of Public Health (CDPHE) - Air Pollution Control Division (APCD). October 2007. Revised Carbon Monoxide Maintenance Plan for the Longmont Attainment/Maintenance Area.
Colorado Department of Public Health (CDPHE) - Air Pollution Control Division (APCD). December 2002. Revised Carbon Monoxide Maintenance Plan for the Greeley Attainment/Maintenance Area.
Houk, Jeff. 2007. FHWA Personal communication. Email discussing nitrogen calculations associated with the US287, I-25 and US85 corridors
U.S Environmental Protection Agency (EPA) and Federal Highway Administration (FHWA). 2006. Transportation Conformity Guidance for Qualitative Hot-spot Analyses in PM2.5 and PM10 Nonattainment and Maintenance Areas. EPA420-B-06-902. March 29.
Denver Regional Council of Governments, January 2010. DRCOG Conformity Determination for the 2035 RTP and the 2008—2013 TIP.
U.S Environmental Protection Agency (EPA). November 1992. Guidelines for Modeling Carbon Monoxide from Roadway Intersections.
U.S Environmental Protection Agency (EPA). November 1992. User’s Guide to CAL3QHC Version 2.0: A Modeling Methodology for Predicting Pollutant Concentrations Near Roadway Intersections.

This Page Left Intentionally Blank.
Appendix A
Final EIS August 2011 Technical Memorandum: Air Quality Addendum
Appendix A. CO Hot Spot Analysis

This Page Left Intentionally Blank.
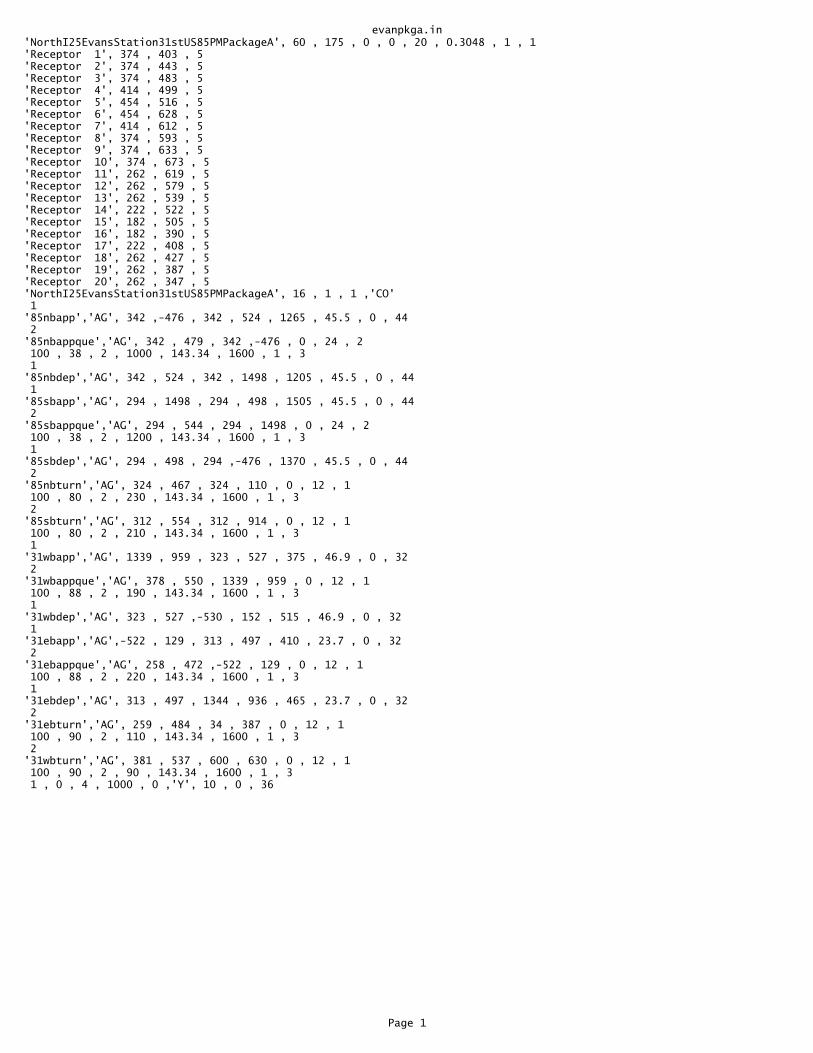
evanpkga.in'NorthI25EvansStation31stUS85PMPackageA', 60 , 175 , 0 , 0 , 20 , 0.3048 , 1 , 1 'Receptor 1', 374 , 403 , 5 'Receptor 2', 374 , 443 , 5 'Receptor 3', 374 , 483 , 5 'Receptor 4', 414 , 499 , 5 'Receptor 5', 454 , 516 , 5 'Receptor 6', 454 , 628 , 5 'Receptor 7', 414 , 612 , 5 'Receptor 8', 374 , 593 , 5 'Receptor 9', 374 , 633 , 5 'Receptor 10', 374 , 673 , 5 'Receptor 11', 262 , 619 , 5 'Receptor 12', 262 , 579 , 5 'Receptor 13', 262 , 539 , 5 'Receptor 14', 222 , 522 , 5 'Receptor 15', 182 , 505 , 5 'Receptor 16', 182 , 390 , 5 'Receptor 17', 222 , 408 , 5 'Receptor 18', 262 , 427 , 5 'Receptor 19', 262 , 387 , 5 'Receptor 20', 262 , 347 , 5 'NorthI25EvansStation31stUS85PMPackageA', 16 , 1 , 1 ,'CO' 1 '85nbapp','AG', 342 ,-476 , 342 , 524 , 1265 , 45.5 , 0 , 44 2 '85nbappque','AG', 342 , 479 , 342 ,-476 , 0 , 24 , 2 100 , 38 , 2 , 1000 , 143.34 , 1600 , 1 , 3 1 '85nbdep','AG', 342 , 524 , 342 , 1498 , 1205 , 45.5 , 0 , 44 1 '85sbapp','AG', 294 , 1498 , 294 , 498 , 1505 , 45.5 , 0 , 44 2 '85sbappque','AG', 294 , 544 , 294 , 1498 , 0 , 24 , 2 100 , 38 , 2 , 1200 , 143.34 , 1600 , 1 , 3 1 '85sbdep','AG', 294 , 498 , 294 ,-476 , 1370 , 45.5 , 0 , 44 2 '85nbturn','AG', 324 , 467 , 324 , 110 , 0 , 12 , 1 100 , 80 , 2 , 230 , 143.34 , 1600 , 1 , 3 2 '85sbturn','AG', 312 , 554 , 312 , 914 , 0 , 12 , 1 100 , 80 , 2 , 210 , 143.34 , 1600 , 1 , 3 1 '31wbapp','AG', 1339 , 959 , 323 , 527 , 375 , 46.9 , 0 , 32 2 '31wbappque','AG', 378 , 550 , 1339 , 959 , 0 , 12 , 1 100 , 88 , 2 , 190 , 143.34 , 1600 , 1 , 3 1 '31wbdep','AG', 323 , 527 ,-530 , 152 , 515 , 46.9 , 0 , 32 1 '31ebapp','AG',-522 , 129 , 313 , 497 , 410 , 23.7 , 0 , 32 2 '31ebappque','AG', 258 , 472 ,-522 , 129 , 0 , 12 , 1 100 , 88 , 2 , 220 , 143.34 , 1600 , 1 , 3 1 '31ebdep','AG', 313 , 497 , 1344 , 936 , 465 , 23.7 , 0 , 32 2 '31ebturn','AG', 259 , 484 , 34 , 387 , 0 , 12 , 1 100 , 90 , 2 , 110 , 143.34 , 1600 , 1 , 3 2 '31wbturn','AG', 381 , 537 , 600 , 630 , 0 , 12 , 1 100 , 90 , 2 , 90 , 143.34 , 1600 , 1 , 3 1 , 0 , 4 , 1000 , 0 ,'Y', 10 , 0 , 36
Page 1

evanpga2.out� CAL3QHC: LINE SOURCE DISPERSION MODEL - VERSION 2.0 Dated 95221 PAGE 1
JOB: NorthI25EvansStation31stUS85PMPackageA RUN: NorthI25EvansStation31stUS85PMPackageA
DATE : 11/22/10 TIME : 10:26:41
The MODE flag has been set to C for calculating CO averages.
SITE & METEOROLOGICAL VARIABLES ------------------------------- VS = .0 CM/S VD = .0 CM/S Z0 = 175. CM U = 1.0 M/S CLAS = 4 (D) ATIM = 60. MINUTES MIXH = 1000. M AMB = .0 PPM
LINK VARIABLES -------------- LINK DESCRIPTION * LINK COORDINATES (FT) * LENGTH BRG TYPE VPH EF H W V/C QUEUE * X1 Y1 X2 Y2 * (FT) (DEG) (G/MI) (FT) (FT) (VEH) ------------------------*----------------------------------------*---------------------------------------------------------- 1. 85nbapp * 342.0 -476.0 342.0 524.0 * 1000. 360. AG 1265. 45.5 .0 44.0 2. 85nbappque * 342.0 479.0 342.0 375.1 * 104. 180. AG 292. 100.0 .0 24.0 .54 5.3 3. 85nbdep * 342.0 524.0 342.0 1498.0 * 974. 360. AG 1205. 45.5 .0 44.0 4. 85sbapp * 294.0 1498.0 294.0 498.0 * 1000. 180. AG 1505. 45.5 .0 44.0 5. 85sbappque * 294.0 544.0 294.0 668.7 * 125. 360. AG 292. 100.0 .0 24.0 .65 6.3 6. 85sbdep * 294.0 498.0 294.0 -476.0 * 974. 180. AG 1370. 45.5 .0 44.0 7. 85nbturn * 324.0 467.0 324.0 332.5 * 134. 180. AG 308. 100.0 .0 12.0 .90 6.8 8. 85sbturn * 312.0 554.0 312.0 662.4 * 108. 360. AG 308. 100.0 .0 12.0 .82 5.5 9. 31wbapp * 1339.0 959.0 323.0 527.0 * 1104. 247. AG 375. 46.9 .0 32.0 10. 31wbappque * 378.0 550.0 1099.1 856.9 * 784. 67. AG 338. 100.0 .0 12.0 1.48 39.8 11. 31wbdep * 323.0 527.0 -530.0 152.0 * 932. 246. AG 515. 46.9 .0 32.0 12. 31ebapp * -522.0 129.0 313.0 497.0 * 912. 66. AG 410. 23.7 .0 32.0 13. 31ebappque * 258.0 472.0 -754.8 26.6 * 1106. 246. AG 338. 100.0 .0 12.0 1.72 56.2 14. 31ebdep * 313.0 497.0 1344.0 936.0 * 1121. 67. AG 465. 23.7 .0 32.0 15. 31ebturn * 259.0 484.0 32.3 386.3 * 247. 247. AG 346. 100.0 .0 12.0 1.15 12.5 16. 31wbturn * 381.0 537.0 451.6 567.0 * 77. 67. AG 346. 100.0 .0 12.0 .94 3.9� PAGE 2 JOB: NorthI25EvansStation31stUS85PMPackageA RUN: NorthI25EvansStation31stUS85PMPackageA
DATE : 11/22/10 TIME : 10:26:41
ADDITIONAL QUEUE LINK PARAMETERS -------------------------------- LINK DESCRIPTION * CYCLE RED CLEARANCE APPROACH SATURATION IDLE SIGNAL ARRIVAL * LENGTH TIME LOST TIME VOL FLOW RATE EM FAC TYPE RATE * (SEC) (SEC) (SEC) (VPH) (VPH) (gm/hr) ------------------------*-------------------------------------------------------------------------------- 2. 85nbappque * 100 38 2.0 1000 1600 143.34 1 3 5. 85sbappque * 100 38 2.0 1200 1600 143.34 1 3 7. 85nbturn * 100 80 2.0 230 1600 143.34 1 3 8. 85sbturn * 100 80 2.0 210 1600 143.34 1 3 10. 31wbappque * 100 88 2.0 190 1600 143.34 1 3 13. 31ebappque * 100 88 2.0 220 1600 143.34 1 3 15. 31ebturn * 100 90 2.0 110 1600 143.34 1 3 16. 31wbturn * 100 90 2.0 90 1600 143.34 1 3
RECEPTOR LOCATIONS ------------------ * COORDINATES (FT) * RECEPTOR * X Y Z * -------------------------*-------------------------------------* 1. Receptor 1 * 374.0 403.0 5.0 * 2. Receptor 2 * 374.0 443.0 5.0 * 3. Receptor 3 * 374.0 483.0 5.0 * 4. Receptor 4 * 414.0 499.0 5.0 * 5. Receptor 5 * 454.0 516.0 5.0 * 6. Receptor 6 * 454.0 628.0 5.0 * 7. Receptor 7 * 414.0 612.0 5.0 *
Page 1

evanpga2.out 8. Receptor 8 * 374.0 593.0 5.0 * 9. Receptor 9 * 374.0 633.0 5.0 * 10. Receptor 10 * 374.0 673.0 5.0 * 11. Receptor 11 * 262.0 619.0 5.0 * 12. Receptor 12 * 262.0 579.0 5.0 * 13. Receptor 13 * 262.0 539.0 5.0 * 14. Receptor 14 * 222.0 522.0 5.0 * 15. Receptor 15 * 182.0 505.0 5.0 * 16. Receptor 16 * 182.0 390.0 5.0 * 17. Receptor 17 * 222.0 408.0 5.0 * 18. Receptor 18 * 262.0 427.0 5.0 * 19. Receptor 19 * 262.0 387.0 5.0 * 20. Receptor 20 * 262.0 347.0 5.0 *� PAGE 3 JOB: NorthI25EvansStation31stUS85PMPackageA RUN: NorthI25EvansStation31stUS85PMPackageA
MODEL RESULTS -------------
REMARKS : In search of the angle corresponding to the maximum concentration, only the first angle, of the angles with same maximum concentrations, is indicated as maximum.
WIND ANGLE RANGE: 0.-360.
WIND * CONCENTRATION ANGLE * (PPM) (DEGR)* REC1 REC2 REC3 REC4 REC5 REC6 REC7 REC8 REC9 REC10 REC11 REC12 REC13 REC14 REC15 REC16 REC17 REC18 REC19 REC20 ------*------------------------------------------------------------------------------------------------------------------------ 0. * 3.4 3.2 3.5 2.6 1.8 .5 1.0 2.4 2.4 2.4 2.7 2.9 3.0 1.1 .7 2.3 2.9 4.1 3.9 3.6 10. * 1.9 1.9 2.2 1.8 1.2 .1 .3 1.0 1.0 1.0 4.1 4.3 4.5 2.2 1.4 3.1 3.9 5.3 4.8 4.9 20. * 1.1 1.3 1.6 1.5 1.1 .0 .0 .2 .2 .2 4.3 4.7 5.1 2.7 1.8 3.6 4.0 5.0 4.8 5.0 30. * .8 1.1 1.6 1.5 1.2 .0 .0 .1 .1 .1 4.3 4.8 5.0 2.8 2.0 3.4 3.7 4.8 4.7 4.9 40. * .7 1.0 1.7 1.3 1.2 .0 .0 .0 .0 .0 4.1 4.5 4.6 2.8 1.9 3.4 3.7 4.6 4.4 4.5 50. * .7 .9 1.6 1.5 1.4 .2 .2 .2 .0 .0 4.0 4.2 4.4 2.9 2.3 3.0 3.4 4.6 4.5 4.5 60. * .5 .7 1.3 1.1 1.0 .5 .5 .6 .2 .0 4.1 4.2 4.6 3.0 2.5 2.9 3.2 4.3 4.3 4.0 70. * .3 .3 .7 .6 .6 1.1 1.1 1.2 .6 .4 4.4 4.6 4.9 3.5 2.8 2.2 2.8 3.9 3.7 3.6 80. * .0 .0 .3 .3 .3 1.4 1.4 1.5 .9 .6 4.6 5.1 4.9 3.6 2.8 1.9 2.6 3.6 3.4 3.2 90. * .0 .0 .0 .0 .0 1.4 1.4 1.5 1.0 .8 4.8 5.1 4.6 3.2 2.9 1.8 2.4 3.5 3.4 3.0 100. * .0 .0 .0 .0 .0 1.4 1.3 1.6 .9 .6 4.7 5.0 4.1 3.2 2.9 1.7 2.3 3.6 3.4 3.0 110. * .0 .0 .0 .0 .0 1.3 1.2 1.6 .9 .6 4.7 4.7 3.9 2.8 3.1 1.5 2.1 3.4 3.1 2.8 120. * .0 .0 .0 .0 .0 1.2 1.1 1.6 .9 .6 4.7 4.4 3.9 3.1 3.3 1.5 2.0 3.5 3.2 3.0 130. * .0 .0 .0 .0 .0 1.1 1.2 1.5 1.0 .6 4.8 4.4 4.2 3.4 3.5 1.5 2.0 3.5 3.2 3.0 140. * .0 .0 .0 .0 .0 1.1 1.3 1.5 1.0 .7 4.8 4.8 4.7 3.7 3.5 1.6 2.1 3.7 3.4 3.3 150. * .1 .1 .1 .0 .0 1.1 1.4 1.5 1.0 .8 5.3 5.0 5.2 4.0 3.5 1.7 2.2 3.8 3.5 3.5 160. * .2 .3 .3 .0 .0 1.1 1.5 1.6 1.3 1.0 5.3 5.2 5.3 3.9 3.4 1.6 2.3 4.0 3.9 3.9 170. * 1.0 1.0 1.1 .3 .1 1.3 1.9 2.4 1.9 1.9 5.2 5.0 5.2 3.7 3.0 1.2 1.9 3.7 3.7 3.7 180. * 2.4 2.6 2.8 1.1 .6 1.9 2.7 3.8 3.5 3.4 3.6 3.5 3.9 2.8 2.3 .6 1.0 2.6 2.5 2.5 190. * 3.6 3.9 4.2 1.9 1.3 2.9 3.7 5.0 4.8 4.5 2.0 2.2 2.5 2.1 1.8 .1 .3 1.1 1.1 1.1 200. * 4.0 4.4 4.7 2.4 1.6 3.4 3.8 4.9 4.7 5.0 1.3 1.4 2.1 1.9 1.9 .0 .0 .3 .3 .3 210. * 3.7 4.3 4.5 2.6 1.9 3.3 3.6 4.7 4.7 4.7 1.0 1.3 1.9 2.0 1.9 .0 .0 .1 .1 .1 220. * 3.8 4.3 4.4 2.8 2.0 3.6 3.6 4.7 4.7 4.9 1.0 1.5 2.2 2.2 2.1 .0 .0 .0 .0 .0 230. * 3.7 4.0 4.1 2.7 2.0 3.4 3.7 4.8 4.7 4.5 .8 1.3 2.1 2.1 2.0 .1 .1 .1
Page 2
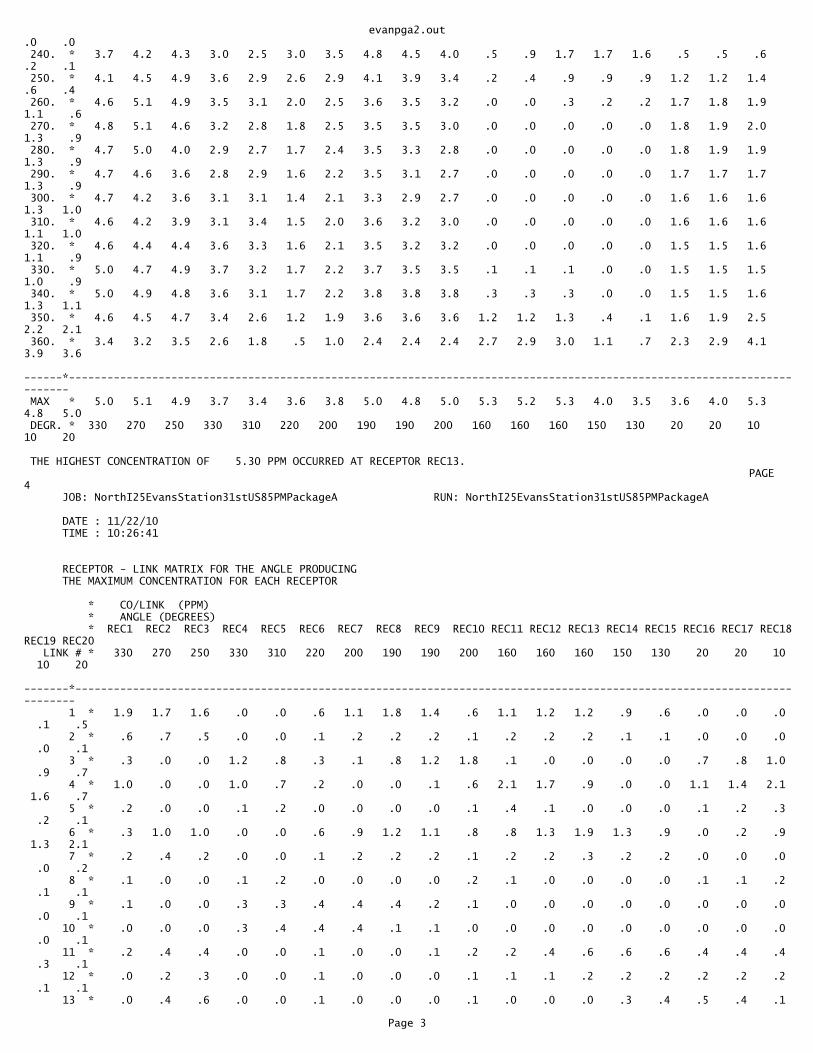
evanpga2.out.0 .0 240. * 3.7 4.2 4.3 3.0 2.5 3.0 3.5 4.8 4.5 4.0 .5 .9 1.7 1.7 1.6 .5 .5 .6 .2 .1 250. * 4.1 4.5 4.9 3.6 2.9 2.6 2.9 4.1 3.9 3.4 .2 .4 .9 .9 .9 1.2 1.2 1.4 .6 .4 260. * 4.6 5.1 4.9 3.5 3.1 2.0 2.5 3.6 3.5 3.2 .0 .0 .3 .2 .2 1.7 1.8 1.9 1.1 .6 270. * 4.8 5.1 4.6 3.2 2.8 1.8 2.5 3.5 3.5 3.0 .0 .0 .0 .0 .0 1.8 1.9 2.0 1.3 .9 280. * 4.7 5.0 4.0 2.9 2.7 1.7 2.4 3.5 3.3 2.8 .0 .0 .0 .0 .0 1.8 1.9 1.9 1.3 .9 290. * 4.7 4.6 3.6 2.8 2.9 1.6 2.2 3.5 3.1 2.7 .0 .0 .0 .0 .0 1.7 1.7 1.7 1.3 .9 300. * 4.7 4.2 3.6 3.1 3.1 1.4 2.1 3.3 2.9 2.7 .0 .0 .0 .0 .0 1.6 1.6 1.6 1.3 1.0 310. * 4.6 4.2 3.9 3.1 3.4 1.5 2.0 3.6 3.2 3.0 .0 .0 .0 .0 .0 1.6 1.6 1.6 1.1 1.0 320. * 4.6 4.4 4.4 3.6 3.3 1.6 2.1 3.5 3.2 3.2 .0 .0 .0 .0 .0 1.5 1.5 1.6 1.1 .9 330. * 5.0 4.7 4.9 3.7 3.2 1.7 2.2 3.7 3.5 3.5 .1 .1 .1 .0 .0 1.5 1.5 1.5 1.0 .9 340. * 5.0 4.9 4.8 3.6 3.1 1.7 2.2 3.8 3.8 3.8 .3 .3 .3 .0 .0 1.5 1.5 1.6 1.3 1.1 350. * 4.6 4.5 4.7 3.4 2.6 1.2 1.9 3.6 3.6 3.6 1.2 1.2 1.3 .4 .1 1.6 1.9 2.5 2.2 2.1 360. * 3.4 3.2 3.5 2.6 1.8 .5 1.0 2.4 2.4 2.4 2.7 2.9 3.0 1.1 .7 2.3 2.9 4.1 3.9 3.6 ------*------------------------------------------------------------------------------------------------------------------------ MAX * 5.0 5.1 4.9 3.7 3.4 3.6 3.8 5.0 4.8 5.0 5.3 5.2 5.3 4.0 3.5 3.6 4.0 5.3 4.8 5.0 DEGR. * 330 270 250 330 310 220 200 190 190 200 160 160 160 150 130 20 20 10 10 20
THE HIGHEST CONCENTRATION OF 5.30 PPM OCCURRED AT RECEPTOR REC13.� PAGE 4 JOB: NorthI25EvansStation31stUS85PMPackageA RUN: NorthI25EvansStation31stUS85PMPackageA
DATE : 11/22/10 TIME : 10:26:41
RECEPTOR - LINK MATRIX FOR THE ANGLE PRODUCING THE MAXIMUM CONCENTRATION FOR EACH RECEPTOR
* CO/LINK (PPM) * ANGLE (DEGREES) * REC1 REC2 REC3 REC4 REC5 REC6 REC7 REC8 REC9 REC10 REC11 REC12 REC13 REC14 REC15 REC16 REC17 REC18REC19 REC20 LINK # * 330 270 250 330 310 220 200 190 190 200 160 160 160 150 130 20 20 10 10 20 -------*------------------------------------------------------------------------------------------------------------------------ 1 * 1.9 1.7 1.6 .0 .0 .6 1.1 1.8 1.4 .6 1.1 1.2 1.2 .9 .6 .0 .0 .0 .1 .5 2 * .6 .7 .5 .0 .0 .1 .2 .2 .2 .1 .2 .2 .2 .1 .1 .0 .0 .0 .0 .1 3 * .3 .0 .0 1.2 .8 .3 .1 .8 1.2 1.8 .1 .0 .0 .0 .0 .7 .8 1.0 .9 .7 4 * 1.0 .0 .0 1.0 .7 .2 .0 .0 .1 .6 2.1 1.7 .9 .0 .0 1.1 1.4 2.1 1.6 .7 5 * .2 .0 .0 .1 .2 .0 .0 .0 .0 .1 .4 .1 .0 .0 .0 .1 .2 .3 .2 .1 6 * .3 1.0 1.0 .0 .0 .6 .9 1.2 1.1 .8 .8 1.3 1.9 1.3 .9 .0 .2 .9 1.3 2.1 7 * .2 .4 .2 .0 .0 .1 .2 .2 .2 .1 .2 .2 .3 .2 .2 .0 .0 .0 .0 .2 8 * .1 .0 .0 .1 .2 .0 .0 .0 .0 .2 .1 .0 .0 .0 .0 .1 .1 .2 .1 .1 9 * .1 .0 .0 .3 .3 .4 .4 .4 .2 .1 .0 .0 .0 .0 .0 .0 .0 .0 .0 .1 10 * .0 .0 .0 .3 .4 .4 .4 .1 .1 .0 .0 .0 .0 .0 .0 .0 .0 .0 .0 .1 11 * .2 .4 .4 .0 .0 .1 .0 .0 .1 .2 .2 .4 .6 .6 .6 .4 .4 .4 .3 .1 12 * .0 .2 .3 .0 .0 .1 .0 .0 .0 .1 .1 .1 .2 .2 .2 .2 .2 .2 .1 .1 13 * .0 .4 .6 .0 .0 .1 .0 .0 .0 .1 .0 .0 .0 .3 .4 .5 .4 .1
Page 3
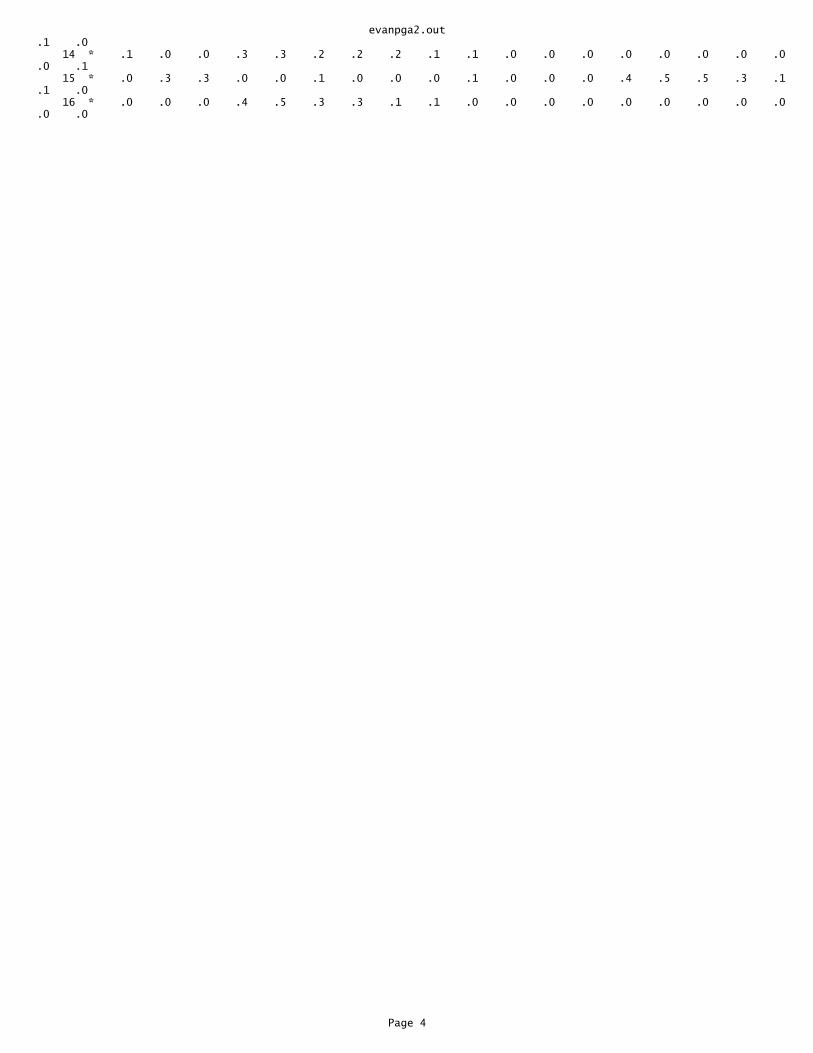
evanpga2.out .1 .0 14 * .1 .0 .0 .3 .3 .2 .2 .2 .1 .1 .0 .0 .0 .0 .0 .0 .0 .0 .0 .1 15 * .0 .3 .3 .0 .0 .1 .0 .0 .0 .1 .0 .0 .0 .4 .5 .5 .3 .1 .1 .0 16 * .0 .0 .0 .4 .5 .3 .3 .1 .1 .0 .0 .0 .0 .0 .0 .0 .0 .0 .0 .0
Page 4

evanpmpa.in'NorthI25EvansStation31stUS85PMPA', 60 , 175 , 0 , 0 , 20 , 0.3048 , 1 , 1 'Receptor 1', 386 , 403 , 5 'Receptor 2', 386 , 443 , 5 'Receptor 3', 386 , 483 , 5 'Receptor 4', 426 , 499 , 5 'Receptor 5', 466 , 516 , 5 'Receptor 6', 466 , 628 , 5 'Receptor 7', 426 , 612 , 5 'Receptor 8', 386 , 593 , 5 'Receptor 9', 386 , 633 , 5 'Receptor 10', 386 , 673 , 5 'Receptor 11', 250 , 619 , 5 'Receptor 12', 250 , 579 , 5 'Receptor 13', 250 , 539 , 5 'Receptor 14', 210 , 522 , 5 'Receptor 15', 170 , 505 , 5 'Receptor 16', 170 , 390 , 5 'Receptor 17', 210 , 408 , 5 'Receptor 18', 250 , 427 , 5 'Receptor 19', 250 , 387 , 5 'Receptor 20', 250 , 347 , 5 'NorthI25EvansStation31stUS85PMPA', 16 , 1 , 1 ,'CO' 1 '85nbapp','AG', 348 ,-476 , 348 , 524 , 1367 , 45.5 , 0 , 56 2 '85nbappque','AG', 348 , 479 , 348 ,-476 , 0 , 36 , 3 120 , 69 , 2 , 1080 , 143.34 , 1600 , 1 , 3 1 '85nbdep','AG', 348 , 524 , 348 , 1498 , 1305 , 45.5 , 0 , 56 1 '85sbapp','AG', 288 , 1498 , 288 , 498 , 1635 , 45.5 , 0 , 56 2 '85sbappque','AG', 288 , 544 , 288 , 1498 , 0 , 36 , 3 120 , 66 , 2 , 1300 , 143.34 , 1600 , 1 , 3 1 '85sbdep','AG', 288 , 498 , 288 ,-476 , 1490 , 45.5 , 0 , 56 2 '85nbturn','AG', 324 , 467 , 324 , 110 , 0 , 12 , 1 120 , 97 , 2 , 247 , 143.34 , 1600 , 1 , 3 2 '85sbturn','AG', 312 , 554 , 312 , 914 , 0 , 12 , 1 120 , 95 , 2 , 230 , 143.34 , 1600 , 1 , 3 1 '31wbapp','AG', 1332 , 973 , 318 , 534 , 415 , 46.9 , 0 , 44 2 '31wbappque','AG', 378 , 560 , 1332 , 973 , 0 , 24 , 2 120 , 89 , 2 , 210 , 143.34 , 1600 , 1 , 3 1 '31wbdep','AG', 318 , 534 ,-537 , 168 , 562 , 46.9 , 0 , 44 1 '31ebapp','AG',-513 , 122 , 318 , 488 , 450 , 23.7 , 0 , 44 2 '31ebappque','AG', 258 , 461 ,-513 , 122 , 0 , 24 , 2 120 , 87 , 2 , 240 , 143.34 , 1600 , 1 , 3 1 '31ebdep','AG', 318 , 488 , 1347 , 927 , 510 , 23.7 , 0 , 44 2 '31ebturn','AG', 259 , 484 , 34 , 387 , 0 , 12 , 1 120 , 80 , 2 , 120 , 143.34 , 1600 , 1 , 3 2 '31wbturn','AG', 381 , 537 , 600 , 630 , 0 , 12 , 1 120 , 84 , 2 , 100 , 143.34 , 1600 , 1 , 3 1 , 0 , 4 , 1000 , 0 ,'Y', 10 , 0 , 36
Page 1
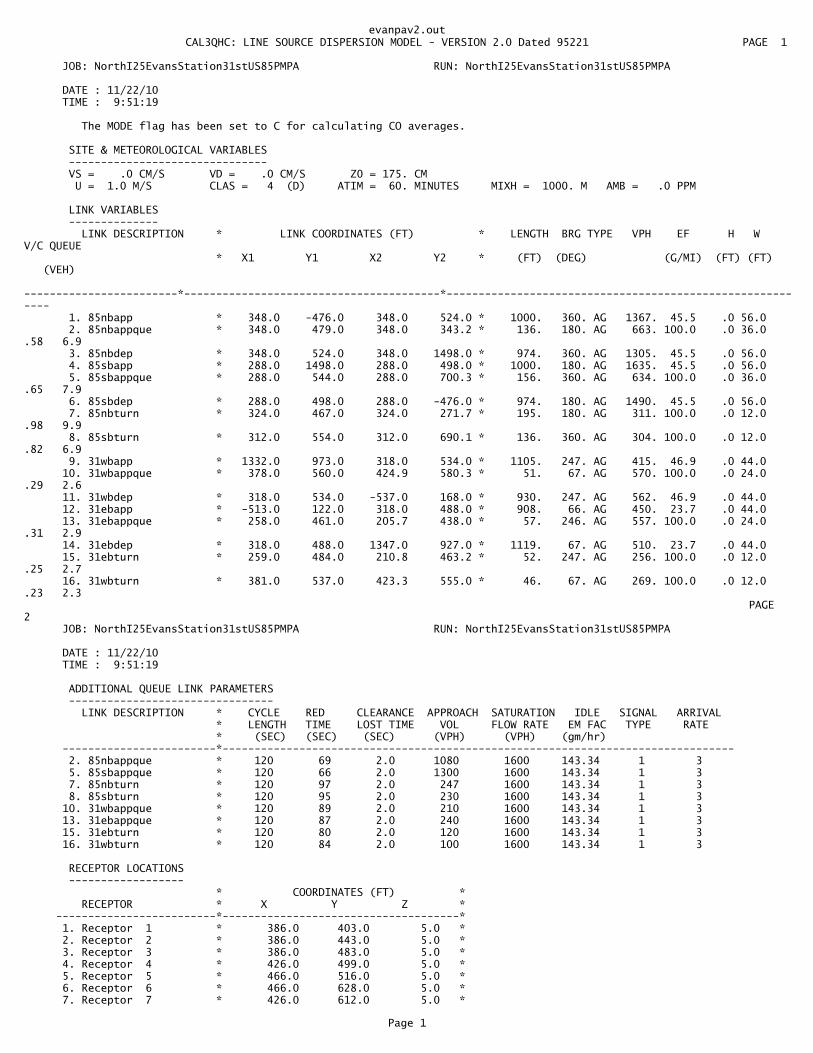
evanpav2.out� CAL3QHC: LINE SOURCE DISPERSION MODEL - VERSION 2.0 Dated 95221 PAGE 1
JOB: NorthI25EvansStation31stUS85PMPA RUN: NorthI25EvansStation31stUS85PMPA
DATE : 11/22/10 TIME : 9:51:19
The MODE flag has been set to C for calculating CO averages.
SITE & METEOROLOGICAL VARIABLES ------------------------------- VS = .0 CM/S VD = .0 CM/S Z0 = 175. CM U = 1.0 M/S CLAS = 4 (D) ATIM = 60. MINUTES MIXH = 1000. M AMB = .0 PPM
LINK VARIABLES -------------- LINK DESCRIPTION * LINK COORDINATES (FT) * LENGTH BRG TYPE VPH EF H W V/C QUEUE * X1 Y1 X2 Y2 * (FT) (DEG) (G/MI) (FT) (FT) (VEH) ------------------------*----------------------------------------*---------------------------------------------------------- 1. 85nbapp * 348.0 -476.0 348.0 524.0 * 1000. 360. AG 1367. 45.5 .0 56.0 2. 85nbappque * 348.0 479.0 348.0 343.2 * 136. 180. AG 663. 100.0 .0 36.0 .58 6.9 3. 85nbdep * 348.0 524.0 348.0 1498.0 * 974. 360. AG 1305. 45.5 .0 56.0 4. 85sbapp * 288.0 1498.0 288.0 498.0 * 1000. 180. AG 1635. 45.5 .0 56.0 5. 85sbappque * 288.0 544.0 288.0 700.3 * 156. 360. AG 634. 100.0 .0 36.0 .65 7.9 6. 85sbdep * 288.0 498.0 288.0 -476.0 * 974. 180. AG 1490. 45.5 .0 56.0 7. 85nbturn * 324.0 467.0 324.0 271.7 * 195. 180. AG 311. 100.0 .0 12.0 .98 9.9 8. 85sbturn * 312.0 554.0 312.0 690.1 * 136. 360. AG 304. 100.0 .0 12.0 .82 6.9 9. 31wbapp * 1332.0 973.0 318.0 534.0 * 1105. 247. AG 415. 46.9 .0 44.0 10. 31wbappque * 378.0 560.0 424.9 580.3 * 51. 67. AG 570. 100.0 .0 24.0 .29 2.6 11. 31wbdep * 318.0 534.0 -537.0 168.0 * 930. 247. AG 562. 46.9 .0 44.0 12. 31ebapp * -513.0 122.0 318.0 488.0 * 908. 66. AG 450. 23.7 .0 44.0 13. 31ebappque * 258.0 461.0 205.7 438.0 * 57. 246. AG 557. 100.0 .0 24.0 .31 2.9 14. 31ebdep * 318.0 488.0 1347.0 927.0 * 1119. 67. AG 510. 23.7 .0 44.0 15. 31ebturn * 259.0 484.0 210.8 463.2 * 52. 247. AG 256. 100.0 .0 12.0 .25 2.7 16. 31wbturn * 381.0 537.0 423.3 555.0 * 46. 67. AG 269. 100.0 .0 12.0 .23 2.3� PAGE 2 JOB: NorthI25EvansStation31stUS85PMPA RUN: NorthI25EvansStation31stUS85PMPA
DATE : 11/22/10 TIME : 9:51:19
ADDITIONAL QUEUE LINK PARAMETERS -------------------------------- LINK DESCRIPTION * CYCLE RED CLEARANCE APPROACH SATURATION IDLE SIGNAL ARRIVAL * LENGTH TIME LOST TIME VOL FLOW RATE EM FAC TYPE RATE * (SEC) (SEC) (SEC) (VPH) (VPH) (gm/hr) ------------------------*-------------------------------------------------------------------------------- 2. 85nbappque * 120 69 2.0 1080 1600 143.34 1 3 5. 85sbappque * 120 66 2.0 1300 1600 143.34 1 3 7. 85nbturn * 120 97 2.0 247 1600 143.34 1 3 8. 85sbturn * 120 95 2.0 230 1600 143.34 1 3 10. 31wbappque * 120 89 2.0 210 1600 143.34 1 3 13. 31ebappque * 120 87 2.0 240 1600 143.34 1 3 15. 31ebturn * 120 80 2.0 120 1600 143.34 1 3 16. 31wbturn * 120 84 2.0 100 1600 143.34 1 3
RECEPTOR LOCATIONS ------------------ * COORDINATES (FT) * RECEPTOR * X Y Z * -------------------------*-------------------------------------* 1. Receptor 1 * 386.0 403.0 5.0 * 2. Receptor 2 * 386.0 443.0 5.0 * 3. Receptor 3 * 386.0 483.0 5.0 * 4. Receptor 4 * 426.0 499.0 5.0 * 5. Receptor 5 * 466.0 516.0 5.0 * 6. Receptor 6 * 466.0 628.0 5.0 * 7. Receptor 7 * 426.0 612.0 5.0 *
Page 1
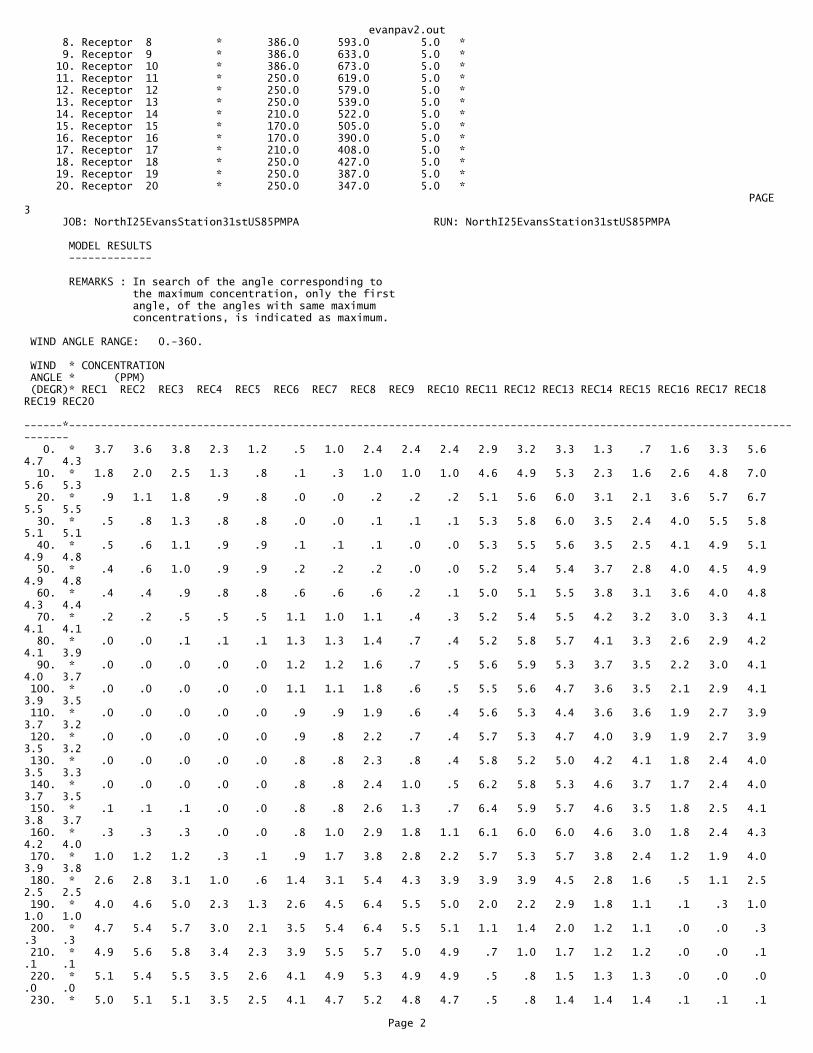
evanpav2.out 8. Receptor 8 * 386.0 593.0 5.0 * 9. Receptor 9 * 386.0 633.0 5.0 * 10. Receptor 10 * 386.0 673.0 5.0 * 11. Receptor 11 * 250.0 619.0 5.0 * 12. Receptor 12 * 250.0 579.0 5.0 * 13. Receptor 13 * 250.0 539.0 5.0 * 14. Receptor 14 * 210.0 522.0 5.0 * 15. Receptor 15 * 170.0 505.0 5.0 * 16. Receptor 16 * 170.0 390.0 5.0 * 17. Receptor 17 * 210.0 408.0 5.0 * 18. Receptor 18 * 250.0 427.0 5.0 * 19. Receptor 19 * 250.0 387.0 5.0 * 20. Receptor 20 * 250.0 347.0 5.0 *� PAGE 3 JOB: NorthI25EvansStation31stUS85PMPA RUN: NorthI25EvansStation31stUS85PMPA
MODEL RESULTS -------------
REMARKS : In search of the angle corresponding to the maximum concentration, only the first angle, of the angles with same maximum concentrations, is indicated as maximum.
WIND ANGLE RANGE: 0.-360.
WIND * CONCENTRATION ANGLE * (PPM) (DEGR)* REC1 REC2 REC3 REC4 REC5 REC6 REC7 REC8 REC9 REC10 REC11 REC12 REC13 REC14 REC15 REC16 REC17 REC18 REC19 REC20 ------*------------------------------------------------------------------------------------------------------------------------ 0. * 3.7 3.6 3.8 2.3 1.2 .5 1.0 2.4 2.4 2.4 2.9 3.2 3.3 1.3 .7 1.6 3.3 5.6 4.7 4.3 10. * 1.8 2.0 2.5 1.3 .8 .1 .3 1.0 1.0 1.0 4.6 4.9 5.3 2.3 1.6 2.6 4.8 7.0 5.6 5.3 20. * .9 1.1 1.8 .9 .8 .0 .0 .2 .2 .2 5.1 5.6 6.0 3.1 2.1 3.6 5.7 6.7 5.5 5.5 30. * .5 .8 1.3 .8 .8 .0 .0 .1 .1 .1 5.3 5.8 6.0 3.5 2.4 4.0 5.5 5.8 5.1 5.1 40. * .5 .6 1.1 .9 .9 .1 .1 .1 .0 .0 5.3 5.5 5.6 3.5 2.5 4.1 4.9 5.1 4.9 4.8 50. * .4 .6 1.0 .9 .9 .2 .2 .2 .0 .0 5.2 5.4 5.4 3.7 2.8 4.0 4.5 4.9 4.9 4.8 60. * .4 .4 .9 .8 .8 .6 .6 .6 .2 .1 5.0 5.1 5.5 3.8 3.1 3.6 4.0 4.8 4.3 4.4 70. * .2 .2 .5 .5 .5 1.1 1.0 1.1 .4 .3 5.2 5.4 5.5 4.2 3.2 3.0 3.3 4.1 4.1 4.1 80. * .0 .0 .1 .1 .1 1.3 1.3 1.4 .7 .4 5.2 5.8 5.7 4.1 3.3 2.6 2.9 4.2 4.1 3.9 90. * .0 .0 .0 .0 .0 1.2 1.2 1.6 .7 .5 5.6 5.9 5.3 3.7 3.5 2.2 3.0 4.1 4.0 3.7 100. * .0 .0 .0 .0 .0 1.1 1.1 1.8 .6 .5 5.5 5.6 4.7 3.6 3.5 2.1 2.9 4.1 3.9 3.5 110. * .0 .0 .0 .0 .0 .9 .9 1.9 .6 .4 5.6 5.3 4.4 3.6 3.6 1.9 2.7 3.9 3.7 3.2 120. * .0 .0 .0 .0 .0 .9 .8 2.2 .7 .4 5.7 5.3 4.7 4.0 3.9 1.9 2.7 3.9 3.5 3.2 130. * .0 .0 .0 .0 .0 .8 .8 2.3 .8 .4 5.8 5.2 5.0 4.2 4.1 1.8 2.4 4.0 3.5 3.3 140. * .0 .0 .0 .0 .0 .8 .8 2.4 1.0 .5 6.2 5.8 5.3 4.6 3.7 1.7 2.4 4.0 3.7 3.5 150. * .1 .1 .1 .0 .0 .8 .8 2.6 1.3 .7 6.4 5.9 5.7 4.6 3.5 1.8 2.5 4.1 3.8 3.7 160. * .3 .3 .3 .0 .0 .8 1.0 2.9 1.8 1.1 6.1 6.0 6.0 4.6 3.0 1.8 2.4 4.3 4.2 4.0 170. * 1.0 1.2 1.2 .3 .1 .9 1.7 3.8 2.8 2.2 5.7 5.3 5.7 3.8 2.4 1.2 1.9 4.0 3.9 3.8 180. * 2.6 2.8 3.1 1.0 .6 1.4 3.1 5.4 4.3 3.9 3.9 3.9 4.5 2.8 1.6 .5 1.1 2.5 2.5 2.5 190. * 4.0 4.6 5.0 2.3 1.3 2.6 4.5 6.4 5.5 5.0 2.0 2.2 2.9 1.8 1.1 .1 .3 1.0 1.0 1.0 200. * 4.7 5.4 5.7 3.0 2.1 3.5 5.4 6.4 5.5 5.1 1.1 1.4 2.0 1.2 1.1 .0 .0 .3 .3 .3 210. * 4.9 5.6 5.8 3.4 2.3 3.9 5.5 5.7 5.0 4.9 .7 1.0 1.7 1.2 1.2 .0 .0 .1 .1 .1 220. * 5.1 5.4 5.5 3.5 2.6 4.1 4.9 5.3 4.9 4.9 .5 .8 1.5 1.3 1.3 .0 .0 .0 .0 .0 230. * 5.0 5.1 5.1 3.5 2.5 4.1 4.7 5.2 4.8 4.7 .5 .8 1.4 1.4 1.4 .1 .1 .1
Page 2
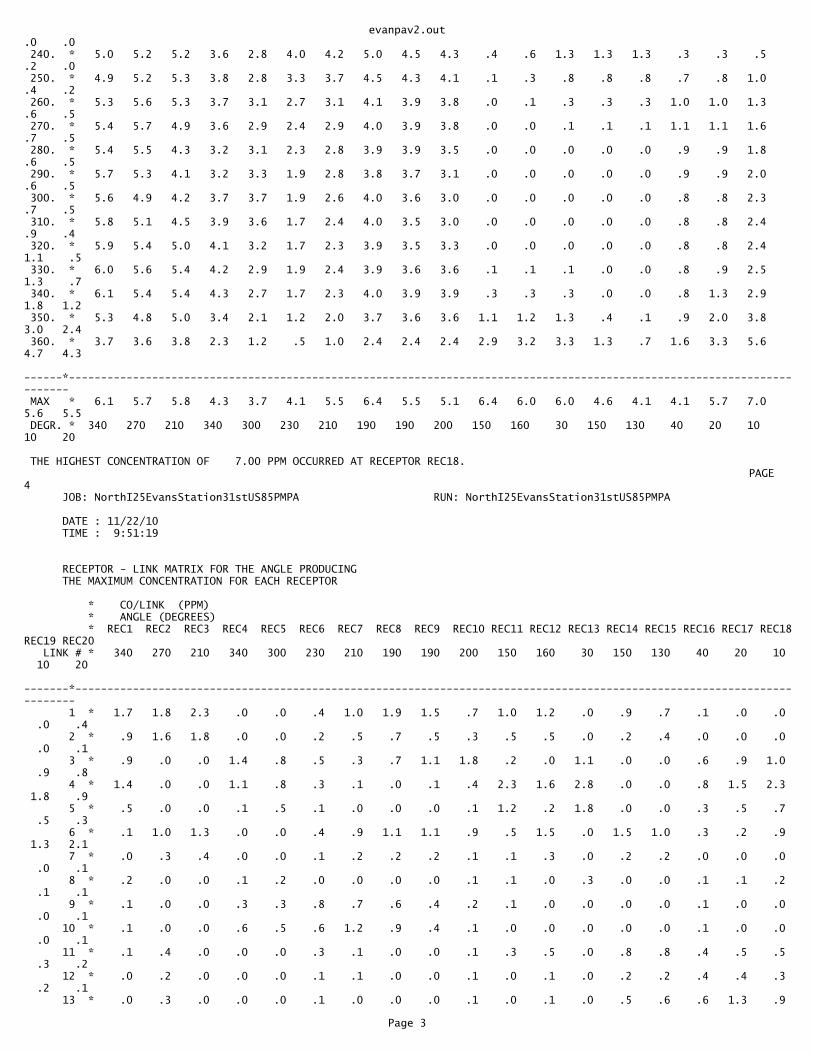
evanpav2.out.0 .0 240. * 5.0 5.2 5.2 3.6 2.8 4.0 4.2 5.0 4.5 4.3 .4 .6 1.3 1.3 1.3 .3 .3 .5 .2 .0 250. * 4.9 5.2 5.3 3.8 2.8 3.3 3.7 4.5 4.3 4.1 .1 .3 .8 .8 .8 .7 .8 1.0 .4 .2 260. * 5.3 5.6 5.3 3.7 3.1 2.7 3.1 4.1 3.9 3.8 .0 .1 .3 .3 .3 1.0 1.0 1.3 .6 .5 270. * 5.4 5.7 4.9 3.6 2.9 2.4 2.9 4.0 3.9 3.8 .0 .0 .1 .1 .1 1.1 1.1 1.6 .7 .5 280. * 5.4 5.5 4.3 3.2 3.1 2.3 2.8 3.9 3.9 3.5 .0 .0 .0 .0 .0 .9 .9 1.8 .6 .5 290. * 5.7 5.3 4.1 3.2 3.3 1.9 2.8 3.8 3.7 3.1 .0 .0 .0 .0 .0 .9 .9 2.0 .6 .5 300. * 5.6 4.9 4.2 3.7 3.7 1.9 2.6 4.0 3.6 3.0 .0 .0 .0 .0 .0 .8 .8 2.3 .7 .5 310. * 5.8 5.1 4.5 3.9 3.6 1.7 2.4 4.0 3.5 3.0 .0 .0 .0 .0 .0 .8 .8 2.4 .9 .4 320. * 5.9 5.4 5.0 4.1 3.2 1.7 2.3 3.9 3.5 3.3 .0 .0 .0 .0 .0 .8 .8 2.4 1.1 .5 330. * 6.0 5.6 5.4 4.2 2.9 1.9 2.4 3.9 3.6 3.6 .1 .1 .1 .0 .0 .8 .9 2.5 1.3 .7 340. * 6.1 5.4 5.4 4.3 2.7 1.7 2.3 4.0 3.9 3.9 .3 .3 .3 .0 .0 .8 1.3 2.9 1.8 1.2 350. * 5.3 4.8 5.0 3.4 2.1 1.2 2.0 3.7 3.6 3.6 1.1 1.2 1.3 .4 .1 .9 2.0 3.8 3.0 2.4 360. * 3.7 3.6 3.8 2.3 1.2 .5 1.0 2.4 2.4 2.4 2.9 3.2 3.3 1.3 .7 1.6 3.3 5.6 4.7 4.3 ------*------------------------------------------------------------------------------------------------------------------------ MAX * 6.1 5.7 5.8 4.3 3.7 4.1 5.5 6.4 5.5 5.1 6.4 6.0 6.0 4.6 4.1 4.1 5.7 7.0 5.6 5.5 DEGR. * 340 270 210 340 300 230 210 190 190 200 150 160 30 150 130 40 20 10 10 20
THE HIGHEST CONCENTRATION OF 7.00 PPM OCCURRED AT RECEPTOR REC18.� PAGE 4 JOB: NorthI25EvansStation31stUS85PMPA RUN: NorthI25EvansStation31stUS85PMPA
DATE : 11/22/10 TIME : 9:51:19
RECEPTOR - LINK MATRIX FOR THE ANGLE PRODUCING THE MAXIMUM CONCENTRATION FOR EACH RECEPTOR
* CO/LINK (PPM) * ANGLE (DEGREES) * REC1 REC2 REC3 REC4 REC5 REC6 REC7 REC8 REC9 REC10 REC11 REC12 REC13 REC14 REC15 REC16 REC17 REC18REC19 REC20 LINK # * 340 270 210 340 300 230 210 190 190 200 150 160 30 150 130 40 20 10 10 20 -------*------------------------------------------------------------------------------------------------------------------------ 1 * 1.7 1.8 2.3 .0 .0 .4 1.0 1.9 1.5 .7 1.0 1.2 .0 .9 .7 .1 .0 .0 .0 .4 2 * .9 1.6 1.8 .0 .0 .2 .5 .7 .5 .3 .5 .5 .0 .2 .4 .0 .0 .0 .0 .1 3 * .9 .0 .0 1.4 .8 .5 .3 .7 1.1 1.8 .2 .0 1.1 .0 .0 .6 .9 1.0 .9 .8 4 * 1.4 .0 .0 1.1 .8 .3 .1 .0 .1 .4 2.3 1.6 2.8 .0 .0 .8 1.5 2.3 1.8 .9 5 * .5 .0 .0 .1 .5 .1 .0 .0 .0 .1 1.2 .2 1.8 .0 .0 .3 .5 .7 .5 .3 6 * .1 1.0 1.3 .0 .0 .4 .9 1.1 1.1 .9 .5 1.5 .0 1.5 1.0 .3 .2 .9 1.3 2.1 7 * .0 .3 .4 .0 .0 .1 .2 .2 .2 .1 .1 .3 .0 .2 .2 .0 .0 .0 .0 .1 8 * .2 .0 .0 .1 .2 .0 .0 .0 .0 .1 .1 .0 .3 .0 .0 .1 .1 .2 .1 .1 9 * .1 .0 .0 .3 .3 .8 .7 .6 .4 .2 .1 .0 .0 .0 .0 .1 .0 .0 .0 .1 10 * .1 .0 .0 .6 .5 .6 1.2 .9 .4 .1 .0 .0 .0 .0 .0 .1 .0 .0 .0 .1 11 * .1 .4 .0 .0 .0 .3 .1 .0 .0 .1 .3 .5 .0 .8 .8 .4 .5 .5 .3 .2 12 * .0 .2 .0 .0 .0 .1 .1 .0 .0 .1 .0 .1 .0 .2 .2 .4 .4 .3 .2 .1 13 * .0 .3 .0 .0 .0 .1 .0 .0 .0 .1 .0 .1 .0 .5 .6 .6 1.3 .9
Page 3

evanpav2.out .4 .1 14 * .1 .0 .0 .4 .4 .1 .2 .2 .1 .1 .1 .0 .0 .0 .0 .1 .0 .0 .0 .1 15 * .0 .1 .0 .0 .0 .0 .0 .0 .0 .0 .0 .0 .0 .3 .2 .2 .3 .2 .1 .0 16 * .0 .0 .0 .3 .2 .1 .2 .1 .1 .0 .0 .0 .0 .0 .0 .0 .0 .0 .0 .0
Page 4

harmpmnb.in'I25HarmonywithPkgStationNoBuild', 60 , 175 , 0 , 0 , 56 , 0.3048 , 1 , 1 'Receptor 1', 978 , 53 , 5 'Receptor 2', 1018 , 53 , 5 'Receptor 3', 1058 , 53 , 5 'Receptor 4', 1098 , 53 , 5 'Receptor 5', 1098 , 13 , 5 'Receptor 6', 1098 ,-27 , 5 'Receptor 7', 1098 ,-67 , 5 'Receptor 8', 1175 ,-67 , 5 'Receptor 9', 1175 ,-27 , 5 'Receptor 10', 1175 , 13 , 5 'Receptor 11', 1175 , 53 , 5 'Receptor 12', 1215 , 53 , 5 'Receptor 13', 1255 , 53 , 5 'Receptor 14', 1295 , 53 , 5 'Receptor 15', 1582 , 53 , 5 'Receptor 16', 1622 , 53 , 5 'Receptor 17', 1662 , 53 , 5 'Receptor 18', 1702 , 53 , 5 'Receptor 19', 1702 , 13 , 5 'Receptor 20', 1702 ,-27 , 5 'Receptor 21', 1702 ,-67 , 5 'Receptor 22', 1778 ,-67 , 5 'Receptor 23', 1778 ,-27 , 5 'Receptor 24', 1778 , 13 , 5 'Receptor 25', 1778 , 53 , 5 'Receptor 26', 1818 , 53 , 5 'Receptor 27', 1858 , 53 , 5 'Receptor 28', 1898 , 53 , 5 'Receptor 29', 1904 , 196 , 5 'Receptor 30', 1864 , 196 , 5 'Receptor 31', 1824 , 196 , 5 'Receptor 32', 1784 , 196 , 5 'Receptor 33', 1784 , 236 , 5 'Receptor 34', 1784 , 276 , 5 'Receptor 35', 1784 , 316 , 5 'Receptor 36', 1708 , 307 , 5 'Receptor 37', 1708 , 267 , 5 'Receptor 38', 1708 , 227 , 5 'Receptor 39', 1708 , 187 , 5 'Receptor 40', 1668 , 187 , 5 'Receptor 41', 1628 , 187 , 5 'Receptor 42', 1588 , 187 , 5 'Receptor 43', 1295 , 187 , 5 'Receptor 44', 1255 , 187 , 5 'Receptor 45', 1215 , 187 , 5 'Receptor 46', 1175 , 187 , 5 'Receptor 47', 1175 , 227 , 5 'Receptor 48', 1175 , 267 , 5 'Receptor 49', 1175 , 307 , 5 'Receptor 50', 1087 , 307 , 5 'Receptor 51', 1087 , 267 , 5 'Receptor 52', 1087 , 227 , 5 'Receptor 53', 1087 , 187 , 5 'Receptor 54', 1047 , 187 , 5 'Receptor 55', 1007 , 187 , 5 'Receptor 56', 967 , 187 , 5 'I25HarmonywithPkgStationNoBuild', 24 , 1 , 1 ,'CO' 1 'harmebapp1','AG', 240 , 91 , 1140 , 91 , 3425 , 48.8 , 0 , 56 2 'harmebapp1 q','AG', 1097 , 91 , 240 , 91 , 0 , 36 , 3 100 , 32 , 2 , 3320 , 143.34 , 1600 , 1 , 3 2 'harmebltturn','AG', 1097 , 109 , 897 , 109 , 0 , 12 , 1 100 , 32 , 2 , 35 , 143.34 , 1600 , 1 , 3 1 'harmebdep/app','AG', 1131 , 91 , 1740 , 91 , 3545 , 48.8 , 0 , 56 2 'harmebdep/app q','AG', 1718 , 91 , 1165 , 91 , 0 , 36 , 3 100 , 43 , 2 , 2155 , 143.34 , 1600 , 1 , 3 1 'harmebdep','AG', 1740 , 85 , 2240 , 85 , 2640 , 48.8 , 0 , 44 1 'harmwbapp1','AG', 2240 , 143 , 1740 , 143 , 3125 , 48.8 , 0 , 44 2 'harmwbque1','AG', 1774 , 143 , 2240 , 143 , 0 , 24 , 2 100 , 43 , 2 , 2805 , 143.34 , 1600 , 1 , 3 2 'harmwbltturn','AG', 1774 , 125 , 1970 , 125 , 0 , 12 , 1 100 , 89 , 2 , 320 , 143.34 , 1600 , 1 , 3
Page 1

harmpmnb.in 1 'harmwbdep/app','AG', 1740 , 149 , 1131 , 149 , 3910 , 48.8 , 0 , 56 2 'harmwbdep/app q','AG', 1165 , 149 , 1718 , 149 , 0 , 36 , 3 100 , 23 , 2 , 3780 , 143.34 , 1600 , 1 , 3 2 'harmwbltturn2','AG', 1165 , 131 , 1465 , 131 , 0 , 12 , 1 100 , 93 , 2 , 85 , 143.34 , 1600 , 1 , 3 1 'harmwbdep','AG', 1131 , 149 , 240 , 149 , 3845 , 48.8 , 0 , 56 1 'pkgsbapp','AG', 1113 , 1124 , 1113 , 124 , 30 , 22.5 , 0 , 32 2 'pkgsbapp q','AG', 1113 , 177 , 1113 , 1124 , 0 , 12 , 1 100 , 81 , 2 , 5 , 143.34 , 1600 , 1 , 3 1 'pkgsbdep','AG', 1125 , 124 , 1125 ,-376 , 160 , 22.5 , 0 , 32 2 'pkgsbleftturn','AG', 1125 , 177 , 1125 , 377 , 0 , 12 , 1 100 , 81 , 2 , 15 , 143.34 , 1600 , 1 , 3 1 'i25sbrampdep','AG', 1740 , 124 , 1740 ,-876 , 1710 , 22.5 , 0 , 44 1 'pkgnbapp','AG', 1149 ,-376 , 1149 , 124 , 285 , 23 , 0 , 32 2 'pkgnbapp q','AG', 1149 , 63 , 1149 ,-376 , 0 , 12 , 1 100 , 81 , 2 , 20 , 143.34 , 1600 , 1 , 3 1 'pkgnbdep','AG', 1149 , 124 , 1149 , 1124 , 100 , 23 , 0 , 32 2 'pkgnbleftturn','AG', 1137 , 63 , 1137 ,-37 , 0 , 12 , 1 100 , 81 , 2 , 55 , 143.34 , 1600 , 1 , 3 1 'i25sbrampapp','AG', 1740 , 1124 , 1740 , 124 , 1590 , 22.8 , 0 , 44 2 'i25sbrampleftturn','AG', 1758 , 177 , 1758 , 377 , 0 , 12 , 1 100 , 74 , 2 , 485 , 143.34 , 1600 , 1 , 3 1 , 0 , 4 , 1000 , 0 ,'Y', 10 , 0 , 36
Page 2

harmnbv2.out� CAL3QHC: LINE SOURCE DISPERSION MODEL - VERSION 2.0 Dated 95221 PAGE 1
JOB: I25HarmonywithPkgStationNoBuild RUN: I25HarmonywithPkgStationNoBuild
DATE : 11/22/10 TIME : 11:28:16
The MODE flag has been set to C for calculating CO averages.
SITE & METEOROLOGICAL VARIABLES ------------------------------- VS = .0 CM/S VD = .0 CM/S Z0 = 175. CM U = 1.0 M/S CLAS = 4 (D) ATIM = 60. MINUTES MIXH = 1000. M AMB = .0 PPM
LINK VARIABLES -------------- LINK DESCRIPTION * LINK COORDINATES (FT) * LENGTH BRG TYPE VPH EF H W V/C QUEUE * X1 Y1 X2 Y2 * (FT) (DEG) (G/MI) (FT) (FT) (VEH) ------------------------*----------------------------------------*---------------------------------------------------------- 1. harmebapp1 * 240.0 91.0 1140.0 91.0 * 900. 90. AG 3425. 48.8 .0 56.0 2. harmebapp1 q * 1097.0 91.0 -72.5 90.7 * 1169. 270. AG 369. 100.0 .0 36.0 1.08 59.4 3. harmebltturn * 1097.0 109.0 1090.9 109.0 * 6. 270. AG 123. 100.0 .0 12.0 .03 .3 4. harmebdep/app * 1131.0 91.0 1740.0 91.0 * 609. 90. AG 3545. 48.8 .0 56.0 5. harmebdep/app q * 1718.0 91.0 1535.5 91.0 * 182. 270. AG 496. 100.0 .0 36.0 .85 9.3 6. harmebdep * 1740.0 85.0 2240.0 85.0 * 500. 90. AG 2640. 48.8 .0 44.0 7. harmwbapp1 * 2240.0 143.0 1740.0 143.0 * 500. 270. AG 3125. 48.8 .0 44.0 8. harmwbque1 * 1774.0 143.0 7791.3 143.0 * 6017. 90. AG 331. 100.0 .0 24.0 1.65 305.7 9. harmwbltturn * 1774.0 125.0 4124.8 125.0 * 2351. 90. AG 342. 100.0 .0 12.0 2.86 119.4 10. harmwbdep/app * 1740.0 149.0 1131.0 149.0 * 609. 270. AG 3910. 48.8 .0 56.0 11. harmwbdep/app q * 1165.0 149.0 2409.4 149.0 * 1244. 90. AG 265. 100.0 .0 36.0 1.08 63.2 12. harmwbltturn2 * 1165.0 131.0 1632.5 131.0 * 467. 90. AG 358. 100.0 .0 12.0 1.77 23.7 13. harmwbdep * 1131.0 149.0 240.0 149.0 * 891. 270. AG 3845. 48.8 .0 56.0 14. pkgsbapp * 1113.0 1124.0 1113.0 124.0 * 1000. 180. AG 30. 22.5 .0 32.0 15. pkgsbapp q * 1113.0 177.0 1113.0 179.2 * 2. 360. AG 311. 100.0 .0 12.0 .02 .1 16. pkgsbdep * 1125.0 124.0 1125.0 -376.0 * 500. 180. AG 160. 22.5 .0 32.0 17. pkgsbleftturn * 1125.0 177.0 1125.0 183.6 * 7. 360. AG 311. 100.0 .0 12.0 .06 .3 18. i25sbrampdep * 1740.0 124.0 1740.0 -876.0 * 1000. 180. AG 1710. 22.5 .0 44.0 19. pkgnbapp * 1149.0 -376.0 1149.0 124.0 * 500. 360. AG 285. 23.0 .0 32.0 20. pkgnbapp q * 1149.0 63.0 1149.0 54.1 * 9. 180. AG 311. 100.0 .0 12.0 .08 .5 21. pkgnbdep * 1149.0 124.0 1149.0 1124.0 * 1000. 360. AG 100. 23.0 .0 32.0 22. pkgnbleftturn * 1137.0 63.0 1137.0 38.6 * 24. 180. AG 311. 100.0 .0 12.0 .23 1.2 23. i25sbrampapp * 1740.0 1124.0 1740.0 124.0 * 1000. 180. AG 1590. 22.8 .0 44.0 24. i25sbrampleftturn * 1758.0 177.0 1758.0 1808.3 * 1631. 360. AG 285. 100.0 .0 12.0 1.38 82.9� PAGE 2 JOB: I25HarmonywithPkgStationNoBuild RUN: I25HarmonywithPkgStationNoBuild
DATE : 11/22/10 TIME : 11:28:16
ADDITIONAL QUEUE LINK PARAMETERS -------------------------------- LINK DESCRIPTION * CYCLE RED CLEARANCE APPROACH SATURATION IDLE SIGNAL ARRIVAL * LENGTH TIME LOST TIME VOL FLOW RATE EM FAC TYPE RATE * (SEC) (SEC) (SEC) (VPH) (VPH) (gm/hr) ------------------------*-------------------------------------------------------------------------------- 2. harmebapp1 q * 100 32 2.0 3320 1600 143.34 1 3 3. harmebltturn * 100 32 2.0 35 1600 143.34 1 3 5. harmebdep/app q * 100 43 2.0 2155 1600 143.34 1 3 8. harmwbque1 * 100 43 2.0 2805 1600 143.34 1 3 9. harmwbltturn * 100 89 2.0 320 1600 143.34 1 3 11. harmwbdep/app q * 100 23 2.0 3780 1600 143.34 1 3 12. harmwbltturn2 * 100 93 2.0 85 1600 143.34 1 3 15. pkgsbapp q * 100 81 2.0 5 1600 143.34 1 3 17. pkgsbleftturn * 100 81 2.0 15 1600 143.34 1 3
Page 1

harmnbv2.out 20. pkgnbapp q * 100 81 2.0 20 1600 143.34 1 3 22. pkgnbleftturn * 100 81 2.0 55 1600 143.34 1 3 24. i25sbrampleftturn * 100 74 2.0 485 1600 143.34 1 3
RECEPTOR LOCATIONS ------------------ * COORDINATES (FT) * RECEPTOR * X Y Z * -------------------------*-------------------------------------* 1. Receptor 1 * 978.0 53.0 5.0 * 2. Receptor 2 * 1018.0 53.0 5.0 * 3. Receptor 3 * 1058.0 53.0 5.0 * 4. Receptor 4 * 1098.0 53.0 5.0 * 5. Receptor 5 * 1098.0 13.0 5.0 * 6. Receptor 6 * 1098.0 -27.0 5.0 * 7. Receptor 7 * 1098.0 -67.0 5.0 * 8. Receptor 8 * 1175.0 -67.0 5.0 * 9. Receptor 9 * 1175.0 -27.0 5.0 * 10. Receptor 10 * 1175.0 13.0 5.0 * 11. Receptor 11 * 1175.0 53.0 5.0 * 12. Receptor 12 * 1215.0 53.0 5.0 * 13. Receptor 13 * 1255.0 53.0 5.0 * 14. Receptor 14 * 1295.0 53.0 5.0 * 15. Receptor 15 * 1582.0 53.0 5.0 * 16. Receptor 16 * 1622.0 53.0 5.0 * 17. Receptor 17 * 1662.0 53.0 5.0 * 18. Receptor 18 * 1702.0 53.0 5.0 * 19. Receptor 19 * 1702.0 13.0 5.0 * 20. Receptor 20 * 1702.0 -27.0 5.0 * 21. Receptor 21 * 1702.0 -67.0 5.0 * 22. Receptor 22 * 1778.0 -67.0 5.0 * 23. Receptor 23 * 1778.0 -27.0 5.0 * 24. Receptor 24 * 1778.0 13.0 5.0 * 25. Receptor 25 * 1778.0 53.0 5.0 * 26. Receptor 26 * 1818.0 53.0 5.0 * 27. Receptor 27 * 1858.0 53.0 5.0 * 28. Receptor 28 * 1898.0 53.0 5.0 * 29. Receptor 29 * 1904.0 196.0 5.0 * 30. Receptor 30 * 1864.0 196.0 5.0 * 31. Receptor 31 * 1824.0 196.0 5.0 * 32. Receptor 32 * 1784.0 196.0 5.0 * 33. Receptor 33 * 1784.0 236.0 5.0 *� PAGE 3 JOB: I25HarmonywithPkgStationNoBuild RUN: I25HarmonywithPkgStationNoBuild
DATE : 11/22/10 TIME : 11:28:16
RECEPTOR LOCATIONS ------------------ * COORDINATES (FT) * RECEPTOR * X Y Z * -------------------------*-------------------------------------* 34. Receptor 34 * 1784.0 276.0 5.0 * 35. Receptor 35 * 1784.0 316.0 5.0 * 36. Receptor 36 * 1708.0 307.0 5.0 * 37. Receptor 37 * 1708.0 267.0 5.0 * 38. Receptor 38 * 1708.0 227.0 5.0 * 39. Receptor 39 * 1708.0 187.0 5.0 * 40. Receptor 40 * 1668.0 187.0 5.0 * 41. Receptor 41 * 1628.0 187.0 5.0 * 42. Receptor 42 * 1588.0 187.0 5.0 * 43. Receptor 43 * 1295.0 187.0 5.0 * 44. Receptor 44 * 1255.0 187.0 5.0 * 45. Receptor 45 * 1215.0 187.0 5.0 * 46. Receptor 46 * 1175.0 187.0 5.0 * 47. Receptor 47 * 1175.0 227.0 5.0 * 48. Receptor 48 * 1175.0 267.0 5.0 * 49. Receptor 49 * 1175.0 307.0 5.0 * 50. Receptor 50 * 1087.0 307.0 5.0 * 51. Receptor 51 * 1087.0 267.0 5.0 * 52. Receptor 52 * 1087.0 227.0 5.0 * 53. Receptor 53 * 1087.0 187.0 5.0 * 54. Receptor 54 * 1047.0 187.0 5.0 * 55. Receptor 55 * 1007.0 187.0 5.0 * 56. Receptor 56 * 967.0 187.0 5.0 *� PAGE 4 JOB: I25HarmonywithPkgStationNoBuild RUN: I25HarmonywithPkgStationNoBuild
Page 2
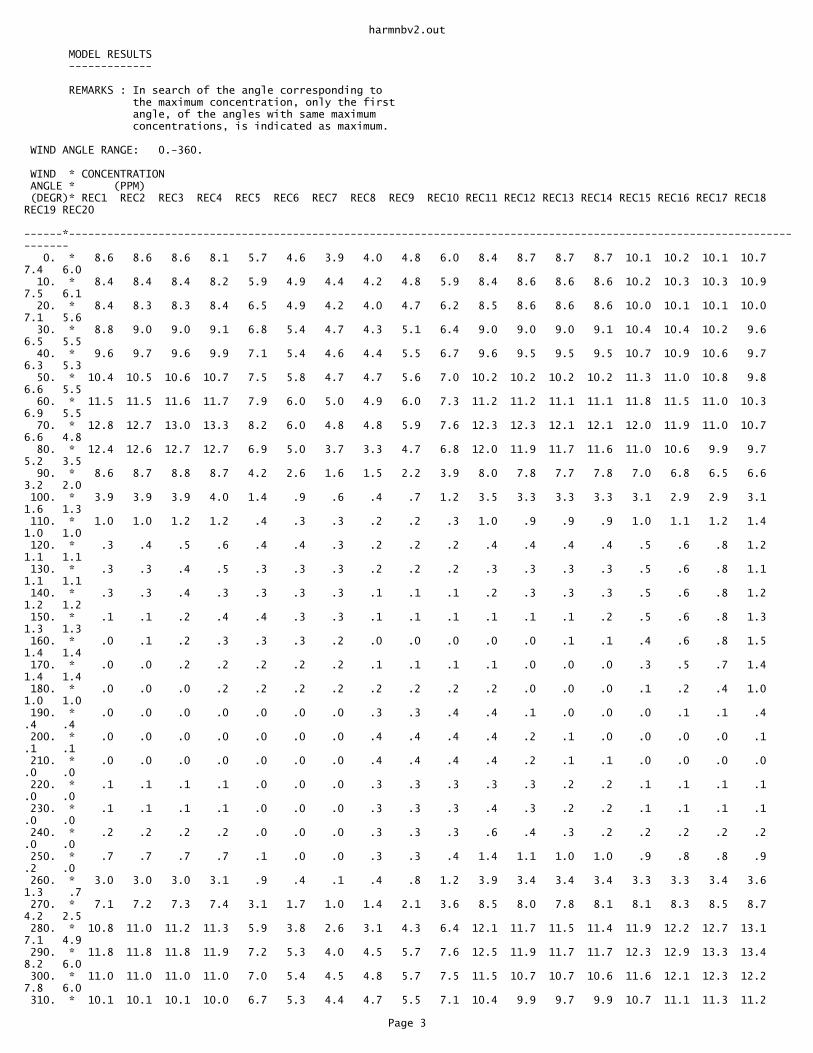
harmnbv2.out
MODEL RESULTS -------------
REMARKS : In search of the angle corresponding to the maximum concentration, only the first angle, of the angles with same maximum concentrations, is indicated as maximum.
WIND ANGLE RANGE: 0.-360.
WIND * CONCENTRATION ANGLE * (PPM) (DEGR)* REC1 REC2 REC3 REC4 REC5 REC6 REC7 REC8 REC9 REC10 REC11 REC12 REC13 REC14 REC15 REC16 REC17 REC18 REC19 REC20 ------*------------------------------------------------------------------------------------------------------------------------ 0. * 8.6 8.6 8.6 8.1 5.7 4.6 3.9 4.0 4.8 6.0 8.4 8.7 8.7 8.7 10.1 10.2 10.1 10.7 7.4 6.0 10. * 8.4 8.4 8.4 8.2 5.9 4.9 4.4 4.2 4.8 5.9 8.4 8.6 8.6 8.6 10.2 10.3 10.3 10.9 7.5 6.1 20. * 8.4 8.3 8.3 8.4 6.5 4.9 4.2 4.0 4.7 6.2 8.5 8.6 8.6 8.6 10.0 10.1 10.1 10.0 7.1 5.6 30. * 8.8 9.0 9.0 9.1 6.8 5.4 4.7 4.3 5.1 6.4 9.0 9.0 9.0 9.1 10.4 10.4 10.2 9.6 6.5 5.5 40. * 9.6 9.7 9.6 9.9 7.1 5.4 4.6 4.4 5.5 6.7 9.6 9.5 9.5 9.5 10.7 10.9 10.6 9.7 6.3 5.3 50. * 10.4 10.5 10.6 10.7 7.5 5.8 4.7 4.7 5.6 7.0 10.2 10.2 10.2 10.2 11.3 11.0 10.8 9.8 6.6 5.5 60. * 11.5 11.5 11.6 11.7 7.9 6.0 5.0 4.9 6.0 7.3 11.2 11.2 11.1 11.1 11.8 11.5 11.0 10.3 6.9 5.5 70. * 12.8 12.7 13.0 13.3 8.2 6.0 4.8 4.8 5.9 7.6 12.3 12.3 12.1 12.1 12.0 11.9 11.0 10.7 6.6 4.8 80. * 12.4 12.6 12.7 12.7 6.9 5.0 3.7 3.3 4.7 6.8 12.0 11.9 11.7 11.6 11.0 10.6 9.9 9.7 5.2 3.5 90. * 8.6 8.7 8.8 8.7 4.2 2.6 1.6 1.5 2.2 3.9 8.0 7.8 7.7 7.8 7.0 6.8 6.5 6.6 3.2 2.0 100. * 3.9 3.9 3.9 4.0 1.4 .9 .6 .4 .7 1.2 3.5 3.3 3.3 3.3 3.1 2.9 2.9 3.1 1.6 1.3 110. * 1.0 1.0 1.2 1.2 .4 .3 .3 .2 .2 .3 1.0 .9 .9 .9 1.0 1.1 1.2 1.4 1.0 1.0 120. * .3 .4 .5 .6 .4 .4 .3 .2 .2 .2 .4 .4 .4 .4 .5 .6 .8 1.2 1.1 1.1 130. * .3 .3 .4 .5 .3 .3 .3 .2 .2 .2 .3 .3 .3 .3 .5 .6 .8 1.1 1.1 1.1 140. * .3 .3 .4 .3 .3 .3 .3 .1 .1 .1 .2 .3 .3 .3 .5 .6 .8 1.2 1.2 1.2 150. * .1 .1 .2 .4 .4 .3 .3 .1 .1 .1 .1 .1 .1 .2 .5 .6 .8 1.3 1.3 1.3 160. * .0 .1 .2 .3 .3 .3 .2 .0 .0 .0 .0 .0 .1 .1 .4 .6 .8 1.5 1.4 1.4 170. * .0 .0 .2 .2 .2 .2 .2 .1 .1 .1 .1 .0 .0 .0 .3 .5 .7 1.4 1.4 1.4 180. * .0 .0 .0 .2 .2 .2 .2 .2 .2 .2 .2 .0 .0 .0 .1 .2 .4 1.0 1.0 1.0 190. * .0 .0 .0 .0 .0 .0 .0 .3 .3 .4 .4 .1 .0 .0 .0 .1 .1 .4 .4 .4 200. * .0 .0 .0 .0 .0 .0 .0 .4 .4 .4 .4 .2 .1 .0 .0 .0 .0 .1 .1 .1 210. * .0 .0 .0 .0 .0 .0 .0 .4 .4 .4 .4 .2 .1 .1 .0 .0 .0 .0 .0 .0 220. * .1 .1 .1 .1 .0 .0 .0 .3 .3 .3 .3 .3 .2 .2 .1 .1 .1 .1 .0 .0 230. * .1 .1 .1 .1 .0 .0 .0 .3 .3 .3 .4 .3 .2 .2 .1 .1 .1 .1 .0 .0 240. * .2 .2 .2 .2 .0 .0 .0 .3 .3 .3 .6 .4 .3 .2 .2 .2 .2 .2 .0 .0 250. * .7 .7 .7 .7 .1 .0 .0 .3 .3 .4 1.4 1.1 1.0 1.0 .9 .8 .8 .9 .2 .0 260. * 3.0 3.0 3.0 3.1 .9 .4 .1 .4 .8 1.2 3.9 3.4 3.4 3.4 3.3 3.3 3.4 3.6 1.3 .7 270. * 7.1 7.2 7.3 7.4 3.1 1.7 1.0 1.4 2.1 3.6 8.5 8.0 7.8 8.1 8.1 8.3 8.5 8.7 4.2 2.5 280. * 10.8 11.0 11.2 11.3 5.9 3.8 2.6 3.1 4.3 6.4 12.1 11.7 11.5 11.4 11.9 12.2 12.7 13.1 7.1 4.9 290. * 11.8 11.8 11.8 11.9 7.2 5.3 4.0 4.5 5.7 7.6 12.5 11.9 11.7 11.7 12.3 12.9 13.3 13.4 8.2 6.0 300. * 11.0 11.0 11.0 11.0 7.0 5.4 4.5 4.8 5.7 7.5 11.5 10.7 10.7 10.6 11.6 12.1 12.3 12.2 7.8 6.0 310. * 10.1 10.1 10.1 10.0 6.7 5.3 4.4 4.7 5.5 7.1 10.4 9.9 9.7 9.9 10.7 11.1 11.3 11.2
Page 3

harmnbv2.out7.5 5.7 320. * 9.2 9.2 9.2 9.3 6.1 4.9 4.1 4.3 5.3 6.7 9.5 9.1 9.2 9.1 10.2 10.5 10.5 10.3 7.1 5.7 330. * 8.8 8.8 8.8 8.7 6.0 4.7 4.0 4.3 5.0 6.5 8.8 8.5 8.7 8.9 10.0 10.1 10.0 9.8 6.8 5.4 340. * 8.3 8.3 8.3 8.3 5.8 4.4 3.7 3.9 4.9 6.2 8.6 8.3 8.3 8.4 9.6 9.6 9.4 9.4 6.7 5.0 350. * 8.5 8.5 8.5 8.2 5.7 4.5 3.8 4.1 5.0 6.3 8.4 8.3 8.5 8.5 9.8 9.8 9.7 9.9 7.0 5.4 360. * 8.6 8.6 8.6 8.1 5.7 4.6 3.9 4.0 4.8 6.0 8.4 8.7 8.7 8.7 10.1 10.2 10.1 10.7 7.4 6.0 ------*------------------------------------------------------------------------------------------------------------------------ MAX * 12.8 12.7 13.0 13.3 8.2 6.0 5.0 4.9 6.0 7.6 12.5 12.3 12.1 12.1 12.3 12.9 13.3 13.4 8.2 6.1 DEGR. * 70 70 70 70 70 60 60 60 60 70 290 70 70 70 290 290 290 290 290 10
� PAGE 5 JOB: I25HarmonywithPkgStationNoBuild RUN: I25HarmonywithPkgStationNoBuild
MODEL RESULTS -------------
REMARKS : In search of the angle corresponding to the maximum concentration, only the first angle, of the angles with same maximum concentrations, is indicated as maximum.
WIND ANGLE RANGE: 0.-360.
WIND * CONCENTRATION ANGLE * (PPM) (DEGR)* REC21 REC22 REC23 REC24 REC25 REC26 REC27 REC28 REC29 REC30 REC31 REC32 REC33 REC34 REC35 REC36 REC37 REC38 REC39 REC40 ------*------------------------------------------------------------------------------------------------------------------------ 0. * 5.2 4.6 5.0 6.2 8.5 8.0 7.7 7.5 .2 .4 .7 1.5 1.5 1.5 1.5 1.5 1.5 1.5 1.6 .6 10. * 5.2 4.0 4.4 5.7 7.7 7.4 7.4 7.2 .0 .1 .2 .6 .6 .6 .6 2.2 2.2 2.2 2.2 1.1 20. * 4.8 3.3 3.9 5.1 7.3 7.1 7.1 7.1 .0 .0 .0 .2 .2 .2 .2 2.2 2.2 2.2 2.2 1.2 30. * 4.7 3.3 3.9 5.0 7.4 7.3 7.3 7.3 .0 .0 .0 .0 .0 .0 .0 1.9 1.9 1.9 1.9 1.2 40. * 4.6 3.4 4.3 5.2 7.7 7.7 7.7 7.7 .0 .0 .0 .0 .0 .0 .0 1.8 1.8 1.8 1.8 1.1 50. * 4.7 3.5 4.4 5.6 8.4 8.4 8.4 8.4 .0 .0 .0 .0 .0 .0 .0 1.6 1.6 1.6 1.6 1.1 60. * 4.6 3.3 4.3 5.8 9.1 9.0 9.0 8.8 .0 .0 .0 .0 .0 .0 .0 1.5 1.5 1.5 1.5 1.0 70. * 3.8 2.4 3.5 5.4 9.4 9.3 9.0 8.8 .1 .1 .1 .1 .0 .0 .0 1.4 1.4 1.4 1.8 1.5 80. * 2.6 1.4 2.2 3.8 8.3 8.0 7.8 7.4 1.0 1.0 1.2 1.4 .4 .2 .1 1.5 1.7 2.1 3.3 3.1 90. * 1.6 .4 1.0 2.0 5.1 4.9 4.7 4.5 3.2 3.4 3.6 3.8 1.8 .8 .5 2.3 2.7 3.7 6.8 7.0 100. * 1.1 .1 .3 .5 2.0 1.9 1.8 1.7 5.6 5.9 6.3 6.5 3.5 2.0 1.3 3.1 4.0 5.5 9.8 10.5 110. * 1.0 .0 .0 .0 .5 .5 .4 .4 7.1 7.3 7.5 7.7 4.9 3.1 2.2 4.2 5.4 7.0 11.1 11.4 120. * 1.1 .0 .0 .0 .1 .1 .1 .1 7.5 7.7 7.8 7.8 5.4 3.9 3.1 4.9 5.9 7.3 10.7 11.1 130. * 1.1 .0 .0 .0 .0 .0 .0 .0 7.4 7.5 7.5 7.5 5.2 4.2 3.4 5.2 6.1 7.1 10.3 10.6 140. * 1.2 .0 .0 .0 .0 .0 .0 .0 6.9 6.9 6.9 6.9 4.9 4.0 3.4 5.2 5.6 6.7 9.8 10.0 150. * 1.3 .0 .0 .0 .0 .0 .0 .0 6.7 6.7 6.7 6.7 4.8 3.8 3.3 5.2 5.7 6.7 9.8 10.0 160. * 1.4 .1 .1 .1 .1 .0 .0 .0 6.5 6.5 6.5 6.5 4.7 3.7 3.2 5.2 5.6 6.9 10.1 9.7 170. * 1.4 .4 .4 .4 .4 .1 .1 .0 6.6 6.7 6.7 6.8 4.9 4.2 3.7 5.4 6.1 7.4 10.6 10.0 180. * .9 .9 1.0 1.0 1.0 .4 .2 .1 6.7 6.8 7.0 7.1 5.5 4.7 4.4 5.1 6.0 7.4 10.3 10.0 190. * .4 1.4 1.4 1.4 1.4 .7 .5 .3 6.9 7.1 7.3 7.5 6.1 5.5 5.0 4.7 5.6 6.8 9.8 9.5 200. * .1 1.4 1.4 1.4 1.5 .8 .6 .4 7.1 7.3 7.3 7.6 6.5 5.8 5.1 4.2 5.2 6.5
Page 4
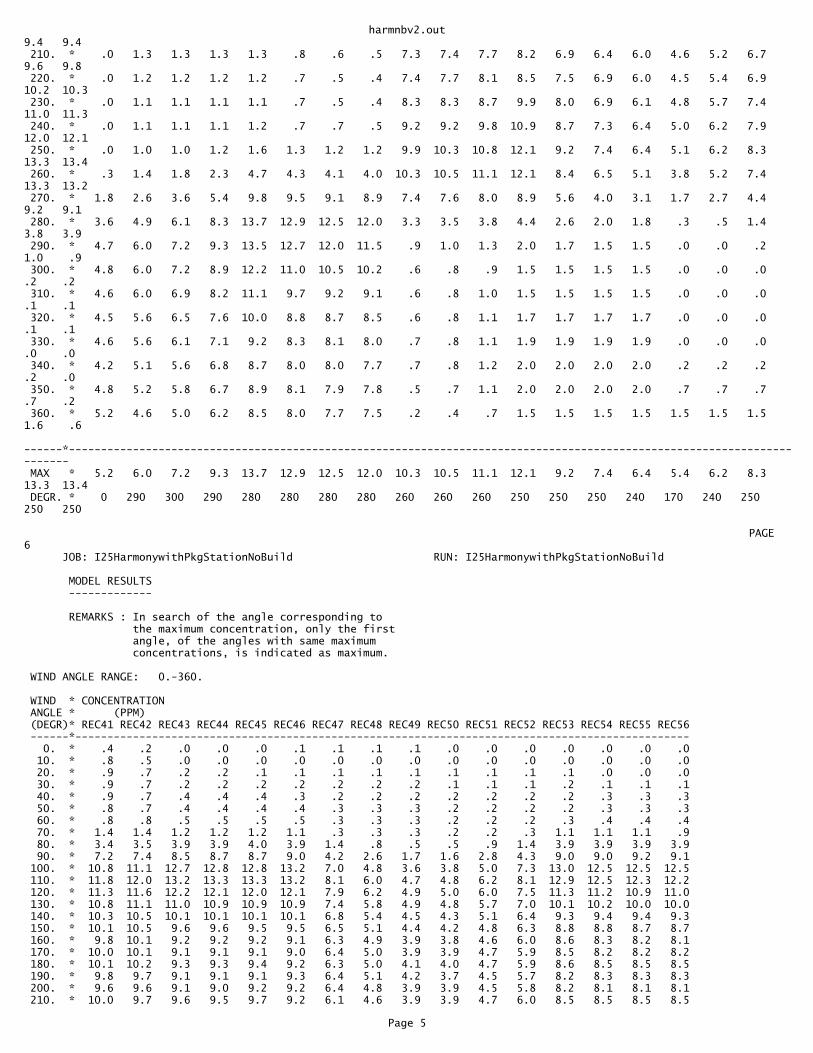
harmnbv2.out9.4 9.4 210. * .0 1.3 1.3 1.3 1.3 .8 .6 .5 7.3 7.4 7.7 8.2 6.9 6.4 6.0 4.6 5.2 6.7 9.6 9.8 220. * .0 1.2 1.2 1.2 1.2 .7 .5 .4 7.4 7.7 8.1 8.5 7.5 6.9 6.0 4.5 5.4 6.9 10.2 10.3 230. * .0 1.1 1.1 1.1 1.1 .7 .5 .4 8.3 8.3 8.7 9.9 8.0 6.9 6.1 4.8 5.7 7.4 11.0 11.3 240. * .0 1.1 1.1 1.1 1.2 .7 .7 .5 9.2 9.2 9.8 10.9 8.7 7.3 6.4 5.0 6.2 7.9 12.0 12.1 250. * .0 1.0 1.0 1.2 1.6 1.3 1.2 1.2 9.9 10.3 10.8 12.1 9.2 7.4 6.4 5.1 6.2 8.3 13.3 13.4 260. * .3 1.4 1.8 2.3 4.7 4.3 4.1 4.0 10.3 10.5 11.1 12.1 8.4 6.5 5.1 3.8 5.2 7.4 13.3 13.2 270. * 1.8 2.6 3.6 5.4 9.8 9.5 9.1 8.9 7.4 7.6 8.0 8.9 5.6 4.0 3.1 1.7 2.7 4.4 9.2 9.1 280. * 3.6 4.9 6.1 8.3 13.7 12.9 12.5 12.0 3.3 3.5 3.8 4.4 2.6 2.0 1.8 .3 .5 1.4 3.8 3.9 290. * 4.7 6.0 7.2 9.3 13.5 12.7 12.0 11.5 .9 1.0 1.3 2.0 1.7 1.5 1.5 .0 .0 .2 1.0 .9 300. * 4.8 6.0 7.2 8.9 12.2 11.0 10.5 10.2 .6 .8 .9 1.5 1.5 1.5 1.5 .0 .0 .0 .2 .2 310. * 4.6 6.0 6.9 8.2 11.1 9.7 9.2 9.1 .6 .8 1.0 1.5 1.5 1.5 1.5 .0 .0 .0 .1 .1 320. * 4.5 5.6 6.5 7.6 10.0 8.8 8.7 8.5 .6 .8 1.1 1.7 1.7 1.7 1.7 .0 .0 .0 .1 .1 330. * 4.6 5.6 6.1 7.1 9.2 8.3 8.1 8.0 .7 .8 1.1 1.9 1.9 1.9 1.9 .0 .0 .0 .0 .0 340. * 4.2 5.1 5.6 6.8 8.7 8.0 8.0 7.7 .7 .8 1.2 2.0 2.0 2.0 2.0 .2 .2 .2 .2 .0 350. * 4.8 5.2 5.8 6.7 8.9 8.1 7.9 7.8 .5 .7 1.1 2.0 2.0 2.0 2.0 .7 .7 .7 .7 .2 360. * 5.2 4.6 5.0 6.2 8.5 8.0 7.7 7.5 .2 .4 .7 1.5 1.5 1.5 1.5 1.5 1.5 1.5 1.6 .6 ------*------------------------------------------------------------------------------------------------------------------------ MAX * 5.2 6.0 7.2 9.3 13.7 12.9 12.5 12.0 10.3 10.5 11.1 12.1 9.2 7.4 6.4 5.4 6.2 8.3 13.3 13.4 DEGR. * 0 290 300 290 280 280 280 280 260 260 260 250 250 250 240 170 240 250 250 250
� PAGE 6 JOB: I25HarmonywithPkgStationNoBuild RUN: I25HarmonywithPkgStationNoBuild
MODEL RESULTS -------------
REMARKS : In search of the angle corresponding to the maximum concentration, only the first angle, of the angles with same maximum concentrations, is indicated as maximum.
WIND ANGLE RANGE: 0.-360.
WIND * CONCENTRATION ANGLE * (PPM) (DEGR)* REC41 REC42 REC43 REC44 REC45 REC46 REC47 REC48 REC49 REC50 REC51 REC52 REC53 REC54 REC55 REC56 ------*------------------------------------------------------------------------------------------------ 0. * .4 .2 .0 .0 .0 .1 .1 .1 .1 .0 .0 .0 .0 .0 .0 .0 10. * .8 .5 .0 .0 .0 .0 .0 .0 .0 .0 .0 .0 .0 .0 .0 .0 20. * .9 .7 .2 .2 .1 .1 .1 .1 .1 .1 .1 .1 .1 .0 .0 .0 30. * .9 .7 .2 .2 .2 .2 .2 .2 .2 .1 .1 .1 .2 .1 .1 .1 40. * .9 .7 .4 .4 .4 .3 .2 .2 .2 .2 .2 .2 .2 .3 .3 .3 50. * .8 .7 .4 .4 .4 .4 .3 .3 .3 .2 .2 .2 .2 .3 .3 .3 60. * .8 .8 .5 .5 .5 .5 .3 .3 .3 .2 .2 .2 .3 .4 .4 .4 70. * 1.4 1.4 1.2 1.2 1.2 1.1 .3 .3 .3 .2 .2 .3 1.1 1.1 1.1 .9 80. * 3.4 3.5 3.9 3.9 4.0 3.9 1.4 .8 .5 .5 .9 1.4 3.9 3.9 3.9 3.9 90. * 7.2 7.4 8.5 8.7 8.7 9.0 4.2 2.6 1.7 1.6 2.8 4.3 9.0 9.0 9.2 9.1 100. * 10.8 11.1 12.7 12.8 12.8 13.2 7.0 4.8 3.6 3.8 5.0 7.3 13.0 12.5 12.5 12.5 110. * 11.8 12.0 13.2 13.3 13.3 13.2 8.1 6.0 4.7 4.8 6.2 8.1 12.9 12.5 12.3 12.2 120. * 11.3 11.6 12.2 12.1 12.0 12.1 7.9 6.2 4.9 5.0 6.0 7.5 11.3 11.2 10.9 11.0 130. * 10.8 11.1 11.0 10.9 10.9 10.9 7.4 5.8 4.9 4.8 5.7 7.0 10.1 10.2 10.0 10.0 140. * 10.3 10.5 10.1 10.1 10.1 10.1 6.8 5.4 4.5 4.3 5.1 6.4 9.3 9.4 9.4 9.3 150. * 10.1 10.5 9.6 9.6 9.5 9.5 6.5 5.1 4.4 4.2 4.8 6.3 8.8 8.8 8.7 8.7 160. * 9.8 10.1 9.2 9.2 9.2 9.1 6.3 4.9 3.9 3.8 4.6 6.0 8.6 8.3 8.2 8.1 170. * 10.0 10.1 9.1 9.1 9.1 9.0 6.4 5.0 3.9 3.9 4.7 5.9 8.5 8.2 8.2 8.2 180. * 10.1 10.2 9.3 9.3 9.4 9.2 6.3 5.0 4.1 4.0 4.7 5.9 8.6 8.5 8.5 8.5 190. * 9.8 9.7 9.1 9.1 9.1 9.3 6.4 5.1 4.2 3.7 4.5 5.7 8.2 8.3 8.3 8.3 200. * 9.6 9.6 9.1 9.0 9.2 9.2 6.4 4.8 3.9 3.9 4.5 5.8 8.2 8.1 8.1 8.1 210. * 10.0 9.7 9.6 9.5 9.7 9.2 6.1 4.6 3.9 3.9 4.7 6.0 8.5 8.5 8.5 8.5
Page 5

harmnbv2.out 220. * 10.3 10.1 10.1 10.4 10.3 9.5 6.2 4.9 4.2 4.1 4.9 6.2 9.1 9.1 9.1 9.1 230. * 11.0 10.8 11.0 11.1 10.8 10.0 6.6 5.3 4.4 4.3 5.2 6.6 9.8 9.8 9.8 9.8 240. * 12.0 11.9 11.9 11.8 11.5 10.8 7.0 5.5 4.5 4.4 5.4 7.0 10.7 10.7 10.7 10.7 250. * 13.2 13.3 13.0 12.7 12.3 12.2 7.3 5.5 4.2 4.0 5.2 7.1 12.0 12.0 11.9 11.8 260. * 13.2 13.0 12.1 11.8 11.5 11.5 6.1 4.0 2.8 2.5 3.7 5.8 11.1 11.0 10.9 10.7 270. * 9.0 9.1 8.0 7.7 7.6 7.6 3.3 1.9 1.2 .9 1.6 3.0 7.3 7.1 7.1 6.9 280. * 3.9 3.9 3.4 3.1 3.1 3.1 1.0 .5 .2 .1 .4 .9 3.0 3.0 2.9 2.8 290. * 1.0 1.0 .9 .9 .9 1.0 .2 .1 .1 .0 .0 .1 .9 .8 .8 .8 300. * .2 .2 .3 .2 .2 .2 .1 .1 .1 .0 .0 .0 .2 .2 .2 .2 310. * .1 .1 .1 .1 .1 .1 .1 .1 .1 .0 .0 .0 .1 .1 .1 .1 320. * .1 .1 .1 .1 .1 .1 .1 .1 .1 .0 .0 .0 .1 .1 .1 .1 330. * .0 .0 .0 .0 .0 .1 .1 .1 .1 .0 .0 .0 .0 .0 .0 .0 340. * .0 .0 .0 .0 .1 .1 .1 .1 .1 .0 .0 .0 .0 .0 .0 .0 350. * .1 .0 .0 .0 .0 .1 .1 .1 .1 .0 .0 .0 .0 .0 .0 .0 360. * .4 .2 .0 .0 .0 .1 .1 .1 .1 .0 .0 .0 .0 .0 .0 .0 ------*------------------------------------------------------------------------------------------------ MAX * 13.2 13.3 13.2 13.3 13.3 13.2 8.1 6.2 4.9 5.0 6.2 8.1 13.0 12.5 12.5 12.5 DEGR. * 260 250 110 110 110 100 110 120 120 120 110 110 100 100 100 100
THE HIGHEST CONCENTRATION OF 13.70 PPM OCCURRED AT RECEPTOR REC25.� PAGE 7 JOB: I25HarmonywithPkgStationNoBuild RUN: I25HarmonywithPkgStationNoBuild
DATE : 11/22/10 TIME : 11:28:16
RECEPTOR - LINK MATRIX FOR THE ANGLE PRODUCING THE MAXIMUM CONCENTRATION FOR EACH RECEPTOR
* CO/LINK (PPM) * ANGLE (DEGREES) * REC1 REC2 REC3 REC4 REC5 REC6 REC7 REC8 REC9 REC10 REC11 REC12 REC13 REC14 REC15 REC16 REC17 REC18REC19 REC20 LINK # * 70 70 70 70 70 60 60 60 60 70 290 70 70 70 290 290 290 290 290 10 -------*------------------------------------------------------------------------------------------------------------------------ 1 * 5.4 4.7 3.6 1.8 .0 .0 .0 .0 .0 .0 5.5 .0 .0 .0 .4 .4 .3 .3 .4 .0 2 * .8 .5 .2 .0 .0 .0 .0 .0 .0 .0 .8 .0 .0 .0 .1 .1 .1 .1 .1 .0 3 * .0 .0 .0 .0 .0 .0 .0 .0 .0 .0 .0 .0 .0 .0 .0 .0 .0 .0 .0 .0 4 * 1.9 2.7 3.9 5.7 3.8 2.7 2.1 2.1 2.7 3.6 1.9 7.1 7.0 6.9 6.9 7.0 7.1 7.1 3.7 1.7 5 * .0 .0 .0 .1 .1 .0 .1 .1 .1 .1 .0 .1 .1 .2 .3 .8 1.1 1.2 .4 .3 6 * .1 .1 .1 .1 .2 .1 .1 .1 .1 .2 .0 .2 .2 .2 .0 .0 .0 .0 .0 .5 7 * .2 .2 .2 .3 .3 .1 .2 .3 .2 .4 .0 .4 .4 .5 .0 .0 .0 .0 .0 .6 8 * .1 .1 .1 .1 .1 .0 .0 .1 .0 .1 .0 .1 .1 .1 .0 .0 .0 .0 .0 .0 9 * .0 .0 .1 .1 .1 .0 .0 .0 .0 .1 .0 .1 .1 .1 .0 .0 .0 .0 .0 .0 10 * 2.7 3.1 3.4 3.4 2.4 2.1 1.7 1.6 2.1 2.2 .0 3.2 3.1 3.0 3.0 3.1 3.2 3.3 2.3 1.1 11 * .3 .4 .4 .5 .4 .3 .2 .2 .3 .4 .0 .5 .5 .5 .4 .4 .4 .4 .3 .2 12 * .3 .3 .4 .5 .3 .3 .2 .2 .3 .3 .0 .4 .4 .4 .4 .4 .5 .5 .3 .0 13 * .8 .3 .1 .0 .0 .0 .0 .0 .0 .0 3.6 .0 .0 .0 .8 .7 .6 .5 .7 .0 14 * .0 .0 .0 .0 .0 .0 .0 .0 .0 .0 .0 .0 .0 .0 .0 .0 .0 .0 .0 .0 15 * .0 .0 .0 .0 .0 .0 .0 .0 .0 .0 .0 .0 .0 .0 .0 .0 .0 .0 .0 .0 16 * .0 .0 .1 .1 .1 .1 .1 .0 .0 .0 .1 .0 .0 .0 .0 .0 .0 .0 .0 .0 17 * .0 .0 .0 .0 .0 .0 .0 .0 .0 .0 .0 .0 .0 .0 .0 .0 .0 .0 .0 .0 18 * .0 .0 .0 .0 .0 .0 .0 .0 .0 .0 .0 .0 .0 .0 .0 .0 .0 .0 .0 .7 19 * .0 .1 .1 .1 .1 .1 .1 .0 .0 .0 .2 .0 .0 .0 .0 .0 .0 .0 .0 .0 20 * .0 .0 .0 .1 .0 .0 .0 .0 .0 .0 .2 .0 .0 .0 .0 .0 .0 .0 .0 .0 21 * .0 .0 .0 .0 .0 .0 .0 .0 .0 .0 .0 .0 .0 .0 .0 .0 .0 .0
Page 6
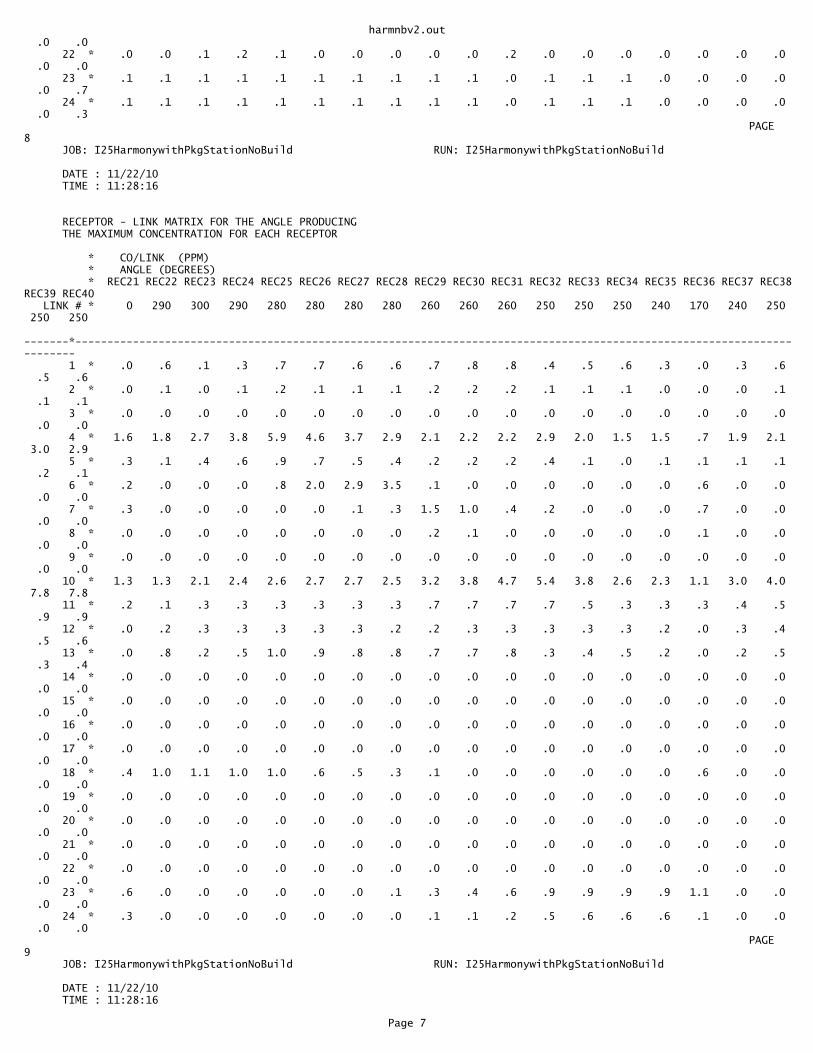
harmnbv2.out .0 .0 22 * .0 .0 .1 .2 .1 .0 .0 .0 .0 .0 .2 .0 .0 .0 .0 .0 .0 .0 .0 .0 23 * .1 .1 .1 .1 .1 .1 .1 .1 .1 .1 .0 .1 .1 .1 .0 .0 .0 .0 .0 .7 24 * .1 .1 .1 .1 .1 .1 .1 .1 .1 .1 .0 .1 .1 .1 .0 .0 .0 .0 .0 .3� PAGE 8 JOB: I25HarmonywithPkgStationNoBuild RUN: I25HarmonywithPkgStationNoBuild
DATE : 11/22/10 TIME : 11:28:16
RECEPTOR - LINK MATRIX FOR THE ANGLE PRODUCING THE MAXIMUM CONCENTRATION FOR EACH RECEPTOR
* CO/LINK (PPM) * ANGLE (DEGREES) * REC21 REC22 REC23 REC24 REC25 REC26 REC27 REC28 REC29 REC30 REC31 REC32 REC33 REC34 REC35 REC36 REC37 REC38REC39 REC40 LINK # * 0 290 300 290 280 280 280 280 260 260 260 250 250 250 240 170 240 250 250 250 -------*------------------------------------------------------------------------------------------------------------------------ 1 * .0 .6 .1 .3 .7 .7 .6 .6 .7 .8 .8 .4 .5 .6 .3 .0 .3 .6 .5 .6 2 * .0 .1 .0 .1 .2 .1 .1 .1 .2 .2 .2 .1 .1 .1 .0 .0 .0 .1 .1 .1 3 * .0 .0 .0 .0 .0 .0 .0 .0 .0 .0 .0 .0 .0 .0 .0 .0 .0 .0 .0 .0 4 * 1.6 1.8 2.7 3.8 5.9 4.6 3.7 2.9 2.1 2.2 2.2 2.9 2.0 1.5 1.5 .7 1.9 2.1 3.0 2.9 5 * .3 .1 .4 .6 .9 .7 .5 .4 .2 .2 .2 .4 .1 .0 .1 .1 .1 .1 .2 .1 6 * .2 .0 .0 .0 .8 2.0 2.9 3.5 .1 .0 .0 .0 .0 .0 .0 .6 .0 .0 .0 .0 7 * .3 .0 .0 .0 .0 .0 .1 .3 1.5 1.0 .4 .2 .0 .0 .0 .7 .0 .0 .0 .0 8 * .0 .0 .0 .0 .0 .0 .0 .0 .2 .1 .0 .0 .0 .0 .0 .1 .0 .0 .0 .0 9 * .0 .0 .0 .0 .0 .0 .0 .0 .0 .0 .0 .0 .0 .0 .0 .0 .0 .0 .0 .0 10 * 1.3 1.3 2.1 2.4 2.6 2.7 2.7 2.5 3.2 3.8 4.7 5.4 3.8 2.6 2.3 1.1 3.0 4.0 7.8 7.8 11 * .2 .1 .3 .3 .3 .3 .3 .3 .7 .7 .7 .7 .5 .3 .3 .3 .4 .5 .9 .9 12 * .0 .2 .3 .3 .3 .3 .3 .2 .2 .3 .3 .3 .3 .3 .2 .0 .3 .4 .5 .6 13 * .0 .8 .2 .5 1.0 .9 .8 .8 .7 .7 .8 .3 .4 .5 .2 .0 .2 .5 .3 .4 14 * .0 .0 .0 .0 .0 .0 .0 .0 .0 .0 .0 .0 .0 .0 .0 .0 .0 .0 .0 .0 15 * .0 .0 .0 .0 .0 .0 .0 .0 .0 .0 .0 .0 .0 .0 .0 .0 .0 .0 .0 .0 16 * .0 .0 .0 .0 .0 .0 .0 .0 .0 .0 .0 .0 .0 .0 .0 .0 .0 .0 .0 .0 17 * .0 .0 .0 .0 .0 .0 .0 .0 .0 .0 .0 .0 .0 .0 .0 .0 .0 .0 .0 .0 18 * .4 1.0 1.1 1.0 1.0 .6 .5 .3 .1 .0 .0 .0 .0 .0 .0 .6 .0 .0 .0 .0 19 * .0 .0 .0 .0 .0 .0 .0 .0 .0 .0 .0 .0 .0 .0 .0 .0 .0 .0 .0 .0 20 * .0 .0 .0 .0 .0 .0 .0 .0 .0 .0 .0 .0 .0 .0 .0 .0 .0 .0 .0 .0 21 * .0 .0 .0 .0 .0 .0 .0 .0 .0 .0 .0 .0 .0 .0 .0 .0 .0 .0 .0 .0 22 * .0 .0 .0 .0 .0 .0 .0 .0 .0 .0 .0 .0 .0 .0 .0 .0 .0 .0 .0 .0 23 * .6 .0 .0 .0 .0 .0 .0 .1 .3 .4 .6 .9 .9 .9 .9 1.1 .0 .0 .0 .0 24 * .3 .0 .0 .0 .0 .0 .0 .0 .1 .1 .2 .5 .6 .6 .6 .1 .0 .0 .0 .0� PAGE 9 JOB: I25HarmonywithPkgStationNoBuild RUN: I25HarmonywithPkgStationNoBuild
DATE : 11/22/10 TIME : 11:28:16
Page 7
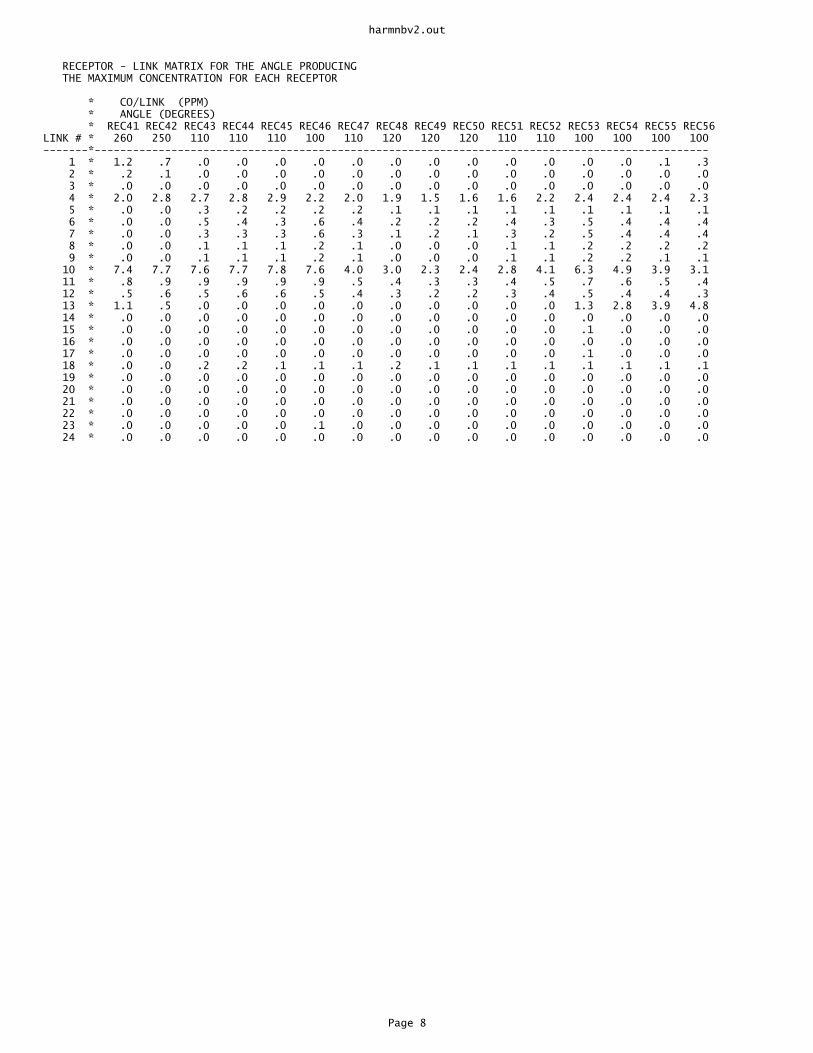
harmnbv2.out
RECEPTOR - LINK MATRIX FOR THE ANGLE PRODUCING THE MAXIMUM CONCENTRATION FOR EACH RECEPTOR
* CO/LINK (PPM) * ANGLE (DEGREES) * REC41 REC42 REC43 REC44 REC45 REC46 REC47 REC48 REC49 REC50 REC51 REC52 REC53 REC54 REC55 REC56 LINK # * 260 250 110 110 110 100 110 120 120 120 110 110 100 100 100 100 -------*------------------------------------------------------------------------------------------------ 1 * 1.2 .7 .0 .0 .0 .0 .0 .0 .0 .0 .0 .0 .0 .0 .1 .3 2 * .2 .1 .0 .0 .0 .0 .0 .0 .0 .0 .0 .0 .0 .0 .0 .0 3 * .0 .0 .0 .0 .0 .0 .0 .0 .0 .0 .0 .0 .0 .0 .0 .0 4 * 2.0 2.8 2.7 2.8 2.9 2.2 2.0 1.9 1.5 1.6 1.6 2.2 2.4 2.4 2.4 2.3 5 * .0 .0 .3 .2 .2 .2 .2 .1 .1 .1 .1 .1 .1 .1 .1 .1 6 * .0 .0 .5 .4 .3 .6 .4 .2 .2 .2 .4 .3 .5 .4 .4 .4 7 * .0 .0 .3 .3 .3 .6 .3 .1 .2 .1 .3 .2 .5 .4 .4 .4 8 * .0 .0 .1 .1 .1 .2 .1 .0 .0 .0 .1 .1 .2 .2 .2 .2 9 * .0 .0 .1 .1 .1 .2 .1 .0 .0 .0 .1 .1 .2 .2 .1 .1 10 * 7.4 7.7 7.6 7.7 7.8 7.6 4.0 3.0 2.3 2.4 2.8 4.1 6.3 4.9 3.9 3.1 11 * .8 .9 .9 .9 .9 .9 .5 .4 .3 .3 .4 .5 .7 .6 .5 .4 12 * .5 .6 .5 .6 .6 .5 .4 .3 .2 .2 .3 .4 .5 .4 .4 .3 13 * 1.1 .5 .0 .0 .0 .0 .0 .0 .0 .0 .0 .0 1.3 2.8 3.9 4.8 14 * .0 .0 .0 .0 .0 .0 .0 .0 .0 .0 .0 .0 .0 .0 .0 .0 15 * .0 .0 .0 .0 .0 .0 .0 .0 .0 .0 .0 .0 .1 .0 .0 .0 16 * .0 .0 .0 .0 .0 .0 .0 .0 .0 .0 .0 .0 .0 .0 .0 .0 17 * .0 .0 .0 .0 .0 .0 .0 .0 .0 .0 .0 .0 .1 .0 .0 .0 18 * .0 .0 .2 .2 .1 .1 .1 .2 .1 .1 .1 .1 .1 .1 .1 .1 19 * .0 .0 .0 .0 .0 .0 .0 .0 .0 .0 .0 .0 .0 .0 .0 .0 20 * .0 .0 .0 .0 .0 .0 .0 .0 .0 .0 .0 .0 .0 .0 .0 .0 21 * .0 .0 .0 .0 .0 .0 .0 .0 .0 .0 .0 .0 .0 .0 .0 .0 22 * .0 .0 .0 .0 .0 .0 .0 .0 .0 .0 .0 .0 .0 .0 .0 .0 23 * .0 .0 .0 .0 .0 .1 .0 .0 .0 .0 .0 .0 .0 .0 .0 .0 24 * .0 .0 .0 .0 .0 .0 .0 .0 .0 .0 .0 .0 .0 .0 .0 .0
Page 8

harmpkga.in'I25HarmonywithPkgStationPMpackageA', 60 , 175 , 0 , 0 , 56 , 0.3048 , 1 , 1 'Receptor 1', 979 , 26 , 5 'Receptor 2', 1019 , 26 , 5 'Receptor 3', 1059 , 26 , 5 'Receptor 4', 1099 , 26 , 5 'Receptor 5', 1099 ,-14 , 5 'Receptor 6', 1099 ,-54 , 5 'Receptor 7', 1099 ,-94 , 5 'Receptor 8', 1187 ,-96 , 5 'Receptor 9', 1187 ,-56 , 5 'Receptor 10', 1187 ,-16 , 5 'Receptor 11', 1187 , 24 , 5 'Receptor 12', 1227 , 24 , 5 'Receptor 13', 1267 , 24 , 5 'Receptor 14', 1307 , 24 , 5 'Receptor 15', 1582 , 24 , 5 'Receptor 16', 1622 , 24 , 5 'Receptor 17', 1662 , 24 , 5 'Receptor 18', 1702 , 24 , 5 'Receptor 19', 1702 ,-16 , 5 'Receptor 20', 1702 ,-56 , 5 'Receptor 21', 1702 ,-96 , 5 'Receptor 22', 1778 ,-84 , 5 'Receptor 23', 1778 ,-44 , 5 'Receptor 24', 1778 ,-4 , 5 'Receptor 25', 1778 , 36 , 5 'Receptor 26', 1818 , 36 , 5 'Receptor 27', 1858 , 36 , 5 'Receptor 28', 1898 , 36 , 5 'Receptor 29', 1898 , 196 , 5 'Receptor 30', 1858 , 196 , 5 'Receptor 31', 1818 , 196 , 5 'Receptor 32', 1778 , 196 , 5 'Receptor 33', 1778 , 236 , 5 'Receptor 34', 1778 , 276 , 5 'Receptor 35', 1778 , 316 , 5 'Receptor 36', 1708 , 328 , 5 'Receptor 37', 1708 , 288 , 5 'Receptor 38', 1708 , 248 , 5 'Receptor 39', 1708 , 208 , 5 'Receptor 40', 1668 , 208 , 5 'Receptor 41', 1628 , 208 , 5 'Receptor 42', 1588 , 208 , 5 'Receptor 43', 1301 , 208 , 5 'Receptor 44', 1261 , 208 , 5 'Receptor 45', 1221 , 208 , 5 'Receptor 46', 1181 , 208 , 5 'Receptor 47', 1181 , 248 , 5 'Receptor 48', 1181 , 288 , 5 'Receptor 49', 1181 , 316 , 5 'Receptor 50', 1093 , 330.4 , 5 'Receptor 51', 1093 , 279.9 , 5 'Receptor 52', 1093 , 233.9 , 5 'Receptor 53', 1093 , 202 , 5 'Receptor 54', 1053 , 202 , 5 'Receptor 55', 1013 , 202 , 5 'Receptor 56', 973 , 202 , 5 'I25HarmonywithPkgStationPMpackageA', 32 , 1 , 1 ,'CO' 1 'harmebapp1','AG', 240 , 88 , 1140 , 88 , 1698 , 48.8 , 0 , 44 2 'harmebapp1 q','AG', 1109 , 88 , 240 , 88 , 0 , 24 , 2 100 , 40 , 2 , 1660 , 143.34 , 1600 , 1 , 3 2 'harmebltturn','AG', 1109 , 106 , 909 , 106 , 0 , 12 , 1 100 , 82 , 2 , 20 , 143.34 , 1600 , 1 , 3 1 'harmebapp2','AG', 240 , 64 , 1140 , 64 , 1698 , 48.8 , 0 , 44 2 'harmebapp2 q','AG', 1109 , 64 , 240 , 64 , 0 , 24 , 2 100 , 40 , 2 , 1660 , 143.34 , 1600 , 1 , 3 1 'harmebdep/app','AG', 1140 , 62 , 1740 , 62 , 1848 , 48.8 , 0 , 56 2 'harmebdep/app q','AG', 1712 , 62 , 1177 , 62 , 0 , 36 , 3 100 , 45 , 2 , 1070 , 143.34 , 1600 , 1 , 3 1 'harmebdep/app2','AG', 1140 , 98 , 1740 , 98 , 1848 , 48.8 , 0 , 56 2 'harmebdep/app2 q','AG', 1712 , 98 , 1177 , 98 , 0 , 36 , 3 100 , 45 , 2 , 1070 , 143.34 , 1600 , 1 , 3
Page 1

harmpkga.in 1 'harmebdep','AG', 1740 , 74 , 2240 , 74 , 1285 , 48.8 , 0 , 56 1 'harmebdep2','AG', 1740 , 104 , 2240 , 104 , 1285 , 48.8 , 0 , 44 1 'harmwbapp1','AG', 2240 , 158 , 1740 , 158 , 2880 , 23.9 , 0 , 56 2 'harmwbque1','AG', 1774 , 158 , 2240 , 158 , 0 , 36 , 3 100 , 23 , 2 , 2480 , 143.34 , 1600 , 1 , 3 2 'harmwbltturn','AG', 1774 , 128 , 1970 , 128 , 0 , 24 , 2 100 , 77 , 2 , 400 , 143.34 , 1600 , 1 , 3 1 'harmwbdep/app','AG', 1740 , 152 , 1140 , 152 , 1938 , 23.9 , 0 , 44 2 'harmwbdep/app q','AG', 1171 , 152 , 1712 , 152 , 0 , 24 , 2 100 , 40 , 2 , 1875 , 143.34 , 1600 , 1 , 3 1 'harmwbdep/app2','AG', 1740 , 176 , 1140 , 176 , 1938 , 23.9 , 0 , 44 2 'harmwbdep/app2 q','AG', 1171 , 176 , 1740 , 176 , 0 , 24 , 2 100 , 40 , 2 , 1875 , 143.34 , 1600 , 1 , 3 2 'harmwbltturn2','AG', 1171 , 134 , 1471 , 134 , 0 , 12 , 1 100 , 80 , 2 , 70 , 143.34 , 1600 , 1 , 3 1 'harmwbdep','AG', 1140 , 146 , 240 , 146 , 1915 , 23.9 , 0 , 44 1 'harmwbdep2','AG', 1140 , 170 , 240 , 170 , 1915 , 23.9 , 0 , 44 1 'pkgsbapp','AG', 1125 , 1124 , 1125 , 124 , 205 , 22.5 , 0 , 44 2 'pkgsbapp q','AG', 1125 , 198 , 1125 , 1124 , 0 , 24 , 2 100 , 70 , 2 , 30 , 143.34 , 1600 , 1 , 3 1 'pkgsbdep','AG', 1125 , 124 , 1125 ,-376 , 155 , 22.5 , 0 , 32 2 'pkgsbleftturn','AG', 1143 , 198 , 1143 , 398 , 0 , 12 , 1 100 , 60 , 2 , 130 , 143.34 , 1600 , 1 , 3 1 'i25sbrampdep','AG', 1740 , 124 , 1740 ,-876 , 1955 , 22.5 , 0 , 56 1 'pkgnbapp','AG', 1155 ,-376 , 1155 , 124 , 185 , 23 , 0 , 44 2 'pkgnbapp q','AG', 1155 , 34 , 1155 ,-376 , 0 , 24 , 2 100 , 85 , 2 , 15 , 143.34 , 1600 , 1 , 3 1 'pkgnbdep','AG', 1155 , 124 , 1155 , 1124 , 90 , 23 , 0 , 32 2 'pkgnbleftturn','AG', 1137 , 34 , 1137 ,-66 , 0 , 12 , 1 100 , 85 , 2 , 35 , 143.34 , 1600 , 1 , 3 1 'i25sbrampapp','AG', 1740 , 1124 , 1740 , 124 , 1555 , 22.5 , 0 , 56 2 'i25sbrampleftturn','AG', 1758 , 198 , 1758 , 398 , 0 , 12 , 1 100 , 78 , 2 , 430 , 143.34 , 1600 , 1 , 3 1 , 0 , 4 , 1000 , 0 ,'Y', 10 , 0 , 36
Page 2

harmpga2.out� CAL3QHC: LINE SOURCE DISPERSION MODEL - VERSION 2.0 Dated 95221 PAGE 1
JOB: I25HarmonywithPkgStationPMpackageA RUN: I25HarmonywithPkgStationPMpackageA
DATE : 11/22/10 TIME : 11:26:56
The MODE flag has been set to C for calculating CO averages.
SITE & METEOROLOGICAL VARIABLES ------------------------------- VS = .0 CM/S VD = .0 CM/S Z0 = 175. CM U = 1.0 M/S CLAS = 4 (D) ATIM = 60. MINUTES MIXH = 1000. M AMB = .0 PPM
LINK VARIABLES -------------- LINK DESCRIPTION * LINK COORDINATES (FT) * LENGTH BRG TYPE VPH EF H W V/C QUEUE * X1 Y1 X2 Y2 * (FT) (DEG) (G/MI) (FT) (FT) (VEH) ------------------------*----------------------------------------*---------------------------------------------------------- 1. harmebapp1 * 240.0 88.0 1140.0 88.0 * 900. 90. AG 1698. 48.8 .0 44.0 2. harmebapp1 q * 1109.0 88.0 872.2 87.9 * 237. 270. AG 308. 100.0 .0 24.0 .93 12.0 3. harmebltturn * 1109.0 106.0 1100.0 106.0 * 9. 270. AG 315. 100.0 .0 12.0 .09 .5 4. harmebapp2 * 240.0 64.0 1140.0 64.0 * 900. 90. AG 1698. 48.8 .0 44.0 5. harmebapp2 q * 1109.0 64.0 872.2 63.9 * 237. 270. AG 308. 100.0 .0 24.0 .93 12.0 6. harmebdep/app * 1140.0 62.0 1740.0 62.0 * 600. 90. AG 1848. 48.8 .0 56.0 7. harmebdep/app q * 1712.0 62.0 1624.4 62.0 * 88. 270. AG 519. 100.0 .0 36.0 .44 4.4 8. harmebdep/app2 * 1140.0 98.0 1740.0 98.0 * 600. 90. AG 1848. 48.8 .0 56.0 9. harmebdep/app2 q * 1712.0 98.0 1624.4 98.0 * 88. 270. AG 519. 100.0 .0 36.0 .44 4.4 10. harmebdep * 1740.0 74.0 2240.0 74.0 * 500. 90. AG 1285. 48.8 .0 56.0 11. harmebdep2 * 1740.0 104.0 2240.0 104.0 * 500. 90. AG 1285. 48.8 .0 44.0 12. harmwbapp1 * 2240.0 158.0 1740.0 158.0 * 500. 270. AG 2880. 23.9 .0 56.0 13. harmwbque1 * 1774.0 158.0 1877.9 158.0 * 104. 90. AG 265. 100.0 .0 36.0 .71 5.3 14. harmwbltturn * 1774.0 128.0 1858.9 128.0 * 85. 90. AG 592. 100.0 .0 24.0 .66 4.3 15. harmwbdep/app * 1740.0 152.0 1140.0 152.0 * 600. 270. AG 1938. 23.9 .0 44.0 16. harmwbdep/app q * 1171.0 152.0 1932.2 152.0 * 761. 90. AG 308. 100.0 .0 24.0 1.05 38.7 17. harmwbdep/app2 * 1740.0 176.0 1140.0 176.0 * 600. 270. AG 1938. 23.9 .0 44.0 18. harmwbdep/app2 q * 1171.0 176.0 1932.2 176.0 * 761. 90. AG 308. 100.0 .0 24.0 1.05 38.7 19. harmwbltturn2 * 1171.0 134.0 1201.6 134.0 * 31. 90. AG 308. 100.0 .0 12.0 .27 1.6 20. harmwbdep * 1140.0 146.0 240.0 146.0 * 900. 270. AG 1915. 23.9 .0 44.0 21. harmwbdep2 * 1140.0 170.0 240.0 170.0 * 900. 270. AG 1915. 23.9 .0 44.0 22. pkgsbapp * 1125.0 1124.0 1125.0 124.0 * 1000. 180. AG 205. 22.5 .0 44.0 23. pkgsbapp q * 1125.0 198.0 1125.0 203.7 * 6. 360. AG 538. 100.0 .0 24.0 .04 .3 24. pkgsbdep * 1125.0 124.0 1125.0 -376.0 * 500. 180. AG 155. 22.5 .0 32.0 25. pkgsbleftturn * 1143.0 198.0 1143.0 240.7 * 43. 360. AG 231. 100.0 .0 12.0 .23 2.2 26. i25sbrampdep * 1740.0 124.0 1740.0 -876.0 * 1000. 180. AG 1955. 22.5 .0 56.0 27. pkgnbapp * 1155.0 -376.0 1155.0 124.0 * 500. 360. AG 185. 23.0 .0 44.0 28. pkgnbapp q * 1155.0 34.0 1155.0 30.7 * 3. 180. AG 654. 100.0 .0 24.0 .04 .2 29. pkgnbdep * 1155.0 124.0 1155.0 1124.0 * 1000. 360. AG 90. 23.0 .0 32.0 30. pkgnbleftturn * 1137.0 34.0 1137.0 17.7 * 16. 180. AG 327. 100.0 .0 12.0 .20 .8 31. i25sbrampapp * 1740.0 1124.0 1740.0 124.0 * 1000. 180. AG 1555. 22.5 .0 56.0 32. i25sbrampleftturn * 1758.0 198.0 1758.0 1902.6 * 1705. 360. AG 300. 100.0 .0 12.0 1.49 86.6� PAGE 2 JOB: I25HarmonywithPkgStationPMpackageA RUN: I25HarmonywithPkgStationPMpackageA
DATE : 11/22/10 TIME : 11:26:56
ADDITIONAL QUEUE LINK PARAMETERS -------------------------------- LINK DESCRIPTION * CYCLE RED CLEARANCE APPROACH SATURATION IDLE SIGNAL ARRIVAL * LENGTH TIME LOST TIME VOL FLOW RATE EM FAC TYPE RATE
Page 1

harmpga2.out * (SEC) (SEC) (SEC) (VPH) (VPH) (gm/hr) ------------------------*-------------------------------------------------------------------------------- 2. harmebapp1 q * 100 40 2.0 1660 1600 143.34 1 3 3. harmebltturn * 100 82 2.0 20 1600 143.34 1 3 5. harmebapp2 q * 100 40 2.0 1660 1600 143.34 1 3 7. harmebdep/app q * 100 45 2.0 1070 1600 143.34 1 3 9. harmebdep/app2 q * 100 45 2.0 1070 1600 143.34 1 3 13. harmwbque1 * 100 23 2.0 2480 1600 143.34 1 3 14. harmwbltturn * 100 77 2.0 400 1600 143.34 1 3 16. harmwbdep/app q * 100 40 2.0 1875 1600 143.34 1 3 18. harmwbdep/app2 q * 100 40 2.0 1875 1600 143.34 1 3 19. harmwbltturn2 * 100 80 2.0 70 1600 143.34 1 3 23. pkgsbapp q * 100 70 2.0 30 1600 143.34 1 3 25. pkgsbleftturn * 100 60 2.0 130 1600 143.34 1 3 28. pkgnbapp q * 100 85 2.0 15 1600 143.34 1 3 30. pkgnbleftturn * 100 85 2.0 35 1600 143.34 1 3 32. i25sbrampleftturn * 100 78 2.0 430 1600 143.34 1 3
RECEPTOR LOCATIONS ------------------ * COORDINATES (FT) * RECEPTOR * X Y Z * -------------------------*-------------------------------------* 1. Receptor 1 * 979.0 26.0 5.0 * 2. Receptor 2 * 1019.0 26.0 5.0 * 3. Receptor 3 * 1059.0 26.0 5.0 * 4. Receptor 4 * 1099.0 26.0 5.0 * 5. Receptor 5 * 1099.0 -14.0 5.0 * 6. Receptor 6 * 1099.0 -54.0 5.0 * 7. Receptor 7 * 1099.0 -94.0 5.0 * 8. Receptor 8 * 1187.0 -96.0 5.0 * 9. Receptor 9 * 1187.0 -56.0 5.0 * 10. Receptor 10 * 1187.0 -16.0 5.0 * 11. Receptor 11 * 1187.0 24.0 5.0 * 12. Receptor 12 * 1227.0 24.0 5.0 * 13. Receptor 13 * 1267.0 24.0 5.0 * 14. Receptor 14 * 1307.0 24.0 5.0 * 15. Receptor 15 * 1582.0 24.0 5.0 * 16. Receptor 16 * 1622.0 24.0 5.0 * 17. Receptor 17 * 1662.0 24.0 5.0 * 18. Receptor 18 * 1702.0 24.0 5.0 * 19. Receptor 19 * 1702.0 -16.0 5.0 * 20. Receptor 20 * 1702.0 -56.0 5.0 * 21. Receptor 21 * 1702.0 -96.0 5.0 * 22. Receptor 22 * 1778.0 -84.0 5.0 * 23. Receptor 23 * 1778.0 -44.0 5.0 * 24. Receptor 24 * 1778.0 -4.0 5.0 * 25. Receptor 25 * 1778.0 36.0 5.0 * 26. Receptor 26 * 1818.0 36.0 5.0 * 27. Receptor 27 * 1858.0 36.0 5.0 * 28. Receptor 28 * 1898.0 36.0 5.0 * 29. Receptor 29 * 1898.0 196.0 5.0 * 30. Receptor 30 * 1858.0 196.0 5.0 *� PAGE 3 JOB: I25HarmonywithPkgStationPMpackageA RUN: I25HarmonywithPkgStationPMpackageA
DATE : 11/22/10 TIME : 11:26:56
RECEPTOR LOCATIONS ------------------ * COORDINATES (FT) * RECEPTOR * X Y Z * -------------------------*-------------------------------------* 31. Receptor 31 * 1818.0 196.0 5.0 * 32. Receptor 32 * 1778.0 196.0 5.0 * 33. Receptor 33 * 1778.0 236.0 5.0 * 34. Receptor 34 * 1778.0 276.0 5.0 * 35. Receptor 35 * 1778.0 316.0 5.0 * 36. Receptor 36 * 1708.0 328.0 5.0 * 37. Receptor 37 * 1708.0 288.0 5.0 * 38. Receptor 38 * 1708.0 248.0 5.0 * 39. Receptor 39 * 1708.0 208.0 5.0 * 40. Receptor 40 * 1668.0 208.0 5.0 * 41. Receptor 41 * 1628.0 208.0 5.0 * 42. Receptor 42 * 1588.0 208.0 5.0 * 43. Receptor 43 * 1301.0 208.0 5.0 * 44. Receptor 44 * 1261.0 208.0 5.0 * 45. Receptor 45 * 1221.0 208.0 5.0 *
Page 2
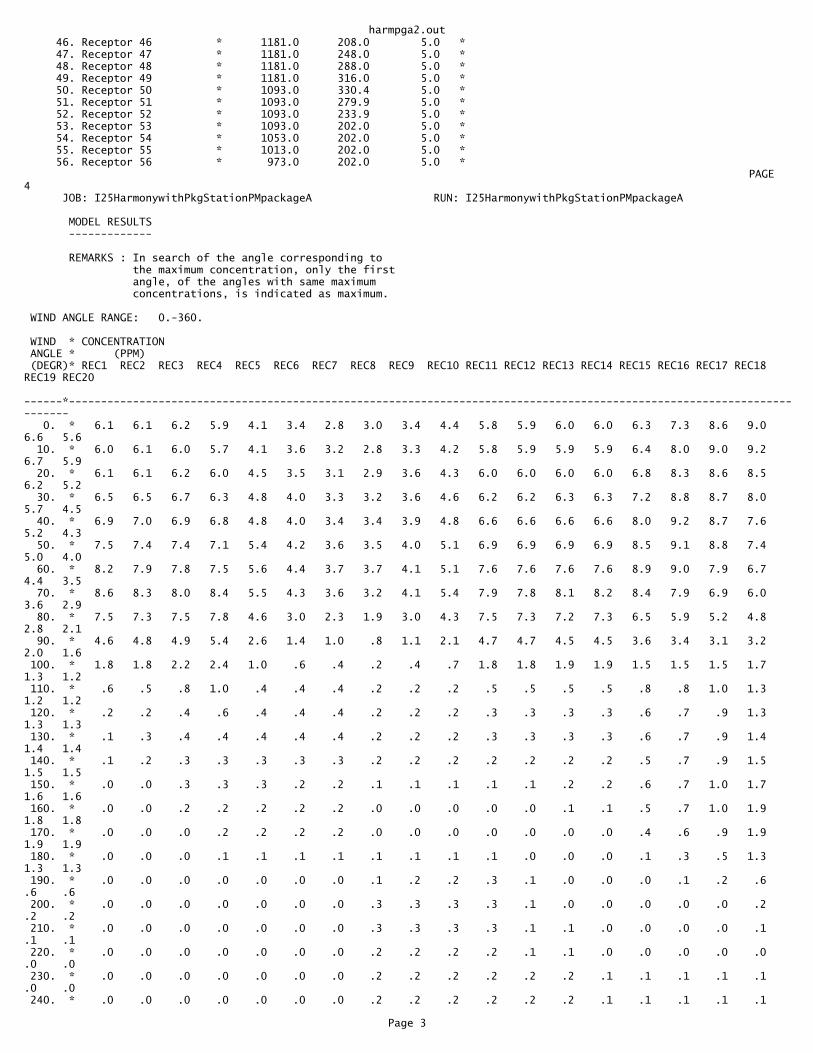
harmpga2.out 46. Receptor 46 * 1181.0 208.0 5.0 * 47. Receptor 47 * 1181.0 248.0 5.0 * 48. Receptor 48 * 1181.0 288.0 5.0 * 49. Receptor 49 * 1181.0 316.0 5.0 * 50. Receptor 50 * 1093.0 330.4 5.0 * 51. Receptor 51 * 1093.0 279.9 5.0 * 52. Receptor 52 * 1093.0 233.9 5.0 * 53. Receptor 53 * 1093.0 202.0 5.0 * 54. Receptor 54 * 1053.0 202.0 5.0 * 55. Receptor 55 * 1013.0 202.0 5.0 * 56. Receptor 56 * 973.0 202.0 5.0 *� PAGE 4 JOB: I25HarmonywithPkgStationPMpackageA RUN: I25HarmonywithPkgStationPMpackageA
MODEL RESULTS -------------
REMARKS : In search of the angle corresponding to the maximum concentration, only the first angle, of the angles with same maximum concentrations, is indicated as maximum.
WIND ANGLE RANGE: 0.-360.
WIND * CONCENTRATION ANGLE * (PPM) (DEGR)* REC1 REC2 REC3 REC4 REC5 REC6 REC7 REC8 REC9 REC10 REC11 REC12 REC13 REC14 REC15 REC16 REC17 REC18 REC19 REC20 ------*------------------------------------------------------------------------------------------------------------------------ 0. * 6.1 6.1 6.2 5.9 4.1 3.4 2.8 3.0 3.4 4.4 5.8 5.9 6.0 6.0 6.3 7.3 8.6 9.0 6.6 5.6 10. * 6.0 6.1 6.0 5.7 4.1 3.6 3.2 2.8 3.3 4.2 5.8 5.9 5.9 5.9 6.4 8.0 9.0 9.2 6.7 5.9 20. * 6.1 6.1 6.2 6.0 4.5 3.5 3.1 2.9 3.6 4.3 6.0 6.0 6.0 6.0 6.8 8.3 8.6 8.5 6.2 5.2 30. * 6.5 6.5 6.7 6.3 4.8 4.0 3.3 3.2 3.6 4.6 6.2 6.2 6.3 6.3 7.2 8.8 8.7 8.0 5.7 4.5 40. * 6.9 7.0 6.9 6.8 4.8 4.0 3.4 3.4 3.9 4.8 6.6 6.6 6.6 6.6 8.0 9.2 8.7 7.6 5.2 4.3 50. * 7.5 7.4 7.4 7.1 5.4 4.2 3.6 3.5 4.0 5.1 6.9 6.9 6.9 6.9 8.5 9.1 8.8 7.4 5.0 4.0 60. * 8.2 7.9 7.8 7.5 5.6 4.4 3.7 3.7 4.1 5.1 7.6 7.6 7.6 7.6 8.9 9.0 7.9 6.7 4.4 3.5 70. * 8.6 8.3 8.0 8.4 5.5 4.3 3.6 3.2 4.1 5.4 7.9 7.8 8.1 8.2 8.4 7.9 6.9 6.0 3.6 2.9 80. * 7.5 7.3 7.5 7.8 4.6 3.0 2.3 1.9 3.0 4.3 7.5 7.3 7.2 7.3 6.5 5.9 5.2 4.8 2.8 2.1 90. * 4.6 4.8 4.9 5.4 2.6 1.4 1.0 .8 1.1 2.1 4.7 4.7 4.5 4.5 3.6 3.4 3.1 3.2 2.0 1.6 100. * 1.8 1.8 2.2 2.4 1.0 .6 .4 .2 .4 .7 1.8 1.8 1.9 1.9 1.5 1.5 1.5 1.7 1.3 1.2 110. * .6 .5 .8 1.0 .4 .4 .4 .2 .2 .2 .5 .5 .5 .5 .8 .8 1.0 1.3 1.2 1.2 120. * .2 .2 .4 .6 .4 .4 .4 .2 .2 .2 .3 .3 .3 .3 .6 .7 .9 1.3 1.3 1.3 130. * .1 .3 .4 .4 .4 .4 .4 .2 .2 .2 .3 .3 .3 .3 .6 .7 .9 1.4 1.4 1.4 140. * .1 .2 .3 .3 .3 .3 .3 .2 .2 .2 .2 .2 .2 .2 .5 .7 .9 1.5 1.5 1.5 150. * .0 .0 .3 .3 .3 .2 .2 .1 .1 .1 .1 .1 .2 .2 .6 .7 1.0 1.7 1.6 1.6 160. * .0 .0 .2 .2 .2 .2 .2 .0 .0 .0 .0 .0 .1 .1 .5 .7 1.0 1.9 1.8 1.8 170. * .0 .0 .0 .2 .2 .2 .2 .0 .0 .0 .0 .0 .0 .0 .4 .6 .9 1.9 1.9 1.9 180. * .0 .0 .0 .1 .1 .1 .1 .1 .1 .1 .1 .0 .0 .0 .1 .3 .5 1.3 1.3 1.3 190. * .0 .0 .0 .0 .0 .0 .0 .1 .2 .2 .3 .1 .0 .0 .0 .1 .2 .6 .6 .6 200. * .0 .0 .0 .0 .0 .0 .0 .3 .3 .3 .3 .1 .0 .0 .0 .0 .0 .2 .2 .2 210. * .0 .0 .0 .0 .0 .0 .0 .3 .3 .3 .3 .1 .1 .0 .0 .0 .0 .1 .1 .1 220. * .0 .0 .0 .0 .0 .0 .0 .2 .2 .2 .2 .1 .1 .0 .0 .0 .0 .0 .0 .0 230. * .0 .0 .0 .0 .0 .0 .0 .2 .2 .2 .2 .2 .2 .1 .1 .1 .1 .1 .0 .0 240. * .0 .0 .0 .0 .0 .0 .0 .2 .2 .2 .2 .2 .2 .1 .1 .1 .1 .1
Page 3

harmpga2.out.0 .0 250. * .3 .3 .3 .3 .0 .0 .0 .2 .2 .2 .6 .5 .5 .4 .4 .4 .4 .4 .0 .0 260. * 1.3 1.4 1.5 1.5 .5 .2 .0 .3 .4 .7 2.1 1.9 1.8 1.7 2.0 1.9 1.9 2.0 .7 .3 270. * 3.5 3.6 3.8 4.1 1.7 1.0 .4 .7 1.2 2.0 5.0 4.9 4.7 4.5 4.8 4.9 5.1 5.2 2.6 1.3 280. * 6.0 6.1 6.5 6.7 3.5 2.1 1.4 1.7 2.6 3.9 7.5 7.4 7.1 6.9 7.3 7.5 7.6 8.0 4.7 3.3 290. * 6.9 7.4 7.6 7.6 4.5 3.1 2.3 2.8 3.6 5.1 8.2 7.5 7.6 7.4 7.7 7.7 8.1 8.5 5.1 3.9 300. * 7.1 7.3 7.5 7.5 4.8 3.7 2.9 3.2 3.9 5.1 7.5 6.9 6.7 6.7 7.3 7.3 7.6 8.4 5.2 4.0 310. * 6.7 6.8 6.9 6.9 4.8 3.6 3.0 3.3 3.7 4.9 6.6 6.2 6.3 6.4 6.6 6.6 7.4 8.3 5.3 3.8 320. * 6.4 6.4 6.4 6.4 4.4 3.5 3.0 3.0 3.7 4.5 5.7 5.8 6.0 6.1 6.3 6.3 7.4 8.2 5.2 3.9 330. * 6.3 6.3 6.3 6.3 4.3 3.4 2.9 3.0 3.5 4.1 5.3 5.7 6.0 5.9 6.0 6.0 7.5 8.1 5.5 4.0 340. * 6.0 6.0 6.0 6.0 4.0 3.3 2.7 3.0 3.4 3.9 5.4 5.7 5.7 5.7 5.8 6.0 7.6 8.1 5.7 4.4 350. * 6.1 6.1 6.1 6.0 4.1 3.1 2.5 3.0 3.4 4.2 5.6 5.9 5.8 5.8 5.8 6.4 8.0 8.4 5.9 4.9 360. * 6.1 6.1 6.2 5.9 4.1 3.4 2.8 3.0 3.4 4.4 5.8 5.9 6.0 6.0 6.3 7.3 8.6 9.0 6.6 5.6 ------*------------------------------------------------------------------------------------------------------------------------ MAX * 8.6 8.3 8.0 8.4 5.6 4.4 3.7 3.7 4.1 5.4 8.2 7.8 8.1 8.2 8.9 9.2 9.0 9.2 6.7 5.9 DEGR. * 70 70 70 70 60 60 60 60 60 70 290 70 70 70 60 40 10 10 10 10
� PAGE 5 JOB: I25HarmonywithPkgStationPMpackageA RUN: I25HarmonywithPkgStationPMpackageA
MODEL RESULTS -------------
REMARKS : In search of the angle corresponding to the maximum concentration, only the first angle, of the angles with same maximum concentrations, is indicated as maximum.
WIND ANGLE RANGE: 0.-360.
WIND * CONCENTRATION ANGLE * (PPM) (DEGR)* REC21 REC22 REC23 REC24 REC25 REC26 REC27 REC28 REC29 REC30 REC31 REC32 REC33 REC34 REC35 REC36 REC37 REC38 REC39 REC40 ------*------------------------------------------------------------------------------------------------------------------------ 0. * 4.8 4.3 4.7 5.3 6.7 6.2 5.4 4.7 .3 .4 .8 2.0 2.0 1.9 1.9 1.8 1.8 1.8 1.8 .8 10. * 5.3 3.2 3.7 4.5 6.0 5.5 4.9 4.2 .0 .2 .2 1.0 1.0 1.0 .9 2.4 2.4 2.4 2.4 1.2 20. * 4.7 2.6 3.1 4.1 5.5 5.0 4.5 4.0 .0 .0 .0 .2 .2 .2 .2 2.3 2.3 2.3 2.3 1.2 30. * 4.2 2.3 2.9 3.7 5.3 4.8 4.2 4.0 .0 .0 .0 .0 .0 .0 .0 2.0 2.0 2.0 2.0 1.2 40. * 3.8 2.0 2.6 3.5 5.2 4.6 4.3 4.1 .0 .0 .0 .0 .0 .0 .0 1.8 1.8 1.8 1.8 1.1 50. * 3.5 1.8 2.3 3.3 5.0 4.6 4.4 4.4 .0 .0 .0 .0 .0 .0 .0 1.7 1.7 1.7 1.7 1.0 60. * 2.9 1.6 2.1 2.9 5.0 4.8 4.5 4.5 .1 .1 .1 .1 .0 .0 .0 1.5 1.5 1.5 1.5 1.0 70. * 2.3 1.0 1.6 2.5 4.6 4.6 4.5 4.2 .2 .2 .3 .3 .0 .0 .0 1.4 1.4 1.4 1.5 1.1 80. * 1.6 .3 .9 1.6 3.9 3.7 3.6 3.3 .7 .8 1.0 1.2 .1 .0 .0 1.4 1.4 1.5 2.0 1.8 90. * 1.4 .1 .3 .7 2.3 2.1 2.0 1.9 1.9 2.3 2.6 2.9 .7 .2 .1 1.6 1.7 2.2 3.7 3.5 100. * 1.2 .0 .0 .1 .9 .8 .7 .7 3.5 4.2 4.8 5.3 1.7 .8 .3 1.9 2.2 3.2 5.5 5.9 110. * 1.2 .0 .0 .0 .2 .2 .2 .2 4.6 5.4 6.0 6.8 3.0 1.7 .9 2.5 3.1 4.5 7.1 7.2 120. * 1.3 .0 .0 .0 .1 .1 .1 .1 5.1 6.0 6.6 7.3 3.9 2.4 1.7 3.3 4.2 5.5 7.9 7.6 130. * 1.4 .0 .0 .0 .0 .0 .0 .0 5.3 5.9 6.7 7.3 4.2 2.9 2.0 4.0 4.8 5.8
Page 4
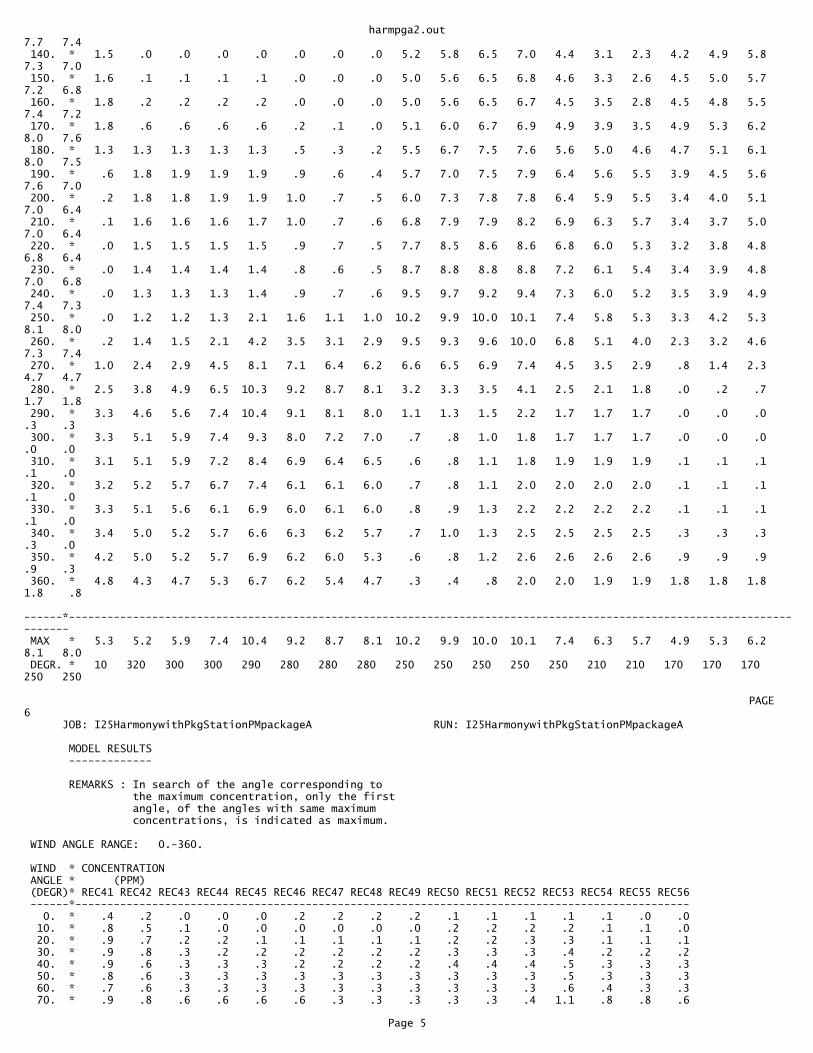
harmpga2.out7.7 7.4 140. * 1.5 .0 .0 .0 .0 .0 .0 .0 5.2 5.8 6.5 7.0 4.4 3.1 2.3 4.2 4.9 5.8 7.3 7.0 150. * 1.6 .1 .1 .1 .1 .0 .0 .0 5.0 5.6 6.5 6.8 4.6 3.3 2.6 4.5 5.0 5.7 7.2 6.8 160. * 1.8 .2 .2 .2 .2 .0 .0 .0 5.0 5.6 6.5 6.7 4.5 3.5 2.8 4.5 4.8 5.5 7.4 7.2 170. * 1.8 .6 .6 .6 .6 .2 .1 .0 5.1 6.0 6.7 6.9 4.9 3.9 3.5 4.9 5.3 6.2 8.0 7.6 180. * 1.3 1.3 1.3 1.3 1.3 .5 .3 .2 5.5 6.7 7.5 7.6 5.6 5.0 4.6 4.7 5.1 6.1 8.0 7.5 190. * .6 1.8 1.9 1.9 1.9 .9 .6 .4 5.7 7.0 7.5 7.9 6.4 5.6 5.5 3.9 4.5 5.6 7.6 7.0 200. * .2 1.8 1.8 1.9 1.9 1.0 .7 .5 6.0 7.3 7.8 7.8 6.4 5.9 5.5 3.4 4.0 5.1 7.0 6.4 210. * .1 1.6 1.6 1.6 1.7 1.0 .7 .6 6.8 7.9 7.9 8.2 6.9 6.3 5.7 3.4 3.7 5.0 7.0 6.4 220. * .0 1.5 1.5 1.5 1.5 .9 .7 .5 7.7 8.5 8.6 8.6 6.8 6.0 5.3 3.2 3.8 4.8 6.8 6.4 230. * .0 1.4 1.4 1.4 1.4 .8 .6 .5 8.7 8.8 8.8 8.8 7.2 6.1 5.4 3.4 3.9 4.8 7.0 6.8 240. * .0 1.3 1.3 1.3 1.4 .9 .7 .6 9.5 9.7 9.2 9.4 7.3 6.0 5.2 3.5 3.9 4.9 7.4 7.3 250. * .0 1.2 1.2 1.3 2.1 1.6 1.1 1.0 10.2 9.9 10.0 10.1 7.4 5.8 5.3 3.3 4.2 5.3 8.1 8.0 260. * .2 1.4 1.5 2.1 4.2 3.5 3.1 2.9 9.5 9.3 9.6 10.0 6.8 5.1 4.0 2.3 3.2 4.6 7.3 7.4 270. * 1.0 2.4 2.9 4.5 8.1 7.1 6.4 6.2 6.6 6.5 6.9 7.4 4.5 3.5 2.9 .8 1.4 2.3 4.7 4.7 280. * 2.5 3.8 4.9 6.5 10.3 9.2 8.7 8.1 3.2 3.3 3.5 4.1 2.5 2.1 1.8 .0 .2 .7 1.7 1.8 290. * 3.3 4.6 5.6 7.4 10.4 9.1 8.1 8.0 1.1 1.3 1.5 2.2 1.7 1.7 1.7 .0 .0 .0 .3 .3 300. * 3.3 5.1 5.9 7.4 9.3 8.0 7.2 7.0 .7 .8 1.0 1.8 1.7 1.7 1.7 .0 .0 .0 .0 .0 310. * 3.1 5.1 5.9 7.2 8.4 6.9 6.4 6.5 .6 .8 1.1 1.8 1.9 1.9 1.9 .1 .1 .1 .1 .0 320. * 3.2 5.2 5.7 6.7 7.4 6.1 6.1 6.0 .7 .8 1.1 2.0 2.0 2.0 2.0 .1 .1 .1 .1 .0 330. * 3.3 5.1 5.6 6.1 6.9 6.0 6.1 6.0 .8 .9 1.3 2.2 2.2 2.2 2.2 .1 .1 .1 .1 .0 340. * 3.4 5.0 5.2 5.7 6.6 6.3 6.2 5.7 .7 1.0 1.3 2.5 2.5 2.5 2.5 .3 .3 .3 .3 .0 350. * 4.2 5.0 5.2 5.7 6.9 6.2 6.0 5.3 .6 .8 1.2 2.6 2.6 2.6 2.6 .9 .9 .9 .9 .3 360. * 4.8 4.3 4.7 5.3 6.7 6.2 5.4 4.7 .3 .4 .8 2.0 2.0 1.9 1.9 1.8 1.8 1.8 1.8 .8 ------*------------------------------------------------------------------------------------------------------------------------ MAX * 5.3 5.2 5.9 7.4 10.4 9.2 8.7 8.1 10.2 9.9 10.0 10.1 7.4 6.3 5.7 4.9 5.3 6.2 8.1 8.0 DEGR. * 10 320 300 300 290 280 280 280 250 250 250 250 250 210 210 170 170 170 250 250
� PAGE 6 JOB: I25HarmonywithPkgStationPMpackageA RUN: I25HarmonywithPkgStationPMpackageA
MODEL RESULTS -------------
REMARKS : In search of the angle corresponding to the maximum concentration, only the first angle, of the angles with same maximum concentrations, is indicated as maximum.
WIND ANGLE RANGE: 0.-360.
WIND * CONCENTRATION ANGLE * (PPM) (DEGR)* REC41 REC42 REC43 REC44 REC45 REC46 REC47 REC48 REC49 REC50 REC51 REC52 REC53 REC54 REC55 REC56 ------*------------------------------------------------------------------------------------------------ 0. * .4 .2 .0 .0 .0 .2 .2 .2 .2 .1 .1 .1 .1 .1 .0 .0 10. * .8 .5 .1 .0 .0 .0 .0 .0 .0 .2 .2 .2 .2 .1 .1 .0 20. * .9 .7 .2 .2 .1 .1 .1 .1 .1 .2 .2 .3 .3 .1 .1 .1 30. * .9 .8 .3 .2 .2 .2 .2 .2 .2 .3 .3 .3 .4 .2 .2 .2 40. * .9 .6 .3 .3 .3 .2 .2 .2 .2 .4 .4 .4 .5 .3 .3 .3 50. * .8 .6 .3 .3 .3 .3 .3 .3 .3 .3 .3 .3 .5 .3 .3 .3 60. * .7 .6 .3 .3 .3 .3 .3 .3 .3 .3 .3 .3 .6 .4 .3 .3 70. * .9 .8 .6 .6 .6 .6 .3 .3 .3 .3 .3 .4 1.1 .8 .8 .6
Page 5

harmpga2.out 80. * 1.7 1.7 1.8 2.0 2.0 2.0 .7 .4 .3 .3 .5 1.1 2.6 2.5 2.4 2.1 90. * 3.6 3.6 4.4 4.3 4.3 4.4 2.2 1.2 1.1 1.1 1.6 3.1 5.7 4.9 5.0 4.6 100. * 6.0 6.0 7.0 7.0 7.2 7.3 4.3 2.7 2.1 2.1 3.2 5.3 7.9 7.3 6.9 6.5 110. * 7.3 7.0 7.9 7.8 8.0 8.2 5.2 3.8 3.4 3.4 4.4 6.3 8.1 7.1 6.9 6.6 120. * 7.4 7.5 7.6 7.5 7.5 7.5 5.2 4.3 3.8 3.6 4.5 5.8 6.9 6.3 6.0 5.9 130. * 7.0 7.4 6.9 7.0 7.0 7.0 4.9 4.0 3.4 3.4 4.2 5.3 6.0 5.6 5.4 5.6 140. * 7.1 7.4 6.6 6.5 6.5 6.5 4.7 3.8 3.3 3.3 3.9 5.0 5.3 5.0 5.1 5.3 150. * 7.5 7.5 6.3 6.3 6.3 6.3 4.6 3.6 3.3 3.2 3.7 4.0 4.7 5.2 5.2 5.2 160. * 7.5 7.0 5.9 5.9 5.9 6.0 4.2 3.3 3.0 2.7 3.2 3.5 4.6 5.0 4.8 4.8 170. * 7.3 6.6 5.9 5.9 5.9 6.1 4.1 3.2 2.7 2.6 3.1 3.7 4.8 4.8 4.8 4.8 180. * 7.0 6.4 6.0 6.0 6.0 6.0 3.9 3.4 3.0 2.5 2.8 3.9 4.8 4.8 4.8 4.8 190. * 6.3 5.9 5.8 5.8 6.0 5.7 3.9 3.5 3.0 2.5 2.9 3.7 4.8 4.9 4.9 4.9 200. * 5.9 5.8 5.8 6.0 6.2 5.6 4.0 3.2 2.8 2.5 3.0 3.8 4.9 4.9 4.9 4.9 210. * 6.1 6.1 6.1 6.2 6.4 5.5 4.0 3.4 3.0 2.5 3.0 3.8 5.1 5.1 5.1 5.0 220. * 6.3 6.3 6.3 6.7 6.4 5.3 4.2 3.5 3.1 2.5 3.2 4.1 5.3 5.3 5.2 5.0 230. * 6.8 6.7 6.9 6.9 6.6 5.8 4.5 3.4 2.9 2.5 3.1 4.1 5.5 5.5 5.3 5.2 240. * 7.2 7.3 7.4 6.9 6.7 6.1 4.5 3.3 3.0 2.3 3.1 4.2 5.8 5.7 5.5 5.4 250. * 8.2 8.0 7.4 6.8 6.5 6.3 4.2 3.0 2.5 1.9 2.8 4.0 5.9 5.8 5.6 5.4 260. * 7.5 7.2 6.0 5.6 5.5 5.3 3.1 2.1 1.6 1.1 1.9 3.0 4.9 4.8 4.7 4.7 270. * 4.5 4.5 3.5 3.4 3.3 3.3 1.6 1.0 .7 .3 .7 1.5 2.9 2.9 2.8 2.8 280. * 1.7 1.5 1.3 1.2 1.3 1.5 .6 .3 .2 .0 .1 .4 1.2 1.2 1.1 1.0 290. * .3 .3 .2 .4 .3 .6 .2 .2 .2 .0 .0 .0 .3 .3 .2 .2 300. * .0 .0 .0 .1 .2 .5 .2 .2 .2 .0 .0 .0 .0 .0 .0 .0 310. * .0 .0 .0 .1 .1 .4 .2 .2 .2 .0 .0 .0 .0 .0 .0 .0 320. * .0 .0 .0 .1 .1 .3 .2 .2 .2 .0 .0 .0 .0 .0 .0 .0 330. * .0 .0 .1 .1 .1 .3 .2 .2 .2 .0 .0 .0 .0 .0 .0 .0 340. * .0 .0 .0 .1 .1 .2 .2 .2 .2 .0 .0 .0 .0 .0 .0 .0 350. * .1 .0 .0 .0 .1 .2 .2 .2 .2 .1 .1 .1 .1 .0 .0 .0 360. * .4 .2 .0 .0 .0 .2 .2 .2 .2 .1 .1 .1 .1 .1 .0 .0 ------*------------------------------------------------------------------------------------------------ MAX * 8.2 8.0 7.9 7.8 8.0 8.2 5.2 4.3 3.8 3.6 4.5 6.3 8.1 7.3 6.9 6.6 DEGR. * 250 250 110 110 110 110 110 120 120 120 120 110 110 100 100 110
THE HIGHEST CONCENTRATION OF 10.40 PPM OCCURRED AT RECEPTOR REC25.� PAGE 7 JOB: I25HarmonywithPkgStationPMpackageA RUN: I25HarmonywithPkgStationPMpackageA
DATE : 11/22/10 TIME : 11:26:56
RECEPTOR - LINK MATRIX FOR THE ANGLE PRODUCING THE MAXIMUM CONCENTRATION FOR EACH RECEPTOR
* CO/LINK (PPM) * ANGLE (DEGREES) * REC1 REC2 REC3 REC4 REC5 REC6 REC7 REC8 REC9 REC10 REC11 REC12 REC13 REC14 REC15 REC16 REC17 REC18REC19 REC20 LINK # * 70 70 70 70 60 60 60 60 60 70 290 70 70 70 60 40 10 10 10 10 -------*------------------------------------------------------------------------------------------------------------------------ 1 * 1.1 .7 .3 .0 .0 .0 .0 .0 .0 .0 2.0 .0 .0 .0 .0 .0 .0 .0 .0 .0 2 * .2 .1 .0 .0 .0 .0 .0 .0 .0 .0 .4 .0 .0 .0 .0 .0 .0 .0 .0 .0 3 * .0 .0 .0 .0 .0 .0 .0 .0 .0 .0 .0 .0 .0 .0 .0 .0 .0 .0 .0 .0 4 * 2.3 2.0 1.4 .6 .0 .0 .0 .0 .0 .0 2.4 .0 .0 .0 .0 .0 .0 .0 .0 .0 5 * .6 .4 .1 .0 .0 .0 .0 .0 .0 .0 .5 .0 .0 .0 .0 .0 .0 .0 .0 .0 6 * .9 1.3 1.9 2.8 1.9 1.4 1.1 1.1 1.4 1.9 1.1 3.7 3.6 3.6 3.0 2.8 2.5 2.5 1.4 .9 7 * .0 .0 .0 .0 .0 .0 .0 .0 .0 .1 .0 .0 .1 .1 .9 1.3 1.3 .8 .4 .2 8 * 1.2 1.5 1.8 2.1 1.5 1.2 .9 .9 1.1 1.3 .0 1.9 1.9 1.9 1.4 1.6 1.7 1.5 .9 .6 9 * .0 .0 .0 .0 .0 .0 .0 .1 .0 .1 .0 .1 .1 .1 .5 .7 .8 .4 .2 .2 10 * .1 .1 .1 .1 .0 .0 .1 .1 .1 .1 .0 .1 .1 .2 .3 .1 .0 .1 .2 .3 11 * .1 .1 .1 .1 .0 .0 .1 .1 .1 .2 .0 .1 .2 .2 .5 .2 .0 .2 .2 .3 12 * .1 .1 .1 .2 .1 .1 .1 .2 .1 .3 .0 .2 .3 .3 .7 .4 .1 .3 .3 .3 13 * .0 .0 .0 .0 .0 .0 .0 .0 .0 .0 .0 .0 .0 .0 .1 .1 .0 .0 .0 .1 14 * .0 .0 .0 .0 .0 .0 .0 .0 .0 .0 .0 .0 .0 .1 .2 .1 .0 .0
Page 6
harmpga2.out .1 .1 15 * .6 .6 .6 .6 .5 .4 .3 .3 .4 .4 .0 .5 .5 .5 .2 .4 .5 .4 .3 .2 16 * .3 .4 .4 .4 .3 .3 .2 .2 .2 .3 .0 .3 .3 .3 .3 .3 .3 .3 .2 .2 17 * .5 .5 .5 .5 .5 .4 .3 .3 .3 .3 .0 .4 .4 .3 .1 .2 .4 .3 .2 .2 18 * .3 .3 .3 .3 .3 .2 .2 .2 .2 .2 .0 .3 .3 .3 .2 .3 .3 .3 .2 .2 19 * .0 .0 .0 .0 .0 .0 .0 .0 .0 .0 .0 .0 .0 .0 .0 .0 .0 .0 .0 .0 20 * .1 .0 .0 .0 .0 .0 .0 .0 .0 .0 .7 .0 .0 .0 .0 .0 .0 .0 .0 .0 21 * .0 .0 .0 .0 .0 .0 .0 .0 .0 .0 .6 .0 .0 .0 .0 .0 .0 .0 .0 .0 22 * .0 .0 .0 .0 .0 .0 .0 .0 .0 .0 .0 .0 .0 .0 .0 .0 .0 .0 .0 .0 23 * .0 .0 .0 .0 .0 .0 .0 .0 .0 .0 .0 .0 .0 .0 .0 .0 .0 .0 .0 .0 24 * .0 .0 .1 .1 .1 .1 .1 .0 .0 .0 .1 .0 .0 .0 .0 .0 .0 .0 .0 .0 25 * .0 .0 .0 .0 .0 .0 .0 .0 .0 .0 .0 .0 .0 .0 .0 .0 .0 .0 .0 .0 26 * .0 .0 .0 .0 .0 .0 .0 .0 .0 .1 .0 .0 .1 .1 .3 .2 .0 .8 1.0 1.2 27 * .0 .0 .1 .1 .1 .1 .1 .0 .0 .0 .1 .0 .0 .0 .0 .0 .0 .0 .0 .0 28 * .0 .0 .0 .1 .0 .0 .0 .0 .0 .0 .2 .0 .0 .0 .0 .0 .0 .0 .0 .0 29 * .0 .0 .0 .0 .0 .0 .0 .0 .0 .0 .0 .0 .0 .0 .0 .0 .0 .0 .0 .0 30 * .0 .0 .0 .2 .1 .0 .0 .0 .0 .0 .1 .0 .0 .0 .0 .0 .0 .0 .0 .0 31 * .1 .1 .1 .1 .1 .1 .1 .1 .1 .1 .0 .1 .1 .1 .2 .4 .7 .9 .7 .6 32 * .1 .1 .1 .1 .1 .1 .1 .1 .1 .0 .0 .1 .1 .1 .0 .1 .4 .4 .4 .3� PAGE 8 JOB: I25HarmonywithPkgStationPMpackageA RUN: I25HarmonywithPkgStationPMpackageA
DATE : 11/22/10 TIME : 11:26:56
RECEPTOR - LINK MATRIX FOR THE ANGLE PRODUCING THE MAXIMUM CONCENTRATION FOR EACH RECEPTOR
* CO/LINK (PPM) * ANGLE (DEGREES) * REC21 REC22 REC23 REC24 REC25 REC26 REC27 REC28 REC29 REC30 REC31 REC32 REC33 REC34 REC35 REC36 REC37 REC38REC39 REC40 LINK # * 10 320 300 300 290 280 280 280 250 250 250 250 250 210 210 170 170 170 250 250 -------*------------------------------------------------------------------------------------------------------------------------ 1 * .0 .0 .1 .0 .1 .3 .3 .3 .2 .2 .2 .2 .3 .0 .0 .0 .0 .0 .3 .3 2 * .0 .0 .0 .0 .0 .0 .0 .0 .0 .0 .0 .0 .0 .0 .0 .0 .0 .0 .0 .0 3 * .0 .0 .0 .0 .0 .0 .0 .0 .0 .0 .0 .0 .0 .0 .0 .0 .0 .0 .0 .0 4 * .0 .0 .0 .0 .1 .3 .3 .3 .2 .2 .2 .2 .3 .0 .0 .0 .0 .0 .3 .4 5 * .0 .0 .0 .0 .0 .0 .0 .0 .0 .0 .0 .0 .0 .0 .0 .0 .0 .0 .0 .1 6 * .6 1.1 1.5 2.0 2.9 2.5 1.9 1.5 1.1 1.2 1.2 1.1 .8 .8 .7 .3 .3 .4 1.0 .9 7 * .2 .3 .3 .6 .7 .5 .3 .2 .2 .1 .1 .0 .0 .2 .2 .1 .1 .1 .0 .0 8 * .5 .9 1.2 1.6 2.3 1.9 1.7 1.5 1.2 1.4 1.6 1.6 1.1 .8 .8 .3 .4 .6 1.4 1.3 9 * .1 .2 .1 .3 .5 .3 .3 .2 .2 .2 .2 .2 .0 .3 .2 .1 .1 .1 .0 .0 10 * .3 .0 .0 .0 .6 .9 1.3 1.6 .1 .0 .0 .0 .0 .0 .0 .3 .3 .3 .0 .0 11 * .3 .0 .0 .0 .0 .0 .2 .3 .3 .1 .0 .0 .0 .1 .0 .3 .3 .3 .0 .0 12 * .3 .0 .0 .0 .0 .0 .0 .0 2.2 1.9 1.4 .6 .0 .2 .1 .3 .3 .3 .0 .0
Page 7
harmpga2.out 13 * .1 .0 .0 .0 .0 .0 .0 .0 .5 .4 .1 .0 .0 .0 .0 .0 .0 .0 .0 .0 14 * .1 .0 .0 .0 .0 .0 .0 .0 .3 .1 .0 .0 .0 .0 .0 .1 .1 .1 .0 .0 15 * .2 .4 .4 .5 .6 .5 .5 .5 .5 .7 1.0 1.3 .9 .5 .4 .2 .3 .5 1.2 1.2 16 * .2 .2 .2 .3 .4 .3 .3 .3 .8 .8 .8 .8 .5 .3 .3 .2 .3 .4 .7 .6 17 * .1 .4 .4 .5 .5 .3 .4 .4 .4 .5 .8 1.4 1.1 .5 .5 .3 .4 .7 2.0 2.0 18 * .2 .2 .2 .3 .3 .2 .2 .2 1.5 1.5 1.5 1.5 .6 .4 .3 .3 .3 .4 1.0 1.0 19 * .0 .0 .0 .0 .0 .0 .0 .0 .0 .0 .0 .0 .0 .0 .0 .0 .0 .0 .0 .0 20 * .0 .0 .1 .0 .1 .2 .2 .2 .1 .1 .1 .1 .1 .0 .0 .0 .0 .0 .1 .1 21 * .0 .0 .1 .0 .1 .2 .2 .2 .0 .0 .1 .1 .1 .0 .0 .0 .0 .0 .1 .1 22 * .0 .0 .0 .0 .0 .0 .0 .0 .0 .0 .0 .0 .0 .0 .0 .0 .0 .0 .0 .0 23 * .0 .0 .0 .0 .0 .0 .0 .0 .0 .0 .0 .0 .0 .0 .0 .0 .0 .0 .0 .0 24 * .0 .0 .0 .0 .0 .0 .0 .0 .0 .0 .0 .0 .0 .0 .0 .0 .0 .0 .0 .0 25 * .0 .0 .0 .0 .0 .0 .0 .0 .0 .0 .0 .0 .0 .0 .0 .0 .0 .0 .0 .0 26 * 1.3 1.5 1.3 1.3 1.2 .8 .6 .4 .2 .1 .1 .0 .0 .2 .1 .7 .8 1.0 .0 .0 27 * .0 .0 .0 .0 .0 .0 .0 .0 .0 .0 .0 .0 .0 .0 .0 .0 .0 .0 .0 .0 28 * .0 .0 .0 .0 .0 .0 .0 .0 .0 .0 .0 .0 .0 .0 .0 .0 .0 .0 .0 .0 29 * .0 .0 .0 .0 .0 .0 .0 .0 .0 .0 .0 .0 .0 .0 .0 .0 .0 .0 .0 .0 30 * .0 .0 .0 .0 .0 .0 .0 .0 .0 .0 .0 .0 .0 .0 .0 .0 .0 .0 .0 .0 31 * .5 .0 .0 .0 .0 .0 .0 .0 .2 .4 .6 .9 .9 1.2 1.2 1.3 1.2 1.0 .0 .0 32 * .3 .0 .0 .0 .0 .0 .0 .0 .0 .0 .0 .1 .7 .8 .9 .1 .1 .0 .0 .0� PAGE 9 JOB: I25HarmonywithPkgStationPMpackageA RUN: I25HarmonywithPkgStationPMpackageA
DATE : 11/22/10 TIME : 11:26:56
RECEPTOR - LINK MATRIX FOR THE ANGLE PRODUCING THE MAXIMUM CONCENTRATION FOR EACH RECEPTOR
* CO/LINK (PPM) * ANGLE (DEGREES) * REC41 REC42 REC43 REC44 REC45 REC46 REC47 REC48 REC49 REC50 REC51 REC52 REC53 REC54 REC55 REC56 LINK # * 250 250 110 110 110 110 110 120 120 120 120 110 110 100 100 110 -------*------------------------------------------------------------------------------------------------ 1 * .4 .4 .0 .0 .0 .0 .0 .0 .0 .0 .0 .0 .0 .0 .0 .2 2 * .1 .1 .0 .0 .0 .0 .0 .0 .0 .0 .0 .0 .0 .0 .0 .0 3 * .0 .0 .0 .0 .0 .0 .0 .0 .0 .0 .0 .0 .0 .0 .0 .0 4 * .4 .5 .0 .0 .0 .0 .0 .0 .0 .0 .0 .0 .0 .0 .0 .1 5 * .1 .1 .0 .0 .0 .0 .0 .0 .0 .0 .0 .0 .0 .0 .0 .0 6 * .9 .8 .8 .8 .9 1.0 .7 .7 .6 .6 .8 .9 1.1 .7 .8 1.1 7 * .0 .0 .1 .1 .1 .1 .1 .1 .1 .0 .0 .1 .1 .1 .0 .0 8 * 1.3 1.2 1.2 1.3 1.3 1.4 .9 .9 .8 .8 1.0 1.1 1.5 1.1 1.1 1.2 9 * .0 .0 .1 .1 .1 .1 .1 .1 .1 .0 .0 .1 .0 .1 .1 .0 10 * .0 .0 .3 .2 .2 .2 .2 .1 .1 .1 .1 .2 .1 .2 .2 .1 11 * .0 .0 .2 .2 .2 .2 .2 .1 .1 .1 .1 .1 .1 .2 .2 .1 12 * .0 .0 .2 .1 .1 .1 .2 .1 .1 .1 .0 .1 .1 .2 .2 .1 13 * .0 .0 .0 .0 .0 .0 .0 .0 .0 .0 .0 .0 .0 .0 .0 .0 14 * .0 .0 .0 .0 .0 .0 .0 .0 .0 .0 .0 .0 .0 .0 .0 .0 15 * 1.2 1.2 1.2 1.2 1.2 1.2 .7 .6 .5 .5 .6 .9 1.2 1.0 .9 .5 16 * .6 .6 .7 .7 .7 .7 .4 .3 .3 .3 .4 .5 .6 .5 .5 .2 17 * 2.0 1.9 1.9 1.9 2.0 2.0 1.0 .7 .6 .5 .7 1.1 1.3 1.2 .9 .4 18 * 1.0 1.0 1.0 1.0 1.0 1.0 .6 .4 .3 .3 .4 .6 .5 .6 .4 .2 19 * .0 .0 .0 .0 .0 .0 .0 .0 .0 .0 .0 .0 .1 .0 .0 .0 20 * .1 .1 .0 .0 .0 .0 .0 .0 .0 .0 .0 .0 .1 .1 .3 .7 21 * .1 .1 .0 .0 .0 .0 .0 .0 .0 .0 .0 .0 .7 .8 1.1 1.6 22 * .0 .0 .0 .0 .0 .0 .0 .0 .0 .1 .1 .1 .1 .1 .1 .0 23 * .0 .0 .0 .0 .0 .0 .0 .0 .0 .0 .0 .1 .2 .1 .0 .0 24 * .0 .0 .0 .0 .0 .0 .0 .0 .0 .0 .0 .0 .0 .0 .0 .0 25 * .0 .0 .0 .0 .0 .0 .0 .0 .0 .0 .1 .3 .1 .1 .0 .0
Page 8

harmpga2.out 26 * .0 .0 .2 .2 .2 .2 .1 .2 .2 .2 .2 .1 .2 .1 .1 .1 27 * .0 .0 .0 .0 .0 .0 .0 .0 .0 .0 .0 .0 .0 .0 .0 .0 28 * .0 .0 .0 .0 .0 .0 .0 .0 .0 .0 .0 .0 .0 .0 .0 .0 29 * .0 .0 .0 .0 .0 .0 .0 .0 .0 .0 .0 .0 .0 .0 .0 .0 30 * .0 .0 .0 .0 .0 .0 .0 .0 .0 .0 .0 .0 .0 .0 .0 .0 31 * .0 .0 .0 .0 .0 .0 .0 .0 .0 .0 .0 .0 .0 .1 .0 .0 32 * .0 .0 .0 .0 .0 .0 .0 .0 .0 .0 .0 .0 .0 .0 .0 .0
Page 9
harmpkgb.in'I25HarmonywithPkgStationPMpackageB', 60 , 175 , 0 , 0 , 56 , 0.3048 , 1 , 1 'Receptor 1', 979 , 26 , 5 'Receptor 2', 1019 , 26 , 5 'Receptor 3', 1059 , 26 , 5 'Receptor 4', 1099 , 26 , 5 'Receptor 5', 1099 ,-14 , 5 'Receptor 6', 1099 ,-54 , 5 'Receptor 7', 1099 ,-94 , 5 'Receptor 8', 1187 ,-96 , 5 'Receptor 9', 1187 ,-56 , 5 'Receptor 10', 1187 ,-16 , 5 'Receptor 11', 1187 , 24 , 5 'Receptor 12', 1227 , 24 , 5 'Receptor 13', 1267 , 24 , 5 'Receptor 14', 1307 , 24 , 5 'Receptor 15', 1582 , 24 , 5 'Receptor 16', 1622 , 24 , 5 'Receptor 17', 1662 , 24 , 5 'Receptor 18', 1702 , 24 , 5 'Receptor 19', 1702 ,-16 , 5 'Receptor 20', 1702 ,-56 , 5 'Receptor 21', 1702 ,-96 , 5 'Receptor 22', 1778 ,-84 , 5 'Receptor 23', 1778 ,-44 , 5 'Receptor 24', 1778 ,-4 , 5 'Receptor 25', 1778 , 36 , 5 'Receptor 26', 1818 , 36 , 5 'Receptor 27', 1858 , 36 , 5 'Receptor 28', 1898 , 36 , 5 'Receptor 29', 1898 , 196 , 5 'Receptor 30', 1858 , 196 , 5 'Receptor 31', 1818 , 196 , 5 'Receptor 32', 1778 , 196 , 5 'Receptor 33', 1778 , 236 , 5 'Receptor 34', 1778 , 276 , 5 'Receptor 35', 1778 , 316 , 5 'Receptor 36', 1708 , 328 , 5 'Receptor 37', 1708 , 288 , 5 'Receptor 38', 1708 , 248 , 5 'Receptor 39', 1708 , 208 , 5 'Receptor 40', 1668 , 208 , 5 'Receptor 41', 1628 , 208 , 5 'Receptor 42', 1588 , 208 , 5 'Receptor 43', 1301 , 208 , 5 'Receptor 44', 1261 , 208 , 5 'Receptor 45', 1221 , 208 , 5 'Receptor 46', 1181 , 208 , 5 'Receptor 47', 1181 , 248 , 5 'Receptor 48', 1181 , 288 , 5 'Receptor 49', 1181 , 316 , 5 'Receptor 50', 1093 , 330.4 , 5 'Receptor 51', 1093 , 279.9 , 5 'Receptor 52', 1093 , 233.9 , 5 'Receptor 53', 1093 , 202 , 5 'Receptor 54', 1053 , 202 , 5 'Receptor 55', 1013 , 202 , 5 'Receptor 56', 973 , 202 , 5 'I25HarmonywithPkgStationPMpackageB', 32 , 1 , 1 ,'CO' 1 'harmebapp1','AG', 240 , 88 , 1140 , 88 , 1715 , 48.8 , 0 , 44 2 'harmebapp1 q','AG', 1109 , 88 , 240 , 88 , 0 , 24 , 2 100 , 34 , 2 , 1673 , 143.34 , 1600 , 1 , 3 2 'harmebltturn','AG', 1109 , 106 , 909 , 106 , 0 , 12 , 1 100 , 31 , 2 , 30 , 143.34 , 1600 , 1 , 3 1 'harmebapp2','AG', 240 , 64 , 1140 , 64 , 1715 , 48.8 , 0 , 44 2 'harmebapp2 q','AG', 1109 , 64 , 240 , 64 , 0 , 24 , 2 100 , 34 , 2 , 1673 , 143.34 , 1600 , 1 , 3 1 'harmebdep/app','AG', 1140 , 62 , 1740 , 62 , 1800 , 48.8 , 0 , 56 2 'harmebdep/app q','AG', 1712 , 62 , 1177 , 62 , 0 , 36 , 3 100 , 45 , 2 , 1105 , 143.34 , 1600 , 1 , 3 1 'harmebdep/app2','AG', 1140 , 98 , 1740 , 98 , 1800 , 48.8 , 0 , 56 2 'harmebdep/app2 q','AG', 1712 , 98 , 1177 , 98 , 0 , 36 , 3 100 , 45 , 2 , 1105 , 143.34 , 1600 , 1 , 3
Page 1
harmpkgb.in 1 'harmebdep','AG', 1740 , 74 , 2240 , 74 , 1335 , 48.8 , 0 , 56 1 'harmebdep2','AG', 1740 , 104 , 2240 , 104 , 1335 , 48.8 , 0 , 44 1 'harmwbapp1','AG', 2240 , 158 , 1740 , 158 , 2695 , 48.8 , 0 , 56 2 'harmwbque1','AG', 1774 , 158 , 2240 , 158 , 0 , 36 , 3 100 , 23 , 2 , 2215 , 143.34 , 1600 , 1 , 3 2 'harmwbltturn','AG', 1774 , 128 , 1970 , 128 , 0 , 24 , 2 100 , 77 , 2 , 480 , 143.34 , 1600 , 1 , 3 1 'harmwbdep/app','AG', 1740 , 152 , 1140 , 152 , 1595 , 48.8 , 0 , 44 2 'harmwbdep/app q','AG', 1171 , 152 , 1712 , 152 , 0 , 24 , 2 100 , 32 , 2 , 1533 , 143.34 , 1600 , 1 , 3 1 'harmwbdep/app2','AG', 1740 , 176 , 1140 , 176 , 1595 , 48.8 , 0 , 44 2 'harmwbdep/app2 q','AG', 1171 , 176 , 1740 , 176 , 0 , 24 , 2 100 , 32 , 2 , 1533 , 143.34 , 1600 , 1 , 3 2 'harmwbltturn2','AG', 1171 , 134 , 1471 , 134 , 0 , 12 , 1 100 , 28 , 2 , 70 , 143.34 , 1600 , 1 , 3 1 'harmwbdep','AG', 1140 , 146 , 240 , 146 , 1625 , 48.8 , 0 , 44 1 'harmwbdep2','AG', 1140 , 170 , 240 , 170 , 1625 , 48.8 , 0 , 44 1 'pkgsbapp','AG', 1125 , 1124 , 1125 , 124 , 300 , 22.5 , 0 , 44 2 'pkgsbapp q','AG', 1125 , 198 , 1125 , 1124 , 0 , 24 , 2 100 , 76 , 2 , 30 , 143.34 , 1600 , 1 , 3 1 'pkgsbdep','AG', 1125 , 124 , 1125 ,-376 , 155 , 22.5 , 0 , 32 2 'pkgsbleftturn','AG', 1143 , 198 , 1143 , 398 , 0 , 12 , 1 100 , 76 , 2 , 120 , 143.34 , 1600 , 1 , 3 1 'i25sbrampdep','AG', 1740 , 124 , 1740 ,-876 , 1870 , 22.5 , 0 , 56 1 'pkgnbapp','AG', 1155 ,-376 , 1155 , 124 , 185 , 23 , 0 , 44 2 'pkgnbapp q','AG', 1155 , 34 , 1155 ,-376 , 0 , 24 , 2 100 , 85 , 2 , 15 , 143.34 , 1600 , 1 , 3 1 'pkgnbdep','AG', 1155 , 124 , 1155 , 1124 , 100 , 23 , 0 , 32 2 'pkgnbleftturn','AG', 1137 , 34 , 1137 ,-66 , 0 , 12 , 1 100 , 85 , 2 , 35 , 143.34 , 1600 , 1 , 3 1 'i25sbrampapp','AG', 1740 , 1124 , 1740 , 124 , 1435 , 22.5 , 0 , 56 2 'i25sbrampleftturn','AG', 1758 , 198 , 1758 , 398 , 0 , 12 , 1 100 , 78 , 2 , 460 , 143.34 , 1600 , 1 , 3 1 , 0 , 4 , 1000 , 0 ,'Y', 10 , 0 , 36
Page 2
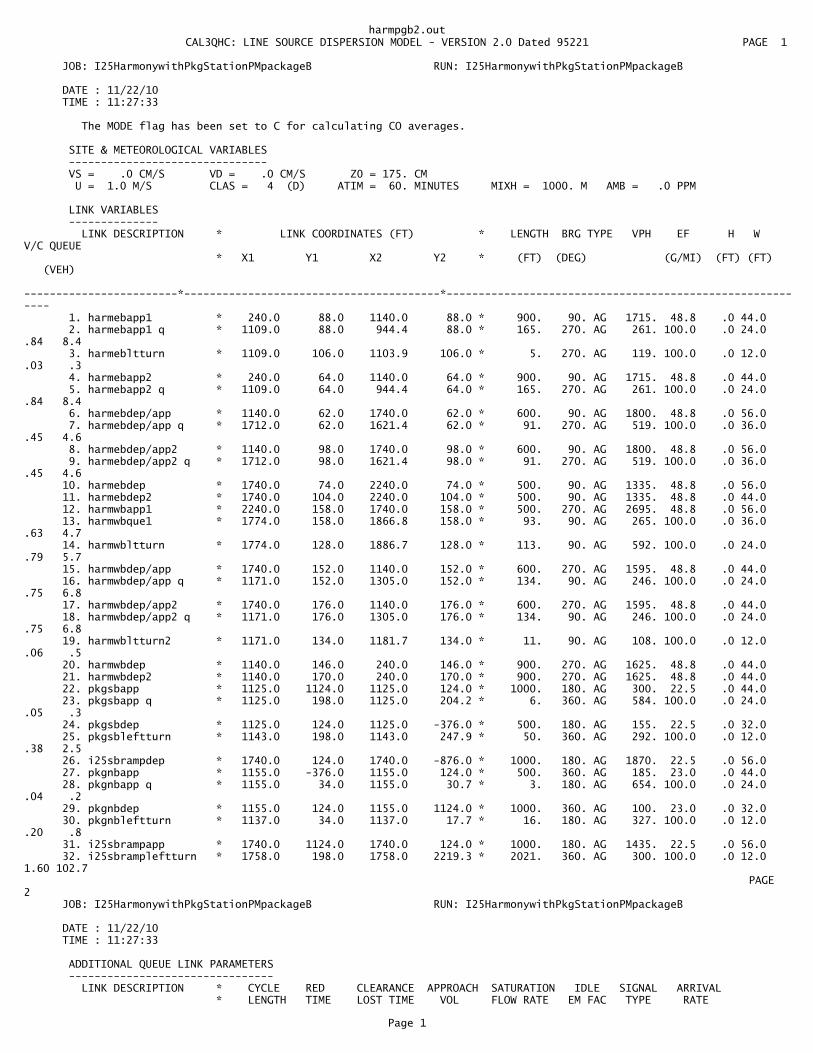
harmpgb2.out� CAL3QHC: LINE SOURCE DISPERSION MODEL - VERSION 2.0 Dated 95221 PAGE 1
JOB: I25HarmonywithPkgStationPMpackageB RUN: I25HarmonywithPkgStationPMpackageB
DATE : 11/22/10 TIME : 11:27:33
The MODE flag has been set to C for calculating CO averages.
SITE & METEOROLOGICAL VARIABLES ------------------------------- VS = .0 CM/S VD = .0 CM/S Z0 = 175. CM U = 1.0 M/S CLAS = 4 (D) ATIM = 60. MINUTES MIXH = 1000. M AMB = .0 PPM
LINK VARIABLES -------------- LINK DESCRIPTION * LINK COORDINATES (FT) * LENGTH BRG TYPE VPH EF H W V/C QUEUE * X1 Y1 X2 Y2 * (FT) (DEG) (G/MI) (FT) (FT) (VEH) ------------------------*----------------------------------------*---------------------------------------------------------- 1. harmebapp1 * 240.0 88.0 1140.0 88.0 * 900. 90. AG 1715. 48.8 .0 44.0 2. harmebapp1 q * 1109.0 88.0 944.4 88.0 * 165. 270. AG 261. 100.0 .0 24.0 .84 8.4 3. harmebltturn * 1109.0 106.0 1103.9 106.0 * 5. 270. AG 119. 100.0 .0 12.0 .03 .3 4. harmebapp2 * 240.0 64.0 1140.0 64.0 * 900. 90. AG 1715. 48.8 .0 44.0 5. harmebapp2 q * 1109.0 64.0 944.4 64.0 * 165. 270. AG 261. 100.0 .0 24.0 .84 8.4 6. harmebdep/app * 1140.0 62.0 1740.0 62.0 * 600. 90. AG 1800. 48.8 .0 56.0 7. harmebdep/app q * 1712.0 62.0 1621.4 62.0 * 91. 270. AG 519. 100.0 .0 36.0 .45 4.6 8. harmebdep/app2 * 1140.0 98.0 1740.0 98.0 * 600. 90. AG 1800. 48.8 .0 56.0 9. harmebdep/app2 q * 1712.0 98.0 1621.4 98.0 * 91. 270. AG 519. 100.0 .0 36.0 .45 4.6 10. harmebdep * 1740.0 74.0 2240.0 74.0 * 500. 90. AG 1335. 48.8 .0 56.0 11. harmebdep2 * 1740.0 104.0 2240.0 104.0 * 500. 90. AG 1335. 48.8 .0 44.0 12. harmwbapp1 * 2240.0 158.0 1740.0 158.0 * 500. 270. AG 2695. 48.8 .0 56.0 13. harmwbque1 * 1774.0 158.0 1866.8 158.0 * 93. 90. AG 265. 100.0 .0 36.0 .63 4.7 14. harmwbltturn * 1774.0 128.0 1886.7 128.0 * 113. 90. AG 592. 100.0 .0 24.0 .79 5.7 15. harmwbdep/app * 1740.0 152.0 1140.0 152.0 * 600. 270. AG 1595. 48.8 .0 44.0 16. harmwbdep/app q * 1171.0 152.0 1305.0 152.0 * 134. 90. AG 246. 100.0 .0 24.0 .75 6.8 17. harmwbdep/app2 * 1740.0 176.0 1140.0 176.0 * 600. 270. AG 1595. 48.8 .0 44.0 18. harmwbdep/app2 q * 1171.0 176.0 1305.0 176.0 * 134. 90. AG 246. 100.0 .0 24.0 .75 6.8 19. harmwbltturn2 * 1171.0 134.0 1181.7 134.0 * 11. 90. AG 108. 100.0 .0 12.0 .06 .5 20. harmwbdep * 1140.0 146.0 240.0 146.0 * 900. 270. AG 1625. 48.8 .0 44.0 21. harmwbdep2 * 1140.0 170.0 240.0 170.0 * 900. 270. AG 1625. 48.8 .0 44.0 22. pkgsbapp * 1125.0 1124.0 1125.0 124.0 * 1000. 180. AG 300. 22.5 .0 44.0 23. pkgsbapp q * 1125.0 198.0 1125.0 204.2 * 6. 360. AG 584. 100.0 .0 24.0 .05 .3 24. pkgsbdep * 1125.0 124.0 1125.0 -376.0 * 500. 180. AG 155. 22.5 .0 32.0 25. pkgsbleftturn * 1143.0 198.0 1143.0 247.9 * 50. 360. AG 292. 100.0 .0 12.0 .38 2.5 26. i25sbrampdep * 1740.0 124.0 1740.0 -876.0 * 1000. 180. AG 1870. 22.5 .0 56.0 27. pkgnbapp * 1155.0 -376.0 1155.0 124.0 * 500. 360. AG 185. 23.0 .0 44.0 28. pkgnbapp q * 1155.0 34.0 1155.0 30.7 * 3. 180. AG 654. 100.0 .0 24.0 .04 .2 29. pkgnbdep * 1155.0 124.0 1155.0 1124.0 * 1000. 360. AG 100. 23.0 .0 32.0 30. pkgnbleftturn * 1137.0 34.0 1137.0 17.7 * 16. 180. AG 327. 100.0 .0 12.0 .20 .8 31. i25sbrampapp * 1740.0 1124.0 1740.0 124.0 * 1000. 180. AG 1435. 22.5 .0 56.0 32. i25sbrampleftturn * 1758.0 198.0 1758.0 2219.3 * 2021. 360. AG 300. 100.0 .0 12.0 1.60 102.7� PAGE 2 JOB: I25HarmonywithPkgStationPMpackageB RUN: I25HarmonywithPkgStationPMpackageB
DATE : 11/22/10 TIME : 11:27:33
ADDITIONAL QUEUE LINK PARAMETERS -------------------------------- LINK DESCRIPTION * CYCLE RED CLEARANCE APPROACH SATURATION IDLE SIGNAL ARRIVAL * LENGTH TIME LOST TIME VOL FLOW RATE EM FAC TYPE RATE
Page 1

harmpgb2.out * (SEC) (SEC) (SEC) (VPH) (VPH) (gm/hr) ------------------------*-------------------------------------------------------------------------------- 2. harmebapp1 q * 100 34 2.0 1673 1600 143.34 1 3 3. harmebltturn * 100 31 2.0 30 1600 143.34 1 3 5. harmebapp2 q * 100 34 2.0 1673 1600 143.34 1 3 7. harmebdep/app q * 100 45 2.0 1105 1600 143.34 1 3 9. harmebdep/app2 q * 100 45 2.0 1105 1600 143.34 1 3 13. harmwbque1 * 100 23 2.0 2215 1600 143.34 1 3 14. harmwbltturn * 100 77 2.0 480 1600 143.34 1 3 16. harmwbdep/app q * 100 32 2.0 1533 1600 143.34 1 3 18. harmwbdep/app2 q * 100 32 2.0 1533 1600 143.34 1 3 19. harmwbltturn2 * 100 28 2.0 70 1600 143.34 1 3 23. pkgsbapp q * 100 76 2.0 30 1600 143.34 1 3 25. pkgsbleftturn * 100 76 2.0 120 1600 143.34 1 3 28. pkgnbapp q * 100 85 2.0 15 1600 143.34 1 3 30. pkgnbleftturn * 100 85 2.0 35 1600 143.34 1 3 32. i25sbrampleftturn * 100 78 2.0 460 1600 143.34 1 3
RECEPTOR LOCATIONS ------------------ * COORDINATES (FT) * RECEPTOR * X Y Z * -------------------------*-------------------------------------* 1. Receptor 1 * 979.0 26.0 5.0 * 2. Receptor 2 * 1019.0 26.0 5.0 * 3. Receptor 3 * 1059.0 26.0 5.0 * 4. Receptor 4 * 1099.0 26.0 5.0 * 5. Receptor 5 * 1099.0 -14.0 5.0 * 6. Receptor 6 * 1099.0 -54.0 5.0 * 7. Receptor 7 * 1099.0 -94.0 5.0 * 8. Receptor 8 * 1187.0 -96.0 5.0 * 9. Receptor 9 * 1187.0 -56.0 5.0 * 10. Receptor 10 * 1187.0 -16.0 5.0 * 11. Receptor 11 * 1187.0 24.0 5.0 * 12. Receptor 12 * 1227.0 24.0 5.0 * 13. Receptor 13 * 1267.0 24.0 5.0 * 14. Receptor 14 * 1307.0 24.0 5.0 * 15. Receptor 15 * 1582.0 24.0 5.0 * 16. Receptor 16 * 1622.0 24.0 5.0 * 17. Receptor 17 * 1662.0 24.0 5.0 * 18. Receptor 18 * 1702.0 24.0 5.0 * 19. Receptor 19 * 1702.0 -16.0 5.0 * 20. Receptor 20 * 1702.0 -56.0 5.0 * 21. Receptor 21 * 1702.0 -96.0 5.0 * 22. Receptor 22 * 1778.0 -84.0 5.0 * 23. Receptor 23 * 1778.0 -44.0 5.0 * 24. Receptor 24 * 1778.0 -4.0 5.0 * 25. Receptor 25 * 1778.0 36.0 5.0 * 26. Receptor 26 * 1818.0 36.0 5.0 * 27. Receptor 27 * 1858.0 36.0 5.0 * 28. Receptor 28 * 1898.0 36.0 5.0 * 29. Receptor 29 * 1898.0 196.0 5.0 * 30. Receptor 30 * 1858.0 196.0 5.0 *� PAGE 3 JOB: I25HarmonywithPkgStationPMpackageB RUN: I25HarmonywithPkgStationPMpackageB
DATE : 11/22/10 TIME : 11:27:33
RECEPTOR LOCATIONS ------------------ * COORDINATES (FT) * RECEPTOR * X Y Z * -------------------------*-------------------------------------* 31. Receptor 31 * 1818.0 196.0 5.0 * 32. Receptor 32 * 1778.0 196.0 5.0 * 33. Receptor 33 * 1778.0 236.0 5.0 * 34. Receptor 34 * 1778.0 276.0 5.0 * 35. Receptor 35 * 1778.0 316.0 5.0 * 36. Receptor 36 * 1708.0 328.0 5.0 * 37. Receptor 37 * 1708.0 288.0 5.0 * 38. Receptor 38 * 1708.0 248.0 5.0 * 39. Receptor 39 * 1708.0 208.0 5.0 * 40. Receptor 40 * 1668.0 208.0 5.0 * 41. Receptor 41 * 1628.0 208.0 5.0 * 42. Receptor 42 * 1588.0 208.0 5.0 * 43. Receptor 43 * 1301.0 208.0 5.0 * 44. Receptor 44 * 1261.0 208.0 5.0 * 45. Receptor 45 * 1221.0 208.0 5.0 *
Page 2

harmpgb2.out 46. Receptor 46 * 1181.0 208.0 5.0 * 47. Receptor 47 * 1181.0 248.0 5.0 * 48. Receptor 48 * 1181.0 288.0 5.0 * 49. Receptor 49 * 1181.0 316.0 5.0 * 50. Receptor 50 * 1093.0 330.4 5.0 * 51. Receptor 51 * 1093.0 279.9 5.0 * 52. Receptor 52 * 1093.0 233.9 5.0 * 53. Receptor 53 * 1093.0 202.0 5.0 * 54. Receptor 54 * 1053.0 202.0 5.0 * 55. Receptor 55 * 1013.0 202.0 5.0 * 56. Receptor 56 * 973.0 202.0 5.0 *� PAGE 4 JOB: I25HarmonywithPkgStationPMpackageB RUN: I25HarmonywithPkgStationPMpackageB
MODEL RESULTS -------------
REMARKS : In search of the angle corresponding to the maximum concentration, only the first angle, of the angles with same maximum concentrations, is indicated as maximum.
WIND ANGLE RANGE: 0.-360.
WIND * CONCENTRATION ANGLE * (PPM) (DEGR)* REC1 REC2 REC3 REC4 REC5 REC6 REC7 REC8 REC9 REC10 REC11 REC12 REC13 REC14 REC15 REC16 REC17 REC18 REC19 REC20 ------*------------------------------------------------------------------------------------------------------------------------ 0. * 6.7 6.8 6.8 6.6 4.7 3.8 3.1 3.3 3.9 4.6 6.3 6.3 6.2 6.0 6.0 7.3 8.6 8.9 6.5 5.5 10. * 6.8 6.8 6.8 6.6 4.7 3.9 3.5 3.0 3.6 4.6 6.1 6.2 6.1 5.9 6.3 7.9 8.8 8.9 6.9 5.8 20. * 6.9 6.9 7.0 6.7 5.1 4.2 3.5 3.2 3.7 4.7 6.3 6.4 6.2 6.0 6.7 8.4 8.6 8.5 6.3 5.2 30. * 7.2 7.4 7.4 6.7 5.1 4.3 3.6 3.4 3.9 4.7 6.6 6.4 6.2 6.3 7.2 8.9 8.8 8.1 6.0 4.7 40. * 7.6 7.7 7.6 7.1 5.3 4.2 3.7 3.4 3.8 5.0 6.8 6.7 6.6 6.6 8.0 9.3 9.1 7.7 5.6 4.6 50. * 8.2 8.0 8.1 7.3 5.7 4.3 3.7 3.5 4.1 5.1 7.2 7.1 7.1 7.2 8.8 9.2 8.9 7.8 5.4 4.3 60. * 8.7 8.6 8.3 7.8 5.6 4.5 3.9 3.5 4.4 5.3 7.6 7.6 7.6 7.6 9.1 9.1 8.3 7.6 4.9 4.0 70. * 9.0 8.5 8.3 8.4 5.6 4.4 3.8 3.3 4.2 5.6 8.0 8.3 8.2 8.3 8.9 8.3 7.7 6.6 4.2 3.2 80. * 7.9 7.5 7.8 8.0 4.9 3.5 2.3 2.1 3.1 4.4 7.7 7.5 7.4 7.4 7.0 6.3 5.7 5.3 3.1 2.3 90. * 4.6 4.9 5.1 5.5 2.6 1.7 1.2 .8 1.2 2.2 4.9 4.9 4.6 4.6 3.9 3.5 3.2 3.3 1.9 1.5 100. * 1.8 1.9 2.2 2.5 1.1 .6 .4 .2 .4 .8 1.7 1.8 1.9 1.8 1.8 1.6 1.6 1.7 1.3 1.2 110. * .5 .5 .8 .9 .4 .4 .4 .2 .2 .2 .5 .5 .5 .5 .7 .8 1.0 1.2 1.1 1.1 120. * .2 .2 .4 .6 .4 .4 .4 .2 .2 .2 .3 .3 .3 .3 .6 .7 .9 1.2 1.2 1.2 130. * .1 .2 .4 .4 .4 .4 .4 .2 .2 .2 .3 .3 .3 .3 .6 .7 .9 1.3 1.3 1.3 140. * .1 .2 .3 .3 .3 .3 .3 .1 .2 .2 .2 .2 .2 .2 .5 .6 .9 1.4 1.4 1.4 150. * .0 .0 .2 .3 .3 .2 .2 .1 .1 .1 .1 .1 .2 .2 .5 .7 .9 1.6 1.6 1.6 160. * .0 .0 .2 .2 .2 .2 .2 .0 .0 .0 .0 .0 .1 .1 .5 .7 1.0 1.8 1.8 1.8 170. * .0 .0 .0 .2 .2 .2 .2 .0 .0 .0 .0 .0 .0 .0 .4 .5 .8 1.8 1.8 1.8 180. * .0 .0 .0 .1 .1 .1 .1 .1 .1 .1 .1 .0 .0 .0 .1 .3 .5 1.3 1.3 1.2 190. * .0 .0 .0 .0 .0 .0 .0 .1 .2 .2 .3 .1 .0 .0 .0 .1 .2 .6 .6 .6 200. * .0 .0 .0 .0 .0 .0 .0 .3 .3 .3 .3 .1 .0 .0 .0 .0 .0 .2 .2 .2 210. * .0 .0 .0 .0 .0 .0 .0 .3 .3 .3 .3 .1 .1 .0 .0 .0 .0 .0 .0 .0 220. * .0 .0 .0 .0 .0 .0 .0 .2 .2 .2 .2 .1 .1 .0 .0 .0 .0 .0 .0 .0 230. * .0 .0 .0 .0 .0 .0 .0 .2 .2 .2 .2 .2 .2 .1 .1 .1 .1 .1 .0 .0 240. * .0 .0 .0 .0 .0 .0 .0 .2 .2 .2 .2 .2 .2 .1 .1 .1 .1 .1
Page 3
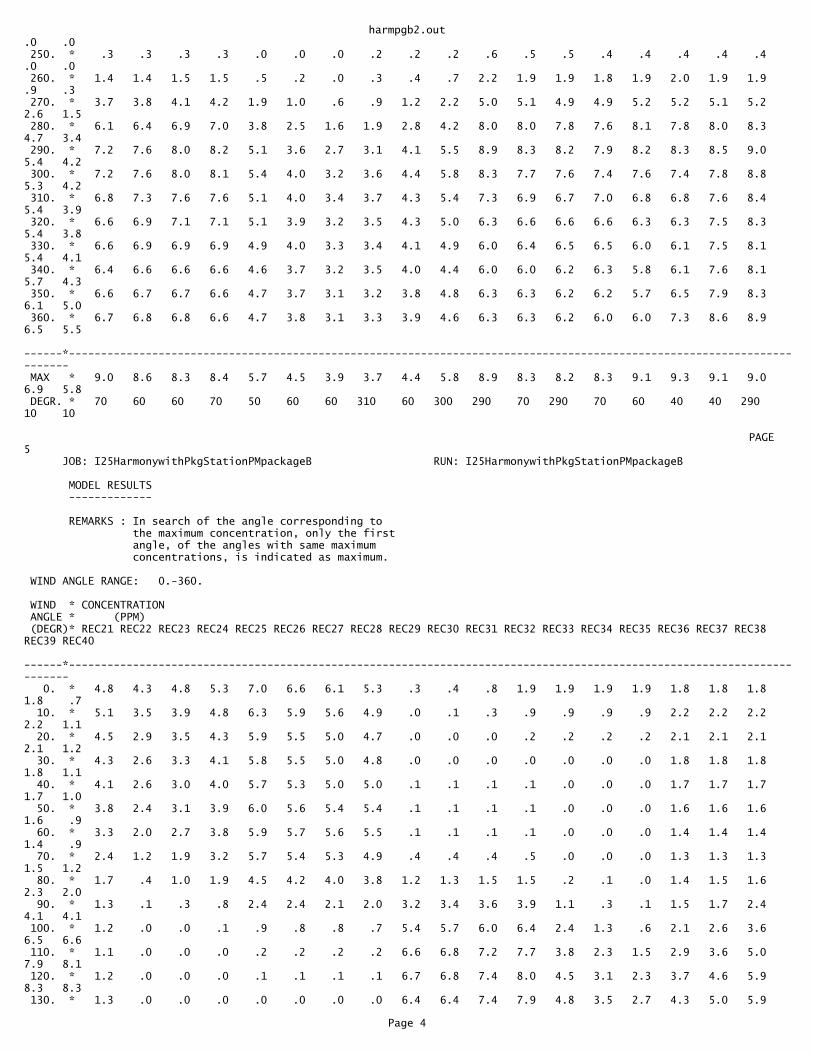
harmpgb2.out.0 .0 250. * .3 .3 .3 .3 .0 .0 .0 .2 .2 .2 .6 .5 .5 .4 .4 .4 .4 .4 .0 .0 260. * 1.4 1.4 1.5 1.5 .5 .2 .0 .3 .4 .7 2.2 1.9 1.9 1.8 1.9 2.0 1.9 1.9 .9 .3 270. * 3.7 3.8 4.1 4.2 1.9 1.0 .6 .9 1.2 2.2 5.0 5.1 4.9 4.9 5.2 5.2 5.1 5.2 2.6 1.5 280. * 6.1 6.4 6.9 7.0 3.8 2.5 1.6 1.9 2.8 4.2 8.0 8.0 7.8 7.6 8.1 7.8 8.0 8.3 4.7 3.4 290. * 7.2 7.6 8.0 8.2 5.1 3.6 2.7 3.1 4.1 5.5 8.9 8.3 8.2 7.9 8.2 8.3 8.5 9.0 5.4 4.2 300. * 7.2 7.6 8.0 8.1 5.4 4.0 3.2 3.6 4.4 5.8 8.3 7.7 7.6 7.4 7.6 7.4 7.8 8.8 5.3 4.2 310. * 6.8 7.3 7.6 7.6 5.1 4.0 3.4 3.7 4.3 5.4 7.3 6.9 6.7 7.0 6.8 6.8 7.6 8.4 5.4 3.9 320. * 6.6 6.9 7.1 7.1 5.1 3.9 3.2 3.5 4.3 5.0 6.3 6.6 6.6 6.6 6.3 6.3 7.5 8.3 5.4 3.8 330. * 6.6 6.9 6.9 6.9 4.9 4.0 3.3 3.4 4.1 4.9 6.0 6.4 6.5 6.5 6.0 6.1 7.5 8.1 5.4 4.1 340. * 6.4 6.6 6.6 6.6 4.6 3.7 3.2 3.5 4.0 4.4 6.0 6.0 6.2 6.3 5.8 6.1 7.6 8.1 5.7 4.3 350. * 6.6 6.7 6.7 6.6 4.7 3.7 3.1 3.2 3.8 4.8 6.3 6.3 6.2 6.2 5.7 6.5 7.9 8.3 6.1 5.0 360. * 6.7 6.8 6.8 6.6 4.7 3.8 3.1 3.3 3.9 4.6 6.3 6.3 6.2 6.0 6.0 7.3 8.6 8.9 6.5 5.5 ------*------------------------------------------------------------------------------------------------------------------------ MAX * 9.0 8.6 8.3 8.4 5.7 4.5 3.9 3.7 4.4 5.8 8.9 8.3 8.2 8.3 9.1 9.3 9.1 9.0 6.9 5.8 DEGR. * 70 60 60 70 50 60 60 310 60 300 290 70 290 70 60 40 40 290 10 10
� PAGE 5 JOB: I25HarmonywithPkgStationPMpackageB RUN: I25HarmonywithPkgStationPMpackageB
MODEL RESULTS -------------
REMARKS : In search of the angle corresponding to the maximum concentration, only the first angle, of the angles with same maximum concentrations, is indicated as maximum.
WIND ANGLE RANGE: 0.-360.
WIND * CONCENTRATION ANGLE * (PPM) (DEGR)* REC21 REC22 REC23 REC24 REC25 REC26 REC27 REC28 REC29 REC30 REC31 REC32 REC33 REC34 REC35 REC36 REC37 REC38 REC39 REC40 ------*------------------------------------------------------------------------------------------------------------------------ 0. * 4.8 4.3 4.8 5.3 7.0 6.6 6.1 5.3 .3 .4 .8 1.9 1.9 1.9 1.9 1.8 1.8 1.8 1.8 .7 10. * 5.1 3.5 3.9 4.8 6.3 5.9 5.6 4.9 .0 .1 .3 .9 .9 .9 .9 2.2 2.2 2.2 2.2 1.1 20. * 4.5 2.9 3.5 4.3 5.9 5.5 5.0 4.7 .0 .0 .0 .2 .2 .2 .2 2.1 2.1 2.1 2.1 1.2 30. * 4.3 2.6 3.3 4.1 5.8 5.5 5.0 4.8 .0 .0 .0 .0 .0 .0 .0 1.8 1.8 1.8 1.8 1.1 40. * 4.1 2.6 3.0 4.0 5.7 5.3 5.0 5.0 .1 .1 .1 .1 .0 .0 .0 1.7 1.7 1.7 1.7 1.0 50. * 3.8 2.4 3.1 3.9 6.0 5.6 5.4 5.4 .1 .1 .1 .1 .0 .0 .0 1.6 1.6 1.6 1.6 .9 60. * 3.3 2.0 2.7 3.8 5.9 5.7 5.6 5.5 .1 .1 .1 .1 .0 .0 .0 1.4 1.4 1.4 1.4 .9 70. * 2.4 1.2 1.9 3.2 5.7 5.4 5.3 4.9 .4 .4 .4 .5 .0 .0 .0 1.3 1.3 1.3 1.5 1.2 80. * 1.7 .4 1.0 1.9 4.5 4.2 4.0 3.8 1.2 1.3 1.5 1.5 .2 .1 .0 1.4 1.5 1.6 2.3 2.0 90. * 1.3 .1 .3 .8 2.4 2.4 2.1 2.0 3.2 3.4 3.6 3.9 1.1 .3 .1 1.5 1.7 2.4 4.1 4.1 100. * 1.2 .0 .0 .1 .9 .8 .8 .7 5.4 5.7 6.0 6.4 2.4 1.3 .6 2.1 2.6 3.6 6.5 6.6 110. * 1.1 .0 .0 .0 .2 .2 .2 .2 6.6 6.8 7.2 7.7 3.8 2.3 1.5 2.9 3.6 5.0 7.9 8.1 120. * 1.2 .0 .0 .0 .1 .1 .1 .1 6.7 6.8 7.4 8.0 4.5 3.1 2.3 3.7 4.6 5.9 8.3 8.3 130. * 1.3 .0 .0 .0 .0 .0 .0 .0 6.4 6.4 7.4 7.9 4.8 3.5 2.7 4.3 5.0 5.9
Page 4
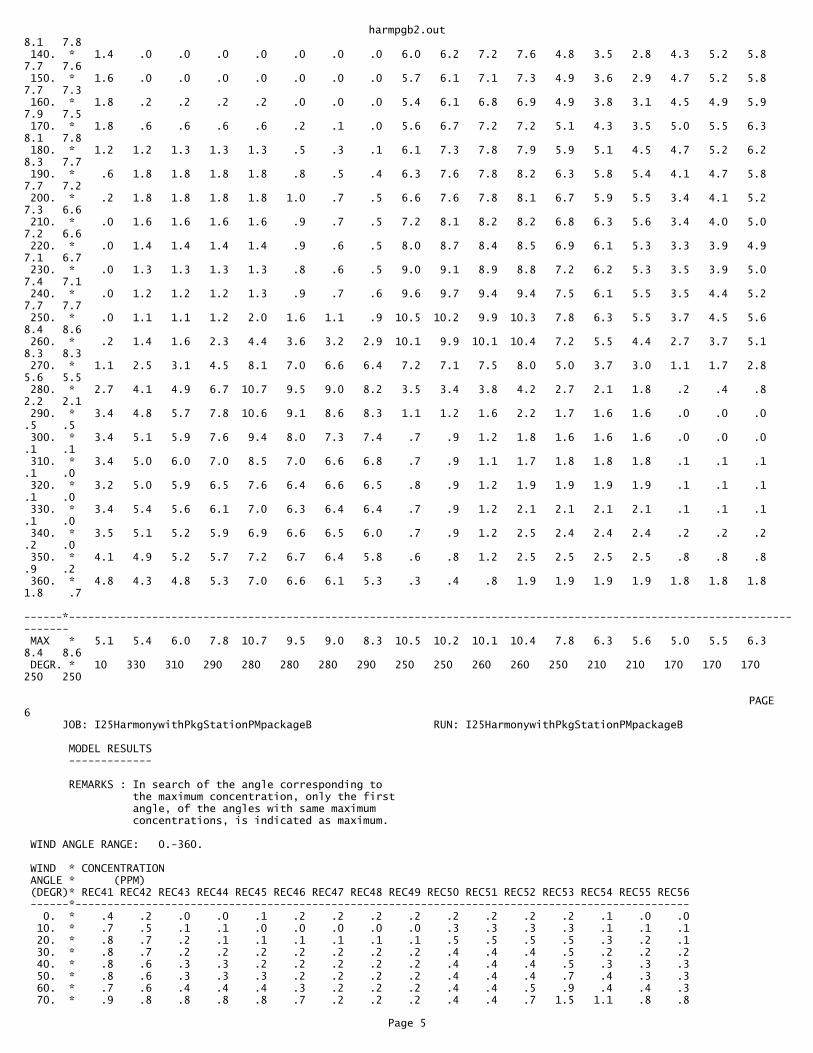
harmpgb2.out8.1 7.8 140. * 1.4 .0 .0 .0 .0 .0 .0 .0 6.0 6.2 7.2 7.6 4.8 3.5 2.8 4.3 5.2 5.8 7.7 7.6 150. * 1.6 .0 .0 .0 .0 .0 .0 .0 5.7 6.1 7.1 7.3 4.9 3.6 2.9 4.7 5.2 5.8 7.7 7.3 160. * 1.8 .2 .2 .2 .2 .0 .0 .0 5.4 6.1 6.8 6.9 4.9 3.8 3.1 4.5 4.9 5.9 7.9 7.5 170. * 1.8 .6 .6 .6 .6 .2 .1 .0 5.6 6.7 7.2 7.2 5.1 4.3 3.5 5.0 5.5 6.3 8.1 7.8 180. * 1.2 1.2 1.3 1.3 1.3 .5 .3 .1 6.1 7.3 7.8 7.9 5.9 5.1 4.5 4.7 5.2 6.2 8.3 7.7 190. * .6 1.8 1.8 1.8 1.8 .8 .5 .4 6.3 7.6 7.8 8.2 6.3 5.8 5.4 4.1 4.7 5.8 7.7 7.2 200. * .2 1.8 1.8 1.8 1.8 1.0 .7 .5 6.6 7.6 7.8 8.1 6.7 5.9 5.5 3.4 4.1 5.2 7.3 6.6 210. * .0 1.6 1.6 1.6 1.6 .9 .7 .5 7.2 8.1 8.2 8.2 6.8 6.3 5.6 3.4 4.0 5.0 7.2 6.6 220. * .0 1.4 1.4 1.4 1.4 .9 .6 .5 8.0 8.7 8.4 8.5 6.9 6.1 5.3 3.3 3.9 4.9 7.1 6.7 230. * .0 1.3 1.3 1.3 1.3 .8 .6 .5 9.0 9.1 8.9 8.8 7.2 6.2 5.3 3.5 3.9 5.0 7.4 7.1 240. * .0 1.2 1.2 1.2 1.3 .9 .7 .6 9.6 9.7 9.4 9.4 7.5 6.1 5.5 3.5 4.4 5.2 7.7 7.7 250. * .0 1.1 1.1 1.2 2.0 1.6 1.1 .9 10.5 10.2 9.9 10.3 7.8 6.3 5.5 3.7 4.5 5.6 8.4 8.6 260. * .2 1.4 1.6 2.3 4.4 3.6 3.2 2.9 10.1 9.9 10.1 10.4 7.2 5.5 4.4 2.7 3.7 5.1 8.3 8.3 270. * 1.1 2.5 3.1 4.5 8.1 7.0 6.6 6.4 7.2 7.1 7.5 8.0 5.0 3.7 3.0 1.1 1.7 2.8 5.6 5.5 280. * 2.7 4.1 4.9 6.7 10.7 9.5 9.0 8.2 3.5 3.4 3.8 4.2 2.7 2.1 1.8 .2 .4 .8 2.2 2.1 290. * 3.4 4.8 5.7 7.8 10.6 9.1 8.6 8.3 1.1 1.2 1.6 2.2 1.7 1.6 1.6 .0 .0 .0 .5 .5 300. * 3.4 5.1 5.9 7.6 9.4 8.0 7.3 7.4 .7 .9 1.2 1.8 1.6 1.6 1.6 .0 .0 .0 .1 .1 310. * 3.4 5.0 6.0 7.0 8.5 7.0 6.6 6.8 .7 .9 1.1 1.7 1.8 1.8 1.8 .1 .1 .1 .1 .0 320. * 3.2 5.0 5.9 6.5 7.6 6.4 6.6 6.5 .8 .9 1.2 1.9 1.9 1.9 1.9 .1 .1 .1 .1 .0 330. * 3.4 5.4 5.6 6.1 7.0 6.3 6.4 6.4 .7 .9 1.2 2.1 2.1 2.1 2.1 .1 .1 .1 .1 .0 340. * 3.5 5.1 5.2 5.9 6.9 6.6 6.5 6.0 .7 .9 1.2 2.5 2.4 2.4 2.4 .2 .2 .2 .2 .0 350. * 4.1 4.9 5.2 5.7 7.2 6.7 6.4 5.8 .6 .8 1.2 2.5 2.5 2.5 2.5 .8 .8 .8 .9 .2 360. * 4.8 4.3 4.8 5.3 7.0 6.6 6.1 5.3 .3 .4 .8 1.9 1.9 1.9 1.9 1.8 1.8 1.8 1.8 .7 ------*------------------------------------------------------------------------------------------------------------------------ MAX * 5.1 5.4 6.0 7.8 10.7 9.5 9.0 8.3 10.5 10.2 10.1 10.4 7.8 6.3 5.6 5.0 5.5 6.3 8.4 8.6 DEGR. * 10 330 310 290 280 280 280 290 250 250 260 260 250 210 210 170 170 170 250 250
� PAGE 6 JOB: I25HarmonywithPkgStationPMpackageB RUN: I25HarmonywithPkgStationPMpackageB
MODEL RESULTS -------------
REMARKS : In search of the angle corresponding to the maximum concentration, only the first angle, of the angles with same maximum concentrations, is indicated as maximum.
WIND ANGLE RANGE: 0.-360.
WIND * CONCENTRATION ANGLE * (PPM) (DEGR)* REC41 REC42 REC43 REC44 REC45 REC46 REC47 REC48 REC49 REC50 REC51 REC52 REC53 REC54 REC55 REC56 ------*------------------------------------------------------------------------------------------------ 0. * .4 .2 .0 .0 .1 .2 .2 .2 .2 .2 .2 .2 .2 .1 .0 .0 10. * .7 .5 .1 .1 .0 .0 .0 .0 .0 .3 .3 .3 .3 .1 .1 .1 20. * .8 .7 .2 .1 .1 .1 .1 .1 .1 .5 .5 .5 .5 .3 .2 .1 30. * .8 .7 .2 .2 .2 .2 .2 .2 .2 .4 .4 .4 .5 .2 .2 .2 40. * .8 .6 .3 .3 .2 .2 .2 .2 .2 .4 .4 .4 .5 .3 .3 .3 50. * .8 .6 .3 .3 .3 .2 .2 .2 .2 .4 .4 .4 .7 .4 .3 .3 60. * .7 .6 .4 .4 .4 .3 .2 .2 .2 .4 .4 .5 .9 .4 .4 .3 70. * .9 .8 .8 .8 .8 .7 .2 .2 .2 .4 .4 .7 1.5 1.1 .8 .8
Page 5

harmpgb2.out 80. * 1.9 1.9 2.1 2.1 2.1 2.2 .7 .4 .3 .5 .6 1.6 3.5 2.9 2.8 2.8 90. * 4.2 4.2 4.9 4.9 4.9 5.2 2.5 1.4 1.0 1.2 1.9 3.7 6.8 6.2 6.1 6.0 100. * 6.8 6.9 7.7 7.9 8.0 8.4 4.6 3.2 2.4 2.3 3.5 6.4 9.7 8.9 8.8 8.3 110. * 8.2 7.9 8.4 8.6 9.0 9.2 5.4 4.4 3.7 3.9 5.1 7.2 9.9 8.8 8.7 8.7 120. * 7.9 8.3 8.1 8.5 8.7 8.7 5.8 4.6 4.0 3.9 5.4 7.0 8.6 8.2 8.0 8.0 130. * 7.7 8.0 7.3 7.8 8.2 8.4 5.6 4.2 3.7 3.8 5.0 6.5 7.8 7.3 7.4 7.5 140. * 7.5 7.8 6.8 7.5 7.8 7.8 5.5 4.2 3.6 3.9 4.9 5.7 7.0 7.1 6.9 6.8 150. * 7.7 7.7 6.6 7.4 7.5 7.4 5.2 4.2 3.7 3.5 4.5 5.1 6.5 6.7 6.8 6.8 160. * 7.6 7.2 6.3 7.1 7.1 7.1 5.0 3.8 3.4 3.2 3.9 4.8 6.6 6.4 6.5 6.4 170. * 7.5 6.9 6.5 7.1 7.1 7.1 4.8 3.8 3.2 3.2 4.1 4.9 6.4 6.4 6.3 6.4 180. * 7.1 6.5 6.7 7.1 7.1 7.1 4.8 3.8 3.4 3.0 3.6 4.9 6.5 6.4 6.4 6.3 190. * 6.6 6.1 6.9 7.0 7.1 6.9 4.8 4.1 3.8 3.0 3.7 4.8 6.4 6.5 6.5 6.3 200. * 6.2 6.0 7.0 7.2 7.3 7.0 5.2 3.9 3.6 2.9 3.8 4.8 6.5 6.5 6.4 6.2 210. * 6.3 6.3 7.4 7.5 7.5 6.9 5.0 4.3 3.6 3.1 3.7 4.8 6.7 6.6 6.5 6.2 220. * 6.6 6.6 7.6 7.9 7.8 7.1 5.4 4.5 3.7 3.0 3.8 5.1 7.0 6.9 6.7 6.6 230. * 7.1 7.1 8.6 8.2 8.5 7.5 5.7 4.3 3.8 3.1 3.8 5.2 7.3 7.2 7.0 7.0 240. * 7.7 7.8 8.9 8.9 8.6 8.2 5.7 4.3 3.6 3.2 4.1 5.5 7.6 7.5 7.5 7.5 250. * 8.5 8.7 9.5 9.1 8.7 8.7 5.5 3.9 3.4 2.8 3.9 5.4 8.1 8.1 8.1 7.9 260. * 8.3 8.4 8.3 7.8 7.8 7.5 4.3 2.9 2.2 1.6 2.7 4.4 7.3 7.1 6.9 6.9 270. * 5.5 5.5 5.1 4.8 4.9 4.9 2.4 1.3 .9 .5 1.0 2.3 4.6 4.4 4.3 4.3 280. * 2.0 2.0 2.1 1.9 1.9 2.3 .9 .4 .3 .0 .2 .7 1.8 1.8 1.7 1.7 290. * .5 .5 .7 .6 .7 .9 .3 .2 .2 .0 .0 .1 .4 .4 .4 .4 300. * .1 .1 .1 .2 .2 .6 .2 .2 .2 .0 .0 .0 .1 .1 .1 .1 310. * .0 .0 .1 .1 .2 .5 .2 .2 .2 .0 .0 .0 .0 .0 .0 .0 320. * .0 .0 .1 .1 .1 .5 .3 .3 .3 .0 .0 .0 .0 .0 .0 .0 330. * .0 .0 .1 .1 .1 .4 .3 .3 .3 .0 .0 .0 .0 .0 .0 .0 340. * .0 .0 .1 .1 .2 .3 .3 .3 .3 .0 .0 .0 .0 .0 .0 .0 350. * .2 .0 .0 .1 .1 .3 .3 .3 .3 .1 .1 .1 .1 .0 .0 .0 360. * .4 .2 .0 .0 .1 .2 .2 .2 .2 .2 .2 .2 .2 .1 .0 .0 ------*------------------------------------------------------------------------------------------------ MAX * 8.5 8.7 9.5 9.1 9.0 9.2 5.8 4.6 4.0 3.9 5.4 7.2 9.9 8.9 8.8 8.7 DEGR. * 250 250 250 250 110 110 120 120 120 110 120 110 110 100 100 110
THE HIGHEST CONCENTRATION OF 10.70 PPM OCCURRED AT RECEPTOR REC25.� PAGE 7 JOB: I25HarmonywithPkgStationPMpackageB RUN: I25HarmonywithPkgStationPMpackageB
DATE : 11/22/10 TIME : 11:27:33
RECEPTOR - LINK MATRIX FOR THE ANGLE PRODUCING THE MAXIMUM CONCENTRATION FOR EACH RECEPTOR
* CO/LINK (PPM) * ANGLE (DEGREES) * REC1 REC2 REC3 REC4 REC5 REC6 REC7 REC8 REC9 REC10 REC11 REC12 REC13 REC14 REC15 REC16 REC17 REC18REC19 REC20 LINK # * 70 60 60 70 50 60 60 310 60 300 290 70 290 70 60 40 40 290 10 10 -------*------------------------------------------------------------------------------------------------------------------------ 1 * 1.1 1.2 .7 .0 .0 .0 .0 .9 .0 1.4 2.0 .0 1.3 .0 .0 .0 .0 .2 .0 .0 2 * .2 .2 .0 .0 .0 .0 .0 .1 .0 .2 .3 .0 .2 .0 .0 .0 .0 .0 .0 .0 3 * .0 .0 .0 .0 .0 .0 .0 .0 .0 .0 .0 .0 .0 .0 .0 .0 .0 .0 .0 .0 4 * 2.4 2.4 2.0 .6 .1 .0 .0 1.0 .0 1.6 2.4 .0 1.2 .0 .0 .0 .0 .1 .0 .0 5 * .5 .5 .2 .0 .0 .0 .0 .2 .0 .3 .4 .0 .2 .0 .0 .0 .0 .0 .0 .0 6 * .9 .6 1.1 2.7 1.6 1.4 1.1 .0 1.4 .1 1.1 3.6 2.5 3.5 2.9 2.7 2.6 3.6 1.4 .8 7 * .0 .0 .0 .0 .0 .0 .0 .0 .0 .0 .0 .0 .0 .1 .9 1.3 1.1 .7 .4 .2 8 * 1.2 1.0 1.5 2.0 1.4 1.1 .9 .0 1.1 .0 .0 1.9 .6 1.8 1.3 1.6 1.3 1.9 .9 .6 9 * .0 .0 .0 .0 .0 .0 .0 .0 .0 .0 .0 .1 .0 .1 .5 .7 .3 .1 .2 .2 10 * .1 .0 .0 .1 .0 .0 .1 .0 .1 .0 .0 .1 .0 .2 .4 .1 .3 .0 .2 .3 11 * .1 .0 .0 .1 .0 .1 .1 .0 .1 .0 .0 .2 .0 .2 .5 .2 .5 .0 .2 .3 12 * .2 .1 .1 .3 .0 .2 .2 .0 .3 .0 .0 .5 .0 .6 1.4 .8 1.3 .0 .6 .6 13 * .0 .0 .0 .0 .0 .0 .0 .0 .0 .0 .0 .0 .0 .0 .1 .1 .1 .0 .0 .1 14 * .0 .0 .0 .0 .0 .0 .0 .0 .0 .0 .0 .1 .0 .1 .2 .1 .2 .0
Page 6

harmpgb2.out .1 .1 15 * .9 1.0 1.1 1.0 .9 .7 .6 .0 .6 .0 .0 .9 .0 .8 .3 .6 .3 .9 .4 .3 16 * .1 .1 .2 .1 .1 .0 .0 .0 .0 .0 .0 .0 .0 .0 .0 .0 .0 .1 .0 .0 17 * .8 .9 .9 .8 .8 .6 .5 .0 .6 .0 .0 .7 .0 .6 .1 .4 .2 .7 .4 .3 18 * .1 .1 .1 .0 .1 .0 .0 .0 .0 .0 .0 .0 .0 .0 .0 .0 .0 .1 .0 .0 19 * .0 .0 .0 .0 .0 .0 .0 .0 .0 .0 .0 .0 .0 .0 .0 .0 .0 .0 .0 .0 20 * .1 .2 .0 .0 .0 .0 .0 .7 .0 1.0 1.2 .0 1.1 .0 .0 .0 .0 .3 .0 .0 21 * .1 .1 .0 .0 .0 .0 .0 .6 .0 .9 1.0 .0 1.0 .0 .0 .0 .0 .3 .0 .0 22 * .0 .0 .0 .0 .0 .0 .0 .0 .0 .0 .0 .0 .0 .0 .0 .0 .0 .0 .0 .0 23 * .0 .0 .0 .0 .0 .0 .0 .0 .0 .0 .0 .0 .0 .0 .0 .0 .0 .0 .0 .0 24 * .0 .0 .1 .1 .1 .1 .1 .1 .0 .1 .1 .0 .0 .0 .0 .0 .0 .0 .0 .0 25 * .0 .0 .0 .0 .0 .0 .0 .0 .0 .0 .0 .0 .0 .0 .0 .0 .0 .0 .0 .0 26 * .0 .0 .0 .0 .0 .0 .0 .0 .0 .0 .0 .0 .0 .1 .3 .2 .5 .0 1.0 1.1 27 * .0 .0 .1 .1 .1 .1 .1 .1 .0 .1 .1 .0 .1 .0 .0 .0 .0 .0 .0 .0 28 * .0 .0 .0 .1 .1 .0 .0 .0 .0 .0 .2 .0 .0 .0 .0 .0 .0 .0 .0 .0 29 * .0 .0 .0 .0 .0 .0 .0 .0 .0 .0 .0 .0 .0 .0 .0 .0 .0 .0 .0 .0 30 * .0 .0 .0 .2 .2 .0 .0 .0 .0 .1 .1 .0 .0 .0 .0 .0 .0 .0 .0 .0 31 * .1 .1 .1 .1 .1 .1 .1 .0 .1 .0 .0 .1 .0 .1 .2 .4 .3 .0 .7 .6 32 * .1 .1 .1 .1 .1 .1 .1 .0 .1 .0 .0 .1 .0 .1 .0 .1 .1 .0 .4 .3� PAGE 8 JOB: I25HarmonywithPkgStationPMpackageB RUN: I25HarmonywithPkgStationPMpackageB
DATE : 11/22/10 TIME : 11:27:33
RECEPTOR - LINK MATRIX FOR THE ANGLE PRODUCING THE MAXIMUM CONCENTRATION FOR EACH RECEPTOR
* CO/LINK (PPM) * ANGLE (DEGREES) * REC21 REC22 REC23 REC24 REC25 REC26 REC27 REC28 REC29 REC30 REC31 REC32 REC33 REC34 REC35 REC36 REC37 REC38REC39 REC40 LINK # * 10 330 310 290 280 280 280 290 250 250 260 260 250 210 210 170 170 170 250 250 -------*------------------------------------------------------------------------------------------------------------------------ 1 * .0 .0 .0 .2 .4 .3 .3 .1 .2 .2 .4 .4 .3 .0 .0 .0 .0 .0 .3 .3 2 * .0 .0 .0 .0 .0 .0 .0 .0 .0 .0 .0 .0 .0 .0 .0 .0 .0 .0 .0 .0 3 * .0 .0 .0 .0 .0 .0 .0 .0 .0 .0 .0 .0 .0 .0 .0 .0 .0 .0 .0 .0 4 * .0 .0 .0 .2 .3 .3 .3 .1 .2 .2 .4 .4 .3 .0 .0 .0 .0 .0 .3 .4 5 * .0 .0 .0 .0 .0 .0 .0 .0 .0 .0 .0 .0 .0 .0 .0 .0 .0 .0 .0 .0 6 * .6 .9 1.4 2.2 3.4 2.4 1.8 .8 1.1 1.1 .8 .7 .8 .8 .7 .3 .3 .4 .9 .9 7 * .2 .3 .4 .5 .7 .5 .3 .2 .2 .1 .0 .0 .0 .2 .2 .1 .1 .1 .0 .0 8 * .4 .8 1.2 1.5 2.0 1.9 1.7 1.1 1.2 1.4 1.2 1.2 1.1 .8 .7 .3 .4 .6 1.3 1.3 9 * .1 .3 .2 .2 .3 .3 .3 .2 .2 .2 .1 .0 .0 .3 .2 .1 .1 .1 .0 .0 10 * .3 .1 .0 .0 .4 .9 1.3 2.1 .1 .0 .0 .0 .0 .0 .0 .3 .3 .3 .0 .0 11 * .3 .1 .0 .0 .0 .0 .2 .7 .3 .1 .0 .0 .0 .1 .0 .3 .3 .3 .0 .0 12 * .5 .1 .0 .0 .0 .0 .0 .2 4.2 3.6 1.9 .7 .0 .4 .2 .7 .7 .6 .0 .0
Page 7

harmpgb2.out 13 * .1 .0 .0 .0 .0 .0 .0 .0 .5 .4 .0 .0 .0 .0 .0 .0 .0 .0 .0 .0 14 * .1 .0 .0 .0 .0 .0 .0 .1 .3 .1 .0 .0 .0 .0 .0 .1 .1 .1 .0 .0 15 * .3 .6 .8 .8 .7 .8 .8 1.0 .8 1.2 1.9 2.2 1.5 .8 .7 .4 .5 .8 2.0 2.0 16 * .0 .0 .0 .0 .0 .0 .0 .0 .0 .0 .0 .0 .0 .0 .0 .0 .0 .0 .0 .0 17 * .2 .6 .7 .6 .5 .6 .6 .9 .6 .9 2.1 3.1 1.9 .8 .8 .5 .7 1.1 3.3 3.3 18 * .0 .0 .0 .0 .0 .0 .0 .0 .0 .0 .0 .0 .0 .0 .0 .0 .0 .0 .0 .0 19 * .0 .0 .0 .0 .0 .0 .0 .0 .0 .0 .0 .0 .0 .0 .0 .0 .0 .0 .0 .0 20 * .0 .0 .0 .2 .4 .4 .4 .1 .1 .1 .3 .4 .2 .0 .0 .0 .0 .0 .2 .2 21 * .0 .0 .0 .3 .4 .4 .4 .2 .1 .1 .3 .3 .1 .0 .0 .0 .0 .0 .1 .2 22 * .0 .0 .0 .0 .0 .0 .0 .0 .0 .0 .0 .0 .0 .0 .0 .0 .0 .0 .0 .0 23 * .0 .0 .0 .0 .0 .0 .0 .0 .0 .0 .0 .0 .0 .0 .0 .0 .0 .0 .0 .0 24 * .0 .0 .0 .0 .0 .0 .0 .0 .0 .0 .0 .0 .0 .0 .0 .0 .0 .0 .0 .0 25 * .0 .0 .0 .0 .0 .0 .0 .0 .0 .0 .0 .0 .0 .0 .0 .0 .0 .0 .0 .0 26 * 1.2 1.5 1.3 1.1 1.2 .7 .6 .4 .2 .1 .0 .0 .0 .2 .1 .6 .8 1.0 .0 .0 27 * .0 .0 .0 .0 .0 .0 .0 .0 .0 .0 .0 .0 .0 .0 .0 .0 .0 .0 .0 .0 28 * .0 .0 .0 .0 .0 .0 .0 .0 .0 .0 .0 .0 .0 .0 .0 .0 .0 .0 .0 .0 29 * .0 .0 .0 .0 .0 .0 .0 .0 .0 .0 .0 .0 .0 .0 .0 .0 .0 .0 .0 .0 30 * .0 .0 .0 .0 .0 .0 .0 .0 .0 .0 .0 .0 .0 .0 .0 .0 .0 .0 .0 .0 31 * .5 .1 .0 .0 .0 .0 .0 .1 .2 .4 .6 .9 .9 1.1 1.1 1.2 1.1 .9 .0 .0 32 * .3 .0 .0 .0 .0 .0 .0 .0 .0 .0 .1 .1 .7 .8 .9 .1 .1 .0 .0 .0� PAGE 9 JOB: I25HarmonywithPkgStationPMpackageB RUN: I25HarmonywithPkgStationPMpackageB
DATE : 11/22/10 TIME : 11:27:33
RECEPTOR - LINK MATRIX FOR THE ANGLE PRODUCING THE MAXIMUM CONCENTRATION FOR EACH RECEPTOR
* CO/LINK (PPM) * ANGLE (DEGREES) * REC41 REC42 REC43 REC44 REC45 REC46 REC47 REC48 REC49 REC50 REC51 REC52 REC53 REC54 REC55 REC56 LINK # * 250 250 250 250 110 110 120 120 120 110 120 110 110 100 100 110 -------*------------------------------------------------------------------------------------------------ 1 * .4 .4 1.1 1.2 .0 .0 .0 .0 .0 .0 .0 .0 .0 .0 .0 .2 2 * .0 .0 .1 .1 .0 .0 .0 .0 .0 .0 .0 .0 .0 .0 .0 .0 3 * .0 .0 .0 .0 .0 .0 .0 .0 .0 .0 .0 .0 .0 .0 .0 .0 4 * .4 .5 1.1 1.1 .0 .0 .0 .0 .0 .0 .0 .0 .0 .0 .0 .1 5 * .0 .0 .1 .1 .0 .0 .0 .0 .0 .0 .0 .0 .0 .0 .0 .0 6 * .8 .8 .1 .0 .9 .9 .9 .7 .6 .4 .8 .8 1.1 .7 .7 1.0 7 * .0 .0 .0 .0 .1 .1 .1 .1 .1 .1 .0 .1 .1 .1 .1 .0 8 * 1.2 1.2 .3 .1 1.3 1.3 1.1 .9 .7 .5 1.0 1.1 1.5 1.1 1.1 1.2 9 * .0 .0 .0 .0 .1 .1 .0 .1 .1 .1 .0 .1 .0 .1 .1 .0 10 * .0 .0 .0 .0 .2 .2 .1 .1 .2 .2 .1 .2 .1 .2 .2 .1 11 * .0 .0 .0 .0 .2 .2 .1 .1 .1 .2 .1 .1 .1 .2 .2 .1 12 * .0 .0 .0 .0 .2 .2 .1 .1 .2 .4 .1 .2 .2 .4 .4 .1 13 * .0 .0 .0 .0 .0 .0 .0 .0 .0 .0 .0 .0 .0 .0 .0 .0 14 * .0 .0 .0 .0 .0 .0 .0 .0 .0 .1 .0 .0 .0 .0 .0 .0 15 * 2.0 1.9 1.2 .9 2.0 2.0 1.3 1.0 .8 .7 1.1 1.5 2.1 1.7 1.4 .8 16 * .0 .1 .2 .1 .1 .2 .1 .0 .0 .0 .1 .2 .3 .2 .2 .1 17 * 3.3 3.3 2.7 2.4 3.3 3.3 1.6 1.2 1.0 .8 1.3 1.9 2.2 2.0 1.5 .6 18 * .0 .0 .6 .4 .4 .5 .2 .1 .0 .0 .2 .3 .3 .2 .2 .1 19 * .0 .0 .0 .0 .0 .0 .0 .0 .0 .0 .0 .0 .0 .0 .0 .0 20 * .2 .3 1.1 1.4 .0 .0 .0 .0 .0 .0 .0 .0 .1 .2 .5 1.3 21 * .2 .2 .9 1.2 .0 .0 .0 .0 .0 .0 .0 .0 1.2 1.4 1.9 2.8 22 * .0 .0 .0 .1 .0 .0 .0 .0 .0 .2 .2 .2 .2 .1 .1 .1 23 * .0 .0 .0 .0 .0 .0 .0 .0 .0 .0 .0 .1 .2 .1 .0 .0 24 * .0 .0 .0 .0 .0 .0 .0 .0 .0 .0 .0 .0 .0 .0 .0 .0 25 * .0 .0 .0 .0 .0 .0 .0 .0 .0 .0 .2 .3 .1 .1 .1 .0
Page 8
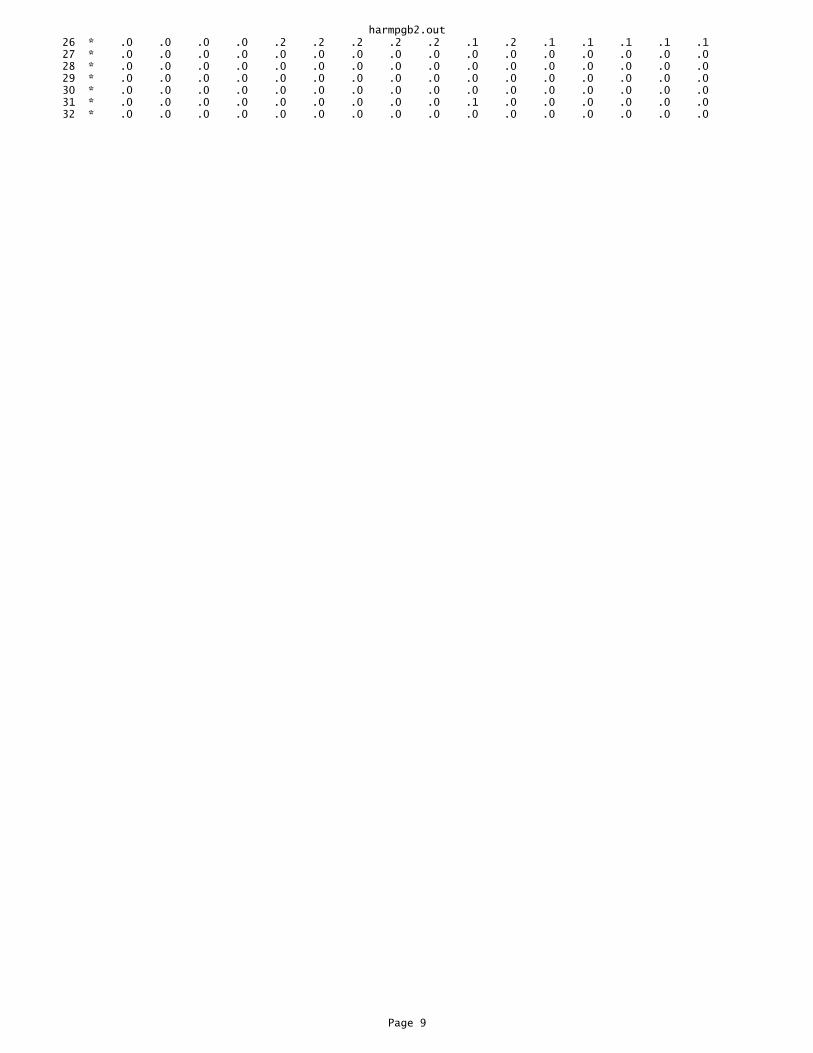
harmpgb2.out 26 * .0 .0 .0 .0 .2 .2 .2 .2 .2 .1 .2 .1 .1 .1 .1 .1 27 * .0 .0 .0 .0 .0 .0 .0 .0 .0 .0 .0 .0 .0 .0 .0 .0 28 * .0 .0 .0 .0 .0 .0 .0 .0 .0 .0 .0 .0 .0 .0 .0 .0 29 * .0 .0 .0 .0 .0 .0 .0 .0 .0 .0 .0 .0 .0 .0 .0 .0 30 * .0 .0 .0 .0 .0 .0 .0 .0 .0 .0 .0 .0 .0 .0 .0 .0 31 * .0 .0 .0 .0 .0 .0 .0 .0 .0 .1 .0 .0 .0 .0 .0 .0 32 * .0 .0 .0 .0 .0 .0 .0 .0 .0 .0 .0 .0 .0 .0 .0 .0
Page 9
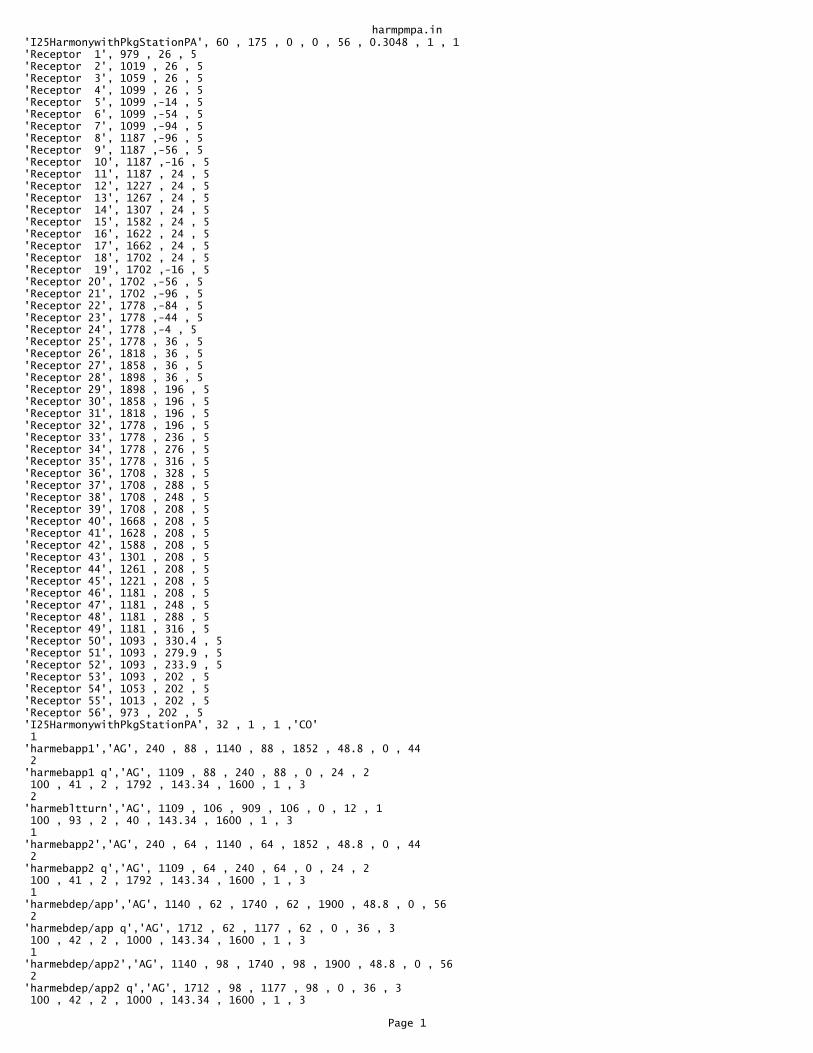
harmpmpa.in'I25HarmonywithPkgStationPA', 60 , 175 , 0 , 0 , 56 , 0.3048 , 1 , 1 'Receptor 1', 979 , 26 , 5 'Receptor 2', 1019 , 26 , 5 'Receptor 3', 1059 , 26 , 5 'Receptor 4', 1099 , 26 , 5 'Receptor 5', 1099 ,-14 , 5 'Receptor 6', 1099 ,-54 , 5 'Receptor 7', 1099 ,-94 , 5 'Receptor 8', 1187 ,-96 , 5 'Receptor 9', 1187 ,-56 , 5 'Receptor 10', 1187 ,-16 , 5 'Receptor 11', 1187 , 24 , 5 'Receptor 12', 1227 , 24 , 5 'Receptor 13', 1267 , 24 , 5 'Receptor 14', 1307 , 24 , 5 'Receptor 15', 1582 , 24 , 5 'Receptor 16', 1622 , 24 , 5 'Receptor 17', 1662 , 24 , 5 'Receptor 18', 1702 , 24 , 5 'Receptor 19', 1702 ,-16 , 5 'Receptor 20', 1702 ,-56 , 5 'Receptor 21', 1702 ,-96 , 5 'Receptor 22', 1778 ,-84 , 5 'Receptor 23', 1778 ,-44 , 5 'Receptor 24', 1778 ,-4 , 5 'Receptor 25', 1778 , 36 , 5 'Receptor 26', 1818 , 36 , 5 'Receptor 27', 1858 , 36 , 5 'Receptor 28', 1898 , 36 , 5 'Receptor 29', 1898 , 196 , 5 'Receptor 30', 1858 , 196 , 5 'Receptor 31', 1818 , 196 , 5 'Receptor 32', 1778 , 196 , 5 'Receptor 33', 1778 , 236 , 5 'Receptor 34', 1778 , 276 , 5 'Receptor 35', 1778 , 316 , 5 'Receptor 36', 1708 , 328 , 5 'Receptor 37', 1708 , 288 , 5 'Receptor 38', 1708 , 248 , 5 'Receptor 39', 1708 , 208 , 5 'Receptor 40', 1668 , 208 , 5 'Receptor 41', 1628 , 208 , 5 'Receptor 42', 1588 , 208 , 5 'Receptor 43', 1301 , 208 , 5 'Receptor 44', 1261 , 208 , 5 'Receptor 45', 1221 , 208 , 5 'Receptor 46', 1181 , 208 , 5 'Receptor 47', 1181 , 248 , 5 'Receptor 48', 1181 , 288 , 5 'Receptor 49', 1181 , 316 , 5 'Receptor 50', 1093 , 330.4 , 5 'Receptor 51', 1093 , 279.9 , 5 'Receptor 52', 1093 , 233.9 , 5 'Receptor 53', 1093 , 202 , 5 'Receptor 54', 1053 , 202 , 5 'Receptor 55', 1013 , 202 , 5 'Receptor 56', 973 , 202 , 5 'I25HarmonywithPkgStationPA', 32 , 1 , 1 ,'CO' 1 'harmebapp1','AG', 240 , 88 , 1140 , 88 , 1852 , 48.8 , 0 , 44 2 'harmebapp1 q','AG', 1109 , 88 , 240 , 88 , 0 , 24 , 2 100 , 41 , 2 , 1792 , 143.34 , 1600 , 1 , 3 2 'harmebltturn','AG', 1109 , 106 , 909 , 106 , 0 , 12 , 1 100 , 93 , 2 , 40 , 143.34 , 1600 , 1 , 3 1 'harmebapp2','AG', 240 , 64 , 1140 , 64 , 1852 , 48.8 , 0 , 44 2 'harmebapp2 q','AG', 1109 , 64 , 240 , 64 , 0 , 24 , 2 100 , 41 , 2 , 1792 , 143.34 , 1600 , 1 , 3 1 'harmebdep/app','AG', 1140 , 62 , 1740 , 62 , 1900 , 48.8 , 0 , 56 2 'harmebdep/app q','AG', 1712 , 62 , 1177 , 62 , 0 , 36 , 3 100 , 42 , 2 , 1000 , 143.34 , 1600 , 1 , 3 1 'harmebdep/app2','AG', 1140 , 98 , 1740 , 98 , 1900 , 48.8 , 0 , 56 2 'harmebdep/app2 q','AG', 1712 , 98 , 1177 , 98 , 0 , 36 , 3 100 , 42 , 2 , 1000 , 143.34 , 1600 , 1 , 3
Page 1
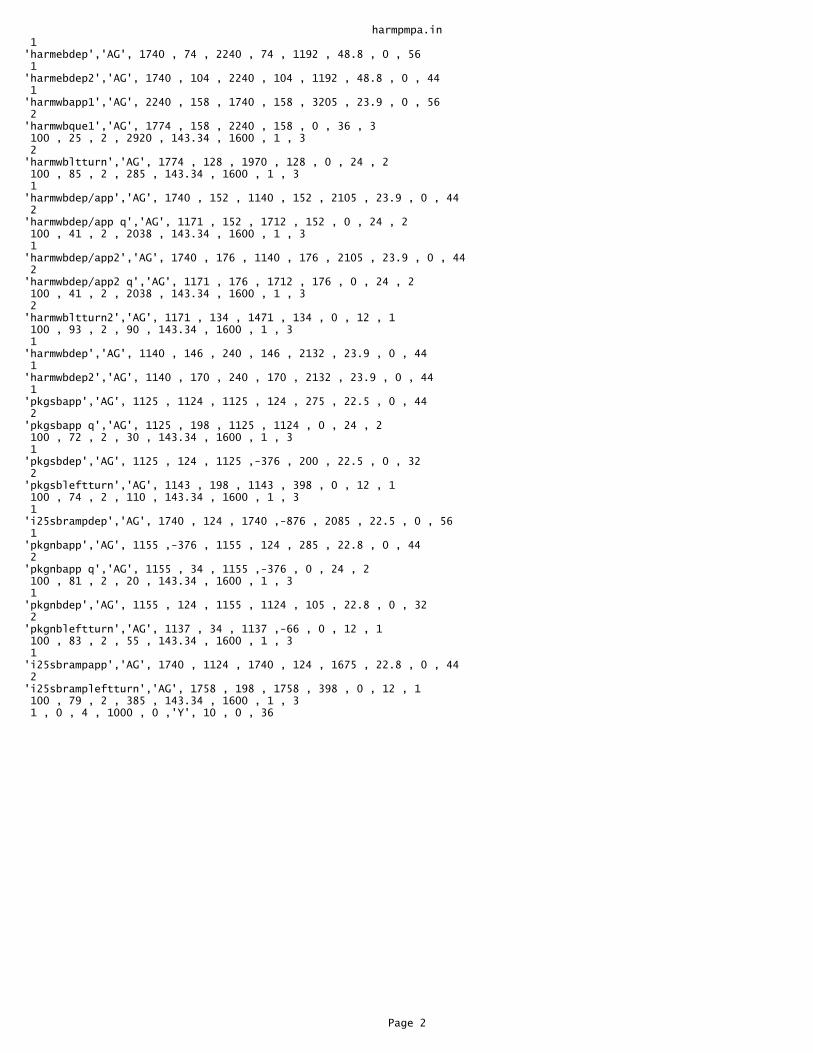
harmpmpa.in 1 'harmebdep','AG', 1740 , 74 , 2240 , 74 , 1192 , 48.8 , 0 , 56 1 'harmebdep2','AG', 1740 , 104 , 2240 , 104 , 1192 , 48.8 , 0 , 44 1 'harmwbapp1','AG', 2240 , 158 , 1740 , 158 , 3205 , 23.9 , 0 , 56 2 'harmwbque1','AG', 1774 , 158 , 2240 , 158 , 0 , 36 , 3 100 , 25 , 2 , 2920 , 143.34 , 1600 , 1 , 3 2 'harmwbltturn','AG', 1774 , 128 , 1970 , 128 , 0 , 24 , 2 100 , 85 , 2 , 285 , 143.34 , 1600 , 1 , 3 1 'harmwbdep/app','AG', 1740 , 152 , 1140 , 152 , 2105 , 23.9 , 0 , 44 2 'harmwbdep/app q','AG', 1171 , 152 , 1712 , 152 , 0 , 24 , 2 100 , 41 , 2 , 2038 , 143.34 , 1600 , 1 , 3 1 'harmwbdep/app2','AG', 1740 , 176 , 1140 , 176 , 2105 , 23.9 , 0 , 44 2 'harmwbdep/app2 q','AG', 1171 , 176 , 1712 , 176 , 0 , 24 , 2 100 , 41 , 2 , 2038 , 143.34 , 1600 , 1 , 3 2 'harmwbltturn2','AG', 1171 , 134 , 1471 , 134 , 0 , 12 , 1 100 , 93 , 2 , 90 , 143.34 , 1600 , 1 , 3 1 'harmwbdep','AG', 1140 , 146 , 240 , 146 , 2132 , 23.9 , 0 , 44 1 'harmwbdep2','AG', 1140 , 170 , 240 , 170 , 2132 , 23.9 , 0 , 44 1 'pkgsbapp','AG', 1125 , 1124 , 1125 , 124 , 275 , 22.5 , 0 , 44 2 'pkgsbapp q','AG', 1125 , 198 , 1125 , 1124 , 0 , 24 , 2 100 , 72 , 2 , 30 , 143.34 , 1600 , 1 , 3 1 'pkgsbdep','AG', 1125 , 124 , 1125 ,-376 , 200 , 22.5 , 0 , 32 2 'pkgsbleftturn','AG', 1143 , 198 , 1143 , 398 , 0 , 12 , 1 100 , 74 , 2 , 110 , 143.34 , 1600 , 1 , 3 1 'i25sbrampdep','AG', 1740 , 124 , 1740 ,-876 , 2085 , 22.5 , 0 , 56 1 'pkgnbapp','AG', 1155 ,-376 , 1155 , 124 , 285 , 22.8 , 0 , 44 2 'pkgnbapp q','AG', 1155 , 34 , 1155 ,-376 , 0 , 24 , 2 100 , 81 , 2 , 20 , 143.34 , 1600 , 1 , 3 1 'pkgnbdep','AG', 1155 , 124 , 1155 , 1124 , 105 , 22.8 , 0 , 32 2 'pkgnbleftturn','AG', 1137 , 34 , 1137 ,-66 , 0 , 12 , 1 100 , 83 , 2 , 55 , 143.34 , 1600 , 1 , 3 1 'i25sbrampapp','AG', 1740 , 1124 , 1740 , 124 , 1675 , 22.8 , 0 , 44 2 'i25sbrampleftturn','AG', 1758 , 198 , 1758 , 398 , 0 , 12 , 1 100 , 79 , 2 , 385 , 143.34 , 1600 , 1 , 3 1 , 0 , 4 , 1000 , 0 ,'Y', 10 , 0 , 36
Page 2
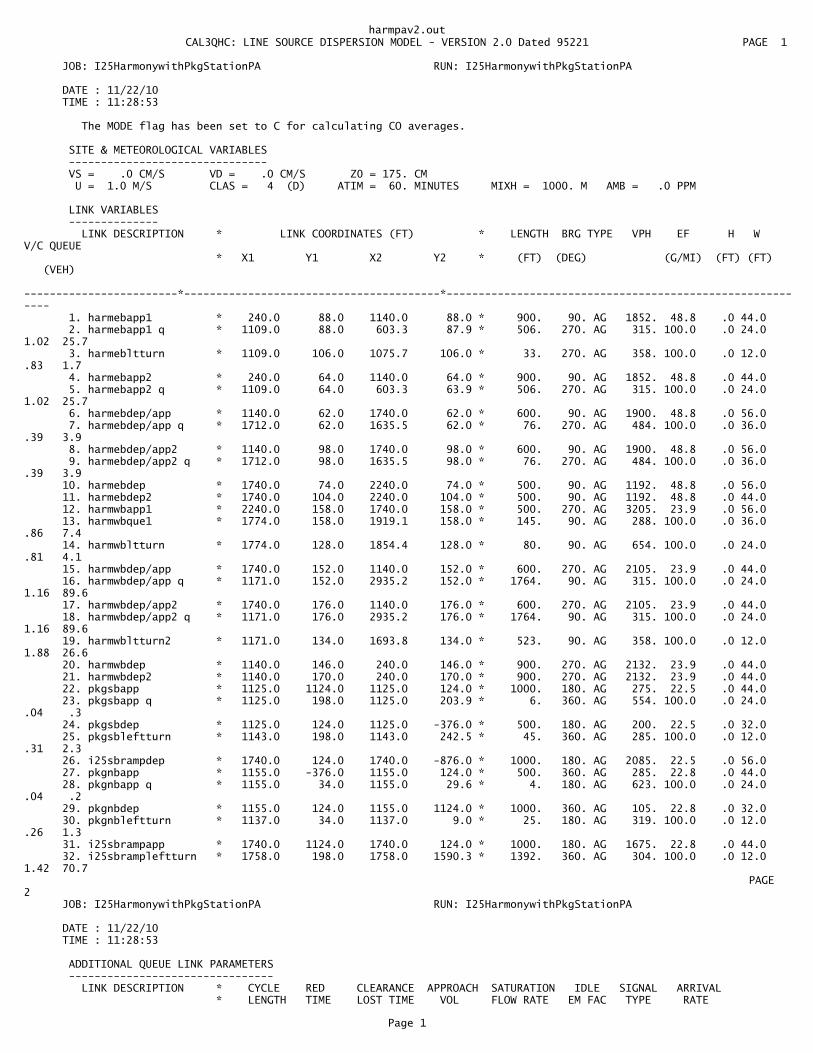
harmpav2.out� CAL3QHC: LINE SOURCE DISPERSION MODEL - VERSION 2.0 Dated 95221 PAGE 1
JOB: I25HarmonywithPkgStationPA RUN: I25HarmonywithPkgStationPA
DATE : 11/22/10 TIME : 11:28:53
The MODE flag has been set to C for calculating CO averages.
SITE & METEOROLOGICAL VARIABLES ------------------------------- VS = .0 CM/S VD = .0 CM/S Z0 = 175. CM U = 1.0 M/S CLAS = 4 (D) ATIM = 60. MINUTES MIXH = 1000. M AMB = .0 PPM
LINK VARIABLES -------------- LINK DESCRIPTION * LINK COORDINATES (FT) * LENGTH BRG TYPE VPH EF H W V/C QUEUE * X1 Y1 X2 Y2 * (FT) (DEG) (G/MI) (FT) (FT) (VEH) ------------------------*----------------------------------------*---------------------------------------------------------- 1. harmebapp1 * 240.0 88.0 1140.0 88.0 * 900. 90. AG 1852. 48.8 .0 44.0 2. harmebapp1 q * 1109.0 88.0 603.3 87.9 * 506. 270. AG 315. 100.0 .0 24.0 1.02 25.7 3. harmebltturn * 1109.0 106.0 1075.7 106.0 * 33. 270. AG 358. 100.0 .0 12.0 .83 1.7 4. harmebapp2 * 240.0 64.0 1140.0 64.0 * 900. 90. AG 1852. 48.8 .0 44.0 5. harmebapp2 q * 1109.0 64.0 603.3 63.9 * 506. 270. AG 315. 100.0 .0 24.0 1.02 25.7 6. harmebdep/app * 1140.0 62.0 1740.0 62.0 * 600. 90. AG 1900. 48.8 .0 56.0 7. harmebdep/app q * 1712.0 62.0 1635.5 62.0 * 76. 270. AG 484. 100.0 .0 36.0 .39 3.9 8. harmebdep/app2 * 1140.0 98.0 1740.0 98.0 * 600. 90. AG 1900. 48.8 .0 56.0 9. harmebdep/app2 q * 1712.0 98.0 1635.5 98.0 * 76. 270. AG 484. 100.0 .0 36.0 .39 3.9 10. harmebdep * 1740.0 74.0 2240.0 74.0 * 500. 90. AG 1192. 48.8 .0 56.0 11. harmebdep2 * 1740.0 104.0 2240.0 104.0 * 500. 90. AG 1192. 48.8 .0 44.0 12. harmwbapp1 * 2240.0 158.0 1740.0 158.0 * 500. 270. AG 3205. 23.9 .0 56.0 13. harmwbque1 * 1774.0 158.0 1919.1 158.0 * 145. 90. AG 288. 100.0 .0 36.0 .86 7.4 14. harmwbltturn * 1774.0 128.0 1854.4 128.0 * 80. 90. AG 654. 100.0 .0 24.0 .81 4.1 15. harmwbdep/app * 1740.0 152.0 1140.0 152.0 * 600. 270. AG 2105. 23.9 .0 44.0 16. harmwbdep/app q * 1171.0 152.0 2935.2 152.0 * 1764. 90. AG 315. 100.0 .0 24.0 1.16 89.6 17. harmwbdep/app2 * 1740.0 176.0 1140.0 176.0 * 600. 270. AG 2105. 23.9 .0 44.0 18. harmwbdep/app2 q * 1171.0 176.0 2935.2 176.0 * 1764. 90. AG 315. 100.0 .0 24.0 1.16 89.6 19. harmwbltturn2 * 1171.0 134.0 1693.8 134.0 * 523. 90. AG 358. 100.0 .0 12.0 1.88 26.6 20. harmwbdep * 1140.0 146.0 240.0 146.0 * 900. 270. AG 2132. 23.9 .0 44.0 21. harmwbdep2 * 1140.0 170.0 240.0 170.0 * 900. 270. AG 2132. 23.9 .0 44.0 22. pkgsbapp * 1125.0 1124.0 1125.0 124.0 * 1000. 180. AG 275. 22.5 .0 44.0 23. pkgsbapp q * 1125.0 198.0 1125.0 203.9 * 6. 360. AG 554. 100.0 .0 24.0 .04 .3 24. pkgsbdep * 1125.0 124.0 1125.0 -376.0 * 500. 180. AG 200. 22.5 .0 32.0 25. pkgsbleftturn * 1143.0 198.0 1143.0 242.5 * 45. 360. AG 285. 100.0 .0 12.0 .31 2.3 26. i25sbrampdep * 1740.0 124.0 1740.0 -876.0 * 1000. 180. AG 2085. 22.5 .0 56.0 27. pkgnbapp * 1155.0 -376.0 1155.0 124.0 * 500. 360. AG 285. 22.8 .0 44.0 28. pkgnbapp q * 1155.0 34.0 1155.0 29.6 * 4. 180. AG 623. 100.0 .0 24.0 .04 .2 29. pkgnbdep * 1155.0 124.0 1155.0 1124.0 * 1000. 360. AG 105. 22.8 .0 32.0 30. pkgnbleftturn * 1137.0 34.0 1137.0 9.0 * 25. 180. AG 319. 100.0 .0 12.0 .26 1.3 31. i25sbrampapp * 1740.0 1124.0 1740.0 124.0 * 1000. 180. AG 1675. 22.8 .0 44.0 32. i25sbrampleftturn * 1758.0 198.0 1758.0 1590.3 * 1392. 360. AG 304. 100.0 .0 12.0 1.42 70.7� PAGE 2 JOB: I25HarmonywithPkgStationPA RUN: I25HarmonywithPkgStationPA
DATE : 11/22/10 TIME : 11:28:53
ADDITIONAL QUEUE LINK PARAMETERS -------------------------------- LINK DESCRIPTION * CYCLE RED CLEARANCE APPROACH SATURATION IDLE SIGNAL ARRIVAL * LENGTH TIME LOST TIME VOL FLOW RATE EM FAC TYPE RATE
Page 1
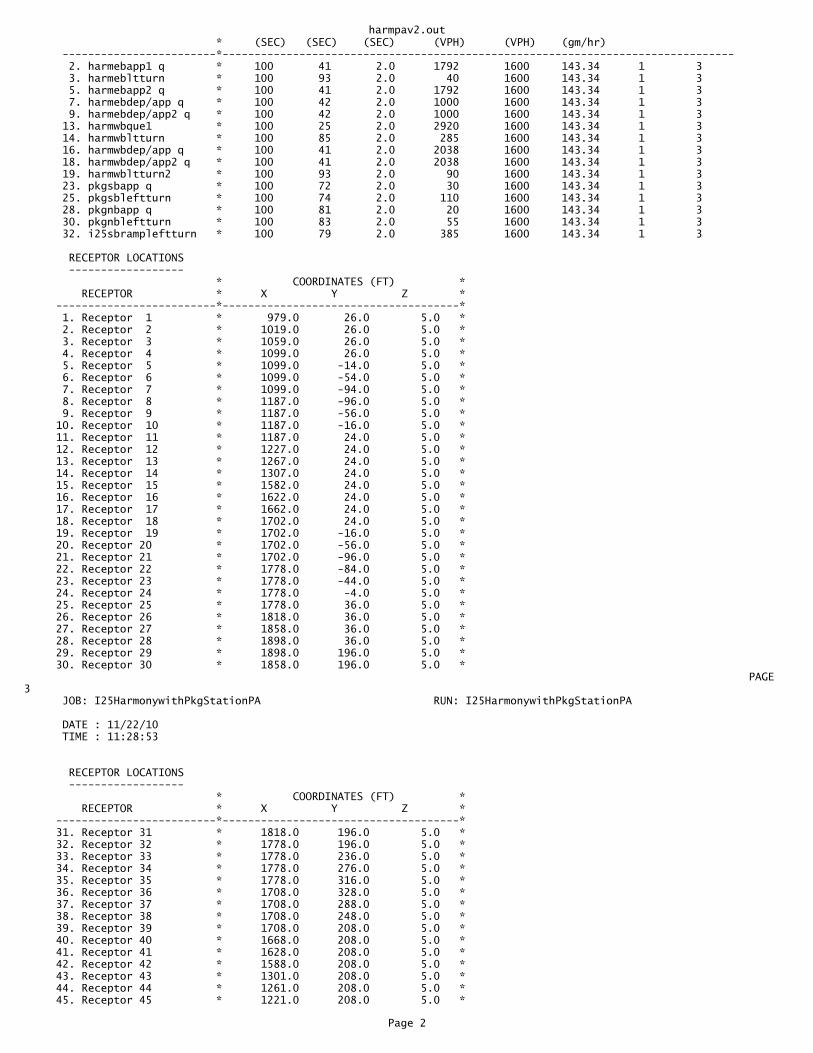
harmpav2.out * (SEC) (SEC) (SEC) (VPH) (VPH) (gm/hr) ------------------------*-------------------------------------------------------------------------------- 2. harmebapp1 q * 100 41 2.0 1792 1600 143.34 1 3 3. harmebltturn * 100 93 2.0 40 1600 143.34 1 3 5. harmebapp2 q * 100 41 2.0 1792 1600 143.34 1 3 7. harmebdep/app q * 100 42 2.0 1000 1600 143.34 1 3 9. harmebdep/app2 q * 100 42 2.0 1000 1600 143.34 1 3 13. harmwbque1 * 100 25 2.0 2920 1600 143.34 1 3 14. harmwbltturn * 100 85 2.0 285 1600 143.34 1 3 16. harmwbdep/app q * 100 41 2.0 2038 1600 143.34 1 3 18. harmwbdep/app2 q * 100 41 2.0 2038 1600 143.34 1 3 19. harmwbltturn2 * 100 93 2.0 90 1600 143.34 1 3 23. pkgsbapp q * 100 72 2.0 30 1600 143.34 1 3 25. pkgsbleftturn * 100 74 2.0 110 1600 143.34 1 3 28. pkgnbapp q * 100 81 2.0 20 1600 143.34 1 3 30. pkgnbleftturn * 100 83 2.0 55 1600 143.34 1 3 32. i25sbrampleftturn * 100 79 2.0 385 1600 143.34 1 3
RECEPTOR LOCATIONS ------------------ * COORDINATES (FT) * RECEPTOR * X Y Z * -------------------------*-------------------------------------* 1. Receptor 1 * 979.0 26.0 5.0 * 2. Receptor 2 * 1019.0 26.0 5.0 * 3. Receptor 3 * 1059.0 26.0 5.0 * 4. Receptor 4 * 1099.0 26.0 5.0 * 5. Receptor 5 * 1099.0 -14.0 5.0 * 6. Receptor 6 * 1099.0 -54.0 5.0 * 7. Receptor 7 * 1099.0 -94.0 5.0 * 8. Receptor 8 * 1187.0 -96.0 5.0 * 9. Receptor 9 * 1187.0 -56.0 5.0 * 10. Receptor 10 * 1187.0 -16.0 5.0 * 11. Receptor 11 * 1187.0 24.0 5.0 * 12. Receptor 12 * 1227.0 24.0 5.0 * 13. Receptor 13 * 1267.0 24.0 5.0 * 14. Receptor 14 * 1307.0 24.0 5.0 * 15. Receptor 15 * 1582.0 24.0 5.0 * 16. Receptor 16 * 1622.0 24.0 5.0 * 17. Receptor 17 * 1662.0 24.0 5.0 * 18. Receptor 18 * 1702.0 24.0 5.0 * 19. Receptor 19 * 1702.0 -16.0 5.0 * 20. Receptor 20 * 1702.0 -56.0 5.0 * 21. Receptor 21 * 1702.0 -96.0 5.0 * 22. Receptor 22 * 1778.0 -84.0 5.0 * 23. Receptor 23 * 1778.0 -44.0 5.0 * 24. Receptor 24 * 1778.0 -4.0 5.0 * 25. Receptor 25 * 1778.0 36.0 5.0 * 26. Receptor 26 * 1818.0 36.0 5.0 * 27. Receptor 27 * 1858.0 36.0 5.0 * 28. Receptor 28 * 1898.0 36.0 5.0 * 29. Receptor 29 * 1898.0 196.0 5.0 * 30. Receptor 30 * 1858.0 196.0 5.0 *� PAGE 3 JOB: I25HarmonywithPkgStationPA RUN: I25HarmonywithPkgStationPA
DATE : 11/22/10 TIME : 11:28:53
RECEPTOR LOCATIONS ------------------ * COORDINATES (FT) * RECEPTOR * X Y Z * -------------------------*-------------------------------------* 31. Receptor 31 * 1818.0 196.0 5.0 * 32. Receptor 32 * 1778.0 196.0 5.0 * 33. Receptor 33 * 1778.0 236.0 5.0 * 34. Receptor 34 * 1778.0 276.0 5.0 * 35. Receptor 35 * 1778.0 316.0 5.0 * 36. Receptor 36 * 1708.0 328.0 5.0 * 37. Receptor 37 * 1708.0 288.0 5.0 * 38. Receptor 38 * 1708.0 248.0 5.0 * 39. Receptor 39 * 1708.0 208.0 5.0 * 40. Receptor 40 * 1668.0 208.0 5.0 * 41. Receptor 41 * 1628.0 208.0 5.0 * 42. Receptor 42 * 1588.0 208.0 5.0 * 43. Receptor 43 * 1301.0 208.0 5.0 * 44. Receptor 44 * 1261.0 208.0 5.0 * 45. Receptor 45 * 1221.0 208.0 5.0 *
Page 2
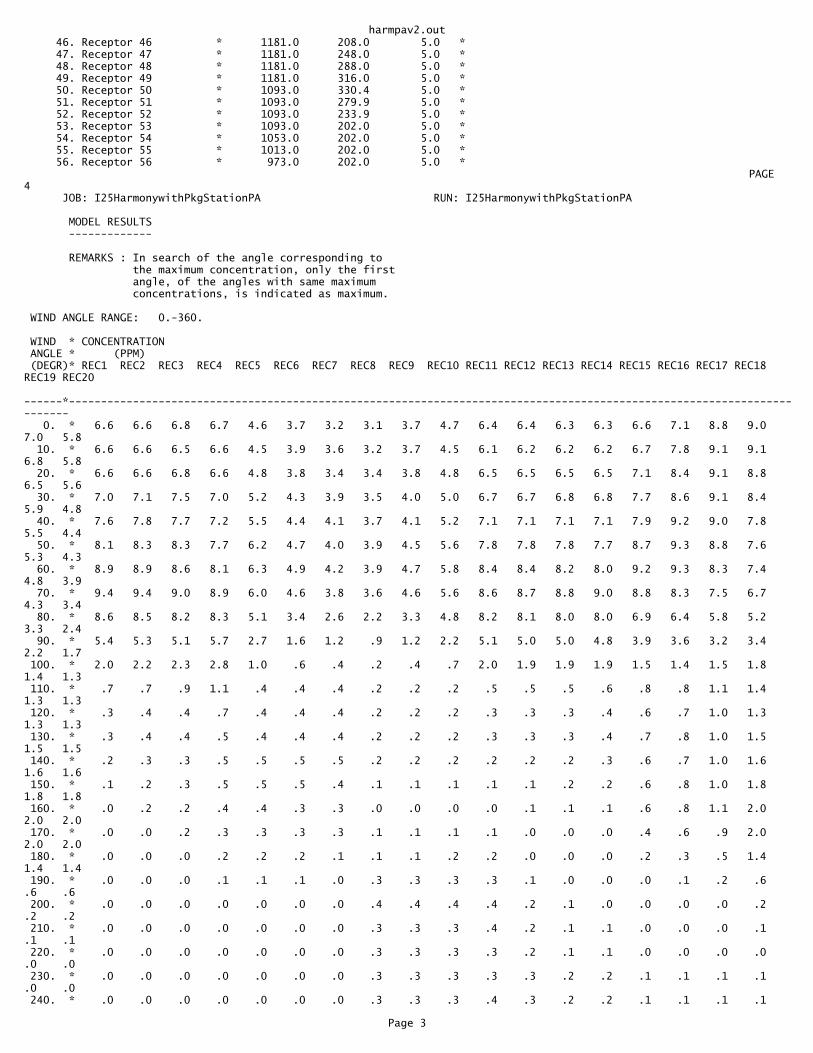
harmpav2.out 46. Receptor 46 * 1181.0 208.0 5.0 * 47. Receptor 47 * 1181.0 248.0 5.0 * 48. Receptor 48 * 1181.0 288.0 5.0 * 49. Receptor 49 * 1181.0 316.0 5.0 * 50. Receptor 50 * 1093.0 330.4 5.0 * 51. Receptor 51 * 1093.0 279.9 5.0 * 52. Receptor 52 * 1093.0 233.9 5.0 * 53. Receptor 53 * 1093.0 202.0 5.0 * 54. Receptor 54 * 1053.0 202.0 5.0 * 55. Receptor 55 * 1013.0 202.0 5.0 * 56. Receptor 56 * 973.0 202.0 5.0 *� PAGE 4 JOB: I25HarmonywithPkgStationPA RUN: I25HarmonywithPkgStationPA
MODEL RESULTS -------------
REMARKS : In search of the angle corresponding to the maximum concentration, only the first angle, of the angles with same maximum concentrations, is indicated as maximum.
WIND ANGLE RANGE: 0.-360.
WIND * CONCENTRATION ANGLE * (PPM) (DEGR)* REC1 REC2 REC3 REC4 REC5 REC6 REC7 REC8 REC9 REC10 REC11 REC12 REC13 REC14 REC15 REC16 REC17 REC18 REC19 REC20 ------*------------------------------------------------------------------------------------------------------------------------ 0. * 6.6 6.6 6.8 6.7 4.6 3.7 3.2 3.1 3.7 4.7 6.4 6.4 6.3 6.3 6.6 7.1 8.8 9.0 7.0 5.8 10. * 6.6 6.6 6.5 6.6 4.5 3.9 3.6 3.2 3.7 4.5 6.1 6.2 6.2 6.2 6.7 7.8 9.1 9.1 6.8 5.8 20. * 6.6 6.6 6.8 6.6 4.8 3.8 3.4 3.4 3.8 4.8 6.5 6.5 6.5 6.5 7.1 8.4 9.1 8.8 6.5 5.6 30. * 7.0 7.1 7.5 7.0 5.2 4.3 3.9 3.5 4.0 5.0 6.7 6.7 6.8 6.8 7.7 8.6 9.1 8.4 5.9 4.8 40. * 7.6 7.8 7.7 7.2 5.5 4.4 4.1 3.7 4.1 5.2 7.1 7.1 7.1 7.1 7.9 9.2 9.0 7.8 5.5 4.4 50. * 8.1 8.3 8.3 7.7 6.2 4.7 4.0 3.9 4.5 5.6 7.8 7.8 7.8 7.7 8.7 9.3 8.8 7.6 5.3 4.3 60. * 8.9 8.9 8.6 8.1 6.3 4.9 4.2 3.9 4.7 5.8 8.4 8.4 8.2 8.0 9.2 9.3 8.3 7.4 4.8 3.9 70. * 9.4 9.4 9.0 8.9 6.0 4.6 3.8 3.6 4.6 5.6 8.6 8.7 8.8 9.0 8.8 8.3 7.5 6.7 4.3 3.4 80. * 8.6 8.5 8.2 8.3 5.1 3.4 2.6 2.2 3.3 4.8 8.2 8.1 8.0 8.0 6.9 6.4 5.8 5.2 3.3 2.4 90. * 5.4 5.3 5.1 5.7 2.7 1.6 1.2 .9 1.2 2.2 5.1 5.0 5.0 4.8 3.9 3.6 3.2 3.4 2.2 1.7 100. * 2.0 2.2 2.3 2.8 1.0 .6 .4 .2 .4 .7 2.0 1.9 1.9 1.9 1.5 1.4 1.5 1.8 1.4 1.3 110. * .7 .7 .9 1.1 .4 .4 .4 .2 .2 .2 .5 .5 .5 .6 .8 .8 1.1 1.4 1.3 1.3 120. * .3 .4 .4 .7 .4 .4 .4 .2 .2 .2 .3 .3 .3 .4 .6 .7 1.0 1.3 1.3 1.3 130. * .3 .4 .4 .5 .4 .4 .4 .2 .2 .2 .3 .3 .3 .4 .7 .8 1.0 1.5 1.5 1.5 140. * .2 .3 .3 .5 .5 .5 .5 .2 .2 .2 .2 .2 .2 .3 .6 .7 1.0 1.6 1.6 1.6 150. * .1 .2 .3 .5 .5 .5 .4 .1 .1 .1 .1 .1 .2 .2 .6 .8 1.0 1.8 1.8 1.8 160. * .0 .2 .2 .4 .4 .3 .3 .0 .0 .0 .0 .1 .1 .1 .6 .8 1.1 2.0 2.0 2.0 170. * .0 .0 .2 .3 .3 .3 .3 .1 .1 .1 .1 .0 .0 .0 .4 .6 .9 2.0 2.0 2.0 180. * .0 .0 .0 .2 .2 .2 .1 .1 .1 .2 .2 .0 .0 .0 .2 .3 .5 1.4 1.4 1.4 190. * .0 .0 .0 .1 .1 .1 .0 .3 .3 .3 .3 .1 .0 .0 .0 .1 .2 .6 .6 .6 200. * .0 .0 .0 .0 .0 .0 .0 .4 .4 .4 .4 .2 .1 .0 .0 .0 .0 .2 .2 .2 210. * .0 .0 .0 .0 .0 .0 .0 .3 .3 .3 .4 .2 .1 .1 .0 .0 .0 .1 .1 .1 220. * .0 .0 .0 .0 .0 .0 .0 .3 .3 .3 .3 .2 .1 .1 .0 .0 .0 .0 .0 .0 230. * .0 .0 .0 .0 .0 .0 .0 .3 .3 .3 .3 .3 .2 .2 .1 .1 .1 .1 .0 .0 240. * .0 .0 .0 .0 .0 .0 .0 .3 .3 .3 .4 .3 .2 .2 .1 .1 .1 .1
Page 3

harmpav2.out.0 .0 250. * .3 .3 .3 .3 .0 .0 .0 .3 .3 .3 .8 .7 .5 .6 .4 .4 .4 .4 .0 .0 260. * 1.6 1.8 1.8 1.8 .5 .2 .0 .4 .5 .9 2.4 2.4 2.3 2.0 2.3 2.2 2.3 2.2 .7 .3 270. * 4.4 4.5 4.6 4.8 2.0 1.1 .5 .9 1.6 2.6 5.8 5.5 5.4 5.0 5.2 5.4 5.4 5.5 2.9 1.7 280. * 7.2 7.3 7.5 7.7 4.1 2.6 1.7 2.2 3.2 4.8 8.6 8.4 7.9 7.7 8.0 8.0 8.0 8.5 4.8 3.5 290. * 8.4 8.4 8.5 8.5 5.4 3.8 2.9 3.3 4.4 5.8 9.0 8.6 8.0 7.9 8.5 8.4 8.7 9.0 5.7 4.3 300. * 8.1 8.2 8.2 8.2 5.3 4.3 3.4 3.8 4.6 5.8 8.4 7.5 7.3 7.3 7.7 8.0 8.3 9.0 5.7 4.3 310. * 7.5 7.5 7.5 7.5 5.1 4.1 3.5 3.6 4.3 5.5 7.3 6.9 6.7 6.7 7.4 7.4 7.9 8.9 5.6 4.1 320. * 6.9 6.9 6.9 6.9 4.8 3.8 3.3 3.4 4.2 5.1 6.5 6.2 6.4 6.5 6.8 6.8 7.5 8.5 5.5 4.0 330. * 6.8 6.8 6.8 6.9 4.6 3.7 3.3 3.5 3.8 4.6 6.0 6.2 6.3 6.5 6.5 6.5 7.5 8.3 5.7 4.3 340. * 6.5 6.5 6.5 6.6 4.5 3.5 3.0 3.2 3.7 4.2 5.9 6.0 6.2 6.3 6.3 6.3 7.7 8.5 5.9 4.5 350. * 6.5 6.5 6.5 6.5 4.6 3.6 2.9 3.3 3.6 4.4 6.2 6.2 6.3 6.2 6.2 6.4 8.1 8.6 6.3 5.0 360. * 6.6 6.6 6.8 6.7 4.6 3.7 3.2 3.1 3.7 4.7 6.4 6.4 6.3 6.3 6.6 7.1 8.8 9.0 7.0 5.8 ------*------------------------------------------------------------------------------------------------------------------------ MAX * 9.4 9.4 9.0 8.9 6.3 4.9 4.2 3.9 4.7 5.8 9.0 8.7 8.8 9.0 9.2 9.3 9.1 9.1 7.0 5.8 DEGR. * 70 70 70 70 60 60 60 50 60 60 290 70 70 70 60 60 10 10 0 10
� PAGE 5 JOB: I25HarmonywithPkgStationPA RUN: I25HarmonywithPkgStationPA
MODEL RESULTS -------------
REMARKS : In search of the angle corresponding to the maximum concentration, only the first angle, of the angles with same maximum concentrations, is indicated as maximum.
WIND ANGLE RANGE: 0.-360.
WIND * CONCENTRATION ANGLE * (PPM) (DEGR)* REC21 REC22 REC23 REC24 REC25 REC26 REC27 REC28 REC29 REC30 REC31 REC32 REC33 REC34 REC35 REC36 REC37 REC38 REC39 REC40 ------*------------------------------------------------------------------------------------------------------------------------ 0. * 5.2 4.4 4.7 5.2 6.6 6.1 5.5 4.9 .2 .4 .8 1.9 1.9 1.8 1.8 1.6 1.6 1.6 1.6 .7 10. * 5.4 3.4 3.8 4.6 6.0 5.4 5.0 4.5 .0 .2 .2 .8 .8 .8 .8 2.3 2.3 2.3 2.3 1.2 20. * 4.9 2.7 3.3 4.0 5.5 5.0 4.6 4.4 .0 .0 .0 .2 .2 .2 .2 2.3 2.3 2.3 2.3 1.3 30. * 4.4 2.4 2.9 3.9 5.3 4.9 4.5 4.4 .0 .0 .0 .0 .0 .0 .0 2.0 2.0 2.0 2.0 1.2 40. * 3.9 2.3 2.9 3.8 5.4 5.0 4.8 4.7 .0 .0 .0 .0 .0 .0 .0 1.8 1.8 1.8 1.8 1.1 50. * 3.7 2.3 2.8 3.7 5.4 5.1 5.0 5.0 .0 .0 .0 .0 .0 .0 .0 1.7 1.7 1.7 1.7 1.0 60. * 3.3 1.9 2.8 3.5 5.6 5.4 5.1 5.1 .1 .1 .1 .1 .0 .0 .0 1.5 1.5 1.5 1.5 1.0 70. * 2.8 1.4 2.1 3.2 5.2 5.2 5.1 4.9 .4 .5 .5 .5 .0 .0 .0 1.5 1.5 1.5 1.7 1.2 80. * 1.9 .6 1.1 2.2 4.3 4.3 4.0 3.7 1.5 1.6 1.6 1.8 .4 .1 .0 1.5 1.6 1.8 2.7 2.4 90. * 1.4 .1 .4 .9 2.5 2.2 2.2 2.1 3.8 3.9 4.1 4.3 1.3 .6 .3 1.8 2.1 2.9 4.6 4.4 100. * 1.3 .0 .0 .1 .7 .7 .7 .7 5.6 6.0 6.4 6.6 2.9 1.6 .9 2.5 3.0 4.1 6.8 6.7 110. * 1.3 .0 .0 .0 .2 .2 .2 .2 6.6 7.0 7.4 7.8 3.9 2.6 1.7 3.2 4.0 5.4 7.7 7.7 120. * 1.3 .0 .0 .0 .1 .1 .1 .1 6.7 7.2 7.4 7.8 4.3 3.1 2.2 3.8 4.7 5.9 8.1 7.9 130. * 1.5 .0 .0 .0 .0 .0 .0 .0 6.4 6.9 7.2 7.7 4.7 3.4 2.6 4.4 5.1 5.8
Page 4
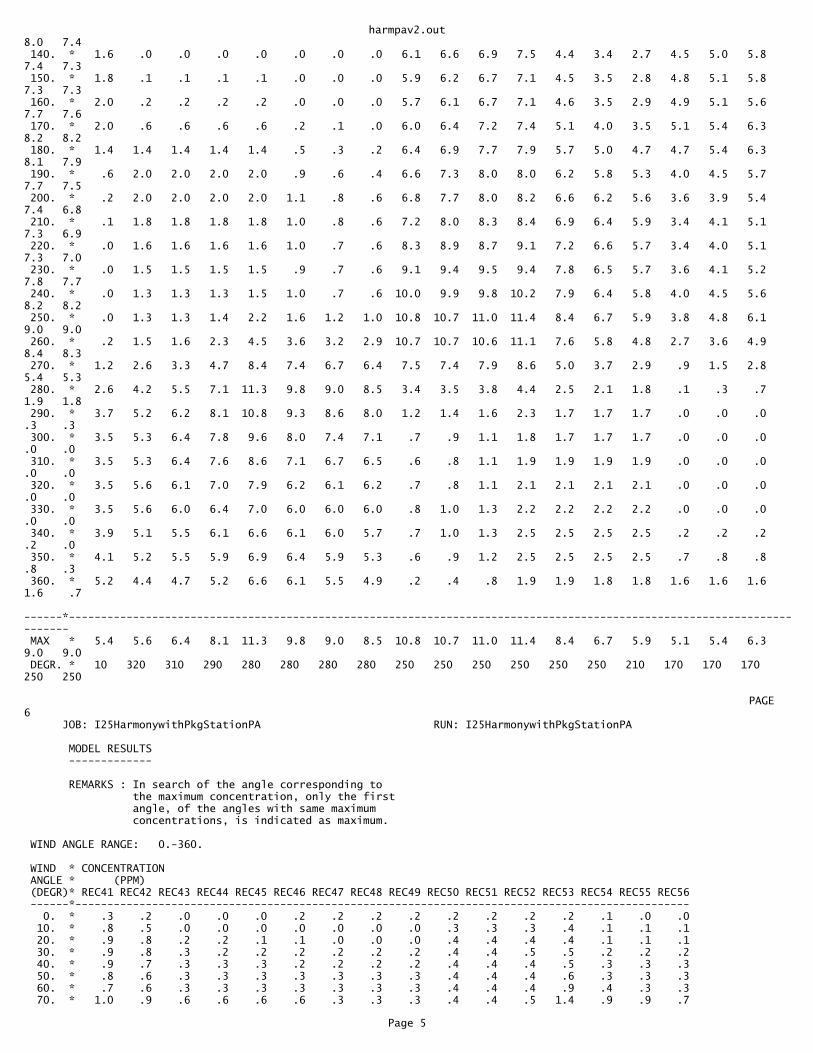
harmpav2.out8.0 7.4 140. * 1.6 .0 .0 .0 .0 .0 .0 .0 6.1 6.6 6.9 7.5 4.4 3.4 2.7 4.5 5.0 5.8 7.4 7.3 150. * 1.8 .1 .1 .1 .1 .0 .0 .0 5.9 6.2 6.7 7.1 4.5 3.5 2.8 4.8 5.1 5.8 7.3 7.3 160. * 2.0 .2 .2 .2 .2 .0 .0 .0 5.7 6.1 6.7 7.1 4.6 3.5 2.9 4.9 5.1 5.6 7.7 7.6 170. * 2.0 .6 .6 .6 .6 .2 .1 .0 6.0 6.4 7.2 7.4 5.1 4.0 3.5 5.1 5.4 6.3 8.2 8.2 180. * 1.4 1.4 1.4 1.4 1.4 .5 .3 .2 6.4 6.9 7.7 7.9 5.7 5.0 4.7 4.7 5.4 6.3 8.1 7.9 190. * .6 2.0 2.0 2.0 2.0 .9 .6 .4 6.6 7.3 8.0 8.0 6.2 5.8 5.3 4.0 4.5 5.7 7.7 7.5 200. * .2 2.0 2.0 2.0 2.0 1.1 .8 .6 6.8 7.7 8.0 8.2 6.6 6.2 5.6 3.6 3.9 5.4 7.4 6.8 210. * .1 1.8 1.8 1.8 1.8 1.0 .8 .6 7.2 8.0 8.3 8.4 6.9 6.4 5.9 3.4 4.1 5.1 7.3 6.9 220. * .0 1.6 1.6 1.6 1.6 1.0 .7 .6 8.3 8.9 8.7 9.1 7.2 6.6 5.7 3.4 4.0 5.1 7.3 7.0 230. * .0 1.5 1.5 1.5 1.5 .9 .7 .6 9.1 9.4 9.5 9.4 7.8 6.5 5.7 3.6 4.1 5.2 7.8 7.7 240. * .0 1.3 1.3 1.3 1.5 1.0 .7 .6 10.0 9.9 9.8 10.2 7.9 6.4 5.8 4.0 4.5 5.6 8.2 8.2 250. * .0 1.3 1.3 1.4 2.2 1.6 1.2 1.0 10.8 10.7 11.0 11.4 8.4 6.7 5.9 3.8 4.8 6.1 9.0 9.0 260. * .2 1.5 1.6 2.3 4.5 3.6 3.2 2.9 10.7 10.7 10.6 11.1 7.6 5.8 4.8 2.7 3.6 4.9 8.4 8.3 270. * 1.2 2.6 3.3 4.7 8.4 7.4 6.7 6.4 7.5 7.4 7.9 8.6 5.0 3.7 2.9 .9 1.5 2.8 5.4 5.3 280. * 2.6 4.2 5.5 7.1 11.3 9.8 9.0 8.5 3.4 3.5 3.8 4.4 2.5 2.1 1.8 .1 .3 .7 1.9 1.8 290. * 3.7 5.2 6.2 8.1 10.8 9.3 8.6 8.0 1.2 1.4 1.6 2.3 1.7 1.7 1.7 .0 .0 .0 .3 .3 300. * 3.5 5.3 6.4 7.8 9.6 8.0 7.4 7.1 .7 .9 1.1 1.8 1.7 1.7 1.7 .0 .0 .0 .0 .0 310. * 3.5 5.3 6.4 7.6 8.6 7.1 6.7 6.5 .6 .8 1.1 1.9 1.9 1.9 1.9 .0 .0 .0 .0 .0 320. * 3.5 5.6 6.1 7.0 7.9 6.2 6.1 6.2 .7 .8 1.1 2.1 2.1 2.1 2.1 .0 .0 .0 .0 .0 330. * 3.5 5.6 6.0 6.4 7.0 6.0 6.0 6.0 .8 1.0 1.3 2.2 2.2 2.2 2.2 .0 .0 .0 .0 .0 340. * 3.9 5.1 5.5 6.1 6.6 6.1 6.0 5.7 .7 1.0 1.3 2.5 2.5 2.5 2.5 .2 .2 .2 .2 .0 350. * 4.1 5.2 5.5 5.9 6.9 6.4 5.9 5.3 .6 .9 1.2 2.5 2.5 2.5 2.5 .7 .8 .8 .8 .3 360. * 5.2 4.4 4.7 5.2 6.6 6.1 5.5 4.9 .2 .4 .8 1.9 1.9 1.8 1.8 1.6 1.6 1.6 1.6 .7 ------*------------------------------------------------------------------------------------------------------------------------ MAX * 5.4 5.6 6.4 8.1 11.3 9.8 9.0 8.5 10.8 10.7 11.0 11.4 8.4 6.7 5.9 5.1 5.4 6.3 9.0 9.0 DEGR. * 10 320 310 290 280 280 280 280 250 250 250 250 250 250 210 170 170 170 250 250
� PAGE 6 JOB: I25HarmonywithPkgStationPA RUN: I25HarmonywithPkgStationPA
MODEL RESULTS -------------
REMARKS : In search of the angle corresponding to the maximum concentration, only the first angle, of the angles with same maximum concentrations, is indicated as maximum.
WIND ANGLE RANGE: 0.-360.
WIND * CONCENTRATION ANGLE * (PPM) (DEGR)* REC41 REC42 REC43 REC44 REC45 REC46 REC47 REC48 REC49 REC50 REC51 REC52 REC53 REC54 REC55 REC56 ------*------------------------------------------------------------------------------------------------ 0. * .3 .2 .0 .0 .0 .2 .2 .2 .2 .2 .2 .2 .2 .1 .0 .0 10. * .8 .5 .0 .0 .0 .0 .0 .0 .0 .3 .3 .3 .4 .1 .1 .1 20. * .9 .8 .2 .2 .1 .1 .0 .0 .0 .4 .4 .4 .4 .1 .1 .1 30. * .9 .8 .3 .2 .2 .2 .2 .2 .2 .4 .4 .5 .5 .2 .2 .2 40. * .9 .7 .3 .3 .3 .2 .2 .2 .2 .4 .4 .4 .5 .3 .3 .3 50. * .8 .6 .3 .3 .3 .3 .3 .3 .3 .4 .4 .4 .6 .3 .3 .3 60. * .7 .6 .3 .3 .3 .3 .3 .3 .3 .4 .4 .4 .9 .4 .3 .3 70. * 1.0 .9 .6 .6 .6 .6 .3 .3 .3 .4 .4 .5 1.4 .9 .9 .7
Page 5
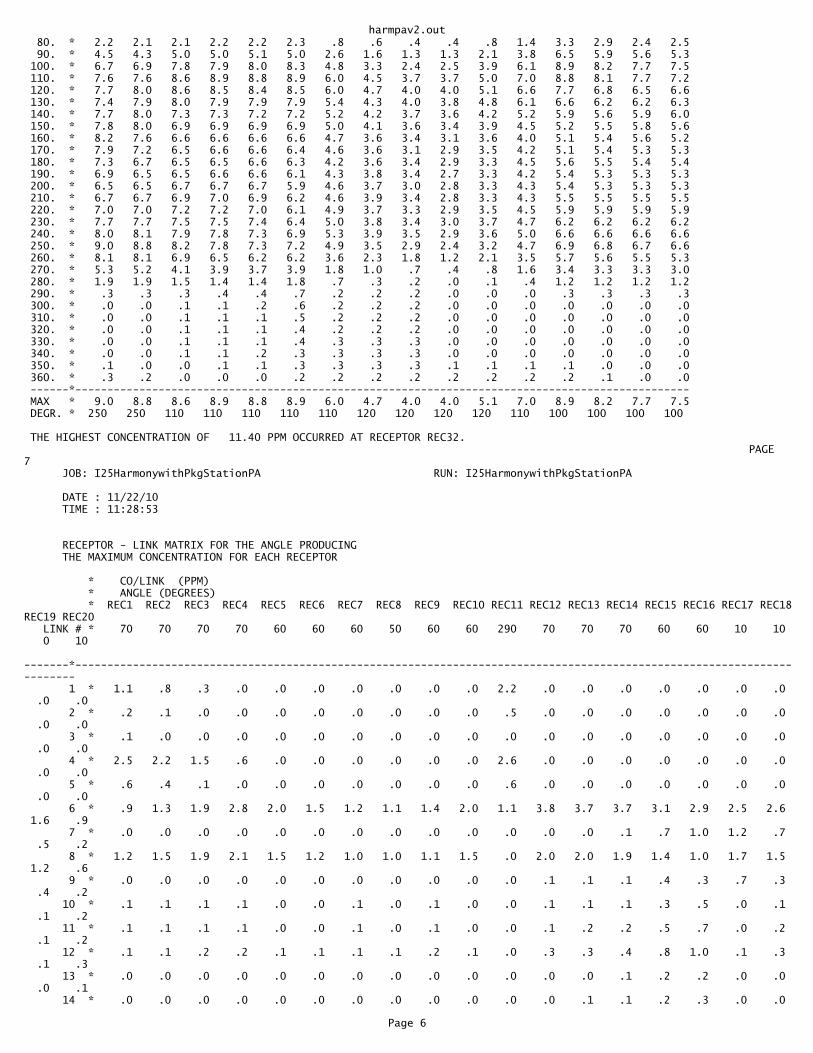
harmpav2.out 80. * 2.2 2.1 2.1 2.2 2.2 2.3 .8 .6 .4 .4 .8 1.4 3.3 2.9 2.4 2.5 90. * 4.5 4.3 5.0 5.0 5.1 5.0 2.6 1.6 1.3 1.3 2.1 3.8 6.5 5.9 5.6 5.3 100. * 6.7 6.9 7.8 7.9 8.0 8.3 4.8 3.3 2.4 2.5 3.9 6.1 8.9 8.2 7.7 7.5 110. * 7.6 7.6 8.6 8.9 8.8 8.9 6.0 4.5 3.7 3.7 5.0 7.0 8.8 8.1 7.7 7.2 120. * 7.7 8.0 8.6 8.5 8.4 8.5 6.0 4.7 4.0 4.0 5.1 6.6 7.7 6.8 6.5 6.6 130. * 7.4 7.9 8.0 7.9 7.9 7.9 5.4 4.3 4.0 3.8 4.8 6.1 6.6 6.2 6.2 6.3 140. * 7.7 8.0 7.3 7.3 7.2 7.2 5.2 4.2 3.7 3.6 4.2 5.2 5.9 5.6 5.9 6.0 150. * 7.8 8.0 6.9 6.9 6.9 6.9 5.0 4.1 3.6 3.4 3.9 4.5 5.2 5.5 5.8 5.6 160. * 8.2 7.6 6.6 6.6 6.6 6.6 4.7 3.6 3.4 3.1 3.6 4.0 5.1 5.4 5.6 5.2 170. * 7.9 7.2 6.5 6.6 6.6 6.4 4.6 3.6 3.1 2.9 3.5 4.2 5.1 5.4 5.3 5.3 180. * 7.3 6.7 6.5 6.5 6.6 6.3 4.2 3.6 3.4 2.9 3.3 4.5 5.6 5.5 5.4 5.4 190. * 6.9 6.5 6.5 6.6 6.6 6.1 4.3 3.8 3.4 2.7 3.3 4.2 5.4 5.3 5.3 5.3 200. * 6.5 6.5 6.7 6.7 6.7 5.9 4.6 3.7 3.0 2.8 3.3 4.3 5.4 5.3 5.3 5.3 210. * 6.7 6.7 6.9 7.0 6.9 6.2 4.6 3.9 3.4 2.8 3.3 4.3 5.5 5.5 5.5 5.5 220. * 7.0 7.0 7.2 7.2 7.0 6.1 4.9 3.7 3.3 2.9 3.5 4.5 5.9 5.9 5.9 5.9 230. * 7.7 7.7 7.5 7.5 7.4 6.4 5.0 3.8 3.4 3.0 3.7 4.7 6.2 6.2 6.2 6.2 240. * 8.0 8.1 7.9 7.8 7.3 6.9 5.3 3.9 3.5 2.9 3.6 5.0 6.6 6.6 6.6 6.6 250. * 9.0 8.8 8.2 7.8 7.3 7.2 4.9 3.5 2.9 2.4 3.2 4.7 6.9 6.8 6.7 6.6 260. * 8.1 8.1 6.9 6.5 6.2 6.2 3.6 2.3 1.8 1.2 2.1 3.5 5.7 5.6 5.5 5.3 270. * 5.3 5.2 4.1 3.9 3.7 3.9 1.8 1.0 .7 .4 .8 1.6 3.4 3.3 3.3 3.0 280. * 1.9 1.9 1.5 1.4 1.4 1.8 .7 .3 .2 .0 .1 .4 1.2 1.2 1.2 1.2 290. * .3 .3 .3 .4 .4 .7 .2 .2 .2 .0 .0 .0 .3 .3 .3 .3 300. * .0 .0 .1 .1 .2 .6 .2 .2 .2 .0 .0 .0 .0 .0 .0 .0 310. * .0 .0 .1 .1 .1 .5 .2 .2 .2 .0 .0 .0 .0 .0 .0 .0 320. * .0 .0 .1 .1 .1 .4 .2 .2 .2 .0 .0 .0 .0 .0 .0 .0 330. * .0 .0 .1 .1 .1 .4 .3 .3 .3 .0 .0 .0 .0 .0 .0 .0 340. * .0 .0 .1 .1 .2 .3 .3 .3 .3 .0 .0 .0 .0 .0 .0 .0 350. * .1 .0 .0 .1 .1 .3 .3 .3 .3 .1 .1 .1 .1 .0 .0 .0 360. * .3 .2 .0 .0 .0 .2 .2 .2 .2 .2 .2 .2 .2 .1 .0 .0 ------*------------------------------------------------------------------------------------------------ MAX * 9.0 8.8 8.6 8.9 8.8 8.9 6.0 4.7 4.0 4.0 5.1 7.0 8.9 8.2 7.7 7.5 DEGR. * 250 250 110 110 110 110 110 120 120 120 120 110 100 100 100 100
THE HIGHEST CONCENTRATION OF 11.40 PPM OCCURRED AT RECEPTOR REC32.� PAGE 7 JOB: I25HarmonywithPkgStationPA RUN: I25HarmonywithPkgStationPA
DATE : 11/22/10 TIME : 11:28:53
RECEPTOR - LINK MATRIX FOR THE ANGLE PRODUCING THE MAXIMUM CONCENTRATION FOR EACH RECEPTOR
* CO/LINK (PPM) * ANGLE (DEGREES) * REC1 REC2 REC3 REC4 REC5 REC6 REC7 REC8 REC9 REC10 REC11 REC12 REC13 REC14 REC15 REC16 REC17 REC18REC19 REC20 LINK # * 70 70 70 70 60 60 60 50 60 60 290 70 70 70 60 60 10 10 0 10 -------*------------------------------------------------------------------------------------------------------------------------ 1 * 1.1 .8 .3 .0 .0 .0 .0 .0 .0 .0 2.2 .0 .0 .0 .0 .0 .0 .0 .0 .0 2 * .2 .1 .0 .0 .0 .0 .0 .0 .0 .0 .5 .0 .0 .0 .0 .0 .0 .0 .0 .0 3 * .1 .0 .0 .0 .0 .0 .0 .0 .0 .0 .0 .0 .0 .0 .0 .0 .0 .0 .0 .0 4 * 2.5 2.2 1.5 .6 .0 .0 .0 .0 .0 .0 2.6 .0 .0 .0 .0 .0 .0 .0 .0 .0 5 * .6 .4 .1 .0 .0 .0 .0 .0 .0 .0 .6 .0 .0 .0 .0 .0 .0 .0 .0 .0 6 * .9 1.3 1.9 2.8 2.0 1.5 1.2 1.1 1.4 2.0 1.1 3.8 3.7 3.7 3.1 2.9 2.5 2.6 1.6 .9 7 * .0 .0 .0 .0 .0 .0 .0 .0 .0 .0 .0 .0 .0 .1 .7 1.0 1.2 .7 .5 .2 8 * 1.2 1.5 1.9 2.1 1.5 1.2 1.0 1.0 1.1 1.5 .0 2.0 2.0 1.9 1.4 1.0 1.7 1.5 1.2 .6 9 * .0 .0 .0 .0 .0 .0 .0 .0 .0 .0 .0 .1 .1 .1 .4 .3 .7 .3 .4 .2 10 * .1 .1 .1 .1 .0 .0 .1 .0 .1 .0 .0 .1 .1 .1 .3 .5 .0 .1 .1 .2 11 * .1 .1 .1 .1 .0 .0 .1 .0 .1 .0 .0 .1 .2 .2 .5 .7 .0 .2 .1 .2 12 * .1 .1 .2 .2 .1 .1 .1 .1 .2 .1 .0 .3 .3 .4 .8 1.0 .1 .3 .1 .3 13 * .0 .0 .0 .0 .0 .0 .0 .0 .0 .0 .0 .0 .0 .1 .2 .2 .0 .0 .0 .1 14 * .0 .0 .0 .0 .0 .0 .0 .0 .0 .0 .0 .0 .1 .1 .2 .3 .0 .0
Page 6
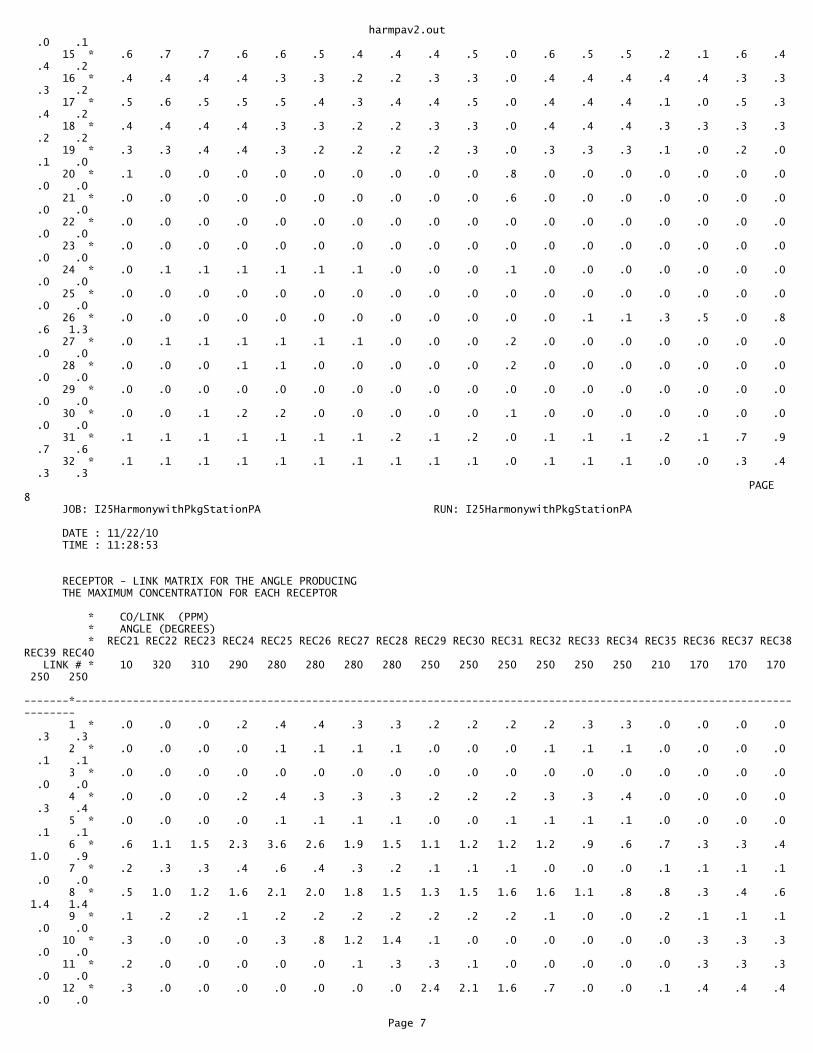
harmpav2.out .0 .1 15 * .6 .7 .7 .6 .6 .5 .4 .4 .4 .5 .0 .6 .5 .5 .2 .1 .6 .4 .4 .2 16 * .4 .4 .4 .4 .3 .3 .2 .2 .3 .3 .0 .4 .4 .4 .4 .4 .3 .3 .3 .2 17 * .5 .6 .5 .5 .5 .4 .3 .4 .4 .5 .0 .4 .4 .4 .1 .0 .5 .3 .4 .2 18 * .4 .4 .4 .4 .3 .3 .2 .2 .3 .3 .0 .4 .4 .4 .3 .3 .3 .3 .2 .2 19 * .3 .3 .4 .4 .3 .2 .2 .2 .2 .3 .0 .3 .3 .3 .1 .0 .2 .0 .1 .0 20 * .1 .0 .0 .0 .0 .0 .0 .0 .0 .0 .8 .0 .0 .0 .0 .0 .0 .0 .0 .0 21 * .0 .0 .0 .0 .0 .0 .0 .0 .0 .0 .6 .0 .0 .0 .0 .0 .0 .0 .0 .0 22 * .0 .0 .0 .0 .0 .0 .0 .0 .0 .0 .0 .0 .0 .0 .0 .0 .0 .0 .0 .0 23 * .0 .0 .0 .0 .0 .0 .0 .0 .0 .0 .0 .0 .0 .0 .0 .0 .0 .0 .0 .0 24 * .0 .1 .1 .1 .1 .1 .1 .0 .0 .0 .1 .0 .0 .0 .0 .0 .0 .0 .0 .0 25 * .0 .0 .0 .0 .0 .0 .0 .0 .0 .0 .0 .0 .0 .0 .0 .0 .0 .0 .0 .0 26 * .0 .0 .0 .0 .0 .0 .0 .0 .0 .0 .0 .0 .1 .1 .3 .5 .0 .8 .6 1.3 27 * .0 .1 .1 .1 .1 .1 .1 .0 .0 .0 .2 .0 .0 .0 .0 .0 .0 .0 .0 .0 28 * .0 .0 .0 .1 .1 .0 .0 .0 .0 .0 .2 .0 .0 .0 .0 .0 .0 .0 .0 .0 29 * .0 .0 .0 .0 .0 .0 .0 .0 .0 .0 .0 .0 .0 .0 .0 .0 .0 .0 .0 .0 30 * .0 .0 .1 .2 .2 .0 .0 .0 .0 .0 .1 .0 .0 .0 .0 .0 .0 .0 .0 .0 31 * .1 .1 .1 .1 .1 .1 .1 .2 .1 .2 .0 .1 .1 .1 .2 .1 .7 .9 .7 .6 32 * .1 .1 .1 .1 .1 .1 .1 .1 .1 .1 .0 .1 .1 .1 .0 .0 .3 .4 .3 .3� PAGE 8 JOB: I25HarmonywithPkgStationPA RUN: I25HarmonywithPkgStationPA
DATE : 11/22/10 TIME : 11:28:53
RECEPTOR - LINK MATRIX FOR THE ANGLE PRODUCING THE MAXIMUM CONCENTRATION FOR EACH RECEPTOR
* CO/LINK (PPM) * ANGLE (DEGREES) * REC21 REC22 REC23 REC24 REC25 REC26 REC27 REC28 REC29 REC30 REC31 REC32 REC33 REC34 REC35 REC36 REC37 REC38REC39 REC40 LINK # * 10 320 310 290 280 280 280 280 250 250 250 250 250 250 210 170 170 170 250 250 -------*------------------------------------------------------------------------------------------------------------------------ 1 * .0 .0 .0 .2 .4 .4 .3 .3 .2 .2 .2 .2 .3 .3 .0 .0 .0 .0 .3 .3 2 * .0 .0 .0 .0 .1 .1 .1 .1 .0 .0 .0 .1 .1 .1 .0 .0 .0 .0 .1 .1 3 * .0 .0 .0 .0 .0 .0 .0 .0 .0 .0 .0 .0 .0 .0 .0 .0 .0 .0 .0 .0 4 * .0 .0 .0 .2 .4 .3 .3 .3 .2 .2 .2 .3 .3 .4 .0 .0 .0 .0 .3 .4 5 * .0 .0 .0 .0 .1 .1 .1 .1 .0 .0 .1 .1 .1 .1 .0 .0 .0 .0 .1 .1 6 * .6 1.1 1.5 2.3 3.6 2.6 1.9 1.5 1.1 1.2 1.2 1.2 .9 .6 .7 .3 .3 .4 1.0 .9 7 * .2 .3 .3 .4 .6 .4 .3 .2 .1 .1 .1 .0 .0 .0 .1 .1 .1 .1 .0 .0 8 * .5 1.0 1.2 1.6 2.1 2.0 1.8 1.5 1.3 1.5 1.6 1.6 1.1 .8 .8 .3 .4 .6 1.4 1.4 9 * .1 .2 .2 .1 .2 .2 .2 .2 .2 .2 .2 .1 .0 .0 .2 .1 .1 .1 .0 .0 10 * .3 .0 .0 .0 .3 .8 1.2 1.4 .1 .0 .0 .0 .0 .0 .0 .3 .3 .3 .0 .0 11 * .2 .0 .0 .0 .0 .0 .1 .3 .3 .1 .0 .0 .0 .0 .0 .3 .3 .3 .0 .0 12 * .3 .0 .0 .0 .0 .0 .0 .0 2.4 2.1 1.6 .7 .0 .0 .1 .4 .4 .4 .0 .0
Page 7
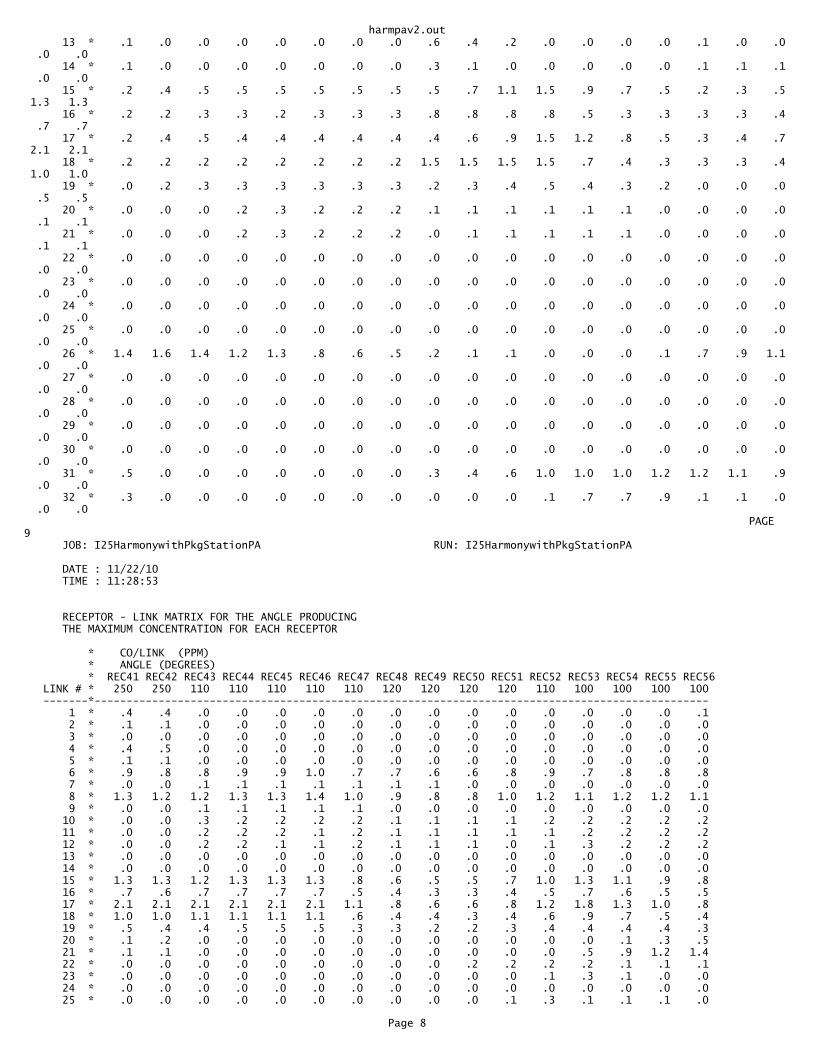
harmpav2.out 13 * .1 .0 .0 .0 .0 .0 .0 .0 .6 .4 .2 .0 .0 .0 .0 .1 .0 .0 .0 .0 14 * .1 .0 .0 .0 .0 .0 .0 .0 .3 .1 .0 .0 .0 .0 .0 .1 .1 .1 .0 .0 15 * .2 .4 .5 .5 .5 .5 .5 .5 .5 .7 1.1 1.5 .9 .7 .5 .2 .3 .5 1.3 1.3 16 * .2 .2 .3 .3 .2 .3 .3 .3 .8 .8 .8 .8 .5 .3 .3 .3 .3 .4 .7 .7 17 * .2 .4 .5 .4 .4 .4 .4 .4 .4 .6 .9 1.5 1.2 .8 .5 .3 .4 .7 2.1 2.1 18 * .2 .2 .2 .2 .2 .2 .2 .2 1.5 1.5 1.5 1.5 .7 .4 .3 .3 .3 .4 1.0 1.0 19 * .0 .2 .3 .3 .3 .3 .3 .3 .2 .3 .4 .5 .4 .3 .2 .0 .0 .0 .5 .5 20 * .0 .0 .0 .2 .3 .2 .2 .2 .1 .1 .1 .1 .1 .1 .0 .0 .0 .0 .1 .1 21 * .0 .0 .0 .2 .3 .2 .2 .2 .0 .1 .1 .1 .1 .1 .0 .0 .0 .0 .1 .1 22 * .0 .0 .0 .0 .0 .0 .0 .0 .0 .0 .0 .0 .0 .0 .0 .0 .0 .0 .0 .0 23 * .0 .0 .0 .0 .0 .0 .0 .0 .0 .0 .0 .0 .0 .0 .0 .0 .0 .0 .0 .0 24 * .0 .0 .0 .0 .0 .0 .0 .0 .0 .0 .0 .0 .0 .0 .0 .0 .0 .0 .0 .0 25 * .0 .0 .0 .0 .0 .0 .0 .0 .0 .0 .0 .0 .0 .0 .0 .0 .0 .0 .0 .0 26 * 1.4 1.6 1.4 1.2 1.3 .8 .6 .5 .2 .1 .1 .0 .0 .0 .1 .7 .9 1.1 .0 .0 27 * .0 .0 .0 .0 .0 .0 .0 .0 .0 .0 .0 .0 .0 .0 .0 .0 .0 .0 .0 .0 28 * .0 .0 .0 .0 .0 .0 .0 .0 .0 .0 .0 .0 .0 .0 .0 .0 .0 .0 .0 .0 29 * .0 .0 .0 .0 .0 .0 .0 .0 .0 .0 .0 .0 .0 .0 .0 .0 .0 .0 .0 .0 30 * .0 .0 .0 .0 .0 .0 .0 .0 .0 .0 .0 .0 .0 .0 .0 .0 .0 .0 .0 .0 31 * .5 .0 .0 .0 .0 .0 .0 .0 .3 .4 .6 1.0 1.0 1.0 1.2 1.2 1.1 .9 .0 .0 32 * .3 .0 .0 .0 .0 .0 .0 .0 .0 .0 .0 .1 .7 .7 .9 .1 .1 .0 .0 .0� PAGE 9 JOB: I25HarmonywithPkgStationPA RUN: I25HarmonywithPkgStationPA
DATE : 11/22/10 TIME : 11:28:53
RECEPTOR - LINK MATRIX FOR THE ANGLE PRODUCING THE MAXIMUM CONCENTRATION FOR EACH RECEPTOR
* CO/LINK (PPM) * ANGLE (DEGREES) * REC41 REC42 REC43 REC44 REC45 REC46 REC47 REC48 REC49 REC50 REC51 REC52 REC53 REC54 REC55 REC56 LINK # * 250 250 110 110 110 110 110 120 120 120 120 110 100 100 100 100 -------*------------------------------------------------------------------------------------------------ 1 * .4 .4 .0 .0 .0 .0 .0 .0 .0 .0 .0 .0 .0 .0 .0 .1 2 * .1 .1 .0 .0 .0 .0 .0 .0 .0 .0 .0 .0 .0 .0 .0 .0 3 * .0 .0 .0 .0 .0 .0 .0 .0 .0 .0 .0 .0 .0 .0 .0 .0 4 * .4 .5 .0 .0 .0 .0 .0 .0 .0 .0 .0 .0 .0 .0 .0 .0 5 * .1 .1 .0 .0 .0 .0 .0 .0 .0 .0 .0 .0 .0 .0 .0 .0 6 * .9 .8 .8 .9 .9 1.0 .7 .7 .6 .6 .8 .9 .7 .8 .8 .8 7 * .0 .0 .1 .1 .1 .1 .1 .1 .1 .0 .0 .0 .0 .0 .0 .0 8 * 1.3 1.2 1.2 1.3 1.3 1.4 1.0 .9 .8 .8 1.0 1.2 1.1 1.2 1.2 1.1 9 * .0 .0 .1 .1 .1 .1 .1 .0 .0 .0 .0 .0 .0 .0 .0 .0 10 * .0 .0 .3 .2 .2 .2 .2 .1 .1 .1 .1 .2 .2 .2 .2 .2 11 * .0 .0 .2 .2 .2 .1 .2 .1 .1 .1 .1 .1 .2 .2 .2 .2 12 * .0 .0 .2 .2 .1 .1 .2 .1 .1 .1 .0 .1 .3 .2 .2 .2 13 * .0 .0 .0 .0 .0 .0 .0 .0 .0 .0 .0 .0 .0 .0 .0 .0 14 * .0 .0 .0 .0 .0 .0 .0 .0 .0 .0 .0 .0 .0 .0 .0 .0 15 * 1.3 1.3 1.2 1.3 1.3 1.3 .8 .6 .5 .5 .7 1.0 1.3 1.1 .9 .8 16 * .7 .6 .7 .7 .7 .7 .5 .4 .3 .3 .4 .5 .7 .6 .5 .5 17 * 2.1 2.1 2.1 2.1 2.1 2.1 1.1 .8 .6 .6 .8 1.2 1.8 1.3 1.0 .8 18 * 1.0 1.0 1.1 1.1 1.1 1.1 .6 .4 .4 .3 .4 .6 .9 .7 .5 .4 19 * .5 .4 .4 .5 .5 .5 .3 .3 .2 .2 .3 .4 .4 .4 .4 .3 20 * .1 .2 .0 .0 .0 .0 .0 .0 .0 .0 .0 .0 .0 .1 .3 .5 21 * .1 .1 .0 .0 .0 .0 .0 .0 .0 .0 .0 .0 .5 .9 1.2 1.4 22 * .0 .0 .0 .0 .0 .0 .0 .0 .0 .2 .2 .2 .2 .1 .1 .1 23 * .0 .0 .0 .0 .0 .0 .0 .0 .0 .0 .0 .1 .3 .1 .0 .0 24 * .0 .0 .0 .0 .0 .0 .0 .0 .0 .0 .0 .0 .0 .0 .0 .0 25 * .0 .0 .0 .0 .0 .0 .0 .0 .0 .0 .1 .3 .1 .1 .1 .0
Page 8
harmpav2.out 26 * .0 .0 .2 .2 .2 .2 .2 .2 .2 .2 .2 .2 .1 .1 .1 .1 27 * .0 .0 .0 .0 .0 .0 .0 .0 .0 .0 .0 .0 .0 .0 .0 .0 28 * .0 .0 .0 .0 .0 .0 .0 .0 .0 .0 .0 .0 .0 .0 .0 .0 29 * .0 .0 .0 .0 .0 .0 .0 .0 .0 .0 .0 .0 .0 .0 .0 .0 30 * .0 .0 .0 .0 .0 .0 .0 .0 .0 .0 .0 .0 .0 .0 .0 .0 31 * .0 .0 .0 .0 .0 .0 .0 .0 .0 .0 .0 .0 .1 .1 .0 .0 32 * .0 .0 .0 .0 .0 .0 .0 .0 .0 .0 .0 .0 .0 .0 .0 .0
Page 9
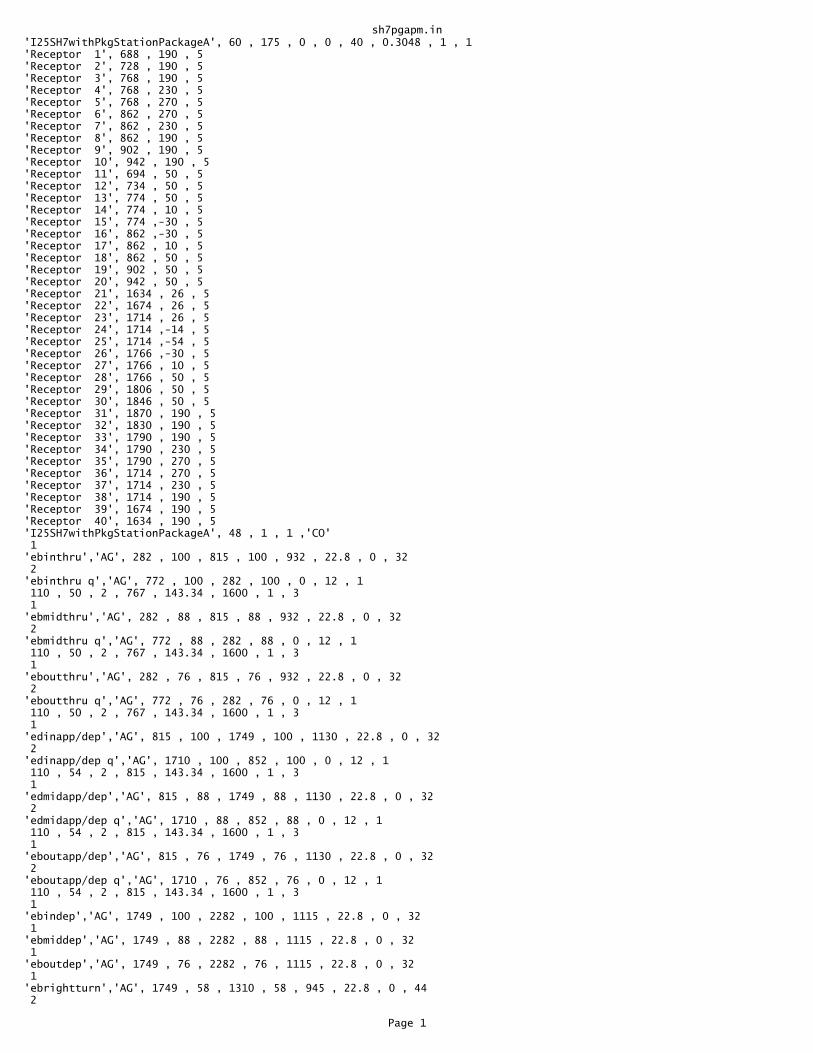
sh7pgapm.in'I25SH7withPkgStationPackageA', 60 , 175 , 0 , 0 , 40 , 0.3048 , 1 , 1 'Receptor 1', 688 , 190 , 5 'Receptor 2', 728 , 190 , 5 'Receptor 3', 768 , 190 , 5 'Receptor 4', 768 , 230 , 5 'Receptor 5', 768 , 270 , 5 'Receptor 6', 862 , 270 , 5 'Receptor 7', 862 , 230 , 5 'Receptor 8', 862 , 190 , 5 'Receptor 9', 902 , 190 , 5 'Receptor 10', 942 , 190 , 5 'Receptor 11', 694 , 50 , 5 'Receptor 12', 734 , 50 , 5 'Receptor 13', 774 , 50 , 5 'Receptor 14', 774 , 10 , 5 'Receptor 15', 774 ,-30 , 5 'Receptor 16', 862 ,-30 , 5 'Receptor 17', 862 , 10 , 5 'Receptor 18', 862 , 50 , 5 'Receptor 19', 902 , 50 , 5 'Receptor 20', 942 , 50 , 5 'Receptor 21', 1634 , 26 , 5 'Receptor 22', 1674 , 26 , 5 'Receptor 23', 1714 , 26 , 5 'Receptor 24', 1714 ,-14 , 5 'Receptor 25', 1714 ,-54 , 5 'Receptor 26', 1766 ,-30 , 5 'Receptor 27', 1766 , 10 , 5 'Receptor 28', 1766 , 50 , 5 'Receptor 29', 1806 , 50 , 5 'Receptor 30', 1846 , 50 , 5 'Receptor 31', 1870 , 190 , 5 'Receptor 32', 1830 , 190 , 5 'Receptor 33', 1790 , 190 , 5 'Receptor 34', 1790 , 230 , 5 'Receptor 35', 1790 , 270 , 5 'Receptor 36', 1714 , 270 , 5 'Receptor 37', 1714 , 230 , 5 'Receptor 38', 1714 , 190 , 5 'Receptor 39', 1674 , 190 , 5 'Receptor 40', 1634 , 190 , 5 'I25SH7withPkgStationPackageA', 48 , 1 , 1 ,'CO' 1 'ebinthru','AG', 282 , 100 , 815 , 100 , 932 , 22.8 , 0 , 32 2 'ebinthru q','AG', 772 , 100 , 282 , 100 , 0 , 12 , 1 110 , 50 , 2 , 767 , 143.34 , 1600 , 1 , 3 1 'ebmidthru','AG', 282 , 88 , 815 , 88 , 932 , 22.8 , 0 , 32 2 'ebmidthru q','AG', 772 , 88 , 282 , 88 , 0 , 12 , 1 110 , 50 , 2 , 767 , 143.34 , 1600 , 1 , 3 1 'eboutthru','AG', 282 , 76 , 815 , 76 , 932 , 22.8 , 0 , 32 2 'eboutthru q','AG', 772 , 76 , 282 , 76 , 0 , 12 , 1 110 , 50 , 2 , 767 , 143.34 , 1600 , 1 , 3 1 'edinapp/dep','AG', 815 , 100 , 1749 , 100 , 1130 , 22.8 , 0 , 32 2 'edinapp/dep q','AG', 1710 , 100 , 852 , 100 , 0 , 12 , 1 110 , 54 , 2 , 815 , 143.34 , 1600 , 1 , 3 1 'edmidapp/dep','AG', 815 , 88 , 1749 , 88 , 1130 , 22.8 , 0 , 32 2 'edmidapp/dep q','AG', 1710 , 88 , 852 , 88 , 0 , 12 , 1 110 , 54 , 2 , 815 , 143.34 , 1600 , 1 , 3 1 'eboutapp/dep','AG', 815 , 76 , 1749 , 76 , 1130 , 22.8 , 0 , 32 2 'eboutapp/dep q','AG', 1710 , 76 , 852 , 76 , 0 , 12 , 1 110 , 54 , 2 , 815 , 143.34 , 1600 , 1 , 3 1 'ebindep','AG', 1749 , 100 , 2282 , 100 , 1115 , 22.8 , 0 , 32 1 'ebmiddep','AG', 1749 , 88 , 2282 , 88 , 1115 , 22.8 , 0 , 32 1 'eboutdep','AG', 1749 , 76 , 2282 , 76 , 1115 , 22.8 , 0 , 32 1 'ebrightturn','AG', 1749 , 58 , 1310 , 58 , 945 , 22.8 , 0 , 44 2
Page 1

sh7pgapm.in'ebinleftturn','AG', 772 , 124 , 572 , 124 , 0 , 12 , 1 110 , 92 , 2 , 163 , 143.34 , 1600 , 1 , 3 2 'eboutleftturn','AG', 772 , 111.9 , 572 , 111.9 , 0 , 12 , 1 110 , 92 , 2 , 163 , 143.34 , 1600 , 1 , 3 1 'wbinthru','AG', 2282 , 140 , 1749 , 140 , 797 , 22.1 , 0 , 32 2 'wbinthru q','AG', 1770 , 140 , 2282 , 140 , 0 , 12 , 1 110 , 32 , 2 , 625 , 143.34 , 1600 , 1 , 3 1 'wbmidthru','AG', 2282 , 152 , 1749 , 152 , 797 , 22.1 , 0 , 32 2 'wbmidthru q','AG', 1770 , 152 , 2282 , 152 , 0 , 12 , 1 110 , 32 , 2 , 625 , 143.34 , 1600 , 1 , 3 1 'wboutthru','AG', 2282 , 164 , 1749 , 164 , 797 , 22.1 , 0 , 32 2 'wboutthru q','AG', 1770 , 164 , 2282 , 164 , 0 , 12 , 1 110 , 32 , 2 , 625 , 143.34 , 1600 , 1 , 3 1 'wbinapp/dep','AG', 1749 , 140 , 815 , 140 , 718 , 22.1 , 0 , 32 2 'wbinapp/dep q','AG', 852 , 140 , 1710 , 140 , 0 , 12 , 1 110 , 50 , 2 , 490 , 143.34 , 1600 , 1 , 3 1 'wbmidapp/dep','AG', 1749 , 152 , 815 , 152 , 718 , 22.1 , 0 , 32 2 'wbmidapp/dep q','AG', 852 , 152 , 1710 , 152 , 0 , 12 , 1 110 , 50 , 2 , 490 , 143.34 , 1600 , 1 , 3 1 'wboutapp/dep','AG', 1749 , 164 , 815 , 164 , 718 , 22.1 , 0 , 32 2 'wboutapp/dep q','AG', 852 , 164 , 1710 , 164 , 0 , 12 , 1 110 , 50 , 2 , 490 , 143.34 , 1600 , 1 , 3 1 'wbindep','AG', 815 , 140 , 282 , 140 , 643 , 22.1 , 0 , 32 1 'wbmiddep','AG', 815 , 152 , 282 , 152 , 643 , 22.1 , 0 , 32 1 'wboutdep','AG', 815 , 164 , 282 , 164 , 643 , 22.1 , 0 , 32 2 'wbinleftturn','AG', 1770 , 116 , 1970 , 116 , 0 , 12 , 1 110 , 88 , 2 , 258 , 143.34 , 1600 , 1 , 3 2 'wboutleftturn','AG', 1770 , 128 , 1970 , 128 , 0 , 12 , 1 110 , 88 , 2 , 258 , 143.34 , 1600 , 1 , 3 2 'wbinleftturn 2','AG', 852 , 112 , 1052 , 112 , 0 , 12 , 1 110 , 90 , 2 , 145 , 143.34 , 1600 , 1 , 3 2 'wboutleftturn 2','AG', 852 , 124 , 1052 , 124 , 0 , 12 , 1 110 , 90 , 2 , 145 , 143.34 , 1600 , 1 , 3 1 'pkg sb','AG', 794 , 1120 , 794 , 120 , 880 , 22.6 , 0 , 44 2 'pkg sb q','AG', 794 , 180 , 794 , 1120 , 0 , 24 , 2 110 , 80 , 2 , 20 , 143.34 , 1600 , 1 , 3 2 'pkg sb left turn','AG', 812 , 180 , 812 , 380 , 0 , 12 , 1 110 , 70 , 2 , 570 , 143.34 , 1600 , 1 , 3 1 'pkg sb dep','AG', 800 , 120 , 800 ,-880 , 480 , 22.6 , 0 , 32 1 'pkg nb','AG', 836 ,-880 , 836 , 120 , 480 , 22.6 , 0 , 32 2 'pkg nb left turn','AG', 824 , 40 , 824 ,-140 , 0 , 12 , 1 110 , 70 , 2 , 170 , 143.34 , 1600 , 1 , 3 1 'pkg nb dep','AG', 830 , 120 , 830 , 1120 , 740 , 22.6 , 0 , 44 1 'i25sbrampthru','AG', 1740 , 1111 , 1740 , 111 , 1326 , 22.6 , 0 , 32 2 'i25sbramp q','AG', 1740 , 180 , 1740 , 1111 , 0 , 12 , 1 110 , 78 , 2 , 1 , 143.34 , 1600 , 1 , 3 2 'i25sbrampleftturn','AG', 1758 , 180 , 1758 , 380 , 0 , 24 , 2 110 , 78 , 2 , 900 , 143.34 , 1600 , 1 , 3 1 'i25sbrampdep','AG', 1740 , 111 , 1740 ,-889 , 1461 , 22.6 , 0 , 32 1 , 0 , 4 , 1000 , 0 ,'Y', 10 , 0 , 36
Page 2
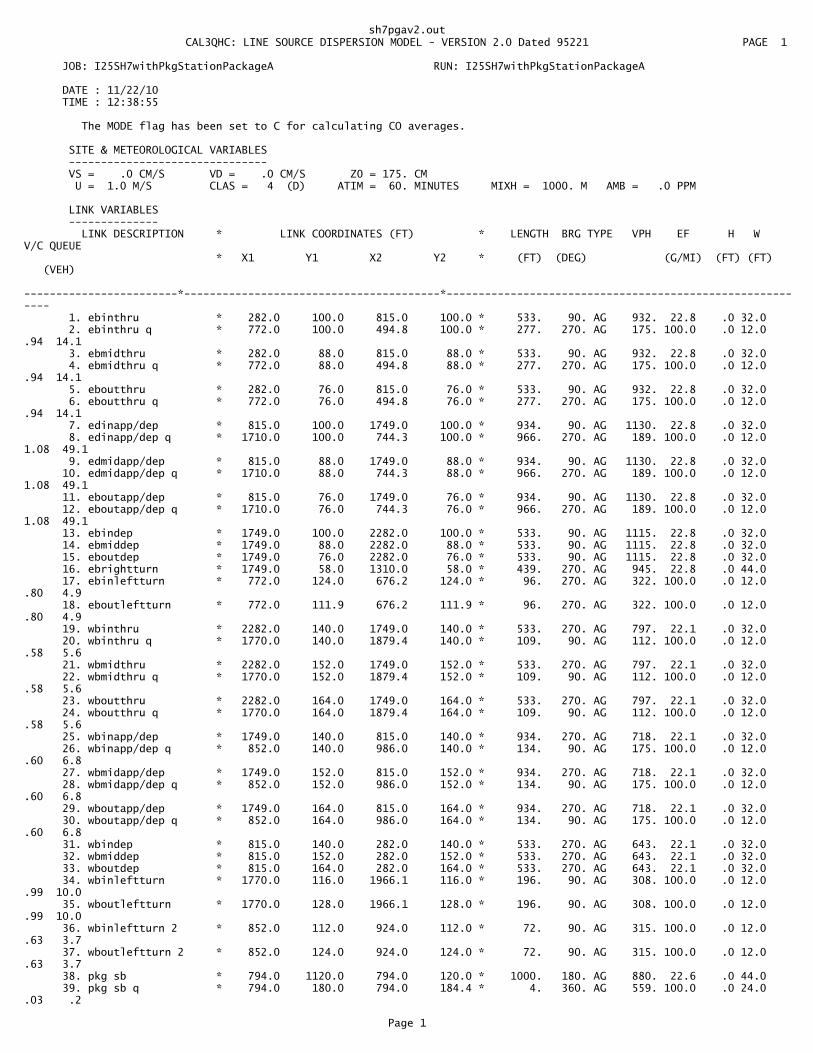
sh7pgav2.out� CAL3QHC: LINE SOURCE DISPERSION MODEL - VERSION 2.0 Dated 95221 PAGE 1
JOB: I25SH7withPkgStationPackageA RUN: I25SH7withPkgStationPackageA
DATE : 11/22/10 TIME : 12:38:55
The MODE flag has been set to C for calculating CO averages.
SITE & METEOROLOGICAL VARIABLES ------------------------------- VS = .0 CM/S VD = .0 CM/S Z0 = 175. CM U = 1.0 M/S CLAS = 4 (D) ATIM = 60. MINUTES MIXH = 1000. M AMB = .0 PPM
LINK VARIABLES -------------- LINK DESCRIPTION * LINK COORDINATES (FT) * LENGTH BRG TYPE VPH EF H W V/C QUEUE * X1 Y1 X2 Y2 * (FT) (DEG) (G/MI) (FT) (FT) (VEH) ------------------------*----------------------------------------*---------------------------------------------------------- 1. ebinthru * 282.0 100.0 815.0 100.0 * 533. 90. AG 932. 22.8 .0 32.0 2. ebinthru q * 772.0 100.0 494.8 100.0 * 277. 270. AG 175. 100.0 .0 12.0 .94 14.1 3. ebmidthru * 282.0 88.0 815.0 88.0 * 533. 90. AG 932. 22.8 .0 32.0 4. ebmidthru q * 772.0 88.0 494.8 88.0 * 277. 270. AG 175. 100.0 .0 12.0 .94 14.1 5. eboutthru * 282.0 76.0 815.0 76.0 * 533. 90. AG 932. 22.8 .0 32.0 6. eboutthru q * 772.0 76.0 494.8 76.0 * 277. 270. AG 175. 100.0 .0 12.0 .94 14.1 7. edinapp/dep * 815.0 100.0 1749.0 100.0 * 934. 90. AG 1130. 22.8 .0 32.0 8. edinapp/dep q * 1710.0 100.0 744.3 100.0 * 966. 270. AG 189. 100.0 .0 12.0 1.08 49.1 9. edmidapp/dep * 815.0 88.0 1749.0 88.0 * 934. 90. AG 1130. 22.8 .0 32.0 10. edmidapp/dep q * 1710.0 88.0 744.3 88.0 * 966. 270. AG 189. 100.0 .0 12.0 1.08 49.1 11. eboutapp/dep * 815.0 76.0 1749.0 76.0 * 934. 90. AG 1130. 22.8 .0 32.0 12. eboutapp/dep q * 1710.0 76.0 744.3 76.0 * 966. 270. AG 189. 100.0 .0 12.0 1.08 49.1 13. ebindep * 1749.0 100.0 2282.0 100.0 * 533. 90. AG 1115. 22.8 .0 32.0 14. ebmiddep * 1749.0 88.0 2282.0 88.0 * 533. 90. AG 1115. 22.8 .0 32.0 15. eboutdep * 1749.0 76.0 2282.0 76.0 * 533. 90. AG 1115. 22.8 .0 32.0 16. ebrightturn * 1749.0 58.0 1310.0 58.0 * 439. 270. AG 945. 22.8 .0 44.0 17. ebinleftturn * 772.0 124.0 676.2 124.0 * 96. 270. AG 322. 100.0 .0 12.0 .80 4.9 18. eboutleftturn * 772.0 111.9 676.2 111.9 * 96. 270. AG 322. 100.0 .0 12.0 .80 4.9 19. wbinthru * 2282.0 140.0 1749.0 140.0 * 533. 270. AG 797. 22.1 .0 32.0 20. wbinthru q * 1770.0 140.0 1879.4 140.0 * 109. 90. AG 112. 100.0 .0 12.0 .58 5.6 21. wbmidthru * 2282.0 152.0 1749.0 152.0 * 533. 270. AG 797. 22.1 .0 32.0 22. wbmidthru q * 1770.0 152.0 1879.4 152.0 * 109. 90. AG 112. 100.0 .0 12.0 .58 5.6 23. wboutthru * 2282.0 164.0 1749.0 164.0 * 533. 270. AG 797. 22.1 .0 32.0 24. wboutthru q * 1770.0 164.0 1879.4 164.0 * 109. 90. AG 112. 100.0 .0 12.0 .58 5.6 25. wbinapp/dep * 1749.0 140.0 815.0 140.0 * 934. 270. AG 718. 22.1 .0 32.0 26. wbinapp/dep q * 852.0 140.0 986.0 140.0 * 134. 90. AG 175. 100.0 .0 12.0 .60 6.8 27. wbmidapp/dep * 1749.0 152.0 815.0 152.0 * 934. 270. AG 718. 22.1 .0 32.0 28. wbmidapp/dep q * 852.0 152.0 986.0 152.0 * 134. 90. AG 175. 100.0 .0 12.0 .60 6.8 29. wboutapp/dep * 1749.0 164.0 815.0 164.0 * 934. 270. AG 718. 22.1 .0 32.0 30. wboutapp/dep q * 852.0 164.0 986.0 164.0 * 134. 90. AG 175. 100.0 .0 12.0 .60 6.8 31. wbindep * 815.0 140.0 282.0 140.0 * 533. 270. AG 643. 22.1 .0 32.0 32. wbmiddep * 815.0 152.0 282.0 152.0 * 533. 270. AG 643. 22.1 .0 32.0 33. wboutdep * 815.0 164.0 282.0 164.0 * 533. 270. AG 643. 22.1 .0 32.0 34. wbinleftturn * 1770.0 116.0 1966.1 116.0 * 196. 90. AG 308. 100.0 .0 12.0 .99 10.0 35. wboutleftturn * 1770.0 128.0 1966.1 128.0 * 196. 90. AG 308. 100.0 .0 12.0 .99 10.0 36. wbinleftturn 2 * 852.0 112.0 924.0 112.0 * 72. 90. AG 315. 100.0 .0 12.0 .63 3.7 37. wboutleftturn 2 * 852.0 124.0 924.0 124.0 * 72. 90. AG 315. 100.0 .0 12.0 .63 3.7 38. pkg sb * 794.0 1120.0 794.0 120.0 * 1000. 180. AG 880. 22.6 .0 44.0 39. pkg sb q * 794.0 180.0 794.0 184.4 * 4. 360. AG 559. 100.0 .0 24.0 .03 .2
Page 1
sh7pgav2.out 40. pkg sb left turn * 812.0 180.0 812.0 982.1 * 802. 360. AG 245. 100.0 .0 12.0 1.09 40.7 41. pkg sb dep * 800.0 120.0 800.0 -880.0 * 1000. 180. AG 480. 22.6 .0 32.0 42. pkg nb * 836.0 -880.0 836.0 120.0 * 1000. 360. AG 480. 22.6 .0 32.0 43. pkg nb left turn * 824.0 40.0 824.0 -25.1 * 65. 180. AG 245. 100.0 .0 12.0 .33 3.3 44. pkg nb dep * 830.0 120.0 830.0 1120.0 * 1000. 360. AG 740. 22.6 .0 44.0� PAGE 2 JOB: I25SH7withPkgStationPackageA RUN: I25SH7withPkgStationPackageA
DATE : 11/22/10 TIME : 12:38:55
LINK VARIABLES -------------- LINK DESCRIPTION * LINK COORDINATES (FT) * LENGTH BRG TYPE VPH EF H W V/C QUEUE * X1 Y1 X2 Y2 * (FT) (DEG) (G/MI) (FT) (FT) (VEH) ------------------------*----------------------------------------*---------------------------------------------------------- 45. i25sbrampthru * 1740.0 1111.0 1740.0 111.0 * 1000. 180. AG 1326. 22.6 .0 32.0 46. i25sbramp q * 1740.0 180.0 1740.0 180.4 * 0. 360. AG 273. 100.0 .0 12.0 .00 .0 47. i25sbrampleftturn * 1758.0 180.0 1758.0 903.7 * 724. 360. AG 545. 100.0 .0 24.0 1.11 36.8 48. i25sbrampdep * 1740.0 111.0 1740.0 -889.0 * 1000. 180. AG 1461. 22.6 .0 32.0� PAGE 3 JOB: I25SH7withPkgStationPackageA RUN: I25SH7withPkgStationPackageA
DATE : 11/22/10 TIME : 12:38:55
ADDITIONAL QUEUE LINK PARAMETERS -------------------------------- LINK DESCRIPTION * CYCLE RED CLEARANCE APPROACH SATURATION IDLE SIGNAL ARRIVAL * LENGTH TIME LOST TIME VOL FLOW RATE EM FAC TYPE RATE * (SEC) (SEC) (SEC) (VPH) (VPH) (gm/hr) ------------------------*-------------------------------------------------------------------------------- 2. ebinthru q * 110 50 2.0 767 1600 143.34 1 3 4. ebmidthru q * 110 50 2.0 767 1600 143.34 1 3 6. eboutthru q * 110 50 2.0 767 1600 143.34 1 3 8. edinapp/dep q * 110 54 2.0 815 1600 143.34 1 3 10. edmidapp/dep q * 110 54 2.0 815 1600 143.34 1 3 12. eboutapp/dep q * 110 54 2.0 815 1600 143.34 1 3 17. ebinleftturn * 110 92 2.0 163 1600 143.34 1 3 18. eboutleftturn * 110 92 2.0 163 1600 143.34 1 3 20. wbinthru q * 110 32 2.0 625 1600 143.34 1 3 22. wbmidthru q * 110 32 2.0 625 1600 143.34 1 3 24. wboutthru q * 110 32 2.0 625 1600 143.34 1 3 26. wbinapp/dep q * 110 50 2.0 490 1600 143.34 1 3 28. wbmidapp/dep q * 110 50 2.0 490 1600 143.34 1 3 30. wboutapp/dep q * 110 50 2.0 490 1600 143.34 1 3 34. wbinleftturn * 110 88 2.0 258 1600 143.34 1 3 35. wboutleftturn * 110 88 2.0 258 1600 143.34 1 3 36. wbinleftturn 2 * 110 90 2.0 145 1600 143.34 1 3 37. wboutleftturn 2 * 110 90 2.0 145 1600 143.34 1 3 39. pkg sb q * 110 80 2.0 20 1600 143.34 1 3 40. pkg sb left turn * 110 70 2.0 570 1600 143.34 1 3 43. pkg nb left turn * 110 70 2.0 170 1600 143.34 1 3 46. i25sbramp q * 110 78 2.0 1 1600 143.34 1 3 47. i25sbrampleftturn * 110 78 2.0 900 1600 143.34 1 3
RECEPTOR LOCATIONS ------------------ * COORDINATES (FT) * RECEPTOR * X Y Z * -------------------------*-------------------------------------* 1. Receptor 1 * 688.0 190.0 5.0 * 2. Receptor 2 * 728.0 190.0 5.0 * 3. Receptor 3 * 768.0 190.0 5.0 * 4. Receptor 4 * 768.0 230.0 5.0 * 5. Receptor 5 * 768.0 270.0 5.0 * 6. Receptor 6 * 862.0 270.0 5.0 * 7. Receptor 7 * 862.0 230.0 5.0 * 8. Receptor 8 * 862.0 190.0 5.0 * 9. Receptor 9 * 902.0 190.0 5.0 * 10. Receptor 10 * 942.0 190.0 5.0 *
Page 2
sh7pgav2.out 11. Receptor 11 * 694.0 50.0 5.0 * 12. Receptor 12 * 734.0 50.0 5.0 * 13. Receptor 13 * 774.0 50.0 5.0 * 14. Receptor 14 * 774.0 10.0 5.0 * 15. Receptor 15 * 774.0 -30.0 5.0 * 16. Receptor 16 * 862.0 -30.0 5.0 * 17. Receptor 17 * 862.0 10.0 5.0 * 18. Receptor 18 * 862.0 50.0 5.0 * 19. Receptor 19 * 902.0 50.0 5.0 * 20. Receptor 20 * 942.0 50.0 5.0 * 21. Receptor 21 * 1634.0 26.0 5.0 * 22. Receptor 22 * 1674.0 26.0 5.0 *� PAGE 4 JOB: I25SH7withPkgStationPackageA RUN: I25SH7withPkgStationPackageA
DATE : 11/22/10 TIME : 12:38:55
RECEPTOR LOCATIONS ------------------ * COORDINATES (FT) * RECEPTOR * X Y Z * -------------------------*-------------------------------------* 23. Receptor 23 * 1714.0 26.0 5.0 * 24. Receptor 24 * 1714.0 -14.0 5.0 * 25. Receptor 25 * 1714.0 -54.0 5.0 * 26. Receptor 26 * 1766.0 -30.0 5.0 * 27. Receptor 27 * 1766.0 10.0 5.0 * 28. Receptor 28 * 1766.0 50.0 5.0 * 29. Receptor 29 * 1806.0 50.0 5.0 * 30. Receptor 30 * 1846.0 50.0 5.0 * 31. Receptor 31 * 1870.0 190.0 5.0 * 32. Receptor 32 * 1830.0 190.0 5.0 * 33. Receptor 33 * 1790.0 190.0 5.0 * 34. Receptor 34 * 1790.0 230.0 5.0 * 35. Receptor 35 * 1790.0 270.0 5.0 * 36. Receptor 36 * 1714.0 270.0 5.0 * 37. Receptor 37 * 1714.0 230.0 5.0 * 38. Receptor 38 * 1714.0 190.0 5.0 * 39. Receptor 39 * 1674.0 190.0 5.0 * 40. Receptor 40 * 1634.0 190.0 5.0 *� PAGE 5 JOB: I25SH7withPkgStationPackageA RUN: I25SH7withPkgStationPackageA
MODEL RESULTS -------------
REMARKS : In search of the angle corresponding to the maximum concentration, only the first angle, of the angles with same maximum concentrations, is indicated as maximum.
WIND ANGLE RANGE: 0.-360.
WIND * CONCENTRATION ANGLE * (PPM) (DEGR)* REC1 REC2 REC3 REC4 REC5 REC6 REC7 REC8 REC9 REC10 REC11 REC12 REC13 REC14 REC15 REC16 REC17 REC18 REC19 REC20 ------*------------------------------------------------------------------------------------------------------------------------ 0. * .3 .5 1.4 1.3 1.3 1.0 1.1 1.1 .4 .3 4.0 4.5 5.1 3.5 2.7 3.2 3.8 5.4 5.1 4.4 10. * .7 .9 2.0 2.0 2.0 .4 .4 .4 .1 .0 4.4 5.1 5.0 3.7 3.3 2.8 3.4 4.8 4.6 3.8 20. * .7 1.1 1.9 1.9 1.9 .1 .1 .1 .0 .0 4.4 5.1 4.5 3.3 2.8 2.2 3.0 4.7 4.2 3.8 30. * .7 1.1 1.8 1.8 1.8 .0 .0 .0 .0 .0 4.6 4.8 4.4 3.3 3.2 2.3 3.0 4.6 4.0 3.7 40. * .7 1.0 1.6 1.6 1.6 .0 .0 .0 .0 .0 4.6 4.8 4.6 3.5 3.1 2.1 3.2 4.6 4.1 3.8 50. * .7 1.0 1.6 1.5 1.4 .2 .2 .2 .2 .2 5.0 5.4 5.2 4.0 3.6 2.3 2.8 4.8 4.3 4.2 60. * .9 1.1 1.5 1.5 1.5 .2 .2 .2 .2 .2 5.7 5.4 5.7 4.1 3.3 2.5 3.0 4.7 4.5 4.6 70. * .9 1.1 1.6 1.5 1.5 .2 .2 .3 .3 .4 5.7 5.6 6.1 4.0 3.2 2.4 3.1 4.9 4.9 4.8 80. * 1.6 1.8 2.2 1.7 1.5 .2 .3 .7 .7 .7 5.4 5.5 5.5 3.5 2.9 2.1 3.0 4.8
Page 3
sh7pgav2.out4.8 4.9 90. * 3.2 3.6 4.6 2.6 2.2 .7 1.3 2.7 2.6 2.6 3.9 3.9 4.2 2.8 1.6 1.2 1.8 3.5 3.5 3.5 100. * 4.5 4.7 5.6 3.8 3.1 1.8 2.2 4.2 4.0 3.7 1.7 1.8 2.1 1.3 .7 .1 .6 1.4 1.4 1.4 110. * 4.4 4.8 5.7 4.1 3.1 1.8 2.7 4.3 4.2 3.7 .7 .9 1.0 .9 .6 .1 .1 .3 .3 .3 120. * 4.3 4.3 5.2 4.2 3.5 2.0 2.8 4.4 4.1 3.8 .4 .6 .9 .8 .6 .1 .1 .1 .1 .1 130. * 3.8 4.0 4.9 4.0 3.6 1.9 2.9 4.4 4.1 3.8 .3 .5 1.0 .8 .7 .1 .1 .1 .1 .1 140. * 3.7 3.4 4.2 3.8 3.6 1.9 3.0 4.3 3.8 3.5 .3 .5 .9 .7 .6 .0 .0 .0 .0 .1 150. * 3.5 3.7 3.7 3.4 3.1 2.0 2.8 4.2 3.9 3.7 .3 .4 .8 .6 .6 .0 .0 .0 .0 .0 160. * 3.3 3.3 3.6 3.0 3.1 2.0 2.8 4.1 3.8 3.6 .3 .4 .8 .7 .7 .0 .0 .1 .0 .0 170. * 3.1 3.4 3.8 3.2 2.8 2.4 3.0 4.3 4.1 3.6 .2 .3 .7 .7 .7 .2 .2 .2 .0 .0 180. * 2.9 3.1 3.6 2.8 2.6 2.5 3.0 4.6 4.5 4.0 .1 .2 .5 .5 .4 .4 .5 .5 .2 .1 190. * 2.7 3.0 3.2 2.5 2.2 2.7 3.3 4.3 4.6 4.0 .0 .0 .2 .2 .2 .7 .7 .8 .3 .2 200. * 2.5 2.9 3.1 2.1 1.9 2.7 2.6 4.2 4.6 4.2 .0 .0 .1 .0 .0 .7 .7 .9 .4 .3 210. * 2.4 3.0 3.1 2.0 1.8 3.1 3.3 3.9 4.9 4.6 .0 .0 .0 .0 .0 .6 .7 .9 .4 .3 220. * 2.6 3.0 3.3 1.9 1.7 2.9 3.3 3.9 3.9 4.7 .0 .0 .0 .0 .0 .6 .8 1.0 .5 .3 230. * 2.5 2.8 3.2 1.9 1.5 2.9 3.2 4.1 4.4 4.7 .0 .0 .0 .0 .0 .6 .8 1.0 .5 .3 240. * 2.5 2.6 3.0 1.8 1.4 2.9 3.3 4.2 4.2 5.0 .0 .0 .0 .0 .0 .5 .8 .8 .5 .3 250. * 2.3 2.4 2.6 1.4 .8 2.3 3.1 4.3 3.9 4.2 .1 .1 .1 .0 .0 .5 .9 .8 .6 .4 260. * 1.7 1.8 1.9 .8 .4 1.8 2.1 3.7 3.3 3.3 .6 .6 .8 .1 .0 .6 1.0 1.5 1.3 1.1 270. * 1.0 1.0 1.2 .3 .0 1.3 1.6 2.6 2.1 1.9 1.7 1.8 2.0 .5 .2 .9 1.6 2.8 2.9 2.9 280. * .4 .4 .4 .0 .0 1.2 1.2 1.6 1.3 1.0 2.8 3.1 3.2 1.4 .4 1.5 2.5 4.3 4.3 4.3 290. * .1 .1 .1 .0 .0 1.2 1.2 1.3 .8 .6 3.4 3.8 4.1 1.9 1.3 2.2 3.2 5.0 5.0 5.0 300. * .0 .0 .0 .0 .0 1.3 1.3 1.3 .8 .6 3.5 3.6 4.1 2.2 1.5 2.7 3.7 5.0 4.9 5.0 310. * .0 .0 .0 .0 .0 1.3 1.3 1.3 .9 .6 3.5 3.7 4.3 2.5 1.7 2.9 3.5 4.6 4.9 5.2 320. * .0 .0 .0 .0 .0 1.4 1.4 1.4 .9 .6 3.2 3.6 4.5 2.5 1.8 2.8 3.1 4.5 4.6 4.9 330. * .0 .0 .1 .1 .1 1.5 1.5 1.5 1.0 .8 3.4 3.8 4.3 2.6 1.7 3.2 3.2 4.6 5.0 5.2 340. * .0 .0 .2 .2 .2 1.7 1.7 1.7 1.0 .7 3.2 3.6 4.4 2.7 1.9 3.0 3.6 5.1 5.3 5.1 350. * .0 .1 .6 .6 .6 1.5 1.5 1.5 .9 .6 3.5 3.9 4.7 3.1 2.5 3.3 3.6 5.4 5.4 4.7 360. * .3 .5 1.4 1.3 1.3 1.0 1.1 1.1 .4 .3 4.0 4.5 5.1 3.5 2.7 3.2 3.8 5.4 5.1 4.4 ------*------------------------------------------------------------------------------------------------------------------------ MAX * 4.5 4.8 5.7 4.2 3.6 3.1 3.3 4.6 4.9 5.0 5.7 5.6 6.1 4.1 3.6 3.3 3.8 5.4 5.4 5.2 DEGR. * 100 110 110 120 130 210 220 180 210 240 60 70 70 60 50 350 0 0 350 330
� PAGE 6 JOB: I25SH7withPkgStationPackageA RUN: I25SH7withPkgStationPackageA
MODEL RESULTS -------------
REMARKS : In search of the angle corresponding to the maximum concentration, only the first angle, of the angles with same maximum concentrations, is indicated as maximum.
WIND ANGLE RANGE: 0.-360.
WIND * CONCENTRATION ANGLE * (PPM)
Page 4

sh7pgav2.out (DEGR)* REC21 REC22 REC23 REC24 REC25 REC26 REC27 REC28 REC29 REC30 REC31 REC32 REC33 REC34 REC35 REC36 REC37 REC38 REC39 REC40 ------*------------------------------------------------------------------------------------------------------------------------ 0. * 3.6 4.0 4.3 3.6 3.0 3.3 3.9 4.8 4.5 4.1 .3 .7 1.7 1.7 1.7 1.8 1.8 1.9 .8 .4 10. * 4.2 4.3 4.8 4.0 3.9 2.6 3.3 4.3 3.8 3.6 .1 .2 .7 .7 .7 2.6 2.6 2.6 1.3 .8 20. * 4.1 4.3 4.6 3.5 3.2 2.3 2.7 3.7 3.5 3.2 .0 .0 .1 .1 .1 2.7 2.7 2.7 1.6 1.1 30. * 3.9 4.1 4.5 3.7 2.8 1.8 2.7 3.5 3.5 3.2 .0 .0 .0 .0 .0 2.5 2.5 2.5 1.5 1.1 40. * 4.0 4.0 4.4 3.3 2.9 1.9 2.5 3.6 3.4 3.3 .0 .0 .0 .0 .0 2.3 2.3 2.3 1.4 1.0 50. * 4.0 4.4 4.5 3.2 2.8 1.9 2.4 3.9 3.7 3.5 .0 .0 .0 .0 .0 2.1 2.1 2.1 1.3 1.0 60. * 3.9 4.1 4.1 3.0 2.4 1.7 2.4 3.9 3.7 3.6 .0 .0 .0 .0 .0 2.0 2.0 2.0 1.2 1.0 70. * 3.9 3.7 3.8 2.7 2.0 1.2 2.0 3.7 3.5 3.3 .1 .1 .1 .0 .0 2.0 2.0 2.0 1.3 .9 80. * 2.9 3.0 3.1 2.0 1.4 .6 1.3 3.0 2.8 2.6 .4 .4 .4 .0 .0 2.0 2.0 2.3 1.5 1.4 90. * 1.7 1.7 1.9 1.3 1.1 .2 .5 1.7 1.7 1.6 1.2 1.3 1.4 .3 .1 2.2 2.5 3.4 2.7 2.5 100. * .8 1.0 1.3 1.0 1.0 .0 .1 .6 .6 .6 2.0 2.3 2.7 1.0 .5 2.7 3.2 4.5 3.9 3.7 110. * .4 .5 1.0 1.0 1.0 .0 .0 .1 .1 .1 2.7 3.1 3.6 1.8 1.0 3.4 4.1 4.9 4.3 3.8 120. * .4 .6 1.0 1.0 1.0 .0 .0 .0 .0 .0 3.0 3.5 3.9 2.3 1.3 3.6 4.6 4.8 4.0 3.5 130. * .4 .6 1.1 1.1 1.1 .0 .0 .0 .0 .0 3.1 3.7 4.0 2.4 1.4 4.1 4.5 4.5 3.4 3.3 140. * .5 .6 1.2 1.2 1.2 .0 .0 .0 .0 .0 3.1 3.6 3.8 2.6 1.7 4.0 3.9 3.7 3.2 3.2 150. * .5 .7 1.3 1.3 1.3 .0 .0 .0 .0 .0 3.1 3.5 3.6 2.5 1.9 3.9 3.6 3.7 3.1 3.1 160. * .5 .7 1.5 1.5 1.5 .2 .2 .2 .0 .0 3.1 3.4 3.4 2.4 1.9 3.5 3.4 3.7 3.5 3.3 170. * .4 .7 1.5 1.5 1.4 .5 .5 .5 .1 .1 3.3 3.6 3.6 2.5 2.2 3.0 3.0 3.8 3.3 3.3 180. * .2 .4 1.1 1.1 1.1 1.1 1.1 1.1 .4 .2 3.5 3.8 3.9 2.8 2.6 2.7 2.9 3.7 3.3 3.3 190. * .1 .1 .5 .5 .5 1.5 1.5 1.5 .7 .4 3.8 4.0 4.3 3.3 2.9 2.2 2.5 3.1 3.1 3.0 200. * .0 .0 .2 .2 .1 1.5 1.5 1.5 .7 .5 3.9 4.1 3.7 3.5 3.5 1.9 2.1 2.9 2.9 2.9 210. * .0 .0 .0 .0 .0 1.3 1.3 1.3 .7 .5 3.9 4.1 3.9 3.4 3.6 1.7 2.1 3.1 3.1 3.1 220. * .0 .0 .0 .0 .0 1.2 1.2 1.3 .6 .5 4.3 4.1 3.9 3.9 3.8 1.7 2.3 3.1 3.1 3.1 230. * .0 .0 .0 .0 .0 1.1 1.1 1.2 .6 .4 4.5 4.2 4.4 4.1 3.7 1.8 2.5 3.4 3.4 3.4 240. * .0 .0 .0 .0 .0 1.0 1.0 1.3 .7 .4 4.6 4.7 4.5 4.5 3.9 1.9 2.6 3.6 3.5 3.5 250. * .1 .1 .1 .0 .0 1.0 1.0 1.8 .9 .7 4.9 4.5 5.0 4.4 3.7 1.7 2.5 3.6 3.6 3.5 260. * .8 .8 .8 .1 .0 1.0 1.5 3.1 2.3 1.8 4.0 4.1 4.8 3.9 3.3 1.7 2.0 3.3 3.5 3.6 270. * 2.6 2.7 2.7 .9 .6 1.8 2.8 5.1 4.2 3.8 2.9 3.0 3.8 3.0 2.5 .5 1.1 2.0 2.0 2.2 280. * 3.6 3.7 3.9 2.2 1.6 3.0 3.9 6.6 5.1 4.9 1.5 1.8 2.5 2.2 2.0 .3 .3 .6 .6 .8 290. * 4.4 4.4 4.4 2.7 2.0 3.5 4.6 6.2 5.1 4.5 1.0 1.3 2.2 2.1 2.1 .2 .2 .3 .4 .4 300. * 4.3 4.3 4.3 3.1 2.5 3.9 4.6 5.5 4.6 4.3 .9 1.3 2.0 2.0 2.0 .1 .2 .3 .3 .3 310. * 4.1 4.1 3.9 2.8 2.4 3.7 4.2 4.7 3.7 3.9 .9 1.2 2.0 2.0 2.0 .0 .0 .0 .1 .1 320. * 3.4 3.4 3.4 2.5 1.9 3.1 3.7 4.3 3.9 3.9 1.1 1.4 2.2 2.2 2.2 .0 .0 .0 .0 .0 330. * 3.3 3.3 3.3 2.4 1.8 3.1 3.7 4.1 3.8 4.3 1.1 1.5 2.3 2.3 2.3 .0 .0 .0 .0 .0 340. * 3.2 3.2 3.3 2.4 2.0 3.3 3.4 4.4 4.4 4.5 1.1 1.5 2.6 2.6 2.6 .2 .2 .2 .0 .0 350. * 3.5 3.5 3.8 2.7 2.4 3.6 4.2 4.9 4.8 4.5 .8 1.2 2.5 2.4 2.4 .8 .8 .8 .2 .0 360. * 3.6 4.0 4.3 3.6 3.0 3.3 3.9 4.8 4.5 4.1 .3 .7 1.7 1.7 1.7 1.8 1.8 1.9 .8 .4 ------*-----------------------------------------------------------------------------------------------------------------
Page 5

sh7pgav2.out------- MAX * 4.4 4.4 4.8 4.0 3.9 3.9 4.6 6.6 5.1 4.9 4.9 4.7 5.0 4.5 3.9 4.1 4.6 4.9 4.3 3.8 DEGR. * 290 290 10 10 10 300 290 280 290 280 250 240 250 240 240 130 120 110 110 110
THE HIGHEST CONCENTRATION OF 6.60 PPM OCCURRED AT RECEPTOR REC28.� PAGE 7 JOB: I25SH7withPkgStationPackageA RUN: I25SH7withPkgStationPackageA
DATE : 11/22/10 TIME : 12:38:55
RECEPTOR - LINK MATRIX FOR THE ANGLE PRODUCING THE MAXIMUM CONCENTRATION FOR EACH RECEPTOR
* CO/LINK (PPM) * ANGLE (DEGREES) * REC1 REC2 REC3 REC4 REC5 REC6 REC7 REC8 REC9 REC10 REC11 REC12 REC13 REC14 REC15 REC16 REC17 REC18REC19 REC20 LINK # * 100 110 110 120 130 210 220 180 210 240 60 70 70 60 50 350 0 0 350 330 -------*------------------------------------------------------------------------------------------------------------------------ 1 * .0 .0 .0 .0 .0 .2 .2 .0 .1 .2 .4 .1 .0 .0 .0 .1 .0 .0 .0 .0 2 * .0 .0 .0 .0 .0 .1 .1 .0 .0 .1 .1 .0 .0 .0 .0 .0 .0 .0 .0 .0 3 * .0 .0 .0 .0 .0 .2 .2 .0 .1 .2 .5 .3 .1 .0 .0 .1 .0 .0 .0 .0 4 * .0 .0 .0 .0 .0 .1 .1 .0 .0 .1 .2 .0 .0 .0 .0 .0 .0 .0 .0 .0 5 * .0 .0 .0 .0 .0 .2 .2 .0 .1 .2 .8 .6 .3 .0 .0 .0 .0 .0 .0 .0 6 * .0 .0 .0 .0 .0 .1 .1 .0 .0 .1 .4 .1 .0 .0 .0 .0 .0 .0 .0 .0 7 * .4 .4 .4 .3 .3 .0 .0 .3 .3 .2 .2 .5 .7 .4 .3 .2 .3 .5 .5 .5 8 * .2 .2 .2 .2 .1 .1 .1 .2 .2 .2 .3 .4 .4 .2 .2 .1 .2 .3 .3 .3 9 * .3 .4 .4 .3 .2 .0 .0 .3 .3 .1 .2 .5 .7 .5 .3 .2 .4 .6 .6 .6 10 * .2 .2 .2 .2 .1 .1 .1 .2 .2 .1 .3 .4 .4 .3 .2 .2 .2 .3 .3 .3 11 * .3 .4 .4 .3 .2 .0 .0 .3 .2 .1 .1 .4 .8 .5 .4 .3 .4 .8 .7 .8 12 * .2 .2 .2 .2 .1 .1 .1 .2 .2 .1 .2 .6 .6 .3 .2 .2 .2 .4 .4 .4 13 * .0 .0 .0 .0 .0 .0 .0 .0 .0 .0 .0 .0 .0 .0 .0 .0 .0 .0 .0 .0 14 * .0 .0 .0 .0 .0 .0 .0 .0 .0 .0 .0 .0 .0 .0 .0 .0 .0 .0 .0 .0 15 * .0 .0 .0 .0 .0 .0 .0 .0 .0 .0 .0 .0 .0 .0 .0 .0 .0 .0 .0 .0 16 * .1 .1 .1 .0 .0 .0 .0 .0 .0 .0 .0 .0 .0 .0 .0 .0 .0 .0 .0 .0 17 * .0 .0 .0 .0 .0 .1 .1 .0 .0 .1 .1 .0 .0 .0 .0 .0 .0 .0 .0 .0 18 * .0 .0 .0 .0 .0 .1 .1 .0 .0 .1 .1 .0 .0 .0 .0 .0 .0 .0 .0 .0 19 * .0 .0 .0 .0 .0 .0 .0 .0 .0 .0 .0 .0 .0 .0 .0 .0 .0 .0 .0 .0 20 * .0 .0 .0 .0 .0 .0 .0 .0 .0 .0 .0 .0 .0 .0 .0 .0 .0 .0 .0 .0 21 * .0 .0 .0 .0 .0 .0 .0 .0 .0 .0 .0 .0 .0 .0 .0 .0 .0 .0 .0 .0 22 * .0 .0 .0 .0 .0 .0 .0 .0 .0 .0 .0 .0 .0 .0 .0 .0 .0 .0 .0 .0 23 * .0 .0 .0 .0 .0 .0 .0 .0 .0 .0 .0 .0 .0 .0 .0 .0 .0 .0 .0 .0 24 * .0 .0 .0 .0 .0 .0 .0 .0 .0 .0 .0 .0 .0 .0 .0 .0 .0 .0 .0 .0 25 * .3 .3 .4 .3 .2 .0 .0 .3 .3 .3 .2 .3 .3 .2 .2 .1 .2 .2 .2 .2 26 * .1 .1 .2 .1 .1 .0 .0 .2 .2 .2 .1 .1 .1 .1 .1 .0 .1 .1 .2 .1 27 * .3 .3 .4 .3 .2 .1 .1 .4 .4 .4 .2 .2 .3 .2 .2 .1 .1 .2 .2 .2
Page 6

sh7pgav2.out 28 * .1 .1 .2 .1 .1 .0 .0 .2 .3 .2 .1 .1 .1 .1 .1 .0 .1 .1 .1 .1 29 * .3 .3 .4 .3 .2 .1 .1 .5 .5 .6 .2 .2 .2 .2 .1 .1 .1 .2 .2 .2 30 * .1 .1 .2 .1 .1 .0 .0 .3 .4 .4 .1 .1 .1 .0 .0 .0 .1 .1 .1 .1 31 * .1 .1 .0 .0 .0 .1 .2 .0 .0 .1 .1 .0 .0 .0 .0 .0 .0 .0 .0 .0 32 * .2 .2 .1 .0 .0 .1 .2 .0 .0 .1 .1 .0 .0 .0 .0 .0 .0 .0 .0 .0 33 * .4 .4 .2 .0 .0 .1 .2 .0 .0 .1 .0 .0 .0 .0 .0 .0 .0 .0 .0 .0 34 * .0 .0 .0 .0 .0 .0 .0 .0 .0 .0 .0 .0 .0 .0 .0 .0 .0 .0 .0 .0 35 * .0 .0 .0 .0 .0 .0 .0 .0 .0 .0 .0 .0 .0 .0 .0 .0 .0 .0 .0 .0 36 * .1 .1 .1 .1 .1 .0 .0 .2 .2 .1 .1 .1 .2 .1 .1 .1 .2 .3 .4 .3 37 * .1 .1 .2 .1 .1 .0 .0 .3 .3 .2 .1 .1 .1 .1 .1 .1 .2 .2 .3 .3 38 * .3 .4 .6 .6 .7 .3 .3 .0 .0 .1 .1 .0 .0 .0 .0 .4 .3 .3 .3 .3 39 * .0 .1 .3 .0 .0 .0 .0 .0 .0 .0 .0 .0 .0 .0 .0 .0 .0 .0 .0 .0 40 * .1 .0 .1 .3 .4 .2 .1 .0 .0 .0 .0 .0 .0 .0 .0 .2 .2 .3 .3 .2 41 * .0 .0 .0 .0 .0 .1 .1 .2 .2 .1 .1 .2 .3 .3 .4 .1 .0 .0 .0 .0 42 * .0 .0 .0 .0 .0 .0 .0 .3 .2 .1 .0 .1 .2 .2 .2 .3 .1 .1 .0 .0 43 * .0 .0 .0 .0 .0 .0 .0 .1 .1 .0 .0 .0 .0 .2 .3 .1 .0 .0 .0 .0 44 * .2 .2 .3 .3 .3 .6 .6 .1 .1 .1 .1 .0 .0 .0 .0 .3 .4 .4 .3 .3 45 * .0 .0 .0 .0 .0 .0 .0 .0 .0 .0 .1 .1 .1 .1 .1 .0 .0 .0 .0 .0� PAGE 8 JOB: I25SH7withPkgStationPackageA RUN: I25SH7withPkgStationPackageA
* CO/LINK (PPM) * ANGLE (DEGREES) * REC1 REC2 REC3 REC4 REC5 REC6 REC7 REC8 REC9 REC10 REC11 REC12 REC13 REC14 REC15 REC16 REC17 REC18REC19 REC20 LINK # * 100 110 110 120 130 210 220 180 210 240 60 70 70 60 50 350 0 0 350 330 -------*------------------------------------------------------------------------------------------------------------------------ 46 * .0 .0 .0 .0 .0 .0 .0 .0 .0 .0 .0 .0 .0 .0 .0 .0 .0 .0 .0 .0 47 * .0 .0 .0 .0 .0 .0 .0 .0 .0 .0 .1 .1 .1 .1 .1 .0 .0 .0 .0 .0 48 * .1 .1 .1 .1 .1 .0 .0 .0 .0 .0 .0 .0 .0 .0 .0 .0 .0 .0 .0 .0� PAGE 9 JOB: I25SH7withPkgStationPackageA RUN: I25SH7withPkgStationPackageA
DATE : 11/22/10 TIME : 12:38:55
RECEPTOR - LINK MATRIX FOR THE ANGLE PRODUCING THE MAXIMUM CONCENTRATION FOR EACH RECEPTOR
* CO/LINK (PPM) * ANGLE (DEGREES) * REC21 REC22 REC23 REC24 REC25 REC26 REC27 REC28 REC29 REC30 REC31 REC32 REC33 REC34 REC35 REC36 REC37 REC38REC39 REC40 LINK # * 290 290 10 10 10 300 290 280 290 280 250 240 250 240 240 130 120 110 110 110 -------*------------------------------------------------------------------------------------------------------------------------ 1 * .0 .0 .0 .0 .0 .0 .0 .0 .0 .0 .0 .0 .0 .0 .0 .0 .0 .0 .0 .0 2 * .0 .0 .0 .0 .0 .0 .0 .0 .0 .0 .0 .0 .0 .0 .0 .0 .0 .0 .0 .0 3 * .0 .0 .0 .0 .0 .0 .0 .0 .0 .0 .0 .0 .0 .0 .0 .0 .0 .0 .0 .0
Page 7
sh7pgav2.out 4 * .0 .0 .0 .0 .0 .0 .0 .0 .0 .0 .0 .0 .0 .0 .0 .0 .0 .0 .0 .0 5 * .0 .0 .0 .0 .0 .0 .0 .0 .0 .0 .0 .0 .0 .0 .0 .0 .0 .0 .0 .0 6 * .0 .0 .0 .0 .0 .0 .0 .0 .0 .0 .0 .0 .0 .0 .0 .0 .0 .0 .0 .0 7 * .5 .5 .3 .2 .1 .3 .4 .7 .6 .6 .4 .4 .4 .3 .3 .0 .0 .0 .0 .0 8 * .3 .3 .0 .0 .0 .2 .2 .4 .3 .3 .2 .2 .2 .2 .2 .0 .0 .0 .0 .0 9 * .6 .6 .4 .2 .2 .4 .5 .8 .6 .6 .4 .4 .4 .3 .3 .0 .0 .0 .0 .0 10 * .3 .3 .0 .0 .0 .2 .3 .4 .2 .3 .2 .2 .2 .2 .1 .0 .0 .0 .0 .0 11 * .7 .7 .5 .3 .2 .4 .6 1.1 .6 .6 .4 .4 .4 .3 .2 .0 .0 .0 .0 .0 12 * .4 .4 .0 .0 .0 .2 .3 .5 .2 .3 .2 .2 .2 .2 .1 .0 .0 .0 .0 .0 13 * .0 .0 .1 .1 .1 .0 .0 .0 .1 .1 .1 .0 .0 .0 .0 .3 .3 .4 .4 .4 14 * .0 .0 .1 .1 .1 .0 .0 .0 .2 .2 .0 .0 .0 .0 .0 .2 .3 .4 .4 .3 15 * .0 .0 .0 .1 .1 .0 .0 .0 .5 .5 .0 .0 .0 .0 .0 .2 .3 .3 .3 .3 16 * .9 .9 .6 .3 .2 .4 .6 1.1 .4 .4 .2 .3 .2 .2 .2 .0 .0 .0 .0 .0 17 * .0 .0 .0 .0 .0 .0 .0 .0 .0 .0 .0 .0 .0 .0 .0 .0 .0 .0 .0 .0 18 * .0 .0 .0 .0 .0 .0 .0 .0 .0 .0 .0 .0 .0 .0 .0 .0 .0 .0 .0 .0 19 * .0 .0 .1 .1 .1 .0 .0 .0 .0 .0 .2 .2 .0 .0 .0 .2 .3 .4 .4 .3 20 * .0 .0 .0 .0 .0 .0 .0 .0 .0 .0 .1 .1 .0 .0 .0 .1 .1 .1 .1 .1 21 * .0 .0 .1 .1 .1 .0 .0 .0 .0 .0 .3 .3 .1 .0 .0 .2 .3 .5 .3 .2 22 * .0 .0 .0 .0 .0 .0 .0 .0 .0 .0 .1 .1 .0 .0 .0 .1 .1 .1 .1 .1 23 * .0 .0 .1 .1 .1 .0 .0 .0 .0 .0 .6 .6 .3 .0 .0 .2 .4 .5 .3 .2 24 * .0 .0 .0 .0 .0 .0 .0 .0 .0 .0 .2 .2 .0 .0 .0 .1 .1 .1 .1 .0 25 * .2 .2 .1 .1 .1 .2 .2 .2 .3 .2 .2 .2 .4 .3 .2 .0 .0 .0 .1 .2 26 * .0 .0 .0 .0 .0 .0 .0 .0 .0 .0 .0 .0 .0 .0 .0 .0 .0 .0 .0 .0 27 * .2 .2 .1 .1 .1 .2 .2 .2 .3 .2 .2 .2 .5 .3 .2 .0 .0 .0 .2 .3 28 * .0 .0 .0 .0 .0 .0 .0 .0 .0 .0 .0 .0 .0 .0 .0 .0 .0 .0 .0 .0 29 * .2 .2 .1 .1 .1 .2 .2 .2 .2 .2 .2 .1 .5 .3 .2 .0 .0 .2 .4 .5 30 * .0 .0 .0 .0 .0 .0 .0 .0 .0 .0 .0 .0 .0 .0 .0 .0 .0 .0 .0 .0 31 * .0 .0 .0 .0 .0 .0 .0 .0 .0 .0 .0 .0 .0 .0 .0 .0 .0 .0 .0 .0 32 * .0 .0 .0 .0 .0 .0 .0 .0 .0 .0 .0 .0 .0 .0 .0 .0 .0 .0 .0 .0 33 * .0 .0 .0 .0 .0 .0 .0 .0 .0 .0 .0 .0 .0 .0 .0 .0 .0 .0 .0 .0 34 * .0 .0 .0 .0 .1 .0 .0 .0 .0 .0 .1 .0 .0 .0 .0 .2 .2 .3 .3 .2 35 * .0 .0 .0 .0 .1 .0 .0 .0 .0 .0 .1 .1 .0 .0 .0 .2 .3 .3 .3 .2 36 * .0 .0 .0 .0 .0 .0 .0 .0 .0 .0 .0 .0 .0 .0 .0 .0 .0 .0 .0 .0 37 * .0 .0 .0 .0 .0 .0 .0 .0 .0 .0 .0 .0 .0 .0 .0 .0 .0 .0 .0 .0 38 * .1 .1 .0 .0 .0 .1 .1 .0 .1 .0 .0 .0 .0 .0 .0 .0 .0 .0 .0 .0 39 * .0 .0 .0 .0 .0 .0 .0 .0 .0 .0 .0 .0 .0 .0 .0 .0 .0 .0 .0 .0 40 * .0 .0 .0 .0 .0 .1 .0 .0 .0 .0 .0 .0 .0 .0 .0 .0 .0 .0 .0 .0 41 * .0 .0 .0 .0 .0 .0 .0 .0 .0 .0 .0 .0 .0 .0 .0 .0 .0 .0 .0 .0 42 * .0 .0 .0 .0 .0 .0 .0 .0 .0 .0 .0 .0 .0 .0 .0 .0 .0 .0 .0 .0 43 * .0 .0 .0 .0 .0 .0 .0 .0 .0 .0 .0 .0 .0 .0 .0 .0 .0 .0 .0 .0 44 * .0 .0 .0 .0 .0 .0 .0 .0 .0 .0 .0 .0 .0 .0 .0 .0 .0 .0
Page 8
sh7pgav2.out .0 .0 45 * .0 .0 .8 .6 .5 .0 .0 .0 .0 .0 .3 .3 .6 .6 .6 1.0 .9 .9 .5 .3� PAGE 10 JOB: I25SH7withPkgStationPackageA RUN: I25SH7withPkgStationPackageA
* CO/LINK (PPM) * ANGLE (DEGREES) * REC21 REC22 REC23 REC24 REC25 REC26 REC27 REC28 REC29 REC30 REC31 REC32 REC33 REC34 REC35 REC36 REC37 REC38REC39 REC40 LINK # * 290 290 10 10 10 300 290 280 290 280 250 240 250 240 240 130 120 110 110 110 -------*------------------------------------------------------------------------------------------------------------------------ 46 * .0 .0 .0 .0 .0 .0 .0 .0 .0 .0 .0 .0 .0 .0 .0 .0 .0 .0 .0 .0 47 * .0 .0 .8 .7 .6 .0 .0 .0 .0 .0 .1 .1 .6 1.3 1.3 1.1 1.0 .4 .1 .1 48 * .0 .0 .6 .8 1.0 1.0 1.0 1.0 .5 .4 .1 .1 .0 .0 .0 .0 .0 .0 .0 .1
Page 9
sh7pgbpm.in'I25SH7withPkgStationPackageB', 60 , 175 , 0 , 0 , 40 , 0.3048 , 1 , 1 'Receptor 1', 688 , 190 , 5 'Receptor 2', 728 , 190 , 5 'Receptor 3', 768 , 190 , 5 'Receptor 4', 768 , 230 , 5 'Receptor 5', 768 , 270 , 5 'Receptor 6', 862 , 270 , 5 'Receptor 7', 862 , 230 , 5 'Receptor 8', 862 , 190 , 5 'Receptor 9', 902 , 190 , 5 'Receptor 10', 942 , 190 , 5 'Receptor 11', 694 , 50 , 5 'Receptor 12', 734 , 50 , 5 'Receptor 13', 774 , 50 , 5 'Receptor 14', 774 , 10 , 5 'Receptor 15', 774 ,-30 , 5 'Receptor 16', 862 ,-30 , 5 'Receptor 17', 862 , 10 , 5 'Receptor 18', 862 , 50 , 5 'Receptor 19', 902 , 50 , 5 'Receptor 20', 942 , 50 , 5 'Receptor 21', 1634 , 26 , 5 'Receptor 22', 1674 , 26 , 5 'Receptor 23', 1714 , 26 , 5 'Receptor 24', 1714 ,-14 , 5 'Receptor 25', 1714 ,-54 , 5 'Receptor 26', 1766 ,-30 , 5 'Receptor 27', 1766 , 10 , 5 'Receptor 28', 1766 , 50 , 5 'Receptor 29', 1806 , 50 , 5 'Receptor 30', 1846 , 50 , 5 'Receptor 31', 1870 , 190 , 5 'Receptor 32', 1830 , 190 , 5 'Receptor 33', 1790 , 190 , 5 'Receptor 34', 1790 , 230 , 5 'Receptor 35', 1790 , 270 , 5 'Receptor 36', 1714 , 270 , 5 'Receptor 37', 1714 , 230 , 5 'Receptor 38', 1714 , 190 , 5 'Receptor 39', 1674 , 190 , 5 'Receptor 40', 1634 , 190 , 5 'I25SH7withPkgStationPackageB', 47 , 1 , 1 ,'CO' 1 'ebinthru','AG', 282 , 100 , 815 , 100 , 1127 , 22.8 , 0 , 32 2 'ebinthru q','AG', 772 , 100 , 282 , 100 , 0 , 12 , 1 110 , 49 , 2 , 952 , 143.34 , 1600 , 1 , 3 1 'ebmidthru','AG', 282 , 88 , 815 , 88 , 1127 , 22.8 , 0 , 32 2 'ebmidthru q','AG', 772 , 88 , 282 , 88 , 0 , 12 , 1 110 , 49 , 2 , 952 , 143.34 , 1600 , 1 , 3 1 'eboutthru','AG', 282 , 76 , 815 , 76 , 1127 , 22.8 , 0 , 32 2 'eboutthru q','AG', 772 , 76 , 282 , 76 , 0 , 12 , 1 110 , 49 , 2 , 952 , 143.34 , 1600 , 1 , 3 1 'edinapp/dep','AG', 815 , 100 , 1749 , 100 , 1238 , 22.8 , 0 , 32 2 'edinapp/dep q','AG', 1710 , 100 , 852 , 100 , 0 , 12 , 1 110 , 49 , 2 , 737 , 143.34 , 1600 , 1 , 3 1 'edmidapp/dep','AG', 815 , 88 , 1749 , 88 , 1238 , 22.8 , 0 , 32 2 'edmidapp/dep q','AG', 1710 , 88 , 852 , 88 , 0 , 12 , 1 110 , 49 , 2 , 737 , 143.34 , 1600 , 1 , 3 1 'eboutapp/dep','AG', 815 , 76 , 1749 , 76 , 1238 , 22.8 , 0 , 32 2 'eboutapp/dep q','AG', 1710 , 76 , 852 , 76 , 0 , 12 , 1 110 , 49 , 2 , 737 , 143.34 , 1600 , 1 , 3 1 'ebindep','AG', 1749 , 100 , 2282 , 100 , 890 , 22.8 , 0 , 32 1 'ebmiddep','AG', 1749 , 88 , 2282 , 88 , 890 , 22.8 , 0 , 32 1 'eboutdep','AG', 1749 , 76 , 2282 , 76 , 890 , 22.8 , 0 , 32 1 'ebrightturn','AG', 1310 , 58 , 1749 , 58 , 1505 , 22.8 , 0 , 44 2
Page 1
sh7pgbpm.in'ebinleftturn','AG', 772 , 124 , 572 , 124 , 0 , 12 , 1 110 , 95 , 2 , 163 , 143.34 , 1600 , 1 , 3 2 'eboutleftturn','AG', 772 , 111.9 , 572 , 111.9 , 0 , 12 , 1 110 , 95 , 2 , 163 , 143.34 , 1600 , 1 , 3 1 'wbinthru','AG', 2282 , 140 , 1749 , 140 , 890 , 22.1 , 0 , 32 2 'wbinthru q','AG', 1770 , 140 , 2282 , 140 , 0 , 12 , 1 110 , 21 , 2 , 695 , 143.34 , 1600 , 1 , 3 1 'wbmidthru','AG', 2282 , 152 , 1749 , 152 , 890 , 22.1 , 0 , 32 2 'wbmidthru q','AG', 1770 , 152 , 2282 , 152 , 0 , 12 , 1 110 , 21 , 2 , 695 , 143.34 , 1600 , 1 , 3 1 'wboutthru','AG', 2282 , 164 , 1749 , 164 , 890 , 22.1 , 0 , 32 2 'wboutthru q','AG', 1770 , 164 , 2282 , 164 , 0 , 12 , 1 110 , 21 , 2 , 695 , 143.34 , 1600 , 1 , 3 1 'wbinapp/dep','AG', 1749 , 140 , 815 , 140 , 955 , 22.1 , 0 , 32 2 'wbinapp/dep q','AG', 852 , 140 , 1710 , 140 , 0 , 12 , 1 110 , 52 , 2 , 727 , 143.34 , 1600 , 1 , 3 1 'wbmidapp/dep','AG', 1749 , 152 , 815 , 152 , 955 , 22.1 , 0 , 32 2 'wbmidapp/dep q','AG', 852 , 152 , 1710 , 152 , 0 , 12 , 1 110 , 52 , 2 , 727 , 143.34 , 1600 , 1 , 3 1 'wboutapp/dep','AG', 1749 , 164 , 815 , 164 , 955 , 22.1 , 0 , 32 2 'wboutapp/dep q','AG', 852 , 164 , 1710 , 164 , 0 , 12 , 1 110 , 52 , 2 , 727 , 143.34 , 1600 , 1 , 3 1 'wbindep','AG', 815 , 140 , 282 , 140 , 880 , 22.1 , 0 , 32 1 'wbmiddep','AG', 815 , 152 , 282 , 152 , 880 , 22.1 , 0 , 32 1 'wboutdep','AG', 815 , 164 , 282 , 164 , 880 , 22.1 , 0 , 32 2 'wbinleftturn','AG', 1770 , 116 , 1970 , 116 , 0 , 12 , 1 110 , 82 , 2 , 293 , 143.34 , 1600 , 1 , 3 2 'wboutleftturn','AG', 1770 , 128 , 1970 , 128 , 0 , 12 , 1 110 , 82 , 2 , 293 , 143.34 , 1600 , 1 , 3 2 'wbinleftturn 2','AG', 852 , 112 , 1052 , 112 , 0 , 12 , 1 110 , 98 , 2 , 145 , 143.34 , 1600 , 1 , 3 2 'wboutleftturn 2','AG', 852 , 124 , 1052 , 124 , 0 , 12 , 1 110 , 98 , 2 , 145 , 143.34 , 1600 , 1 , 3 1 'pkg sb','AG', 794 , 1120 , 794 , 120 , 880 , 22.6 , 0 , 44 2 'pkg sb q','AG', 794 , 180 , 794 , 1120 , 0 , 24 , 2 110 , 73 , 2 , 20 , 143.34 , 1600 , 1 , 3 2 'pkg sb left turn','AG', 812 , 180 , 812 , 380 , 0 , 12 , 1 110 , 73 , 2 , 570 , 143.34 , 1600 , 1 , 3 1 'pkg sb dep','AG', 800 , 120 , 800 ,-880 , 510 , 22.6 , 0 , 32 1 'pkg nb','AG', 836 ,-880 , 836 , 120 , 480 , 22.6 , 0 , 32 2 'pkg nb left turn','AG', 824 , 40 , 824 ,-140 , 0 , 12 , 1 110 , 90 , 2 , 170 , 143.34 , 1600 , 1 , 3 1 'pkg nb dep','AG', 830 , 120 , 830 , 1120 , 740 , 22.6 , 0 , 44 1 'i25sbrampthru','AG', 1740 , 1111 , 1740 , 111 , 1060 , 22.6 , 0 , 32 2 'i25sbrampleftturn','AG', 1758 , 180 , 1758 , 380 , 0 , 24 , 2 110 , 89 , 2 , 280 , 143.34 , 1600 , 1 , 3 1 'i25sbrampdep','AG', 1740 , 111 , 1740 ,-889 , 2090 , 22.6 , 0 , 32 1 , 0 , 4 , 1000 , 0 ,'Y', 10 , 0 , 36
Page 2
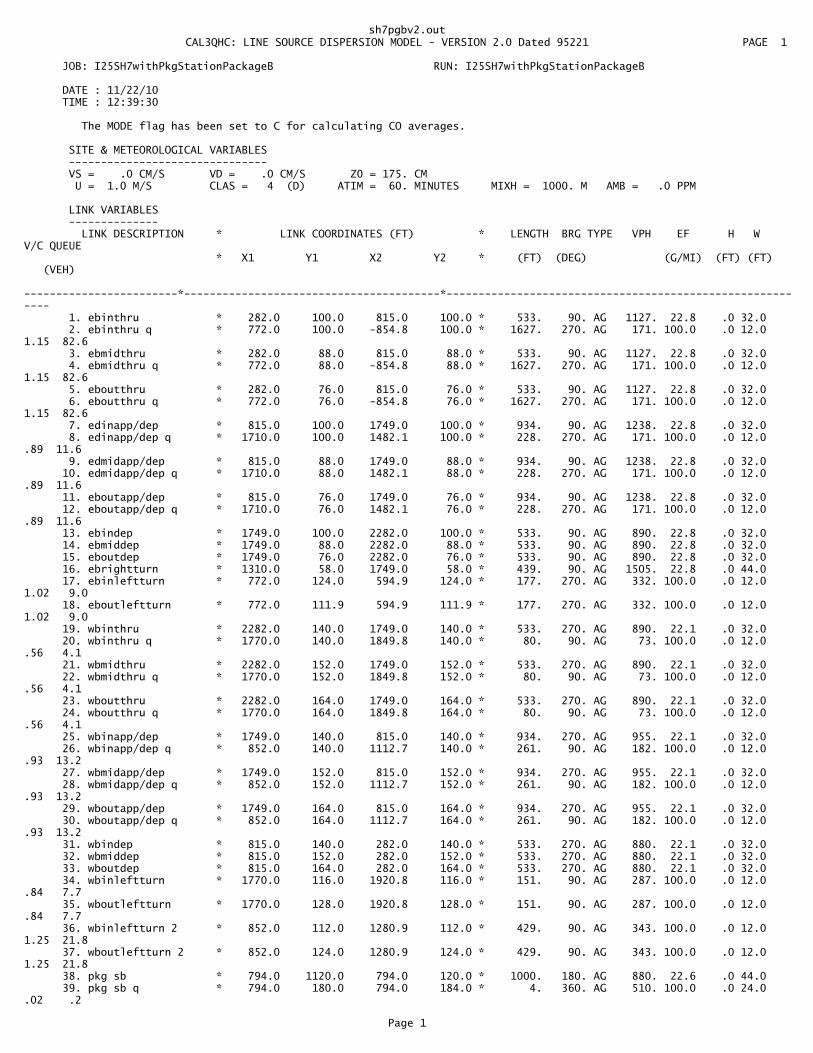
sh7pgbv2.out� CAL3QHC: LINE SOURCE DISPERSION MODEL - VERSION 2.0 Dated 95221 PAGE 1
JOB: I25SH7withPkgStationPackageB RUN: I25SH7withPkgStationPackageB
DATE : 11/22/10 TIME : 12:39:30
The MODE flag has been set to C for calculating CO averages.
SITE & METEOROLOGICAL VARIABLES ------------------------------- VS = .0 CM/S VD = .0 CM/S Z0 = 175. CM U = 1.0 M/S CLAS = 4 (D) ATIM = 60. MINUTES MIXH = 1000. M AMB = .0 PPM
LINK VARIABLES -------------- LINK DESCRIPTION * LINK COORDINATES (FT) * LENGTH BRG TYPE VPH EF H W V/C QUEUE * X1 Y1 X2 Y2 * (FT) (DEG) (G/MI) (FT) (FT) (VEH) ------------------------*----------------------------------------*---------------------------------------------------------- 1. ebinthru * 282.0 100.0 815.0 100.0 * 533. 90. AG 1127. 22.8 .0 32.0 2. ebinthru q * 772.0 100.0 -854.8 100.0 * 1627. 270. AG 171. 100.0 .0 12.0 1.15 82.6 3. ebmidthru * 282.0 88.0 815.0 88.0 * 533. 90. AG 1127. 22.8 .0 32.0 4. ebmidthru q * 772.0 88.0 -854.8 88.0 * 1627. 270. AG 171. 100.0 .0 12.0 1.15 82.6 5. eboutthru * 282.0 76.0 815.0 76.0 * 533. 90. AG 1127. 22.8 .0 32.0 6. eboutthru q * 772.0 76.0 -854.8 76.0 * 1627. 270. AG 171. 100.0 .0 12.0 1.15 82.6 7. edinapp/dep * 815.0 100.0 1749.0 100.0 * 934. 90. AG 1238. 22.8 .0 32.0 8. edinapp/dep q * 1710.0 100.0 1482.1 100.0 * 228. 270. AG 171. 100.0 .0 12.0 .89 11.6 9. edmidapp/dep * 815.0 88.0 1749.0 88.0 * 934. 90. AG 1238. 22.8 .0 32.0 10. edmidapp/dep q * 1710.0 88.0 1482.1 88.0 * 228. 270. AG 171. 100.0 .0 12.0 .89 11.6 11. eboutapp/dep * 815.0 76.0 1749.0 76.0 * 934. 90. AG 1238. 22.8 .0 32.0 12. eboutapp/dep q * 1710.0 76.0 1482.1 76.0 * 228. 270. AG 171. 100.0 .0 12.0 .89 11.6 13. ebindep * 1749.0 100.0 2282.0 100.0 * 533. 90. AG 890. 22.8 .0 32.0 14. ebmiddep * 1749.0 88.0 2282.0 88.0 * 533. 90. AG 890. 22.8 .0 32.0 15. eboutdep * 1749.0 76.0 2282.0 76.0 * 533. 90. AG 890. 22.8 .0 32.0 16. ebrightturn * 1310.0 58.0 1749.0 58.0 * 439. 90. AG 1505. 22.8 .0 44.0 17. ebinleftturn * 772.0 124.0 594.9 124.0 * 177. 270. AG 332. 100.0 .0 12.0 1.02 9.0 18. eboutleftturn * 772.0 111.9 594.9 111.9 * 177. 270. AG 332. 100.0 .0 12.0 1.02 9.0 19. wbinthru * 2282.0 140.0 1749.0 140.0 * 533. 270. AG 890. 22.1 .0 32.0 20. wbinthru q * 1770.0 140.0 1849.8 140.0 * 80. 90. AG 73. 100.0 .0 12.0 .56 4.1 21. wbmidthru * 2282.0 152.0 1749.0 152.0 * 533. 270. AG 890. 22.1 .0 32.0 22. wbmidthru q * 1770.0 152.0 1849.8 152.0 * 80. 90. AG 73. 100.0 .0 12.0 .56 4.1 23. wboutthru * 2282.0 164.0 1749.0 164.0 * 533. 270. AG 890. 22.1 .0 32.0 24. wboutthru q * 1770.0 164.0 1849.8 164.0 * 80. 90. AG 73. 100.0 .0 12.0 .56 4.1 25. wbinapp/dep * 1749.0 140.0 815.0 140.0 * 934. 270. AG 955. 22.1 .0 32.0 26. wbinapp/dep q * 852.0 140.0 1112.7 140.0 * 261. 90. AG 182. 100.0 .0 12.0 .93 13.2 27. wbmidapp/dep * 1749.0 152.0 815.0 152.0 * 934. 270. AG 955. 22.1 .0 32.0 28. wbmidapp/dep q * 852.0 152.0 1112.7 152.0 * 261. 90. AG 182. 100.0 .0 12.0 .93 13.2 29. wboutapp/dep * 1749.0 164.0 815.0 164.0 * 934. 270. AG 955. 22.1 .0 32.0 30. wboutapp/dep q * 852.0 164.0 1112.7 164.0 * 261. 90. AG 182. 100.0 .0 12.0 .93 13.2 31. wbindep * 815.0 140.0 282.0 140.0 * 533. 270. AG 880. 22.1 .0 32.0 32. wbmiddep * 815.0 152.0 282.0 152.0 * 533. 270. AG 880. 22.1 .0 32.0 33. wboutdep * 815.0 164.0 282.0 164.0 * 533. 270. AG 880. 22.1 .0 32.0 34. wbinleftturn * 1770.0 116.0 1920.8 116.0 * 151. 90. AG 287. 100.0 .0 12.0 .84 7.7 35. wboutleftturn * 1770.0 128.0 1920.8 128.0 * 151. 90. AG 287. 100.0 .0 12.0 .84 7.7 36. wbinleftturn 2 * 852.0 112.0 1280.9 112.0 * 429. 90. AG 343. 100.0 .0 12.0 1.25 21.8 37. wboutleftturn 2 * 852.0 124.0 1280.9 124.0 * 429. 90. AG 343. 100.0 .0 12.0 1.25 21.8 38. pkg sb * 794.0 1120.0 794.0 120.0 * 1000. 180. AG 880. 22.6 .0 44.0 39. pkg sb q * 794.0 180.0 794.0 184.0 * 4. 360. AG 510. 100.0 .0 24.0 .02 .2
Page 1
sh7pgbv2.out 40. pkg sb left turn * 812.0 180.0 812.0 1420.0 * 1240. 360. AG 255. 100.0 .0 12.0 1.19 63.0 41. pkg sb dep * 800.0 120.0 800.0 -880.0 * 1000. 180. AG 510. 22.6 .0 32.0 42. pkg nb * 836.0 -880.0 836.0 120.0 * 1000. 360. AG 480. 22.6 .0 32.0 43. pkg nb left turn * 824.0 40.0 824.0 -50.0 * 90. 180. AG 315. 100.0 .0 12.0 .73 4.6 44. pkg nb dep * 830.0 120.0 830.0 1120.0 * 1000. 360. AG 740. 22.6 .0 44.0� PAGE 2 JOB: I25SH7withPkgStationPackageB RUN: I25SH7withPkgStationPackageB
DATE : 11/22/10 TIME : 12:39:30
LINK VARIABLES -------------- LINK DESCRIPTION * LINK COORDINATES (FT) * LENGTH BRG TYPE VPH EF H W V/C QUEUE * X1 Y1 X2 Y2 * (FT) (DEG) (G/MI) (FT) (FT) (VEH) ------------------------*----------------------------------------*---------------------------------------------------------- 45. i25sbrampthru * 1740.0 1111.0 1740.0 111.0 * 1000. 180. AG 1060. 22.6 .0 32.0 46. i25sbrampleftturn * 1758.0 180.0 1758.0 248.1 * 68. 360. AG 622. 100.0 .0 24.0 .57 3.5 47. i25sbrampdep * 1740.0 111.0 1740.0 -889.0 * 1000. 180. AG 2090. 22.6 .0 32.0� PAGE 3 JOB: I25SH7withPkgStationPackageB RUN: I25SH7withPkgStationPackageB
DATE : 11/22/10 TIME : 12:39:30
ADDITIONAL QUEUE LINK PARAMETERS -------------------------------- LINK DESCRIPTION * CYCLE RED CLEARANCE APPROACH SATURATION IDLE SIGNAL ARRIVAL * LENGTH TIME LOST TIME VOL FLOW RATE EM FAC TYPE RATE * (SEC) (SEC) (SEC) (VPH) (VPH) (gm/hr) ------------------------*-------------------------------------------------------------------------------- 2. ebinthru q * 110 49 2.0 952 1600 143.34 1 3 4. ebmidthru q * 110 49 2.0 952 1600 143.34 1 3 6. eboutthru q * 110 49 2.0 952 1600 143.34 1 3 8. edinapp/dep q * 110 49 2.0 737 1600 143.34 1 3 10. edmidapp/dep q * 110 49 2.0 737 1600 143.34 1 3 12. eboutapp/dep q * 110 49 2.0 737 1600 143.34 1 3 17. ebinleftturn * 110 95 2.0 163 1600 143.34 1 3 18. eboutleftturn * 110 95 2.0 163 1600 143.34 1 3 20. wbinthru q * 110 21 2.0 695 1600 143.34 1 3 22. wbmidthru q * 110 21 2.0 695 1600 143.34 1 3 24. wboutthru q * 110 21 2.0 695 1600 143.34 1 3 26. wbinapp/dep q * 110 52 2.0 727 1600 143.34 1 3 28. wbmidapp/dep q * 110 52 2.0 727 1600 143.34 1 3 30. wboutapp/dep q * 110 52 2.0 727 1600 143.34 1 3 34. wbinleftturn * 110 82 2.0 293 1600 143.34 1 3 35. wboutleftturn * 110 82 2.0 293 1600 143.34 1 3 36. wbinleftturn 2 * 110 98 2.0 145 1600 143.34 1 3 37. wboutleftturn 2 * 110 98 2.0 145 1600 143.34 1 3 39. pkg sb q * 110 73 2.0 20 1600 143.34 1 3 40. pkg sb left turn * 110 73 2.0 570 1600 143.34 1 3 43. pkg nb left turn * 110 90 2.0 170 1600 143.34 1 3 46. i25sbrampleftturn * 110 89 2.0 280 1600 143.34 1 3
RECEPTOR LOCATIONS ------------------ * COORDINATES (FT) * RECEPTOR * X Y Z * -------------------------*-------------------------------------* 1. Receptor 1 * 688.0 190.0 5.0 * 2. Receptor 2 * 728.0 190.0 5.0 * 3. Receptor 3 * 768.0 190.0 5.0 * 4. Receptor 4 * 768.0 230.0 5.0 * 5. Receptor 5 * 768.0 270.0 5.0 * 6. Receptor 6 * 862.0 270.0 5.0 * 7. Receptor 7 * 862.0 230.0 5.0 * 8. Receptor 8 * 862.0 190.0 5.0 * 9. Receptor 9 * 902.0 190.0 5.0 * 10. Receptor 10 * 942.0 190.0 5.0 * 11. Receptor 11 * 694.0 50.0 5.0 * 12. Receptor 12 * 734.0 50.0 5.0 * 13. Receptor 13 * 774.0 50.0 5.0 *
Page 2
sh7pgbv2.out 14. Receptor 14 * 774.0 10.0 5.0 * 15. Receptor 15 * 774.0 -30.0 5.0 * 16. Receptor 16 * 862.0 -30.0 5.0 * 17. Receptor 17 * 862.0 10.0 5.0 * 18. Receptor 18 * 862.0 50.0 5.0 * 19. Receptor 19 * 902.0 50.0 5.0 * 20. Receptor 20 * 942.0 50.0 5.0 * 21. Receptor 21 * 1634.0 26.0 5.0 * 22. Receptor 22 * 1674.0 26.0 5.0 * 23. Receptor 23 * 1714.0 26.0 5.0 *� PAGE 4 JOB: I25SH7withPkgStationPackageB RUN: I25SH7withPkgStationPackageB
DATE : 11/22/10 TIME : 12:39:30
RECEPTOR LOCATIONS ------------------ * COORDINATES (FT) * RECEPTOR * X Y Z * -------------------------*-------------------------------------* 24. Receptor 24 * 1714.0 -14.0 5.0 * 25. Receptor 25 * 1714.0 -54.0 5.0 * 26. Receptor 26 * 1766.0 -30.0 5.0 * 27. Receptor 27 * 1766.0 10.0 5.0 * 28. Receptor 28 * 1766.0 50.0 5.0 * 29. Receptor 29 * 1806.0 50.0 5.0 * 30. Receptor 30 * 1846.0 50.0 5.0 * 31. Receptor 31 * 1870.0 190.0 5.0 * 32. Receptor 32 * 1830.0 190.0 5.0 * 33. Receptor 33 * 1790.0 190.0 5.0 * 34. Receptor 34 * 1790.0 230.0 5.0 * 35. Receptor 35 * 1790.0 270.0 5.0 * 36. Receptor 36 * 1714.0 270.0 5.0 * 37. Receptor 37 * 1714.0 230.0 5.0 * 38. Receptor 38 * 1714.0 190.0 5.0 * 39. Receptor 39 * 1674.0 190.0 5.0 * 40. Receptor 40 * 1634.0 190.0 5.0 *� PAGE 5 JOB: I25SH7withPkgStationPackageB RUN: I25SH7withPkgStationPackageB
MODEL RESULTS -------------
REMARKS : In search of the angle corresponding to the maximum concentration, only the first angle, of the angles with same maximum concentrations, is indicated as maximum.
WIND ANGLE RANGE: 0.-360.
WIND * CONCENTRATION ANGLE * (PPM) (DEGR)* REC1 REC2 REC3 REC4 REC5 REC6 REC7 REC8 REC9 REC10 REC11 REC12 REC13 REC14 REC15 REC16 REC17 REC18 REC19 REC20 ------*------------------------------------------------------------------------------------------------------------------------ 0. * .3 .6 1.5 1.4 1.4 1.0 1.1 1.1 .5 .3 4.6 4.7 4.7 3.4 2.7 3.1 3.7 4.9 4.7 4.6 10. * .7 .9 2.0 2.0 2.0 .4 .4 .4 .2 .0 4.9 5.1 4.7 3.5 3.1 2.7 3.2 4.4 4.5 4.3 20. * .8 1.2 1.9 1.9 1.9 .1 .1 .1 .0 .0 5.0 4.9 3.9 3.0 2.7 2.2 2.9 4.3 4.3 4.3 30. * .8 1.1 1.8 1.8 1.8 .0 .0 .0 .0 .0 4.9 4.7 4.2 3.2 3.2 2.4 2.8 4.5 4.5 4.5 40. * .7 1.0 1.6 1.6 1.6 .0 .0 .0 .0 .0 4.9 4.4 4.2 3.3 3.1 2.5 2.9 4.6 4.6 4.6 50. * .7 .9 1.4 1.4 1.4 .0 .1 .1 .1 .1 5.5 4.7 4.8 3.8 3.7 2.7 3.2 5.0 4.9 4.8 60. * .8 1.0 1.4 1.4 1.4 .1 .1 .1 .1 .1 5.1 5.0 5.7 4.3 3.8 2.5 3.5 5.2 5.2 5.0 70. * .9 1.1 1.5 1.4 1.4 .1 .1 .2 .2 .2 5.6 5.5 5.7 4.3 3.3 2.4 3.2 5.2 5.2 5.0 80. * 2.0 2.1 2.5 1.7 1.4 .1 .3 .9 .9 .9 5.3 5.2 5.2 3.5 2.6 1.7 2.7 4.5 4.6 4.8 90. * 3.5 3.9 4.7 2.9 2.1 .6 1.3 3.1 3.1 3.2 3.5 3.6 3.7 2.5 1.7 .7 1.5 3.3 3.3 3.3
Page 3

sh7pgbv2.out 100. * 4.8 5.5 6.0 4.2 3.2 1.9 2.8 5.1 4.9 4.8 1.7 2.0 2.0 1.4 .9 .2 .5 1.2 1.1 1.2 110. * 5.0 5.3 6.2 5.0 4.0 2.7 3.7 5.7 5.7 5.5 .7 .8 1.1 1.0 .8 .1 .1 .3 .3 .3 120. * 4.5 4.8 5.8 4.7 4.3 2.8 3.6 5.5 5.5 5.4 .5 .7 1.1 1.1 .8 .1 .1 .1 .1 .1 130. * 4.1 3.9 4.9 4.2 4.2 3.0 3.3 5.1 5.1 5.1 .5 .6 1.1 1.1 .8 .1 .1 .1 .1 .1 140. * 3.8 3.5 4.3 4.0 3.6 2.8 3.2 4.6 4.6 4.6 .3 .6 1.0 .9 .6 .0 .1 .1 .1 .1 150. * 3.8 3.8 3.7 3.5 3.4 2.4 3.1 4.4 4.4 4.4 .3 .5 1.0 .8 .7 .0 .0 .0 .0 .0 160. * 3.9 3.8 3.6 3.2 3.2 2.1 3.0 4.2 4.2 4.2 .3 .5 .9 .8 .7 .0 .0 .1 .0 .0 170. * 3.8 3.8 3.9 3.3 3.0 2.3 3.3 4.4 4.3 4.2 .2 .3 .8 .7 .7 .3 .3 .3 .0 .0 180. * 3.7 3.7 3.9 3.0 2.6 2.3 3.2 4.4 4.6 4.6 .1 .2 .5 .5 .5 .4 .5 .7 .2 .1 190. * 3.6 3.6 3.5 2.7 2.2 2.9 3.2 4.4 4.6 4.4 .0 .0 .2 .2 .2 .7 .8 .9 .3 .2 200. * 3.6 3.7 3.6 2.7 2.0 2.6 2.7 4.0 4.6 4.6 .0 .0 .1 .1 .1 .8 1.0 1.1 .4 .3 210. * 3.7 3.8 3.8 2.8 2.0 3.2 3.2 3.9 4.6 4.6 .0 .0 .0 .0 .0 .6 .9 1.1 .5 .3 220. * 3.8 3.9 3.9 2.7 2.0 3.2 3.6 4.2 4.4 4.8 .0 .0 .0 .0 .0 .7 1.0 1.1 .6 .4 230. * 3.8 4.0 4.1 2.7 1.9 3.3 3.6 4.5 4.9 4.9 .0 .0 .0 .0 .0 .7 1.1 1.1 .7 .3 240. * 3.9 4.1 4.3 2.8 1.8 3.3 4.1 5.1 4.8 5.4 .0 .0 .0 .0 .0 .7 1.0 .9 .6 .4 250. * 3.6 3.8 4.0 2.3 1.4 3.1 3.9 5.3 5.0 5.1 .1 .1 .1 .0 .0 .8 1.0 .9 .7 .5 260. * 2.8 3.0 3.2 1.5 .9 2.3 3.1 4.7 4.5 4.4 1.0 1.0 1.0 .3 .0 .9 1.4 1.7 1.6 1.4 270. * 1.5 1.6 1.6 .7 .4 1.8 2.1 3.4 3.0 2.7 2.5 2.5 2.8 1.0 .5 1.6 2.0 3.6 3.3 3.2 280. * .4 .4 .5 .0 .0 1.2 1.3 1.8 1.3 1.1 3.8 4.0 4.2 2.1 1.2 2.5 3.4 4.8 4.7 4.3 290. * .1 .1 .1 .0 .0 1.2 1.2 1.3 .9 .7 4.6 4.7 5.0 2.8 1.8 3.0 4.0 5.2 4.8 4.9 300. * .0 .0 .0 .0 .0 1.3 1.3 1.3 .9 .6 4.7 5.1 5.2 3.0 2.3 3.5 3.9 5.1 4.7 4.4 310. * .0 .0 .0 .0 .0 1.3 1.3 1.3 .9 .6 4.6 4.8 4.9 3.0 2.5 3.3 3.5 4.3 4.3 4.4 320. * .0 .0 .0 .0 .0 1.4 1.4 1.4 .9 .6 4.5 4.6 4.6 3.1 2.4 3.5 3.2 3.9 4.0 4.7 330. * .0 .0 .1 .1 .1 1.6 1.6 1.6 1.0 .9 4.4 4.4 4.3 3.0 2.3 2.9 3.2 4.0 4.6 5.0 340. * .0 .0 .2 .2 .2 1.7 1.7 1.7 1.0 .8 4.2 4.2 4.1 3.0 2.3 3.0 3.1 4.4 4.8 5.1 350. * .0 .2 .7 .7 .7 1.6 1.6 1.6 .9 .6 4.1 4.3 4.4 3.1 2.6 3.4 3.6 5.0 5.0 4.8 360. * .3 .6 1.5 1.4 1.4 1.0 1.1 1.1 .5 .3 4.6 4.7 4.7 3.4 2.7 3.1 3.7 4.9 4.7 4.6 ------*------------------------------------------------------------------------------------------------------------------------ MAX * 5.0 5.5 6.2 5.0 4.3 3.3 4.1 5.7 5.7 5.5 5.6 5.5 5.7 4.3 3.8 3.5 4.0 5.2 5.2 5.1 DEGR. * 110 100 110 110 120 230 240 110 110 110 70 70 60 60 60 320 290 60 60 340
� PAGE 6 JOB: I25SH7withPkgStationPackageB RUN: I25SH7withPkgStationPackageB
MODEL RESULTS -------------
REMARKS : In search of the angle corresponding to the maximum concentration, only the first angle, of the angles with same maximum concentrations, is indicated as maximum.
WIND ANGLE RANGE: 0.-360.
WIND * CONCENTRATION ANGLE * (PPM) (DEGR)* REC21 REC22 REC23 REC24 REC25 REC26 REC27 REC28 REC29 REC30 REC31 REC32 REC33 REC34 REC35 REC36 REC37 REC38 REC39 REC40
Page 4

sh7pgbv2.out------*------------------------------------------------------------------------------------------------------------------------ 0. * 3.9 4.1 4.6 3.8 3.0 3.1 3.2 3.9 3.6 3.0 .1 .2 .5 .4 .4 .8 .8 .8 .3 .2 10. * 4.0 4.3 4.9 4.1 4.0 1.8 2.6 3.1 3.2 2.8 .0 .1 .2 .2 .1 1.1 1.1 1.2 .5 .3 20. * 4.2 4.5 5.1 4.0 3.3 1.9 2.2 3.2 2.8 2.8 .0 .0 .0 .0 .0 1.1 1.1 1.3 .5 .4 30. * 4.3 4.5 5.0 4.1 3.2 1.7 1.9 3.0 2.9 2.9 .0 .0 .0 .0 .0 1.0 1.0 1.5 .5 .4 40. * 4.4 4.6 4.9 3.4 3.2 1.6 2.0 3.1 3.0 2.9 .0 .0 .0 .0 .0 .9 1.0 1.7 .6 .3 50. * 5.0 4.4 4.6 3.5 2.9 1.6 2.0 3.3 3.2 3.0 .0 .0 .0 .0 .0 .8 1.0 1.8 .7 .4 60. * 4.4 4.4 4.4 3.1 2.6 1.4 1.9 3.3 3.1 2.9 .0 .0 .0 .0 .0 .7 1.1 1.9 .9 .5 70. * 4.0 4.1 3.8 2.8 2.3 1.0 1.7 3.1 3.0 2.7 .1 .1 .1 .0 .0 .7 1.4 2.0 1.2 .8 80. * 3.4 3.1 3.3 2.3 1.8 .5 1.1 2.4 2.3 2.1 .4 .5 .5 .0 .0 .7 1.7 2.4 1.7 1.2 90. * 1.9 1.9 2.3 1.7 1.4 .2 .4 1.6 1.4 1.3 1.2 1.2 1.5 .4 .1 1.0 2.2 3.2 2.5 2.4 100. * 1.0 1.1 1.6 1.4 1.4 .0 .1 .5 .5 .5 2.1 2.2 2.3 1.0 .5 1.7 3.0 4.3 3.6 3.3 110. * .7 .8 1.4 1.4 1.4 .0 .0 .1 .1 .1 2.6 2.8 3.1 1.6 .9 2.2 3.8 4.8 4.0 3.9 120. * .6 .8 1.4 1.4 1.4 .0 .0 .0 .0 .0 2.8 3.1 3.5 1.9 1.4 3.0 4.0 4.5 3.7 3.5 130. * .6 .8 1.5 1.5 1.5 .0 .0 .0 .0 .0 2.8 3.1 3.5 1.9 1.6 3.4 3.8 4.3 3.4 3.4 140. * .7 .9 1.7 1.7 1.7 .0 .0 .0 .0 .0 2.6 3.1 3.5 2.1 1.5 3.4 3.7 3.6 3.5 3.8 150. * .7 1.0 1.9 1.9 1.9 .0 .0 .0 .0 .0 2.8 3.1 3.4 2.2 1.6 3.5 3.3 3.9 3.6 3.8 160. * .7 1.0 2.1 2.1 2.1 .2 .2 .2 .0 .0 2.8 3.1 3.2 2.4 1.7 3.4 3.4 4.0 4.1 4.0 170. * .6 .9 2.1 2.1 2.1 .7 .7 .8 .2 .1 3.0 3.3 3.6 2.5 2.1 3.3 3.7 4.6 4.1 3.9 180. * .3 .6 1.5 1.5 1.5 1.5 1.5 1.5 .6 .3 3.1 3.6 3.9 3.1 2.4 2.8 3.5 4.5 4.0 3.8 190. * .1 .2 .7 .7 .7 2.1 2.1 2.1 .9 .6 3.4 3.9 4.4 3.2 3.3 2.6 3.1 3.9 3.7 3.6 200. * .0 .0 .2 .2 .2 2.1 2.1 2.1 1.0 .7 3.4 4.1 4.3 3.8 3.5 2.1 2.5 3.4 3.4 3.4 210. * .0 .0 .0 .0 .0 1.9 1.9 1.9 1.0 .7 3.8 4.2 4.4 3.9 3.9 2.0 2.5 3.5 3.5 3.5 220. * .0 .0 .0 .0 .0 1.7 1.7 1.8 .9 .7 4.1 4.4 4.2 4.4 3.8 2.2 2.5 3.7 3.6 3.5 230. * .0 .0 .0 .0 .0 1.5 1.5 1.7 .8 .6 4.5 4.5 4.4 4.4 3.8 2.4 2.6 4.0 3.9 3.8 240. * .0 .0 .0 .0 .0 1.4 1.4 1.9 .9 .7 4.6 4.7 5.2 4.8 3.4 2.1 2.8 4.0 3.9 3.9 250. * .1 .1 .1 .0 .0 1.4 1.4 2.5 1.4 1.0 4.7 4.9 5.5 4.9 2.9 2.0 2.7 4.3 4.2 3.9 260. * .7 .8 .8 .2 .0 1.4 1.9 4.1 2.8 2.3 4.3 4.6 5.8 4.8 2.7 2.0 2.7 4.1 4.1 4.2 270. * 3.0 3.2 3.3 1.8 1.0 3.0 3.9 6.8 5.5 4.9 3.4 3.8 4.8 3.4 1.3 .9 1.7 2.9 3.1 3.1 280. * 5.1 4.8 4.7 2.8 2.0 3.9 5.1 7.7 6.2 5.5 1.6 2.0 2.8 2.2 .7 .3 .4 .9 1.0 1.1 290. * 4.8 5.1 5.1 3.1 2.2 4.3 5.6 7.8 5.9 4.6 .9 1.4 2.3 1.8 .7 .2 .2 .3 .4 .4 300. * 4.8 5.0 5.0 3.3 2.9 4.3 5.6 6.8 4.8 4.2 .7 1.2 2.2 1.5 .7 .2 .3 .3 .3 .3 310. * 4.8 4.8 4.7 3.2 2.6 4.4 5.2 6.0 3.9 3.7 .4 1.0 2.1 1.1 .6 .1 .1 .1 .2 .2 320. * 4.2 4.2 4.2 2.9 2.4 4.2 4.5 5.1 3.5 3.5 .3 .6 1.9 .9 .6 .0 .0 .0 .0 .1 330. * 3.8 3.8 3.8 2.8 2.3 4.1 4.5 4.6 3.3 3.6 .3 .5 1.6 .7 .6 .0 .0 .0 .0 .0 340. * 3.7 3.7 3.8 2.7 2.4 3.8 4.0 4.4 3.6 3.6 .3 .4 1.2 .6 .6 .1 .1 .1 .0 .0 350. * 3.7 3.8 4.0 3.2 2.7 3.7 3.8 4.1 3.7 3.4 .2 .4 .9 .6 .6 .4 .4 .4 .1 .0 360. * 3.9 4.1 4.6 3.8 3.0 3.1 3.2 3.9 3.6 3.0 .1 .2 .5 .4 .4 .8 .8 .8 .3 .2 ------*------------------------------------------------------------------------------------------------------------------------ MAX * 5.1 5.1 5.1 4.1 4.0 4.4 5.6 7.8 6.2 5.5 4.7 4.9 5.8 4.9 3.9 3.5 4.0 4.8 4.2 4.2
Page 5

sh7pgbv2.out DEGR. * 280 290 290 30 10 310 290 290 280 280 250 250 260 250 210 150 120 110 250 260
THE HIGHEST CONCENTRATION OF 7.80 PPM OCCURRED AT RECEPTOR REC28.� PAGE 7 JOB: I25SH7withPkgStationPackageB RUN: I25SH7withPkgStationPackageB
DATE : 11/22/10 TIME : 12:39:30
RECEPTOR - LINK MATRIX FOR THE ANGLE PRODUCING THE MAXIMUM CONCENTRATION FOR EACH RECEPTOR
* CO/LINK (PPM) * ANGLE (DEGREES) * REC1 REC2 REC3 REC4 REC5 REC6 REC7 REC8 REC9 REC10 REC11 REC12 REC13 REC14 REC15 REC16 REC17 REC18REC19 REC20 LINK # * 110 100 110 110 120 230 240 110 110 110 70 70 60 60 60 320 290 60 60 340 -------*------------------------------------------------------------------------------------------------------------------------ 1 * .1 .0 .0 .0 .0 .3 .3 .0 .0 .0 .3 .2 .1 .0 .0 .3 .4 .0 .0 .0 2 * .0 .0 .0 .0 .0 .1 .2 .0 .0 .0 .1 .0 .0 .0 .0 .1 .2 .0 .0 .0 3 * .0 .0 .0 .0 .0 .2 .3 .0 .0 .0 .5 .3 .2 .0 .0 .3 .5 .0 .0 .0 4 * .0 .0 .0 .0 .0 .1 .2 .0 .0 .0 .1 .0 .0 .0 .0 .1 .2 .0 .0 .0 5 * .0 .0 .0 .0 .0 .2 .3 .0 .0 .0 .9 .7 .5 .0 .0 .3 .5 .0 .0 .0 6 * .0 .0 .0 .0 .0 .1 .2 .0 .0 .0 .3 .1 .0 .0 .0 .1 .3 .0 .0 .0 7 * .4 .4 .5 .4 .3 .0 .0 .5 .5 .5 .4 .6 .6 .5 .4 .0 .0 .7 .7 .6 8 * .0 .0 .0 .0 .0 .0 .0 .0 .0 .0 .0 .0 .0 .0 .0 .0 .0 .0 .0 .0 9 * .4 .4 .4 .3 .3 .0 .0 .4 .4 .4 .4 .5 .6 .5 .4 .0 .0 .9 .9 .7 10 * .0 .0 .0 .0 .0 .0 .0 .0 .0 .0 .0 .0 .0 .0 .0 .0 .0 .0 .0 .0 11 * .4 .3 .4 .3 .3 .0 .0 .4 .4 .4 .3 .5 .6 .6 .4 .1 .0 1.1 1.1 .8 12 * .0 .0 .0 .0 .0 .0 .0 .0 .0 .0 .0 .0 .0 .0 .0 .0 .0 .0 .0 .0 13 * .0 .0 .0 .0 .0 .0 .0 .0 .0 .0 .0 .0 .0 .0 .0 .0 .0 .0 .0 .0 14 * .0 .0 .0 .0 .0 .0 .0 .0 .0 .0 .0 .0 .0 .0 .0 .0 .0 .0 .0 .0 15 * .0 .0 .0 .0 .0 .0 .0 .0 .0 .0 .0 .0 .0 .0 .0 .0 .0 .0 .0 .0 16 * .1 .1 .1 .1 .1 .0 .0 .1 .2 .2 .0 .0 .0 .0 .0 .0 .0 .0 .0 .0 17 * .1 .0 .0 .0 .0 .2 .2 .0 .0 .0 .0 .0 .0 .0 .0 .2 .2 .0 .0 .0 18 * .0 .0 .0 .0 .0 .2 .2 .0 .0 .0 .1 .0 .0 .0 .0 .2 .2 .0 .0 .0 19 * .0 .0 .0 .0 .0 .0 .0 .0 .0 .0 .0 .0 .0 .0 .0 .0 .0 .0 .0 .0 20 * .0 .0 .0 .0 .0 .0 .0 .0 .0 .0 .0 .0 .0 .0 .0 .0 .0 .0 .0 .0 21 * .0 .0 .0 .0 .0 .0 .0 .0 .0 .0 .0 .0 .0 .0 .0 .0 .0 .0 .0 .0 22 * .0 .0 .0 .0 .0 .0 .0 .0 .0 .0 .0 .0 .0 .0 .0 .0 .0 .0 .0 .0 23 * .0 .0 .0 .0 .0 .0 .0 .0 .0 .0 .0 .0 .0 .0 .0 .0 .0 .0 .0 .0 24 * .0 .0 .0 .0 .0 .0 .0 .0 .0 .0 .0 .0 .0 .0 .0 .0 .0 .0 .0 .0 25 * .3 .5 .5 .4 .3 .0 .0 .6 .6 .6 .3 .4 .4 .3 .2 .0 .0 .4 .4 .3 26 * .1 .2 .2 .2 .1 .0 .0 .3 .2 .2 .1 .2 .2 .1 .1 .0 .0 .2 .2 .2 27 * .3 .5 .6 .4 .3 .0 .0 .7 .7 .7 .3 .3 .3 .3 .2 .0 .0 .3 .3 .3 28 * .1 .2 .2 .2 .1 .0 .0 .3 .3 .3 .1 .1 .2 .1 .1 .0 .0 .1 .1 .2 29 * .2 .5 .6 .5 .3 .0 .0 .9 .9 .9 .3 .3 .3 .2 .2 .0 .0 .3
Page 6
sh7pgbv2.out .3 .2 30 * .1 .2 .2 .2 .2 .0 .0 .5 .5 .4 .1 .1 .2 .1 .1 .0 .0 .1 .1 .1 31 * .3 .1 .0 .0 .0 .2 .3 .0 .0 .0 .0 .0 .0 .0 .0 .2 .2 .0 .0 .0 32 * .4 .1 .1 .0 .0 .2 .3 .0 .0 .0 .0 .0 .0 .0 .0 .2 .2 .0 .0 .0 33 * .7 .4 .3 .0 .0 .3 .4 .0 .0 .0 .0 .0 .0 .0 .0 .2 .2 .0 .0 .0 34 * .0 .0 .0 .0 .0 .0 .0 .0 .0 .0 .0 .0 .0 .0 .0 .0 .0 .0 .0 .0 35 * .0 .0 .0 .0 .0 .0 .0 .0 .0 .0 .0 .0 .0 .0 .0 .0 .0 .0 .0 .0 36 * .3 .3 .4 .3 .3 .0 .0 .4 .4 .4 .3 .4 .4 .4 .3 .0 .0 .5 .5 .4 37 * .3 .4 .4 .3 .3 .0 .0 .5 .5 .4 .3 .4 .4 .3 .3 .0 .0 .5 .5 .4 38 * .2 .4 .6 .6 .6 .4 .4 .0 .0 .0 .0 .0 .0 .0 .0 .1 .0 .0 .0 .3 39 * .0 .1 .2 .0 .0 .0 .0 .0 .0 .0 .0 .0 .0 .0 .0 .0 .0 .0 .0 .0 40 * .0 .1 .1 .4 .4 .3 .3 .0 .0 .0 .0 .0 .0 .0 .0 .0 .0 .0 .0 .3 41 * .0 .0 .0 .0 .0 .0 .0 .0 .0 .0 .1 .2 .4 .4 .4 .2 .2 .0 .0 .0 42 * .0 .0 .0 .0 .0 .0 .0 .0 .0 .0 .1 .1 .2 .2 .2 .4 .3 .0 .0 .0 43 * .0 .0 .0 .0 .0 .0 .0 .0 .0 .0 .0 .0 .0 .2 .4 .5 .4 .0 .0 .0 44 * .1 .2 .3 .3 .3 .5 .5 .0 .0 .0 .1 .0 .0 .0 .0 .0 .0 .0 .0 .3 45 * .0 .0 .0 .0 .0 .0 .0 .0 .0 .0 .1 .1 .1 .1 .1 .0 .0 .1 .1 .0� PAGE 8 JOB: I25SH7withPkgStationPackageB RUN: I25SH7withPkgStationPackageB
* CO/LINK (PPM) * ANGLE (DEGREES) * REC1 REC2 REC3 REC4 REC5 REC6 REC7 REC8 REC9 REC10 REC11 REC12 REC13 REC14 REC15 REC16 REC17 REC18REC19 REC20 LINK # * 110 100 110 110 120 230 240 110 110 110 70 70 60 60 60 320 290 60 60 340 -------*------------------------------------------------------------------------------------------------------------------------ 46 * .0 .0 .0 .0 .0 .0 .0 .0 .0 .0 .0 .0 .0 .0 .0 .0 .0 .0 .0 .0 47 * .1 .1 .1 .1 .1 .0 .0 .1 .1 .1 .0 .0 .0 .0 .0 .0 .0 .0 .0 .0� PAGE 9 JOB: I25SH7withPkgStationPackageB RUN: I25SH7withPkgStationPackageB
DATE : 11/22/10 TIME : 12:39:30
RECEPTOR - LINK MATRIX FOR THE ANGLE PRODUCING THE MAXIMUM CONCENTRATION FOR EACH RECEPTOR
* CO/LINK (PPM) * ANGLE (DEGREES) * REC21 REC22 REC23 REC24 REC25 REC26 REC27 REC28 REC29 REC30 REC31 REC32 REC33 REC34 REC35 REC36 REC37 REC38REC39 REC40 LINK # * 280 290 290 30 10 310 290 290 280 280 250 250 260 250 210 150 120 110 250 260 -------*------------------------------------------------------------------------------------------------------------------------ 1 * .1 .0 .0 .0 .0 .0 .0 .0 .0 .0 .0 .0 .1 .0 .0 .0 .0 .0 .0 .1 2 * .1 .0 .0 .0 .0 .0 .0 .0 .0 .0 .0 .0 .0 .0 .0 .0 .0 .0 .0 .1 3 * .1 .0 .0 .0 .0 .0 .0 .0 .0 .0 .0 .0 .1 .0 .0 .0 .0 .0 .0 .1 4 * .1 .0 .0 .0 .0 .0 .0 .0 .0 .0 .0 .0 .1 .0 .0 .0 .0 .0 .0 .1 5 * .1 .0 .0 .0 .0 .0 .0 .0 .0 .0 .0 .0 .1 .0 .0 .0 .0 .0 .0 .1 6 * .1 .0 .0 .0 .0 .0 .0 .0 .0 .0 .0 .0 .1 .0 .0 .0 .0 .0
Page 7

sh7pgbv2.out .0 .1 7 * .5 .6 .6 .1 .2 .3 .5 .8 .7 .6 .4 .5 .4 .4 .2 .0 .0 .0 .5 .4 8 * .0 .1 .1 .0 .0 .1 .1 .2 .2 .1 .1 .1 .1 .1 .1 .0 .0 .0 .1 .0 9 * .6 .6 .6 .1 .2 .4 .5 .9 .8 .7 .4 .4 .4 .3 .2 .0 .0 .0 .4 .3 10 * .1 .2 .2 .0 .0 .1 .2 .3 .2 .2 .1 .1 .1 .1 .1 .0 .0 .0 .1 .0 11 * .7 .8 .8 .1 .2 .4 .6 1.1 .9 .7 .4 .4 .3 .3 .2 .0 .0 .0 .4 .3 12 * .1 .2 .2 .0 .0 .2 .2 .3 .2 .2 .1 .1 .0 .0 .1 .0 .0 .0 .0 .0 13 * .0 .0 .0 .2 .1 .0 .0 .0 .0 .1 .0 .0 .0 .0 .0 .2 .2 .3 .0 .0 14 * .0 .0 .0 .2 .1 .0 .0 .0 .1 .2 .0 .0 .0 .0 .0 .2 .2 .3 .0 .0 15 * .0 .0 .0 .2 .1 .0 .0 .1 .3 .4 .0 .0 .0 .0 .0 .2 .2 .3 .0 .0 16 * 1.2 1.4 1.4 .3 .3 .6 1.0 1.4 1.0 .7 .4 .4 .2 .2 .3 .0 .0 .0 .3 .1 17 * .0 .0 .0 .0 .0 .0 .0 .0 .0 .0 .0 .0 .0 .0 .0 .0 .0 .0 .0 .0 18 * .0 .0 .0 .0 .0 .0 .0 .0 .0 .0 .0 .0 .0 .0 .0 .0 .0 .0 .0 .0 19 * .0 .0 .0 .2 .1 .0 .0 .0 .0 .0 .2 .1 .0 .0 .0 .2 .3 .5 .0 .0 20 * .0 .0 .0 .0 .0 .0 .0 .0 .0 .0 .0 .0 .0 .0 .0 .0 .0 .1 .0 .0 21 * .0 .0 .0 .2 .1 .0 .0 .0 .0 .0 .4 .3 .0 .0 .1 .2 .4 .6 .0 .0 22 * .0 .0 .0 .0 .0 .0 .0 .0 .0 .0 .1 .0 .0 .0 .0 .0 .0 .1 .0 .0 23 * .0 .0 .0 .2 .1 .0 .0 .0 .0 .0 .7 .5 .2 .0 .1 .2 .4 .6 .0 .0 24 * .0 .0 .0 .0 .0 .0 .0 .0 .0 .0 .1 .1 .0 .0 .0 .0 .1 .1 .0 .0 25 * .2 .3 .3 .0 .1 .2 .3 .4 .3 .3 .3 .4 .5 .4 .2 .0 .0 .0 .6 .5 26 * .0 .0 .0 .0 .0 .0 .0 .0 .0 .0 .0 .0 .0 .0 .0 .0 .0 .0 .0 .0 27 * .2 .3 .3 .0 .1 .2 .3 .3 .3 .3 .3 .4 .6 .4 .2 .0 .0 .0 .7 .7 28 * .0 .0 .0 .0 .0 .0 .0 .0 .0 .0 .0 .0 .0 .0 .0 .0 .0 .0 .0 .0 29 * .2 .3 .3 .0 .1 .2 .2 .3 .2 .3 .2 .4 .8 .5 .2 .1 .0 .3 .9 .9 30 * .0 .0 .0 .0 .0 .0 .0 .0 .0 .0 .0 .0 .0 .0 .0 .0 .0 .0 .0 .0 31 * .1 .0 .0 .0 .0 .0 .0 .0 .0 .0 .0 .0 .0 .0 .0 .0 .0 .0 .0 .0 32 * .1 .0 .0 .0 .0 .0 .0 .0 .0 .0 .0 .0 .0 .0 .0 .0 .0 .0 .0 .0 33 * .1 .0 .0 .0 .0 .0 .0 .0 .0 .0 .0 .0 .0 .0 .0 .0 .0 .0 .0 .0 34 * .0 .0 .0 .2 .1 .0 .0 .0 .0 .0 .0 .0 .0 .0 .0 .1 .2 .2 .0 .0 35 * .0 .0 .0 .2 .1 .0 .0 .0 .0 .0 .1 .0 .0 .0 .0 .2 .2 .3 .0 .0 36 * .2 .1 .1 .0 .0 .0 .1 .1 .1 .1 .0 .1 .1 .1 .0 .0 .0 .0 .1 .2 37 * .2 .1 .1 .0 .0 .0 .1 .1 .1 .1 .0 .0 .1 .1 .0 .0 .0 .0 .1 .2 38 * .0 .1 .1 .0 .0 .1 .1 .1 .0 .0 .0 .0 .0 .0 .0 .0 .0 .0 .0 .0 39 * .0 .0 .0 .0 .0 .0 .0 .0 .0 .0 .0 .0 .0 .0 .0 .0 .0 .0 .0 .0 40 * .0 .0 .0 .0 .0 .1 .0 .0 .0 .0 .0 .0 .0 .0 .0 .0 .0 .0 .0 .0 41 * .0 .0 .0 .0 .0 .0 .0 .0 .0 .0 .0 .0 .0 .0 .0 .0 .0 .0 .0 .0 42 * .0 .0 .0 .0 .0 .0 .0 .0 .0 .0 .0 .0 .0 .0 .0 .0 .0 .0 .0 .0 43 * .0 .0 .0 .0 .0 .0 .0 .0 .0 .0 .0 .0 .0 .0 .0 .0 .0 .0 .0 .0 44 * .0 .0 .0 .0 .0 .0 .0 .0 .0 .0 .0 .0 .0 .0 .0 .0 .0 .0 .0 .0 45 * .0 .0 .0 .1 .4 .0 .0 .0 .0 .0 .2 .3 .5 .5 .5 .9 .7 .7 .0 .0� PAGE 10
Page 8

sh7pgbv2.out JOB: I25SH7withPkgStationPackageB RUN: I25SH7withPkgStationPackageB
* CO/LINK (PPM) * ANGLE (DEGREES) * REC21 REC22 REC23 REC24 REC25 REC26 REC27 REC28 REC29 REC30 REC31 REC32 REC33 REC34 REC35 REC36 REC37 REC38REC39 REC40 LINK # * 280 290 290 30 10 310 290 290 280 280 250 250 260 250 210 150 120 110 250 260 -------*------------------------------------------------------------------------------------------------------------------------ 46 * .0 .0 .0 .1 .2 .0 .0 .0 .0 .0 .1 .2 1.0 1.5 1.2 .9 1.1 .4 .0 .0 47 * .0 .0 .0 1.7 1.4 1.5 1.4 1.4 .8 .5 .1 .1 .0 .0 .2 .1 .0 .0 .0 .0
Page 9

sh7pmph1.in'I25SH7withparkinglotPMphaseI', 60 , 175 , 0 , 0 , 56 , 0.3048 , 1 , 1 'Receptor 1', 4476 , 2514 , 5 'Receptor 2', 4516 , 2514 , 5 'Receptor 3', 4556 , 2514 , 5 'Receptor 4', 4596 , 2514 , 5 'Receptor 5', 4596 , 2474 , 5 'Receptor 6', 4596 , 2434 , 5 'Receptor 7', 4596 , 2394 , 5 'Receptor 8', 4684 , 2394 , 5 'Receptor 9', 4684 , 2434 , 5 'Receptor 10', 4684 , 2474 , 5 'Receptor 11', 4684 , 2514 , 5 'Receptor 12', 4724 , 2514 , 5 'Receptor 13', 4764 , 2514 , 5 'Receptor 14', 4804 , 2514 , 5 'Receptor 15', 5529 , 2514 , 5 'Receptor 16', 5569 , 2514 , 5 'Receptor 17', 5609 , 2514 , 5 'Receptor 18', 5649 , 2514 , 5 'Receptor 19', 5680 , 2474 , 5 'Receptor 20', 5712 , 2434 , 5 'Receptor 21', 5748 , 2394 , 5 'Receptor 22', 5816 , 2394 , 5 'Receptor 23', 5787 , 2434 , 5 'Receptor 24', 5748 , 2474 , 5 'Receptor 25', 5716 , 2514 , 5 'Receptor 26', 5756 , 2514 , 5 'Receptor 27', 5796 , 2514 , 5 'Receptor 28', 5836 , 2514 , 5 'Receptor 29', 5760 , 2673 , 5 'Receptor 30', 5720 , 2673 , 5 'Receptor 31', 5680 , 2673 , 5 'Receptor 32', 5640 , 2673 , 5 'Receptor 33', 5631 , 2713 , 5 'Receptor 34', 5622 , 2753 , 5 'Receptor 35', 5614 , 2793 , 5 'Receptor 36', 5535 , 2801 , 5 'Receptor 37', 5542 , 2761 , 5 'Receptor 38', 5550 , 2721 , 5 'Receptor 39', 5560 , 2681 , 5 'Receptor 40', 5520 , 2681 , 5 'Receptor 41', 5480 , 2681 , 5 'Receptor 42', 5440 , 2681 , 5 'Receptor 43', 4813 , 2681 , 5 'Receptor 44', 4773 , 2681 , 5 'Receptor 45', 4733 , 2681 , 5 'Receptor 46', 4693 , 2681 , 5 'Receptor 47', 4693 , 2721 , 5 'Receptor 48', 4693 , 2761 , 5 'Receptor 49', 4693 , 2801 , 5 'Receptor 50', 4581 , 2801 , 5 'Receptor 51', 4581 , 2761 , 5 'Receptor 52', 4581 , 2721 , 5 'Receptor 53', 4581 , 2681 , 5 'Receptor 54', 4541 , 2681 , 5 'Receptor 55', 4501 , 2681 , 5 'Receptor 56', 4461 , 2681 , 5 'I25SH7withparkinglotPMphaseI', 33 , 1 , 1 ,'CO' 1 'sh7ebapp1-1','AG', 4131 , 2570 , 4640 , 2570 , 1333 , 22.8 , 0 , 44 2 'sh7ebapp1-1 que','AG', 4591 , 2570 , 4131 , 2570 , 0 , 24 , 2 110 , 51 , 2 , 1088 , 143.34 , 1600 , 1 , 3 1 'sh7ebapp2-1','AG', 4131 , 2546 , 4640 , 2546 , 1333 , 22.8 , 0 , 44 2 'sh7ebapp2-1 que','AG', 4591 , 2546 , 4131 , 2546 , 0 , 24 , 2 110 , 51 , 2 , 1088 , 143.34 , 1600 , 1 , 3 1 'sh7ebapp/dep1-1','AG', 4640 , 2570 , 5623 , 2570 , 1520 , 22.8 , 0 , 44 2 'sh7ebapp/dep1-1 que','AG', 5601 , 2570 , 4683 , 2570 , 0 , 24 , 2 110 , 48 , 2 , 1040 , 143.34 , 1600 , 1 , 3 1 'sh7ebapp/dep2-1','AG', 4640 , 2546 , 5623 , 2546 , 1520 , 22.8 , 0 , 44 2 'sh7ebapp/dep2-1 que','AG', 5601 , 2546 , 4683 , 2546 , 0 , 24 , 2 110 , 48 , 2 , 1040 , 143.34 , 1600 , 1 , 3 1 'sh7ebdep1-1','AG', 5623 , 2570 , 6132 , 2570 , 1455 , 22.8 , 0 , 56 1
Page 1

sh7pmph1.in'sh7ebdep2-1','AG', 5623 , 2546 , 6132 , 2546 , 1455 , 22.8 , 0 , 32 2 'sh7ebleftturn','AG', 4591 , 2595 , 4391 , 2595 , 0 , 24 , 2 110 , 91 , 2 , 325 , 143.34 , 1600 , 1 , 3 1 'sh7wbapp1-1','AG', 6132 , 2635 , 5623 , 2635 , 1765 , 22.1 , 0 , 56 2 'sh7wbapp1-1 que','AG', 5645 , 2635 , 6132 , 2635 , 0 , 36 , 3 110 , 48 , 2 , 1765 , 143.34 , 1600 , 1 , 3 1 'sh7wbapp/dep1-1','AG', 5623 , 2625 , 4640 , 2625 , 930 , 22.1 , 0 , 44 2 'sh7wbapp/dep1-1 que','AG', 4683 , 2625 , 5577 , 2625 , 0 , 24 , 2 110 , 57 , 2 , 608 , 143.34 , 1600 , 1 , 3 1 'sh7wbapp/dep2-1','AG', 5623 , 2649 , 4640 , 2649 , 930 , 22.1 , 0 , 44 2 'sh7wbapp/dep2-1 que','AG', 4683 , 2649 , 5577 , 2649 , 0 , 24 , 2 110 , 57 , 2 , 608 , 143.34 , 1600 , 1 , 3 1 'sh7wbdep1-1','AG', 4640 , 2625 , 4131 , 2625 , 845 , 22.1 , 0 , 44 1 'sh7wbdep2-1','AG', 4640 , 2649 , 4131 , 2649 , 845 , 22.1 , 0 , 44 2 'sh7wbleftturn','AG', 4683 , 2601 , 4883 , 2601 , 0 , 24 , 2 110 , 91 , 2 , 275 , 143.34 , 1600 , 1 , 3 1 'pklotsbapp','AG', 4613 , 3598 , 4613 , 2598 , 890 , 22.6 , 0 , 44 2 'pklotsbapp que','AG', 4613 , 2671 , 4613 , 3598 , 0 , 24 , 2 110 , 72 , 2 , 20 , 143.34 , 1600 , 1 , 3 1 'pklotsbdep','AG', 4622 , 2598 , 4622 , 1598 , 460 , 22.6 , 0 , 32 2 'pklotsbleftturn','AG', 4631 , 2691 , 4631 , 2891 , 0 , 12 , 1 110 , 72 , 2 , 570 , 143.34 , 1600 , 1 , 3 1 'pklotnbapp','AG', 4658 , 1598 , 4658 , 2598 , 490 , 22.5 , 0 , 32 2 'pklotnbapp que','AG', 4658 , 2524 , 4658 , 1598 , 0 , 12 , 1 110 , 90 , 2 , 20 , 143.34 , 1600 , 1 , 3 1 'pklotnbdep','AG', 4661 , 2598 , 4661 , 3598 , 715 , 22.5 , 0 , 44 2 'pklotnbleftturn','AG', 4646 , 2524 , 4646 , 2324 , 0 , 12 , 1 110 , 86 , 2 , 175 , 143.34 , 1600 , 1 , 3 1 'i25sbrampapp1','AG', 5896.9 , 3596.9 , 5540.1 , 2935.4 , 971 , 22.6 , 0 , 44 1 'i25sbrampapp2','AG', 5540.1 , 2935.4 , 5612 , 2598 , 971 , 22.6 , 0 , 44 1 'i25sbrampdep1','AG', 5612 , 2598 , 5799.6 , 2374.3 , 961 , 22.6 , 0 , 44 1 'i25sbrampdep2','AG', 5799.6 , 2374.3 , 5681.8 , 1596.9 , 961 , 22.6 , 0 , 44 2 'i25sbrampleftturn','AG', 5609 , 2671 , 5568 , 2891 , 0 , 12 , 1 110 , 63 , 2 , 830 , 143.34 , 1600 , 1 , 3 1 , 0 , 4 , 1000 , 0 ,'Y', 10 , 0 , 36
Page 2

sh7ph1v2.out� CAL3QHC: LINE SOURCE DISPERSION MODEL - VERSION 2.0 Dated 95221 PAGE 1
JOB: I25SH7withparkinglotPMphaseI RUN: I25SH7withparkinglotPMphaseI
DATE : 11/22/10 TIME : 12:40:59
The MODE flag has been set to C for calculating CO averages.
SITE & METEOROLOGICAL VARIABLES ------------------------------- VS = .0 CM/S VD = .0 CM/S Z0 = 175. CM U = 1.0 M/S CLAS = 4 (D) ATIM = 60. MINUTES MIXH = 1000. M AMB = .0 PPM
LINK VARIABLES -------------- LINK DESCRIPTION * LINK COORDINATES (FT) * LENGTH BRG TYPE VPH EF H W V/C QUEUE * X1 Y1 X2 Y2 * (FT) (DEG) (G/MI) (FT) (FT) (VEH) ------------------------*----------------------------------------*---------------------------------------------------------- 1. sh7ebapp1-1 * 4131.0 2570.0 4640.0 2570.0 * 509. 90. AG 1333. 22.8 .0 44.0 2. sh7ebapp1-1 que * 4591.0 2570.0 4439.3 2570.0 * 152. 270. AG 357. 100.0 .0 24.0 .68 7.7 3. sh7ebapp2-1 * 4131.0 2546.0 4640.0 2546.0 * 509. 90. AG 1333. 22.8 .0 44.0 4. sh7ebapp2-1 que * 4591.0 2546.0 4439.3 2546.0 * 152. 270. AG 357. 100.0 .0 24.0 .68 7.7 5. sh7ebapp/dep1-1 * 4640.0 2570.0 5623.0 2570.0 * 983. 90. AG 1520. 22.8 .0 44.0 6. sh7ebapp/dep1-1 que * 5601.0 2570.0 5464.5 2570.0 * 136. 270. AG 336. 100.0 .0 24.0 .62 6.9 7. sh7ebapp/dep2-1 * 4640.0 2546.0 5623.0 2546.0 * 983. 90. AG 1520. 22.8 .0 44.0 8. sh7ebapp/dep2-1 que * 5601.0 2546.0 5464.5 2546.0 * 136. 270. AG 336. 100.0 .0 24.0 .62 6.9 9. sh7ebdep1-1 * 5623.0 2570.0 6132.0 2570.0 * 509. 90. AG 1455. 22.8 .0 56.0 10. sh7ebdep2-1 * 5623.0 2546.0 6132.0 2546.0 * 509. 90. AG 1455. 22.8 .0 32.0 11. sh7ebleftturn * 4591.0 2595.0 4503.0 2595.0 * 88. 270. AG 636. 100.0 .0 24.0 .74 4.5 12. sh7wbapp1-1 * 6132.0 2635.0 5623.0 2635.0 * 509. 270. AG 1765. 22.1 .0 56.0 13. sh7wbapp1-1 que * 5645.0 2635.0 5799.3 2635.0 * 154. 90. AG 503. 100.0 .0 36.0 .70 7.8 14. sh7wbapp/dep1-1 * 5623.0 2625.0 4640.0 2625.0 * 983. 270. AG 930. 22.1 .0 44.0 15. sh7wbapp/dep1-1 que * 4683.0 2625.0 4777.8 2625.0 * 95. 90. AG 398. 100.0 .0 24.0 .43 4.8 16. sh7wbapp/dep2-1 * 5623.0 2649.0 4640.0 2649.0 * 983. 270. AG 930. 22.1 .0 44.0 17. sh7wbapp/dep2-1 que * 4683.0 2649.0 4777.8 2649.0 * 95. 90. AG 398. 100.0 .0 24.0 .43 4.8 18. sh7wbdep1-1 * 4640.0 2625.0 4131.0 2625.0 * 509. 270. AG 845. 22.1 .0 44.0 19. sh7wbdep2-1 * 4640.0 2649.0 4131.0 2649.0 * 509. 270. AG 845. 22.1 .0 44.0 20. sh7wbleftturn * 4683.0 2601.0 4752.2 2601.0 * 69. 90. AG 636. 100.0 .0 24.0 .63 3.5 21. pklotsbapp * 4613.0 3598.0 4613.0 2598.0 * 1000. 180. AG 890. 22.6 .0 44.0 22. pklotsbapp que * 4613.0 2671.0 4613.0 2674.9 * 4. 360. AG 503. 100.0 .0 24.0 .02 .2 23. pklotsbdep * 4622.0 2598.0 4622.0 1598.0 * 1000. 180. AG 460. 22.6 .0 32.0 24. pklotsbleftturn * 4631.0 2691.0 4631.0 3788.2 * 1097. 360. AG 252. 100.0 .0 12.0 1.15 55.7 25. pklotnbapp * 4658.0 1598.0 4658.0 2598.0 * 1000. 360. AG 490. 22.5 .0 32.0 26. pklotnbapp que * 4658.0 2524.0 4658.0 2514.2 * 10. 180. AG 315. 100.0 .0 12.0 .09 .5 27. pklotnbdep * 4661.0 2598.0 4661.0 3598.0 * 1000. 360. AG 715. 22.5 .0 44.0 28. pklotnbleftturn * 4646.0 2524.0 4646.0 2441.7 * 82. 180. AG 301. 100.0 .0 12.0 .60 4.2 29. i25sbrampapp1 * 5896.9 3596.9 5540.1 2935.4 * 752. 208. AG 971. 22.6 .0 44.0 30. i25sbrampapp2 * 5540.1 2935.4 5612.0 2598.0 * 345. 168. AG 971. 22.6 .0 44.0 31. i25sbrampdep1 * 5612.0 2598.0 5799.6 2374.3 * 292. 140. AG 961. 22.6 .0 44.0 32. i25sbrampdep2 * 5799.6 2374.3 5681.8 1596.9 * 786. 189. AG 961. 22.6 .0 44.0 33. i25sbrampleftturn * 5609.0 2671.0 5157.3 5094.5 * 2465. 349. AG 220. 100.0 .0 12.0 1.33 125.2� PAGE 2 JOB: I25SH7withparkinglotPMphaseI RUN: I25SH7withparkinglotPMphaseI
DATE : 11/22/10 TIME : 12:40:59
ADDITIONAL QUEUE LINK PARAMETERS -------------------------------- LINK DESCRIPTION * CYCLE RED CLEARANCE APPROACH SATURATION IDLE SIGNAL ARRIVAL * LENGTH TIME LOST TIME VOL FLOW RATE EM FAC TYPE RATE
Page 1

sh7ph1v2.out * (SEC) (SEC) (SEC) (VPH) (VPH) (gm/hr) ------------------------*-------------------------------------------------------------------------------- 2. sh7ebapp1-1 que * 110 51 2.0 1088 1600 143.34 1 3 4. sh7ebapp2-1 que * 110 51 2.0 1088 1600 143.34 1 3 6. sh7ebapp/dep1-1 que * 110 48 2.0 1040 1600 143.34 1 3 8. sh7ebapp/dep2-1 que * 110 48 2.0 1040 1600 143.34 1 3 11. sh7ebleftturn * 110 91 2.0 325 1600 143.34 1 3 13. sh7wbapp1-1 que * 110 48 2.0 1765 1600 143.34 1 3 15. sh7wbapp/dep1-1 que * 110 57 2.0 608 1600 143.34 1 3 17. sh7wbapp/dep2-1 que * 110 57 2.0 608 1600 143.34 1 3 20. sh7wbleftturn * 110 91 2.0 275 1600 143.34 1 3 22. pklotsbapp que * 110 72 2.0 20 1600 143.34 1 3 24. pklotsbleftturn * 110 72 2.0 570 1600 143.34 1 3 26. pklotnbapp que * 110 90 2.0 20 1600 143.34 1 3 28. pklotnbleftturn * 110 86 2.0 175 1600 143.34 1 3 33. i25sbrampleftturn * 110 63 2.0 830 1600 143.34 1 3
RECEPTOR LOCATIONS ------------------ * COORDINATES (FT) * RECEPTOR * X Y Z * -------------------------*-------------------------------------* 1. Receptor 1 * 4476.0 2514.0 5.0 * 2. Receptor 2 * 4516.0 2514.0 5.0 * 3. Receptor 3 * 4556.0 2514.0 5.0 * 4. Receptor 4 * 4596.0 2514.0 5.0 * 5. Receptor 5 * 4596.0 2474.0 5.0 * 6. Receptor 6 * 4596.0 2434.0 5.0 * 7. Receptor 7 * 4596.0 2394.0 5.0 * 8. Receptor 8 * 4684.0 2394.0 5.0 * 9. Receptor 9 * 4684.0 2434.0 5.0 * 10. Receptor 10 * 4684.0 2474.0 5.0 * 11. Receptor 11 * 4684.0 2514.0 5.0 * 12. Receptor 12 * 4724.0 2514.0 5.0 * 13. Receptor 13 * 4764.0 2514.0 5.0 * 14. Receptor 14 * 4804.0 2514.0 5.0 * 15. Receptor 15 * 5529.0 2514.0 5.0 * 16. Receptor 16 * 5569.0 2514.0 5.0 * 17. Receptor 17 * 5609.0 2514.0 5.0 * 18. Receptor 18 * 5649.0 2514.0 5.0 * 19. Receptor 19 * 5680.0 2474.0 5.0 * 20. Receptor 20 * 5712.0 2434.0 5.0 * 21. Receptor 21 * 5748.0 2394.0 5.0 * 22. Receptor 22 * 5816.0 2394.0 5.0 * 23. Receptor 23 * 5787.0 2434.0 5.0 * 24. Receptor 24 * 5748.0 2474.0 5.0 * 25. Receptor 25 * 5716.0 2514.0 5.0 * 26. Receptor 26 * 5756.0 2514.0 5.0 * 27. Receptor 27 * 5796.0 2514.0 5.0 * 28. Receptor 28 * 5836.0 2514.0 5.0 * 29. Receptor 29 * 5760.0 2673.0 5.0 * 30. Receptor 30 * 5720.0 2673.0 5.0 * 31. Receptor 31 * 5680.0 2673.0 5.0 *� PAGE 3 JOB: I25SH7withparkinglotPMphaseI RUN: I25SH7withparkinglotPMphaseI
DATE : 11/22/10 TIME : 12:40:59
RECEPTOR LOCATIONS ------------------ * COORDINATES (FT) * RECEPTOR * X Y Z * -------------------------*-------------------------------------* 32. Receptor 32 * 5640.0 2673.0 5.0 * 33. Receptor 33 * 5631.0 2713.0 5.0 * 34. Receptor 34 * 5622.0 2753.0 5.0 * 35. Receptor 35 * 5614.0 2793.0 5.0 * 36. Receptor 36 * 5535.0 2801.0 5.0 * 37. Receptor 37 * 5542.0 2761.0 5.0 * 38. Receptor 38 * 5550.0 2721.0 5.0 * 39. Receptor 39 * 5560.0 2681.0 5.0 * 40. Receptor 40 * 5520.0 2681.0 5.0 * 41. Receptor 41 * 5480.0 2681.0 5.0 * 42. Receptor 42 * 5440.0 2681.0 5.0 * 43. Receptor 43 * 4813.0 2681.0 5.0 * 44. Receptor 44 * 4773.0 2681.0 5.0 * 45. Receptor 45 * 4733.0 2681.0 5.0 * 46. Receptor 46 * 4693.0 2681.0 5.0 *
Page 2

sh7ph1v2.out 47. Receptor 47 * 4693.0 2721.0 5.0 * 48. Receptor 48 * 4693.0 2761.0 5.0 * 49. Receptor 49 * 4693.0 2801.0 5.0 * 50. Receptor 50 * 4581.0 2801.0 5.0 * 51. Receptor 51 * 4581.0 2761.0 5.0 * 52. Receptor 52 * 4581.0 2721.0 5.0 * 53. Receptor 53 * 4581.0 2681.0 5.0 * 54. Receptor 54 * 4541.0 2681.0 5.0 * 55. Receptor 55 * 4501.0 2681.0 5.0 * 56. Receptor 56 * 4461.0 2681.0 5.0 *� PAGE 4 JOB: I25SH7withparkinglotPMphaseI RUN: I25SH7withparkinglotPMphaseI
MODEL RESULTS -------------
REMARKS : In search of the angle corresponding to the maximum concentration, only the first angle, of the angles with same maximum concentrations, is indicated as maximum.
WIND ANGLE RANGE: 0.-360.
WIND * CONCENTRATION ANGLE * (PPM) (DEGR)* REC1 REC2 REC3 REC4 REC5 REC6 REC7 REC8 REC9 REC10 REC11 REC12 REC13 REC14 REC15 REC16 REC17 REC18 REC19 REC20 ------*------------------------------------------------------------------------------------------------------------------------ 0. * 3.6 4.3 4.7 3.9 3.1 2.4 2.0 2.2 2.4 3.3 4.1 4.1 3.2 2.7 4.2 4.3 4.0 3.7 2.9 2.6 10. * 4.1 4.7 4.9 4.0 3.1 2.7 2.8 1.9 2.4 2.9 3.8 3.7 2.6 2.2 4.3 4.4 3.6 3.7 2.6 2.3 20. * 4.6 4.9 4.5 3.0 2.7 2.6 2.4 1.6 2.1 2.6 3.8 3.2 2.5 2.3 4.3 4.2 3.2 3.5 2.5 2.1 30. * 4.7 4.9 4.3 3.3 3.1 2.8 2.5 1.5 1.7 2.2 3.4 2.8 2.3 2.3 4.1 4.0 3.1 3.5 2.3 1.9 40. * 4.9 4.6 4.0 3.6 3.2 2.7 2.4 1.2 1.4 1.9 3.3 2.8 2.6 2.6 4.3 4.1 3.2 3.5 2.4 1.9 50. * 5.0 4.6 4.1 4.0 3.2 2.6 2.1 1.4 1.5 1.9 3.2 2.8 2.8 2.8 4.4 3.9 3.4 3.6 2.5 1.9 60. * 5.1 4.9 4.2 4.2 3.3 2.5 1.8 1.2 1.4 1.9 3.1 3.0 2.9 3.0 4.3 3.8 3.4 3.5 2.3 1.8 70. * 4.8 4.2 4.0 3.9 2.9 2.3 1.7 1.2 1.5 2.0 3.0 3.0 3.0 3.2 4.0 3.4 3.3 3.4 2.0 1.5 80. * 4.1 3.9 3.7 4.1 2.8 2.1 1.6 1.0 1.2 1.8 3.2 3.2 3.2 3.2 3.1 2.8 2.7 2.9 1.5 1.1 90. * 2.9 2.8 2.6 3.1 2.1 1.4 .9 .5 .7 1.2 2.2 2.2 2.2 2.1 1.9 1.9 1.9 2.0 1.0 .8 100. * 1.1 1.1 1.2 1.7 1.1 .6 .5 .0 .1 .2 .7 .7 .7 .7 .9 .9 1.0 1.4 .9 .8 110. * .5 .5 .7 1.0 .8 .6 .6 .1 .1 .1 .3 .3 .2 .2 .3 .4 .6 1.0 .9 .9 120. * .3 .3 .5 .9 .7 .5 .5 .0 .0 .1 .1 .1 .1 .1 .3 .3 .5 1.0 1.0 .8 130. * .2 .3 .4 .9 .7 .5 .5 .0 .0 .0 .0 .0 .0 .0 .2 .2 .4 1.0 .8 .8 140. * .2 .2 .5 .9 .7 .6 .6 .0 .0 .0 .0 .0 .0 .0 .2 .2 .3 .8 .7 .6 150. * .2 .3 .4 .8 .6 .6 .6 .0 .0 .0 .0 .0 .0 .0 .2 .2 .2 .5 .5 .4 160. * .2 .3 .4 .9 .8 .7 .7 .0 .0 .1 .1 .0 .0 .0 .2 .2 .2 .3 .4 .5 170. * .2 .2 .3 .7 .7 .7 .7 .2 .2 .2 .2 .0 .0 .0 .1 .1 .2 .3 .3 .4 180. * .0 .1 .2 .4 .4 .4 .4 .4 .5 .5 .5 .2 .1 .0 .0 .1 .1 .1 .2 .3 190. * .0 .0 .0 .3 .2 .2 .2 .7 .7 .7 .8 .3 .2 .2 .0 .0 .0 .0 .1 .1 200. * .0 .0 .0 .0 .0 .0 .0 .7 .7 .7 .9 .4 .3 .2 .0 .0 .0 .0 .0 .0 210. * .0 .0 .0 .0 .0 .0 .0 .6 .6 .7 .9 .4 .3 .2 .0 .0 .0 .0 .0 .0 220. * .0 .0 .0 .0 .0 .0 .0 .6 .6 .8 1.1 .4 .3 .2 .0 .0 .0 .0 .0 .0 230. * .0 .0 .0 .0 .0 .0 .0 .6 .6 .9 1.1 .5 .3 .2 .0 .0 .0 .0 .0 .0 240. * .0 .0 .0 .0 .0 .0 .0 .5 .5 .9 1.0 .6 .3 .3 .0 .0 .0 .0 .0 .0
Page 3
sh7ph1v2.out 250. * .1 .1 .1 .1 .0 .0 .0 .5 .5 .9 1.2 .7 .6 .5 .2 .2 .2 .1 .0 .0 260. * .4 .4 .5 .6 .1 .0 .0 .5 .5 1.1 1.8 1.3 1.2 .9 .7 .8 .8 .8 .2 .1 270. * 1.0 1.2 1.3 1.7 .3 .1 .0 .5 .8 1.6 3.0 2.6 2.4 2.2 2.2 2.3 2.5 2.5 1.2 .7 280. * 1.8 2.3 2.6 2.8 1.0 .4 .2 .8 1.4 2.3 4.3 3.6 3.3 3.3 3.3 3.6 3.9 3.8 2.1 1.4 290. * 2.3 3.0 3.5 3.9 1.8 1.0 .5 1.3 2.0 3.0 4.8 4.1 3.8 3.7 3.6 4.0 4.3 4.2 2.4 1.8 300. * 2.7 3.5 3.9 4.3 2.1 1.4 .9 1.7 2.7 3.4 4.3 3.6 3.7 3.7 4.0 4.3 4.4 4.0 2.9 2.1 310. * 2.9 3.6 3.9 4.3 2.5 1.7 1.1 2.2 3.1 3.5 3.9 3.4 3.4 3.9 3.8 4.2 4.2 3.6 2.5 2.0 320. * 3.1 3.6 4.0 4.3 2.7 1.9 1.4 2.3 3.1 3.2 3.2 3.1 3.7 3.9 3.7 3.9 3.8 3.4 2.5 2.2 330. * 3.2 3.6 4.0 4.1 2.7 2.2 1.5 2.4 2.6 3.0 3.4 3.4 3.9 3.8 3.5 3.6 3.4 3.5 2.9 2.6 340. * 3.2 3.6 4.1 3.8 2.6 2.2 1.7 2.4 2.6 3.0 3.4 3.8 4.3 3.6 3.7 3.7 3.7 4.2 3.1 2.9 350. * 3.3 3.8 4.4 4.0 2.9 2.3 2.0 2.8 2.9 3.3 4.0 4.5 3.9 3.2 3.9 4.2 3.9 3.9 3.1 2.7 360. * 3.6 4.3 4.7 3.9 3.1 2.4 2.0 2.2 2.4 3.3 4.1 4.1 3.2 2.7 4.2 4.3 4.0 3.7 2.9 2.6 ------*------------------------------------------------------------------------------------------------------------------------ MAX * 5.1 4.9 4.9 4.3 3.3 2.8 2.8 2.8 3.1 3.5 4.8 4.5 4.3 3.9 4.4 4.4 4.4 4.2 3.1 2.9 DEGR. * 60 20 10 300 60 30 10 350 310 310 290 350 340 320 50 10 300 340 340 340
� PAGE 5 JOB: I25SH7withparkinglotPMphaseI RUN: I25SH7withparkinglotPMphaseI
MODEL RESULTS -------------
REMARKS : In search of the angle corresponding to the maximum concentration, only the first angle, of the angles with same maximum concentrations, is indicated as maximum.
WIND ANGLE RANGE: 0.-360.
WIND * CONCENTRATION ANGLE * (PPM) (DEGR)* REC21 REC22 REC23 REC24 REC25 REC26 REC27 REC28 REC29 REC30 REC31 REC32 REC33 REC34 REC35 REC36 REC37 REC38 REC39 REC40 ------*------------------------------------------------------------------------------------------------------------------------ 0. * 2.2 1.2 1.5 2.1 2.9 2.7 2.5 2.3 .1 .3 .3 .5 .5 .6 .5 1.2 1.3 1.3 1.4 .6 10. * 2.0 1.0 1.3 1.8 2.8 2.6 2.3 2.1 .1 .1 .1 .2 .3 .3 .4 1.5 1.4 1.5 1.5 .8 20. * 1.7 .9 1.1 1.6 2.6 2.4 2.2 2.1 .0 .0 .1 .1 .1 .2 .2 1.5 1.4 1.4 1.4 .9 30. * 1.6 .9 1.2 1.5 2.6 2.3 2.2 2.2 .0 .0 .0 .0 .0 .1 .1 1.4 1.3 1.2 1.2 .8 40. * 1.7 1.0 1.2 1.5 2.5 2.3 2.3 2.2 .0 .0 .0 .0 .0 .0 .0 1.1 1.0 1.0 1.0 .6 50. * 1.6 .8 1.1 1.6 2.6 2.5 2.5 2.4 .0 .0 .0 .0 .0 .0 .0 .9 .9 .9 .9 .6 60. * 1.5 .6 1.0 1.6 2.6 2.5 2.5 2.5 .0 .0 .0 .0 .0 .0 .0 .9 .9 .9 .9 .6 70. * 1.1 .2 .6 1.3 2.5 2.5 2.4 2.2 .1 .1 .1 .1 .0 .0 .0 .9 .9 .9 1.0 .7 80. * .9 .0 .2 .8 1.9 1.9 1.8 1.6 .4 .4 .5 .5 .1 .0 .0 .9 .9 1.0 1.3 1.1 90. * .7 .0 .0 .3 1.2 1.2 .9 .9 1.0 1.1 1.5 1.6 .4 .1 .0 1.0 1.0 1.4 2.2 1.9 100. * .7 .0 .0 .1 .4 .4 .4 .3 1.8 2.2 2.6 2.8 1.1 .5 .2 1.2 1.5 2.1 3.2 2.9 110. * .8 .0 .0 .1 .2 .1 .1 .1 2.4 3.1 3.4 3.6 1.7 .9 .5 1.8 2.0 2.6 3.7 3.4 120. * .8 .0 .0 .1 .1 .0 .0 .0 2.7 3.3 3.7 3.8 2.1 1.4 1.1 2.1 2.6 3.0 3.5 3.2 130. * .8 .0 .1 .3 .3 .0 .0 .0 2.9 3.4 3.7 3.7 2.3 1.8 1.3 2.3 2.7 2.9 3.5 3.0
Page 4

sh7ph1v2.out 140. * .7 .0 .3 .6 .7 .0 .0 .0 3.0 3.4 3.4 3.4 2.3 1.9 1.4 2.4 2.6 2.8 3.2 3.0 150. * .6 .0 .5 .9 1.0 .2 .0 .0 3.1 3.3 3.5 3.5 2.4 1.8 1.5 2.5 2.3 2.5 3.1 2.8 160. * .6 .2 .8 1.2 1.2 .5 .1 .0 3.2 3.3 3.5 3.5 2.4 1.8 1.6 2.1 2.2 2.3 2.8 2.6 170. * .6 .5 1.2 1.4 1.2 .8 .4 .1 3.5 3.6 3.7 3.1 2.4 2.3 2.0 1.7 2.0 2.2 2.5 2.6 180. * .5 .9 1.3 1.2 1.1 .9 .6 .3 3.6 3.7 3.6 3.0 2.5 2.4 2.1 1.4 1.7 2.1 2.5 2.6 190. * .3 1.2 1.4 1.1 .9 .8 .7 .5 3.6 3.5 3.5 2.8 2.4 2.3 2.3 1.3 1.5 1.9 2.5 2.5 200. * .1 1.3 1.0 .8 .7 .6 .5 .6 3.2 3.3 3.3 3.1 2.5 2.5 2.5 1.2 1.3 1.8 2.4 2.2 210. * .0 1.0 .7 .7 .7 .5 .4 .4 3.4 3.6 3.6 3.1 2.8 2.6 2.3 1.0 1.3 1.6 2.4 2.2 220. * .0 1.0 .7 .7 .7 .4 .3 .3 3.7 3.8 3.8 3.1 2.8 2.5 2.3 1.0 1.2 1.6 2.4 2.2 230. * .0 .9 .7 .7 .7 .4 .3 .3 4.1 4.3 4.0 3.3 2.9 2.4 2.2 1.0 1.3 1.5 2.3 2.2 240. * .0 .9 .7 .7 .7 .4 .3 .3 4.4 4.2 3.8 3.4 2.8 2.2 2.0 1.1 1.3 1.6 2.3 2.3 250. * .0 .7 .6 .7 .8 .6 .4 .4 4.4 3.8 3.5 3.4 2.7 2.2 1.9 1.1 1.2 1.7 2.6 2.5 260. * .0 .7 .8 1.0 1.5 1.3 1.0 1.2 3.8 3.6 3.4 3.3 2.5 2.0 1.8 .7 1.1 1.4 2.3 2.3 270. * .3 1.1 1.4 2.0 3.2 2.9 2.8 2.6 2.5 2.4 2.4 2.7 1.9 1.4 1.2 .3 .4 .8 1.5 1.4 280. * 1.0 1.8 2.3 3.0 4.1 3.7 3.5 3.3 1.2 1.1 1.4 1.7 1.2 1.0 1.1 .2 .2 .2 .6 .6 290. * 1.5 2.4 2.6 3.3 4.4 3.8 3.8 3.4 .6 .7 .8 1.4 1.2 1.2 1.3 .2 .2 .2 .3 .3 300. * 1.7 2.4 2.7 3.4 4.2 3.5 3.5 3.4 .4 .6 .8 1.2 1.3 1.3 1.2 .2 .2 .2 .2 .3 310. * 1.9 2.5 2.6 3.0 3.7 3.3 3.3 3.3 .4 .5 .7 1.1 1.1 1.1 1.1 .1 .1 .1 .1 .1 320. * 1.9 2.4 2.3 2.8 3.4 3.2 3.1 3.1 .4 .4 .7 1.2 1.2 1.2 1.3 .0 .0 .0 .0 .0 330. * 2.4 1.9 2.2 2.5 3.4 3.1 3.2 3.1 .4 .5 .8 1.2 1.3 1.3 1.3 .0 .0 .0 .1 .0 340. * 2.6 1.8 2.0 2.6 3.3 3.2 3.0 2.7 .3 .4 .6 1.1 1.2 1.2 1.2 .3 .3 .4 .4 .1 350. * 2.5 1.4 1.7 2.4 3.1 3.0 2.8 2.5 .3 .4 .5 .9 .9 .9 .9 .8 .8 .9 1.0 .3 360. * 2.2 1.2 1.5 2.1 2.9 2.7 2.5 2.3 .1 .3 .3 .5 .5 .6 .5 1.2 1.3 1.3 1.4 .6 ------*------------------------------------------------------------------------------------------------------------------------ MAX * 2.6 2.5 2.7 3.4 4.4 3.8 3.8 3.4 4.4 4.3 4.0 3.8 2.9 2.6 2.5 2.5 2.7 3.0 3.7 3.4 DEGR. * 340 310 300 300 290 290 290 290 240 230 230 120 230 210 200 150 130 120 110 110
� PAGE 6 JOB: I25SH7withparkinglotPMphaseI RUN: I25SH7withparkinglotPMphaseI
MODEL RESULTS -------------
REMARKS : In search of the angle corresponding to the maximum concentration, only the first angle, of the angles with same maximum concentrations, is indicated as maximum.
WIND ANGLE RANGE: 0.-360.
WIND * CONCENTRATION ANGLE * (PPM) (DEGR)* REC41 REC42 REC43 REC44 REC45 REC46 REC47 REC48 REC49 REC50 REC51 REC52 REC53 REC54 REC55 REC56 ------*------------------------------------------------------------------------------------------------ 0. * .4 .2 .2 .3 .4 1.0 1.0 1.0 1.0 1.1 1.1 1.1 1.1 .5 .3 .2 10. * .6 .4 .0 .0 .1 .4 .4 .4 .4 1.7 1.7 1.7 1.7 .9 .6 .5 20. * .7 .5 .1 .1 .1 .2 .2 .2 .2 1.7 1.7 1.7 1.7 1.0 .8 .5 30. * .7 .6 .1 .1 .1 .1 .1 .1 .1 1.6 1.6 1.6 1.6 1.0 .8 .7 40. * .6 .5 .1 .1 .1 .1 .1 .1 .1 1.5 1.5 1.5 1.5 .9 .7 .6 50. * .5 .4 .2 .2 .1 .1 .1 .1 .1 1.4 1.4 1.3 1.3 .9 .7 .5 60. * .5 .3 .2 .2 .2 .1 .1 .1 .2 1.3 1.4 1.4 1.3 .9 .8 .5 70. * .6 .4 .3 .3 .3 .2 .2 .2 .2 1.3 1.3 1.3 1.3 1.0 .9 .5 80. * .8 .7 .6 .7 .6 .6 .1 .0 .0 1.2 1.2 1.4 1.8 1.3 1.2 1.0
Page 5
sh7ph1v2.out 90. * 1.9 1.7 1.7 1.5 1.6 1.9 .9 .6 .3 1.6 1.8 2.2 3.2 3.0 2.8 2.5 100. * 2.7 2.5 2.4 2.4 2.5 3.0 1.5 1.2 .8 2.2 2.4 3.1 4.4 4.1 3.6 3.1 110. * 3.0 3.0 2.5 2.5 2.7 3.5 1.8 1.3 1.2 2.3 2.6 3.5 4.4 3.8 3.2 3.2 120. * 3.0 3.2 2.4 2.4 3.0 3.7 1.9 1.3 1.1 2.6 2.9 3.4 4.0 3.4 3.3 3.2 130. * 2.8 3.0 2.3 2.3 3.1 3.9 1.9 1.4 1.0 2.7 3.1 3.1 3.7 3.1 3.1 3.0 140. * 2.8 2.9 2.1 2.1 3.3 4.1 2.4 1.5 1.1 2.9 2.9 2.8 3.2 2.7 3.1 3.2 150. * 2.6 2.6 1.9 2.0 3.4 4.2 2.6 1.7 1.4 2.6 2.8 2.9 3.1 2.8 3.3 3.1 160. * 2.5 2.3 1.8 2.1 3.6 4.1 2.7 2.1 1.7 2.6 2.5 2.6 2.9 3.2 3.1 2.8 170. * 2.6 2.4 1.9 2.6 4.0 4.2 3.0 2.3 1.8 2.4 2.5 2.7 3.2 3.2 3.1 2.6 180. * 2.4 2.1 1.9 3.1 4.4 4.2 3.0 2.4 2.0 1.8 2.0 2.5 3.0 3.3 2.8 2.1 190. * 2.2 1.9 2.2 3.7 4.5 4.1 2.9 2.5 2.2 1.8 1.9 2.4 3.1 3.0 2.4 2.0 200. * 2.0 1.8 2.3 4.2 4.5 3.4 2.9 2.7 2.4 1.4 1.6 2.3 3.0 2.8 2.2 1.8 210. * 1.9 1.9 3.0 4.6 4.3 3.6 2.7 2.6 2.5 1.1 1.6 2.1 3.2 2.6 2.1 1.8 220. * 2.1 2.1 3.5 4.6 4.4 3.4 2.8 2.8 2.5 .9 1.4 1.7 2.9 2.3 1.9 1.8 230. * 2.2 2.1 4.5 4.7 4.3 3.7 3.0 2.6 2.3 .8 1.1 1.7 2.6 2.1 1.9 1.9 240. * 2.3 2.3 4.5 4.5 3.9 3.8 2.9 2.4 1.9 .7 .9 1.3 2.3 2.0 1.9 1.9 250. * 2.5 2.4 4.2 4.2 3.4 3.2 2.3 2.0 1.6 .4 .6 1.1 2.0 2.0 1.7 1.7 260. * 2.3 2.3 3.5 3.0 2.8 2.7 1.9 1.6 1.3 .1 .3 .7 1.4 1.4 1.3 1.2 270. * 1.6 1.6 2.0 1.8 1.7 1.8 1.4 1.2 1.1 .0 .0 .2 .8 .8 .8 .6 280. * .6 .7 .9 .9 1.1 1.3 1.1 1.1 1.1 .0 .0 .0 .3 .3 .3 .2 290. * .4 .4 .5 .6 .8 1.1 1.1 1.1 1.1 .0 .0 .0 .1 .1 .1 .1 300. * .3 .3 .6 .6 .8 1.1 1.1 1.1 1.1 .0 .0 .0 .0 .0 .0 .0 310. * .2 .2 .6 .6 .8 1.1 1.1 1.1 1.1 .0 .0 .0 .0 .0 .0 .0 320. * .0 .0 .6 .6 .9 1.4 1.4 1.4 1.4 .0 .0 .0 .0 .0 .0 .0 330. * .0 .0 .6 .7 .9 1.4 1.4 1.4 1.4 .0 .0 .0 .0 .0 .0 .0 340. * .0 .0 .6 .7 1.0 1.5 1.5 1.5 1.5 .1 .1 .1 .1 .0 .0 .0 350. * .2 .1 .3 .6 .8 1.5 1.5 1.5 1.4 .4 .4 .5 .5 .2 .0 .0 360. * .4 .2 .2 .3 .4 1.0 1.0 1.0 1.0 1.1 1.1 1.1 1.1 .5 .3 .2 ------*------------------------------------------------------------------------------------------------ MAX * 3.0 3.2 4.5 4.7 4.5 4.2 3.0 2.8 2.5 2.9 3.1 3.5 4.4 4.1 3.6 3.2 DEGR. * 120 120 230 230 190 150 180 220 210 140 130 110 100 100 100 110
THE HIGHEST CONCENTRATION OF 5.10 PPM OCCURRED AT RECEPTOR REC1 .� PAGE 7 JOB: I25SH7withparkinglotPMphaseI RUN: I25SH7withparkinglotPMphaseI
DATE : 11/22/10 TIME : 12:40:59
RECEPTOR - LINK MATRIX FOR THE ANGLE PRODUCING THE MAXIMUM CONCENTRATION FOR EACH RECEPTOR
* CO/LINK (PPM) * ANGLE (DEGREES) * REC1 REC2 REC3 REC4 REC5 REC6 REC7 REC8 REC9 REC10 REC11 REC12 REC13 REC14 REC15 REC16 REC17 REC18REC19 REC20 LINK # * 60 20 10 300 60 30 10 350 310 310 290 350 340 320 50 10 300 340 340 340 -------*------------------------------------------------------------------------------------------------------------------------ 1 * .6 .6 .6 .8 .0 .1 .2 .1 .4 .5 .8 .0 .0 .0 .0 .0 .0 .0 .0 .0 2 * .5 .6 .5 .6 .0 .0 .1 .0 .3 .3 .4 .0 .0 .0 .0 .0 .0 .0 .0 .0 3 * 1.1 .8 .9 1.2 .0 .1 .2 .1 .4 .5 .9 .0 .0 .0 .0 .0 .0 .0 .0 .0 4 * .9 .9 .8 1.0 .0 .0 .1 .0 .3 .2 .4 .0 .0 .0 .0 .0 .0 .0 .0 .0 5 * .2 .0 .0 .0 .6 .3 .1 .2 .0 .0 .0 .7 .7 .7 .6 .7 .9 .3 .1 .1 6 * .0 .0 .0 .0 .0 .0 .0 .0 .0 .0 .0 .0 .0 .0 .4 .5 .5 .1 .0 .0 7 * .1 .0 .0 .0 .7 .3 .1 .2 .0 .1 .5 1.0 1.0 1.1 1.1 1.0 1.3 .2 .1 .0 8 * .0 .0 .0 .0 .0 .0 .0 .0 .0 .0 .0 .0 .0 .0 .8 .8 .9 .0 .0 .0 9 * .0 .0 .0 .0 .0 .0 .0 .0 .0 .0 .0 .0 .0 .0 .2 .0 .0 .5 .4 .3 10 * .0 .0 .0 .0 .0 .0 .0 .0 .0 .0 .0 .0 .0 .0 .1 .0 .0 .8 .5 .4 11 * .4 .8 .7 .2 .0 .0 .1 .1 .2 .4 .4 .0 .0 .0 .0 .0 .0 .0 .0 .0 12 * .0 .0 .0 .0 .0 .0 .0 .0 .0 .0 .0 .0 .0 .0 .4 .1 .0 .2 .2 .2 13 * .0 .0 .0 .0 .0 .0 .0 .0 .0 .0 .0 .0 .0 .0 .4 .0 .0 .1 .1 .2 14 * .2 .0 .0 .0 .3 .2 .1 .1 .0 .0 .0 .3 .3 .3 .1 .2 .3 .2 .1 .1
Page 6
sh7ph1v2.out 15 * .1 .0 .0 .0 .1 .2 .1 .1 .0 .0 .0 .3 .4 .3 .0 .0 .0 .0 .0 .0 16 * .2 .0 .0 .0 .2 .2 .1 .1 .0 .0 .0 .2 .2 .2 .0 .2 .3 .2 .1 .1 17 * .1 .0 .0 .0 .1 .1 .1 .1 .0 .0 .0 .3 .3 .2 .0 .0 .0 .0 .0 .0 18 * .1 .2 .2 .3 .0 .0 .1 .1 .2 .2 .3 .0 .0 .0 .0 .0 .0 .0 .0 .0 19 * .1 .2 .2 .2 .0 .0 .1 .1 .2 .2 .2 .0 .0 .1 .0 .0 .0 .0 .0 .0 20 * .1 .0 .0 .0 .2 .2 .1 .1 .0 .0 .0 .7 .6 .5 .0 .0 .0 .0 .0 .0 21 * .1 .4 .5 .0 .0 .0 .3 .3 .0 .0 .0 .3 .3 .2 .0 .0 .1 .0 .0 .0 22 * .0 .0 .0 .0 .0 .0 .0 .0 .0 .0 .0 .0 .0 .0 .0 .0 .0 .0 .0 .0 23 * .1 .0 .0 .0 .3 .4 .3 .1 .2 .2 .2 .0 .0 .0 .0 .0 .0 .0 .0 .0 24 * .0 .2 .3 .0 .0 .0 .2 .2 .0 .0 .0 .3 .2 .1 .0 .0 .1 .0 .0 .0 25 * .0 .0 .0 .0 .2 .2 .1 .4 .4 .4 .3 .0 .0 .0 .0 .0 .0 .0 .0 .0 26 * .0 .0 .0 .0 .1 .0 .0 .0 .0 .1 .2 .0 .0 .0 .0 .0 .0 .0 .0 .0 27 * .1 .2 .2 .0 .0 .1 .2 .2 .0 .0 .0 .4 .3 .2 .0 .0 .0 .0 .0 .0 28 * .0 .0 .0 .0 .4 .3 .1 .2 .5 .4 .2 .0 .0 .0 .0 .0 .0 .0 .0 .0 29 * .1 .0 .0 .0 .1 .0 .0 .0 .0 .0 .0 .0 .0 .0 .0 .2 .0 .1 .1 .1 30 * .0 .0 .0 .0 .0 .0 .0 .0 .0 .0 .0 .0 .0 .0 .1 .4 .0 .5 .3 .2 31 * .0 .0 .0 .0 .0 .0 .0 .0 .0 .0 .0 .0 .0 .0 .2 .1 .0 .7 .8 .9 32 * .0 .0 .0 .0 .0 .0 .0 .0 .0 .0 .0 .0 .0 .0 .0 .0 .0 .0 .0 .0 33 * .0 .0 .0 .0 .0 .1 .0 .0 .0 .0 .0 .0 .0 .0 .0 .2 .0 .3 .3 .3� PAGE 8 JOB: I25SH7withparkinglotPMphaseI RUN: I25SH7withparkinglotPMphaseI
DATE : 11/22/10 TIME : 12:40:59
RECEPTOR - LINK MATRIX FOR THE ANGLE PRODUCING THE MAXIMUM CONCENTRATION FOR EACH RECEPTOR
* CO/LINK (PPM) * ANGLE (DEGREES) * REC21 REC22 REC23 REC24 REC25 REC26 REC27 REC28 REC29 REC30 REC31 REC32 REC33 REC34 REC35 REC36 REC37 REC38REC39 REC40 LINK # * 340 310 300 300 290 290 290 290 240 230 230 120 230 210 200 150 130 120 110 110 -------*------------------------------------------------------------------------------------------------------------------------ 1 * .0 .0 .0 .0 .0 .0 .0 .0 .0 .0 .0 .0 .0 .0 .0 .0 .0 .0 .0 .0 2 * .0 .0 .0 .0 .0 .0 .0 .0 .0 .0 .0 .0 .0 .0 .0 .0 .0 .0 .0 .0 3 * .0 .0 .0 .0 .0 .0 .0 .0 .0 .0 .0 .0 .0 .0 .0 .0 .0 .0 .0 .0 4 * .0 .0 .0 .0 .0 .0 .0 .0 .0 .0 .0 .0 .0 .0 .0 .0 .0 .0 .0 .0 5 * .0 .2 .4 .4 .7 .5 .4 .3 .4 .4 .5 .0 .4 .3 .3 .1 .0 .0 .0 .0 6 * .0 .1 .2 .2 .3 .2 .2 .1 .2 .2 .3 .0 .2 .2 .2 .0 .0 .0 .0 .0 7 * .0 .2 .3 .4 .6 .4 .3 .2 .4 .4 .5 .0 .4 .3 .3 .1 .0 .0 .0 .0 8 * .0 .1 .2 .2 .3 .2 .1 .1 .2 .2 .3 .0 .1 .2 .2 .0 .0 .0 .0 .0 9 * .3 .2 .1 .2 .3 .5 .6 .7 .2 .2 .1 .6 .0 .0 .0 .2 .3 .4 .5 .5 10 * .3 .2 .2 .3 .7 .9 1.0 1.0 .1 .1 .0 .4 .0 .0 .0 .2 .3 .3 .3 .4 11 * .0 .0 .0 .0 .0 .0 .0 .0 .0 .0 .0 .0 .0 .0 .0 .0 .0 .0 .0 .0 12 * .2 .1 .0 .0 .0 .0 .1 .2 1.2 1.2 .9 1.4 .0 .0 .0 .2 .5 .7
Page 7
sh7ph1v2.out 1.0 .7 13 * .2 .1 .0 .0 .0 .0 .1 .1 1.3 1.2 .6 1.4 .0 .0 .0 .2 .4 .5 .7 .5 14 * .0 .1 .2 .2 .3 .3 .3 .2 .1 .1 .3 .0 .4 .2 .2 .1 .0 .0 .1 .2 15 * .0 .0 .0 .0 .0 .0 .0 .0 .0 .0 .0 .0 .0 .0 .0 .0 .0 .0 .0 .0 16 * .1 .1 .2 .2 .3 .3 .3 .2 .1 .0 .1 .0 .4 .3 .2 .1 .1 .1 .4 .6 17 * .0 .0 .0 .0 .0 .0 .0 .0 .0 .0 .0 .0 .0 .0 .0 .0 .0 .0 .0 .0 18 * .0 .0 .0 .0 .0 .0 .0 .0 .0 .0 .0 .0 .0 .0 .0 .0 .0 .0 .0 .0 19 * .0 .0 .0 .0 .0 .0 .0 .0 .0 .0 .0 .0 .0 .0 .0 .0 .0 .0 .0 .0 20 * .0 .0 .0 .0 .0 .0 .0 .0 .0 .0 .0 .0 .0 .0 .0 .0 .0 .0 .0 .0 21 * .0 .0 .0 .1 .0 .0 .0 .0 .0 .0 .0 .0 .0 .0 .0 .0 .0 .0 .0 .0 22 * .0 .0 .0 .0 .0 .0 .0 .0 .0 .0 .0 .0 .0 .0 .0 .0 .0 .0 .0 .0 23 * .0 .0 .0 .0 .0 .0 .0 .0 .0 .0 .0 .0 .0 .0 .0 .0 .0 .0 .0 .0 24 * .0 .0 .0 .1 .0 .0 .0 .0 .0 .0 .0 .0 .0 .0 .0 .0 .0 .0 .0 .0 25 * .0 .0 .0 .0 .0 .0 .0 .0 .0 .0 .0 .0 .0 .0 .0 .0 .0 .0 .0 .0 26 * .0 .0 .0 .0 .0 .0 .0 .0 .0 .0 .0 .0 .0 .0 .0 .0 .0 .0 .0 .0 27 * .0 .0 .0 .0 .0 .0 .0 .0 .0 .0 .0 .0 .0 .0 .0 .0 .0 .0 .0 .0 28 * .0 .0 .0 .0 .0 .0 .0 .0 .0 .0 .0 .0 .0 .0 .0 .0 .0 .0 .0 .0 29 * .1 .0 .0 .0 .0 .0 .0 .0 .0 .0 .0 .0 .0 .0 .0 .0 .0 .0 .0 .0 30 * .2 .1 .0 .1 .0 .1 .1 .1 .1 .1 .3 .0 .6 .6 .6 .8 .7 .7 .6 .4 31 * 1.0 1.0 .9 1.0 .9 .4 .3 .2 .1 .2 .1 .0 .0 .0 .0 .2 .1 .0 .0 .1 32 * .0 .0 .0 .0 .0 .0 .0 .0 .0 .0 .0 .0 .0 .0 .0 .1 .0 .0 .0 .0 33 * .2 .0 .0 .0 .0 .0 .0 .0 .0 .0 .0 .0 .4 .5 .5 .2 .3 .3 .1 .0� PAGE 9 JOB: I25SH7withparkinglotPMphaseI RUN: I25SH7withparkinglotPMphaseI
DATE : 11/22/10 TIME : 12:40:59
RECEPTOR - LINK MATRIX FOR THE ANGLE PRODUCING THE MAXIMUM CONCENTRATION FOR EACH RECEPTOR
* CO/LINK (PPM) * ANGLE (DEGREES) * REC41 REC42 REC43 REC44 REC45 REC46 REC47 REC48 REC49 REC50 REC51 REC52 REC53 REC54 REC55 REC56 LINK # * 120 120 230 230 190 150 180 220 210 140 130 110 100 100 100 110 -------*------------------------------------------------------------------------------------------------ 1 * .0 .0 .1 .2 .0 .0 .0 .3 .2 .0 .0 .0 .0 .0 .0 .1 2 * .0 .0 .1 .1 .0 .0 .0 .2 .2 .0 .0 .0 .0 .0 .0 .0 3 * .0 .0 .2 .3 .0 .0 .0 .3 .2 .0 .0 .0 .0 .0 .0 .0 4 * .0 .0 .1 .1 .0 .0 .0 .2 .1 .0 .0 .0 .0 .0 .0 .0 5 * .2 .3 .4 .3 .4 .5 .3 .0 .0 .3 .4 .4 .5 .5 .5 .4 6 * .1 .2 .0 .0 .0 .0 .0 .0 .0 .0 .0 .0 .0 .0 .0 .0 7 * .1 .2 .3 .2 .4 .4 .3 .0 .0 .3 .3 .4 .4 .4 .4 .4 8 * .0 .1 .0 .0 .0 .0 .0 .0 .0 .0 .0 .0 .0 .0 .0 .0 9 * .4 .3 .0 .0 .0 .0 .0 .0 .0 .0 .0 .0 .1 .1 .1 .0 10 * .3 .3 .0 .0 .0 .0 .0 .0 .0 .0 .0 .0 .1 .1 .1 .0 11 * .0 .0 .1 .1 .0 .0 .0 .3 .2 .0 .0 .0 .0 .0 .0 .2 12 * .2 .2 .0 .0 .0 .0 .0 .0 .0 .0 .0 .0 .1 .1 .1 .0 13 * .2 .1 .0 .0 .0 .0 .0 .0 .0 .0 .0 .0 .0 .0 .0 .0 14 * .4 .4 .5 .4 .4 .4 .3 .0 .0 .2 .3 .4 .5 .5 .4 .2 15 * .0 .0 .6 .5 .7 .7 .3 .0 .0 .2 .2 .2 .2 .2 .2 .1 16 * .7 .8 .7 .7 .6 .6 .4 .0 .1 .2 .3 .5 .7 .5 .4 .2 17 * .0 .0 .6 1.0 .9 1.0 .4 .0 .0 .2 .2 .3 .4 .3 .2 .1 18 * .0 .0 .0 .1 .0 .0 .0 .2 .2 .0 .0 .0 .0 .1 .1 .3 19 * .0 .0 .0 .0 .0 .0 .0 .2 .2 .0 .0 .0 .2 .4 .5 .7 20 * .0 .0 .5 .4 .7 .6 .4 .0 .0 .2 .2 .1 .1 .2 .2 .2 21 * .0 .0 .0 .0 .0 .0 .0 .3 .3 .7 .6 .6 .6 .4 .3 .2 22 * .0 .0 .0 .0 .0 .0 .0 .0 .0 .0 .0 .0 .2 .1 .0 .0
Page 8

sh7ph1v2.out 23 * .0 .0 .1 .1 .1 .0 .1 .0 .0 .0 .0 .0 .0 .0 .0 .0 24 * .0 .0 .0 .0 .0 .0 .0 .2 .2 .3 .3 .3 .0 .0 .0 .0 25 * .0 .0 .1 .1 .2 .0 .2 .0 .0 .0 .0 .0 .0 .0 .0 .0 26 * .0 .0 .0 .0 .0 .0 .0 .0 .0 .0 .0 .0 .0 .0 .0 .0 27 * .0 .0 .0 .1 .0 .0 .2 .6 .6 .3 .3 .3 .3 .2 .1 .1 28 * .0 .0 .1 .0 .1 .0 .1 .0 .0 .0 .0 .0 .0 .0 .0 .0 29 * .0 .0 .0 .0 .0 .0 .0 .0 .0 .0 .0 .0 .0 .0 .0 .0 30 * .2 .1 .0 .0 .0 .0 .0 .0 .0 .0 .0 .0 .0 .0 .0 .0 31 * .2 .2 .0 .0 .0 .0 .0 .0 .0 .0 .0 .0 .0 .0 .0 .0 32 * .0 .0 .0 .0 .0 .0 .0 .0 .0 .0 .0 .0 .0 .0 .0 .0 33 * .0 .0 .0 .0 .0 .0 .0 .0 .0 .0 .0 .0 .0 .0 .0 .0
Page 9

sh7pmpfa.in'I25SH7withparkinglotPMPA', 60 , 175 , 0 , 0 , 56 , 0.3048 , 1 , 1 'Receptor 1', 4476 , 2514 , 5 'Receptor 2', 4516 , 2514 , 5 'Receptor 3', 4556 , 2514 , 5 'Receptor 4', 4596 , 2514 , 5 'Receptor 5', 4596 , 2474 , 5 'Receptor 6', 4596 , 2434 , 5 'Receptor 7', 4596 , 2394 , 5 'Receptor 8', 4684 , 2394 , 5 'Receptor 9', 4684 , 2434 , 5 'Receptor 10', 4684 , 2474 , 5 'Receptor 11', 4684 , 2514 , 5 'Receptor 12', 4724 , 2514 , 5 'Receptor 13', 4764 , 2514 , 5 'Receptor 14', 4804 , 2514 , 5 'Receptor 15', 5529 , 2514 , 5 'Receptor 16', 5569 , 2514 , 5 'Receptor 17', 5609 , 2514 , 5 'Receptor 18', 5649 , 2514 , 5 'Receptor 19', 5680 , 2474 , 5 'Receptor 20', 5712 , 2434 , 5 'Receptor 21', 5748 , 2394 , 5 'Receptor 22', 5816 , 2394 , 5 'Receptor 23', 5787 , 2434 , 5 'Receptor 24', 5748 , 2474 , 5 'Receptor 25', 5716 , 2514 , 5 'Receptor 26', 5756 , 2514 , 5 'Receptor 27', 5796 , 2514 , 5 'Receptor 28', 5836 , 2514 , 5 'Receptor 29', 5760 , 2673 , 5 'Receptor 30', 5720 , 2673 , 5 'Receptor 31', 5680 , 2673 , 5 'Receptor 32', 5640 , 2673 , 5 'Receptor 33', 5631 , 2713 , 5 'Receptor 34', 5622 , 2753 , 5 'Receptor 35', 5614 , 2793 , 5 'Receptor 36', 5535 , 2801 , 5 'Receptor 37', 5542 , 2761 , 5 'Receptor 38', 5550 , 2721 , 5 'Receptor 39', 5560 , 2681 , 5 'Receptor 40', 5520 , 2681 , 5 'Receptor 41', 5480 , 2681 , 5 'Receptor 42', 5440 , 2681 , 5 'Receptor 43', 4813 , 2681 , 5 'Receptor 44', 4773 , 2681 , 5 'Receptor 45', 4733 , 2681 , 5 'Receptor 46', 4693 , 2681 , 5 'Receptor 47', 4693 , 2721 , 5 'Receptor 48', 4693 , 2761 , 5 'Receptor 49', 4693 , 2801 , 5 'Receptor 50', 4581 , 2801 , 5 'Receptor 51', 4581 , 2761 , 5 'Receptor 52', 4581 , 2721 , 5 'Receptor 53', 4581 , 2681 , 5 'Receptor 54', 4541 , 2681 , 5 'Receptor 55', 4501 , 2681 , 5 'Receptor 56', 4461 , 2681 , 5 'I25SH7withparkinglotPMPA', 33 , 1 , 1 ,'CO' 1 'sh7ebapp1-1','AG', 4131 , 2570 , 4640 , 2570 , 1433 , 22.8 , 0 , 44 2 'sh7ebapp1-1 que','AG', 4591 , 2570 , 4131 , 2570 , 0 , 24 , 2 110 , 51 , 2 , 1188 , 143.34 , 1600 , 1 , 3 1 'sh7ebapp2-1','AG', 4131 , 2546 , 4640 , 2546 , 1433 , 22.8 , 0 , 44 2 'sh7ebapp2-1 que','AG', 4591 , 2546 , 4131 , 2546 , 0 , 24 , 2 110 , 51 , 2 , 1188 , 143.34 , 1600 , 1 , 3 1 'sh7ebapp/dep1-1','AG', 4640 , 2570 , 5623 , 2570 , 1628 , 22.8 , 0 , 44 2 'sh7ebapp/dep1-1 que','AG', 5601 , 2570 , 4683 , 2570 , 0 , 24 , 2 110 , 48 , 2 , 1035 , 143.34 , 1600 , 1 , 3 1 'sh7ebapp/dep2-1','AG', 4640 , 2546 , 5623 , 2546 , 1628 , 22.8 , 0 , 44 2 'sh7ebapp/dep2-1 que','AG', 5601 , 2546 , 4683 , 2546 , 0 , 24 , 2 110 , 48 , 2 , 1035 , 143.34 , 1600 , 1 , 3 1 'sh7ebdep1-1','AG', 5623 , 2570 , 6132 , 2570 , 1475 , 22.8 , 0 , 56 1
Page 1

sh7pmpfa.in'sh7ebdep2-1','AG', 5623 , 2546 , 6132 , 2546 , 1475 , 22.8 , 0 , 32 2 'sh7ebleftturn','AG', 4591 , 2595 , 4391 , 2595 , 0 , 24 , 2 110 , 91 , 2 , 325 , 143.34 , 1600 , 1 , 3 1 'sh7wbapp1-1','AG', 6132 , 2635 , 5623 , 2635 , 1875 , 22.1 , 0 , 56 2 'sh7wbapp1-1 que','AG', 5645 , 2635 , 6132 , 2635 , 0 , 36 , 3 110 , 48 , 2 , 1875 , 143.34 , 1600 , 1 , 3 1 'sh7wbapp/dep1-1','AG', 5623 , 2625 , 4640 , 2625 , 1010 , 22.1 , 0 , 44 2 'sh7wbapp/dep1-1 que','AG', 4683 , 2625 , 5577 , 2625 , 0 , 24 , 2 110 , 58 , 2 , 668 , 143.34 , 1600 , 1 , 3 1 'sh7wbapp/dep2-1','AG', 5623 , 2649 , 4640 , 2649 , 1010 , 22.1 , 0 , 44 2 'sh7wbapp/dep2-1 que','AG', 4683 , 2649 , 5577 , 2649 , 0 , 24 , 2 110 , 58 , 2 , 668 , 143.34 , 1600 , 1 , 3 1 'sh7wbdep1-1','AG', 4640 , 2625 , 4131 , 2625 , 905 , 22.1 , 0 , 44 1 'sh7wbdep2-1','AG', 4640 , 2649 , 4131 , 2649 , 905 , 22.1 , 0 , 44 2 'sh7wbleftturn','AG', 4683 , 2601 , 4883 , 2601 , 0 , 24 , 2 110 , 91 , 2 , 290 , 143.34 , 1600 , 1 , 3 1 'pklotsbapp','AG', 4613 , 3598 , 4613 , 2598 , 905 , 22.6 , 0 , 44 2 'pklotsbapp que','AG', 4613 , 2671 , 4613 , 3598 , 0 , 24 , 2 110 , 72 , 2 , 20 , 143.34 , 1600 , 1 , 3 1 'pklotsbdep','AG', 4622 , 2598 , 4622 , 1598 , 475 , 22.6 , 0 , 32 2 'pklotsbleftturn','AG', 4631 , 2671 , 4631 , 2891 , 0 , 12 , 1 110 , 72 , 2 , 585 , 143.34 , 1600 , 1 , 3 1 'pklotnbapp','AG', 4658 , 1598 , 4658 , 2598 , 490 , 22.5 , 0 , 32 2 'pklotnbapp que','AG', 4658 , 2524 , 4658 , 1598 , 0 , 12 , 1 110 , 90 , 2 , 20 , 143.34 , 1600 , 1 , 3 1 'pklotnbdep','AG', 4661 , 2598 , 4661 , 3598 , 740 , 22.5 , 0 , 44 2 'pklotnbleftturn','AG', 4646 , 2524 , 4646 , 2324 , 0 , 12 , 1 110 , 86 , 2 , 175 , 143.34 , 1600 , 1 , 3 1 'i25sbrampapp1','AG', 5896.9 , 3596.9 , 5540.1 , 2935.4 , 1026 , 22.6 , 0 , 44 1 'i25sbrampapp2','AG', 5540.1 , 2935.4 , 5612 , 2598 , 1026 , 22.6 , 0 , 44 1 'i25sbrampdep1','AG', 5612 , 2598 , 5799.6 , 2374.3 , 1186 , 22.6 , 0 , 44 1 'i25sbrampdep2','AG', 5799.6 , 2374.3 , 5681.8 , 1596.9 , 1186 , 22.6 , 0 , 44 2 'i25sbrampleftturn','AG', 5609 , 2671 , 5568 , 2891 , 0 , 12 , 1 110 , 63 , 2 , 880 , 143.34 , 1600 , 1 , 3 1 , 0 , 4 , 1000 , 0 ,'Y', 10 , 0 , 36
Page 2
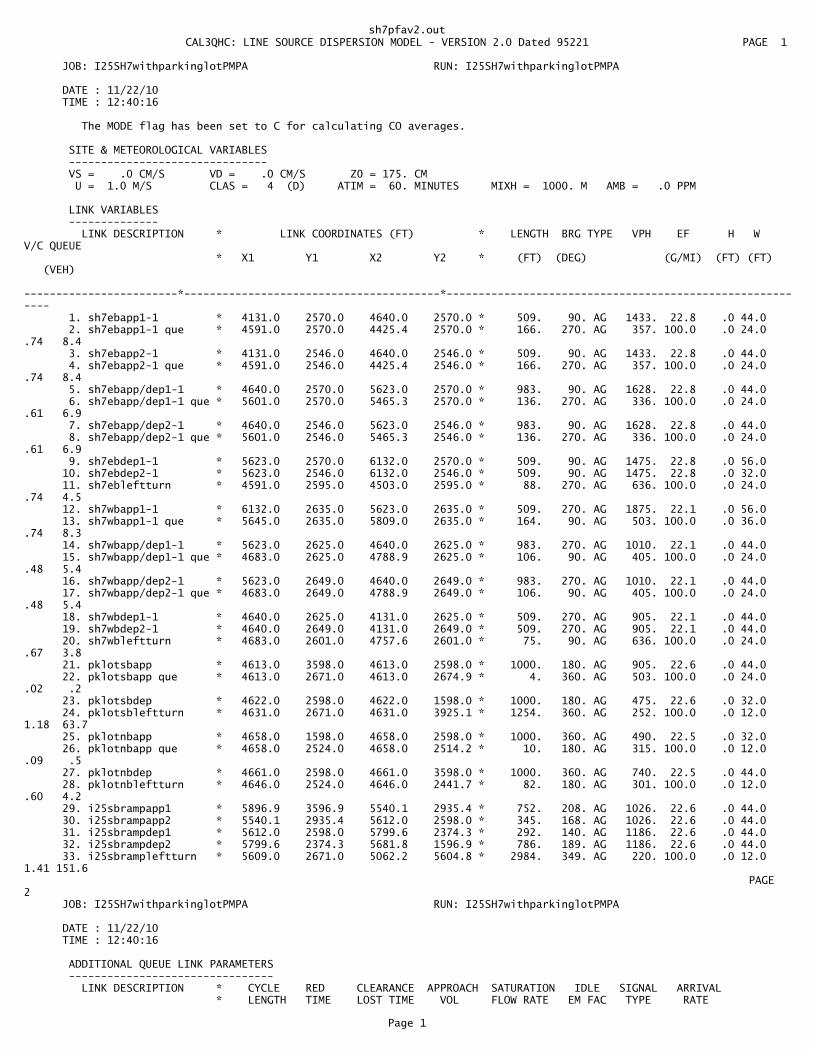
sh7pfav2.out� CAL3QHC: LINE SOURCE DISPERSION MODEL - VERSION 2.0 Dated 95221 PAGE 1
JOB: I25SH7withparkinglotPMPA RUN: I25SH7withparkinglotPMPA
DATE : 11/22/10 TIME : 12:40:16
The MODE flag has been set to C for calculating CO averages.
SITE & METEOROLOGICAL VARIABLES ------------------------------- VS = .0 CM/S VD = .0 CM/S Z0 = 175. CM U = 1.0 M/S CLAS = 4 (D) ATIM = 60. MINUTES MIXH = 1000. M AMB = .0 PPM
LINK VARIABLES -------------- LINK DESCRIPTION * LINK COORDINATES (FT) * LENGTH BRG TYPE VPH EF H W V/C QUEUE * X1 Y1 X2 Y2 * (FT) (DEG) (G/MI) (FT) (FT) (VEH) ------------------------*----------------------------------------*---------------------------------------------------------- 1. sh7ebapp1-1 * 4131.0 2570.0 4640.0 2570.0 * 509. 90. AG 1433. 22.8 .0 44.0 2. sh7ebapp1-1 que * 4591.0 2570.0 4425.4 2570.0 * 166. 270. AG 357. 100.0 .0 24.0 .74 8.4 3. sh7ebapp2-1 * 4131.0 2546.0 4640.0 2546.0 * 509. 90. AG 1433. 22.8 .0 44.0 4. sh7ebapp2-1 que * 4591.0 2546.0 4425.4 2546.0 * 166. 270. AG 357. 100.0 .0 24.0 .74 8.4 5. sh7ebapp/dep1-1 * 4640.0 2570.0 5623.0 2570.0 * 983. 90. AG 1628. 22.8 .0 44.0 6. sh7ebapp/dep1-1 que * 5601.0 2570.0 5465.3 2570.0 * 136. 270. AG 336. 100.0 .0 24.0 .61 6.9 7. sh7ebapp/dep2-1 * 4640.0 2546.0 5623.0 2546.0 * 983. 90. AG 1628. 22.8 .0 44.0 8. sh7ebapp/dep2-1 que * 5601.0 2546.0 5465.3 2546.0 * 136. 270. AG 336. 100.0 .0 24.0 .61 6.9 9. sh7ebdep1-1 * 5623.0 2570.0 6132.0 2570.0 * 509. 90. AG 1475. 22.8 .0 56.0 10. sh7ebdep2-1 * 5623.0 2546.0 6132.0 2546.0 * 509. 90. AG 1475. 22.8 .0 32.0 11. sh7ebleftturn * 4591.0 2595.0 4503.0 2595.0 * 88. 270. AG 636. 100.0 .0 24.0 .74 4.5 12. sh7wbapp1-1 * 6132.0 2635.0 5623.0 2635.0 * 509. 270. AG 1875. 22.1 .0 56.0 13. sh7wbapp1-1 que * 5645.0 2635.0 5809.0 2635.0 * 164. 90. AG 503. 100.0 .0 36.0 .74 8.3 14. sh7wbapp/dep1-1 * 5623.0 2625.0 4640.0 2625.0 * 983. 270. AG 1010. 22.1 .0 44.0 15. sh7wbapp/dep1-1 que * 4683.0 2625.0 4788.9 2625.0 * 106. 90. AG 405. 100.0 .0 24.0 .48 5.4 16. sh7wbapp/dep2-1 * 5623.0 2649.0 4640.0 2649.0 * 983. 270. AG 1010. 22.1 .0 44.0 17. sh7wbapp/dep2-1 que * 4683.0 2649.0 4788.9 2649.0 * 106. 90. AG 405. 100.0 .0 24.0 .48 5.4 18. sh7wbdep1-1 * 4640.0 2625.0 4131.0 2625.0 * 509. 270. AG 905. 22.1 .0 44.0 19. sh7wbdep2-1 * 4640.0 2649.0 4131.0 2649.0 * 509. 270. AG 905. 22.1 .0 44.0 20. sh7wbleftturn * 4683.0 2601.0 4757.6 2601.0 * 75. 90. AG 636. 100.0 .0 24.0 .67 3.8 21. pklotsbapp * 4613.0 3598.0 4613.0 2598.0 * 1000. 180. AG 905. 22.6 .0 44.0 22. pklotsbapp que * 4613.0 2671.0 4613.0 2674.9 * 4. 360. AG 503. 100.0 .0 24.0 .02 .2 23. pklotsbdep * 4622.0 2598.0 4622.0 1598.0 * 1000. 180. AG 475. 22.6 .0 32.0 24. pklotsbleftturn * 4631.0 2671.0 4631.0 3925.1 * 1254. 360. AG 252. 100.0 .0 12.0 1.18 63.7 25. pklotnbapp * 4658.0 1598.0 4658.0 2598.0 * 1000. 360. AG 490. 22.5 .0 32.0 26. pklotnbapp que * 4658.0 2524.0 4658.0 2514.2 * 10. 180. AG 315. 100.0 .0 12.0 .09 .5 27. pklotnbdep * 4661.0 2598.0 4661.0 3598.0 * 1000. 360. AG 740. 22.5 .0 44.0 28. pklotnbleftturn * 4646.0 2524.0 4646.0 2441.7 * 82. 180. AG 301. 100.0 .0 12.0 .60 4.2 29. i25sbrampapp1 * 5896.9 3596.9 5540.1 2935.4 * 752. 208. AG 1026. 22.6 .0 44.0 30. i25sbrampapp2 * 5540.1 2935.4 5612.0 2598.0 * 345. 168. AG 1026. 22.6 .0 44.0 31. i25sbrampdep1 * 5612.0 2598.0 5799.6 2374.3 * 292. 140. AG 1186. 22.6 .0 44.0 32. i25sbrampdep2 * 5799.6 2374.3 5681.8 1596.9 * 786. 189. AG 1186. 22.6 .0 44.0 33. i25sbrampleftturn * 5609.0 2671.0 5062.2 5604.8 * 2984. 349. AG 220. 100.0 .0 12.0 1.41 151.6� PAGE 2 JOB: I25SH7withparkinglotPMPA RUN: I25SH7withparkinglotPMPA
DATE : 11/22/10 TIME : 12:40:16
ADDITIONAL QUEUE LINK PARAMETERS -------------------------------- LINK DESCRIPTION * CYCLE RED CLEARANCE APPROACH SATURATION IDLE SIGNAL ARRIVAL * LENGTH TIME LOST TIME VOL FLOW RATE EM FAC TYPE RATE
Page 1
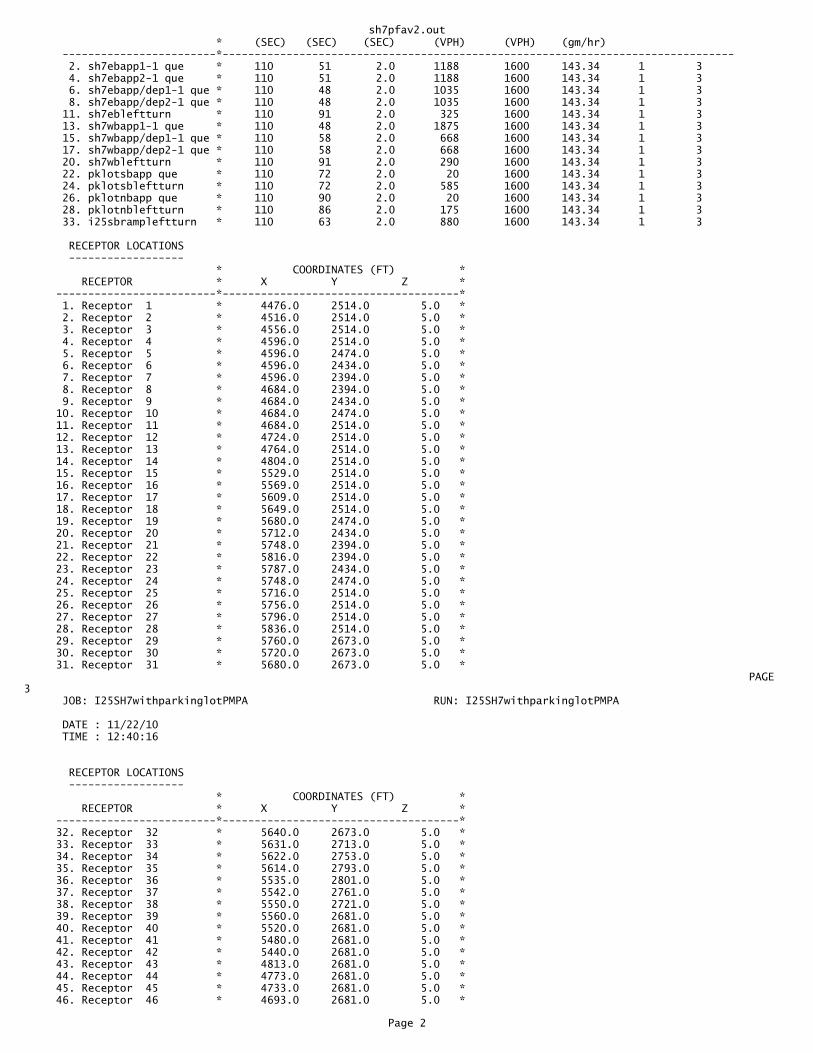
sh7pfav2.out * (SEC) (SEC) (SEC) (VPH) (VPH) (gm/hr) ------------------------*-------------------------------------------------------------------------------- 2. sh7ebapp1-1 que * 110 51 2.0 1188 1600 143.34 1 3 4. sh7ebapp2-1 que * 110 51 2.0 1188 1600 143.34 1 3 6. sh7ebapp/dep1-1 que * 110 48 2.0 1035 1600 143.34 1 3 8. sh7ebapp/dep2-1 que * 110 48 2.0 1035 1600 143.34 1 3 11. sh7ebleftturn * 110 91 2.0 325 1600 143.34 1 3 13. sh7wbapp1-1 que * 110 48 2.0 1875 1600 143.34 1 3 15. sh7wbapp/dep1-1 que * 110 58 2.0 668 1600 143.34 1 3 17. sh7wbapp/dep2-1 que * 110 58 2.0 668 1600 143.34 1 3 20. sh7wbleftturn * 110 91 2.0 290 1600 143.34 1 3 22. pklotsbapp que * 110 72 2.0 20 1600 143.34 1 3 24. pklotsbleftturn * 110 72 2.0 585 1600 143.34 1 3 26. pklotnbapp que * 110 90 2.0 20 1600 143.34 1 3 28. pklotnbleftturn * 110 86 2.0 175 1600 143.34 1 3 33. i25sbrampleftturn * 110 63 2.0 880 1600 143.34 1 3
RECEPTOR LOCATIONS ------------------ * COORDINATES (FT) * RECEPTOR * X Y Z * -------------------------*-------------------------------------* 1. Receptor 1 * 4476.0 2514.0 5.0 * 2. Receptor 2 * 4516.0 2514.0 5.0 * 3. Receptor 3 * 4556.0 2514.0 5.0 * 4. Receptor 4 * 4596.0 2514.0 5.0 * 5. Receptor 5 * 4596.0 2474.0 5.0 * 6. Receptor 6 * 4596.0 2434.0 5.0 * 7. Receptor 7 * 4596.0 2394.0 5.0 * 8. Receptor 8 * 4684.0 2394.0 5.0 * 9. Receptor 9 * 4684.0 2434.0 5.0 * 10. Receptor 10 * 4684.0 2474.0 5.0 * 11. Receptor 11 * 4684.0 2514.0 5.0 * 12. Receptor 12 * 4724.0 2514.0 5.0 * 13. Receptor 13 * 4764.0 2514.0 5.0 * 14. Receptor 14 * 4804.0 2514.0 5.0 * 15. Receptor 15 * 5529.0 2514.0 5.0 * 16. Receptor 16 * 5569.0 2514.0 5.0 * 17. Receptor 17 * 5609.0 2514.0 5.0 * 18. Receptor 18 * 5649.0 2514.0 5.0 * 19. Receptor 19 * 5680.0 2474.0 5.0 * 20. Receptor 20 * 5712.0 2434.0 5.0 * 21. Receptor 21 * 5748.0 2394.0 5.0 * 22. Receptor 22 * 5816.0 2394.0 5.0 * 23. Receptor 23 * 5787.0 2434.0 5.0 * 24. Receptor 24 * 5748.0 2474.0 5.0 * 25. Receptor 25 * 5716.0 2514.0 5.0 * 26. Receptor 26 * 5756.0 2514.0 5.0 * 27. Receptor 27 * 5796.0 2514.0 5.0 * 28. Receptor 28 * 5836.0 2514.0 5.0 * 29. Receptor 29 * 5760.0 2673.0 5.0 * 30. Receptor 30 * 5720.0 2673.0 5.0 * 31. Receptor 31 * 5680.0 2673.0 5.0 *� PAGE 3 JOB: I25SH7withparkinglotPMPA RUN: I25SH7withparkinglotPMPA
DATE : 11/22/10 TIME : 12:40:16
RECEPTOR LOCATIONS ------------------ * COORDINATES (FT) * RECEPTOR * X Y Z * -------------------------*-------------------------------------* 32. Receptor 32 * 5640.0 2673.0 5.0 * 33. Receptor 33 * 5631.0 2713.0 5.0 * 34. Receptor 34 * 5622.0 2753.0 5.0 * 35. Receptor 35 * 5614.0 2793.0 5.0 * 36. Receptor 36 * 5535.0 2801.0 5.0 * 37. Receptor 37 * 5542.0 2761.0 5.0 * 38. Receptor 38 * 5550.0 2721.0 5.0 * 39. Receptor 39 * 5560.0 2681.0 5.0 * 40. Receptor 40 * 5520.0 2681.0 5.0 * 41. Receptor 41 * 5480.0 2681.0 5.0 * 42. Receptor 42 * 5440.0 2681.0 5.0 * 43. Receptor 43 * 4813.0 2681.0 5.0 * 44. Receptor 44 * 4773.0 2681.0 5.0 * 45. Receptor 45 * 4733.0 2681.0 5.0 * 46. Receptor 46 * 4693.0 2681.0 5.0 *
Page 2

sh7pfav2.out 47. Receptor 47 * 4693.0 2721.0 5.0 * 48. Receptor 48 * 4693.0 2761.0 5.0 * 49. Receptor 49 * 4693.0 2801.0 5.0 * 50. Receptor 50 * 4581.0 2801.0 5.0 * 51. Receptor 51 * 4581.0 2761.0 5.0 * 52. Receptor 52 * 4581.0 2721.0 5.0 * 53. Receptor 53 * 4581.0 2681.0 5.0 * 54. Receptor 54 * 4541.0 2681.0 5.0 * 55. Receptor 55 * 4501.0 2681.0 5.0 * 56. Receptor 56 * 4461.0 2681.0 5.0 *� PAGE 4 JOB: I25SH7withparkinglotPMPA RUN: I25SH7withparkinglotPMPA
MODEL RESULTS -------------
REMARKS : In search of the angle corresponding to the maximum concentration, only the first angle, of the angles with same maximum concentrations, is indicated as maximum.
WIND ANGLE RANGE: 0.-360.
WIND * CONCENTRATION ANGLE * (PPM) (DEGR)* REC1 REC2 REC3 REC4 REC5 REC6 REC7 REC8 REC9 REC10 REC11 REC12 REC13 REC14 REC15 REC16 REC17 REC18 REC19 REC20 ------*------------------------------------------------------------------------------------------------------------------------ 0. * 3.9 4.6 5.0 4.1 3.3 2.6 2.2 2.2 2.8 3.4 4.4 4.4 3.7 3.0 4.5 4.5 4.1 4.0 3.2 2.8 10. * 4.3 5.0 5.1 4.0 3.1 3.0 2.9 2.2 2.5 3.0 4.2 4.0 3.1 2.6 4.5 4.6 3.8 3.8 2.9 2.6 20. * 4.8 5.3 5.0 3.4 2.9 2.7 2.5 1.7 2.2 2.7 4.0 3.5 2.7 2.5 4.4 4.2 3.4 3.7 2.7 2.3 30. * 5.1 5.1 4.6 3.6 3.1 2.9 2.7 1.6 1.8 2.4 3.9 3.2 2.7 2.6 4.5 4.1 3.2 3.7 2.7 2.2 40. * 5.0 4.8 4.1 3.9 3.3 2.9 2.5 1.3 1.7 2.3 3.6 3.0 2.7 2.7 4.5 4.2 3.5 3.7 2.6 2.1 50. * 5.2 4.8 4.4 4.2 3.4 2.8 2.2 1.4 1.7 2.2 3.5 3.0 3.0 3.0 4.7 4.2 3.6 3.9 2.7 2.1 60. * 5.3 5.1 4.4 4.5 3.6 2.6 1.9 1.3 1.6 2.2 3.4 3.2 3.2 3.3 4.7 3.9 3.6 3.6 2.4 1.9 70. * 5.2 4.4 4.3 4.3 3.0 2.4 1.9 1.2 1.6 2.1 3.3 3.3 3.5 3.4 4.2 3.6 3.5 3.5 2.2 1.7 80. * 4.5 4.2 3.9 4.2 3.0 2.1 1.6 1.1 1.4 2.1 3.3 3.3 3.3 3.4 3.2 3.0 2.8 3.1 1.8 1.2 90. * 2.9 3.0 2.9 3.3 2.2 1.5 1.0 .5 .7 1.2 2.3 2.3 2.3 2.3 2.1 1.9 2.0 2.2 1.2 1.0 100. * 1.1 1.2 1.3 1.7 1.2 .7 .6 .1 .2 .2 .8 .7 .7 .7 1.0 1.0 1.1 1.6 1.1 .9 110. * .6 .7 .8 1.1 .9 .6 .6 .1 .1 .1 .3 .3 .3 .3 .5 .5 .7 1.2 1.1 1.0 120. * .3 .4 .6 1.0 .8 .6 .6 .1 .1 .1 .1 .1 .1 .1 .3 .4 .6 1.2 1.2 1.0 130. * .2 .3 .4 1.0 .8 .6 .6 .0 .0 .0 .0 .0 .1 .1 .3 .4 .4 1.2 1.1 .9 140. * .2 .3 .5 .9 .7 .6 .6 .0 .0 .0 .0 .0 .0 .0 .2 .2 .4 1.0 .9 .8 150. * .2 .3 .4 .8 .6 .6 .6 .0 .0 .0 .0 .0 .0 .0 .2 .2 .2 .7 .6 .6 160. * .2 .3 .4 .9 .8 .7 .7 .0 .0 .1 .1 .0 .0 .0 .2 .2 .3 .5 .5 .6 170. * .2 .2 .3 .7 .7 .7 .7 .2 .2 .2 .2 .0 .0 .0 .1 .2 .2 .4 .5 .5 180. * .0 .1 .2 .4 .4 .4 .4 .4 .5 .5 .5 .2 .1 .0 .0 .1 .1 .3 .2 .4 190. * .0 .0 .0 .3 .2 .2 .2 .7 .7 .7 .8 .3 .2 .2 .0 .0 .0 .1 .1 .2 200. * .0 .0 .0 .0 .0 .0 .0 .7 .7 .7 .9 .4 .3 .2 .0 .0 .0 .0 .0 .0 210. * .0 .0 .0 .0 .0 .0 .0 .6 .6 .7 .9 .4 .3 .2 .0 .0 .0 .0 .0 .0 220. * .0 .0 .0 .0 .0 .0 .0 .6 .6 .8 1.1 .5 .3 .2 .0 .0 .0 .0 .0 .0 230. * .0 .0 .0 .0 .0 .0 .0 .6 .6 .9 1.1 .5 .3 .2 .0 .0 .0 .0 .0 .0 240. * .0 .0 .0 .0 .0 .0 .0 .5 .5 .9 1.0 .6 .3 .3 .0 .0 .0 .0 .0 .0
Page 3
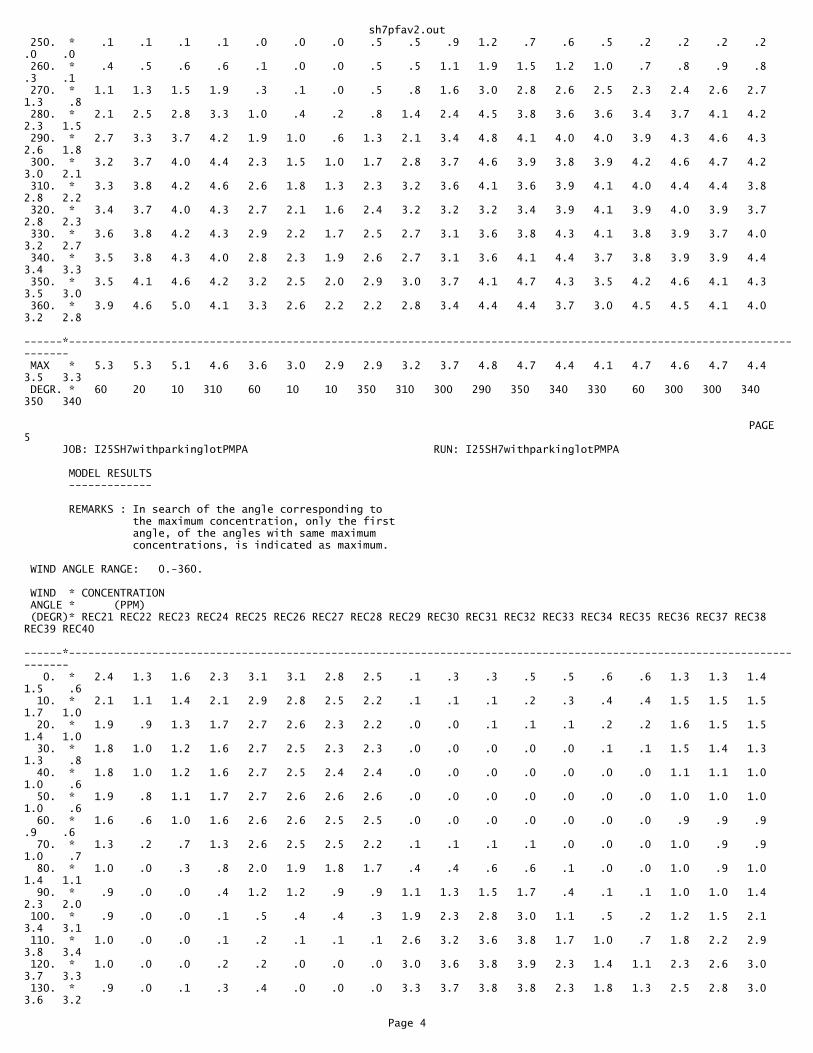
sh7pfav2.out 250. * .1 .1 .1 .1 .0 .0 .0 .5 .5 .9 1.2 .7 .6 .5 .2 .2 .2 .2 .0 .0 260. * .4 .5 .6 .6 .1 .0 .0 .5 .5 1.1 1.9 1.5 1.2 1.0 .7 .8 .9 .8 .3 .1 270. * 1.1 1.3 1.5 1.9 .3 .1 .0 .5 .8 1.6 3.0 2.8 2.6 2.5 2.3 2.4 2.6 2.7 1.3 .8 280. * 2.1 2.5 2.8 3.3 1.0 .4 .2 .8 1.4 2.4 4.5 3.8 3.6 3.6 3.4 3.7 4.1 4.2 2.3 1.5 290. * 2.7 3.3 3.7 4.2 1.9 1.0 .6 1.3 2.1 3.4 4.8 4.1 4.0 4.0 3.9 4.3 4.6 4.3 2.6 1.8 300. * 3.2 3.7 4.0 4.4 2.3 1.5 1.0 1.7 2.8 3.7 4.6 3.9 3.8 3.9 4.2 4.6 4.7 4.2 3.0 2.1 310. * 3.3 3.8 4.2 4.6 2.6 1.8 1.3 2.3 3.2 3.6 4.1 3.6 3.9 4.1 4.0 4.4 4.4 3.8 2.8 2.2 320. * 3.4 3.7 4.0 4.3 2.7 2.1 1.6 2.4 3.2 3.2 3.2 3.4 3.9 4.1 3.9 4.0 3.9 3.7 2.8 2.3 330. * 3.6 3.8 4.2 4.3 2.9 2.2 1.7 2.5 2.7 3.1 3.6 3.8 4.3 4.1 3.8 3.9 3.7 4.0 3.2 2.7 340. * 3.5 3.8 4.3 4.0 2.8 2.3 1.9 2.6 2.7 3.1 3.6 4.1 4.4 3.7 3.8 3.9 3.9 4.4 3.4 3.3 350. * 3.5 4.1 4.6 4.2 3.2 2.5 2.0 2.9 3.0 3.7 4.1 4.7 4.3 3.5 4.2 4.6 4.1 4.3 3.5 3.0 360. * 3.9 4.6 5.0 4.1 3.3 2.6 2.2 2.2 2.8 3.4 4.4 4.4 3.7 3.0 4.5 4.5 4.1 4.0 3.2 2.8 ------*------------------------------------------------------------------------------------------------------------------------ MAX * 5.3 5.3 5.1 4.6 3.6 3.0 2.9 2.9 3.2 3.7 4.8 4.7 4.4 4.1 4.7 4.6 4.7 4.4 3.5 3.3 DEGR. * 60 20 10 310 60 10 10 350 310 300 290 350 340 330 60 300 300 340 350 340
� PAGE 5 JOB: I25SH7withparkinglotPMPA RUN: I25SH7withparkinglotPMPA
MODEL RESULTS -------------
REMARKS : In search of the angle corresponding to the maximum concentration, only the first angle, of the angles with same maximum concentrations, is indicated as maximum.
WIND ANGLE RANGE: 0.-360.
WIND * CONCENTRATION ANGLE * (PPM) (DEGR)* REC21 REC22 REC23 REC24 REC25 REC26 REC27 REC28 REC29 REC30 REC31 REC32 REC33 REC34 REC35 REC36 REC37 REC38 REC39 REC40 ------*------------------------------------------------------------------------------------------------------------------------ 0. * 2.4 1.3 1.6 2.3 3.1 3.1 2.8 2.5 .1 .3 .3 .5 .5 .6 .6 1.3 1.3 1.4 1.5 .6 10. * 2.1 1.1 1.4 2.1 2.9 2.8 2.5 2.2 .1 .1 .1 .2 .3 .4 .4 1.5 1.5 1.5 1.7 1.0 20. * 1.9 .9 1.3 1.7 2.7 2.6 2.3 2.2 .0 .0 .1 .1 .1 .2 .2 1.6 1.5 1.5 1.4 1.0 30. * 1.8 1.0 1.2 1.6 2.7 2.5 2.3 2.3 .0 .0 .0 .0 .0 .1 .1 1.5 1.4 1.3 1.3 .8 40. * 1.8 1.0 1.2 1.6 2.7 2.5 2.4 2.4 .0 .0 .0 .0 .0 .0 .0 1.1 1.1 1.0 1.0 .6 50. * 1.9 .8 1.1 1.7 2.7 2.6 2.6 2.6 .0 .0 .0 .0 .0 .0 .0 1.0 1.0 1.0 1.0 .6 60. * 1.6 .6 1.0 1.6 2.6 2.6 2.5 2.5 .0 .0 .0 .0 .0 .0 .0 .9 .9 .9 .9 .6 70. * 1.3 .2 .7 1.3 2.6 2.5 2.5 2.2 .1 .1 .1 .1 .0 .0 .0 1.0 .9 .9 1.0 .7 80. * 1.0 .0 .3 .8 2.0 1.9 1.8 1.7 .4 .4 .6 .6 .1 .0 .0 1.0 .9 1.0 1.4 1.1 90. * .9 .0 .0 .4 1.2 1.2 .9 .9 1.1 1.3 1.5 1.7 .4 .1 .1 1.0 1.0 1.4 2.3 2.0 100. * .9 .0 .0 .1 .5 .4 .4 .3 1.9 2.3 2.8 3.0 1.1 .5 .2 1.2 1.5 2.1 3.4 3.1 110. * 1.0 .0 .0 .1 .2 .1 .1 .1 2.6 3.2 3.6 3.8 1.7 1.0 .7 1.8 2.2 2.9 3.8 3.4 120. * 1.0 .0 .0 .2 .2 .0 .0 .0 3.0 3.6 3.8 3.9 2.3 1.4 1.1 2.3 2.6 3.0 3.7 3.3 130. * .9 .0 .1 .3 .4 .0 .0 .0 3.3 3.7 3.8 3.8 2.3 1.8 1.3 2.5 2.8 3.0 3.6 3.2
Page 4
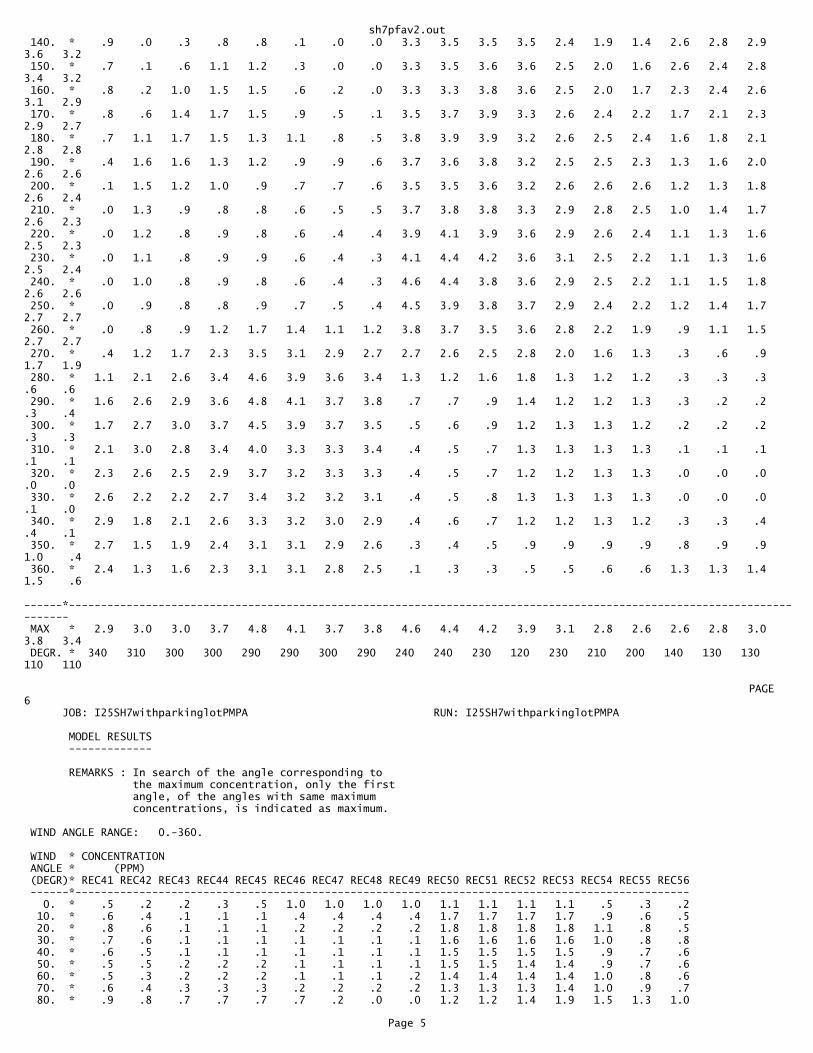
sh7pfav2.out 140. * .9 .0 .3 .8 .8 .1 .0 .0 3.3 3.5 3.5 3.5 2.4 1.9 1.4 2.6 2.8 2.9 3.6 3.2 150. * .7 .1 .6 1.1 1.2 .3 .0 .0 3.3 3.5 3.6 3.6 2.5 2.0 1.6 2.6 2.4 2.8 3.4 3.2 160. * .8 .2 1.0 1.5 1.5 .6 .2 .0 3.3 3.3 3.8 3.6 2.5 2.0 1.7 2.3 2.4 2.6 3.1 2.9 170. * .8 .6 1.4 1.7 1.5 .9 .5 .1 3.5 3.7 3.9 3.3 2.6 2.4 2.2 1.7 2.1 2.3 2.9 2.7 180. * .7 1.1 1.7 1.5 1.3 1.1 .8 .5 3.8 3.9 3.9 3.2 2.6 2.5 2.4 1.6 1.8 2.1 2.8 2.8 190. * .4 1.6 1.6 1.3 1.2 .9 .9 .6 3.7 3.6 3.8 3.2 2.5 2.5 2.3 1.3 1.6 2.0 2.6 2.6 200. * .1 1.5 1.2 1.0 .9 .7 .7 .6 3.5 3.5 3.6 3.2 2.6 2.6 2.6 1.2 1.3 1.8 2.6 2.4 210. * .0 1.3 .9 .8 .8 .6 .5 .5 3.7 3.8 3.8 3.3 2.9 2.8 2.5 1.0 1.4 1.7 2.6 2.3 220. * .0 1.2 .8 .9 .8 .6 .4 .4 3.9 4.1 3.9 3.6 2.9 2.6 2.4 1.1 1.3 1.6 2.5 2.3 230. * .0 1.1 .8 .9 .9 .6 .4 .3 4.1 4.4 4.2 3.6 3.1 2.5 2.2 1.1 1.3 1.6 2.5 2.4 240. * .0 1.0 .8 .9 .8 .6 .4 .3 4.6 4.4 3.8 3.6 2.9 2.5 2.2 1.1 1.5 1.8 2.6 2.6 250. * .0 .9 .8 .8 .9 .7 .5 .4 4.5 3.9 3.8 3.7 2.9 2.4 2.2 1.2 1.4 1.7 2.7 2.7 260. * .0 .8 .9 1.2 1.7 1.4 1.1 1.2 3.8 3.7 3.5 3.6 2.8 2.2 1.9 .9 1.1 1.5 2.7 2.7 270. * .4 1.2 1.7 2.3 3.5 3.1 2.9 2.7 2.7 2.6 2.5 2.8 2.0 1.6 1.3 .3 .6 .9 1.7 1.9 280. * 1.1 2.1 2.6 3.4 4.6 3.9 3.6 3.4 1.3 1.2 1.6 1.8 1.3 1.2 1.2 .3 .3 .3 .6 .6 290. * 1.6 2.6 2.9 3.6 4.8 4.1 3.7 3.8 .7 .7 .9 1.4 1.2 1.2 1.3 .3 .2 .2 .3 .4 300. * 1.7 2.7 3.0 3.7 4.5 3.9 3.7 3.5 .5 .6 .9 1.2 1.3 1.3 1.2 .2 .2 .2 .3 .3 310. * 2.1 3.0 2.8 3.4 4.0 3.3 3.3 3.4 .4 .5 .7 1.3 1.3 1.3 1.3 .1 .1 .1 .1 .1 320. * 2.3 2.6 2.5 2.9 3.7 3.2 3.3 3.3 .4 .5 .7 1.2 1.2 1.3 1.3 .0 .0 .0 .0 .0 330. * 2.6 2.2 2.2 2.7 3.4 3.2 3.2 3.1 .4 .5 .8 1.3 1.3 1.3 1.3 .0 .0 .0 .1 .0 340. * 2.9 1.8 2.1 2.6 3.3 3.2 3.0 2.9 .4 .6 .7 1.2 1.2 1.3 1.2 .3 .3 .4 .4 .1 350. * 2.7 1.5 1.9 2.4 3.1 3.1 2.9 2.6 .3 .4 .5 .9 .9 .9 .9 .8 .9 .9 1.0 .4 360. * 2.4 1.3 1.6 2.3 3.1 3.1 2.8 2.5 .1 .3 .3 .5 .5 .6 .6 1.3 1.3 1.4 1.5 .6 ------*------------------------------------------------------------------------------------------------------------------------ MAX * 2.9 3.0 3.0 3.7 4.8 4.1 3.7 3.8 4.6 4.4 4.2 3.9 3.1 2.8 2.6 2.6 2.8 3.0 3.8 3.4 DEGR. * 340 310 300 300 290 290 300 290 240 240 230 120 230 210 200 140 130 130 110 110
� PAGE 6 JOB: I25SH7withparkinglotPMPA RUN: I25SH7withparkinglotPMPA
MODEL RESULTS -------------
REMARKS : In search of the angle corresponding to the maximum concentration, only the first angle, of the angles with same maximum concentrations, is indicated as maximum.
WIND ANGLE RANGE: 0.-360.
WIND * CONCENTRATION ANGLE * (PPM) (DEGR)* REC41 REC42 REC43 REC44 REC45 REC46 REC47 REC48 REC49 REC50 REC51 REC52 REC53 REC54 REC55 REC56 ------*------------------------------------------------------------------------------------------------ 0. * .5 .2 .2 .3 .5 1.0 1.0 1.0 1.0 1.1 1.1 1.1 1.1 .5 .3 .2 10. * .6 .4 .1 .1 .1 .4 .4 .4 .4 1.7 1.7 1.7 1.7 .9 .6 .5 20. * .8 .6 .1 .1 .1 .2 .2 .2 .2 1.8 1.8 1.8 1.8 1.1 .8 .5 30. * .7 .6 .1 .1 .1 .1 .1 .1 .1 1.6 1.6 1.6 1.6 1.0 .8 .8 40. * .6 .5 .1 .1 .1 .1 .1 .1 .1 1.5 1.5 1.5 1.5 .9 .7 .6 50. * .5 .5 .2 .2 .2 .1 .1 .1 .1 1.5 1.5 1.4 1.4 .9 .7 .6 60. * .5 .3 .2 .2 .2 .1 .1 .1 .2 1.4 1.4 1.4 1.4 1.0 .8 .6 70. * .6 .4 .3 .3 .3 .2 .2 .2 .2 1.3 1.3 1.3 1.4 1.0 .9 .7 80. * .9 .8 .7 .7 .7 .7 .2 .0 .0 1.2 1.2 1.4 1.9 1.5 1.3 1.0
Page 5

sh7pfav2.out 90. * 2.0 1.9 1.8 2.0 1.9 2.0 1.0 .7 .4 1.6 1.9 2.4 3.6 3.2 2.8 2.6 100. * 2.9 2.7 2.7 2.8 3.0 3.3 1.7 1.2 1.0 2.2 2.4 3.3 4.9 4.3 3.8 3.8 110. * 3.2 3.2 2.7 2.7 3.1 3.7 1.9 1.6 1.3 2.3 2.8 3.6 4.7 4.1 3.4 3.4 120. * 3.2 3.4 2.7 2.7 3.4 4.2 2.2 1.6 1.3 2.8 3.3 3.8 4.4 3.6 3.5 3.4 130. * 3.1 3.2 2.5 2.6 3.6 4.3 2.3 1.6 1.2 3.1 3.3 3.4 3.9 3.3 3.3 3.5 140. * 3.0 3.0 2.2 2.6 3.7 4.3 2.4 1.8 1.3 3.0 3.1 3.2 3.5 3.0 3.2 3.3 150. * 3.0 2.8 2.1 2.6 3.9 4.4 2.8 2.1 1.5 2.9 2.9 3.1 3.2 3.0 3.3 3.2 160. * 2.8 2.5 2.0 2.9 4.1 4.3 2.8 2.1 1.7 2.7 2.5 2.6 3.1 3.3 3.3 3.0 170. * 2.7 2.3 2.0 3.3 4.3 4.3 3.0 2.4 2.0 2.4 2.5 2.7 3.3 3.4 3.3 2.8 180. * 2.6 2.3 2.1 3.9 4.7 4.5 3.1 2.6 2.0 1.8 2.2 2.6 3.2 3.5 3.0 2.4 190. * 2.3 2.0 2.4 4.2 4.9 4.2 3.0 2.6 2.5 1.8 2.1 2.5 3.3 3.2 2.7 2.3 200. * 2.2 2.0 2.8 4.7 4.9 3.5 2.9 2.8 2.4 1.5 1.8 2.4 3.2 3.0 2.5 2.1 210. * 2.1 2.1 3.4 5.0 4.6 3.7 3.0 2.8 2.6 1.3 1.7 2.3 3.2 2.8 2.2 1.9 220. * 2.2 2.2 4.3 4.8 4.6 3.6 3.1 2.9 2.8 1.1 1.4 2.0 3.1 2.5 2.1 1.9 230. * 2.4 2.4 5.0 5.0 4.5 3.9 3.1 2.8 2.3 .9 1.3 1.7 2.9 2.4 2.2 2.1 240. * 2.6 2.6 5.2 5.0 4.3 4.0 3.0 2.6 2.0 .8 1.0 1.5 2.6 2.3 2.2 2.0 250. * 2.7 2.7 4.8 4.3 3.9 3.8 2.7 2.0 1.7 .5 .7 1.2 2.1 2.0 2.0 1.8 260. * 2.7 2.4 3.6 3.2 3.0 2.8 1.9 1.6 1.3 .1 .3 .7 1.6 1.5 1.5 1.3 270. * 1.9 1.7 2.3 1.8 1.9 2.1 1.5 1.2 1.1 .0 .1 .2 .8 .8 .8 .7 280. * .8 .8 .9 1.0 1.2 1.4 1.2 1.1 1.1 .0 .0 .0 .3 .3 .3 .3 290. * .4 .4 .5 .6 .8 1.2 1.1 1.1 1.1 .0 .0 .0 .1 .1 .1 .1 300. * .3 .3 .6 .6 .8 1.1 1.1 1.1 1.1 .0 .0 .0 .0 .0 .0 .0 310. * .2 .3 .6 .6 .8 1.2 1.2 1.2 1.2 .0 .0 .0 .0 .0 .0 .0 320. * .1 .1 .6 .6 .9 1.4 1.4 1.4 1.4 .0 .0 .0 .0 .0 .0 .0 330. * .0 .0 .6 .7 1.0 1.4 1.4 1.4 1.4 .0 .0 .0 .0 .0 .0 .0 340. * .1 .0 .6 .7 1.0 1.5 1.5 1.5 1.5 .1 .1 .1 .1 .0 .0 .0 350. * .2 .1 .4 .6 .8 1.5 1.5 1.5 1.5 .4 .5 .5 .5 .2 .0 .0 360. * .5 .2 .2 .3 .5 1.0 1.0 1.0 1.0 1.1 1.1 1.1 1.1 .5 .3 .2 ------*------------------------------------------------------------------------------------------------ MAX * 3.2 3.4 5.2 5.0 4.9 4.5 3.1 2.9 2.8 3.1 3.3 3.8 4.9 4.3 3.8 3.8 DEGR. * 120 120 240 210 190 180 230 220 220 130 120 120 100 100 100 100
THE HIGHEST CONCENTRATION OF 5.30 PPM OCCURRED AT RECEPTOR REC2 .� PAGE 7 JOB: I25SH7withparkinglotPMPA RUN: I25SH7withparkinglotPMPA
DATE : 11/22/10 TIME : 12:40:16
RECEPTOR - LINK MATRIX FOR THE ANGLE PRODUCING THE MAXIMUM CONCENTRATION FOR EACH RECEPTOR
* CO/LINK (PPM) * ANGLE (DEGREES) * REC1 REC2 REC3 REC4 REC5 REC6 REC7 REC8 REC9 REC10 REC11 REC12 REC13 REC14 REC15 REC16 REC17 REC18REC19 REC20 LINK # * 60 20 10 310 60 10 10 350 310 300 290 350 340 330 60 300 300 340 350 340 -------*------------------------------------------------------------------------------------------------------------------------ 1 * .7 .7 .7 .8 .0 .3 .2 .1 .4 .6 .8 .0 .0 .0 .0 .0 .0 .0 .0 .0 2 * .5 .6 .5 .7 .0 .1 .1 .0 .3 .3 .4 .0 .0 .0 .0 .0 .0 .0 .0 .0 3 * 1.2 .9 .9 1.1 .0 .3 .2 .1 .5 .7 .9 .0 .0 .0 .0 .0 .0 .0 .0 .0 4 * .9 .9 .8 .9 .0 .1 .1 .0 .3 .4 .4 .0 .0 .0 .0 .0 .0 .0 .0 .0 5 * .2 .0 .0 .0 .7 .1 .1 .2 .0 .0 .0 .8 .8 .8 .5 1.0 1.0 .3 .0 .1 6 * .0 .0 .0 .0 .0 .0 .0 .0 .0 .0 .0 .0 .0 .0 .2 .4 .5 .1 .0 .0 7 * .1 .0 .0 .0 .8 .1 .1 .3 .0 .0 .5 1.1 1.0 1.1 1.2 1.4 1.4 .2 .0 .1 8 * .0 .0 .0 .0 .0 .0 .0 .0 .0 .0 .0 .0 .0 .0 .7 .8 .9 .0 .0 .0 9 * .0 .0 .0 .0 .0 .0 .0 .0 .0 .0 .0 .0 .0 .0 .4 .0 .0 .5 .5 .3 10 * .0 .0 .0 .0 .0 .0 .0 .0 .0 .0 .0 .0 .0 .0 .3 .0 .0 .8 .5 .4 11 * .4 .8 .7 .5 .0 .1 .1 .1 .2 .3 .4 .0 .0 .0 .0 .0 .0 .0 .0 .0 12 * .0 .0 .0 .0 .0 .0 .0 .0 .0 .0 .0 .0 .0 .0 .6 .0 .0 .2 .3 .2 13 * .0 .0 .0 .0 .0 .0 .0 .0 .0 .0 .0 .0 .0 .0 .4 .0 .0 .1 .3 .2 14 * .2 .0 .0 .0 .3 .1 .1 .1 .0 .0 .0 .3 .3 .3 .0 .4 .4 .2 .1 .1
Page 6

sh7pfav2.out 15 * .1 .0 .0 .0 .1 .0 .1 .1 .0 .0 .0 .3 .4 .4 .0 .0 .0 .0 .0 .0 16 * .2 .0 .0 .0 .3 .1 .1 .1 .0 .0 .0 .2 .2 .2 .0 .3 .3 .2 .1 .1 17 * .1 .0 .0 .0 .1 .1 .1 .1 .0 .0 .0 .3 .3 .3 .0 .0 .0 .0 .0 .0 18 * .1 .3 .3 .3 .0 .1 .1 .1 .2 .2 .3 .0 .0 .0 .0 .0 .0 .0 .0 .0 19 * .1 .2 .2 .3 .0 .1 .1 .1 .2 .2 .2 .0 .0 .0 .0 .0 .0 .0 .0 .0 20 * .1 .0 .0 .0 .2 .1 .1 .1 .0 .0 .0 .7 .6 .4 .0 .0 .0 .0 .0 .0 21 * .1 .4 .5 .0 .0 .3 .3 .3 .0 .0 .0 .3 .3 .2 .0 .1 .1 .0 .0 .0 22 * .0 .0 .0 .0 .0 .0 .0 .0 .0 .0 .0 .0 .0 .0 .0 .0 .0 .0 .0 .0 23 * .1 .0 .0 .0 .3 .3 .3 .1 .2 .2 .2 .0 .0 .0 .0 .0 .0 .0 .0 .0 24 * .0 .3 .3 .0 .0 .2 .2 .2 .0 .0 .0 .3 .2 .2 .0 .1 .1 .0 .0 .0 25 * .0 .0 .0 .0 .2 .1 .1 .4 .4 .3 .3 .0 .0 .0 .0 .0 .0 .0 .0 .0 26 * .0 .0 .0 .0 .1 .0 .0 .0 .0 .0 .2 .0 .0 .0 .0 .0 .0 .0 .0 .0 27 * .1 .2 .2 .0 .0 .3 .3 .2 .0 .0 .0 .4 .3 .2 .0 .1 .0 .0 .0 .0 28 * .0 .0 .0 .0 .4 .1 .1 .2 .5 .5 .2 .0 .0 .0 .0 .0 .0 .0 .0 .0 29 * .1 .0 .0 .0 .1 .0 .0 .0 .0 .0 .0 .0 .0 .0 .0 .0 .0 .1 .1 .1 30 * .0 .0 .0 .0 .0 .0 .0 .0 .0 .0 .0 .0 .0 .0 .1 .0 .0 .5 .3 .3 31 * .0 .0 .0 .0 .0 .0 .0 .0 .0 .0 .0 .0 .0 .0 .3 .0 .0 .9 1.0 1.1 32 * .0 .0 .0 .0 .0 .0 .0 .0 .0 .0 .0 .0 .0 .0 .0 .0 .0 .0 .0 .0 33 * .0 .0 .0 .0 .0 .0 .0 .0 .0 .0 .0 .0 .0 .0 .0 .0 .0 .3 .3 .3� PAGE 8 JOB: I25SH7withparkinglotPMPA RUN: I25SH7withparkinglotPMPA
DATE : 11/22/10 TIME : 12:40:16
RECEPTOR - LINK MATRIX FOR THE ANGLE PRODUCING THE MAXIMUM CONCENTRATION FOR EACH RECEPTOR
* CO/LINK (PPM) * ANGLE (DEGREES) * REC21 REC22 REC23 REC24 REC25 REC26 REC27 REC28 REC29 REC30 REC31 REC32 REC33 REC34 REC35 REC36 REC37 REC38REC39 REC40 LINK # * 340 310 300 300 290 290 300 290 240 240 230 120 230 210 200 140 130 130 110 110 -------*------------------------------------------------------------------------------------------------------------------------ 1 * .0 .0 .0 .0 .0 .0 .0 .0 .0 .0 .0 .0 .0 .0 .0 .0 .0 .0 .0 .0 2 * .0 .0 .0 .0 .0 .0 .0 .0 .0 .0 .0 .0 .0 .0 .0 .0 .0 .0 .0 .0 3 * .0 .0 .0 .0 .0 .0 .0 .0 .0 .0 .0 .0 .0 .0 .0 .0 .0 .0 .0 .0 4 * .0 .0 .0 .0 .0 .0 .0 .0 .0 .0 .0 .0 .0 .0 .0 .0 .0 .0 .0 .0 5 * .0 .2 .4 .4 .7 .6 .2 .3 .4 .5 .5 .0 .5 .4 .3 .0 .0 .0 .0 .0 6 * .0 .1 .2 .2 .3 .2 .1 .1 .2 .2 .3 .0 .2 .2 .2 .0 .0 .0 .0 .0 7 * .0 .2 .4 .4 .7 .5 .1 .3 .4 .5 .5 .0 .4 .3 .3 .0 .0 .0 .0 .0 8 * .0 .1 .2 .2 .3 .2 .0 .1 .2 .2 .3 .0 .1 .2 .2 .0 .0 .0 .0 .0 9 * .3 .2 .1 .2 .3 .5 .8 .7 .2 .1 .1 .6 .0 .0 .0 .3 .3 .4 .5 .5 10 * .3 .2 .2 .3 .7 .9 1.1 1.1 .1 .0 .0 .4 .0 .0 .0 .2 .3 .3 .3 .4 11 * .0 .0 .0 .0 .0 .0 .0 .0 .0 .0 .0 .0 .0 .0 .0 .0 .0 .0 .0 .0 12 * .2 .1 .0 .0 .0 .0 .3 .2 1.3 1.2 1.0 1.5 .0 .0 .0 .4 .5 .5
Page 7
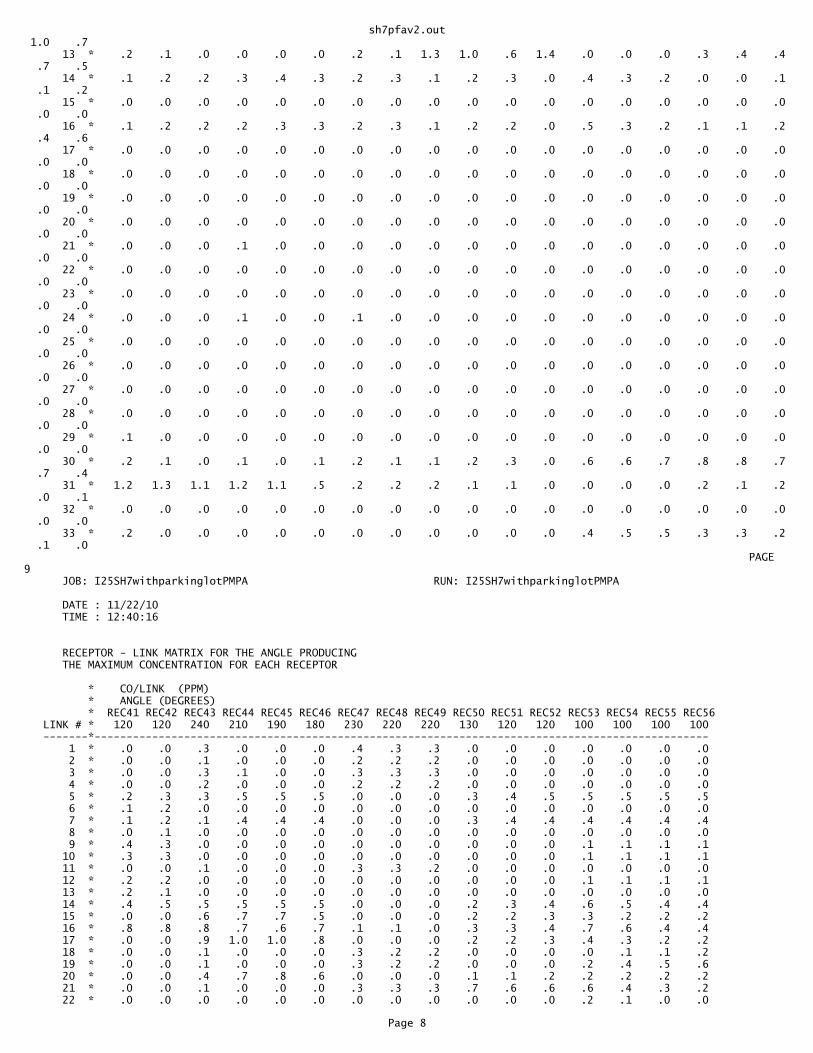
sh7pfav2.out 1.0 .7 13 * .2 .1 .0 .0 .0 .0 .2 .1 1.3 1.0 .6 1.4 .0 .0 .0 .3 .4 .4 .7 .5 14 * .1 .2 .2 .3 .4 .3 .2 .3 .1 .2 .3 .0 .4 .3 .2 .0 .0 .1 .1 .2 15 * .0 .0 .0 .0 .0 .0 .0 .0 .0 .0 .0 .0 .0 .0 .0 .0 .0 .0 .0 .0 16 * .1 .2 .2 .2 .3 .3 .2 .3 .1 .2 .2 .0 .5 .3 .2 .1 .1 .2 .4 .6 17 * .0 .0 .0 .0 .0 .0 .0 .0 .0 .0 .0 .0 .0 .0 .0 .0 .0 .0 .0 .0 18 * .0 .0 .0 .0 .0 .0 .0 .0 .0 .0 .0 .0 .0 .0 .0 .0 .0 .0 .0 .0 19 * .0 .0 .0 .0 .0 .0 .0 .0 .0 .0 .0 .0 .0 .0 .0 .0 .0 .0 .0 .0 20 * .0 .0 .0 .0 .0 .0 .0 .0 .0 .0 .0 .0 .0 .0 .0 .0 .0 .0 .0 .0 21 * .0 .0 .0 .1 .0 .0 .0 .0 .0 .0 .0 .0 .0 .0 .0 .0 .0 .0 .0 .0 22 * .0 .0 .0 .0 .0 .0 .0 .0 .0 .0 .0 .0 .0 .0 .0 .0 .0 .0 .0 .0 23 * .0 .0 .0 .0 .0 .0 .0 .0 .0 .0 .0 .0 .0 .0 .0 .0 .0 .0 .0 .0 24 * .0 .0 .0 .1 .0 .0 .1 .0 .0 .0 .0 .0 .0 .0 .0 .0 .0 .0 .0 .0 25 * .0 .0 .0 .0 .0 .0 .0 .0 .0 .0 .0 .0 .0 .0 .0 .0 .0 .0 .0 .0 26 * .0 .0 .0 .0 .0 .0 .0 .0 .0 .0 .0 .0 .0 .0 .0 .0 .0 .0 .0 .0 27 * .0 .0 .0 .0 .0 .0 .0 .0 .0 .0 .0 .0 .0 .0 .0 .0 .0 .0 .0 .0 28 * .0 .0 .0 .0 .0 .0 .0 .0 .0 .0 .0 .0 .0 .0 .0 .0 .0 .0 .0 .0 29 * .1 .0 .0 .0 .0 .0 .0 .0 .0 .0 .0 .0 .0 .0 .0 .0 .0 .0 .0 .0 30 * .2 .1 .0 .1 .0 .1 .2 .1 .1 .2 .3 .0 .6 .6 .7 .8 .8 .7 .7 .4 31 * 1.2 1.3 1.1 1.2 1.1 .5 .2 .2 .2 .1 .1 .0 .0 .0 .0 .2 .1 .2 .0 .1 32 * .0 .0 .0 .0 .0 .0 .0 .0 .0 .0 .0 .0 .0 .0 .0 .0 .0 .0 .0 .0 33 * .2 .0 .0 .0 .0 .0 .0 .0 .0 .0 .0 .0 .4 .5 .5 .3 .3 .2 .1 .0� PAGE 9 JOB: I25SH7withparkinglotPMPA RUN: I25SH7withparkinglotPMPA
DATE : 11/22/10 TIME : 12:40:16
RECEPTOR - LINK MATRIX FOR THE ANGLE PRODUCING THE MAXIMUM CONCENTRATION FOR EACH RECEPTOR
* CO/LINK (PPM) * ANGLE (DEGREES) * REC41 REC42 REC43 REC44 REC45 REC46 REC47 REC48 REC49 REC50 REC51 REC52 REC53 REC54 REC55 REC56 LINK # * 120 120 240 210 190 180 230 220 220 130 120 120 100 100 100 100 -------*------------------------------------------------------------------------------------------------ 1 * .0 .0 .3 .0 .0 .0 .4 .3 .3 .0 .0 .0 .0 .0 .0 .0 2 * .0 .0 .1 .0 .0 .0 .2 .2 .2 .0 .0 .0 .0 .0 .0 .0 3 * .0 .0 .3 .1 .0 .0 .3 .3 .3 .0 .0 .0 .0 .0 .0 .0 4 * .0 .0 .2 .0 .0 .0 .2 .2 .2 .0 .0 .0 .0 .0 .0 .0 5 * .2 .3 .3 .5 .5 .5 .0 .0 .0 .3 .4 .5 .5 .5 .5 .5 6 * .1 .2 .0 .0 .0 .0 .0 .0 .0 .0 .0 .0 .0 .0 .0 .0 7 * .1 .2 .1 .4 .4 .4 .0 .0 .0 .3 .4 .4 .4 .4 .4 .4 8 * .0 .1 .0 .0 .0 .0 .0 .0 .0 .0 .0 .0 .0 .0 .0 .0 9 * .4 .3 .0 .0 .0 .0 .0 .0 .0 .0 .0 .0 .1 .1 .1 .1 10 * .3 .3 .0 .0 .0 .0 .0 .0 .0 .0 .0 .0 .1 .1 .1 .1 11 * .0 .0 .1 .0 .0 .0 .3 .3 .2 .0 .0 .0 .0 .0 .0 .0 12 * .2 .2 .0 .0 .0 .0 .0 .0 .0 .0 .0 .0 .1 .1 .1 .1 13 * .2 .1 .0 .0 .0 .0 .0 .0 .0 .0 .0 .0 .0 .0 .0 .0 14 * .4 .5 .5 .5 .5 .5 .0 .0 .0 .2 .3 .4 .6 .5 .4 .4 15 * .0 .0 .6 .7 .7 .5 .0 .0 .0 .2 .2 .3 .3 .2 .2 .2 16 * .8 .8 .8 .7 .6 .7 .1 .1 .0 .3 .3 .4 .7 .6 .4 .4 17 * .0 .0 .9 1.0 1.0 .8 .0 .0 .0 .2 .2 .3 .4 .3 .2 .2 18 * .0 .0 .1 .0 .0 .0 .3 .2 .2 .0 .0 .0 .0 .1 .1 .2 19 * .0 .0 .1 .0 .0 .0 .3 .2 .2 .0 .0 .0 .2 .4 .5 .6 20 * .0 .0 .4 .7 .8 .6 .0 .0 .0 .1 .1 .2 .2 .2 .2 .2 21 * .0 .0 .1 .0 .0 .0 .3 .3 .3 .7 .6 .6 .6 .4 .3 .2 22 * .0 .0 .0 .0 .0 .0 .0 .0 .0 .0 .0 .0 .2 .1 .0 .0
Page 8
sh7pfav2.out 23 * .0 .0 .1 .1 .1 .1 .0 .0 .0 .0 .0 .0 .0 .0 .0 .0 24 * .0 .0 .0 .0 .0 .0 .2 .2 .3 .4 .4 .3 .2 .1 .1 .1 25 * .0 .0 .1 .2 .2 .2 .0 .0 .0 .0 .0 .0 .0 .0 .0 .0 26 * .0 .0 .0 .0 .0 .0 .0 .0 .0 .0 .0 .0 .0 .0 .0 .0 27 * .0 .0 .1 .0 .0 .1 .5 .6 .6 .3 .3 .3 .3 .2 .2 .1 28 * .0 .0 .0 .1 .1 .1 .0 .0 .0 .0 .0 .0 .0 .0 .0 .0 29 * .0 .0 .0 .0 .0 .0 .0 .0 .0 .0 .0 .0 .0 .0 .0 .0 30 * .2 .1 .0 .0 .0 .0 .0 .0 .0 .0 .0 .0 .0 .0 .0 .0 31 * .3 .3 .0 .0 .0 .0 .0 .0 .0 .0 .0 .0 .0 .0 .0 .0 32 * .0 .0 .0 .0 .0 .0 .0 .0 .0 .1 .1 .1 .0 .0 .0 .0 33 * .0 .0 .0 .0 .0 .0 .0 .0 .0 .0 .0 .0 .0 .0 .0 .0
Page 9
sgmlpkga.in'SugarMillStationPMPackageA', 60 , 175 , 0 , 0 , 20 , 0.3048 , 1 , 1 'Receptor 1', 862 ,-18 , 5 'Receptor 2', 862 , 22 , 5 'Receptor 3', 862 , 62 , 5 'Receptor 4', 902 , 62 , 5 'Receptor 5', 942 , 62 , 5 'Receptor 6', 942 , 174 , 5 'Receptor 7', 902 , 174 , 5 'Receptor 8', 862 , 174 , 5 'Receptor 9', 862 , 214 , 5 'Receptor 10', 862 , 254 , 5 'Receptor 11', 762 , 254 , 5 'Receptor 12', 762 , 214 , 5 'Receptor 13', 762 , 174 , 5 'Receptor 14', 722 , 174 , 5 'Receptor 15', 682 , 174 , 5 'Receptor 16', 682 , 62 , 5 'Receptor 17', 722 , 62 , 5 'Receptor 18', 762 , 62 , 5 'Receptor 19', 762 , 22 , 5 'Receptor 20', 762 ,-18 , 5 'SugarMillStationPMPackageA', 16 , 1 , 1 ,'CO' 1 'SH119ebapp','AG',-188 , 94 , 812 , 94 , 3050 , 23.7 , 0 , 44 2 'SH119ebappque','AG', 760 , 94 ,-188 , 94 , 0 , 24 , 2 100 , 45 , 2 , 2500 , 143.34 , 1600 , 1 , 3 2 'SH119ebleftturn','AG', 760 , 118 , 310 , 118 , 0 , 24 , 2 100 , 80 , 2 , 475 , 143.34 , 1600 , 1 , 3 1 'SH119ebdep','AG', 812 , 94 , 1812 , 94 , 3055 , 23.7 , 0 , 44 1 'SH119wbapp','AG', 1812 , 142 , 812 , 142 , 2730 , 46.9 , 0 , 44 2 'SH119wbappque','AG', 864 , 142 , 1812 , 142 , 0 , 24 , 2 100 , 55 , 2 , 1575 , 143.34 , 1600 , 1 , 3 2 'SH119wbleftturn','AG', 864 , 118 , 1274 , 118 , 0 , 24 , 2 100 , 90 , 2 , 50 , 143.34 , 1600 , 1 , 3 1 'SH119wbdep','AG', 812 , 142 ,-188 , 142 , 2150 , 46.9 , 0 , 44 1 'cntysbapp','AG', 794 , 1118 , 794 , 118 , 1135 , 45.5 , 0 , 44 2 'cntysbappque','AG', 794 , 188 , 794 , 1118 , 0 , 24 , 2 100 , 90 , 2 , 315 , 143.34 , 1600 , 1 , 3 2 'cntysbleftturn','AG', 812 , 188 , 812 , 363 , 0 , 12 , 1 100 , 65 , 2 , 445 , 143.34 , 1600 , 1 , 3 1 'cntysbdep','AG', 794 , 118 , 794 ,-882 , 440 , 45.5 , 0 , 44 1 'cntynbapp','AG', 830 ,-882 , 830 , 118 , 801 , 45.5 , 0 , 44 2 'cntynbappque','AG', 830 , 48 , 830 ,-882 , 0 , 24 , 2 100 , 90 , 2 , 491 , 143.34 , 1600 , 1 , 3 1 'cntynbdep','AG', 830 , 118 , 830 , 1118 , 2067 , 45.5 , 0 , 44 2 'cntynbleftturn','AG', 812 , 48 , 812 ,-127 , 0 , 12 , 1 100 , 65 , 2 , 200 , 143.34 , 1600 , 1 , 3 1 , 0 , 4 , 1000 , 0 ,'Y', 10 , 0 , 36
Page 1

sgmlpkga.out� CAL3QHC: LINE SOURCE DISPERSION MODEL - VERSION 2.0 Dated 95221 PAGE 1
JOB: SugarMillStationPMPackageA RUN: SugarMillStationPMPackageA
DATE : 11/16/10 TIME : 17:27:28
The MODE flag has been set to C for calculating CO averages.
SITE & METEOROLOGICAL VARIABLES ------------------------------- VS = .0 CM/S VD = .0 CM/S Z0 = 175. CM U = 1.0 M/S CLAS = 4 (D) ATIM = 60. MINUTES MIXH = 1000. M AMB = .0 PPM
LINK VARIABLES -------------- LINK DESCRIPTION * LINK COORDINATES (FT) * LENGTH BRG TYPE VPH EF H W V/C QUEUE * X1 Y1 X2 Y2 * (FT) (DEG) (G/MI) (FT) (FT) (VEH) ------------------------*----------------------------------------*---------------------------------------------------------- 1. SH119ebapp * -188.0 94.0 812.0 94.0 * 1000. 90. AG 3050. 23.7 .0 44.0 2. SH119ebappque * 760.0 94.0 -4032.6 93.2 * 4793. 270. AG 346. 100.0 .0 24.0 1.53 243.5 3. SH119ebleftturn * 760.0 118.0 613.5 118.0 * 146. 270. AG 615. 100.0 .0 24.0 .93 7.4 4. SH119ebdep * 812.0 94.0 1812.0 94.0 * 1000. 90. AG 3055. 23.7 .0 44.0 5. SH119wbapp * 1812.0 142.0 812.0 142.0 * 1000. 270. AG 2730. 46.9 .0 44.0 6. SH119wbappque * 864.0 142.0 2539.8 142.0 * 1676. 90. AG 423. 100.0 .0 24.0 1.20 85.1 7. SH119wbleftturn * 864.0 118.0 876.3 118.0 * 12. 90. AG 692. 100.0 .0 24.0 .26 .6 8. SH119wbdep * 812.0 142.0 -188.0 142.0 * 1000. 270. AG 2150. 46.9 .0 44.0 9. cntysbapp * 794.0 1118.0 794.0 118.0 * 1000. 180. AG 1135. 45.5 .0 44.0 10. cntysbappque * 794.0 188.0 794.0 944.0 * 756. 360. AG 692. 100.0 .0 24.0 1.64 38.4 11. cntysbleftturn * 812.0 188.0 812.0 383.4 * 195. 360. AG 250. 100.0 .0 12.0 .90 9.9 12. cntysbdep * 794.0 118.0 794.0 -882.0 * 1000. 180. AG 440. 45.5 .0 44.0 13. cntynbapp * 830.0 -882.0 830.0 118.0 * 1000. 360. AG 801. 45.5 .0 44.0 14. cntynbappque * 830.0 48.0 830.0 -1661.4 * 1709. 180. AG 692. 100.0 .0 24.0 2.55 86.8 15. cntynbdep * 830.0 118.0 830.0 1118.0 * 1000. 360. AG 2067. 45.5 .0 44.0 16. cntynbleftturn * 812.0 48.0 812.0 -23.1 * 71. 180. AG 250. 100.0 .0 12.0 .40 3.6� PAGE 2 JOB: SugarMillStationPMPackageA RUN: SugarMillStationPMPackageA
DATE : 11/16/10 TIME : 17:27:28
ADDITIONAL QUEUE LINK PARAMETERS -------------------------------- LINK DESCRIPTION * CYCLE RED CLEARANCE APPROACH SATURATION IDLE SIGNAL ARRIVAL * LENGTH TIME LOST TIME VOL FLOW RATE EM FAC TYPE RATE * (SEC) (SEC) (SEC) (VPH) (VPH) (gm/hr) ------------------------*-------------------------------------------------------------------------------- 2. SH119ebappque * 100 45 2.0 2500 1600 143.34 1 3 3. SH119ebleftturn * 100 80 2.0 475 1600 143.34 1 3 6. SH119wbappque * 100 55 2.0 1575 1600 143.34 1 3 7. SH119wbleftturn * 100 90 2.0 50 1600 143.34 1 3 10. cntysbappque * 100 90 2.0 315 1600 143.34 1 3 11. cntysbleftturn * 100 65 2.0 445 1600 143.34 1 3 14. cntynbappque * 100 90 2.0 491 1600 143.34 1 3 16. cntynbleftturn * 100 65 2.0 200 1600 143.34 1 3
RECEPTOR LOCATIONS ------------------ * COORDINATES (FT) * RECEPTOR * X Y Z * -------------------------*-------------------------------------* 1. Receptor 1 * 862.0 -18.0 5.0 * 2. Receptor 2 * 862.0 22.0 5.0 * 3. Receptor 3 * 862.0 62.0 5.0 * 4. Receptor 4 * 902.0 62.0 5.0 * 5. Receptor 5 * 942.0 62.0 5.0 * 6. Receptor 6 * 942.0 174.0 5.0 * 7. Receptor 7 * 902.0 174.0 5.0 *
Page 1

sgmlpkga.out 8. Receptor 8 * 862.0 174.0 5.0 * 9. Receptor 9 * 862.0 214.0 5.0 * 10. Receptor 10 * 862.0 254.0 5.0 * 11. Receptor 11 * 762.0 254.0 5.0 * 12. Receptor 12 * 762.0 214.0 5.0 * 13. Receptor 13 * 762.0 174.0 5.0 * 14. Receptor 14 * 722.0 174.0 5.0 * 15. Receptor 15 * 682.0 174.0 5.0 * 16. Receptor 16 * 682.0 62.0 5.0 * 17. Receptor 17 * 722.0 62.0 5.0 * 18. Receptor 18 * 762.0 62.0 5.0 * 19. Receptor 19 * 762.0 22.0 5.0 * 20. Receptor 20 * 762.0 -18.0 5.0 *� PAGE 3 JOB: SugarMillStationPMPackageA RUN: SugarMillStationPMPackageA
MODEL RESULTS -------------
REMARKS : In search of the angle corresponding to the maximum concentration, only the first angle, of the angles with same maximum concentrations, is indicated as maximum.
WIND ANGLE RANGE: 0.-360.
WIND * CONCENTRATION ANGLE * (PPM) (DEGR)* REC1 REC2 REC3 REC4 REC5 REC6 REC7 REC8 REC9 REC10 REC11 REC12 REC13 REC14 REC15 REC16 REC17 REC18 REC19 REC20 ------*------------------------------------------------------------------------------------------------------------------------ 0. * 6.3 7.2 9.1 6.8 5.9 1.0 1.8 4.5 4.5 4.1 4.3 4.4 4.5 1.8 1.0 6.8 7.7 8.5 6.9 5.8 10. * 4.2 4.9 6.7 5.4 5.0 .2 .6 1.8 1.8 1.8 6.6 6.7 6.7 3.5 2.3 7.8 9.0 9.5 7.8 6.6 20. * 2.9 3.7 5.3 4.8 4.7 .0 .1 .4 .4 .4 6.8 7.1 7.1 4.1 2.9 8.5 9.3 9.0 6.8 5.9 30. * 2.7 3.3 5.1 4.9 4.9 .0 .0 .1 .1 .1 6.5 6.6 6.5 4.0 3.0 8.6 8.7 7.8 5.8 5.1 40. * 2.8 3.6 5.3 5.2 5.2 .0 .0 .0 .0 .0 6.1 6.1 5.9 3.8 3.0 8.2 8.1 7.3 5.5 5.2 50. * 3.0 3.8 5.6 5.6 5.6 .0 .0 .0 .0 .0 5.7 5.7 5.1 3.6 2.8 8.2 7.7 7.4 5.5 5.3 60. * 3.1 4.0 6.1 6.1 6.1 .1 .1 .1 .0 .0 5.4 5.4 4.7 3.4 2.7 8.2 7.6 7.8 6.0 5.6 70. * 3.2 4.2 6.8 6.7 6.7 .6 .6 .6 .1 .0 5.2 5.3 4.7 3.6 3.0 8.3 7.9 8.1 6.3 5.8 80. * 2.3 3.5 6.2 6.2 6.2 2.6 2.6 2.6 .8 .3 5.6 6.1 6.4 5.4 4.7 7.6 7.4 7.8 6.0 5.1 90. * 1.1 1.9 4.2 4.1 4.1 5.8 5.9 6.0 2.5 1.3 6.6 7.7 9.1 7.9 7.3 5.4 5.5 5.9 4.5 3.7 100. * .2 .6 1.7 1.7 1.7 8.4 8.4 8.5 4.3 2.8 8.0 9.5 11.2 9.7 8.8 3.1 3.2 3.7 3.2 2.7 110. * .0 .0 .4 .4 .4 8.5 8.5 8.5 4.8 3.4 8.7 9.4 10.5 8.7 8.4 1.7 2.1 2.6 2.7 2.4 120. * .0 .0 .1 .1 .1 7.7 7.7 7.7 4.7 3.5 8.6 9.0 9.3 7.9 7.6 1.4 1.8 2.5 2.7 2.4 130. * .0 .0 .0 .0 .0 7.1 7.1 7.1 4.3 3.2 8.3 8.2 8.5 6.9 7.1 1.5 1.9 2.7 2.6 2.4 140. * .0 .0 .0 .0 .0 6.4 6.4 6.4 4.0 3.1 8.0 7.4 7.7 6.9 6.9 1.4 2.0 3.0 2.8 2.7 150. * .0 .0 .0 .0 .0 6.0 6.0 6.2 3.8 3.1 7.7 6.7 7.4 7.0 7.2 1.6 1.9 3.1 3.0 2.9 160. * .4 .4 .4 .0 .0 5.8 5.9 6.2 4.1 3.1 7.1 6.7 7.6 7.3 7.0 1.6 2.1 3.3 3.2 3.2 170. * 1.4 1.4 1.4 .4 .3 6.1 6.3 7.1 5.1 4.4 6.5 6.6 7.9 7.4 7.0 1.3 1.9 3.1 3.1 3.1 180. * 3.2 3.2 3.3 1.4 .9 7.0 7.6 8.9 6.8 6.1 5.2 5.7 7.2 6.8 6.4 .6 1.0 2.0 2.0 2.0 190. * 4.4 4.4 4.4 2.3 1.6 7.4 8.2 9.3 7.7 7.2 3.6 4.4 6.0 6.0 5.7 .1 .4 .8 .8 .8 200. * 4.4 4.4 4.5 2.4 1.8 7.6 8.2 9.1 7.5 7.2 3.1 4.0 5.6 5.6 5.6 .0 .0 .2 .2 .2 210. * 3.9 4.0 4.0 2.3 1.8 7.8 8.1 8.6 7.4 7.3 2.9 3.8 5.7 5.7 5.7 .0 .0 .0 .0 .0 220. * 3.6 3.7 3.7 2.2 1.6 8.0 8.2 8.9 7.5 7.5 2.9 4.0 6.0 6.0 5.8 .0 .0 .0 .0 .0 230. * 3.4 3.6 3.2 2.2 1.6 8.3 8.5 9.8 8.0 7.9 2.9 4.0 6.4 6.3 5.9 .0 .0 .0
Page 2
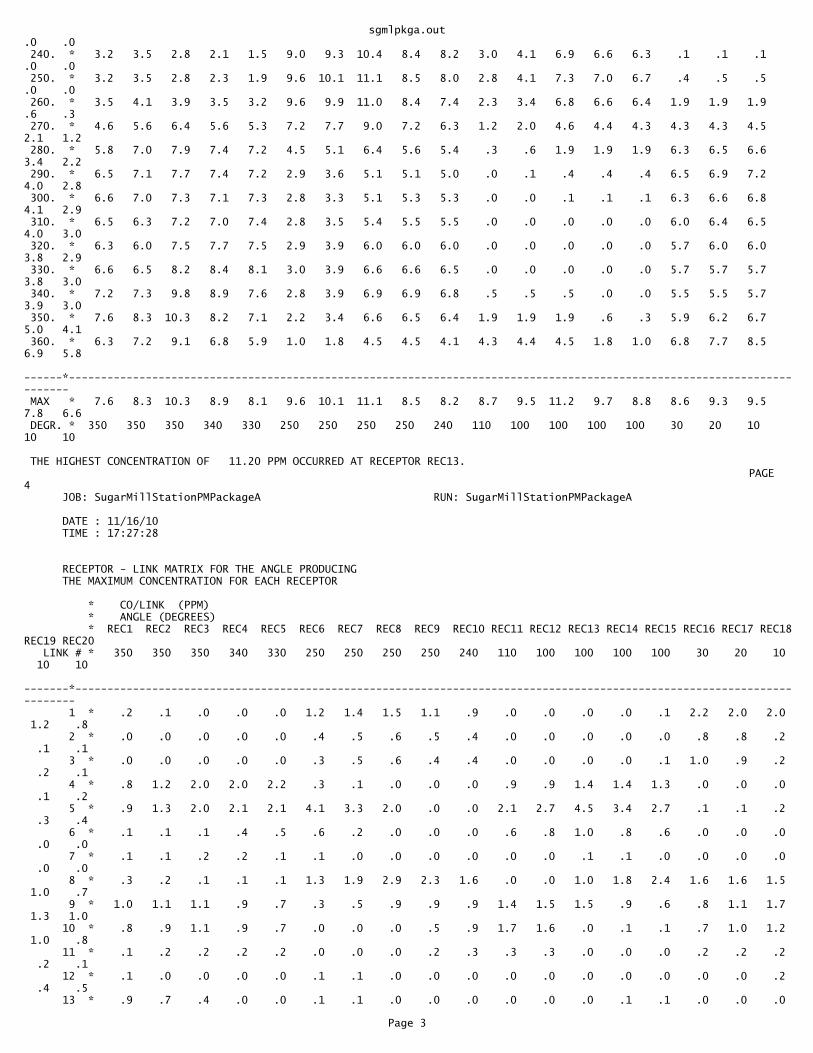
sgmlpkga.out.0 .0 240. * 3.2 3.5 2.8 2.1 1.5 9.0 9.3 10.4 8.4 8.2 3.0 4.1 6.9 6.6 6.3 .1 .1 .1 .0 .0 250. * 3.2 3.5 2.8 2.3 1.9 9.6 10.1 11.1 8.5 8.0 2.8 4.1 7.3 7.0 6.7 .4 .5 .5 .0 .0 260. * 3.5 4.1 3.9 3.5 3.2 9.6 9.9 11.0 8.4 7.4 2.3 3.4 6.8 6.6 6.4 1.9 1.9 1.9 .6 .3 270. * 4.6 5.6 6.4 5.6 5.3 7.2 7.7 9.0 7.2 6.3 1.2 2.0 4.6 4.4 4.3 4.3 4.3 4.5 2.1 1.2 280. * 5.8 7.0 7.9 7.4 7.2 4.5 5.1 6.4 5.6 5.4 .3 .6 1.9 1.9 1.9 6.3 6.5 6.6 3.4 2.2 290. * 6.5 7.1 7.7 7.4 7.2 2.9 3.6 5.1 5.1 5.0 .0 .1 .4 .4 .4 6.5 6.9 7.2 4.0 2.8 300. * 6.6 7.0 7.3 7.1 7.3 2.8 3.3 5.1 5.3 5.3 .0 .0 .1 .1 .1 6.3 6.6 6.8 4.1 2.9 310. * 6.5 6.3 7.2 7.0 7.4 2.8 3.5 5.4 5.5 5.5 .0 .0 .0 .0 .0 6.0 6.4 6.5 4.0 3.0 320. * 6.3 6.0 7.5 7.7 7.5 2.9 3.9 6.0 6.0 6.0 .0 .0 .0 .0 .0 5.7 6.0 6.0 3.8 2.9 330. * 6.6 6.5 8.2 8.4 8.1 3.0 3.9 6.6 6.6 6.5 .0 .0 .0 .0 .0 5.7 5.7 5.7 3.8 3.0 340. * 7.2 7.3 9.8 8.9 7.6 2.8 3.9 6.9 6.9 6.8 .5 .5 .5 .0 .0 5.5 5.5 5.7 3.9 3.0 350. * 7.6 8.3 10.3 8.2 7.1 2.2 3.4 6.6 6.5 6.4 1.9 1.9 1.9 .6 .3 5.9 6.2 6.7 5.0 4.1 360. * 6.3 7.2 9.1 6.8 5.9 1.0 1.8 4.5 4.5 4.1 4.3 4.4 4.5 1.8 1.0 6.8 7.7 8.5 6.9 5.8 ------*------------------------------------------------------------------------------------------------------------------------ MAX * 7.6 8.3 10.3 8.9 8.1 9.6 10.1 11.1 8.5 8.2 8.7 9.5 11.2 9.7 8.8 8.6 9.3 9.5 7.8 6.6 DEGR. * 350 350 350 340 330 250 250 250 250 240 110 100 100 100 100 30 20 10 10 10
THE HIGHEST CONCENTRATION OF 11.20 PPM OCCURRED AT RECEPTOR REC13.� PAGE 4 JOB: SugarMillStationPMPackageA RUN: SugarMillStationPMPackageA
DATE : 11/16/10 TIME : 17:27:28
RECEPTOR - LINK MATRIX FOR THE ANGLE PRODUCING THE MAXIMUM CONCENTRATION FOR EACH RECEPTOR
* CO/LINK (PPM) * ANGLE (DEGREES) * REC1 REC2 REC3 REC4 REC5 REC6 REC7 REC8 REC9 REC10 REC11 REC12 REC13 REC14 REC15 REC16 REC17 REC18REC19 REC20 LINK # * 350 350 350 340 330 250 250 250 250 240 110 100 100 100 100 30 20 10 10 10 -------*------------------------------------------------------------------------------------------------------------------------ 1 * .2 .1 .0 .0 .0 1.2 1.4 1.5 1.1 .9 .0 .0 .0 .0 .1 2.2 2.0 2.0 1.2 .8 2 * .0 .0 .0 .0 .0 .4 .5 .6 .5 .4 .0 .0 .0 .0 .0 .8 .8 .2 .1 .1 3 * .0 .0 .0 .0 .0 .3 .5 .6 .4 .4 .0 .0 .0 .0 .1 1.0 .9 .2 .2 .1 4 * .8 1.2 2.0 2.0 2.2 .3 .1 .0 .0 .0 .9 .9 1.4 1.4 1.3 .0 .0 .0 .1 .2 5 * .9 1.3 2.0 2.1 2.1 4.1 3.3 2.0 .0 .0 2.1 2.7 4.5 3.4 2.7 .1 .1 .2 .3 .4 6 * .1 .1 .1 .4 .5 .6 .2 .0 .0 .0 .6 .8 1.0 .8 .6 .0 .0 .0 .0 .0 7 * .1 .1 .2 .2 .1 .1 .0 .0 .0 .0 .0 .0 .1 .1 .0 .0 .0 .0 .0 .0 8 * .3 .2 .1 .1 .1 1.3 1.9 2.9 2.3 1.6 .0 .0 1.0 1.8 2.4 1.6 1.6 1.5 1.0 .7 9 * 1.0 1.1 1.1 .9 .7 .3 .5 .9 .9 .9 1.4 1.5 1.5 .9 .6 .8 1.1 1.7 1.3 1.0 10 * .8 .9 1.1 .9 .7 .0 .0 .0 .5 .9 1.7 1.6 .0 .1 .1 .7 1.0 1.2 1.0 .8 11 * .1 .2 .2 .2 .2 .0 .0 .0 .2 .3 .3 .3 .0 .0 .0 .2 .2 .2 .2 .1 12 * .1 .0 .0 .0 .0 .1 .1 .0 .0 .0 .0 .0 .0 .0 .0 .0 .0 .2 .4 .5 13 * .9 .7 .4 .0 .0 .1 .1 .0 .0 .0 .0 .0 .0 .1 .1 .0 .0 .0
Page 3
sgmlpkga.out .0 .1 14 * .4 .0 .0 .0 .0 .0 .0 .0 .0 .0 .0 .0 .0 .0 .0 .0 .0 .0 .0 .0 15 * 1.9 2.4 3.1 2.1 1.5 .8 1.5 2.6 2.6 2.8 1.7 1.7 1.7 1.1 .8 1.2 1.6 2.1 2.0 1.8 16 * .0 .0 .0 .0 .0 .0 .0 .0 .0 .0 .0 .0 .0 .0 .0 .0 .0 .0 .0 .0
Page 4

sgmlpapm.in'SugarMillStationPMPA', 60 , 175 , 0 , 0 , 20 , 0.3048 , 1 , 1 'Receptor 1', 874 ,-42 , 5 'Receptor 2', 874 ,-2 , 5 'Receptor 3', 874 , 38 , 5 'Receptor 4', 914 , 38 , 5 'Receptor 5', 954 , 38 , 5 'Receptor 6', 954 , 198 , 5 'Receptor 7', 914 , 198 , 5 'Receptor 8', 874 , 198 , 5 'Receptor 9', 874 , 238 , 5 'Receptor 10', 874 , 278 , 5 'Receptor 11', 750 , 278 , 5 'Receptor 12', 750 , 238 , 5 'Receptor 13', 750 , 198 , 5 'Receptor 14', 710 , 198 , 5 'Receptor 15', 670 , 198 , 5 'Receptor 16', 670 , 38 , 5 'Receptor 17', 710 , 38 , 5 'Receptor 18', 750 , 38 , 5 'Receptor 19', 750 ,-2 , 5 'Receptor 20', 750 ,-42 , 5 'SugarMillStationPMPA', 22 , 1 , 1 ,'CO' 1 'SH119eboutapp','AG',-188 , 70 , 812 , 70 , 1524 , 23.7 , 0 , 44 2 'SH119eboutappque','AG', 760 , 70 ,-188 , 70 , 0 , 24 , 2 100 , 47 , 2 , 1250 , 143.34 , 1600 , 1 , 3 1 'SH119ebinapp','AG',-188 , 94 , 812 , 94 , 1524 , 23.7 , 0 , 44 2 'SH119ebinappque','AG', 760 , 94 ,-188 , 94 , 0 , 24 , 2 100 , 47 , 2 , 1250 , 143.34 , 1600 , 1 , 3 2 'SH119ebleftturn','AG', 760 , 118 , 310 , 118 , 0 , 24 , 2 100 , 81 , 2 , 472 , 143.34 , 1600 , 1 , 3 1 'SH119eboutdep','AG', 812 , 70 , 1812 , 70 , 1523 , 23.7 , 0 , 44 1 'SH119ebindep','AG', 812 , 94 , 1812 , 94 , 1523 , 23.7 , 0 , 44 1 'SH119wboutapp','AG', 1812 , 166 , 812 , 166 , 1365 , 46.9 , 0 , 44 2 'SH119wboutappque','AG', 864 , 166 , 1812 , 166 , 0 , 24 , 2 100 , 58 , 2 , 788 , 143.34 , 1600 , 1 , 3 1 'SH119wbinapp','AG', 1812 , 142 , 812 , 142 , 1365 , 46.9 , 0 , 44 2 'SH119wbinappque','AG', 864 , 142 , 1812 , 142 , 0 , 24 , 2 100 , 58 , 2 , 788 , 143.34 , 1600 , 1 , 3 2 'SH119wbleftturn','AG', 864 , 118 , 1274 , 118 , 0 , 24 , 2 100 , 92 , 2 , 50 , 143.34 , 1600 , 1 , 3 1 'SH119wboutdep','AG', 812 , 166 ,-188 , 166 , 1072 , 46.9 , 0 , 44 1 'SH119wbindep','AG', 812 , 142 ,-188 , 142 , 1072 , 46.9 , 0 , 44 1 'cntysbapp','AG', 788 , 1118 , 788 , 118 , 1116 , 45.5 , 0 , 56 2 'cntysbappque','AG', 788 , 188 , 788 , 1118 , 0 , 36 , 3 100 , 75 , 2 , 312 , 143.34 , 1600 , 1 , 3 2 'cntysbleftturn','AG', 812 , 188 , 812 , 363 , 0 , 24 , 2 100 , 84 , 2 , 436 , 143.34 , 1600 , 1 , 3 1 'cntysbdep','AG', 788 , 118 , 788 ,-882 , 437 , 45.5 , 0 , 56 1 'cntynbapp','AG', 836 ,-882 , 836 , 118 , 800 , 45.5 , 0 , 56 2 'cntynbappque','AG', 836 , 48 , 836 ,-882 , 0 , 36 , 3 100 , 77 , 2 , 490 , 143.34 , 1600 , 1 , 3 1 'cntynbdep','AG', 836 , 118 , 836 , 1118 , 2067 , 45.5 , 0 , 56 2 'cntynbleftturn','AG', 812 , 48 , 812 ,-127 , 0 , 24 , 2 100 , 86 , 2 , 200 , 143.34 , 1600 , 1 , 3 1 , 0 , 4 , 1000 , 0 ,'Y', 10 , 0 , 36
Page 1

sgmlpav2.out� CAL3QHC: LINE SOURCE DISPERSION MODEL - VERSION 2.0 Dated 95221 PAGE 1
JOB: SugarMillStationPMPA RUN: SugarMillStationPMPA
DATE : 11/22/10 TIME : 12:46:48
The MODE flag has been set to C for calculating CO averages.
SITE & METEOROLOGICAL VARIABLES ------------------------------- VS = .0 CM/S VD = .0 CM/S Z0 = 175. CM U = 1.0 M/S CLAS = 4 (D) ATIM = 60. MINUTES MIXH = 1000. M AMB = .0 PPM
LINK VARIABLES -------------- LINK DESCRIPTION * LINK COORDINATES (FT) * LENGTH BRG TYPE VPH EF H W V/C QUEUE * X1 Y1 X2 Y2 * (FT) (DEG) (G/MI) (FT) (FT) (VEH) ------------------------*----------------------------------------*---------------------------------------------------------- 1. SH119eboutapp * -188.0 70.0 812.0 70.0 * 1000. 90. AG 1524. 23.7 .0 44.0 2. SH119eboutappque * 760.0 70.0 597.1 70.0 * 163. 270. AG 361. 100.0 .0 24.0 .80 8.3 3. SH119ebinapp * -188.0 94.0 812.0 94.0 * 1000. 90. AG 1524. 23.7 .0 44.0 4. SH119ebinappque * 760.0 94.0 597.1 94.0 * 163. 270. AG 361. 100.0 .0 24.0 .80 8.3 5. SH119ebleftturn * 760.0 118.0 589.0 117.9 * 171. 270. AG 623. 100.0 .0 24.0 .98 8.7 6. SH119eboutdep * 812.0 70.0 1812.0 70.0 * 1000. 90. AG 1523. 23.7 .0 44.0 7. SH119ebindep * 812.0 94.0 1812.0 94.0 * 1000. 90. AG 1523. 23.7 .0 44.0 8. SH119wboutapp * 1812.0 166.0 812.0 166.0 * 1000. 270. AG 1365. 46.9 .0 44.0 9. SH119wboutappque * 864.0 166.0 989.0 166.0 * 125. 90. AG 446. 100.0 .0 24.0 .65 6.3 10. SH119wbinapp * 1812.0 142.0 812.0 142.0 * 1000. 270. AG 1365. 46.9 .0 44.0 11. SH119wbinappque * 864.0 142.0 989.0 142.0 * 125. 90. AG 446. 100.0 .0 24.0 .65 6.3 12. SH119wbleftturn * 864.0 118.0 876.6 118.0 * 13. 90. AG 707. 100.0 .0 24.0 .39 .6 13. SH119wboutdep * 812.0 166.0 -188.0 166.0 * 1000. 270. AG 1072. 46.9 .0 44.0 14. SH119wbindep * 812.0 142.0 -188.0 142.0 * 1000. 270. AG 1072. 46.9 .0 44.0 15. cntysbapp * 788.0 1118.0 788.0 118.0 * 1000. 180. AG 1116. 45.5 .0 56.0 16. cntysbappque * 788.0 188.0 788.0 230.7 * 43. 360. AG 865. 100.0 .0 36.0 .31 2.2 17. cntysbleftturn * 812.0 188.0 812.0 620.8 * 433. 360. AG 646. 100.0 .0 24.0 1.14 22.0 18. cntysbdep * 788.0 118.0 788.0 -882.0 * 1000. 180. AG 437. 45.5 .0 56.0 19. cntynbapp * 836.0 -882.0 836.0 118.0 * 1000. 360. AG 800. 45.5 .0 56.0 20. cntynbappque * 836.0 48.0 836.0 -20.6 * 69. 180. AG 888. 100.0 .0 36.0 .54 3.5 21. cntynbdep * 836.0 118.0 836.0 1118.0 * 1000. 360. AG 2067. 45.5 .0 56.0 22. cntynbleftturn * 812.0 48.0 812.0 -1.0 * 49. 180. AG 661. 100.0 .0 24.0 .63 2.5� PAGE 2 JOB: SugarMillStationPMPA RUN: SugarMillStationPMPA
DATE : 11/22/10 TIME : 12:46:48
ADDITIONAL QUEUE LINK PARAMETERS -------------------------------- LINK DESCRIPTION * CYCLE RED CLEARANCE APPROACH SATURATION IDLE SIGNAL ARRIVAL * LENGTH TIME LOST TIME VOL FLOW RATE EM FAC TYPE RATE * (SEC) (SEC) (SEC) (VPH) (VPH) (gm/hr) ------------------------*-------------------------------------------------------------------------------- 2. SH119eboutappque * 100 47 2.0 1250 1600 143.34 1 3 4. SH119ebinappque * 100 47 2.0 1250 1600 143.34 1 3 5. SH119ebleftturn * 100 81 2.0 472 1600 143.34 1 3 9. SH119wboutappque * 100 58 2.0 788 1600 143.34 1 3 11. SH119wbinappque * 100 58 2.0 788 1600 143.34 1 3 12. SH119wbleftturn * 100 92 2.0 50 1600 143.34 1 3 16. cntysbappque * 100 75 2.0 312 1600 143.34 1 3 17. cntysbleftturn * 100 84 2.0 436 1600 143.34 1 3 20. cntynbappque * 100 77 2.0 490 1600 143.34 1 3 22. cntynbleftturn * 100 86 2.0 200 1600 143.34 1 3
RECEPTOR LOCATIONS ------------------
Page 1

sgmlpav2.out * COORDINATES (FT) * RECEPTOR * X Y Z * -------------------------*-------------------------------------* 1. Receptor 1 * 874.0 -42.0 5.0 * 2. Receptor 2 * 874.0 -2.0 5.0 * 3. Receptor 3 * 874.0 38.0 5.0 * 4. Receptor 4 * 914.0 38.0 5.0 * 5. Receptor 5 * 954.0 38.0 5.0 * 6. Receptor 6 * 954.0 198.0 5.0 * 7. Receptor 7 * 914.0 198.0 5.0 * 8. Receptor 8 * 874.0 198.0 5.0 * 9. Receptor 9 * 874.0 238.0 5.0 * 10. Receptor 10 * 874.0 278.0 5.0 * 11. Receptor 11 * 750.0 278.0 5.0 * 12. Receptor 12 * 750.0 238.0 5.0 * 13. Receptor 13 * 750.0 198.0 5.0 * 14. Receptor 14 * 710.0 198.0 5.0 * 15. Receptor 15 * 670.0 198.0 5.0 * 16. Receptor 16 * 670.0 38.0 5.0 * 17. Receptor 17 * 710.0 38.0 5.0 * 18. Receptor 18 * 750.0 38.0 5.0 * 19. Receptor 19 * 750.0 -2.0 5.0 * 20. Receptor 20 * 750.0 -42.0 5.0 *� PAGE 3 JOB: SugarMillStationPMPA RUN: SugarMillStationPMPA
MODEL RESULTS -------------
REMARKS : In search of the angle corresponding to the maximum concentration, only the first angle, of the angles with same maximum concentrations, is indicated as maximum.
WIND ANGLE RANGE: 0.-360.
WIND * CONCENTRATION ANGLE * (PPM) (DEGR)* REC1 REC2 REC3 REC4 REC5 REC6 REC7 REC8 REC9 REC10 REC11 REC12 REC13 REC14 REC15 REC16 REC17 REC18 REC19 REC20 ------*------------------------------------------------------------------------------------------------------------------------ 0. * 6.0 6.6 7.9 6.2 5.4 .9 1.6 3.9 3.7 3.7 2.8 2.8 3.0 1.3 .7 6.3 7.0 7.8 6.3 5.2 10. * 4.2 4.7 6.1 5.0 4.4 .1 .5 1.6 1.6 1.5 4.5 4.8 4.8 2.5 1.5 7.1 8.3 8.9 7.0 6.4 20. * 2.9 3.5 4.8 4.3 3.9 .0 .1 .4 .4 .4 5.2 5.3 5.5 3.3 2.3 8.1 9.0 8.3 6.7 6.1 30. * 2.5 3.0 4.5 4.1 3.8 .0 .0 .1 .1 .1 5.0 5.0 5.5 3.3 2.6 8.4 8.5 7.4 5.6 5.5 40. * 2.3 3.1 4.4 4.0 3.7 .0 .0 .1 .1 .1 4.7 4.7 5.6 3.3 2.6 7.8 7.9 6.7 5.5 5.6 50. * 2.3 2.9 4.5 4.2 4.1 .0 .0 .0 .0 .0 4.3 4.3 5.6 3.3 2.4 7.7 7.2 6.5 5.8 5.4 60. * 2.4 2.9 4.4 4.3 4.3 .1 .1 .1 .0 .0 4.1 4.1 5.8 3.4 2.5 7.4 6.5 6.6 6.0 5.1 70. * 2.3 3.0 4.6 4.6 4.6 .4 .4 .4 .0 .0 4.0 4.1 6.1 3.9 3.1 7.0 6.6 6.8 6.1 4.5 80. * 1.6 2.3 4.1 4.1 4.1 1.4 1.4 1.6 .4 .2 4.2 4.7 7.4 5.3 4.4 6.2 6.1 6.3 5.3 3.5 90. * .6 1.2 2.5 2.4 2.4 3.4 3.6 3.9 1.5 .9 5.1 6.5 9.6 7.5 6.4 4.3 4.6 5.5 4.0 2.2 100. * .1 .3 .9 .9 .9 5.3 5.6 6.0 3.0 1.8 6.2 8.3 10.7 8.7 7.6 2.5 3.0 4.0 2.5 1.3 110. * .0 .0 .2 .2 .2 5.7 6.3 6.9 3.8 2.6 7.0 9.5 10.1 8.1 7.1 1.5 2.0 3.1 1.6 1.1 120. * .0 .0 .0 .0 .0 5.5 6.4 6.9 4.0 2.8 7.5 9.4 8.9 7.0 6.4 1.0 1.5 2.6 1.4 1.2 130. * .0 .0 .0 .0 .0 5.5 6.4 6.7 4.0 2.7 7.6 9.0 7.8 6.2 6.1 .8 1.2 2.1 1.2 1.2 140. * .0 .0 .0 .0 .0 5.6 6.2 6.5 4.1 3.0 7.8 8.0 6.9 6.0 5.9 .7 .9 1.8 1.4 1.4 150. * .0 .0 .0 .0 .0 5.6 6.0 6.2 4.0 3.1 7.3 7.0 7.0 5.8 5.9 .8 1.0 1.5 1.4 1.4 160. * .2 .2 .2 .0 .0 5.7 5.9 6.2 4.0 3.2 6.5 6.3 6.6 5.9 5.8 .7 1.1 1.6 1.6 1.6 170. * .6 .6 .6 .1 .1 5.8 6.0 6.7 4.8 3.9 5.8 5.8 6.4 5.8 5.4 .6 .8 1.5 1.4 1.4 180. * 1.3 1.3 1.4 .5 .3 6.3 6.6 7.9 5.9 5.3 4.4 4.8 6.0 5.4 5.1 .2 .4 1.0
Page 2
sgmlpav2.out1.0 1.0 190. * 1.8 1.9 2.3 .9 .7 6.6 7.3 9.0 7.1 6.5 3.4 3.8 5.0 5.0 4.8 .0 .1 .4 .4 .4 200. * 1.9 1.9 2.7 1.1 .8 6.9 7.7 8.7 7.4 7.3 2.8 3.7 5.0 4.9 4.8 .0 .0 .1 .1 .1 210. * 1.8 1.9 3.2 1.2 .8 7.5 8.0 8.4 7.2 7.7 2.8 3.6 5.0 5.0 4.7 .0 .0 .0 .0 .0 220. * 1.6 1.9 3.6 1.3 .9 7.7 8.0 8.6 7.5 7.9 2.7 3.5 5.3 5.0 4.6 .0 .0 .0 .0 .0 230. * 1.4 2.0 3.9 1.7 .9 8.4 8.6 9.0 8.2 8.1 2.4 3.3 5.4 5.0 4.6 .0 .0 .0 .0 .0 240. * 1.3 2.3 4.1 2.2 1.2 8.7 8.6 9.5 8.7 7.9 2.4 3.2 5.3 4.9 4.6 .0 .0 .0 .0 .0 250. * 1.3 2.8 4.3 2.6 1.8 9.1 8.6 9.8 8.5 7.1 2.2 3.0 5.1 4.9 4.7 .2 .2 .2 .0 .0 260. * 1.4 3.8 5.3 3.8 3.0 8.2 8.3 9.6 7.8 6.3 1.5 2.4 4.5 4.4 4.4 .9 1.0 1.0 .2 .1 270. * 2.1 5.2 6.9 5.4 4.6 6.4 6.7 8.2 6.4 5.5 .7 1.2 2.9 2.9 2.8 2.3 2.5 2.8 1.0 .6 280. * 3.4 6.8 8.0 6.5 6.1 3.9 4.8 6.4 5.0 4.7 .1 .3 1.1 1.1 1.1 4.0 4.3 4.6 2.2 1.5 290. * 4.8 8.0 8.1 6.5 6.0 2.8 3.7 5.3 4.6 4.5 .0 .0 .3 .3 .3 4.7 5.3 5.8 3.0 2.1 300. * 5.8 7.9 7.0 6.2 6.3 2.6 3.3 5.0 4.6 4.6 .0 .0 .0 .0 .0 4.9 5.6 6.0 3.5 2.5 310. * 6.3 7.5 6.2 6.1 6.2 2.5 3.3 5.1 4.9 4.9 .0 .0 .0 .0 .0 5.4 5.9 6.1 3.8 2.7 320. * 6.6 7.0 6.2 6.4 6.7 2.7 3.4 5.4 5.4 5.4 .0 .0 .0 .0 .0 5.3 5.6 5.6 3.9 3.0 330. * 7.1 6.7 7.1 7.4 7.0 2.7 3.7 5.7 5.7 5.7 .1 .1 .1 .0 .0 5.4 5.5 5.5 3.7 3.0 340. * 7.1 7.1 8.4 7.9 7.0 2.5 3.6 6.3 6.3 6.2 .2 .2 .2 .0 .0 5.4 5.4 5.6 3.8 3.2 350. * 7.5 7.5 9.1 7.2 6.4 1.8 2.9 5.8 5.8 5.7 1.1 1.1 1.1 .3 .2 5.6 5.8 6.3 4.6 4.0 360. * 6.0 6.6 7.9 6.2 5.4 .9 1.6 3.9 3.7 3.7 2.8 2.8 3.0 1.3 .7 6.3 7.0 7.8 6.3 5.2 ------*------------------------------------------------------------------------------------------------------------------------ MAX * 7.5 8.0 9.1 7.9 7.0 9.1 8.6 9.8 8.7 8.1 7.8 9.5 10.7 8.7 7.6 8.4 9.0 8.9 7.0 6.4 DEGR. * 350 290 350 340 340 250 240 250 240 230 140 110 100 100 100 30 20 10 10 10
THE HIGHEST CONCENTRATION OF 10.70 PPM OCCURRED AT RECEPTOR REC13.� PAGE 4 JOB: SugarMillStationPMPA RUN: SugarMillStationPMPA
DATE : 11/22/10 TIME : 12:46:48
RECEPTOR - LINK MATRIX FOR THE ANGLE PRODUCING THE MAXIMUM CONCENTRATION FOR EACH RECEPTOR
* CO/LINK (PPM) * ANGLE (DEGREES) * REC1 REC2 REC3 REC4 REC5 REC6 REC7 REC8 REC9 REC10 REC11 REC12 REC13 REC14 REC15 REC16 REC17 REC18REC19 REC20 LINK # * 350 290 350 340 340 250 240 250 240 230 140 110 100 100 100 30 20 10 10 10 -------*------------------------------------------------------------------------------------------------------------------------ 1 * .0 .8 .0 .0 .0 .5 .5 .5 .4 .3 .0 .0 .0 .0 .0 1.1 1.0 1.0 .6 .4 2 * .0 .3 .0 .0 .0 .2 .2 .2 .2 .2 .0 .0 .0 .0 .0 .9 .9 .6 .2 .1 3 * .1 .7 .0 .0 .0 .5 .5 .6 .5 .4 .0 .0 .0 .0 .0 .8 .8 .7 .5 .4 4 * .0 .3 .0 .0 .0 .2 .2 .2 .2 .2 .0 .0 .0 .0 .0 .6 .6 .3 .2 .1 5 * .0 .3 .0 .0 .0 .4 .4 .6 .5 .4 .0 .0 .0 .0 .0 .8 .7 .3 .2 .2 6 * .4 .0 1.0 1.0 1.0 .0 .0 .0 .0 .0 .3 .4 .4 .4 .4 .0 .0 .0 .0 .0 7 * .4 .0 .7 .8 .8 .1 .1 .0 .0 .0 .3 .5 .5 .5 .5 .0 .0 .0 .0 .1 8 * .4 .0 .7 .7 .7 2.1 2.0 1.2 .2 .1 .7 1.4 2.1 1.6 1.3 .1 .1 .1
Page 3
sgmlpav2.out .1 .2 9 * .1 .0 .2 .2 .4 .8 .6 .0 .0 .0 .2 .4 .4 .3 .2 .0 .0 .0 .0 .0 10 * .4 .0 .8 .9 .9 .9 .9 .2 .0 .0 .7 1.2 1.6 1.4 1.2 .0 .0 .1 .1 .2 11 * .1 .0 .2 .3 .5 .2 .1 .0 .0 .0 .2 .3 .3 .3 .2 .0 .0 .0 .0 .0 12 * .1 .0 .2 .2 .0 .0 .0 .0 .0 .0 .1 .0 .0 .0 .0 .0 .0 .0 .0 .0 13 * .1 .6 .1 .1 .0 .6 .4 1.3 .9 .7 .2 .0 .6 1.0 1.3 .6 .6 .5 .4 .3 14 * .1 .7 .1 .0 .0 .7 .6 1.2 .8 .6 .1 .0 .0 .2 .4 .7 .7 .6 .5 .3 15 * .9 .0 1.0 .8 .6 .4 .4 .8 .9 .8 1.7 1.4 1.4 .9 .7 .8 1.1 1.5 1.2 1.0 16 * .1 .0 .1 .1 .0 .1 .0 .2 .6 .6 .8 1.4 1.3 .6 .3 .2 .3 .3 .2 .2 17 * .6 .0 .8 .7 .6 .1 .0 .3 .8 .9 .8 .9 .5 .3 .2 .6 .7 .8 .7 .6 18 * .1 .3 .0 .0 .0 .1 .1 .0 .0 .0 .0 .0 .0 .0 .0 .0 .0 .3 .4 .5 19 * .9 1.0 .5 .1 .0 .1 .1 .0 .0 .0 .1 .0 .0 .0 .0 .0 .0 .0 .0 .1 20 * .8 2.2 .0 .0 .0 .0 .0 .0 .0 .0 .1 .0 .0 .0 .0 .0 .0 .0 .0 .0 21 * 1.8 .0 2.7 2.0 1.5 1.1 1.5 2.5 2.7 2.9 1.5 1.6 1.6 1.2 .9 1.2 1.5 1.8 1.7 1.6 22 * .1 .8 .0 .0 .0 .0 .0 .0 .0 .0 .0 .0 .0 .0 .0 .0 .0 .0 .0 .1
Page 4
thopkapm.in'I25ThorntonParkwayInterchangePMpackageA', 60 , 175 , 0 , 0 , 56 , 0.3048 , 1 , 1 'Receptor 1', 672 , 52 , 5 'Receptor 2', 712 , 52 , 5 'Receptor 3', 752 , 52 , 5 'Receptor 4', 792 , 52 , 5 'Receptor 5', 792 , 2 , 5 'Receptor 6', 792 ,-38 , 5 'Receptor 7', 792 ,-78 , 5 'Receptor 8', 856 ,-56 , 5 'Receptor 9', 856 ,-16 , 5 'Receptor 10', 856 , 24 , 5 'Receptor 11', 856 , 64 , 5 'Receptor 12', 896 , 64 , 5 'Receptor 13', 936 , 64 , 5 'Receptor 14', 976 , 64 , 5 'Receptor 15', 1256 , 64 , 5 'Receptor 16', 1296 , 64 , 5 'Receptor 17', 1336 , 64 , 5 'Receptor 18', 1376 , 64 , 5 'Receptor 19', 1376 , 24 , 5 'Receptor 20', 1376 ,-16 , 5 'Receptor 21', 1376 ,-56 , 5 'Receptor 22', 1452 ,-68 , 5 'Receptor 23', 1452 ,-28 , 5 'Receptor 24', 1452 , 12 , 5 'Receptor 25', 1452 , 52 , 5 'Receptor 26', 1492 , 52 , 5 'Receptor 27', 1532 , 52 , 5 'Receptor 28', 1572 , 52 , 5 'Receptor 29', 1572 , 194 , 5 'Receptor 30', 1532 , 194 , 5 'Receptor 31', 1492 , 194 , 5 'Receptor 32', 1452 , 194 , 5 'Receptor 33', 1452 , 234 , 5 'Receptor 34', 1452 , 274 , 5 'Receptor 35', 1452 , 314 , 5 'Receptor 36', 1388 , 302 , 5 'Receptor 37', 1388 , 262 , 5 'Receptor 38', 1388 , 222 , 5 'Receptor 39', 1388 , 182 , 5 'Receptor 40', 1348 , 182 , 5 'Receptor 41', 1308 , 182 , 5 'Receptor 42', 1264 , 182 , 5 'Receptor 43', 988 , 182 , 5 'Receptor 44', 948 , 182 , 5 'Receptor 45', 908 , 182 , 5 'Receptor 46', 868 , 182 , 5 'Receptor 47', 868 , 222 , 5 'Receptor 48', 868 , 262 , 5 'Receptor 49', 868 , 302 , 5 'Receptor 50', 792 , 314 , 5 'Receptor 51', 792 , 274 , 5 'Receptor 52', 792 , 234 , 5 'Receptor 53', 792 , 194 , 5 'Receptor 54', 752 , 194 , 5 'Receptor 55', 712 , 194 , 5 'Receptor 56', 672 , 194 , 5 'I25ThorntonParkwayInterchangePMpackageA', 18 , 1 , 1 ,'CO' 1 'thornebapp','AG', 122 , 90 , 833 , 90 , 1925 , 22.5 , 0 , 56 2 'thornebapp que','AG', 802 , 90 , 122 , 90 , 0 , 36 , 3 100 , 53 , 2 , 1675 , 143.34 , 1600 , 1 , 3 1 'thornebdep/app','AG', 833 , 96 , 1411 , 96 , 2135 , 22.5 , 0 , 44 2 'thornebdep/app que','AG', 1386 , 96 , 858 , 96 , 0 , 24 , 2 100 , 41 , 2 , 1785 , 143.34 , 1600 , 1 , 3 2 'thornebleftturn','AG', 1386 , 114 , 1186 , 114 , 0 , 12 , 1 100 , 82 , 2 , 350 , 143.34 , 1600 , 1 , 3 1 'thornebdep','AG', 1411 , 90 , 2122 , 90 , 2425 , 22.5 , 0 , 56 1 'thornwbapp','AG', 2122 , 156 , 1411 , 156 , 2150 , 22.5 , 0 , 56 2 'thornwbapp que','AG', 1442 , 156 , 2122 , 156 , 0 , 36 , 3 100 , 59 , 2 , 1725 , 143.34 , 1600 , 1 , 3 1 'thornwbdep/app','AG', 1411 , 150 , 833 , 150 , 1875 , 45.4 , 0 , 44 2
Page 1
thopkapm.in'thornwbdep/app que','AG', 858 , 150 , 1386 , 150 , 0 , 24 , 2 100 , 41 , 2 , 1445 , 143.34 , 1600 , 1 , 3 2 'thornwbleftturn','AG', 858 , 126 , 1058 , 126 , 0 , 24 , 2 100 , 88 , 2 , 430 , 143.34 , 1600 , 1 , 3 1 'thornwbdep','AG', 833 , 156 , 122 , 156 , 1745 , 45.4 , 0 , 56 1 'I25sbrampapp','AG', 824 , 1124 , 824 , 124 , 760 , 22.8 , 0 , 44 2 'I25sbrampleftturn','AG', 842 , 184 , 842 , 384 , 0 , 12 , 1 100 , 59 , 2 , 460 , 143.34 , 1600 , 1 , 3 1 'I25sbrampdep','AG', 824 , 124 , 824 ,-876 , 680 , 22.8 , 0 , 44 1 'I25nbrampapp','AG', 1420 ,-876 , 1420 , 124 , 790 , 23.1 , 0 , 44 2 'I25nbrampleftturn','AG', 1402 , 62 , 1402 ,-138 , 0 , 12 , 1 100 , 59 , 2 , 150 , 143.34 , 1600 , 1 , 3 1 'I25nbrampdep','AG', 1420 , 124 , 1420 , 1124 , 775 , 23.1 , 0 , 44 1 , 0 , 4 , 1000 , 0 ,'Y', 10 , 0 , 36
Page 2
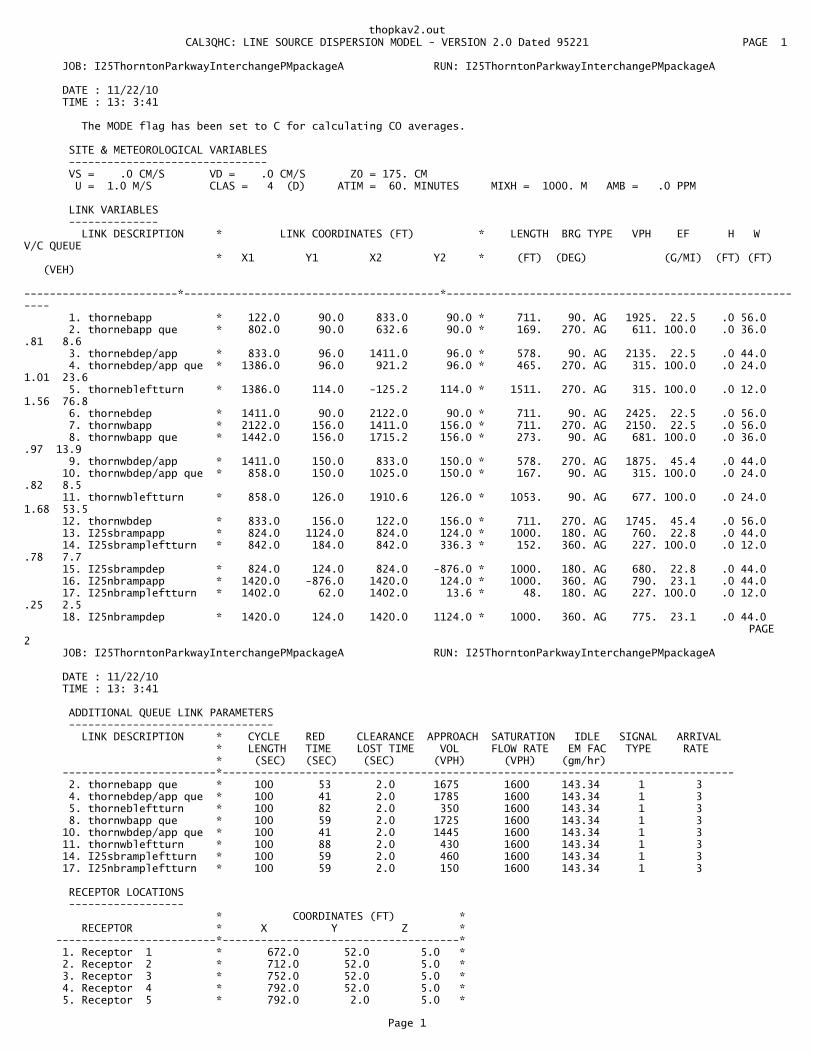
thopkav2.out� CAL3QHC: LINE SOURCE DISPERSION MODEL - VERSION 2.0 Dated 95221 PAGE 1
JOB: I25ThorntonParkwayInterchangePMpackageA RUN: I25ThorntonParkwayInterchangePMpackageA
DATE : 11/22/10 TIME : 13: 3:41
The MODE flag has been set to C for calculating CO averages.
SITE & METEOROLOGICAL VARIABLES ------------------------------- VS = .0 CM/S VD = .0 CM/S Z0 = 175. CM U = 1.0 M/S CLAS = 4 (D) ATIM = 60. MINUTES MIXH = 1000. M AMB = .0 PPM
LINK VARIABLES -------------- LINK DESCRIPTION * LINK COORDINATES (FT) * LENGTH BRG TYPE VPH EF H W V/C QUEUE * X1 Y1 X2 Y2 * (FT) (DEG) (G/MI) (FT) (FT) (VEH) ------------------------*----------------------------------------*---------------------------------------------------------- 1. thornebapp * 122.0 90.0 833.0 90.0 * 711. 90. AG 1925. 22.5 .0 56.0 2. thornebapp que * 802.0 90.0 632.6 90.0 * 169. 270. AG 611. 100.0 .0 36.0 .81 8.6 3. thornebdep/app * 833.0 96.0 1411.0 96.0 * 578. 90. AG 2135. 22.5 .0 44.0 4. thornebdep/app que * 1386.0 96.0 921.2 96.0 * 465. 270. AG 315. 100.0 .0 24.0 1.01 23.6 5. thornebleftturn * 1386.0 114.0 -125.2 114.0 * 1511. 270. AG 315. 100.0 .0 12.0 1.56 76.8 6. thornebdep * 1411.0 90.0 2122.0 90.0 * 711. 90. AG 2425. 22.5 .0 56.0 7. thornwbapp * 2122.0 156.0 1411.0 156.0 * 711. 270. AG 2150. 22.5 .0 56.0 8. thornwbapp que * 1442.0 156.0 1715.2 156.0 * 273. 90. AG 681. 100.0 .0 36.0 .97 13.9 9. thornwbdep/app * 1411.0 150.0 833.0 150.0 * 578. 270. AG 1875. 45.4 .0 44.0 10. thornwbdep/app que * 858.0 150.0 1025.0 150.0 * 167. 90. AG 315. 100.0 .0 24.0 .82 8.5 11. thornwbleftturn * 858.0 126.0 1910.6 126.0 * 1053. 90. AG 677. 100.0 .0 24.0 1.68 53.5 12. thornwbdep * 833.0 156.0 122.0 156.0 * 711. 270. AG 1745. 45.4 .0 56.0 13. I25sbrampapp * 824.0 1124.0 824.0 124.0 * 1000. 180. AG 760. 22.8 .0 44.0 14. I25sbrampleftturn * 842.0 184.0 842.0 336.3 * 152. 360. AG 227. 100.0 .0 12.0 .78 7.7 15. I25sbrampdep * 824.0 124.0 824.0 -876.0 * 1000. 180. AG 680. 22.8 .0 44.0 16. I25nbrampapp * 1420.0 -876.0 1420.0 124.0 * 1000. 360. AG 790. 23.1 .0 44.0 17. I25nbrampleftturn * 1402.0 62.0 1402.0 13.6 * 48. 180. AG 227. 100.0 .0 12.0 .25 2.5 18. I25nbrampdep * 1420.0 124.0 1420.0 1124.0 * 1000. 360. AG 775. 23.1 .0 44.0� PAGE 2 JOB: I25ThorntonParkwayInterchangePMpackageA RUN: I25ThorntonParkwayInterchangePMpackageA
DATE : 11/22/10 TIME : 13: 3:41
ADDITIONAL QUEUE LINK PARAMETERS -------------------------------- LINK DESCRIPTION * CYCLE RED CLEARANCE APPROACH SATURATION IDLE SIGNAL ARRIVAL * LENGTH TIME LOST TIME VOL FLOW RATE EM FAC TYPE RATE * (SEC) (SEC) (SEC) (VPH) (VPH) (gm/hr) ------------------------*-------------------------------------------------------------------------------- 2. thornebapp que * 100 53 2.0 1675 1600 143.34 1 3 4. thornebdep/app que * 100 41 2.0 1785 1600 143.34 1 3 5. thornebleftturn * 100 82 2.0 350 1600 143.34 1 3 8. thornwbapp que * 100 59 2.0 1725 1600 143.34 1 3 10. thornwbdep/app que * 100 41 2.0 1445 1600 143.34 1 3 11. thornwbleftturn * 100 88 2.0 430 1600 143.34 1 3 14. I25sbrampleftturn * 100 59 2.0 460 1600 143.34 1 3 17. I25nbrampleftturn * 100 59 2.0 150 1600 143.34 1 3
RECEPTOR LOCATIONS ------------------ * COORDINATES (FT) * RECEPTOR * X Y Z * -------------------------*-------------------------------------* 1. Receptor 1 * 672.0 52.0 5.0 * 2. Receptor 2 * 712.0 52.0 5.0 * 3. Receptor 3 * 752.0 52.0 5.0 * 4. Receptor 4 * 792.0 52.0 5.0 * 5. Receptor 5 * 792.0 2.0 5.0 *
Page 1

thopkav2.out 6. Receptor 6 * 792.0 -38.0 5.0 * 7. Receptor 7 * 792.0 -78.0 5.0 * 8. Receptor 8 * 856.0 -56.0 5.0 * 9. Receptor 9 * 856.0 -16.0 5.0 * 10. Receptor 10 * 856.0 24.0 5.0 * 11. Receptor 11 * 856.0 64.0 5.0 * 12. Receptor 12 * 896.0 64.0 5.0 * 13. Receptor 13 * 936.0 64.0 5.0 * 14. Receptor 14 * 976.0 64.0 5.0 * 15. Receptor 15 * 1256.0 64.0 5.0 * 16. Receptor 16 * 1296.0 64.0 5.0 * 17. Receptor 17 * 1336.0 64.0 5.0 * 18. Receptor 18 * 1376.0 64.0 5.0 * 19. Receptor 19 * 1376.0 24.0 5.0 * 20. Receptor 20 * 1376.0 -16.0 5.0 * 21. Receptor 21 * 1376.0 -56.0 5.0 * 22. Receptor 22 * 1452.0 -68.0 5.0 * 23. Receptor 23 * 1452.0 -28.0 5.0 * 24. Receptor 24 * 1452.0 12.0 5.0 * 25. Receptor 25 * 1452.0 52.0 5.0 * 26. Receptor 26 * 1492.0 52.0 5.0 * 27. Receptor 27 * 1532.0 52.0 5.0 * 28. Receptor 28 * 1572.0 52.0 5.0 * 29. Receptor 29 * 1572.0 194.0 5.0 * 30. Receptor 30 * 1532.0 194.0 5.0 * 31. Receptor 31 * 1492.0 194.0 5.0 * 32. Receptor 32 * 1452.0 194.0 5.0 * 33. Receptor 33 * 1452.0 234.0 5.0 * 34. Receptor 34 * 1452.0 274.0 5.0 * 35. Receptor 35 * 1452.0 314.0 5.0 * 36. Receptor 36 * 1388.0 302.0 5.0 * 37. Receptor 37 * 1388.0 262.0 5.0 *� PAGE 3 JOB: I25ThorntonParkwayInterchangePMpackageA RUN: I25ThorntonParkwayInterchangePMpackageA
DATE : 11/22/10 TIME : 13: 3:41
RECEPTOR LOCATIONS ------------------ * COORDINATES (FT) * RECEPTOR * X Y Z * -------------------------*-------------------------------------* 38. Receptor 38 * 1388.0 222.0 5.0 * 39. Receptor 39 * 1388.0 182.0 5.0 * 40. Receptor 40 * 1348.0 182.0 5.0 * 41. Receptor 41 * 1308.0 182.0 5.0 * 42. Receptor 42 * 1264.0 182.0 5.0 * 43. Receptor 43 * 988.0 182.0 5.0 * 44. Receptor 44 * 948.0 182.0 5.0 * 45. Receptor 45 * 908.0 182.0 5.0 * 46. Receptor 46 * 868.0 182.0 5.0 * 47. Receptor 47 * 868.0 222.0 5.0 * 48. Receptor 48 * 868.0 262.0 5.0 * 49. Receptor 49 * 868.0 302.0 5.0 * 50. Receptor 50 * 792.0 314.0 5.0 * 51. Receptor 51 * 792.0 274.0 5.0 * 52. Receptor 52 * 792.0 234.0 5.0 * 53. Receptor 53 * 792.0 194.0 5.0 * 54. Receptor 54 * 752.0 194.0 5.0 * 55. Receptor 55 * 712.0 194.0 5.0 * 56. Receptor 56 * 672.0 194.0 5.0 *� PAGE 4 JOB: I25ThorntonParkwayInterchangePMpackageA RUN: I25ThorntonParkwayInterchangePMpackageA
MODEL RESULTS -------------
REMARKS : In search of the angle corresponding to the maximum concentration, only the first angle, of the angles with same maximum concentrations, is indicated as maximum.
WIND ANGLE RANGE: 0.-360.
WIND * CONCENTRATION ANGLE * (PPM) (DEGR)* REC1 REC2 REC3 REC4 REC5 REC6 REC7 REC8 REC9 REC10 REC11 REC12 REC13 REC14 REC15 REC16 REC17 REC18
Page 2

thopkav2.outREC19 REC20 ------*------------------------------------------------------------------------------------------------------------------------ 0. * 4.4 4.4 4.5 4.6 3.2 2.5 2.3 2.5 2.6 3.3 4.6 4.8 5.4 5.4 5.0 5.0 5.1 5.1 3.6 3.0 10. * 4.5 4.5 4.7 4.5 3.3 2.7 2.6 2.4 2.8 3.2 4.5 4.7 5.3 5.4 5.2 5.2 5.2 5.0 3.5 3.0 20. * 4.5 4.7 4.7 4.3 3.2 2.7 2.6 2.2 2.5 3.2 4.4 4.7 5.4 5.3 5.2 5.2 5.4 4.8 3.7 3.1 30. * 4.6 4.8 4.8 4.3 3.3 3.0 2.8 2.4 2.9 3.6 4.9 5.0 5.6 5.4 5.2 5.4 5.4 4.7 3.8 3.3 40. * 4.8 5.1 5.3 4.7 3.4 3.1 2.9 2.6 3.2 3.7 5.2 5.5 5.8 5.6 5.6 5.6 5.7 5.0 3.9 3.2 50. * 5.6 5.6 5.5 5.3 3.9 3.3 2.9 2.7 3.2 4.2 5.6 5.9 6.1 5.9 5.9 5.9 5.6 5.3 4.5 3.5 60. * 5.8 6.1 5.9 5.8 3.9 3.6 3.2 2.8 3.4 4.4 6.2 6.5 6.5 6.3 6.3 6.2 5.9 5.6 4.5 3.3 70. * 6.7 6.7 6.5 6.4 4.3 3.3 2.7 2.6 3.4 4.4 6.7 7.0 6.9 6.9 6.5 6.2 5.7 5.7 4.3 2.6 80. * 6.2 5.9 5.7 5.9 3.4 2.5 2.1 1.7 2.4 3.8 6.4 6.6 6.5 6.3 5.6 5.4 5.2 5.3 3.3 1.8 90. * 4.1 3.9 3.8 4.0 2.2 1.5 1.1 .8 1.4 2.1 4.3 4.4 4.5 4.2 3.6 3.5 3.4 3.8 1.9 .9 100. * 1.6 1.6 1.6 1.7 .8 .6 .5 .2 .3 .6 1.9 1.9 1.8 1.8 1.7 1.6 1.7 2.1 1.0 .5 110. * .5 .5 .5 .6 .5 .5 .5 .1 .1 .1 .5 .5 .5 .5 .6 .6 .8 1.2 .7 .4 120. * .3 .3 .4 .6 .6 .6 .6 .1 .1 .1 .1 .1 .1 .1 .2 .3 .6 1.0 .7 .5 130. * .3 .3 .4 .6 .6 .6 .6 .1 .1 .1 .1 .1 .1 .1 .2 .2 .4 1.0 .6 .5 140. * .2 .2 .4 .6 .6 .6 .5 .1 .1 .1 .1 .1 .1 .1 .2 .3 .4 .9 .5 .5 150. * .2 .2 .3 .6 .6 .6 .6 .0 .0 .0 .0 .1 .1 .1 .2 .3 .4 .9 .6 .6 160. * .2 .2 .3 .7 .7 .7 .7 .1 .1 .1 .1 .0 .0 .0 .2 .3 .4 .8 .6 .6 170. * .1 .2 .3 .7 .7 .7 .7 .2 .2 .2 .2 .1 .0 .0 .1 .2 .3 .7 .6 .6 180. * .1 .1 .2 .5 .5 .5 .5 .5 .5 .5 .5 .2 .1 .1 .1 .1 .2 .4 .4 .4 190. * .0 .0 .1 .2 .2 .2 .2 .7 .7 .7 .7 .3 .2 .1 .0 .0 .1 .2 .2 .2 200. * .0 .0 .0 .1 .1 .1 .1 .7 .7 .7 .7 .4 .2 .2 .0 .0 .0 .0 .0 .0 210. * .0 .0 .0 .0 .0 .0 .0 .6 .6 .6 .6 .3 .2 .2 .1 .1 .0 .0 .0 .0 220. * .0 .0 .0 .0 .0 .0 .0 .5 .5 .5 .5 .3 .2 .2 .1 .1 .1 .1 .1 .1 230. * .0 .0 .0 .0 .0 .0 .0 .5 .5 .5 .5 .3 .2 .2 .1 .1 .1 .1 .1 .1 240. * .0 .0 .0 .0 .0 .0 .0 .5 .5 .5 .6 .4 .2 .2 .1 .1 .1 .1 .1 .1 250. * .1 .2 .2 .2 .0 .0 .0 .4 .4 .4 .9 .6 .6 .5 .3 .4 .4 .4 .1 .1 260. * .7 .7 .8 .9 .1 .0 .0 .4 .5 .8 2.3 1.9 1.7 1.7 1.8 1.8 1.9 1.8 .6 .3 270. * 1.9 2.1 2.2 2.5 .6 .4 .1 .8 1.1 1.8 4.2 3.8 3.4 3.3 4.2 4.1 4.3 4.4 2.0 1.4 280. * 3.2 3.5 4.0 4.3 1.6 .9 .5 1.2 1.8 3.0 5.7 5.0 4.7 4.8 6.3 6.4 6.4 6.5 3.7 2.3 290. * 3.9 4.5 4.9 5.1 2.4 1.6 1.1 1.8 2.6 3.9 5.6 5.0 5.0 5.6 6.9 6.9 7.0 6.9 4.4 3.2 300. * 4.0 4.7 5.1 5.2 2.8 1.9 1.5 2.5 3.1 4.1 5.1 4.6 4.8 5.7 6.5 6.6 6.5 6.5 4.3 3.3 310. * 4.2 4.8 5.0 5.0 2.9 2.1 1.6 2.6 3.1 3.7 4.5 4.3 4.9 5.8 5.9 5.9 5.9 5.9 4.1 3.1 320. * 4.0 4.5 4.5 4.5 2.8 2.2 1.8 2.4 2.9 3.3 4.0 4.1 5.2 6.0 5.4 5.4 5.4 5.4 3.7 3.1 330. * 4.1 4.4 4.4 4.5 2.8 2.3 1.9 2.5 2.8 3.0 3.8 4.4 5.4 5.8 5.2 5.2 5.2 5.2 3.7 2.8 340. * 4.2 4.3 4.3 4.4 2.7 2.0 1.7 2.4 2.5 3.2 4.0 4.7 5.3 5.5 4.9 4.9 4.9 4.9 3.4 2.5 350. * 4.3 4.3 4.4 4.4 3.0 2.3 1.9 2.4 2.8 3.3 4.4 5.1 5.5 5.5 5.0 5.0 5.1 5.1 3.6 2.6 360. * 4.4 4.4 4.5 4.6 3.2 2.5 2.3 2.5 2.6 3.3 4.6 4.8 5.4 5.4 5.0 5.0 5.1 5.1 3.6 3.0 ------*------------------------------------------------------------------------------------------------------------------------
Page 3
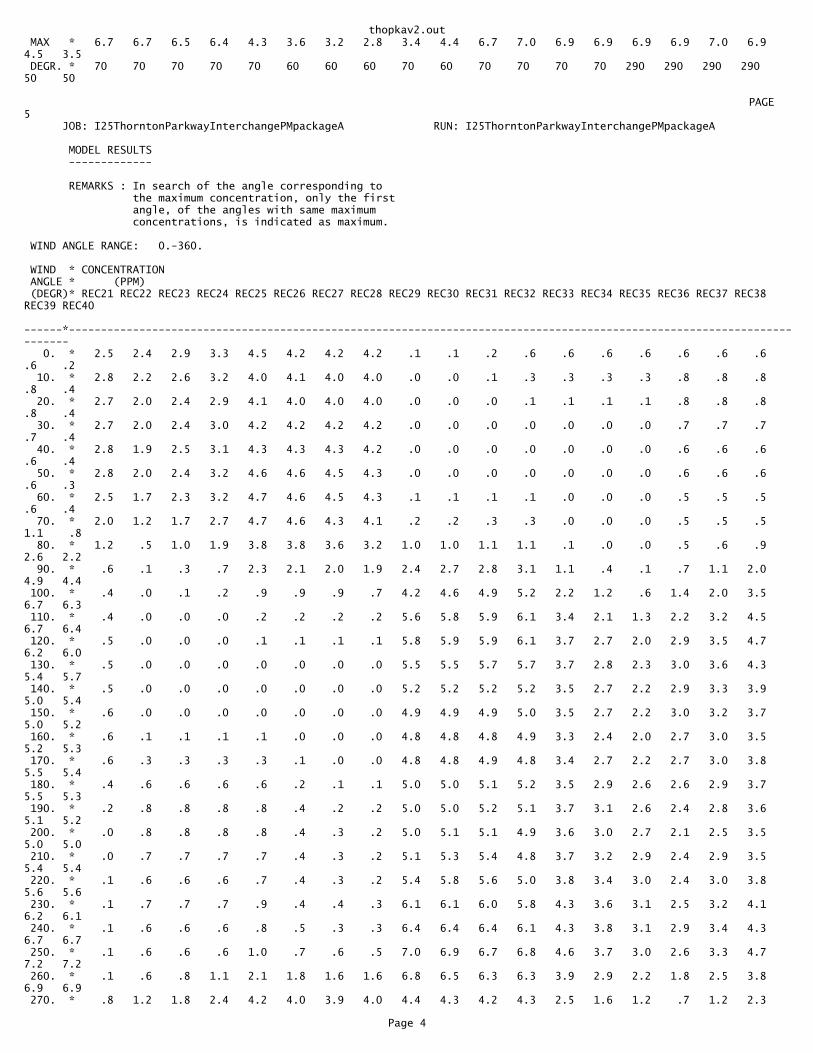
thopkav2.out MAX * 6.7 6.7 6.5 6.4 4.3 3.6 3.2 2.8 3.4 4.4 6.7 7.0 6.9 6.9 6.9 6.9 7.0 6.9 4.5 3.5 DEGR. * 70 70 70 70 70 60 60 60 70 60 70 70 70 70 290 290 290 290 50 50
� PAGE 5 JOB: I25ThorntonParkwayInterchangePMpackageA RUN: I25ThorntonParkwayInterchangePMpackageA
MODEL RESULTS -------------
REMARKS : In search of the angle corresponding to the maximum concentration, only the first angle, of the angles with same maximum concentrations, is indicated as maximum.
WIND ANGLE RANGE: 0.-360.
WIND * CONCENTRATION ANGLE * (PPM) (DEGR)* REC21 REC22 REC23 REC24 REC25 REC26 REC27 REC28 REC29 REC30 REC31 REC32 REC33 REC34 REC35 REC36 REC37 REC38 REC39 REC40 ------*------------------------------------------------------------------------------------------------------------------------ 0. * 2.5 2.4 2.9 3.3 4.5 4.2 4.2 4.2 .1 .1 .2 .6 .6 .6 .6 .6 .6 .6 .6 .2 10. * 2.8 2.2 2.6 3.2 4.0 4.1 4.0 4.0 .0 .0 .1 .3 .3 .3 .3 .8 .8 .8 .8 .4 20. * 2.7 2.0 2.4 2.9 4.1 4.0 4.0 4.0 .0 .0 .0 .1 .1 .1 .1 .8 .8 .8 .8 .4 30. * 2.7 2.0 2.4 3.0 4.2 4.2 4.2 4.2 .0 .0 .0 .0 .0 .0 .0 .7 .7 .7 .7 .4 40. * 2.8 1.9 2.5 3.1 4.3 4.3 4.3 4.2 .0 .0 .0 .0 .0 .0 .0 .6 .6 .6 .6 .4 50. * 2.8 2.0 2.4 3.2 4.6 4.6 4.5 4.3 .0 .0 .0 .0 .0 .0 .0 .6 .6 .6 .6 .3 60. * 2.5 1.7 2.3 3.2 4.7 4.6 4.5 4.3 .1 .1 .1 .1 .0 .0 .0 .5 .5 .5 .6 .4 70. * 2.0 1.2 1.7 2.7 4.7 4.6 4.3 4.1 .2 .2 .3 .3 .0 .0 .0 .5 .5 .5 1.1 .8 80. * 1.2 .5 1.0 1.9 3.8 3.8 3.6 3.2 1.0 1.0 1.1 1.1 .1 .0 .0 .5 .6 .9 2.6 2.2 90. * .6 .1 .3 .7 2.3 2.1 2.0 1.9 2.4 2.7 2.8 3.1 1.1 .4 .1 .7 1.1 2.0 4.9 4.4 100. * .4 .0 .1 .2 .9 .9 .9 .7 4.2 4.6 4.9 5.2 2.2 1.2 .6 1.4 2.0 3.5 6.7 6.3 110. * .4 .0 .0 .0 .2 .2 .2 .2 5.6 5.8 5.9 6.1 3.4 2.1 1.3 2.2 3.2 4.5 6.7 6.4 120. * .5 .0 .0 .0 .1 .1 .1 .1 5.8 5.9 5.9 6.1 3.7 2.7 2.0 2.9 3.5 4.7 6.2 6.0 130. * .5 .0 .0 .0 .0 .0 .0 .0 5.5 5.5 5.7 5.7 3.7 2.8 2.3 3.0 3.6 4.3 5.4 5.7 140. * .5 .0 .0 .0 .0 .0 .0 .0 5.2 5.2 5.2 5.2 3.5 2.7 2.2 2.9 3.3 3.9 5.0 5.4 150. * .6 .0 .0 .0 .0 .0 .0 .0 4.9 4.9 4.9 5.0 3.5 2.7 2.2 3.0 3.2 3.7 5.0 5.2 160. * .6 .1 .1 .1 .1 .0 .0 .0 4.8 4.8 4.8 4.9 3.3 2.4 2.0 2.7 3.0 3.5 5.2 5.3 170. * .6 .3 .3 .3 .3 .1 .0 .0 4.8 4.8 4.9 4.8 3.4 2.7 2.2 2.7 3.0 3.8 5.5 5.4 180. * .4 .6 .6 .6 .6 .2 .1 .1 5.0 5.0 5.1 5.2 3.5 2.9 2.6 2.6 2.9 3.7 5.5 5.3 190. * .2 .8 .8 .8 .8 .4 .2 .2 5.0 5.0 5.2 5.1 3.7 3.1 2.6 2.4 2.8 3.6 5.1 5.2 200. * .0 .8 .8 .8 .8 .4 .3 .2 5.0 5.1 5.1 4.9 3.6 3.0 2.7 2.1 2.5 3.5 5.0 5.0 210. * .0 .7 .7 .7 .7 .4 .3 .2 5.1 5.3 5.4 4.8 3.7 3.2 2.9 2.4 2.9 3.5 5.4 5.4 220. * .1 .6 .6 .6 .7 .4 .3 .2 5.4 5.8 5.6 5.0 3.8 3.4 3.0 2.4 3.0 3.8 5.6 5.6 230. * .1 .7 .7 .7 .9 .4 .4 .3 6.1 6.1 6.0 5.8 4.3 3.6 3.1 2.5 3.2 4.1 6.2 6.1 240. * .1 .6 .6 .6 .8 .5 .3 .3 6.4 6.4 6.4 6.1 4.3 3.8 3.1 2.9 3.4 4.3 6.7 6.7 250. * .1 .6 .6 .6 1.0 .7 .6 .5 7.0 6.9 6.7 6.8 4.6 3.7 3.0 2.6 3.3 4.7 7.2 7.2 260. * .1 .6 .8 1.1 2.1 1.8 1.6 1.6 6.8 6.5 6.3 6.3 3.9 2.9 2.2 1.8 2.5 3.8 6.9 6.9 270. * .8 1.2 1.8 2.4 4.2 4.0 3.9 4.0 4.4 4.3 4.2 4.3 2.5 1.6 1.2 .7 1.2 2.3
Page 4

thopkav2.out4.8 4.6 280. * 1.7 2.1 2.9 4.0 6.2 6.2 6.0 5.9 1.9 1.9 1.8 1.9 1.2 .8 .7 .2 .3 .8 2.1 2.1 290. * 2.6 2.9 3.6 4.9 6.8 6.3 5.9 5.7 .5 .5 .5 .7 .6 .6 .6 .1 .1 .1 .5 .5 300. * 2.9 3.1 3.8 4.8 5.8 5.6 5.2 5.2 .3 .3 .4 .6 .6 .6 .6 .1 .1 .1 .2 .2 310. * 2.6 3.1 3.7 4.4 5.5 4.8 4.7 4.8 .3 .3 .4 .7 .7 .7 .7 .1 .1 .1 .1 .1 320. * 2.5 3.0 3.5 3.9 4.9 4.4 4.4 4.5 .2 .3 .4 .7 .7 .6 .6 .1 .1 .1 .1 .1 330. * 2.3 2.9 3.3 3.5 4.4 4.1 4.4 4.3 .2 .3 .4 .7 .7 .7 .7 .0 .0 .0 .0 .1 340. * 2.2 2.7 3.1 3.4 4.2 4.1 4.2 4.1 .2 .3 .4 .8 .8 .8 .8 .1 .1 .1 .1 .0 350. * 2.2 2.7 2.9 3.4 4.3 4.3 4.2 4.2 .2 .2 .4 .8 .8 .8 .8 .3 .3 .3 .3 .1 360. * 2.5 2.4 2.9 3.3 4.5 4.2 4.2 4.2 .1 .1 .2 .6 .6 .6 .6 .6 .6 .6 .6 .2 ------*------------------------------------------------------------------------------------------------------------------------ MAX * 2.9 3.1 3.8 4.9 6.8 6.3 6.0 5.9 7.0 6.9 6.7 6.8 4.6 3.8 3.1 3.0 3.6 4.7 7.2 7.2 DEGR. * 300 300 300 290 290 290 280 280 250 250 250 250 250 240 230 130 130 120 250 250
� PAGE 6 JOB: I25ThorntonParkwayInterchangePMpackageA RUN: I25ThorntonParkwayInterchangePMpackageA
MODEL RESULTS -------------
REMARKS : In search of the angle corresponding to the maximum concentration, only the first angle, of the angles with same maximum concentrations, is indicated as maximum.
WIND ANGLE RANGE: 0.-360.
WIND * CONCENTRATION ANGLE * (PPM) (DEGR)* REC41 REC42 REC43 REC44 REC45 REC46 REC47 REC48 REC49 REC50 REC51 REC52 REC53 REC54 REC55 REC56 ------*------------------------------------------------------------------------------------------------ 0. * .1 .1 .1 .1 .2 .6 .6 .5 .4 .5 .5 .5 .5 .2 .1 .1 10. * .2 .2 .0 .0 .1 .3 .3 .2 .1 .8 .8 .9 .9 .3 .2 .1 20. * .3 .2 .0 .0 .0 .0 .0 .0 .0 .8 .8 .9 1.0 .5 .3 .2 30. * .3 .2 .1 .1 .1 .0 .0 .0 .0 .7 .8 .9 1.0 .5 .3 .2 40. * .3 .2 .1 .1 .1 .1 .1 .1 .1 .6 .9 1.0 1.0 .6 .4 .2 50. * .2 .2 .1 .1 .1 .1 .1 .1 .1 .8 1.0 1.0 1.0 .6 .4 .5 60. * .2 .2 .2 .2 .2 .2 .1 .1 .1 .7 .9 .9 .9 .7 .6 .5 70. * .6 .7 .6 .5 .5 .5 .1 .1 .1 .8 .9 .9 1.0 .8 .7 .6 80. * 2.0 2.0 1.9 1.9 2.0 2.3 .7 .4 .1 .9 1.2 1.5 2.3 2.2 2.2 2.2 90. * 4.2 4.3 4.5 4.8 4.9 5.3 2.3 1.3 .8 1.6 2.1 2.7 4.8 4.6 4.6 4.5 100. * 6.2 6.1 6.8 7.3 7.2 7.6 3.9 2.6 1.9 2.6 3.2 4.2 7.0 6.8 6.6 6.3 110. * 6.6 6.7 7.2 7.7 7.9 8.3 4.7 3.5 2.5 3.2 3.9 5.3 7.5 6.9 6.5 6.2 120. * 6.0 6.3 7.0 7.4 7.5 7.6 4.8 3.5 2.9 3.4 4.1 5.0 6.7 6.0 5.5 5.3 130. * 5.8 6.0 6.5 6.9 6.9 7.0 4.4 3.4 2.6 3.6 4.1 4.7 5.7 5.1 4.7 4.6 140. * 5.8 5.8 6.2 6.4 6.4 6.3 4.3 3.3 2.6 3.4 3.9 4.0 4.9 4.2 4.5 4.5 150. * 5.5 5.4 6.1 6.2 6.2 6.1 4.0 3.1 2.7 3.2 3.3 3.7 4.3 4.0 4.1 4.2 160. * 5.3 5.2 5.8 5.8 5.7 5.5 3.6 2.9 2.5 2.7 3.0 3.2 4.3 3.9 4.0 4.0 170. * 5.3 5.3 5.8 5.8 5.8 5.3 3.7 2.7 2.5 2.5 2.8 3.4 4.2 4.1 4.1 4.0 180. * 5.2 5.2 5.9 5.9 5.7 5.4 3.5 2.9 2.5 2.2 2.7 3.1 4.2 4.2 4.1 4.0 190. * 5.1 5.1 6.0 6.0 5.6 5.2 3.5 2.9 2.8 1.9 2.4 3.0 4.0 4.0 3.9 3.7 200. * 5.0 5.0 6.0 5.8 5.8 4.7 3.4 3.2 3.0 1.9 2.2 2.8 3.9 3.8 3.7 3.4 210. * 5.4 5.4 6.1 5.9 5.8 4.7 3.6 3.1 3.0 1.8 2.1 2.9 4.0 3.9 3.8 3.4 220. * 5.6 5.6 6.3 6.2 5.8 4.9 3.8 3.4 3.0 1.7 2.1 2.8 4.4 4.2 4.0 3.7 230. * 6.1 6.1 6.6 6.4 6.0 5.1 3.9 3.4 2.7 1.7 2.1 2.8 4.4 4.2 4.0 3.8 240. * 6.7 6.7 6.9 6.6 6.1 5.5 3.9 3.3 2.7 1.6 2.1 2.7 4.6 4.4 4.2 4.1 250. * 7.4 7.3 7.0 6.6 5.8 5.8 4.1 3.0 2.4 1.3 1.9 2.5 4.7 4.6 4.5 4.4 260. * 6.8 6.8 6.1 5.8 5.6 5.6 3.5 2.4 1.9 .7 1.2 2.0 4.1 4.1 4.1 4.0 270. * 4.6 4.6 4.1 3.9 3.9 4.2 2.4 1.6 1.2 .2 .6 1.0 2.7 2.6 2.5 2.5 280. * 2.0 2.1 1.9 1.9 2.1 2.5 1.3 1.0 .9 .0 .1 .2 1.2 1.2 1.1 1.0 290. * .5 .5 .7 .8 1.0 1.4 1.0 .8 .9 .0 .0 .0 .3 .3 .3 .3 300. * .2 .2 .3 .5 .7 .9 .9 .9 .8 .0 .0 .0 .1 .1 .1 .1 310. * .1 .1 .3 .4 .6 1.0 1.0 1.0 .9 .0 .0 .0 .1 .1 .1 .1 320. * .1 .1 .3 .4 .6 1.0 1.0 1.0 .8 .0 .0 .0 .0 .0 .0 .0 330. * .1 .1 .2 .4 .5 1.1 1.0 .9 .7 .0 .0 .0 .0 .0 .0 .0 340. * .0 .0 .2 .3 .4 1.1 1.1 .9 .7 .1 .1 .1 .1 .0 .0 .0 350. * .0 .0 .1 .2 .4 .9 .8 .7 .5 .2 .3 .3 .3 .1 .0 .0
Page 5
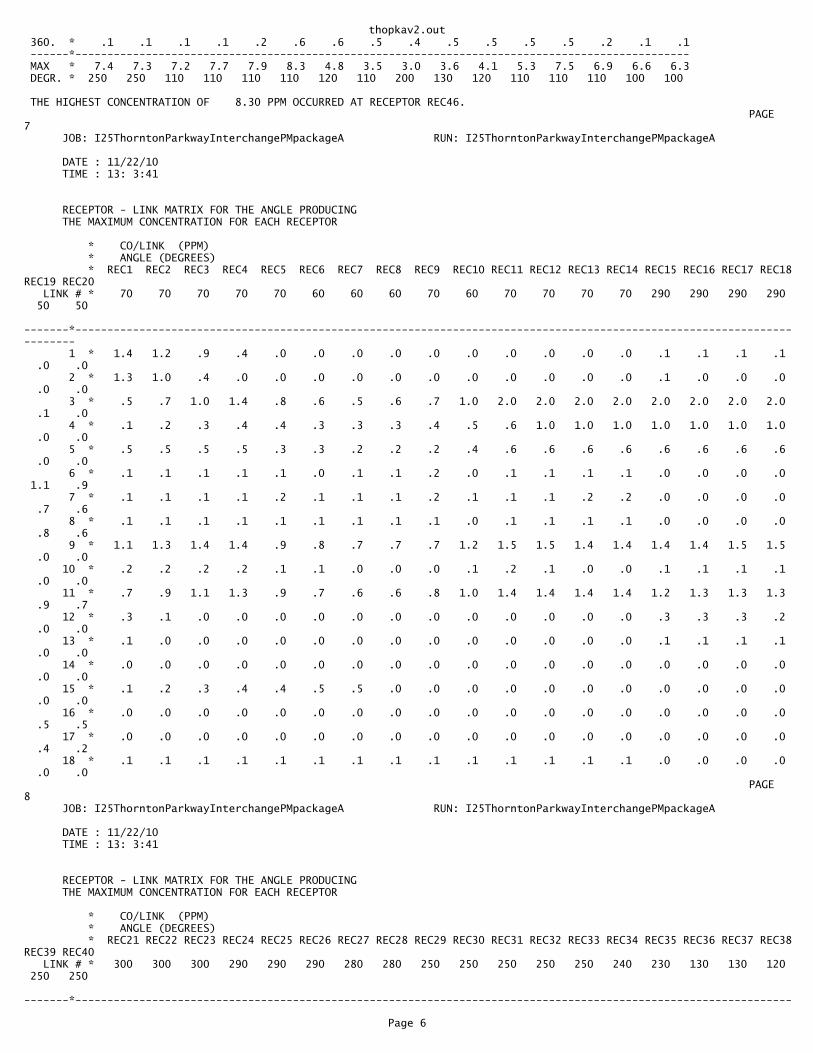
thopkav2.out 360. * .1 .1 .1 .1 .2 .6 .6 .5 .4 .5 .5 .5 .5 .2 .1 .1 ------*------------------------------------------------------------------------------------------------ MAX * 7.4 7.3 7.2 7.7 7.9 8.3 4.8 3.5 3.0 3.6 4.1 5.3 7.5 6.9 6.6 6.3 DEGR. * 250 250 110 110 110 110 120 110 200 130 120 110 110 110 100 100
THE HIGHEST CONCENTRATION OF 8.30 PPM OCCURRED AT RECEPTOR REC46.� PAGE 7 JOB: I25ThorntonParkwayInterchangePMpackageA RUN: I25ThorntonParkwayInterchangePMpackageA
DATE : 11/22/10 TIME : 13: 3:41
RECEPTOR - LINK MATRIX FOR THE ANGLE PRODUCING THE MAXIMUM CONCENTRATION FOR EACH RECEPTOR
* CO/LINK (PPM) * ANGLE (DEGREES) * REC1 REC2 REC3 REC4 REC5 REC6 REC7 REC8 REC9 REC10 REC11 REC12 REC13 REC14 REC15 REC16 REC17 REC18REC19 REC20 LINK # * 70 70 70 70 70 60 60 60 70 60 70 70 70 70 290 290 290 290 50 50 -------*------------------------------------------------------------------------------------------------------------------------ 1 * 1.4 1.2 .9 .4 .0 .0 .0 .0 .0 .0 .0 .0 .0 .0 .1 .1 .1 .1 .0 .0 2 * 1.3 1.0 .4 .0 .0 .0 .0 .0 .0 .0 .0 .0 .0 .0 .1 .0 .0 .0 .0 .0 3 * .5 .7 1.0 1.4 .8 .6 .5 .6 .7 1.0 2.0 2.0 2.0 2.0 2.0 2.0 2.0 2.0 .1 .0 4 * .1 .2 .3 .4 .4 .3 .3 .3 .4 .5 .6 1.0 1.0 1.0 1.0 1.0 1.0 1.0 .0 .0 5 * .5 .5 .5 .5 .3 .3 .2 .2 .2 .4 .6 .6 .6 .6 .6 .6 .6 .6 .0 .0 6 * .1 .1 .1 .1 .1 .0 .1 .1 .2 .0 .1 .1 .1 .1 .0 .0 .0 .0 1.1 .9 7 * .1 .1 .1 .1 .2 .1 .1 .1 .2 .1 .1 .1 .2 .2 .0 .0 .0 .0 .7 .6 8 * .1 .1 .1 .1 .1 .1 .1 .1 .1 .0 .1 .1 .1 .1 .0 .0 .0 .0 .8 .6 9 * 1.1 1.3 1.4 1.4 .9 .8 .7 .7 .7 1.2 1.5 1.5 1.4 1.4 1.4 1.4 1.5 1.5 .0 .0 10 * .2 .2 .2 .2 .1 .1 .0 .0 .0 .1 .2 .1 .0 .0 .1 .1 .1 .1 .0 .0 11 * .7 .9 1.1 1.3 .9 .7 .6 .6 .8 1.0 1.4 1.4 1.4 1.4 1.2 1.3 1.3 1.3 .9 .7 12 * .3 .1 .0 .0 .0 .0 .0 .0 .0 .0 .0 .0 .0 .0 .3 .3 .3 .2 .0 .0 13 * .1 .0 .0 .0 .0 .0 .0 .0 .0 .0 .0 .0 .0 .0 .1 .1 .1 .1 .0 .0 14 * .0 .0 .0 .0 .0 .0 .0 .0 .0 .0 .0 .0 .0 .0 .0 .0 .0 .0 .0 .0 15 * .1 .2 .3 .4 .4 .5 .5 .0 .0 .0 .0 .0 .0 .0 .0 .0 .0 .0 .0 .0 16 * .0 .0 .0 .0 .0 .0 .0 .0 .0 .0 .0 .0 .0 .0 .0 .0 .0 .0 .5 .5 17 * .0 .0 .0 .0 .0 .0 .0 .0 .0 .0 .0 .0 .0 .0 .0 .0 .0 .0 .4 .2 18 * .1 .1 .1 .1 .1 .1 .1 .1 .1 .1 .1 .1 .1 .1 .0 .0 .0 .0 .0 .0� PAGE 8 JOB: I25ThorntonParkwayInterchangePMpackageA RUN: I25ThorntonParkwayInterchangePMpackageA
DATE : 11/22/10 TIME : 13: 3:41
RECEPTOR - LINK MATRIX FOR THE ANGLE PRODUCING THE MAXIMUM CONCENTRATION FOR EACH RECEPTOR
* CO/LINK (PPM) * ANGLE (DEGREES) * REC21 REC22 REC23 REC24 REC25 REC26 REC27 REC28 REC29 REC30 REC31 REC32 REC33 REC34 REC35 REC36 REC37 REC38REC39 REC40 LINK # * 300 300 300 290 290 290 280 280 250 250 250 250 250 240 230 130 130 120 250 250 -------*----------------------------------------------------------------------------------------------------------------
Page 6
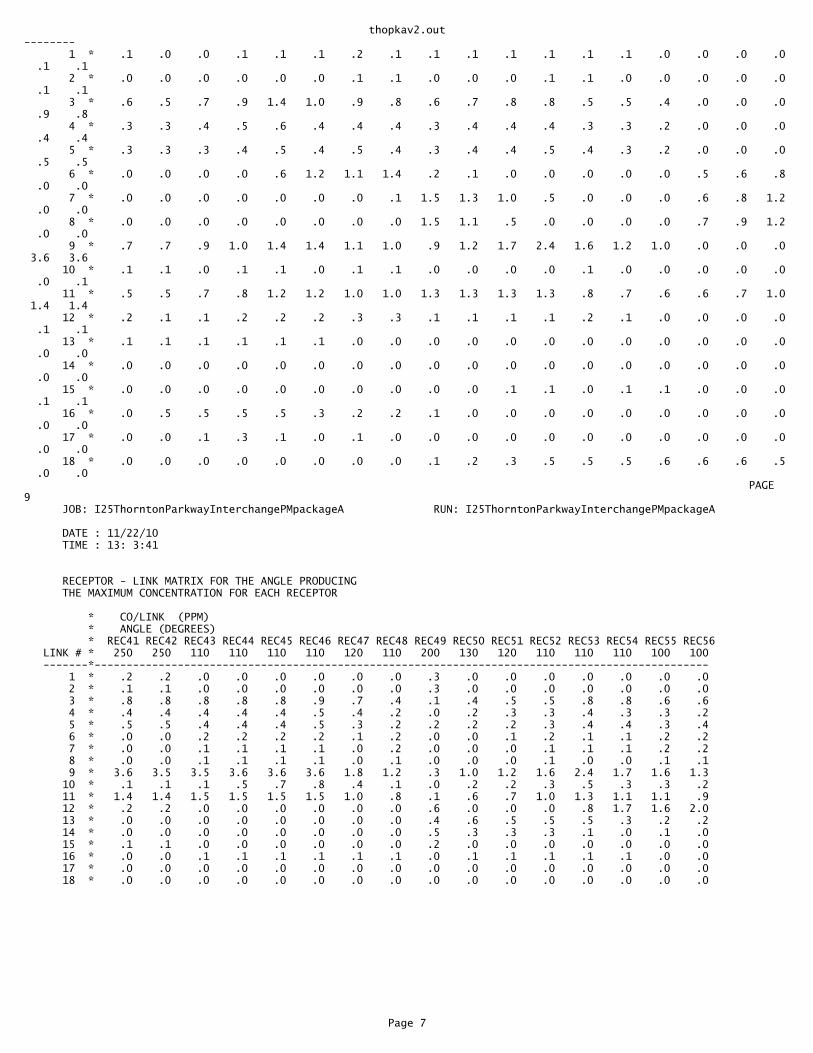
thopkav2.out-------- 1 * .1 .0 .0 .1 .1 .1 .2 .1 .1 .1 .1 .1 .1 .1 .0 .0 .0 .0 .1 .1 2 * .0 .0 .0 .0 .0 .0 .1 .1 .0 .0 .0 .1 .1 .0 .0 .0 .0 .0 .1 .1 3 * .6 .5 .7 .9 1.4 1.0 .9 .8 .6 .7 .8 .8 .5 .5 .4 .0 .0 .0 .9 .8 4 * .3 .3 .4 .5 .6 .4 .4 .4 .3 .4 .4 .4 .3 .3 .2 .0 .0 .0 .4 .4 5 * .3 .3 .3 .4 .5 .4 .5 .4 .3 .4 .4 .5 .4 .3 .2 .0 .0 .0 .5 .5 6 * .0 .0 .0 .0 .6 1.2 1.1 1.4 .2 .1 .0 .0 .0 .0 .0 .5 .6 .8 .0 .0 7 * .0 .0 .0 .0 .0 .0 .0 .1 1.5 1.3 1.0 .5 .0 .0 .0 .6 .8 1.2 .0 .0 8 * .0 .0 .0 .0 .0 .0 .0 .0 1.5 1.1 .5 .0 .0 .0 .0 .7 .9 1.2 .0 .0 9 * .7 .7 .9 1.0 1.4 1.4 1.1 1.0 .9 1.2 1.7 2.4 1.6 1.2 1.0 .0 .0 .0 3.6 3.6 10 * .1 .1 .0 .1 .1 .0 .1 .1 .0 .0 .0 .0 .1 .0 .0 .0 .0 .0 .0 .1 11 * .5 .5 .7 .8 1.2 1.2 1.0 1.0 1.3 1.3 1.3 1.3 .8 .7 .6 .6 .7 1.0 1.4 1.4 12 * .2 .1 .1 .2 .2 .2 .3 .3 .1 .1 .1 .1 .2 .1 .0 .0 .0 .0 .1 .1 13 * .1 .1 .1 .1 .1 .1 .0 .0 .0 .0 .0 .0 .0 .0 .0 .0 .0 .0 .0 .0 14 * .0 .0 .0 .0 .0 .0 .0 .0 .0 .0 .0 .0 .0 .0 .0 .0 .0 .0 .0 .0 15 * .0 .0 .0 .0 .0 .0 .0 .0 .0 .0 .1 .1 .0 .1 .1 .0 .0 .0 .1 .1 16 * .0 .5 .5 .5 .5 .3 .2 .2 .1 .0 .0 .0 .0 .0 .0 .0 .0 .0 .0 .0 17 * .0 .0 .1 .3 .1 .0 .1 .0 .0 .0 .0 .0 .0 .0 .0 .0 .0 .0 .0 .0 18 * .0 .0 .0 .0 .0 .0 .0 .0 .1 .2 .3 .5 .5 .5 .6 .6 .6 .5 .0 .0� PAGE 9 JOB: I25ThorntonParkwayInterchangePMpackageA RUN: I25ThorntonParkwayInterchangePMpackageA
DATE : 11/22/10 TIME : 13: 3:41
RECEPTOR - LINK MATRIX FOR THE ANGLE PRODUCING THE MAXIMUM CONCENTRATION FOR EACH RECEPTOR
* CO/LINK (PPM) * ANGLE (DEGREES) * REC41 REC42 REC43 REC44 REC45 REC46 REC47 REC48 REC49 REC50 REC51 REC52 REC53 REC54 REC55 REC56 LINK # * 250 250 110 110 110 110 120 110 200 130 120 110 110 110 100 100 -------*------------------------------------------------------------------------------------------------ 1 * .2 .2 .0 .0 .0 .0 .0 .0 .3 .0 .0 .0 .0 .0 .0 .0 2 * .1 .1 .0 .0 .0 .0 .0 .0 .3 .0 .0 .0 .0 .0 .0 .0 3 * .8 .8 .8 .8 .8 .9 .7 .4 .1 .4 .5 .5 .8 .8 .6 .6 4 * .4 .4 .4 .4 .4 .5 .4 .2 .0 .2 .3 .3 .4 .3 .3 .2 5 * .5 .5 .4 .4 .4 .5 .3 .2 .2 .2 .2 .3 .4 .4 .3 .4 6 * .0 .0 .2 .2 .2 .2 .1 .2 .0 .0 .1 .2 .1 .1 .2 .2 7 * .0 .0 .1 .1 .1 .1 .0 .2 .0 .0 .0 .1 .1 .1 .2 .2 8 * .0 .0 .1 .1 .1 .1 .0 .1 .0 .0 .0 .1 .0 .0 .1 .1 9 * 3.6 3.5 3.5 3.6 3.6 3.6 1.8 1.2 .3 1.0 1.2 1.6 2.4 1.7 1.6 1.3 10 * .1 .1 .1 .5 .7 .8 .4 .1 .0 .2 .2 .3 .5 .3 .3 .2 11 * 1.4 1.4 1.5 1.5 1.5 1.5 1.0 .8 .1 .6 .7 1.0 1.3 1.1 1.1 .9 12 * .2 .2 .0 .0 .0 .0 .0 .0 .6 .0 .0 .0 .8 1.7 1.6 2.0 13 * .0 .0 .0 .0 .0 .0 .0 .0 .4 .6 .5 .5 .5 .3 .2 .2 14 * .0 .0 .0 .0 .0 .0 .0 .0 .5 .3 .3 .3 .1 .0 .1 .0 15 * .1 .1 .0 .0 .0 .0 .0 .0 .2 .0 .0 .0 .0 .0 .0 .0 16 * .0 .0 .1 .1 .1 .1 .1 .1 .0 .1 .1 .1 .1 .1 .0 .0 17 * .0 .0 .0 .0 .0 .0 .0 .0 .0 .0 .0 .0 .0 .0 .0 .0 18 * .0 .0 .0 .0 .0 .0 .0 .0 .0 .0 .0 .0 .0 .0 .0 .0
Page 7

thopkbpm.in'I25ThorntonParkwayInterchangePMpackageB', 60 , 175 , 0 , 0 , 56 , 0.3048 , 1 , 1 'Receptor 1', 672 , 52 , 5 'Receptor 2', 712 , 52 , 5 'Receptor 3', 752 , 52 , 5 'Receptor 4', 792 , 52 , 5 'Receptor 5', 792 , 2 , 5 'Receptor 6', 792 ,-38 , 5 'Receptor 7', 792 ,-78 , 5 'Receptor 8', 856 ,-56 , 5 'Receptor 9', 856 ,-16 , 5 'Receptor 10', 856 , 24 , 5 'Receptor 11', 856 , 64 , 5 'Receptor 12', 896 , 64 , 5 'Receptor 13', 936 , 64 , 5 'Receptor 14', 976 , 64 , 5 'Receptor 15', 1256 , 64 , 5 'Receptor 16', 1296 , 64 , 5 'Receptor 17', 1336 , 64 , 5 'Receptor 18', 1376 , 64 , 5 'Receptor 19', 1376 , 24 , 5 'Receptor 20', 1376 ,-16 , 5 'Receptor 21', 1376 ,-56 , 5 'Receptor 22', 1452 ,-68 , 5 'Receptor 23', 1452 ,-28 , 5 'Receptor 24', 1452 , 12 , 5 'Receptor 25', 1452 , 52 , 5 'Receptor 26', 1492 , 52 , 5 'Receptor 27', 1532 , 52 , 5 'Receptor 28', 1572 , 52 , 5 'Receptor 29', 1572 , 194 , 5 'Receptor 30', 1532 , 194 , 5 'Receptor 31', 1492 , 194 , 5 'Receptor 32', 1452 , 194 , 5 'Receptor 33', 1452 , 234 , 5 'Receptor 34', 1452 , 274 , 5 'Receptor 35', 1452 , 314 , 5 'Receptor 36', 1388 , 302 , 5 'Receptor 37', 1388 , 262 , 5 'Receptor 38', 1388 , 222 , 5 'Receptor 39', 1388 , 182 , 5 'Receptor 40', 1348 , 182 , 5 'Receptor 41', 1308 , 182 , 5 'Receptor 42', 1264 , 182 , 5 'Receptor 43', 988 , 182 , 5 'Receptor 44', 948 , 182 , 5 'Receptor 45', 908 , 182 , 5 'Receptor 46', 868 , 182 , 5 'Receptor 47', 868 , 222 , 5 'Receptor 48', 868 , 262 , 5 'Receptor 49', 868 , 302 , 5 'Receptor 50', 792 , 314 , 5 'Receptor 51', 792 , 274 , 5 'Receptor 52', 792 , 234 , 5 'Receptor 53', 792 , 194 , 5 'Receptor 54', 752 , 194 , 5 'Receptor 55', 712 , 194 , 5 'Receptor 56', 672 , 194 , 5 'I25ThorntonParkwayInterchangePMpackageB', 18 , 1 , 1 ,'CO' 1 'thornebapp','AG', 122 , 90 , 833 , 90 , 1980 , 22.5 , 0 , 56 2 'thornebapp que','AG', 802 , 90 , 122 , 90 , 0 , 36 , 3 100 , 53 , 2 , 1750 , 143.34 , 1600 , 1 , 3 1 'thornebdep/app','AG', 833 , 96 , 1411 , 96 , 2270 , 22.5 , 0 , 44 2 'thornebdep/app que','AG', 1386 , 96 , 858 , 96 , 0 , 24 , 2 100 , 41 , 2 , 1795 , 143.34 , 1600 , 1 , 3 2 'thornebleftturn','AG', 1386 , 114 , 1186 , 114 , 0 , 12 , 1 100 , 81 , 2 , 475 , 143.34 , 1600 , 1 , 3 1 'thornebdep','AG', 1411 , 90 , 2122 , 90 , 2380 , 22.5 , 0 , 56 1 'thornwbapp','AG', 2122 , 156 , 1411 , 156 , 2350 , 22.5 , 0 , 56 2 'thornwbapp que','AG', 1442 , 156 , 2122 , 156 , 0 , 36 , 3 100 , 60 , 2 , 1800 , 143.34 , 1600 , 1 , 3 1 'thornwbdep/app','AG', 1411 , 150 , 833 , 150 , 2000 , 45.4 , 0 , 44 2
Page 1

thopkbpm.in'thornwbdep/app que','AG', 858 , 150 , 1386 , 150 , 0 , 24 , 2 100 , 41 , 2 , 1600 , 143.34 , 1600 , 1 , 3 2 'thornwbleftturn','AG', 858 , 126 , 1058 , 126 , 0 , 24 , 2 100 , 88 , 2 , 400 , 143.34 , 1600 , 1 , 3 1 'thornwbdep','AG', 833 , 156 , 122 , 156 , 2020 , 45.4 , 0 , 56 1 'I25sbrampapp','AG', 824 , 1124 , 824 , 124 , 940 , 22.8 , 0 , 44 2 'I25sbrampleftturn','AG', 842 , 184 , 842 , 384 , 0 , 12 , 1 100 , 59 , 2 , 520 , 143.34 , 1600 , 1 , 3 1 'I25sbrampdep','AG', 824 , 124 , 824 ,-876 , 630 , 22.8 , 0 , 44 1 'I25nbrampapp','AG', 1420 ,-876 , 1420 , 124 , 785 , 23.1 , 0 , 44 2 'I25nbrampleftturn','AG', 1402 , 62 , 1402 ,-138 , 0 , 12 , 1 100 , 59 , 2 , 200 , 143.34 , 1600 , 1 , 3 1 'I25nbrampdep','AG', 1420 , 124 , 1420 , 1124 , 1025 , 23.1 , 0 , 44 1 , 0 , 4 , 1000 , 0 ,'Y', 10 , 0 , 36
Page 2

thopkbv2.out� CAL3QHC: LINE SOURCE DISPERSION MODEL - VERSION 2.0 Dated 95221 PAGE 1
JOB: I25ThorntonParkwayInterchangePMpackageB RUN: I25ThorntonParkwayInterchangePMpackageB
DATE : 11/22/10 TIME : 13: 4:16
The MODE flag has been set to C for calculating CO averages.
SITE & METEOROLOGICAL VARIABLES ------------------------------- VS = .0 CM/S VD = .0 CM/S Z0 = 175. CM U = 1.0 M/S CLAS = 4 (D) ATIM = 60. MINUTES MIXH = 1000. M AMB = .0 PPM
LINK VARIABLES -------------- LINK DESCRIPTION * LINK COORDINATES (FT) * LENGTH BRG TYPE VPH EF H W V/C QUEUE * X1 Y1 X2 Y2 * (FT) (DEG) (G/MI) (FT) (FT) (VEH) ------------------------*----------------------------------------*---------------------------------------------------------- 1. thornebapp * 122.0 90.0 833.0 90.0 * 711. 90. AG 1980. 22.5 .0 56.0 2. thornebapp que * 802.0 90.0 615.8 90.0 * 186. 270. AG 611. 100.0 .0 36.0 .85 9.5 3. thornebdep/app * 833.0 96.0 1411.0 96.0 * 578. 90. AG 2270. 22.5 .0 44.0 4. thornebdep/app que * 1386.0 96.0 870.0 96.0 * 516. 270. AG 315. 100.0 .0 24.0 1.02 26.2 5. thornebleftturn * 1386.0 114.0 -1286.9 114.0 * 2673. 270. AG 311. 100.0 .0 12.0 1.98 135.8 6. thornebdep * 1411.0 90.0 2122.0 90.0 * 711. 90. AG 2380. 22.5 .0 56.0 7. thornwbapp * 2122.0 156.0 1411.0 156.0 * 711. 270. AG 2350. 22.5 .0 56.0 8. thornwbapp que * 1442.0 156.0 1996.9 156.0 * 555. 90. AG 692. 100.0 .0 36.0 1.04 28.2 9. thornwbdep/app * 1411.0 150.0 833.0 150.0 * 578. 270. AG 2000. 45.4 .0 44.0 10. thornwbdep/app que * 858.0 150.0 1080.1 150.0 * 222. 90. AG 315. 100.0 .0 24.0 .91 11.3 11. thornwbleftturn * 858.0 126.0 1749.3 126.0 * 891. 90. AG 677. 100.0 .0 24.0 1.56 45.3 12. thornwbdep * 833.0 156.0 122.0 156.0 * 711. 270. AG 2020. 45.4 .0 56.0 13. I25sbrampapp * 824.0 1124.0 824.0 124.0 * 1000. 180. AG 940. 22.8 .0 44.0 14. I25sbrampleftturn * 842.0 184.0 842.0 381.1 * 197. 360. AG 227. 100.0 .0 12.0 .88 10.0 15. I25sbrampdep * 824.0 124.0 824.0 -876.0 * 1000. 180. AG 630. 22.8 .0 44.0 16. I25nbrampapp * 1420.0 -876.0 1420.0 124.0 * 1000. 360. AG 785. 23.1 .0 44.0 17. I25nbrampleftturn * 1402.0 62.0 1402.0 -2.5 * 65. 180. AG 227. 100.0 .0 12.0 .34 3.3 18. I25nbrampdep * 1420.0 124.0 1420.0 1124.0 * 1000. 360. AG 1025. 23.1 .0 44.0� PAGE 2 JOB: I25ThorntonParkwayInterchangePMpackageB RUN: I25ThorntonParkwayInterchangePMpackageB
DATE : 11/22/10 TIME : 13: 4:16
ADDITIONAL QUEUE LINK PARAMETERS -------------------------------- LINK DESCRIPTION * CYCLE RED CLEARANCE APPROACH SATURATION IDLE SIGNAL ARRIVAL * LENGTH TIME LOST TIME VOL FLOW RATE EM FAC TYPE RATE * (SEC) (SEC) (SEC) (VPH) (VPH) (gm/hr) ------------------------*-------------------------------------------------------------------------------- 2. thornebapp que * 100 53 2.0 1750 1600 143.34 1 3 4. thornebdep/app que * 100 41 2.0 1795 1600 143.34 1 3 5. thornebleftturn * 100 81 2.0 475 1600 143.34 1 3 8. thornwbapp que * 100 60 2.0 1800 1600 143.34 1 3 10. thornwbdep/app que * 100 41 2.0 1600 1600 143.34 1 3 11. thornwbleftturn * 100 88 2.0 400 1600 143.34 1 3 14. I25sbrampleftturn * 100 59 2.0 520 1600 143.34 1 3 17. I25nbrampleftturn * 100 59 2.0 200 1600 143.34 1 3
RECEPTOR LOCATIONS ------------------ * COORDINATES (FT) * RECEPTOR * X Y Z * -------------------------*-------------------------------------* 1. Receptor 1 * 672.0 52.0 5.0 * 2. Receptor 2 * 712.0 52.0 5.0 * 3. Receptor 3 * 752.0 52.0 5.0 * 4. Receptor 4 * 792.0 52.0 5.0 * 5. Receptor 5 * 792.0 2.0 5.0 *
Page 1
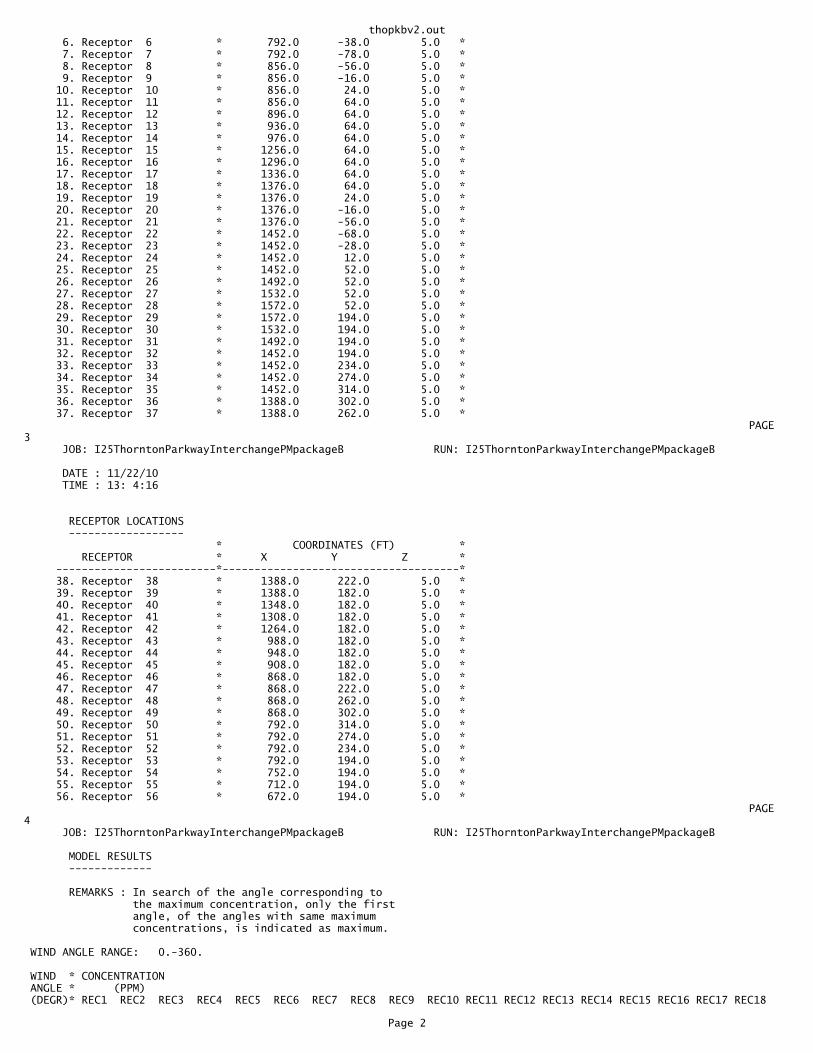
thopkbv2.out 6. Receptor 6 * 792.0 -38.0 5.0 * 7. Receptor 7 * 792.0 -78.0 5.0 * 8. Receptor 8 * 856.0 -56.0 5.0 * 9. Receptor 9 * 856.0 -16.0 5.0 * 10. Receptor 10 * 856.0 24.0 5.0 * 11. Receptor 11 * 856.0 64.0 5.0 * 12. Receptor 12 * 896.0 64.0 5.0 * 13. Receptor 13 * 936.0 64.0 5.0 * 14. Receptor 14 * 976.0 64.0 5.0 * 15. Receptor 15 * 1256.0 64.0 5.0 * 16. Receptor 16 * 1296.0 64.0 5.0 * 17. Receptor 17 * 1336.0 64.0 5.0 * 18. Receptor 18 * 1376.0 64.0 5.0 * 19. Receptor 19 * 1376.0 24.0 5.0 * 20. Receptor 20 * 1376.0 -16.0 5.0 * 21. Receptor 21 * 1376.0 -56.0 5.0 * 22. Receptor 22 * 1452.0 -68.0 5.0 * 23. Receptor 23 * 1452.0 -28.0 5.0 * 24. Receptor 24 * 1452.0 12.0 5.0 * 25. Receptor 25 * 1452.0 52.0 5.0 * 26. Receptor 26 * 1492.0 52.0 5.0 * 27. Receptor 27 * 1532.0 52.0 5.0 * 28. Receptor 28 * 1572.0 52.0 5.0 * 29. Receptor 29 * 1572.0 194.0 5.0 * 30. Receptor 30 * 1532.0 194.0 5.0 * 31. Receptor 31 * 1492.0 194.0 5.0 * 32. Receptor 32 * 1452.0 194.0 5.0 * 33. Receptor 33 * 1452.0 234.0 5.0 * 34. Receptor 34 * 1452.0 274.0 5.0 * 35. Receptor 35 * 1452.0 314.0 5.0 * 36. Receptor 36 * 1388.0 302.0 5.0 * 37. Receptor 37 * 1388.0 262.0 5.0 *� PAGE 3 JOB: I25ThorntonParkwayInterchangePMpackageB RUN: I25ThorntonParkwayInterchangePMpackageB
DATE : 11/22/10 TIME : 13: 4:16
RECEPTOR LOCATIONS ------------------ * COORDINATES (FT) * RECEPTOR * X Y Z * -------------------------*-------------------------------------* 38. Receptor 38 * 1388.0 222.0 5.0 * 39. Receptor 39 * 1388.0 182.0 5.0 * 40. Receptor 40 * 1348.0 182.0 5.0 * 41. Receptor 41 * 1308.0 182.0 5.0 * 42. Receptor 42 * 1264.0 182.0 5.0 * 43. Receptor 43 * 988.0 182.0 5.0 * 44. Receptor 44 * 948.0 182.0 5.0 * 45. Receptor 45 * 908.0 182.0 5.0 * 46. Receptor 46 * 868.0 182.0 5.0 * 47. Receptor 47 * 868.0 222.0 5.0 * 48. Receptor 48 * 868.0 262.0 5.0 * 49. Receptor 49 * 868.0 302.0 5.0 * 50. Receptor 50 * 792.0 314.0 5.0 * 51. Receptor 51 * 792.0 274.0 5.0 * 52. Receptor 52 * 792.0 234.0 5.0 * 53. Receptor 53 * 792.0 194.0 5.0 * 54. Receptor 54 * 752.0 194.0 5.0 * 55. Receptor 55 * 712.0 194.0 5.0 * 56. Receptor 56 * 672.0 194.0 5.0 *� PAGE 4 JOB: I25ThorntonParkwayInterchangePMpackageB RUN: I25ThorntonParkwayInterchangePMpackageB
MODEL RESULTS -------------
REMARKS : In search of the angle corresponding to the maximum concentration, only the first angle, of the angles with same maximum concentrations, is indicated as maximum.
WIND ANGLE RANGE: 0.-360.
WIND * CONCENTRATION ANGLE * (PPM) (DEGR)* REC1 REC2 REC3 REC4 REC5 REC6 REC7 REC8 REC9 REC10 REC11 REC12 REC13 REC14 REC15 REC16 REC17 REC18
Page 2
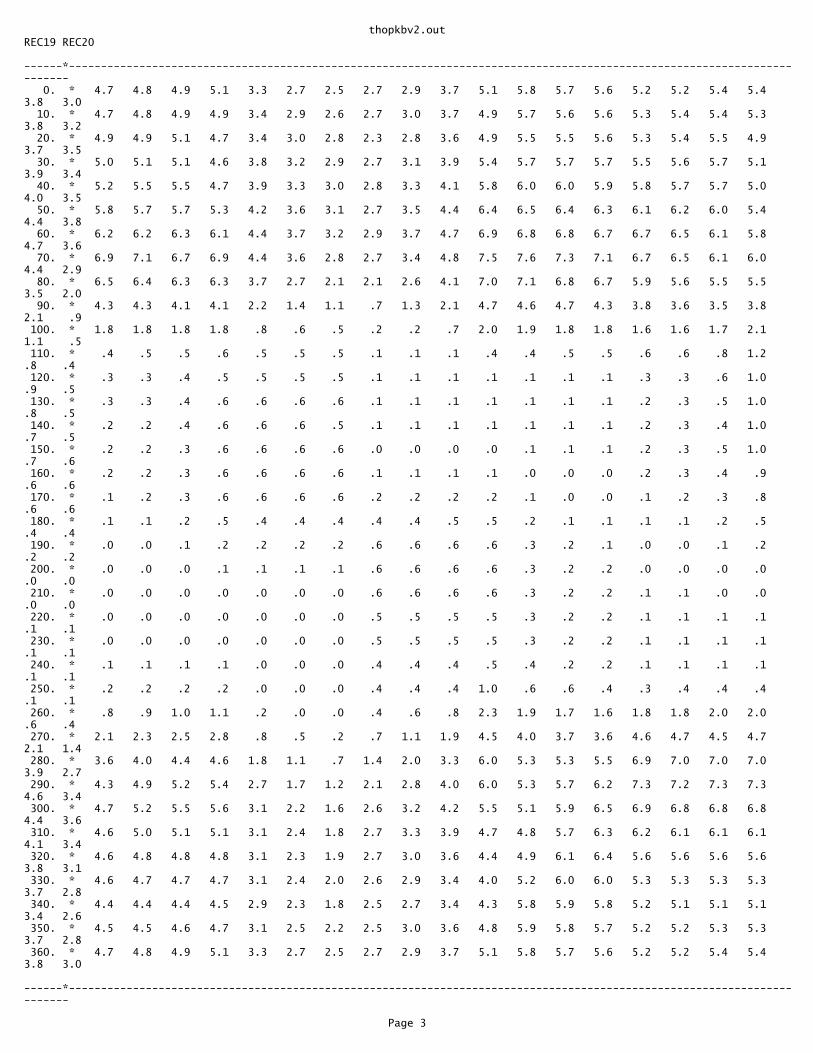
thopkbv2.outREC19 REC20 ------*------------------------------------------------------------------------------------------------------------------------ 0. * 4.7 4.8 4.9 5.1 3.3 2.7 2.5 2.7 2.9 3.7 5.1 5.8 5.7 5.6 5.2 5.2 5.4 5.4 3.8 3.0 10. * 4.7 4.8 4.9 4.9 3.4 2.9 2.6 2.7 3.0 3.7 4.9 5.7 5.6 5.6 5.3 5.4 5.4 5.3 3.8 3.2 20. * 4.9 4.9 5.1 4.7 3.4 3.0 2.8 2.3 2.8 3.6 4.9 5.5 5.5 5.6 5.3 5.4 5.5 4.9 3.7 3.5 30. * 5.0 5.1 5.1 4.6 3.8 3.2 2.9 2.7 3.1 3.9 5.4 5.7 5.7 5.7 5.5 5.6 5.7 5.1 3.9 3.4 40. * 5.2 5.5 5.5 4.7 3.9 3.3 3.0 2.8 3.3 4.1 5.8 6.0 6.0 5.9 5.8 5.7 5.7 5.0 4.0 3.5 50. * 5.8 5.7 5.7 5.3 4.2 3.6 3.1 2.7 3.5 4.4 6.4 6.5 6.4 6.3 6.1 6.2 6.0 5.4 4.4 3.8 60. * 6.2 6.2 6.3 6.1 4.4 3.7 3.2 2.9 3.7 4.7 6.9 6.8 6.8 6.7 6.7 6.5 6.1 5.8 4.7 3.6 70. * 6.9 7.1 6.7 6.9 4.4 3.6 2.8 2.7 3.4 4.8 7.5 7.6 7.3 7.1 6.7 6.5 6.1 6.0 4.4 2.9 80. * 6.5 6.4 6.3 6.3 3.7 2.7 2.1 2.1 2.6 4.1 7.0 7.1 6.8 6.7 5.9 5.6 5.5 5.5 3.5 2.0 90. * 4.3 4.3 4.1 4.1 2.2 1.4 1.1 .7 1.3 2.1 4.7 4.6 4.7 4.3 3.8 3.6 3.5 3.8 2.1 .9 100. * 1.8 1.8 1.8 1.8 .8 .6 .5 .2 .2 .7 2.0 1.9 1.8 1.8 1.6 1.6 1.7 2.1 1.1 .5 110. * .4 .5 .5 .6 .5 .5 .5 .1 .1 .1 .4 .4 .5 .5 .6 .6 .8 1.2 .8 .4 120. * .3 .3 .4 .5 .5 .5 .5 .1 .1 .1 .1 .1 .1 .1 .3 .3 .6 1.0 .9 .5 130. * .3 .3 .4 .6 .6 .6 .6 .1 .1 .1 .1 .1 .1 .1 .2 .3 .5 1.0 .8 .5 140. * .2 .2 .4 .6 .6 .6 .5 .1 .1 .1 .1 .1 .1 .1 .2 .3 .4 1.0 .7 .5 150. * .2 .2 .3 .6 .6 .6 .6 .0 .0 .0 .0 .1 .1 .1 .2 .3 .5 1.0 .7 .6 160. * .2 .2 .3 .6 .6 .6 .6 .1 .1 .1 .1 .0 .0 .0 .2 .3 .4 .9 .6 .6 170. * .1 .2 .3 .6 .6 .6 .6 .2 .2 .2 .2 .1 .0 .0 .1 .2 .3 .8 .6 .6 180. * .1 .1 .2 .5 .4 .4 .4 .4 .4 .5 .5 .2 .1 .1 .1 .1 .2 .5 .4 .4 190. * .0 .0 .1 .2 .2 .2 .2 .6 .6 .6 .6 .3 .2 .1 .0 .0 .1 .2 .2 .2 200. * .0 .0 .0 .1 .1 .1 .1 .6 .6 .6 .6 .3 .2 .2 .0 .0 .0 .0 .0 .0 210. * .0 .0 .0 .0 .0 .0 .0 .6 .6 .6 .6 .3 .2 .2 .1 .1 .0 .0 .0 .0 220. * .0 .0 .0 .0 .0 .0 .0 .5 .5 .5 .5 .3 .2 .2 .1 .1 .1 .1 .1 .1 230. * .0 .0 .0 .0 .0 .0 .0 .5 .5 .5 .5 .3 .2 .2 .1 .1 .1 .1 .1 .1 240. * .1 .1 .1 .1 .0 .0 .0 .4 .4 .4 .5 .4 .2 .2 .1 .1 .1 .1 .1 .1 250. * .2 .2 .2 .2 .0 .0 .0 .4 .4 .4 1.0 .6 .6 .4 .3 .4 .4 .4 .1 .1 260. * .8 .9 1.0 1.1 .2 .0 .0 .4 .6 .8 2.3 1.9 1.7 1.6 1.8 1.8 2.0 2.0 .6 .4 270. * 2.1 2.3 2.5 2.8 .8 .5 .2 .7 1.1 1.9 4.5 4.0 3.7 3.6 4.6 4.7 4.5 4.7 2.1 1.4 280. * 3.6 4.0 4.4 4.6 1.8 1.1 .7 1.4 2.0 3.3 6.0 5.3 5.3 5.5 6.9 7.0 7.0 7.0 3.9 2.7 290. * 4.3 4.9 5.2 5.4 2.7 1.7 1.2 2.1 2.8 4.0 6.0 5.3 5.7 6.2 7.3 7.2 7.3 7.3 4.6 3.4 300. * 4.7 5.2 5.5 5.6 3.1 2.2 1.6 2.6 3.2 4.2 5.5 5.1 5.9 6.5 6.9 6.8 6.8 6.8 4.4 3.6 310. * 4.6 5.0 5.1 5.1 3.1 2.4 1.8 2.7 3.3 3.9 4.7 4.8 5.7 6.3 6.2 6.1 6.1 6.1 4.1 3.4 320. * 4.6 4.8 4.8 4.8 3.1 2.3 1.9 2.7 3.0 3.6 4.4 4.9 6.1 6.4 5.6 5.6 5.6 5.6 3.8 3.1 330. * 4.6 4.7 4.7 4.7 3.1 2.4 2.0 2.6 2.9 3.4 4.0 5.2 6.0 6.0 5.3 5.3 5.3 5.3 3.7 2.8 340. * 4.4 4.4 4.4 4.5 2.9 2.3 1.8 2.5 2.7 3.4 4.3 5.8 5.9 5.8 5.2 5.1 5.1 5.1 3.4 2.6 350. * 4.5 4.5 4.6 4.7 3.1 2.5 2.2 2.5 3.0 3.6 4.8 5.9 5.8 5.7 5.2 5.2 5.3 5.3 3.7 2.8 360. * 4.7 4.8 4.9 5.1 3.3 2.7 2.5 2.7 2.9 3.7 5.1 5.8 5.7 5.6 5.2 5.2 5.4 5.4 3.8 3.0 ------*------------------------------------------------------------------------------------------------------------------------
Page 3
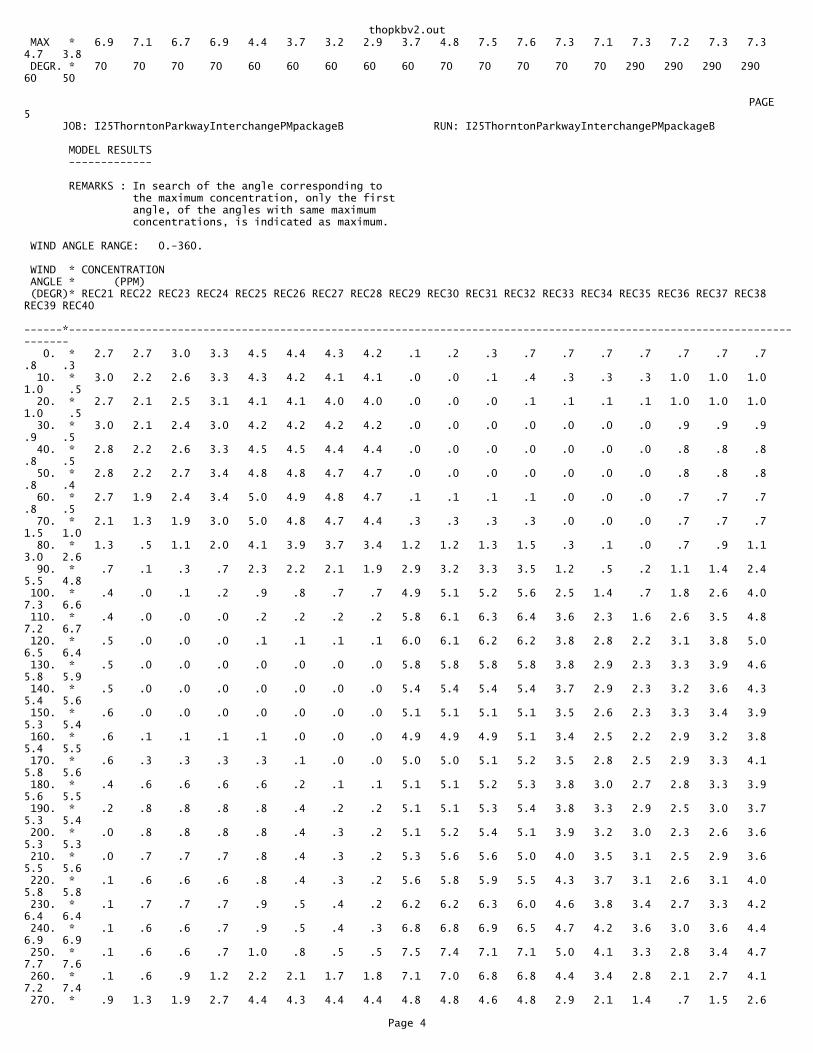
thopkbv2.out MAX * 6.9 7.1 6.7 6.9 4.4 3.7 3.2 2.9 3.7 4.8 7.5 7.6 7.3 7.1 7.3 7.2 7.3 7.3 4.7 3.8 DEGR. * 70 70 70 70 60 60 60 60 60 70 70 70 70 70 290 290 290 290 60 50
� PAGE 5 JOB: I25ThorntonParkwayInterchangePMpackageB RUN: I25ThorntonParkwayInterchangePMpackageB
MODEL RESULTS -------------
REMARKS : In search of the angle corresponding to the maximum concentration, only the first angle, of the angles with same maximum concentrations, is indicated as maximum.
WIND ANGLE RANGE: 0.-360.
WIND * CONCENTRATION ANGLE * (PPM) (DEGR)* REC21 REC22 REC23 REC24 REC25 REC26 REC27 REC28 REC29 REC30 REC31 REC32 REC33 REC34 REC35 REC36 REC37 REC38 REC39 REC40 ------*------------------------------------------------------------------------------------------------------------------------ 0. * 2.7 2.7 3.0 3.3 4.5 4.4 4.3 4.2 .1 .2 .3 .7 .7 .7 .7 .7 .7 .7 .8 .3 10. * 3.0 2.2 2.6 3.3 4.3 4.2 4.1 4.1 .0 .0 .1 .4 .3 .3 .3 1.0 1.0 1.0 1.0 .5 20. * 2.7 2.1 2.5 3.1 4.1 4.1 4.0 4.0 .0 .0 .0 .1 .1 .1 .1 1.0 1.0 1.0 1.0 .5 30. * 3.0 2.1 2.4 3.0 4.2 4.2 4.2 4.2 .0 .0 .0 .0 .0 .0 .0 .9 .9 .9 .9 .5 40. * 2.8 2.2 2.6 3.3 4.5 4.5 4.4 4.4 .0 .0 .0 .0 .0 .0 .0 .8 .8 .8 .8 .5 50. * 2.8 2.2 2.7 3.4 4.8 4.8 4.7 4.7 .0 .0 .0 .0 .0 .0 .0 .8 .8 .8 .8 .4 60. * 2.7 1.9 2.4 3.4 5.0 4.9 4.8 4.7 .1 .1 .1 .1 .0 .0 .0 .7 .7 .7 .8 .5 70. * 2.1 1.3 1.9 3.0 5.0 4.8 4.7 4.4 .3 .3 .3 .3 .0 .0 .0 .7 .7 .7 1.5 1.0 80. * 1.3 .5 1.1 2.0 4.1 3.9 3.7 3.4 1.2 1.2 1.3 1.5 .3 .1 .0 .7 .9 1.1 3.0 2.6 90. * .7 .1 .3 .7 2.3 2.2 2.1 1.9 2.9 3.2 3.3 3.5 1.2 .5 .2 1.1 1.4 2.4 5.5 4.8 100. * .4 .0 .1 .2 .9 .8 .7 .7 4.9 5.1 5.2 5.6 2.5 1.4 .7 1.8 2.6 4.0 7.3 6.6 110. * .4 .0 .0 .0 .2 .2 .2 .2 5.8 6.1 6.3 6.4 3.6 2.3 1.6 2.6 3.5 4.8 7.2 6.7 120. * .5 .0 .0 .0 .1 .1 .1 .1 6.0 6.1 6.2 6.2 3.8 2.8 2.2 3.1 3.8 5.0 6.5 6.4 130. * .5 .0 .0 .0 .0 .0 .0 .0 5.8 5.8 5.8 5.8 3.8 2.9 2.3 3.3 3.9 4.6 5.8 5.9 140. * .5 .0 .0 .0 .0 .0 .0 .0 5.4 5.4 5.4 5.4 3.7 2.9 2.3 3.2 3.6 4.3 5.4 5.6 150. * .6 .0 .0 .0 .0 .0 .0 .0 5.1 5.1 5.1 5.1 3.5 2.6 2.3 3.3 3.4 3.9 5.3 5.4 160. * .6 .1 .1 .1 .1 .0 .0 .0 4.9 4.9 4.9 5.1 3.4 2.5 2.2 2.9 3.2 3.8 5.4 5.5 170. * .6 .3 .3 .3 .3 .1 .0 .0 5.0 5.0 5.1 5.2 3.5 2.8 2.5 2.9 3.3 4.1 5.8 5.6 180. * .4 .6 .6 .6 .6 .2 .1 .1 5.1 5.1 5.2 5.3 3.8 3.0 2.7 2.8 3.3 3.9 5.6 5.5 190. * .2 .8 .8 .8 .8 .4 .2 .2 5.1 5.1 5.3 5.4 3.8 3.3 2.9 2.5 3.0 3.7 5.3 5.4 200. * .0 .8 .8 .8 .8 .4 .3 .2 5.1 5.2 5.4 5.1 3.9 3.2 3.0 2.3 2.6 3.6 5.3 5.3 210. * .0 .7 .7 .7 .8 .4 .3 .2 5.3 5.6 5.6 5.0 4.0 3.5 3.1 2.5 2.9 3.6 5.5 5.6 220. * .1 .6 .6 .6 .8 .4 .3 .2 5.6 5.8 5.9 5.5 4.3 3.7 3.1 2.6 3.1 4.0 5.8 5.8 230. * .1 .7 .7 .7 .9 .5 .4 .2 6.2 6.2 6.3 6.0 4.6 3.8 3.4 2.7 3.3 4.2 6.4 6.4 240. * .1 .6 .6 .7 .9 .5 .4 .3 6.8 6.8 6.9 6.5 4.7 4.2 3.6 3.0 3.6 4.4 6.9 6.9 250. * .1 .6 .6 .7 1.0 .8 .5 .5 7.5 7.4 7.1 7.1 5.0 4.1 3.3 2.8 3.4 4.7 7.7 7.6 260. * .1 .6 .9 1.2 2.2 2.1 1.7 1.8 7.1 7.0 6.8 6.8 4.4 3.4 2.8 2.1 2.7 4.1 7.2 7.4 270. * .9 1.3 1.9 2.7 4.4 4.3 4.4 4.4 4.8 4.8 4.6 4.8 2.9 2.1 1.4 .7 1.5 2.6
Page 4
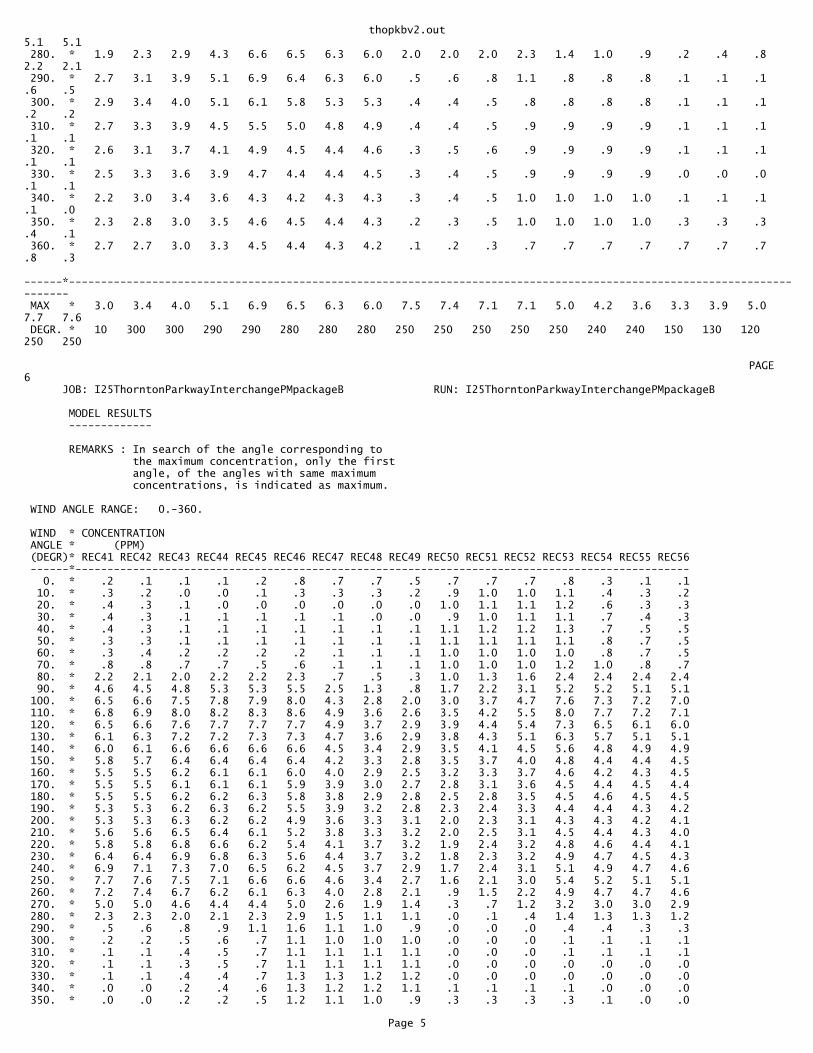
thopkbv2.out5.1 5.1 280. * 1.9 2.3 2.9 4.3 6.6 6.5 6.3 6.0 2.0 2.0 2.0 2.3 1.4 1.0 .9 .2 .4 .8 2.2 2.1 290. * 2.7 3.1 3.9 5.1 6.9 6.4 6.3 6.0 .5 .6 .8 1.1 .8 .8 .8 .1 .1 .1 .6 .5 300. * 2.9 3.4 4.0 5.1 6.1 5.8 5.3 5.3 .4 .4 .5 .8 .8 .8 .8 .1 .1 .1 .2 .2 310. * 2.7 3.3 3.9 4.5 5.5 5.0 4.8 4.9 .4 .4 .5 .9 .9 .9 .9 .1 .1 .1 .1 .1 320. * 2.6 3.1 3.7 4.1 4.9 4.5 4.4 4.6 .3 .5 .6 .9 .9 .9 .9 .1 .1 .1 .1 .1 330. * 2.5 3.3 3.6 3.9 4.7 4.4 4.4 4.5 .3 .4 .5 .9 .9 .9 .9 .0 .0 .0 .1 .1 340. * 2.2 3.0 3.4 3.6 4.3 4.2 4.3 4.3 .3 .4 .5 1.0 1.0 1.0 1.0 .1 .1 .1 .1 .0 350. * 2.3 2.8 3.0 3.5 4.6 4.5 4.4 4.3 .2 .3 .5 1.0 1.0 1.0 1.0 .3 .3 .3 .4 .1 360. * 2.7 2.7 3.0 3.3 4.5 4.4 4.3 4.2 .1 .2 .3 .7 .7 .7 .7 .7 .7 .7 .8 .3 ------*------------------------------------------------------------------------------------------------------------------------ MAX * 3.0 3.4 4.0 5.1 6.9 6.5 6.3 6.0 7.5 7.4 7.1 7.1 5.0 4.2 3.6 3.3 3.9 5.0 7.7 7.6 DEGR. * 10 300 300 290 290 280 280 280 250 250 250 250 250 240 240 150 130 120 250 250
� PAGE 6 JOB: I25ThorntonParkwayInterchangePMpackageB RUN: I25ThorntonParkwayInterchangePMpackageB
MODEL RESULTS -------------
REMARKS : In search of the angle corresponding to the maximum concentration, only the first angle, of the angles with same maximum concentrations, is indicated as maximum.
WIND ANGLE RANGE: 0.-360.
WIND * CONCENTRATION ANGLE * (PPM) (DEGR)* REC41 REC42 REC43 REC44 REC45 REC46 REC47 REC48 REC49 REC50 REC51 REC52 REC53 REC54 REC55 REC56 ------*------------------------------------------------------------------------------------------------ 0. * .2 .1 .1 .1 .2 .8 .7 .7 .5 .7 .7 .7 .8 .3 .1 .1 10. * .3 .2 .0 .0 .1 .3 .3 .3 .2 .9 1.0 1.0 1.1 .4 .3 .2 20. * .4 .3 .1 .0 .0 .0 .0 .0 .0 1.0 1.1 1.1 1.2 .6 .3 .3 30. * .4 .3 .1 .1 .1 .1 .1 .0 .0 .9 1.0 1.1 1.1 .7 .4 .3 40. * .4 .3 .1 .1 .1 .1 .1 .1 .1 1.1 1.2 1.2 1.3 .7 .5 .5 50. * .3 .3 .1 .1 .1 .1 .1 .1 .1 1.1 1.1 1.1 1.1 .8 .7 .5 60. * .3 .4 .2 .2 .2 .2 .1 .1 .1 1.0 1.0 1.0 1.0 .8 .7 .5 70. * .8 .8 .7 .7 .5 .6 .1 .1 .1 1.0 1.0 1.0 1.2 1.0 .8 .7 80. * 2.2 2.1 2.0 2.2 2.2 2.3 .7 .5 .3 1.0 1.3 1.6 2.4 2.4 2.4 2.4 90. * 4.6 4.5 4.8 5.3 5.3 5.5 2.5 1.3 .8 1.7 2.2 3.1 5.2 5.2 5.1 5.1 100. * 6.5 6.6 7.5 7.8 7.9 8.0 4.3 2.8 2.0 3.0 3.7 4.7 7.6 7.3 7.2 7.0 110. * 6.8 6.9 8.0 8.2 8.3 8.6 4.9 3.6 2.6 3.5 4.2 5.5 8.0 7.7 7.2 7.1 120. * 6.5 6.6 7.6 7.7 7.7 7.7 4.9 3.7 2.9 3.9 4.4 5.4 7.3 6.5 6.1 6.0 130. * 6.1 6.3 7.2 7.2 7.3 7.3 4.7 3.6 2.9 3.8 4.3 5.1 6.3 5.7 5.1 5.1 140. * 6.0 6.1 6.6 6.6 6.6 6.6 4.5 3.4 2.9 3.5 4.1 4.5 5.6 4.8 4.9 4.9 150. * 5.8 5.7 6.4 6.4 6.4 6.4 4.2 3.3 2.8 3.5 3.7 4.0 4.8 4.4 4.4 4.5 160. * 5.5 5.5 6.2 6.1 6.1 6.0 4.0 2.9 2.5 3.2 3.3 3.7 4.6 4.2 4.3 4.5 170. * 5.5 5.5 6.1 6.1 6.1 5.9 3.9 3.0 2.7 2.8 3.1 3.6 4.5 4.4 4.5 4.4 180. * 5.5 5.5 6.2 6.2 6.3 5.8 3.8 2.9 2.8 2.5 2.8 3.5 4.5 4.6 4.5 4.5 190. * 5.3 5.3 6.2 6.3 6.2 5.5 3.9 3.2 2.8 2.3 2.4 3.3 4.4 4.4 4.3 4.2 200. * 5.3 5.3 6.3 6.2 6.2 4.9 3.6 3.3 3.1 2.0 2.3 3.1 4.3 4.3 4.2 4.1 210. * 5.6 5.6 6.5 6.4 6.1 5.2 3.8 3.3 3.2 2.0 2.5 3.1 4.5 4.4 4.3 4.0 220. * 5.8 5.8 6.8 6.6 6.2 5.4 4.1 3.7 3.2 1.9 2.4 3.2 4.8 4.6 4.4 4.1 230. * 6.4 6.4 6.9 6.8 6.3 5.6 4.4 3.7 3.2 1.8 2.3 3.2 4.9 4.7 4.5 4.3 240. * 6.9 7.1 7.3 7.0 6.5 6.2 4.5 3.7 2.9 1.7 2.4 3.1 5.1 4.9 4.7 4.6 250. * 7.7 7.6 7.5 7.1 6.6 6.6 4.6 3.4 2.7 1.6 2.1 3.0 5.4 5.2 5.1 5.1 260. * 7.2 7.4 6.7 6.2 6.1 6.3 4.0 2.8 2.1 .9 1.5 2.2 4.9 4.7 4.7 4.6 270. * 5.0 5.0 4.6 4.4 4.4 5.0 2.6 1.9 1.4 .3 .7 1.2 3.2 3.0 3.0 2.9 280. * 2.3 2.3 2.0 2.1 2.3 2.9 1.5 1.1 1.1 .0 .1 .4 1.4 1.3 1.3 1.2 290. * .5 .6 .8 .9 1.1 1.6 1.1 1.0 .9 .0 .0 .0 .4 .4 .3 .3 300. * .2 .2 .5 .6 .7 1.1 1.0 1.0 1.0 .0 .0 .0 .1 .1 .1 .1 310. * .1 .1 .4 .5 .7 1.1 1.1 1.1 1.1 .0 .0 .0 .1 .1 .1 .1 320. * .1 .1 .3 .5 .7 1.1 1.1 1.1 1.1 .0 .0 .0 .0 .0 .0 .0 330. * .1 .1 .4 .4 .7 1.3 1.3 1.2 1.2 .0 .0 .0 .0 .0 .0 .0 340. * .0 .0 .2 .4 .6 1.3 1.2 1.2 1.1 .1 .1 .1 .1 .0 .0 .0 350. * .0 .0 .2 .2 .5 1.2 1.1 1.0 .9 .3 .3 .3 .3 .1 .0 .0
Page 5
thopkbv2.out 360. * .2 .1 .1 .1 .2 .8 .7 .7 .5 .7 .7 .7 .8 .3 .1 .1 ------*------------------------------------------------------------------------------------------------ MAX * 7.7 7.6 8.0 8.2 8.3 8.6 4.9 3.7 3.2 3.9 4.4 5.5 8.0 7.7 7.2 7.1 DEGR. * 250 250 110 110 110 110 110 230 230 120 120 110 110 110 100 110
THE HIGHEST CONCENTRATION OF 8.60 PPM OCCURRED AT RECEPTOR REC46.� PAGE 7 JOB: I25ThorntonParkwayInterchangePMpackageB RUN: I25ThorntonParkwayInterchangePMpackageB
DATE : 11/22/10 TIME : 13: 4:16
RECEPTOR - LINK MATRIX FOR THE ANGLE PRODUCING THE MAXIMUM CONCENTRATION FOR EACH RECEPTOR
* CO/LINK (PPM) * ANGLE (DEGREES) * REC1 REC2 REC3 REC4 REC5 REC6 REC7 REC8 REC9 REC10 REC11 REC12 REC13 REC14 REC15 REC16 REC17 REC18REC19 REC20 LINK # * 70 70 70 70 60 60 60 60 60 70 70 70 70 70 290 290 290 290 60 50 -------*------------------------------------------------------------------------------------------------------------------------ 1 * 1.4 1.2 .9 .5 .0 .0 .0 .0 .0 .0 .0 .0 .0 .0 .1 .1 .1 .1 .0 .0 2 * 1.3 1.0 .4 .0 .0 .0 .0 .0 .0 .0 .0 .0 .0 .0 .1 .0 .0 .0 .0 .0 3 * .5 .7 1.0 1.5 .9 .7 .5 .6 .8 1.1 2.2 2.2 2.1 2.1 2.1 2.1 2.2 2.2 .0 .0 4 * .2 .3 .4 .6 .4 .3 .3 .3 .4 .5 1.0 1.0 1.0 1.0 1.0 1.0 1.0 1.0 .0 .0 5 * .5 .5 .5 .5 .3 .3 .2 .2 .3 .4 .6 .6 .6 .5 .6 .6 .6 .6 .0 .0 6 * .1 .1 .1 .1 .0 .0 .1 .1 .0 .1 .1 .1 .1 .1 .0 .0 .0 .0 1.2 .9 7 * .1 .1 .1 .1 .1 .1 .1 .1 .1 .2 .1 .2 .2 .2 .0 .0 .0 .0 .8 .6 8 * .1 .1 .1 .1 .1 .1 .1 .1 .1 .2 .1 .2 .2 .2 .0 .0 .0 .0 .9 .7 9 * 1.2 1.4 1.5 1.5 1.1 .9 .7 .8 1.0 1.1 1.6 1.6 1.5 1.5 1.5 1.5 1.6 1.6 .0 .0 10 * .2 .3 .3 .3 .2 .1 .1 .0 .1 .1 .3 .2 .1 .0 .2 .2 .1 .1 .0 .0 11 * .7 .9 1.1 1.2 .8 .7 .6 .6 .8 1.0 1.4 1.4 1.4 1.4 1.2 1.3 1.3 1.3 .9 .7 12 * .3 .1 .0 .0 .0 .0 .0 .0 .0 .0 .0 .0 .0 .0 .4 .3 .3 .3 .0 .0 13 * .1 .1 .0 .0 .0 .0 .0 .0 .0 .0 .0 .0 .0 .0 .1 .1 .1 .1 .0 .0 14 * .0 .0 .0 .0 .0 .0 .0 .0 .0 .0 .0 .0 .0 .0 .0 .0 .0 .0 .0 .0 15 * .1 .2 .2 .4 .4 .4 .4 .0 .0 .0 .0 .0 .0 .0 .0 .0 .0 .0 .0 .0 16 * .0 .0 .0 .0 .0 .0 .0 .0 .0 .0 .0 .0 .0 .0 .0 .0 .0 .0 .5 .5 17 * .0 .0 .0 .0 .0 .0 .0 .0 .0 .0 .0 .0 .0 .0 .0 .0 .0 .0 .4 .4 18 * .1 .1 .1 .1 .1 .1 .1 .1 .1 .1 .1 .1 .1 .1 .0 .0 .0 .0 .0 .0� PAGE 8 JOB: I25ThorntonParkwayInterchangePMpackageB RUN: I25ThorntonParkwayInterchangePMpackageB
DATE : 11/22/10 TIME : 13: 4:16
RECEPTOR - LINK MATRIX FOR THE ANGLE PRODUCING THE MAXIMUM CONCENTRATION FOR EACH RECEPTOR
* CO/LINK (PPM) * ANGLE (DEGREES) * REC21 REC22 REC23 REC24 REC25 REC26 REC27 REC28 REC29 REC30 REC31 REC32 REC33 REC34 REC35 REC36 REC37 REC38REC39 REC40 LINK # * 10 300 300 290 290 280 280 280 250 250 250 250 250 240 240 150 130 120 250 250 -------*----------------------------------------------------------------------------------------------------------------
Page 6

thopkbv2.out-------- 1 * .0 .0 .0 .1 .1 .2 .2 .1 .1 .1 .1 .1 .1 .1 .1 .0 .0 .0 .1 .1 2 * .0 .0 .0 .0 .0 .1 .1 .1 .0 .0 .1 .1 .1 .0 .1 .0 .0 .0 .1 .1 3 * .3 .6 .7 1.0 1.5 1.2 1.0 .8 .7 .8 .8 .8 .6 .5 .4 .0 .0 .0 .9 .9 4 * .1 .3 .4 .5 .6 .6 .4 .4 .3 .4 .4 .4 .3 .3 .2 .0 .0 .0 .5 .4 5 * .1 .3 .3 .4 .5 .5 .5 .4 .3 .4 .4 .5 .4 .3 .2 .0 .0 .0 .5 .5 6 * .3 .0 .0 .0 .5 .8 1.1 1.3 .2 .1 .0 .0 .0 .0 .0 .5 .6 .8 .0 .0 7 * .2 .0 .0 .0 .0 .0 .0 .1 1.7 1.5 1.1 .5 .0 .0 .0 .6 .9 1.3 .0 .0 8 * .2 .0 .0 .0 .0 .0 .0 .0 1.5 1.1 .5 .0 .0 .0 .0 .5 .9 1.3 .0 .0 9 * .4 .8 .9 1.0 1.5 1.1 1.1 1.1 1.0 1.3 1.9 2.6 1.7 1.3 1.0 .1 .0 .0 3.9 3.8 10 * .0 .1 .1 .1 .1 .1 .1 .1 .0 .0 .0 .1 .1 .1 .1 .0 .0 .0 .1 .1 11 * .5 .5 .7 .8 1.2 1.0 1.0 1.0 1.3 1.3 1.3 1.2 .8 .7 .6 .6 .7 .9 1.4 1.4 12 * .0 .2 .1 .3 .2 .4 .4 .4 .1 .1 .1 .1 .2 .1 .1 .0 .0 .0 .1 .2 13 * .0 .1 .1 .1 .1 .1 .1 .0 .0 .0 .0 .0 .0 .0 .0 .0 .0 .0 .0 .0 14 * .0 .0 .0 .0 .0 .0 .0 .0 .0 .0 .0 .0 .0 .0 .0 .0 .0 .0 .0 .0 15 * .0 .0 .0 .0 .0 .0 .0 .0 .0 .0 .0 .0 .0 .1 .1 .0 .0 .0 .1 .1 16 * .3 .5 .5 .5 .5 .3 .2 .2 .1 .0 .0 .0 .0 .0 .0 .1 .0 .0 .0 .0 17 * .2 .0 .2 .3 .1 .1 .1 .0 .0 .0 .0 .0 .0 .0 .0 .0 .0 .0 .0 .0 18 * .4 .0 .0 .0 .0 .0 .0 .0 .2 .3 .4 .7 .7 .7 .7 .9 .8 .7 .0 .0� PAGE 9 JOB: I25ThorntonParkwayInterchangePMpackageB RUN: I25ThorntonParkwayInterchangePMpackageB
DATE : 11/22/10 TIME : 13: 4:16
RECEPTOR - LINK MATRIX FOR THE ANGLE PRODUCING THE MAXIMUM CONCENTRATION FOR EACH RECEPTOR
* CO/LINK (PPM) * ANGLE (DEGREES) * REC41 REC42 REC43 REC44 REC45 REC46 REC47 REC48 REC49 REC50 REC51 REC52 REC53 REC54 REC55 REC56 LINK # * 250 250 110 110 110 110 110 230 230 120 120 110 110 110 100 110 -------*------------------------------------------------------------------------------------------------ 1 * .2 .2 .0 .0 .0 .0 .0 .5 .4 .0 .0 .0 .0 .0 .0 .2 2 * .1 .1 .0 .0 .0 .0 .0 .4 .3 .0 .0 .0 .0 .0 .0 .1 3 * .9 .8 .8 .9 .9 .9 .6 .0 .0 .4 .5 .6 .8 .8 .6 .7 4 * .4 .4 .4 .4 .4 .5 .3 .0 .0 .2 .3 .3 .4 .4 .3 .3 5 * .5 .5 .4 .4 .4 .4 .3 .3 .2 .2 .2 .3 .4 .4 .3 .4 6 * .0 .0 .2 .2 .2 .2 .2 .0 .0 .1 .1 .2 .1 .1 .2 .1 7 * .0 .0 .1 .1 .1 .1 .1 .0 .0 .1 .0 .1 .1 .1 .2 .1 8 * .0 .0 .1 .1 .1 .1 .1 .0 .0 .1 .0 .1 .1 .1 .2 .1 9 * 3.8 3.8 3.8 3.8 3.8 3.9 1.9 .0 .0 1.0 1.3 1.7 2.6 1.9 1.8 1.0 10 * .1 .2 .6 .7 .8 .9 .3 .0 .0 .2 .3 .3 .5 .4 .3 .2 11 * 1.4 1.3 1.5 1.5 1.5 1.5 1.0 .0 .0 .6 .7 .9 1.3 1.1 1.0 .7 12 * .2 .2 .0 .0 .0 .0 .0 1.5 1.2 .0 .0 .0 .9 1.9 1.9 2.9 13 * .0 .0 .0 .0 .0 .0 .0 .5 .6 .6 .6 .6 .6 .4 .3 .1 14 * .0 .0 .0 .0 .0 .0 .0 .5 .5 .3 .3 .3 .1 .0 .1 .0 15 * .1 .1 .0 .0 .0 .0 .0 .0 .0 .0 .0 .0 .0 .0 .0 .1 16 * .0 .0 .1 .1 .1 .1 .1 .0 .0 .1 .1 .1 .1 .1 .0 .1 17 * .0 .0 .0 .0 .0 .0 .0 .0 .0 .0 .0 .0 .0 .0 .0 .0 18 * .0 .0 .0 .0 .0 .0 .0 .0 .0 .0 .0 .0 .0 .0 .0 .0
Page 7

thorpapm.in'I25ThorntonParkwayInterchangePMPA', 60 , 175 , 0 , 0 , 56 , 0.3048 , 1 , 1 'Receptor 1', 672 , 52 , 5 'Receptor 2', 712 , 52 , 5 'Receptor 3', 752 , 52 , 5 'Receptor 4', 792 , 52 , 5 'Receptor 5', 792 , 2 , 5 'Receptor 6', 792 ,-38 , 5 'Receptor 7', 792 ,-78 , 5 'Receptor 8', 856 ,-56 , 5 'Receptor 9', 856 ,-16 , 5 'Receptor 10', 856 , 24 , 5 'Receptor 11', 856 , 64 , 5 'Receptor 12', 896 , 64 , 5 'Receptor 13', 936 , 64 , 5 'Receptor 14', 976 , 64 , 5 'Receptor 15', 1256 , 64 , 5 'Receptor 16', 1296 , 64 , 5 'Receptor 17', 1336 , 64 , 5 'Receptor 18', 1376 , 64 , 5 'Receptor 19', 1376 , 24 , 5 'Receptor 20', 1376 ,-16 , 5 'Receptor 21', 1376 ,-56 , 5 'Receptor 22', 1452 ,-68 , 5 'Receptor 23', 1452 ,-28 , 5 'Receptor 24', 1452 , 12 , 5 'Receptor 25', 1452 , 52 , 5 'Receptor 26', 1492 , 52 , 5 'Receptor 27', 1532 , 52 , 5 'Receptor 28', 1572 , 52 , 5 'Receptor 29', 1572 , 194 , 5 'Receptor 30', 1532 , 194 , 5 'Receptor 31', 1492 , 194 , 5 'Receptor 32', 1452 , 194 , 5 'Receptor 33', 1452 , 234 , 5 'Receptor 34', 1452 , 274 , 5 'Receptor 35', 1452 , 314 , 5 'Receptor 36', 1388 , 302 , 5 'Receptor 37', 1388 , 262 , 5 'Receptor 38', 1388 , 222 , 5 'Receptor 39', 1388 , 182 , 5 'Receptor 40', 1348 , 182 , 5 'Receptor 41', 1308 , 182 , 5 'Receptor 42', 1264 , 182 , 5 'Receptor 43', 988 , 182 , 5 'Receptor 44', 948 , 182 , 5 'Receptor 45', 908 , 182 , 5 'Receptor 46', 868 , 182 , 5 'Receptor 47', 868 , 222 , 5 'Receptor 48', 868 , 262 , 5 'Receptor 49', 868 , 302 , 5 'Receptor 50', 792 , 314 , 5 'Receptor 51', 792 , 274 , 5 'Receptor 52', 792 , 234 , 5 'Receptor 53', 792 , 194 , 5 'Receptor 54', 752 , 194 , 5 'Receptor 55', 712 , 194 , 5 'Receptor 56', 672 , 194 , 5 'I25ThorntonParkwayInterchangePMPA', 18 , 1 , 1 ,'CO' 1 'thornebapp','AG', 122 , 90 , 833 , 90 , 1985 , 22.5 , 0 , 56 2 'thornebapp que','AG', 802 , 90 , 122 , 90 , 0 , 36 , 3 100 , 53 , 2 , 1690 , 143.34 , 1600 , 1 , 3 1 'thornebdep/app','AG', 833 , 96 , 1411 , 96 , 2100 , 22.5 , 0 , 44 2 'thornebdep/app que','AG', 1386 , 96 , 858 , 96 , 0 , 24 , 2 100 , 41 , 2 , 1580 , 143.34 , 1600 , 1 , 3 2 'thornebleftturn','AG', 1386 , 114 , 1186 , 114 , 0 , 12 , 1 100 , 78 , 2 , 520 , 143.34 , 1600 , 1 , 3 1 'thornebdep','AG', 1411 , 90 , 2122 , 90 , 2130 , 22.5 , 0 , 56 1 'thornwbapp','AG', 2122 , 156 , 1411 , 156 , 1870 , 22.5 , 0 , 56 2 'thornwbapp que','AG', 1442 , 156 , 2122 , 156 , 0 , 36 , 3 100 , 65 , 2 , 1415 , 143.34 , 1600 , 1 , 3 1 'thornwbdep/app','AG', 1411 , 150 , 833 , 150 , 1695 , 45.4 , 0 , 44 2
Page 1
thorpapm.in'thornwbdep/app que','AG', 858 , 150 , 1386 , 150 , 0 , 24 , 2 100 , 41 , 2 , 1340 , 143.34 , 1600 , 1 , 3 2 'thornwbleftturn','AG', 858 , 126 , 1058 , 126 , 0 , 24 , 2 100 , 90 , 2 , 355 , 143.34 , 1600 , 1 , 3 1 'thornwbdep','AG', 833 , 156 , 122 , 156 , 1840 , 45.4 , 0 , 56 1 'I25sbrampapp','AG', 824 , 1124 , 824 , 124 , 910 , 22.8 , 0 , 44 2 'I25sbrampleftturn','AG', 842 , 184 , 842 , 384 , 0 , 12 , 1 100 , 59 , 2 , 410 , 143.34 , 1600 , 1 , 3 1 'I25sbrampdep','AG', 824 , 124 , 824 ,-876 , 650 , 22.8 , 0 , 44 1 'I25nbrampapp','AG', 1420 ,-876 , 1420 , 124 , 830 , 23.1 , 0 , 44 2 'I25nbrampleftturn','AG', 1402 , 62 , 1402 ,-138 , 0 , 12 , 1 100 , 59 , 2 , 280 , 143.34 , 1600 , 1 , 3 1 'I25nbrampdep','AG', 1420 , 124 , 1420 , 1124 , 975 , 23.1 , 0 , 44 1 , 0 , 4 , 1000 , 0 ,'Y', 10 , 0 , 36
Page 2

thorpav2.out� CAL3QHC: LINE SOURCE DISPERSION MODEL - VERSION 2.0 Dated 95221 PAGE 1
JOB: I25ThorntonParkwayInterchangePMPA RUN: I25ThorntonParkwayInterchangePMPA
DATE : 11/22/10 TIME : 13: 4:59
The MODE flag has been set to C for calculating CO averages.
SITE & METEOROLOGICAL VARIABLES ------------------------------- VS = .0 CM/S VD = .0 CM/S Z0 = 175. CM U = 1.0 M/S CLAS = 4 (D) ATIM = 60. MINUTES MIXH = 1000. M AMB = .0 PPM
LINK VARIABLES -------------- LINK DESCRIPTION * LINK COORDINATES (FT) * LENGTH BRG TYPE VPH EF H W V/C QUEUE * X1 Y1 X2 Y2 * (FT) (DEG) (G/MI) (FT) (FT) (VEH) ------------------------*----------------------------------------*---------------------------------------------------------- 1. thornebapp * 122.0 90.0 833.0 90.0 * 711. 90. AG 1985. 22.5 .0 56.0 2. thornebapp que * 802.0 90.0 629.5 90.0 * 173. 270. AG 611. 100.0 .0 36.0 .82 8.8 3. thornebdep/app * 833.0 96.0 1411.0 96.0 * 578. 90. AG 2100. 22.5 .0 44.0 4. thornebdep/app que * 1386.0 96.0 1173.1 96.0 * 213. 270. AG 315. 100.0 .0 24.0 .90 10.8 5. thornebleftturn * 1386.0 114.0 -1268.6 114.0 * 2655. 270. AG 300. 100.0 .0 12.0 1.81 134.9 6. thornebdep * 1411.0 90.0 2122.0 90.0 * 711. 90. AG 2130. 22.5 .0 56.0 7. thornwbapp * 2122.0 156.0 1411.0 156.0 * 711. 270. AG 1870. 22.5 .0 56.0 8. thornwbapp que * 1442.0 156.0 1675.0 156.0 * 233. 90. AG 750. 100.0 .0 36.0 .95 11.8 9. thornwbdep/app * 1411.0 150.0 833.0 150.0 * 578. 270. AG 1695. 45.4 .0 44.0 10. thornwbdep/app que * 858.0 150.0 1008.2 150.0 * 150. 90. AG 315. 100.0 .0 24.0 .76 7.6 11. thornwbleftturn * 858.0 126.0 1830.7 126.0 * 973. 90. AG 692. 100.0 .0 24.0 1.84 49.4 12. thornwbdep * 833.0 156.0 122.0 156.0 * 711. 270. AG 1840. 45.4 .0 56.0 13. I25sbrampapp * 824.0 1124.0 824.0 124.0 * 1000. 180. AG 910. 22.8 .0 44.0 14. I25sbrampleftturn * 842.0 184.0 842.0 316.3 * 132. 360. AG 227. 100.0 .0 12.0 .69 6.7 15. I25sbrampdep * 824.0 124.0 824.0 -876.0 * 1000. 180. AG 650. 22.8 .0 44.0 16. I25nbrampapp * 1420.0 -876.0 1420.0 124.0 * 1000. 360. AG 830. 23.1 .0 44.0 17. I25nbrampleftturn * 1402.0 62.0 1402.0 -28.3 * 90. 180. AG 227. 100.0 .0 12.0 .47 4.6 18. I25nbrampdep * 1420.0 124.0 1420.0 1124.0 * 1000. 360. AG 975. 23.1 .0 44.0� PAGE 2 JOB: I25ThorntonParkwayInterchangePMPA RUN: I25ThorntonParkwayInterchangePMPA
DATE : 11/22/10 TIME : 13: 4:59
ADDITIONAL QUEUE LINK PARAMETERS -------------------------------- LINK DESCRIPTION * CYCLE RED CLEARANCE APPROACH SATURATION IDLE SIGNAL ARRIVAL * LENGTH TIME LOST TIME VOL FLOW RATE EM FAC TYPE RATE * (SEC) (SEC) (SEC) (VPH) (VPH) (gm/hr) ------------------------*-------------------------------------------------------------------------------- 2. thornebapp que * 100 53 2.0 1690 1600 143.34 1 3 4. thornebdep/app que * 100 41 2.0 1580 1600 143.34 1 3 5. thornebleftturn * 100 78 2.0 520 1600 143.34 1 3 8. thornwbapp que * 100 65 2.0 1415 1600 143.34 1 3 10. thornwbdep/app que * 100 41 2.0 1340 1600 143.34 1 3 11. thornwbleftturn * 100 90 2.0 355 1600 143.34 1 3 14. I25sbrampleftturn * 100 59 2.0 410 1600 143.34 1 3 17. I25nbrampleftturn * 100 59 2.0 280 1600 143.34 1 3
RECEPTOR LOCATIONS ------------------ * COORDINATES (FT) * RECEPTOR * X Y Z * -------------------------*-------------------------------------* 1. Receptor 1 * 672.0 52.0 5.0 * 2. Receptor 2 * 712.0 52.0 5.0 * 3. Receptor 3 * 752.0 52.0 5.0 * 4. Receptor 4 * 792.0 52.0 5.0 * 5. Receptor 5 * 792.0 2.0 5.0 *
Page 1
thorpav2.out 6. Receptor 6 * 792.0 -38.0 5.0 * 7. Receptor 7 * 792.0 -78.0 5.0 * 8. Receptor 8 * 856.0 -56.0 5.0 * 9. Receptor 9 * 856.0 -16.0 5.0 * 10. Receptor 10 * 856.0 24.0 5.0 * 11. Receptor 11 * 856.0 64.0 5.0 * 12. Receptor 12 * 896.0 64.0 5.0 * 13. Receptor 13 * 936.0 64.0 5.0 * 14. Receptor 14 * 976.0 64.0 5.0 * 15. Receptor 15 * 1256.0 64.0 5.0 * 16. Receptor 16 * 1296.0 64.0 5.0 * 17. Receptor 17 * 1336.0 64.0 5.0 * 18. Receptor 18 * 1376.0 64.0 5.0 * 19. Receptor 19 * 1376.0 24.0 5.0 * 20. Receptor 20 * 1376.0 -16.0 5.0 * 21. Receptor 21 * 1376.0 -56.0 5.0 * 22. Receptor 22 * 1452.0 -68.0 5.0 * 23. Receptor 23 * 1452.0 -28.0 5.0 * 24. Receptor 24 * 1452.0 12.0 5.0 * 25. Receptor 25 * 1452.0 52.0 5.0 * 26. Receptor 26 * 1492.0 52.0 5.0 * 27. Receptor 27 * 1532.0 52.0 5.0 * 28. Receptor 28 * 1572.0 52.0 5.0 * 29. Receptor 29 * 1572.0 194.0 5.0 * 30. Receptor 30 * 1532.0 194.0 5.0 * 31. Receptor 31 * 1492.0 194.0 5.0 * 32. Receptor 32 * 1452.0 194.0 5.0 * 33. Receptor 33 * 1452.0 234.0 5.0 * 34. Receptor 34 * 1452.0 274.0 5.0 * 35. Receptor 35 * 1452.0 314.0 5.0 * 36. Receptor 36 * 1388.0 302.0 5.0 * 37. Receptor 37 * 1388.0 262.0 5.0 *� PAGE 3 JOB: I25ThorntonParkwayInterchangePMPA RUN: I25ThorntonParkwayInterchangePMPA
DATE : 11/22/10 TIME : 13: 4:59
RECEPTOR LOCATIONS ------------------ * COORDINATES (FT) * RECEPTOR * X Y Z * -------------------------*-------------------------------------* 38. Receptor 38 * 1388.0 222.0 5.0 * 39. Receptor 39 * 1388.0 182.0 5.0 * 40. Receptor 40 * 1348.0 182.0 5.0 * 41. Receptor 41 * 1308.0 182.0 5.0 * 42. Receptor 42 * 1264.0 182.0 5.0 * 43. Receptor 43 * 988.0 182.0 5.0 * 44. Receptor 44 * 948.0 182.0 5.0 * 45. Receptor 45 * 908.0 182.0 5.0 * 46. Receptor 46 * 868.0 182.0 5.0 * 47. Receptor 47 * 868.0 222.0 5.0 * 48. Receptor 48 * 868.0 262.0 5.0 * 49. Receptor 49 * 868.0 302.0 5.0 * 50. Receptor 50 * 792.0 314.0 5.0 * 51. Receptor 51 * 792.0 274.0 5.0 * 52. Receptor 52 * 792.0 234.0 5.0 * 53. Receptor 53 * 792.0 194.0 5.0 * 54. Receptor 54 * 752.0 194.0 5.0 * 55. Receptor 55 * 712.0 194.0 5.0 * 56. Receptor 56 * 672.0 194.0 5.0 *� PAGE 4 JOB: I25ThorntonParkwayInterchangePMPA RUN: I25ThorntonParkwayInterchangePMPA
MODEL RESULTS -------------
REMARKS : In search of the angle corresponding to the maximum concentration, only the first angle, of the angles with same maximum concentrations, is indicated as maximum.
WIND ANGLE RANGE: 0.-360.
WIND * CONCENTRATION ANGLE * (PPM) (DEGR)* REC1 REC2 REC3 REC4 REC5 REC6 REC7 REC8 REC9 REC10 REC11 REC12 REC13 REC14 REC15 REC16 REC17 REC18
Page 2
thorpav2.outREC19 REC20 ------*------------------------------------------------------------------------------------------------------------------------ 0. * 4.5 4.5 4.7 4.9 3.2 2.6 2.3 2.4 2.7 3.3 4.6 4.9 4.6 4.6 4.9 4.9 5.0 5.1 3.5 2.8 10. * 4.5 4.6 4.8 4.6 3.3 2.8 2.6 2.4 2.7 3.3 4.4 4.5 4.4 4.3 5.0 5.1 5.1 5.1 3.5 2.9 20. * 4.6 4.7 4.8 4.5 3.3 2.8 2.6 2.0 2.4 3.1 4.4 4.3 4.3 4.2 5.0 5.0 5.1 4.7 3.6 3.3 30. * 4.9 5.0 4.9 4.4 3.2 2.9 2.5 2.3 2.5 3.3 4.6 4.6 4.5 4.3 5.2 5.3 5.4 4.9 3.6 3.4 40. * 5.1 5.3 5.3 4.8 3.3 2.8 2.5 2.2 2.7 3.4 5.0 5.0 4.8 4.6 5.5 5.6 5.6 5.0 3.8 3.5 50. * 5.6 5.5 5.3 5.0 3.7 3.0 2.7 2.2 2.7 3.4 5.3 5.3 5.1 5.0 5.8 5.8 5.7 5.1 4.2 3.6 60. * 5.9 5.8 5.9 5.4 3.4 3.1 2.8 2.4 3.0 3.7 5.5 5.4 5.2 5.3 6.2 6.2 5.6 5.5 4.2 3.4 70. * 6.4 6.4 6.0 5.9 3.7 3.1 2.5 2.4 2.8 3.7 5.9 5.8 5.7 5.9 6.3 6.0 5.6 5.4 4.0 2.9 80. * 5.8 5.7 5.5 5.4 3.1 2.2 2.0 1.7 2.3 3.1 5.5 5.6 5.6 5.5 5.2 5.0 4.9 4.9 3.2 2.2 90. * 3.9 3.6 3.5 3.4 1.9 1.3 .9 .8 1.2 1.9 3.7 3.8 3.8 3.7 3.3 3.1 3.1 3.4 2.0 1.4 100. * 1.5 1.5 1.4 1.5 .8 .6 .5 .1 .3 .5 1.7 1.7 1.7 1.6 1.6 1.4 1.6 2.1 1.2 1.0 110. * .5 .5 .5 .6 .5 .5 .5 .1 .1 .1 .4 .3 .3 .4 .5 .7 .7 1.3 1.0 .8 120. * .3 .3 .4 .5 .5 .5 .5 .1 .1 .1 .1 .1 .1 .1 .3 .4 .6 1.0 1.0 .7 130. * .3 .3 .4 .6 .6 .6 .6 .1 .1 .1 .1 .1 .1 .1 .3 .3 .5 1.0 1.0 .6 140. * .2 .2 .4 .6 .6 .6 .5 .1 .1 .1 .1 .1 .1 .1 .2 .4 .5 1.0 .9 .5 150. * .2 .2 .3 .6 .6 .6 .6 .0 .0 .0 .0 .1 .1 .1 .2 .3 .5 1.1 .9 .6 160. * .2 .2 .3 .6 .6 .6 .6 .1 .1 .1 .1 .0 .0 .0 .2 .3 .4 1.0 .8 .6 170. * .1 .2 .3 .7 .6 .6 .6 .2 .2 .2 .2 .1 .0 .0 .1 .2 .3 .9 .7 .6 180. * .1 .1 .2 .5 .5 .5 .5 .5 .5 .5 .5 .2 .1 .1 .1 .1 .2 .5 .4 .4 190. * .0 .0 .1 .2 .2 .2 .2 .6 .6 .7 .7 .3 .2 .1 .0 .0 .1 .2 .2 .2 200. * .0 .0 .0 .1 .1 .1 .1 .6 .6 .6 .6 .3 .2 .2 .0 .0 .0 .0 .0 .0 210. * .0 .0 .0 .0 .0 .0 .0 .6 .6 .6 .6 .3 .2 .2 .1 .1 .0 .0 .0 .0 220. * .0 .0 .0 .0 .0 .0 .0 .5 .5 .5 .5 .3 .2 .2 .1 .1 .1 .1 .1 .1 230. * .0 .0 .0 .0 .0 .0 .0 .5 .5 .5 .5 .3 .2 .2 .1 .1 .1 .1 .1 .1 240. * .1 .1 .1 .1 .0 .0 .0 .4 .4 .4 .5 .4 .2 .2 .1 .1 .1 .1 .1 .1 250. * .2 .2 .2 .2 .0 .0 .0 .4 .4 .4 .9 .6 .6 .5 .3 .3 .3 .3 .1 .1 260. * .7 .7 .9 1.0 .2 .0 .0 .4 .6 .8 2.3 1.9 1.7 1.7 1.5 1.8 1.8 1.8 .5 .4 270. * 2.0 2.2 2.5 2.7 .8 .5 .2 .7 1.1 1.8 4.4 3.9 3.5 3.3 3.9 3.9 4.0 4.2 1.8 1.3 280. * 3.3 3.8 4.1 4.3 1.8 1.0 .7 1.4 1.9 3.1 5.8 5.1 4.9 4.8 5.6 6.1 6.1 6.3 3.5 2.3 290. * 3.9 4.6 5.0 5.3 2.5 1.7 1.2 1.9 2.7 3.9 5.8 5.1 5.0 5.4 6.5 6.5 6.6 6.7 4.1 3.0 300. * 4.2 4.9 5.3 5.4 2.9 2.1 1.5 2.4 3.1 4.1 5.2 4.6 4.9 5.3 6.0 6.0 6.1 6.1 4.0 3.0 310. * 4.2 4.8 5.0 5.0 2.9 2.1 1.7 2.6 3.2 3.7 4.6 4.2 4.6 5.1 5.8 5.8 5.9 5.9 3.7 2.9 320. * 4.3 4.7 4.7 4.7 3.0 2.2 1.8 2.5 2.9 3.5 4.2 4.2 5.0 5.1 5.4 5.4 5.4 5.4 3.6 2.9 330. * 4.3 4.5 4.5 4.5 3.0 2.3 1.9 2.5 2.8 3.3 3.8 4.3 4.8 4.9 5.0 5.0 5.0 5.0 3.5 2.7 340. * 4.2 4.3 4.3 4.4 2.8 2.3 1.8 2.4 2.5 3.1 4.2 4.7 4.8 4.7 4.8 4.7 4.7 4.8 3.2 2.4 350. * 4.3 4.3 4.4 4.5 3.0 2.5 2.1 2.4 2.8 3.4 4.6 4.8 4.8 4.6 4.8 4.8 4.9 4.9 3.4 2.6 360. * 4.5 4.5 4.7 4.9 3.2 2.6 2.3 2.4 2.7 3.3 4.6 4.9 4.6 4.6 4.9 4.9 5.0 5.1 3.5 2.8 ------*------------------------------------------------------------------------------------------------------------------------
Page 3
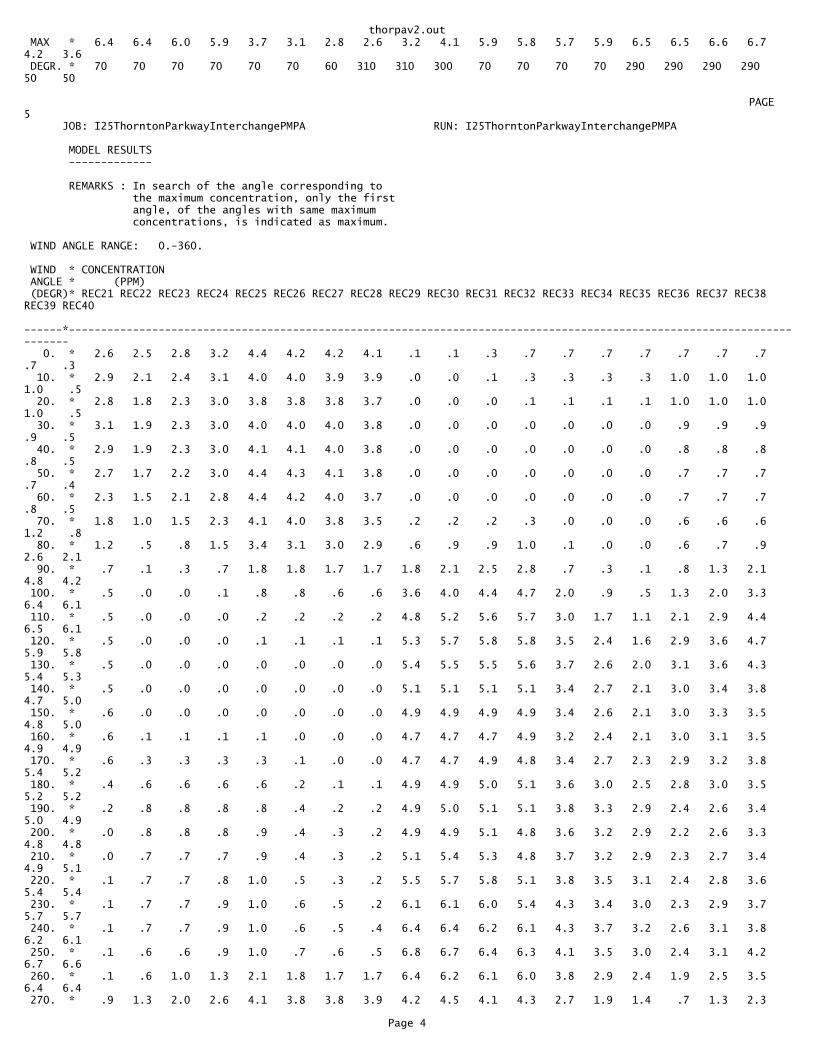
thorpav2.out MAX * 6.4 6.4 6.0 5.9 3.7 3.1 2.8 2.6 3.2 4.1 5.9 5.8 5.7 5.9 6.5 6.5 6.6 6.7 4.2 3.6 DEGR. * 70 70 70 70 70 70 60 310 310 300 70 70 70 70 290 290 290 290 50 50
� PAGE 5 JOB: I25ThorntonParkwayInterchangePMPA RUN: I25ThorntonParkwayInterchangePMPA
MODEL RESULTS -------------
REMARKS : In search of the angle corresponding to the maximum concentration, only the first angle, of the angles with same maximum concentrations, is indicated as maximum.
WIND ANGLE RANGE: 0.-360.
WIND * CONCENTRATION ANGLE * (PPM) (DEGR)* REC21 REC22 REC23 REC24 REC25 REC26 REC27 REC28 REC29 REC30 REC31 REC32 REC33 REC34 REC35 REC36 REC37 REC38 REC39 REC40 ------*------------------------------------------------------------------------------------------------------------------------ 0. * 2.6 2.5 2.8 3.2 4.4 4.2 4.2 4.1 .1 .1 .3 .7 .7 .7 .7 .7 .7 .7 .7 .3 10. * 2.9 2.1 2.4 3.1 4.0 4.0 3.9 3.9 .0 .0 .1 .3 .3 .3 .3 1.0 1.0 1.0 1.0 .5 20. * 2.8 1.8 2.3 3.0 3.8 3.8 3.8 3.7 .0 .0 .0 .1 .1 .1 .1 1.0 1.0 1.0 1.0 .5 30. * 3.1 1.9 2.3 3.0 4.0 4.0 4.0 3.8 .0 .0 .0 .0 .0 .0 .0 .9 .9 .9 .9 .5 40. * 2.9 1.9 2.3 3.0 4.1 4.1 4.0 3.8 .0 .0 .0 .0 .0 .0 .0 .8 .8 .8 .8 .5 50. * 2.7 1.7 2.2 3.0 4.4 4.3 4.1 3.8 .0 .0 .0 .0 .0 .0 .0 .7 .7 .7 .7 .4 60. * 2.3 1.5 2.1 2.8 4.4 4.2 4.0 3.7 .0 .0 .0 .0 .0 .0 .0 .7 .7 .7 .8 .5 70. * 1.8 1.0 1.5 2.3 4.1 4.0 3.8 3.5 .2 .2 .2 .3 .0 .0 .0 .6 .6 .6 1.2 .8 80. * 1.2 .5 .8 1.5 3.4 3.1 3.0 2.9 .6 .9 .9 1.0 .1 .0 .0 .6 .7 .9 2.6 2.1 90. * .7 .1 .3 .7 1.8 1.8 1.7 1.7 1.8 2.1 2.5 2.8 .7 .3 .1 .8 1.3 2.1 4.8 4.2 100. * .5 .0 .0 .1 .8 .8 .6 .6 3.6 4.0 4.4 4.7 2.0 .9 .5 1.3 2.0 3.3 6.4 6.1 110. * .5 .0 .0 .0 .2 .2 .2 .2 4.8 5.2 5.6 5.7 3.0 1.7 1.1 2.1 2.9 4.4 6.5 6.1 120. * .5 .0 .0 .0 .1 .1 .1 .1 5.3 5.7 5.8 5.8 3.5 2.4 1.6 2.9 3.6 4.7 5.9 5.8 130. * .5 .0 .0 .0 .0 .0 .0 .0 5.4 5.5 5.5 5.6 3.7 2.6 2.0 3.1 3.6 4.3 5.4 5.3 140. * .5 .0 .0 .0 .0 .0 .0 .0 5.1 5.1 5.1 5.1 3.4 2.7 2.1 3.0 3.4 3.8 4.7 5.0 150. * .6 .0 .0 .0 .0 .0 .0 .0 4.9 4.9 4.9 4.9 3.4 2.6 2.1 3.0 3.3 3.5 4.8 5.0 160. * .6 .1 .1 .1 .1 .0 .0 .0 4.7 4.7 4.7 4.9 3.2 2.4 2.1 3.0 3.1 3.5 4.9 4.9 170. * .6 .3 .3 .3 .3 .1 .0 .0 4.7 4.7 4.9 4.8 3.4 2.7 2.3 2.9 3.2 3.8 5.4 5.2 180. * .4 .6 .6 .6 .6 .2 .1 .1 4.9 4.9 5.0 5.1 3.6 3.0 2.5 2.8 3.0 3.5 5.2 5.2 190. * .2 .8 .8 .8 .8 .4 .2 .2 4.9 5.0 5.1 5.1 3.8 3.3 2.9 2.4 2.6 3.4 5.0 4.9 200. * .0 .8 .8 .8 .9 .4 .3 .2 4.9 4.9 5.1 4.8 3.6 3.2 2.9 2.2 2.6 3.3 4.8 4.8 210. * .0 .7 .7 .7 .9 .4 .3 .2 5.1 5.4 5.3 4.8 3.7 3.2 2.9 2.3 2.7 3.4 4.9 5.1 220. * .1 .7 .7 .8 1.0 .5 .3 .2 5.5 5.7 5.8 5.1 3.8 3.5 3.1 2.4 2.8 3.6 5.4 5.4 230. * .1 .7 .7 .9 1.0 .6 .5 .2 6.1 6.1 6.0 5.4 4.3 3.4 3.0 2.3 2.9 3.7 5.7 5.7 240. * .1 .7 .7 .9 1.0 .6 .5 .4 6.4 6.4 6.2 6.1 4.3 3.7 3.2 2.6 3.1 3.8 6.2 6.1 250. * .1 .6 .6 .9 1.0 .7 .6 .5 6.8 6.7 6.4 6.3 4.1 3.5 3.0 2.4 3.1 4.2 6.7 6.6 260. * .1 .6 1.0 1.3 2.1 1.8 1.7 1.7 6.4 6.2 6.1 6.0 3.8 2.9 2.4 1.9 2.5 3.5 6.4 6.4 270. * .9 1.3 2.0 2.6 4.1 3.8 3.8 3.9 4.2 4.5 4.1 4.3 2.7 1.9 1.4 .7 1.3 2.3
Page 4

thorpav2.out4.6 4.5 280. * 1.7 2.1 2.8 3.9 6.2 5.9 5.8 5.1 1.8 1.9 1.9 2.0 1.3 .8 .8 .2 .3 .8 1.9 1.9 290. * 2.3 2.7 3.8 4.7 6.3 5.9 5.6 5.4 .5 .6 .6 .8 .7 .7 .7 .1 .1 .1 .5 .5 300. * 2.5 3.0 3.9 4.6 5.8 5.3 4.9 4.9 .3 .4 .5 .8 .8 .8 .8 .1 .1 .1 .2 .2 310. * 2.4 3.1 3.6 4.3 5.1 4.6 4.5 4.5 .4 .4 .5 .8 .8 .8 .8 .1 .1 .1 .1 .1 320. * 2.4 3.1 3.7 3.7 4.6 4.2 4.3 4.4 .3 .4 .6 .9 .9 .9 .9 .1 .1 .1 .1 .1 330. * 2.4 3.2 3.4 3.5 4.3 4.0 4.2 4.2 .3 .4 .5 .9 .9 .9 .9 .0 .0 .0 .1 .1 340. * 2.1 2.9 3.1 3.3 4.1 4.0 4.1 4.0 .3 .4 .5 1.0 1.0 1.0 1.0 .1 .1 .1 .1 .0 350. * 2.3 2.8 2.9 3.4 4.4 4.2 4.2 4.1 .2 .3 .5 1.0 1.0 1.0 1.0 .3 .3 .3 .3 .1 360. * 2.6 2.5 2.8 3.2 4.4 4.2 4.2 4.1 .1 .1 .3 .7 .7 .7 .7 .7 .7 .7 .7 .3 ------*------------------------------------------------------------------------------------------------------------------------ MAX * 3.1 3.2 3.9 4.7 6.3 5.9 5.8 5.4 6.8 6.7 6.4 6.3 4.3 3.7 3.2 3.1 3.6 4.7 6.7 6.6 DEGR. * 30 330 300 290 290 280 280 290 250 250 250 250 230 240 240 130 120 120 250 250
� PAGE 6 JOB: I25ThorntonParkwayInterchangePMPA RUN: I25ThorntonParkwayInterchangePMPA
MODEL RESULTS -------------
REMARKS : In search of the angle corresponding to the maximum concentration, only the first angle, of the angles with same maximum concentrations, is indicated as maximum.
WIND ANGLE RANGE: 0.-360.
WIND * CONCENTRATION ANGLE * (PPM) (DEGR)* REC41 REC42 REC43 REC44 REC45 REC46 REC47 REC48 REC49 REC50 REC51 REC52 REC53 REC54 REC55 REC56 ------*------------------------------------------------------------------------------------------------ 0. * .1 .1 .1 .1 .2 .6 .5 .4 .4 .6 .6 .7 .7 .3 .1 .1 10. * .3 .2 .0 .0 .1 .3 .2 .2 .2 .9 .9 .9 1.0 .4 .3 .2 20. * .4 .3 .1 .0 .0 .0 .0 .0 .0 .9 .9 1.0 1.1 .5 .3 .3 30. * .4 .3 .1 .1 .1 .1 .1 .0 .0 .8 .8 1.0 1.1 .5 .3 .3 40. * .3 .3 .1 .1 .1 .1 .1 .1 .1 .8 .9 1.1 1.1 .7 .5 .2 50. * .3 .2 .1 .1 .1 .1 .1 .1 .1 .8 1.0 1.1 1.1 .8 .6 .5 60. * .3 .2 .2 .2 .2 .2 .1 .1 .1 .7 .9 1.0 1.0 .8 .7 .5 70. * .7 .5 .5 .5 .5 .5 .1 .1 .1 .7 1.0 1.0 1.1 .9 .8 .7 80. * 1.9 1.7 1.8 1.8 1.8 2.0 .7 .4 .1 .8 1.2 1.5 2.4 2.3 2.2 2.3 90. * 4.1 3.9 4.2 4.4 4.7 4.7 2.1 1.3 .8 1.5 2.1 2.7 4.8 4.6 4.7 4.6 100. * 5.8 5.8 6.4 6.5 6.8 6.8 3.6 2.5 1.7 2.5 3.2 4.0 6.7 6.5 6.4 6.0 110. * 6.1 6.2 6.6 6.9 7.1 7.3 4.4 3.0 2.3 3.1 4.0 4.9 7.2 6.8 6.2 6.0 120. * 5.8 6.1 6.2 6.5 6.8 6.7 4.1 3.1 2.7 3.4 4.0 4.8 6.3 5.8 5.5 5.3 130. * 5.5 5.6 5.6 6.0 6.1 6.2 3.8 2.9 2.4 3.4 3.8 4.5 5.6 5.0 4.8 4.7 140. * 5.4 5.4 5.3 5.7 5.8 5.8 3.8 2.9 2.4 3.2 3.6 3.9 4.9 4.4 4.6 4.6 150. * 5.3 5.3 5.1 5.5 5.5 5.5 3.7 2.8 2.3 3.2 3.4 3.7 4.4 4.0 4.2 4.3 160. * 5.0 4.9 5.0 5.1 5.1 5.1 3.4 2.5 2.2 2.9 3.2 3.3 4.3 4.0 4.1 4.2 170. * 5.1 5.0 5.1 5.1 5.2 5.0 3.4 2.5 2.3 2.7 2.9 3.2 4.4 4.2 4.3 4.2 180. * 5.0 5.0 5.3 5.3 5.4 5.1 3.5 2.8 2.6 2.4 2.7 3.2 4.3 4.4 4.3 4.2 190. * 4.8 4.8 5.3 5.4 5.3 4.9 3.5 3.0 2.7 2.1 2.3 3.0 4.2 4.2 4.1 3.9 200. * 4.7 4.7 5.3 5.2 5.4 4.4 3.4 3.2 3.0 1.9 2.2 2.8 4.1 4.0 3.9 3.6 210. * 5.1 5.1 5.6 5.6 5.6 4.6 3.6 3.2 3.2 1.8 2.3 2.9 4.2 4.1 4.0 3.6 220. * 5.4 5.3 5.8 5.8 5.6 5.0 3.9 3.6 3.1 1.8 2.2 3.0 4.4 4.3 4.0 3.7 230. * 5.6 5.5 6.2 6.3 5.8 5.3 4.1 3.5 2.9 1.7 2.2 2.9 4.5 4.3 4.1 3.9 240. * 6.0 6.0 6.5 6.3 6.0 5.6 4.2 3.5 2.8 1.6 2.1 2.9 4.7 4.5 4.4 4.3 250. * 6.7 6.6 6.9 6.5 6.1 6.1 4.3 3.2 2.6 1.4 2.0 2.6 5.0 4.8 4.6 4.6 260. * 6.3 6.2 6.2 5.7 5.7 5.8 3.8 2.7 2.1 .8 1.4 2.1 4.5 4.4 4.3 4.2 270. * 4.5 4.4 4.1 4.0 4.1 4.7 2.5 1.8 1.3 .3 .6 1.1 2.9 2.8 2.8 2.7 280. * 1.9 2.0 2.0 1.9 2.2 2.7 1.5 1.1 .9 .0 .1 .3 1.3 1.2 1.2 1.1 290. * .5 .5 .7 .8 1.0 1.5 1.1 1.0 .8 .0 .0 .0 .3 .3 .3 .3 300. * .2 .2 .3 .6 .7 1.0 1.0 1.0 .7 .0 .0 .0 .1 .1 .1 .1 310. * .1 .1 .3 .5 .6 1.0 1.0 1.0 .6 .0 .0 .0 .1 .1 .1 .1 320. * .1 .1 .3 .4 .7 1.1 1.1 1.0 .7 .0 .0 .0 .0 .0 .0 .0 330. * .1 .1 .2 .4 .6 1.1 1.1 1.0 .6 .0 .0 .0 .0 .0 .0 .0 340. * .0 .0 .2 .3 .5 1.2 1.1 .9 .7 .1 .1 .1 .1 .0 .0 .0 350. * .0 .0 .2 .2 .4 1.1 1.0 .7 .6 .3 .3 .3 .3 .1 .0 .0
Page 5
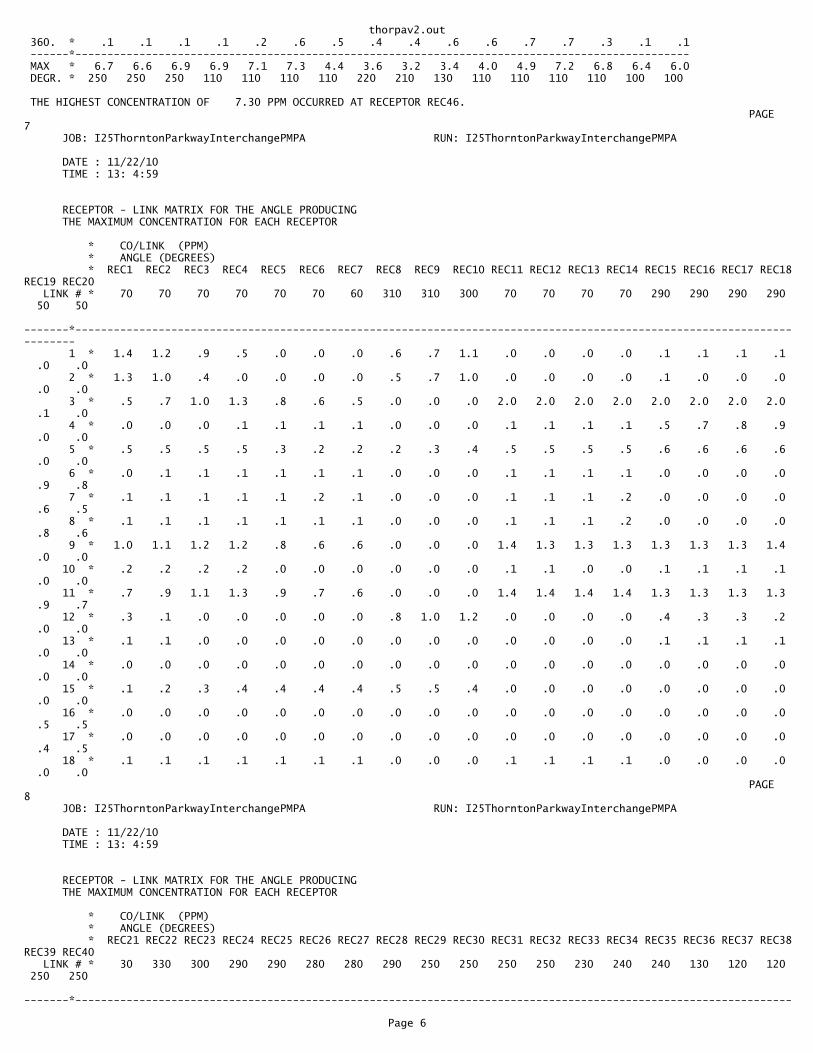
thorpav2.out 360. * .1 .1 .1 .1 .2 .6 .5 .4 .4 .6 .6 .7 .7 .3 .1 .1 ------*------------------------------------------------------------------------------------------------ MAX * 6.7 6.6 6.9 6.9 7.1 7.3 4.4 3.6 3.2 3.4 4.0 4.9 7.2 6.8 6.4 6.0 DEGR. * 250 250 250 110 110 110 110 220 210 130 110 110 110 110 100 100
THE HIGHEST CONCENTRATION OF 7.30 PPM OCCURRED AT RECEPTOR REC46.� PAGE 7 JOB: I25ThorntonParkwayInterchangePMPA RUN: I25ThorntonParkwayInterchangePMPA
DATE : 11/22/10 TIME : 13: 4:59
RECEPTOR - LINK MATRIX FOR THE ANGLE PRODUCING THE MAXIMUM CONCENTRATION FOR EACH RECEPTOR
* CO/LINK (PPM) * ANGLE (DEGREES) * REC1 REC2 REC3 REC4 REC5 REC6 REC7 REC8 REC9 REC10 REC11 REC12 REC13 REC14 REC15 REC16 REC17 REC18REC19 REC20 LINK # * 70 70 70 70 70 70 60 310 310 300 70 70 70 70 290 290 290 290 50 50 -------*------------------------------------------------------------------------------------------------------------------------ 1 * 1.4 1.2 .9 .5 .0 .0 .0 .6 .7 1.1 .0 .0 .0 .0 .1 .1 .1 .1 .0 .0 2 * 1.3 1.0 .4 .0 .0 .0 .0 .5 .7 1.0 .0 .0 .0 .0 .1 .0 .0 .0 .0 .0 3 * .5 .7 1.0 1.3 .8 .6 .5 .0 .0 .0 2.0 2.0 2.0 2.0 2.0 2.0 2.0 2.0 .1 .0 4 * .0 .0 .0 .1 .1 .1 .1 .0 .0 .0 .1 .1 .1 .1 .5 .7 .8 .9 .0 .0 5 * .5 .5 .5 .5 .3 .2 .2 .2 .3 .4 .5 .5 .5 .5 .6 .6 .6 .6 .0 .0 6 * .0 .1 .1 .1 .1 .1 .1 .0 .0 .0 .1 .1 .1 .1 .0 .0 .0 .0 .9 .8 7 * .1 .1 .1 .1 .1 .2 .1 .0 .0 .0 .1 .1 .1 .2 .0 .0 .0 .0 .6 .5 8 * .1 .1 .1 .1 .1 .1 .1 .0 .0 .0 .1 .1 .1 .2 .0 .0 .0 .0 .8 .6 9 * 1.0 1.1 1.2 1.2 .8 .6 .6 .0 .0 .0 1.4 1.3 1.3 1.3 1.3 1.3 1.3 1.4 .0 .0 10 * .2 .2 .2 .2 .0 .0 .0 .0 .0 .0 .1 .1 .0 .0 .1 .1 .1 .1 .0 .0 11 * .7 .9 1.1 1.3 .9 .7 .6 .0 .0 .0 1.4 1.4 1.4 1.4 1.3 1.3 1.3 1.3 .9 .7 12 * .3 .1 .0 .0 .0 .0 .0 .8 1.0 1.2 .0 .0 .0 .0 .4 .3 .3 .2 .0 .0 13 * .1 .1 .0 .0 .0 .0 .0 .0 .0 .0 .0 .0 .0 .0 .1 .1 .1 .1 .0 .0 14 * .0 .0 .0 .0 .0 .0 .0 .0 .0 .0 .0 .0 .0 .0 .0 .0 .0 .0 .0 .0 15 * .1 .2 .3 .4 .4 .4 .4 .5 .5 .4 .0 .0 .0 .0 .0 .0 .0 .0 .0 .0 16 * .0 .0 .0 .0 .0 .0 .0 .0 .0 .0 .0 .0 .0 .0 .0 .0 .0 .0 .5 .5 17 * .0 .0 .0 .0 .0 .0 .0 .0 .0 .0 .0 .0 .0 .0 .0 .0 .0 .0 .4 .5 18 * .1 .1 .1 .1 .1 .1 .1 .0 .0 .0 .1 .1 .1 .1 .0 .0 .0 .0 .0 .0� PAGE 8 JOB: I25ThorntonParkwayInterchangePMPA RUN: I25ThorntonParkwayInterchangePMPA
DATE : 11/22/10 TIME : 13: 4:59
RECEPTOR - LINK MATRIX FOR THE ANGLE PRODUCING THE MAXIMUM CONCENTRATION FOR EACH RECEPTOR
* CO/LINK (PPM) * ANGLE (DEGREES) * REC21 REC22 REC23 REC24 REC25 REC26 REC27 REC28 REC29 REC30 REC31 REC32 REC33 REC34 REC35 REC36 REC37 REC38REC39 REC40 LINK # * 30 330 300 290 290 280 280 290 250 250 250 250 230 240 240 130 120 120 250 250 -------*----------------------------------------------------------------------------------------------------------------
Page 6
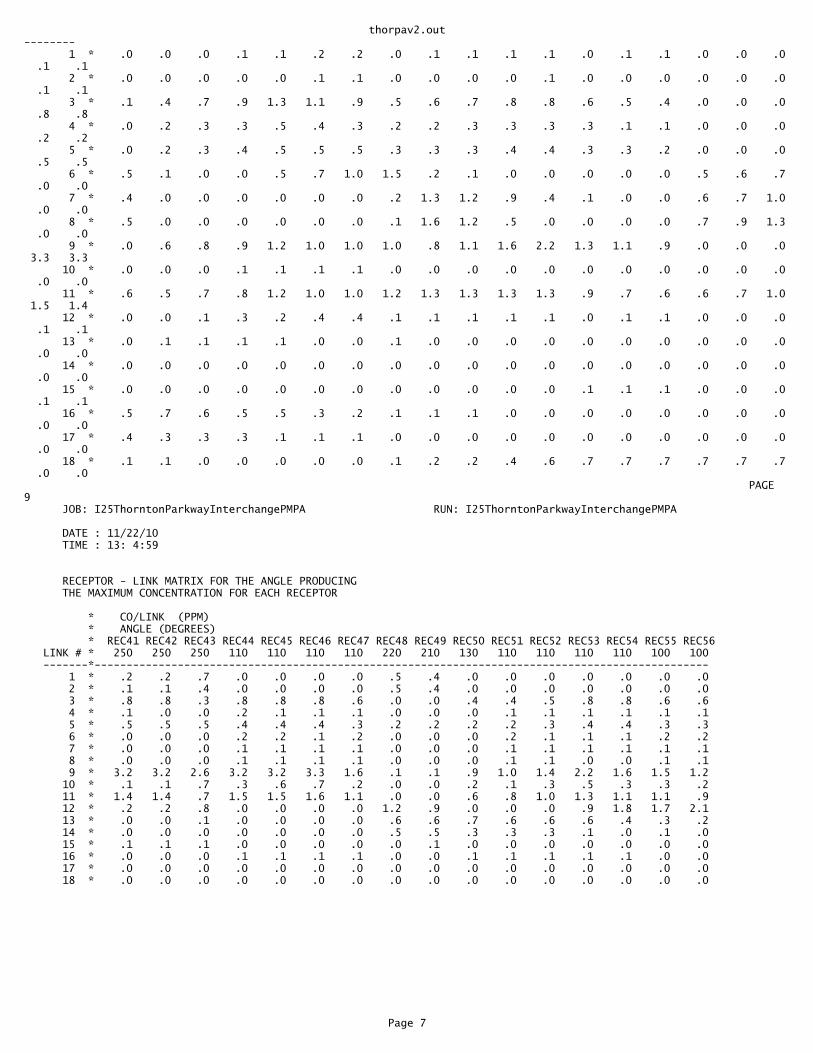
thorpav2.out-------- 1 * .0 .0 .0 .1 .1 .2 .2 .0 .1 .1 .1 .1 .0 .1 .1 .0 .0 .0 .1 .1 2 * .0 .0 .0 .0 .0 .1 .1 .0 .0 .0 .0 .1 .0 .0 .0 .0 .0 .0 .1 .1 3 * .1 .4 .7 .9 1.3 1.1 .9 .5 .6 .7 .8 .8 .6 .5 .4 .0 .0 .0 .8 .8 4 * .0 .2 .3 .3 .5 .4 .3 .2 .2 .3 .3 .3 .3 .1 .1 .0 .0 .0 .2 .2 5 * .0 .2 .3 .4 .5 .5 .5 .3 .3 .3 .4 .4 .3 .3 .2 .0 .0 .0 .5 .5 6 * .5 .1 .0 .0 .5 .7 1.0 1.5 .2 .1 .0 .0 .0 .0 .0 .5 .6 .7 .0 .0 7 * .4 .0 .0 .0 .0 .0 .0 .2 1.3 1.2 .9 .4 .1 .0 .0 .6 .7 1.0 .0 .0 8 * .5 .0 .0 .0 .0 .0 .0 .1 1.6 1.2 .5 .0 .0 .0 .0 .7 .9 1.3 .0 .0 9 * .0 .6 .8 .9 1.2 1.0 1.0 1.0 .8 1.1 1.6 2.2 1.3 1.1 .9 .0 .0 .0 3.3 3.3 10 * .0 .0 .0 .1 .1 .1 .1 .0 .0 .0 .0 .0 .0 .0 .0 .0 .0 .0 .0 .0 11 * .6 .5 .7 .8 1.2 1.0 1.0 1.2 1.3 1.3 1.3 1.3 .9 .7 .6 .6 .7 1.0 1.5 1.4 12 * .0 .0 .1 .3 .2 .4 .4 .1 .1 .1 .1 .1 .0 .1 .1 .0 .0 .0 .1 .1 13 * .0 .1 .1 .1 .1 .0 .0 .1 .0 .0 .0 .0 .0 .0 .0 .0 .0 .0 .0 .0 14 * .0 .0 .0 .0 .0 .0 .0 .0 .0 .0 .0 .0 .0 .0 .0 .0 .0 .0 .0 .0 15 * .0 .0 .0 .0 .0 .0 .0 .0 .0 .0 .0 .0 .1 .1 .1 .0 .0 .0 .1 .1 16 * .5 .7 .6 .5 .5 .3 .2 .1 .1 .1 .0 .0 .0 .0 .0 .0 .0 .0 .0 .0 17 * .4 .3 .3 .3 .1 .1 .1 .0 .0 .0 .0 .0 .0 .0 .0 .0 .0 .0 .0 .0 18 * .1 .1 .0 .0 .0 .0 .0 .1 .2 .2 .4 .6 .7 .7 .7 .7 .7 .7 .0 .0� PAGE 9 JOB: I25ThorntonParkwayInterchangePMPA RUN: I25ThorntonParkwayInterchangePMPA
DATE : 11/22/10 TIME : 13: 4:59
RECEPTOR - LINK MATRIX FOR THE ANGLE PRODUCING THE MAXIMUM CONCENTRATION FOR EACH RECEPTOR
* CO/LINK (PPM) * ANGLE (DEGREES) * REC41 REC42 REC43 REC44 REC45 REC46 REC47 REC48 REC49 REC50 REC51 REC52 REC53 REC54 REC55 REC56 LINK # * 250 250 250 110 110 110 110 220 210 130 110 110 110 110 100 100 -------*------------------------------------------------------------------------------------------------ 1 * .2 .2 .7 .0 .0 .0 .0 .5 .4 .0 .0 .0 .0 .0 .0 .0 2 * .1 .1 .4 .0 .0 .0 .0 .5 .4 .0 .0 .0 .0 .0 .0 .0 3 * .8 .8 .3 .8 .8 .8 .6 .0 .0 .4 .4 .5 .8 .8 .6 .6 4 * .1 .0 .0 .2 .1 .1 .1 .0 .0 .0 .1 .1 .1 .1 .1 .1 5 * .5 .5 .5 .4 .4 .4 .3 .2 .2 .2 .2 .3 .4 .4 .3 .3 6 * .0 .0 .0 .2 .2 .1 .2 .0 .0 .0 .2 .1 .1 .1 .2 .2 7 * .0 .0 .0 .1 .1 .1 .1 .0 .0 .0 .1 .1 .1 .1 .1 .1 8 * .0 .0 .0 .1 .1 .1 .1 .0 .0 .0 .1 .1 .0 .0 .1 .1 9 * 3.2 3.2 2.6 3.2 3.2 3.3 1.6 .1 .1 .9 1.0 1.4 2.2 1.6 1.5 1.2 10 * .1 .1 .7 .3 .6 .7 .2 .0 .0 .2 .1 .3 .5 .3 .3 .2 11 * 1.4 1.4 .7 1.5 1.5 1.6 1.1 .0 .0 .6 .8 1.0 1.3 1.1 1.1 .9 12 * .2 .2 .8 .0 .0 .0 .0 1.2 .9 .0 .0 .0 .9 1.8 1.7 2.1 13 * .0 .0 .1 .0 .0 .0 .0 .6 .6 .7 .6 .6 .6 .4 .3 .2 14 * .0 .0 .0 .0 .0 .0 .0 .5 .5 .3 .3 .3 .1 .0 .1 .0 15 * .1 .1 .1 .0 .0 .0 .0 .0 .1 .0 .0 .0 .0 .0 .0 .0 16 * .0 .0 .0 .1 .1 .1 .1 .0 .0 .1 .1 .1 .1 .1 .0 .0 17 * .0 .0 .0 .0 .0 .0 .0 .0 .0 .0 .0 .0 .0 .0 .0 .0 18 * .0 .0 .0 .0 .0 .0 .0 .0 .0 .0 .0 .0 .0 .0 .0 .0
Page 7

Emission and Idling Factors from APCD

DRCOGid2035 hr street FirstOfsid MaxOfsp MinOfEF(g/m)12109 7 CountyLineRoad n 25 45.3278112107 7 CountyLineRoad s 25 45.3278111367 7 HarmonyRoad&nbI25 w 51 23.930811367 7 HarmonyRoad&sbI25 e 51 23.930811368 7 HarmonyRoad&sbI25 w 51 22.8877611369 7 I-25northboundHR n 39 22.9657411364 7 I-25northboundHR s 30 22.3369911232 7 I-25northboundStateHwy7 n 38 22.3145211227 7 I-25northboundStateHwy7 s 39 44.8609710581 7 I-25northboundTP n 39 22.9657410490 7 I-25northboundTP s 35 22.4243911371 7 I-25southboundHR n 38 22.8411111366 7 I-25southboundHR s 37 22.7097211223 7 I-25southboundStateHwy7 n 38 22.3145211230 7 I-25southboundStateHwy7 s 37 22.1922710480 7 I-25southboundTP n 37 22.7097210579 7 I-25southboundTP s 30 22.3369924886 7 StateHwy119 e 51 22.7480812108 7 StateHwy119 w 51 44.82211233 7 StateHwy7&nbI25 e 46 22.5406611231 7 StateHwy7&nbI25 w 53 22.3145211231 7 StateHwy7&sbI25 e 53 22.3145224864 7 StateHwy7&sbI25 w 50 22.3885510522 7 ThorntonParkway&nbI25 e 34 22.4089810580 7 ThorntonParkway&nbI25 w 36 22.3926210580 7 ThorntonParkway&sbI25 e 36 22.3926210513 7 ThorntonParkway&sbI25 w 36 22.4243912109 17 CountyLineRoad n 25 45.5190312107 17 CountyLineRoad s 25 45.5190311367 17 HarmonyRoad&nbI25 w 51 48.8001811367 17 HarmonyRoad&sbI25 e 51 48.8001811368 17 HarmonyRoad&sbI25 w 51 23.8605111369 17 I-25northboundHR n 37 22.823111364 17 I-25northboundHR s 36 22.682711232 17 I-25northboundStateHwy7 n 38 22.4554111227 17 I-25northboundStateHwy7 s 38 44.9108110581 17 I-25northboundTP n 39 23.0822110490 17 I-25northboundTP s 24 22.8827811371 17 I-25southboundHR n 38 22.9560811366 17 I-25southboundHR s 34 22.5177211223 17 I-25southboundStateHwy7 n 38 22.4554111230 17 I-25southboundStateHwy7 s 39 22.5732710480 17 I-25southboundTP n 38 22.9560810579 17 I-25southboundTP s 37 22.823124886 17 StateHwy119 e 50 23.7196412108 17 StateHwy119 w 50 46.9099211233 17 StateHwy7&nbI25 e 44 22.9654111231 17 StateHwy7&nbI25 w 43 22.8287311231 17 StateHwy7&sbI25 e 43 22.8287324864 17 StateHwy7&sbI25 w 44 22.0613110522 17 ThorntonParkway&nbI25 e 35 22.53431

10580 17 ThorntonParkway&nbI25 w 36 22.5343110580 17 ThorntonParkway&sbI25 e 36 22.5343110513 17 ThorntonParkway&sbI25 w 36 45.3654
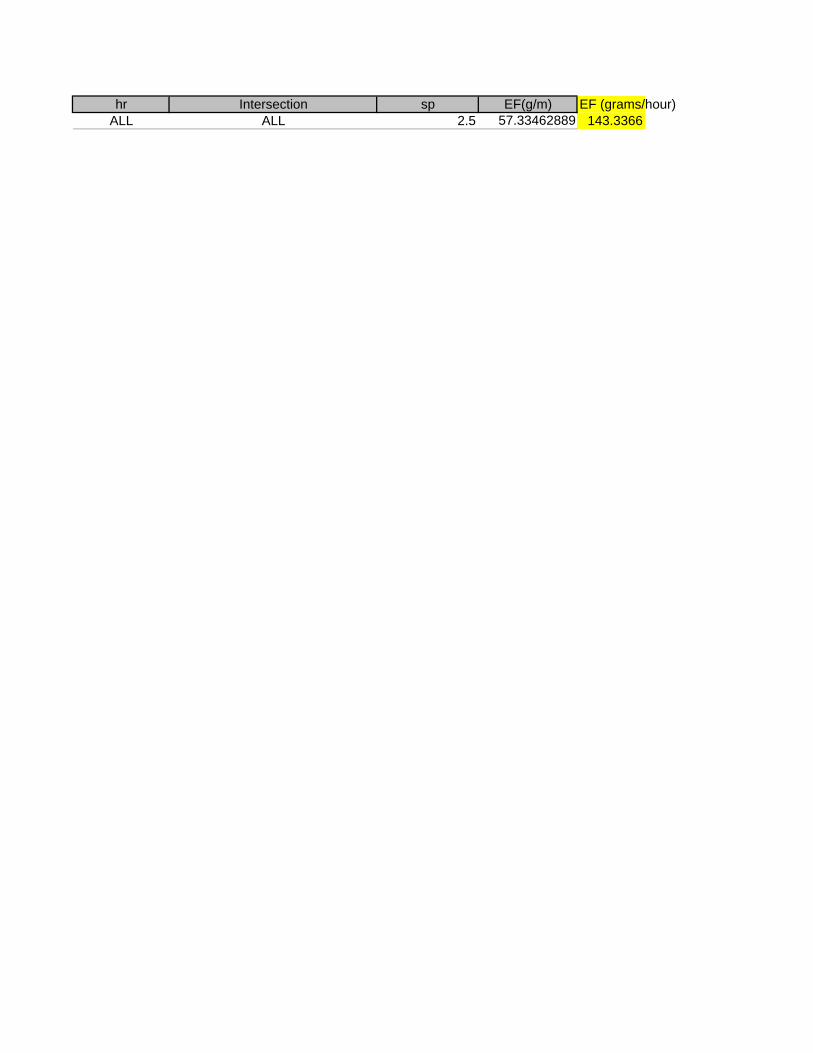
hr Intersection sp EF(g/m) EF (grams/hour)ALL ALL 2.5 57.33462889 143.3366
Appendix B
Final EIS August 2011 Technical Memorandum: Air Quality Addendum
Appendix B. Traffic
This Page Left Intentionally Blank.
Evans Package A (DEIS) PM Traffic

US 85 Commuter Bus - Evans DEIS Evaluation Page 10 of 15
Federal Highway Administration ▪ Federal Transit Administration ▪ Colorado Department of Transportation
Figure 6. 2030 Package A Background Traffic Forecasts
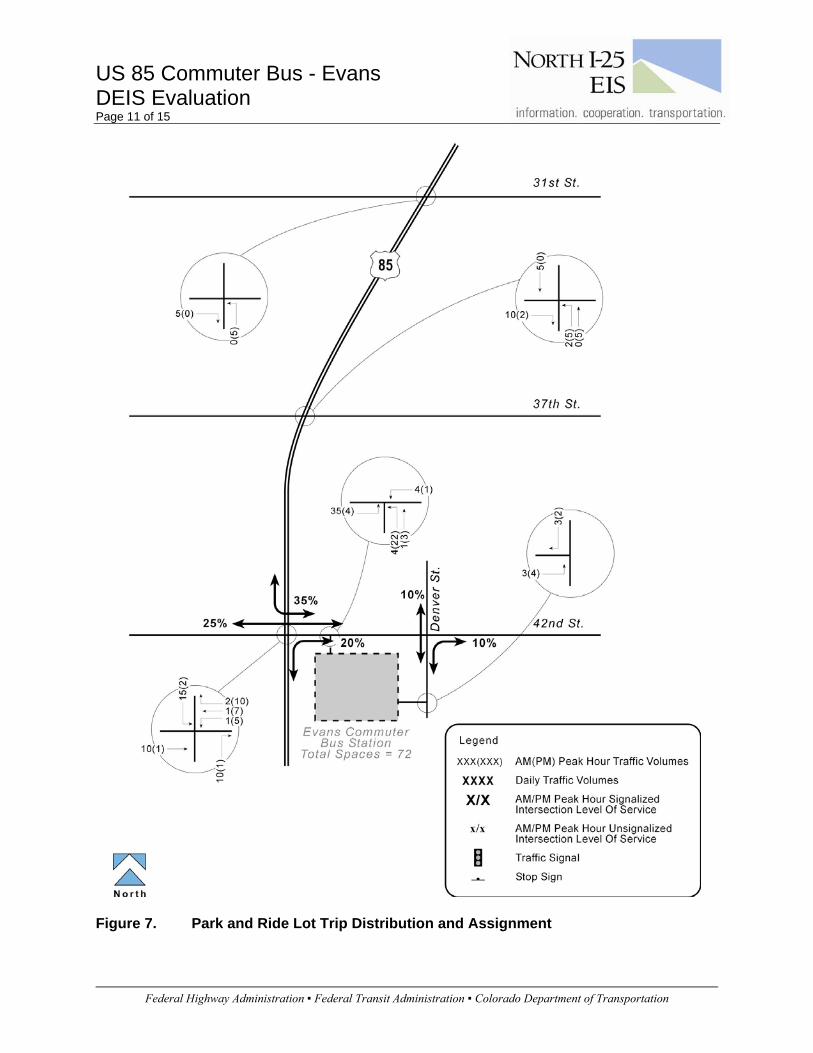
US 85 Commuter Bus - Evans DEIS Evaluation Page 11 of 15
Federal Highway Administration ▪ Federal Transit Administration ▪ Colorado Department of Transportation
Figure 7. Park and Ride Lot Trip Distribution and Assignment
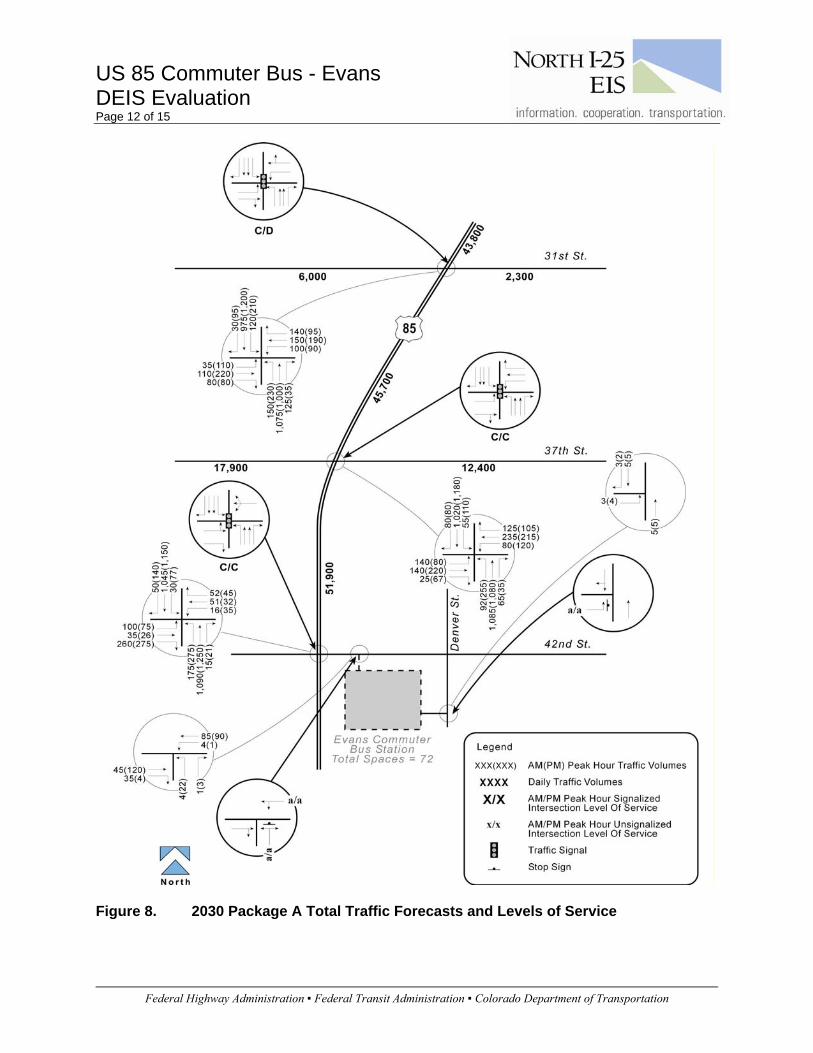
US 85 Commuter Bus - Evans DEIS Evaluation Page 12 of 15
Federal Highway Administration ▪ Federal Transit Administration ▪ Colorado Department of Transportation
Figure 8. 2030 Package A Total Traffic Forecasts and Levels of Service

Evans Preferred Alternative PM Traffic

HCM Signalized Intersection Capacity Analysis
21: 31st St & US 85-2035 Preferred Alternative PM Peak 1/5/2010
Evans Synchro 7 - Report
Jacobs Page 2
Movement EBL EBT EBR WBL WBT WBR NBL NBT NBR SBL SBT SBR
Lane Configurations
Volume (vph) 120 240 90 100 210 105 247 1080 40 230 1300 105
Ideal Flow (vphpl) 1900 1900 1900 1900 1900 1900 1900 1900 1900 1900 1900 1900
Total Lost time (s) 4.0 4.0 4.0 4.0 4.0 4.0 4.0 4.0 4.0 4.0
Lane Util. Factor 1.00 1.00 1.00 1.00 1.00 0.95 1.00 1.00 0.95 1.00
Frt 1.00 0.96 1.00 0.95 1.00 1.00 0.85 1.00 1.00 0.85
Flt Protected 0.95 1.00 0.95 1.00 0.95 1.00 1.00 0.95 1.00 1.00
Satd. Flow (prot) 1752 1769 1752 1752 1752 3505 1568 1752 3505 1568
Flt Permitted 0.18 1.00 0.21 1.00 0.95 1.00 1.00 0.95 1.00 1.00
Satd. Flow (perm) 334 1769 395 1752 1752 3505 1568 1752 3505 1568
Peak-hour factor, PHF 0.92 0.92 0.92 0.92 0.92 0.92 0.92 0.92 0.92 0.92 0.92 0.92
Adj. Flow (vph) 130 261 98 109 228 114 268 1174 43 250 1413 114
RTOR Reduction (vph) 0 12 0 0 15 0 0 0 25 0 0 41
Lane Group Flow (vph) 130 347 0 109 327 0 268 1174 18 250 1413 73
Turn Type pm+pt pm+pt Prot Perm Prot Perm
Protected Phases 7 4 3 8 5 2 1 6
Permitted Phases 4 8 2 6
Actuated Green, G (s) 35.3 28.3 31.3 26.3 16.7 45.4 45.4 19.3 48.0 48.0
Effective Green, g (s) 37.3 29.3 33.3 27.3 18.7 47.4 47.4 21.3 50.0 50.0
Actuated g/C Ratio 0.31 0.24 0.28 0.23 0.16 0.39 0.39 0.18 0.42 0.42
Clearance Time (s) 5.0 5.0 5.0 5.0 6.0 6.0 6.0 6.0 6.0 6.0
Vehicle Extension (s) 3.0 3.0 3.0 3.0 3.0 3.0 3.0 3.0 3.0 3.0
Lane Grp Cap (vph) 198 432 177 399 273 1384 619 311 1460 653
v/s Ratio Prot c0.04 c0.20 0.03 0.19 c0.15 0.33 0.14 c0.40
v/s Ratio Perm 0.16 0.14 0.01 0.05
v/c Ratio 0.66 0.80 0.62 0.82 0.98 0.85 0.03 0.80 0.97 0.11
Uniform Delay, d1 32.6 42.6 34.7 44.0 50.5 33.0 22.2 47.3 34.2 21.4
Progression Factor 1.00 1.00 1.00 1.00 0.66 1.07 1.62 1.00 1.00 1.00
Incremental Delay, d2 7.6 10.3 6.2 12.3 34.1 3.5 0.0 13.9 17.0 0.3
Delay (s) 40.3 53.0 40.9 56.3 67.4 39.0 36.0 61.3 51.2 21.8
Level of Service D D D E E D D E D C
Approach Delay (s) 49.6 52.6 44.0 50.8
Approach LOS D D D D
Intersection Summary
HCM Average Control Delay 48.4 HCM Level of Service D
HCM Volume to Capacity ratio 0.92
Actuated Cycle Length (s) 120.0 Sum of lost time (s) 16.0
Intersection Capacity Utilization 87.1% ICU Level of Service E
Analysis Period (min) 15
c Critical Lane Group

Harmony No Build PM Traffic
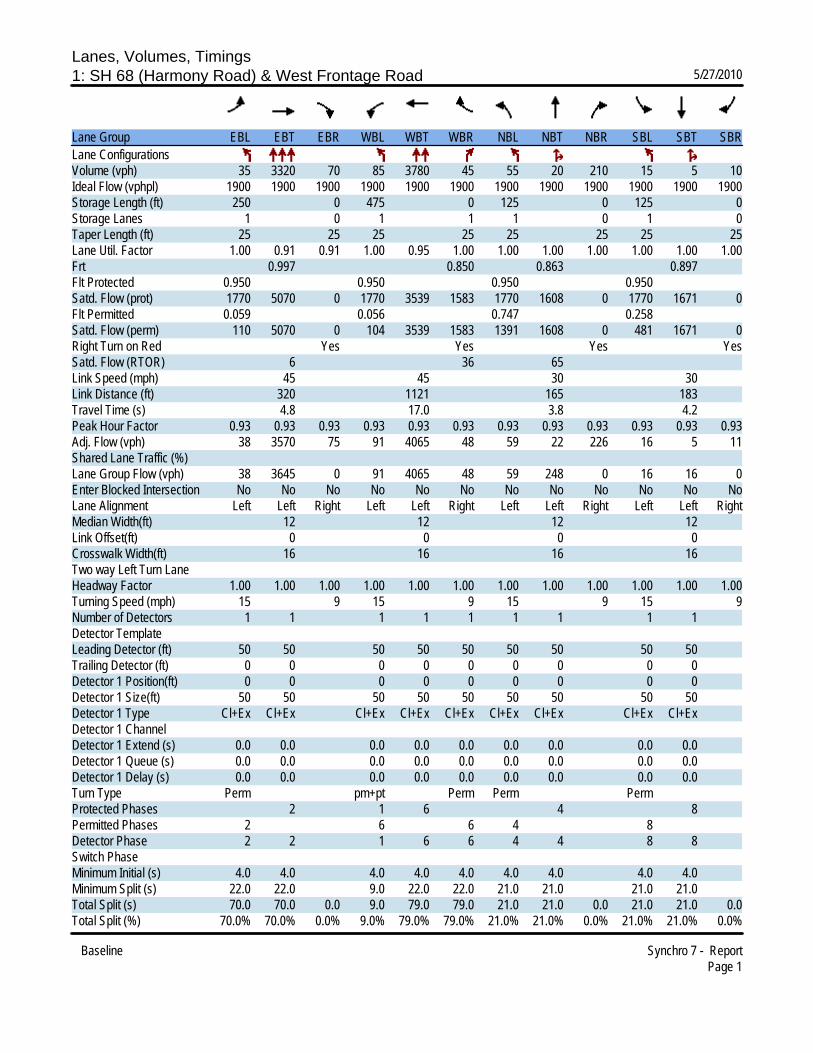
Lanes, Volumes, Timings1: SH 68 (Harmony Road) & West Frontage Road 5/27/2010
Baseline Synchro 7 - ReportPage 1
Lane Group EBL EBT EBR WBL WBT WBR NBL NBT NBR SBL SBT SBRLane ConfigurationsVolume (vph) 35 3320 70 85 3780 45 55 20 210 15 5 10Ideal Flow (vphpl) 1900 1900 1900 1900 1900 1900 1900 1900 1900 1900 1900 1900Storage Length (ft) 250 0 475 0 125 0 125 0Storage Lanes 1 0 1 1 1 0 1 0Taper Length (ft) 25 25 25 25 25 25 25 25Lane Util. Factor 1.00 0.91 0.91 1.00 0.95 1.00 1.00 1.00 1.00 1.00 1.00 1.00Frt 0.997 0.850 0.863 0.897Flt Protected 0.950 0.950 0.950 0.950Satd. Flow (prot) 1770 5070 0 1770 3539 1583 1770 1608 0 1770 1671 0Flt Permitted 0.059 0.056 0.747 0.258Satd. Flow (perm) 110 5070 0 104 3539 1583 1391 1608 0 481 1671 0Right Turn on Red Yes Yes Yes YesSatd. Flow (RTOR) 6 36 65Link Speed (mph) 45 45 30 30Link Distance (ft) 320 1121 165 183Travel Time (s) 4.8 17.0 3.8 4.2Peak Hour Factor 0.93 0.93 0.93 0.93 0.93 0.93 0.93 0.93 0.93 0.93 0.93 0.93Adj. Flow (vph) 38 3570 75 91 4065 48 59 22 226 16 5 11Shared Lane Traffic (%)Lane Group Flow (vph) 38 3645 0 91 4065 48 59 248 0 16 16 0Enter Blocked Intersection No No No No No No No No No No No NoLane Alignment Left Left Right Left Left Right Left Left Right Left Left RightMedian Width(ft) 12 12 12 12Link Offset(ft) 0 0 0 0Crosswalk Width(ft) 16 16 16 16Two way Left Turn LaneHeadway Factor 1.00 1.00 1.00 1.00 1.00 1.00 1.00 1.00 1.00 1.00 1.00 1.00Turning Speed (mph) 15 9 15 9 15 9 15 9Number of Detectors 1 1 1 1 1 1 1 1 1Detector Template Leading Detector (ft) 50 50 50 50 50 50 50 50 50Trailing Detector (ft) 0 0 0 0 0 0 0 0 0Detector 1 Position(ft) 0 0 0 0 0 0 0 0 0Detector 1 Size(ft) 50 50 50 50 50 50 50 50 50Detector 1 Type Cl+Ex Cl+Ex Cl+Ex Cl+Ex Cl+Ex Cl+Ex Cl+Ex Cl+Ex Cl+ExDetector 1 ChannelDetector 1 Extend (s) 0.0 0.0 0.0 0.0 0.0 0.0 0.0 0.0 0.0Detector 1 Queue (s) 0.0 0.0 0.0 0.0 0.0 0.0 0.0 0.0 0.0Detector 1 Delay (s) 0.0 0.0 0.0 0.0 0.0 0.0 0.0 0.0 0.0Turn Type Perm pm+pt Perm Perm PermProtected Phases 2 1 6 4 8Permitted Phases 2 6 6 4 8Detector Phase 2 2 1 6 6 4 4 8 8Switch PhaseMinimum Initial (s) 4.0 4.0 4.0 4.0 4.0 4.0 4.0 4.0 4.0Minimum Split (s) 22.0 22.0 9.0 22.0 22.0 21.0 21.0 21.0 21.0Total Split (s) 70.0 70.0 0.0 9.0 79.0 79.0 21.0 21.0 0.0 21.0 21.0 0.0Total Split (%) 70.0% 70.0% 0.0% 9.0% 79.0% 79.0% 21.0% 21.0% 0.0% 21.0% 21.0% 0.0%
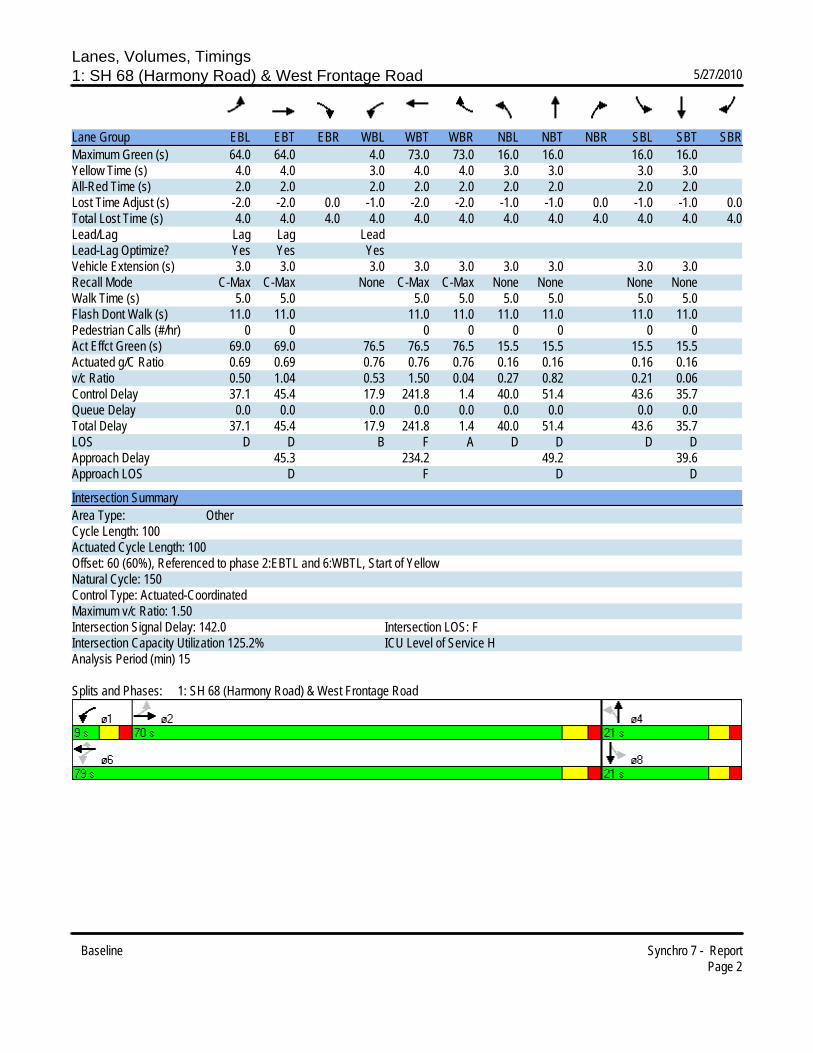
Lanes, Volumes, Timings1: SH 68 (Harmony Road) & West Frontage Road 5/27/2010
Baseline Synchro 7 - ReportPage 2
Lane Group EBL EBT EBR WBL WBT WBR NBL NBT NBR SBL SBT SBRMaximum Green (s) 64.0 64.0 4.0 73.0 73.0 16.0 16.0 16.0 16.0Yellow Time (s) 4.0 4.0 3.0 4.0 4.0 3.0 3.0 3.0 3.0All-Red Time (s) 2.0 2.0 2.0 2.0 2.0 2.0 2.0 2.0 2.0Lost Time Adjust (s) -2.0 -2.0 0.0 -1.0 -2.0 -2.0 -1.0 -1.0 0.0 -1.0 -1.0 0.0Total Lost Time (s) 4.0 4.0 4.0 4.0 4.0 4.0 4.0 4.0 4.0 4.0 4.0 4.0Lead/Lag Lag Lag LeadLead-Lag Optimize? Yes Yes YesVehicle Extension (s) 3.0 3.0 3.0 3.0 3.0 3.0 3.0 3.0 3.0Recall Mode C-Max C-Max None C-Max C-Max None None None NoneWalk Time (s) 5.0 5.0 5.0 5.0 5.0 5.0 5.0 5.0Flash Dont Walk (s) 11.0 11.0 11.0 11.0 11.0 11.0 11.0 11.0Pedestrian Calls (#/hr) 0 0 0 0 0 0 0 0Act Effct Green (s) 69.0 69.0 76.5 76.5 76.5 15.5 15.5 15.5 15.5Actuated g/C Ratio 0.69 0.69 0.76 0.76 0.76 0.16 0.16 0.16 0.16v/c Ratio 0.50 1.04 0.53 1.50 0.04 0.27 0.82 0.21 0.06Control Delay 37.1 45.4 17.9 241.8 1.4 40.0 51.4 43.6 35.7Queue Delay 0.0 0.0 0.0 0.0 0.0 0.0 0.0 0.0 0.0Total Delay 37.1 45.4 17.9 241.8 1.4 40.0 51.4 43.6 35.7LOS D D B F A D D D DApproach Delay 45.3 234.2 49.2 39.6Approach LOS D F D D
Intersection SummaryArea Type: OtherCycle Length: 100Actuated Cycle Length: 100Offset: 60 (60%), Referenced to phase 2:EBTL and 6:WBTL, Start of YellowNatural Cycle: 150Control Type: Actuated-CoordinatedMaximum v/c Ratio: 1.50Intersection Signal Delay: 142.0 Intersection LOS: FIntersection Capacity Utilization 125.2% ICU Level of Service HAnalysis Period (min) 15
Splits and Phases: 1: SH 68 (Harmony Road) & West Frontage Road

Lanes, Volumes, Timings2: SH 68 (Harmony Road) & SB Ramps 5/27/2010
Baseline Synchro 7 - ReportPage 3
Lane Group EBL EBT EBR WBL WBT WBR NBL NBT NBR SBL SBT SBRLane ConfigurationsVolume (vph) 0 2155 1390 320 2805 0 0 0 0 485 0 1105Ideal Flow (vphpl) 1900 1900 1900 1900 1900 1900 1900 1900 1900 1900 1900 1900Storage Length (ft) 0 0 100 0 0 0 100 350Storage Lanes 0 1 1 0 0 0 1 1Taper Length (ft) 25 25 25 25 25 25 25 25Lane Util. Factor 1.00 0.95 1.00 1.00 0.95 1.00 1.00 1.00 1.00 1.00 1.00 1.00Frt 0.850 0.850Flt Protected 0.950 0.950Satd. Flow (prot) 0 3539 1583 1770 3539 0 0 0 0 1770 1863 1583Flt Permitted 0.073 0.950Satd. Flow (perm) 0 3539 1583 136 3539 0 0 0 0 1770 1863 1583Right Turn on Red Yes Yes Yes YesSatd. Flow (RTOR) 470 287Link Speed (mph) 45 45 30 30Link Distance (ft) 1121 572 570 510Travel Time (s) 17.0 8.7 13.0 11.6Peak Hour Factor 0.93 0.93 0.96 0.96 0.93 0.93 0.93 0.93 0.93 0.96 0.96 0.96Adj. Flow (vph) 0 2317 1448 333 3016 0 0 0 0 505 0 1151Shared Lane Traffic (%)Lane Group Flow (vph) 0 2317 1448 333 3016 0 0 0 0 505 0 1151Enter Blocked Intersection No No No No No No No No No No No NoLane Alignment Left Left Right Left Left Right Left Left Right Left Left RightMedian Width(ft) 24 24 12 12Link Offset(ft) 0 0 0 0Crosswalk Width(ft) 16 16 16 16Two way Left Turn LaneHeadway Factor 1.00 1.00 1.00 1.00 1.00 1.00 1.00 1.00 1.00 1.00 1.00 1.00Turning Speed (mph) 15 9 15 9 15 9 15 9Number of Detectors 1 1 1 1 1 1 1Detector Template Leading Detector (ft) 50 50 50 50 50 50 50Trailing Detector (ft) 0 0 0 0 0 0 0Detector 1 Position(ft) 0 0 0 0 0 0 0Detector 1 Size(ft) 50 50 50 50 50 50 50Detector 1 Type Cl+Ex Cl+Ex Cl+Ex Cl+Ex Cl+Ex Cl+Ex Cl+ExDetector 1 ChannelDetector 1 Extend (s) 0.0 0.0 0.0 0.0 0.0 0.0 0.0Detector 1 Queue (s) 0.0 0.0 0.0 0.0 0.0 0.0 0.0Detector 1 Delay (s) 0.0 0.0 0.0 0.0 0.0 0.0 0.0Turn Type Free pm+pt Perm FreeProtected Phases 2 1 2 1 4Permitted Phases Free 2 1 4 FreeDetector Phase 2 1 2 1 4 4Switch PhaseMinimum Initial (s) 4.0 4.0 4.0 4.0Minimum Split (s) 21.0 9.0 22.0 22.0Total Split (s) 0.0 59.0 0.0 13.0 72.0 0.0 0.0 0.0 0.0 28.0 28.0 0.0Total Split (%) 0.0% 59.0% 0.0% 13.0% 72.0% 0.0% 0.0% 0.0% 0.0% 28.0% 28.0% 0.0%

Lanes, Volumes, Timings2: SH 68 (Harmony Road) & SB Ramps 5/27/2010
Baseline Synchro 7 - ReportPage 4
Lane Group EBL EBT EBR WBL WBT WBR NBL NBT NBR SBL SBT SBRMaximum Green (s) 54.0 8.0 22.0 22.0Yellow Time (s) 3.0 3.0 4.0 4.0All-Red Time (s) 2.0 2.0 2.0 2.0Lost Time Adjust (s) 0.0 -1.0 0.0 -1.0 -1.0 0.0 0.0 0.0 0.0 -2.0 -2.0 0.0Total Lost Time (s) 4.0 4.0 4.0 4.0 4.0 4.0 4.0 4.0 4.0 4.0 4.0 4.0Lead/Lag Lead LagLead-Lag Optimize? Yes YesVehicle Extension (s) 3.0 3.0 3.0 3.0Recall Mode C-Max None None NoneWalk Time (s) 5.0 5.0 5.0Flash Dont Walk (s) 11.0 11.0 11.0Pedestrian Calls (#/hr) 0 0 0Act Effct Green (s) 55.0 100.0 64.0 68.0 24.0 100.0Actuated g/C Ratio 0.55 1.00 0.64 0.68 0.24 1.00v/c Ratio 1.19 0.91 1.42 1.25 1.19 0.73Control Delay 110.5 12.2 221.0 132.5 141.4 3.0Queue Delay 3.6 0.0 0.0 27.7 0.0 0.0Total Delay 114.1 12.2 221.0 160.2 141.4 3.0LOS F B F F F AApproach Delay 74.9 166.2Approach LOS E F
Intersection SummaryArea Type: OtherCycle Length: 100Actuated Cycle Length: 100Offset: 42 (42%), Referenced to phase 2:EBWB, Start of YellowNatural Cycle: 150Control Type: Actuated-CoordinatedMaximum v/c Ratio: 1.42Intersection Signal Delay: 104.2 Intersection LOS: FIntersection Capacity Utilization 172.9% ICU Level of Service HAnalysis Period (min) 15
Splits and Phases: 2: SH 68 (Harmony Road) & SB Ramps

Lanes, Volumes, Timings3: SH 68 (Harmony Road) & NB Ramps 5/27/2010
Baseline Synchro 7 - ReportPage 5
Lane Group EBL EBT EBR WBL WBT WBR NBL NBT NBR SBL SBT SBRLane ConfigurationsVolume (vph) 985 1655 0 0 1665 425 1460 0 635 0 0 0Ideal Flow (vphpl) 1900 1900 1900 1900 1900 1900 1900 1900 1900 1900 1900 1900Storage Length (ft) 275 0 0 125 700 160 0 0Storage Lanes 2 0 0 1 1 1 0 0Taper Length (ft) 25 25 25 25 25 25 25 25Lane Util. Factor 0.97 0.95 1.00 1.00 0.95 1.00 0.97 1.00 1.00 1.00 1.00 1.00Frt 0.850 0.850Flt Protected 0.950 0.950Satd. Flow (prot) 3433 3539 0 0 3539 1583 3433 1583 0 0 0 0Flt Permitted 0.950 0.950Satd. Flow (perm) 3433 3539 0 0 3539 1583 3433 1583 0 0 0 0Right Turn on Red Yes Yes Yes YesSatd. Flow (RTOR) 164 21Link Speed (mph) 45 45 30 30Link Distance (ft) 572 598 589 504Travel Time (s) 8.7 9.1 13.4 11.5Peak Hour Factor 0.96 0.93 0.93 0.93 0.93 0.96 0.96 0.96 0.96 0.93 0.93 0.93Adj. Flow (vph) 1026 1780 0 0 1790 443 1521 0 661 0 0 0Shared Lane Traffic (%)Lane Group Flow (vph) 1026 1780 0 0 1790 443 1521 661 0 0 0 0Enter Blocked Intersection No No No No No No No No No No No NoLane Alignment Left Left Right Left Left Right Left Left Right Left Left RightMedian Width(ft) 24 24 24 24Link Offset(ft) 0 0 0 0Crosswalk Width(ft) 16 16 16 16Two way Left Turn LaneHeadway Factor 1.00 1.00 1.00 1.00 1.00 1.00 1.00 1.00 1.00 1.00 1.00 1.00Turning Speed (mph) 15 9 15 9 15 9 15 9Number of Detectors 1 1 1 1 1 1Detector Template Leading Detector (ft) 50 50 50 50 50 50Trailing Detector (ft) 0 0 0 0 0 0Detector 1 Position(ft) 0 0 0 0 0 0Detector 1 Size(ft) 50 50 50 50 50 50Detector 1 Type Cl+Ex Cl+Ex Cl+Ex Cl+Ex Cl+Ex Cl+ExDetector 1 ChannelDetector 1 Extend (s) 0.0 0.0 0.0 0.0 0.0 0.0Detector 1 Queue (s) 0.0 0.0 0.0 0.0 0.0 0.0Detector 1 Delay (s) 0.0 0.0 0.0 0.0 0.0 0.0Turn Type Prot Perm PermProtected Phases 5 5 6 6 8Permitted Phases 6 8Detector Phase 5 5 6 6 6 8 8Switch PhaseMinimum Initial (s) 4.0 4.0 4.0 4.0 4.0Minimum Split (s) 10.0 22.0 22.0 22.0 22.0Total Split (s) 23.0 65.0 0.0 0.0 42.0 42.0 35.0 35.0 0.0 0.0 0.0 0.0Total Split (%) 23.0% 65.0% 0.0% 0.0% 42.0% 42.0% 35.0% 35.0% 0.0% 0.0% 0.0% 0.0%

Lanes, Volumes, Timings3: SH 68 (Harmony Road) & NB Ramps 5/27/2010
Baseline Synchro 7 - ReportPage 6
Lane Group EBL EBT EBR WBL WBT WBR NBL NBT NBR SBL SBT SBRMaximum Green (s) 18.0 36.0 36.0 30.0 30.0Yellow Time (s) 3.0 4.0 4.0 3.0 3.0All-Red Time (s) 2.0 2.0 2.0 2.0 2.0Lost Time Adjust (s) -1.0 -1.0 0.0 0.0 -2.0 -2.0 -1.0 -1.0 0.0 0.0 0.0 0.0Total Lost Time (s) 4.0 4.0 4.0 4.0 4.0 4.0 4.0 4.0 4.0 4.0 4.0 4.0Lead/Lag Lead Lag LagLead-Lag Optimize? Yes Yes YesVehicle Extension (s) 3.0 3.0 3.0 3.0 3.0Recall Mode None C-Max C-Max Min MinWalk Time (s) 5.0 5.0 5.0 5.0Flash Dont Walk (s) 11.0 11.0 11.0 11.0Pedestrian Calls (#/hr) 0 0 0 0Act Effct Green (s) 19.0 61.0 38.0 38.0 31.0 31.0Actuated g/C Ratio 0.19 0.61 0.38 0.38 0.31 0.31v/c Ratio 1.57 0.82 1.33 0.63 1.43 1.31Control Delay 292.4 5.9 182.8 20.0 228.2 183.0Queue Delay 0.0 3.5 33.2 0.0 266.6 0.0Total Delay 292.4 9.3 216.0 20.0 494.9 183.0LOS F A F C F FApproach Delay 112.9 177.2 400.4Approach LOS F F F
Intersection SummaryArea Type: OtherCycle Length: 100Actuated Cycle Length: 100Offset: 45 (45%), Referenced to phase 6:EBWB, Start of YellowNatural Cycle: 150Control Type: Actuated-CoordinatedMaximum v/c Ratio: 1.57Intersection Signal Delay: 219.6 Intersection LOS: FIntersection Capacity Utilization 172.9% ICU Level of Service HAnalysis Period (min) 15
Splits and Phases: 3: SH 68 (Harmony Road) & NB Ramps

Lanes, Volumes, Timings4: SH 68 (Harmony Road) & East Frontage Road 5/27/2010
Baseline Synchro 7 - ReportPage 7
Lane Group EBL EBT EBR WBL WBT WBR NBL NBT NBR SBL SBT SBRLane ConfigurationsVolume (vph) 105 1870 315 95 1685 85 165 20 45 45 15 240Ideal Flow (vphpl) 1900 1900 1900 1900 1900 1900 1900 1900 1900 1900 1900 1900Storage Length (ft) 200 0 150 0 0 0 0 0Storage Lanes 1 1 1 0 0 0 0 0Taper Length (ft) 25 25 25 25 25 25 25 25Lane Util. Factor 1.00 1.00 1.00 1.00 0.95 0.95 1.00 1.00 1.00 1.00 1.00 1.00Frt 0.850 0.993 0.974 0.892Flt Protected 0.950 0.950 0.965 0.993Satd. Flow (prot) 1770 1863 1583 1770 3514 0 0 1751 0 0 1650 0Flt Permitted 0.950 0.950 0.965 0.993Satd. Flow (perm) 1770 1863 1583 1770 3514 0 0 1751 0 0 1650 0Link Speed (mph) 45 45 30 30Link Distance (ft) 598 172 162 226Travel Time (s) 9.1 2.6 3.7 5.1Peak Hour Factor 0.93 0.93 0.93 0.93 0.93 0.93 0.93 0.93 0.93 0.93 0.93 0.93Adj. Flow (vph) 113 2011 339 102 1812 91 177 22 48 48 16 258Shared Lane Traffic (%)Lane Group Flow (vph) 113 2011 339 102 1903 0 0 247 0 0 322 0Enter Blocked Intersection No No No No No No No No No No No NoLane Alignment Left Left Right Left Left Right Left Left Right Left Left RightMedian Width(ft) 12 12 0 0Link Offset(ft) 0 0 0 0Crosswalk Width(ft) 16 16 16 16Two way Left Turn LaneHeadway Factor 1.00 1.00 1.00 1.00 1.00 1.00 1.00 1.00 1.00 1.00 1.00 1.00Turning Speed (mph) 15 9 15 9 15 9 15 9Sign Control Free Free Stop Stop
Intersection SummaryArea Type: OtherControl Type: UnsignalizedIntersection Capacity Utilization 139.4% ICU Level of Service HAnalysis Period (min) 15

Harmony Package A PM Traffic
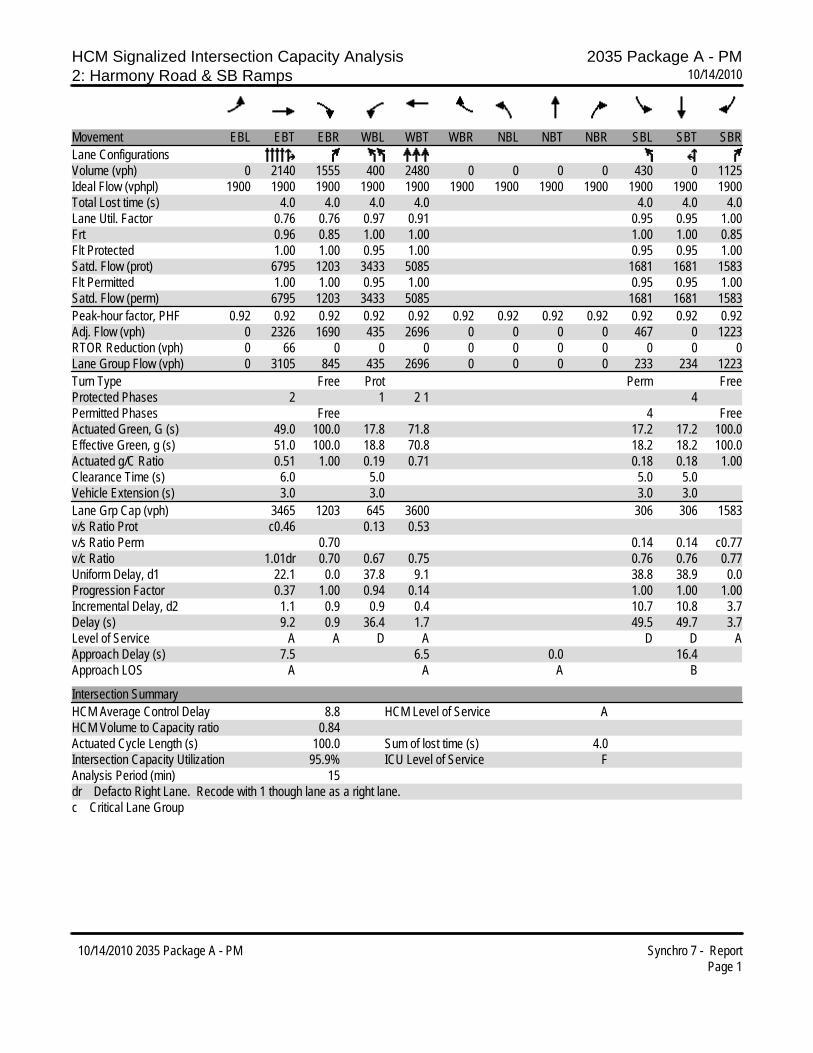
HCM Signalized Intersection Capacity Analysis 2035 Package A - PM2: Harmony Road & SB Ramps 10/14/2010
10/14/2010 2035 Package A - PM Synchro 7 - ReportPage 1
Movement EBL EBT EBR WBL WBT WBR NBL NBT NBR SBL SBT SBRLane ConfigurationsVolume (vph) 0 2140 1555 400 2480 0 0 0 0 430 0 1125Ideal Flow (vphpl) 1900 1900 1900 1900 1900 1900 1900 1900 1900 1900 1900 1900Total Lost time (s) 4.0 4.0 4.0 4.0 4.0 4.0 4.0Lane Util. Factor 0.76 0.76 0.97 0.91 0.95 0.95 1.00Frt 0.96 0.85 1.00 1.00 1.00 1.00 0.85Flt Protected 1.00 1.00 0.95 1.00 0.95 0.95 1.00Satd. Flow (prot) 6795 1203 3433 5085 1681 1681 1583Flt Permitted 1.00 1.00 0.95 1.00 0.95 0.95 1.00Satd. Flow (perm) 6795 1203 3433 5085 1681 1681 1583Peak-hour factor, PHF 0.92 0.92 0.92 0.92 0.92 0.92 0.92 0.92 0.92 0.92 0.92 0.92Adj. Flow (vph) 0 2326 1690 435 2696 0 0 0 0 467 0 1223RTOR Reduction (vph) 0 66 0 0 0 0 0 0 0 0 0 0Lane Group Flow (vph) 0 3105 845 435 2696 0 0 0 0 233 234 1223Turn Type Free Prot Perm FreeProtected Phases 2 1 2 1 4Permitted Phases Free 4 FreeActuated Green, G (s) 49.0 100.0 17.8 71.8 17.2 17.2 100.0Effective Green, g (s) 51.0 100.0 18.8 70.8 18.2 18.2 100.0Actuated g/C Ratio 0.51 1.00 0.19 0.71 0.18 0.18 1.00Clearance Time (s) 6.0 5.0 5.0 5.0Vehicle Extension (s) 3.0 3.0 3.0 3.0Lane Grp Cap (vph) 3465 1203 645 3600 306 306 1583v/s Ratio Prot c0.46 0.13 0.53v/s Ratio Perm 0.70 0.14 0.14 c0.77v/c Ratio 1.01dr 0.70 0.67 0.75 0.76 0.76 0.77Uniform Delay, d1 22.1 0.0 37.8 9.1 38.8 38.9 0.0Progression Factor 0.37 1.00 0.94 0.14 1.00 1.00 1.00Incremental Delay, d2 1.1 0.9 0.9 0.4 10.7 10.8 3.7Delay (s) 9.2 0.9 36.4 1.7 49.5 49.7 3.7Level of Service A A D A D D AApproach Delay (s) 7.5 6.5 0.0 16.4Approach LOS A A A B
Intersection SummaryHCM Average Control Delay 8.8 HCM Level of Service AHCM Volume to Capacity ratio 0.84Actuated Cycle Length (s) 100.0 Sum of lost time (s) 4.0Intersection Capacity Utilization 95.9% ICU Level of Service FAnalysis Period (min) 15dr Defacto Right Lane. Recode with 1 though lane as a right lane.c Critical Lane Group
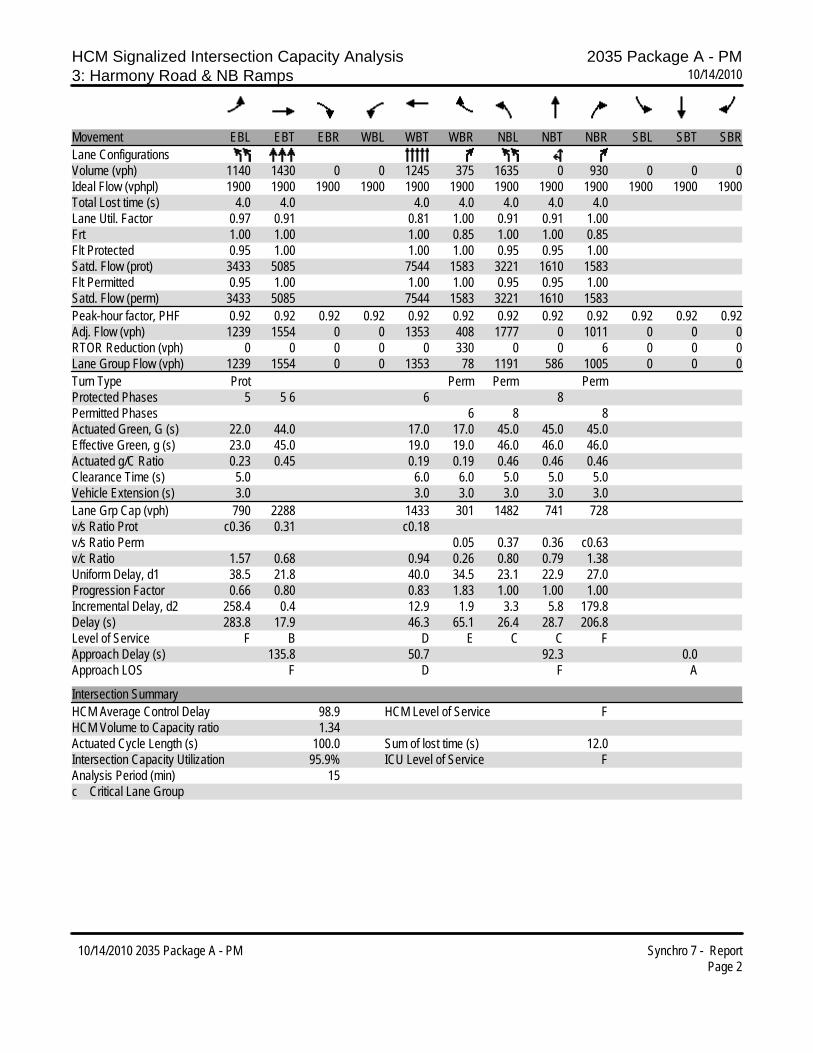
HCM Signalized Intersection Capacity Analysis 2035 Package A - PM3: Harmony Road & NB Ramps 10/14/2010
10/14/2010 2035 Package A - PM Synchro 7 - ReportPage 2
Movement EBL EBT EBR WBL WBT WBR NBL NBT NBR SBL SBT SBRLane ConfigurationsVolume (vph) 1140 1430 0 0 1245 375 1635 0 930 0 0 0Ideal Flow (vphpl) 1900 1900 1900 1900 1900 1900 1900 1900 1900 1900 1900 1900Total Lost time (s) 4.0 4.0 4.0 4.0 4.0 4.0 4.0Lane Util. Factor 0.97 0.91 0.81 1.00 0.91 0.91 1.00Frt 1.00 1.00 1.00 0.85 1.00 1.00 0.85Flt Protected 0.95 1.00 1.00 1.00 0.95 0.95 1.00Satd. Flow (prot) 3433 5085 7544 1583 3221 1610 1583Flt Permitted 0.95 1.00 1.00 1.00 0.95 0.95 1.00Satd. Flow (perm) 3433 5085 7544 1583 3221 1610 1583Peak-hour factor, PHF 0.92 0.92 0.92 0.92 0.92 0.92 0.92 0.92 0.92 0.92 0.92 0.92Adj. Flow (vph) 1239 1554 0 0 1353 408 1777 0 1011 0 0 0RTOR Reduction (vph) 0 0 0 0 0 330 0 0 6 0 0 0Lane Group Flow (vph) 1239 1554 0 0 1353 78 1191 586 1005 0 0 0Turn Type Prot Perm Perm PermProtected Phases 5 5 6 6 8Permitted Phases 6 8 8Actuated Green, G (s) 22.0 44.0 17.0 17.0 45.0 45.0 45.0Effective Green, g (s) 23.0 45.0 19.0 19.0 46.0 46.0 46.0Actuated g/C Ratio 0.23 0.45 0.19 0.19 0.46 0.46 0.46Clearance Time (s) 5.0 6.0 6.0 5.0 5.0 5.0Vehicle Extension (s) 3.0 3.0 3.0 3.0 3.0 3.0Lane Grp Cap (vph) 790 2288 1433 301 1482 741 728v/s Ratio Prot c0.36 0.31 c0.18v/s Ratio Perm 0.05 0.37 0.36 c0.63v/c Ratio 1.57 0.68 0.94 0.26 0.80 0.79 1.38Uniform Delay, d1 38.5 21.8 40.0 34.5 23.1 22.9 27.0Progression Factor 0.66 0.80 0.83 1.83 1.00 1.00 1.00Incremental Delay, d2 258.4 0.4 12.9 1.9 3.3 5.8 179.8Delay (s) 283.8 17.9 46.3 65.1 26.4 28.7 206.8Level of Service F B D E C C FApproach Delay (s) 135.8 50.7 92.3 0.0Approach LOS F D F A
Intersection SummaryHCM Average Control Delay 98.9 HCM Level of Service FHCM Volume to Capacity ratio 1.34Actuated Cycle Length (s) 100.0 Sum of lost time (s) 12.0Intersection Capacity Utilization 95.9% ICU Level of Service FAnalysis Period (min) 15c Critical Lane Group

Harmony Package B PM Traffic

HCM Signalized Intersection Capacity Analysis 2035 Package B - PM Peak2: Harmony Road & SB Ramps 10/14/2010
10/14/2010 2035 Package B - PM Peak Synchro 7 - ReportPage 1
Movement EBL EBT EBR WBL WBT WBR NBL NBT NBR SBL SBT SBRLane ConfigurationsVolume (vph) 0 2210 1390 480 2215 0 0 0 0 460 0 975Ideal Flow (vphpl) 1900 1900 1900 1900 1900 1900 1900 1900 1900 1900 1900 1900Total Lost time (s) 4.0 4.0 4.0 4.0 4.0 4.0 4.0Lane Util. Factor 0.76 0.76 0.97 0.91 0.95 0.95 1.00Frt 0.96 0.85 1.00 1.00 1.00 1.00 0.85Flt Protected 1.00 1.00 0.95 1.00 0.95 0.95 1.00Satd. Flow (prot) 6824 1203 3433 5085 1681 1681 1583Flt Permitted 1.00 1.00 0.95 1.00 0.95 0.95 1.00Satd. Flow (perm) 6824 1203 3433 5085 1681 1681 1583Peak-hour factor, PHF 0.92 0.92 0.92 0.92 0.92 0.92 0.92 0.92 0.92 0.92 0.92 0.92Adj. Flow (vph) 0 2402 1511 522 2408 0 0 0 0 500 0 1060RTOR Reduction (vph) 0 57 0 0 0 0 0 0 0 0 0 0Lane Group Flow (vph) 0 3101 755 522 2408 0 0 0 0 250 250 1060Turn Type Free Prot Perm FreeProtected Phases 2 1 2 1 4Permitted Phases Free 4 FreeActuated Green, G (s) 49.0 100.0 17.9 71.9 17.1 17.1 100.0Effective Green, g (s) 51.0 100.0 18.9 70.9 18.1 18.1 100.0Actuated g/C Ratio 0.51 1.00 0.19 0.71 0.18 0.18 1.00Clearance Time (s) 6.0 5.0 5.0 5.0Vehicle Extension (s) 3.0 3.0 3.0 3.0Lane Grp Cap (vph) 3480 1203 649 3605 304 304 1583v/s Ratio Prot c0.45 0.15 0.47v/s Ratio Perm 0.63 c0.15 0.15 c0.67v/c Ratio 0.92dr 0.63 0.80 0.67 0.82 0.82 0.67Uniform Delay, d1 22.0 0.0 38.8 8.0 39.4 39.4 0.0Progression Factor 0.38 1.00 0.89 0.18 1.00 1.00 1.00Incremental Delay, d2 1.2 0.7 3.1 0.3 16.2 16.2 2.3Delay (s) 9.5 0.7 37.4 1.8 55.6 55.6 2.3Level of Service A A D A E E AApproach Delay (s) 7.8 8.1 0.0 19.4Approach LOS A A A B
Intersection SummaryHCM Average Control Delay 10.1 HCM Level of Service BHCM Volume to Capacity ratio 0.82Actuated Cycle Length (s) 100.0 Sum of lost time (s) 8.0Intersection Capacity Utilization 102.6% ICU Level of Service GAnalysis Period (min) 15dr Defacto Right Lane. Recode with 1 though lane as a right lane.c Critical Lane Group
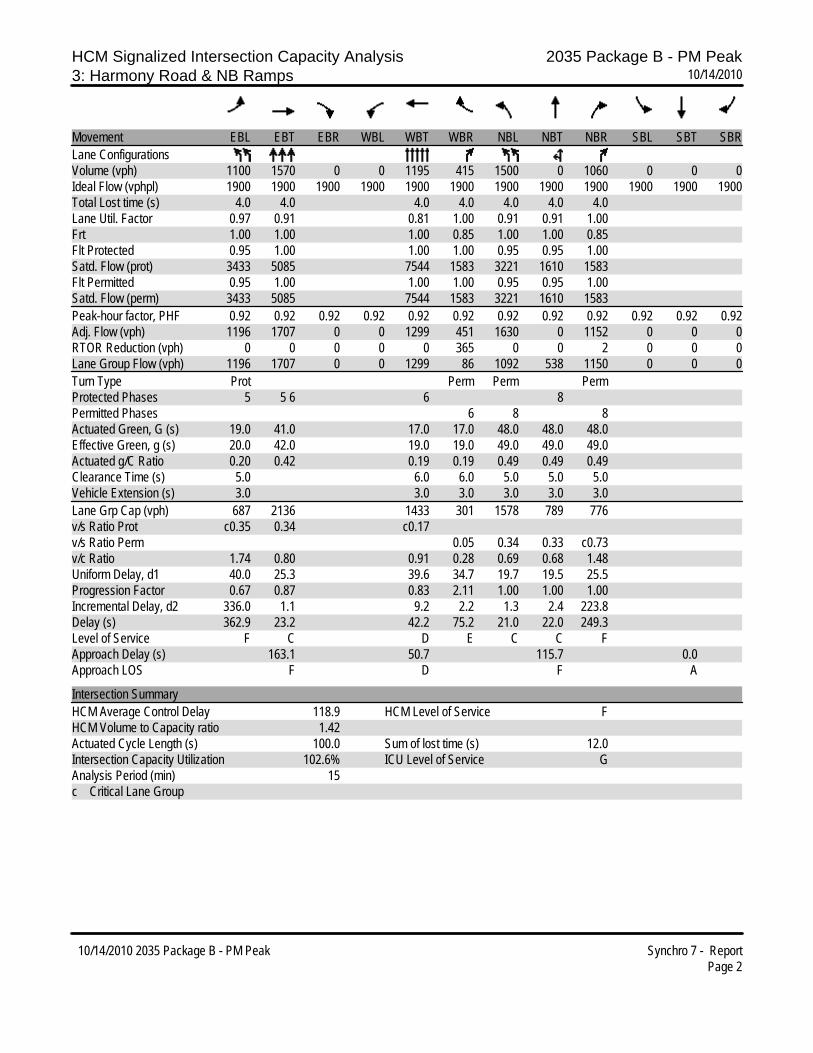
HCM Signalized Intersection Capacity Analysis 2035 Package B - PM Peak3: Harmony Road & NB Ramps 10/14/2010
10/14/2010 2035 Package B - PM Peak Synchro 7 - ReportPage 2
Movement EBL EBT EBR WBL WBT WBR NBL NBT NBR SBL SBT SBRLane ConfigurationsVolume (vph) 1100 1570 0 0 1195 415 1500 0 1060 0 0 0Ideal Flow (vphpl) 1900 1900 1900 1900 1900 1900 1900 1900 1900 1900 1900 1900Total Lost time (s) 4.0 4.0 4.0 4.0 4.0 4.0 4.0Lane Util. Factor 0.97 0.91 0.81 1.00 0.91 0.91 1.00Frt 1.00 1.00 1.00 0.85 1.00 1.00 0.85Flt Protected 0.95 1.00 1.00 1.00 0.95 0.95 1.00Satd. Flow (prot) 3433 5085 7544 1583 3221 1610 1583Flt Permitted 0.95 1.00 1.00 1.00 0.95 0.95 1.00Satd. Flow (perm) 3433 5085 7544 1583 3221 1610 1583Peak-hour factor, PHF 0.92 0.92 0.92 0.92 0.92 0.92 0.92 0.92 0.92 0.92 0.92 0.92Adj. Flow (vph) 1196 1707 0 0 1299 451 1630 0 1152 0 0 0RTOR Reduction (vph) 0 0 0 0 0 365 0 0 2 0 0 0Lane Group Flow (vph) 1196 1707 0 0 1299 86 1092 538 1150 0 0 0Turn Type Prot Perm Perm PermProtected Phases 5 5 6 6 8Permitted Phases 6 8 8Actuated Green, G (s) 19.0 41.0 17.0 17.0 48.0 48.0 48.0Effective Green, g (s) 20.0 42.0 19.0 19.0 49.0 49.0 49.0Actuated g/C Ratio 0.20 0.42 0.19 0.19 0.49 0.49 0.49Clearance Time (s) 5.0 6.0 6.0 5.0 5.0 5.0Vehicle Extension (s) 3.0 3.0 3.0 3.0 3.0 3.0Lane Grp Cap (vph) 687 2136 1433 301 1578 789 776v/s Ratio Prot c0.35 0.34 c0.17v/s Ratio Perm 0.05 0.34 0.33 c0.73v/c Ratio 1.74 0.80 0.91 0.28 0.69 0.68 1.48Uniform Delay, d1 40.0 25.3 39.6 34.7 19.7 19.5 25.5Progression Factor 0.67 0.87 0.83 2.11 1.00 1.00 1.00Incremental Delay, d2 336.0 1.1 9.2 2.2 1.3 2.4 223.8Delay (s) 362.9 23.2 42.2 75.2 21.0 22.0 249.3Level of Service F C D E C C FApproach Delay (s) 163.1 50.7 115.7 0.0Approach LOS F D F A
Intersection SummaryHCM Average Control Delay 118.9 HCM Level of Service FHCM Volume to Capacity ratio 1.42Actuated Cycle Length (s) 100.0 Sum of lost time (s) 12.0Intersection Capacity Utilization 102.6% ICU Level of Service GAnalysis Period (min) 15c Critical Lane Group
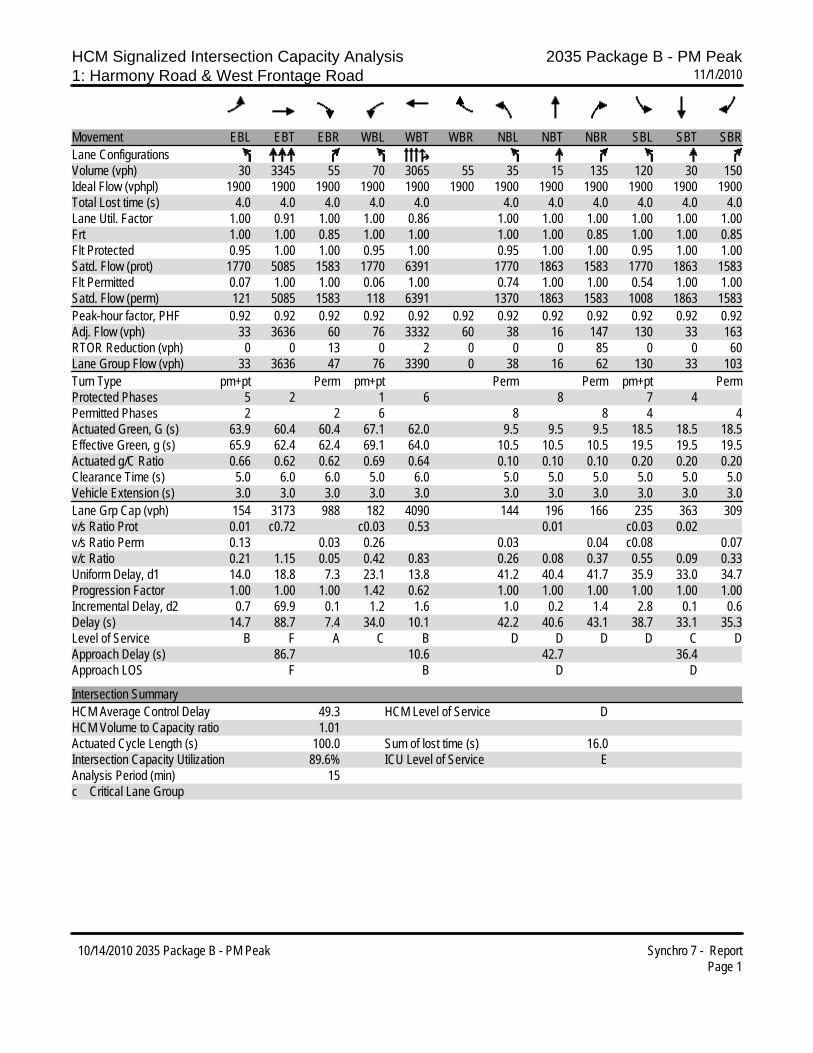
HCM Signalized Intersection Capacity Analysis 2035 Package B - PM Peak1: Harmony Road & West Frontage Road 11/1/2010
10/14/2010 2035 Package B - PM Peak Synchro 7 - ReportPage 1
Movement EBL EBT EBR WBL WBT WBR NBL NBT NBR SBL SBT SBRLane ConfigurationsVolume (vph) 30 3345 55 70 3065 55 35 15 135 120 30 150Ideal Flow (vphpl) 1900 1900 1900 1900 1900 1900 1900 1900 1900 1900 1900 1900Total Lost time (s) 4.0 4.0 4.0 4.0 4.0 4.0 4.0 4.0 4.0 4.0 4.0Lane Util. Factor 1.00 0.91 1.00 1.00 0.86 1.00 1.00 1.00 1.00 1.00 1.00Frt 1.00 1.00 0.85 1.00 1.00 1.00 1.00 0.85 1.00 1.00 0.85Flt Protected 0.95 1.00 1.00 0.95 1.00 0.95 1.00 1.00 0.95 1.00 1.00Satd. Flow (prot) 1770 5085 1583 1770 6391 1770 1863 1583 1770 1863 1583Flt Permitted 0.07 1.00 1.00 0.06 1.00 0.74 1.00 1.00 0.54 1.00 1.00Satd. Flow (perm) 121 5085 1583 118 6391 1370 1863 1583 1008 1863 1583Peak-hour factor, PHF 0.92 0.92 0.92 0.92 0.92 0.92 0.92 0.92 0.92 0.92 0.92 0.92Adj. Flow (vph) 33 3636 60 76 3332 60 38 16 147 130 33 163RTOR Reduction (vph) 0 0 13 0 2 0 0 0 85 0 0 60Lane Group Flow (vph) 33 3636 47 76 3390 0 38 16 62 130 33 103Turn Type pm+pt Perm pm+pt Perm Perm pm+pt PermProtected Phases 5 2 1 6 8 7 4Permitted Phases 2 2 6 8 8 4 4Actuated Green, G (s) 63.9 60.4 60.4 67.1 62.0 9.5 9.5 9.5 18.5 18.5 18.5Effective Green, g (s) 65.9 62.4 62.4 69.1 64.0 10.5 10.5 10.5 19.5 19.5 19.5Actuated g/C Ratio 0.66 0.62 0.62 0.69 0.64 0.10 0.10 0.10 0.20 0.20 0.20Clearance Time (s) 5.0 6.0 6.0 5.0 6.0 5.0 5.0 5.0 5.0 5.0 5.0Vehicle Extension (s) 3.0 3.0 3.0 3.0 3.0 3.0 3.0 3.0 3.0 3.0 3.0Lane Grp Cap (vph) 154 3173 988 182 4090 144 196 166 235 363 309v/s Ratio Prot 0.01 c0.72 c0.03 0.53 0.01 c0.03 0.02v/s Ratio Perm 0.13 0.03 0.26 0.03 0.04 c0.08 0.07v/c Ratio 0.21 1.15 0.05 0.42 0.83 0.26 0.08 0.37 0.55 0.09 0.33Uniform Delay, d1 14.0 18.8 7.3 23.1 13.8 41.2 40.4 41.7 35.9 33.0 34.7Progression Factor 1.00 1.00 1.00 1.42 0.62 1.00 1.00 1.00 1.00 1.00 1.00Incremental Delay, d2 0.7 69.9 0.1 1.2 1.6 1.0 0.2 1.4 2.8 0.1 0.6Delay (s) 14.7 88.7 7.4 34.0 10.1 42.2 40.6 43.1 38.7 33.1 35.3Level of Service B F A C B D D D D C DApproach Delay (s) 86.7 10.6 42.7 36.4Approach LOS F B D D
Intersection SummaryHCM Average Control Delay 49.3 HCM Level of Service DHCM Volume to Capacity ratio 1.01Actuated Cycle Length (s) 100.0 Sum of lost time (s) 16.0Intersection Capacity Utilization 89.6% ICU Level of Service EAnalysis Period (min) 15c Critical Lane Group

Harmony Preferred Alternative PM Traffic
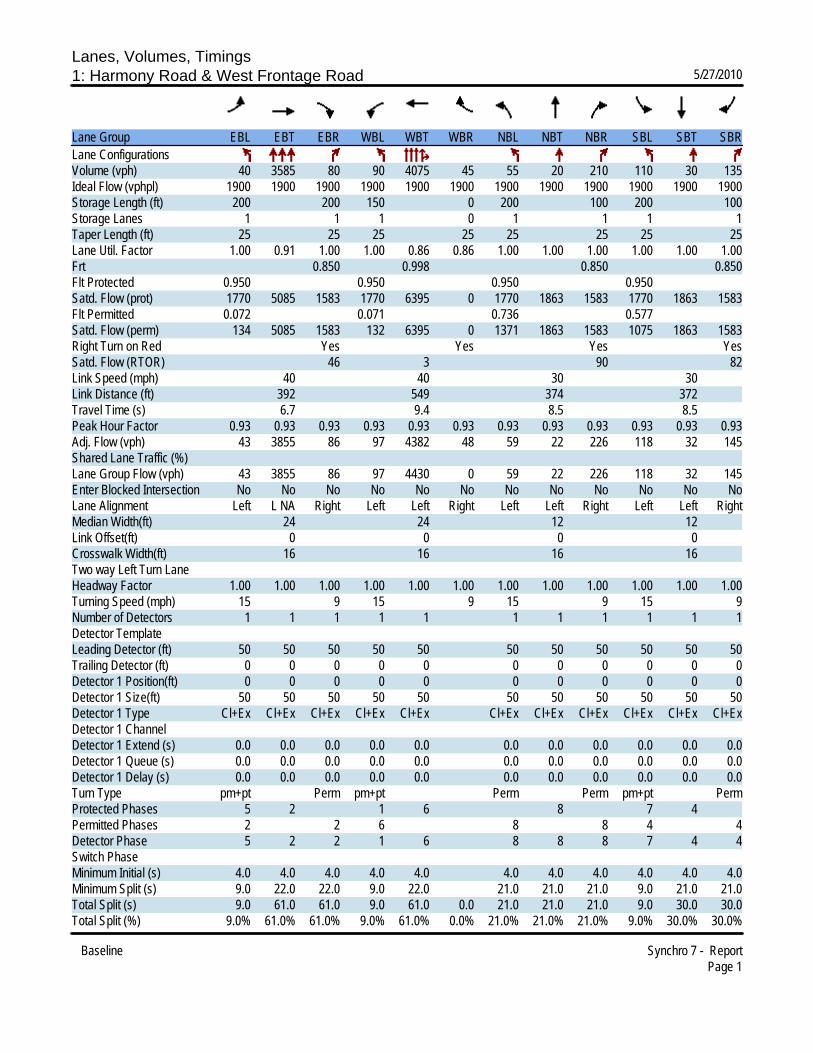
Lanes, Volumes, Timings1: Harmony Road & West Frontage Road 5/27/2010
Baseline Synchro 7 - ReportPage 1
Lane Group EBL EBT EBR WBL WBT WBR NBL NBT NBR SBL SBT SBRLane ConfigurationsVolume (vph) 40 3585 80 90 4075 45 55 20 210 110 30 135Ideal Flow (vphpl) 1900 1900 1900 1900 1900 1900 1900 1900 1900 1900 1900 1900Storage Length (ft) 200 200 150 0 200 100 200 100Storage Lanes 1 1 1 0 1 1 1 1Taper Length (ft) 25 25 25 25 25 25 25 25Lane Util. Factor 1.00 0.91 1.00 1.00 0.86 0.86 1.00 1.00 1.00 1.00 1.00 1.00Frt 0.850 0.998 0.850 0.850Flt Protected 0.950 0.950 0.950 0.950Satd. Flow (prot) 1770 5085 1583 1770 6395 0 1770 1863 1583 1770 1863 1583Flt Permitted 0.072 0.071 0.736 0.577Satd. Flow (perm) 134 5085 1583 132 6395 0 1371 1863 1583 1075 1863 1583Right Turn on Red Yes Yes Yes YesSatd. Flow (RTOR) 46 3 90 82Link Speed (mph) 40 40 30 30Link Distance (ft) 392 549 374 372Travel Time (s) 6.7 9.4 8.5 8.5Peak Hour Factor 0.93 0.93 0.93 0.93 0.93 0.93 0.93 0.93 0.93 0.93 0.93 0.93Adj. Flow (vph) 43 3855 86 97 4382 48 59 22 226 118 32 145Shared Lane Traffic (%)Lane Group Flow (vph) 43 3855 86 97 4430 0 59 22 226 118 32 145Enter Blocked Intersection No No No No No No No No No No No NoLane Alignment Left L NA Right Left Left Right Left Left Right Left Left RightMedian Width(ft) 24 24 12 12Link Offset(ft) 0 0 0 0Crosswalk Width(ft) 16 16 16 16Two way Left Turn LaneHeadway Factor 1.00 1.00 1.00 1.00 1.00 1.00 1.00 1.00 1.00 1.00 1.00 1.00Turning Speed (mph) 15 9 15 9 15 9 15 9Number of Detectors 1 1 1 1 1 1 1 1 1 1 1Detector Template Leading Detector (ft) 50 50 50 50 50 50 50 50 50 50 50Trailing Detector (ft) 0 0 0 0 0 0 0 0 0 0 0Detector 1 Position(ft) 0 0 0 0 0 0 0 0 0 0 0Detector 1 Size(ft) 50 50 50 50 50 50 50 50 50 50 50Detector 1 Type Cl+Ex Cl+Ex Cl+Ex Cl+Ex Cl+Ex Cl+Ex Cl+Ex Cl+Ex Cl+Ex Cl+Ex Cl+ExDetector 1 ChannelDetector 1 Extend (s) 0.0 0.0 0.0 0.0 0.0 0.0 0.0 0.0 0.0 0.0 0.0Detector 1 Queue (s) 0.0 0.0 0.0 0.0 0.0 0.0 0.0 0.0 0.0 0.0 0.0Detector 1 Delay (s) 0.0 0.0 0.0 0.0 0.0 0.0 0.0 0.0 0.0 0.0 0.0Turn Type pm+pt Perm pm+pt Perm Perm pm+pt PermProtected Phases 5 2 1 6 8 7 4Permitted Phases 2 2 6 8 8 4 4Detector Phase 5 2 2 1 6 8 8 8 7 4 4Switch PhaseMinimum Initial (s) 4.0 4.0 4.0 4.0 4.0 4.0 4.0 4.0 4.0 4.0 4.0Minimum Split (s) 9.0 22.0 22.0 9.0 22.0 21.0 21.0 21.0 9.0 21.0 21.0Total Split (s) 9.0 61.0 61.0 9.0 61.0 0.0 21.0 21.0 21.0 9.0 30.0 30.0Total Split (%) 9.0% 61.0% 61.0% 9.0% 61.0% 0.0% 21.0% 21.0% 21.0% 9.0% 30.0% 30.0%

Lanes, Volumes, Timings1: Harmony Road & West Frontage Road 5/27/2010
Baseline Synchro 7 - ReportPage 2
Lane Group EBL EBT EBR WBL WBT WBR NBL NBT NBR SBL SBT SBRMaximum Green (s) 4.0 55.0 55.0 4.0 55.0 16.0 16.0 16.0 4.0 25.0 25.0Yellow Time (s) 3.0 4.0 4.0 3.0 4.0 3.0 3.0 3.0 3.0 3.0 3.0All-Red Time (s) 2.0 2.0 2.0 2.0 2.0 2.0 2.0 2.0 2.0 2.0 2.0Lost Time Adjust (s) -1.0 -2.0 -2.0 -1.0 -2.0 0.0 -1.0 -1.0 -1.0 -1.0 -1.0 -1.0Total Lost Time (s) 4.0 4.0 4.0 4.0 4.0 4.0 4.0 4.0 4.0 4.0 4.0 4.0Lead/Lag Lead Lead Lead Lag Lag Lag Lag Lag LeadLead-Lag Optimize? Yes Yes Yes Yes Yes Yes Yes Yes YesVehicle Extension (s) 3.0 3.0 3.0 3.0 3.0 3.0 3.0 3.0 3.0 3.0 3.0Recall Mode None C-Max C-Max None C-Max None None None None None NoneWalk Time (s) 5.0 5.0 5.0 5.0 5.0 5.0 5.0 5.0Flash Dont Walk (s) 11.0 11.0 11.0 11.0 11.0 11.0 11.0 11.0Pedestrian Calls (#/hr) 0 0 0 0 0 0 0 0Act Effct Green (s) 61.9 61.9 61.9 63.4 63.4 13.9 13.9 13.9 22.9 22.9 22.9Actuated g/C Ratio 0.62 0.62 0.62 0.63 0.63 0.14 0.14 0.14 0.23 0.23 0.23v/c Ratio 0.24 1.22 0.09 0.59 1.09 0.31 0.08 0.76 0.42 0.08 0.34Control Delay 12.3 125.9 5.3 27.7 57.7 41.7 36.4 41.0 35.9 29.1 16.5Queue Delay 0.0 0.0 0.0 0.0 0.2 0.0 0.0 0.0 0.0 0.0 0.0Total Delay 12.3 125.9 5.3 27.7 57.9 41.7 36.4 41.0 35.9 29.1 16.5LOS B F A C E D D D D C BApproach Delay 122.1 57.3 40.8 25.6Approach LOS F E D C
Intersection SummaryArea Type: OtherCycle Length: 100Actuated Cycle Length: 100Offset: 13 (13%), Referenced to phase 2:EBTL and 6:WBTL, Start of YellowNatural Cycle: 150Control Type: Actuated-CoordinatedMaximum v/c Ratio: 1.22Intersection Signal Delay: 84.0 Intersection LOS: FIntersection Capacity Utilization 98.4% ICU Level of Service FAnalysis Period (min) 15
Splits and Phases: 1: Harmony Road & West Frontage Road
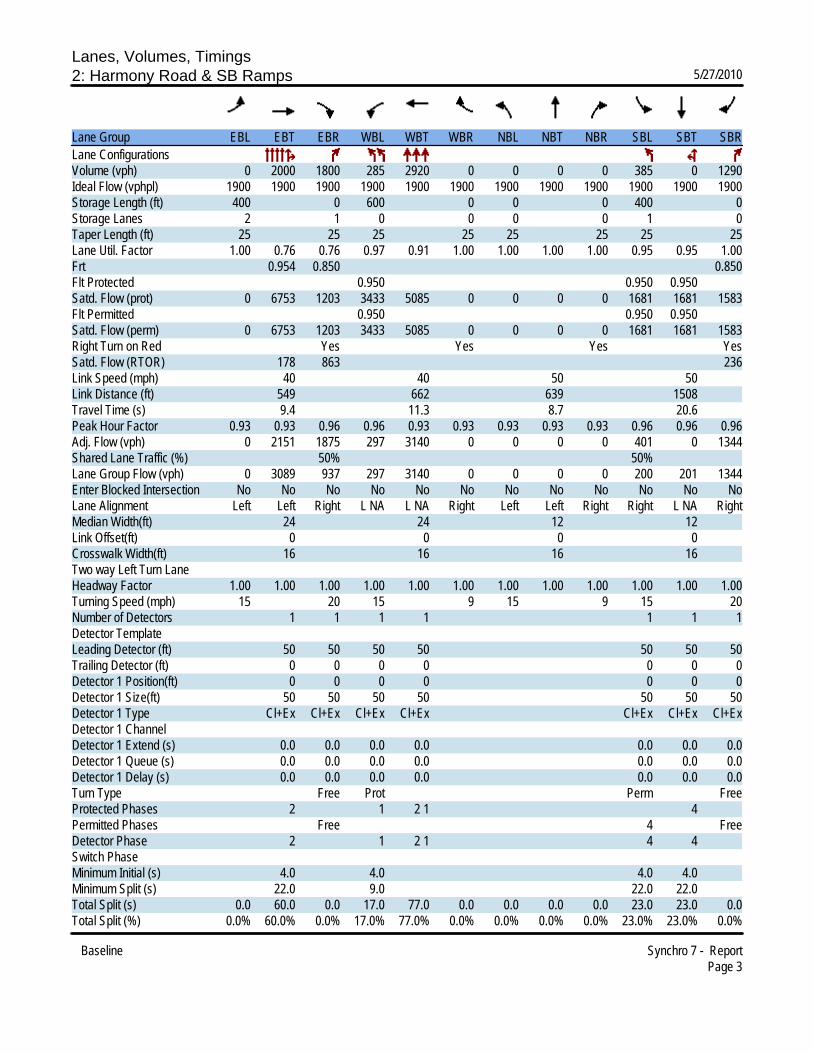
Lanes, Volumes, Timings2: Harmony Road & SB Ramps 5/27/2010
Baseline Synchro 7 - ReportPage 3
Lane Group EBL EBT EBR WBL WBT WBR NBL NBT NBR SBL SBT SBRLane ConfigurationsVolume (vph) 0 2000 1800 285 2920 0 0 0 0 385 0 1290Ideal Flow (vphpl) 1900 1900 1900 1900 1900 1900 1900 1900 1900 1900 1900 1900Storage Length (ft) 400 0 600 0 0 0 400 0Storage Lanes 2 1 0 0 0 0 1 0Taper Length (ft) 25 25 25 25 25 25 25 25Lane Util. Factor 1.00 0.76 0.76 0.97 0.91 1.00 1.00 1.00 1.00 0.95 0.95 1.00Frt 0.954 0.850 0.850Flt Protected 0.950 0.950 0.950Satd. Flow (prot) 0 6753 1203 3433 5085 0 0 0 0 1681 1681 1583Flt Permitted 0.950 0.950 0.950Satd. Flow (perm) 0 6753 1203 3433 5085 0 0 0 0 1681 1681 1583Right Turn on Red Yes Yes Yes YesSatd. Flow (RTOR) 178 863 236Link Speed (mph) 40 40 50 50Link Distance (ft) 549 662 639 1508Travel Time (s) 9.4 11.3 8.7 20.6Peak Hour Factor 0.93 0.93 0.96 0.96 0.93 0.93 0.93 0.93 0.93 0.96 0.96 0.96Adj. Flow (vph) 0 2151 1875 297 3140 0 0 0 0 401 0 1344Shared Lane Traffic (%) 50% 50%Lane Group Flow (vph) 0 3089 937 297 3140 0 0 0 0 200 201 1344Enter Blocked Intersection No No No No No No No No No No No NoLane Alignment Left Left Right L NA L NA Right Left Left Right Right L NA RightMedian Width(ft) 24 24 12 12Link Offset(ft) 0 0 0 0Crosswalk Width(ft) 16 16 16 16Two way Left Turn LaneHeadway Factor 1.00 1.00 1.00 1.00 1.00 1.00 1.00 1.00 1.00 1.00 1.00 1.00Turning Speed (mph) 15 20 15 9 15 9 15 20Number of Detectors 1 1 1 1 1 1 1Detector Template Leading Detector (ft) 50 50 50 50 50 50 50Trailing Detector (ft) 0 0 0 0 0 0 0Detector 1 Position(ft) 0 0 0 0 0 0 0Detector 1 Size(ft) 50 50 50 50 50 50 50Detector 1 Type Cl+Ex Cl+Ex Cl+Ex Cl+Ex Cl+Ex Cl+Ex Cl+ExDetector 1 ChannelDetector 1 Extend (s) 0.0 0.0 0.0 0.0 0.0 0.0 0.0Detector 1 Queue (s) 0.0 0.0 0.0 0.0 0.0 0.0 0.0Detector 1 Delay (s) 0.0 0.0 0.0 0.0 0.0 0.0 0.0Turn Type Free Prot Perm FreeProtected Phases 2 1 2 1 4Permitted Phases Free 4 FreeDetector Phase 2 1 2 1 4 4Switch PhaseMinimum Initial (s) 4.0 4.0 4.0 4.0Minimum Split (s) 22.0 9.0 22.0 22.0Total Split (s) 0.0 60.0 0.0 17.0 77.0 0.0 0.0 0.0 0.0 23.0 23.0 0.0Total Split (%) 0.0% 60.0% 0.0% 17.0% 77.0% 0.0% 0.0% 0.0% 0.0% 23.0% 23.0% 0.0%

Lanes, Volumes, Timings2: Harmony Road & SB Ramps 5/27/2010
Baseline Synchro 7 - ReportPage 4
Lane Group EBL EBT EBR WBL WBT WBR NBL NBT NBR SBL SBT SBRMaximum Green (s) 54.0 12.0 18.0 18.0Yellow Time (s) 4.0 3.0 3.0 3.0All-Red Time (s) 2.0 2.0 2.0 2.0Lost Time Adjust (s) 0.0 -2.0 0.0 -1.0 -2.0 0.0 0.0 0.0 0.0 -1.0 -1.0 0.0Total Lost Time (s) 4.0 4.0 4.0 4.0 4.0 4.0 4.0 4.0 4.0 4.0 4.0 4.0Lead/Lag Lag LeadLead-Lag Optimize? Yes YesVehicle Extension (s) 3.0 3.0 3.0 3.0Recall Mode C-Max None None NoneWalk Time (s) 5.0 5.0 5.0Flash Dont Walk (s) 11.0 11.0 11.0Pedestrian Calls (#/hr) 0 0 0Act Effct Green (s) 56.0 100.0 15.3 75.3 16.7 16.7 100.0Actuated g/C Ratio 0.56 1.00 0.15 0.75 0.17 0.17 1.00v/c Ratio 1.02dr 0.78 0.56 0.82 0.71 0.72 0.85Control Delay 3.0 8.5 29.8 1.7 53.7 53.9 6.3Queue Delay 0.3 0.0 0.0 1.8 0.0 0.0 0.0Total Delay 3.4 8.5 29.8 3.5 53.7 53.9 6.3LOS A A C A D D AApproach Delay 4.6 5.8 17.2Approach LOS A A B
Intersection SummaryArea Type: OtherCycle Length: 100Actuated Cycle Length: 100Offset: 22 (22%), Referenced to phase 2:EBWB, Start of YellowNatural Cycle: 75Control Type: Actuated-CoordinatedMaximum v/c Ratio: 0.85Intersection Signal Delay: 7.4 Intersection LOS: AIntersection Capacity Utilization 101.4% ICU Level of Service GAnalysis Period (min) 15dr Defacto Right Lane. Recode with 1 though lane as a right lane.
Splits and Phases: 2: Harmony Road & SB Ramps

Lanes, Volumes, Timings3: Harmony Road & NB Ramps 5/27/2010
Baseline Synchro 7 - ReportPage 5
Lane Group EBL EBT EBR WBL WBT WBR NBL NBT NBR SBL SBT SBRLane ConfigurationsVolume (vph) 1165 1220 0 0 1120 350 2085 0 620 0 0 0Ideal Flow (vphpl) 1900 1900 1900 1900 1900 1900 1900 1900 1900 1900 1900 1900Storage Length (ft) 600 0 200 0 650 400 0 0Storage Lanes 0 0 2 1 1 1 0 0Taper Length (ft) 25 25 25 25 25 25 25 25Lane Util. Factor 0.97 0.91 1.00 1.00 0.81 1.00 0.91 0.91 1.00 1.00 1.00 1.00Frt 0.850 0.850Flt Protected 0.950 0.950 0.950Satd. Flow (prot) 3433 5085 0 0 7544 1583 3221 1610 1583 0 0 0Flt Permitted 0.950 0.950 0.950Satd. Flow (perm) 3433 5085 0 0 7544 1583 3221 1610 1583 0 0 0Right Turn on Red Yes Yes Yes YesSatd. Flow (RTOR) 365 34Link Speed (mph) 40 40 50 50Link Distance (ft) 662 903 988 1510Travel Time (s) 11.3 15.4 13.5 20.6Peak Hour Factor 0.96 0.93 0.93 0.93 0.93 0.96 0.96 0.96 0.96 0.93 0.93 0.93Adj. Flow (vph) 1214 1312 0 0 1204 365 2172 0 646 0 0 0Shared Lane Traffic (%) 33%Lane Group Flow (vph) 1214 1312 0 0 1204 365 1455 717 646 0 0 0Enter Blocked Intersection No No No No No No No No No No No NoLane Alignment Left Left Right Left Left Right Right L NA Right Left Left RightMedian Width(ft) 24 24 24 24Link Offset(ft) 0 0 0 0Crosswalk Width(ft) 16 16 16 16Two way Left Turn LaneHeadway Factor 1.00 1.00 1.00 1.00 1.00 1.00 1.00 1.00 1.00 1.00 1.00 1.00Turning Speed (mph) 15 9 15 9 15 9 15 9Number of Detectors 1 1 1 1 1 1 1Detector Template Leading Detector (ft) 50 50 50 50 50 50 50Trailing Detector (ft) 0 0 0 0 0 0 0Detector 1 Position(ft) 0 0 0 0 0 0 0Detector 1 Size(ft) 50 50 50 50 50 50 50Detector 1 Type Cl+Ex Cl+Ex Cl+Ex Cl+Ex Cl+Ex Cl+Ex Cl+ExDetector 1 ChannelDetector 1 Extend (s) 0.0 0.0 0.0 0.0 0.0 0.0 0.0Detector 1 Queue (s) 0.0 0.0 0.0 0.0 0.0 0.0 0.0Detector 1 Delay (s) 0.0 0.0 0.0 0.0 0.0 0.0 0.0Turn Type Prot Perm Perm PermProtected Phases 5 5 6 6 8Permitted Phases 6 8 8Detector Phase 5 5 6 6 6 8 8 8Switch PhaseMinimum Initial (s) 4.0 4.0 4.0 4.0 4.0 4.0Minimum Split (s) 9.0 22.0 22.0 31.0 31.0 31.0Total Split (s) 34.0 55.0 0.0 0.0 21.0 21.0 45.0 45.0 45.0 0.0 0.0 0.0Total Split (%) 34.0% 55.0% 0.0% 0.0% 21.0% 21.0% 45.0% 45.0% 45.0% 0.0% 0.0% 0.0%

Lanes, Volumes, Timings3: Harmony Road & NB Ramps 5/27/2010
Baseline Synchro 7 - ReportPage 6
Lane Group EBL EBT EBR WBL WBT WBR NBL NBT NBR SBL SBT SBRMaximum Green (s) 29.0 15.0 15.0 40.0 40.0 40.0Yellow Time (s) 3.0 4.0 4.0 3.0 3.0 3.0All-Red Time (s) 2.0 2.0 2.0 2.0 2.0 2.0Lost Time Adjust (s) -1.0 -1.0 0.0 0.0 -2.0 -2.0 -1.0 -1.0 -1.0 0.0 0.0 0.0Total Lost Time (s) 4.0 4.0 4.0 4.0 4.0 4.0 4.0 4.0 4.0 4.0 4.0 4.0Lead/Lag Lead Lag LagLead-Lag Optimize? Yes Yes YesVehicle Extension (s) 3.0 3.0 3.0 3.0 3.0 3.0Recall Mode None C-Max C-Max None None NoneWalk Time (s) 4.0 4.0 4.0 4.0 4.0Flash Dont Walk (s) 11.0 11.0 22.0 22.0 22.0Pedestrian Calls (#/hr) 0 0 0 0 0Act Effct Green (s) 30.0 51.0 17.0 17.0 41.0 41.0 41.0Actuated g/C Ratio 0.30 0.51 0.17 0.17 0.41 0.41 0.41v/c Ratio 1.18 0.51 0.94 0.64 1.10 1.09 0.97Control Delay 108.4 9.7 50.4 10.3 87.0 90.9 56.1Queue Delay 0.0 0.0 0.0 0.0 0.0 0.0 0.0Total Delay 108.4 9.7 50.4 10.3 87.0 90.9 56.1LOS F A D B F F EApproach Delay 57.2 41.1 80.9Approach LOS E D F
Intersection SummaryArea Type: OtherCycle Length: 100Actuated Cycle Length: 100Offset: 57 (57%), Referenced to phase 6:EBWB, Start of YellowNatural Cycle: 120Control Type: Actuated-CoordinatedMaximum v/c Ratio: 1.18Intersection Signal Delay: 63.2 Intersection LOS: EIntersection Capacity Utilization 101.4% ICU Level of Service GAnalysis Period (min) 15
Splits and Phases: 3: Harmony Road & NB Ramps

Lanes, Volumes, Timings4: Harmony Road & East Frontage Road 5/27/2010
Baseline Synchro 7 - ReportPage 7
Lane Group EBL EBT EBR WBL WBT WBR NBL NBT NBR SBL SBT SBRLane ConfigurationsVolume (vph) 105 1585 150 40 1155 85 75 10 20 45 10 240Ideal Flow (vphpl) 1900 1900 1900 1900 1900 1900 1900 1900 1900 1900 1900 1900Storage Length (ft) 300 0 150 200 200 100 200 100Storage Lanes 1 1 1 1 1 1 1 1Taper Length (ft) 25 25 25 25 25 25 25 25Lane Util. Factor 1.00 0.95 1.00 1.00 0.95 0.95 1.00 1.00 1.00 1.00 1.00 1.00Frt 0.850 0.990 0.850 0.850Flt Protected 0.950 0.950 0.950 0.950Satd. Flow (prot) 1770 3539 1583 1770 3504 0 1770 1863 1583 1770 1863 1583Flt Permitted 0.135 0.081 0.569 0.750Satd. Flow (perm) 251 3539 1583 151 3504 0 1060 1863 1583 1397 1863 1583Right Turn on Red Yes Yes Yes YesSatd. Flow (RTOR) 142 11 22 258Link Speed (mph) 40 40 30 30Link Distance (ft) 903 1425 582 598Travel Time (s) 15.4 24.3 13.2 13.6Peak Hour Factor 0.93 0.93 0.93 0.93 0.93 0.93 0.93 0.93 0.93 0.93 0.93 0.93Adj. Flow (vph) 113 1704 161 43 1242 91 81 11 22 48 11 258Shared Lane Traffic (%)Lane Group Flow (vph) 113 1704 161 43 1333 0 81 11 22 48 11 258Enter Blocked Intersection No No No No No No No No No No No NoLane Alignment Left Left Right Left Left Right Left Left Right Left Left RightMedian Width(ft) 24 24 12 12Link Offset(ft) 0 0 0 0Crosswalk Width(ft) 16 16 16 16Two way Left Turn LaneHeadway Factor 1.00 1.00 1.00 1.00 1.00 1.00 1.00 1.00 1.00 1.00 1.00 1.00Turning Speed (mph) 15 9 15 9 15 9 15 20Number of Detectors 1 1 1 1 1 1 1 1 1 1 1Detector Template Leading Detector (ft) 50 50 50 50 50 50 50 50 50 50 50Trailing Detector (ft) 0 0 0 0 0 0 0 0 0 0 0Detector 1 Position(ft) 0 0 0 0 0 0 0 0 0 0 0Detector 1 Size(ft) 50 50 50 50 50 50 50 50 50 50 50Detector 1 Type Cl+Ex Cl+Ex Cl+Ex Cl+Ex Cl+Ex Cl+Ex Cl+Ex Cl+Ex Cl+Ex Cl+Ex Cl+ExDetector 1 ChannelDetector 1 Extend (s) 0.0 0.0 0.0 0.0 0.0 0.0 0.0 0.0 0.0 0.0 0.0Detector 1 Queue (s) 0.0 0.0 0.0 0.0 0.0 0.0 0.0 0.0 0.0 0.0 0.0Detector 1 Delay (s) 0.0 0.0 0.0 0.0 0.0 0.0 0.0 0.0 0.0 0.0 0.0Turn Type pm+pt Perm pm+pt pm+pt Perm pm+pt FreeProtected Phases 5 2 1 6 3 8 7 4Permitted Phases 2 2 6 8 8 4 FreeDetector Phase 5 2 2 1 6 3 8 8 7 4Switch PhaseMinimum Initial (s) 4.0 4.0 4.0 4.0 4.0 4.0 4.0 4.0 4.0 4.0Minimum Split (s) 9.0 21.0 21.0 9.0 21.0 9.0 28.0 28.0 9.0 28.0Total Split (s) 10.0 54.0 54.0 9.0 53.0 0.0 9.0 28.0 28.0 9.0 28.0 0.0Total Split (%) 10.0% 54.0% 54.0% 9.0% 53.0% 0.0% 9.0% 28.0% 28.0% 9.0% 28.0% 0.0%

Lanes, Volumes, Timings4: Harmony Road & East Frontage Road 5/27/2010
Baseline Synchro 7 - ReportPage 8
Lane Group EBL EBT EBR WBL WBT WBR NBL NBT NBR SBL SBT SBRMaximum Green (s) 5.0 48.0 48.0 4.0 47.0 4.0 23.0 23.0 4.0 23.0Yellow Time (s) 3.0 4.0 4.0 3.0 4.0 3.0 3.0 3.0 3.0 3.0All-Red Time (s) 2.0 2.0 2.0 2.0 2.0 2.0 2.0 2.0 2.0 2.0Lost Time Adjust (s) -1.0 -2.0 -2.0 -1.0 -2.0 0.0 -1.0 -1.0 -1.0 -1.0 -1.0 0.0Total Lost Time (s) 4.0 4.0 4.0 4.0 4.0 4.0 4.0 4.0 4.0 4.0 4.0 4.0Lead/Lag Lead Lag Lag Lead Lag Lead Lag Lag Lead LagLead-Lag Optimize? Yes Yes Yes Yes Yes Yes Yes Yes Yes YesVehicle Extension (s) 3.0 3.0 3.0 3.0 3.0 3.0 3.0 3.0 3.0 3.0Recall Mode None C-Max C-Max None C-Max None None None None NoneWalk Time (s) 4.0 4.0 4.0 4.0 4.0 4.0Flash Dont Walk (s) 11.0 11.0 11.0 19.0 19.0 19.0Pedestrian Calls (#/hr) 0 0 0 6 6 6Act Effct Green (s) 77.1 73.2 73.2 73.8 67.3 13.5 10.3 10.3 11.3 10.3 100.0Actuated g/C Ratio 0.77 0.73 0.73 0.74 0.67 0.14 0.10 0.10 0.11 0.10 1.00v/c Ratio 0.37 0.66 0.13 0.20 0.56 0.42 0.06 0.12 0.27 0.06 0.16Control Delay 8.0 9.6 1.0 7.6 12.5 40.8 36.6 15.2 37.9 36.6 0.2Queue Delay 0.0 0.0 0.0 0.0 0.0 0.0 0.0 0.0 0.0 0.0 0.0Total Delay 8.0 9.6 1.0 7.6 12.5 40.8 36.6 15.2 37.9 36.6 0.2LOS A A A A B D D B D D AApproach Delay 8.8 12.3 35.4 7.2Approach LOS A B D A
Intersection SummaryArea Type: OtherCycle Length: 100Actuated Cycle Length: 100Offset: 65 (65%), Referenced to phase 2:EBTL and 6:WBTL, Start of YellowNatural Cycle: 90Control Type: Actuated-CoordinatedMaximum v/c Ratio: 0.66Intersection Signal Delay: 10.8 Intersection LOS: BIntersection Capacity Utilization 68.0% ICU Level of Service CAnalysis Period (min) 15
Splits and Phases: 4: Harmony Road & East Frontage Road

SH 7 Package A PM Traffic

HCM Signalized Intersection Capacity Analysis 2035 Package A - PM 1: SH 7 & SB Ramps 10/14/2010
10/14/2010 2035 Package A - PM Synchro 7 - ReportPage 1
Movement EBL EBT EBR WBL WBT WBR NBL NBT NBR SBL SBT SBRLane ConfigurationsVolume (vph) 0 2445 945 515 1875 0 0 0 0 900 1 425Ideal Flow (vphpl) 1900 1900 1900 1900 1900 1900 1900 1900 1900 1900 1900 1900Total Lost time (s) 4.0 4.0 4.0 4.0 4.0 4.0 4.0Lane Util. Factor 0.91 0.88 0.97 0.91 0.95 0.95 1.00Frt 1.00 0.85 1.00 1.00 1.00 1.00 0.85Flt Protected 1.00 1.00 0.95 1.00 0.95 0.95 1.00Satd. Flow (prot) 4715 2584 3183 4715 1559 1563 1468Flt Permitted 1.00 1.00 0.95 1.00 0.95 0.95 1.00Satd. Flow (perm) 4715 2584 3183 4715 1559 1563 1468Peak-hour factor, PHF 0.96 0.96 0.96 0.95 0.96 0.95 0.92 0.92 0.92 0.96 0.92 0.96Adj. Flow (vph) 0 2547 984 542 1953 0 0 0 0 938 1 443RTOR Reduction (vph) 0 0 0 0 0 0 0 0 0 0 0 0Lane Group Flow (vph) 0 2547 984 542 1953 0 0 0 0 469 470 443Heavy Vehicles (%) 2% 10% 10% 10% 10% 2% 2% 2% 2% 10% 2% 10%Turn Type Free Prot Perm FreeProtected Phases 2 1 2 1 4Permitted Phases Free 4 FreeActuated Green, G (s) 50.0 110.0 16.0 72.0 27.0 27.0 110.0Effective Green, g (s) 52.0 110.0 18.0 74.0 28.0 28.0 110.0Actuated g/C Ratio 0.47 1.00 0.16 0.67 0.25 0.25 1.00Clearance Time (s) 6.0 6.0 5.0 5.0Vehicle Extension (s) 3.0 3.0 3.0 3.0Lane Grp Cap (vph) 2229 2584 521 3172 397 398 1468v/s Ratio Prot c0.54 c0.17 0.41v/s Ratio Perm 0.38 c0.30 0.30 0.30v/c Ratio 1.14 0.38 1.04 0.62 1.18 1.18 0.30Uniform Delay, d1 29.0 0.0 46.0 10.1 41.0 41.0 0.0Progression Factor 0.53 1.00 0.70 0.98 1.00 1.00 1.00Incremental Delay, d2 65.7 0.1 38.4 0.1 104.6 104.4 0.5Delay (s) 80.9 0.1 70.8 10.0 145.6 145.4 0.5Level of Service F A E B F F AApproach Delay (s) 58.4 23.2 0.0 99.1Approach LOS E C A F
Intersection SummaryHCM Average Control Delay 54.2 HCM Level of Service DHCM Volume to Capacity ratio 1.14Actuated Cycle Length (s) 110.0 Sum of lost time (s) 12.0Intersection Capacity Utilization 96.9% ICU Level of Service FAnalysis Period (min) 15c Critical Lane Group

HCM Signalized Intersection Capacity Analysis 2035 Package A - PM 2: SH 7 & NB Ramps 10/14/2010
10/14/2010 2035 Package A - PM Synchro 7 - ReportPage 2
Movement EBL EBT EBR WBL WBT WBR NBL NBT NBR SBL SBT SBRLane ConfigurationsVolume (vph) 475 2870 0 0 1395 630 995 1 1250 0 0 0Ideal Flow (vphpl) 1900 1900 1900 1900 1900 1900 1900 1900 1900 1900 1900 1900Total Lost time (s) 4.0 4.0 4.0 4.0 4.0 4.0 4.0Lane Util. Factor 0.97 0.91 *0.91 1.00 0.91 0.91 1.00Frt 1.00 1.00 1.00 0.85 1.00 1.00 0.85Flt Protected 0.95 1.00 1.00 1.00 0.95 0.95 1.00Satd. Flow (prot) 3183 4715 4715 1468 2986 1497 1468Flt Permitted 0.95 1.00 1.00 1.00 0.95 0.95 1.00Satd. Flow (perm) 3183 4715 4715 1468 2986 1497 1468Peak-hour factor, PHF 0.96 0.96 0.93 0.87 0.96 0.96 0.96 0.96 0.96 0.92 0.92 0.92Adj. Flow (vph) 495 2990 0 0 1453 656 1036 1 1302 0 0 0RTOR Reduction (vph) 0 0 0 0 0 0 0 0 0 0 0 0Lane Group Flow (vph) 495 2990 0 0 1453 656 694 343 1302 0 0 0Heavy Vehicles (%) 10% 10% 2% 2% 10% 10% 10% 2% 10% 2% 2% 2%Turn Type Prot Free Perm FreeProtected Phases 5 5 6 6 8Permitted Phases Free 8 FreeActuated Green, G (s) 31.0 74.0 39.0 110.0 25.0 25.0 110.0Effective Green, g (s) 32.0 72.0 39.0 110.0 27.0 27.0 110.0Actuated g/C Ratio 0.29 0.65 0.35 1.00 0.25 0.25 1.00Clearance Time (s) 5.0 4.0 6.0 6.0Vehicle Extension (s) 3.0 3.0 3.0 3.0Lane Grp Cap (vph) 926 3086 1672 1468 733 367 1468v/s Ratio Prot 0.16 c0.63 0.31v/s Ratio Perm 0.45 0.23 0.23 c0.89v/c Ratio 0.53 0.97 0.87 0.45 0.95 0.93 0.89Uniform Delay, d1 32.7 17.9 33.1 0.0 40.8 40.6 0.0Progression Factor 0.21 0.20 1.00 1.00 1.00 1.00 1.00Incremental Delay, d2 0.1 1.4 6.4 1.0 21.0 30.5 8.3Delay (s) 7.1 5.0 39.6 1.0 61.8 71.2 8.3Level of Service A A D A E E AApproach Delay (s) 5.3 27.6 33.4 0.0Approach LOS A C C A
Intersection SummaryHCM Average Control Delay 19.5 HCM Level of Service BHCM Volume to Capacity ratio 0.93Actuated Cycle Length (s) 110.0 Sum of lost time (s) 4.0Intersection Capacity Utilization 96.9% ICU Level of Service FAnalysis Period (min) 15c Critical Lane Group

SH 7 Package B PM Traffic
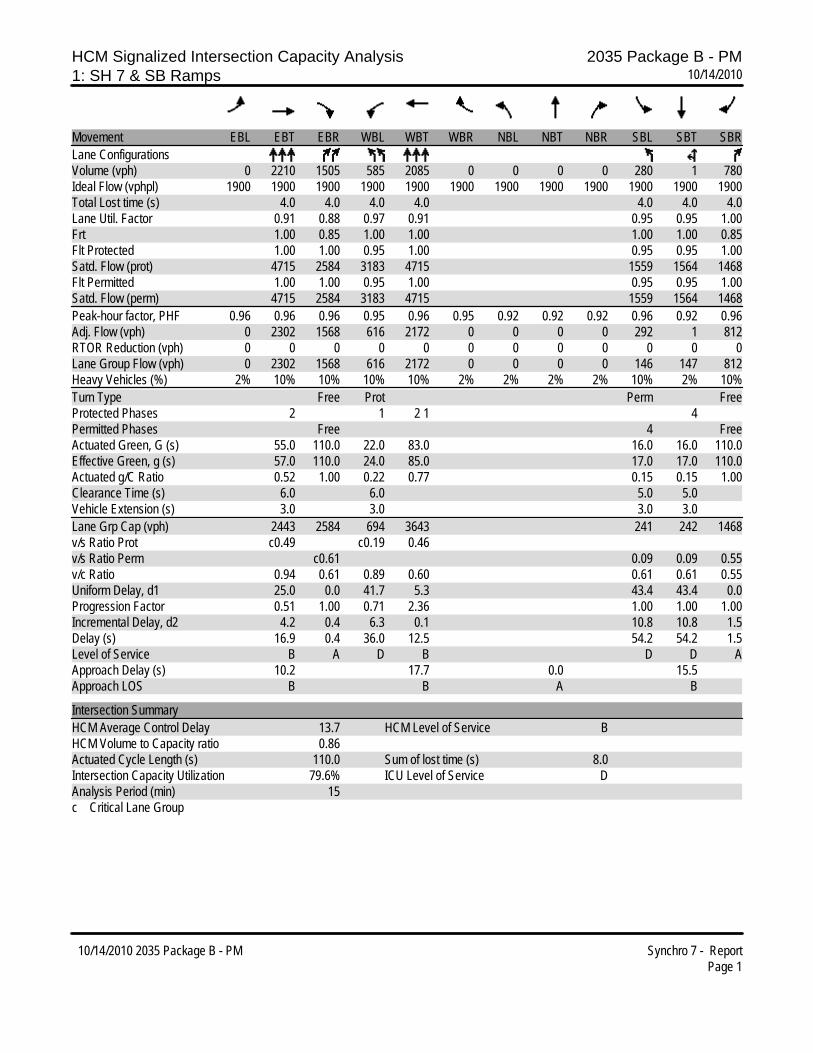
HCM Signalized Intersection Capacity Analysis 2035 Package B - PM1: SH 7 & SB Ramps 10/14/2010
10/14/2010 2035 Package B - PM Synchro 7 - ReportPage 1
Movement EBL EBT EBR WBL WBT WBR NBL NBT NBR SBL SBT SBRLane ConfigurationsVolume (vph) 0 2210 1505 585 2085 0 0 0 0 280 1 780Ideal Flow (vphpl) 1900 1900 1900 1900 1900 1900 1900 1900 1900 1900 1900 1900Total Lost time (s) 4.0 4.0 4.0 4.0 4.0 4.0 4.0Lane Util. Factor 0.91 0.88 0.97 0.91 0.95 0.95 1.00Frt 1.00 0.85 1.00 1.00 1.00 1.00 0.85Flt Protected 1.00 1.00 0.95 1.00 0.95 0.95 1.00Satd. Flow (prot) 4715 2584 3183 4715 1559 1564 1468Flt Permitted 1.00 1.00 0.95 1.00 0.95 0.95 1.00Satd. Flow (perm) 4715 2584 3183 4715 1559 1564 1468Peak-hour factor, PHF 0.96 0.96 0.96 0.95 0.96 0.95 0.92 0.92 0.92 0.96 0.92 0.96Adj. Flow (vph) 0 2302 1568 616 2172 0 0 0 0 292 1 812RTOR Reduction (vph) 0 0 0 0 0 0 0 0 0 0 0 0Lane Group Flow (vph) 0 2302 1568 616 2172 0 0 0 0 146 147 812Heavy Vehicles (%) 2% 10% 10% 10% 10% 2% 2% 2% 2% 10% 2% 10%Turn Type Free Prot Perm FreeProtected Phases 2 1 2 1 4Permitted Phases Free 4 FreeActuated Green, G (s) 55.0 110.0 22.0 83.0 16.0 16.0 110.0Effective Green, g (s) 57.0 110.0 24.0 85.0 17.0 17.0 110.0Actuated g/C Ratio 0.52 1.00 0.22 0.77 0.15 0.15 1.00Clearance Time (s) 6.0 6.0 5.0 5.0Vehicle Extension (s) 3.0 3.0 3.0 3.0Lane Grp Cap (vph) 2443 2584 694 3643 241 242 1468v/s Ratio Prot c0.49 c0.19 0.46v/s Ratio Perm c0.61 0.09 0.09 0.55v/c Ratio 0.94 0.61 0.89 0.60 0.61 0.61 0.55Uniform Delay, d1 25.0 0.0 41.7 5.3 43.4 43.4 0.0Progression Factor 0.51 1.00 0.71 2.36 1.00 1.00 1.00Incremental Delay, d2 4.2 0.4 6.3 0.1 10.8 10.8 1.5Delay (s) 16.9 0.4 36.0 12.5 54.2 54.2 1.5Level of Service B A D B D D AApproach Delay (s) 10.2 17.7 0.0 15.5Approach LOS B B A B
Intersection SummaryHCM Average Control Delay 13.7 HCM Level of Service BHCM Volume to Capacity ratio 0.86Actuated Cycle Length (s) 110.0 Sum of lost time (s) 8.0Intersection Capacity Utilization 79.6% ICU Level of Service DAnalysis Period (min) 15c Critical Lane Group
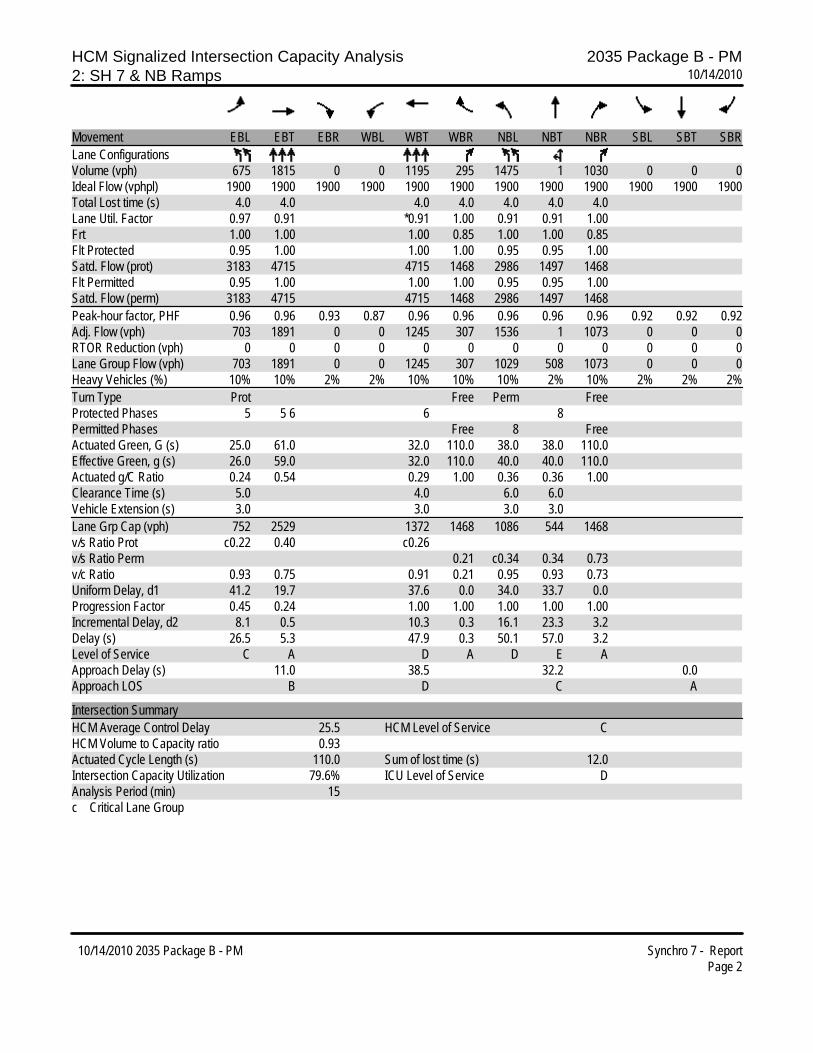
HCM Signalized Intersection Capacity Analysis 2035 Package B - PM2: SH 7 & NB Ramps 10/14/2010
10/14/2010 2035 Package B - PM Synchro 7 - ReportPage 2
Movement EBL EBT EBR WBL WBT WBR NBL NBT NBR SBL SBT SBRLane ConfigurationsVolume (vph) 675 1815 0 0 1195 295 1475 1 1030 0 0 0Ideal Flow (vphpl) 1900 1900 1900 1900 1900 1900 1900 1900 1900 1900 1900 1900Total Lost time (s) 4.0 4.0 4.0 4.0 4.0 4.0 4.0Lane Util. Factor 0.97 0.91 *0.91 1.00 0.91 0.91 1.00Frt 1.00 1.00 1.00 0.85 1.00 1.00 0.85Flt Protected 0.95 1.00 1.00 1.00 0.95 0.95 1.00Satd. Flow (prot) 3183 4715 4715 1468 2986 1497 1468Flt Permitted 0.95 1.00 1.00 1.00 0.95 0.95 1.00Satd. Flow (perm) 3183 4715 4715 1468 2986 1497 1468Peak-hour factor, PHF 0.96 0.96 0.93 0.87 0.96 0.96 0.96 0.96 0.96 0.92 0.92 0.92Adj. Flow (vph) 703 1891 0 0 1245 307 1536 1 1073 0 0 0RTOR Reduction (vph) 0 0 0 0 0 0 0 0 0 0 0 0Lane Group Flow (vph) 703 1891 0 0 1245 307 1029 508 1073 0 0 0Heavy Vehicles (%) 10% 10% 2% 2% 10% 10% 10% 2% 10% 2% 2% 2%Turn Type Prot Free Perm FreeProtected Phases 5 5 6 6 8Permitted Phases Free 8 FreeActuated Green, G (s) 25.0 61.0 32.0 110.0 38.0 38.0 110.0Effective Green, g (s) 26.0 59.0 32.0 110.0 40.0 40.0 110.0Actuated g/C Ratio 0.24 0.54 0.29 1.00 0.36 0.36 1.00Clearance Time (s) 5.0 4.0 6.0 6.0Vehicle Extension (s) 3.0 3.0 3.0 3.0Lane Grp Cap (vph) 752 2529 1372 1468 1086 544 1468v/s Ratio Prot c0.22 0.40 c0.26v/s Ratio Perm 0.21 c0.34 0.34 0.73v/c Ratio 0.93 0.75 0.91 0.21 0.95 0.93 0.73Uniform Delay, d1 41.2 19.7 37.6 0.0 34.0 33.7 0.0Progression Factor 0.45 0.24 1.00 1.00 1.00 1.00 1.00Incremental Delay, d2 8.1 0.5 10.3 0.3 16.1 23.3 3.2Delay (s) 26.5 5.3 47.9 0.3 50.1 57.0 3.2Level of Service C A D A D E AApproach Delay (s) 11.0 38.5 32.2 0.0Approach LOS B D C A
Intersection SummaryHCM Average Control Delay 25.5 HCM Level of Service CHCM Volume to Capacity ratio 0.93Actuated Cycle Length (s) 110.0 Sum of lost time (s) 12.0Intersection Capacity Utilization 79.6% ICU Level of Service DAnalysis Period (min) 15c Critical Lane Group

HCM Signalized Intersection Capacity Analysis 2035 Package B - PM16: SH 7 & Street A 11/1/2010
10/14/2010 2035 Package B - PM Synchro 7 - ReportPage 1
Movement EBL EBT EBR WBL WBT WBR NBL NBT NBR SBL SBT SBRLane ConfigurationsVolume (vph) 325 2855 200 290 2180 395 170 20 290 570 20 290Ideal Flow (vphpl) 1900 1900 1900 1900 1900 1900 1900 1900 1900 1900 1900 1900Total Lost time (s) 4.0 4.0 4.0 4.0 4.0 4.0 4.0 4.0 4.0 4.0 4.0Lane Util. Factor 0.97 0.91 1.00 0.97 0.91 1.00 1.00 1.00 0.95 0.95 1.00Frt 1.00 1.00 0.85 1.00 1.00 0.85 1.00 0.86 1.00 1.00 0.85Flt Protected 0.95 1.00 1.00 0.95 1.00 1.00 0.95 1.00 0.95 0.96 1.00Satd. Flow (prot) 3433 4715 1583 3433 4715 1583 1770 1602 1681 1691 1583Flt Permitted 0.95 1.00 1.00 0.95 1.00 1.00 0.56 1.00 0.20 0.19 1.00Satd. Flow (perm) 3433 4715 1583 3433 4715 1583 1039 1602 354 342 1583Peak-hour factor, PHF 0.92 0.96 0.92 0.92 0.96 0.92 0.92 0.92 0.92 0.92 0.92 0.92Adj. Flow (vph) 353 2974 217 315 2271 429 185 22 315 620 22 315RTOR Reduction (vph) 0 0 85 0 0 186 0 107 0 0 0 151Lane Group Flow (vph) 353 2974 132 315 2271 243 185 230 0 322 320 164Heavy Vehicles (%) 2% 10% 2% 2% 10% 2% 2% 2% 2% 2% 2% 2%Turn Type Prot Perm Prot Perm pm+pt pm+pt PermProtected Phases 7 4 3 8 5 2 1 6Permitted Phases 4 8 2 6 6Actuated Green, G (s) 11.0 57.0 57.0 8.0 54.0 54.0 20.0 16.0 33.0 33.0 25.0Effective Green, g (s) 11.0 57.0 57.0 8.0 54.0 54.0 20.0 16.0 33.0 33.0 25.0Actuated g/C Ratio 0.10 0.52 0.52 0.07 0.49 0.49 0.18 0.15 0.30 0.30 0.23Clearance Time (s) 4.0 4.0 4.0 4.0 4.0 4.0 4.0 4.0 4.0 4.0 4.0Vehicle Extension (s) 3.0 3.0 3.0 3.0 3.0 3.0 3.0 3.0 3.0 3.0 3.0Lane Grp Cap (vph) 343 2443 820 250 2315 777 215 233 263 262 360v/s Ratio Prot 0.10 c0.63 0.09 c0.48 0.03 0.14 c0.14 0.14v/s Ratio Perm 0.08 0.15 0.12 c0.22 0.22 0.10v/c Ratio 1.03 1.22 0.16 1.26 0.98 0.31 0.86 0.99 1.22 1.22 0.46Uniform Delay, d1 49.5 26.5 13.9 51.0 27.5 16.8 42.5 46.9 34.5 38.5 36.6Progression Factor 1.00 1.00 1.00 0.68 0.38 0.02 1.00 1.00 1.00 1.00 1.00Incremental Delay, d2 56.3 101.8 0.4 140.8 13.0 0.9 27.8 55.0 130.0 128.9 0.9Delay (s) 105.8 128.3 14.4 175.3 23.6 1.2 70.3 101.9 164.5 167.4 37.6Level of Service F F B F C A E F F F DApproach Delay (s) 119.1 36.3 90.7 123.7Approach LOS F D F F
Intersection SummaryHCM Average Control Delay 86.7 HCM Level of Service FHCM Volume to Capacity ratio 1.16Actuated Cycle Length (s) 110.0 Sum of lost time (s) 8.0Intersection Capacity Utilization 112.1% ICU Level of Service HAnalysis Period (min) 15c Critical Lane Group

SH 7 Phase I PM Traffic
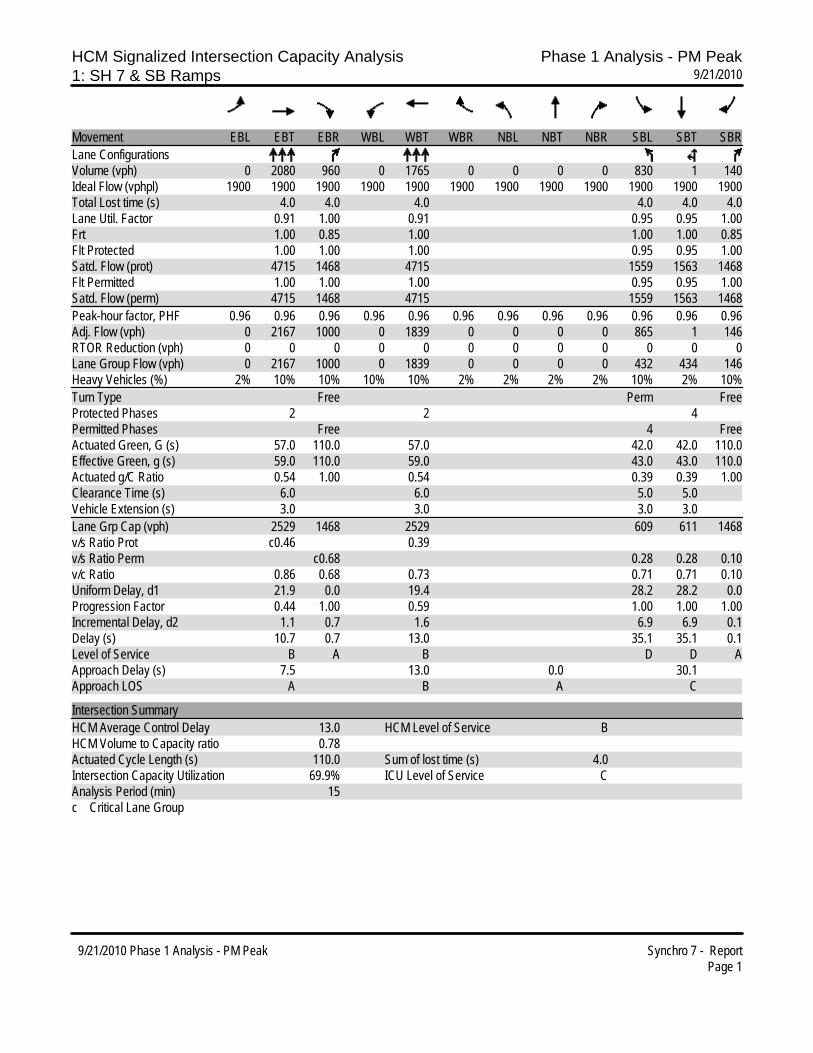
HCM Signalized Intersection Capacity Analysis Phase 1 Analysis - PM Peak1: SH 7 & SB Ramps 9/21/2010
9/21/2010 Phase 1 Analysis - PM Peak Synchro 7 - ReportPage 1
Movement EBL EBT EBR WBL WBT WBR NBL NBT NBR SBL SBT SBRLane ConfigurationsVolume (vph) 0 2080 960 0 1765 0 0 0 0 830 1 140Ideal Flow (vphpl) 1900 1900 1900 1900 1900 1900 1900 1900 1900 1900 1900 1900Total Lost time (s) 4.0 4.0 4.0 4.0 4.0 4.0Lane Util. Factor 0.91 1.00 0.91 0.95 0.95 1.00Frt 1.00 0.85 1.00 1.00 1.00 0.85Flt Protected 1.00 1.00 1.00 0.95 0.95 1.00Satd. Flow (prot) 4715 1468 4715 1559 1563 1468Flt Permitted 1.00 1.00 1.00 0.95 0.95 1.00Satd. Flow (perm) 4715 1468 4715 1559 1563 1468Peak-hour factor, PHF 0.96 0.96 0.96 0.96 0.96 0.96 0.96 0.96 0.96 0.96 0.96 0.96Adj. Flow (vph) 0 2167 1000 0 1839 0 0 0 0 865 1 146RTOR Reduction (vph) 0 0 0 0 0 0 0 0 0 0 0 0Lane Group Flow (vph) 0 2167 1000 0 1839 0 0 0 0 432 434 146Heavy Vehicles (%) 2% 10% 10% 10% 10% 2% 2% 2% 2% 10% 2% 10%Turn Type Free Perm FreeProtected Phases 2 2 4Permitted Phases Free 4 FreeActuated Green, G (s) 57.0 110.0 57.0 42.0 42.0 110.0Effective Green, g (s) 59.0 110.0 59.0 43.0 43.0 110.0Actuated g/C Ratio 0.54 1.00 0.54 0.39 0.39 1.00Clearance Time (s) 6.0 6.0 5.0 5.0Vehicle Extension (s) 3.0 3.0 3.0 3.0Lane Grp Cap (vph) 2529 1468 2529 609 611 1468v/s Ratio Prot c0.46 0.39v/s Ratio Perm c0.68 0.28 0.28 0.10v/c Ratio 0.86 0.68 0.73 0.71 0.71 0.10Uniform Delay, d1 21.9 0.0 19.4 28.2 28.2 0.0Progression Factor 0.44 1.00 0.59 1.00 1.00 1.00Incremental Delay, d2 1.1 0.7 1.6 6.9 6.9 0.1Delay (s) 10.7 0.7 13.0 35.1 35.1 0.1Level of Service B A B D D AApproach Delay (s) 7.5 13.0 0.0 30.1Approach LOS A B A C
Intersection SummaryHCM Average Control Delay 13.0 HCM Level of Service BHCM Volume to Capacity ratio 0.78Actuated Cycle Length (s) 110.0 Sum of lost time (s) 4.0Intersection Capacity Utilization 69.9% ICU Level of Service CAnalysis Period (min) 15c Critical Lane Group
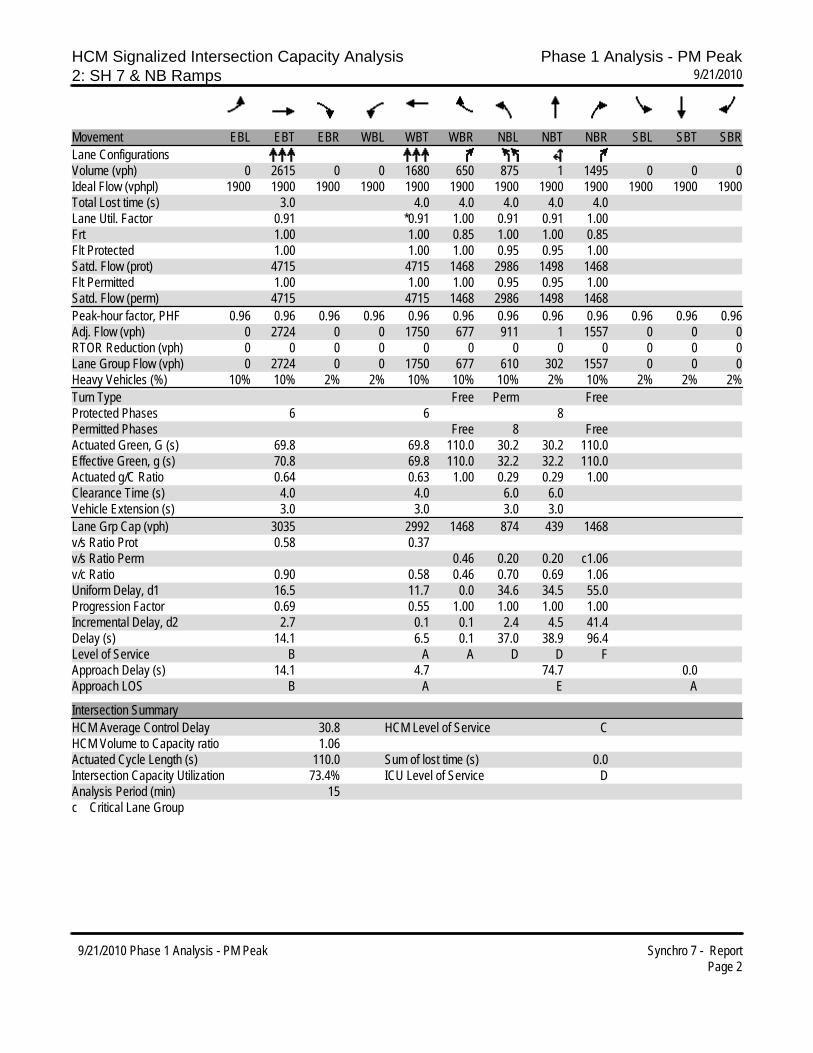
HCM Signalized Intersection Capacity Analysis Phase 1 Analysis - PM Peak2: SH 7 & NB Ramps 9/21/2010
9/21/2010 Phase 1 Analysis - PM Peak Synchro 7 - ReportPage 2
Movement EBL EBT EBR WBL WBT WBR NBL NBT NBR SBL SBT SBRLane ConfigurationsVolume (vph) 0 2615 0 0 1680 650 875 1 1495 0 0 0Ideal Flow (vphpl) 1900 1900 1900 1900 1900 1900 1900 1900 1900 1900 1900 1900Total Lost time (s) 3.0 4.0 4.0 4.0 4.0 4.0Lane Util. Factor 0.91 *0.91 1.00 0.91 0.91 1.00Frt 1.00 1.00 0.85 1.00 1.00 0.85Flt Protected 1.00 1.00 1.00 0.95 0.95 1.00Satd. Flow (prot) 4715 4715 1468 2986 1498 1468Flt Permitted 1.00 1.00 1.00 0.95 0.95 1.00Satd. Flow (perm) 4715 4715 1468 2986 1498 1468Peak-hour factor, PHF 0.96 0.96 0.96 0.96 0.96 0.96 0.96 0.96 0.96 0.96 0.96 0.96Adj. Flow (vph) 0 2724 0 0 1750 677 911 1 1557 0 0 0RTOR Reduction (vph) 0 0 0 0 0 0 0 0 0 0 0 0Lane Group Flow (vph) 0 2724 0 0 1750 677 610 302 1557 0 0 0Heavy Vehicles (%) 10% 10% 2% 2% 10% 10% 10% 2% 10% 2% 2% 2%Turn Type Free Perm FreeProtected Phases 6 6 8Permitted Phases Free 8 FreeActuated Green, G (s) 69.8 69.8 110.0 30.2 30.2 110.0Effective Green, g (s) 70.8 69.8 110.0 32.2 32.2 110.0Actuated g/C Ratio 0.64 0.63 1.00 0.29 0.29 1.00Clearance Time (s) 4.0 4.0 6.0 6.0Vehicle Extension (s) 3.0 3.0 3.0 3.0Lane Grp Cap (vph) 3035 2992 1468 874 439 1468v/s Ratio Prot 0.58 0.37v/s Ratio Perm 0.46 0.20 0.20 c1.06v/c Ratio 0.90 0.58 0.46 0.70 0.69 1.06Uniform Delay, d1 16.5 11.7 0.0 34.6 34.5 55.0Progression Factor 0.69 0.55 1.00 1.00 1.00 1.00Incremental Delay, d2 2.7 0.1 0.1 2.4 4.5 41.4Delay (s) 14.1 6.5 0.1 37.0 38.9 96.4Level of Service B A A D D FApproach Delay (s) 14.1 4.7 74.7 0.0Approach LOS B A E A
Intersection SummaryHCM Average Control Delay 30.8 HCM Level of Service CHCM Volume to Capacity ratio 1.06Actuated Cycle Length (s) 110.0 Sum of lost time (s) 0.0Intersection Capacity Utilization 73.4% ICU Level of Service DAnalysis Period (min) 15c Critical Lane Group
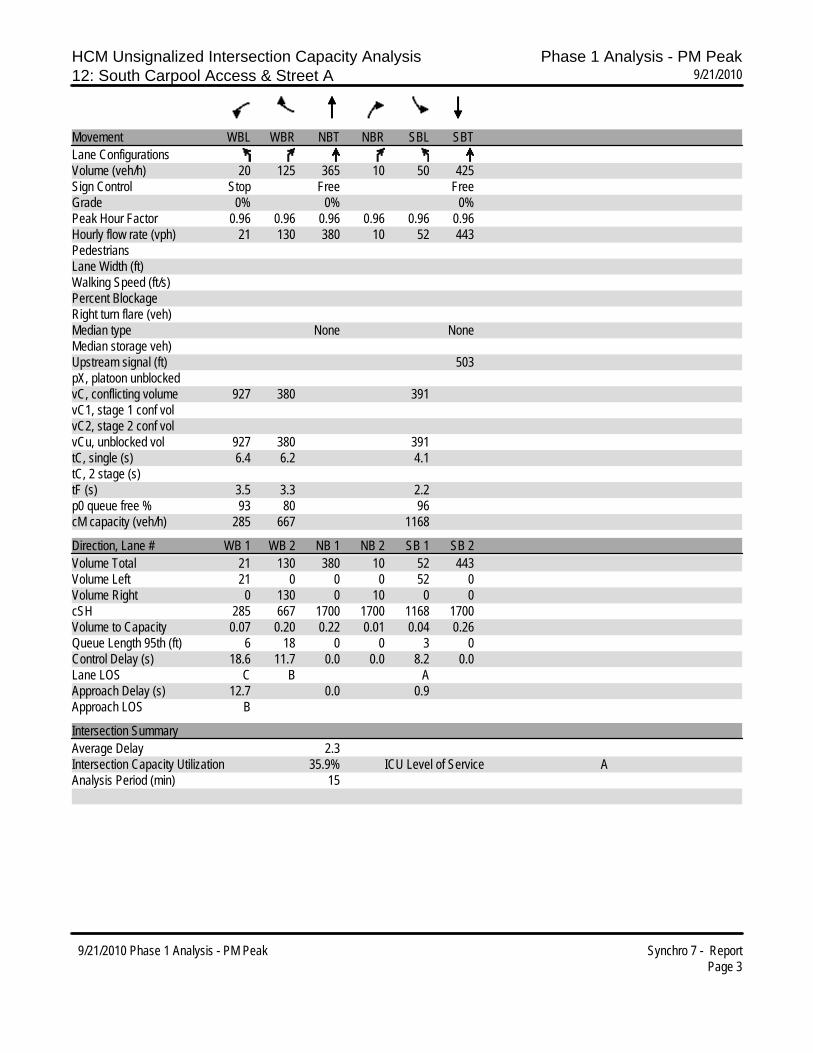
HCM Unsignalized Intersection Capacity Analysis Phase 1 Analysis - PM Peak12: South Carpool Access & Street A 9/21/2010
9/21/2010 Phase 1 Analysis - PM Peak Synchro 7 - ReportPage 3
Movement WBL WBR NBT NBR SBL SBTLane ConfigurationsVolume (veh/h) 20 125 365 10 50 425Sign Control Stop Free FreeGrade 0% 0% 0%Peak Hour Factor 0.96 0.96 0.96 0.96 0.96 0.96Hourly flow rate (vph) 21 130 380 10 52 443PedestriansLane Width (ft)Walking Speed (ft/s)Percent BlockageRight turn flare (veh)Median type None NoneMedian storage veh)Upstream signal (ft) 503pX, platoon unblockedvC, conflicting volume 927 380 391vC1, stage 1 conf volvC2, stage 2 conf volvCu, unblocked vol 927 380 391tC, single (s) 6.4 6.2 4.1tC, 2 stage (s)tF (s) 3.5 3.3 2.2p0 queue free % 93 80 96cM capacity (veh/h) 285 667 1168
Direction, Lane # WB 1 WB 2 NB 1 NB 2 SB 1 SB 2Volume Total 21 130 380 10 52 443Volume Left 21 0 0 0 52 0Volume Right 0 130 0 10 0 0cSH 285 667 1700 1700 1168 1700Volume to Capacity 0.07 0.20 0.22 0.01 0.04 0.26Queue Length 95th (ft) 6 18 0 0 3 0Control Delay (s) 18.6 11.7 0.0 0.0 8.2 0.0Lane LOS C B AApproach Delay (s) 12.7 0.0 0.9Approach LOS B
Intersection SummaryAverage Delay 2.3Intersection Capacity Utilization 35.9% ICU Level of Service AAnalysis Period (min) 15
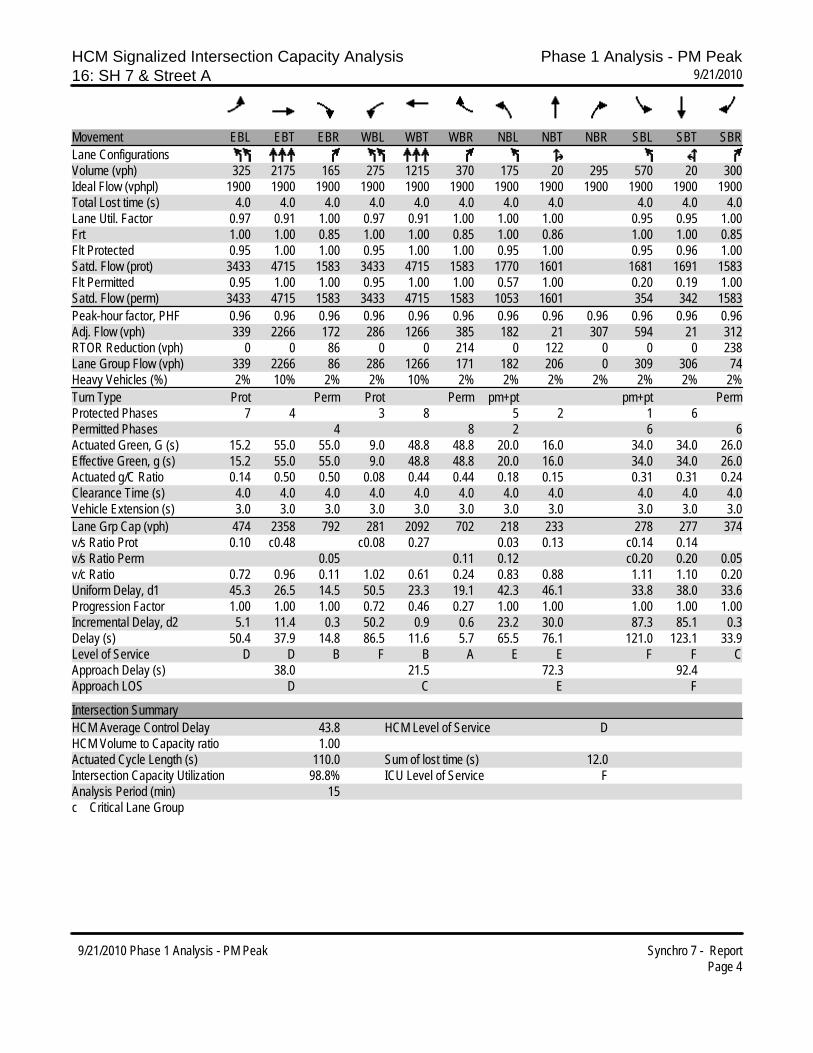
HCM Signalized Intersection Capacity Analysis Phase 1 Analysis - PM Peak16: SH 7 & Street A 9/21/2010
9/21/2010 Phase 1 Analysis - PM Peak Synchro 7 - ReportPage 4
Movement EBL EBT EBR WBL WBT WBR NBL NBT NBR SBL SBT SBRLane ConfigurationsVolume (vph) 325 2175 165 275 1215 370 175 20 295 570 20 300Ideal Flow (vphpl) 1900 1900 1900 1900 1900 1900 1900 1900 1900 1900 1900 1900Total Lost time (s) 4.0 4.0 4.0 4.0 4.0 4.0 4.0 4.0 4.0 4.0 4.0Lane Util. Factor 0.97 0.91 1.00 0.97 0.91 1.00 1.00 1.00 0.95 0.95 1.00Frt 1.00 1.00 0.85 1.00 1.00 0.85 1.00 0.86 1.00 1.00 0.85Flt Protected 0.95 1.00 1.00 0.95 1.00 1.00 0.95 1.00 0.95 0.96 1.00Satd. Flow (prot) 3433 4715 1583 3433 4715 1583 1770 1601 1681 1691 1583Flt Permitted 0.95 1.00 1.00 0.95 1.00 1.00 0.57 1.00 0.20 0.19 1.00Satd. Flow (perm) 3433 4715 1583 3433 4715 1583 1053 1601 354 342 1583Peak-hour factor, PHF 0.96 0.96 0.96 0.96 0.96 0.96 0.96 0.96 0.96 0.96 0.96 0.96Adj. Flow (vph) 339 2266 172 286 1266 385 182 21 307 594 21 312RTOR Reduction (vph) 0 0 86 0 0 214 0 122 0 0 0 238Lane Group Flow (vph) 339 2266 86 286 1266 171 182 206 0 309 306 74Heavy Vehicles (%) 2% 10% 2% 2% 10% 2% 2% 2% 2% 2% 2% 2%Turn Type Prot Perm Prot Perm pm+pt pm+pt PermProtected Phases 7 4 3 8 5 2 1 6Permitted Phases 4 8 2 6 6Actuated Green, G (s) 15.2 55.0 55.0 9.0 48.8 48.8 20.0 16.0 34.0 34.0 26.0Effective Green, g (s) 15.2 55.0 55.0 9.0 48.8 48.8 20.0 16.0 34.0 34.0 26.0Actuated g/C Ratio 0.14 0.50 0.50 0.08 0.44 0.44 0.18 0.15 0.31 0.31 0.24Clearance Time (s) 4.0 4.0 4.0 4.0 4.0 4.0 4.0 4.0 4.0 4.0 4.0Vehicle Extension (s) 3.0 3.0 3.0 3.0 3.0 3.0 3.0 3.0 3.0 3.0 3.0Lane Grp Cap (vph) 474 2358 792 281 2092 702 218 233 278 277 374v/s Ratio Prot 0.10 c0.48 c0.08 0.27 0.03 0.13 c0.14 0.14v/s Ratio Perm 0.05 0.11 0.12 c0.20 0.20 0.05v/c Ratio 0.72 0.96 0.11 1.02 0.61 0.24 0.83 0.88 1.11 1.10 0.20Uniform Delay, d1 45.3 26.5 14.5 50.5 23.3 19.1 42.3 46.1 33.8 38.0 33.6Progression Factor 1.00 1.00 1.00 0.72 0.46 0.27 1.00 1.00 1.00 1.00 1.00Incremental Delay, d2 5.1 11.4 0.3 50.2 0.9 0.6 23.2 30.0 87.3 85.1 0.3Delay (s) 50.4 37.9 14.8 86.5 11.6 5.7 65.5 76.1 121.0 123.1 33.9Level of Service D D B F B A E E F F CApproach Delay (s) 38.0 21.5 72.3 92.4Approach LOS D C E F
Intersection SummaryHCM Average Control Delay 43.8 HCM Level of Service DHCM Volume to Capacity ratio 1.00Actuated Cycle Length (s) 110.0 Sum of lost time (s) 12.0Intersection Capacity Utilization 98.8% ICU Level of Service FAnalysis Period (min) 15c Critical Lane Group
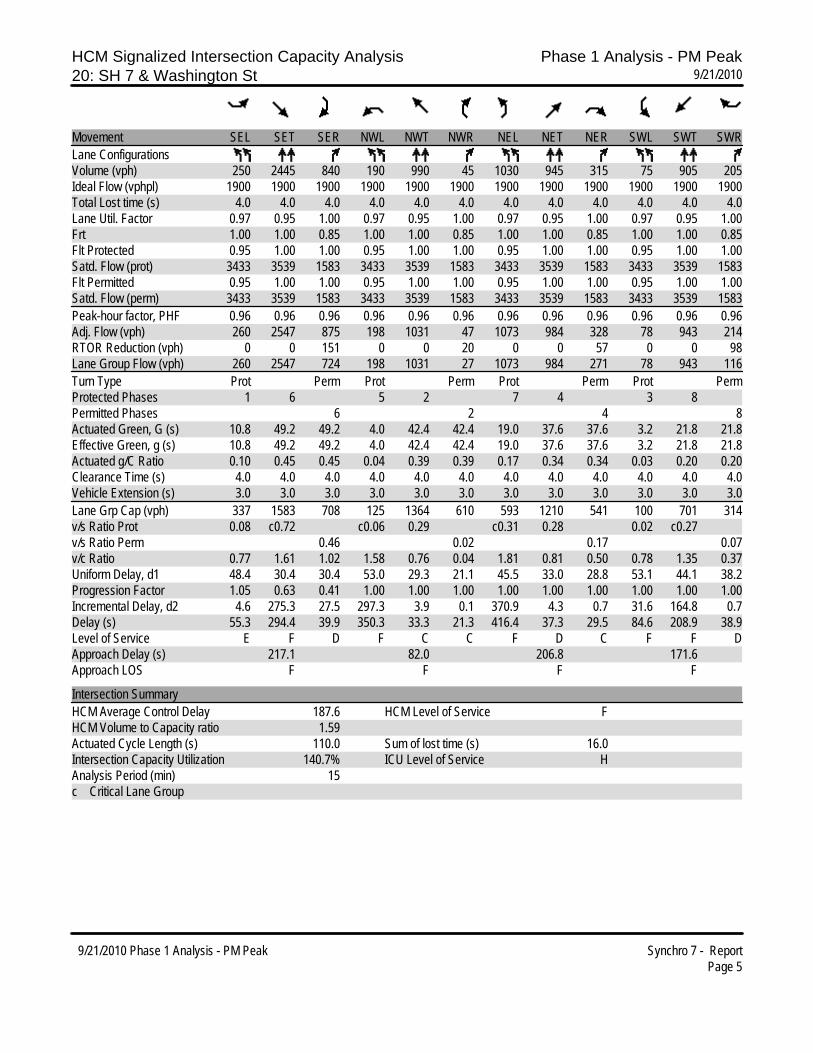
HCM Signalized Intersection Capacity Analysis Phase 1 Analysis - PM Peak20: SH 7 & Washington St 9/21/2010
9/21/2010 Phase 1 Analysis - PM Peak Synchro 7 - ReportPage 5
Movement SEL SET SER NWL NWT NWR NEL NET NER SWL SWT SWRLane ConfigurationsVolume (vph) 250 2445 840 190 990 45 1030 945 315 75 905 205Ideal Flow (vphpl) 1900 1900 1900 1900 1900 1900 1900 1900 1900 1900 1900 1900Total Lost time (s) 4.0 4.0 4.0 4.0 4.0 4.0 4.0 4.0 4.0 4.0 4.0 4.0Lane Util. Factor 0.97 0.95 1.00 0.97 0.95 1.00 0.97 0.95 1.00 0.97 0.95 1.00Frt 1.00 1.00 0.85 1.00 1.00 0.85 1.00 1.00 0.85 1.00 1.00 0.85Flt Protected 0.95 1.00 1.00 0.95 1.00 1.00 0.95 1.00 1.00 0.95 1.00 1.00Satd. Flow (prot) 3433 3539 1583 3433 3539 1583 3433 3539 1583 3433 3539 1583Flt Permitted 0.95 1.00 1.00 0.95 1.00 1.00 0.95 1.00 1.00 0.95 1.00 1.00Satd. Flow (perm) 3433 3539 1583 3433 3539 1583 3433 3539 1583 3433 3539 1583Peak-hour factor, PHF 0.96 0.96 0.96 0.96 0.96 0.96 0.96 0.96 0.96 0.96 0.96 0.96Adj. Flow (vph) 260 2547 875 198 1031 47 1073 984 328 78 943 214RTOR Reduction (vph) 0 0 151 0 0 20 0 0 57 0 0 98Lane Group Flow (vph) 260 2547 724 198 1031 27 1073 984 271 78 943 116Turn Type Prot Perm Prot Perm Prot Perm Prot PermProtected Phases 1 6 5 2 7 4 3 8Permitted Phases 6 2 4 8Actuated Green, G (s) 10.8 49.2 49.2 4.0 42.4 42.4 19.0 37.6 37.6 3.2 21.8 21.8Effective Green, g (s) 10.8 49.2 49.2 4.0 42.4 42.4 19.0 37.6 37.6 3.2 21.8 21.8Actuated g/C Ratio 0.10 0.45 0.45 0.04 0.39 0.39 0.17 0.34 0.34 0.03 0.20 0.20Clearance Time (s) 4.0 4.0 4.0 4.0 4.0 4.0 4.0 4.0 4.0 4.0 4.0 4.0Vehicle Extension (s) 3.0 3.0 3.0 3.0 3.0 3.0 3.0 3.0 3.0 3.0 3.0 3.0Lane Grp Cap (vph) 337 1583 708 125 1364 610 593 1210 541 100 701 314v/s Ratio Prot 0.08 c0.72 c0.06 0.29 c0.31 0.28 0.02 c0.27v/s Ratio Perm 0.46 0.02 0.17 0.07v/c Ratio 0.77 1.61 1.02 1.58 0.76 0.04 1.81 0.81 0.50 0.78 1.35 0.37Uniform Delay, d1 48.4 30.4 30.4 53.0 29.3 21.1 45.5 33.0 28.8 53.1 44.1 38.2Progression Factor 1.05 0.63 0.41 1.00 1.00 1.00 1.00 1.00 1.00 1.00 1.00 1.00Incremental Delay, d2 4.6 275.3 27.5 297.3 3.9 0.1 370.9 4.3 0.7 31.6 164.8 0.7Delay (s) 55.3 294.4 39.9 350.3 33.3 21.3 416.4 37.3 29.5 84.6 208.9 38.9Level of Service E F D F C C F D C F F DApproach Delay (s) 217.1 82.0 206.8 171.6Approach LOS F F F F
Intersection SummaryHCM Average Control Delay 187.6 HCM Level of Service FHCM Volume to Capacity ratio 1.59Actuated Cycle Length (s) 110.0 Sum of lost time (s) 16.0Intersection Capacity Utilization 140.7% ICU Level of Service HAnalysis Period (min) 15c Critical Lane Group

SH 7 Preferred Alternative PM Traffic

HCM Signalized Intersection Capacity Analysis SH 71: SH 7 & SB Ramps Action - PM
Baseline Synchro 7 - ReportPage 1
Movement EBL EBT EBR WBL WBT WBR NBL NBT NBR SBL SBT SBRLane ConfigurationsVolume (vph) 0 2070 1185 0 1875 0 0 0 0 880 1 145Ideal Flow (vphpl) 1900 1900 1900 1900 1900 1900 1900 1900 1900 1900 1900 1900Total Lost time (s) 4.0 4.0 4.0 4.0 4.0 4.0Lane Util. Factor 0.91 1.00 0.91 0.95 0.95 1.00Frt 1.00 0.85 1.00 1.00 1.00 0.85Flt Protected 1.00 1.00 1.00 0.95 0.95 1.00Satd. Flow (prot) 4715 1468 4715 1559 1563 1468Flt Permitted 1.00 1.00 1.00 0.95 0.95 1.00Satd. Flow (perm) 4715 1468 4715 1559 1563 1468Peak-hour factor, PHF 0.96 0.96 0.96 0.96 0.96 0.96 0.96 0.96 0.96 0.96 0.96 0.96Adj. Flow (vph) 0 2156 1234 0 1953 0 0 0 0 917 1 151RTOR Reduction (vph) 0 0 0 0 0 0 0 0 0 0 0 0Lane Group Flow (vph) 0 2156 1234 0 1953 0 0 0 0 458 460 151Heavy Vehicles (%) 2% 10% 10% 10% 10% 2% 2% 2% 2% 10% 2% 10%Turn Type Free Perm FreeProtected Phases 2 2 4Permitted Phases Free 4 FreeActuated Green, G (s) 57.0 110.0 57.0 42.0 42.0 110.0Effective Green, g (s) 59.0 110.0 59.0 43.0 43.0 110.0Actuated g/C Ratio 0.54 1.00 0.54 0.39 0.39 1.00Clearance Time (s) 6.0 6.0 5.0 5.0Vehicle Extension (s) 3.0 3.0 3.0 3.0Lane Grp Cap (vph) 2529 1468 2529 609 611 1468v/s Ratio Prot 0.46 0.41v/s Ratio Perm c0.84 0.29 0.29 0.10v/c Ratio 0.85 0.84 0.77 0.75 0.75 0.10Uniform Delay, d1 21.8 0.0 20.2 28.9 28.9 0.0Progression Factor 0.40 1.00 0.64 1.00 1.00 1.00Incremental Delay, d2 0.4 0.6 1.8 8.3 8.3 0.1Delay (s) 9.1 0.6 14.7 37.2 37.3 0.1Level of Service A A B D D AApproach Delay (s) 6.0 14.7 0.0 32.0Approach LOS A B A C
Intersection SummaryHCM Average Control Delay 13.0 HCM Level of Service BHCM Volume to Capacity ratio 0.84Actuated Cycle Length (s) 110.0 Sum of lost time (s) 0.0Intersection Capacity Utilization 71.1% ICU Level of Service CAnalysis Period (min) 15c Critical Lane Group

HCM Signalized Intersection Capacity Analysis SH 72: SH 7 & NB Ramps Action - PM
Baseline Synchro 7 - ReportPage 2
Movement EBL EBT EBR WBL WBT WBR NBL NBT NBR SBL SBT SBRLane ConfigurationsVolume (vph) 0 2665 0 0 1870 635 985 1 1680 0 0 0Ideal Flow (vphpl) 1900 1900 1900 1900 1900 1900 1900 1900 1900 1900 1900 1900Total Lost time (s) 3.0 4.0 4.0 4.0 4.0 4.0Lane Util. Factor 0.91 *0.91 1.00 0.91 0.91 1.00Frt 1.00 1.00 0.85 1.00 1.00 0.85Flt Protected 1.00 1.00 1.00 0.95 0.95 1.00Satd. Flow (prot) 4715 4715 1468 2986 1497 1468Flt Permitted 1.00 1.00 1.00 0.95 0.95 1.00Satd. Flow (perm) 4715 4715 1468 2986 1497 1468Peak-hour factor, PHF 0.96 0.96 0.96 0.96 0.96 0.96 0.96 0.96 0.96 0.96 0.96 0.96Adj. Flow (vph) 0 2776 0 0 1948 661 1026 1 1750 0 0 0RTOR Reduction (vph) 0 0 0 0 0 0 0 0 0 0 0 0Lane Group Flow (vph) 0 2776 0 0 1948 661 687 340 1750 0 0 0Heavy Vehicles (%) 10% 10% 2% 2% 10% 10% 10% 2% 10% 2% 2% 2%Turn Type Free Perm FreeProtected Phases 6 6 8Permitted Phases Free 8 FreeActuated Green, G (s) 66.7 66.7 110.0 33.3 33.3 110.0Effective Green, g (s) 67.7 66.7 110.0 35.3 35.3 110.0Actuated g/C Ratio 0.62 0.61 1.00 0.32 0.32 1.00Clearance Time (s) 4.0 4.0 6.0 6.0Vehicle Extension (s) 3.0 3.0 3.0 3.0Lane Grp Cap (vph) 2902 2859 1468 958 480 1468v/s Ratio Prot 0.59 0.41v/s Ratio Perm 0.45 0.23 0.23 c1.19v/c Ratio 0.96 0.68 0.45 0.72 0.71 1.19Uniform Delay, d1 19.8 14.5 0.0 32.9 32.8 55.0Progression Factor 0.75 0.61 1.00 1.00 1.00 1.00Incremental Delay, d2 5.7 0.1 0.1 2.6 4.7 93.5Delay (s) 20.5 9.0 0.1 35.5 37.6 148.5Level of Service C A A D D FApproach Delay (s) 20.5 6.7 107.0 0.0Approach LOS C A F A
Intersection SummaryHCM Average Control Delay 45.5 HCM Level of Service DHCM Volume to Capacity ratio 1.19Actuated Cycle Length (s) 110.0 Sum of lost time (s) 0.0Intersection Capacity Utilization 76.4% ICU Level of Service DAnalysis Period (min) 15c Critical Lane Group
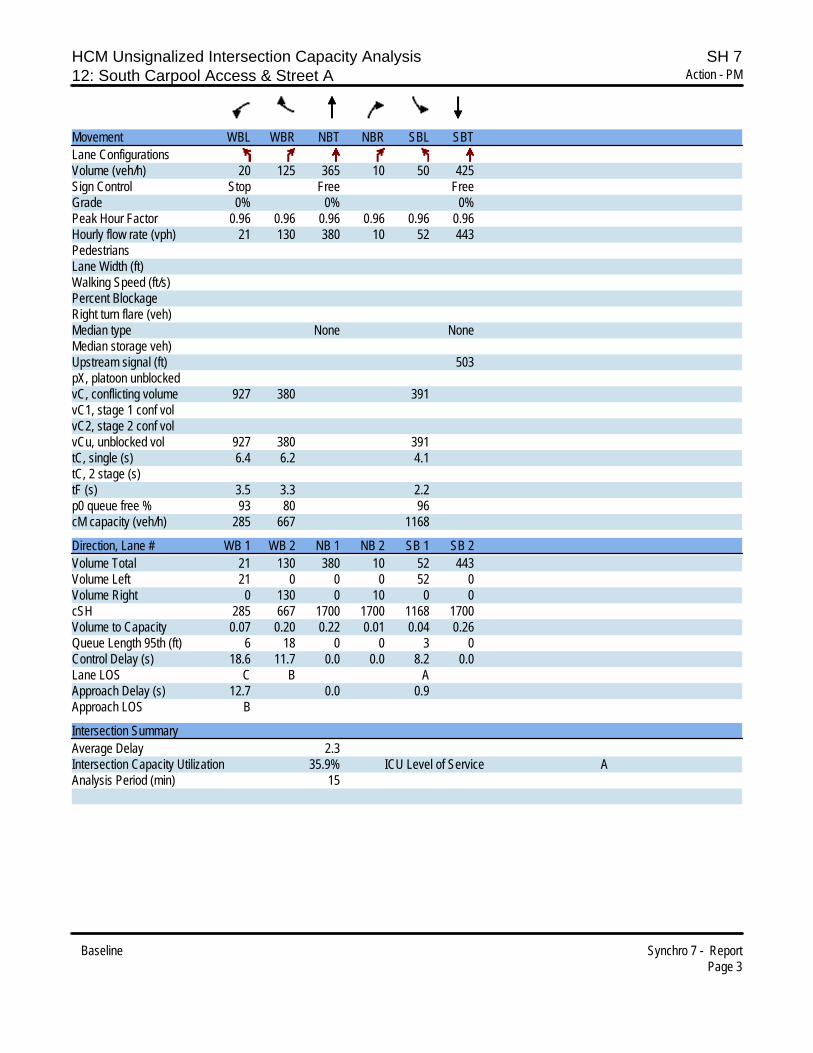
HCM Unsignalized Intersection Capacity Analysis SH 712: South Carpool Access & Street A Action - PM
Baseline Synchro 7 - ReportPage 3
Movement WBL WBR NBT NBR SBL SBTLane ConfigurationsVolume (veh/h) 20 125 365 10 50 425Sign Control Stop Free FreeGrade 0% 0% 0%Peak Hour Factor 0.96 0.96 0.96 0.96 0.96 0.96Hourly flow rate (vph) 21 130 380 10 52 443PedestriansLane Width (ft)Walking Speed (ft/s)Percent BlockageRight turn flare (veh)Median type None NoneMedian storage veh)Upstream signal (ft) 503pX, platoon unblockedvC, conflicting volume 927 380 391vC1, stage 1 conf volvC2, stage 2 conf volvCu, unblocked vol 927 380 391tC, single (s) 6.4 6.2 4.1tC, 2 stage (s)tF (s) 3.5 3.3 2.2p0 queue free % 93 80 96cM capacity (veh/h) 285 667 1168
Direction, Lane # WB 1 WB 2 NB 1 NB 2 SB 1 SB 2Volume Total 21 130 380 10 52 443Volume Left 21 0 0 0 52 0Volume Right 0 130 0 10 0 0cSH 285 667 1700 1700 1168 1700Volume to Capacity 0.07 0.20 0.22 0.01 0.04 0.26Queue Length 95th (ft) 6 18 0 0 3 0Control Delay (s) 18.6 11.7 0.0 0.0 8.2 0.0Lane LOS C B AApproach Delay (s) 12.7 0.0 0.9Approach LOS B
Intersection SummaryAverage Delay 2.3Intersection Capacity Utilization 35.9% ICU Level of Service AAnalysis Period (min) 15

HCM Signalized Intersection Capacity Analysis SH 716: SH 7 & Street A Action - PM
Baseline Synchro 7 - ReportPage 4
Movement EBL EBT EBR WBL WBT WBR NBL NBT NBR SBL SBT SBRLane ConfigurationsVolume (vph) 325 2375 165 290 1335 395 175 20 295 585 20 300Ideal Flow (vphpl) 1900 1900 1900 1900 1900 1900 1900 1900 1900 1900 1900 1900Total Lost time (s) 4.0 4.0 4.0 4.0 4.0 4.0 4.0 4.0 4.0 4.0 4.0Lane Util. Factor 0.97 0.91 1.00 0.97 0.91 1.00 1.00 1.00 0.95 0.95 1.00Frt 1.00 1.00 0.85 1.00 1.00 0.85 1.00 0.86 1.00 1.00 0.85Flt Protected 0.95 1.00 1.00 0.95 1.00 1.00 0.95 1.00 0.95 0.96 1.00Satd. Flow (prot) 3433 4715 1583 3433 4715 1583 1770 1601 1681 1691 1583Flt Permitted 0.95 1.00 1.00 0.95 1.00 1.00 0.56 1.00 0.20 0.19 1.00Satd. Flow (perm) 3433 4715 1583 3433 4715 1583 1046 1601 354 342 1583Peak-hour factor, PHF 0.96 0.96 0.96 0.96 0.96 0.96 0.96 0.96 0.96 0.96 0.96 0.96Adj. Flow (vph) 339 2474 172 302 1391 411 182 21 307 609 21 312RTOR Reduction (vph) 0 0 81 0 0 229 0 121 0 0 0 235Lane Group Flow (vph) 339 2474 91 302 1391 182 182 207 0 317 313 77Heavy Vehicles (%) 2% 10% 2% 2% 10% 2% 2% 2% 2% 2% 2% 2%Turn Type Prot Perm Prot Perm pm+pt pm+pt PermProtected Phases 7 4 3 8 5 2 1 6Permitted Phases 4 8 2 6 6Actuated Green, G (s) 15.2 55.0 55.0 9.0 48.8 48.8 20.0 16.0 34.0 34.0 26.0Effective Green, g (s) 15.2 55.0 55.0 9.0 48.8 48.8 20.0 16.0 34.0 34.0 26.0Actuated g/C Ratio 0.14 0.50 0.50 0.08 0.44 0.44 0.18 0.15 0.31 0.31 0.24Clearance Time (s) 4.0 4.0 4.0 4.0 4.0 4.0 4.0 4.0 4.0 4.0 4.0Vehicle Extension (s) 3.0 3.0 3.0 3.0 3.0 3.0 3.0 3.0 3.0 3.0 3.0Lane Grp Cap (vph) 474 2358 792 281 2092 702 217 233 278 277 374v/s Ratio Prot 0.10 c0.52 c0.09 0.29 0.03 0.13 c0.14 0.14v/s Ratio Perm 0.06 0.12 0.12 c0.21 0.21 0.05v/c Ratio 0.72 1.05 0.11 1.07 0.66 0.26 0.84 0.89 1.14 1.13 0.21Uniform Delay, d1 45.3 27.5 14.6 50.5 24.1 19.2 42.4 46.1 33.8 38.0 33.7Progression Factor 1.00 1.00 1.00 0.70 0.43 0.22 1.00 1.00 1.00 1.00 1.00Incremental Delay, d2 5.1 33.0 0.3 65.5 1.1 0.6 23.7 30.6 97.3 93.7 0.3Delay (s) 50.4 60.5 14.9 100.7 11.5 4.8 66.0 76.7 131.0 131.7 34.0Level of Service D E B F B A E E F F CApproach Delay (s) 56.8 23.0 72.9 99.1Approach LOS E C E F
Intersection SummaryHCM Average Control Delay 53.3 HCM Level of Service DHCM Volume to Capacity ratio 1.07Actuated Cycle Length (s) 110.0 Sum of lost time (s) 12.0Intersection Capacity Utilization 103.5% ICU Level of Service GAnalysis Period (min) 15c Critical Lane Group
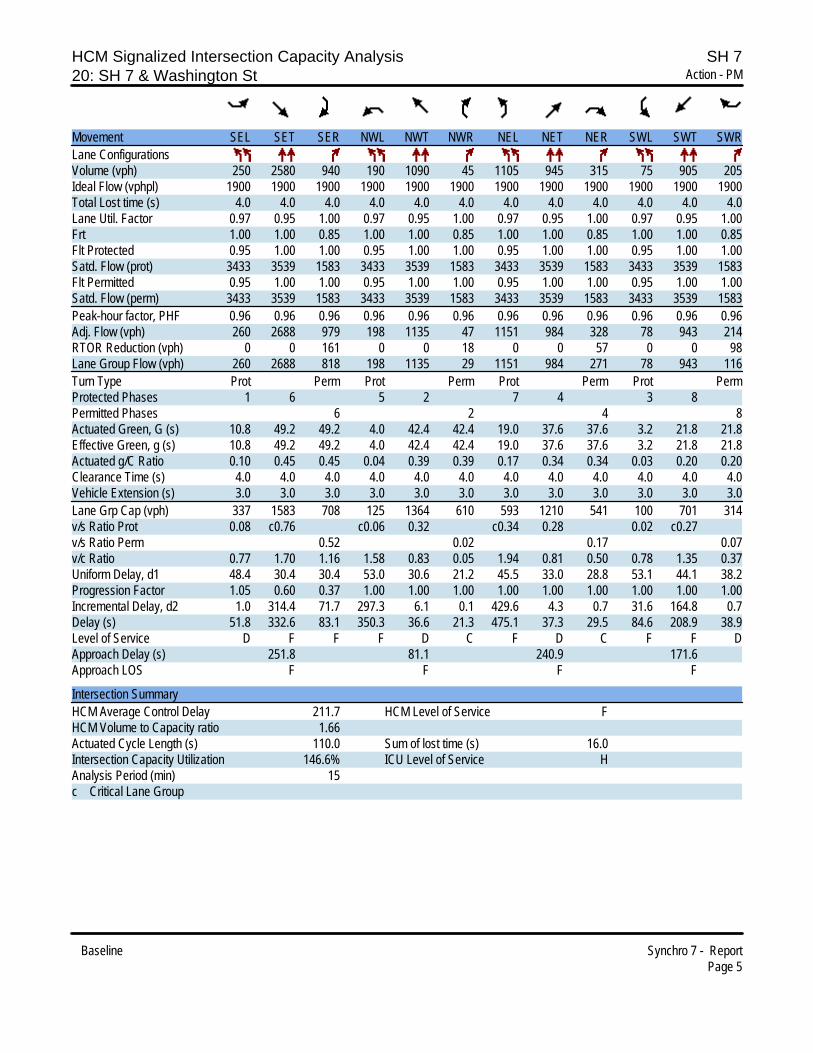
HCM Signalized Intersection Capacity Analysis SH 720: SH 7 & Washington St Action - PM
Baseline Synchro 7 - ReportPage 5
Movement SEL SET SER NWL NWT NWR NEL NET NER SWL SWT SWRLane ConfigurationsVolume (vph) 250 2580 940 190 1090 45 1105 945 315 75 905 205Ideal Flow (vphpl) 1900 1900 1900 1900 1900 1900 1900 1900 1900 1900 1900 1900Total Lost time (s) 4.0 4.0 4.0 4.0 4.0 4.0 4.0 4.0 4.0 4.0 4.0 4.0Lane Util. Factor 0.97 0.95 1.00 0.97 0.95 1.00 0.97 0.95 1.00 0.97 0.95 1.00Frt 1.00 1.00 0.85 1.00 1.00 0.85 1.00 1.00 0.85 1.00 1.00 0.85Flt Protected 0.95 1.00 1.00 0.95 1.00 1.00 0.95 1.00 1.00 0.95 1.00 1.00Satd. Flow (prot) 3433 3539 1583 3433 3539 1583 3433 3539 1583 3433 3539 1583Flt Permitted 0.95 1.00 1.00 0.95 1.00 1.00 0.95 1.00 1.00 0.95 1.00 1.00Satd. Flow (perm) 3433 3539 1583 3433 3539 1583 3433 3539 1583 3433 3539 1583Peak-hour factor, PHF 0.96 0.96 0.96 0.96 0.96 0.96 0.96 0.96 0.96 0.96 0.96 0.96Adj. Flow (vph) 260 2688 979 198 1135 47 1151 984 328 78 943 214RTOR Reduction (vph) 0 0 161 0 0 18 0 0 57 0 0 98Lane Group Flow (vph) 260 2688 818 198 1135 29 1151 984 271 78 943 116Turn Type Prot Perm Prot Perm Prot Perm Prot PermProtected Phases 1 6 5 2 7 4 3 8Permitted Phases 6 2 4 8Actuated Green, G (s) 10.8 49.2 49.2 4.0 42.4 42.4 19.0 37.6 37.6 3.2 21.8 21.8Effective Green, g (s) 10.8 49.2 49.2 4.0 42.4 42.4 19.0 37.6 37.6 3.2 21.8 21.8Actuated g/C Ratio 0.10 0.45 0.45 0.04 0.39 0.39 0.17 0.34 0.34 0.03 0.20 0.20Clearance Time (s) 4.0 4.0 4.0 4.0 4.0 4.0 4.0 4.0 4.0 4.0 4.0 4.0Vehicle Extension (s) 3.0 3.0 3.0 3.0 3.0 3.0 3.0 3.0 3.0 3.0 3.0 3.0Lane Grp Cap (vph) 337 1583 708 125 1364 610 593 1210 541 100 701 314v/s Ratio Prot 0.08 c0.76 c0.06 0.32 c0.34 0.28 0.02 c0.27v/s Ratio Perm 0.52 0.02 0.17 0.07v/c Ratio 0.77 1.70 1.16 1.58 0.83 0.05 1.94 0.81 0.50 0.78 1.35 0.37Uniform Delay, d1 48.4 30.4 30.4 53.0 30.6 21.2 45.5 33.0 28.8 53.1 44.1 38.2Progression Factor 1.05 0.60 0.37 1.00 1.00 1.00 1.00 1.00 1.00 1.00 1.00 1.00Incremental Delay, d2 1.0 314.4 71.7 297.3 6.1 0.1 429.6 4.3 0.7 31.6 164.8 0.7Delay (s) 51.8 332.6 83.1 350.3 36.6 21.3 475.1 37.3 29.5 84.6 208.9 38.9Level of Service D F F F D C F D C F F DApproach Delay (s) 251.8 81.1 240.9 171.6Approach LOS F F F F
Intersection SummaryHCM Average Control Delay 211.7 HCM Level of Service FHCM Volume to Capacity ratio 1.66Actuated Cycle Length (s) 110.0 Sum of lost time (s) 16.0Intersection Capacity Utilization 146.6% ICU Level of Service HAnalysis Period (min) 15c Critical Lane Group

Sugarmill Package A PM Traffic
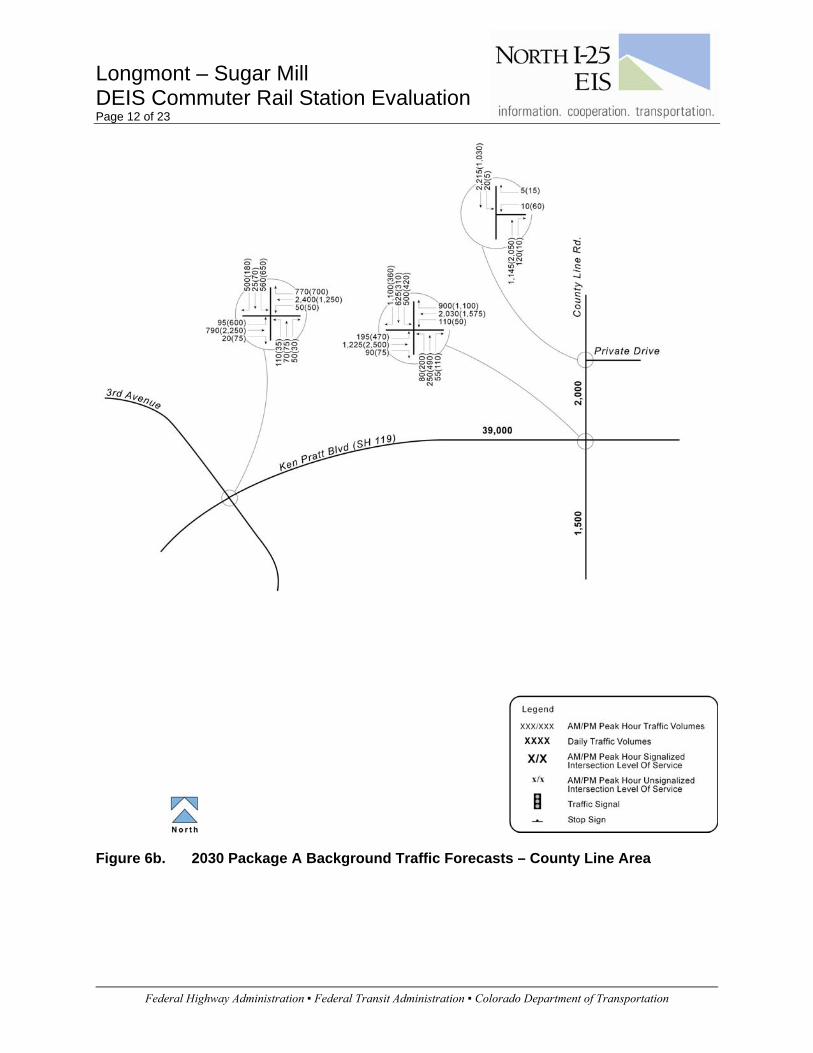
Longmont – Sugar Mill DEIS Commuter Rail Station Evaluation Page 12 of 23
Federal Highway Administration ▪ Federal Transit Administration ▪ Colorado Department of Transportation
Figure 6b. 2030 Package A Background Traffic Forecasts – County Line Area
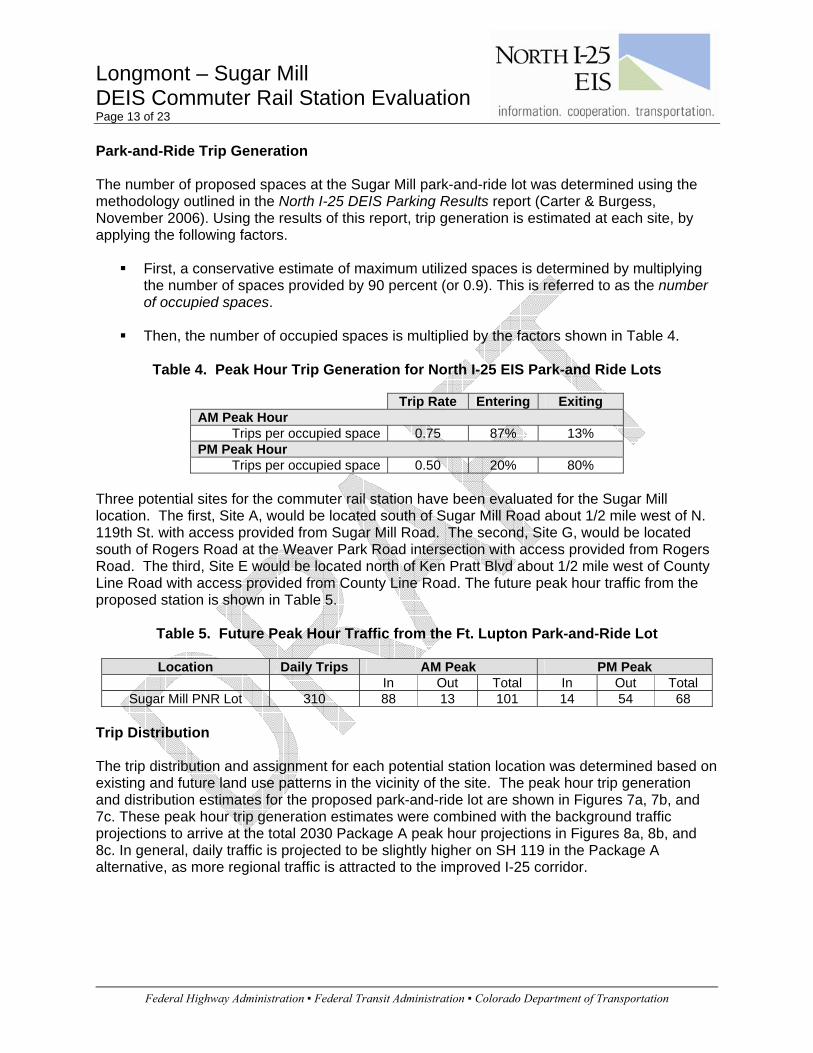
Longmont – Sugar Mill DEIS Commuter Rail Station Evaluation Page 13 of 23
Federal Highway Administration ▪ Federal Transit Administration ▪ Colorado Department of Transportation
Park-and-Ride Trip Generation
The number of proposed spaces at the Sugar Mill park-and-ride lot was determined using the methodology outlined in the North I-25 DEIS Parking Results report (Carter & Burgess, November 2006). Using the results of this report, trip generation is estimated at each site, by applying the following factors.
First, a conservative estimate of maximum utilized spaces is determined by multiplying the number of spaces provided by 90 percent (or 0.9). This is referred to as the number of occupied spaces.
Then, the number of occupied spaces is multiplied by the factors shown in Table 4.
Table 4. Peak Hour Trip Generation for North I-25 EIS Park-and Ride Lots
Trip Rate Entering Exiting
AM Peak Hour Trips per occupied space 0.75 87% 13%
PM Peak Hour Trips per occupied space 0.50 20% 80%
Three potential sites for the commuter rail station have been evaluated for the Sugar Mill location. The first, Site A, would be located south of Sugar Mill Road about 1/2 mile west of N. 119th St. with access provided from Sugar Mill Road. The second, Site G, would be located south of Rogers Road at the Weaver Park Road intersection with access provided from Rogers Road. The third, Site E would be located north of Ken Pratt Blvd about 1/2 mile west of County Line Road with access provided from County Line Road. The future peak hour traffic from the proposed station is shown in Table 5.
Table 5. Future Peak Hour Traffic from the Ft. Lupton Park-and-Ride Lot
Location Daily Trips AM Peak PM Peak In Out Total In Out Total
Sugar Mill PNR Lot 310 88 13 101 14 54 68 Trip Distribution The trip distribution and assignment for each potential station location was determined based on existing and future land use patterns in the vicinity of the site. The peak hour trip generation and distribution estimates for the proposed park-and-ride lot are shown in Figures 7a, 7b, and 7c. These peak hour trip generation estimates were combined with the background traffic projections to arrive at the total 2030 Package A peak hour projections in Figures 8a, 8b, and 8c. In general, daily traffic is projected to be slightly higher on SH 119 in the Package A alternative, as more regional traffic is attracted to the improved I-25 corridor.
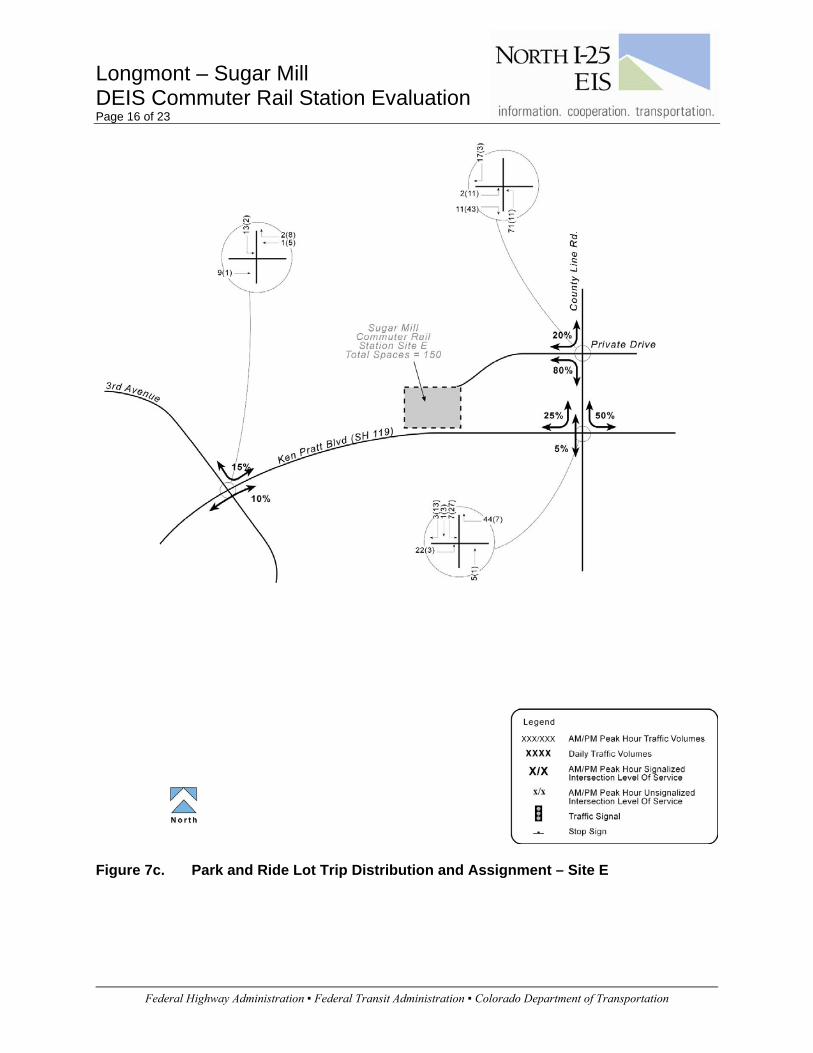
Longmont – Sugar Mill DEIS Commuter Rail Station Evaluation Page 16 of 23
Federal Highway Administration ▪ Federal Transit Administration ▪ Colorado Department of Transportation
Figure 7c. Park and Ride Lot Trip Distribution and Assignment – Site E
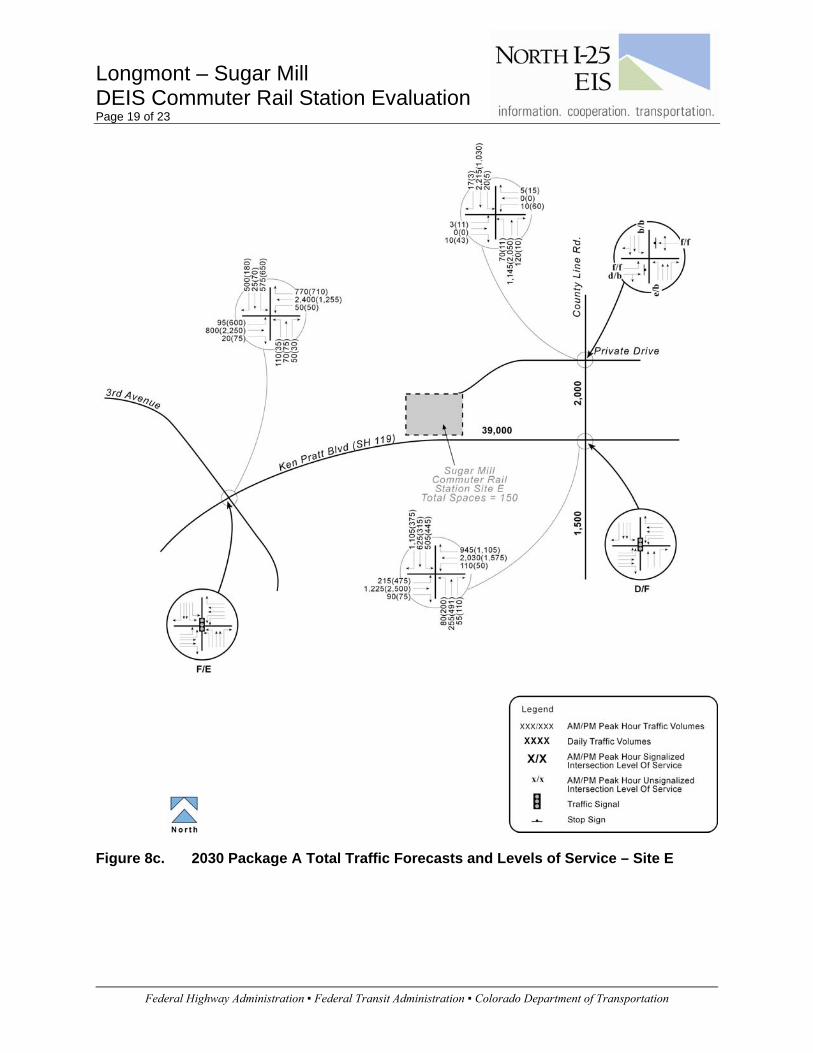
Longmont – Sugar Mill DEIS Commuter Rail Station Evaluation Page 19 of 23
Federal Highway Administration ▪ Federal Transit Administration ▪ Colorado Department of Transportation
Figure 8c. 2030 Package A Total Traffic Forecasts and Levels of Service – Site E

Sugarmill Preferred Alternative PM Traffic
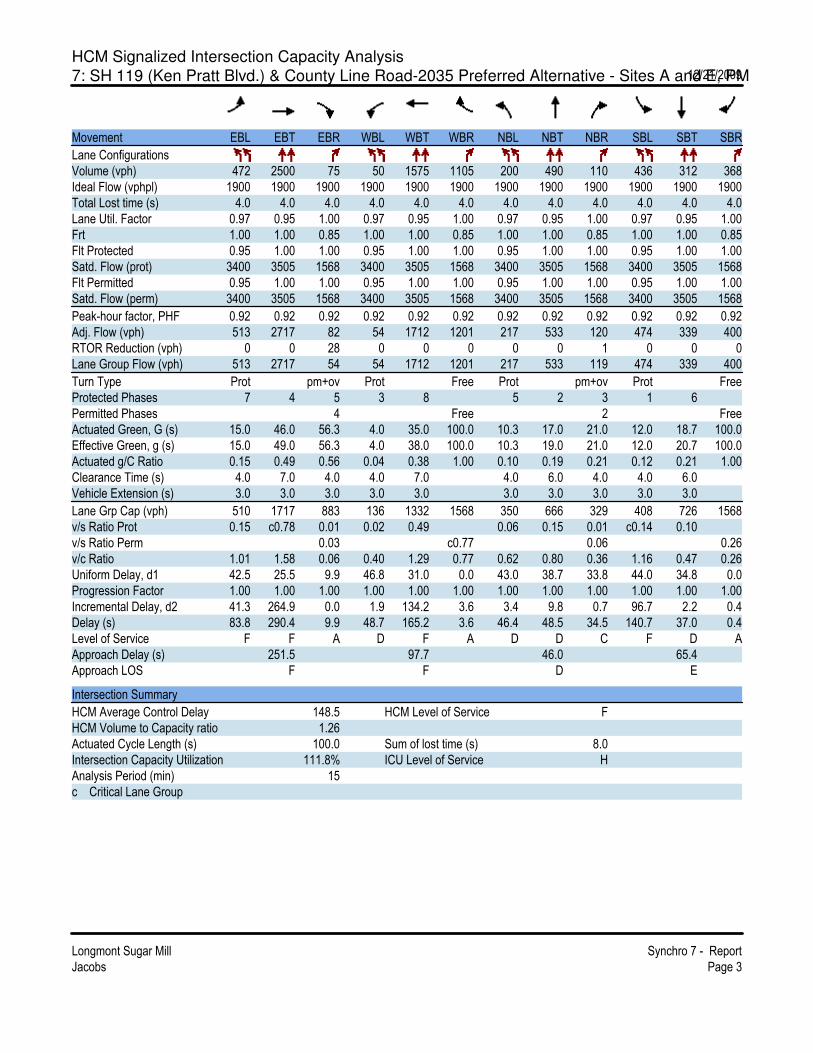
HCM Signalized Intersection Capacity Analysis
7: SH 119 (Ken Pratt Blvd.) & County Line Road-2035 Preferred Alternative - Sites A and E, PM12/21/2009
Longmont Sugar Mill Synchro 7 - Report
Jacobs Page 3
Movement EBL EBT EBR WBL WBT WBR NBL NBT NBR SBL SBT SBR
Lane Configurations
Volume (vph) 472 2500 75 50 1575 1105 200 490 110 436 312 368
Ideal Flow (vphpl) 1900 1900 1900 1900 1900 1900 1900 1900 1900 1900 1900 1900
Total Lost time (s) 4.0 4.0 4.0 4.0 4.0 4.0 4.0 4.0 4.0 4.0 4.0 4.0
Lane Util. Factor 0.97 0.95 1.00 0.97 0.95 1.00 0.97 0.95 1.00 0.97 0.95 1.00
Frt 1.00 1.00 0.85 1.00 1.00 0.85 1.00 1.00 0.85 1.00 1.00 0.85
Flt Protected 0.95 1.00 1.00 0.95 1.00 1.00 0.95 1.00 1.00 0.95 1.00 1.00
Satd. Flow (prot) 3400 3505 1568 3400 3505 1568 3400 3505 1568 3400 3505 1568
Flt Permitted 0.95 1.00 1.00 0.95 1.00 1.00 0.95 1.00 1.00 0.95 1.00 1.00
Satd. Flow (perm) 3400 3505 1568 3400 3505 1568 3400 3505 1568 3400 3505 1568
Peak-hour factor, PHF 0.92 0.92 0.92 0.92 0.92 0.92 0.92 0.92 0.92 0.92 0.92 0.92
Adj. Flow (vph) 513 2717 82 54 1712 1201 217 533 120 474 339 400
RTOR Reduction (vph) 0 0 28 0 0 0 0 0 1 0 0 0
Lane Group Flow (vph) 513 2717 54 54 1712 1201 217 533 119 474 339 400
Turn Type Prot pm+ov Prot Free Prot pm+ov Prot Free
Protected Phases 7 4 5 3 8 5 2 3 1 6
Permitted Phases 4 Free 2 Free
Actuated Green, G (s) 15.0 46.0 56.3 4.0 35.0 100.0 10.3 17.0 21.0 12.0 18.7 100.0
Effective Green, g (s) 15.0 49.0 56.3 4.0 38.0 100.0 10.3 19.0 21.0 12.0 20.7 100.0
Actuated g/C Ratio 0.15 0.49 0.56 0.04 0.38 1.00 0.10 0.19 0.21 0.12 0.21 1.00
Clearance Time (s) 4.0 7.0 4.0 4.0 7.0 4.0 6.0 4.0 4.0 6.0
Vehicle Extension (s) 3.0 3.0 3.0 3.0 3.0 3.0 3.0 3.0 3.0 3.0
Lane Grp Cap (vph) 510 1717 883 136 1332 1568 350 666 329 408 726 1568
v/s Ratio Prot 0.15 c0.78 0.01 0.02 0.49 0.06 0.15 0.01 c0.14 0.10
v/s Ratio Perm 0.03 c0.77 0.06 0.26
v/c Ratio 1.01 1.58 0.06 0.40 1.29 0.77 0.62 0.80 0.36 1.16 0.47 0.26
Uniform Delay, d1 42.5 25.5 9.9 46.8 31.0 0.0 43.0 38.7 33.8 44.0 34.8 0.0
Progression Factor 1.00 1.00 1.00 1.00 1.00 1.00 1.00 1.00 1.00 1.00 1.00 1.00
Incremental Delay, d2 41.3 264.9 0.0 1.9 134.2 3.6 3.4 9.8 0.7 96.7 2.2 0.4
Delay (s) 83.8 290.4 9.9 48.7 165.2 3.6 46.4 48.5 34.5 140.7 37.0 0.4
Level of Service F F A D F A D D C F D A
Approach Delay (s) 251.5 97.7 46.0 65.4
Approach LOS F F D E
Intersection Summary
HCM Average Control Delay 148.5 HCM Level of Service F
HCM Volume to Capacity ratio 1.26
Actuated Cycle Length (s) 100.0 Sum of lost time (s) 8.0
Intersection Capacity Utilization 111.8% ICU Level of Service H
Analysis Period (min) 15
c Critical Lane Group

Thornton Parkway Package A PM Traffic

HCM Signalized Intersection Capacity Analysis 2035 Package A - PM Peak6: Thornton Pkwy & SB Ramp 10/14/2010
2/4/2010 2035 Package A - PM Peak Synchro 7 - ReportPage 1
Movement EBL EBT EBR WBL WBT WBR NBL NBT NBR SBL SBT SBRLane ConfigurationsVolume (vph) 0 1675 250 430 1445 0 0 0 0 460 0 300Ideal Flow (vphpl) 1900 1900 1900 1900 1900 1900 1900 1900 1900 1900 1900 1900Total Lost time (s) 4.0 4.0 4.0 4.0 4.0 4.0 4.0Lane Util. Factor 0.95 1.00 0.97 0.95 0.95 0.95 1.00Frpb, ped/bikes 1.00 0.98 1.00 1.00 1.00 1.00 0.98Flpb, ped/bikes 1.00 1.00 1.00 1.00 1.00 1.00 1.00Frt 1.00 0.85 1.00 1.00 1.00 1.00 0.85Flt Protected 1.00 1.00 0.95 1.00 0.95 0.95 1.00Satd. Flow (prot) 3539 1559 3433 3539 1675 1675 1559Flt Permitted 1.00 1.00 0.95 1.00 0.95 0.95 1.00Satd. Flow (perm) 3539 1559 3433 3539 1675 1675 1559Peak-hour factor, PHF 0.92 0.92 0.92 0.92 0.92 0.92 0.92 0.92 0.92 0.92 0.92 0.92Adj. Flow (vph) 0 1821 272 467 1571 0 0 0 0 500 0 326RTOR Reduction (vph) 0 0 112 0 0 0 0 0 0 0 0 14Lane Group Flow (vph) 0 1821 160 467 1571 0 0 0 0 250 250 312Confl. Peds. (#/hr) 2 2 2 2Turn Type Perm Prot Perm PermProtected Phases 2 1 2 1 4 12Permitted Phases 2 4 12 4 12Actuated Green, G (s) 43.0 43.0 8.0 55.0 37.0 37.0 37.0Effective Green, g (s) 43.0 43.0 8.0 55.0 37.0 37.0 37.0Actuated g/C Ratio 0.43 0.43 0.08 0.55 0.37 0.37 0.37Clearance Time (s) 4.0 4.0 4.0Vehicle Extension (s) 3.0 3.0 3.0Lane Grp Cap (vph) 1522 670 275 1946 620 620 577v/s Ratio Prot c0.51 c0.14 0.44v/s Ratio Perm 0.10 0.15 0.15 c0.20v/c Ratio 1.20 0.24 1.70 0.81 0.40 0.40 0.54Uniform Delay, d1 28.5 18.1 46.0 18.2 23.3 23.3 24.8Progression Factor 1.02 1.68 0.60 0.27 1.00 1.00 1.00Incremental Delay, d2 94.3 0.7 315.6 0.2 0.4 0.4 1.0Delay (s) 123.4 31.1 343.0 5.2 23.8 23.8 25.9Level of Service F C F A C C CApproach Delay (s) 111.4 82.6 0.0 24.6Approach LOS F F A C
Intersection SummaryHCM Average Control Delay 85.1 HCM Level of Service FHCM Volume to Capacity ratio 0.97Actuated Cycle Length (s) 100.0 Sum of lost time (s) 12.0Intersection Capacity Utilization 95.6% ICU Level of Service FAnalysis Period (min) 15c Critical Lane Group

HCM Signalized Intersection Capacity Analysis 2035 Package A - PM Peak9: Thornton Pkwy & NB Ramp 10/14/2010
2/4/2010 2035 Package A - PM Peak Synchro 7 - ReportPage 2
Movement EBL EBT EBR WBL WBT WBR NBL NBT NBR SBL SBT SBRLane ConfigurationsVolume (vph) 350 1785 0 0 1725 425 150 0 640 0 0 0Ideal Flow (vphpl) 1900 1900 1900 1900 1900 1900 1900 1900 1900 1900 1900 1900Total Lost time (s) 4.0 4.0 4.0 4.0 4.0 4.0 4.0Lane Util. Factor 1.00 0.95 0.95 1.00 0.95 0.95 1.00Frpb, ped/bikes 1.00 1.00 1.00 1.00 1.00 1.00 1.00Flpb, ped/bikes 1.00 1.00 1.00 1.00 1.00 1.00 1.00Frt 1.00 1.00 1.00 0.85 1.00 1.00 0.85Flt Protected 0.95 1.00 1.00 1.00 0.95 0.95 1.00Satd. Flow (prot) 1770 3539 3539 1583 1675 1675 1583Flt Permitted 0.95 1.00 1.00 1.00 0.95 0.95 1.00Satd. Flow (perm) 1770 3539 3539 1583 1675 1675 1583Peak-hour factor, PHF 0.92 0.92 0.92 0.92 0.92 0.92 0.92 0.92 0.92 0.92 0.92 0.92Adj. Flow (vph) 380 1940 0 0 1875 462 163 0 696 0 0 0RTOR Reduction (vph) 0 0 0 0 0 185 0 0 5 0 0 0Lane Group Flow (vph) 380 1940 0 0 1875 277 81 82 691 0 0 0Confl. Peds. (#/hr) 2 2Turn Type Prot Perm Perm PermProtected Phases 5 5 6 6 8 16Permitted Phases 6 8 16 8 16Actuated Green, G (s) 14.0 55.0 37.0 37.0 37.0 37.0 37.0Effective Green, g (s) 14.0 55.0 37.0 37.0 37.0 37.0 37.0Actuated g/C Ratio 0.14 0.55 0.37 0.37 0.37 0.37 0.37Clearance Time (s) 4.0 4.0 4.0Vehicle Extension (s) 3.0 3.0 3.0Lane Grp Cap (vph) 248 1946 1309 586 620 620 586v/s Ratio Prot c0.21 c0.55 c0.53v/s Ratio Perm 0.17 0.05 0.05 c0.44v/c Ratio 1.53 1.00 1.43 0.47 0.13 0.13 1.18Uniform Delay, d1 43.0 22.4 31.5 24.0 20.9 20.9 31.5Progression Factor 0.66 0.34 0.70 0.35 1.00 1.00 1.00Incremental Delay, d2 241.4 5.4 197.9 0.4 0.1 0.1 97.3Delay (s) 269.9 13.0 219.9 9.0 20.9 21.0 128.8Level of Service F B F A C C FApproach Delay (s) 55.1 178.2 108.4 0.0Approach LOS E F F A
Intersection SummaryHCM Average Control Delay 115.5 HCM Level of Service FHCM Volume to Capacity ratio 1.29Actuated Cycle Length (s) 100.0 Sum of lost time (s) 8.0Intersection Capacity Utilization 95.6% ICU Level of Service FAnalysis Period (min) 15c Critical Lane Group

Thornton Parkway Package B PM Traffic
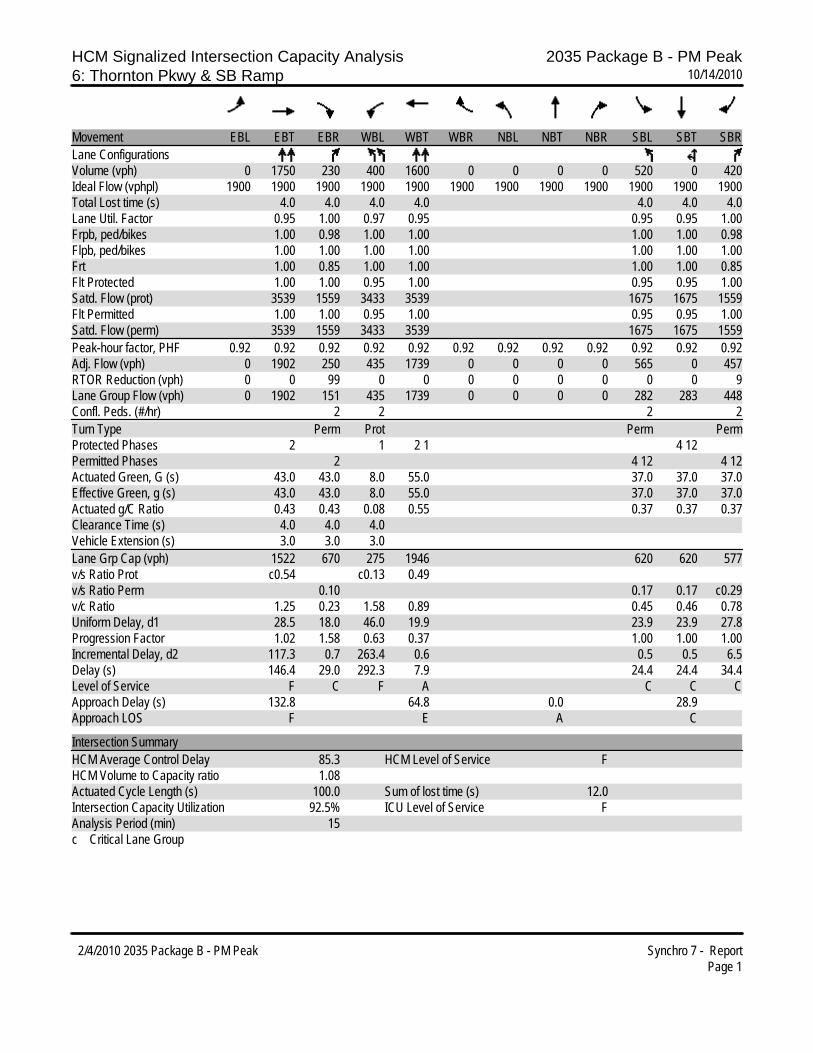
HCM Signalized Intersection Capacity Analysis 2035 Package B - PM Peak6: Thornton Pkwy & SB Ramp 10/14/2010
2/4/2010 2035 Package B - PM Peak Synchro 7 - ReportPage 1
Movement EBL EBT EBR WBL WBT WBR NBL NBT NBR SBL SBT SBRLane ConfigurationsVolume (vph) 0 1750 230 400 1600 0 0 0 0 520 0 420Ideal Flow (vphpl) 1900 1900 1900 1900 1900 1900 1900 1900 1900 1900 1900 1900Total Lost time (s) 4.0 4.0 4.0 4.0 4.0 4.0 4.0Lane Util. Factor 0.95 1.00 0.97 0.95 0.95 0.95 1.00Frpb, ped/bikes 1.00 0.98 1.00 1.00 1.00 1.00 0.98Flpb, ped/bikes 1.00 1.00 1.00 1.00 1.00 1.00 1.00Frt 1.00 0.85 1.00 1.00 1.00 1.00 0.85Flt Protected 1.00 1.00 0.95 1.00 0.95 0.95 1.00Satd. Flow (prot) 3539 1559 3433 3539 1675 1675 1559Flt Permitted 1.00 1.00 0.95 1.00 0.95 0.95 1.00Satd. Flow (perm) 3539 1559 3433 3539 1675 1675 1559Peak-hour factor, PHF 0.92 0.92 0.92 0.92 0.92 0.92 0.92 0.92 0.92 0.92 0.92 0.92Adj. Flow (vph) 0 1902 250 435 1739 0 0 0 0 565 0 457RTOR Reduction (vph) 0 0 99 0 0 0 0 0 0 0 0 9Lane Group Flow (vph) 0 1902 151 435 1739 0 0 0 0 282 283 448Confl. Peds. (#/hr) 2 2 2 2Turn Type Perm Prot Perm PermProtected Phases 2 1 2 1 4 12Permitted Phases 2 4 12 4 12Actuated Green, G (s) 43.0 43.0 8.0 55.0 37.0 37.0 37.0Effective Green, g (s) 43.0 43.0 8.0 55.0 37.0 37.0 37.0Actuated g/C Ratio 0.43 0.43 0.08 0.55 0.37 0.37 0.37Clearance Time (s) 4.0 4.0 4.0Vehicle Extension (s) 3.0 3.0 3.0Lane Grp Cap (vph) 1522 670 275 1946 620 620 577v/s Ratio Prot c0.54 c0.13 0.49v/s Ratio Perm 0.10 0.17 0.17 c0.29v/c Ratio 1.25 0.23 1.58 0.89 0.45 0.46 0.78Uniform Delay, d1 28.5 18.0 46.0 19.9 23.9 23.9 27.8Progression Factor 1.02 1.58 0.63 0.37 1.00 1.00 1.00Incremental Delay, d2 117.3 0.7 263.4 0.6 0.5 0.5 6.5Delay (s) 146.4 29.0 292.3 7.9 24.4 24.4 34.4Level of Service F C F A C C CApproach Delay (s) 132.8 64.8 0.0 28.9Approach LOS F E A C
Intersection SummaryHCM Average Control Delay 85.3 HCM Level of Service FHCM Volume to Capacity ratio 1.08Actuated Cycle Length (s) 100.0 Sum of lost time (s) 12.0Intersection Capacity Utilization 92.5% ICU Level of Service FAnalysis Period (min) 15c Critical Lane Group
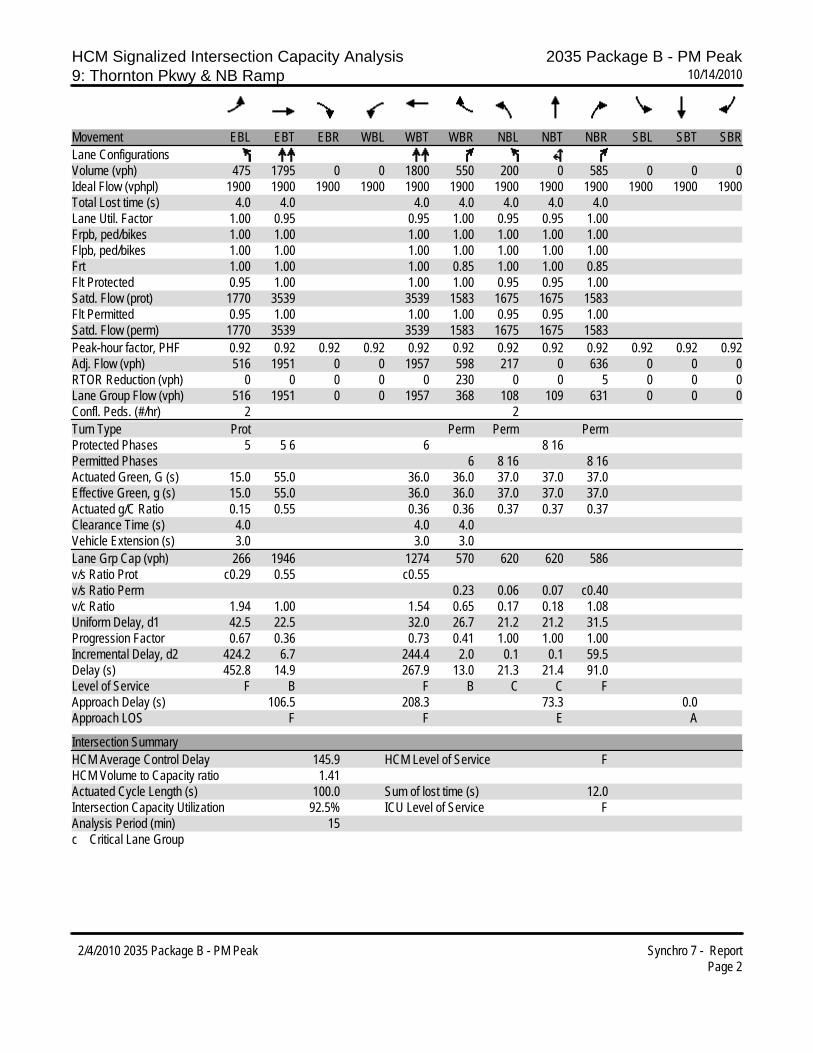
HCM Signalized Intersection Capacity Analysis 2035 Package B - PM Peak9: Thornton Pkwy & NB Ramp 10/14/2010
2/4/2010 2035 Package B - PM Peak Synchro 7 - ReportPage 2
Movement EBL EBT EBR WBL WBT WBR NBL NBT NBR SBL SBT SBRLane ConfigurationsVolume (vph) 475 1795 0 0 1800 550 200 0 585 0 0 0Ideal Flow (vphpl) 1900 1900 1900 1900 1900 1900 1900 1900 1900 1900 1900 1900Total Lost time (s) 4.0 4.0 4.0 4.0 4.0 4.0 4.0Lane Util. Factor 1.00 0.95 0.95 1.00 0.95 0.95 1.00Frpb, ped/bikes 1.00 1.00 1.00 1.00 1.00 1.00 1.00Flpb, ped/bikes 1.00 1.00 1.00 1.00 1.00 1.00 1.00Frt 1.00 1.00 1.00 0.85 1.00 1.00 0.85Flt Protected 0.95 1.00 1.00 1.00 0.95 0.95 1.00Satd. Flow (prot) 1770 3539 3539 1583 1675 1675 1583Flt Permitted 0.95 1.00 1.00 1.00 0.95 0.95 1.00Satd. Flow (perm) 1770 3539 3539 1583 1675 1675 1583Peak-hour factor, PHF 0.92 0.92 0.92 0.92 0.92 0.92 0.92 0.92 0.92 0.92 0.92 0.92Adj. Flow (vph) 516 1951 0 0 1957 598 217 0 636 0 0 0RTOR Reduction (vph) 0 0 0 0 0 230 0 0 5 0 0 0Lane Group Flow (vph) 516 1951 0 0 1957 368 108 109 631 0 0 0Confl. Peds. (#/hr) 2 2Turn Type Prot Perm Perm PermProtected Phases 5 5 6 6 8 16Permitted Phases 6 8 16 8 16Actuated Green, G (s) 15.0 55.0 36.0 36.0 37.0 37.0 37.0Effective Green, g (s) 15.0 55.0 36.0 36.0 37.0 37.0 37.0Actuated g/C Ratio 0.15 0.55 0.36 0.36 0.37 0.37 0.37Clearance Time (s) 4.0 4.0 4.0Vehicle Extension (s) 3.0 3.0 3.0Lane Grp Cap (vph) 266 1946 1274 570 620 620 586v/s Ratio Prot c0.29 0.55 c0.55v/s Ratio Perm 0.23 0.06 0.07 c0.40v/c Ratio 1.94 1.00 1.54 0.65 0.17 0.18 1.08Uniform Delay, d1 42.5 22.5 32.0 26.7 21.2 21.2 31.5Progression Factor 0.67 0.36 0.73 0.41 1.00 1.00 1.00Incremental Delay, d2 424.2 6.7 244.4 2.0 0.1 0.1 59.5Delay (s) 452.8 14.9 267.9 13.0 21.3 21.4 91.0Level of Service F B F B C C FApproach Delay (s) 106.5 208.3 73.3 0.0Approach LOS F F E A
Intersection SummaryHCM Average Control Delay 145.9 HCM Level of Service FHCM Volume to Capacity ratio 1.41Actuated Cycle Length (s) 100.0 Sum of lost time (s) 12.0Intersection Capacity Utilization 92.5% ICU Level of Service FAnalysis Period (min) 15c Critical Lane Group

Thornton Parkway Preferred Alternative PM Traffic

Lanes, Volumes, Timings1: Thornton Pkwy & Civic Dr 5/27/2010
2/4/2010 Preferred Alternative - PM Peak Synchro 7 - ReportPage 1
Lane Group EBL EBT WBT WBR SBL SBRLane ConfigurationsVolume (vph) 40 2090 1730 35 150 140Ideal Flow (vphpl) 1900 1900 1900 1900 1900 1900Storage Length (ft) 200 0 275 0Storage Lanes 1 1 1 1Taper Length (ft) 25 25 25 25Lane Util. Factor 1.00 0.91 0.95 1.00 1.00 1.00Ped Bike Factor 1.00 0.97 1.00Frt 0.850 0.850Flt Protected 0.950 0.950Satd. Flow (prot) 1770 5085 3539 1583 1770 1583Flt Permitted 0.950 0.950Satd. Flow (perm) 1769 5085 3539 1542 1763 1583Right Turn on Red Yes YesSatd. Flow (RTOR) 38 112Link Speed (mph) 35 35 15Link Distance (ft) 831 962 584Travel Time (s) 16.2 18.7 26.5Confl. Peds. (#/hr) 2 2 2Peak Hour Factor 0.92 0.92 0.92 0.92 0.92 0.92Adj. Flow (vph) 43 2272 1880 38 163 152Shared Lane Traffic (%)Lane Group Flow (vph) 43 2272 1880 38 163 152Enter Blocked Intersection No No No No No NoLane Alignment Left Left Left Right Left RightMedian Width(ft) 24 24 12Link Offset(ft) 0 0 0Crosswalk Width(ft) 16 16 16Two way Left Turn LaneHeadway Factor 1.00 1.00 1.00 1.00 1.00 1.00Turning Speed (mph) 15 9 15 9Number of Detectors 1 1 1 1 1 1Detector Template Leading Detector (ft) 50 50 50 50 50 50Trailing Detector (ft) 0 0 0 0 0 0Detector 1 Position(ft) 0 0 0 0 0 0Detector 1 Size(ft) 50 50 50 50 50 50Detector 1 Type Cl+Ex Cl+Ex Cl+Ex Cl+Ex Cl+Ex Cl+ExDetector 1 ChannelDetector 1 Extend (s) 0.0 0.0 0.0 0.0 0.0 0.0Detector 1 Queue (s) 0.0 0.0 0.0 0.0 0.0 0.0Detector 1 Delay (s) 0.0 0.0 0.0 0.0 0.0 0.0Turn Type Prot Perm PermProtected Phases 1 6 2 3Permitted Phases 2 3Detector Phase 1 6 2 2 3 3Switch PhaseMinimum Initial (s) 4.0 4.0 4.0 4.0 4.0 4.0Minimum Split (s) 8.0 21.0 21.0 21.0 21.0 21.0

Lanes, Volumes, Timings1: Thornton Pkwy & Civic Dr 5/27/2010
2/4/2010 Preferred Alternative - PM Peak Synchro 7 - ReportPage 2
Lane Group EBL EBT WBT WBR SBL SBRTotal Split (s) 10.0 79.0 69.0 69.0 21.0 21.0Total Split (%) 10.0% 79.0% 69.0% 69.0% 21.0% 21.0%Maximum Green (s) 6.0 75.0 65.0 65.0 17.0 17.0Yellow Time (s) 3.0 3.0 3.0 3.0 3.0 3.0All-Red Time (s) 1.0 1.0 1.0 1.0 1.0 1.0Lost Time Adjust (s) 0.0 0.0 0.0 0.0 0.0 0.0Total Lost Time (s) 4.0 4.0 4.0 4.0 4.0 4.0Lead/Lag Lag Lead LeadLead-Lag Optimize? Yes Yes YesVehicle Extension (s) 3.0 3.0 3.0 3.0 3.0 3.0Recall Mode None C-Max None None Max MaxWalk Time (s) 5.0 5.0 5.0 5.0 5.0Flash Dont Walk (s) 11.0 11.0 11.0 11.0 11.0Pedestrian Calls (#/hr) 0 0 0 0 0Act Effct Green (s) 6.0 75.0 69.0 69.0 17.0 17.0Actuated g/C Ratio 0.06 0.75 0.69 0.69 0.17 0.17v/c Ratio 0.40 0.60 0.77 0.04 0.54 0.42Control Delay 50.9 8.1 13.3 0.9 45.5 16.0Queue Delay 0.0 0.0 0.0 0.0 0.0 0.0Total Delay 50.9 8.1 13.3 0.9 45.5 16.0LOS D A B A D BApproach Delay 8.9 13.1 31.2Approach LOS A B C
Intersection SummaryArea Type: OtherCycle Length: 100Actuated Cycle Length: 100Offset: 72 (72%), Referenced to phase 6:EBT, Start of GreenNatural Cycle: 75Control Type: Actuated-CoordinatedMaximum v/c Ratio: 0.77Intersection Signal Delay: 12.2 Intersection LOS: BIntersection Capacity Utilization 63.2% ICU Level of Service BAnalysis Period (min) 15
Splits and Phases: 1: Thornton Pkwy & Civic Dr

Lanes, Volumes, Timings4: Thornton Pkwy & Grant St 5/27/2010
2/4/2010 Preferred Alternative - PM Peak Synchro 7 - ReportPage 3
Lane Group EBL EBT EBR WBL WBT WBR NBL NBT NBR SBL SBT SBRLane ConfigurationsVolume (vph) 650 1415 175 60 965 175 275 500 125 225 250 525Ideal Flow (vphpl) 1900 1900 1900 1900 1900 1900 1900 1900 1900 1900 1900 1900Storage Length (ft) 350 0 375 0 200 200 225 0Storage Lanes 2 0 2 1 1 1 1 1Taper Length (ft) 25 25 25 25 25 25 25 25Lane Util. Factor 0.97 0.91 0.91 0.97 0.95 1.00 1.00 0.95 1.00 1.00 0.95 1.00Ped Bike Factor 1.00 1.00 1.00 1.00Frt 0.984 0.850 0.850 0.850Flt Protected 0.950 0.950 0.950 0.950Satd. Flow (prot) 3433 5004 0 3433 3539 1583 1770 3539 1583 1770 3539 1583Flt Permitted 0.950 0.950 0.950 0.950Satd. Flow (perm) 3428 5004 0 3431 3539 1583 1765 3539 1583 1766 3539 1583Right Turn on Red Yes Yes Yes YesSatd. Flow (RTOR) 27 22 34 40Link Speed (mph) 35 35 35 35Link Distance (ft) 962 540 544 593Travel Time (s) 18.7 10.5 10.6 11.6Confl. Peds. (#/hr) 2 2 2 2Peak Hour Factor 0.92 0.92 0.92 0.92 0.92 0.92 0.92 0.92 0.92 0.92 0.92 0.92Adj. Flow (vph) 707 1538 190 65 1049 190 299 543 136 245 272 571Shared Lane Traffic (%)Lane Group Flow (vph) 707 1728 0 65 1049 190 299 543 136 245 272 571Enter Blocked Intersection No No No No No No No No No No No NoLane Alignment Left Left Right Left Left Right Left Left Right Left Left RightMedian Width(ft) 24 24 12 12Link Offset(ft) 0 0 0 0Crosswalk Width(ft) 16 16 16 16Two way Left Turn LaneHeadway Factor 1.00 1.00 1.00 1.00 1.00 1.00 1.00 1.00 1.00 1.00 1.00 1.00Turning Speed (mph) 15 9 15 9 15 9 15 9Number of Detectors 1 1 1 1 1 1 1 1 1 1 1Detector Template Leading Detector (ft) 50 50 50 50 50 50 50 50 50 50 50Trailing Detector (ft) 0 0 0 0 0 0 0 0 0 0 0Detector 1 Position(ft) 0 0 0 0 0 0 0 0 0 0 0Detector 1 Size(ft) 50 50 50 50 50 50 50 50 50 50 50Detector 1 Type Cl+Ex Cl+Ex Cl+Ex Cl+Ex Cl+Ex Cl+Ex Cl+Ex Cl+Ex Cl+Ex Cl+Ex Cl+ExDetector 1 ChannelDetector 1 Extend (s) 0.0 0.0 0.0 0.0 0.0 0.0 0.0 0.0 0.0 0.0 0.0Detector 1 Queue (s) 0.0 0.0 0.0 0.0 0.0 0.0 0.0 0.0 0.0 0.0 0.0Detector 1 Delay (s) 0.0 0.0 0.0 0.0 0.0 0.0 0.0 0.0 0.0 0.0 0.0Turn Type Prot Prot pm+ov Prot pm+ov Prot pm+ovProtected Phases 7 4 3 8 1 5 2 3 1 6 7Permitted Phases 8 2 6Detector Phase 7 4 3 8 1 5 2 3 1 6 7Switch PhaseMinimum Initial (s) 4.0 4.0 4.0 4.0 4.0 4.0 4.0 4.0 4.0 4.0 4.0Minimum Split (s) 8.0 21.0 8.0 21.0 8.0 8.0 21.0 8.0 8.0 21.0 8.0
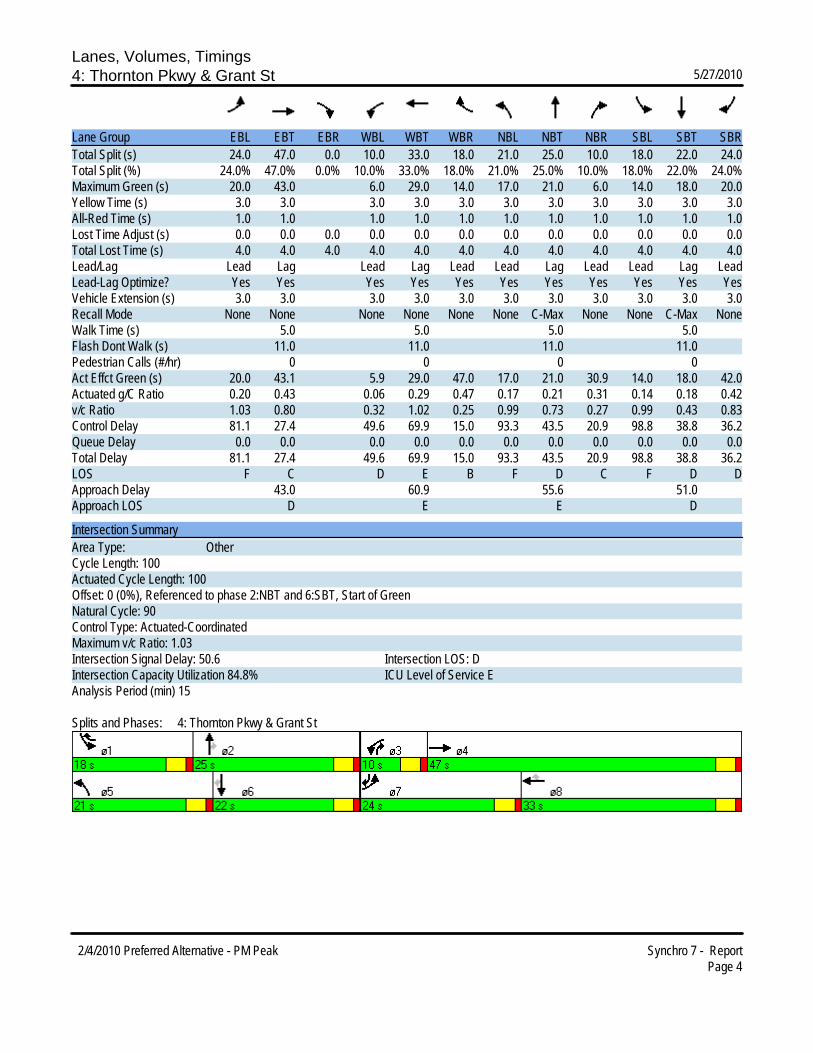
Lanes, Volumes, Timings4: Thornton Pkwy & Grant St 5/27/2010
2/4/2010 Preferred Alternative - PM Peak Synchro 7 - ReportPage 4
Lane Group EBL EBT EBR WBL WBT WBR NBL NBT NBR SBL SBT SBRTotal Split (s) 24.0 47.0 0.0 10.0 33.0 18.0 21.0 25.0 10.0 18.0 22.0 24.0Total Split (%) 24.0% 47.0% 0.0% 10.0% 33.0% 18.0% 21.0% 25.0% 10.0% 18.0% 22.0% 24.0%Maximum Green (s) 20.0 43.0 6.0 29.0 14.0 17.0 21.0 6.0 14.0 18.0 20.0Yellow Time (s) 3.0 3.0 3.0 3.0 3.0 3.0 3.0 3.0 3.0 3.0 3.0All-Red Time (s) 1.0 1.0 1.0 1.0 1.0 1.0 1.0 1.0 1.0 1.0 1.0Lost Time Adjust (s) 0.0 0.0 0.0 0.0 0.0 0.0 0.0 0.0 0.0 0.0 0.0 0.0Total Lost Time (s) 4.0 4.0 4.0 4.0 4.0 4.0 4.0 4.0 4.0 4.0 4.0 4.0Lead/Lag Lead Lag Lead Lag Lead Lead Lag Lead Lead Lag LeadLead-Lag Optimize? Yes Yes Yes Yes Yes Yes Yes Yes Yes Yes YesVehicle Extension (s) 3.0 3.0 3.0 3.0 3.0 3.0 3.0 3.0 3.0 3.0 3.0Recall Mode None None None None None None C-Max None None C-Max NoneWalk Time (s) 5.0 5.0 5.0 5.0Flash Dont Walk (s) 11.0 11.0 11.0 11.0Pedestrian Calls (#/hr) 0 0 0 0Act Effct Green (s) 20.0 43.1 5.9 29.0 47.0 17.0 21.0 30.9 14.0 18.0 42.0Actuated g/C Ratio 0.20 0.43 0.06 0.29 0.47 0.17 0.21 0.31 0.14 0.18 0.42v/c Ratio 1.03 0.80 0.32 1.02 0.25 0.99 0.73 0.27 0.99 0.43 0.83Control Delay 81.1 27.4 49.6 69.9 15.0 93.3 43.5 20.9 98.8 38.8 36.2Queue Delay 0.0 0.0 0.0 0.0 0.0 0.0 0.0 0.0 0.0 0.0 0.0Total Delay 81.1 27.4 49.6 69.9 15.0 93.3 43.5 20.9 98.8 38.8 36.2LOS F C D E B F D C F D DApproach Delay 43.0 60.9 55.6 51.0Approach LOS D E E D
Intersection SummaryArea Type: OtherCycle Length: 100Actuated Cycle Length: 100Offset: 0 (0%), Referenced to phase 2:NBT and 6:SBT, Start of GreenNatural Cycle: 90Control Type: Actuated-CoordinatedMaximum v/c Ratio: 1.03Intersection Signal Delay: 50.6 Intersection LOS: DIntersection Capacity Utilization 84.8% ICU Level of Service EAnalysis Period (min) 15
Splits and Phases: 4: Thornton Pkwy & Grant St
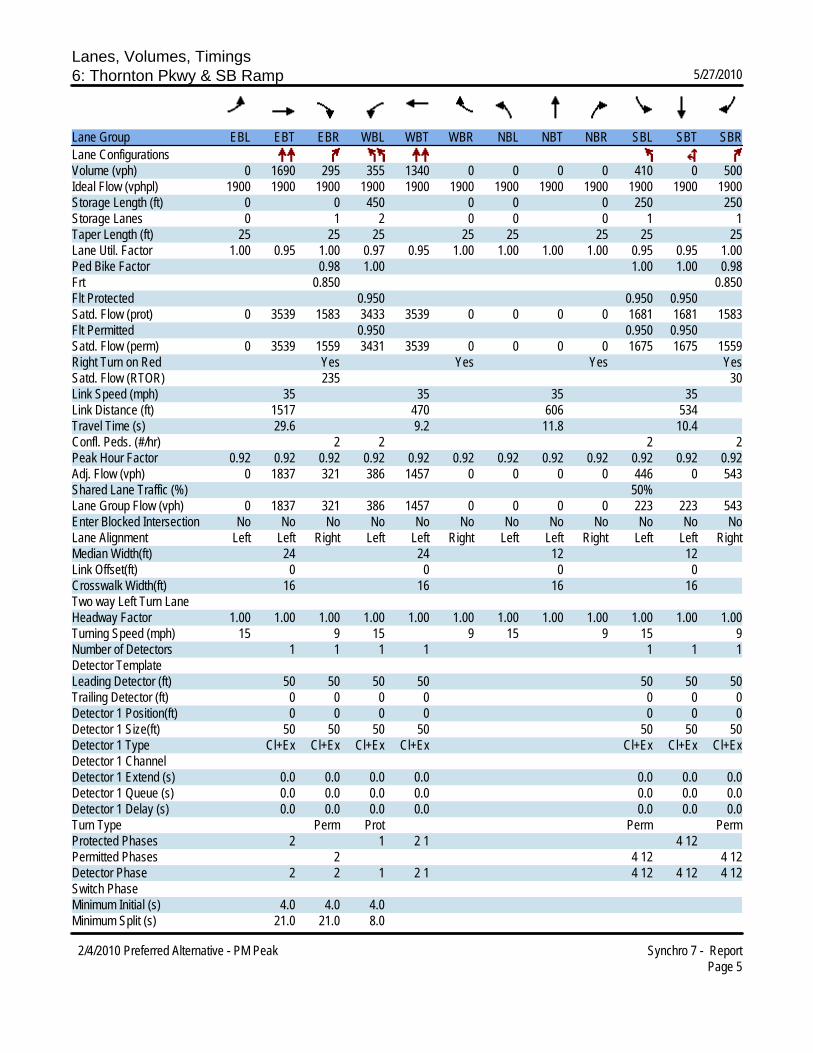
Lanes, Volumes, Timings6: Thornton Pkwy & SB Ramp 5/27/2010
2/4/2010 Preferred Alternative - PM Peak Synchro 7 - ReportPage 5
Lane Group EBL EBT EBR WBL WBT WBR NBL NBT NBR SBL SBT SBRLane ConfigurationsVolume (vph) 0 1690 295 355 1340 0 0 0 0 410 0 500Ideal Flow (vphpl) 1900 1900 1900 1900 1900 1900 1900 1900 1900 1900 1900 1900Storage Length (ft) 0 0 450 0 0 0 250 250Storage Lanes 0 1 2 0 0 0 1 1Taper Length (ft) 25 25 25 25 25 25 25 25Lane Util. Factor 1.00 0.95 1.00 0.97 0.95 1.00 1.00 1.00 1.00 0.95 0.95 1.00Ped Bike Factor 0.98 1.00 1.00 1.00 0.98Frt 0.850 0.850Flt Protected 0.950 0.950 0.950Satd. Flow (prot) 0 3539 1583 3433 3539 0 0 0 0 1681 1681 1583Flt Permitted 0.950 0.950 0.950Satd. Flow (perm) 0 3539 1559 3431 3539 0 0 0 0 1675 1675 1559Right Turn on Red Yes Yes Yes YesSatd. Flow (RTOR) 235 30Link Speed (mph) 35 35 35 35Link Distance (ft) 1517 470 606 534Travel Time (s) 29.6 9.2 11.8 10.4Confl. Peds. (#/hr) 2 2 2 2Peak Hour Factor 0.92 0.92 0.92 0.92 0.92 0.92 0.92 0.92 0.92 0.92 0.92 0.92Adj. Flow (vph) 0 1837 321 386 1457 0 0 0 0 446 0 543Shared Lane Traffic (%) 50%Lane Group Flow (vph) 0 1837 321 386 1457 0 0 0 0 223 223 543Enter Blocked Intersection No No No No No No No No No No No NoLane Alignment Left Left Right Left Left Right Left Left Right Left Left RightMedian Width(ft) 24 24 12 12Link Offset(ft) 0 0 0 0Crosswalk Width(ft) 16 16 16 16Two way Left Turn LaneHeadway Factor 1.00 1.00 1.00 1.00 1.00 1.00 1.00 1.00 1.00 1.00 1.00 1.00Turning Speed (mph) 15 9 15 9 15 9 15 9Number of Detectors 1 1 1 1 1 1 1Detector Template Leading Detector (ft) 50 50 50 50 50 50 50Trailing Detector (ft) 0 0 0 0 0 0 0Detector 1 Position(ft) 0 0 0 0 0 0 0Detector 1 Size(ft) 50 50 50 50 50 50 50Detector 1 Type Cl+Ex Cl+Ex Cl+Ex Cl+Ex Cl+Ex Cl+Ex Cl+ExDetector 1 ChannelDetector 1 Extend (s) 0.0 0.0 0.0 0.0 0.0 0.0 0.0Detector 1 Queue (s) 0.0 0.0 0.0 0.0 0.0 0.0 0.0Detector 1 Delay (s) 0.0 0.0 0.0 0.0 0.0 0.0 0.0Turn Type Perm Prot Perm PermProtected Phases 2 1 2 1 4 12Permitted Phases 2 4 12 4 12Detector Phase 2 2 1 2 1 4 12 4 12 4 12Switch PhaseMinimum Initial (s) 4.0 4.0 4.0Minimum Split (s) 21.0 21.0 8.0

Lanes, Volumes, Timings6: Thornton Pkwy & SB Ramp 5/27/2010
2/4/2010 Preferred Alternative - PM Peak Synchro 7 - ReportPage 6
Lane Group ø4 ø5 ø6 ø8 ø12 ø16Lane ConfigurationsVolume (vph)Ideal Flow (vphpl)Storage Length (ft)Storage LanesTaper Length (ft)Lane Util. FactorPed Bike FactorFrtFlt ProtectedSatd. Flow (prot)Flt PermittedSatd. Flow (perm)Right Turn on RedSatd. Flow (RTOR)Link Speed (mph)Link Distance (ft)Travel Time (s)Confl. Peds. (#/hr)Peak Hour FactorAdj. Flow (vph)Shared Lane Traffic (%)Lane Group Flow (vph)Enter Blocked IntersectionLane AlignmentMedian Width(ft)Link Offset(ft)Crosswalk Width(ft)Two way Left Turn LaneHeadway FactorTurning Speed (mph)Number of Detectors Detector Template Leading Detector (ft)Trailing Detector (ft)Detector 1 Position(ft)Detector 1 Size(ft)Detector 1 TypeDetector 1 ChannelDetector 1 Extend (s)Detector 1 Queue (s)Detector 1 Delay (s)Turn TypeProtected Phases 4 5 6 8 12 16Permitted PhasesDetector PhaseSwitch PhaseMinimum Initial (s) 4.0 4.0 4.0 4.0 4.0 4.0Minimum Split (s) 21.0 8.0 20.0 21.0 20.0 20.0
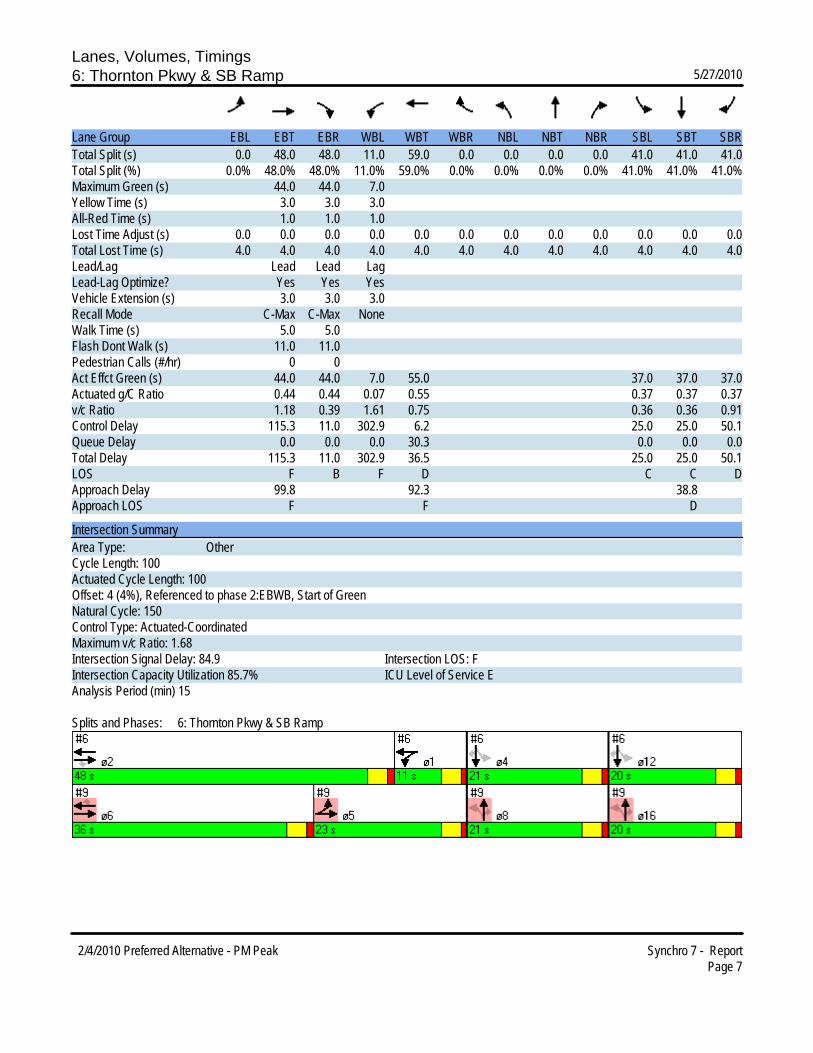
Lanes, Volumes, Timings6: Thornton Pkwy & SB Ramp 5/27/2010
2/4/2010 Preferred Alternative - PM Peak Synchro 7 - ReportPage 7
Lane Group EBL EBT EBR WBL WBT WBR NBL NBT NBR SBL SBT SBRTotal Split (s) 0.0 48.0 48.0 11.0 59.0 0.0 0.0 0.0 0.0 41.0 41.0 41.0Total Split (%) 0.0% 48.0% 48.0% 11.0% 59.0% 0.0% 0.0% 0.0% 0.0% 41.0% 41.0% 41.0%Maximum Green (s) 44.0 44.0 7.0Yellow Time (s) 3.0 3.0 3.0All-Red Time (s) 1.0 1.0 1.0Lost Time Adjust (s) 0.0 0.0 0.0 0.0 0.0 0.0 0.0 0.0 0.0 0.0 0.0 0.0Total Lost Time (s) 4.0 4.0 4.0 4.0 4.0 4.0 4.0 4.0 4.0 4.0 4.0 4.0Lead/Lag Lead Lead LagLead-Lag Optimize? Yes Yes YesVehicle Extension (s) 3.0 3.0 3.0Recall Mode C-Max C-Max NoneWalk Time (s) 5.0 5.0Flash Dont Walk (s) 11.0 11.0Pedestrian Calls (#/hr) 0 0Act Effct Green (s) 44.0 44.0 7.0 55.0 37.0 37.0 37.0Actuated g/C Ratio 0.44 0.44 0.07 0.55 0.37 0.37 0.37v/c Ratio 1.18 0.39 1.61 0.75 0.36 0.36 0.91Control Delay 115.3 11.0 302.9 6.2 25.0 25.0 50.1Queue Delay 0.0 0.0 0.0 30.3 0.0 0.0 0.0Total Delay 115.3 11.0 302.9 36.5 25.0 25.0 50.1LOS F B F D C C DApproach Delay 99.8 92.3 38.8Approach LOS F F D
Intersection SummaryArea Type: OtherCycle Length: 100Actuated Cycle Length: 100Offset: 4 (4%), Referenced to phase 2:EBWB, Start of GreenNatural Cycle: 150Control Type: Actuated-CoordinatedMaximum v/c Ratio: 1.68Intersection Signal Delay: 84.9 Intersection LOS: FIntersection Capacity Utilization 85.7% ICU Level of Service EAnalysis Period (min) 15
Splits and Phases: 6: Thornton Pkwy & SB Ramp
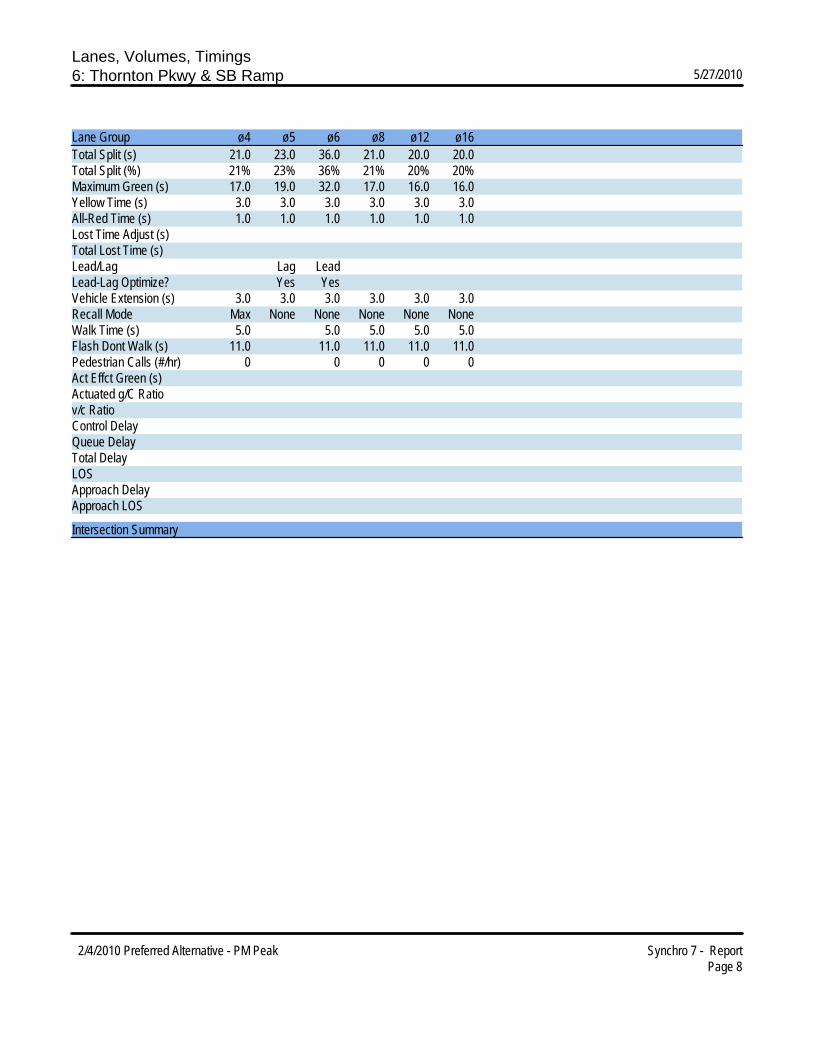
Lanes, Volumes, Timings6: Thornton Pkwy & SB Ramp 5/27/2010
2/4/2010 Preferred Alternative - PM Peak Synchro 7 - ReportPage 8
Lane Group ø4 ø5 ø6 ø8 ø12 ø16Total Split (s) 21.0 23.0 36.0 21.0 20.0 20.0Total Split (%) 21% 23% 36% 21% 20% 20%Maximum Green (s) 17.0 19.0 32.0 17.0 16.0 16.0Yellow Time (s) 3.0 3.0 3.0 3.0 3.0 3.0All-Red Time (s) 1.0 1.0 1.0 1.0 1.0 1.0Lost Time Adjust (s)Total Lost Time (s)Lead/Lag Lag LeadLead-Lag Optimize? Yes YesVehicle Extension (s) 3.0 3.0 3.0 3.0 3.0 3.0Recall Mode Max None None None None NoneWalk Time (s) 5.0 5.0 5.0 5.0 5.0Flash Dont Walk (s) 11.0 11.0 11.0 11.0 11.0Pedestrian Calls (#/hr) 0 0 0 0 0Act Effct Green (s)Actuated g/C Ratiov/c RatioControl DelayQueue DelayTotal DelayLOSApproach DelayApproach LOS
Intersection Summary
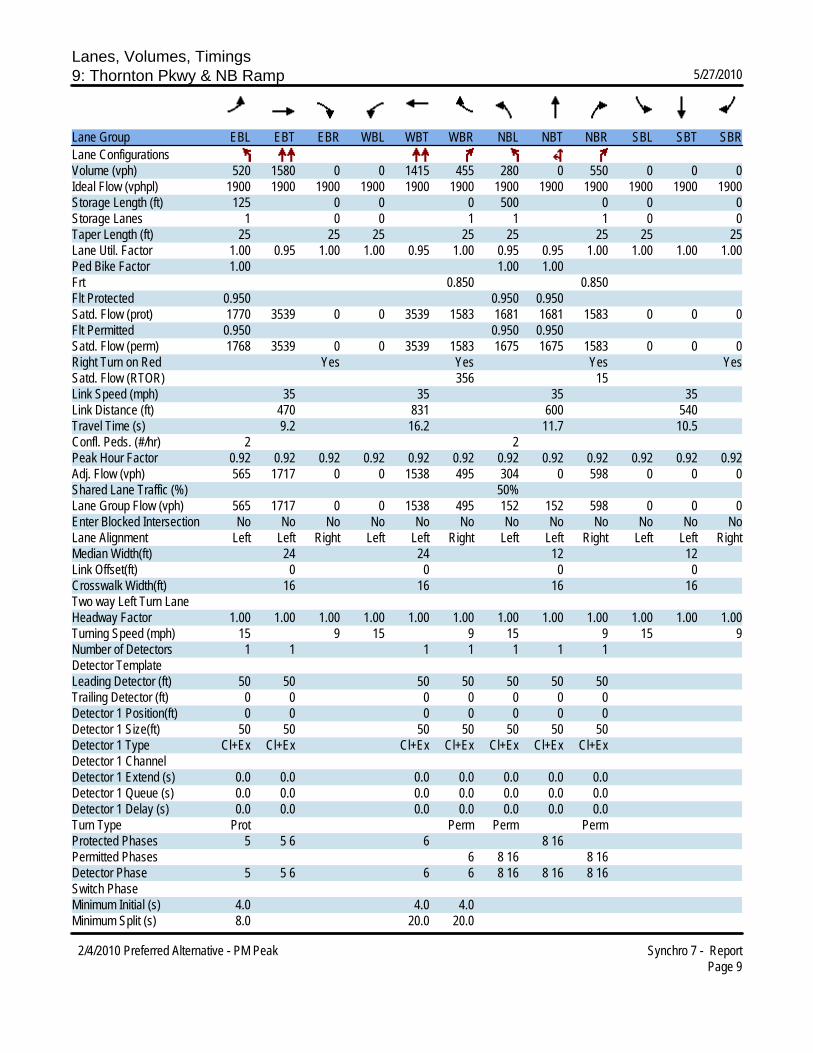
Lanes, Volumes, Timings9: Thornton Pkwy & NB Ramp 5/27/2010
2/4/2010 Preferred Alternative - PM Peak Synchro 7 - ReportPage 9
Lane Group EBL EBT EBR WBL WBT WBR NBL NBT NBR SBL SBT SBRLane ConfigurationsVolume (vph) 520 1580 0 0 1415 455 280 0 550 0 0 0Ideal Flow (vphpl) 1900 1900 1900 1900 1900 1900 1900 1900 1900 1900 1900 1900Storage Length (ft) 125 0 0 0 500 0 0 0Storage Lanes 1 0 0 1 1 1 0 0Taper Length (ft) 25 25 25 25 25 25 25 25Lane Util. Factor 1.00 0.95 1.00 1.00 0.95 1.00 0.95 0.95 1.00 1.00 1.00 1.00Ped Bike Factor 1.00 1.00 1.00Frt 0.850 0.850Flt Protected 0.950 0.950 0.950Satd. Flow (prot) 1770 3539 0 0 3539 1583 1681 1681 1583 0 0 0Flt Permitted 0.950 0.950 0.950Satd. Flow (perm) 1768 3539 0 0 3539 1583 1675 1675 1583 0 0 0Right Turn on Red Yes Yes Yes YesSatd. Flow (RTOR) 356 15Link Speed (mph) 35 35 35 35Link Distance (ft) 470 831 600 540Travel Time (s) 9.2 16.2 11.7 10.5Confl. Peds. (#/hr) 2 2Peak Hour Factor 0.92 0.92 0.92 0.92 0.92 0.92 0.92 0.92 0.92 0.92 0.92 0.92Adj. Flow (vph) 565 1717 0 0 1538 495 304 0 598 0 0 0Shared Lane Traffic (%) 50%Lane Group Flow (vph) 565 1717 0 0 1538 495 152 152 598 0 0 0Enter Blocked Intersection No No No No No No No No No No No NoLane Alignment Left Left Right Left Left Right Left Left Right Left Left RightMedian Width(ft) 24 24 12 12Link Offset(ft) 0 0 0 0Crosswalk Width(ft) 16 16 16 16Two way Left Turn LaneHeadway Factor 1.00 1.00 1.00 1.00 1.00 1.00 1.00 1.00 1.00 1.00 1.00 1.00Turning Speed (mph) 15 9 15 9 15 9 15 9Number of Detectors 1 1 1 1 1 1 1Detector Template Leading Detector (ft) 50 50 50 50 50 50 50Trailing Detector (ft) 0 0 0 0 0 0 0Detector 1 Position(ft) 0 0 0 0 0 0 0Detector 1 Size(ft) 50 50 50 50 50 50 50Detector 1 Type Cl+Ex Cl+Ex Cl+Ex Cl+Ex Cl+Ex Cl+Ex Cl+ExDetector 1 ChannelDetector 1 Extend (s) 0.0 0.0 0.0 0.0 0.0 0.0 0.0Detector 1 Queue (s) 0.0 0.0 0.0 0.0 0.0 0.0 0.0Detector 1 Delay (s) 0.0 0.0 0.0 0.0 0.0 0.0 0.0Turn Type Prot Perm Perm PermProtected Phases 5 5 6 6 8 16Permitted Phases 6 8 16 8 16Detector Phase 5 5 6 6 6 8 16 8 16 8 16Switch PhaseMinimum Initial (s) 4.0 4.0 4.0Minimum Split (s) 8.0 20.0 20.0
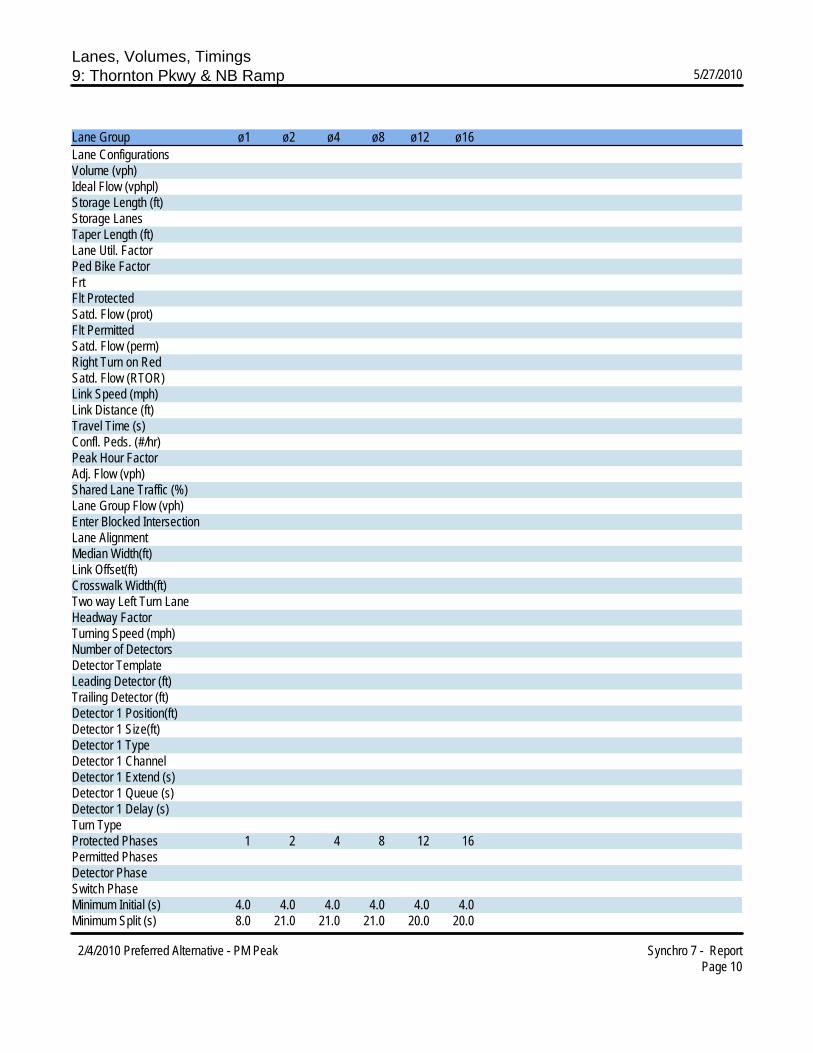
Lanes, Volumes, Timings9: Thornton Pkwy & NB Ramp 5/27/2010
2/4/2010 Preferred Alternative - PM Peak Synchro 7 - ReportPage 10
Lane Group ø1 ø2 ø4 ø8 ø12 ø16Lane ConfigurationsVolume (vph)Ideal Flow (vphpl)Storage Length (ft)Storage LanesTaper Length (ft)Lane Util. FactorPed Bike FactorFrtFlt ProtectedSatd. Flow (prot)Flt PermittedSatd. Flow (perm)Right Turn on RedSatd. Flow (RTOR)Link Speed (mph)Link Distance (ft)Travel Time (s)Confl. Peds. (#/hr)Peak Hour FactorAdj. Flow (vph)Shared Lane Traffic (%)Lane Group Flow (vph)Enter Blocked IntersectionLane AlignmentMedian Width(ft)Link Offset(ft)Crosswalk Width(ft)Two way Left Turn LaneHeadway FactorTurning Speed (mph)Number of Detectors Detector Template Leading Detector (ft)Trailing Detector (ft)Detector 1 Position(ft)Detector 1 Size(ft)Detector 1 TypeDetector 1 ChannelDetector 1 Extend (s)Detector 1 Queue (s)Detector 1 Delay (s)Turn TypeProtected Phases 1 2 4 8 12 16Permitted PhasesDetector PhaseSwitch PhaseMinimum Initial (s) 4.0 4.0 4.0 4.0 4.0 4.0Minimum Split (s) 8.0 21.0 21.0 21.0 20.0 20.0
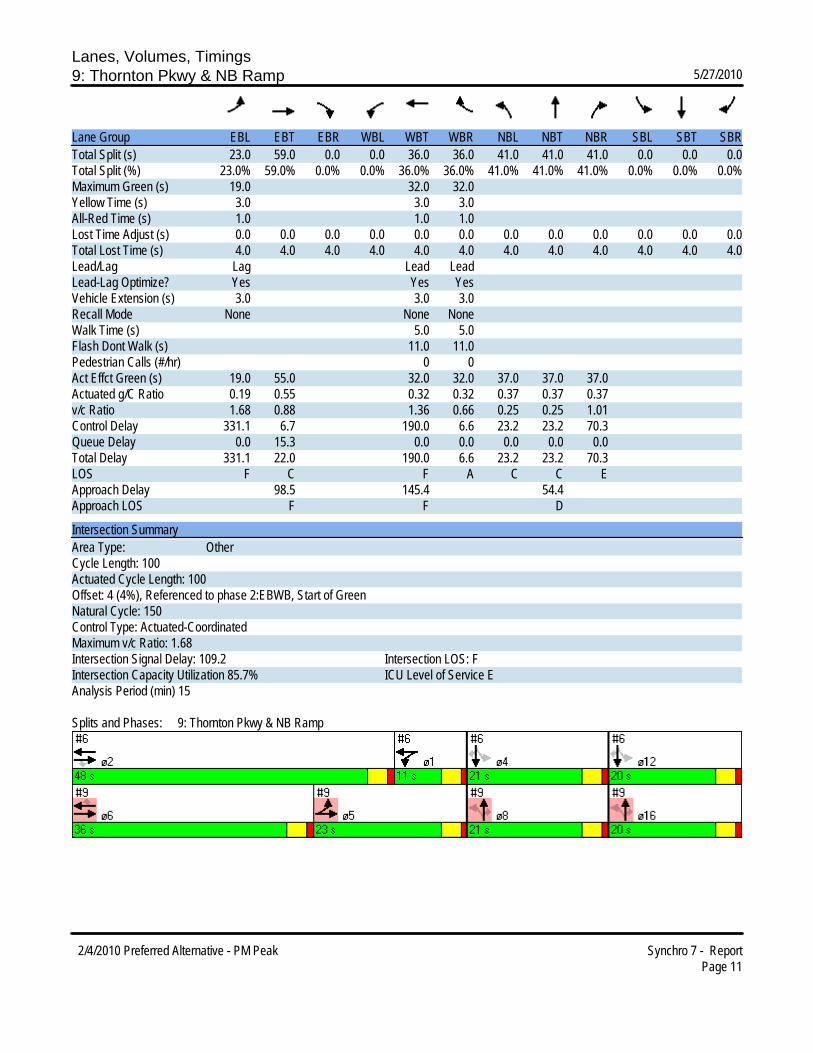
Lanes, Volumes, Timings9: Thornton Pkwy & NB Ramp 5/27/2010
2/4/2010 Preferred Alternative - PM Peak Synchro 7 - ReportPage 11
Lane Group EBL EBT EBR WBL WBT WBR NBL NBT NBR SBL SBT SBRTotal Split (s) 23.0 59.0 0.0 0.0 36.0 36.0 41.0 41.0 41.0 0.0 0.0 0.0Total Split (%) 23.0% 59.0% 0.0% 0.0% 36.0% 36.0% 41.0% 41.0% 41.0% 0.0% 0.0% 0.0%Maximum Green (s) 19.0 32.0 32.0Yellow Time (s) 3.0 3.0 3.0All-Red Time (s) 1.0 1.0 1.0Lost Time Adjust (s) 0.0 0.0 0.0 0.0 0.0 0.0 0.0 0.0 0.0 0.0 0.0 0.0Total Lost Time (s) 4.0 4.0 4.0 4.0 4.0 4.0 4.0 4.0 4.0 4.0 4.0 4.0Lead/Lag Lag Lead LeadLead-Lag Optimize? Yes Yes YesVehicle Extension (s) 3.0 3.0 3.0Recall Mode None None NoneWalk Time (s) 5.0 5.0Flash Dont Walk (s) 11.0 11.0Pedestrian Calls (#/hr) 0 0Act Effct Green (s) 19.0 55.0 32.0 32.0 37.0 37.0 37.0Actuated g/C Ratio 0.19 0.55 0.32 0.32 0.37 0.37 0.37v/c Ratio 1.68 0.88 1.36 0.66 0.25 0.25 1.01Control Delay 331.1 6.7 190.0 6.6 23.2 23.2 70.3Queue Delay 0.0 15.3 0.0 0.0 0.0 0.0 0.0Total Delay 331.1 22.0 190.0 6.6 23.2 23.2 70.3LOS F C F A C C EApproach Delay 98.5 145.4 54.4Approach LOS F F D
Intersection SummaryArea Type: OtherCycle Length: 100Actuated Cycle Length: 100Offset: 4 (4%), Referenced to phase 2:EBWB, Start of GreenNatural Cycle: 150Control Type: Actuated-CoordinatedMaximum v/c Ratio: 1.68Intersection Signal Delay: 109.2 Intersection LOS: FIntersection Capacity Utilization 85.7% ICU Level of Service EAnalysis Period (min) 15
Splits and Phases: 9: Thornton Pkwy & NB Ramp

Lanes, Volumes, Timings9: Thornton Pkwy & NB Ramp 5/27/2010
2/4/2010 Preferred Alternative - PM Peak Synchro 7 - ReportPage 12
Lane Group ø1 ø2 ø4 ø8 ø12 ø16Total Split (s) 11.0 48.0 21.0 21.0 20.0 20.0Total Split (%) 11% 48% 21% 21% 20% 20%Maximum Green (s) 7.0 44.0 17.0 17.0 16.0 16.0Yellow Time (s) 3.0 3.0 3.0 3.0 3.0 3.0All-Red Time (s) 1.0 1.0 1.0 1.0 1.0 1.0Lost Time Adjust (s)Total Lost Time (s)Lead/Lag Lag LeadLead-Lag Optimize? Yes YesVehicle Extension (s) 3.0 3.0 3.0 3.0 3.0 3.0Recall Mode None C-Max Max None None NoneWalk Time (s) 5.0 5.0 5.0 5.0 5.0Flash Dont Walk (s) 11.0 11.0 11.0 11.0 11.0Pedestrian Calls (#/hr) 0 0 0 0 0Act Effct Green (s)Actuated g/C Ratiov/c RatioControl DelayQueue DelayTotal DelayLOSApproach DelayApproach LOS
Intersection Summary
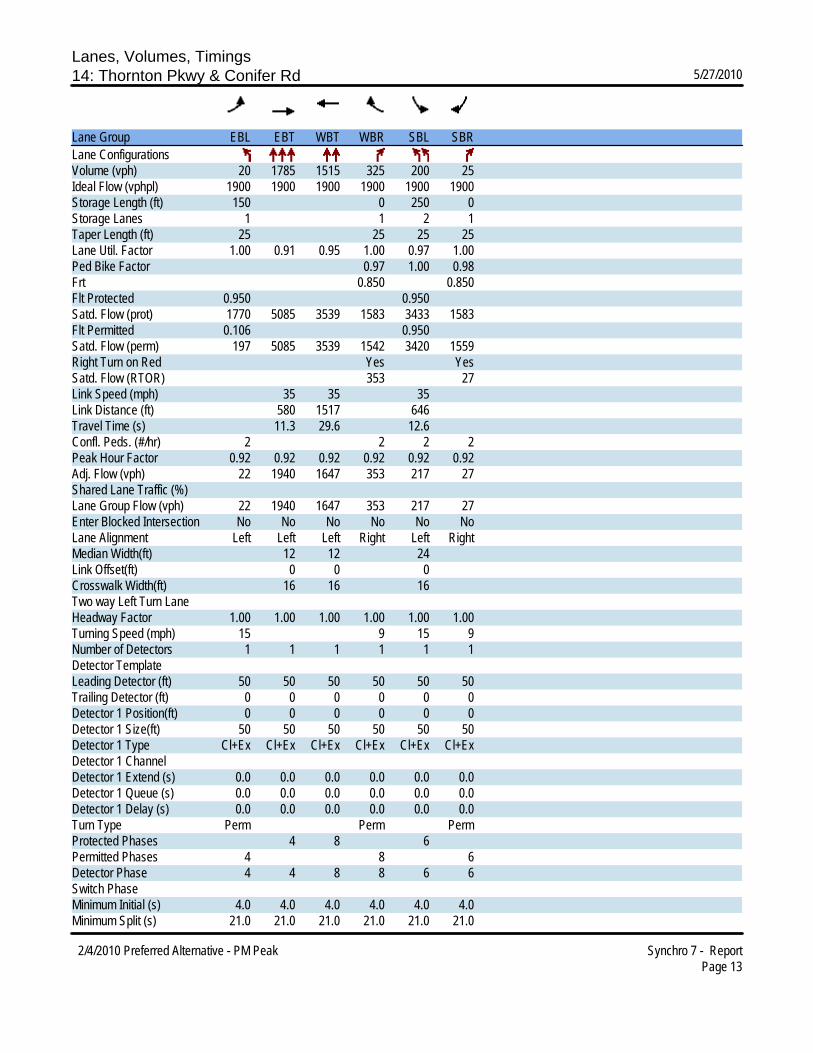
Lanes, Volumes, Timings14: Thornton Pkwy & Conifer Rd 5/27/2010
2/4/2010 Preferred Alternative - PM Peak Synchro 7 - ReportPage 13
Lane Group EBL EBT WBT WBR SBL SBRLane ConfigurationsVolume (vph) 20 1785 1515 325 200 25Ideal Flow (vphpl) 1900 1900 1900 1900 1900 1900Storage Length (ft) 150 0 250 0Storage Lanes 1 1 2 1Taper Length (ft) 25 25 25 25Lane Util. Factor 1.00 0.91 0.95 1.00 0.97 1.00Ped Bike Factor 0.97 1.00 0.98Frt 0.850 0.850Flt Protected 0.950 0.950Satd. Flow (prot) 1770 5085 3539 1583 3433 1583Flt Permitted 0.106 0.950Satd. Flow (perm) 197 5085 3539 1542 3420 1559Right Turn on Red Yes YesSatd. Flow (RTOR) 353 27Link Speed (mph) 35 35 35Link Distance (ft) 580 1517 646Travel Time (s) 11.3 29.6 12.6Confl. Peds. (#/hr) 2 2 2 2Peak Hour Factor 0.92 0.92 0.92 0.92 0.92 0.92Adj. Flow (vph) 22 1940 1647 353 217 27Shared Lane Traffic (%)Lane Group Flow (vph) 22 1940 1647 353 217 27Enter Blocked Intersection No No No No No NoLane Alignment Left Left Left Right Left RightMedian Width(ft) 12 12 24Link Offset(ft) 0 0 0Crosswalk Width(ft) 16 16 16Two way Left Turn LaneHeadway Factor 1.00 1.00 1.00 1.00 1.00 1.00Turning Speed (mph) 15 9 15 9Number of Detectors 1 1 1 1 1 1Detector Template Leading Detector (ft) 50 50 50 50 50 50Trailing Detector (ft) 0 0 0 0 0 0Detector 1 Position(ft) 0 0 0 0 0 0Detector 1 Size(ft) 50 50 50 50 50 50Detector 1 Type Cl+Ex Cl+Ex Cl+Ex Cl+Ex Cl+Ex Cl+ExDetector 1 ChannelDetector 1 Extend (s) 0.0 0.0 0.0 0.0 0.0 0.0Detector 1 Queue (s) 0.0 0.0 0.0 0.0 0.0 0.0Detector 1 Delay (s) 0.0 0.0 0.0 0.0 0.0 0.0Turn Type Perm Perm PermProtected Phases 4 8 6Permitted Phases 4 8 6Detector Phase 4 4 8 8 6 6Switch PhaseMinimum Initial (s) 4.0 4.0 4.0 4.0 4.0 4.0Minimum Split (s) 21.0 21.0 21.0 21.0 21.0 21.0

Lanes, Volumes, Timings14: Thornton Pkwy & Conifer Rd 5/27/2010
2/4/2010 Preferred Alternative - PM Peak Synchro 7 - ReportPage 14
Lane Group EBL EBT WBT WBR SBL SBRTotal Split (s) 77.0 77.0 77.0 77.0 23.0 23.0Total Split (%) 77.0% 77.0% 77.0% 77.0% 23.0% 23.0%Maximum Green (s) 73.0 73.0 73.0 73.0 19.0 19.0Yellow Time (s) 3.0 3.0 3.0 3.0 3.0 3.0All-Red Time (s) 1.0 1.0 1.0 1.0 1.0 1.0Lost Time Adjust (s) 0.0 0.0 0.0 0.0 0.0 0.0Total Lost Time (s) 4.0 4.0 4.0 4.0 4.0 4.0Lead/LagLead-Lag Optimize?Vehicle Extension (s) 3.0 3.0 3.0 3.0 3.0 3.0Recall Mode C-Max C-Max C-Max C-Max Max MaxWalk Time (s) 5.0 5.0 5.0 5.0 5.0 5.0Flash Dont Walk (s) 11.0 11.0 11.0 11.0 11.0 11.0Pedestrian Calls (#/hr) 0 0 0 0 0 0Act Effct Green (s) 73.0 73.0 73.0 73.0 19.0 19.0Actuated g/C Ratio 0.73 0.73 0.73 0.73 0.19 0.19v/c Ratio 0.15 0.52 0.64 0.29 0.33 0.08Control Delay 7.0 6.5 6.0 0.4 36.7 13.2Queue Delay 0.0 0.0 0.0 0.0 0.0 0.0Total Delay 7.0 6.5 6.0 0.4 36.7 13.2LOS A A A A D BApproach Delay 6.5 5.0 34.1Approach LOS A A C
Intersection SummaryArea Type: OtherCycle Length: 100Actuated Cycle Length: 100Offset: 37 (37%), Referenced to phase 4:EBTL and 8:WBT, Start of GreenNatural Cycle: 60Control Type: Actuated-CoordinatedMaximum v/c Ratio: 0.64Intersection Signal Delay: 7.4 Intersection LOS: AIntersection Capacity Utilization 61.9% ICU Level of Service BAnalysis Period (min) 15
Splits and Phases: 14: Thornton Pkwy & Conifer Rd

4) US Hwy 85 & 31st Street (Greeley) freeway/arterial/ruralbk Grnd 2005
8-hr 1.2936200251-hr 1.795621826
State Hwy 119 & County Line Roadbk Grnd 2005
8-hr 0.9273568271-hr 2.053432975
3) Harmony Road & I-25 (Ft. Collins) freeway/arterialbk Grnd 2005
8-hr 0.7685090611-hr 1.355564593
2) State Hwy 7 & I-25 (Adams/Broomfield County line area) freeway/arterialbk Grnd 2005
8-hr 2.5443270771-hr 3.717681797
1) Thornton Parkway & I-25 (Denver) freeway/arterialbk Grnd 2005
8-hr 3.0554360921-hr 5.536820555