
Technical Structure Technical Council - The Vertical Flight ...
Upload
khangminh22Category
view
2download
0
Submission 5.1
Report on Environmental Laboratories, SOPs for
Environmental Sampling, Recommendations on
Environmental Quality Standards, Environmental
Modelling, Monitoring Framework and Curriculum
Restructuring and Capacity Building of
Environmental Protection Department Punjab
Technical Report

Restructuring and Capacity Building of
Environmental Protection Department Punjab
1. Inception Report
2. Gap Analysis Report
3. Restructuring Report
3.1: Training Need Assessment Report
3.2: Restructuring of Environmental Governance in Punjab
4. Legal Report
4.1: Report on Multilateral Environmental Agreements
4.2: Environmental Governance and Monitoring Framework of Punjab
4.3: New and Amended Laws, Rules, Regulations, Guidelines, SOPs, Checklists
5. Technical Report
5.1: Environmental Laboratories, SOPs for Environmental Sampling, Recommendations on
Environmental Quality Standards, Environmental Modelling, Monitoring Framework and
Curriculum
5.2: Environmental Approvals/EIAs, Market-based Instrument for Environmental Management
6. Information and Communication Technology Solutions Report
7. Final Report
DISCLAIMER
Urban Sector Planning and Management Sector Unit (Private.) Limited, (USPMSU) has prepared this
report for purpose of Restructuring and Capacity Building of Environmental Protection Department
(EPD). Extreme care and caution has been observed while developing this document.
No part of this document may be reproduced or transmitted in any form or by any means, electronic or
mechanical, including photocopying, recording or information storage and retrieval system, without
the express permission, in writing, by competent authority.
Authors
Mr. Tapio Reinikainen
Mr. Ville Hokka
Mr. Julien Perez
Mr. Abid Hussainy
Mr. Hassan Ilyas
Ms. Anza Javaid
Ms. Saba Sarfraz
Technical Review Team
Mr. Alexis Gazzo
Ms. Auli Keinänen
Dr. Nasir Javed
The Urban Unit
503-Shaheen Complex, Egerton road, Lahore
Tel: +42 992005316-22
Fax : +42 99205323
Email: [email protected]
Website: www.urbanunit.gov.pk
Table of Contents
Chapter 1: Environmental Laboratories Section 1: Need Assessment of Environmental Laboratories and Monitoring Stations
Introduction / Current Situation ............................................................................................................ 16
Recommendations for Improving Management of Laboratories .......................................................... 17
Practical Steps For Corrective Measures .............................................................................................. 18
Procedures and Outputs/Results of Establishment of Well Managed Environmental
Laboratory/EMC ................................................................................................................................... 19
Capacity Building and Preliminary Needs Analysis ............................................................................. 21
Section 2: Certification of Environmental Laboratories
Certification Criteria ............................................................................................................................. 26
Process Flow ......................................................................................................................................... 26
SOPs for Inspection and Certification .................................................................................................. 28
Registration Application Of Environmental Laboratories .................................................................... 28
Renewal Application Of Environmental Laboratories .......................................................................... 28
Certification Application Of Environmental Laboratories ................................................................... 28
Lab Inspection Report ........................................................................................................................... 32
Section 3: Quality Assurance / Quality Control System
Quality Assurance / Quality Control System ........................................................................................ 40
Section 4: Accreditation
Requirements ........................................................................................................................................ 46
Continuing Accreditation ...................................................................................................................... 46
Accreditation Application By PNAC .................................................................................................... 46
Section 5: Environmental Sampling and Rate Analysis
Environmental Rates ............................................................................................................................. 60
Chapter 2: Standard Operating Procedures Section 1: Standard Operating Procedures for Environmental Sampling
Standard Operating Procedures For Environmental Sampling ............................................................. 68
1.Water ............................................................................................................................................. 68
2.Wastewater .................................................................................................................................... 77
3. Industrial Gaseous Emissions ..................................................................................................... 82
4. Motor Vehicle Exhaust And Noise .............................................................................................. 84
5.Ambient Air .................................................................................................................................. 86
6. Types Of Sampling (Grab, Composite, Integrated) ..................................................................... 86
Section 2: Standard Operating Procedures for Testing and Analysis
Standard Operating Procedures For Testing And Analysis .................................................................. 92
1. Organics/Physiochemical .................................................................................................................. 92
i. Standard Operating Procedure For Total Dissolved Solids (Tds) ................................................. 92
ii. Standard Operating Procedure For Total Suspended Solids (Tss) ............................................... 93
iii. Standard Operating Procedure For Ph ........................................................................................ 94
iv. Standard Operating Procedure For Biological Oxygen Demand (Bod) ...................................... 95
v. Standard Operating Procedure For Chemical Oxygen Demand (Cod) ........................................ 99
vi. Standard Operating Procedure For Chlorides (Cl-) .................................................................. 100
vii. Standard Operating Procedure For Free Chlorine.................................................................... 102
viii. Standard Operating Procedure For Sulfide (S2-) .................................................................... 105
ix. Standard Operating Procedure For Ammonia (Nh3) ................................................................. 106
x. Standard Operating Procedure For Fluoride (F-)........................................................................ 108
xi. Standard Operating Procedure For Cyanide (Cn-) Total ........................................................... 109
2.Ambient Air And Gaseous Emissions ............................................................................................. 110
3. Heavy Metals .................................................................................................................................. 111
4. Microbiological Analysis ................................................................................................................ 113
Chapter 3: Environmental Quality Standards Section 1: Comparative Analysis of Environmental Quality Standards
Comparative Analysis of Environmental Quality Standards .............................................................. 120
1. Municipal & Liquid Industrial Effluents .................................................................................... 120
2. Industrial Gaseous Emissions .................................................................................................... 122
3. Motor Vehicle Exhaust & Noise ................................................................................................ 123
4. Ambient Air ............................................................................................................................... 124
5. Drinking Water Quality ............................................................................................................. 125
6. Noise .......................................................................................................................................... 127
7. Treatment Of Liquid And Disposal Of Bio-Medical Waste By Incineration, Autoclaving,
Microwaving And Deep Burial ...................................................................................................... 128
Chapter 4: Environmental Modelling Section 1: Introduction and Scope
Introduction And Scope ...................................................................................................................... 134
Section 2: Environmental Modelling Framework
Environmental Modelling Framework ................................................................................................ 138
1. Dispersion Modelling ...................................................................................................................... 138
2. Receptor Modelling ........................................................................................................................ 147
3. Surface Water Modelling ................................................................................................................ 151
4. Groundwater Modelling .................................................................................................................. 153
Section 3: Recommendations for Workable Models for Environmental Modelling
Recommendations for Workable Models for Environmental Modelling 162
Environmental Modelling for EIA ...................................................................................................... 163
Application of Modelling in IEE/EIA ................................................................................................. 163
Chapter 5: Environmental Monitoring and Reporting
Framework Section 1: Introduction and Background
Introduction and Background ............................................................................................................. 171
Section 2: Principles for Environmental Monitoring nad Reporting
Principles For Environmental Monitoring And Reporting ................................................................. 177
Section 3: Environmental Monitoring and Reporting Framework
Methods for Environmental Monitoring ............................................................................................. 182
Framework for Ambient Environment Monitoring and Reporting ..................................................... 183
What to Monitor? ................................................................................................................................ 190
Environmental Monitoring Plan For Punjab ....................................................................................... 197
Air Quality Monitoring Plan .......................................................................................................... 197
Ground Water Monitoring Plan ..................................................................................................... 203
Surface Water Monitoring Plan ..................................................................................................... 206
Monitoring of Drinking Water ....................................................................................................... 216
Monitoring of Hazardous Substances ............................................................................................ 216
Monitoring of Noise ....................................................................................................................... 218
Monitoring of Biodiversity ............................................................................................................ 218
Compliance Monitoring And Inspection ............................................................................................. 219
Policy Recommendations For Environmental Monitoring And Reporting ........................................ 224
Annexure…………………………………………………………………………………………….226

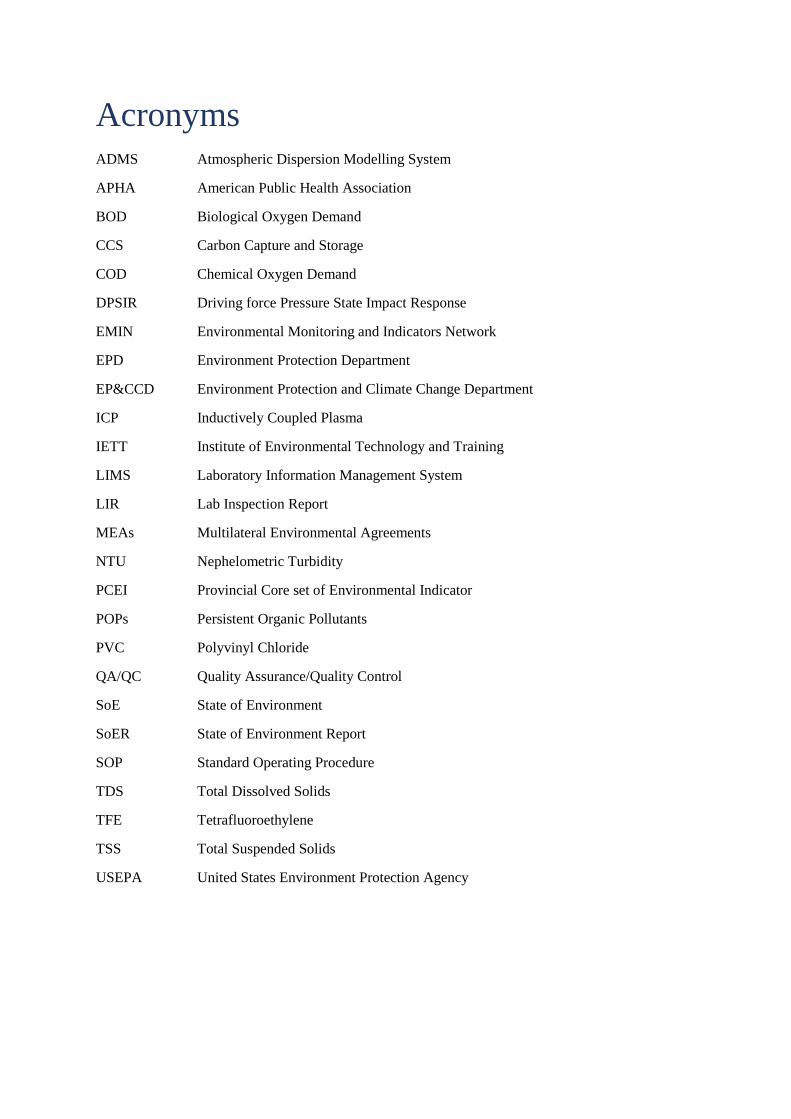
Acronyms ADMS Atmospheric Dispersion Modelling System
APHA American Public Health Association
BOD Biological Oxygen Demand
CCS Carbon Capture and Storage
COD Chemical Oxygen Demand
DPSIR Driving force Pressure State Impact Response
EMIN Environmental Monitoring and Indicators Network
EPD Environment Protection Department
EP&CCD Environment Protection and Climate Change Department
ICP Inductively Coupled Plasma
IETT Institute of Environmental Technology and Training
LIMS Laboratory Information Management System
LIR Lab Inspection Report
MEAs Multilateral Environmental Agreements
NTU Nephelometric Turbidity
PCEI Provincial Core set of Environmental Indicator
POPs Persistent Organic Pollutants
PVC Polyvinyl Chloride
QA/QC Quality Assurance/Quality Control
SoE State of Environment
SoER State of Environment Report
SOP Standard Operating Procedure
TDS Total Dissolved Solids
TFE Tetrafluoroethylene
TSS Total Suspended Solids
USEPA United States Environment Protection Agency

Executive Summary Environmental Laboratories form the backbone of Environmental Monitoring which is one of the key
tasks of an Environment Protection Agency (EPA). The environmental laboratories of EPA have been
envisioned to constitute a significant part of Environmental Monitoring Centre (EMC). EMC will
monitor environmental quality of Punjab and produce results that would be defendable and provide a
basis for stringent enforcement. In order for EMC to be a reference lab, for testing and analysis in
Punjab, it needs to overcome the existing gaps and develop measures and systems for operation and
maintenance that comply with ISO 17025. Need assessment of these labs would enable the authorities
to recognize the gaps in the functionality, equipment, quality of work, health and safety measures and
sustainability etc. and help identify possible solutions to fill the gaps. A framework for development
of quality management for the laboratories would also be proposed.
EPA is required to certify laboratories to conduct tests and analysis of environmental quality
parameters and get accreditation for its own establishment, under EMC, from Pakistan National
Accreditation Council (PNAC). The existing system has not been capable enough to get accreditation
and has also been inefficient in performing certification due to a variety of reasons which has
inculcated dissent and resentment between EPA and the public/private labs applying for certification.
Hence, the process had to be streamlined and automated to make evaluation easier and response
timely. A GIS/MIS based system has been designed for providing certification as a solution to make
the application and scrutiny of the cases easy, transparent and thorough. Once all the documentation
of the labs is complete and all systems are in place, EMC can also apply for accreditation according to
the criteria mentioned.
An environmental lab must have a QA/QC system in place which is designed to identify policies,
organization, objectives, functional activities, and Quality Assurance/Quality Control activities aimed
at achieving quality goals desired for operation of a laboratory. A QA/QC manual is primarily
intended for use by laboratory personnel to ensure reliability of results. It is important for a testing lab
that the QA/QC manual should be in compliance with ISO 17025 criteria as a benchmark as proposed.
EMC laboratories need to be financially sustainable in order for them to function smoothly and
conduct regular O&M. Existing lab has rates set for sampling and testing of environmental quality
parameters but these are outdated, as they were last notified in 2013, and need to be revised. Hence,
feasible rates to provide testing and analysis facilities to stakeholders and also to make the EPA labs
self-sustainable are proposed. Proposed rates reflect the market prices in order to provide relief to
industries and stakeholders and encourage monitoring and reporting
Standard Operating Procedures (SOPs) are a set of instructions to provide step-by step guidance to
their personnel in carrying out a specific task or function. SOPs are usually created on a standard
format to assist workers for complex routine operations. The idea is to improve efficiency,
consistency and quality of output. An environmental lab should have standardized SOPs for sampling
and testing and analysis and user manuals for operation and handling of complex equipment in order
to get verifiable and good quality results.
Establishing a comprehensive environmental monitoring mechanism is essential for ensuring and
safeguarding the environment for maintaining its goods and services to sustain development in the
province. This report sets the framework for environmental monitoring and reporting that on one hand
serves the operative needs of environmental permitting, EIA’s, IEE’s and complaint handlings, but on
the other hand it serves the vitally important assessment of trends in the environment by monitoring
indicators defined in Sustainable Development Goals and for provincial purposes through setting of
core environmental indicators for the province.
The report deliberates the future state of Punjab Environmental monitoring Center (EMC) as a
separate scientific oriented expert organization to produce high quality environmental data and
information through certified sampling and laboratory procedures. The Punjab EMC will also act as a
reference laboratory for other government labs and private sector laboratories and produce State of
Environment Report (SoER) as a result of ambient environment and regulatory monitoring. The report
focuses on overall approach and methods for monitoring and reporting and proposes Environmental
Monitoring and Indicators Network (EMIN) process for selecting indicators for Provincial Core Set of
Environmental Indicators (PCEI).
For State of Environment reporting, the report provides Driving force-Pressure-State-Impact-
Response (DPSIR) model in order to design environmental monitoring programmes for Punjab in a
cost-effective way. This model will help the department and agency to support decision making
through the provision of credible environmental information. This will also help to present the
environmental indicators needed to provide feedback to policy makers on environmental quality and
the resulting impact of the political choices made, or to be made in the future. It also covers the
monitoring intensity/environmental monitoring plan for the province, approach for compliance
monitoring and prosecution of polluters and policy recommendations for improvement of monitoring
and reporting in the province.

Chapter 1
Environmental Laboratories

Section 1
Need Assessment of Environmental
Laboratories and Monitoring
Stations

Section 1 of Chapter 1 Need assessment of environmental laboratories & monitoring stations
Technical Report – Submission 5.1 Page No 16
Section 1
Need Assessment of Environmental
Laboratories and Monitoring Stations INTRODUCTION / CURRENT SITUATION
Monitoring for environmental quality is a mandatory function of EPA Punjab which is bound by the
Punjab Environmental Protection Act, 2012 in Section 6 (1) (i) to;
“Establish systems and procedures for surveys, surveillance, monitoring, measurement, examination,
investigation, research, inspection and audit to prevent and control pollution, and to estimate the
costs of cleaning up pollution and rehabilitating the environment in various sector.”
Environmental laboratories form the backbone of environmental monitoring. Currently the situation
of EPA environmental laboratories is not in a level required for producing defendable results for
stringent enforcement, but there are some signs for positive developments at the EPA central
laboratory, which is planned to form the heart of a future Environmental Monitoring Center (EMC).
Regional laboratories are not operational at the moment.
During the first visits of the consultant to the central laboratory of EPA, it was in a development
phase. Some air conditioned rooms had brand new sophisticated equipment like ICP, AAS and GC,
but activity was only about to be started with the ICP, which is able analyse 72 metallic parameters
within minutes. That was in a process of calibration with standard solutions. The differences in test
results seemed minimal. EPA had also hired three MSc level experts in analytical chemistry to run
this equipment after training. These are positive efforts and need to be strengthened. Another part of
the lab was consisting of equipment, like oxygen analyser, incubation cupboards etc. to make basic
analyses on mainly fresh water and waste water. In this laboratory the ventilation was not functional
at that time and needed urgently action in order to guarantee good quality of analysis results. The third
part of the laboratory was storage for analysis chemicals, which room was also used as an office. The
room was a mess, but later on it was reorganised. There were toxic and carcinogenic chemicals like
carbon tetrachloride (CTC), which is also ozone depleting substance laying in cardboard boxes with
acids and flammable substances alongside with other chemicals, some of them already outdated and
obsolete. There were also piles of document everywhere. This is against any OHS regulations and it
was later corrected as advised.
The situation with the regional laboratories is not very clear, but obviously there is a lack of skilled
personnel, probably lack of proper equipment and lack operational management rules.
Some representatives of private labs have expressed their worries that the EPA EMC would start to
compete with private labs. That worry should be unnecessary as the EMC shall target in doing
comparative analysis of the same recipient as the self-monitoring of industries performed by private
labs and serves as a high quality reference laboratory in the future.
There is more about the current situation of the laboratories in the combined gap analysis report (UU-
EY-FCG), including gaps in analysing ambient air, water and waste water. The report describes
details of the following:
availability of laboratory equipment, monitoring stations and mobile monitoring units and
gaps in their use and functionality
gaps in the usage of international standards
gaps in OHS measures
Section 1 of Chapter 1 Need assessment of environmental laboratories & monitoring stations
Technical Report – Submission 5.1 Page No 17
availability of SOPs
aspects of lack of financial sustainability
aspects of quality assurance system and accreditation
existing environmental quality standards
As a general conclusion there is still a long way for the EMC or EPA central laboratory to be an ISO
17025 certified lab. There is clear possibility for development, but lots of training is needed. Currently
there is obviously also lack of trust between different stakeholders (between organisations and within
organisations), which hampers the smooth cooperation and quality monitoring.
Laboratory work is only one part of the monitoring. Trained field staff will also be needed to take
samples and monitoring programmes to be designed and implemented.
The reasons for establishing monitoring programs include:
ensuring the health of ecosystems and species
protection of human health
ensuring the compliance with legislation
reducing pollution levels
preserving natural resources
protecting biodiversity
protecting ecosystem services
RECOMMENDATIONS FOR IMPROVING MANAGEMENT OF LABORATORIES
In a functional model there should be a high level, well equipped, ISO 17025 certified reference
laboratory with well trained staff, Laboratory Information Management System (LIMS), all SOPs in
place and strictly followed for more complicated analysis and controlling of quality of EPA regional
laboratories and private environmental laboratories. In addition seven to nine good quality regional
laboratories are needed to perform sampling and analysis of a limited amount of parameters, as well
as adequate number of good private laboratories.
In order to improve the management of laboratories the following objectives will have to be fulfilled:
1) To establish an Environmental Monitoring Centre (EMC) under the Environmental Protection
Department of Punjab
2) To enhance the quality of current central laboratory by aiming for the international
accreditation for ISO 17025 (General requirements for the competence of testing and
calibration laboratories).
3) To enhance/rebuild the operations of regional laboratories and capacities of laboratory staff to
take representative environmental samples and carry out analysis professionally to attain
defendable and reliable data and information for evidence based decision making in regions.
4) To facilitate the certification of private environmental laboratories and set requirements for
quality control and update and renewal of them and organize the co-operation within the
private sector to support the emerging market.
5) To establish a thorough capacity programme, based on training needs assessment of
laboratory staff and inventories in laboratories.
The laboratory needs to comply with ISO 17025. A practical guidebook is needed for meeting the
requirements of laboratory accreditation schemes based on ISO 17025:2005 or equivalent national
standard.

Section 1 of Chapter 1 Need assessment of environmental laboratories & monitoring stations
Technical Report – Submission 5.1 Page No 18
PRACTICAL STEPS FOR CORRECTIVE MEASURES
The steps needed for EPA Punjab for reaching the objectives of the complete system of management
of environmental laboratories are illustrated in the Fig. 1.1.
Fig. 1.1: Framework for development of quality management for laboratories
The major steps in the laboratory framework are the following:
1. Gap Analysis. A comprehensive gap analysis and recommendations has been presented in the
gap analysis report of the EPA restructuring project (2017) and also briefly described in the
earlier chapters of this report (a summary table is presented in annex 1). A complete inventory
of the current status of the laboratory equipment has been carried out (Annex 2).
2. Staffing plan needs to be based on the Gap Analysis and TORs/job descriptions for positions
prepared and the job descriptions of the laboratory manager; quality manager and other senior
staff shall be included in the quality manual. The laboratory management and key experts
needs to be hired whenever necessary. The staffing situation shall be reviewed and the plan
finalized during the consultancy of the international laboratory specialist (see also below re
training needs assessment).
3. It is proposed to carry out the EMIN process1 (through a set of stakeholder workshops
facilitated by an international specialist) in order to develop environmental indicators and to
prepare proper environmental monitoring programmes (see monitoring section of this report
page x).
4. An acquisition plan for the central laboratory and regional laboratories shall be done based
on results of inventory (see Annex 2) and future needs.
1 Environmental Monitoring and Indicators Network: See Section _ for further details
Section 1 of Chapter 1 Need assessment of environmental laboratories & monitoring stations
Technical Report – Submission 5.1 Page No 19
5. At the same time with above, a decision on establishing EMC and related legal provisions
shall be processed; the above mentioned staffing and acquisition plans shall include the
programmatic multi-year resource allocation for the entire EMC.
6. Laboratory certification process shall be carried out and quality management
practices established in the laboratories.
7. The key piece of quality documentation is the quality manual. This is the document which
describes in detail the policy on quality and the quality management structure and describes or
refers to the procedures which constitute the working quality system. The quality manual is,
typically, prepared and checked by laboratory management, usually under the overall co-
ordination of the quality manager. It should, however, be formally authorised for issuing from
as high a point in the management hierarchy as possible; chief executive, director general,
chairman are typical points. This ensures that the manual has the strongest authority and also
shows, to the accreditation body, a commitment on the part of the senior management to the
quality system. It is critical that the quality manual is seen to be a working document. It
should be available to all staff and they must be instructed to read it and to use it to guide them
in all aspects of their work. It will then be a vital force for the consistent and comprehensive
operation of the quality system2.
Laboratories will normally require documentation of technical procedures in addition to the
quality manual. The key part of the technical procedural documentation will be the
documentation of the test or calibration methods themselves (Standard Operating Procedures -
see Chapter 2 for SOPs prepared so far). The level of detail for these methods documents
should be such as to enable a trained practitioner to carry out tests and calibrations in a proper
and consistent fashion.
8. Training Needs Assessment. Currently training is needed for all staff of the laboratories,
including management, key experts and other staff ̧a detailed training plan shall be prepared
and training carried out by an international laboratory specialist whose qualification includes
degree in chemistry and experience in laboratory works as per international guidelines, and
who masters advanced laboratory equipment (GC, AAS, HPLC) and has been professionally
trained according to ISO 17025 requirements. Training will include management and quality
aspects and certification issues, as well as practical training on laboratory analysis as per
SOPs as well as sampling, reporting and statistical analysis.
PROCEDURES AND OUTPUTS/RESULTS OF ESTABLISHMENT OF WELL MANAGED
ENVIRONMENTAL LABORATORY/EMC
Capacity and procedures needed to establish a well-managed Environmental Laboratory/
Environmental Monitoring Centre and develop it will include:
1. Create and maintain capacities of the future EMC central laboratory (current EPA lab in
Lahore) to analyse all parameters related to Environmental Quality Standards (EQS’s) of
Punjab.
2. Create and maintain capacities of the EMC central laboratory to analyse all parameters
expressed in MEAs signed by Pakistan, including heavy metals and POPs (Persistent Organic
Pollutants).
2 Source: Complying with ISO 17025 – A practical guidebook.

Section 1 of Chapter 1 Need assessment of environmental laboratories & monitoring stations
Technical Report – Submission 5.1 Page No 20
3. Create a network of good quality regional laboratories (7-8) to perform a basic set of
environmental analysis, limited to about 35 parameters, in each laboratory or as required by
the typical pollution profile of regional industries.
4. Act as a reference laboratory (testing and calibration) to regional laboratories and private
laboratories to enhance their level of performance.
5. To create capacity for the EMC central lab to assess the quality and enhance the quality
control mechanisms of regional laboratories for periodic controls by own management and
third party controllers.
6. Establish a procedure to certify private environmental laboratories, environmental
consultancy companies and individual sample takers, to keep record on certifications and
keep the record updated and publicly available.
7. Establish a Laboratory Quality Management Committee to strive for and ensure a continuous
development of quality in all laboratories of Punjab
8. Create and maintain Standard Operating Procedures (SOP’s) for sample taking, site
inspections and laboratory analysis for each environmental parameter analyzed in EMC
central laboratory and regional laboratories.
9. Take into use a Laboratory Information Management System (LIMS) to keep record on
particulars, treatment and fate of each individual sample and operations in the laboratory.
10. Establish a mechanism to report analysis results in standard format, perform basic statistical
analysis and record results to central database and to report to customer and to the EMIS-
database.
11. Establish a separate development project for the central laboratory to attain ISO 17025
laboratory certificate, maintain it with quality control system, including periodic management
reviews and external reviews.
Other related activities that will support the good management of environmental laboratories:
1. Strengthening Environmental Assessments and Environmental Regulatory Framework in
Punjab (SEA-ERF)
2. Development of Cost-effective Environmental Monitoring through EMIN-process and
Capacity Development (EMIN-programme)
3. Establishment of Punjab Environmental Institute (EPI-programme)
4. Establishment of Punjab Environmental Technology Institute (IETT-programme)
5. Cooperation with related organizations such as Pakistan Space and Upper Atmosphere
Research Commission and their laboratory and monitoring activities, as well as Punjab
Saaf Pani Company and their monitoring of drinking water quality and quantity.
As a result of the activities above, it is expected that:
1. The EMC central laboratory will be equipped to take samples and do measurements of
wide variety of parameters, including air, water, waste water and soil analysis according
to international standards.
2. The EMC central laboratory has reached ISO 17025:2005 certification.
3. EMC regional laboratories are equipped and capacitated to take samples by certified
sample takers and reached ability to analyze and measure basic 35 parameters, including
air, water, waste water and soil analysis according to international standards and SOP’s.
4. All EMC laboratories are using Laboratory Information Management System (LIMS) for
numbering and keeping track of each individual sample from a sampling bottle to the
analysis report as well as recording of all requirements set in ISO 17025:2005 –standard.

Section 1 of Chapter 1 Need assessment of environmental laboratories & monitoring stations
Technical Report – Submission 5.1 Page No 21
5. The field staff has got training and got certified on the following fields of sampling:
drinking water and general water sampling, waste water sampling, air quality
sampling/measurements, hydrological measurements, noise measurements, sampling of
soils and solid waste.
6. EMC has established certification schemes for private laboratories, individual laboratory
analyses, individual sample takers on the above mentioned sampling types and
environmental consultancy companies and provides training and certification services to
private environmental consultancy companies and laboratories.
7. EMC laboratories are recording the results of all measurements, with location data, to
Environmental Monitoring Information System (EMIS).
CAPACITY BUILDING AND PRELIMINARY NEEDS ANALYSIS
Personnel
Together with the establishment of a well-managed EPA environmental laboratory network/EMC, an
extensive capacity building program shall be designed and implemented. Basic principle will be to
train all key experts for compliance with ISO 17025:2005, the LIMS and training of trainers programs
and certification schemes. The focus shall be in creating local capacities to do the trainings in future
and to further develop their palette of analysis, widening of certification schemes to take into account
of trend to take into use automatic measuring stations, field measurements, IT-data transfers and
related technologies to gradually replace part of the “sampling to analysis” –procedures, including an
extensive and programmatic trainings on sampling, analysis, measurements, site inspections and
LIMS as well as on recording of data, reporting, handling and storing of hazardous chemicals to fulfil
requirements of ISO 17025 and relevant international sampling standards.
As mentioned earlier, it is proposed to hire an international expert to train key staff and send some key
experts to be trained as trainers and future “owners” of local sampling certification scheme to be
established. International experts will be also assigned to assist EMC in drafting the certification
schemes and training of trainers according to them (to perform according to SOP’s of sampling
methods, inspections, analysis).
Special attention will be paid for procurement procedures and competence of procurement officials.
Preliminary needs analysis for laboratory design EMC central water laboratory
A preliminary draft plan of the needed instruments for water laboratory is presented below.
The structure and capacity of the suggested laboratory should be further discussed and developed as
the monitoring requirements (what indicators and parameters are monitored and in which distances
from Lahore) become clear through EMIN-process and selection of Provincial Core Set of
Environmental Indicators (PCEI).
The function of the laboratory would be: Water laboratory primarily supporting the monitoring of the
water quality in Punjab (ambient environment monitoring). For some parameters requiring more
sophisticated instruments, the EMC laboratory could also service needs of regions.
The proposed duties and functions of the laboratory would relate to monitoring (sampling, measuring,
analysing) the water quality, including sediment.
Some general instruments supporting the laboratory:
Section 1 of Chapter 1 Need assessment of environmental laboratories & monitoring stations
Technical Report – Submission 5.1 Page No 22
Water purification system (depending on the level of the equipment, eg. central vs. local, limited vs.
limitless volume of water as well as the level of purity)
Laboratory fume hood(s),
Laboratory oven (for drying laboratory glassware),
Balance(s)
Desiccator
Glassware
Sample bottles
Pipettes
Solvent dispensers
Water and sediment samplers
Nutrient analysis
CFA equipment,
Spectrophotometer,
Autoclave,
Helium gas
Basic measurements (pH, conductivity, alkalinity, dissolved oxygen, chemical oxygen demand):
Titration apparatus (multifunctional),
Water bath
TOC and TIC:
Carbon analyzer,
Synthetic air
Anions:
Ion chromatography system,
Nitrogen gas
Trace element analysis:
ICP-OES, matrix elements and elements in environmental samples,
Argon gas and additional gases depending on instrument
metal-free laboratory fume hood,
preferably a metal-free laminar flow cabinet, (if not possible, also normal fume hood)
freeze dryer (lyophilizer)
sieving equipment (for soils, sediments etc.)
milling equipment (e.g. planetary ball mill),
Direct Hg analysis (solid samples):
Hg-analyzer
Oxygen gas
PCB and organochlorine pesticide analysis (suitable for some other organic analysis as well):
GC-MS instrument (single quadrupole), with diffusion vacuum pump,
helium gas (or other gas depending on instrument)
laboratory chamber furnace,
Section 1 of Chapter 1 Need assessment of environmental laboratories & monitoring stations
Technical Report – Submission 5.1 Page No 23
solvent dispenser
water samples: magnetic stirrer
soil and biota samples: ultrasonicator,
solvent evaporator: rotavapor+vacuum pump,
centrifuge,
Biological analysis (phytoplankton, periphyton, (benthic fauna):
inverted microscope(s) for phytoplankton analysis
study and stereo microscopes for benthic fauna
study microscopes for diatoms
microcope cameras and imaging programmes
sedimenting chambers for phytoplankton
Phytoplankton nets
Additionally, the sampling devices, including a boat.
The laboratory should aim for the international accreditation for ISO 17025 (General requirements for
the competence of testing and calibration laboratories). The equipment listed above but not present in
the inventory (Annex 1) of the current Environmental Laboratories would constitute a list that would
serve as basis for acquisition plan to be drafted by the EMC according to the procedure presented in
the Fig 1.1.
Section 2 of Chapter 1 Certification of environmental laboratories
Technical Report – Submission 5.1 Page No 24
Section 2
Certification of Environmental
Laboratories

Section 2 of Chapter 1 Certification of environmental laboratories
Technical Report – Submission 5.1 Page No 26
Section 2
Certification of Environmental Laboratories CERTIFICATION CRITERIA
Section 6(1) (k) of PEPA 1997 amended 2012 states that EPA is required to;
“Certify one or more laboratories as approved laboratories for conducting tests and analysis and one
or more research institutes as environmental research institutes for conducting research and
investigation, for the purposes of this Act.”
Subject to regulation 5 of the Lab Certification Rules, 2000 the criteria for a laboratory to be certified
as an environmental lab is as follows:
1) The laboratory is located in a clean area and not adjacent to an open sewerage drain or factory
from which emissions of air pollutants or discharge of effluents or wastes may interfere with,
contaminate or otherwise adversely affect the reliability of its tests and analyses;
2) The building in which the laboratory is housed is suitable in size, design and quality of
construction, for use as an environmental laboratory;
3) The laboratory has qualified and experienced scientific and technical staff and appropriate
analytical equipment and apparatus as specified in Schedules III and IV (of the Lab
Certification Rules, 2000) respectively;
4) The laboratory has deposited with the Federal Agency the scrutiny fee and certification fee at
the rates specified in Schedule II;
5) The laboratory has installed a comprehensive scientific system of reporting test results,
supported by data handling facilities; and
6) The laboratory has proper waste disposal arrangements.
Furthermore, the Rules also state that a laboratory may be certified as an environmental laboratory for
testing of water, liquid effluents, wastes, soil, gaseous emissions, noise or a combination of these for
specific Environmental Quality Standards parameters, in which case the requirements of analytical
equipment and apparatus specified in Schedule IV, scientific and technical staff specified in Schedule
III of the same Rules have to be evaluated accordingly.
PROCESS FLOW
The future state organisational structure enables the Environment Protection and Climate Change
Department (EP&CCD) to register and certify environmental laboratories and consultants. The
following process flow (Fig 1.2) involving the flow of information and task delegation, has been
proposed for the ease of the staff carrying out Lab inspections and certifications. The flow has been
designed keeping in view the bottlenecks identified in the previous system and aims to provide timely
execution of the task.
Section 2 of Chapter 1 Certification of environmental laboratories
Technical Report – Submission 5.1 Page No 27
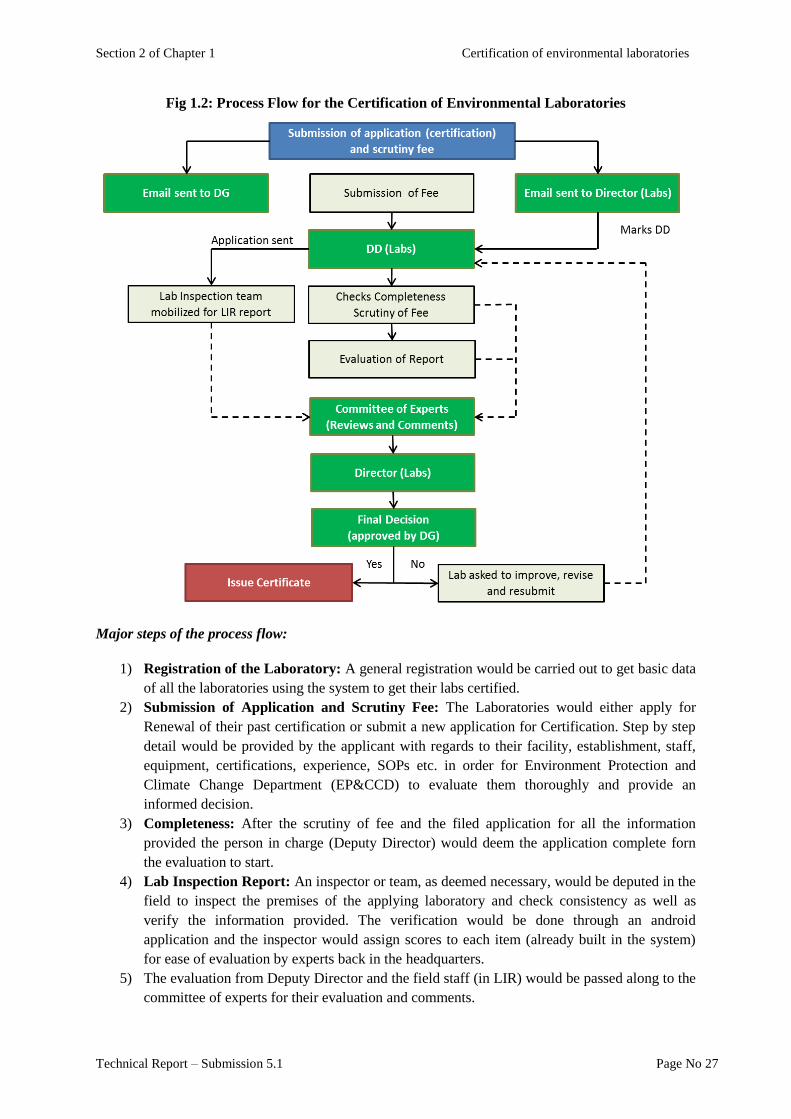
Fig 1.2: Process Flow for the Certification of Environmental Laboratories
Major steps of the process flow:
1) Registration of the Laboratory: A general registration would be carried out to get basic data
of all the laboratories using the system to get their labs certified.
2) Submission of Application and Scrutiny Fee: The Laboratories would either apply for
Renewal of their past certification or submit a new application for Certification. Step by step
detail would be provided by the applicant with regards to their facility, establishment, staff,
equipment, certifications, experience, SOPs etc. in order for Environment Protection and
Climate Change Department (EP&CCD) to evaluate them thoroughly and provide an
informed decision.
3) Completeness: After the scrutiny of fee and the filed application for all the information
provided the person in charge (Deputy Director) would deem the application complete forn
the evaluation to start.
4) Lab Inspection Report: An inspector or team, as deemed necessary, would be deputed in the
field to inspect the premises of the applying laboratory and check consistency as well as
verify the information provided. The verification would be done through an android
application and the inspector would assign scores to each item (already built in the system)
for ease of evaluation by experts back in the headquarters.
5) The evaluation from Deputy Director and the field staff (in LIR) would be passed along to the
committee of experts for their evaluation and comments.
Section 2 of Chapter 1 Certification of environmental laboratories
Technical Report – Submission 5.1 Page No 28
6) The final Decision would lie with the Director countersigned and approved by the Director
General. The lab would either be certified or it would be asked to revise and improve the
flaws and resubmit the application again after improvements.
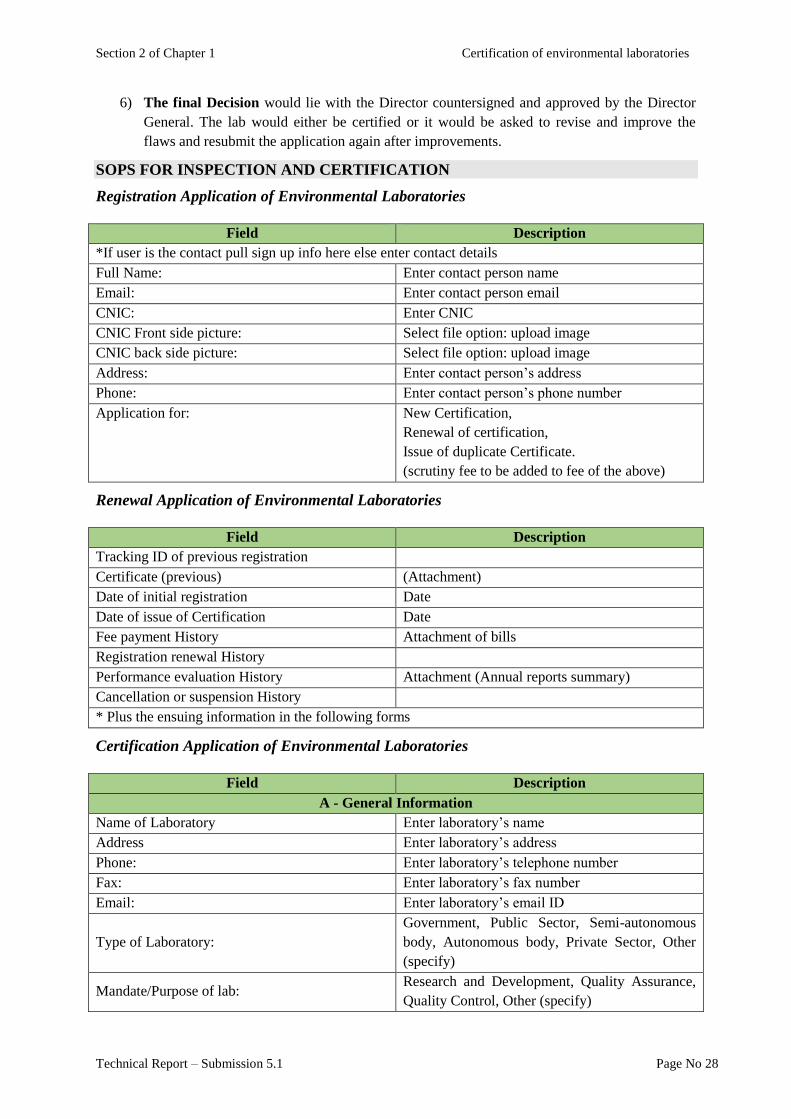
SOPS FOR INSPECTION AND CERTIFICATION
Registration Application of Environmental Laboratories
Field Description
*If user is the contact pull sign up info here else enter contact details
Full Name: Enter contact person name
Email: Enter contact person email
CNIC: Enter CNIC
CNIC Front side picture: Select file option: upload image
CNIC back side picture: Select file option: upload image
Address: Enter contact person’s address
Phone: Enter contact person’s phone number
Application for: New Certification,
Renewal of certification,
Issue of duplicate Certificate.
(scrutiny fee to be added to fee of the above)
Renewal Application of Environmental Laboratories
Field Description
Tracking ID of previous registration
Certificate (previous) (Attachment)
Date of initial registration Date
Date of issue of Certification Date
Fee payment History Attachment of bills
Registration renewal History
Performance evaluation History Attachment (Annual reports summary)
Cancellation or suspension History
* Plus the ensuing information in the following forms
Certification Application of Environmental Laboratories
Field Description
A - General Information
Name of Laboratory Enter laboratory’s name
Address Enter laboratory’s address
Phone: Enter laboratory’s telephone number
Fax: Enter laboratory’s fax number
Email: Enter laboratory’s email ID
Type of Laboratory:
Government, Public Sector, Semi-autonomous
body, Autonomous body, Private Sector, Other
(specify)
Mandate/Purpose of lab: Research and Development, Quality Assurance,
Quality Control, Other (specify)
Section 2 of Chapter 1 Certification of environmental laboratories
Technical Report – Submission 5.1 Page No 29
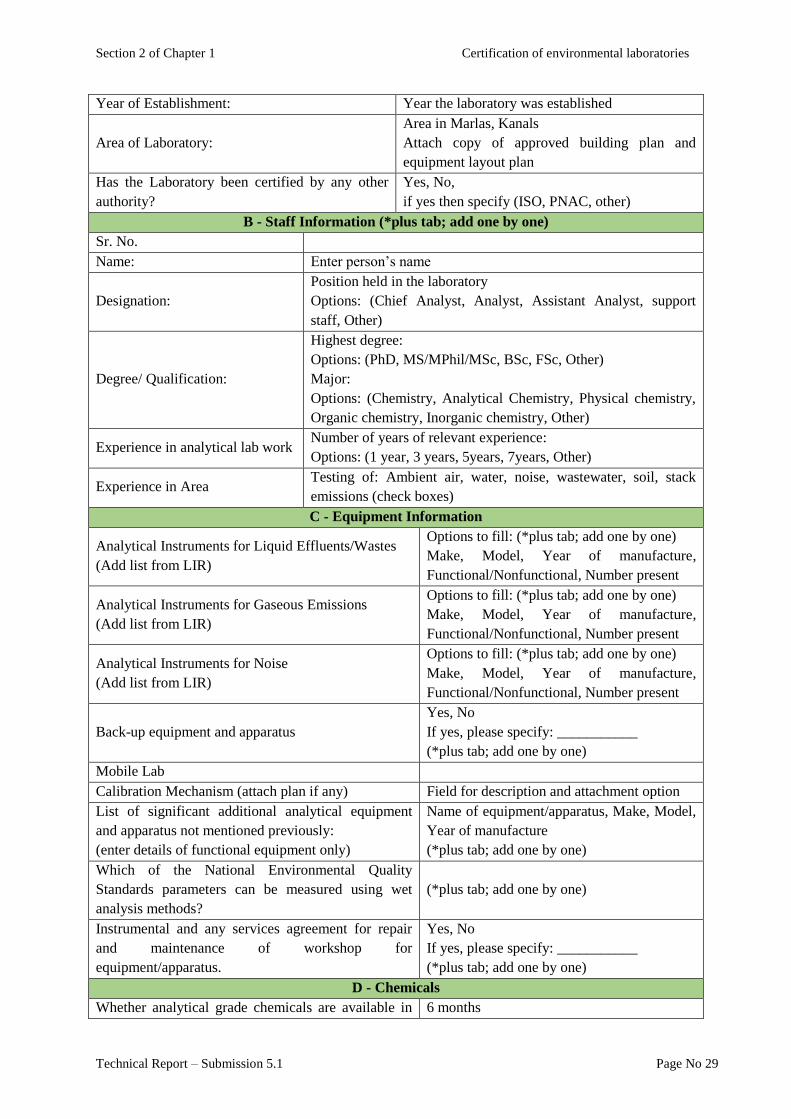
Year of Establishment: Year the laboratory was established
Area of Laboratory:
Area in Marlas, Kanals
Attach copy of approved building plan and
equipment layout plan
Has the Laboratory been certified by any other
authority?
Yes, No,
if yes then specify (ISO, PNAC, other)
B - Staff Information (*plus tab; add one by one)
Sr. No.
Name: Enter person’s name
Designation:
Position held in the laboratory
Options: (Chief Analyst, Analyst, Assistant Analyst, support
staff, Other)
Degree/ Qualification:
Highest degree:
Options: (PhD, MS/MPhil/MSc, BSc, FSc, Other)
Major:
Options: (Chemistry, Analytical Chemistry, Physical chemistry,
Organic chemistry, Inorganic chemistry, Other)
Experience in analytical lab work Number of years of relevant experience:
Options: (1 year, 3 years, 5years, 7years, Other)
Experience in Area Testing of: Ambient air, water, noise, wastewater, soil, stack
emissions (check boxes)
C - Equipment Information
Analytical Instruments for Liquid Effluents/Wastes
(Add list from LIR)
Options to fill: (*plus tab; add one by one)
Make, Model, Year of manufacture,
Functional/Nonfunctional, Number present
Analytical Instruments for Gaseous Emissions
(Add list from LIR)
Options to fill: (*plus tab; add one by one)
Make, Model, Year of manufacture,
Functional/Nonfunctional, Number present
Analytical Instruments for Noise
(Add list from LIR)
Options to fill: (*plus tab; add one by one)
Make, Model, Year of manufacture,
Functional/Nonfunctional, Number present
Back-up equipment and apparatus
Yes, No
If yes, please specify: ___________
(*plus tab; add one by one)
Mobile Lab
Calibration Mechanism (attach plan if any) Field for description and attachment option
List of significant additional analytical equipment
and apparatus not mentioned previously:
(enter details of functional equipment only)
Name of equipment/apparatus, Make, Model,
Year of manufacture
(*plus tab; add one by one)
Which of the National Environmental Quality
Standards parameters can be measured using wet
analysis methods?
(*plus tab; add one by one)
Instrumental and any services agreement for repair
and maintenance of workshop for
equipment/apparatus.
Yes, No
If yes, please specify: ___________
(*plus tab; add one by one)
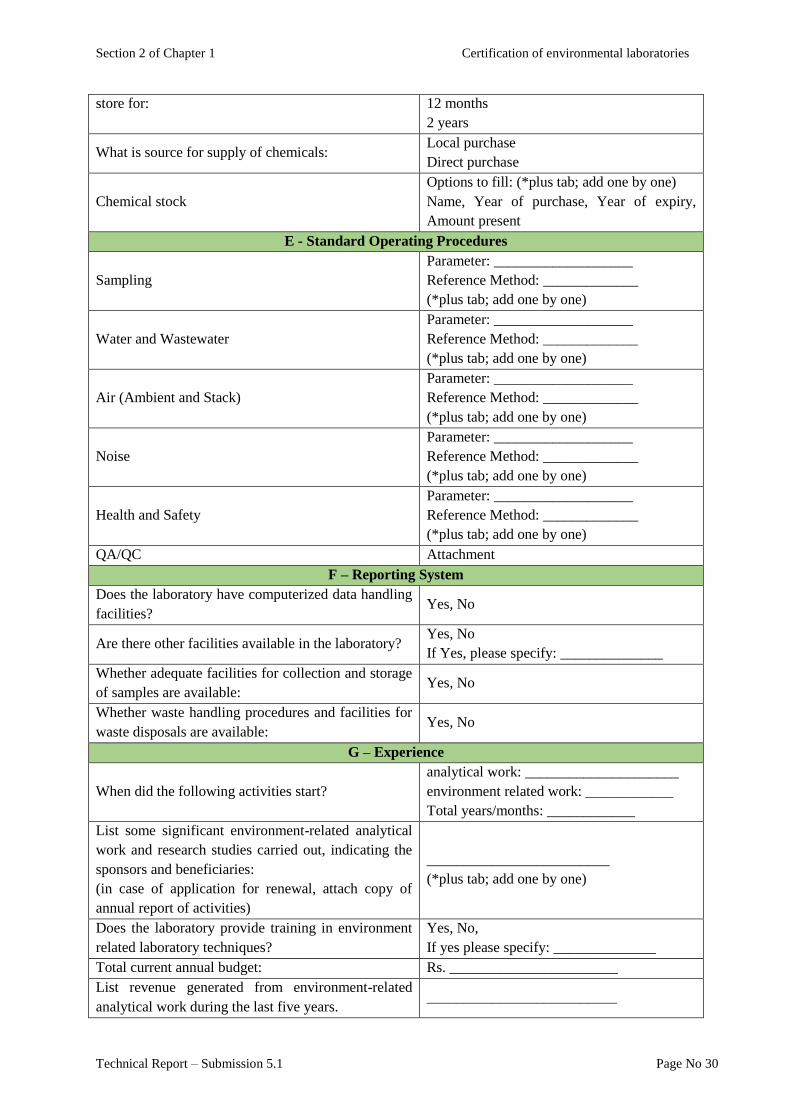
D - Chemicals
Whether analytical grade chemicals are available in 6 months
Section 2 of Chapter 1 Certification of environmental laboratories
Technical Report – Submission 5.1 Page No 30
store for: 12 months
2 years
What is source for supply of chemicals: Local purchase
Direct purchase
Chemical stock
Options to fill: (*plus tab; add one by one)
Name, Year of purchase, Year of expiry,
Amount present
E - Standard Operating Procedures
Sampling
Parameter: ___________________
Reference Method: _____________
(*plus tab; add one by one)
Water and Wastewater
Parameter: ___________________
Reference Method: _____________
(*plus tab; add one by one)
Air (Ambient and Stack)
Parameter: ___________________
Reference Method: _____________
(*plus tab; add one by one)
Noise
Parameter: ___________________
Reference Method: _____________
(*plus tab; add one by one)
Health and Safety
Parameter: ___________________
Reference Method: _____________
(*plus tab; add one by one)
QA/QC Attachment
F – Reporting System
Does the laboratory have computerized data handling
facilities? Yes, No
Are there other facilities available in the laboratory? Yes, No
If Yes, please specify: ______________
Whether adequate facilities for collection and storage
of samples are available: Yes, No
Whether waste handling procedures and facilities for
waste disposals are available: Yes, No
G – Experience
When did the following activities start?
analytical work: _____________________
environment related work: ____________
Total years/months: ____________
List some significant environment-related analytical
work and research studies carried out, indicating the
sponsors and beneficiaries:
(in case of application for renewal, attach copy of
annual report of activities)
_________________________
(*plus tab; add one by one)
Does the laboratory provide training in environment
related laboratory techniques?
Yes, No,
If yes please specify: ______________
Total current annual budget: Rs. _______________________
List revenue generated from environment-related
analytical work during the last five years. __________________________

Section 2 of Chapter 1 Certification of environmental laboratories
Technical Report – Submission 5.1 Page No 31
Certifications:
Options:
ISO/IEC: (Fill ref number)
PNAC
Punjab EPA
Federal EPA
Other: ________________________
Note: Every Data Field mentioned above would be pulled into respective field in the LIR for
the inspector to verify.
Section 2 of Chapter 1 Certification of environmental laboratories
Technical Report – Submission 5.1 Page No 32
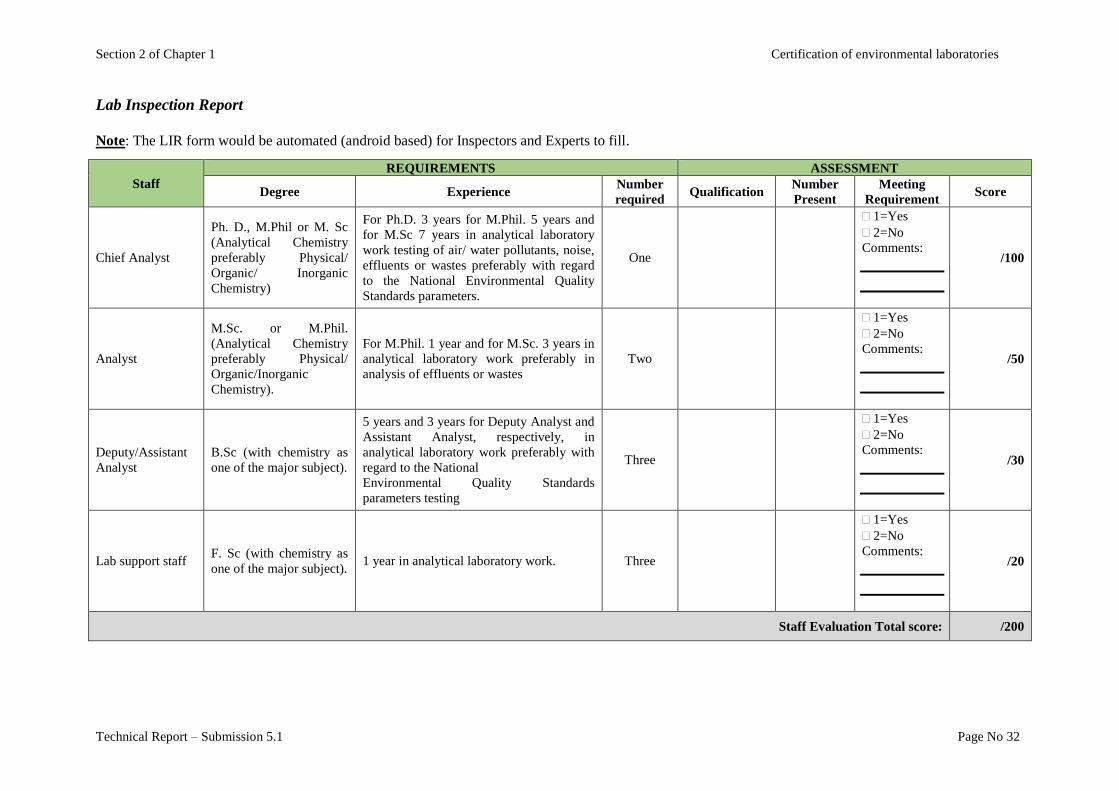
Lab Inspection Report
Note: The LIR form would be automated (android based) for Inspectors and Experts to fill.
Staff
REQUIREMENTS ASSESSMENT
Degree Experience Number
required Qualification
Number
Present
Meeting
Requirement Score
Chief Analyst
Ph. D., M.Phil or M. Sc
(Analytical Chemistry
preferably Physical/
Organic/ Inorganic
Chemistry)
For Ph.D. 3 years for M.Phil. 5 years and
for M.Sc 7 years in analytical laboratory
work testing of air/ water pollutants, noise,
effluents or wastes preferably with regard
to the National Environmental Quality
Standards parameters.
One
1=Yes
2=No
Comments:
/100
Analyst
M.Sc. or M.Phil.
(Analytical Chemistry
preferably Physical/
Organic/Inorganic
Chemistry).
For M.Phil. 1 year and for M.Sc. 3 years in
analytical laboratory work preferably in
analysis of effluents or wastes
Two
1=Yes
2=No
Comments:
/50
Deputy/Assistant
Analyst
B.Sc (with chemistry as
one of the major subject).
5 years and 3 years for Deputy Analyst and
Assistant Analyst, respectively, in
analytical laboratory work preferably with
regard to the National
Environmental Quality Standards
parameters testing
Three
1=Yes
2=No
Comments:
/30
Lab support staff F. Sc (with chemistry as
one of the major subject). 1 year in analytical laboratory work. Three
1=Yes
2=No
Comments:
/20
Staff Evaluation Total score: /200
Section 2 of Chapter 1 Certification of environmental laboratories
Technical Report – Submission 5.1 Page No 33
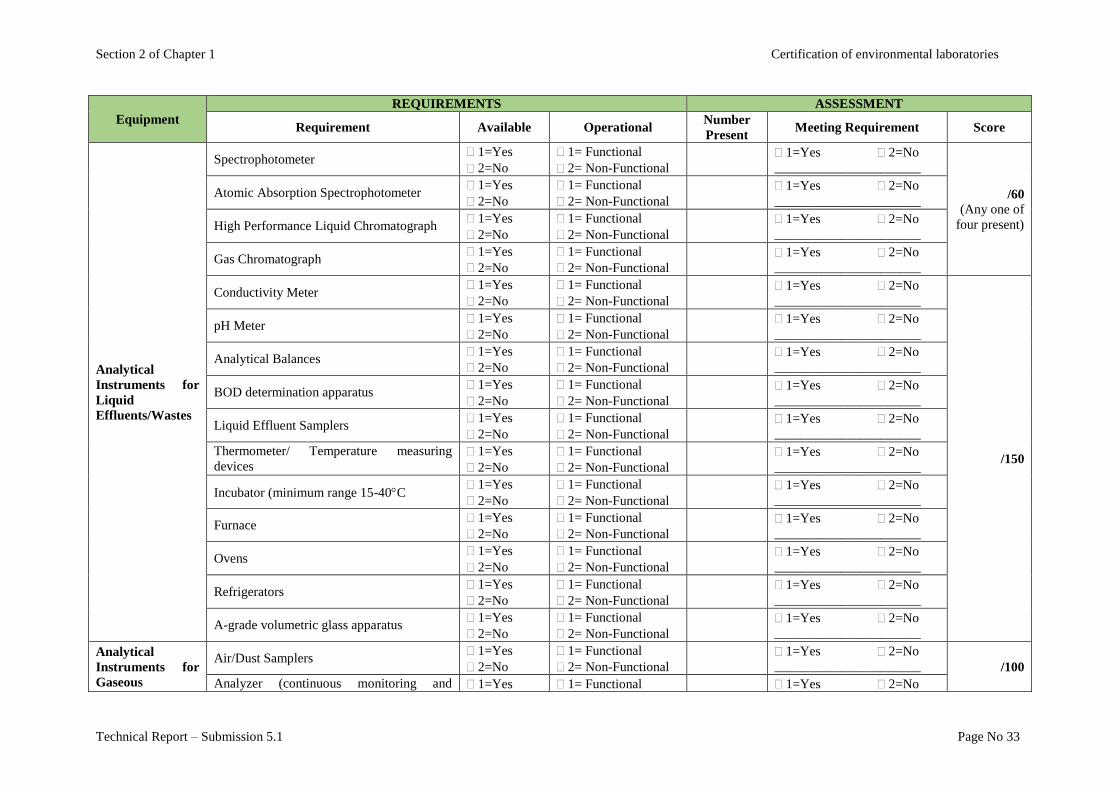
Equipment
REQUIREMENTS ASSESSMENT
Requirement Available Operational Number
Present Meeting Requirement Score
Analytical
Instruments for
Liquid
Effluents/Wastes
Spectrophotometer 1=Yes
2=No
1= Functional
2= Non-Functional
1=Yes 2=No
______________________
/60
(Any one of
four present)
Atomic Absorption Spectrophotometer 1=Yes
2=No
1= Functional
2= Non-Functional
1=Yes 2=No
______________________
High Performance Liquid Chromatograph 1=Yes
2=No
1= Functional
2= Non-Functional
1=Yes 2=No
______________________
Gas Chromatograph 1=Yes
2=No
1= Functional
2= Non-Functional
1=Yes 2=No
______________________
Conductivity Meter 1=Yes
2=No
1= Functional
2= Non-Functional
1=Yes 2=No
______________________
/150
pH Meter 1=Yes
2=No
1= Functional
2= Non-Functional
1=Yes 2=No
______________________
Analytical Balances 1=Yes
2=No
1= Functional
2= Non-Functional
1=Yes 2=No
______________________
BOD determination apparatus 1=Yes
2=No
1= Functional
2= Non-Functional
1=Yes 2=No
______________________
Liquid Effluent Samplers 1=Yes
2=No
1= Functional
2= Non-Functional
1=Yes 2=No
______________________
Thermometer/ Temperature measuring
devices
1=Yes
2=No
1= Functional
2= Non-Functional
1=Yes 2=No
______________________
Incubator (minimum range 15-40C 1=Yes
2=No
1= Functional
2= Non-Functional
1=Yes 2=No
______________________
Furnace 1=Yes
2=No
1= Functional
2= Non-Functional
1=Yes 2=No
______________________
Ovens 1=Yes
2=No
1= Functional
2= Non-Functional
1=Yes 2=No
______________________
Refrigerators 1=Yes
2=No
1= Functional
2= Non-Functional
1=Yes 2=No
______________________
A-grade volumetric glass apparatus 1=Yes
2=No
1= Functional
2= Non-Functional
1=Yes 2=No
______________________
Analytical
Instruments for
Gaseous
Air/Dust Samplers 1=Yes
2=No
1= Functional
2= Non-Functional
1=Yes 2=No
______________________ /100
Analyzer (continuous monitoring and 1=Yes 1= Functional 1=Yes 2=No
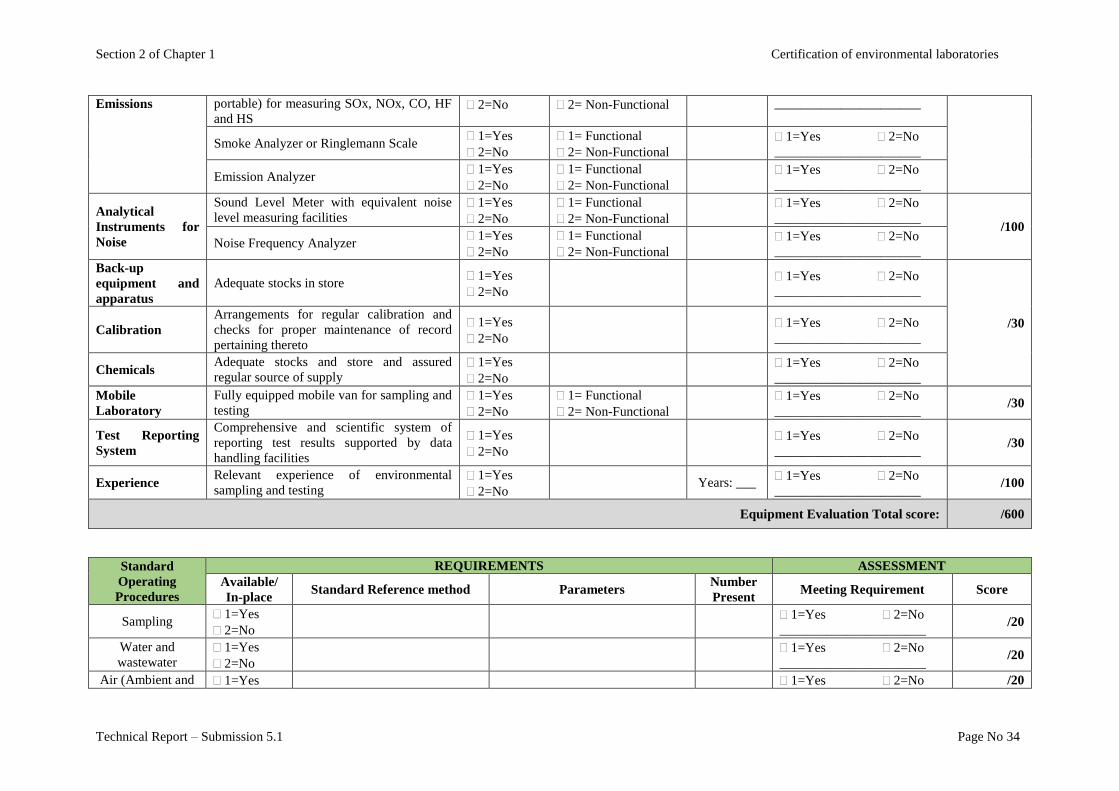
Section 2 of Chapter 1 Certification of environmental laboratories
Technical Report – Submission 5.1 Page No 34
Emissions portable) for measuring SOx, NOx, CO, HF
and HS 2=No 2= Non-Functional ______________________
Smoke Analyzer or Ringlemann Scale 1=Yes
2=No
1= Functional
2= Non-Functional
1=Yes 2=No
______________________
Emission Analyzer 1=Yes
2=No
1= Functional
2= Non-Functional
1=Yes 2=No
______________________
Analytical
Instruments for
Noise
Sound Level Meter with equivalent noise
level measuring facilities
1=Yes
2=No
1= Functional
2= Non-Functional
1=Yes 2=No
______________________ /100
Noise Frequency Analyzer 1=Yes
2=No
1= Functional
2= Non-Functional
1=Yes 2=No
______________________
Back-up
equipment and
apparatus
Adequate stocks in store 1=Yes
2=No
1=Yes 2=No
______________________
/30 Calibration
Arrangements for regular calibration and
checks for proper maintenance of record
pertaining thereto
1=Yes
2=No
1=Yes 2=No
______________________
Chemicals Adequate stocks and store and assured
regular source of supply
1=Yes
2=No
1=Yes 2=No
______________________
Mobile
Laboratory
Fully equipped mobile van for sampling and
testing
1=Yes
2=No
1= Functional
2= Non-Functional
1=Yes 2=No
______________________ /30
Test Reporting
System
Comprehensive and scientific system of
reporting test results supported by data
handling facilities
1=Yes
2=No
1=Yes 2=No
______________________ /30
Experience Relevant experience of environmental
sampling and testing
1=Yes
2=No Years: ___
1=Yes 2=No
______________________ /100
Equipment Evaluation Total score: /600
Standard
Operating
Procedures
REQUIREMENTS ASSESSMENT
Available/
In-place Standard Reference method Parameters
Number
Present Meeting Requirement Score
Sampling 1=Yes
2=No
1=Yes 2=No
______________________ /20
Water and
wastewater
1=Yes
2=No
1=Yes 2=No
______________________ /20
Air (Ambient and 1=Yes 1=Yes 2=No /20

Section 2 of Chapter 1 Certification of environmental laboratories
Technical Report – Submission 5.1 Page No 35
Stack) 2=No ______________________
Noise 1=Yes
2=No
1=Yes 2=No
______________________ /10
Health and Safety 1=Yes
2=No
1=Yes 2=No
______________________ /10
QA/QC 1=Yes
2=No
1=Yes 2=No
______________________ /20
SOPs Evaluation Total score: /100
Certifications
REQUIREMENTS ASSESSMENT
Certified Category
(eg. Testing & Calibration) Date of issuance Date of expiry Score
Punjab EPA 1=Yes
2=No
/20
Federal EPA 1=Yes
2=No
PNAC 1=Yes
2=No /30
ISO/IEC 1=Yes
2=No /30
Any Other:
________________
1=Yes
2=No
/20 Any Other:
________________
1=Yes
2=No
Evaluation Total score: /100
Section 2 of Chapter 1 Certification of environmental laboratories
Technical Report – Submission 5.1 Page No 36
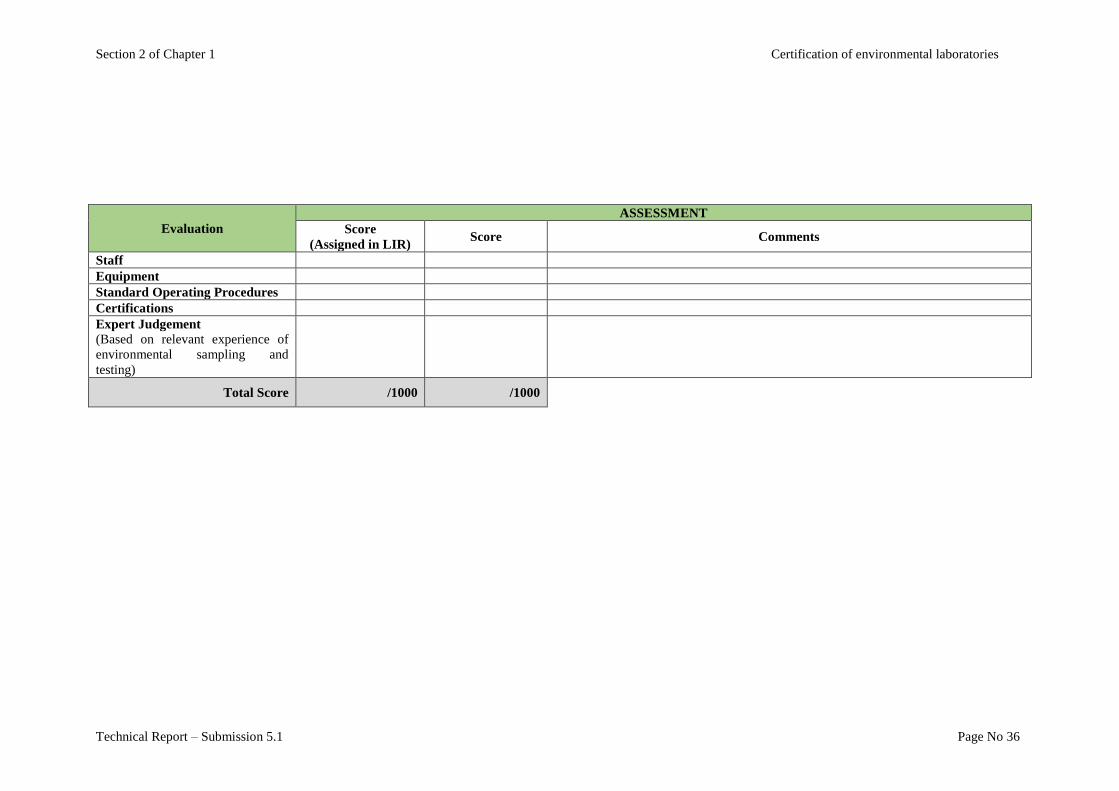
Evaluation
ASSESSMENT
Score
(Assigned in LIR) Score Comments
Staff
Equipment
Standard Operating Procedures
Certifications
Expert Judgement
(Based on relevant experience of
environmental sampling and
testing)
Total Score /1000 /1000

Section 3
Quality Assurance / Quality Control
System


Section 3 of Chapter 1 Quality Assurance / Quality Control System
Section 3
QUALITY ASSURANCE / QUALITY
CONTROL SYSTEM A QA/QC manual is designed to identify policies, organization, objectives, functional activities, and
Quality Assurance/Quality Control activities aimed at achieving quality goals desired for operation of
a laboratory. The manual is also intended to give confidence to users of the lab's reports by indicating
specific methods and procedures by which the lab achieves its quality objectives.
The QA/QC manual documents how the lab ensures the quality of results reported by the lab. QA is
important during sampling, preservation and transport of samples to the lab, while samples are being
analysed as well as when data is reported.
The QA/QC manual is primarily intended for use by laboratory personnel to ensure reliability of
results. It is also used by personnel outside the lab to gain insight and confidence in the overall QA
measures used by the lab. The manual must be readily available to analysts and lab personnel.
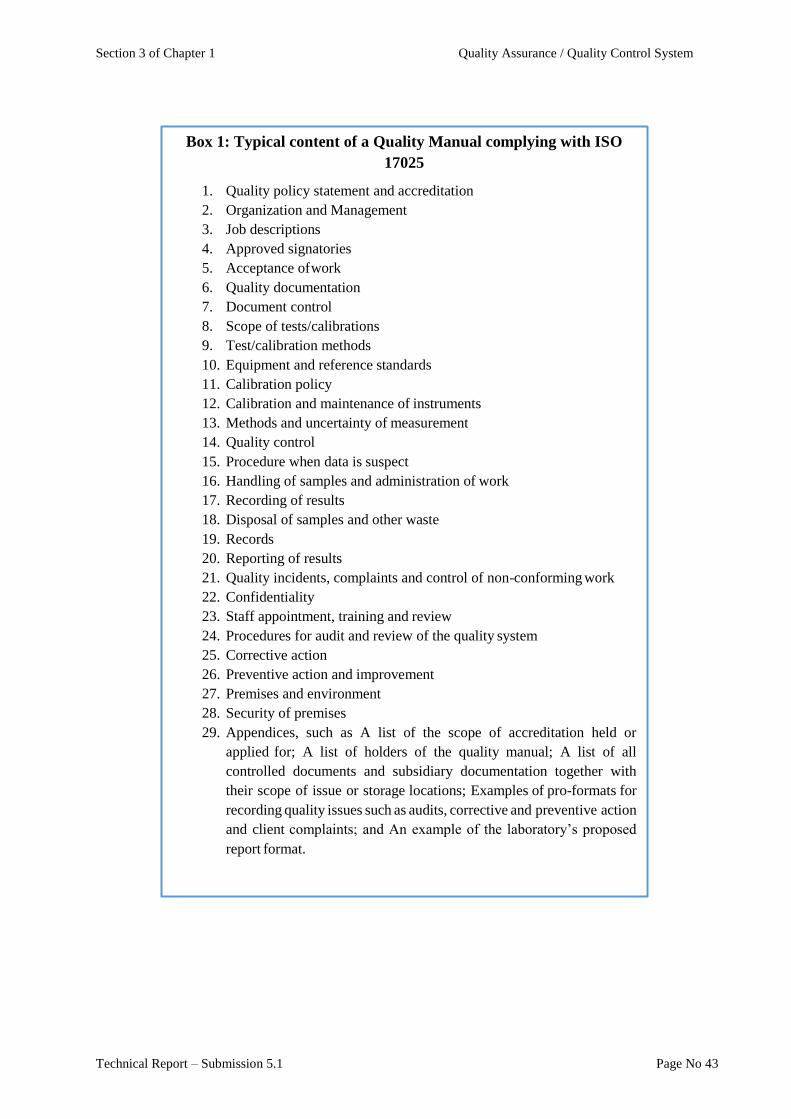
The main features and content of a QA/QC manual (Box 1), which also complies with ISO 17025,
includes the following:
1) Quality policy statement and accreditation: This should be made on the authority of the
most senior management body for the laboratory. This must be at the level where decisions on
resource allocation are made. It should contain a commitment to quality, to good professional
practice and to a quality management system based on ISO 17025. It should also contain a
commitment to provide resources to support this level of quality.
2) Organization and Management: This section should show the internal organisation of the
laboratory and the relationship between the laboratory and any organisation of which it is a
part. It should include organisational charts to show that the quality manager has access to the
highest level of management and to the laboratory manager. Each level of staff should be
described, with an outline of the level of experience and qualifications required to fill each
grade. The object of this is to set a minimum acceptable level of expertise at each level which
the laboratory undertakes to maintain, but the description should allow sufficient flexibility to
admit staff with specialised but narrow capabilities, where required.
3) Job descriptions: This section should contain full job descriptions of key staff. This must
include the laboratory manager and the quality manager and their deputies. It should make
clear what the responsibilities of each post are and what functions each performs. Any other
key posts should also be included.
4) Approved signatories: This section must define precisely, either by name, seniority or post,
the individuals who are authorized to take responsibility for the laboratory's data. Only these
individuals may authorize the release of work and sign test/calibration certificates.
5) Acceptance of work: This section should make clear exactly who may accept work and
commit the laboratory to a delivery date. It should state that the person accepting the work is
under an obligation to ensure that the laboratory has the equipment and expertise to do the
work and that they must not enter into a commitment unless they can be certain on this point.
The formal contract review process can be described here.
6) Quality documentation: The structure of the quality documentation should be defined. This
will normally be a hierarchy, headed by the quality manual, which refers to the methods
manual or equivalent technical and other procedural documentation. Reference should be
Section 3 of Chapter 1 Quality Assurance / Quality Control System
made to the subsidiary records and documentation such as the equipment logs and the staff
records. The purpose of each piece of documentation must also be defined as well as the
person responsible for maintaining it and authorizing it to be issued.
7) Document control: The controlled document system should be described and the
responsibility and authority of the quality manager in this respect defined.
8) Scope of tests/calibrations: This should state the laboratory's policy to use internationally
recognized methods wherever possible, supplemented by fully validated and documented in-
house methods. This section should also include or refer to a list of typical sources for
methods appropriate to the laboratory's scope of activities.
9) Test/calibration methods: There should be a description of the procedure for introducing a
new method. This will generally involve the laboratory manager in arranging to validate and
document the method. The quality manager should approve the validation and documentation
before the laboratory manager releases the method.
10) Equipment and reference standards: This section should list the major items of equipment
which the laboratory operates and the reference standards held. This can be expressed in
general terms and reference made to the equipment logs as a full inventory. The format and
operation of the equipment logs should be described and the procedure for checking and
accepting a new piece of equipment into service, as well as the procedure for the withdrawal
of equipment.
11) Calibration policy: There should be a statement of the policy of the laboratory to achieve
traceability of all measurements by the use of traceable (to SI units where relevant) standards
of measurement and certified reference materials. Where this is not achievable there should
be a commitment to inter-laboratory calibration exercises and similar measurement audits.
12) Calibration and maintenance of instruments: There should be a general statement of the
policy to calibrate at intervals such that the integrity of measurements is not set at risk. The
preferred procedure for determining calibration intervals should be stated. Reference should
be made to the procedural documents which describe instrument calibrations. A general
responsibility should be placed on all staff to ensure that any instrument or piece of
equipment which they suspect is out of calibration is not used until checked. The equipment
must be clearly labelled as suspect and not to be used. The problem should be brought to the
attention of the laboratory manager.
13) Methods and uncertainty of measurement: This section should describe the laboratory's
policy and procedures on the determination of method performance validation and on
assessing uncertainty of measurement. There should be a description of procedures to be used
at initial validation of methods and a description of the responsibility of the laboratory
manager for updating the information on the basis of QC data.
14) Quality control: There should be a general statement on which level of staff or individuals
are permitted to judge whether results meet quality control criteria. Reference should be made
to the fact that methods documentation includes details of the quality control data to be
collected and the criteria to be applied.
15) Procedure when data is suspect: The procedure to be followed when a suspicion that faulty
data has been released should be described. This will normally require investigation by the
laboratory manager and quality manager and probably an audit. Corrective action would also
normally be required.
16) Handling of samples and administration of work: This section should have a complete
description of the laboratory's procedures for receiving, storing and recording samples,
sample numbering and labelling, allocation of work, recording of results, quality checking of
results, preparation of reports and issuing reports.

Section 3 of Chapter 1 Quality Assurance / Quality Control System
17) Recording of results: This section should describe the use of worksheets and/or notebooks.
Instructions on the use of ink and the way of making corrections should be given.
18) Disposal of samples and other waste: The laboratory's policy on the length of time samples
are kept should be stated, as should the policy on disposal, with a commitment to the
responsible disposal of toxic materials.
19) Records: The laboratory policy on the retention of records should be stated and the procedure
to be followed in disposal of records must be given. This should define who may authorize
disposal and require that an inventory be kept of the records disposed of. The policy on
security of records, including computer data, must be stated, and the person responsible for
archiving and computer back-up identified.
20) Reporting of results: The minimum requirement for the contents of a report should be given
21) Quality incidents, complaints and control of non-conforming work: The laboratory's
policy to treat complaints positively and as a source of useful information should be stated.
The persons authorised to deal with complaints should be identified and the procedure for
recording complaints and following them up defined, including the requirement for corrective
action.
22) Confidentiality: The laboratory's policy to retain confidentiality should be stated.
Instructions must be included that all staff must take all reasonable precautions to keep
clients’ data and other information confidential. The requirement to ensure that no such
information is left out in the laboratory overnight or in an unattended room should be stated.
23) Staff appointment, training and review: The operation of the staff records must be
described including their use for recording new staff and changes in the training or status of
existing staff. The mechanism for selecting staff for training, carrying out the training and
assessing competence and for issuing authorisations to carry out tests, calibrations and other
procedures should be described.
24) Procedures for audit and review of the quality system: All of the procedures for the audit
and review of the quality system should be described together with the records to be kept, and
the policy on frequency of audits and review included.
25) Corrective action: The procedure for agreeing and recording corrective action should be
described, as well as a description of the procedure for follow-up to ensure corrective action
is complete and has been effective.
26) Preventive action and improvement: The procedures for identifying preventive action and
quality improvement opportunities should be described, and the responsibility for evaluating
suggestions and carrying out the preventive action assigned.
27) Premises and environment: The laboratory premises should be described and, ideally, a plan
included. This section should also draw attention to any parts of the premises to which access
is restricted and who is authorized to grant access, and should describe any areas subject to
special environmental controls as well as the mechanism for monitoring, recording and
maintaining such control.
28) Security of premises: This section should describe the arrangements for the security of the
premises during and outside working hours, identify the persons authorized to hold keys,
describe the procedure for granting authorization, and identify the person with overall
responsibility for security.
Section 3 of Chapter 1 Quality Assurance / Quality Control System
Technical Report – Submission 5.1 Page No 43
Box 1: Typical content of a Quality Manual complying with ISO
17025
1. Quality policy statement and accreditation
2. Organization and Management
3. Job descriptions
4. Approved signatories
5. Acceptance of work
6. Quality documentation
7. Document control
8. Scope of tests/calibrations
9. Test/calibration methods
10. Equipment and reference standards
11. Calibration policy
12. Calibration and maintenance of instruments
13. Methods and uncertainty of measurement
14. Quality control
15. Procedure when data is suspect
16. Handling of samples and administration of work
17. Recording of results
18. Disposal of samples and other waste
19. Records
20. Reporting of results
21. Quality incidents, complaints and control of non-conforming work
22. Confidentiality
23. Staff appointment, training and review
24. Procedures for audit and review of the quality system
25. Corrective action
26. Preventive action and improvement
27. Premises and environment
28. Security of premises
29. Appendices, such as A list of the scope of accreditation held or
applied for; A list of holders of the quality manual; A list of all
controlled documents and subsidiary documentation together with
their scope of issue or storage locations; Examples of pro-formats for
recording quality issues such as audits, corrective and preventive action
and client complaints; and An example of the laboratory’s proposed
report format.

Section 4
Accreditation

Section 4 of Chapter 1 Accreditation
Technical Report – Submission 5.1 Page No 46
Section 4
ACCREDITATION Accreditation involves thorough evaluation of a facility’s, in this case environmental Laboratory’s,
capacities, expertise and technological capabilities. To acquire accreditation as an environmental lab,
it should provide sufficient details and evidence regarding;
Lab's quality system
Staff
Facilities and equipment
Test methods and SOPs
Records and reports;
in order to indicate that the lab has the capability to provide accurate and defensible data.
REQUIREMENTS
To become accredited, EMC lab must:
i. Submit a complete application and pay the appropriate fee.
ii. Submit an acceptable QA manual.
iii. Submit documentation of initial QC procedures required by the methods.
iv. Successfully analyse required PT samples.
v. Pass an on-site audit by Ecology or another recognized accrediting authority.
CONTINUING ACCREDITATION
To retain accreditation, EMC lab must:
i. Submit results of PT sample analyses.
ii. Make required improvements in its QA program.
iii. Report significant changes in facility, equipment, personnel, or QA/QC procedures.
iv. Submit a renewal application and pay annual fees.
v. Submit to required audits and implement any required corrective actions.
EMC must get accreditation from Pakistan National Accreditation Council, Islamabad, in order to be
certified as a quality reference environmental laboratory. The main SOP of the PNAC accreditation
procedure is given below:
Accreditation Application by PNAC
Organization
(Address of laboratory)
Postcode
Tel:
Fax:
Person to whom enquiries about this application should be directed
Name of Contact:
Designation:
Address:
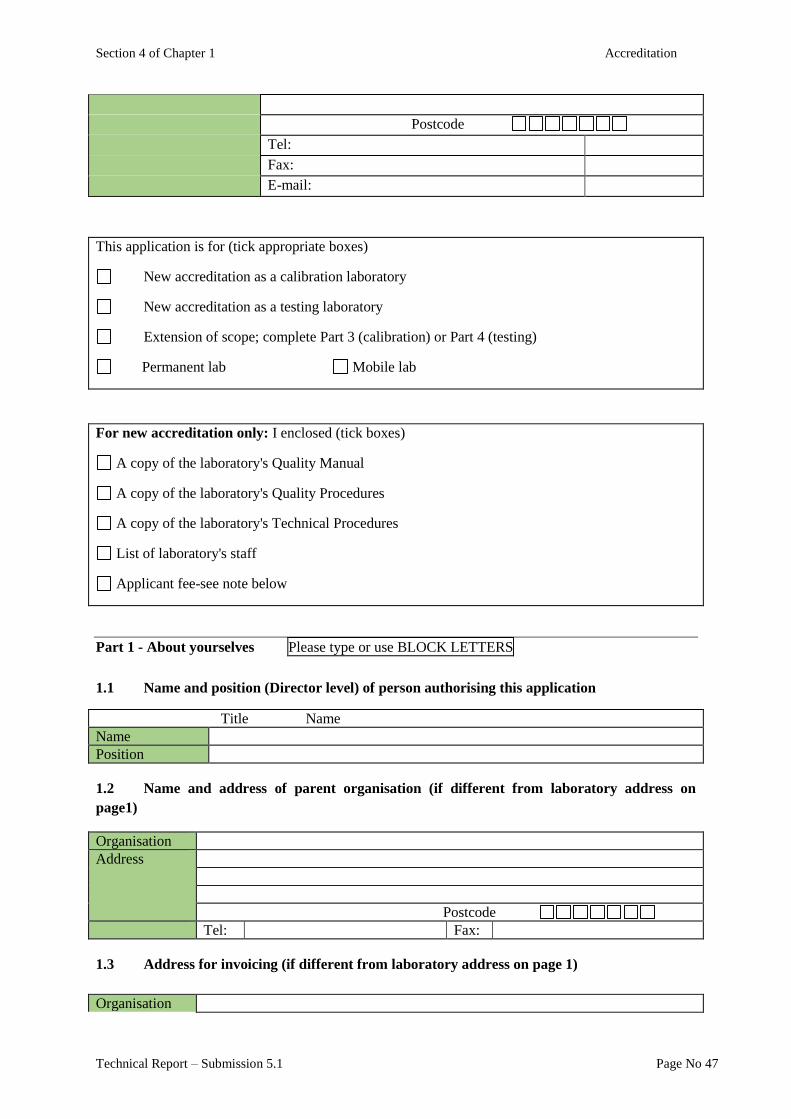
Section 4 of Chapter 1 Accreditation
Technical Report – Submission 5.1 Page No 47
Postcode
Tel:
Fax:
E-mail:
This application is for (tick appropriate boxes)
New accreditation as a calibration laboratory
New accreditation as a testing laboratory
Extension of scope; complete Part 3 (calibration) or Part 4 (testing)
Permanent lab Mobile lab
For new accreditation only: I enclosed (tick boxes)
A copy of the laboratory's Quality Manual
A copy of the laboratory's Quality Procedures
A copy of the laboratory's Technical Procedures
List of laboratory's staff
Applicant fee-see note below
Part 1 - About yourselves Please type or use BLOCK LETTERS
1.1 Name and position (Director level) of person authorising this application
Title Name
Name
Position
1.2 Name and address of parent organisation (if different from laboratory address on
page1)
Organisation
Address
Postcode
Tel: Fax:
1.3 Address for invoicing (if different from laboratory address on page 1)
Organisation
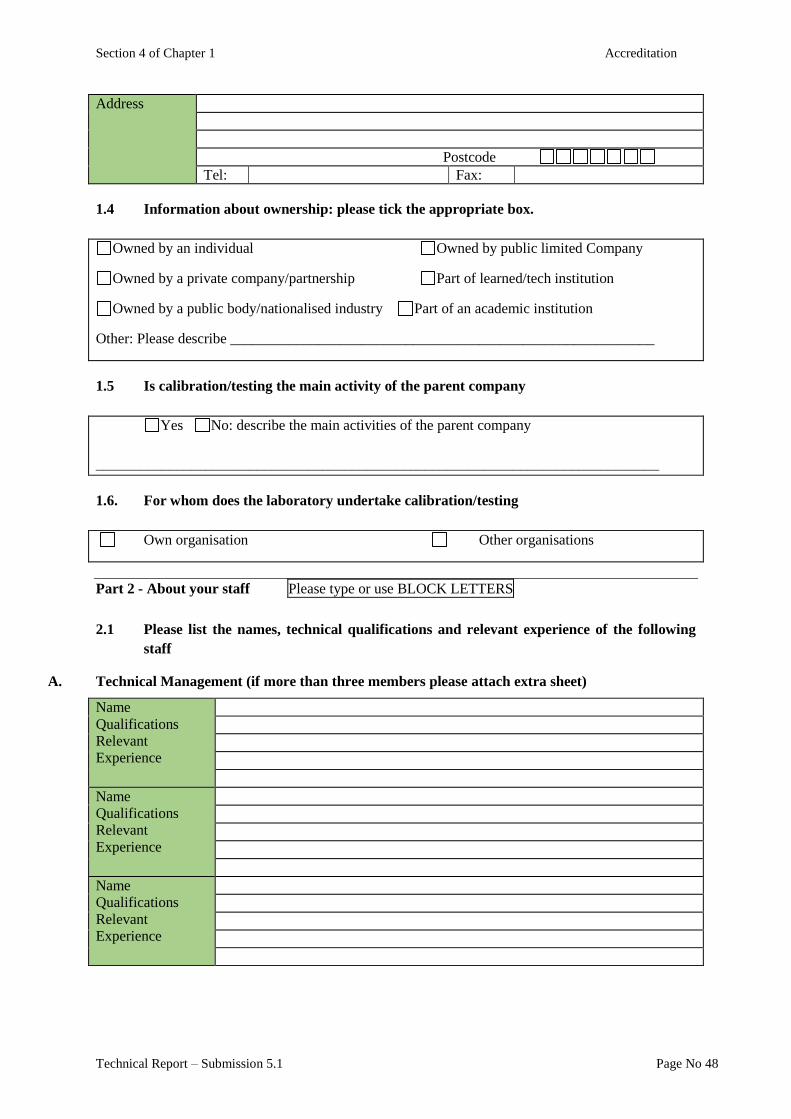
Section 4 of Chapter 1 Accreditation
Technical Report – Submission 5.1 Page No 48
Address
Postcode
Tel: Fax:
1.4 Information about ownership: please tick the appropriate box.
Owned by an individual Owned by public limited Company
Owned by a private company/partnership Part of learned/tech institution
Owned by a public body/nationalised industry Part of an academic institution
Other: Please describe __________________________________________________________
1.5 Is calibration/testing the main activity of the parent company
Yes No: describe the main activities of the parent company
_____________________________________________________________________________
1.6. For whom does the laboratory undertake calibration/testing
Own organisation Other organisations
Part 2 - About your staff Please type or use BLOCK LETTERS
2.1 Please list the names, technical qualifications and relevant experience of the following
staff
A. Technical Management (if more than three members please attach extra sheet)
Name
Qualifications
Relevant
Experience
Name
Qualifications
Relevant
Experience
Name
Qualifications
Relevant
Experience

Section 4 of Chapter 1 Accreditation
Technical Report – Submission 5.1 Page No 49
B. Quality Manager
Name
Qualifications
Relevant
Experience
Part 3 - Scope of application: calibration
List all the measurement parameters for which you seek accreditation. Use a photocopy of this
page for each field of measurement.
Field of measurement:
Measured quantity Range
Calibration & Measurement
Capability (CMC)
expressed as an uncertainty
( + )
Brief description of
measurement and
equipment used
*capabilities are to be expressed as uncertainties (±) for a confidence probability of not less than 95%
Part 4 - Scope of application: testing
4A. As far as is possible, quote standard specifications in the third column. These may include
specifications issued by companies and other organisations, both Pakistan and foreign, as well as
national and international standards. Give reference numbers and dates of specifications quoted.
In the absence of standard specifications, documented in-house procedures may be quoted: cross-refer
to your laboratory's Quality Manual/Procedures Manual.
(Use of photocopy of this page, if the space given is found insufficient)
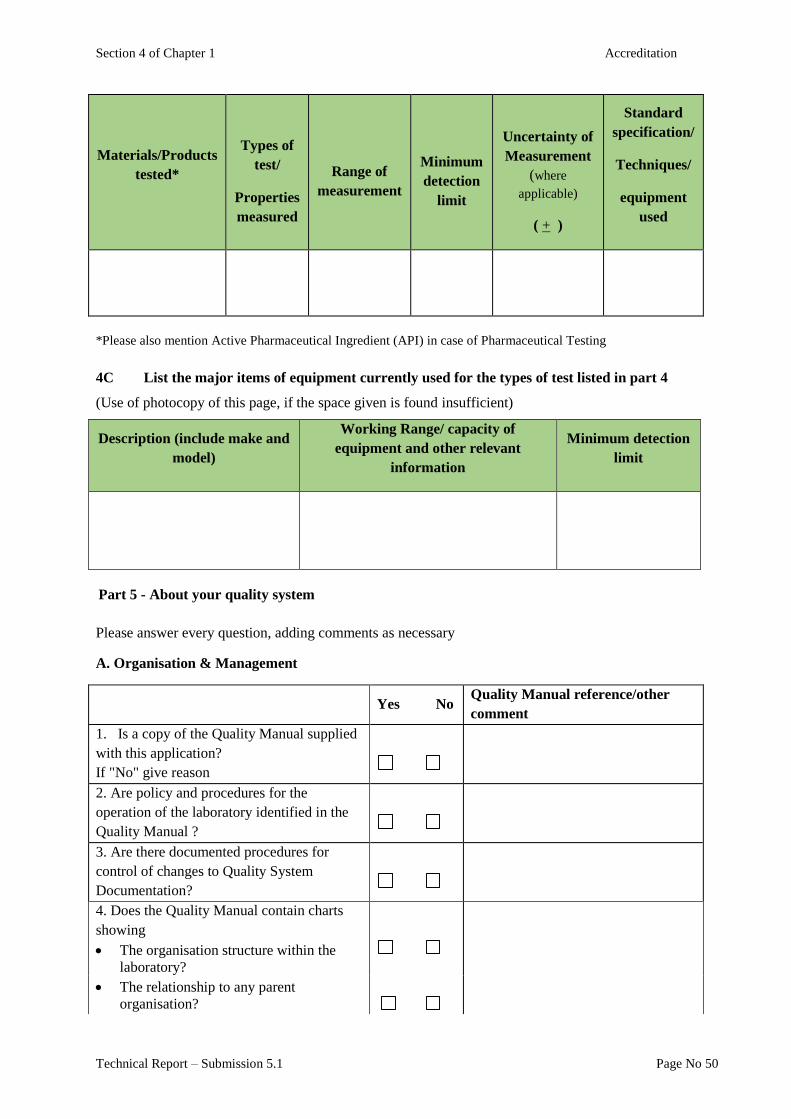
Section 4 of Chapter 1 Accreditation
Technical Report – Submission 5.1 Page No 50
Materials/Products
tested*
Types of
test/
Properties
measured
Range of
measurement
Minimum
detection
limit
Uncertainty of
Measurement
(where
applicable)
( + )
Standard
specification/
Techniques/
equipment
used
*Please also mention Active Pharmaceutical Ingredient (API) in case of Pharmaceutical Testing
4C List the major items of equipment currently used for the types of test listed in part 4
(Use of photocopy of this page, if the space given is found insufficient)
Description (include make and
model)
Working Range/ capacity of
equipment and other relevant
information
Minimum detection
limit
Part 5 - About your quality system
Please answer every question, adding comments as necessary
A. Organisation & Management
Yes No Quality Manual reference/other
comment
1. Is a copy of the Quality Manual supplied
with this application?
If "No" give reason
2. Are policy and procedures for the
operation of the laboratory identified in the
Quality Manual ?
3. Are there documented procedures for
control of changes to Quality System
Documentation?
4. Does the Quality Manual contain charts
showing
The organisation structure within the
laboratory?
The relationship to any parent
organisation?
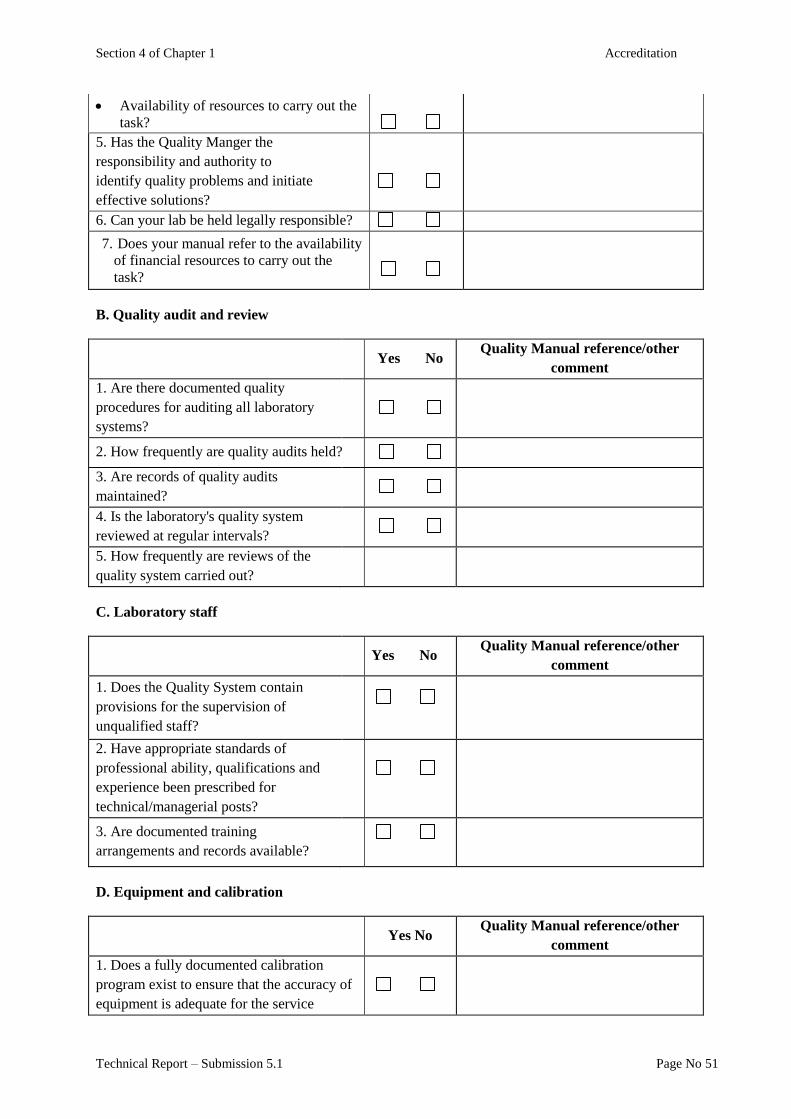
Section 4 of Chapter 1 Accreditation
Technical Report – Submission 5.1 Page No 51
Availability of resources to carry out the
task?
5. Has the Quality Manger the
responsibility and authority to
identify quality problems and initiate
effective solutions?
6. Can your lab be held legally responsible?
7. Does your manual refer to the availability
of financial resources to carry out the
task?
B. Quality audit and review
Yes No Quality Manual reference/other
comment
1. Are there documented quality
procedures for auditing all laboratory
systems?
2. How frequently are quality audits held?
3. Are records of quality audits
maintained?
4. Is the laboratory's quality system
reviewed at regular intervals?
5. How frequently are reviews of the
quality system carried out?
C. Laboratory staff
Yes No Quality Manual reference/other
comment
1. Does the Quality System contain
provisions for the supervision of
unqualified staff?
2. Have appropriate standards of
professional ability, qualifications and
experience been prescribed for
technical/managerial posts?
3. Are documented training
arrangements and records available?
D. Equipment and calibration
Yes No Quality Manual reference/other
comment
1. Does a fully documented calibration
program exist to ensure that the accuracy of
equipment is adequate for the service

Section 4 of Chapter 1 Accreditation
Technical Report – Submission 5.1 Page No 52
operated by the laboratory?
2. Is a record maintained for test equipment,
including calibration results?
3. Are adequate facilities and environments
provided for calibration, handling, control,
storage and maintenance of all testing &
measuring equipment?
4. Are there documented procedures for
calibrating all equipment and reference
standards which cover the method of
calibration and maximum, intervals between
calibrations?
5. Are the internal laboratory reference
standards, and the calibration of key testing
equipment traceable to national standard
through:
PNAC accredited
Other bodies (specify)?
E. Procedures
Yes No
Quality Manual reference/other
comment
1. Are all methods and procedures for
calibration and testing fully documented?
2. Does the laboratory use any non-standard
methods (e.g documented in-house
methods)?
3. Are the documents referred to above
available to all concerned?
F. Accommodation & environment
Yes No Quality Manual reference/other
comment
1. Are the environmental conditions in
which calibration/tests are undertaken
suitable for the accuracy of the
determinations made?
2. Is there control of access to work areas?
G. Handling and storage
Yes No Quality Manual reference/other
comment
1. Are work and inspection instructions
documented and implemented for the
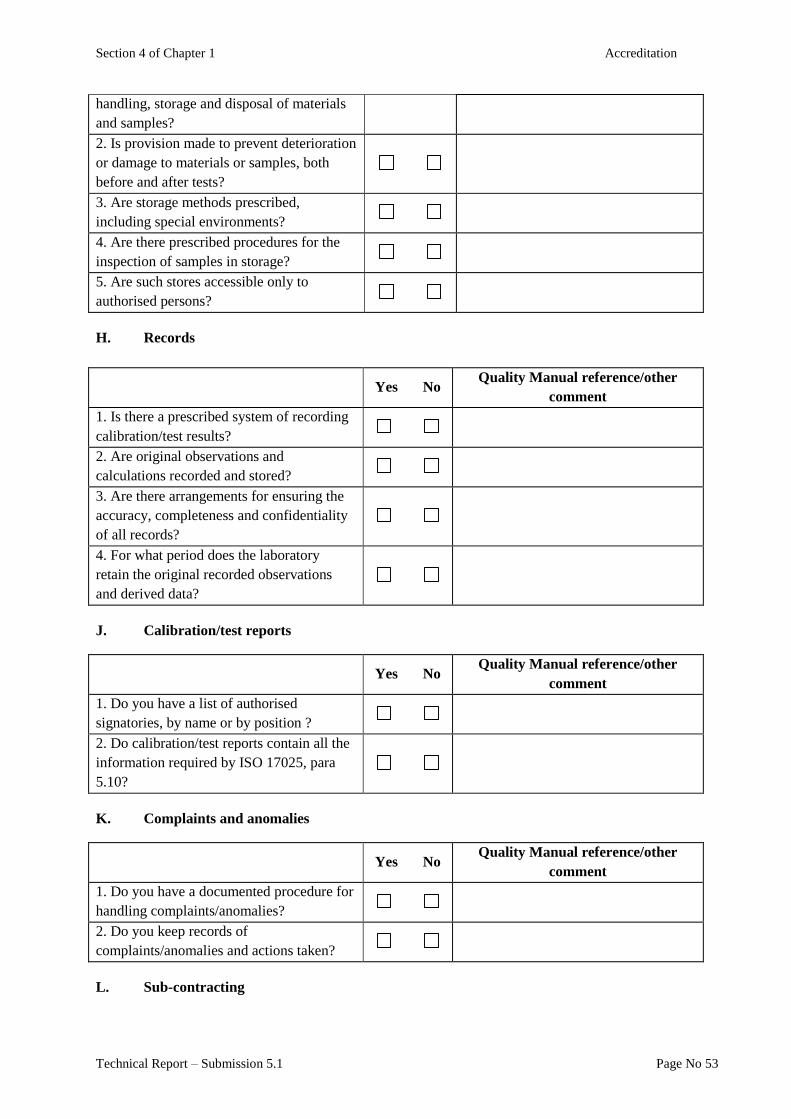
Section 4 of Chapter 1 Accreditation
Technical Report – Submission 5.1 Page No 53
handling, storage and disposal of materials
and samples?
2. Is provision made to prevent deterioration
or damage to materials or samples, both
before and after tests?
3. Are storage methods prescribed,
including special environments?
4. Are there prescribed procedures for the
inspection of samples in storage?
5. Are such stores accessible only to
authorised persons?
H. Records
Yes No
Quality Manual reference/other
comment
1. Is there a prescribed system of recording
calibration/test results?
2. Are original observations and
calculations recorded and stored?
3. Are there arrangements for ensuring the
accuracy, completeness and confidentiality
of all records?
4. For what period does the laboratory
retain the original recorded observations
and derived data?
J. Calibration/test reports
Yes No Quality Manual reference/other
comment
1. Do you have a list of authorised
signatories, by name or by position ?
2. Do calibration/test reports contain all the
information required by ISO 17025, para
5.10?
K. Complaints and anomalies
Yes No
Quality Manual reference/other
comment
1. Do you have a documented procedure for
handling complaints/anomalies?
2. Do you keep records of
complaints/anomalies and actions taken?
L. Sub-contracting
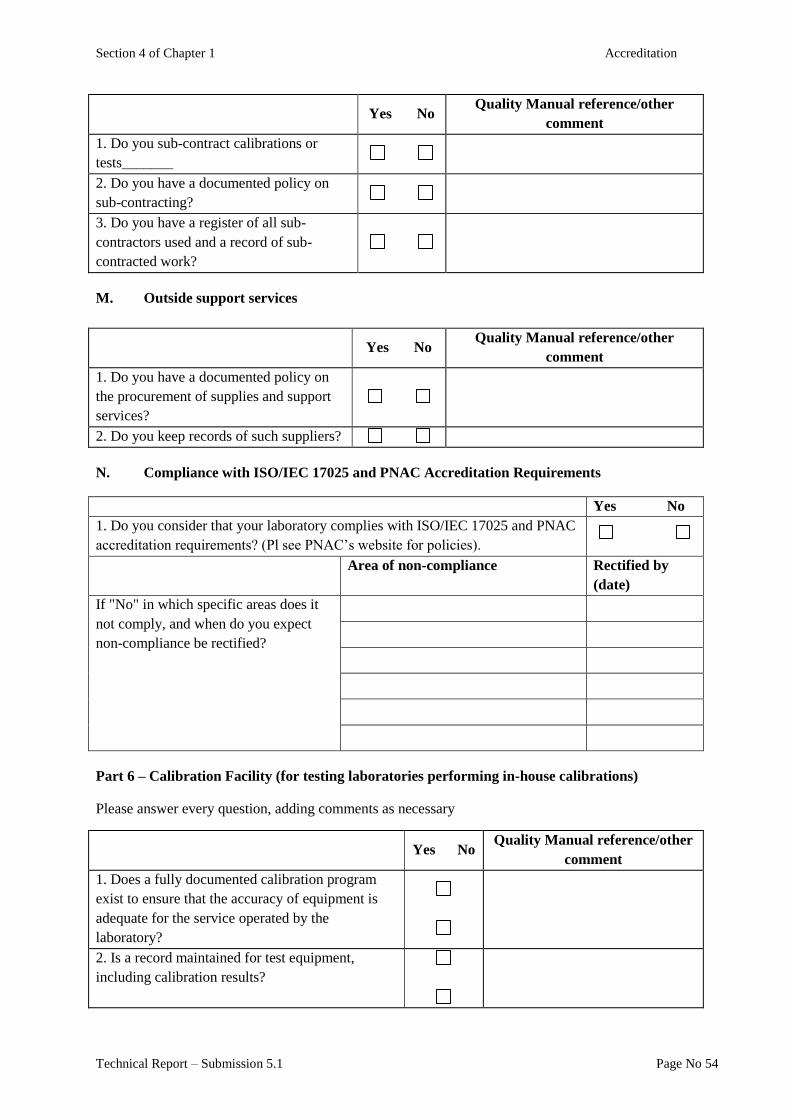
Section 4 of Chapter 1 Accreditation
Technical Report – Submission 5.1 Page No 54
Yes No Quality Manual reference/other
comment
1. Do you sub-contract calibrations or
tests_______
2. Do you have a documented policy on
sub-contracting?
3. Do you have a register of all sub-
contractors used and a record of sub-
contracted work?
M. Outside support services
Yes No
Quality Manual reference/other
comment
1. Do you have a documented policy on
the procurement of supplies and support
services?
2. Do you keep records of such suppliers?
N. Compliance with ISO/IEC 17025 and PNAC Accreditation Requirements
Yes No
1. Do you consider that your laboratory complies with ISO/IEC 17025 and PNAC
accreditation requirements? (Pl see PNAC’s website for policies).
Area of non-compliance Rectified by
(date)
If "No" in which specific areas does it
not comply, and when do you expect
non-compliance be rectified?
Part 6 – Calibration Facility (for testing laboratories performing in-house calibrations)
Please answer every question, adding comments as necessary
Yes No Quality Manual reference/other
comment
1. Does a fully documented calibration program
exist to ensure that the accuracy of equipment is
adequate for the service operated by the
laboratory?
2. Is a record maintained for test equipment,
including calibration results?
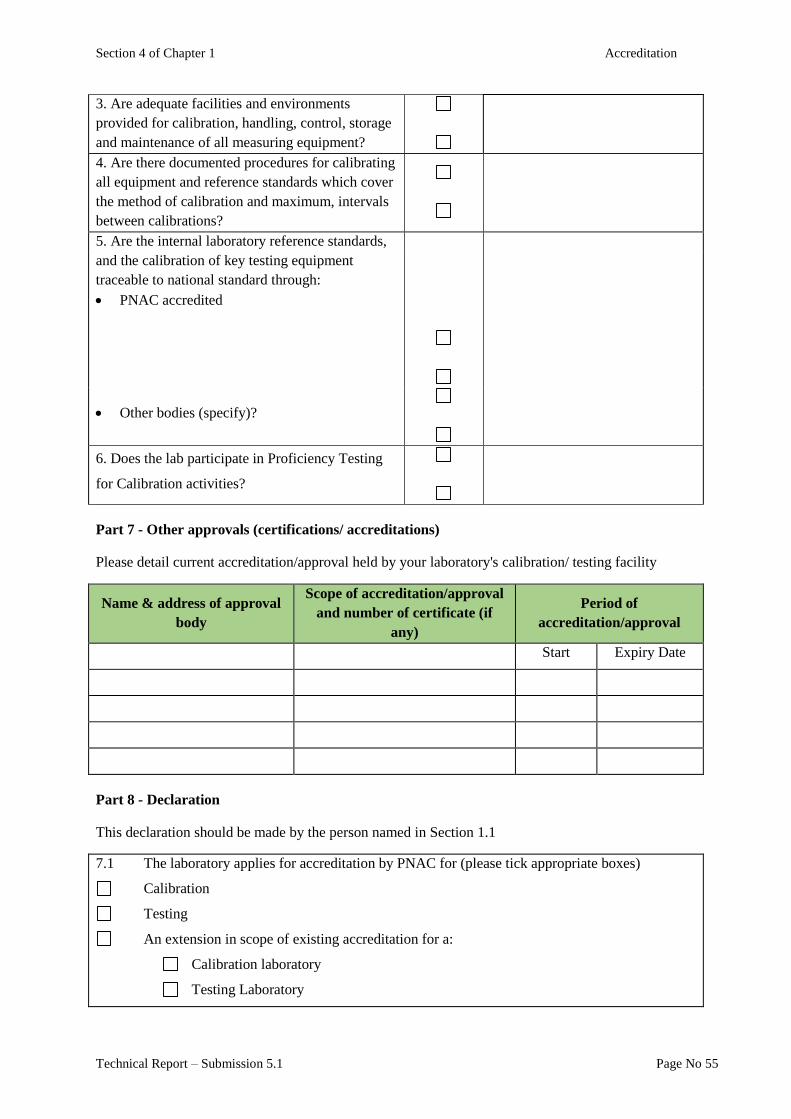
Section 4 of Chapter 1 Accreditation
Technical Report – Submission 5.1 Page No 55
3. Are adequate facilities and environments
provided for calibration, handling, control, storage
and maintenance of all measuring equipment?
4. Are there documented procedures for calibrating
all equipment and reference standards which cover
the method of calibration and maximum, intervals
between calibrations?
5. Are the internal laboratory reference standards,
and the calibration of key testing equipment
traceable to national standard through:
PNAC accredited
Other bodies (specify)?
6. Does the lab participate in Proficiency Testing
for Calibration activities?
Part 7 - Other approvals (certifications/ accreditations)
Please detail current accreditation/approval held by your laboratory's calibration/ testing facility
Name & address of approval
body
Scope of accreditation/approval
and number of certificate (if
any)
Period of
accreditation/approval
Start Expiry Date
Part 8 - Declaration
This declaration should be made by the person named in Section 1.1
7.1 The laboratory applies for accreditation by PNAC for (please tick appropriate boxes)
Calibration
Testing
An extension in scope of existing accreditation for a:
Calibration laboratory
Testing Laboratory
Section 4 of Chapter 1 Accreditation
Technical Report – Submission 5.1 Page No 56
7.2. The organisation/laboratory agrees to conform, upon accreditation, with PNAC requirements
as detailed in the Agreement [F-01/04].
7.3. I enclose a copy of Quality Manual and Quality Procedures (see Note below)
7.4. I enclose a cheque (payable to PNAC) for the Applicant fee of ________. I understand that
this fee is non-refundable. (see Note below).
7.5. I understand the manner in which the accreditation system functions.
7.6. I declare that the information given in this form is correct to the best of my knowledge and
belief
Signed _____________________________ Date ________________
Note: PNAC will not process your application until it has received your Quality Manual and Quality
Procedures and application fee. This fee is not required for extensions of scope.
When completed, return this Form to:
(Please mention type of Laboratory on the right corner of the
envelope such as testing/ calibration/ medical lab)
TO
THE DIRECTOR GENERAL
Pakistan National Accreditation Council
1-Constitution Avenue, Opposite Prime Minister Office, G-5/2,
Islamabad, Pakistan.
Tel: 051-9206044, 9209507, 9205509
Fax: 051-9209510
051-9222312


Section 5
Environmental Sampling
Rate Analysis

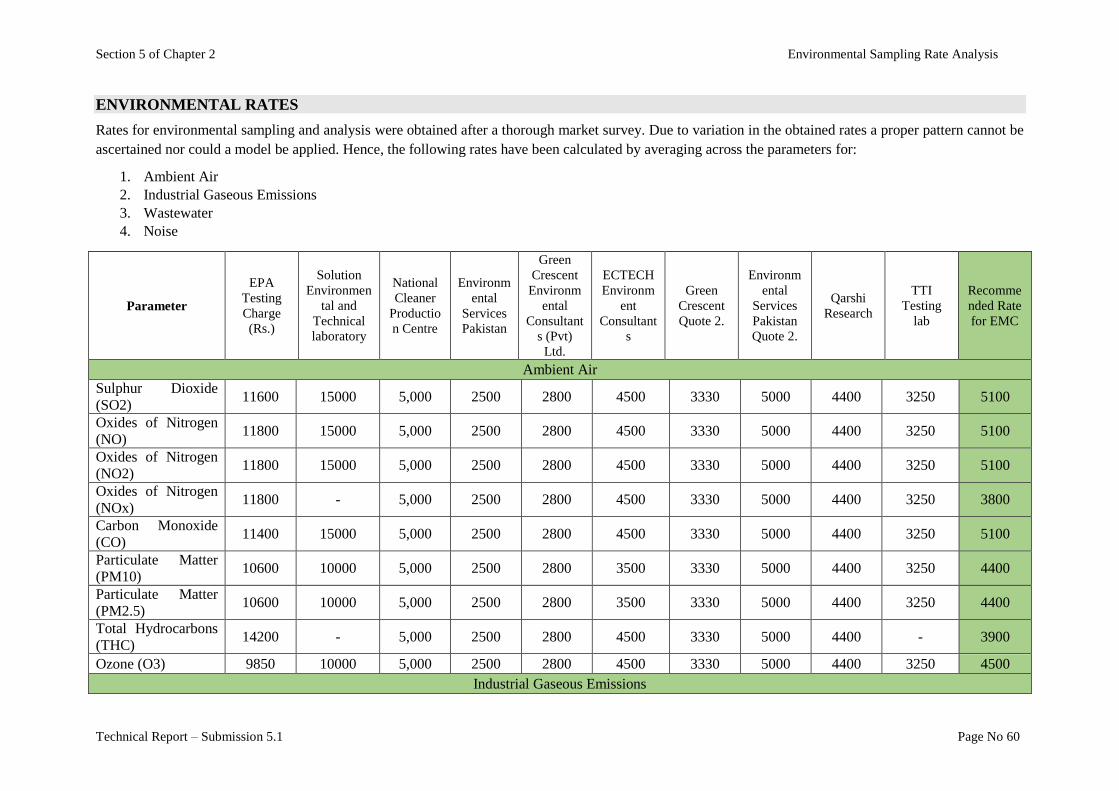
Section 5 of Chapter 2 Environmental Sampling Rate Analysis
Technical Report – Submission 5.1 Page No 60
ENVIRONMENTAL RATES
Rates for environmental sampling and analysis were obtained after a thorough market survey. Due to variation in the obtained rates a proper pattern cannot be
ascertained nor could a model be applied. Hence, the following rates have been calculated by averaging across the parameters for:
1. Ambient Air
2. Industrial Gaseous Emissions
3. Wastewater
4. Noise
Parameter
EPA
Testing
Charge
(Rs.)
Solution
Environmen
tal and
Technical
laboratory
National
Cleaner
Productio
n Centre
Environm
ental
Services
Pakistan
Green
Crescent
Environm
ental
Consultant
s (Pvt)
Ltd.
ECTECH
Environm
ent
Consultant
s
Green
Crescent
Quote 2.
Environm
ental
Services
Pakistan
Quote 2.
Qarshi
Research
TTI
Testing
lab
Recomme
nded Rate
for EMC
Ambient Air
Sulphur Dioxide
(SO2) 11600 15000 5,000 2500 2800 4500 3330 5000 4400 3250 5100
Oxides of Nitrogen
(NO) 11800 15000 5,000 2500 2800 4500 3330 5000 4400 3250 5100
Oxides of Nitrogen
(NO2) 11800 15000 5,000 2500 2800 4500 3330 5000 4400 3250 5100
Oxides of Nitrogen
(NOx) 11800 - 5,000 2500 2800 4500 3330 5000 4400 3250 3800
Carbon Monoxide
(CO) 11400 15000 5,000 2500 2800 4500 3330 5000 4400 3250 5100
Particulate Matter
(PM10) 10600 10000 5,000 2500 2800 3500 3330 5000 4400 3250 4400
Particulate Matter
(PM2.5) 10600 10000 5,000 2500 2800 3500 3330 5000 4400 3250 4400
Total Hydrocarbons
(THC) 14200 - 5,000 2500 2800 4500 3330 5000 4400 - 3900
Ozone (O3) 9850 10000 5,000 2500 2800 4500 3330 5000 4400 3250 4500
Industrial Gaseous Emissions
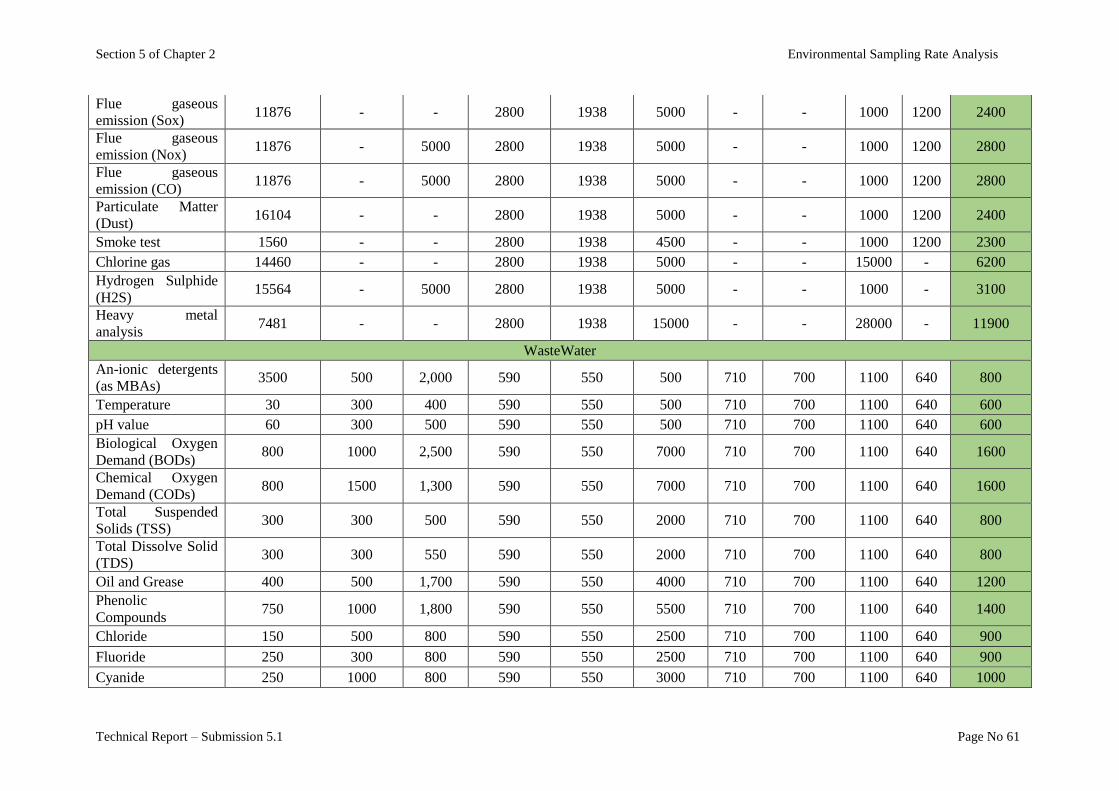
Section 5 of Chapter 2 Environmental Sampling Rate Analysis
Technical Report – Submission 5.1 Page No 61
Flue gaseous
emission (Sox) 11876 - - 2800 1938 5000 - - 1000 1200 2400
Flue gaseous
emission (Nox) 11876 - 5000 2800 1938 5000 - - 1000 1200 2800
Flue gaseous
emission (CO) 11876 - 5000 2800 1938 5000 - - 1000 1200 2800
Particulate Matter
(Dust) 16104 - - 2800 1938 5000 - - 1000 1200 2400
Smoke test 1560 - - 2800 1938 4500 - - 1000 1200 2300
Chlorine gas 14460 - - 2800 1938 5000 - - 15000 - 6200
Hydrogen Sulphide
(H2S) 15564 - 5000 2800 1938 5000 - - 1000 - 3100
Heavy metal
analysis 7481 - - 2800 1938 15000 - - 28000 - 11900
WasteWater
An-ionic detergents
(as MBAs) 3500 500 2,000 590 550 500 710 700 1100 640 800
Temperature 30 300 400 590 550 500 710 700 1100 640 600
pH value 60 300 500 590 550 500 710 700 1100 640 600
Biological Oxygen
Demand (BODs) 800 1000 2,500 590 550 7000 710 700 1100 640 1600
Chemical Oxygen
Demand (CODs) 800 1500 1,300 590 550 7000 710 700 1100 640 1600
Total Suspended
Solids (TSS) 300 300 500 590 550 2000 710 700 1100 640 800
Total Dissolve Solid
(TDS) 300 300 550 590 550 2000 710 700 1100 640 800
Oil and Grease 400 500 1,700 590 550 4000 710 700 1100 640 1200
Phenolic
Compounds 750 1000 1,800 590 550 5500 710 700 1100 640 1400
Chloride 150 500 800 590 550 2500 710 700 1100 640 900
Fluoride 250 300 800 590 550 2500 710 700 1100 640 900
Cyanide 250 1000 800 590 550 3000 710 700 1100 640 1000

Section 5 of Chapter 2 Environmental Sampling Rate Analysis
Technical Report – Submission 5.1 Page No 62
Sulfates 200 1000 600 590 550 3500 710 700 1100 640 1000
Sulphide 150 500 650 590 550 3000 710 700 1100 640 900
Ammonia 200 300 1,200 590 550 2000 710 700 1100 640 900
Copper 500 1000 1,500 590 550 3500 710 700 1100 640 1100
Lead 500 1000 1,500 590 550 3500 710 700 1100 640 1100
Nickel 500 500 1,500 590 550 3500 710 700 1100 640 1100
Silver 500 500 1,500 590 550 3500 710 700 1100 640 1100
Zinc 500 500 1,500 590 550 3500 710 700 1100 640 1100
Barium 500 500 1,500 590 550 3500 710 700 1100 640 1100
Iron 500 800 1,500 590 550 2500 710 700 1100 640 1000
Manganese 500 500 1,500 590 550 3500 710 700 1100 640 1100
Boron 500 500 1,500 590 550 4000 710 700 1100 640 1100
Total Toxic Metals 500 200 1,500 590 550
710 700 1100 640 700
Mercury 700 500 1,500 590 550 3500 710 700 1100 640 1100
Slenium 700 1000 1,500 590 550 4500 710 700 1100 640 1300
Arsenic 700 1000 1,500 590 550 6000 710 700 1100 640 1400
Bacteriological
analysis of drinking
water sample Total
Coliform of Fecal
Coliform
1500
11100 10500 10000
10000
16,000 25255
2500 3000 5200
Chemical analysis
of drinking water
sample (excluding
metals and
pesticides)
5000
20000 16150 1100
0 15700
Noise
Noise Level 1500
400 500 3000
200 300 900


Chapter 2
Standard Operating Procedures

Section 1
Standard Operating Procedures
For Environmental Sampling


Section 1 of Chapter 2 Standard Operating Procedures for Environmental Sampling
Technical Report – Submission 5.1 Page No 68
Section 1
Standard Operating Procedures for
Environmental Sampling Standard Operating Procedures, commonly referred to as SOPs, are a set of instructions compiled by
an organization or firm to provide step-by step guidance to their personnel in carrying out a specific
task or function. SOPs are usually created on a standard format to assist workers for complex routine
operations. The idea behind having a standardized set of instructions is to improve efficiency,
consistency and quality of output.
Sampling is the science of collecting materials to be used as data for analysis and ascertaining
information. Samples should be taken in a way that is unbiased and the sample is representative of the
population it comes from.
Note: Site safety determinations should be made before proceeding with sampling.
EPA personnel are required to take environmental samples of the types mentioned below and thus
require SOPs for the following:
1. Water (drinking water, groundwater, surface water)
2. Wastewater
3. Industrial Gaseous Emissions
4. Motor Vehicle Exhaust and Noise
5. Ambient Air
6. Types of sampling (grab, composite)
Following are descriptions of environmental sampling procedures to allow the sampling personnel to
find a comfortable sequence of sampling.
1. WATER
Drinking Water
Scope This document describes general and specific procedures, methods and
considerations to be used and observed when collecting drinking water samples for
field screening or laboratory analysis.
Principle The procedures contained in this document are to be used by field personnel when
collecting and handling drinking water samples in the field. On the occasion that
field personnel determine that any of the procedures described in this section are
either inappropriate, inadequate or impractical and that another procedure must be
used to obtain a surface water sample, the variant procedure will be documented in
the field logbook, along with a description of the circumstances requiring its use.
Mention of trade names or commercial products in this operating procedure does
not constitute endorsement or recommendation for use.
Procedure 1. Prepare a Sampling and Analysis Plan (SAP) that describes the sampling
locations, numbers and types of samples to be collected, and the quality
control requirements of the project.
2. Check with the laboratory before collecting samples to ensure that sampling
equipment, preservatives, and procedures for sample collection are
Section 1 of Chapter 2 Standard Operating Procedures for Environmental Sampling
Technical Report – Submission 5.1 Page No 69
acceptable. It is best to obtain sampling supplies directly from the laboratory
performing the analyses. Gather all equipment and supplies necessary for the
project.
3. The acids and bases used in preservation of many types of samples described
in this document are dangerous and must be handled with care. Always wear
gloves and eye protection when handling preservatives. When opening a
preservative bottle, particularly a glass ampoule, break open the ampoule
away from yourself and others. Have acid/base neutralization supplies
(baking soda) on hand in the event of a spill. If acid spills on your skin or
clothing, remove the contaminated clothing and rinse the area with water. Do
not apply baking soda (the heat of reaction can cause burns).
4. Collect samples in an area free of excessive dust, rain, snow or other sources
of contamination.
5. Select a cold water faucet for sampling which is free of contaminating
devices such as screens, aeration devices, hoses, purification devices or
swiveled faucets. Check the faucet to be sure it is clean. If the faucet is in a
state of disrepair, select another sampling location.
6. Collect samples from faucets which are high enough to put a bottle
underneath, generally the bath tub or kitchen sink, without contacting the
mouth of the container with the faucet.
7. Open the faucet and thoroughly flush. Generally 2 to 3 minutes will suffice,
however longer times may be needed, especially in the case of lead
distribution lines. Typically the water temperature will stabilize which
indicates flushing is completed. Once the lines are flushed, adjust the flow so
it does not splash against the walls of the bathtub, sink or other surfaces.
8. Follow the collection instructions provided for the analytes of interest
described on the following pages. Wear eye protection and gloves if you are
handling containers with acidic/basic preservatives and when you are
collecting samples.
9. Select a cold water faucet for sampling which is free from devices that are
designed to change the water composition, such as water softeners or point of
use filters. DO NOT remove any screens or aeration devices.
10. Fill out the chain of custody form with the sample collection information.
Record the site location, name of the sampler, date and time of collection,
method of collection, type of analysis to be completed, and preservative in
use.
11. Deliver or ship samples to the laboratory to ensure that holding times are met.
Holding time starts at sample collection and ends at preparation and/or
analysis. Be sure to allow time for the laboratory to process the samples.
12. Return empty preservative containers to the laboratory for proper disposal.
Biological Contaminants
1. Bacteria and Coliphage: Total coliforms; fecal coliforms; E. coli; enterococci;
heterotrophic bacteria; or coliphage
2. Bottle to use: Sterile 125 or 150 mL plastic bottles must be used.
3. Preservatives to use: Sodium thiosulfate (if sample is chlorinated) and cool to
< 10°C for source water and groundwater samples (recommended for
drinking water as well) but do not allow samples to freeze.
Section 1 of Chapter 2 Standard Operating Procedures for Environmental Sampling
Technical Report – Submission 5.1 Page No 70
4. Holding times: Holding times are generally very short – 8 hours for source
water compliance samples, 30 hours for drinking water samples, 48 hours for
coliphage samples. Deliver samples to the lab the day of collection if possible
or ship via overnight delivery.
5. Sampling instructions: Wear gloves when collecting samples. Do not rinse
the bottles. The bottles are sterile so care must be taken not to contaminate
the bottle or cap. Once the distribution line is flushed and the flow reduced,
quickly open the bottle (but do not set the cap down), hold the cap by its
outside edges only, and fill the sample bottle to just above the 100 mL line
leaving a one inch headspace. Cap the bottle immediately and place it into a
cooler with ice for delivery or overnight shipment to the laboratory.
Total coliform and E. coli sampling
1. Remove any attachments on the faucet
2. Allow water to flow for 5 or 6 minutes before sampling
3. Do not rinse or overfill container
4. Always collect cold water; never sample hot water
5. Do not touch the inside of the sample bottle or its cap
Avoid these sampling sites for total coliform, if possible
Outdoor faucets
Faucets connected to cisterns, softeners, pumps, pressure tanks or hot water
heaters
New plumbing and fixtures or those repaired recently
Faucets that hot and cold water come through
Threaded taps
Swing spouts
Faucets positioned close to sink or ground
Leaky faucets
Classical Chemistry Constituents and Nutrients (IOCs)
1. Acidity, alkalinity, biological oxygen demand, bromate, chloride, chlorite,
color, conductivity, fluoride, foaming agents, nitrate, nitrite, odor, o-
phosphate, residues, silica, sulfate, surfactants, total dissolved solids, total
suspended solids, turbidity
2. Bottles to use: Plastic or glass bottles may be used but plastic is preferred.
3. Preservative to use: Cool to ≤ 4 °C (≤ 39.2 °F)
4. Holding times: Most of these analytes have short holding times. Deliver
samples to the lab the same day if possible or ship via overnight delivery.
Check with the lab regarding the holding times for the specific analytes of
interest.
5. Sampling Instructions: Check with the laboratory on the sample volume
required for analysis. Wear gloves and eye protection when collecting
samples. Rinse the bottle and cap three times with sample water and fill the
bottle to within one to two inches from the top. Place the sample into a cooler
with ice for immediate delivery or shipment to the laboratory.
Cyanide
1. Bottles to use: Plastic or glass bottles may be used but plastic is preferred.
2. Preservatives to use:
0.6 g ascorbic acid if sample is chlorinated
sodium hydroxide (NaOH) to pH > 12
cool to ≤ 4 °C (≤ 39.2 °F)
3. Holding time:14 days
4. Sampling instructions: Check with the laboratory on the sample volume
Section 1 of Chapter 2 Standard Operating Procedures for Environmental Sampling
Technical Report – Submission 5.1 Page No 71
required for analysis. Wear gloves and eye protection when handling acids
and other preservatives and while collecting samples. If the bottle contains a
preservative, do not rinse the bottle. If the preservatives are not included in
the bottle, rinse the bottle and cap three times with sample water, fill the
bottle, and then carefully add the preservatives following the instructions
provided by the laboratory. The bottle should be filled to within one to two
inches from the top. Place the sample into a cooler with ice for delivery or
shipment to the laboratory.
Metals (IOCs)
1. Antimony, arsenic, barium, beryllium, cadmium, calcium, chromium (total),
magnesium, manganese, mercury, nickel, selenium, sodium, silver, thallium,
lead, copper, zinc and other trace metals
2. Bottles to use: Plastic or glass bottles may be used but plastic is preferred.
3. Note: 1000 mL wide-mouth bottles are recommended for collection of lead
and copper rule compliance samples.
4. Preservative to use: Nitric acid (HNO3) to pH < 2
5. Holding times: 28 days for mercury, 6 months for other metals
6. Sampling instructions: Check with the laboratory on the sample volume
required for analysis. Wear gloves and eye protection when handling acid and
while collecting samples. If the bottle contains a preservative, do not rinse the
bottle. If the preservatives are not included in the bottle, rinse the bottle and
cap three times with sample water, fill the bottle, and then carefully add the
preservatives following the instructions provided by the laboratory. The
bottle should be filled to within one to two inches from the top. Deliver or
ship the samples to the laboratory.
Lead and Copper Rule Compliance Samples:
Do not remove aerators or rinse bottles. Use the bathroom tap if the kitchen tap has
a water softener or point of use filter on it.
Note: If samples are not acid preserved, they must be received by the laboratory
within 14 days of sampling.
1. Radionuclides: Gross alpha, gross beta.
2. Bottles to use: Plastic or glass bottles may be used but plastic is preferred.
3. Preservatives to Use: Hydrochloric acid (HCl) or nitric acid (HNO3)
preservation for all analytes.
4. Holding times: 8 days for Iodine-131, 6 months for all other radionuclides
5. Sampling instructions: Check with the laboratory on the sample volume
required for analysis. Wear gloves and eye protection when handling acids
and other preservatives and while collecting samples. If the bottle contains a
preservative, do not rinse the bottle. If the preservatives are not included in
the bottle, rinse the bottle and cap three times with sample water, fill the
bottle, and then carefully add the preservatives following the instructions
provided by the laboratory. The bottle should be filled to within one to two
inches from the top. Deliver or ship samples to the laboratory.
6. Synthetic Organic Compounds (SOCs)
Interferences 1. Proper safety precautions must be observed when collecting surface water
samples. Refer to the Safety, Health and Environmental Management
Program (SHEMP) Procedures and Policy Manual and any pertinent site-
specific Health and Safety Plans (HASP) for guidelines on safety precautions.
These guidelines should be used to complement the judgment of an
experienced professional. Address chemicals that pose specific toxicity or
safety concerns and follow any other relevant requirements, as appropriate.
2. Special care must be taken not to contaminate samples. This includes storing
Section 1 of Chapter 2 Standard Operating Procedures for Environmental Sampling
Technical Report – Submission 5.1 Page No 72
samples in a secure location to preclude conditions which could alter the
properties of the sample. Samples shall be custody sealed during long-term
storage or shipment.
3. Collected samples are in the custody of the sampler or sample custodian until
the samples are relinquished to another party.
4. If samples are transported by the sampler, they will remain under his/her
custody or be secured until they are relinquished.
5. Documentation of field sampling is done in a bound logbook.
6. Chain-of-custody documents shall be filled out and remain with the samples
until custody is relinquished.
7. All shipping documents, such as air bills, bills of lading, etc., shall be
retained by the sampling leader and stored in a secure place.
Quality
Control
Samples should be collected from an area free of excessive dust, rain, snow or other
sources of contamination.
A cold water faucet should be considered for sampling which is free of
contaminating devices such as screens, aeration devices, hoses, purification devices
or swiveled faucets. Make sure the faucet is clean. If the faucet is in a state of
disrepair, select another sampling location. Height of faucet should be considered
into account before collecting the sample. Flush the faucet for 2 to 3 minutes
prior to sample collection. However, longer times may be needed, especially in
the case of any distribution line contamination. Avoid splashing against the
walls of the bathtub, sink or other surfaces.
Surface Water and Ground Water
Scope The procedures contained in this document are to be used by field personnel when
collecting and handling surface water samples in the field. On the occasion that
field personnel determine that any of the procedures described in this section are
either inappropriate, inadequate or impractical and that another procedure must be
used to obtain a surface water sample, the variant procedure will be documented in
the field logbook, along with a description of the circumstances requiring its use.
Mention of trade names or commercial products in this operating procedure does
not constitute endorsement or recommendation for use.
Apparatus The physical location of the investigator when collecting a sample may dictate the
equipment to be used. If surface water samples are required, direct dipping of the
sample container into the stream is desirable. Collecting samples in this manner is
possible when sampling from accessible locations such as stream banks or by
wading or from low platforms, such as small boats or piers. Wading or streamside
sampling from banks, however, may cause the re-suspension of bottom deposits
and bias the sample. Wading is acceptable if the stream has a noticeable current (is
not impounded), and the samples are collected while facing upstream. If the stream
is too deep to wade, or if the sample must be collected from more than one water
depth, or if the sample must be collected from an elevated platform (bridge, pier,
etc.), supplemental sampling equipment must be used.
To collect a surface water sample from a water body or other surface water
conveyance, a variety of methods can be used:
Dipping Using Sample Container
Section 1 of Chapter 2 Standard Operating Procedures for Environmental Sampling
Technical Report – Submission 5.1 Page No 73
Scoops
Peristaltic Pumps
Discrete Depth Samplers
Bailers
Buckets
Submersible Pumps
Automatic Samplers
Regardless of the method used, precautions should be taken to ensure that
the sample collected is representative of the water body or conveyance.
Dipping Using Sample Container
A sample may be collected directly into the sample container when the surface
water source is accessible by wading or other means. The sampler should face
upstream if there is a current and collect the sample without disturbing the bottom
sediment. The surface water sample should always be collected prior to the
collection of a sediment sample at the same location. The sampler should be careful
not to displace the preservative from a pre-preserved sample container, such as the
40-ml VOC vial.
Scoops
Stainless steel scoops provide a means of collecting surface water samples from
surface water bodies that are too deep to access by wading. They have a limited
reach of about eight feet and, if samples from distances too far to access using this
method are needed, a mobile platform, such as a boat, may be required. Stainless
steel scoops are useful for reaching out into a body of water to collect a surface
water sample. The scoop may be used directly to collect and transfer a surface
water sample to the sample container, or it may be attached to an extension in order
to access the selected sampling location.
Peristaltic Pumps
Another device that can be effectively used to sample a water column, such as a
shallow pond or stream, is the peristaltic pump/vacuum jug system. The peristaltic
pump can be used to collect a water sample from any depth if the pump is located
at or near the surface water elevation. There is no suction limit for these
applications. The use of a metal conduit to which the tubing is attached, allows for
the collection of a vertical sample (to about a 25-foot depth) which is representative
of the water column. The tubing intake is positioned in the water column at the
desired depth by means of the conduit. Using this method, discrete samples may be
collected by positioning the tubing intake at one depth or a vertical composite may
be collected by moving the tubing intake at a constant rate vertically up and down
the water column over the interval to be composited.
Samples for VOC analysis cannot be collected directly from the peristaltic pump
discharge or from the vacuum jug. If a peristaltic pump is used for sample
collection and VOC analysis is required, the VOC sample must be collected using
one of the “soda straw” variations. Ideally, the tubing intake will be placed at the
depth from which the sample is to be collected and the pump will be run for several
minutes to fill the tubing with water representative of that interval. After several
Section 1 of Chapter 2 Standard Operating Procedures for Environmental Sampling
Technical Report – Submission 5.1 Page No 74
minutes, the pump is turned off and the tubing string is retrieved. The pump speed
is then reduced to a slow pumping rate and the pump direction is reversed. After
turning the pump back on, the sample stream is collected into the VOC vials as it is
pushed from the tubing by the pump. Care must be taken to prevent any water that
was in contact with the silastic pump head tubing from being incorporated into the
sample.
Discrete Depth Samplers
When discrete samples are desired from a specific depth, and the parameters to be
measured do not require a Teflon®-coated sampler, a standard Kemmerer or Van
Dorn sampler may be used. The Kemmerer sampler is a brass cylinder with rubber
stoppers that leave the ends of the sampler open while being lowered in a vertical
position, thus allowing free passage of water through the cylinder. The Van Dorn
sampler is plastic and is lowered in a horizontal position. In each case, a messenger
is sent down a rope when the sampler is at the designated depth, to cause the
stoppers to close the cylinder, which is then raised. Water is removed through a
valve to fill respective sample containers. With a rubber tube attached to the valve,
dissolved oxygen sample bottles can be properly filled by allowing an overflow of
the water being collected. With multiple depth samples, care should be taken not to
disturb the bottom sediment, thus biasing the sample.
When metals and organic compounds parameters are of concern, then a double-
check valve, stainless steel bailer or Kemmerer sampler should be used to collect
the sample.
Bailers
Teflon® bailers may also be used for surface water sampling if the study objectives
do not necessitate a sample from a discrete interval in the water column. A closed-
top bailer with a bottom check-valve is sufficient for many studies. As the bailer is
lowered through the water column, water is continually displaced through the bailer
until the desired depth is reached, at which point the bailer is retrieved. This
technique may not be successful where strong currents are found.
Buckets
A plastic bucket can be used to collect samples for measurement of water quality
parameters such as pH, temperature, and conductivity. Samples collected for
analysis of classical water quality parameters including but not limited to ammonia,
nitrate-nitrite, phosphorus, and total organic carbon may also be collected with a
bucket. Typically, a bucket is used to collect a sample when the water depth is too
great for wading, it is not possible to deploy a boat, or access is not possible
(excessive vegetation or steep embankments) and the water column is well mixed.
The water body is usually accessed from a bridge. The bucket is normally lowered
by rope over the side of the bridge. Upon retrieval, the water is poured into the
appropriate sample containers
Caution should be exercised whenever working from a bridge. Appropriate
measures should be taken to insure the safety of sampling personnel from traffic
hazards.
Section 1 of Chapter 2 Standard Operating Procedures for Environmental Sampling
Technical Report – Submission 5.1 Page No 75
Submersible Pumps
Submersible pumps can be used to collect surface water samples directly into a
sample container. The constituents of interest should be taken into consideration
when choosing the type of submersible pump and tubing to be used. If trace
contaminant sampling of extractable organic compounds and/or inorganic analytes
will be conducted, the submersible pump and all of its components should be
constructed of inert materials such as stainless steel and Teflon®. The tubing
should also be constructed of Teflon®. If re-using the same pump between sample
locations, the pump should be decontaminated before next sample collection. New
tubing should be used at each sample location.
If the samples will be analyzed for classical parameters such as ammonia, nitrate-
nitrite, phosphorus, or total organic carbon, the pump and tubing may be
constructed of components other than stainless steel and Teflon®. The same pump
and tubing may be re-used at each sampling station after rinsing with deionized
water and then purging several volumes of sample water through the pump and
tubing prior to filling the sample containers.
Either a grab or composite sample can be collected using a submersible pump. A
composite sample can be collected by raising and lowering the pump throughout
the water column. If a composite sample is collected, it may be necessary to pump
the sample into a compositing vessel for mixing prior to dispensing into the sample
containers. If a compositing vessel is required, it should be constructed of materials
compatible with the constituents of concern and decontaminated between sample
stations according to appropriate procedures, again depending on the constituents
of concern.
Automatic Samplers
Where unattended sampling is required (e.g., storm-event sampling, time-of-travel
studies) an automatic sampler may be used. The automatic sampling device may be
used to collect grab samples based on time, in-stream flow or water level or used to
collect composite samples as dictated by the study data needs. The automatic
sampling device should be calibrated prior to deployment to insure the proper
volume is collected. The manufacturer’s instruction manual should be consulted for
automatic sampler operation.
Special Sampling Considerations
Volatile Organic Compounds (VOC) Analysis
Surface water samples for VOC analysis must be collected in 40 ml glass vials with
Teflon® septa. The vial may be either preserved with concentrated hydrochloric
acid or they may be unpreserved. Preserved samples have a two-week holding time,
whereas, unpreserved samples have only a seven-day holding time. In the great
majority of cases, the preserved vials are used to take advantage of the extended
holding time. In some situations, however, it may be necessary to use the
unpreserved vials. For example, if the surface water sample contains a high
concentration of dissolved calcium carbonate, there may be an effervescent reaction
between the hydrochloric acid and the water, producing large numbers of fine
bubbles. This will render the sample unacceptable. In this case, unpreserved vials
should be used and arrangements must be confirmed with the laboratory to ensure
Section 1 of Chapter 2 Standard Operating Procedures for Environmental Sampling
Technical Report – Submission 5.1 Page No 76
that they can accept the unpreserved vials and meet the shorter sample holding
times.
The samples should be collected with as little agitation or disturbance as possible.
The vial should be filled so that there is a reverse or convex meniscus at the top of
the vial and absolutely no bubbles or headspace should be present in the vial after it
is capped. After the cap is securely tightened, the vial should be inverted and
tapped on the palm of one hand to see if any undetected bubbles are dislodged. If a
bubble or bubbles are present, the vial should be topped off using a minimal
amount of sample to re-establish the meniscus. Care should be taken not to flush
any preservative out of the vial during topping off. If, after topping off and capping
the vial, bubbles are still present, a new vial should be obtained and the sample re-
collected.
Samples for VOC analysis must be collected using either stainless steel or Teflon®
equipment.
Special Precautions for Surface Water Sampling
A clean pair of new, non-powdered, disposable gloves will be worn each time a
different location is sampled and the gloves should be donned immediately prior to
sampling. The gloves should not come in contact with the media being sampled and
should be changed any time during sample collection when their cleanliness is
compromised.
Sample containers for samples suspected of containing high concentrations of
contaminants shall be stored separately. All background or control samples shall be
collected and placed in separate ice chests or shipping containers. Sample
collection activities shall proceed progressively from the least suspected
contaminated area to the most suspected contaminated area. Samples of waste or
highly contaminated media must not be placed in the same ice chest as
environmental (i.e., containing low contaminant levels) or background samples.
If possible, one member of the field sampling team should take all the notes and
photographs, fill out tags, etc., while the other members collect the samples.
Samplers must use new, verified and certified-clean disposable or non-disposable
equipment.
Sample Handling and Preservation Requirements
Surface water samples will typically be collected either by directly filling the
container from the surface water body being sampled or by decanting the water
from a collection device such as a stainless steel scoop or other device.
During sample collection, if transferring the sample from a collection device, make
sure that the device does not come in contact with the sample containers.
Place the sample into appropriate, labeled containers. Samples collected for VOC
analysis must not have any headspace. All other sample containers must be filled
with an allowance for ullage.
All samples requiring preservation must be preserved as soon as practically
possible, ideally immediately at the time of sample collection. If preserved VOC
vials are used, these will be preserved with concentrated hydrochloric acid by lab
Section 1 of Chapter 2 Standard Operating Procedures for Environmental Sampling
Technical Report – Submission 5.1 Page No 77
personnel prior to departure for the field investigation. For all other chemical
preservatives, use the appropriate chemical preservative generally stored in an
individual single-use vial. The adequacy of sample preservation will be checked
after the addition of the preservative for all samples, except for the samples
collected for VOC analysis. If it is determined that a sample is not adequately
preserved, additional preservative should be added to achieve adequate
preservation.
All samples preserved using a pH adjustment (except VOCs) must be checked,
using pH strips, to ensure that they were adequately preserved. This is done by
pouring a small volume of sample over the strip. Do not place the strip in the
sample. Samples requiring reduced temperature storage should be placed on ice
immediately.
Interferences Special care must be taken not to contaminate samples. This includes storing
samples in a secure location to preclude conditions which could alter the
properties of the sample. Samples shall be custody sealed during long-term
storage or shipment.
Collected samples are in the custody of the sampler or sample custodian until
the samples are relinquished to another party.
If samples are transported by the sampler, they will remain under his/her
custody or be secured until they are relinquished.
Documentation of field sampling is done in a bound logbook.
Chain-of-custody documents shall be filled out and remain with the samples
until custody is relinquished.
All shipping documents, such as air bills, bills of lading, etc., shall be retained
by the sampling leader and stored in a secure place.
Quality
Control
If possible, a control sample should be collected from a location not affected by the
possible contaminants of concern and submitted with the other samples. In streams
or other bodies of moving water, the control sample should be collected upstream
of the sampled area. For impounded bodies of water, particularly small lakes or
ponds, it may be difficult or inappropriate to obtain an unbiased control from the
same body of water from which the samples are collected. In these cases, it may be
appropriate to collect a background sample from a similar impoundment located
near the sampled body of water if there is a reasonable certainty that the
background location has not been impacted. Equipment blanks should be collected
if equipment is field cleaned and re-used on-site or if necessary to document that
low-level contaminants were not introduced by pumps, bailers or other sampling
equipment.
2.WASTEWATER
Scope This document describes both general and specific methods to be used by field
personnel when collecting and handling wastewater samples in the field. On the
occasion that field personnel determine that any of the procedures described in this
section are inappropriate, inadequate or impractical and that another procedure
must be used to obtain a wastewater sample, the variant procedure will be
documented in the field log book, along with a description of the circumstances
requiring its use. Mention of trade names or commercial products does not
Section 1 of Chapter 2 Standard Operating Procedures for Environmental Sampling
Technical Report – Submission 5.1 Page No 78
constitute endorsement or recommendation for use.
Principle The wastewater sampling techniques and equipment described in the following
section of this document are designed to minimize effects on the chemical and
physical integrity of the sample. If the procedures in these sections are
followed, a representative sample of the wastewater should be obtained.
The variety of conditions at different sampling locations requires that considerable
judgment be exercised regarding the methodologies and procedures for the
collection of representative samples of wastewater.
The sample should be collected where the wastewater is well mixed.
Therefore, the sample should be collected near the center of the flow channel,
at approximately 40 to 60 percent of the water depth, where the turbulence is
at a maximum and the possibility of solids settling is minimized. Skimming
the water surface or dragging the channel bottom should be avoided.
However, allowances should be made for fluctuations in water depth due to
flow variations.
In sampling from wide conduits, cross-sectional sampling should be
considered. Rhodamine WT dye may be used as an aid in determining the
most representative sampling locations.
If manual compositing is employed, the individual sample portions must be
thoroughly mixed before pouring the individual aliquots into the composite
container. For manual composite sampling, the individual sample aliquots
should be preserved at the time of sample collection.
Apparatus/
Procedure Automatic Sampling
Automatic samplers may be used to collect composite or grab samples when
several aliquots are to be collected at frequent intervals or when a continuous
sample is required. For composite sampling applications, the automatic samplers
may be used to collect time composite or flow proportional samples. In the flow
proportional mode, the samplers are activated and paced by a compatible flow
meter. Flow proportional samples can also be collected using an automatic sampler
equipped with multiple containers and manually compositing the individual sample
portions proportional to the flow.
Automatic samplers must meet the following requirements:
Sampling equipment must be properly cleaned to avoid cross-
contamination which could result from prior use.
No plastic or metal parts of the sampler shall come in contact with the
water or wastewater stream when parameters to be analyzed could be
impacted by these materials.
The automatic sampler must be capable of providing adequate refrigeration
during the sampling period. This can be accomplished in the field by using
ice.
The automatic sampler must be able to collect a large enough sample for all
parameter analyses.
The individual sample aliquot must be at least 100 mL if the sampler uses a
peristaltic pump.
Section 1 of Chapter 2 Standard Operating Procedures for Environmental Sampling
Technical Report – Submission 5.1 Page No 79
The automatic sampler should be capable of providing a lift of at least 20
feet and the sample volume should be adjustable since the volume is a
function of the pumping head.
The pumping velocity must be at least two (2) ft. /sec to transport solids
and not allow solids to settle.
The intake line leading to the pump must be purged before each sample is
collected.
The minimum inside diameter of the intake line should be 1/4 inch.
An adequate power source should be available to operate the sampler for
the time required to complete the sampling. Facility electrical outlets may
be used if available.
Facility automatic samplers should only be used if
a. field conditions do not allow for the installation of EPA sampling
equipment, and
b. the facility sampling equipment meets all of the requirements
detailed above.
Conventional Sampling (Inorganic Parameters)
Conventional sampling includes all inorganic parameters (e.g., BOD5,
TSS, COD, nutrients) that can be collected using an automatic sampler.
New tubing (Silastic ®, or equal, in the pump and either Teflon ® or Tygon
®, or equal, in the sample train) will be used for each sampler installation.
Installation procedures for installing tubing on a sampler include cutting
the proper length of tubing, positioning it in the wastewater stream, and
sampler programming. Protective gloves should be worn to reduce
exposure and to maintain the integrity of the sample.
For a time composite sample, the sampler should be programmed to collect
sufficiently sized aliquots (at least 100-milliliter if using a peristaltic pump) at a
frequency that provides a representative sample and enough sample volume to
conduct all required analyses.
For a flow proportional sample, the sampler should be programmed to collect a
minimum of 100 -milliliters for each sample aliquot with the interval predetermined
based on the flow of the monitored stream.
At the end of the compositing period, the sample collected should be properly
mixed and transferred into the respective containers, followed by immediate
preservation, if required. For routine inspections, the permittee should be offered a
split sample.
Metals
When an automatic sampler is used for collecting samples for metals analyses, the
entire sample collection system is rinsed with organic-free water and an equipment
rinse blank is collected. The equipment rinse blank is taken to ensure that metals
contamination is not occurring from the sampling equipment, and to check the
effectiveness of the decontamination procedures. To collect an equipment rinse
blank approximately one-half gallon of rinse water should be pumped through the
sample tubing into the composite container and discarded. After the purge, another
one-half gallon of rinse water is pumped through the sample tubing, into the
composite container, and collected as an equipment rinse blank. Once the
Section 1 of Chapter 2 Standard Operating Procedures for Environmental Sampling
Technical Report – Submission 5.1 Page No 80
equipment rinse blank sample is collected, it must be properly preserved with Nitric
acid. The automatic sampler may then be positioned in the appropriate location and
the sampler program initiated.
If the automatic sampler tubing is attached to a metal conduit pipe, the intake
tubing should be carefully installed upstream and away from the conduit to prevent
metals contamination. This can be accomplished by clamping the tubing upstream
of the conduit using laboratory clamps and wrapping the submerged portion of
conduit pipe with a protective barrier (e.g., duct tape).
Extractable Organic Compounds, Pesticides and PCBs
When an automatic sampler is used for collecting samples for the analyses of
extractable organic compounds, pesticides and/or PCBs, the installation procedures
include cutting the proper length of new Teflon7 tubing, rinsing of the entire
sampler collection system with organic-free water and collection of appropriate
equipment blanks for organic compounds analysis. For the organic-free water rinse,
approximately one-half gallons is initially pumped into the composite sample
container and discarded. An additional one and one-half gallons (approximate) are
then pumped into the composite sample container for distribution into the
appropriate blank container. Finally, the collection tubing should be positioned in
the wastewater stream and the sampler programmed and initiated.
Automatic Sampler Security
Field investigators should take whatever steps are necessary to prevent tampering
with EPA equipment. A lock or custody seal may be placed on the sampler to
detect tampering. However, this does not prevent tampering with the sample
collection tubing. If necessary, seals may be placed on the sampling pole and tubing
line to further reduce tampering possibilities.
Automatic Sampler Maintenance, Calibration and Quality Control
To ensure proper operation of automatic samplers, and thus the collection of re-
presentative samples, the following maintenance and calibration procedures should
be used and any deviations should be documented in the field logbook.
Prior to being used, the sampler operation should be checked by the field
investigator or Field Equipment Center personnel to ensure proper operation. This
includes operation (forward, reverse, and automatic) of at least one purge-pump-
purge cycle; checking desiccant and replacing if necessary; checking the 12-volt
batteries to be used with the sampler; and repairing any item if necessary.
During each field trip, prior to initiating the automatic sampler, the rinse and purge-
pump-purge cycle shall be checked at least once. The pumping volume should be
checked at least twice using a graduated cylinder or other calibrated container prior
to initiating the sampler. For flow proportional sampling, the flow meter that
activates the sampler should be checked to ensure that it operates properly.
Upon returning from a field trip, the structural integrity of the sampler should be
examined and repaired, if necessary. The desiccant will be checked and replaced if
appropriate. The operation (forward, reverse, automatic, etc.) will be checked and
required repairs will be made and documented. The sampler will then be cleaned
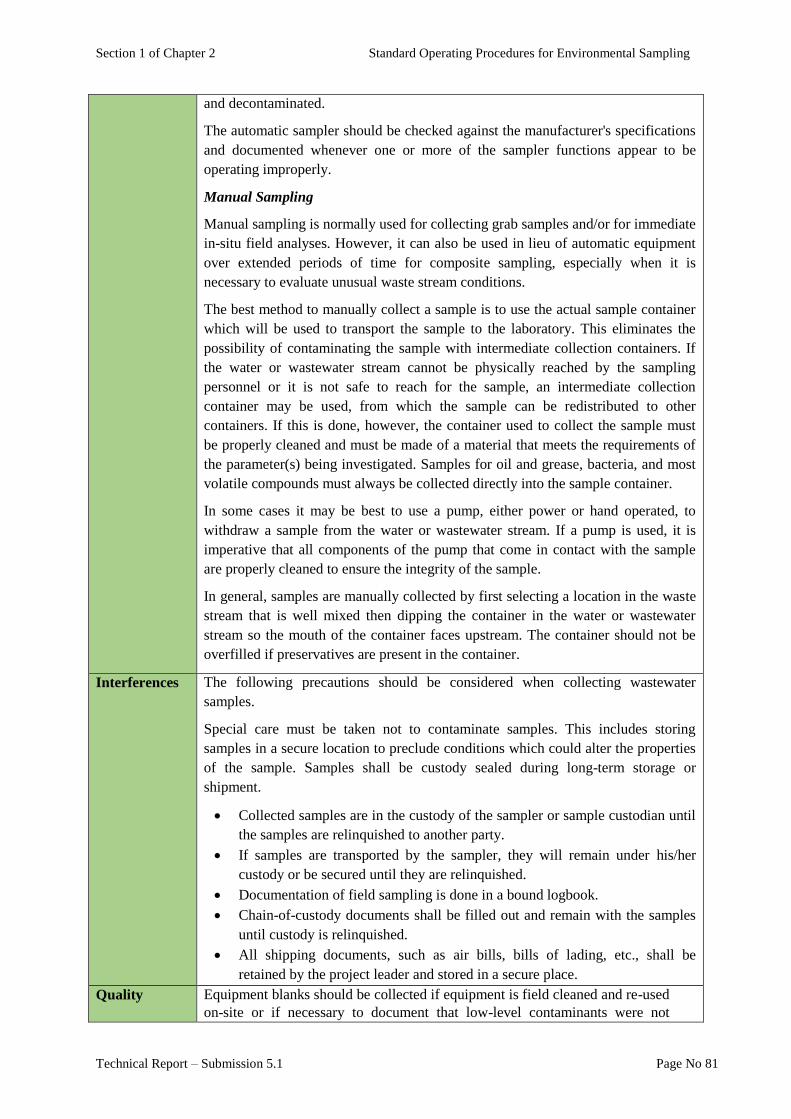
Section 1 of Chapter 2 Standard Operating Procedures for Environmental Sampling
Technical Report – Submission 5.1 Page No 81
and decontaminated.
The automatic sampler should be checked against the manufacturer's specifications
and documented whenever one or more of the sampler functions appear to be
operating improperly.
Manual Sampling
Manual sampling is normally used for collecting grab samples and/or for immediate
in-situ field analyses. However, it can also be used in lieu of automatic equipment
over extended periods of time for composite sampling, especially when it is
necessary to evaluate unusual waste stream conditions.
The best method to manually collect a sample is to use the actual sample container
which will be used to transport the sample to the laboratory. This eliminates the
possibility of contaminating the sample with intermediate collection containers. If
the water or wastewater stream cannot be physically reached by the sampling
personnel or it is not safe to reach for the sample, an intermediate collection
container may be used, from which the sample can be redistributed to other
containers. If this is done, however, the container used to collect the sample must
be properly cleaned and must be made of a material that meets the requirements of
the parameter(s) being investigated. Samples for oil and grease, bacteria, and most
volatile compounds must always be collected directly into the sample container.
In some cases it may be best to use a pump, either power or hand operated, to
withdraw a sample from the water or wastewater stream. If a pump is used, it is
imperative that all components of the pump that come in contact with the sample
are properly cleaned to ensure the integrity of the sample.
In general, samples are manually collected by first selecting a location in the waste
stream that is well mixed then dipping the container in the water or wastewater
stream so the mouth of the container faces upstream. The container should not be
overfilled if preservatives are present in the container.
Interferences The following precautions should be considered when collecting wastewater
samples.
Special care must be taken not to contaminate samples. This includes storing
samples in a secure location to preclude conditions which could alter the properties
of the sample. Samples shall be custody sealed during long-term storage or
shipment.
Collected samples are in the custody of the sampler or sample custodian until
the samples are relinquished to another party.
If samples are transported by the sampler, they will remain under his/her
custody or be secured until they are relinquished.
Documentation of field sampling is done in a bound logbook.
Chain-of-custody documents shall be filled out and remain with the samples
until custody is relinquished.
All shipping documents, such as air bills, bills of lading, etc., shall be
retained by the project leader and stored in a secure place.
Quality Equipment blanks should be collected if equipment is field cleaned and re-used
on-site or if necessary to document that low-level contaminants were not

Section 1 of Chapter 2 Standard Operating Procedures for Environmental Sampling
Technical Report – Submission 5.1 Page No 82
Control introduced by the sampling equipment.
3. INDUSTRIAL GASEOUS EMISSIONS
This procedure is for measuring Sulfur Dioxide (SO2), nitrogen oxides (NOx), Carbon Monoxide
(CO), Carbon Dioxide (CO2) and Oxygen (O2) in stationary source emissions using a continuous
instrumental analyzer
Sr. No. Parameter
1. Sulphur oxides
2. Sulfur Dioxide (SO2)
3. Oxides of Nitrogen; (NO) and (NO2)
4. Carbon Monoxide (CO)
5. Oxygen (O2)
6. Carbon Dioxide (CO2)
Scope The monitoring of stack emissions can involve taking samples for onsite analysis
and laboratory analysis. Its primary use is for regulatory purposes, including
measurements for determining compliance with authorized numerical limits and
acceptance trials on new pollution abatement plant.
Principle Quality assurance and quality control requirements are included to assure that the
tester collects data of known quality and documents adherence to these specific
requirements for equipment, supplies, sample collection and analysis,
calculations, and data analysis. In this method, a sample of the effluent gas is
continuously sampled and conveyed to the analyzer that measures the
concentration of respective analyte.
Apparatus Sample Probe: Glass, stainless steel, or other approved material, of sufficient
length to traverse the sample points.
Sample Line: The sample line from the probe to the conditioning
system/sample pump should be made of Teflon or other material that does not
absorb or otherwise alter the sample gas. For a dry-basis measurement system,
the temperature of the sample line must be maintained at a sufficiently high
level to prevent condensation before the sample conditioning components. For
wet-basis measurement systems, the temperature of the sample line must be
maintained at a sufficiently high level to prevent condensation before the
analyzer.
Conditioning Equipment: For dry basis measurements, a condenser, dryer or
other suitable device is required to remove moisture continuously from the
sample gas. Any equipment needed to heat the probe or sample line to avoid
condensation prior to the sample conditioning component is also required.
For wet basis systems, you must keep the sample above its dew point either by:
Heating the sample line and all sample transport components up to the inlet of
the analyzer (and, for hot-wet extractive systems, also heating the analyzer), or
by diluting the sample prior to analysis using a dilution probe system. The
components required to do either of the above are considered to be conditioning
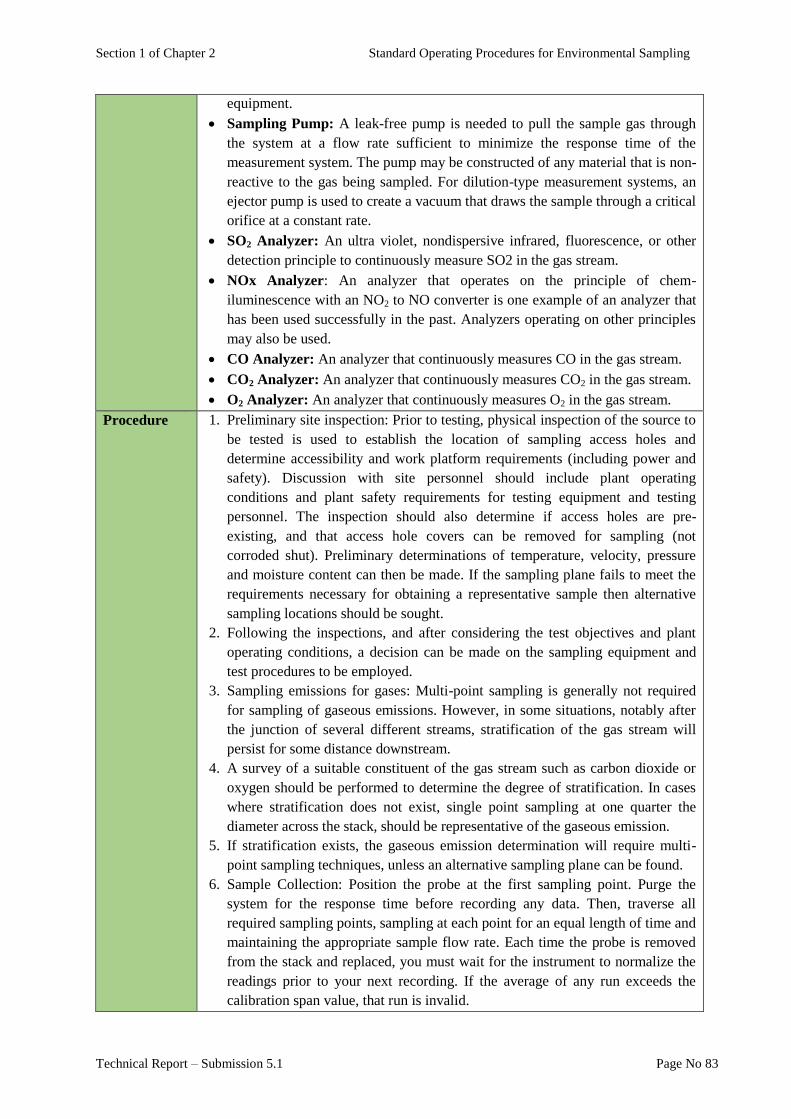
Section 1 of Chapter 2 Standard Operating Procedures for Environmental Sampling
Technical Report – Submission 5.1 Page No 83
equipment.
Sampling Pump: A leak-free pump is needed to pull the sample gas through
the system at a flow rate sufficient to minimize the response time of the
measurement system. The pump may be constructed of any material that is non-
reactive to the gas being sampled. For dilution-type measurement systems, an
ejector pump is used to create a vacuum that draws the sample through a critical
orifice at a constant rate.
SO2 Analyzer: An ultra violet, nondispersive infrared, fluorescence, or other
detection principle to continuously measure SO2 in the gas stream.
NOx Analyzer: An analyzer that operates on the principle of chem-
iluminescence with an NO2 to NO converter is one example of an analyzer that
has been used successfully in the past. Analyzers operating on other principles
may also be used.
CO Analyzer: An analyzer that continuously measures CO in the gas stream.
CO2 Analyzer: An analyzer that continuously measures CO2 in the gas stream.
O2 Analyzer: An analyzer that continuously measures O2 in the gas stream.
Procedure 1. Preliminary site inspection: Prior to testing, physical inspection of the source to
be tested is used to establish the location of sampling access holes and
determine accessibility and work platform requirements (including power and
safety). Discussion with site personnel should include plant operating
conditions and plant safety requirements for testing equipment and testing
personnel. The inspection should also determine if access holes are pre-
existing, and that access hole covers can be removed for sampling (not
corroded shut). Preliminary determinations of temperature, velocity, pressure
and moisture content can then be made. If the sampling plane fails to meet the
requirements necessary for obtaining a representative sample then alternative
sampling locations should be sought.
2. Following the inspections, and after considering the test objectives and plant
operating conditions, a decision can be made on the sampling equipment and
test procedures to be employed.
3. Sampling emissions for gases: Multi-point sampling is generally not required
for sampling of gaseous emissions. However, in some situations, notably after
the junction of several different streams, stratification of the gas stream will
persist for some distance downstream.
4. A survey of a suitable constituent of the gas stream such as carbon dioxide or
oxygen should be performed to determine the degree of stratification. In cases
where stratification does not exist, single point sampling at one quarter the
diameter across the stack, should be representative of the gaseous emission.
5. If stratification exists, the gaseous emission determination will require multi-
point sampling techniques, unless an alternative sampling plane can be found.
6. Sample Collection: Position the probe at the first sampling point. Purge the
system for the response time before recording any data. Then, traverse all
required sampling points, sampling at each point for an equal length of time and
maintaining the appropriate sample flow rate. Each time the probe is removed
from the stack and replaced, you must wait for the instrument to normalize the
readings prior to your next recording. If the average of any run exceeds the
calibration span value, that run is invalid.

Section 1 of Chapter 2 Standard Operating Procedures for Environmental Sampling
Technical Report – Submission 5.1 Page No 84
Interferences Instrumental gas analyzers are often used in a semi-continuous (batch) monitoring
mode to measure emissions for short periods of time (typically from 1-hour to
several days). These systems are not permanently attached to the stack and
generally stack gases are withdrawn from the discharge through a gas conditioning
system to the instrumental analyzer.
Because of the variety of parameters measured and techniques available in gas
analyzers it is not possible to specify performance specifications for all types of
instrumental analyzers. However, users must operate equipment according to the
manufacturer’s instructions and be familiar with the characteristics of their analyzer
for their particular application. A requirement for instrumental analyzers is that the
following performance characteristics are assessed before use:
response time,
zero and span drift,
detection limit,
effect of interfering substances, and
effect of temperature and pressure on instrument stability.
Quality
Control
Gas withdrawn from the discharge through the gas conditioning system must not
change the integrity of the sample gas. As the conditioning system and instrumental
analyzers are normally cold started, sufficient warm-up and conditioning time must
be allowed before calibration and measurements are commenced.
4. MOTOR VEHICLE EXHAUST AND NOISE
Scope This document describes general and specific procedures, methods and
considerations to be used and observed when measuring sound pressure emission
levels from stationary and mobile motor vehicles for field measurements.
Principle The procedures contained in this document are to be used by field personnel when
measuring sound pressure emission levels from stationary and mobile motor
vehicles in the field. On the occasion that field personnel determine that any of the
procedures described in this section are either inappropriate, inadequate or
impractical and that another procedure must be used to obtain a surface water
sample, the variant procedure will be documented in the field logbook, along with a
description of the circumstances requiring its use. Mention of trade names or
commercial products in this operating procedure does not constitute endorsement or
recommendation for use.
Procedure Motor Vehicles (Stationary)
13. While the vehicle is being tested, any ancillary equipment, such as
refrigeration units, or agitator drum drives, must be in operation except where
that equipment would only be in operation whilst the vehicle is stationary or
travelling on a road at a speed of less than 8 km/h.
14. The measurements must be made in the open air where the ambient noise
level is at least 10 dB(A) below the noise level being measured.
15. The test site may take the form of an open space or beneath a canopy if no
part of the canopy or its supports is within 3 metres of the microphone.
16. The test site within 3 metres of the microphone must be substantially flat and
may include kerbs, channels, gutter, poles or other objects not providing
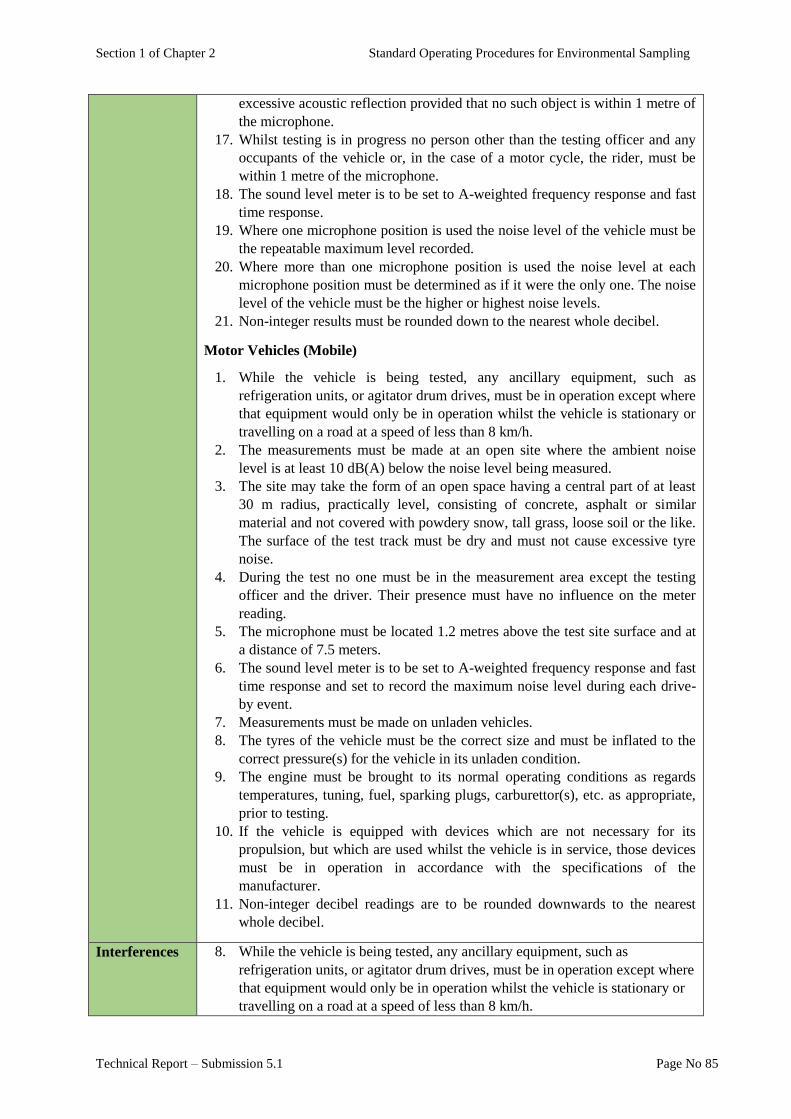
Section 1 of Chapter 2 Standard Operating Procedures for Environmental Sampling
Technical Report – Submission 5.1 Page No 85
excessive acoustic reflection provided that no such object is within 1 metre of
the microphone.
17. Whilst testing is in progress no person other than the testing officer and any
occupants of the vehicle or, in the case of a motor cycle, the rider, must be
within 1 metre of the microphone.
18. The sound level meter is to be set to A-weighted frequency response and fast
time response.
19. Where one microphone position is used the noise level of the vehicle must be
the repeatable maximum level recorded.
20. Where more than one microphone position is used the noise level at each
microphone position must be determined as if it were the only one. The noise
level of the vehicle must be the higher or highest noise levels.
21. Non-integer results must be rounded down to the nearest whole decibel.
Motor Vehicles (Mobile)
1. While the vehicle is being tested, any ancillary equipment, such as
refrigeration units, or agitator drum drives, must be in operation except where
that equipment would only be in operation whilst the vehicle is stationary or
travelling on a road at a speed of less than 8 km/h.
2. The measurements must be made at an open site where the ambient noise
level is at least 10 dB(A) below the noise level being measured.
3. The site may take the form of an open space having a central part of at least
30 m radius, practically level, consisting of concrete, asphalt or similar
material and not covered with powdery snow, tall grass, loose soil or the like.
The surface of the test track must be dry and must not cause excessive tyre
noise.
4. During the test no one must be in the measurement area except the testing
officer and the driver. Their presence must have no influence on the meter
reading.
5. The microphone must be located 1.2 metres above the test site surface and at
a distance of 7.5 meters.
6. The sound level meter is to be set to A-weighted frequency response and fast
time response and set to record the maximum noise level during each drive-
by event.
7. Measurements must be made on unladen vehicles.
8. The tyres of the vehicle must be the correct size and must be inflated to the
correct pressure(s) for the vehicle in its unladen condition.
9. The engine must be brought to its normal operating conditions as regards
temperatures, tuning, fuel, sparking plugs, carburettor(s), etc. as appropriate,
prior to testing.
10. If the vehicle is equipped with devices which are not necessary for its
propulsion, but which are used whilst the vehicle is in service, those devices
must be in operation in accordance with the specifications of the
manufacturer.
11. Non-integer decibel readings are to be rounded downwards to the nearest
whole decibel.
Interferences 8. While the vehicle is being tested, any ancillary equipment, such as
refrigeration units, or agitator drum drives, must be in operation except where
that equipment would only be in operation whilst the vehicle is stationary or
travelling on a road at a speed of less than 8 km/h.
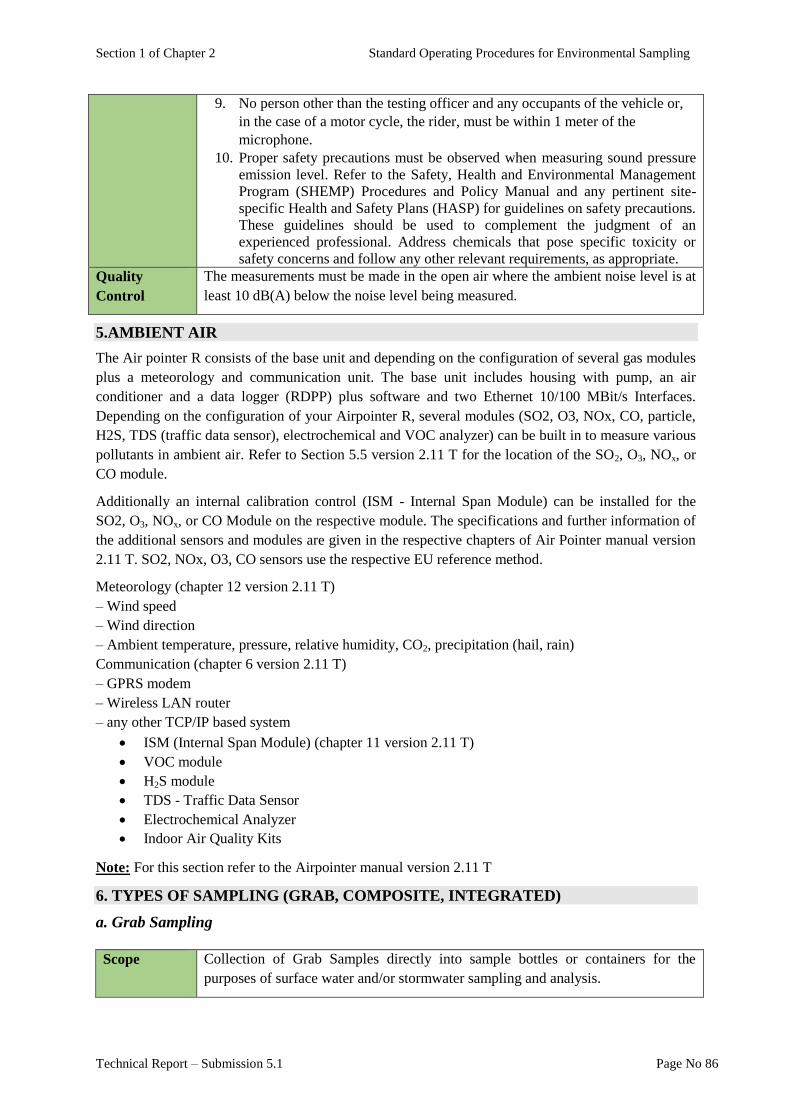
Section 1 of Chapter 2 Standard Operating Procedures for Environmental Sampling
Technical Report – Submission 5.1 Page No 86
9. No person other than the testing officer and any occupants of the vehicle or,
in the case of a motor cycle, the rider, must be within 1 meter of the
microphone.
10. Proper safety precautions must be observed when measuring sound pressure
emission level. Refer to the Safety, Health and Environmental Management
Program (SHEMP) Procedures and Policy Manual and any pertinent site-
specific Health and Safety Plans (HASP) for guidelines on safety precautions.
These guidelines should be used to complement the judgment of an
experienced professional. Address chemicals that pose specific toxicity or
safety concerns and follow any other relevant requirements, as appropriate.
Quality
Control
The measurements must be made in the open air where the ambient noise level is at
least 10 dB(A) below the noise level being measured.
5.AMBIENT AIR
The Air pointer R consists of the base unit and depending on the configuration of several gas modules
plus a meteorology and communication unit. The base unit includes housing with pump, an air
conditioner and a data logger (RDPP) plus software and two Ethernet 10/100 MBit/s Interfaces.
Depending on the configuration of your Airpointer R, several modules (SO2, O3, NOx, CO, particle,
H2S, TDS (traffic data sensor), electrochemical and VOC analyzer) can be built in to measure various
pollutants in ambient air. Refer to Section 5.5 version 2.11 T for the location of the SO2, O3, NOx, or
CO module.
Additionally an internal calibration control (ISM - Internal Span Module) can be installed for the
SO2, O3, NOx, or CO Module on the respective module. The specifications and further information of
the additional sensors and modules are given in the respective chapters of Air Pointer manual version
2.11 T. SO2, NOx, O3, CO sensors use the respective EU reference method.
Meteorology (chapter 12 version 2.11 T)
– Wind speed
– Wind direction
– Ambient temperature, pressure, relative humidity, CO2, precipitation (hail, rain)
Communication (chapter 6 version 2.11 T)
– GPRS modem
– Wireless LAN router
– any other TCP/IP based system
ISM (Internal Span Module) (chapter 11 version 2.11 T)
VOC module
H2S module
TDS - Traffic Data Sensor
Electrochemical Analyzer
Indoor Air Quality Kits
Note: For this section refer to the Airpointer manual version 2.11 T
6. TYPES OF SAMPLING (GRAB, COMPOSITE, INTEGRATED)
a. Grab Sampling
Scope Collection of Grab Samples directly into sample bottles or containers for the
purposes of surface water and/or stormwater sampling and analysis.
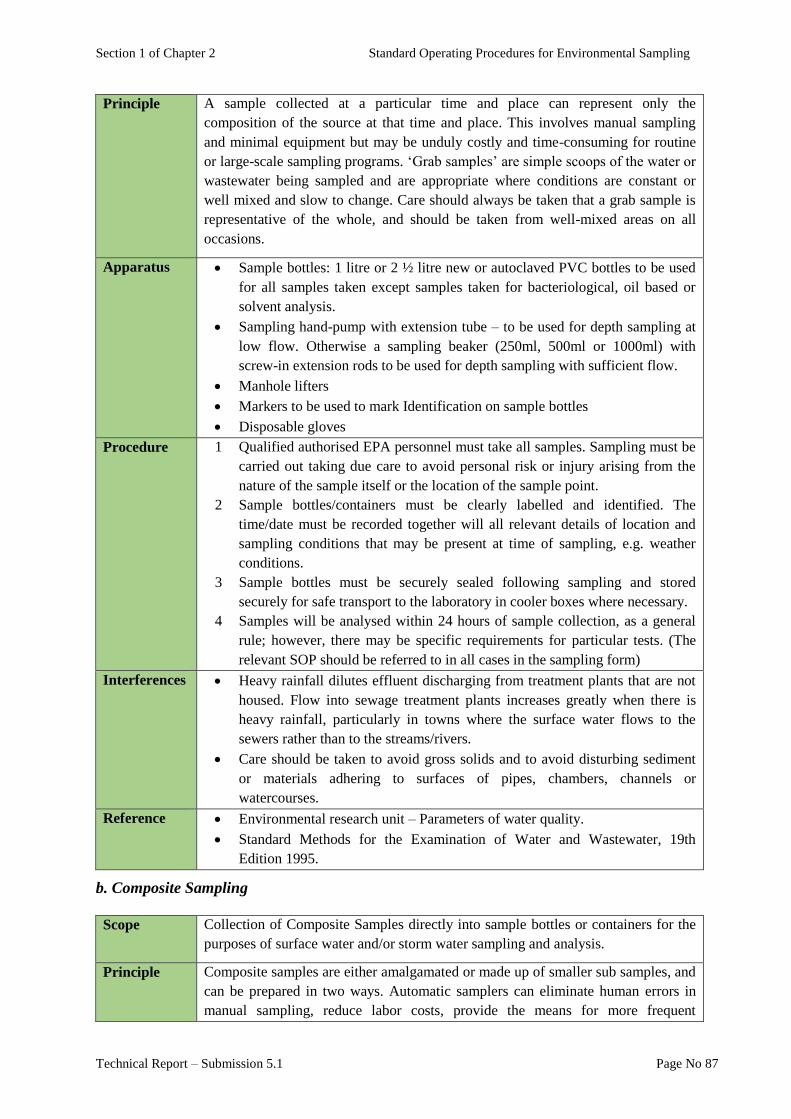
Section 1 of Chapter 2 Standard Operating Procedures for Environmental Sampling
Technical Report – Submission 5.1 Page No 87
Principle A sample collected at a particular time and place can represent only the
composition of the source at that time and place. This involves manual sampling
and minimal equipment but may be unduly costly and time-consuming for routine
or large-scale sampling programs. ‘Grab samples’ are simple scoops of the water or
wastewater being sampled and are appropriate where conditions are constant or
well mixed and slow to change. Care should always be taken that a grab sample is
representative of the whole, and should be taken from well-mixed areas on all
occasions.
Apparatus Sample bottles: 1 litre or 2 ½ litre new or autoclaved PVC bottles to be used
for all samples taken except samples taken for bacteriological, oil based or
solvent analysis.
Sampling hand-pump with extension tube – to be used for depth sampling at
low flow. Otherwise a sampling beaker (250ml, 500ml or 1000ml) with
screw-in extension rods to be used for depth sampling with sufficient flow.
Manhole lifters
Markers to be used to mark Identification on sample bottles
Disposable gloves
Procedure 1 Qualified authorised EPA personnel must take all samples. Sampling must be
carried out taking due care to avoid personal risk or injury arising from the
nature of the sample itself or the location of the sample point.
2 Sample bottles/containers must be clearly labelled and identified. The
time/date must be recorded together will all relevant details of location and
sampling conditions that may be present at time of sampling, e.g. weather
conditions.
3 Sample bottles must be securely sealed following sampling and stored
securely for safe transport to the laboratory in cooler boxes where necessary.
4 Samples will be analysed within 24 hours of sample collection, as a general
rule; however, there may be specific requirements for particular tests. (The
relevant SOP should be referred to in all cases in the sampling form)
Interferences Heavy rainfall dilutes effluent discharging from treatment plants that are not
housed. Flow into sewage treatment plants increases greatly when there is
heavy rainfall, particularly in towns where the surface water flows to the
sewers rather than to the streams/rivers.
Care should be taken to avoid gross solids and to avoid disturbing sediment
or materials adhering to surfaces of pipes, chambers, channels or
watercourses.
Reference Environmental research unit – Parameters of water quality.
Standard Methods for the Examination of Water and Wastewater, 19th
Edition 1995.
b. Composite Sampling
Scope Collection of Composite Samples directly into sample bottles or containers for the
purposes of surface water and/or storm water sampling and analysis.
Principle Composite samples are either amalgamated or made up of smaller sub samples, and
can be prepared in two ways. Automatic samplers can eliminate human errors in
manual sampling, reduce labor costs, provide the means for more frequent
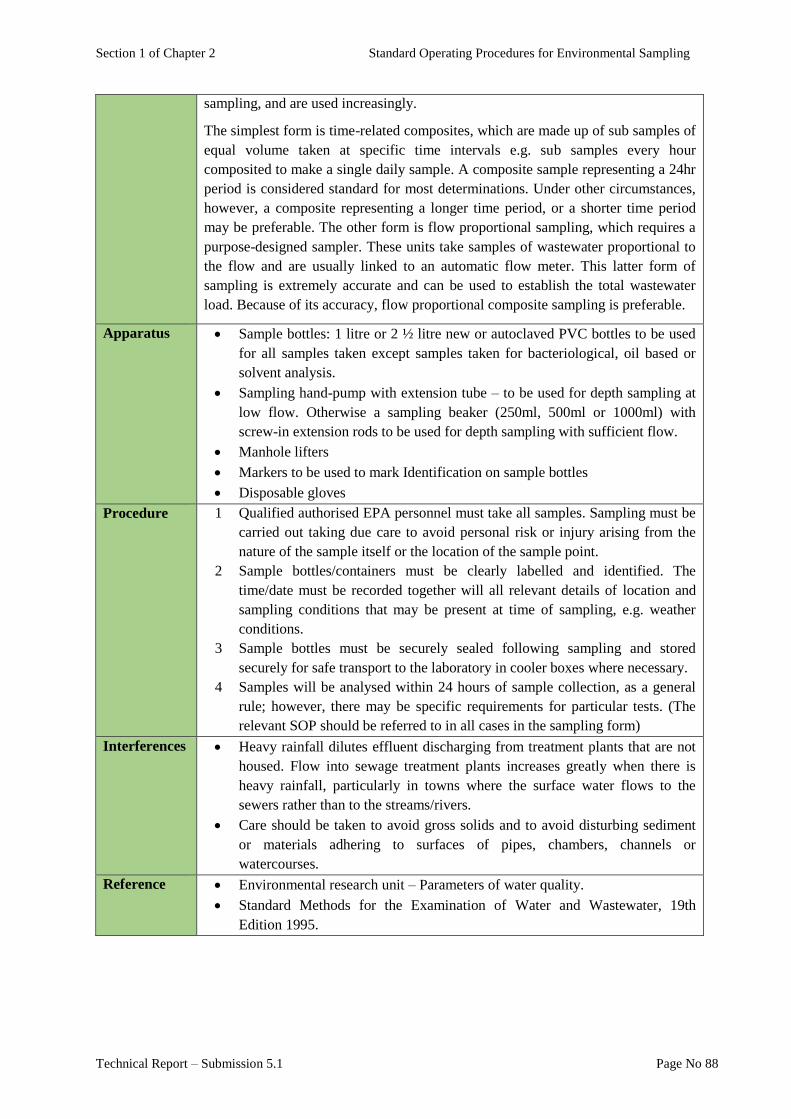
Section 1 of Chapter 2 Standard Operating Procedures for Environmental Sampling
Technical Report – Submission 5.1 Page No 88
sampling, and are used increasingly.
The simplest form is time-related composites, which are made up of sub samples of
equal volume taken at specific time intervals e.g. sub samples every hour
composited to make a single daily sample. A composite sample representing a 24hr
period is considered standard for most determinations. Under other circumstances,
however, a composite representing a longer time period, or a shorter time period
may be preferable. The other form is flow proportional sampling, which requires a
purpose-designed sampler. These units take samples of wastewater proportional to
the flow and are usually linked to an automatic flow meter. This latter form of
sampling is extremely accurate and can be used to establish the total wastewater
load. Because of its accuracy, flow proportional composite sampling is preferable.
Apparatus Sample bottles: 1 litre or 2 ½ litre new or autoclaved PVC bottles to be used
for all samples taken except samples taken for bacteriological, oil based or
solvent analysis.
Sampling hand-pump with extension tube – to be used for depth sampling at
low flow. Otherwise a sampling beaker (250ml, 500ml or 1000ml) with
screw-in extension rods to be used for depth sampling with sufficient flow.
Manhole lifters
Markers to be used to mark Identification on sample bottles
Disposable gloves
Procedure 1 Qualified authorised EPA personnel must take all samples. Sampling must be
carried out taking due care to avoid personal risk or injury arising from the
nature of the sample itself or the location of the sample point.
2 Sample bottles/containers must be clearly labelled and identified. The
time/date must be recorded together will all relevant details of location and
sampling conditions that may be present at time of sampling, e.g. weather
conditions.
3 Sample bottles must be securely sealed following sampling and stored
securely for safe transport to the laboratory in cooler boxes where necessary.
4 Samples will be analysed within 24 hours of sample collection, as a general
rule; however, there may be specific requirements for particular tests. (The
relevant SOP should be referred to in all cases in the sampling form)
Interferences Heavy rainfall dilutes effluent discharging from treatment plants that are not
housed. Flow into sewage treatment plants increases greatly when there is
heavy rainfall, particularly in towns where the surface water flows to the
sewers rather than to the streams/rivers.
Care should be taken to avoid gross solids and to avoid disturbing sediment
or materials adhering to surfaces of pipes, chambers, channels or
watercourses.
Reference Environmental research unit – Parameters of water quality.
Standard Methods for the Examination of Water and Wastewater, 19th
Edition 1995.

Section 2
Standard Operating Procedures
For Testing and Analysis


Section 2 of Chapter 2 Standard Operating Procedures for Testing and Analysis
Technical Report – Submission 5.1 Page No 92
Section 2
Standard Operating Procedures for Testing
and Analysis EPA personnel are required to analyze environmental samples of the types mentioned below and thus
require SOPs for testing and analysis for the following categories:
1. Organics/Physiochemical (except metals)
2. Ambient Air and Gaseous Emissions
3. Heavy Metals
4. Microbiological Analysis
Note: Occupational health and safety considerations should be made before proceeding with
laboratory procedures.
Following are descriptions of testing and analysis procedures to allow the laboratory personnel to
analyze the composition and properties of environmental samples.
1. ORGANICS/PHYSIOCHEMICAL
Sr. No. Parameter
i. Total Dissolved Solids (TDS)
ii. Total Suspended Solids (TSS)
iii. pH
iv. Biological Oxygen Demand (BOD)
v. Chemical Oxygen Demand (COD)
vi. Chlorides (Cl-)
vii. Free Chlorine (Cl2)
viii. Sulfide (S-2
)
ix. Ammonia (NH3)
x. Fluoride (F-)
xi. Cyanide (CN-) total
i. Standard Operating Procedure for Total Dissolved Solids (TDS)
Scope This method describes the determination of Total Dissolved Solids in
water/wastewater samples.
Principle A well-mixed sample is filtered through a standard glass fiber filter and the filtrate
is evaporated to dryness in a weighed dish and dried to a constant weight at 180C.
The increase in the dish weight represents the total dissolved solids.
Apparatus/
Reagents
Evaporating Dish, 100mL capacity made of porcelain.
Desiccator, provided with a desiccant containing a color indicator of moisture
concentration (silica gel beads with blue indicator).
Drying oven for operation at 103 to 105C.
Analytical balance.
Magnetic stirrer with TFE stirring bar.
Wide bore pipets.
Glass fibre filter disks without organic binder (Millipore type AP40), 47mm
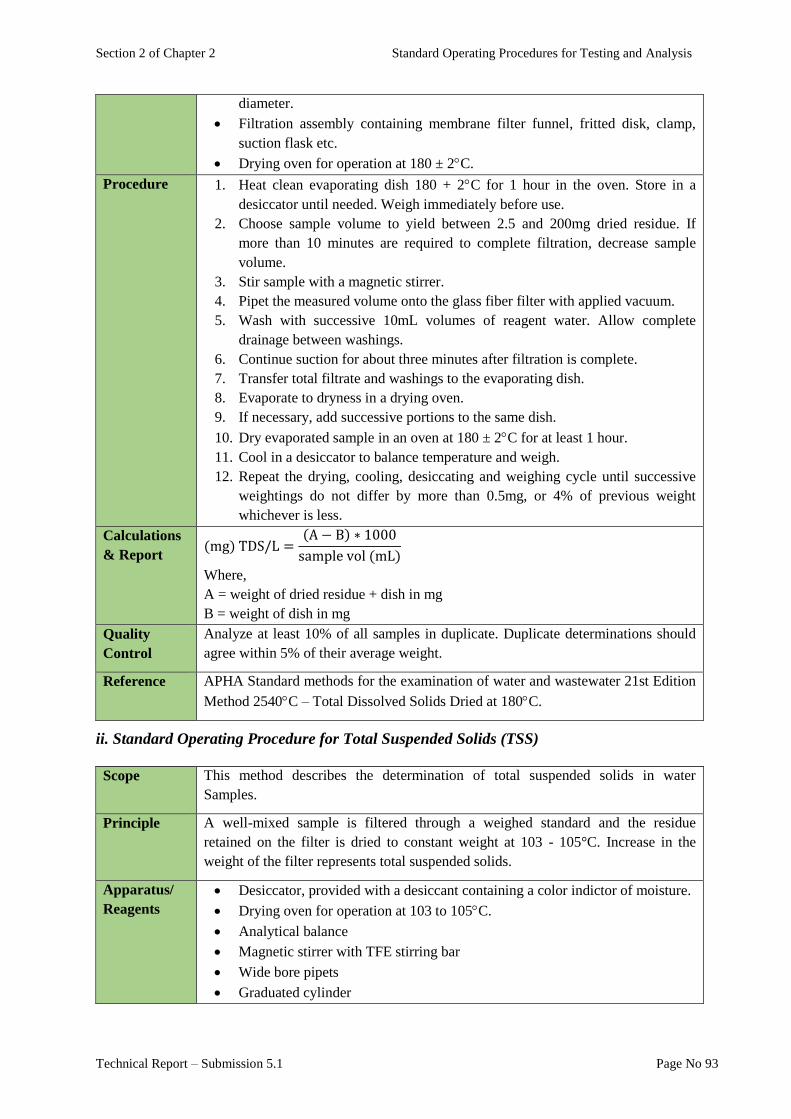
Section 2 of Chapter 2 Standard Operating Procedures for Testing and Analysis
Technical Report – Submission 5.1 Page No 93
diameter.
Filtration assembly containing membrane filter funnel, fritted disk, clamp,
suction flask etc.
Drying oven for operation at 180 ± 2C.
Procedure 1. Heat clean evaporating dish 180 + 2C for 1 hour in the oven. Store in a
desiccator until needed. Weigh immediately before use.
2. Choose sample volume to yield between 2.5 and 200mg dried residue. If
more than 10 minutes are required to complete filtration, decrease sample
volume.
3. Stir sample with a magnetic stirrer.
4. Pipet the measured volume onto the glass fiber filter with applied vacuum.
5. Wash with successive 10mL volumes of reagent water. Allow complete
drainage between washings.
6. Continue suction for about three minutes after filtration is complete.
7. Transfer total filtrate and washings to the evaporating dish.
8. Evaporate to dryness in a drying oven.
9. If necessary, add successive portions to the same dish.
10. Dry evaporated sample in an oven at 180 ± 2C for at least 1 hour.
11. Cool in a desiccator to balance temperature and weigh.
12. Repeat the drying, cooling, desiccating and weighing cycle until successive
weightings do not differ by more than 0.5mg, or 4% of previous weight
whichever is less.
Calculations
& Report (mg) TDS/L =
(A − B) ∗ 1000
sample vol (mL)
Where,
A = weight of dried residue + dish in mg
B = weight of dish in mg
Quality
Control
Analyze at least 10% of all samples in duplicate. Duplicate determinations should
agree within 5% of their average weight.
Reference APHA Standard methods for the examination of water and wastewater 21st Edition
Method 2540C – Total Dissolved Solids Dried at 180C.
ii. Standard Operating Procedure for Total Suspended Solids (TSS)
Scope This method describes the determination of total suspended solids in water
Samples.
Principle A well-mixed sample is filtered through a weighed standard and the residue
retained on the filter is dried to constant weight at 103 - 105°C. Increase in the
weight of the filter represents total suspended solids.
Apparatus/
Reagents
Desiccator, provided with a desiccant containing a color indictor of moisture.
Drying oven for operation at 103 to 105C.
Analytical balance
Magnetic stirrer with TFE stirring bar
Wide bore pipets
Graduated cylinder
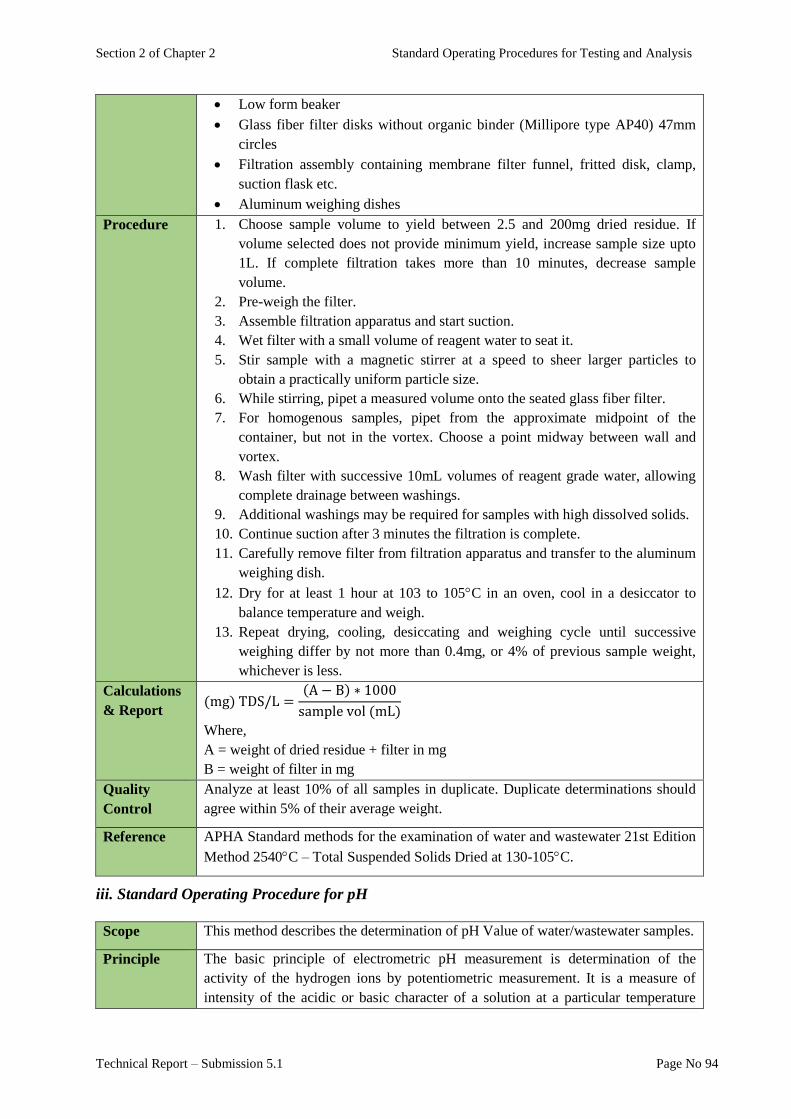
Section 2 of Chapter 2 Standard Operating Procedures for Testing and Analysis
Technical Report – Submission 5.1 Page No 94
Low form beaker
Glass fiber filter disks without organic binder (Millipore type AP40) 47mm
circles
Filtration assembly containing membrane filter funnel, fritted disk, clamp,
suction flask etc.
Aluminum weighing dishes
Procedure 1. Choose sample volume to yield between 2.5 and 200mg dried residue. If
volume selected does not provide minimum yield, increase sample size upto
1L. If complete filtration takes more than 10 minutes, decrease sample
volume.
2. Pre-weigh the filter.
3. Assemble filtration apparatus and start suction.
4. Wet filter with a small volume of reagent water to seat it.
5. Stir sample with a magnetic stirrer at a speed to sheer larger particles to
obtain a practically uniform particle size.
6. While stirring, pipet a measured volume onto the seated glass fiber filter.
7. For homogenous samples, pipet from the approximate midpoint of the
container, but not in the vortex. Choose a point midway between wall and
vortex.
8. Wash filter with successive 10mL volumes of reagent grade water, allowing
complete drainage between washings.
9. Additional washings may be required for samples with high dissolved solids.
10. Continue suction after 3 minutes the filtration is complete.
11. Carefully remove filter from filtration apparatus and transfer to the aluminum
weighing dish.
12. Dry for at least 1 hour at 103 to 105C in an oven, cool in a desiccator to
balance temperature and weigh.
13. Repeat drying, cooling, desiccating and weighing cycle until successive
weighing differ by not more than 0.4mg, or 4% of previous sample weight,
whichever is less.
Calculations
& Report (mg) TDS/L =
(A − B) ∗ 1000
sample vol (mL)
Where,
A = weight of dried residue + filter in mg
B = weight of filter in mg
Quality
Control
Analyze at least 10% of all samples in duplicate. Duplicate determinations should
agree within 5% of their average weight.
Reference APHA Standard methods for the examination of water and wastewater 21st Edition
Method 2540C – Total Suspended Solids Dried at 130-105C.
iii. Standard Operating Procedure for pH
Scope This method describes the determination of pH Value of water/wastewater samples.
Principle The basic principle of electrometric pH measurement is determination of the
activity of the hydrogen ions by potentiometric measurement. It is a measure of
intensity of the acidic or basic character of a solution at a particular temperature
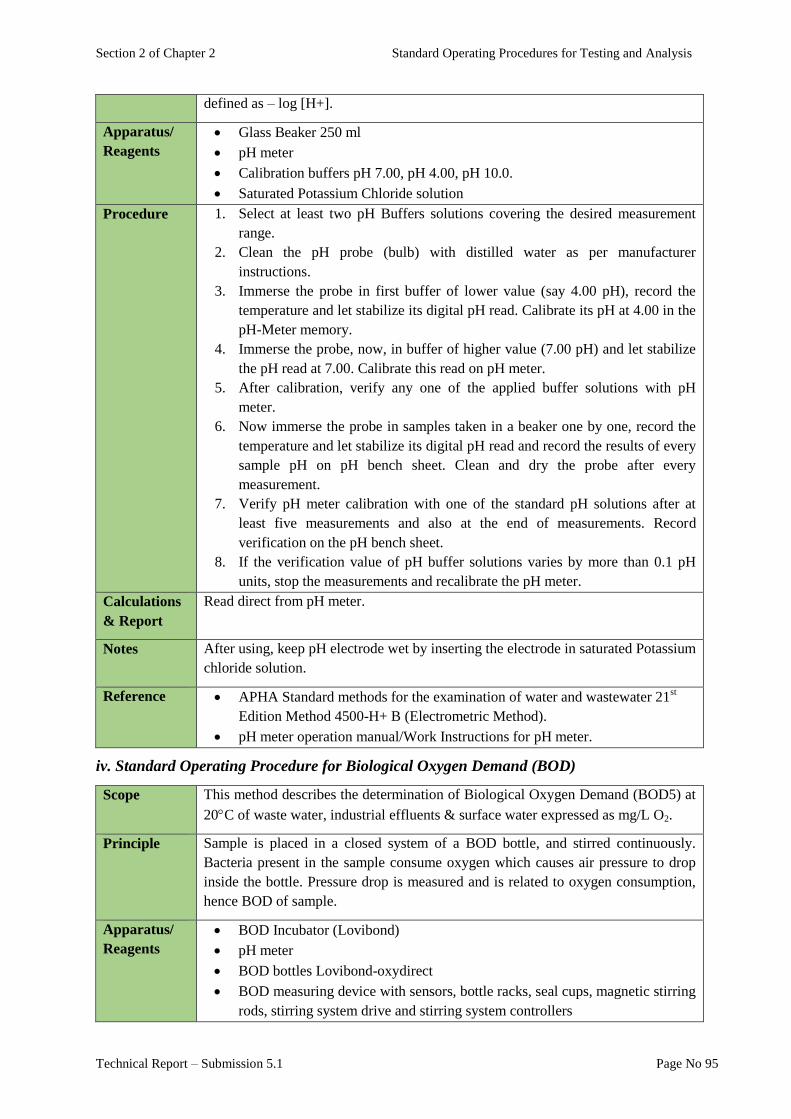
Section 2 of Chapter 2 Standard Operating Procedures for Testing and Analysis
Technical Report – Submission 5.1 Page No 95
defined as – log [H+].
Apparatus/
Reagents
Glass Beaker 250 ml
pH meter
Calibration buffers pH 7.00, pH 4.00, pH 10.0.
Saturated Potassium Chloride solution
Procedure 1. Select at least two pH Buffers solutions covering the desired measurement
range.
2. Clean the pH probe (bulb) with distilled water as per manufacturer
instructions.
3. Immerse the probe in first buffer of lower value (say 4.00 pH), record the
temperature and let stabilize its digital pH read. Calibrate its pH at 4.00 in the
pH-Meter memory.
4. Immerse the probe, now, in buffer of higher value (7.00 pH) and let stabilize
the pH read at 7.00. Calibrate this read on pH meter.
5. After calibration, verify any one of the applied buffer solutions with pH
meter.
6. Now immerse the probe in samples taken in a beaker one by one, record the
temperature and let stabilize its digital pH read and record the results of every
sample pH on pH bench sheet. Clean and dry the probe after every
measurement.
7. Verify pH meter calibration with one of the standard pH solutions after at
least five measurements and also at the end of measurements. Record
verification on the pH bench sheet.
8. If the verification value of pH buffer solutions varies by more than 0.1 pH
units, stop the measurements and recalibrate the pH meter.
Calculations
& Report
Read direct from pH meter.
Notes After using, keep pH electrode wet by inserting the electrode in saturated Potassium
chloride solution.
Reference APHA Standard methods for the examination of water and wastewater 21st
Edition Method 4500-H+ B (Electrometric Method).
pH meter operation manual/Work Instructions for pH meter.
iv. Standard Operating Procedure for Biological Oxygen Demand (BOD)
Scope This method describes the determination of Biological Oxygen Demand (BOD5) at
20C of waste water, industrial effluents & surface water expressed as mg/L O2.
Principle Sample is placed in a closed system of a BOD bottle, and stirred continuously.
Bacteria present in the sample consume oxygen which causes air pressure to drop
inside the bottle. Pressure drop is measured and is related to oxygen consumption,
hence BOD of sample.
Apparatus/
Reagents
BOD Incubator (Lovibond)
pH meter
BOD bottles Lovibond-oxydirect
BOD measuring device with sensors, bottle racks, seal cups, magnetic stirring
rods, stirring system drive and stirring system controllers
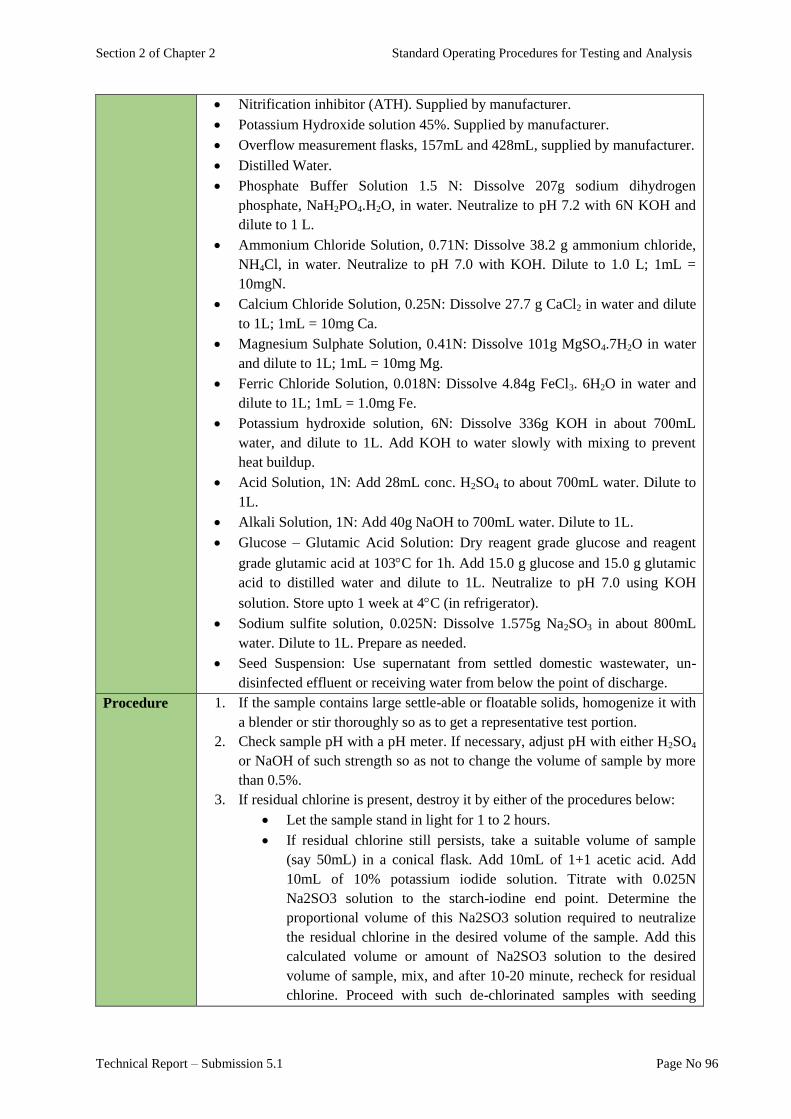
Section 2 of Chapter 2 Standard Operating Procedures for Testing and Analysis
Technical Report – Submission 5.1 Page No 96
Nitrification inhibitor (ATH). Supplied by manufacturer.
Potassium Hydroxide solution 45%. Supplied by manufacturer.
Overflow measurement flasks, 157mL and 428mL, supplied by manufacturer.
Distilled Water.
Phosphate Buffer Solution 1.5 N: Dissolve 207g sodium dihydrogen
phosphate, NaH2PO4.H2O, in water. Neutralize to pH 7.2 with 6N KOH and
dilute to 1 L.
Ammonium Chloride Solution, 0.71N: Dissolve 38.2 g ammonium chloride,
NH4Cl, in water. Neutralize to pH 7.0 with KOH. Dilute to 1.0 L; 1mL =
10mgN.
Calcium Chloride Solution, 0.25N: Dissolve 27.7 g CaCl2 in water and dilute
to 1L; 1mL = 10mg Ca.
Magnesium Sulphate Solution, 0.41N: Dissolve 101g MgSO4.7H2O in water
and dilute to 1L; 1mL = 10mg Mg.
Ferric Chloride Solution, 0.018N: Dissolve 4.84g FeCl3. 6H2O in water and
dilute to 1L; 1mL = 1.0mg Fe.
Potassium hydroxide solution, 6N: Dissolve 336g KOH in about 700mL
water, and dilute to 1L. Add KOH to water slowly with mixing to prevent
heat buildup.
Acid Solution, 1N: Add 28mL conc. H2SO4 to about 700mL water. Dilute to
1L.
Alkali Solution, 1N: Add 40g NaOH to 700mL water. Dilute to 1L.
Glucose – Glutamic Acid Solution: Dry reagent grade glucose and reagent
grade glutamic acid at 103C for 1h. Add 15.0 g glucose and 15.0 g glutamic
acid to distilled water and dilute to 1L. Neutralize to pH 7.0 using KOH
solution. Store upto 1 week at 4C (in refrigerator).
Sodium sulfite solution, 0.025N: Dissolve 1.575g Na2SO3 in about 800mL
water. Dilute to 1L. Prepare as needed.
Seed Suspension: Use supernatant from settled domestic wastewater, un-
disinfected effluent or receiving water from below the point of discharge.
Procedure 1. If the sample contains large settle-able or floatable solids, homogenize it with
a blender or stir thoroughly so as to get a representative test portion.
2. Check sample pH with a pH meter. If necessary, adjust pH with either H2SO4
or NaOH of such strength so as not to change the volume of sample by more
than 0.5%.
3. If residual chlorine is present, destroy it by either of the procedures below:
Let the sample stand in light for 1 to 2 hours.
If residual chlorine still persists, take a suitable volume of sample
(say 50mL) in a conical flask. Add 10mL of 1+1 acetic acid. Add
10mL of 10% potassium iodide solution. Titrate with 0.025N
Na2SO3 solution to the starch-iodine end point. Determine the
proportional volume of this Na2SO3 solution required to neutralize
the residual chlorine in the desired volume of the sample. Add this
calculated volume or amount of Na2SO3 solution to the desired
volume of sample, mix, and after 10-20 minute, recheck for residual
chlorine. Proceed with such de-chlorinated samples with seeding
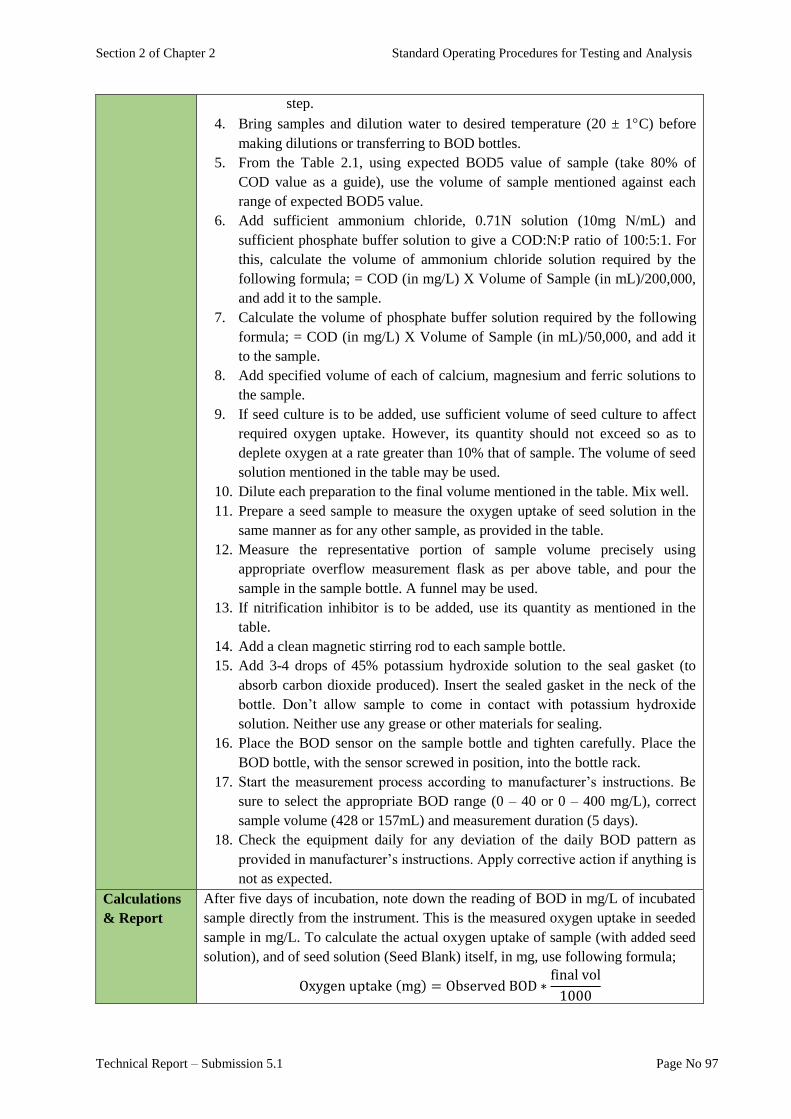
Section 2 of Chapter 2 Standard Operating Procedures for Testing and Analysis
Technical Report – Submission 5.1 Page No 97
step.
4. Bring samples and dilution water to desired temperature (20 ± 1C) before
making dilutions or transferring to BOD bottles.
5. From the Table 2.1, using expected BOD5 value of sample (take 80% of
COD value as a guide), use the volume of sample mentioned against each
range of expected BOD5 value.
6. Add sufficient ammonium chloride, 0.71N solution (10mg N/mL) and
sufficient phosphate buffer solution to give a COD:N:P ratio of 100:5:1. For
this, calculate the volume of ammonium chloride solution required by the
following formula; = COD (in mg/L) X Volume of Sample (in mL)/200,000,
and add it to the sample.
7. Calculate the volume of phosphate buffer solution required by the following
formula; = COD (in mg/L) X Volume of Sample (in mL)/50,000, and add it
to the sample.
8. Add specified volume of each of calcium, magnesium and ferric solutions to
the sample.
9. If seed culture is to be added, use sufficient volume of seed culture to affect
required oxygen uptake. However, its quantity should not exceed so as to
deplete oxygen at a rate greater than 10% that of sample. The volume of seed
solution mentioned in the table may be used.
10. Dilute each preparation to the final volume mentioned in the table. Mix well.
11. Prepare a seed sample to measure the oxygen uptake of seed solution in the
same manner as for any other sample, as provided in the table.
12. Measure the representative portion of sample volume precisely using
appropriate overflow measurement flask as per above table, and pour the
sample in the sample bottle. A funnel may be used.
13. If nitrification inhibitor is to be added, use its quantity as mentioned in the
table.
14. Add a clean magnetic stirring rod to each sample bottle.
15. Add 3-4 drops of 45% potassium hydroxide solution to the seal gasket (to
absorb carbon dioxide produced). Insert the sealed gasket in the neck of the
bottle. Don’t allow sample to come in contact with potassium hydroxide
solution. Neither use any grease or other materials for sealing.
16. Place the BOD sensor on the sample bottle and tighten carefully. Place the
BOD bottle, with the sensor screwed in position, into the bottle rack.
17. Start the measurement process according to manufacturer’s instructions. Be
sure to select the appropriate BOD range (0 – 40 or 0 – 400 mg/L), correct
sample volume (428 or 157mL) and measurement duration (5 days).
18. Check the equipment daily for any deviation of the daily BOD pattern as
provided in manufacturer’s instructions. Apply corrective action if anything is
not as expected.
Calculations
& Report
After five days of incubation, note down the reading of BOD in mg/L of incubated
sample directly from the instrument. This is the measured oxygen uptake in seeded
sample in mg/L. To calculate the actual oxygen uptake of sample (with added seed
solution), and of seed solution (Seed Blank) itself, in mg, use following formula;
Oxygen uptake (mg) = Observed BOD ∗final vol
1000
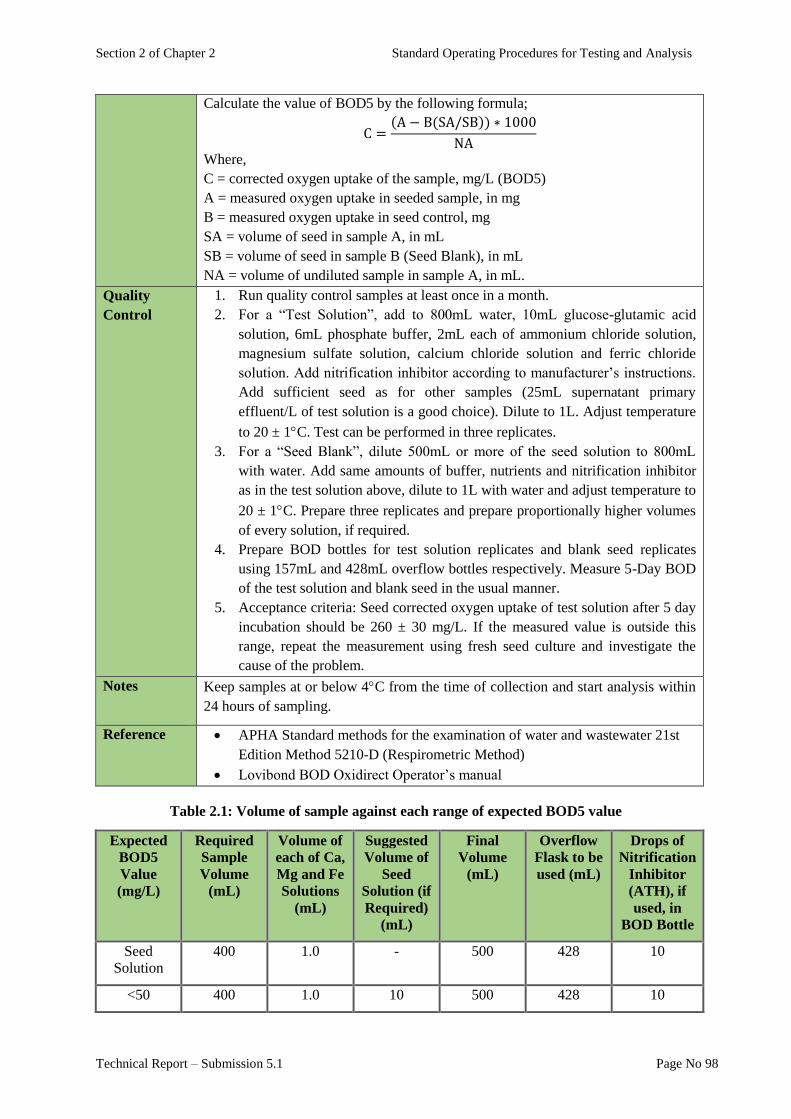
Section 2 of Chapter 2 Standard Operating Procedures for Testing and Analysis
Technical Report – Submission 5.1 Page No 98
Calculate the value of BOD5 by the following formula;
C =(A − B(SA/SB)) ∗ 1000
NA
Where,
C = corrected oxygen uptake of the sample, mg/L (BOD5)
A = measured oxygen uptake in seeded sample, in mg
B = measured oxygen uptake in seed control, mg
SA = volume of seed in sample A, in mL
SB = volume of seed in sample B (Seed Blank), in mL
NA = volume of undiluted sample in sample A, in mL.
Quality
Control
1. Run quality control samples at least once in a month.
2. For a “Test Solution”, add to 800mL water, 10mL glucose-glutamic acid
solution, 6mL phosphate buffer, 2mL each of ammonium chloride solution,
magnesium sulfate solution, calcium chloride solution and ferric chloride
solution. Add nitrification inhibitor according to manufacturer’s instructions.
Add sufficient seed as for other samples (25mL supernatant primary
effluent/L of test solution is a good choice). Dilute to 1L. Adjust temperature
to 20 ± 1C. Test can be performed in three replicates.
3. For a “Seed Blank”, dilute 500mL or more of the seed solution to 800mL
with water. Add same amounts of buffer, nutrients and nitrification inhibitor
as in the test solution above, dilute to 1L with water and adjust temperature to
20 ± 1C. Prepare three replicates and prepare proportionally higher volumes
of every solution, if required.
4. Prepare BOD bottles for test solution replicates and blank seed replicates
using 157mL and 428mL overflow bottles respectively. Measure 5-Day BOD
of the test solution and blank seed in the usual manner.
5. Acceptance criteria: Seed corrected oxygen uptake of test solution after 5 day
incubation should be 260 ± 30 mg/L. If the measured value is outside this
range, repeat the measurement using fresh seed culture and investigate the
cause of the problem.
Notes Keep samples at or below 4C from the time of collection and start analysis within
24 hours of sampling.
Reference APHA Standard methods for the examination of water and wastewater 21st
Edition Method 5210-D (Respirometric Method)
Lovibond BOD Oxidirect Operator’s manual
Table 2.1: Volume of sample against each range of expected BOD5 value
Expected
BOD5
Value
(mg/L)
Required
Sample
Volume
(mL)
Volume of
each of Ca,
Mg and Fe
Solutions
(mL)
Suggested
Volume of
Seed
Solution (if
Required)
(mL)
Final
Volume
(mL)
Overflow
Flask to be
used (mL)
Drops of
Nitrification
Inhibitor
(ATH), if
used, in
BOD Bottle
Seed
Solution
400 1.0 - 500 428 10
<50 400 1.0 10 500 428 10
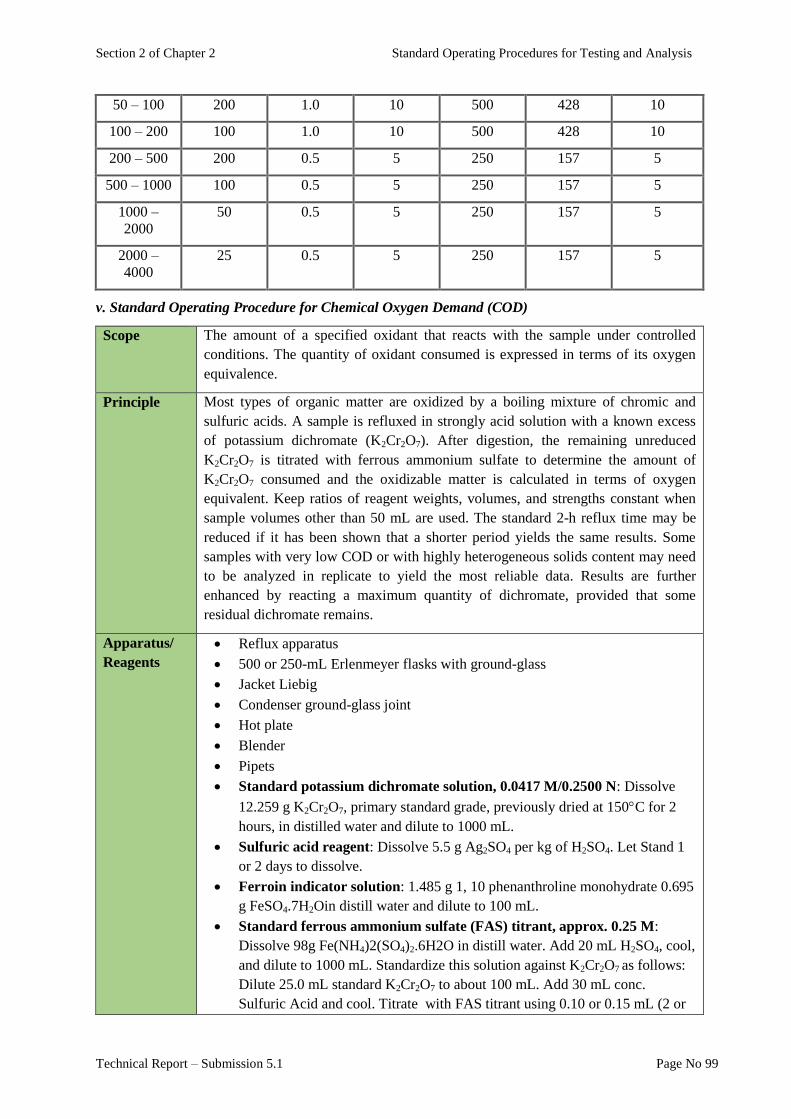
Section 2 of Chapter 2 Standard Operating Procedures for Testing and Analysis
Technical Report – Submission 5.1 Page No 99
50 – 100 200 1.0 10 500 428 10
100 – 200 100 1.0 10 500 428 10
200 – 500 200 0.5 5 250 157 5
500 – 1000 100 0.5 5 250 157 5
1000 –
2000
50 0.5 5 250 157 5
2000 –
4000
25 0.5 5 250 157 5
v. Standard Operating Procedure for Chemical Oxygen Demand (COD)
Scope The amount of a specified oxidant that reacts with the sample under controlled
conditions. The quantity of oxidant consumed is expressed in terms of its oxygen
equivalence.
Principle Most types of organic matter are oxidized by a boiling mixture of chromic and
sulfuric acids. A sample is refluxed in strongly acid solution with a known excess
of potassium dichromate (K2Cr2O7). After digestion, the remaining unreduced
K2Cr2O7 is titrated with ferrous ammonium sulfate to determine the amount of
K2Cr2O7 consumed and the oxidizable matter is calculated in terms of oxygen
equivalent. Keep ratios of reagent weights, volumes, and strengths constant when
sample volumes other than 50 mL are used. The standard 2-h reflux time may be
reduced if it has been shown that a shorter period yields the same results. Some
samples with very low COD or with highly heterogeneous solids content may need
to be analyzed in replicate to yield the most reliable data. Results are further
enhanced by reacting a maximum quantity of dichromate, provided that some
residual dichromate remains.
Apparatus/
Reagents
Reflux apparatus
500 or 250-mL Erlenmeyer flasks with ground-glass
Jacket Liebig
Condenser ground-glass joint
Hot plate
Blender
Pipets
Standard potassium dichromate solution, 0.0417 M/0.2500 N: Dissolve
12.259 g K2Cr2O7, primary standard grade, previously dried at 150C for 2
hours, in distilled water and dilute to 1000 mL.
Sulfuric acid reagent: Dissolve 5.5 g Ag2SO4 per kg of H2SO4. Let Stand 1
or 2 days to dissolve.
Ferroin indicator solution: 1.485 g 1, 10 phenanthroline monohydrate 0.695
g FeSO4.7H2Oin distill water and dilute to 100 mL.
Standard ferrous ammonium sulfate (FAS) titrant, approx. 0.25 M:
Dissolve 98g Fe(NH4)2(SO4)2.6H2O in distill water. Add 20 mL H2SO4, cool,
and dilute to 1000 mL. Standardize this solution against K2Cr2O7 as follows:
Dilute 25.0 mL standard K2Cr2O7 to about 100 mL. Add 30 mL conc.
Sulfuric Acid and cool. Titrate with FAS titrant using 0.10 or 0.15 mL (2 or

Section 2 of Chapter 2 Standard Operating Procedures for Testing and Analysis
Technical Report – Submission 5.1 Page No 100
3 drops ) of Ferroin indicator.
Mercuric sulfate HgSO4 crystal or powder
Potassium hydrogen phthalate (KHP) standard, HOOCC6H4COOK:
Lightly crush and then dry KHP to constant weight at 110C Dissolve 0.425 g
in distilled water and dilute to 1000 mL. KHP has a theoretical COD of
0.001176 g O2/mg and this solution has a theoretical COD of 500 µg O2/mL.
This solution is stable when refrigerated, but not indefinitely. Be alert to
development of visible biological growth. If practical, prepare and transfer
solution under sterile conditions. Weekly preparation usually is satisfactory.
Procedure 1. Treatment of sample with COD of>50 mg O2/L: Blend sample if necessary
and pipet 50 mL into a 500 mL refluxing flask. For a sample with COD
of>900 mg O2/L, use a small portion diluted to 50 mL.
2. Add 1 g HgSO4 several glass beads and very slowly add 5.0 mL sulfuric acid
reagent with mixing to dissolve mercuric sulfate. Cool while mixing to avoid
possible loss of volatile material.
3. Add 25.0 mL 0.25 N potassium dichromate solution and mix. Attach flask to
condenser and turn on cooling water.
4. Add remaining sulfuric acid reagent (70 mL) through open end of condenser.
Continue swirling and mixing while adding sulfuric acid reagent.
5. Note: Mix reflux mixture thoroughly before applying heat to prevent local
heating of flask bottom and a possible blowout of flask contents.
6. Cover open end of condenser with a small beaker to prevent foreign material
from entering refluxing mixture and reflux for 2 h. Cool and wash down
condenser with distilled water.
7. Disconnect reflux condenser and dilute mixture to about twice its volume
with distilled water.
8. Cool to room temperature and titrate excess K2Cr2O7 with FAS, using 0.10 to
0.15 mL (2 to 3 drops) ferroin indicator. Although the quantity of ferroin
indicator is not critical, use the same volume for all titrations.
9. Take as the end point of the titration the first sharp color change from blue-
green to reddish brown that persists for 1 min or longer.
10. Duplicate determinations should agree within 5% of their average.
11. The blue-green may reappear. In the same manner, reflux and titrate a blank
containing the reagents and a volume of distilled water equal to that of
sample.
Calculations
& Report COD as mg/L =
(A − B) ∗ M ∗ 8,000
sample vol (mL)
Where,
A = mL FAS used for blank
B = mL FAS used for sample
M = Molarity of FAS
8000 = milli equivalent weight of Oxygen * 1000 mL/L
vi. Standard Operating Procedure for Chlorides (Cl-)
Scope This method describes the determination of Chlorides in water/wastewater.
Principle In a neutral or slightly alkaline solution, potassium chromate can indicate the end
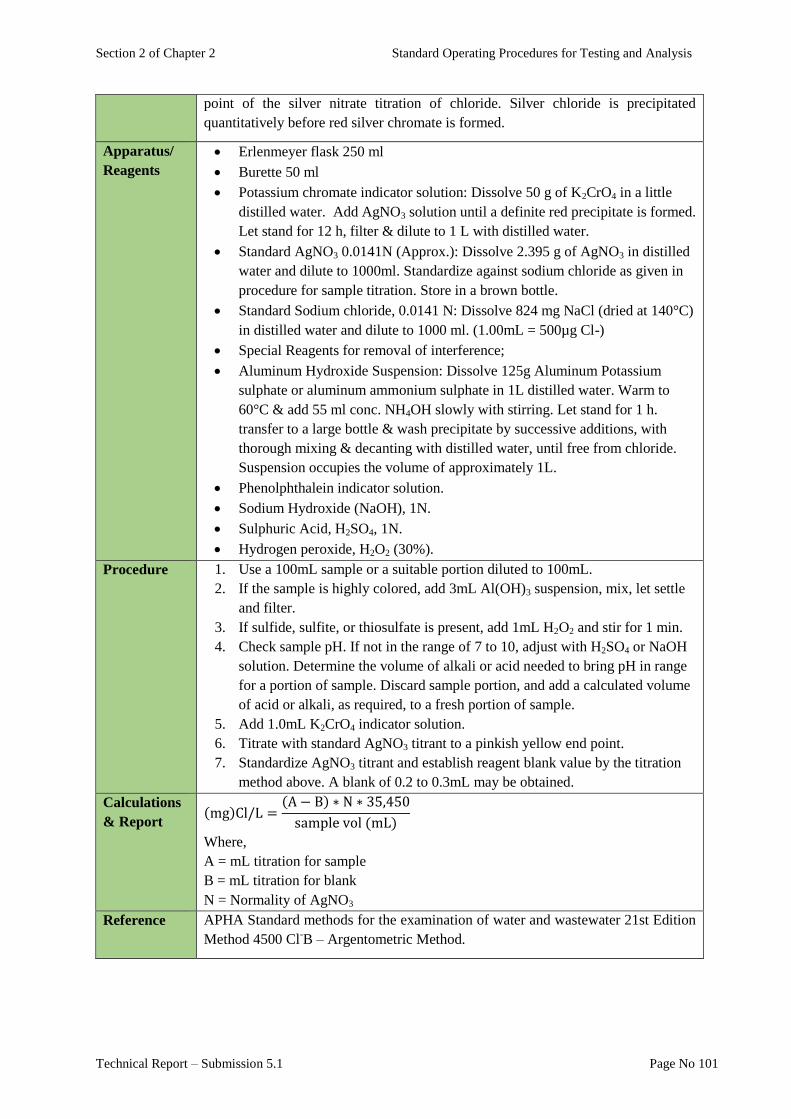
Section 2 of Chapter 2 Standard Operating Procedures for Testing and Analysis
Technical Report – Submission 5.1 Page No 101
point of the silver nitrate titration of chloride. Silver chloride is precipitated
quantitatively before red silver chromate is formed.
Apparatus/
Reagents
Erlenmeyer flask 250 ml
Burette 50 ml
Potassium chromate indicator solution: Dissolve 50 g of K2CrO4 in a little
distilled water. Add AgNO3 solution until a definite red precipitate is formed.
Let stand for 12 h, filter & dilute to 1 L with distilled water.
Standard AgNO3 0.0141N (Approx.): Dissolve 2.395 g of AgNO3 in distilled
water and dilute to 1000ml. Standardize against sodium chloride as given in
procedure for sample titration. Store in a brown bottle.
Standard Sodium chloride, 0.0141 N: Dissolve 824 mg NaCl (dried at 140°C)
in distilled water and dilute to 1000 ml. (1.00mL = 500µg Cl-)
Special Reagents for removal of interference;
Aluminum Hydroxide Suspension: Dissolve 125g Aluminum Potassium
sulphate or aluminum ammonium sulphate in 1L distilled water. Warm to
60°C & add 55 ml conc. NH4OH slowly with stirring. Let stand for 1 h.
transfer to a large bottle & wash precipitate by successive additions, with
thorough mixing & decanting with distilled water, until free from chloride.
Suspension occupies the volume of approximately 1L.
Phenolphthalein indicator solution.
Sodium Hydroxide (NaOH), 1N.
Sulphuric Acid, H2SO4, 1N.
Hydrogen peroxide, H2O2 (30%).
Procedure 1. Use a 100mL sample or a suitable portion diluted to 100mL.
2. If the sample is highly colored, add 3mL Al(OH)3 suspension, mix, let settle
and filter.
3. If sulfide, sulfite, or thiosulfate is present, add 1mL H2O2 and stir for 1 min.
4. Check sample pH. If not in the range of 7 to 10, adjust with H2SO4 or NaOH
solution. Determine the volume of alkali or acid needed to bring pH in range
for a portion of sample. Discard sample portion, and add a calculated volume
of acid or alkali, as required, to a fresh portion of sample.
5. Add 1.0mL K2CrO4 indicator solution.
6. Titrate with standard AgNO3 titrant to a pinkish yellow end point.
7. Standardize AgNO3 titrant and establish reagent blank value by the titration
method above. A blank of 0.2 to 0.3mL may be obtained.
Calculations
& Report (mg)Cl/L =
(A − B) ∗ N ∗ 35,450
sample vol (mL)
Where,
A = mL titration for sample
B = mL titration for blank
N = Normality of AgNO3
Reference APHA Standard methods for the examination of water and wastewater 21st Edition
Method 4500 Cl-B – Argentometric Method.
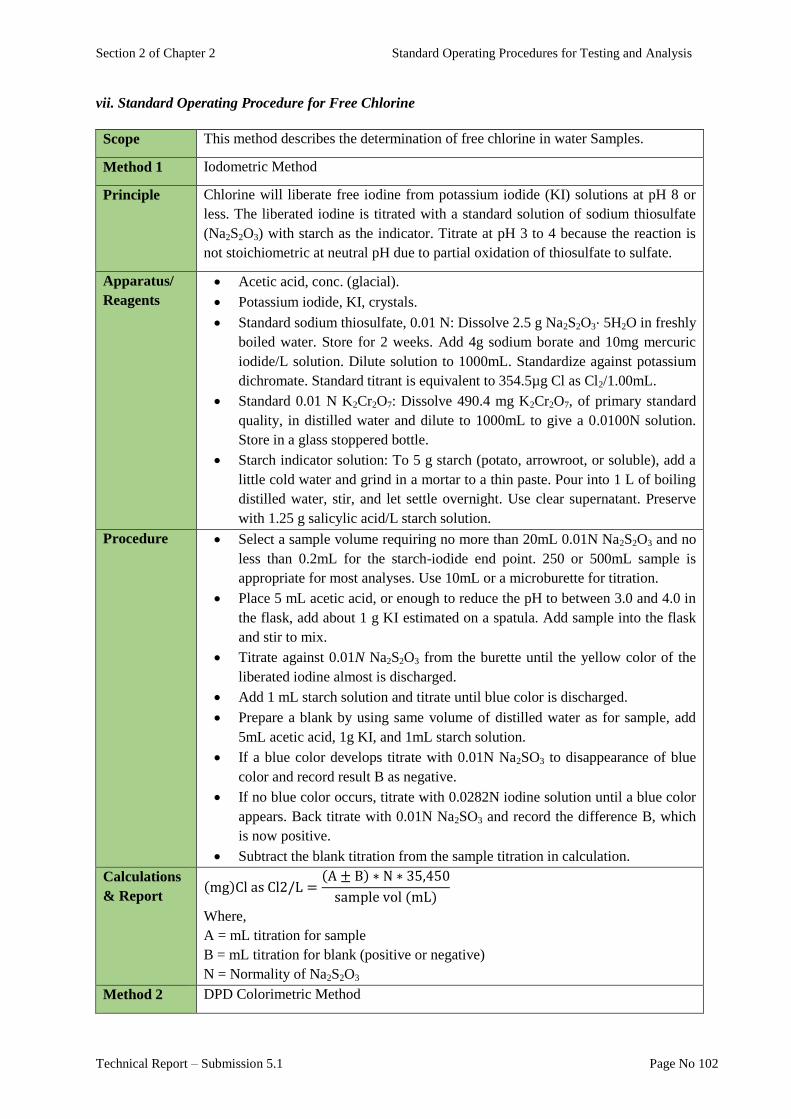
Section 2 of Chapter 2 Standard Operating Procedures for Testing and Analysis
Technical Report – Submission 5.1 Page No 102
vii. Standard Operating Procedure for Free Chlorine
Scope This method describes the determination of free chlorine in water Samples.
Method 1 Iodometric Method
Principle Chlorine will liberate free iodine from potassium iodide (KI) solutions at pH 8 or
less. The liberated iodine is titrated with a standard solution of sodium thiosulfate
(Na2S2O3) with starch as the indicator. Titrate at pH 3 to 4 because the reaction is
not stoichiometric at neutral pH due to partial oxidation of thiosulfate to sulfate.
Apparatus/
Reagents
Acetic acid, conc. (glacial).
Potassium iodide, KI, crystals.
Standard sodium thiosulfate, 0.01 N: Dissolve 2.5 g Na2S2O3⋅ 5H2O in freshly
boiled water. Store for 2 weeks. Add 4g sodium borate and 10mg mercuric
iodide/L solution. Dilute solution to 1000mL. Standardize against potassium
dichromate. Standard titrant is equivalent to 354.5µg Cl as Cl2/1.00mL.
Standard 0.01 N K2Cr2O7: Dissolve 490.4 mg K2Cr2O7, of primary standard
quality, in distilled water and dilute to 1000mL to give a 0.0100N solution.
Store in a glass stoppered bottle.
Starch indicator solution: To 5 g starch (potato, arrowroot, or soluble), add a
little cold water and grind in a mortar to a thin paste. Pour into 1 L of boiling
distilled water, stir, and let settle overnight. Use clear supernatant. Preserve
with 1.25 g salicylic acid/L starch solution.
Procedure Select a sample volume requiring no more than 20mL 0.01N Na2S2O3 and no
less than 0.2mL for the starch-iodide end point. 250 or 500mL sample is
appropriate for most analyses. Use 10mL or a microburette for titration.
Place 5 mL acetic acid, or enough to reduce the pH to between 3.0 and 4.0 in
the flask, add about 1 g KI estimated on a spatula. Add sample into the flask
and stir to mix.
Titrate against 0.01N Na2S2O3 from the burette until the yellow color of the
liberated iodine almost is discharged.
Add 1 mL starch solution and titrate until blue color is discharged.
Prepare a blank by using same volume of distilled water as for sample, add
5mL acetic acid, 1g KI, and 1mL starch solution.
If a blue color develops titrate with 0.01N Na2SO3 to disappearance of blue
color and record result B as negative.
If no blue color occurs, titrate with 0.0282N iodine solution until a blue color
appears. Back titrate with 0.01N Na2SO3 and record the difference B, which
is now positive.
Subtract the blank titration from the sample titration in calculation.
Calculations
& Report (mg)Cl as Cl2/L =
(A ± B) ∗ N ∗ 35,450
sample vol (mL)
Where,
A = mL titration for sample
B = mL titration for blank (positive or negative)
N = Normality of Na2S2O3
Method 2 DPD Colorimetric Method

Section 2 of Chapter 2 Standard Operating Procedures for Testing and Analysis
Technical Report – Submission 5.1 Page No 103
Principle Chlorine-containing samples are reacted with N, N-diethyl-p-phenylenediamine to
produce a color which can be measured by a spectrophotometer at 515nm. The
sample absorbance value is compared to a standard series curve to give total
chlorine content of sample.
Apparatus/
Reagents
Spectrophotometer, for use at 515nm and providing a light path of 1cm.
Phosphate buffer solution: Dissolve 24 g anhydrous Na2HPO4 and 46 g
anhydrous KH2PO4 in distilled water. Combine with 100 mL distilled water
in which 800 mg disodium ethylenediamine tetraacetate dihydrate (EDTA)
have been dissolved. Dilute to 1 L with distilled water. Add 20mg HgCl2 to
prevent mold growth.
N,N-Diethyl-p-phenylenediamine (DPD) indicator solution: Dissolve 1 g
DPD oxalate chlorine-free distilled water containing 8 mL 1 + 3 H2SO4 and
200 mg disodium EDTA. Make up to 1 L, store in a brown glass-stoppered
bottle in the dark, and discard when discolored. Periodically check solution
blank for absorbance and discard when absorbance at 515 nm exceeds
0.002/cm.
Chlorine water
Potassium iodide, KI, crystals.
Chlorine demand free water: Prepare from deionized water by adding
sufficient chlorine to give 5mg/L free chlorine. Let stand for 2 days. The
solution should contain at least 2mg/L free chlorine. If not, discard and obtain
further pure water until it passes this check. Remove remaining free chlorine
by placing container in sunlight or irradiating with an ultraviolet lamp. After
several hours, take sample, add KI, and measure total chlorine. Do not use
before all chlorine has been removed
Procedure 1. Prepare standard series by either of the following two methods.
2. Standard series preparation method 1.
Standardize about 100mg/L chlorine water as follows: Place 2mL acetic
acid and 10 to 25mL chlorine demand free water in a flask. Add about 1 g
KI. Measure into the flask a suitable volume of chlorine solution. In
choosing a convenient volume, note that 1mL 0.025N Na2SO3 titrant is
equivalent to 0.9mg chlorine. (100mL may be appropriate). Titrate with
standardized 0.025N Na2SO3 titrant until the yellow iodine colour almost
disappears. Add 1 to 2mL starch indicator solution and continue titration
till disappearance of blue color. Determine the blank by adding identical
quantities of acid, KI, and starch indicator to a volume of chlorine demand
free water corresponding to the sample used for titration. Calculate the
chlorine concentration by using the formula;
(mg)Cl as Cl2/mL =(A ± B) ∗ N ∗ 35.45
sample vol (mL)
Where,
A = mL titration for sample
B = mL titration for blank (positive or negative)
N = Normality of Na2S2O3
Use chlorine free water and glassware to prepare standard solutions from
the standardized 100mg/L chlorine solution ranging from 0.05 to 4mg/L

Section 2 of Chapter 2 Standard Operating Procedures for Testing and Analysis
Technical Report – Submission 5.1 Page No 104
chlorine as follows:
For about 0.05mg/L chlorine standard solution, dilute 1mL stock solution
to 100mL. (1.0mg/L standard solution). Further dilute 5mL of this solution
to 100mL. (0.05mg/L standard solution).
For about 0.1mL chlorine standard solution, dilute 10mL of 1mg/L
standard to 100mL.
For 2mg/L chlorine standard solution, dilute 2mL stock solution to 100mL.
For 4mg/L chlorine standard solution, dilute 4mL stock solution to 100mL.
Into five tubes, place 0.5mL phosphate buffer solution followed by 0.5mL
DPD indicator reagent each.
Add 10mL from each standard chlorine solution to one of the tubes with
through mixing.
Read in spectrophotometer at 515nm and record absorbance of each
standard solution.
3. Standard series preparation method 2.
Prepare a stock solution containing 891mg KMNO4/1000mL. Dilute
10.00mL stock solution to 100mL with distilled water in a volumetric flask.
(First Dilution). When 1mL of this solution is diluted to 100mL with
distilled water, a chlorine equivalent of 1.00mg/L is produced in the DPD
reaction. Prepare a series of standard solutions from the first dilution as
provided for in preparation of standard series method 1 above, ranging
from 0.05 to 4mg/L chlorine equivalent.
Into five tubes, place 0.5mL phosphate buffer solution followed by 0.5mL
DPD indicator reagent each.
Add 10mL from each standard chlorine solution to one of the tubes with
through mixing.
Read in spectrophotometer at 515nm and record absorbance of each
standard solution.
4. If the sample has expected chlorine concentration greater than 4mg/L, dilute
with chorine demand free water appropriately to bring sample concentration in
the measurement range of calibration standard solutions.
5. Place 0.5mL each of buffer solution and DPD indicator reagent in a test tube.
6. Add about 0.1g KI and mix.
7. Add 10mL sample and mix.
8. Read absorbance of this solution after 2minutes in spectrophotometer at
515nm.
9. Construct a calibration curve from the standard solution series, whichever is
employed, and from the absorbance of sample solution, compute the
concentration of sample solution from the calibration curve.
Calculations
& Report
From the calibration curve
Reference APHA Standard methods for the examination of water and wastewater 21st Edition
Method 4500 Cl B – Iodometric Method I, and Method 4500 Cl G – DPD
Colorimetric Method.
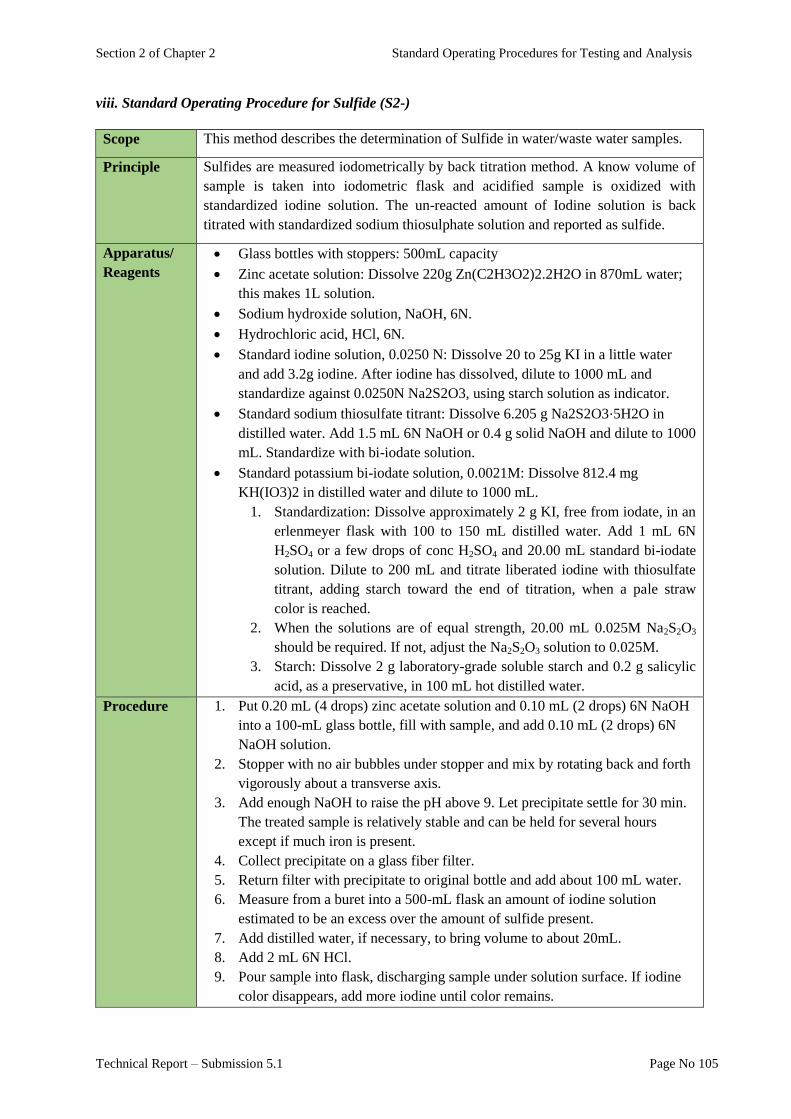
Section 2 of Chapter 2 Standard Operating Procedures for Testing and Analysis
Technical Report – Submission 5.1 Page No 105
viii. Standard Operating Procedure for Sulfide (S2-)
Scope This method describes the determination of Sulfide in water/waste water samples.
Principle Sulfides are measured iodometrically by back titration method. A know volume of
sample is taken into iodometric flask and acidified sample is oxidized with
standardized iodine solution. The un-reacted amount of Iodine solution is back
titrated with standardized sodium thiosulphate solution and reported as sulfide.
Apparatus/
Reagents
Glass bottles with stoppers: 500mL capacity
Zinc acetate solution: Dissolve 220g Zn(C2H3O2)2.2H2O in 870mL water;
this makes 1L solution.
Sodium hydroxide solution, NaOH, 6N.
Hydrochloric acid, HCl, 6N.
Standard iodine solution, 0.0250 N: Dissolve 20 to 25g KI in a little water
and add 3.2g iodine. After iodine has dissolved, dilute to 1000 mL and
standardize against 0.0250N Na2S2O3, using starch solution as indicator.
Standard sodium thiosulfate titrant: Dissolve 6.205 g Na2S2O3⋅5H2O in
distilled water. Add 1.5 mL 6N NaOH or 0.4 g solid NaOH and dilute to 1000
mL. Standardize with bi-iodate solution.
Standard potassium bi-iodate solution, 0.0021M: Dissolve 812.4 mg
KH(IO3)2 in distilled water and dilute to 1000 mL.
1. Standardization: Dissolve approximately 2 g KI, free from iodate, in an
erlenmeyer flask with 100 to 150 mL distilled water. Add 1 mL 6N
H2SO4 or a few drops of conc H2SO4 and 20.00 mL standard bi-iodate
solution. Dilute to 200 mL and titrate liberated iodine with thiosulfate
titrant, adding starch toward the end of titration, when a pale straw
color is reached.
2. When the solutions are of equal strength, 20.00 mL 0.025M Na2S2O3
should be required. If not, adjust the Na2S2O3 solution to 0.025M.
3. Starch: Dissolve 2 g laboratory-grade soluble starch and 0.2 g salicylic
acid, as a preservative, in 100 mL hot distilled water.
Procedure 1. Put 0.20 mL (4 drops) zinc acetate solution and 0.10 mL (2 drops) 6N NaOH
into a 100-mL glass bottle, fill with sample, and add 0.10 mL (2 drops) 6N
NaOH solution.
2. Stopper with no air bubbles under stopper and mix by rotating back and forth
vigorously about a transverse axis.
3. Add enough NaOH to raise the pH above 9. Let precipitate settle for 30 min.
The treated sample is relatively stable and can be held for several hours
except if much iron is present.
4. Collect precipitate on a glass fiber filter.
5. Return filter with precipitate to original bottle and add about 100 mL water.
6. Measure from a buret into a 500-mL flask an amount of iodine solution
estimated to be an excess over the amount of sulfide present.
7. Add distilled water, if necessary, to bring volume to about 20mL.
8. Add 2 mL 6N HCl.
9. Pour sample into flask, discharging sample under solution surface. If iodine
color disappears, add more iodine until color remains.

Section 2 of Chapter 2 Standard Operating Procedures for Testing and Analysis
Technical Report – Submission 5.1 Page No 106
10. Back-titrate with Na2S2O3 solution, adding a few drops of starch solution as
end point is approached, and continuing until blue color disappears.
Calculations
& Report (mg)Cl/L =
[(A ∗ B) ∗ (C ∗ D)] ∗ 16,000
sample vol (mL)
Where,
A = mL Iodine solution
B = Normality of Iodine solution
C = mL Na2S2O3 solution
D = Normality of Na2S2O3 solution
Reference APHA Standard methods for the examination of water and wastewater 21st Edition
Method 4500 – S2-
– C – Sample Pretreatment to Remove Interfering Substances or
to Concentrate the Sulfide, Method 4500 – S2-
– F - Iodometric Method.
ix. Standard Operating Procedure for Ammonia (NH3)
Scope This method is applicable to the measurement of NH3-N/L in potable and surface
waters and domestic and industrial wastes. High concentrations of dissolved ions
affect the measurement, but color and turbidity do not. Sample distillation is
necessary.
Principle The distillation and titration procedure is used especially for NH3-N concentrations
greater than 5 mg/L. Boric acid is used as the absorbent following distillation if the
distillate is to be titrated.
Apparatus/
Reagents
Distillation apparatus: Arrange a borosilicate glass flask of 800- to 2000-
mL capacity attached to a vertical condenser so that the outlet tip may be
submerged below the surface of the receiving acid solution. Use an all-
borosilicate-glass apparatus or one with condensing units constructed of
block tin or aluminum tubes.
pH meter
Ammonia-free water: Prepare by ion-exchange or distillation methods:
1. Ion exchange—Prepare ammonia-free water by passing distilled water
through an ion-exchange column containing a strongly acidic cation-
exchange resin mixed with a strongly basic anion-exchange resin. Select
resins that will remove organic compounds that interfere with the ammonia
determination. Some anion-exchange resins tend to release ammonia. If this
occurs, prepare ammonia-free water with a strongly acidic cation-exchange
resin. Regenerate the column according to the manufacturer’s instructions.
Check ammonia-free water for the possibility of a high blank value.
2. Distillation—Eliminate traces of ammonia in distilled water by adding 0.1
mL conc H2SO4 to 1 L distilled water and redistilling. Alternatively, treat
distilled water with sufficient bromine or chlorine water to produce a free
halogen residual of 2 to 5 mg/ L and redistill after standing at least 1 h.
Discard the first 100 mL distillate. Check redistilled water for the
possibility of a high blank. It is very difficult to store ammonia-free water
in the laboratory without contamination from gaseous ammonia. However,
if storage is necessary, store in a tightly stoppered glass container to which
is added about 10 g ion-exchange resin (preferably a strongly acidic cation-
exchange resin)/L ammonia-free water. For use, let resin settle and decant
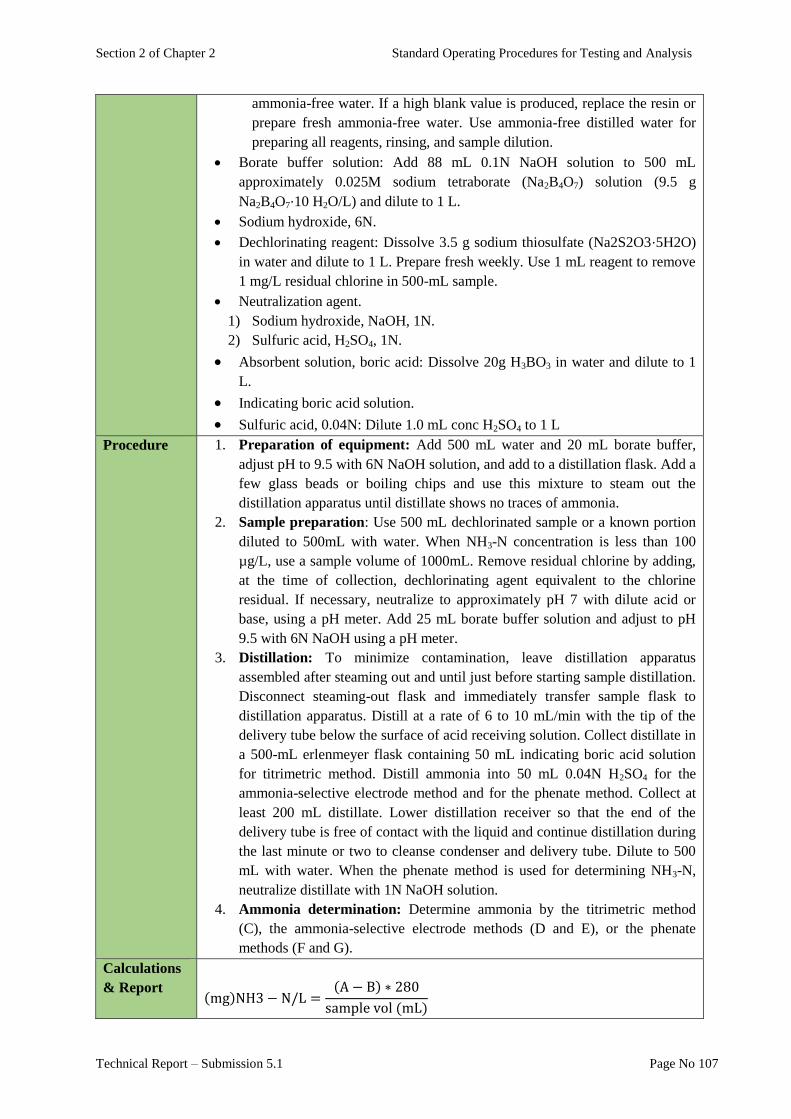
Section 2 of Chapter 2 Standard Operating Procedures for Testing and Analysis
Technical Report – Submission 5.1 Page No 107
ammonia-free water. If a high blank value is produced, replace the resin or
prepare fresh ammonia-free water. Use ammonia-free distilled water for
preparing all reagents, rinsing, and sample dilution.
Borate buffer solution: Add 88 mL 0.1N NaOH solution to 500 mL
approximately 0.025M sodium tetraborate (Na2B4O7) solution (9.5 g
Na2B4O7⋅10 H2O/L) and dilute to 1 L.
Sodium hydroxide, 6N.
Dechlorinating reagent: Dissolve 3.5 g sodium thiosulfate (Na2S2O3⋅5H2O)
in water and dilute to 1 L. Prepare fresh weekly. Use 1 mL reagent to remove
1 mg/L residual chlorine in 500-mL sample.
Neutralization agent.
1) Sodium hydroxide, NaOH, 1N.
2) Sulfuric acid, H2SO4, 1N.
Absorbent solution, boric acid: Dissolve 20g H3BO3 in water and dilute to 1
L.
Indicating boric acid solution.
Sulfuric acid, 0.04N: Dilute 1.0 mL conc H2SO4 to 1 L
Procedure 1. Preparation of equipment: Add 500 mL water and 20 mL borate buffer,
adjust pH to 9.5 with 6N NaOH solution, and add to a distillation flask. Add a
few glass beads or boiling chips and use this mixture to steam out the
distillation apparatus until distillate shows no traces of ammonia.
2. Sample preparation: Use 500 mL dechlorinated sample or a known portion
diluted to 500mL with water. When NH3-N concentration is less than 100
µg/L, use a sample volume of 1000mL. Remove residual chlorine by adding,
at the time of collection, dechlorinating agent equivalent to the chlorine
residual. If necessary, neutralize to approximately pH 7 with dilute acid or
base, using a pH meter. Add 25 mL borate buffer solution and adjust to pH
9.5 with 6N NaOH using a pH meter.
3. Distillation: To minimize contamination, leave distillation apparatus
assembled after steaming out and until just before starting sample distillation.
Disconnect steaming-out flask and immediately transfer sample flask to
distillation apparatus. Distill at a rate of 6 to 10 mL/min with the tip of the
delivery tube below the surface of acid receiving solution. Collect distillate in
a 500-mL erlenmeyer flask containing 50 mL indicating boric acid solution
for titrimetric method. Distill ammonia into 50 mL 0.04N H2SO4 for the
ammonia-selective electrode method and for the phenate method. Collect at
least 200 mL distillate. Lower distillation receiver so that the end of the
delivery tube is free of contact with the liquid and continue distillation during
the last minute or two to cleanse condenser and delivery tube. Dilute to 500
mL with water. When the phenate method is used for determining NH3-N,
neutralize distillate with 1N NaOH solution.
4. Ammonia determination: Determine ammonia by the titrimetric method
(C), the ammonia-selective electrode methods (D and E), or the phenate
methods (F and G).
Calculations
& Report
(mg)NH3 − N/L =(A − B) ∗ 280
sample vol (mL)
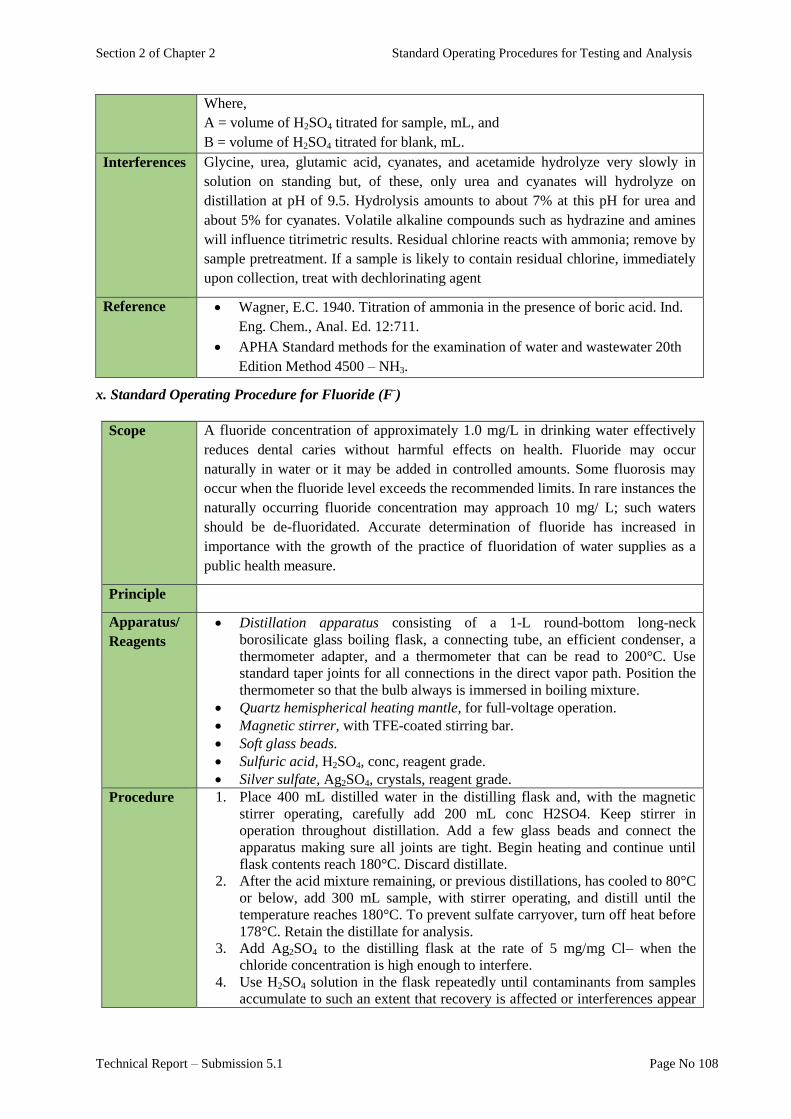
Section 2 of Chapter 2 Standard Operating Procedures for Testing and Analysis
Technical Report – Submission 5.1 Page No 108
Where,
A = volume of H2SO4 titrated for sample, mL, and
B = volume of H2SO4 titrated for blank, mL.
Interferences Glycine, urea, glutamic acid, cyanates, and acetamide hydrolyze very slowly in
solution on standing but, of these, only urea and cyanates will hydrolyze on
distillation at pH of 9.5. Hydrolysis amounts to about 7% at this pH for urea and
about 5% for cyanates. Volatile alkaline compounds such as hydrazine and amines
will influence titrimetric results. Residual chlorine reacts with ammonia; remove by
sample pretreatment. If a sample is likely to contain residual chlorine, immediately
upon collection, treat with dechlorinating agent
Reference Wagner, E.C. 1940. Titration of ammonia in the presence of boric acid. Ind.
Eng. Chem., Anal. Ed. 12:711.
APHA Standard methods for the examination of water and wastewater 20th
Edition Method 4500 – NH3.
x. Standard Operating Procedure for Fluoride (F-)
Scope A fluoride concentration of approximately 1.0 mg/L in drinking water effectively
reduces dental caries without harmful effects on health. Fluoride may occur
naturally in water or it may be added in controlled amounts. Some fluorosis may
occur when the fluoride level exceeds the recommended limits. In rare instances the
naturally occurring fluoride concentration may approach 10 mg/ L; such waters
should be de-fluoridated. Accurate determination of fluoride has increased in
importance with the growth of the practice of fluoridation of water supplies as a
public health measure.
Principle
Apparatus/
Reagents
Distillation apparatus consisting of a 1-L round-bottom long-neck
borosilicate glass boiling flask, a connecting tube, an efficient condenser, a
thermometer adapter, and a thermometer that can be read to 200°C. Use
standard taper joints for all connections in the direct vapor path. Position the
thermometer so that the bulb always is immersed in boiling mixture.
Quartz hemispherical heating mantle, for full-voltage operation.
Magnetic stirrer, with TFE-coated stirring bar.
Soft glass beads.
Sulfuric acid, H2SO4, conc, reagent grade.
Silver sulfate, Ag2SO4, crystals, reagent grade.
Procedure 1. Place 400 mL distilled water in the distilling flask and, with the magnetic
stirrer operating, carefully add 200 mL conc H2SO4. Keep stirrer in
operation throughout distillation. Add a few glass beads and connect the
apparatus making sure all joints are tight. Begin heating and continue until
flask contents reach 180°C. Discard distillate.
2. After the acid mixture remaining, or previous distillations, has cooled to 80°C
or below, add 300 mL sample, with stirrer operating, and distill until the
temperature reaches 180°C. To prevent sulfate carryover, turn off heat before
178°C. Retain the distillate for analysis.
3. Add Ag2SO4 to the distilling flask at the rate of 5 mg/mg Cl– when the
chloride concentration is high enough to interfere.
4. Use H2SO4 solution in the flask repeatedly until contaminants from samples
accumulate to such an extent that recovery is affected or interferences appear
Section 2 of Chapter 2 Standard Operating Procedures for Testing and Analysis
Technical Report – Submission 5.1 Page No 109
in the distillate. Check acid suitability periodically by distilling standard
fluoride samples and analyzing for both fluoride and sulfate. After distilling
samples containing more than 3 mg F–/L, flush still by adding 300 mL
distilled water, redistill, and combine the two fluoride distillates. If necessary,
repeat flushing until the fluoride content of the last distillate is at a minimum.
Include additional fluoride recovered with that of the first distillation. After
periods of inactivity, similarly flush still and discard distillate.
Calculations
& Report
The recovery of fluoride is quantitative within the accuracy of the methods used for
its measurement.
Reference APHA Standard methods for the examination of water and wastewater 20th
Edition Method 4500 – F- B.
xi. Standard Operating Procedure for Cyanide (CN-) Total
Scope “Cyanide” refers to all of the CN groups in cyanide compounds that can be
determined as the cyanide ion; CN–. The great toxicity to aquatic life of molecular
HCN is well known; it is formed in solutions of cyanide by hydrolytic reaction of
CN– with water. When total cyanide is determined, the almost nondissociable
cyanides, as well as cyanide bound in complexes that are readily dissociable and
complexes of intermediate stability, are measured preferably using the titrimetric
method.
Principle CN– in the alkaline distillate from the preliminary treatment procedure is
titrated with standard silver nitrate (AgNO3) to form the soluble cyanide complex,
Ag(CN)2–
. As soon as all CN– has been complexed and a small excess of Ag
+ has
been added, the excess Ag+ is detected by the silver-sensitive indicator, p-
dimethylaminobenzalrhodanine, which immediately turns from a yellow to a
salmon color. The distillation has provided a 2:1
concentration. The indicator is sensitive to about 0.1 mg Ag/L.
Apparatus/
Reagents
microburet, 10-mL capacity.
Indicator solution: Dissolve 20 mg p-dimethylaminobenzalrhodanine in 100
mL acetone.
Standard silver nitrate titrant: Dissolve 3.27 g AgNO3 in 1 L distilled water.
Standardize against standard NaCl solution, using the argentometric method
with K2CrO4 indicator, as directed in Chloride, Section 4500-Cl–.B. Dilute
500 mL AgNO3 solution according to the titer found so that 1.00 mL is
equivalent to 1.00 mg CN–.
Sodium hydroxide dilution solution: Dissolve 1.6 g NaOH in 1 L distilled
water.
Procedure 1. From the absorption solution take a measured volume of sample so that the
titration will require approximately 1 to 10 mL AgNO3 titrant. Dilute to 100
mL using the NaOH dilution solution or to some other convenient volume to
be used for all titrations. For samples with low cyanide concentration (≤5
mg/L) do not dilute. Add 0.5 mL indicator solution.
2. Titrate with standard AgNO3 titrant to the first change in color from a canary
yellow to a salmon hue. Titrate a blank containing the same amount of alkali
and water, i.e., 100 mL NaOH dilution solution (or volume used for sample).
As the analyst becomes accustomed to the end point, blank titrations decrease
from the high values usually experienced in the first few trials to 1 drop or
less, with a corresponding improvement in precision.

Section 2 of Chapter 2 Standard Operating Procedures for Testing and Analysis
Technical Report – Submission 5.1 Page No 110
Calculations
& Report (mg)NH3 − N/L =
(A − B) ∗ 280
sample vol (mL)
Where,
A = mL standard AgNO3 for sample and
B = mL standard AgNO3 for blank.
Reference Ryan, J.A. & Gulshaw, G.W. (1944) The use of p-dimethylaminobenzylidene
rhodamine as an indicator for the volumetric determination of cyanides.
Analyst 69:370.
American Society For Testing & Materials (1987) Research Rep. D2036:19-
1131. American Soc. Testing & Materials, Philadelphia, Pa.
APHA Standard methods for the examination of water and wastewater 20th
Edition Method 4500 – CN- D.
2.AMBIENT AIR AND GASEOUS EMISSIONS
The Air pointer R (manual version 2.11 T) would be used for taking measurements and readings for
ambient air quality. This consists of the base unit and depending on the configuration of several gas
modules plus a meteorology and communication unit as previously described in Section 1 of Chapter
2. The equipment used for monitoring and measurements of stack emissions/ gaseous emissions
includes:
1. Gas Badge Plus Personal Gas Monitor (CO) 5 Instrument Manual
2. SIBATA Air sampler
3. AirMetrics Mini volume air sampler
4. RAAS volume Sampler; whose manuals would be used for their operation and calibration in
field.
In addition to the parameters listed there, the following parameters would be measured for ambient air
and gaseous emissions.
Sr. No Parameter
1. Smoke
2. Particulate matter; (PM10), (PM2.5) and (SPM)
3. Hydrogen Chloride (HCl)
4. Chlorine (Cl2)
5. Hydrogen Fluoride (HF)
6. Hydrogen Sulphide (H2S)
7. Sulphur oxides; Sulfur Dioxide (SO2)
8. Carbon Monoxide (CO)
9. Lead (Pb)
10. Mercury (Hg)
11. Cadmium (Cd)
12. Arsenic (As)
13. Copper (Cu)
14. Antimony (Sb)
15. Zinc (Zn)
16. Oxides of Nitrogen; (NO) and (NO2)
17. Ozone (O3)
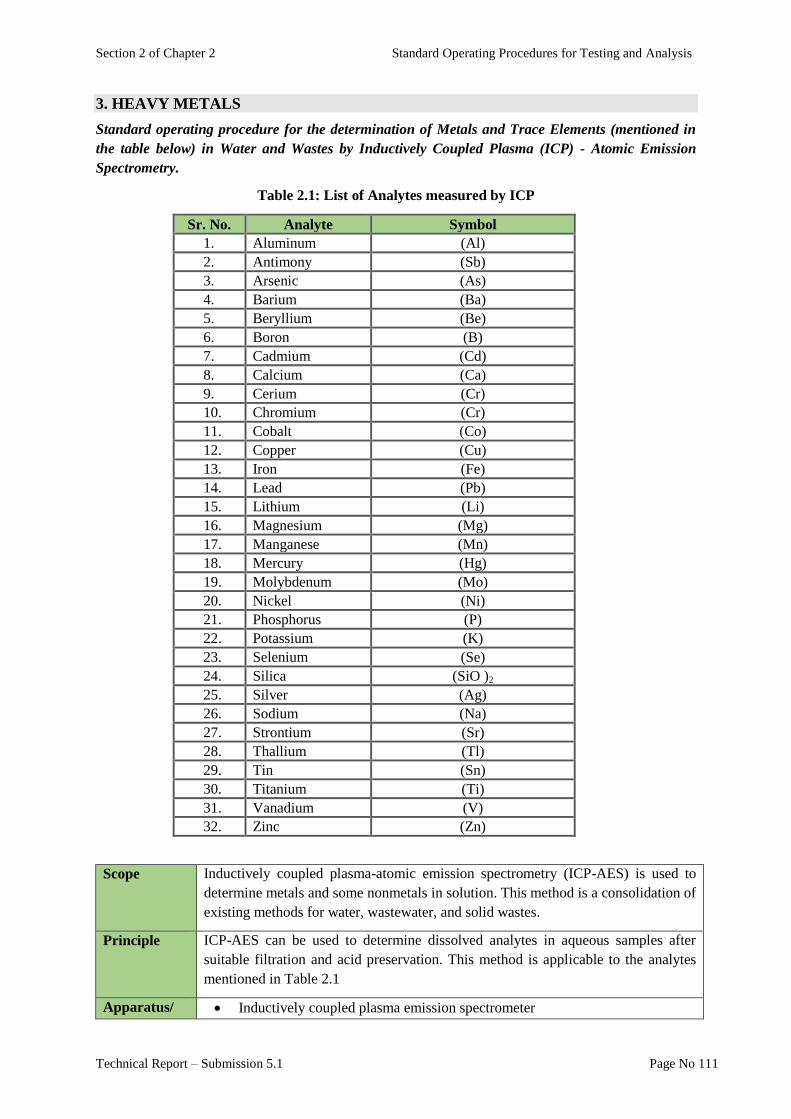
Section 2 of Chapter 2 Standard Operating Procedures for Testing and Analysis
Technical Report – Submission 5.1 Page No 111
3. HEAVY METALS
Standard operating procedure for the determination of Metals and Trace Elements (mentioned in
the table below) in Water and Wastes by Inductively Coupled Plasma (ICP) - Atomic Emission
Spectrometry.
Table 2.1: List of Analytes measured by ICP
Sr. No. Analyte Symbol
1. Aluminum (Al)
2. Antimony (Sb)
3. Arsenic (As)
4. Barium (Ba)
5. Beryllium (Be)
6. Boron (B)
7. Cadmium (Cd)
8. Calcium (Ca)
9. Cerium (Cr)
10. Chromium (Cr)
11. Cobalt (Co)
12. Copper (Cu)
13. Iron (Fe)
14. Lead (Pb)
15. Lithium (Li)
16. Magnesium (Mg)
17. Manganese (Mn)
18. Mercury (Hg)
19. Molybdenum (Mo)
20. Nickel (Ni)
21. Phosphorus (P)
22. Potassium (K)
23. Selenium (Se)
24. Silica (SiO )2
25. Silver (Ag)
26. Sodium (Na)
27. Strontium (Sr)
28. Thallium (Tl)
29. Tin (Sn)
30. Titanium (Ti)
31. Vanadium (V)
32. Zinc (Zn)
Scope Inductively coupled plasma-atomic emission spectrometry (ICP-AES) is used to
determine metals and some nonmetals in solution. This method is a consolidation of
existing methods for water, wastewater, and solid wastes.
Principle ICP-AES can be used to determine dissolved analytes in aqueous samples after
suitable filtration and acid preservation. This method is applicable to the analytes
mentioned in Table 2.1
Apparatus/ Inductively coupled plasma emission spectrometer

Section 2 of Chapter 2 Standard Operating Procedures for Testing and Analysis
Technical Report – Submission 5.1 Page No 112
Reagents Analytical balance, with capability to measure to 0.1 mg, for use in weighing
solids, for preparing standards, and for determining dissolved solids in digests
or extracts.
A temperature adjustable hot plate capable of maintaining a temperature of
95°C.
A temperature adjustable block digester capable of maintaining a temperature
of 95°C and equipped with 250 mL constricted digestion tubes.
A gravity convection drying oven with thermostatic control capable of
maintaining 180°C ± 5°C.
Mortar and pestle, ceramic or nonmetallic material.
Polypropylene sieve, 5-mesh (4 mm opening).
Labware - For determination of trace levels of elements, contamination and
loss are of prime consideration. All reusable labware (glass, quartz,
polyethylene, PTFE, FEP, etc.) should be sufficiently clean for the task
objectives. Several procedures found to provide clean labware include
washing with a detergent solution, rinsing with tap water, soaking for four
hours or more in 20% (v/v) nitric acid or a mixture of HNO3 and HCl
(1+2+9), rinsing with reagent water and storing clean.2,3 Chromic acid
cleaning solutions must be avoided because chromium is an analyte.
Glassware - Volumetric flasks, graduated cylinders, funnels and centrifuge
tubes (glass and/or metal-free plastic).
Assorted calibrated pipettes.
Conical Phillips beakers (Corning 1080-250 or equivalent), 250 mL with 50
mm watch glasses.
Griffin beakers, 250 mL with 75 mm watch glasses and (optional) 75 mm
ribbed watch glasses.
Evaporating dishes or high-form crucibles, porcelain, 100 mL capacity.
Narrow-mouth storage bottles, FEP (fluorinated ethylene propylene) with
screw closure, 125 mL to 1 L capacities.
One-piece stem FEP wash bottle with screw closure, 125 mL capacity.
Hydrochloric acid, concentrated
Nitric acid, concentrated
Reagent water.
Ammonium hydroxide, concentrated (sp. gr. 0.902).
Tartaric acid, ACS reagent grade.
Hydrogen peroxide, 50%, stabilized certified reagent grade.
Standard Stock Solutions
Mixed Calibration Standard Solutions
Blanks
Quality Control Sample (QCS)
Instrument Performance Check (IPC) Solution
Spectral Interference Check (SIC) Solutions
Procedure An aliquot of a well-mixed, homogeneous aqueous or solid sample is
accurately weighed or measured for sample processing. For total recoverable
analysis of a solid or an aqueous sample containing undissolved material,
analytes are first solubilized by gentle refluxing with nitric and hydrochloric
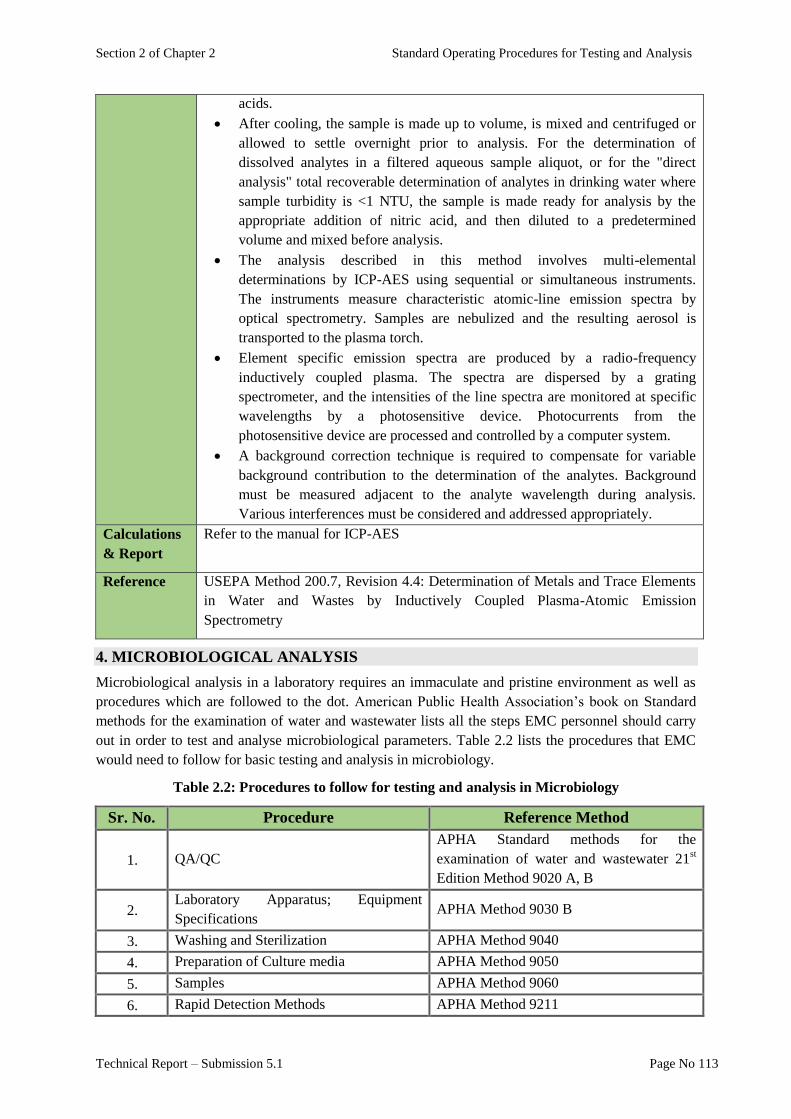
Section 2 of Chapter 2 Standard Operating Procedures for Testing and Analysis
Technical Report – Submission 5.1 Page No 113
acids.
After cooling, the sample is made up to volume, is mixed and centrifuged or
allowed to settle overnight prior to analysis. For the determination of
dissolved analytes in a filtered aqueous sample aliquot, or for the "direct
analysis" total recoverable determination of analytes in drinking water where
sample turbidity is <1 NTU, the sample is made ready for analysis by the
appropriate addition of nitric acid, and then diluted to a predetermined
volume and mixed before analysis.
The analysis described in this method involves multi-elemental
determinations by ICP-AES using sequential or simultaneous instruments.
The instruments measure characteristic atomic-line emission spectra by
optical spectrometry. Samples are nebulized and the resulting aerosol is
transported to the plasma torch.
Element specific emission spectra are produced by a radio-frequency
inductively coupled plasma. The spectra are dispersed by a grating
spectrometer, and the intensities of the line spectra are monitored at specific
wavelengths by a photosensitive device. Photocurrents from the
photosensitive device are processed and controlled by a computer system.
A background correction technique is required to compensate for variable
background contribution to the determination of the analytes. Background
must be measured adjacent to the analyte wavelength during analysis.
Various interferences must be considered and addressed appropriately.
Calculations
& Report
Refer to the manual for ICP-AES
Reference USEPA Method 200.7, Revision 4.4: Determination of Metals and Trace Elements
in Water and Wastes by Inductively Coupled Plasma-Atomic Emission
Spectrometry
4. MICROBIOLOGICAL ANALYSIS
Microbiological analysis in a laboratory requires an immaculate and pristine environment as well as
procedures which are followed to the dot. American Public Health Association’s book on Standard
methods for the examination of water and wastewater lists all the steps EMC personnel should carry
out in order to test and analyse microbiological parameters. Table 2.2 lists the procedures that EMC
would need to follow for basic testing and analysis in microbiology.
Table 2.2: Procedures to follow for testing and analysis in Microbiology
Sr. No. Procedure Reference Method
1. QA/QC
APHA Standard methods for the
examination of water and wastewater 21st
Edition Method 9020 A, B
2. Laboratory Apparatus; Equipment
Specifications APHA Method 9030 B
3. Washing and Sterilization APHA Method 9040
4. Preparation of Culture media APHA Method 9050
5. Samples APHA Method 9060
6. Rapid Detection Methods APHA Method 9211

Section 2 of Chapter 2 Standard Operating Procedures for Testing and Analysis
Technical Report – Submission 5.1 Page No 114
7. Heterotrophic Plate Count APHA Method 9215
8. Escherichia coli Procedure APHA Method 9221 F
9. Membrane filter technique for members
of the coliform Group APHA Method 9222

Chapter 3
Environmental Quality Standards

Section 1
Comparative Analysis of
Environmental Quality Standards

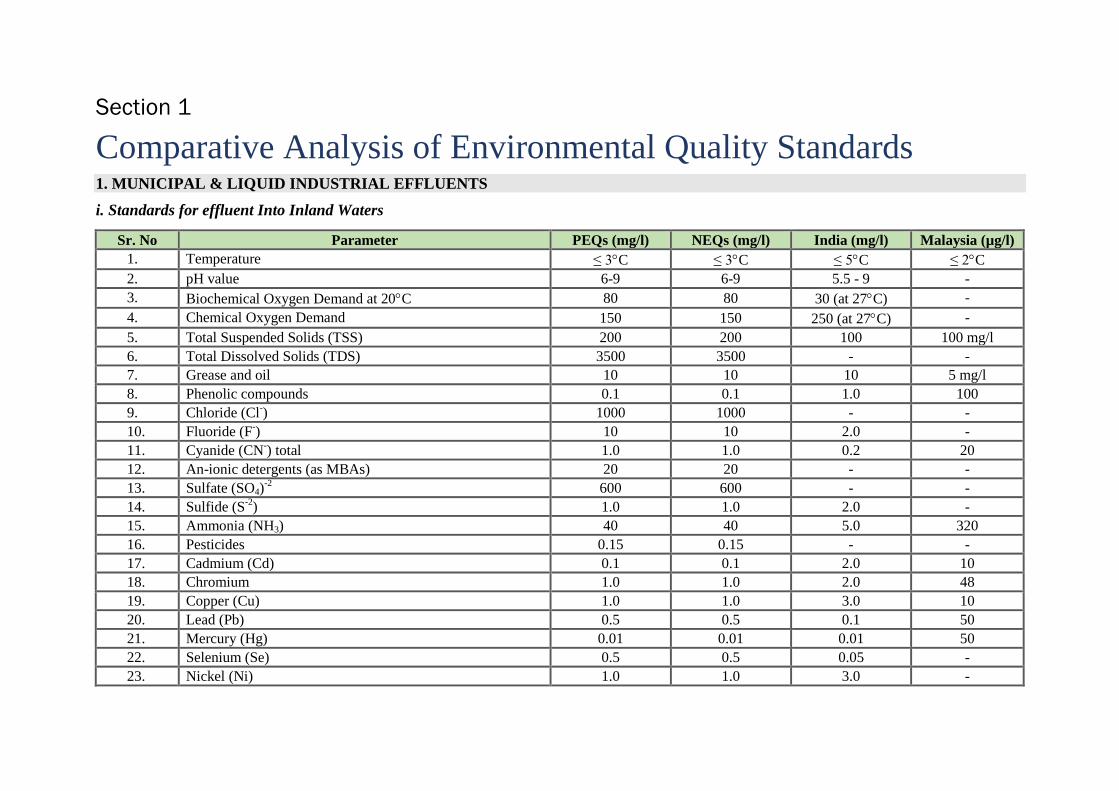
Section 1
Comparative Analysis of Environmental Quality Standards 1. MUNICIPAL & LIQUID INDUSTRIAL EFFLUENTS
i. Standards for effluent Into Inland Waters
Sr. No Parameter PEQs (mg/l) NEQs (mg/l) India (mg/l) Malaysia (µg/l)
1. Temperature ≤ 3C ≤ 3C ≤ 5C ≤ 2C
2. pH value 6-9 6-9 5.5 - 9 -
3. Biochemical Oxygen Demand at 20C 80 80 30 (at 27C) -
4. Chemical Oxygen Demand 150 150 250 (at 27C) -
5. Total Suspended Solids (TSS) 200 200 100 100 mg/l
6. Total Dissolved Solids (TDS) 3500 3500 - -
7. Grease and oil 10 10 10 5 mg/l
8. Phenolic compounds 0.1 0.1 1.0 100
9. Chloride (Cl-) 1000 1000 - -
10. Fluoride (F-) 10 10 2.0 -
11. Cyanide (CN-) total 1.0 1.0 0.2 20
12. An-ionic detergents (as MBAs) 20 20 - -
13. Sulfate (SO4)-2
600 600 - -
14. Sulfide (S-2
) 1.0 1.0 2.0 -
15. Ammonia (NH3) 40 40 5.0 320
16. Pesticides 0.15 0.15 - -
17. Cadmium (Cd) 0.1 0.1 2.0 10
18. Chromium 1.0 1.0 2.0 48
19. Copper (Cu) 1.0 1.0 3.0 10
20. Lead (Pb) 0.5 0.5 0.1 50
21. Mercury (Hg) 0.01 0.01 0.01 50
22. Selenium (Se) 0.5 0.5 0.05 -
23. Nickel (Ni) 1.0 1.0 3.0 -
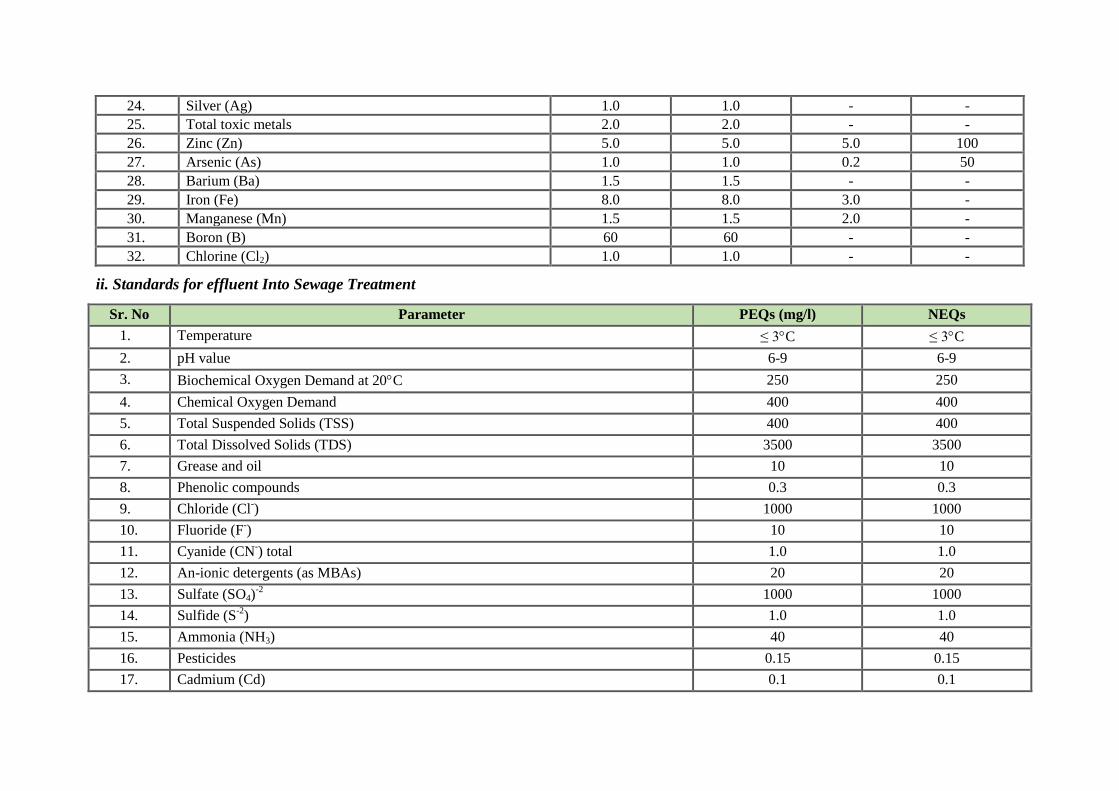
24. Silver (Ag) 1.0 1.0 - -
25. Total toxic metals 2.0 2.0 - -
26. Zinc (Zn) 5.0 5.0 5.0 100
27. Arsenic (As) 1.0 1.0 0.2 50
28. Barium (Ba) 1.5 1.5 - -
29. Iron (Fe) 8.0 8.0 3.0 -
30. Manganese (Mn) 1.5 1.5 2.0 -
31. Boron (B) 60 60 - -
32. Chlorine (Cl2) 1.0 1.0 - -
ii. Standards for effluent Into Sewage Treatment
Sr. No Parameter PEQs (mg/l) NEQs
1. Temperature ≤ 3C ≤ 3C
2. pH value 6-9 6-9
3. Biochemical Oxygen Demand at 20C 250 250
4. Chemical Oxygen Demand 400 400
5. Total Suspended Solids (TSS) 400 400
6. Total Dissolved Solids (TDS) 3500 3500
7. Grease and oil 10 10
8. Phenolic compounds 0.3 0.3
9. Chloride (Cl-) 1000 1000
10. Fluoride (F-) 10 10
11. Cyanide (CN-) total 1.0 1.0
12. An-ionic detergents (as MBAs) 20 20
13. Sulfate (SO4)-2
1000 1000
14. Sulfide (S-2
) 1.0 1.0
15. Ammonia (NH3) 40 40
16. Pesticides 0.15 0.15
17. Cadmium (Cd) 0.1 0.1

18. Chromium 1.0 1.0
19. Copper (Cu) 1.0 1.0
20. Lead (Pb) 0.5 0.5
21. Mercury (Hg) 0.01 0.01
22. Selenium (Se) 0.5 0.5
23. Nickel (Ni) 1.0 1.0
24. Silver (Ag) 1.0 1.0
25. Total toxic metals 2.0 2.0
26. Zinc (Zn) 5.0 5.0
27. Arsenic (As) 1.0 1.0
28. Barium (Ba) 1.5 1.5
29. Iron (Fe) 8.0 8.0
30. Manganese (Mn) 1.5 1.5
31. Boron (B) 60 60
32. Chlorine (Cl2) 1.0 1.0
2. INDUSTRIAL GASEOUS EMISSIONS
Sr. No Parameter PEQs (mg/Nm3) NEQs (mg/Nm
3)
1. Smoke 40% or 2 Ringkemann
scale
40% or 2 Ringkemann
scale
2. Particulate matter
Oil fired furnace
Coal fired
Cement kilns
Grinding crushing
300
500
300
500
300
500
200
500
3. Hydrogen Chloride (HCl) 400 400
4. Chlorine (Cl2) 150 150
5. Hydrogen Fluoride (HF) 150 150
6. Hydrogen Sulphide (H2S) 10 10
7. Sulphur oxides 5000 -

Sulfuric acid plants
Other plants except power plants
1700 400
8. Carbon Monoxide (CO) 800 800
9. Lead (Pb) 50 50
10. Mercury (Hg) 10 10
11. Cadmium (Cd) 20 20
12. Arsenic (As) 20 20
13. Copper (Cu) 50 50
14. Antimony (Sb) 20 20
15. Zinc (Zn) 200 200
16. Oxides of Nitrogen
Nitric acid manufacture
Gas fired power plant
Oil fired
Coal fired
3000
400
600
1200
400
400
-
-
3. MOTOR VEHICLE EXHAUST & NOISE
Sr. No Parameter PEQs NEQs
1. Smoke
40% or 2 Ringlemann
scale
40% or 2 Ringlemann
scale
2. Carbon Monoxide 6% 6%
3. Noise 85 dB(A) 85 dB(A)
4.
Passenger cars (<2500 kg)
Carbon Monoxide 1.0 g/km 1.0 g/km
5. HC, NOx 0.7 g/km 0.7 g/km
6. Particulate matter 0.08 g/km 0.08 g/km
7.
Passenger cars (>2500 kg)
Carbon Monoxide 1.0 g/km 1.0 g/km
8. HC, NOx 0.9 g/km 0.9 g/km
9. Particulate matter 0.1 g/km 0.1 g/km
10.
Light commercial vehicles (<1250 kg)
Carbon Monoxide 1.0 g/km 1.0 g/km
11. HC, NOx 0.7 g/km 0.7 g/km
12. Particulate matter 0.08 g/km 0.08 g/km
13. Light commercial vehicles (1250< RW Carbon Monoxide 1.25 g/km 1.25 g/km
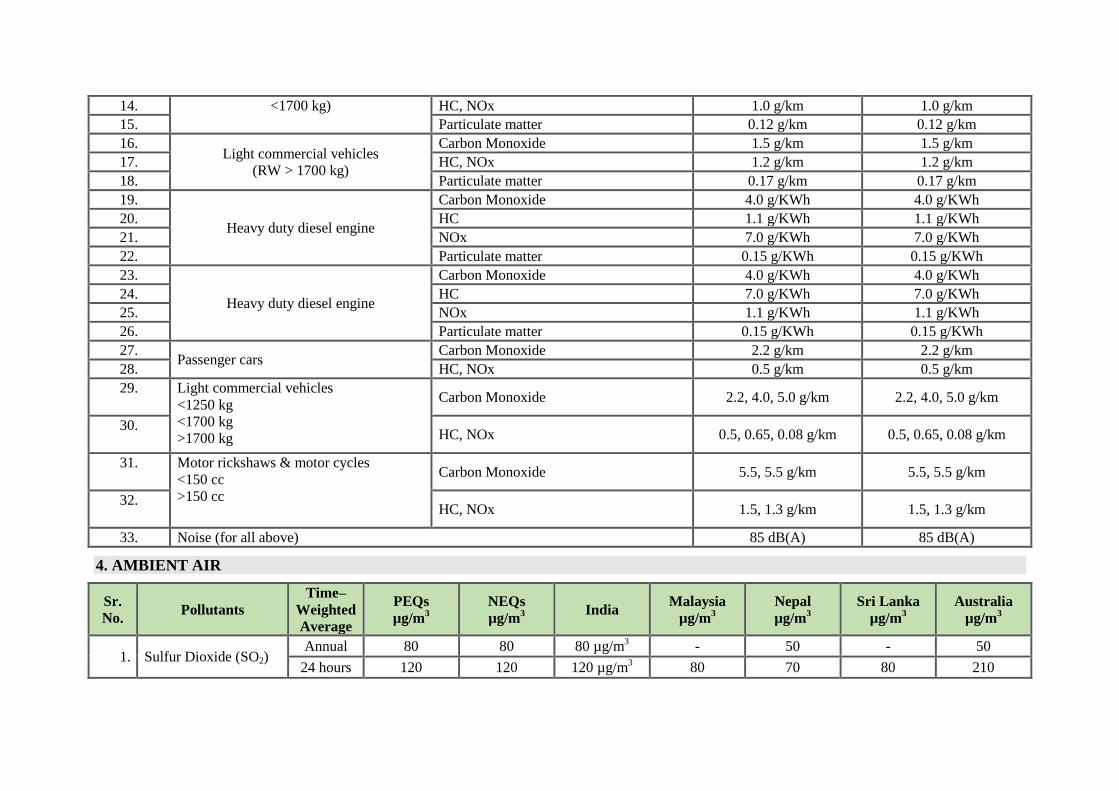
14. <1700 kg) HC, NOx 1.0 g/km 1.0 g/km
15. Particulate matter 0.12 g/km 0.12 g/km
16. Light commercial vehicles
(RW > 1700 kg)
Carbon Monoxide 1.5 g/km 1.5 g/km
17. HC, NOx 1.2 g/km 1.2 g/km
18. Particulate matter 0.17 g/km 0.17 g/km
19.
Heavy duty diesel engine
Carbon Monoxide 4.0 g/KWh 4.0 g/KWh
20. HC 1.1 g/KWh 1.1 g/KWh
21. NOx 7.0 g/KWh 7.0 g/KWh
22. Particulate matter 0.15 g/KWh 0.15 g/KWh
23.
Heavy duty diesel engine
Carbon Monoxide 4.0 g/KWh 4.0 g/KWh
24. HC 7.0 g/KWh 7.0 g/KWh
25. NOx 1.1 g/KWh 1.1 g/KWh
26. Particulate matter 0.15 g/KWh 0.15 g/KWh
27. Passenger cars
Carbon Monoxide 2.2 g/km 2.2 g/km
28. HC, NOx 0.5 g/km 0.5 g/km
29. Light commercial vehicles
<1250 kg
<1700 kg
>1700 kg
Carbon Monoxide 2.2, 4.0, 5.0 g/km 2.2, 4.0, 5.0 g/km
30. HC, NOx 0.5, 0.65, 0.08 g/km 0.5, 0.65, 0.08 g/km
31. Motor rickshaws & motor cycles
<150 cc
>150 cc
Carbon Monoxide 5.5, 5.5 g/km 5.5, 5.5 g/km
32. HC, NOx 1.5, 1.3 g/km 1.5, 1.3 g/km
33. Noise (for all above) 85 dB(A) 85 dB(A)
4. AMBIENT AIR
Sr.
No. Pollutants
Time–
Weighted
Average
PEQs
µg/m3
NEQs
µg/m3
India Malaysia
µg/m3
Nepal
µg/m3
Sri Lanka
µg/m3
Australia
µg/m3
1. Sulfur Dioxide (SO2) Annual 80 80 80 µg/m
3 - 50 - 50
24 hours 120 120 120 µg/m3 80 70 80 210
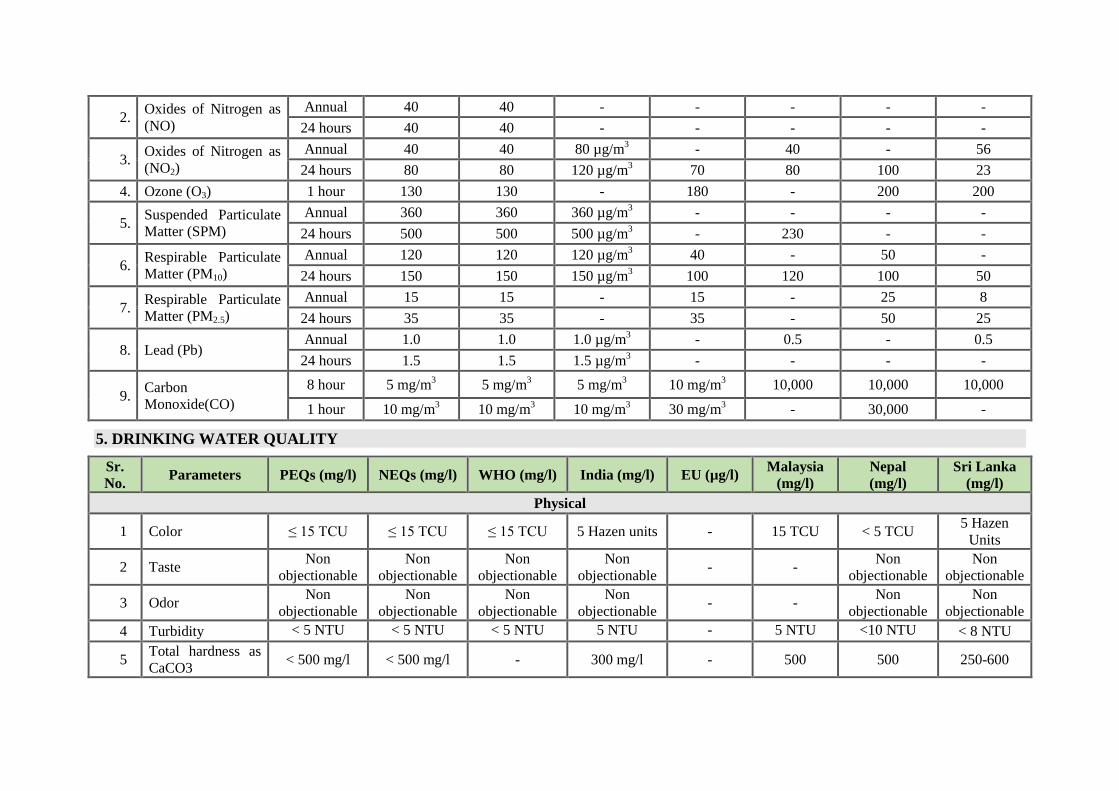
2. Oxides of Nitrogen as
(NO)
Annual 40 40 - - - - -
24 hours 40 40 - - - - -
3. Oxides of Nitrogen as
(NO2)
Annual 40 40 80 µg/m3 - 40 - 56
24 hours 80 80 120 µg/m3 70 80 100 23
4. Ozone (O3) 1 hour 130 130 - 180 - 200 200
5. Suspended Particulate
Matter (SPM)
Annual 360 360 360 µg/m3 - - - -
24 hours 500 500 500 µg/m3 - 230 - -
6. Respirable Particulate
Matter (PM10)
Annual 120 120 120 µg/m3 40 - 50 -
24 hours 150 150 150 µg/m3 100 120 100 50
7. Respirable Particulate
Matter (PM2.5)
Annual 15 15 - 15 - 25 8
24 hours 35 35 - 35 - 50 25
8. Lead (Pb) Annual 1.0 1.0 1.0 µg/m
3 - 0.5 - 0.5
24 hours 1.5 1.5 1.5 µg/m3 - - - -
9. Carbon
Monoxide(CO)
8 hour 5 mg/m3 5 mg/m
3 5 mg/m
3 10 mg/m
3 10,000 10,000 10,000
1 hour 10 mg/m3 10 mg/m
3 10 mg/m
3 30 mg/m
3 - 30,000 -
5. DRINKING WATER QUALITY
Sr.
No. Parameters PEQs (mg/l) NEQs (mg/l) WHO (mg/l) India (mg/l) EU (µg/l)
Malaysia
(mg/l)
Nepal
(mg/l)
Sri Lanka
(mg/l)
Physical
1 Color ≤ 15 TCU ≤ 15 TCU ≤ 15 TCU 5 Hazen units - 15 TCU < 5 TCU 5 Hazen
Units
2 Taste Non
objectionable
Non
objectionable
Non
objectionable
Non
objectionable - -
Non
objectionable
Non
objectionable
3 Odor Non
objectionable
Non
objectionable
Non
objectionable
Non
objectionable - -
Non
objectionable
Non
objectionable
4 Turbidity < 5 NTU < 5 NTU < 5 NTU 5 NTU - 5 NTU <10 NTU < 8 NTU
5 Total hardness as
CaCO3 < 500 mg/l < 500 mg/l - 300 mg/l - 500 500 250-600
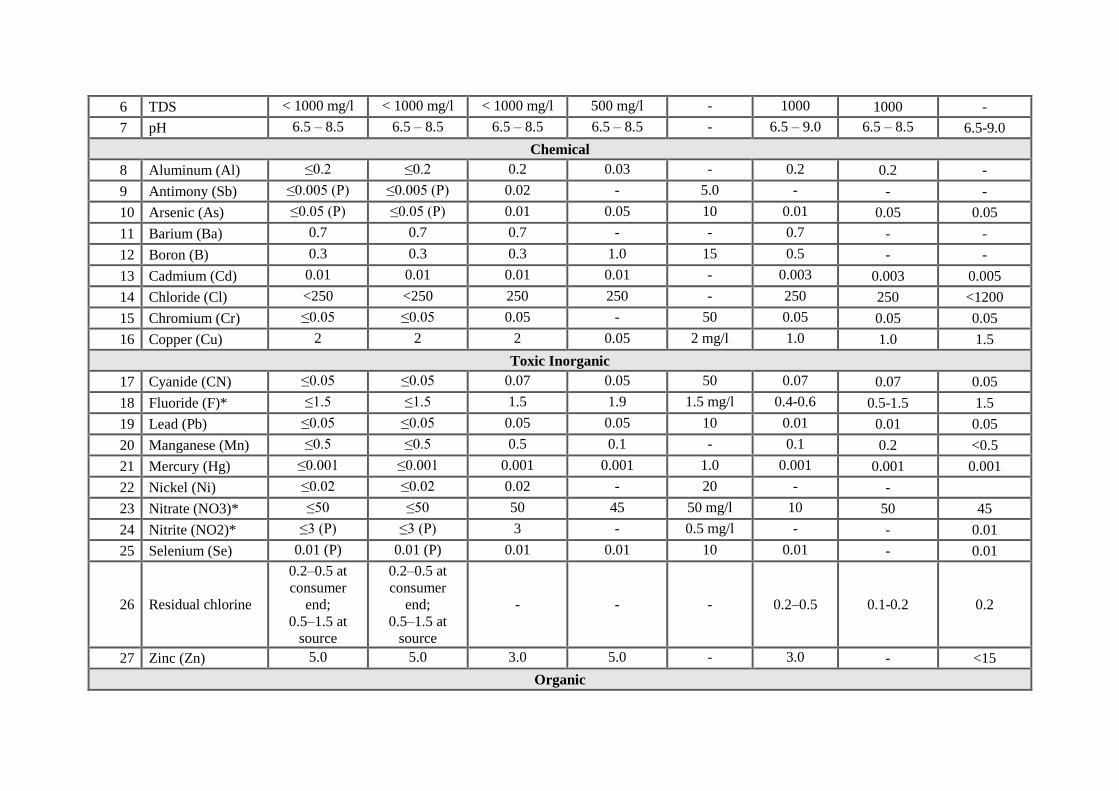
6 TDS < 1000 mg/l < 1000 mg/l < 1000 mg/l 500 mg/l - 1000 1000 -
7 pH 6.5 – 8.5 6.5 – 8.5 6.5 – 8.5 6.5 – 8.5 - 6.5 – 9.0 6.5 – 8.5 6.5-9.0
Chemical
8 Aluminum (Al) ≤0.2 ≤0.2 0.2 0.03 - 0.2 0.2 -
9 Antimony (Sb) ≤0.005 (P) ≤0.005 (P) 0.02 - 5.0 - - -
10 Arsenic (As) ≤0.05 (P) ≤0.05 (P) 0.01 0.05 10 0.01 0.05 0.05
11 Barium (Ba) 0.7 0.7 0.7 - - 0.7 - -
12 Boron (B) 0.3 0.3 0.3 1.0 15 0.5 - -
13 Cadmium (Cd) 0.01 0.01 0.01 0.01 - 0.003 0.003 0.005
14 Chloride (Cl) <250 <250 250 250 - 250 250 <1200
15 Chromium (Cr) ≤0.05 ≤0.05 0.05 - 50 0.05 0.05 0.05
16 Copper (Cu) 2 2 2 0.05 2 mg/l 1.0 1.0 1.5
Toxic Inorganic
17 Cyanide (CN) ≤0.05 ≤0.05 0.07 0.05 50 0.07 0.07 0.05
18 Fluoride (F)* ≤1.5 ≤1.5 1.5 1.9 1.5 mg/l 0.4-0.6 0.5-1.5 1.5
19 Lead (Pb) ≤0.05 ≤0.05 0.05 0.05 10 0.01 0.01 0.05
20 Manganese (Mn) ≤0.5 ≤0.5 0.5 0.1 - 0.1 0.2 <0.5
21 Mercury (Hg) ≤0.001 ≤0.001 0.001 0.001 1.0 0.001 0.001 0.001
22 Nickel (Ni) ≤0.02 ≤0.02 0.02 - 20 - -
23 Nitrate (NO3)* ≤50 ≤50 50 45 50 mg/l 10 50 45
24 Nitrite (NO2)* ≤3 (P) ≤3 (P) 3 - 0.5 mg/l - - 0.01
25 Selenium (Se) 0.01 (P) 0.01 (P) 0.01 0.01 10 0.01 - 0.01
26 Residual chlorine
0.2–0.5 at
consumer
end;
0.5–1.5 at
source
0.2–0.5 at
consumer
end;
0.5–1.5 at
source
- - - 0.2–0.5 0.1-0.2 0.2
27 Zinc (Zn) 5.0 5.0 3.0 5.0 - 3.0 - <15
Organic

28 Pesticides - - - 0.1 - - -
29
Phenolic
compound (as
phenols)
- - ≤0.002 0.001 - 0.02 - 0.002
30
Polynuclear
Aromatic
hydrocarbon (as
PAH)
- - 0.01 - 0.1 - - 0.0002
Radioactive
31 Alpha Emitters
bq/L or pCi 0.1 0.1 0.1 - szx- 0.1 - 3
32 Beta Emitters 1 1 1 - - 1 - 30
6. NOISE
Day time dB(A) Leq
Sr. No. Category of area/ zone PEQS NEQS WHO Malaysia
1. Residential Area 55 55 35 55
2. Commercial Area 65 65 - 65
3. Industrial Area 75 75 70 70
4. Silence Zone 50 50 30 50
Night time dB(A) Leq
Sr. No. Category of area/ zone PEQS NEQS WHO Malaysia
1. Residential Area 45 45 35 45
2. Commercial Area 55 55 - 55
3. Industrial Area 65 65 70 60
4. Silence Zone 45 45 30 40
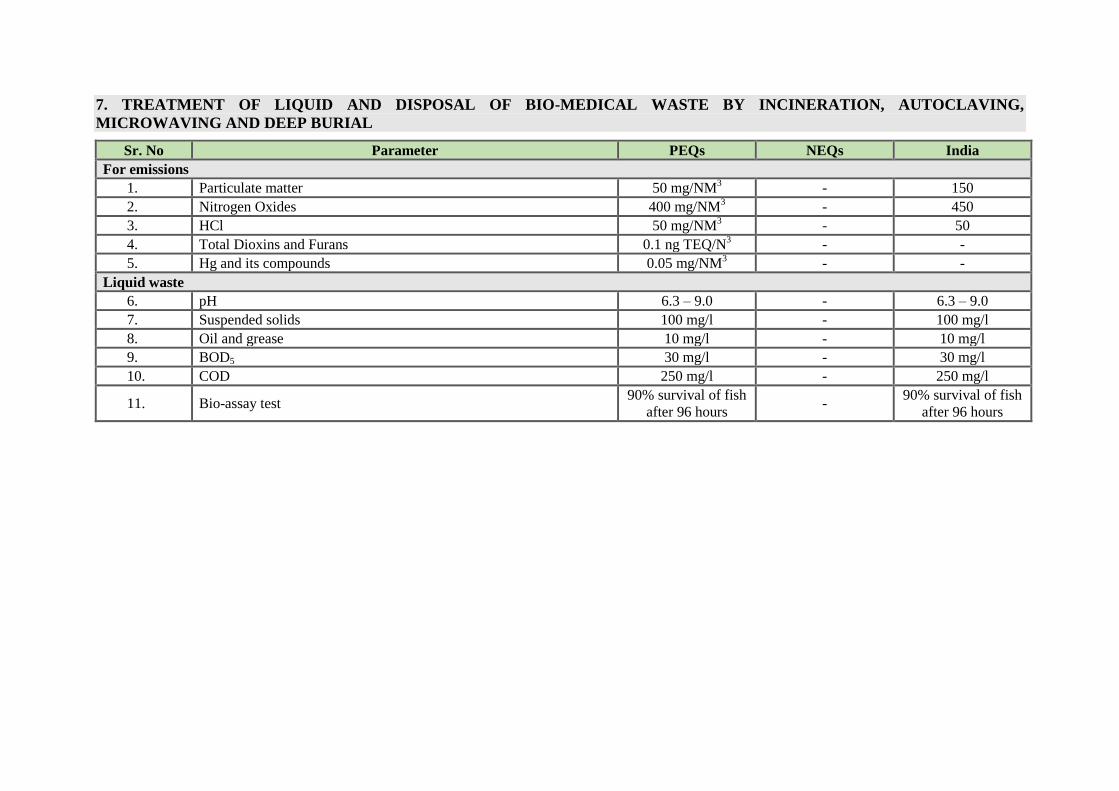
7. TREATMENT OF LIQUID AND DISPOSAL OF BIO-MEDICAL WASTE BY INCINERATION, AUTOCLAVING,
MICROWAVING AND DEEP BURIAL
Sr. No Parameter PEQs NEQs India
For emissions
1. Particulate matter 50 mg/NM3 - 150
2. Nitrogen Oxides 400 mg/NM3 - 450
3. HCl 50 mg/NM3 - 50
4. Total Dioxins and Furans 0.1 ng TEQ/N3 - -
5. Hg and its compounds 0.05 mg/NM3 - -
Liquid waste
6. pH 6.3 – 9.0 - 6.3 – 9.0
7. Suspended solids 100 mg/l - 100 mg/l
8. Oil and grease 10 mg/l - 10 mg/l
9. BOD5 30 mg/l - 30 mg/l
10. COD 250 mg/l - 250 mg/l
11. Bio-assay test 90% survival of fish
after 96 hours -
90% survival of fish
after 96 hours


Section 1 of Chapter 4 Introduction and Scope
Chapter 4
Environmental Modelling

Section 1
Introduction and Scope

Section 1 of Chapter 4 Introduction and Scope
Technical Report – Submission 5.1 Page No 134
Section 1
INTRODUCTION AND SCOPE Modelling is an essential part of all the environmental domains. It helps decision and policy makers to
improve the understanding of natural systems and how they changing the conditions. It helps to
identify the exposure to hazards and the temporal effects from the exposure-making environment
polluted. Environmental modelling supports simulation, modelling and decision-support tools. The
applications of environment modelling carry a special demands dealing with scale, complex
dimensions, modelling with different purposes and adaptability. The environmental models were
reviewed for four types of modelling that include:
a. Dispersion modelling
b. Receptor modelling
c. Surface water modelling
d. Groundwater modelling
The most suitable models were selected in each category and discussed in Section 2 of this chapter.

Section 1 of Chapter 4 Introduction and Scope
Technical Report – Submission 5.1 Page No 135

Section 2
Environmental Modelling Framework

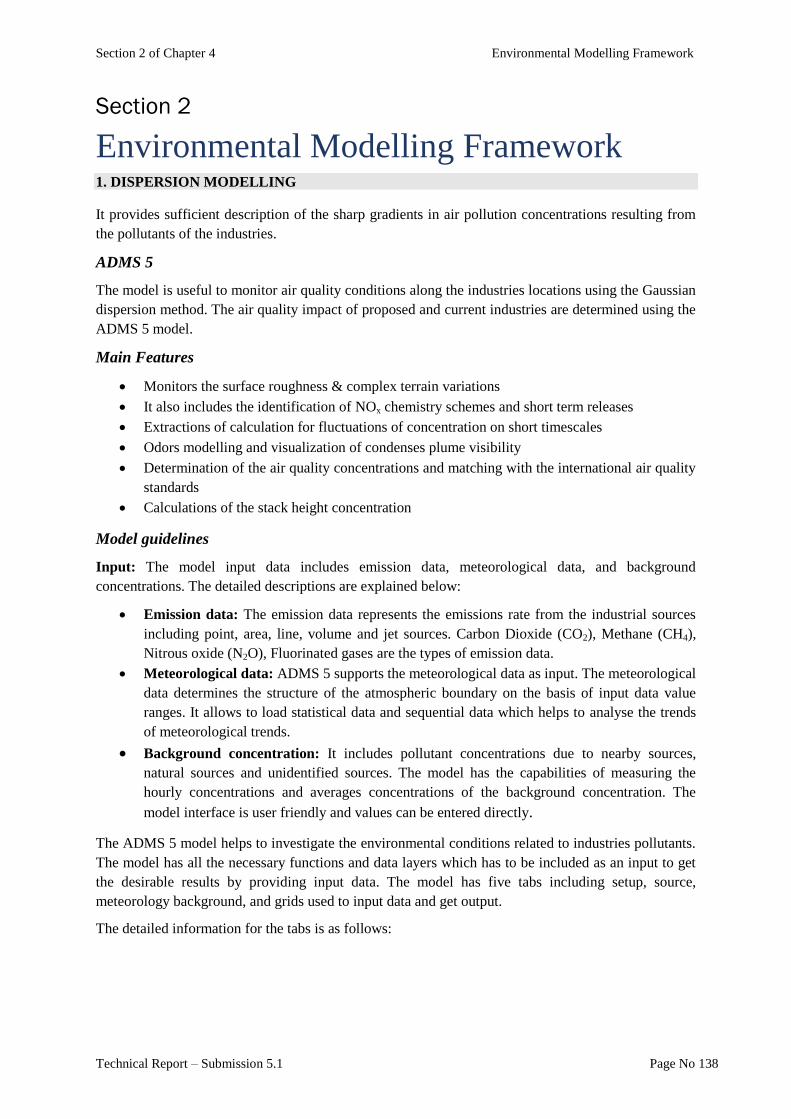
Section 2 of Chapter 4 Environmental Modelling Framework
Technical Report – Submission 5.1 Page No 138
Section 2
Environmental Modelling Framework 1. DISPERSION MODELLING
It provides sufficient description of the sharp gradients in air pollution concentrations resulting from
the pollutants of the industries.
ADMS 5
The model is useful to monitor air quality conditions along the industries locations using the Gaussian
dispersion method. The air quality impact of proposed and current industries are determined using the
ADMS 5 model.
Main Features
Monitors the surface roughness & complex terrain variations
It also includes the identification of NOx chemistry schemes and short term releases
Extractions of calculation for fluctuations of concentration on short timescales
Odors modelling and visualization of condenses plume visibility
Determination of the air quality concentrations and matching with the international air quality
standards
Calculations of the stack height concentration
Model guidelines
Input: The model input data includes emission data, meteorological data, and background
concentrations. The detailed descriptions are explained below:
Emission data: The emission data represents the emissions rate from the industrial sources
including point, area, line, volume and jet sources. Carbon Dioxide (CO2), Methane (CH4),
Nitrous oxide (N2O), Fluorinated gases are the types of emission data.
Meteorological data: ADMS 5 supports the meteorological data as input. The meteorological
data determines the structure of the atmospheric boundary on the basis of input data value
ranges. It allows to load statistical data and sequential data which helps to analyse the trends
of meteorological trends.
Background concentration: It includes pollutant concentrations due to nearby sources,
natural sources and unidentified sources. The model has the capabilities of measuring the
hourly concentrations and averages concentrations of the background concentration. The
model interface is user friendly and values can be entered directly.
The ADMS 5 model helps to investigate the environmental conditions related to industries pollutants.
The model has all the necessary functions and data layers which has to be included as an input to get
the desirable results by providing input data. The model has five tabs including setup, source,
meteorology background, and grids used to input data and get output.
The detailed information for the tabs is as follows:
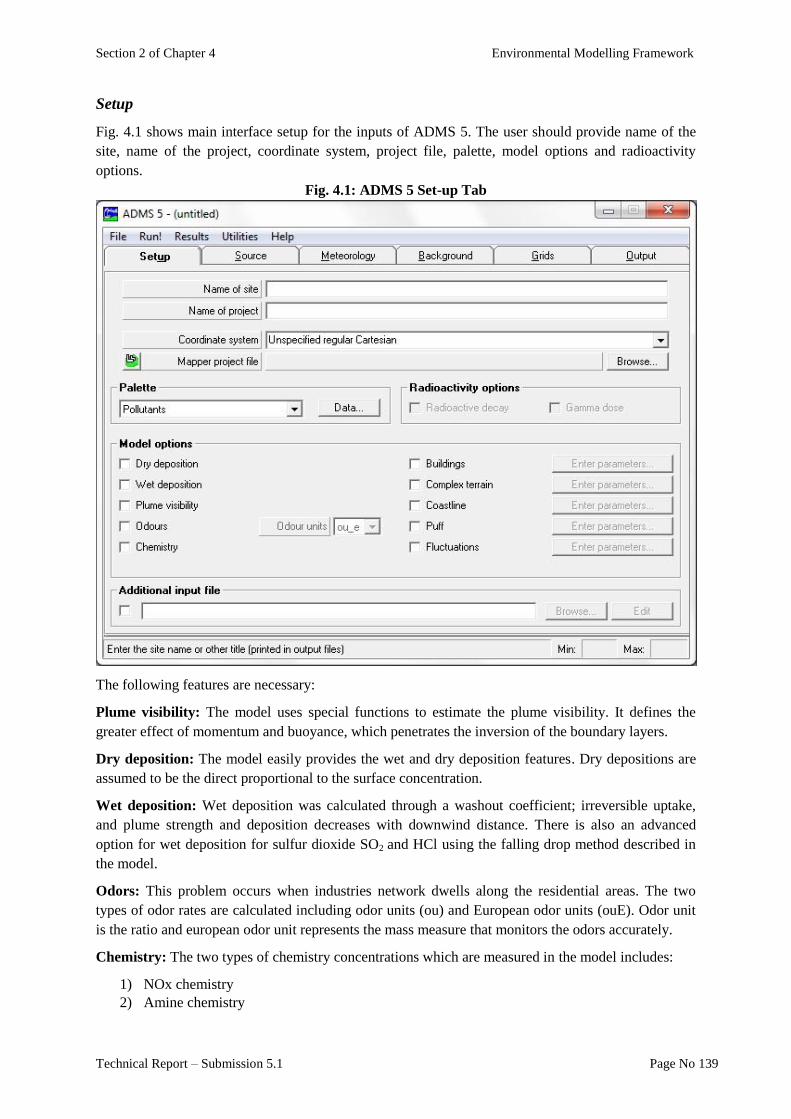
Section 2 of Chapter 4 Environmental Modelling Framework
Technical Report – Submission 5.1 Page No 139
Setup
Fig. 4.1 shows main interface setup for the inputs of ADMS 5. The user should provide name of the
site, name of the project, coordinate system, project file, palette, model options and radioactivity
options.
Fig. 4.1: ADMS 5 Set-up Tab
The following features are necessary:
Plume visibility: The model uses special functions to estimate the plume visibility. It defines the
greater effect of momentum and buoyance, which penetrates the inversion of the boundary layers.
Dry deposition: The model easily provides the wet and dry deposition features. Dry depositions are
assumed to be the direct proportional to the surface concentration.
Wet deposition: Wet deposition was calculated through a washout coefficient; irreversible uptake,
and plume strength and deposition decreases with downwind distance. There is also an advanced
option for wet deposition for sulfur dioxide SO2 and HCl using the falling drop method described in
the model.
Odors: This problem occurs when industries network dwells along the residential areas. The two
types of odor rates are calculated including odor units (ou) and European odor units (ouE). Odor unit
is the ratio and european odor unit represents the mass measure that monitors the odors accurately.
Chemistry: The two types of chemistry concentrations which are measured in the model includes:
1) NOx chemistry
2) Amine chemistry
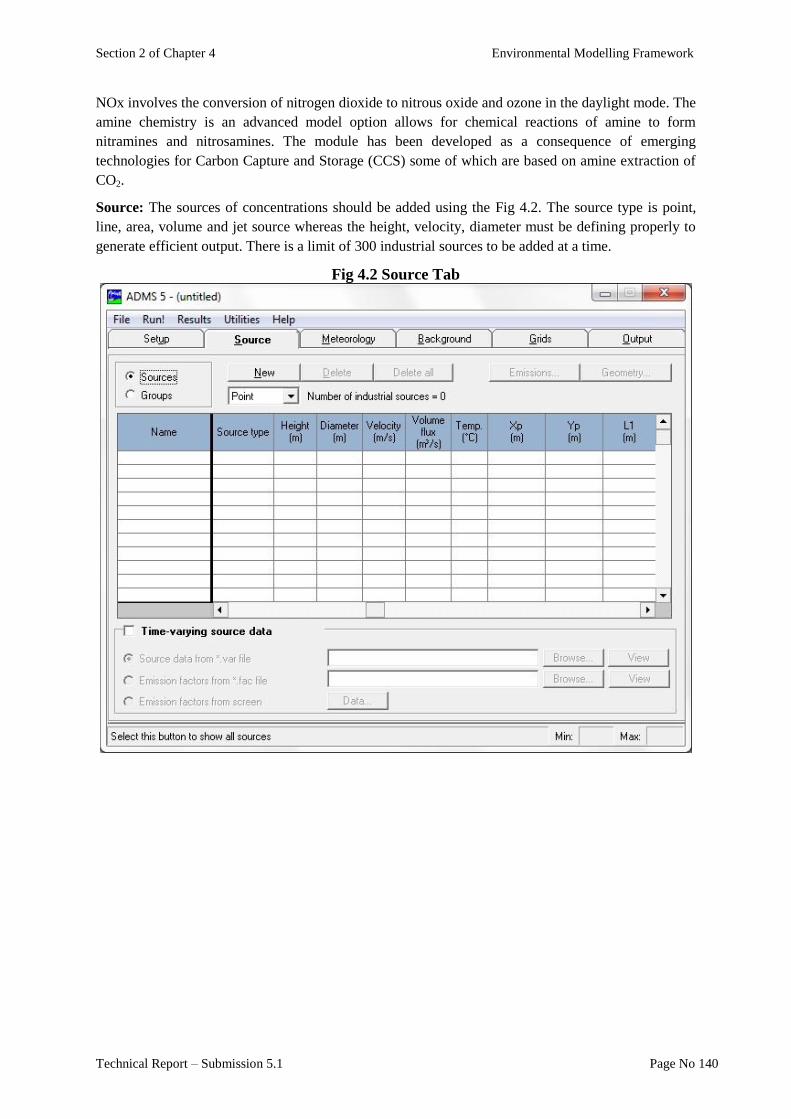
Section 2 of Chapter 4 Environmental Modelling Framework
Technical Report – Submission 5.1 Page No 140
NOx involves the conversion of nitrogen dioxide to nitrous oxide and ozone in the daylight mode. The
amine chemistry is an advanced model option allows for chemical reactions of amine to form
nitramines and nitrosamines. The module has been developed as a consequence of emerging
technologies for Carbon Capture and Storage (CCS) some of which are based on amine extraction of
CO2.
Source: The sources of concentrations should be added using the Fig 4.2. The source type is point,
line, area, volume and jet source whereas the height, velocity, diameter must be defining properly to
generate efficient output. There is a limit of 300 industrial sources to be added at a time.
Fig 4.2 Source Tab

Section 2 of Chapter 4 Environmental Modelling Framework
Technical Report – Submission 5.1 Page No 141
Meteorology
Meteorological data should be added in Fig 4.3. It shows the surface roughness as an input. Met file is
required for the regions to load into the model. Height of recorded wind, hourly sequential data and
statistical meteorological data is required for the input data.
Fig 4.3 Meteorology

Section 2 of Chapter 4 Environmental Modelling Framework
Technical Report – Submission 5.1 Page No 142
Background
Background tab is the integral part as shown in Fig. 4.4. The level of concentration should be defined
according to the actual values in the required units. These values can be entered directly or by
uploading file.
Fig 4.1 Background
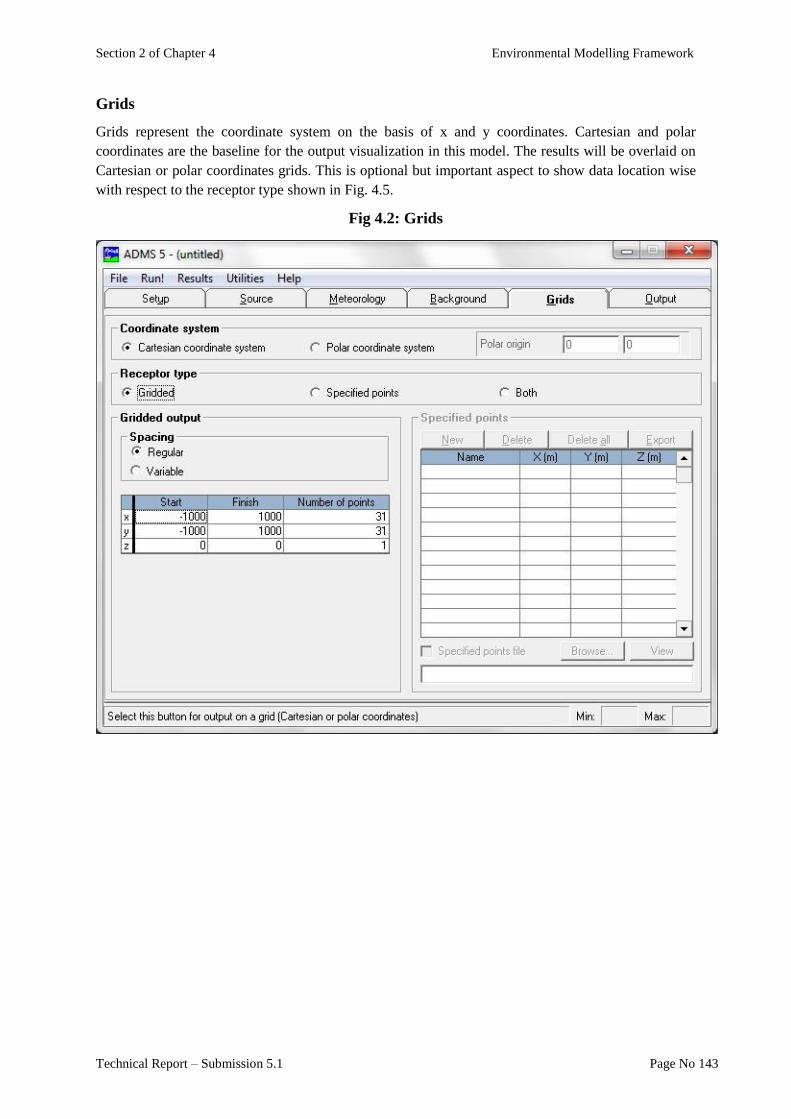
Section 2 of Chapter 4 Environmental Modelling Framework
Technical Report – Submission 5.1 Page No 143
Grids
Grids represent the coordinate system on the basis of x and y coordinates. Cartesian and polar
coordinates are the baseline for the output visualization in this model. The results will be overlaid on
Cartesian or polar coordinates grids. This is optional but important aspect to show data location wise
with respect to the receptor type shown in Fig. 4.5.
Fig 4.2: Grids

Section 2 of Chapter 4 Environmental Modelling Framework
Technical Report – Submission 5.1 Page No 144
Output
The model shows output for up to 10 pollutants at a time, which may be either long-term statistical
output or short-term output for each hour or meteorological conditions. Rolling averages, exceedances
and percentile statistics also calculated as shown in Fig. 4.6. The output of the model will be in the
form of ASCII file and the results can be easily imported in different visualization software.
Fig. 4.6: Output
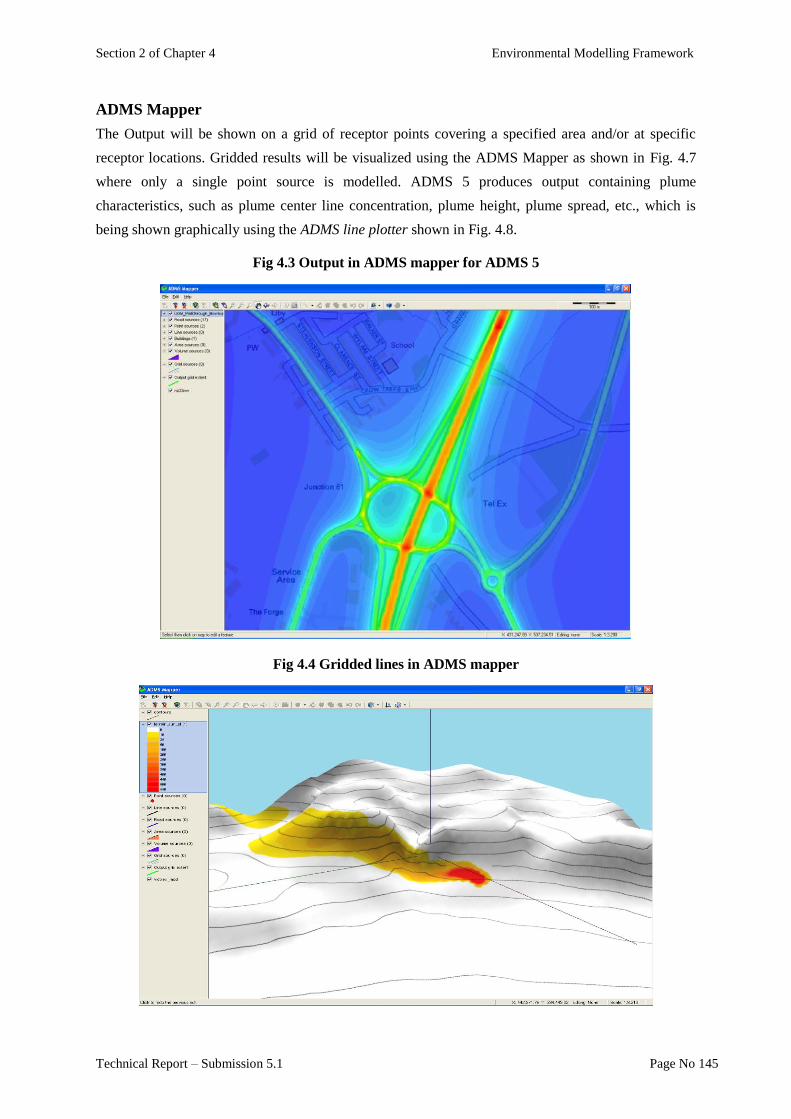
Section 2 of Chapter 4 Environmental Modelling Framework
Technical Report – Submission 5.1 Page No 145
ADMS Mapper
The Output will be shown on a grid of receptor points covering a specified area and/or at specific
receptor locations. Gridded results will be visualized using the ADMS Mapper as shown in Fig. 4.7
where only a single point source is modelled. ADMS 5 produces output containing plume
characteristics, such as plume center line concentration, plume height, plume spread, etc., which is
being shown graphically using the ADMS line plotter shown in Fig. 4.8.
Fig 4.3 Output in ADMS mapper for ADMS 5
Fig 4.4 Gridded lines in ADMS mapper
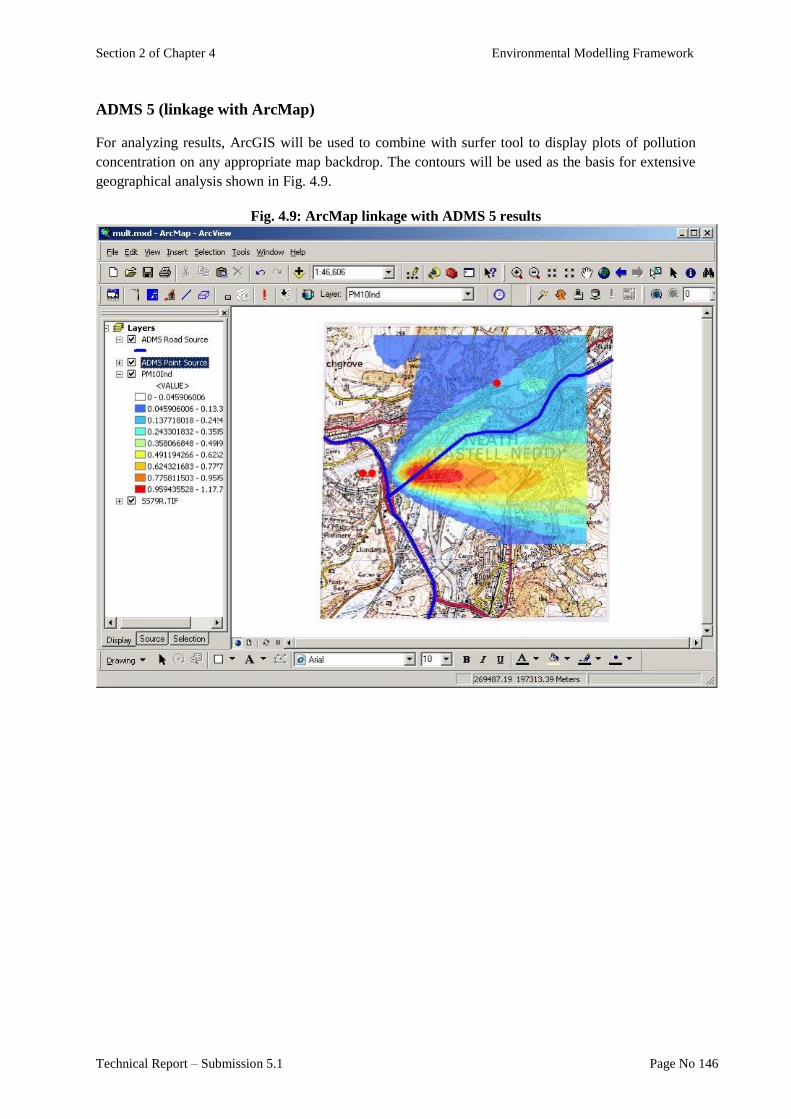
Section 2 of Chapter 4 Environmental Modelling Framework
Technical Report – Submission 5.1 Page No 146
ADMS 5 (linkage with ArcMap)
For analyzing results, ArcGIS will be used to combine with surfer tool to display plots of pollution
concentration on any appropriate map backdrop. The contours will be used as the basis for extensive
geographical analysis shown in Fig. 4.9.
Fig. 4.9: ArcMap linkage with ADMS 5 results
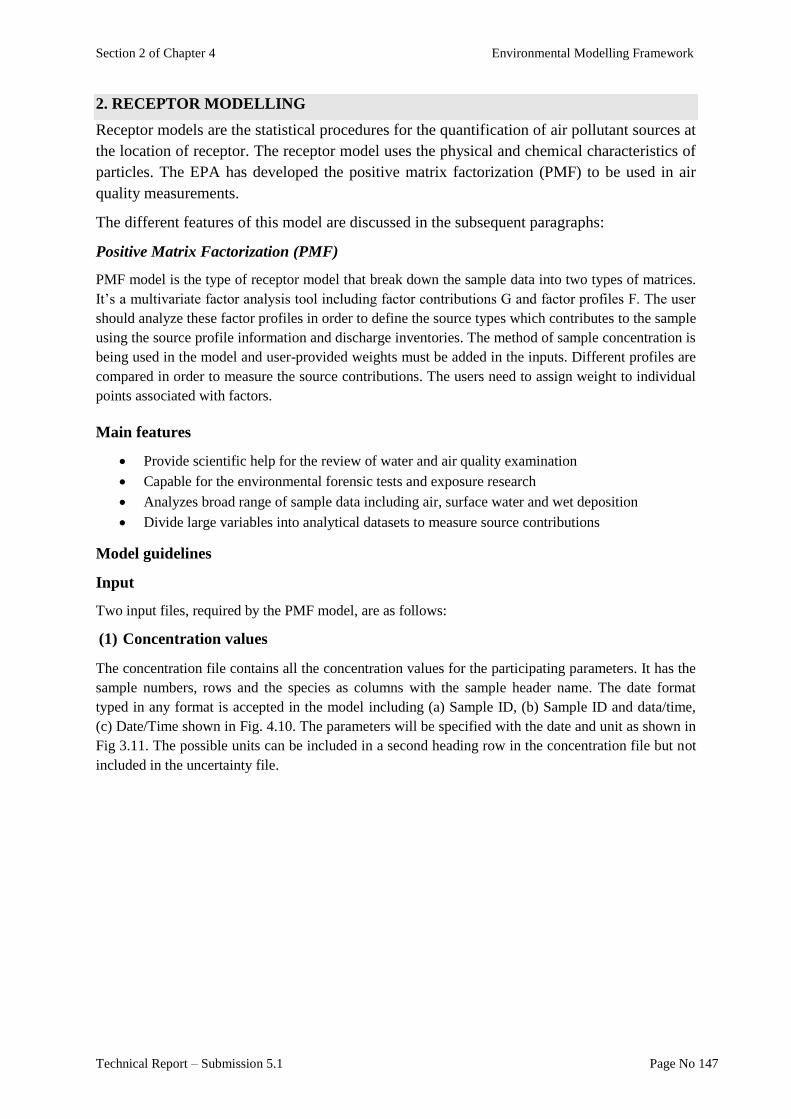
Section 2 of Chapter 4 Environmental Modelling Framework
Technical Report – Submission 5.1 Page No 147
2. RECEPTOR MODELLING
Receptor models are the statistical procedures for the quantification of air pollutant sources at
the location of receptor. The receptor model uses the physical and chemical characteristics of
particles. The EPA has developed the positive matrix factorization (PMF) to be used in air
quality measurements.
The different features of this model are discussed in the subsequent paragraphs:
Positive Matrix Factorization (PMF)
PMF model is the type of receptor model that break down the sample data into two types of matrices.
It’s a multivariate factor analysis tool including factor contributions G and factor profiles F. The user
should analyze these factor profiles in order to define the source types which contributes to the sample
using the source profile information and discharge inventories. The method of sample concentration is
being used in the model and user-provided weights must be added in the inputs. Different profiles are
compared in order to measure the source contributions. The users need to assign weight to individual
points associated with factors.
Main features
Provide scientific help for the review of water and air quality examination
Capable for the environmental forensic tests and exposure research
Analyzes broad range of sample data including air, surface water and wet deposition
Divide large variables into analytical datasets to measure source contributions
Model guidelines
Input
Two input files, required by the PMF model, are as follows:
(1) Concentration values
The concentration file contains all the concentration values for the participating parameters. It has the
sample numbers, rows and the species as columns with the sample header name. The date format
typed in any format is accepted in the model including (a) Sample ID, (b) Sample ID and data/time,
(c) Date/Time shown in Fig. 4.10. The parameters will be specified with the date and unit as shown in
Fig 3.11. The possible units can be included in a second heading row in the concentration file but not
included in the uncertainty file.
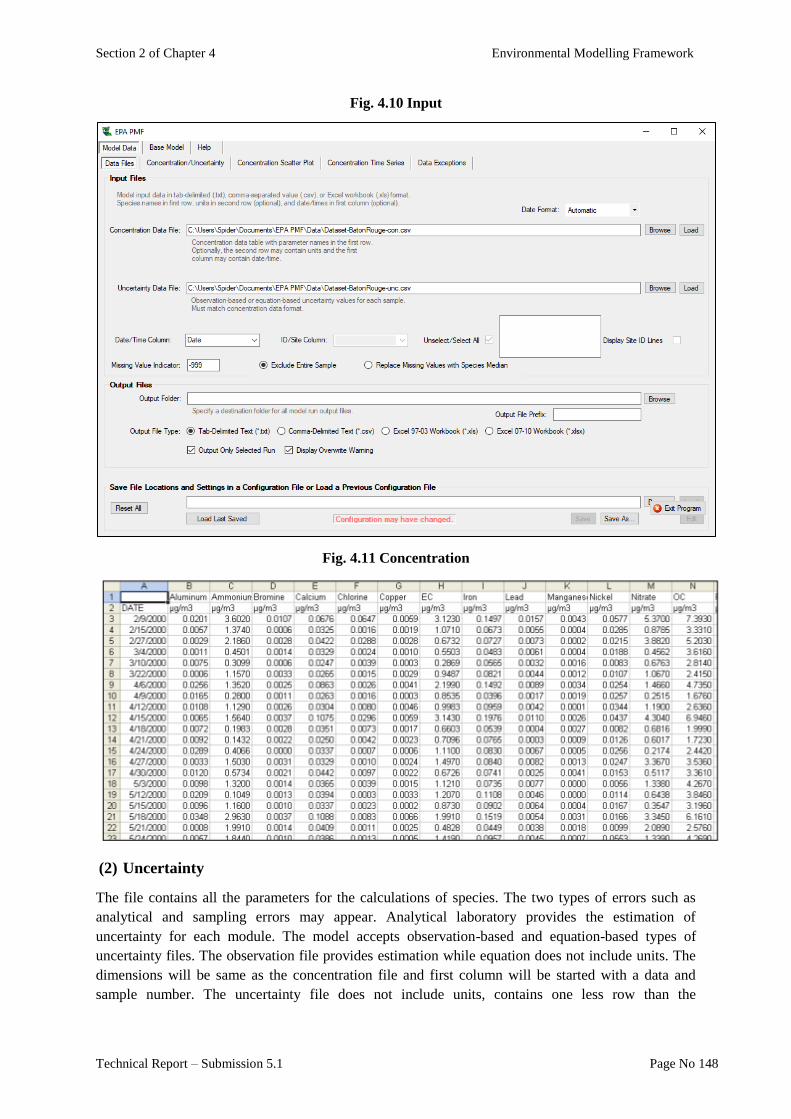
Section 2 of Chapter 4 Environmental Modelling Framework
Technical Report – Submission 5.1 Page No 148
Fig. 4.10 Input
Fig. 4.11 Concentration
(2) Uncertainty
The file contains all the parameters for the calculations of species. The two types of errors such as
analytical and sampling errors may appear. Analytical laboratory provides the estimation of
uncertainty for each module. The model accepts observation-based and equation-based types of
uncertainty files. The observation file provides estimation while equation does not include units. The
dimensions will be same as the concentration file and first column will be started with a data and
sample number. The uncertainty file does not include units, contains one less row than the
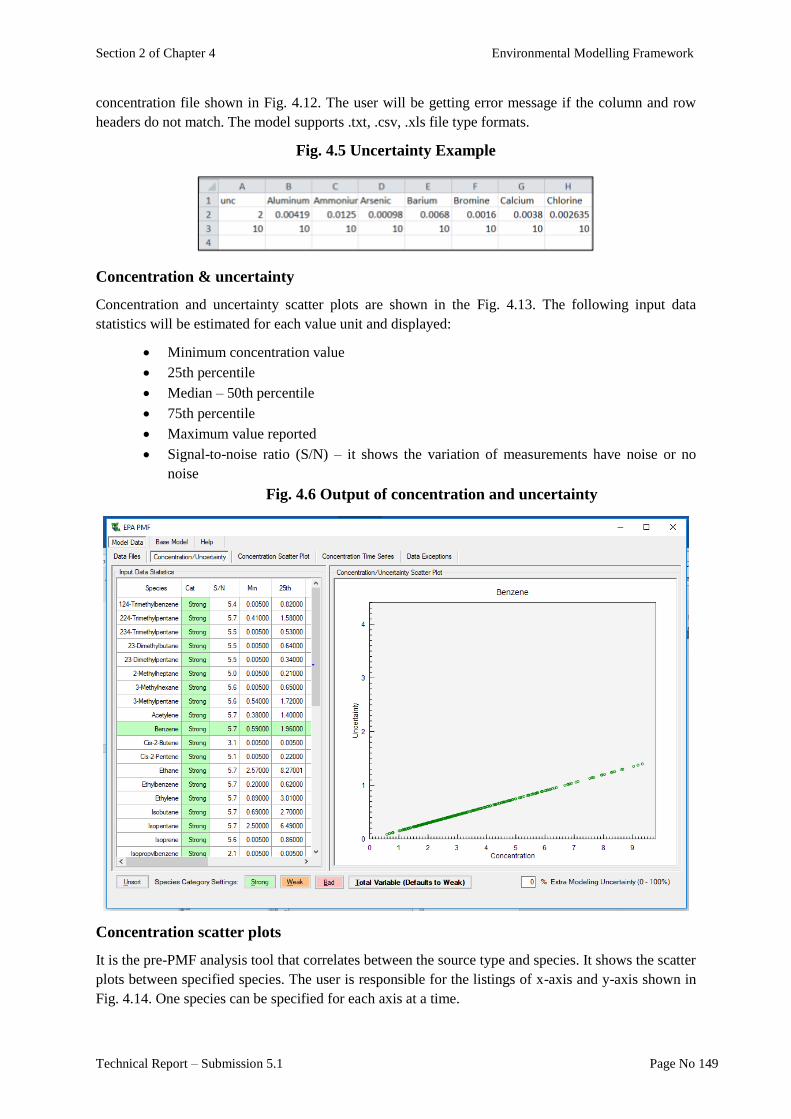
Section 2 of Chapter 4 Environmental Modelling Framework
Technical Report – Submission 5.1 Page No 149
concentration file shown in Fig. 4.12. The user will be getting error message if the column and row
headers do not match. The model supports .txt, .csv, .xls file type formats.
Fig. 4.5 Uncertainty Example
Concentration & uncertainty
Concentration and uncertainty scatter plots are shown in the Fig. 4.13. The following input data
statistics will be estimated for each value unit and displayed:
Minimum concentration value
25th percentile
Median – 50th percentile
75th percentile
Maximum value reported
Signal-to-noise ratio (S/N) – it shows the variation of measurements have noise or no
noise
Fig. 4.6 Output of concentration and uncertainty
Concentration scatter plots
It is the pre-PMF analysis tool that correlates between the source type and species. It shows the scatter
plots between specified species. The user is responsible for the listings of x-axis and y-axis shown in
Fig. 4.14. One species can be specified for each axis at a time.
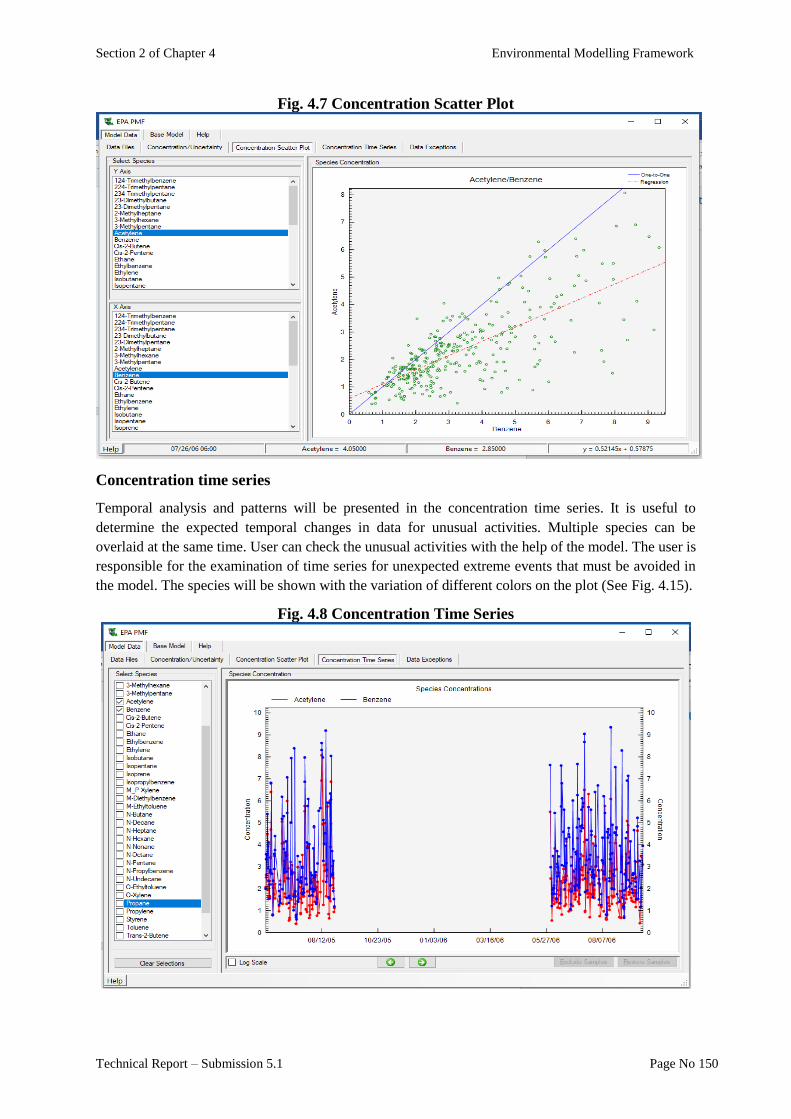
Section 2 of Chapter 4 Environmental Modelling Framework
Technical Report – Submission 5.1 Page No 150
Fig. 4.7 Concentration Scatter Plot
Concentration time series
Temporal analysis and patterns will be presented in the concentration time series. It is useful to
determine the expected temporal changes in data for unusual activities. Multiple species can be
overlaid at the same time. User can check the unusual activities with the help of the model. The user is
responsible for the examination of time series for unexpected extreme events that must be avoided in
the model. The species will be shown with the variation of different colors on the plot (See Fig. 4.15).
Fig. 4.8 Concentration Time Series

Section 2 of Chapter 4 Environmental Modelling Framework
Technical Report – Submission 5.1 Page No 151
3. SURFACE WATER MODELLING
The surface water quality models are very significant to manage the surface water quality. The models
help decisions makers to better understand how water changes in terms of pollution.
The following model has been selected:
Canadian water quality index (CWQI)
This model provides a glance of surface water quality measurements with the quality data. The model
has scope, frequency and amplitude, which help to produce the final results. CWQI produces final
results between 0 (poor) to 100 (excellent).
Scope indicate the parameters which are not meeting the water quality guidelines. Amplitude is the
amount by which guidelines are not met. Frequency is the numbers of time by which the standards
were rejected or accepted.
Main features:
Able to combine the measurements in a single number
Provides site specific good water quality measurements
Provides the water suitable conditional equations
Model guidelines
Calculations of the Canadian Water Quality Index
Three factors (i.e., F1, F2 and F3) are relatively very important and must be calculated in order to get
the information on condition of water quality. Each of the three factors that make up the CWQI
should be calculated.
F1 (scope) represents the parameter percentages that is not meeting the guidelines at least once during
the whole time period for failed parameters out of the total number of parameters measured. F1 is
calculated using Eq. (1):
Eq. (1)
F2 is used for the calculation of frequency percentage on the basis of failed tests out of total number
of tests Eq. (2).
Eq. (2)
F3 is used for the calculation of amplitude and represents the amount by which test failed and do not
meet the guidelines. It is calculated in three steps:
Excursion is defined as the number of times by which an individual concentration is greater
than the minimum guidelines. The excursion is calculated when the test value must not above the
guideline shown in Eq. (3):
Eq. (3)
The formula to test the value which is not falling below the guideline shown in Eq. (4):
F1 (Scope) =Number of failed parameters
Total number of parameters
æ
èç
ö
ø÷ x 100
F2 (Frequency) =Number of failed tests
Total number of tests
æ
èç
ö
ø÷ x 100
excursioni =Failed test value i
Objectivej
æ
èç
ö
ø÷ - 1
Section 2 of Chapter 4 Environmental Modelling Framework
Technical Report – Submission 5.1 Page No 152
Eq. (4)
Normalized sum of the excursions (NSE) is obtained by dividing the sum of excursions with the total
number of individual tests.
Eq. (5)
Finally F3 is calculated by an asymptotic function that scale normalization by the following equation
Eq. (6):
Eq. (6)
CWQI is obtained by summing three factors using Pythagoras Theorem Eq. (7).
Eq. (7)
The divisor 1.732 is used for normalization of the CWQI values ranges between 0 and 100, where 0
represents the “poor” water quality and 100 represents the “excellent” water quality.
Output
The results are estimated into one of the following categories including excellent, good, fair, marginal
and poor.
Excellent: (CWQI Value 95-100)
The water quality conditions are very close to natural level. The scientist declared this range as
excellent and suitable for many purposes.
Good: (CWQI Value 80-94)
The “Good” level of water quality contains minor degree of threat and fulfils the desirable levels and
very suitable.
Fair: (CWQI Value 65-79)
The “fair” water quality contains occasionally threats and do not meet desirable levels.
Marginal: (CWQI Value 45-64)
The “marginal” water quality level is frequently threatened and meets unsatisfied condition of
desirable levels.
Poor: (CWQI Value 0-44)
The “poor” water quality level is always threatened and totally failed in meeting the desirable levels,
not suitable at all.
1 - e test valuFailed
Objectiveexcursion
i
ji
testsofnumber
excursion1nse
ini
F3 (amplitude) =nse
0.01nse + 0.01
æ
èç
ö
ø÷
732.1
2 F3 2 F2 2F1100CWQI
Section 2 of Chapter 4 Environmental Modelling Framework
Technical Report – Submission 5.1 Page No 153
4. GROUNDWATER MODELLING
It includes the mathematical and physical models for the ground water investigation. The modelling is
applied to imitate the impact of pollutants on ground water quality. There are more chances that
ground water contamination may lead to serious destructions of quality. There is a need to study and
extract the condition of ground water quality. For that purposes, the AquaChem model was selected
and described below:
AquaChem
AquaChem is the type of model, which was developed for the ground water modelling. It represents
numerical and graphical analysis of water quality parameters. The model has fully functional and have
customizable database including chemical and physical parameters for the comprehensive analysis for
the water quality data. It covers a broad range of calculations and methods used for interpreting and
analyzing the quality of the water. The aquaChem contain tools such as charge balances tool, unit
transformations tool, statistical and sample mixing functions for geothermometer calculations.
Geochemical graphs and plots will be used to represent the chemical water characteristics for
analyzing quality data.
Main Features:
Creation of multiple graphs and plots side by side for highlighting the points interactively
and when the data point is clicked, the corresponding samples are highlighted
It has built-in list for the calculators that allow on the fly analysis on water quality
Includes statistical features such as maximum and minimum ranges, arithmetic mean,
standard deviation, interquartile range, skewness, quantile and kurtosis
Identifications of exceedance parameters from water quality standards for samples and
metals
It links with geochemical programs for the calculations of equilibrium concentrations
Model guidelines
Input: Station name, sample collection date, sample list water type and geology are the input data
parameters used in the model shown in Fig. 4.16.
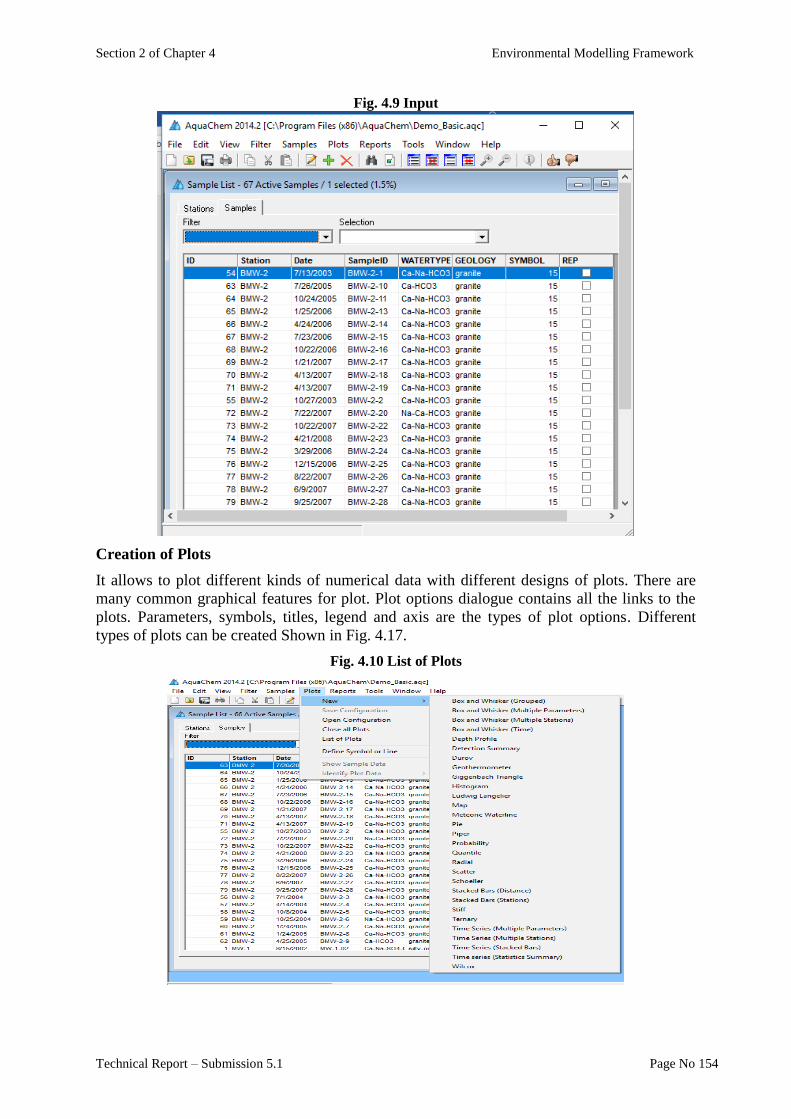
Section 2 of Chapter 4 Environmental Modelling Framework
Technical Report – Submission 5.1 Page No 154
Fig. 4.9 Input
Creation of Plots
It allows to plot different kinds of numerical data with different designs of plots. There are
many common graphical features for plot. Plot options dialogue contains all the links to the
plots. Parameters, symbols, titles, legend and axis are the types of plot options. Different
types of plots can be created Shown in Fig. 4.17.
Fig. 4.10 List of Plots
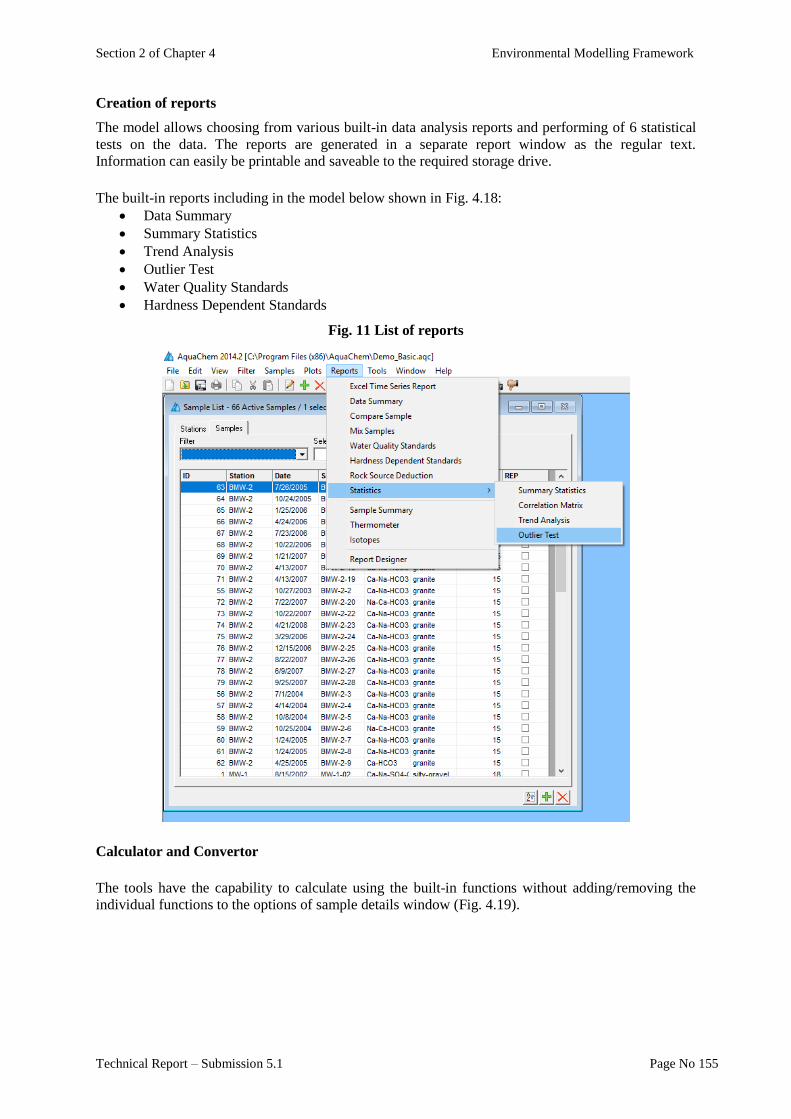
Section 2 of Chapter 4 Environmental Modelling Framework
Technical Report – Submission 5.1 Page No 155
Creation of reports
The model allows choosing from various built-in data analysis reports and performing of 6 statistical
tests on the data. The reports are generated in a separate report window as the regular text.
Information can easily be printable and saveable to the required storage drive.
The built-in reports including in the model below shown in Fig. 4.18:
Data Summary
Summary Statistics
Trend Analysis
Outlier Test
Water Quality Standards
Hardness Dependent Standards
Fig. 11 List of reports
Calculator and Convertor
The tools have the capability to calculate using the built-in functions without adding/removing the
individual functions to the options of sample details window (Fig. 4.19).
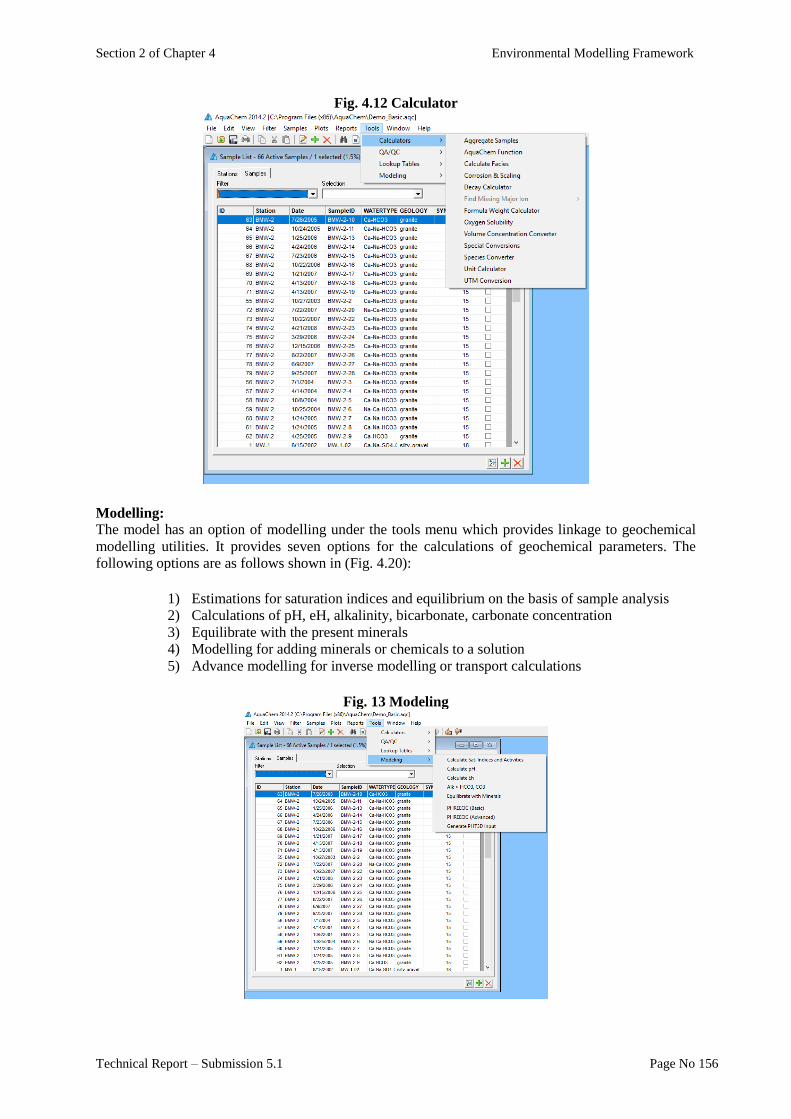
Section 2 of Chapter 4 Environmental Modelling Framework
Technical Report – Submission 5.1 Page No 156
Fig. 4.12 Calculator
Modelling:
The model has an option of modelling under the tools menu which provides linkage to geochemical
modelling utilities. It provides seven options for the calculations of geochemical parameters. The
following options are as follows shown in (Fig. 4.20):
1) Estimations for saturation indices and equilibrium on the basis of sample analysis
2) Calculations of pH, eH, alkalinity, bicarbonate, carbonate concentration
3) Equilibrate with the present minerals
4) Modelling for adding minerals or chemicals to a solution
5) Advance modelling for inverse modelling or transport calculations
Fig. 13 Modeling
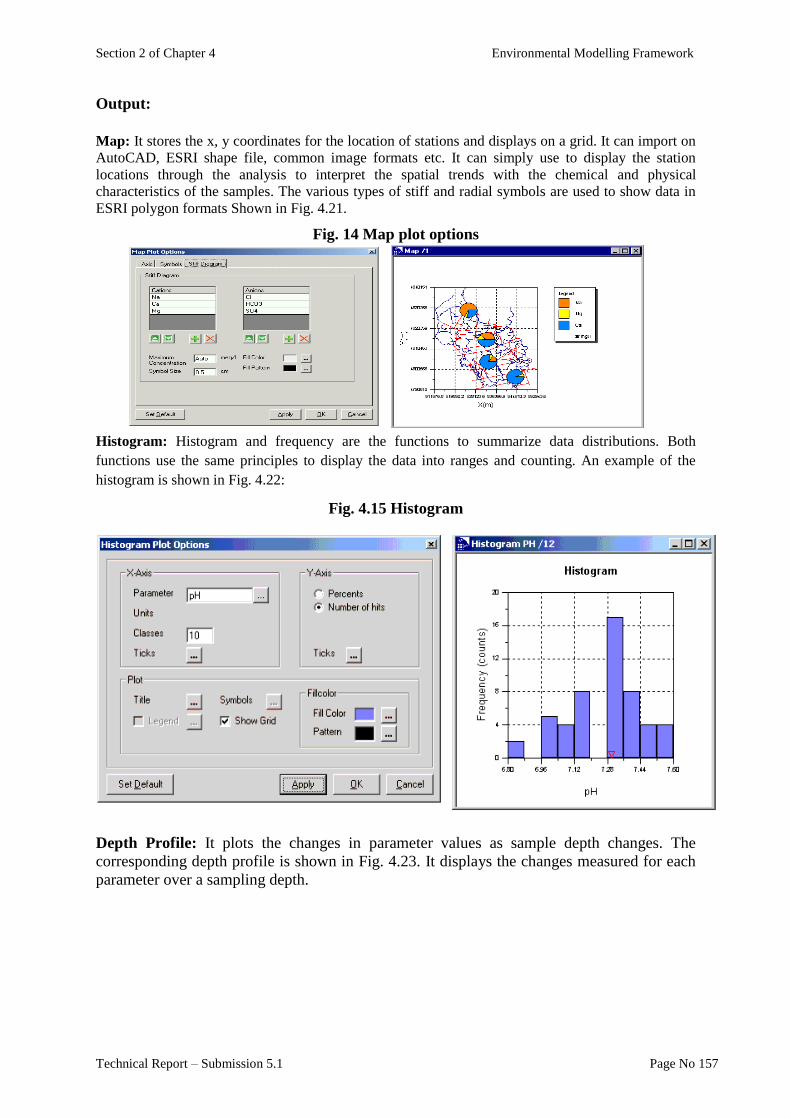
Section 2 of Chapter 4 Environmental Modelling Framework
Technical Report – Submission 5.1 Page No 157
Output:
Map: It stores the x, y coordinates for the location of stations and displays on a grid. It can import on
AutoCAD, ESRI shape file, common image formats etc. It can simply use to display the station
locations through the analysis to interpret the spatial trends with the chemical and physical
characteristics of the samples. The various types of stiff and radial symbols are used to show data in
ESRI polygon formats Shown in Fig. 4.21.
Fig. 14 Map plot options
Histogram: Histogram and frequency are the functions to summarize data distributions. Both
functions use the same principles to display the data into ranges and counting. An example of the
histogram is shown in Fig. 4.22:
Fig. 4.15 Histogram
Depth Profile: It plots the changes in parameter values as sample depth changes. The
corresponding depth profile is shown in Fig. 4.23. It displays the changes measured for each
parameter over a sampling depth.
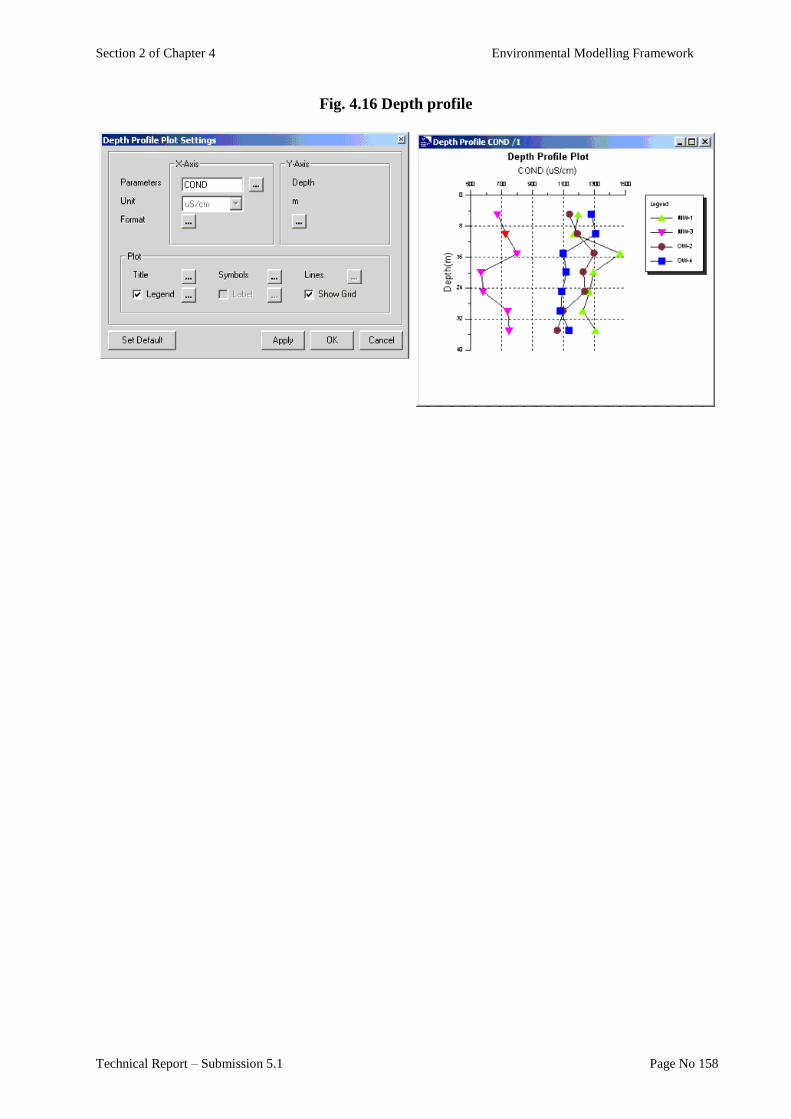
Section 2 of Chapter 4 Environmental Modelling Framework
Technical Report – Submission 5.1 Page No 158
Fig. 4.16 Depth profile


Section 3
Recommendations for Workable Models


Section 3 of Chapter 4 Recommendations for Workable Models for Environmental Modelling
Technical Report – Submission 5.1 Page No 162
Section 3
Recommendations for Workable Models for Environmental Modelling
Sr.
No. Type of Modelling Description
Environmental models used across the world Most suitable
model Model Features
USA Canada UK Europe Australia
1.
Atmospheric Dispersion
Modelling
Based on the
mathematical
modelling for
analysing dispersion
of air pollutants
disperse in
atmosphere.
AERMOD
CALPUFF
ADAM
AERSCREEN
PUFF-PLUME
MLCD
MLDP
SLAB-View
Emissions
Trajectory
ADMS-URBAN
ADMS-Roads
ADMS-Screen
Urban Dispersion
Model
EMIT
AEROPOL (Estonia)
ATSTEP (Germany)
CAR-FMI (Finland)
OSPM
(Denmark)
LADM
PDs AUSMOD
TAPM
DISPMOD
AUSPUFF
Atmospheric
Dispersion
Modelling System
(ADMS-5)
Determination of the air quality
concentrations
Monitor complex terrain variations
NOx chemistry schemes identification
2. Receptor Modelling
Involves mathematical
methods to quantify
the sources of air
pollutants at receptor
location
National air sampling
networks,
Mass balance principle,
chemical mass balance
Positive matrix
factorization (PMF),
Bortas-B
experiment, PM 2.5,
Pollution climate
mapping,
PM 10,
Number size
distributions,
EMEP4UK
Receptor models
(RM), organic carbon
(OC), Gas to particle
conversion
Multivariate
Receptor model
Positive matrix
factorization (PMF)
Analyzes sample data including air and
surface water
Divide large variables into analytical
datasets
Provide scientific help for the review of
water and air quality measurements
3.
Surface Water Quality
Modelling
It involves the
prediction of surface
water pollution using
mathematical
simulation techniques.
EFDC
EXAMS
HSPF
PRZM
Aquachem
WatPro
CWQI
DISPRIN
DESCAR
ARIA
(France)
NRM
(Germany)
MUSIC
CRC
Hunter River water
quality model
Canadian water
quality index
(CWQI)
Provide site specific good quality
measurements
Water suitable equations based on poor and
excellent quality
Combining measurements in a single value
4.
Ground Water Quality
Modelling
It involves the
prediction of ground
water pollution using
Mathematical
simulation techniques.
AQUATOX
BASINS
WMOST
3DLEWASTE
WhAEM2000
Visual MODFLOW
Flex
AQUARIUS
HYSIM SERAM
(Switzerland) Delft 3d suite AquaChem
Creation of multiple graphs and plots for
ground water samples
Allows on-the-fly analysis on water quality
Performs equilibrium concentrations
Statistical analysis

Section 3 of Chapter 4 Recommendations for Workable Models for Environmental Modelling
Technical Report – Submission 5.1 Page No 163
ENVIRONMENTAL MODELLING FOR EIA
The essential purpose of EIA is the choice between a range of alternatives. Any choice among these
can affect several heterogeneous 'elements"- physical, chemical, ecological, and/or social. These
elements are usually interrelated in complicated ways and there is a mass of information.
Application of modelling in IEE/EIA
The application of Modeling in the Environmental Impact Assessment (EIA) process has gained
substantial momentum over the past few years. Even so, the misconception exists that modeling
involves predictions only, and many companies are still unaware of the robust solutions and cost
savings this tool has to offer, when correctly implemented. Accessibility to good quality, up-to-date
spatial information has improved significantly, along with data accuracy.
Fig. 4.24: Usefulness of Modeling in EIA
Major applications of modeling with reference to EIA include those related to:
i. Impact mitigation and control,
ii. Public consultation and participation,
iii. Monitoring and auditing
Likewise, the associated advantages of Modelling in EIA include those related to:
i. ability to perform spatial and temporal analysis;
ii. clearer presentation of results/output;
iii. power of models to store, manage & organize complex data;
iv. integrate and manipulate extracted information from data;
v. ease of changing and updating information/data
As experienced in majority of the cases, the respective stakeholders agree that analyzing
developments in their context during the initial stages of the EIA process, in fact, expedites the
identification of potential aspects and impacts that may have to be assessed while the process goes on.
Potential risk factors may be identified upfront and presented to the client to assess the viability of
proceeding with the project. Environmental models reduce timeframes and usually end up presenting
the client with a cost saving.
In addition to identifying and analyzing potential impacts, models coupled with mapping can act as a
powerful spatial planning tool. For example, a Geographic Information System (GIS) is often used to
identify sites suitable for establishing cemeteries and waste disposal facilities. Overlaying several
spatial datasets (soil type, vegetation, ground and surface water, geology etc.), with specific
assessment criteria for each, can produce a map indicating suitable and unsuitable areas. The resulting
Management of large data sets
Data overlay and analysis of development and natural
resource patterns
Trends analysis Spatial
Analysis

Section 3 of Chapter 4 Recommendations for Workable Models for Environmental Modelling
Technical Report – Submission 5.1 Page No 164
sites can be processed as a component in modelling for the potential environmental impacts that could
occur during different stages as a result of such developments. Modelling can be used in all specialist
studies ranging from air pollution control to wetland delineation as an integral part of the EIA process.
The use of environmental models in EIAs will continue to evolve as dealing with global warming
becomes a worldwide priority. In future, even more planned approaches shall be required to meet the
requirements of authorities and governments, while ensuring sustainable development.
Data Analysis and Modelling in IEE/EIA
A large number of environmental management and planning decisions are based on methodologies that
utilize the spatial analysis tools provided by conventional GIS technologies (e.g. digital mapping
or modeling of future changes). In the context of EIA, modeling allows for consideration of
spatio-temporal dimensions common to environmental, biodiversity and planning issues. This is
of particular significance in land-use planning, where the potential significance and magnitude of an
impact is largely dependent on the spatial location of proposed actions and affected receptors at a
given time. The intrinsic spatial nature of land-use planning and the need to integrate environmental
considerations into plan-making give modeling and mapping tools like GIS, the potential to augment
existing EIA methods and plan-making procedures. Similarly, the spatio-temporal implications of
planning decisions make it a significant tool for assessing potential adverse effects on their integrity.
This is achieved by incorporating spatial evidence into the process and by facilitating assessment of
alternatives (or alternative ecological solutions) definition of mitigation measures and monitoring of
changes over time. In this context, data coalition and analysis through modeling can support a more
baseline-led approach to environmental planning and decision-making.
Modeling provides the means to integrate and assess multiple environmental and planning
considerations in a single interface, supporting the systematic prediction and evaluation of
spatially distributed and cumulative impacts, a key assessment consideration in EIA. The EIA
Directive gives special consideration to the cumulative nature of potential environmental impacts.
Cumulative impacts can derive from several individual aspects of a plan/programme (e.g. pollution,
loss of habitats) having a combined effect. Cumulative effects also arise where each of several aspects
has insignificant effects but together they have a significant additive or synergistic effect (i.e.
greater than the sum of individual effects). Evaluating co-occurring environmental resources and their
status or sensitivity through modeling can help address cumulative effects.
Spatial Analysis in EIA
Spatial analysis typically deals with site selection or site suitability assessment of both point/polygon
(e.g. landfill) and linear projects (e.g. railway). This analysis finds its practical applications primarily
in urban and rural planning and development control in Pakistan.
An essential ingredient in spatial analysis is that of interpolation. Interpolation technique combines
multi-criteria analysis used in modelling with mapping tools like GIS. This technique is based on the
ability of models to combine multiple datasets, and the relative importance/significance value for
each assessment criteria or dataset, in a spatially-specific manner. This technique allows for
the systematic aggregation of co-occurring environmental factors. The Interpolation results identify
areas with relative degrees of environmental sensitivity, reflecting the assigned weights as established
by the assessor or gathered through public participation. It can play a significant role in facilitating
the assessment of potential commonalities, overlaps and interactions between environmental
considerations, as well as contributing to the assessment of cumulative effects. Likewise, it could be
used to jointly map and spatially assess sensitive environmental areas.
Section 3 of Chapter 4 Recommendations for Workable Models for Environmental Modelling
Technical Report – Submission 5.1 Page No 165
The outputs illustrate the degree of interaction and overlap between co-occurring environmental
factors (a larger amount of environmental sensitivities occurring at one location can be illustrated as
darker shaded). In this way, they help identify environmentally sensitive areas as well as areas free of
environmental constraints that are, therefore, suitable for development. Overlay mapping can either
combine all relevant environmental aspects (as in SEA) or focus on a set of thematically aspects (such
as biodiversity-related considerations for biodiversity impact assessment).
Step by step approach –Modelling & EIA
Screening & Scoping
Screening is the process through which a decision is taken as to EIA is required for a particular
project.
Data coalition should be started early in the process to ensure the timely application of modelling. An
inventory of relevant available datasets shall need to be collected in this step. Data from third parties
may require additional time and effort to collate and integrate into modelling. Delays in data
provision can affect their timely incorporation and, thereby, restrain the effectiveness of modelling.
Prepare a data checklist to verify that all relevant datasets have been gathered. Based on the
significant environmental factors and the assessment scope, prepare a list of required spatial
datasets. To assist the gathering and incorporation of such datasets, and support data management
tasks, record when the dataset was provided, in which format, who provided it (i.e. source),
whether it included any metadata or quality statement, and whether it contained any
copyright/licensing conditions. This information can be of significant value when describing the
difficulties encountered or any data limitations in the Environmental Report. It can also assist future
EIAs, facilitating data retrieval and quality control, as well as establishing priorities for future
data collation.
Impact Analysis
Impact prediction is a way of ‘mapping’ the environmental consequences of the significant aspects of
the projects and its alternatives. Environmental impact can never be predicted with absolute certainty,
and this is all the more reason to consider all possible factors and take all possible precautions for
reducing the degree of uncertainty.
To facilitate the spatial assessment, transparency tool in vector models or weighted-overlay
operations with raster models can be applied. This would contribute to a more comprehensive
environmental baseline.
Recognizing Alternatives
Spatially specific definition of sectoral land-uses and areas of policy application need to be devised
from the earliest stages of plan development. Although the zoning of lands is more explicit at local
area level, the definition of indicative strategic areas at county level can help address any spatial
issues. These strategic zonings potentially contribute to a more balanced and equally distributed
development plan that ensures environmental protection while allowing for economic and social
development.
Modelling and mapping can facilitate in figuring out the alternatives for EIA in several ways. This can
be done simply by bringing hard copy maps to the workshop and encouraging planners, stakeholders
and/or the general public to draw on them. Alternatively, a mediator could use either GIS or acetate
maps to draw up different zonings resulting from workshop deliberations. These maps can be further

Section 3 of Chapter 4 Recommendations for Workable Models for Environmental Modelling
Technical Report – Submission 5.1 Page No 166
defined by presenting them back to participants, appropriately amending them and reaching consensus
on the final alternatives to be considered in the assessment.
Modelling tools can be used to simulate and explore possible future scenarios based on population
trends, land-use changes, climate, energy supply and consumption, waste water volume and treatment
capacity, etc. These can further inform the identification and development of reasonable and realistic
alternatives.
Assessment Alternative
Spatially specific areas of zoning or policy can be contrasted with the previously prepared
environmental sensitivity maps. This allows for the rapid and clear detection of potential land-use
conflicts. The areas zoned for development that coincide spatially (i.e. overlay) with the areas
containing environmental sensitivities (i.e. ‘hot-spots’ illustrating a high degree of environmental
sensitivity) can be easily identified and quantified.
The number of planning applications for a particular project-type within the study area can be used to
inform the development and assessment of alternatives. The assessment of alternatives can be
informed, for example, by the number of planning applications for rural housing or the number of
wind farms or quarrying permits in a sensitive landscape area. The greater the number of planning
applications, higher the development pressure, and the more potential there will be for (cumulative)
impacts. Also, arguably, the higher the environmental sensitivity of the area and the higher the
number of planning applications, the greater the impact will be.
Areas under urban/industrial/infrastructure development pressure can be quantified and mapped using
GIS and modelling softwares. Quantitative values often provide additional insight into the assessment.
Reporting or matrix-based assessment can also be used to support the spatial analysis, particularly
where the alternatives have not been (or cannot be) mapped.
Spatial assessment of proposed alternatives can be used to detect and highlight potential direct and
cumulative environmental effects/impacts.
The modelling and mapping of environmental constraints alongside the spatially specific provision of
a plan can facilitate easy and early anticipation of the principal direct and cumulative impacts
associated with the accommodation of growth. These can be further assessed using other published
documents/data. The geographic representation of environmental resources/sensitivities and
development pressures within the area can significantly enhance the explicitness of assessments.
The resulting assessment maps can also be used as complementary illustrative Fig.s in the EIA
Report. Potential issues associated with each alternative can be shown along with the ‘preferred’
option in particular and give all environmental and planning considerations a geographical context.
Baseline Mapping & Modelling
Maps for environment baseline mapping & modelling can be generated in this process. Any additional
spatial data gathered throughout the EIA should be mapped and modelled, wherever needed, to
provide a full account of the baseline of environmental factors. Any data deficiencies should also be
addressed, as far as feasible, throughout the assessment. All the relevant environmental datasets can
eventually be overlain to assess composite environmental sensitivities within the study area.
The coalition of data shall continue, and datasets not gathered early in the assessment can still be
incorporated (when available). The inclusion of additional information can be of significant value to
the subsequent stages of the EIA process.
Chapter 5
Environmental Monitoring and Reporting
Framework


Section 1 of Chapter 5 Introduction and Background
Technical Report – Submission 5.1 Page No
169
Section 1
Introduction and Background

Section 1 of Chapter 5 Introduction and Background
Technical Report – Submission 5.1 Page No 171
Section 1
Introduction and Background Establishing environmental monitoring mechanism is essential for ensuring and safeguarding the
environment for maintaining its goods and services to sustain development in the province. It is also
an effective tool for following progress of development initiatives, monitor the compliance of
polluters, monitor environmental conditions of the region and provide guiding outline to improve
implementation approach. Therefore systematic approach to environmental monitoring is critical for
achieving Sustainable Development in Punjab.
Environmental monitoring can be described as a programme of recurring, systematic studies that
reveals the state of the environment. The specific aspects of the environment to be studied are
determined by environmental objectives and environmental legislation. The purpose of environmental
monitoring is to assess the progress made to achieve given environmental objectives and to help
detect new environmental issues3. It can also be defined as a process with certain intervals repeated
measurements of relevant characteristics with comparable (standardized) methods to follow changes
and trends in nature and the environment over a (longer) period of time taking into account
differentiation of the anthropogenic variations and trends from natural cycles and trends4.
Both of the definitions are dealing with repeated measurements to assess changes in the environment.
Monitoring of environmental conditions is central to informed decision making. It allows the
evaluation of the success or failure of management projects or can pinpoint new environmental
problems that need regulatory attention for the implementation of environmental standards. The
results of these assessments can be quantitative in the form of data and information or alternatively
qualitative, based on subjective observation.
In Punjab the starting point is more difficult and unrewarding in the beginning, as there is very little
data to assess change. Carrying out monitoring for environmental quality is a mandatory function of
EPA Punjab which is bounded by the Punjab Environmental Protection Act, 2012 in Section 6
(1)(i) to:
“Establishes systems and procedures for surveys, surveillance, monitoring, measurement,
examination, investigation, research, inspection and audit to prevent and control pollution,
and to estimate the costs of cleaning up pollution and rehabilitating the environment in
various sectors”
As per the Punjab Environmental Quality Standards, EPA is responsible for monitoring of ambient
air; industrial gaseous emissions; municipal and liquid industrial effluents; drinking water; Noise;
Motor vehicle exhaust and noise; treatment of liquid and disposal of bio medical waste.
In existing structure, the Monitoring, Labs and Implementations (ML&I) directorate is tasked with
looking after the environmental monitoring aspect and delves deep into the laboratories, and
technology transfer subsections of the ML&I directorate. It has been observed that EPA conducts
monitoring exercises for two streams; assessing pressures on the environment and complaint based
monitoring. Director (ML&I) instructs DD (Labs) to carry out monitoring of ambient air, emissions,
noise and smoke across the province. This exercise however, is not conducted according to a specific
schedule or plan but randomly. Complaint based monitoring is carried out to assess environmental
3 Definition by Joint Research Centre (JRC), European Union. Retrieved from
https://ec.europa.eu/jrc/en/printpdf/113097 4 Definition by Joint Research Centre (JRC), European Union.
Section 1 of Chapter 5 Introduction and Background
Technical Report – Submission 5.1 Page No 172
pollution created by specific sources in different districts of Punjab. Once a complaint for the issuance
of EIA or by public/private complainer is registered with the DD (labs) or DD (ML&I) then an order
is issued, to an inspector at the District level, to carry out site inspection and collection of
sample. Sample collection is done according to the Samples Rules, 2001 but strict adherence is
seldom observed.
At the current state, environmental monitoring is fairly stochastic and available data seems to be very
scattered. There are no organized environmental long term monitoring programs related to any
environmental problem. There is not either sufficient information available on what kind of
environmental monitoring programs exist in Punjab. In our observation most of the datasets are not
publicly available. Environmental monitoring and reporting process is not sufficiently functional
because:
There is no comprehensive and coherent monitoring plan which covers all relevant aspects of
environment (air, noise, water, waste water, etc.), industrial sectors, geographic regions and
assesses/ enforces compliance with notified EQS and conditions set out in EIA.
Monitoring data is not used to the fullest possible extent or used very late so that the
information becomes outdated
It does not have a role in monitoring of biodiversity (endangered species and habitats,
migratory birds, forests, fish, etc.), climate change, Persistent Organic Pollutants (POPs),
hazardous waste, and very limited contribution in protecting and conserving sensitive areas of
Punjab such as RAMSAR sites.
It has limited collaboration with other government departments to jointly monitor and utilize
environmental data from other sources (forest, ground water table, weather data or
information related to the ecology of national parks and protected areas). EPA could have
been a custodian of all environmental data, irrespective to which organization would do the
actual monitoring. That role would have been logical as EPA has an obligation to prepare
State of the Environment reports (SOER’s).
It is evident that there is no time based reporting cycle and EPA Punjab has never prepared
annual environmental state of the environment report as mention in PEPA 1997 (amended
2012) Section 6 (1) (d). It doesn’t develop any journal or publication, providing a summary of
data collected.
The involvement of private sector environmental consultants and laboratories and assurance
of their competencies and quality is not properly organized
Data quality is questionable as there are no SOP’s for sampling of all parameters or sufficient
training for sample takers.
Scientific procedures are not followed while collecting samples (e.g. sampling is not
representative; statistical analysis cannot be performed on the basis of single reading)
There is no data management strategy in place which can ensure that all relevant data is
assimilated in a coordinated manner on a unified platform which can be available in a useable
form.
The modern technology is not used sufficiently as modelling, GIS techniques or on-line
measurement technologies are not in place.
Beyond this, there are multiple reasons to monitor issues related to environment in the province. To
assess this in detail is a key factor in understanding what needs to be done to safeguard the health and
well-being of ecosystems and citizens, protecting the public interest. Other key motivation factors to
organize environmental monitoring are legal obligations in domestic laws and reporting obligations of
Multilateral Environmental Agreements (MEA’s).
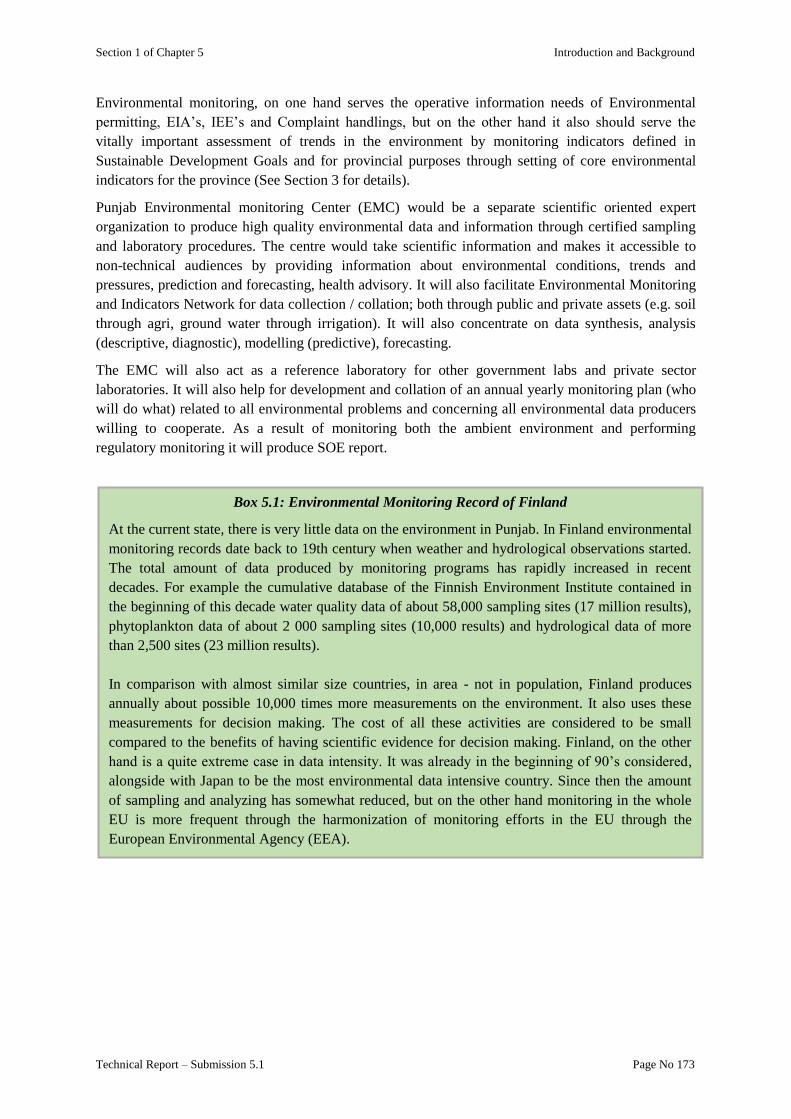
Section 1 of Chapter 5 Introduction and Background
Technical Report – Submission 5.1 Page No 173
Environmental monitoring, on one hand serves the operative information needs of Environmental
permitting, EIA’s, IEE’s and Complaint handlings, but on the other hand it also should serve the
vitally important assessment of trends in the environment by monitoring indicators defined in
Sustainable Development Goals and for provincial purposes through setting of core environmental
indicators for the province (See Section 3 for details).
Punjab Environmental monitoring Center (EMC) would be a separate scientific oriented expert
organization to produce high quality environmental data and information through certified sampling
and laboratory procedures. The centre would take scientific information and makes it accessible to
non-technical audiences by providing information about environmental conditions, trends and
pressures, prediction and forecasting, health advisory. It will also facilitate Environmental Monitoring
and Indicators Network for data collection / collation; both through public and private assets (e.g. soil
through agri, ground water through irrigation). It will also concentrate on data synthesis, analysis
(descriptive, diagnostic), modelling (predictive), forecasting.
The EMC will also act as a reference laboratory for other government labs and private sector
laboratories. It will also help for development and collation of an annual yearly monitoring plan (who
will do what) related to all environmental problems and concerning all environmental data producers
willing to cooperate. As a result of monitoring both the ambient environment and performing
regulatory monitoring it will produce SOE report.
Box 5.1: Environmental Monitoring Record of Finland
At the current state, there is very little data on the environment in Punjab. In Finland environmental
monitoring records date back to 19th century when weather and hydrological observations started.
The total amount of data produced by monitoring programs has rapidly increased in recent
decades. For example the cumulative database of the Finnish Environment Institute contained in
the beginning of this decade water quality data of about 58,000 sampling sites (17 million results),
phytoplankton data of about 2 000 sampling sites (10,000 results) and hydrological data of more
than 2,500 sites (23 million results).
In comparison with almost similar size countries, in area - not in population, Finland produces
annually about possible 10,000 times more measurements on the environment. It also uses these
measurements for decision making. The cost of all these activities are considered to be small
compared to the benefits of having scientific evidence for decision making. Finland, on the other
hand is a quite extreme case in data intensity. It was already in the beginning of 90’s considered,
alongside with Japan to be the most environmental data intensive country. Since then the amount
of sampling and analyzing has somewhat reduced, but on the other hand monitoring in the whole
EU is more frequent through the harmonization of monitoring efforts in the EU through the
European Environmental Agency (EEA).
There has been an effort to reduce monitoring costs through satellite imagery, modelling,
automated monitoring stations/equipment, field measurements and citizen observations. These
have had quite limited impacts in savings – for example through modelling it is assumed that
monitoring of chemicals in the environment could be reduced maximally by 20% from current
levels. Despite development of more cost-effective monitoring technology, tools and methods,
society has grown data hungry. Evidence based decision making and environmental awareness of
citizens requires significant amount of data and their continuous monitoring.

Section 2
Principles for Environmental Monitoring
and Reporting


Section 2 of Chapter 5 Principle for Environmental Monitoring and Reporting
Technical Report – Submission 5.1 Page No 177
Section 2
Principles for Environmental Monitoring
and Reporting There are eight governing principles that a monitoring and reporting system should adhere to in order
to ensure that it is fit-for-purpose;
1. Scientific
Based on rigorous, open and repeatable scientific investigation
Scientifically credible and accepted by experts, stakeholders and end users
2. Comprehensive
Provide comprehensive data that is;
Representative of key issues and broader impacts or effects
Sufficient for informed decision making
Cover the objectives of the intervention both objective (e.g. Factual, quantitative) and
subjective (e.g. Opinion based, qualitative) evidence
Provide evidence on both the costs and benefits of the legislation
Includes consideration of community, social and traditional knowledge
3. Proportionate
Responsive to changes within a useful reporting time scale
Weight of evidence provided should reflect the importance placed on different aspects of
the intervention
Compatible with other indicators to present an overall picture
Maintain balance between the extent of information requested and the cost of its
provision
4. Effectiveness and efficiency
Deliver monitoring and reporting activities in a coordinated way that makes the best use
of public and private resources
Readily communicable, interesting, clear and easy to understand
Useful for prediction and forecasting
Relevant to needs of policy-makers or enable individuals to make meaningful decisions
5. Standardized data and data management
Data should be standardized
Respect data management protocols and develop new protocols as appropriate, to ensure
compatibility and facilitate the effective sharing of data, support data integrity, permit
comprehensive data analysis, and protect historical records.
6. Verification & Validation
Evaluate how closely the documents and procedures were followed during data
generation
Identify the project needs for records, documentation, and technical specifications for
data generation; and determining the location and source of these records
Verifying records that are produced or reported against the method, as per the field and
analytical operations such as sample collection, sample receipt, sample preparation,
sample analysis etc.

Section 2 of Chapter 5 Principle for Environmental Monitoring and Reporting
Technical Report – Submission 5.1 Page No 178
Use analytic & sample-specific processes that extend the evaluation of data beyond
method or procedural compliance (i.e., data verification) to determine the analytical
quality of a specific data set.
7. Timeliness
Timing of reporting should align with the requirement of related agencies like EPA,
EP&CCD and IETT
Provide data that is up-to-date at the point of use
8. Accessibility
All evidence gathered should be made available to the general public (subject to
appropriate aggregation and confidentiality limitations).
Section 3
Environmental Monitoring
&
Reporting Framework

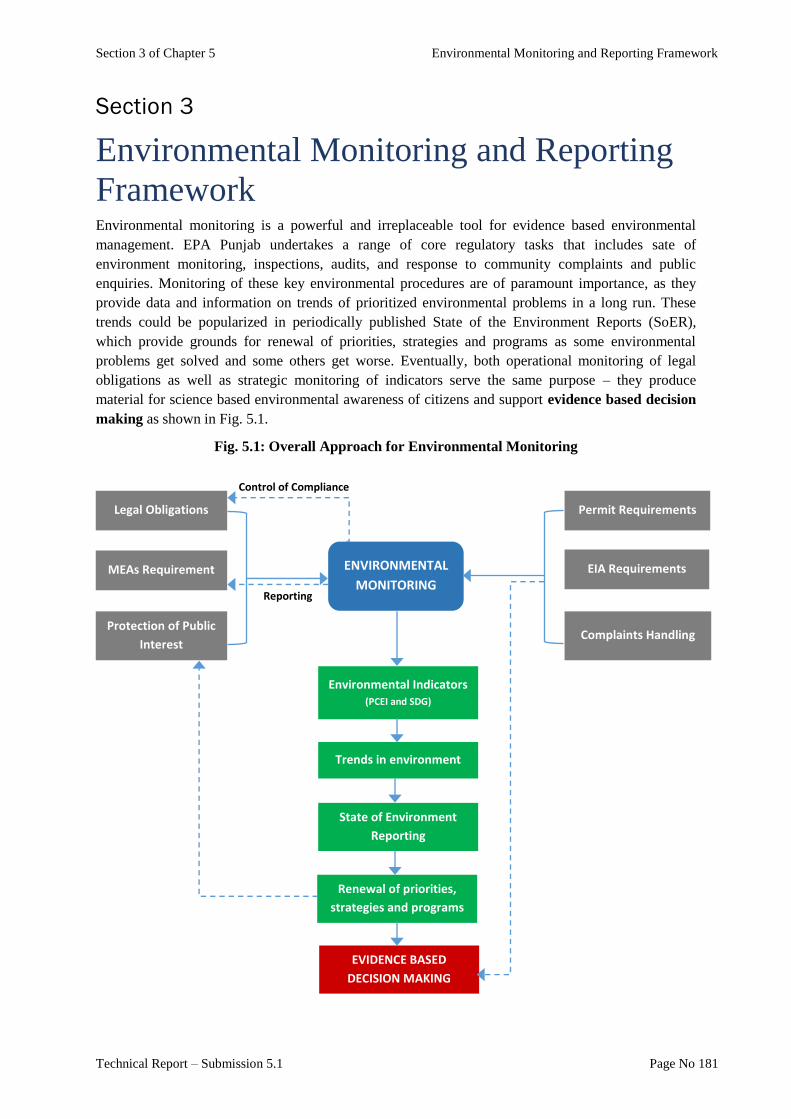
Section 3 of Chapter 5 Environmental Monitoring and Reporting Framework
Technical Report – Submission 5.1 Page No 181
Section 3
Environmental Monitoring and Reporting
Framework Environmental monitoring is a powerful and irreplaceable tool for evidence based environmental
management. EPA Punjab undertakes a range of core regulatory tasks that includes sate of
environment monitoring, inspections, audits, and response to community complaints and public
enquiries. Monitoring of these key environmental procedures are of paramount importance, as they
provide data and information on trends of prioritized environmental problems in a long run. These
trends could be popularized in periodically published State of the Environment Reports (SoER),
which provide grounds for renewal of priorities, strategies and programs as some environmental
problems get solved and some others get worse. Eventually, both operational monitoring of legal
obligations as well as strategic monitoring of indicators serve the same purpose – they produce
material for science based environmental awareness of citizens and support evidence based decision
making as shown in Fig. 5.1.
Fig. 5.1: Overall Approach for Environmental Monitoring
MEAs Requirement
Protection of Public
Interest
Legal Obligations
ENVIRONMENTAL
MONITORING
Permit Requirements
EIA Requirements
Complaints Handling
Control of Compliance
Reporting
Environmental Indicators (PCEI and SDG)
Trends in environment
State of Environment
Reporting
Renewal of priorities,
strategies and programs
EVIDENCE BASED
DECISION MAKING
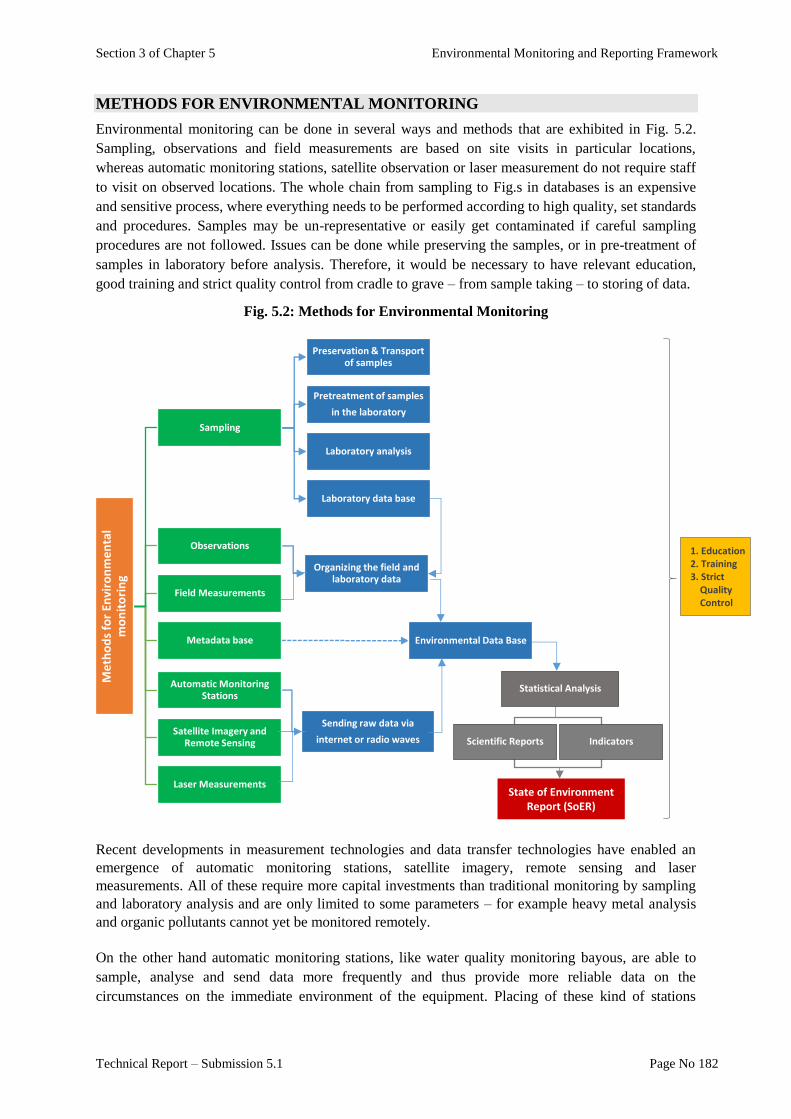
Section 3 of Chapter 5 Environmental Monitoring and Reporting Framework
Technical Report – Submission 5.1 Page No 182
METHODS FOR ENVIRONMENTAL MONITORING
Environmental monitoring can be done in several ways and methods that are exhibited in Fig. 5.2.
Sampling, observations and field measurements are based on site visits in particular locations,
whereas automatic monitoring stations, satellite observation or laser measurement do not require staff
to visit on observed locations. The whole chain from sampling to Fig.s in databases is an expensive
and sensitive process, where everything needs to be performed according to high quality, set standards
and procedures. Samples may be un-representative or easily get contaminated if careful sampling
procedures are not followed. Issues can be done while preserving the samples, or in pre-treatment of
samples in laboratory before analysis. Therefore, it would be necessary to have relevant education,
good training and strict quality control from cradle to grave – from sample taking – to storing of data.
Fig. 5.2: Methods for Environmental Monitoring
Recent developments in measurement technologies and data transfer technologies have enabled an
emergence of automatic monitoring stations, satellite imagery, remote sensing and laser
measurements. All of these require more capital investments than traditional monitoring by sampling
and laboratory analysis and are only limited to some parameters – for example heavy metal analysis
and organic pollutants cannot yet be monitored remotely.
On the other hand automatic monitoring stations, like water quality monitoring bayous, are able to
sample, analyse and send data more frequently and thus provide more reliable data on the
circumstances on the immediate environment of the equipment. Placing of these kind of stations
Me
tho
ds
for
Envi
ron
me
nta
l m
on
ito
rin
g
Sampling
Preservation & Transport of samples
Pretreatment of samples
in the laboratory
Laboratory analysis
Laboratory data base
Observations
Organizing the field and laboratory data
Field Measurements
Metadata base Environmental Data Base
Automatic Monitoring Stations
Sending raw data via
internet or radio waves Satellite Imagery and
Remote Sensing
Laser Measurements
1. 1. Education 2. 2. Training 3. 3. Strict 4. Quality 5. Control
Statistical Analysis
Scientific Reports Indicators
State of Environment Report (SoER)

Section 3 of Chapter 5 Environmental Monitoring and Reporting Framework
Technical Report – Submission 5.1 Page No 183
require understanding of environmental conditions and can be done only by environmental experts.
Also understanding the representativeness of that sampling location is a task suitable for experts.
FRAMEWORK FOR AMBIENT ENVIRONMENT MONITORING AND
REPORTING
The information explosion is widening the gap between citizens, decision makers and scientists.
Therefore it is extremely difficult for a Decision Maker or even a layman to get a holistic picture of
changes in the environment – even scientists get lost in the labyrinth of numbers without meanings.
The absence of meaningful environmental information is a problem for sensible management of
environmental issues. Meaningful and reliable information is a key management tool in environmental
management at all levels including national level.
‘Indicators represent an empirical model of reality, not reality itself, but they must, nonetheless, be
analytically sound and have fixed methodology for measurement’5.
Punjab EMC will use three steps structural approach for environmental indicators monitoring and
reporting that includes;
1. Environmental Monitoring and Indicators Network
2. Pressure-State-Response Model for Environmental Indicators
3. DPSIR Model for Monitoring and Reporting
(i) Environmental Monitoring and Indicators Network (EMIN)
In order to design environmental monitoring programmes for Punjab in a cost-effective manner it
would be feasible to apply EMIN- process (Environmental Monitoring and Indicators Network) 6
. It
starts from defining what kind of indicator framework should be selected for selecting indicators for
Provincial Core Set of Environmental Indicators (PCEI).
Fig. 5.3: Structure for Environmental Monitoring and Indicators Network (EMIN)
5 Hammond, A. etal. 1995. Environmental Indicators: A systematic approach to measuring and reporting on
environmental policy performance in the context of sustainable development. World Resources Institute 6 EMIN is a cost-efficient way to have sufficient understanding on the nature of environmental problems that
Punjab is facing now
Envi
ron
me
nta
l Mo
nit
ori
ng
and
In
dic
ato
rs N
etw
ork
(EM
IN)
Data sharing protocols/policy
Meta-data base
Environmental data base
State of Environment Report (SoER) for
Punjab
Sustainable decisions in the province
Assessment of hot spots on all 10
problems Gaps in environmental monitoring
Top 10 environmental problems
Indicators for top 10 environmental
problems Provincial Core set of Environmental
Indicators (PCEI)
Renewed Monitoring Programs
Section 3 of Chapter 5 Environmental Monitoring and Reporting Framework
Technical Report – Submission 5.1 Page No 184
The EMIN-process seeks to allocate future environmental monitoring resources optimally by
assessing environmental monitoring needs in a holistic and participatory expert process. Following
steps involved for an effective EMIN exercise in Punjab;
• Invite all environmental data holders, including government agencies, academic institutions,
I(NGO)’s and other data holders and monitoring organizations to Environmental Monitoring
and Indicators Network (EMIN) to support efforts of Government of Punjab through the
Environmental Protection Department (EPD) or future Environment Protection and Climate
Change Department (EP&CCD) to get and share reliable environmental data
• Initiate discussions on data sharing policies of Punjab
• Define the most important environmental problems of Punjab
• Prioritize Top-10 environmental problems with a system analytic method
• Perform a preliminary spatial analysis on possible “hot-spots” for each environmental
problem
• Define environmental indicators for prioritized environmental problems
• Assess existing environmental monitoring programmes and data sets of different data
producers
• Create a meta-database on environmental monitoring and research
• Assess gaps between existing monitoring and defined indicators
• Create a Provincial Core Set of Environmental Indicators (PCEI), also taking into account
obligations from MEA’s and SDG’s
• Making gap analysis on monitoring (current versus PCEI)
• Fill the observed gaps in monitoring by establishing necessary monitoring programmes with
defined locations, sampling/measurement intervals and methods
• Draft a data-sharing policy for Punjab and/or contracts with data holders to provide data for
open databases and/or production of the State of the Environment book and periodic state of
the Environment reporting with PCEI-indicators
• Establish environmental databases including the EMIS and/or links to existing databases
As a part of the EMIN-process, the future ‘Strategy and Policy Department of Environment Protection
and Climate Change Department’ would need to do a complete meta-database survey. Other than
EMC, there are many other departments of Punjab and a variety of non-government institutions l that
are also collecting environmental monitoring data and can contribute in meta data base. These are the
stakeholders that can be involved in the State of Environment Reporting process, either as providers
of information, advice or expertise, or as users or interested parties in the conclusions and
recommendations in the annual SoE report. Fig. 5.4 provides a network of stakeholders that can play
role in meta-database and SoE monitoring and reporting.

Section 3 of Chapter 5 Environmental Monitoring and Reporting Framework
Technical Report – Submission 5.1 Page No 185
Fig. 5.4: Network of Stakeholders with a role in Metadata Base and SoE monitoring and
reporting
Indicator sets are usually based of frameworks and they are steering the development. The purpose
of frameworks is to ensure that information is balanced and include minimally three dimensions:
Pressures to ecosystems and human health, State of the Environment and Societal Responses as
required in the traditional P-S-R framework of the OECD (Organization for Economic Cooperation
and Development)7. Punjab EMC and EP&CCD will use 2 models for environmental indicators
monitoring and reporting.
(ii) Pressure-State-Response Framework for Environmental Indicators
The PSR model helps in defining human activities that exert pressures on the environment and affect
its quality and the quantity of natural resources i.e. state. Society responds to these changes through
environmental, general economic and sectoral policies and through changes in awareness and
behaviour, termed as societal response (Fig. 5.5). EMC may start with PSR Model to identify the
pollutants/pressures impacting the state of environment.
There are 2 defining characteristics of indicators:
1. Indicators reduce the number of measurements and parameters that normally would be
required to give. As a consequence, the size of an indicator set and the level of detail
contained in the set need to be limited. A set with a large number of indicators will tend to
clutter the overview it is meant to provide.
2. Indicators simplify information about complex phenomena to improve communication. Due
to this simplification and adaptation to user needs, indicators may not always meet strict
scientific demands to demonstrate causal chains.
7 This Pressure-State-Response framework, following a cause-effect-social response logic, was developed by the
OECD which is increasingly widely accepted and internationally adopted, it can be applied at provincial level
(as in this report), at sectoral levels, at the level of an individual industrial firm, or at the community level.
EP&CCD and EMC
Government Departments/
Agencies
International Organizations
Academia
Industries / Chambers/
Associations
Private Sector and
Public Sector Companies
NGO
Local Government
&Municipalities
Provincial: Irrigation Department, Punjab Meteorological Department, HUD&PHED National: Pakistan Space and Upper Atmosphere Research Commission Others: Ministries, Statistical departments
Such as World Bank, Asian Development Bank, USAid, WHO, JMP Programs
Research Institutes Universities Govt. Research Organization like Pakistan Council of Scientific and Industrial Research (PCSIR)
Such as Leather Associations Brick Kilns Association Chamber of Commerce & Industries
Consultancy Firms Certified Private Laboratories
Public Sector Companies like Punjab Saaf Pani or Waste Management Companies
Environmental like WWF Industry specific
Health
Such as WASAs, Municipalities,
Metropolitan Corporations
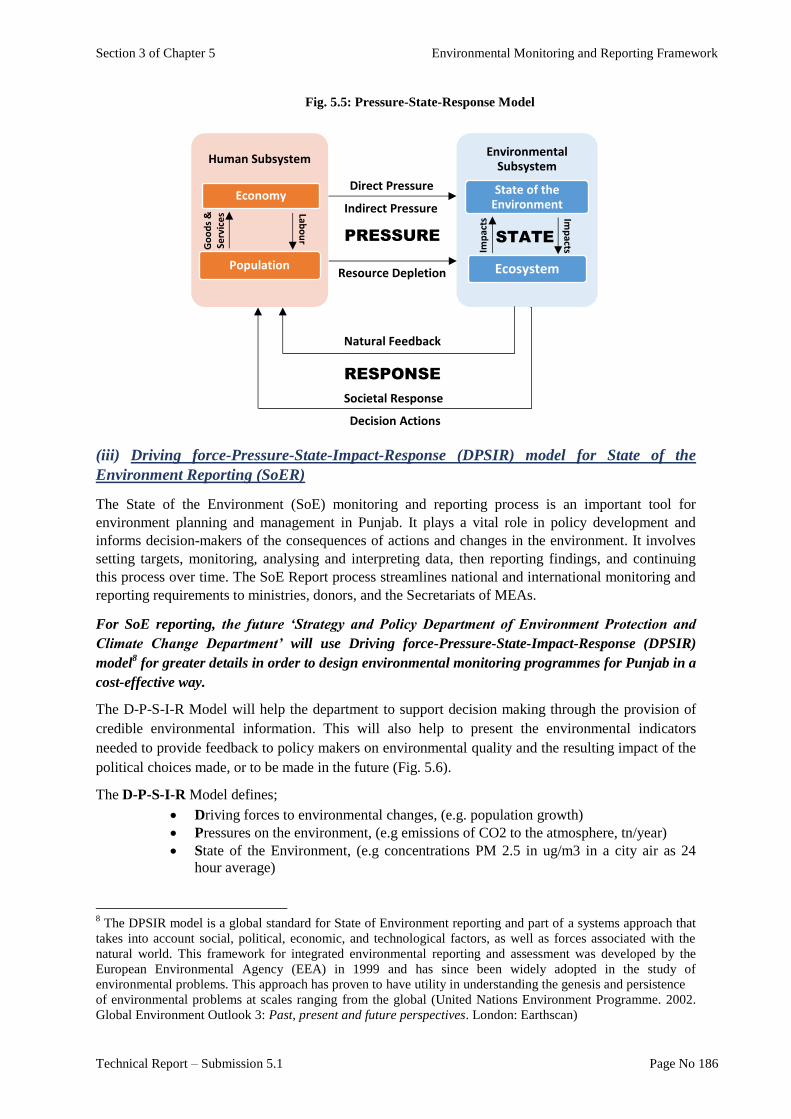
Section 3 of Chapter 5 Environmental Monitoring and Reporting Framework
Technical Report – Submission 5.1 Page No 186
Fig. 5.5: Pressure-State-Response Model
(iii) Driving force-Pressure-State-Impact-Response (DPSIR) model for State of the
Environment Reporting (SoER)
The State of the Environment (SoE) monitoring and reporting process is an important tool for
environment planning and management in Punjab. It plays a vital role in policy development and
informs decision-makers of the consequences of actions and changes in the environment. It involves
setting targets, monitoring, analysing and interpreting data, then reporting findings, and continuing
this process over time. The SoE Report process streamlines national and international monitoring and
reporting requirements to ministries, donors, and the Secretariats of MEAs.
For SoE reporting, the future ‘Strategy and Policy Department of Environment Protection and
Climate Change Department’ will use Driving force-Pressure-State-Impact-Response (DPSIR)
model8 for greater details in order to design environmental monitoring programmes for Punjab in a
cost-effective way.
The D-P-S-I-R Model will help the department to support decision making through the provision of
credible environmental information. This will also help to present the environmental indicators
needed to provide feedback to policy makers on environmental quality and the resulting impact of the
political choices made, or to be made in the future (Fig. 5.6).
The D-P-S-I-R Model defines;
Driving forces to environmental changes, (e.g. population growth)
Pressures on the environment, (e.g emissions of CO2 to the atmosphere, tn/year)
State of the Environment, (e.g concentrations PM 2.5 in ug/m3 in a city air as 24
hour average)
8 The DPSIR model is a global standard for State of Environment reporting and part of a systems approach that
takes into account social, political, economic, and technological factors, as well as forces associated with the
natural world. This framework for integrated environmental reporting and assessment was developed by the
European Environmental Agency (EEA) in 1999 and has since been widely adopted in the study of
environmental problems. This approach has proven to have utility in understanding the genesis and persistence
of environmental problems at scales ranging from the global (United Nations Environment Programme. 2002.
Global Environment Outlook 3: Past, present and future perspectives. London: Earthscan)
Human Subsystem
Economy
Population
Environmental Subsystem
State of the Environment
Ecosystem
PRESSURE STATE
RESPONSE
Natural Feedback
Societal Response
Decision Actions
Direct Pressure
Indirect Pressure
Resource Depletion
Imp
acts Imp
acts
Labo
ur
Go
od
s &
Se
rvic
es
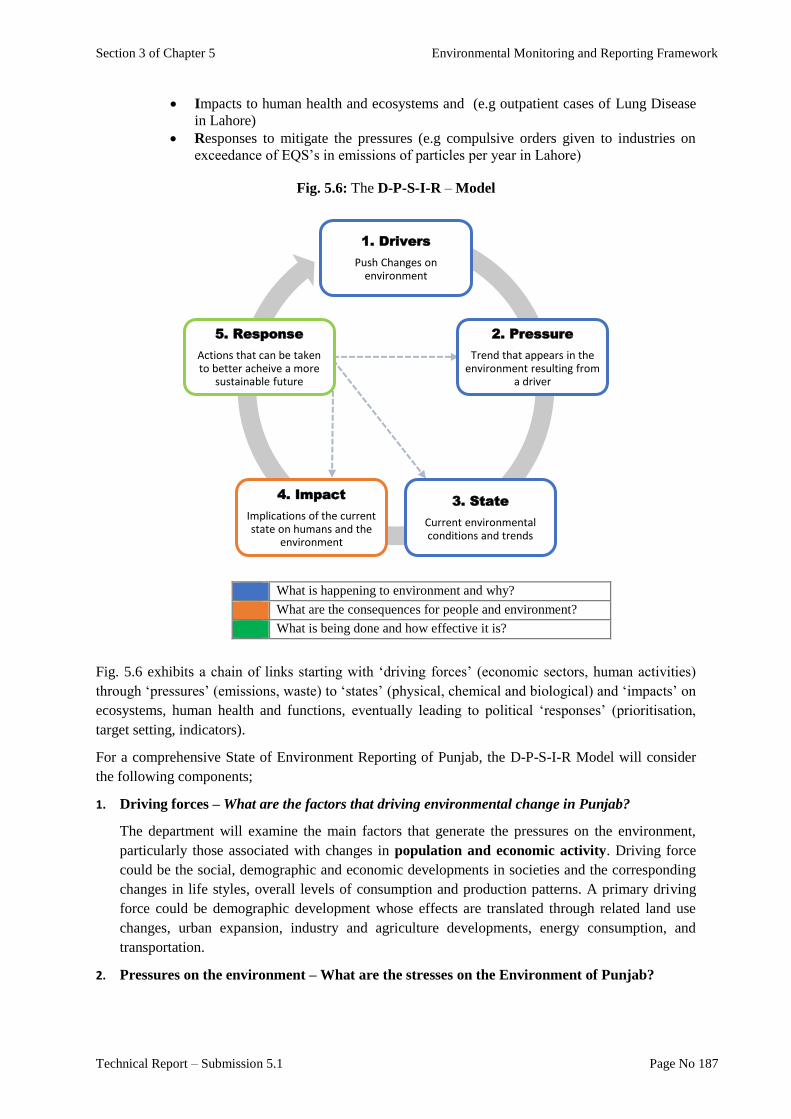
Section 3 of Chapter 5 Environmental Monitoring and Reporting Framework
Technical Report – Submission 5.1 Page No 187
Impacts to human health and ecosystems and (e.g outpatient cases of Lung Disease
in Lahore)
Responses to mitigate the pressures (e.g compulsive orders given to industries on
exceedance of EQS’s in emissions of particles per year in Lahore)
Fig. 5.6: The D-P-S-I-R – Model
What is happening to environment and why?
What are the consequences for people and environment?
What is being done and how effective it is?
Fig. 5.6 exhibits a chain of links starting with ‘driving forces’ (economic sectors, human activities)
through ‘pressures’ (emissions, waste) to ‘states’ (physical, chemical and biological) and ‘impacts’ on
ecosystems, human health and functions, eventually leading to political ‘responses’ (prioritisation,
target setting, indicators).
For a comprehensive State of Environment Reporting of Punjab, the D-P-S-I-R Model will consider
the following components;
1. Driving forces – What are the factors that driving environmental change in Punjab?
The department will examine the main factors that generate the pressures on the environment,
particularly those associated with changes in population and economic activity. Driving force
could be the social, demographic and economic developments in societies and the corresponding
changes in life styles, overall levels of consumption and production patterns. A primary driving
force could be demographic development whose effects are translated through related land use
changes, urban expansion, industry and agriculture developments, energy consumption, and
transportation.
2. Pressures on the environment – What are the stresses on the Environment of Punjab?
1. Drivers
Push Changes on environment
2. Pressure
Trend that appears in the environment resulting from
a driver
3. State
Current environmental conditions and trends
4. Impact
Implications of the current state on humans and the
environment
5. Response
Actions that can be taken to better acheive a more
sustainable future
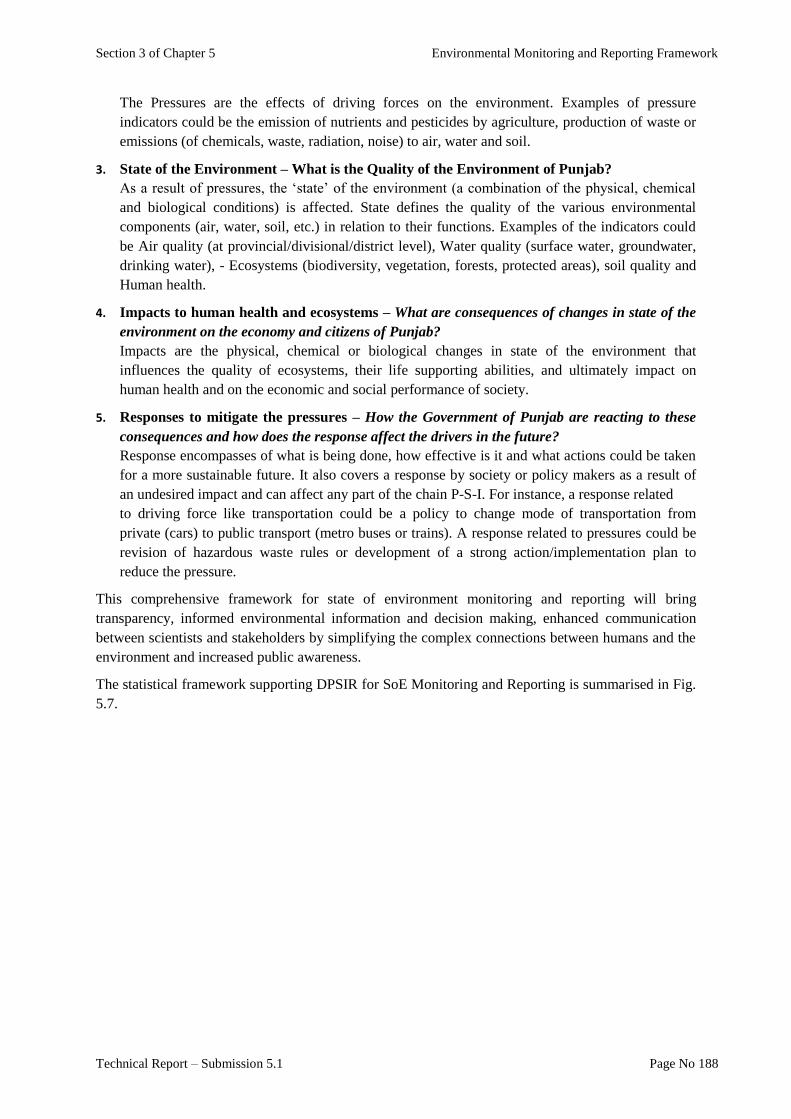
Section 3 of Chapter 5 Environmental Monitoring and Reporting Framework
Technical Report – Submission 5.1 Page No 188
The Pressures are the effects of driving forces on the environment. Examples of pressure
indicators could be the emission of nutrients and pesticides by agriculture, production of waste or
emissions (of chemicals, waste, radiation, noise) to air, water and soil.
3. State of the Environment – What is the Quality of the Environment of Punjab?
As a result of pressures, the ‘state’ of the environment (a combination of the physical, chemical
and biological conditions) is affected. State defines the quality of the various environmental
components (air, water, soil, etc.) in relation to their functions. Examples of the indicators could
be Air quality (at provincial/divisional/district level), Water quality (surface water, groundwater,
drinking water), - Ecosystems (biodiversity, vegetation, forests, protected areas), soil quality and
Human health.
4. Impacts to human health and ecosystems – What are consequences of changes in state of the
environment on the economy and citizens of Punjab?
Impacts are the physical, chemical or biological changes in state of the environment that
influences the quality of ecosystems, their life supporting abilities, and ultimately impact on
human health and on the economic and social performance of society.
5. Responses to mitigate the pressures – How the Government of Punjab are reacting to these
consequences and how does the response affect the drivers in the future?
Response encompasses of what is being done, how effective is it and what actions could be taken
for a more sustainable future. It also covers a response by society or policy makers as a result of
an undesired impact and can affect any part of the chain P-S-I. For instance, a response related
to driving force like transportation could be a policy to change mode of transportation from
private (cars) to public transport (metro buses or trains). A response related to pressures could be
revision of hazardous waste rules or development of a strong action/implementation plan to
reduce the pressure.
This comprehensive framework for state of environment monitoring and reporting will bring
transparency, informed environmental information and decision making, enhanced communication
between scientists and stakeholders by simplifying the complex connections between humans and the
environment and increased public awareness.
The statistical framework supporting DPSIR for SoE Monitoring and Reporting is summarised in Fig.
5.7.
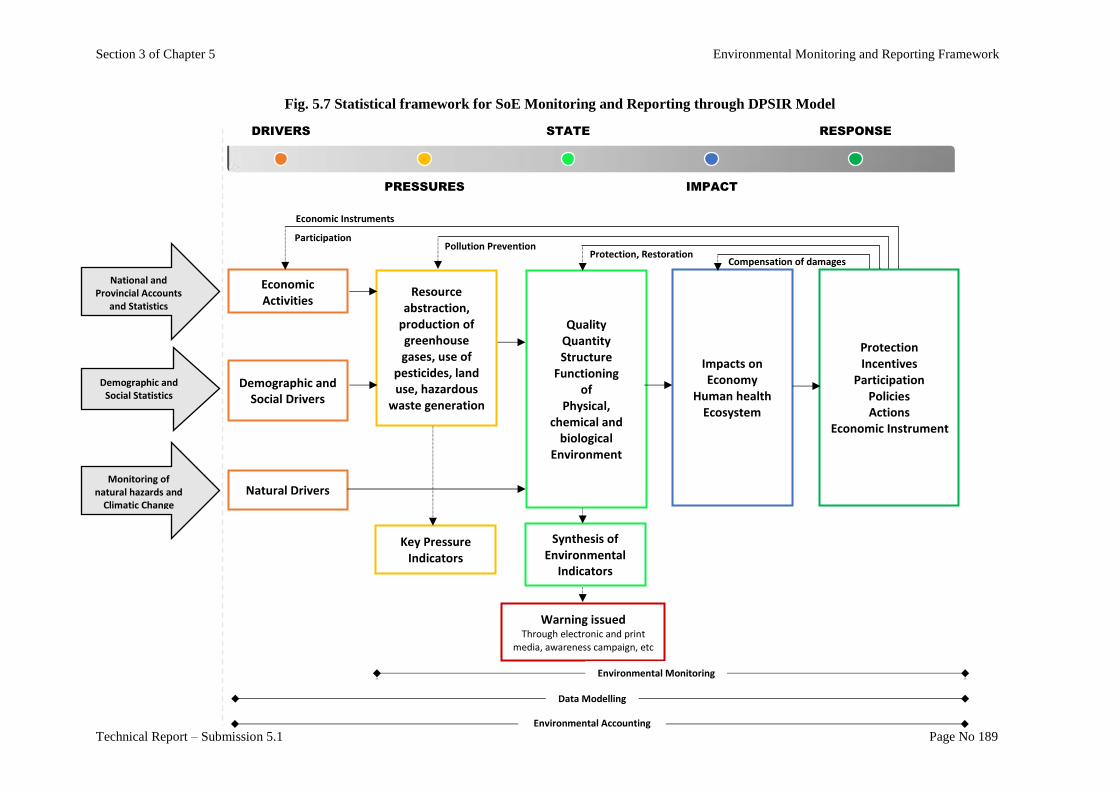
Section 3 of Chapter 5 Environmental Monitoring and Reporting Framework
Technical Report – Submission 5.1 Page No 189
Fig. 5.7 Statistical framework for SoE Monitoring and Reporting through DPSIR Model
National and Provincial Accounts
and Statistics
Demographic and Social Statistics
Monitoring of natural hazards and
Climatic Change
Economic Activities
Demographic and Social Drivers
Natural Drivers
DRIVERS
PRESSURES
STATE
IMPACT
RESPONSE
Resource abstraction,
production of greenhouse gases, use of
pesticides, land use, hazardous
waste generation
Quality Quantity Structure
Functioning of
Physical, chemical and
biological Environment
Impacts on Economy
Human health Ecosystem
Protection Incentives
Participation Policies Actions
Economic Instrument
Key Pressure Indicators
Economic Instruments
Participation Pollution Prevention
Protection, Restoration Compensation of damages
Synthesis of Environmental
Indicators
Warning issued Through electronic and print
media, awareness campaign, etc
Environmental Monitoring
Data Modelling
Environmental Accounting
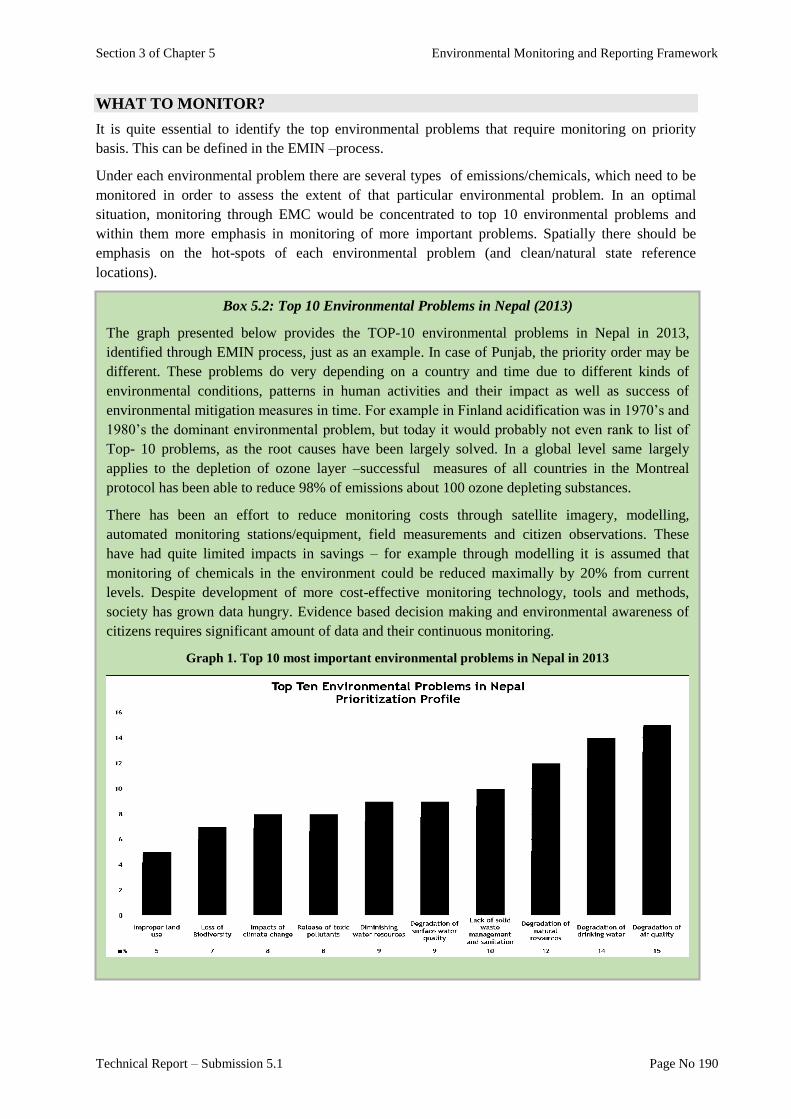
Section 3 of Chapter 5 Environmental Monitoring and Reporting Framework
Technical Report – Submission 5.1 Page No 190
WHAT TO MONITOR?
It is quite essential to identify the top environmental problems that require monitoring on priority
basis. This can be defined in the EMIN –process.
Under each environmental problem there are several types of emissions/chemicals, which need to be
monitored in order to assess the extent of that particular environmental problem. In an optimal
situation, monitoring through EMC would be concentrated to top 10 environmental problems and
within them more emphasis in monitoring of more important problems. Spatially there should be
emphasis on the hot-spots of each environmental problem (and clean/natural state reference
locations).
Box 5.2: Top 10 Environmental Problems in Nepal (2013)
The graph presented below provides the TOP-10 environmental problems in Nepal in 2013,
identified through EMIN process, just as an example. In case of Punjab, the priority order may be
different. These problems do very depending on a country and time due to different kinds of
environmental conditions, patterns in human activities and their impact as well as success of
environmental mitigation measures in time. For example in Finland acidification was in 1970’s and
1980’s the dominant environmental problem, but today it would probably not even rank to list of
Top- 10 problems, as the root causes have been largely solved. In a global level same largely
applies to the depletion of ozone layer –successful measures of all countries in the Montreal
protocol has been able to reduce 98% of emissions about 100 ozone depleting substances.
There has been an effort to reduce monitoring costs through satellite imagery, modelling,
automated monitoring stations/equipment, field measurements and citizen observations. These
have had quite limited impacts in savings – for example through modelling it is assumed that
monitoring of chemicals in the environment could be reduced maximally by 20% from current
levels. Despite development of more cost-effective monitoring technology, tools and methods,
society has grown data hungry. Evidence based decision making and environmental awareness of
citizens requires significant amount of data and their continuous monitoring.
Graph 1. Top 10 most important environmental problems in Nepal in 2013
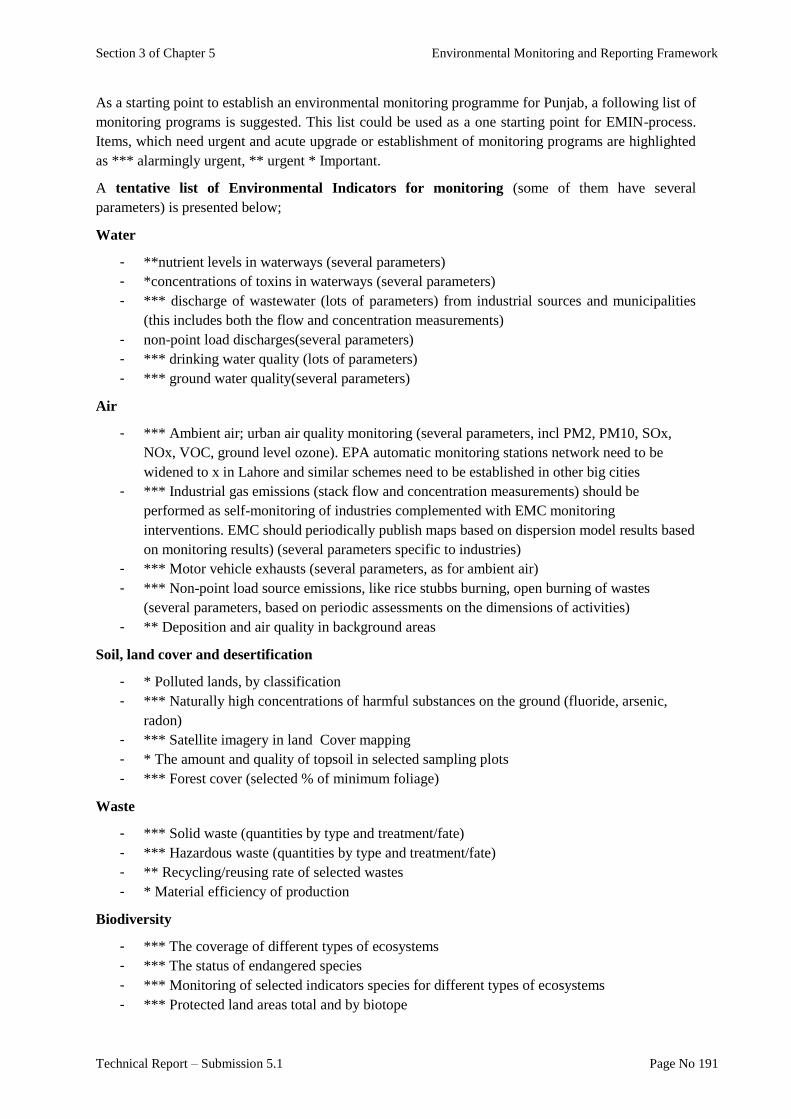
Section 3 of Chapter 5 Environmental Monitoring and Reporting Framework
Technical Report – Submission 5.1 Page No 191
As a starting point to establish an environmental monitoring programme for Punjab, a following list of
monitoring programs is suggested. This list could be used as a one starting point for EMIN-process.
Items, which need urgent and acute upgrade or establishment of monitoring programs are highlighted
as *** alarmingly urgent, ** urgent * Important.
A tentative list of Environmental Indicators for monitoring (some of them have several
parameters) is presented below;
Water
- **nutrient levels in waterways (several parameters)
- *concentrations of toxins in waterways (several parameters)
- *** discharge of wastewater (lots of parameters) from industrial sources and municipalities
(this includes both the flow and concentration measurements)
- non-point load discharges(several parameters)
- *** drinking water quality (lots of parameters)
- *** ground water quality(several parameters)
Air
- *** Ambient air; urban air quality monitoring (several parameters, incl PM2, PM10, SOx,
NOx, VOC, ground level ozone). EPA automatic monitoring stations network need to be
widened to x in Lahore and similar schemes need to be established in other big cities
- *** Industrial gas emissions (stack flow and concentration measurements) should be
performed as self-monitoring of industries complemented with EMC monitoring
interventions. EMC should periodically publish maps based on dispersion model results based
on monitoring results) (several parameters specific to industries)
- *** Motor vehicle exhausts (several parameters, as for ambient air)
- *** Non-point load source emissions, like rice stubbs burning, open burning of wastes
(several parameters, based on periodic assessments on the dimensions of activities)
- ** Deposition and air quality in background areas
Soil, land cover and desertification
- * Polluted lands, by classification
- *** Naturally high concentrations of harmful substances on the ground (fluoride, arsenic,
radon)
- *** Satellite imagery in land Cover mapping
- * The amount and quality of topsoil in selected sampling plots
- *** Forest cover (selected % of minimum foliage)
Waste
- *** Solid waste (quantities by type and treatment/fate)
- *** Hazardous waste (quantities by type and treatment/fate)
- ** Recycling/reusing rate of selected wastes
- * Material efficiency of production
Biodiversity
- *** The coverage of different types of ecosystems
- *** The status of endangered species
- *** Monitoring of selected indicators species for different types of ecosystems
- *** Protected land areas total and by biotope
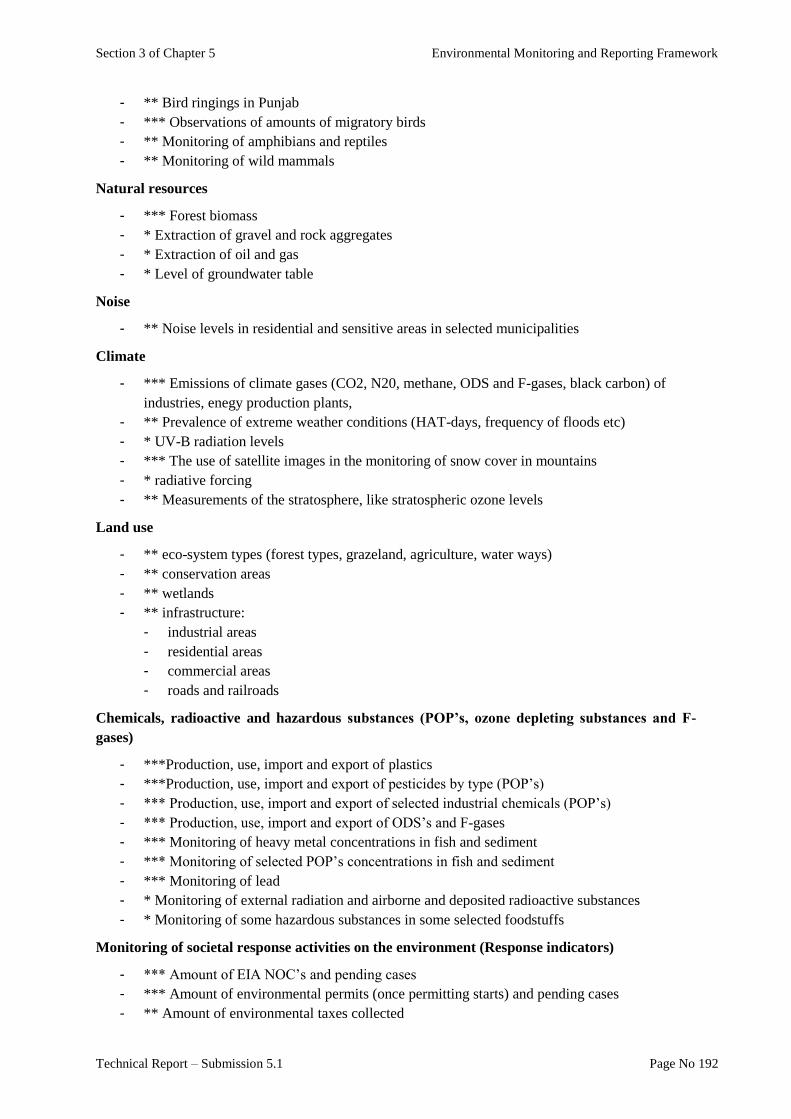
Section 3 of Chapter 5 Environmental Monitoring and Reporting Framework
Technical Report – Submission 5.1 Page No 192
- ** Bird ringings in Punjab
- *** Observations of amounts of migratory birds
- ** Monitoring of amphibians and reptiles
- ** Monitoring of wild mammals
Natural resources
- *** Forest biomass
- * Extraction of gravel and rock aggregates
- * Extraction of oil and gas
- * Level of groundwater table
Noise
- ** Noise levels in residential and sensitive areas in selected municipalities
Climate
- *** Emissions of climate gases (CO2, N20, methane, ODS and F-gases, black carbon) of
industries, enegy production plants,
- ** Prevalence of extreme weather conditions (HAT-days, frequency of floods etc)
- * UV-B radiation levels
- *** The use of satellite images in the monitoring of snow cover in mountains
- * radiative forcing
- ** Measurements of the stratosphere, like stratospheric ozone levels
Land use
- ** eco-system types (forest types, grazeland, agriculture, water ways)
- ** conservation areas
- ** wetlands
- ** infrastructure:
- industrial areas
- residential areas
- commercial areas
- roads and railroads
Chemicals, radioactive and hazardous substances (POP’s, ozone depleting substances and F-
gases)
- ***Production, use, import and export of plastics
- ***Production, use, import and export of pesticides by type (POP’s)
- *** Production, use, import and export of selected industrial chemicals (POP’s)
- *** Production, use, import and export of ODS’s and F-gases
- *** Monitoring of heavy metal concentrations in fish and sediment
- *** Monitoring of selected POP’s concentrations in fish and sediment
- *** Monitoring of lead
- * Monitoring of external radiation and airborne and deposited radioactive substances
- * Monitoring of some hazardous substances in some selected foodstuffs
Monitoring of societal response activities on the environment (Response indicators)
- *** Amount of EIA NOC’s and pending cases
- *** Amount of environmental permits (once permitting starts) and pending cases
- ** Amount of environmental taxes collected

Section 3 of Chapter 5 Environmental Monitoring and Reporting Framework
Technical Report – Submission 5.1 Page No 193
- ** Amount of deposits paid (e.g. glass bottles, plastic bottles)
- * Environmental investments in industries and municipalities
- * Energy efficiency of selected industrial plants and/or municipalities, traffic sector, real
estate’s sector and households


Section 4
Environmental Monitoring Plan for Punjab

Section 4 of Chapter 5 Environmental Monitoring Plan for Punjab
Technical Report – Submission 5.1 Page No 197
Section 4
Environmental Monitoring Plan for Punjab
What is a sufficient amount of monitoring? That cannot be answered directly as there are no
universally agreed standards or even recommendations for that for all types of monitoring. That is
why administration needs capacities of environmental scientists for expert judgement and knowledge
on the local circumstances on that matter. That would be best done within EMIN –process, facilitated
by environmental scientists of the administration, in the presence of actual data producers and
scientists who have theoretical background and practical experience on each type of monitoring and
related environmental problems.
In this section, we are only giving a proxy set of suggestions for “monitoring intensity” and
presenting background thinking to justify these suggestions.
AIR QUALITY MONITORING PLAN
Currently there are 6 air quality monitoring stations in Lahore. They are the only AQ monitoring
station in the whole of Punjab. These stations have produced data only since November 2017 and the
results are posted daily in EPA website. This is very useful approach and shows already the
importance of these measurements as threshold limits are exceeded daily in most of the measurement
stations.
Air quality information is crucial for citizen to prepare and protect themselves for episodes of high
concentrations of air pollutants. EPD has drafted also an important paper on air quality – an action
plan named: Standing instructions for management of episodes of poor air quality in the Punjab
(2017), draft. The paper introduces Air Quality Index (AQI), which has threshold levels of 6 air
pollutants (PM10, PM2.5, SO2, NO2, O3 and CO) to indicate with colours green, light green, yellow,
orange, red and maroon respectively representing good, satisfactory, moderate, poor, very poor and
extremely poor quality of ambient air. Index levels are then suggested to be used in measures to
protect citizens through selected measure and to reduce emissions instantly.
Similar types of AQI’s have been used in many countries successfully for decades. For Punjab’s
perspective, it is important to be able to show differences between days of extremely bad pollution
levels, like during the episodes of burning Rice Stubbs in October and November. In a long run, as air
quality gets better new threshold levels should be taken in use as there is no such thing as adaptation
to bad air quality, stricter threshold would be needed to protect Punjab population and to raise
awareness on importance of good air quality for health.
These kinds of networks of monitoring stations would need to be established in all other big cities of
Punjab, namely Rawalpindi, Gujranwala, Faisalabad, Multan and Sialkot and then expanded to
intermediate and small size cities, which have industries.
Air quality should be continuously monitored in the influence areas of industries, traffic and even
small-scale combustion in the future (areas were solid wastes are burned openly or areas were rice
stubbles are burned in October-November time, as well as in the background areas.
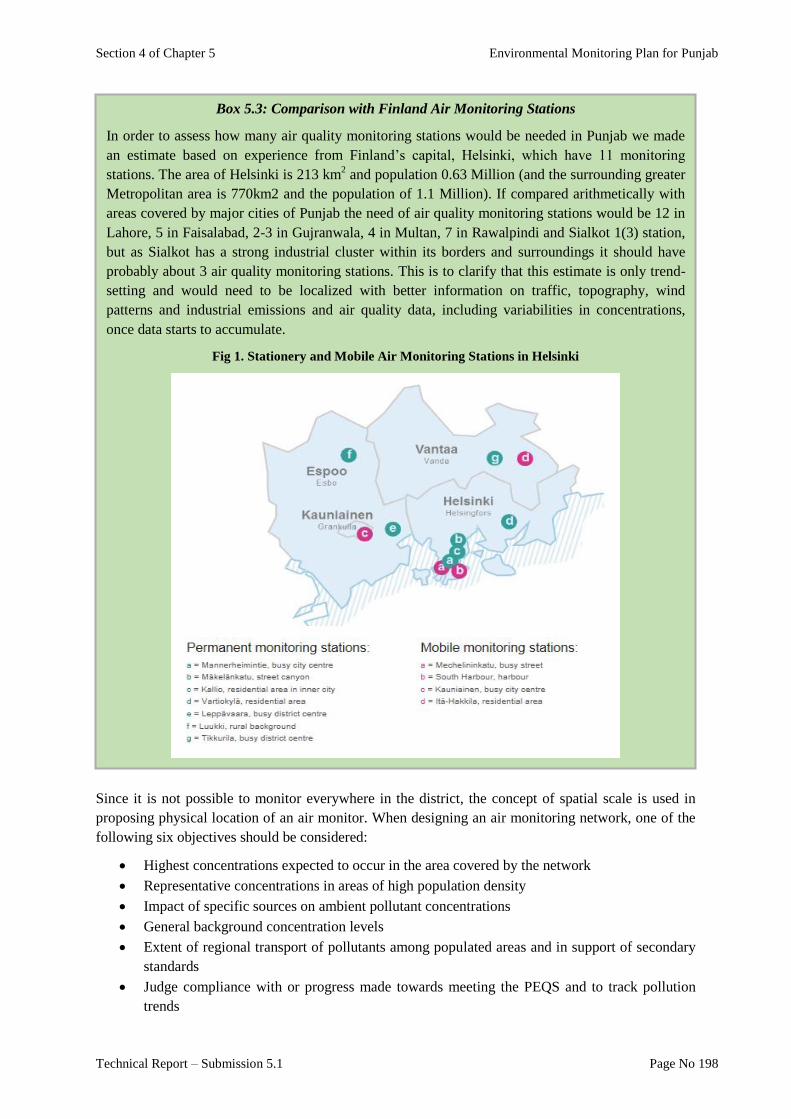
Section 4 of Chapter 5 Environmental Monitoring Plan for Punjab
Technical Report – Submission 5.1 Page No 198
Since it is not possible to monitor everywhere in the district, the concept of spatial scale is used in
proposing physical location of an air monitor. When designing an air monitoring network, one of the
following six objectives should be considered:
Highest concentrations expected to occur in the area covered by the network
Representative concentrations in areas of high population density
Impact of specific sources on ambient pollutant concentrations
General background concentration levels
Extent of regional transport of pollutants among populated areas and in support of secondary
standards
Judge compliance with or progress made towards meeting the PEQS and to track pollution
trends
Box 5.3: Comparison with Finland Air Monitoring Stations
In order to assess how many air quality monitoring stations would be needed in Punjab we made
an estimate based on experience from Finland’s capital, Helsinki, which have 11 monitoring
stations. The area of Helsinki is 213 km2 and population 0.63 Million (and the surrounding greater
Metropolitan area is 770km2 and the population of 1.1 Million). If compared arithmetically with
areas covered by major cities of Punjab the need of air quality monitoring stations would be 12 in
Lahore, 5 in Faisalabad, 2-3 in Gujranwala, 4 in Multan, 7 in Rawalpindi and Sialkot 1(3) station,
but as Sialkot has a strong industrial cluster within its borders and surroundings it should have
probably about 3 air quality monitoring stations. This is to clarify that this estimate is only trend-
setting and would need to be localized with better information on traffic, topography, wind
patterns and industrial emissions and air quality data, including variabilities in concentrations,
once data starts to accumulate.
Fig 1. Stationery and Mobile Air Monitoring Stations in Helsinki

Section 4 of Chapter 5 Environmental Monitoring Plan for Punjab
Technical Report – Submission 5.1 Page No 199
Number and Distribution of Monitoring Locations
The EMC will develop a system which specifies an exclusive area, or spatial scale, that an air monitor
represents. The goal in establishing air monitoring sites is to correctly match the spatial scale that is
most appropriate for the monitoring objective.
EMC should design a monitoring plan for yearly basis in order to satisfy a variety of purposes,
including monitoring compliance with the PEQS/WHO, public reporting of the Air Quality Index
(AQI), assessing population exposure and risk from air toxics, determining pollution trends,
monitoring specific emissions sources, investigating background conditions, and evaluating computer
models.
Knowledge of existing air pollutants levels and pattern within the area are essential for deciding
number and distribution of stations. The air quality data was not available therefore number of
monitoring stations in a city are selected based on Population Fig.s which can be used as indicators of
region variability of the pollutants concentration.
A general guide is used for estimating no. of minimum stations in the cities of the Punjab Province
(major and intermediate cities) is described as follows:
Table 5.1: General guide for no. of stations vs population
Population No of Stations
< 100000 1
100000 - 1000000 1+ 0.4 x per 100000 pop
100000 - 5000001 2 + 0.2 x per 100000 Population
> 5000000 4 + 0.15 x per 100000 Population
With reference to the above table, the number of air quality monitor/stations proposed in each city
with respect to its population is listed in Table 1.2.
Table 1.1: Proposed Number of Air Monitors/Stations in each city
City No of Stations Population City No of Stations Population
Bahawalpur 3.4 612800 Multan 6.8 2362136
Chiniot 1.8 191351 Muzaffargarh 1.8 180692
D G Khan 2.48 378711 Okara 2.2 326726
Faisalabad 8.6 3281725 R Y Khan 2.6 426300
Gujranwala 6.6 2369049 Rawalpindi 6.8 2406962
Gujrat 2.6 400665 Sahiwal 2.6 425819
Jhang 2.6 410884 Sargodha 4.2 789631
Kasur 2.6 426411 Sheikhopura 2.6 430792
Lahore 17.5 8681007 Sialkot 4.6 953679
Monitoring Site selection Criteria
Since it is not possible to monitor everywhere in the province, so the air monitoring stations are
proposed for five large cities and 13 intermediate cities of Punjab. The initial selection of air
monitoring sites/locations in the city was based on following factors/layers:
Population
Industrial Clusters
Built-up area
Roads
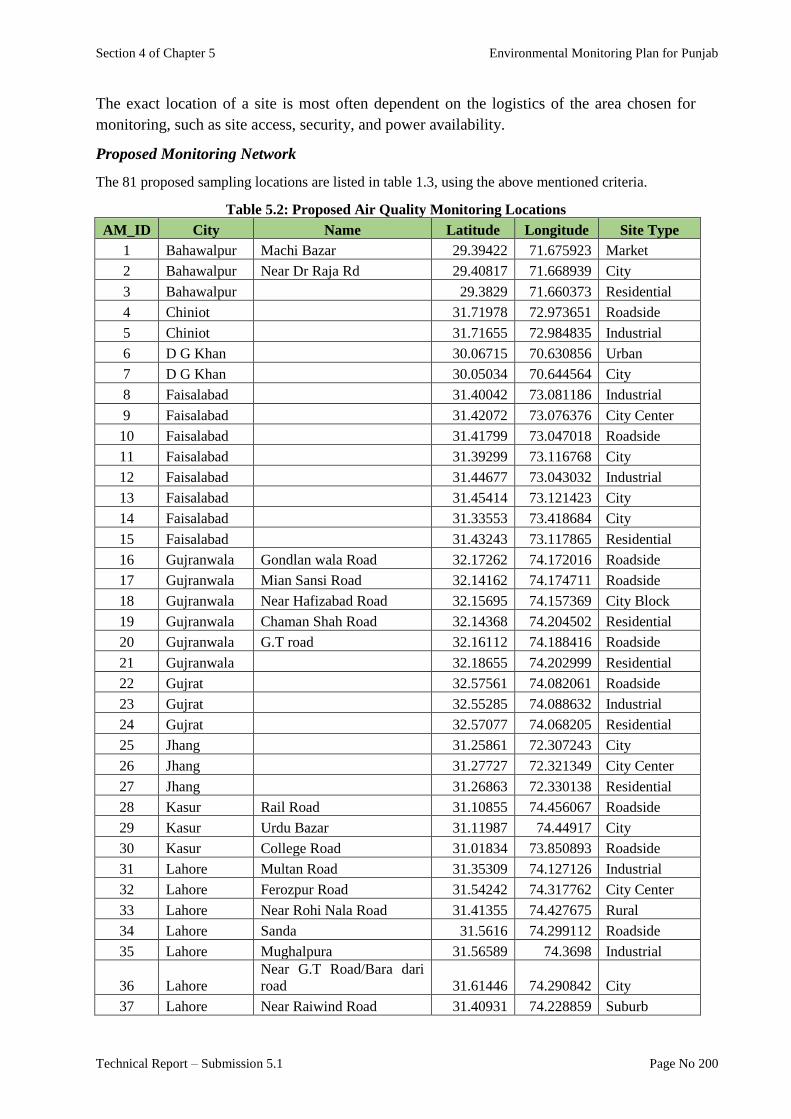
Section 4 of Chapter 5 Environmental Monitoring Plan for Punjab
Technical Report – Submission 5.1 Page No 200
The exact location of a site is most often dependent on the logistics of the area chosen for
monitoring, such as site access, security, and power availability.
Proposed Monitoring Network
The 81 proposed sampling locations are listed in table 1.3, using the above mentioned criteria.
Table 5.2: Proposed Air Quality Monitoring Locations
AM_ID City Name Latitude Longitude Site Type
1 Bahawalpur Machi Bazar 29.39422 71.675923 Market
2 Bahawalpur Near Dr Raja Rd 29.40817 71.668939 City
3 Bahawalpur 29.3829 71.660373 Residential
4 Chiniot 31.71978 72.973651 Roadside
5 Chiniot 31.71655 72.984835 Industrial
6 D G Khan 30.06715 70.630856 Urban
7 D G Khan 30.05034 70.644564 City
8 Faisalabad 31.40042 73.081186 Industrial
9 Faisalabad 31.42072 73.076376 City Center
10 Faisalabad 31.41799 73.047018 Roadside
11 Faisalabad 31.39299 73.116768 City
12 Faisalabad 31.44677 73.043032 Industrial
13 Faisalabad 31.45414 73.121423 City
14 Faisalabad 31.33553 73.418684 City
15 Faisalabad 31.43243 73.117865 Residential
16 Gujranwala Gondlan wala Road 32.17262 74.172016 Roadside
17 Gujranwala Mian Sansi Road 32.14162 74.174711 Roadside
18 Gujranwala Near Hafizabad Road 32.15695 74.157369 City Block
19 Gujranwala Chaman Shah Road 32.14368 74.204502 Residential
20 Gujranwala G.T road 32.16112 74.188416 Roadside
21 Gujranwala 32.18655 74.202999 Residential
22 Gujrat 32.57561 74.082061 Roadside
23 Gujrat 32.55285 74.088632 Industrial
24 Gujrat 32.57077 74.068205 Residential
25 Jhang 31.25861 72.307243 City
26 Jhang 31.27727 72.321349 City Center
27 Jhang 31.26863 72.330138 Residential
28 Kasur Rail Road 31.10855 74.456067 Roadside
29 Kasur Urdu Bazar 31.11987 74.44917 City
30 Kasur College Road 31.01834 73.850893 Roadside
31 Lahore Multan Road 31.35309 74.127126 Industrial
32 Lahore Ferozpur Road 31.54242 74.317762 City Center
33 Lahore Near Rohi Nala Road 31.41355 74.427675 Rural
34 Lahore Sanda 31.5616 74.299112 Roadside
35 Lahore Mughalpura 31.56589 74.3698 Industrial
36 Lahore
Near G.T Road/Bara dari
road 31.61446 74.290842 City
37 Lahore Near Raiwind Road 31.40931 74.228859 Suburb
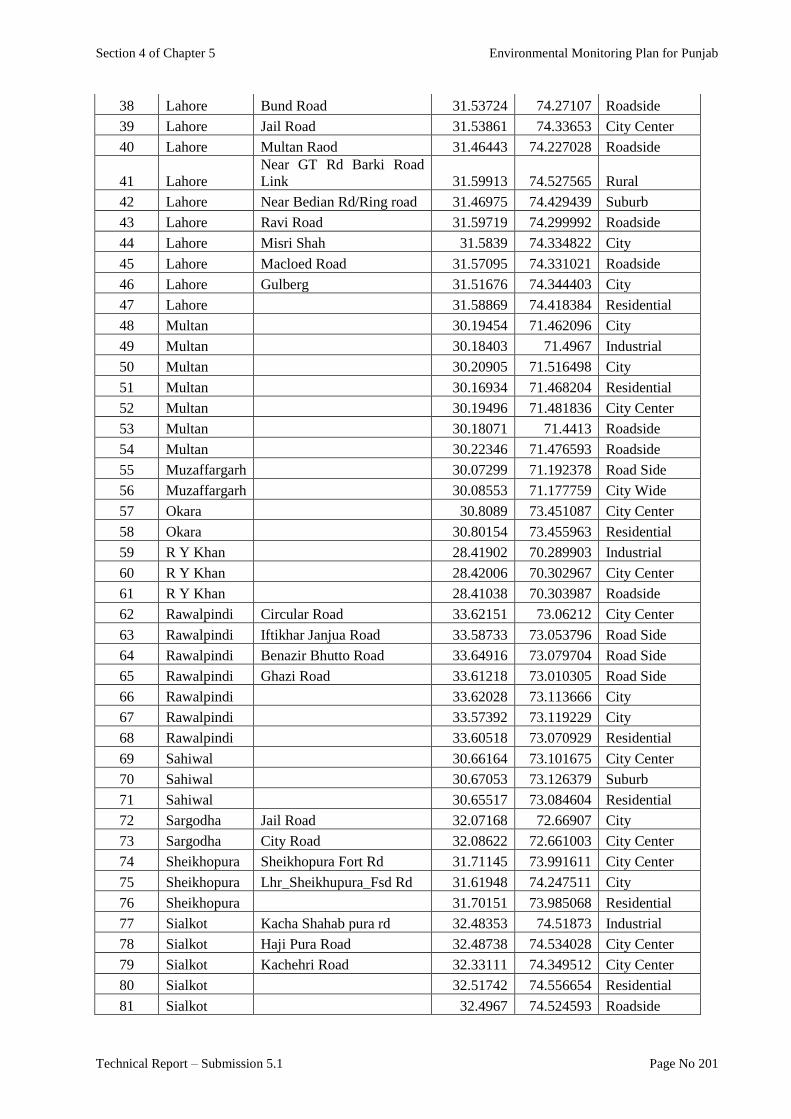
Section 4 of Chapter 5 Environmental Monitoring Plan for Punjab
Technical Report – Submission 5.1 Page No 201
38 Lahore Bund Road 31.53724 74.27107 Roadside
39 Lahore Jail Road 31.53861 74.33653 City Center
40 Lahore Multan Raod 31.46443 74.227028 Roadside
41 Lahore
Near GT Rd Barki Road
Link 31.59913 74.527565 Rural
42 Lahore Near Bedian Rd/Ring road 31.46975 74.429439 Suburb
43 Lahore Ravi Road 31.59719 74.299992 Roadside
44 Lahore Misri Shah 31.5839 74.334822 City
45 Lahore Macloed Road 31.57095 74.331021 Roadside
46 Lahore Gulberg 31.51676 74.344403 City
47 Lahore 31.58869 74.418384 Residential
48 Multan 30.19454 71.462096 City
49 Multan 30.18403 71.4967 Industrial
50 Multan 30.20905 71.516498 City
51 Multan 30.16934 71.468204 Residential
52 Multan 30.19496 71.481836 City Center
53 Multan 30.18071 71.4413 Roadside
54 Multan 30.22346 71.476593 Roadside
55 Muzaffargarh 30.07299 71.192378 Road Side
56 Muzaffargarh 30.08553 71.177759 City Wide
57 Okara 30.8089 73.451087 City Center
58 Okara 30.80154 73.455963 Residential
59 R Y Khan 28.41902 70.289903 Industrial
60 R Y Khan 28.42006 70.302967 City Center
61 R Y Khan 28.41038 70.303987 Roadside
62 Rawalpindi Circular Road 33.62151 73.06212 City Center
63 Rawalpindi Iftikhar Janjua Road 33.58733 73.053796 Road Side
64 Rawalpindi Benazir Bhutto Road 33.64916 73.079704 Road Side
65 Rawalpindi Ghazi Road 33.61218 73.010305 Road Side
66 Rawalpindi 33.62028 73.113666 City
67 Rawalpindi 33.57392 73.119229 City
68 Rawalpindi 33.60518 73.070929 Residential
69 Sahiwal 30.66164 73.101675 City Center
70 Sahiwal 30.67053 73.126379 Suburb
71 Sahiwal 30.65517 73.084604 Residential
72 Sargodha Jail Road 32.07168 72.66907 City
73 Sargodha City Road 32.08622 72.661003 City Center
74 Sheikhopura Sheikhopura Fort Rd 31.71145 73.991611 City Center
75 Sheikhopura Lhr_Sheikhupura_Fsd Rd 31.61948 74.247511 City
76 Sheikhopura 31.70151 73.985068 Residential
77 Sialkot Kacha Shahab pura rd 32.48353 74.51873 Industrial
78 Sialkot Haji Pura Road 32.48738 74.534028 City Center
79 Sialkot Kachehri Road 32.33111 74.349512 City Center
80 Sialkot 32.51742 74.556654 Residential
81 Sialkot 32.4967 74.524593 Roadside
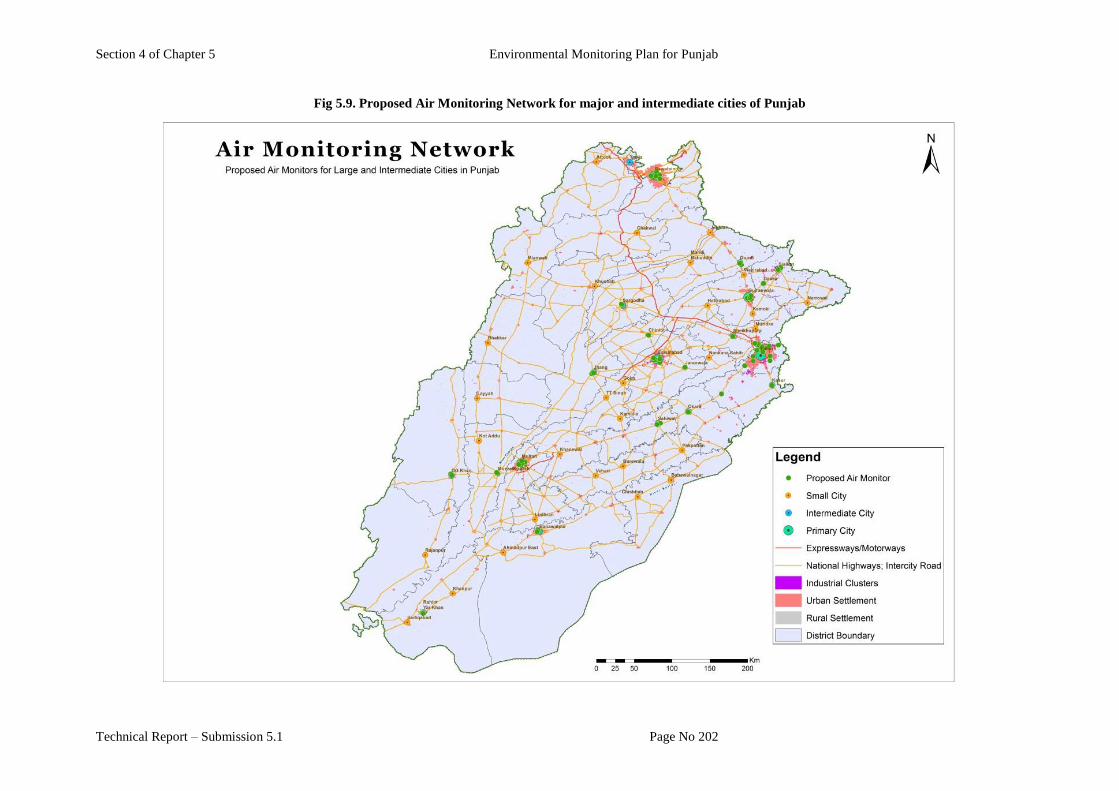
Section 4 of Chapter 5 Environmental Monitoring Plan for Punjab
Technical Report – Submission 5.1 Page No 202
Fig 5.9. Proposed Air Monitoring Network for major and intermediate cities of Punjab

Section 4 of Chapter 5 Environmental Monitoring Plan for Punjab
Technical Report – Submission 5.1 Page No 203
GROUND WATER MONITORING PLAN
For general protection of ground waters the precautionary principle should be applied. It comprises a
prohibition on direct discharges to groundwater, and (to cover indirect discharges) a requirement to
monitor groundwater bodies so as to detect changes in chemical composition and to reverse any
antropogenically induced upward pollution trend.
Setting chemical standards may lead to think that it would be acceptable to pollute ground waters up
to the threshold level. In any case nitrates, pesticides and biocides should be regulated with standards
anyway.
Monitoring of ground water quality would need to be done 2-4/year. Samples can be taken from tube
wells or natural springs. Parameters for monitoring9 could be as follows:
Table 5.4: Ground Water Quality Parameters and Monitoring Plan
2-4 times/year Once/year Non-obligatory/additional
parameters
Nutrients (Ammonium, Total- Nitrogen,
Nitrate, Phosphate, Total-Phosphorus,
Sulphate)
Fluoride
Silver
Alkalinity Mercury Beryllium,
Dissolved Oxygen Silica Lithium,
PH Uranium Rubidium
Electrical Conductivity Nitrite Thallium
Chloride Molybdenum,
Total Organic Carbon Antimony
Temperature Tin
Aluminum Palladium
Barium Boron
Iron Bismuth
Manganese Thorium
Strontium Uranium
Zinc
Calcium
Magnesium
Sodium
Arsenic
Cadmium
Cobalt
Chromium
Copper
Nickel
Lead
Selenium
Vanadium
9 World Water Assessment Program WWAP. (Unescon raportti)
Section 4 of Chapter 5 Environmental Monitoring Plan for Punjab
Technical Report – Submission 5.1 Page No 204
Quantity is also a major issue for groundwater. Briefly, the issue can be put as follows. There is only
a certain amount of recharge into a groundwater each year, and of this recharge, some is needed to
support connected ecosystems (whether they be surface water bodies, or terrestrial systems such as
wetlands). For good management, only that portion of the overall recharge not needed by the ecology
can be abstracted - this is the sustainable resource, and the Directive limits abstraction to that quantity.
Monitoring of ground waters should be done 1-2/month depending on the importance of the ground
water area and amounts of extraction.
Monitoring Site selection Criteria
Sampling points for groundwater monitoring are confined to places where there is access to an
aquifer, and in most cases this means that samples will be obtained from existing wells.
To describe such a sampling station adequately, it is essential to have certain information about the
well, including depth, depth to the well screen, length of the screen and the amount by which the static
water level is lowered when the well is pumped. Wells with broken or damaged casings should be
avoided because surface water may leak into them and affect the water quality.
Sampling points may include public water supply wells, domestic wells, or up gradient facility wells.
The following criteria should be considered when selecting these types of monitoring points.
Select wells that are actively used.
Choose wells that are properly constructed (with no visible damage to the casing) with the
casing anchored into bedrock, and properly capped.
Select wells that have a means to circumvent any pressure tank, water softener, or filtering
system (or any type of treatment system).
Avoid monitoring points that may have contamination from obvious nearby point sources
such as waste disposal sites, petroleum and mining activities, direct road salt or agricultural
runoff.
Use wells that have detailed construction information. At a minimum, well data should
include type of construction, size and length of casing, total depth, yield, water bearing zones
and static water levels, when possible.
Ground Water Monitoring Locations
The location data of existing bores/wells are taken from irrigation department and these existing
bore/wells are proposed for monitoring of ground water quality. A map of monitoring locations is
shown in Fig. 5.10.
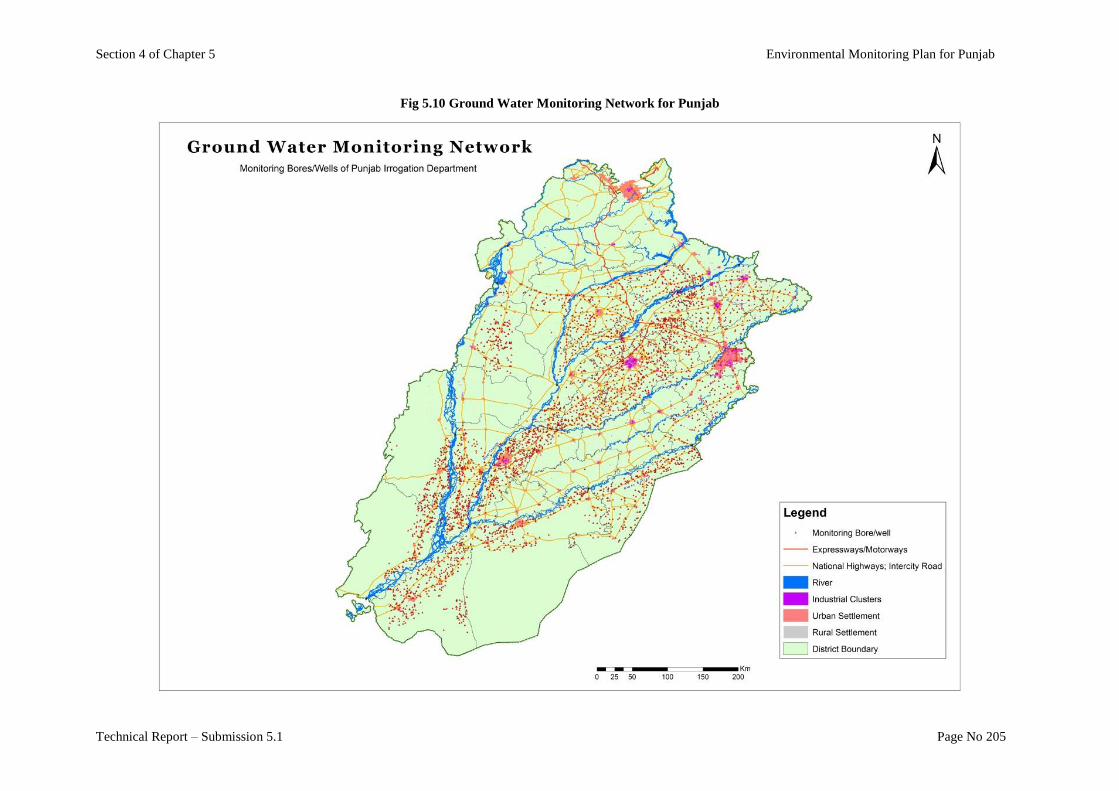
Section 4 of Chapter 5 Environmental Monitoring Plan for Punjab
Technical Report – Submission 5.1 Page No 205
Fig 5.10 Ground Water Monitoring Network for Punjab
Section 4 of Chapter 5 Environmental Monitoring Plan for Punjab
Technical Report – Submission 5.1 Page No 206
SURFACE WATER MONITORING PLAN
The best model for a single system of water management is management by river basin - the natural
geographical and hydrological unit - instead of according to administrative or political boundaries.
For each river basin district - some of which will traverse provisional or even national frontiers - a
"river basin management plan" will need to be established and updated periodically, e.g. every five
years.
The objectives for protection of surface waters should cover general protection of the aquatic ecology,
specific protection of unique and valuable habitats, protection of drinking water resources, and
protection of bathing water. All these objectives must be integrated for each river basin. It is clear that
the last three - special habitats, drinking water areas and bathing water - apply only to specific bodies
of water (those supporting special wetlands; those identified for drinking water abstraction; those
generally used as bathing areas). In contrast, ecological protection should apply to all waters.
Ecological status refers to the quality of the biological community, the hydrological characteristics
and the chemical characteristics. As no absolute standards for biological quality can be set which
apply across the Community, because of ecological variability, the controls are specified as allowing
only a slight departure from the biological community which would be expected in conditions of
minimal anthropogenic impact (clean areas, background values)
Good chemical status is defined in terms of compliance with all the quality standards established for
chemical substances at Federal/Provincial level. There should also be a mechanism for renewing these
standards and establishing new ones by means of a prioritization mechanism for hazardous chemicals.
This will ensure at least a minimum chemical quality, particularly in relation to very toxic substances.
Nutrients, such as nitrates and phosphates, from farm fertilizers to household detergents can 'over
fertilize' the water causing the growth of large mats of algae; some of which can be toxic. When the
algae die, they sink to the bottom, decompose, consume oxygen and damage ecosystems.
Pesticides and veterinary medicines from farmland and chemical contaminants, including heavy
metals and some industrial chemicals, can threaten wildlife and human health. Some of these damage
the hormonal systems of fish, causing feminization.
Standards and threshold levels used in various countries are presented in Annex-3 of this report.
The monitoring of surface waters should serve objectives of river basin management. Monitoring of
surface waters is based on long-term monitoring of ambient environment by government (EMC,
Irrigation department and others) and self-monitoring of polluters (complemented with government
check-ups and verification). The latter will be based on obligations given to industries and
municipalities in permitting conditions. Industries in certain areas can be given an obligation to form
“Water Protection Associations”, which do the monitoring on behalf of the industries. Water
Protection Associations must have ISO 17025 certified laboratories and certified personnel for sample
taking and field measurements. Industries will pay the costs of the monitoring to the associations as
membership fees.
As a general rule:
Punjab EMC is responsible for monitoring of background values and general water quality of all
waterways and checking through periodic sampling, based on statistical analysis, the discharges of
waste waters and gradients outside industries and verifying results of private environmental firms
and Water Protection Associations of polluters (industries and municipalities).
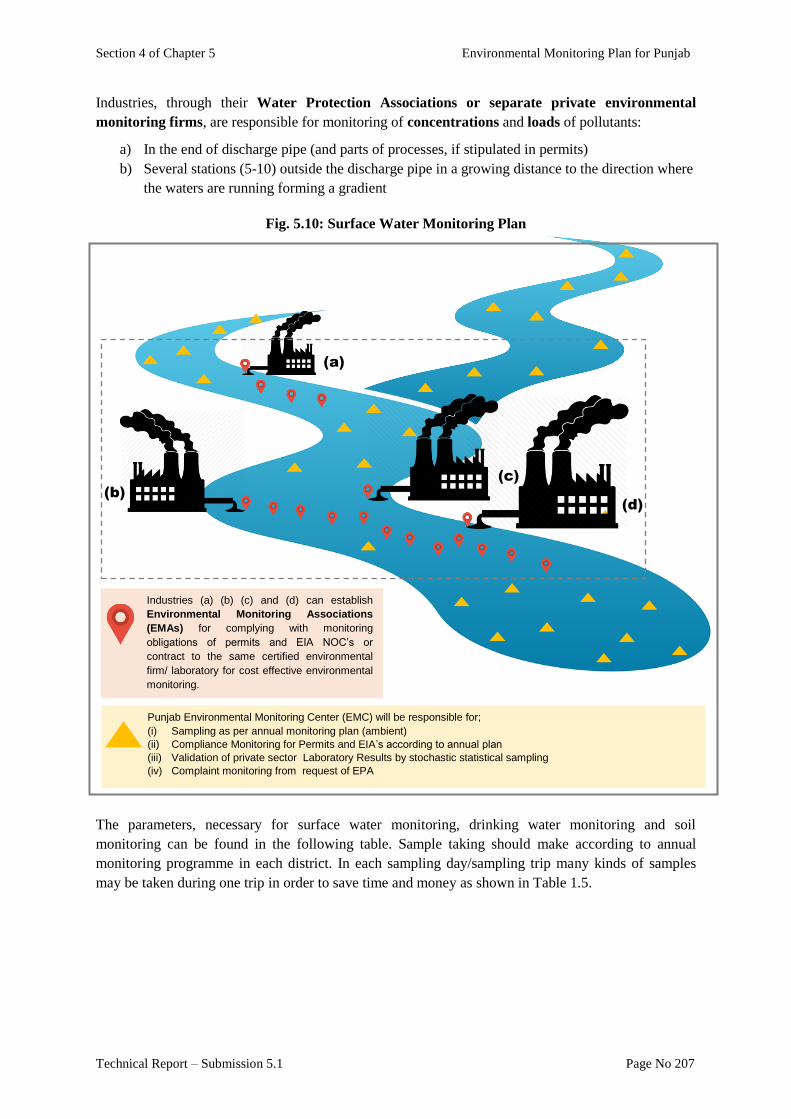
Section 4 of Chapter 5 Environmental Monitoring Plan for Punjab
Technical Report – Submission 5.1 Page No 207
Industries, through their Water Protection Associations or separate private environmental
monitoring firms, are responsible for monitoring of concentrations and loads of pollutants:
a) In the end of discharge pipe (and parts of processes, if stipulated in permits)
b) Several stations (5-10) outside the discharge pipe in a growing distance to the direction where
the waters are running forming a gradient
Fig. 5.10: Surface Water Monitoring Plan
The parameters, necessary for surface water monitoring, drinking water monitoring and soil
monitoring can be found in the following table. Sample taking should make according to annual
monitoring programme in each district. In each sampling day/sampling trip many kinds of samples
may be taken during one trip in order to save time and money as shown in Table 1.5.
(b)
(d)
Industries (a) (b) (c) and (d) can establish
Environmental Monitoring Associations
(EMAs) for complying with monitoring
obligations of permits and EIA NOC’s or
contract to the same certified environmental
firm/ laboratory for cost effective environmental
monitoring.
Punjab Environmental Monitoring Center (EMC) will be responsible for;
(i) Sampling as per annual monitoring plan (ambient)
(ii) Compliance Monitoring for Permits and EIA’s according to annual plan
(iii) Validation of private sector Laboratory Results by stochastic statistical sampling
(iv) Complaint monitoring from request of EPA
(a)
(c)
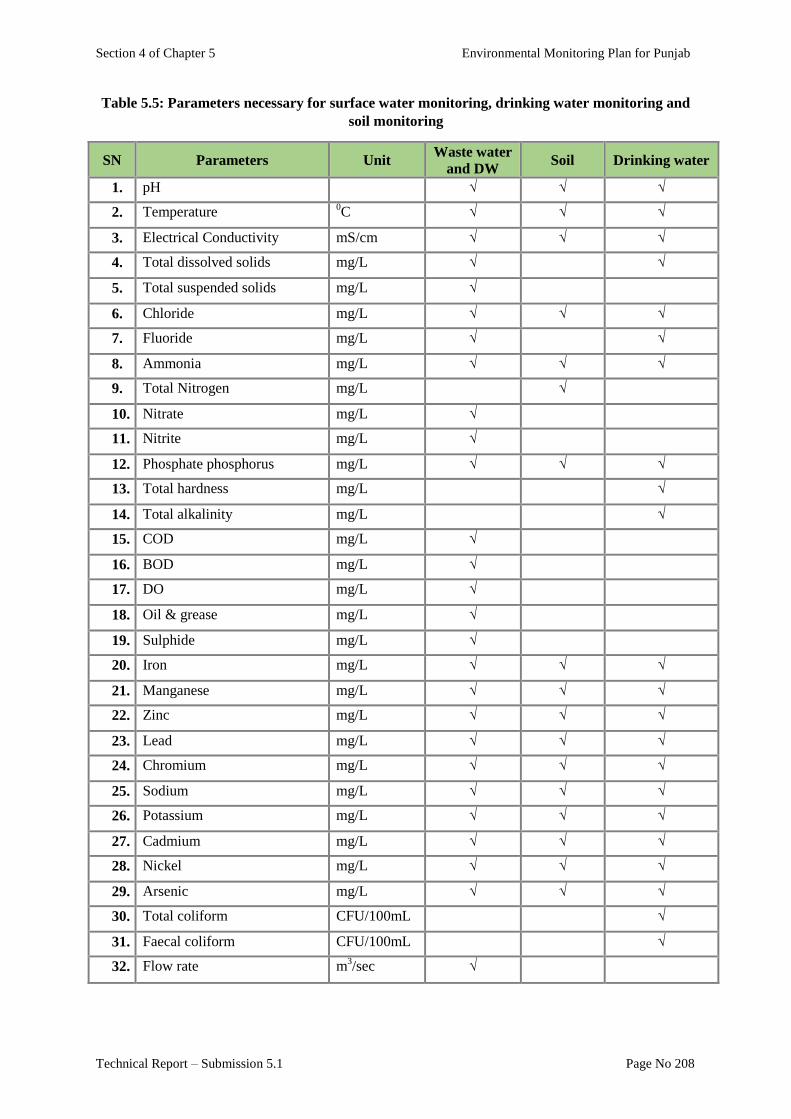
Section 4 of Chapter 5 Environmental Monitoring Plan for Punjab
Technical Report – Submission 5.1 Page No 208
Table 5.5: Parameters necessary for surface water monitoring, drinking water monitoring and
soil monitoring
SN Parameters Unit Waste water
and DW Soil Drinking water
1. pH √ √ √
2. Temperature 0C √ √ √
3. Electrical Conductivity mS/cm √ √ √
4. Total dissolved solids mg/L √ √
5. Total suspended solids mg/L √
6. Chloride mg/L √ √ √
7. Fluoride mg/L √ √
8. Ammonia mg/L √ √ √
9. Total Nitrogen mg/L √
10. Nitrate mg/L √
11. Nitrite mg/L √
12. Phosphate phosphorus mg/L √ √ √
13. Total hardness mg/L √
14. Total alkalinity mg/L √
15. COD mg/L √
16. BOD mg/L √
17. DO mg/L √
18. Oil & grease mg/L √
19. Sulphide mg/L √
20. Iron mg/L √ √ √
21. Manganese mg/L √ √ √
22. Zinc mg/L √ √ √
23. Lead mg/L √ √ √
24. Chromium mg/L √ √ √
25. Sodium mg/L √ √ √
26. Potassium mg/L √ √ √
27. Cadmium mg/L √ √ √
28. Nickel mg/L √ √ √
29. Arsenic mg/L √ √ √
30. Total coliform CFU/100mL √
31. Faecal coliform CFU/100mL √
32. Flow rate m3/sec √

Section 4 of Chapter 5 Environmental Monitoring Plan for Punjab
Technical Report – Submission 5.1 Page No 209
Monitoring of Rivers
An attempt has been made to develop a monitoring plan for five rivers of Punjab i.e. Indus,
Satluj, Ravi Jhelum and Chenab. These rivers originate from mountain ecosystems, and
deliver major part of their water resource to the plain areas of province. All these five rivers
are the tributaries of Indus River. Summary of all the five rivers of Punjab is given below;
Table 5.6: Summary of Five Rivers in Punjab
River
Name
Length
(In k.m) Place of Origin Terminates In
Sutlej 1200 Rakshastal lake in Tibet Chenab river
Beas 470 Beas Kund in Himalayas,
Himachal Pradesh
Sutlej river at Harike in Tarn Taran
district
Ravi 720 Kangra district of Himachal
Pradesh
Chenab river
Chenab 960 Upper Himalayas in Lahaul and
Spiti district of Himachal Pradesh
Merge with Sutlej and forms Panjnad
river, which flows into Indus river
Jhelum 725 Verinag spring in Kashmir Chenab river
Sampling stations on rivers should, as a general rule, be established at places where the water
is sufficiently well mixed for only a single sample to be required. The lateral and vertical
mixing of a wastewater effluent or a tributary stream with the main river can be rather slow,
particularly if the flow in the river is laminar and the waters are at different temperatures.
To verify that there is complete mixing at a sampling station it is necessary to take several
samples at points across the width and depth of the river and to analyze them. If the results do
not vary significantly one from the other, a station can be established at mid-stream or some
other convenient point. If the results are significantly different it will be necessary to obtain a
composite sample by combining samples taken at several points in the cross-section of the
stream. Generally, the more points that are sampled, the more representative the composite
sample will be. Sampling at three to five points is usually sufficient and fewer points are
needed for narrow and shallow streams.
A bridge is an excellent place at which to establish a sampling station (provided that it is
located at a sampling site on the river). It is easily accessible and clearly identifiable, and the
station can be precisely described. Usually, a sample taken from a bridge at mid-stream or in
mid-channel, in a well-mixed river, will adequately represent all of the water in the river.
Criteria of River Monitoring Sites
A sampling site is the general area of a water body from which samples are to be taken and is
sometimes called a “macro-location”. The exact place at which the sample is taken is
commonly referred to as a sampling station or, sometimes, a “micro-location”.
A basic river network can comprise sampling sites at major tributaries at its confluence and
major discharges of sewage or industrial effluent.
The initially proposed macro locations are based on following sites:
Below major population centers and industrial clusters
Where major streams enter the state
Random location to cover river stretch/length
.
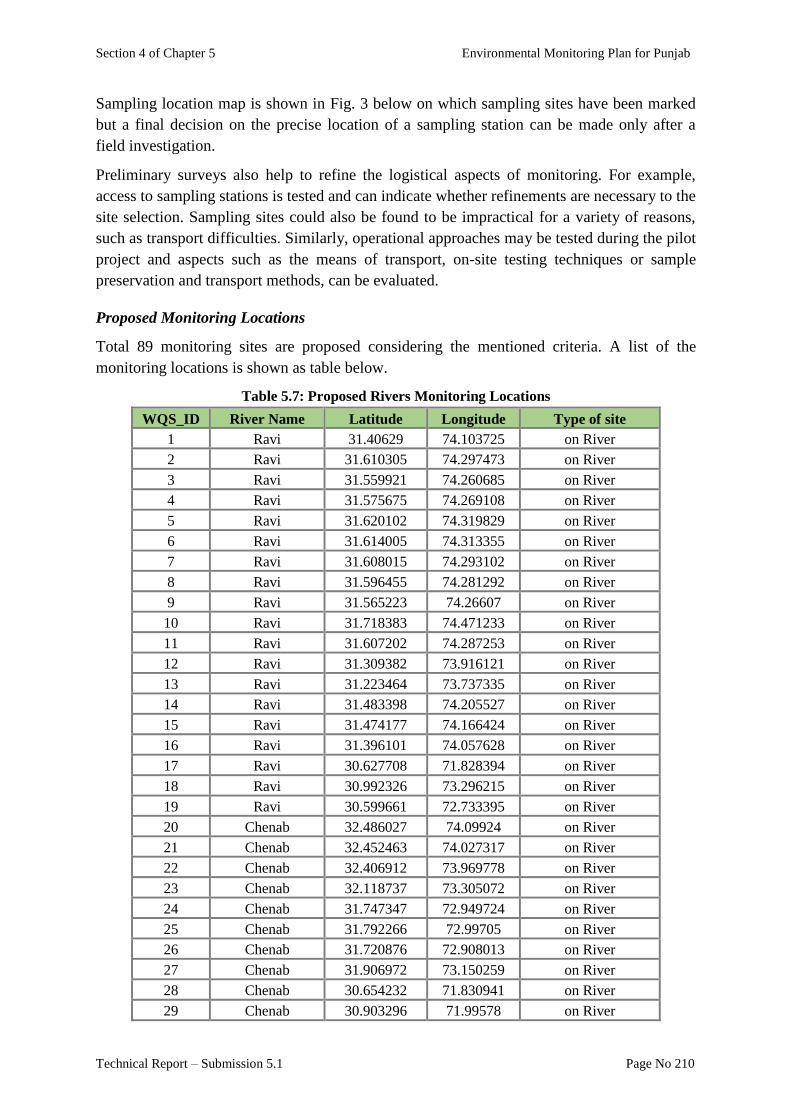
Section 4 of Chapter 5 Environmental Monitoring Plan for Punjab
Technical Report – Submission 5.1 Page No 210
Sampling location map is shown in Fig. 3 below on which sampling sites have been marked
but a final decision on the precise location of a sampling station can be made only after a
field investigation.
Preliminary surveys also help to refine the logistical aspects of monitoring. For example,
access to sampling stations is tested and can indicate whether refinements are necessary to the
site selection. Sampling sites could also be found to be impractical for a variety of reasons,
such as transport difficulties. Similarly, operational approaches may be tested during the pilot
project and aspects such as the means of transport, on-site testing techniques or sample
preservation and transport methods, can be evaluated.
Proposed Monitoring Locations
Total 89 monitoring sites are proposed considering the mentioned criteria. A list of the
monitoring locations is shown as table below.
Table 5.7: Proposed Rivers Monitoring Locations
WQS_ID River Name Latitude Longitude Type of site
1 Ravi 31.40629 74.103725 on River
2 Ravi 31.610305 74.297473 on River
3 Ravi 31.559921 74.260685 on River
4 Ravi 31.575675 74.269108 on River
5 Ravi 31.620102 74.319829 on River
6 Ravi 31.614005 74.313355 on River
7 Ravi 31.608015 74.293102 on River
8 Ravi 31.596455 74.281292 on River
9 Ravi 31.565223 74.26607 on River
10 Ravi 31.718383 74.471233 on River
11 Ravi 31.607202 74.287253 on River
12 Ravi 31.309382 73.916121 on River
13 Ravi 31.223464 73.737335 on River
14 Ravi 31.483398 74.205527 on River
15 Ravi 31.474177 74.166424 on River
16 Ravi 31.396101 74.057628 on River
17 Ravi 30.627708 71.828394 on River
18 Ravi 30.992326 73.296215 on River
19 Ravi 30.599661 72.733395 on River
20 Chenab 32.486027 74.09924 on River
21 Chenab 32.452463 74.027317 on River
22 Chenab 32.406912 73.969778 on River
23 Chenab 32.118737 73.305072 on River
24 Chenab 31.747347 72.949724 on River
25 Chenab 31.792266 72.99705 on River
26 Chenab 31.720876 72.908013 on River
27 Chenab 31.906972 73.150259 on River
28 Chenab 30.654232 71.830941 on River
29 Chenab 30.903296 71.99578 on River
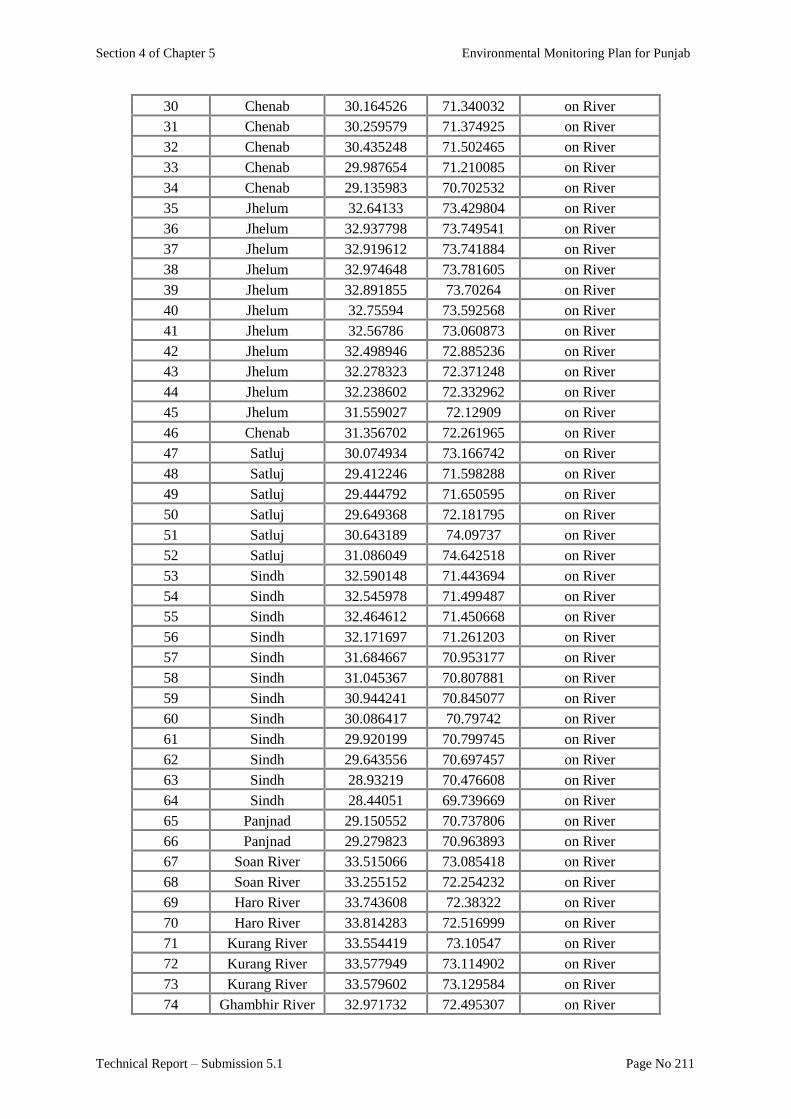
Section 4 of Chapter 5 Environmental Monitoring Plan for Punjab
Technical Report – Submission 5.1 Page No 211
30 Chenab 30.164526 71.340032 on River
31 Chenab 30.259579 71.374925 on River
32 Chenab 30.435248 71.502465 on River
33 Chenab 29.987654 71.210085 on River
34 Chenab 29.135983 70.702532 on River
35 Jhelum 32.64133 73.429804 on River
36 Jhelum 32.937798 73.749541 on River
37 Jhelum 32.919612 73.741884 on River
38 Jhelum 32.974648 73.781605 on River
39 Jhelum 32.891855 73.70264 on River
40 Jhelum 32.75594 73.592568 on River
41 Jhelum 32.56786 73.060873 on River
42 Jhelum 32.498946 72.885236 on River
43 Jhelum 32.278323 72.371248 on River
44 Jhelum 32.238602 72.332962 on River
45 Jhelum 31.559027 72.12909 on River
46 Chenab 31.356702 72.261965 on River
47 Satluj 30.074934 73.166742 on River
48 Satluj 29.412246 71.598288 on River
49 Satluj 29.444792 71.650595 on River
50 Satluj 29.649368 72.181795 on River
51 Satluj 30.643189 74.09737 on River
52 Satluj 31.086049 74.642518 on River
53 Sindh 32.590148 71.443694 on River
54 Sindh 32.545978 71.499487 on River
55 Sindh 32.464612 71.450668 on River
56 Sindh 32.171697 71.261203 on River
57 Sindh 31.684667 70.953177 on River
58 Sindh 31.045367 70.807881 on River
59 Sindh 30.944241 70.845077 on River
60 Sindh 30.086417 70.79742 on River
61 Sindh 29.920199 70.799745 on River
62 Sindh 29.643556 70.697457 on River
63 Sindh 28.93219 70.476608 on River
64 Sindh 28.44051 69.739669 on River
65 Panjnad 29.150552 70.737806 on River
66 Panjnad 29.279823 70.963893 on River
67 Soan River 33.515066 73.085418 on River
68 Soan River 33.255152 72.254232 on River
69 Haro River 33.743608 72.38322 on River
70 Haro River 33.814283 72.516999 on River
71 Kurang River 33.554419 73.10547 on River
72 Kurang River 33.577949 73.114902 on River
73 Kurang River 33.579602 73.129584 on River
74 Ghambhir River 32.971732 72.495307 on River

Section 4 of Chapter 5 Environmental Monitoring Plan for Punjab
Technical Report – Submission 5.1 Page No 212
75 Ghambhir River 33.141688 72.434561 on River
76 Islam Barrage 29.826576 72.549618 Barrage/Head works
77 Punjnad 29.346413 71.020994 Barrage/Head works
78 Suleimanke 30.377725 73.866971 Barrage/Head works
79 Sindhani 30.5729 72.157865 Barrage/Head works
80 Trimmu 31.145096 72.146212 Barrage/Head works
81 Balloki 31.221625 73.859529 Barrage/Head works
82 Qudirabad 32.321202 73.685638 Barrage/Head works
83 Taunsa 30.513513 70.851309 Barrage/Head works
84 Marala 32.672508 74.46488 Barrage/Head works
85 Rasul 32.681519 73.519422 Barrage/Head works
86 Jinnah 32.917984 71.522812 Barrage/Head works
87 Chashma 32.443076 71.385975 Barrage/Head works
88 Khanki 32.404739 73.970583 Barrage/Head works
89 Gudu 28.42496 69.71786 Barrage/Head works
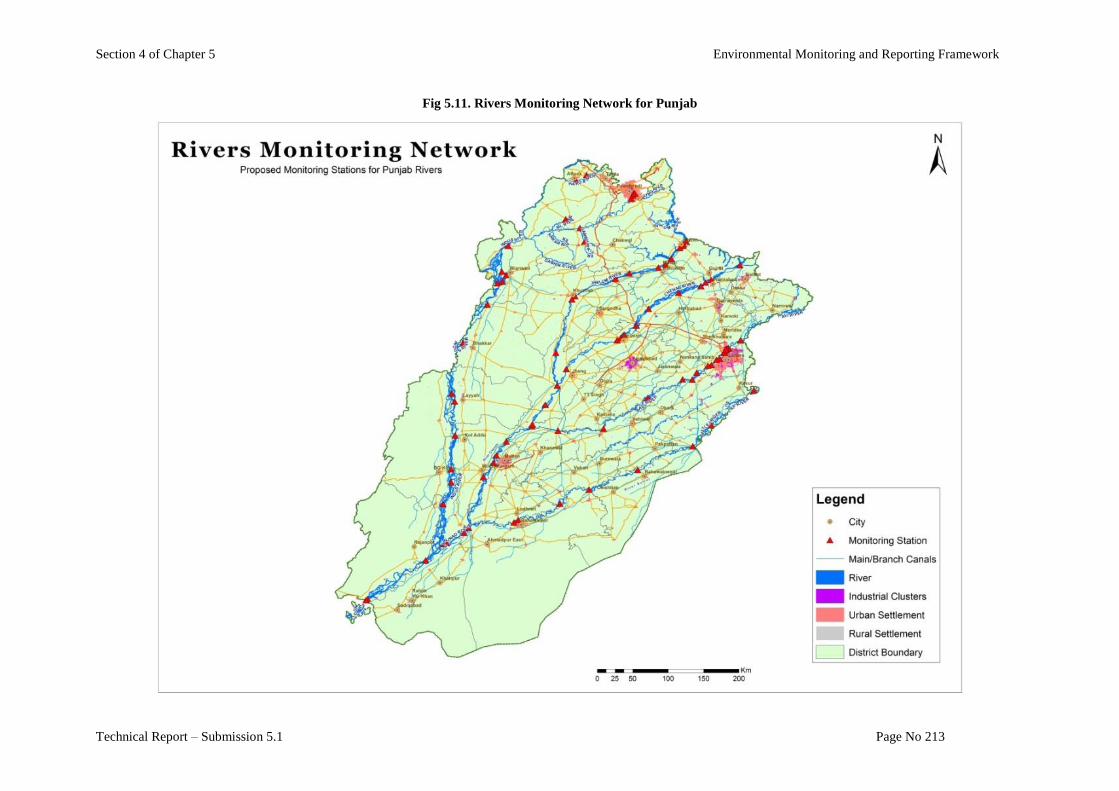
Section 4 of Chapter 5 Environmental Monitoring and Reporting Framework
Technical Report – Submission 5.1 Page No 213
Fig 5.11. Rivers Monitoring Network for Punjab

Section 4 of Chapter 5 Environmental Monitoring and Reporting Framework
Technical Report – Submission 5.1 Page No 214
Lakes and Reservoir Monitoring
Lakes and reservoirs can be subject to several influences that cause water quality to vary from place to
place and from time to time. It is, therefore, prudent to conduct preliminary investigations to ensure
that sampling stations are truly representative of the water body.
Where feeder streams or effluents enter lakes or reservoirs there may be local areas where the
incoming water is concentrated, because it has not yet mixed with the main water body.
Isolated bays and narrow inlets of lakes are frequently poorly mixed and may contain water of a
different quality from that of the rest of the lake. Wind action and the shape of a lake may lead to a
lack of homogeneity; for example when wind along a long, narrow lake causes a concentration of
algae at one end.
If there is good horizontal mixing, a single station near the center or at the deepest part of the lake will
normally be sufficient for the monitoring of long-term trends. However, if the lake is large, has many
narrow bays or contains several deep basins, more than one station will be needed.
Access to lake and reservoir sampling stations is usually by boat and returning to precisely the same
locations for subsequent samples can be extremely difficult. The task is made simpler when the
locations can be described in relation to local, easily identified landmarks. This, as well as the
representativeness of samples taken at those locations, should be borne in mind when sampling
stations are chosen. Monitoring Points of Ucchali and Namal Lake are illustrated in fig. 5.12 and 5.13
as examples.
Fig. 5.12.Monitoring Points for Ucchali Lake
Fig. 5.13.Monitoring Points for Namal Lake
Table 1.9: Monitoring Points for
Namal Lake
LM_ID X Y
1 71.80333 32.66595
2 71.80405 32.67556
3 71.80223 32.68289
4 71.80752 32.6962
Table 1.8: Monitoring Points for
Ucchali Lake
LM_ID X Y
1 72.05214 32.5628
2 72.0411 32.56222
3 72.02337 32.56123
4 72.00792 32.54777

Section 4 of Chapter 5 Environmental Monitoring and Reporting Framework
Technical Report – Submission 5.1 Page No 215
Frequency and timing of sampling
Sampling frequency at stations where water quality varies considerably should be higher than at
stations where quality remains relatively constant. A new programme, however, with no advance
information on quality variation, should be preceded by a preliminary survey and then begin with a
fixed sampling schedule that can be revised when the need becomes apparent.
Table 5.8: Sampling Frequency
Water Body Sampling Frequency
Rivers 12 per year
Streams 4 Per year including high and low water stages
Lakes/reservoir 1 per year
Groundwater 4 per year
Section 4 of Chapter 5 Environmental Monitoring and Reporting Framework
Technical Report – Submission 5.1 Page No 216
MONITORING OF DRINKING WATER
For drinking water we suggest a set of parameters to be measured in drinking water treatment plants
to measure the end product quality (drinking water). We also present in the same annex quality
recommendations/legal requirements for DW quality set in Finnish government decree (rules)10
.
Organic substances (like POP’s) are not usually measured from drinking water as their solubility to
water is so low and they accumulate to humans mainly through food chain. One exception is the
perfluorinated substances as they are assumed to pose a risk to human health. Concentrations of
perfluorinated substances are measured on raw water of water works. The key sources for
perfluorinated substances are airports/air fields and training areas of fire brigades if they use such
distinguishers, which contain these substances. In Sweden it has detected that 3,5 million people have
been exposed to perfluorinated substances through drinking water.
A single system of water management: River basin management (to be added later)
MONITORING OF HAZARDOUS SUBSTANCES
Monitoring of hazardous substances is an important and difficult challenge to be encountered.
Pakistan in general and Punjab within it is in high risk zone of contamination by various hazardous
substances due to various reasons, like:
- large cotton production (large scale pesticide usage)
- dumping of electronic waste from developed countries
- rapid industrialization
- dismantling of ships (in coastal areas)
Hazardous substances can be divided in three groups, namely;
- heavy metals
- radioactive substances
- organic pollutants
Concentrations of all of these substances need to be monitored in order to protect human beings and
ecosystems
Stockholm Convention on Persistent Organic Pollutants, which entered into force in 2004 restricts or
bans the production and use, import and export of the following 28 chemicals and by-products, which
are persistent, bio-accumulative and have capacity to bio-magnify in the ecosystems. Most of them
are long-lived chemicals, which may undergo long-range transport and travel far from their sources.
They are divided in three categories: Pesticides, Industrial chemicals and by-products.
Pesticides: aldrin, chlordane, DDT, dieldrin, endrin, heptachlor, hexachlorobenzene, mirex,
toxaphene chlordecone, alpha hexachlorocyclohexane, beta hexachlorocyclohexane, lindane,
pentachlorobenzene, Pesticide endosulfan and its isomers.
Industrial chemicals: hexabromobiphenyl, hexabromodiphenyl ether and heptabromodiphenyl ether,
pentachlorobenzene, perfluorooctane sulfonic acid, its salts and perfluorooctane sulfonyl fluoride,
tetrabromodiphenyl ether and pentabromodiphenyl ether, brominated flame retardant
hexabromocyclododecane (HBCD), Pentachlorophenol (+salts and esters), HCBD (A),
10
Decree of the Ministry of Social Affairs and Health Relating to the Quality and Monitoring of Water Intended
for Human Consumption 1352/2000
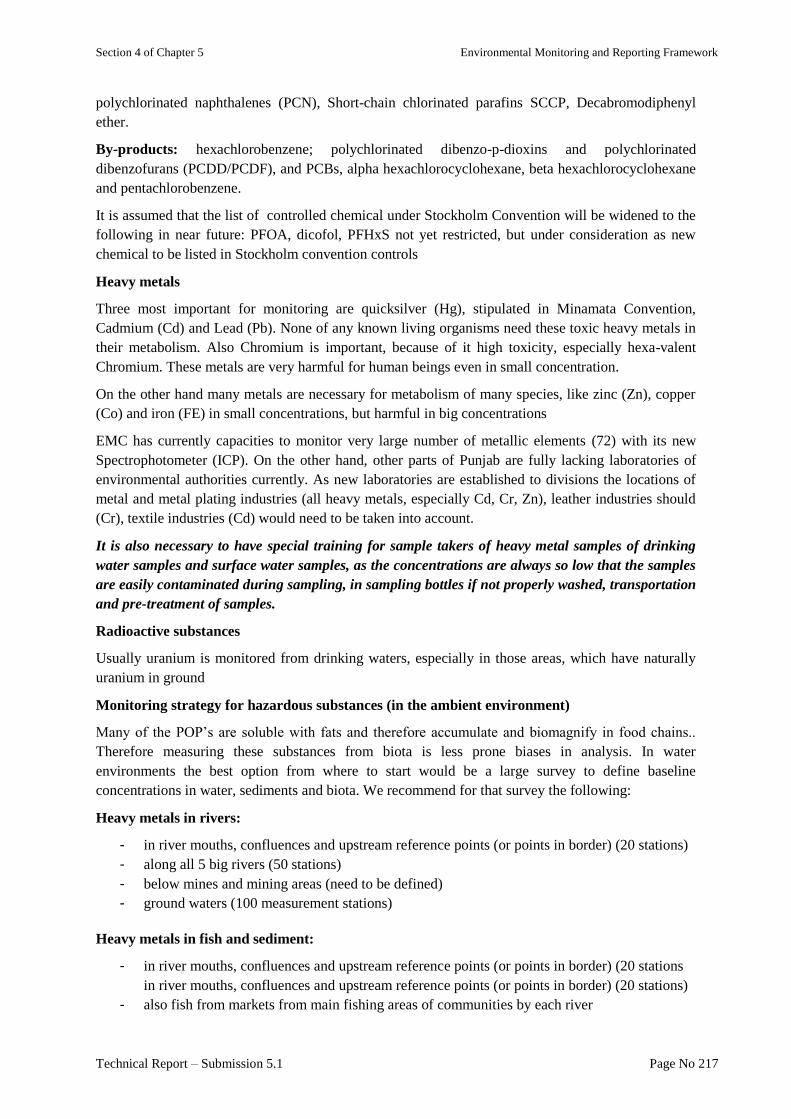
Section 4 of Chapter 5 Environmental Monitoring and Reporting Framework
Technical Report – Submission 5.1 Page No 217
polychlorinated naphthalenes (PCN), Short-chain chlorinated parafins SCCP, Decabromodiphenyl
ether.
By-products: hexachlorobenzene; polychlorinated dibenzo-p-dioxins and polychlorinated
dibenzofurans (PCDD/PCDF), and PCBs, alpha hexachlorocyclohexane, beta hexachlorocyclohexane
and pentachlorobenzene.
It is assumed that the list of controlled chemical under Stockholm Convention will be widened to the
following in near future: PFOA, dicofol, PFHxS not yet restricted, but under consideration as new
chemical to be listed in Stockholm convention controls
Heavy metals
Three most important for monitoring are quicksilver (Hg), stipulated in Minamata Convention,
Cadmium (Cd) and Lead (Pb). None of any known living organisms need these toxic heavy metals in
their metabolism. Also Chromium is important, because of it high toxicity, especially hexa-valent
Chromium. These metals are very harmful for human beings even in small concentration.
On the other hand many metals are necessary for metabolism of many species, like zinc (Zn), copper
(Co) and iron (FE) in small concentrations, but harmful in big concentrations
EMC has currently capacities to monitor very large number of metallic elements (72) with its new
Spectrophotometer (ICP). On the other hand, other parts of Punjab are fully lacking laboratories of
environmental authorities currently. As new laboratories are established to divisions the locations of
metal and metal plating industries (all heavy metals, especially Cd, Cr, Zn), leather industries should
(Cr), textile industries (Cd) would need to be taken into account.
It is also necessary to have special training for sample takers of heavy metal samples of drinking
water samples and surface water samples, as the concentrations are always so low that the samples
are easily contaminated during sampling, in sampling bottles if not properly washed, transportation
and pre-treatment of samples.
Radioactive substances
Usually uranium is monitored from drinking waters, especially in those areas, which have naturally
uranium in ground
Monitoring strategy for hazardous substances (in the ambient environment)
Many of the POP’s are soluble with fats and therefore accumulate and biomagnify in food chains..
Therefore measuring these substances from biota is less prone biases in analysis. In water
environments the best option from where to start would be a large survey to define baseline
concentrations in water, sediments and biota. We recommend for that survey the following:
Heavy metals in rivers:
- in river mouths, confluences and upstream reference points (or points in border) (20 stations)
- along all 5 big rivers (50 stations)
- below mines and mining areas (need to be defined)
- ground waters (100 measurement stations)
Heavy metals in fish and sediment:
- in river mouths, confluences and upstream reference points (or points in border) (20 stations
in river mouths, confluences and upstream reference points (or points in border) (20 stations)
- also fish from markets from main fishing areas of communities by each river
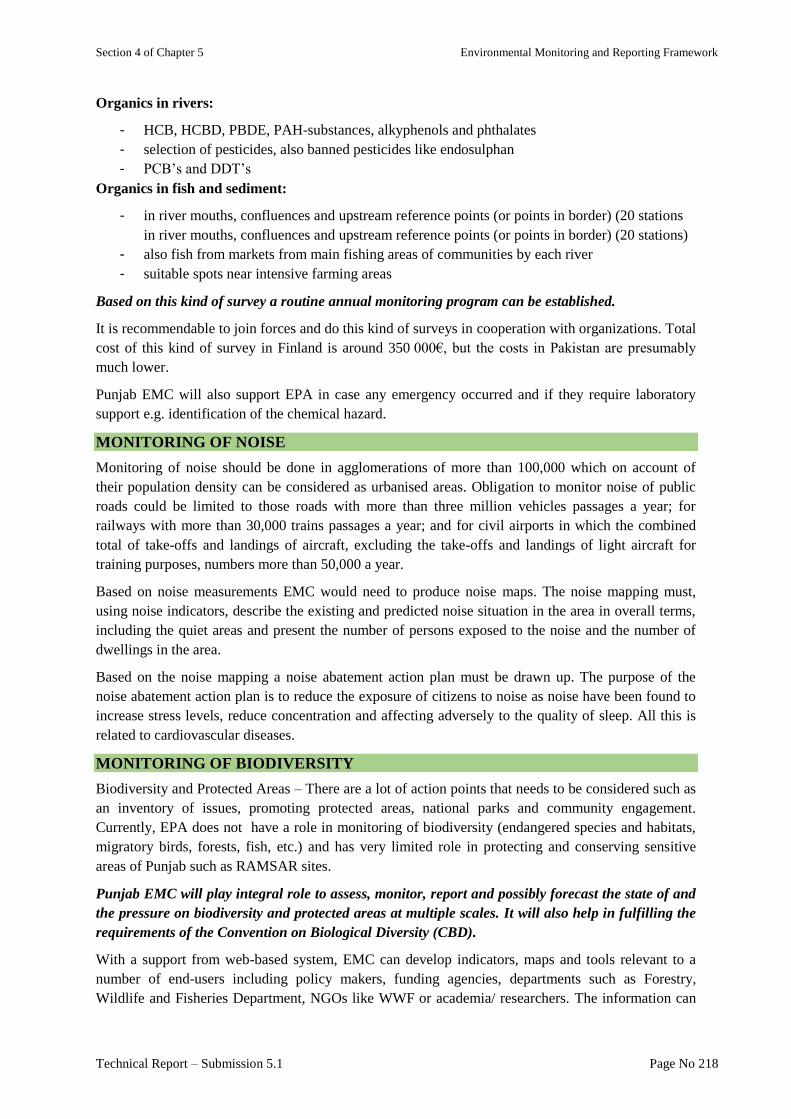
Section 4 of Chapter 5 Environmental Monitoring and Reporting Framework
Technical Report – Submission 5.1 Page No 218
Organics in rivers:
- HCB, HCBD, PBDE, PAH-substances, alkyphenols and phthalates
- selection of pesticides, also banned pesticides like endosulphan
- PCB’s and DDT’s
Organics in fish and sediment:
- in river mouths, confluences and upstream reference points (or points in border) (20 stations
in river mouths, confluences and upstream reference points (or points in border) (20 stations)
- also fish from markets from main fishing areas of communities by each river
- suitable spots near intensive farming areas
Based on this kind of survey a routine annual monitoring program can be established.
It is recommendable to join forces and do this kind of surveys in cooperation with organizations. Total
cost of this kind of survey in Finland is around 350 000€, but the costs in Pakistan are presumably
much lower.
Punjab EMC will also support EPA in case any emergency occurred and if they require laboratory
support e.g. identification of the chemical hazard.
MONITORING OF NOISE
Monitoring of noise should be done in agglomerations of more than 100,000 which on account of
their population density can be considered as urbanised areas. Obligation to monitor noise of public
roads could be limited to those roads with more than three million vehicles passages a year; for
railways with more than 30,000 trains passages a year; and for civil airports in which the combined
total of take-offs and landings of aircraft, excluding the take-offs and landings of light aircraft for
training purposes, numbers more than 50,000 a year.
Based on noise measurements EMC would need to produce noise maps. The noise mapping must,
using noise indicators, describe the existing and predicted noise situation in the area in overall terms,
including the quiet areas and present the number of persons exposed to the noise and the number of
dwellings in the area.
Based on the noise mapping a noise abatement action plan must be drawn up. The purpose of the
noise abatement action plan is to reduce the exposure of citizens to noise as noise have been found to
increase stress levels, reduce concentration and affecting adversely to the quality of sleep. All this is
related to cardiovascular diseases.
MONITORING OF BIODIVERSITY
Biodiversity and Protected Areas – There are a lot of action points that needs to be considered such as
an inventory of issues, promoting protected areas, national parks and community engagement.
Currently, EPA does not have a role in monitoring of biodiversity (endangered species and habitats,
migratory birds, forests, fish, etc.) and has very limited role in protecting and conserving sensitive
areas of Punjab such as RAMSAR sites.
Punjab EMC will play integral role to assess, monitor, report and possibly forecast the state of and
the pressure on biodiversity and protected areas at multiple scales. It will also help in fulfilling the
requirements of the Convention on Biological Diversity (CBD).
With a support from web-based system, EMC can develop indicators, maps and tools relevant to a
number of end-users including policy makers, funding agencies, departments such as Forestry,
Wildlife and Fisheries Department, NGOs like WWF or academia/ researchers. The information can

Section 4 of Chapter 5 Environmental Monitoring and Reporting Framework
Technical Report – Submission 5.1 Page No 219
be useful for spatial planning, resource allocation, biodiversity conservation, protected area
development and management, and national and international reporting.
COMPLIANCE MONITORING AND INSPECTION
Environmental compliance monitoring is a procedure that helps to monitor the environment in order
to enforce the compliance with the environmental quality standards and regulations. Compliance
monitoring promotes the environmental friendly businesses, ensures the facility
owners/operators/industrialists to comply and uphold the enforcement process by stopping those who
disregard the rules, sanctioning them and obliging them to rectify the damage.
Complaints monitoring
Complaints relate to events and environmental problems or perceived problems and can be useful for
management purposes and may indicate situations where consents may be required in future to better
address adverse effects created by permitted activities. It can also help to fill gaps in knowledge and
information about the quality of the environment and community attitudes.
In the long run, it may be possible to use complaints monitoring to help develop trend data and add
value to state of the environment reporting. This relies on having an integrated approach to
monitoring and reporting within EPA and other entities.
Operational Permits Monitoring
Monitoring requirements are a very important aspect of the operating permits. Assessing and
documenting compliance with permits and regulations provides information to the facility
owners/operators/industrialists to self-assess their performance relative to meeting air pollution
requirements, and to support them in determining the proper corrective actions, when necessary.
As per Punjab Environmental Protection Act 1997 (amended 2018), all polluting facilities are legally
required to obtain an "operating permit" that document how pollution sources will demonstrate
compliance with emission limits and how these pollution sources will monitor, either periodically or
continuously, their compliance with emission limits and all other applicable requirements on an on-
going basis.
The compliance assurance monitoring identifies the required permit conditions, including:
the approved monitoring approach, including the indicator(s) of performance to be monitored;
the indicator range such that operation within the range provides a reasonable assurance of
compliance;
specifications for the monitoring system and monitoring location to assure data
representativeness;
quality assurance & quality control practices to ensure continuing validity of the data; and
the frequency of monitoring, and, if applicable, the data averaging period.
Punjab EMC will do regular monitoring as per Annual Ambient Environmental Monitoring Plan.
However, it will also do monitoring upon request from EPA directorates to either check the
compliance of EQS of specific industry or monitoring as per the requirements of EIA, operational
or tradeable permits. This will help EPA Punjab to set out the core regulatory and targeted
compliance interventions and also help to promote transparency and bring an opportunity for
businesses to review and where necessary correct their practices, prior to any intervention by the
regulator.
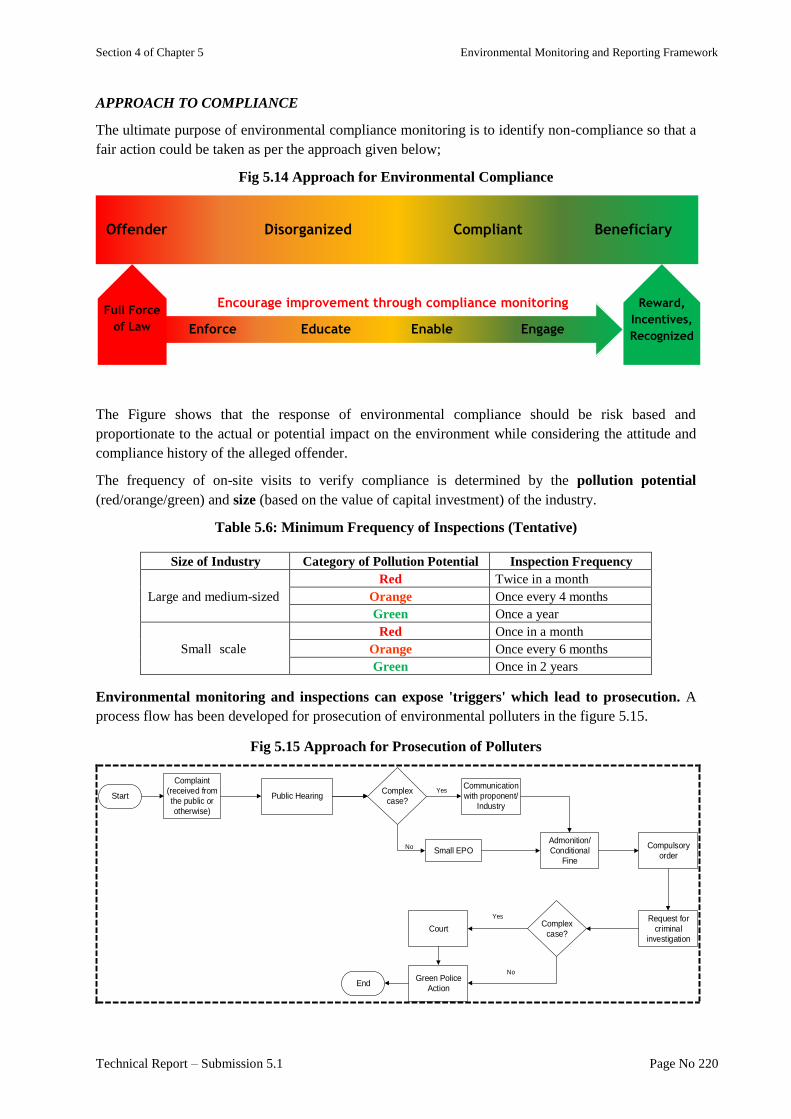
Section 4 of Chapter 5 Environmental Monitoring and Reporting Framework
Technical Report – Submission 5.1 Page No 220
APPROACH TO COMPLIANCE
The ultimate purpose of environmental compliance monitoring is to identify non-compliance so that a
fair action could be taken as per the approach given below;
Fig 5.14 Approach for Environmental Compliance
The Figure shows that the response of environmental compliance should be risk based and
proportionate to the actual or potential impact on the environment while considering the attitude and
compliance history of the alleged offender.
The frequency of on-site visits to verify compliance is determined by the pollution potential
(red/orange/green) and size (based on the value of capital investment) of the industry.
Table 5.6: Minimum Frequency of Inspections (Tentative)
Size of Industry Category of Pollution Potential Inspection Frequency
Large and medium-sized
Red Twice in a month
Orange Once every 4 months
Green Once a year
Small scale
Red Once in a month
Orange Once every 6 months
Green Once in 2 years
Environmental monitoring and inspections can expose 'triggers' which lead to prosecution. A
process flow has been developed for prosecution of environmental polluters in the figure 5.15.
Fig 5.15 Approach for Prosecution of Polluters
Start
Complaint
(received from
the public or
otherwise)
Public Hearing
Small EPO
Admonition/
Conditional
Fine
Complex
case?
Communication
with proponent/
Industry
Compulsory
order
Request for
criminal
investigation
Complex
case?
Yes
No
Court
Green Police
Action
Yes
No
End
Offender Disorganized Compliant Beneficiary
Enforce Educate Enable Engage
Full Force
of Law
Reward,
Incentives,
Recognized
Encourage improvement through compliance monitoring

Section 5
Policy Recommendations
for
Environmental Monitoring and Reporting

Section 5 of Chapter 5 Policy Recommendations for Environmental Monitoring and Reporting
Technical Report – Submission 5.1 Page No 224
Section 5
Policy Recommendations for
Environmental Monitoring and Reporting Recommendations for improved environmental monitoring include;
In order to have access to environmental information one would need first to know what kind of
environmental data is already available (meta-database)
Secondly the information need to be found (web-based databases)
Thirdly, it would be necessary to have it for free of charge or on the cost coverage price (Data
sharing policy)
Fourthly, the data would need be presented in an understandable format (indicators). In order to
educate citizens and Decision Makers, environmental data would need to be interpreted to
meaningful information and distributed as EIP’s and through public media (NCEI, SOEr)
Monitoring should have legislative basis, with also provisions and obligations for data sharing
It is elementary to invest sufficiently and sustainably in environmental monitoring to guarantee
long term monitoring
In monitoring of emissions and discharges of industries as well, in case of large infrastructure
projects, the costs of monitoring should be paid by the proponent/environmental permit holder
(industries, infra constructing companies and municipalities)
There should be a monitoring strategy based on needs and economical possibilities (revised
every 5-10 years). This could be constituted through EMIN process in Punjab province level
Clear responsibilities should be set and organized in co-operation with expert institutes with
high expertise
Long-term programmes (revised e.g. every 3 years) should be laid down
Quality control and assessment needed in every phase of monitoring (planning, sampling,
laboratory work, data processing, assessment and reporting)
Annual reporting on different levels (national, regional and local) should be performed in a
regular basis


Annexure

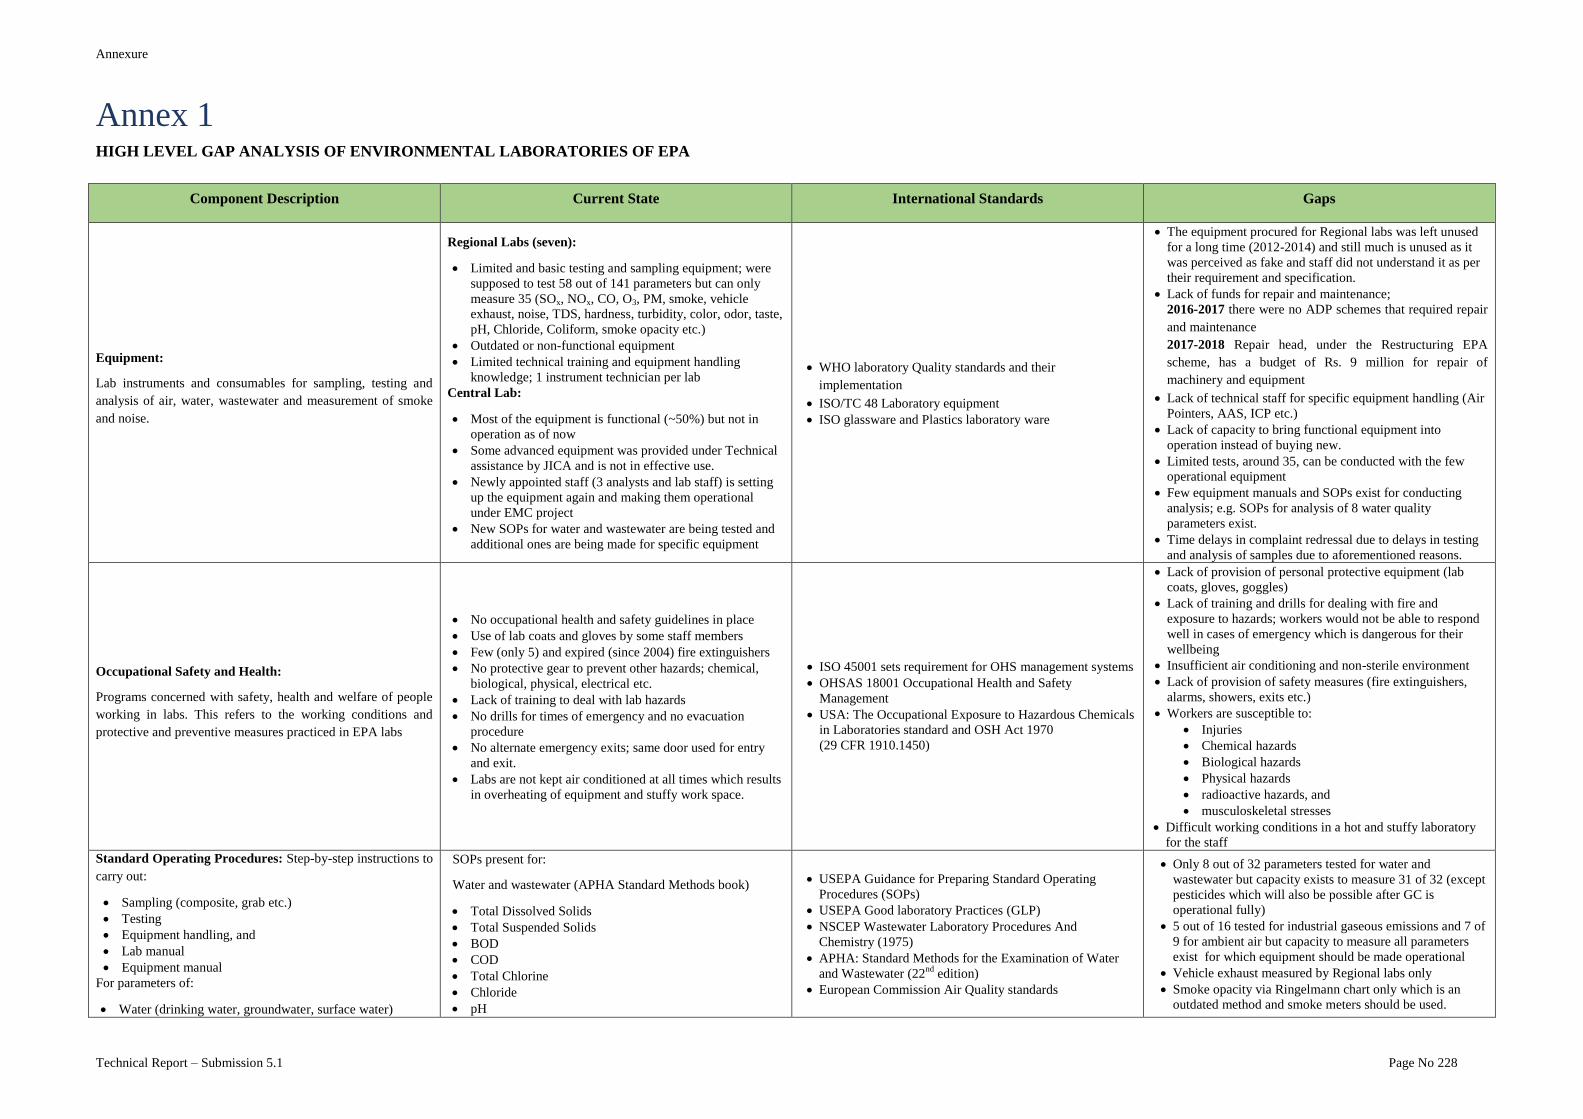
Annexure
Technical Report – Submission 5.1 Page No 228
Annex 1 HIGH LEVEL GAP ANALYSIS OF ENVIRONMENTAL LABORATORIES OF EPA
Component Description Current State International Standards Gaps
Equipment:
Lab instruments and consumables for sampling, testing and
analysis of air, water, wastewater and measurement of smoke
and noise.
Regional Labs (seven):
Limited and basic testing and sampling equipment; were
supposed to test 58 out of 141 parameters but can only
measure 35 (SOx, NOx, CO, O3, PM, smoke, vehicle
exhaust, noise, TDS, hardness, turbidity, color, odor, taste,
pH, Chloride, Coliform, smoke opacity etc.)
Outdated or non-functional equipment
Limited technical training and equipment handling
knowledge; 1 instrument technician per lab
Central Lab:
Most of the equipment is functional (~50%) but not in
operation as of now
Some advanced equipment was provided under Technical
assistance by JICA and is not in effective use.
Newly appointed staff (3 analysts and lab staff) is setting
up the equipment again and making them operational
under EMC project
New SOPs for water and wastewater are being tested and
additional ones are being made for specific equipment
WHO laboratory Quality standards and their
implementation
ISO/TC 48 Laboratory equipment
ISO glassware and Plastics laboratory ware
The equipment procured for Regional labs was left unused
for a long time (2012-2014) and still much is unused as it
was perceived as fake and staff did not understand it as per
their requirement and specification.
Lack of funds for repair and maintenance;
2016-2017 there were no ADP schemes that required repair
and maintenance
2017-2018 Repair head, under the Restructuring EPA
scheme, has a budget of Rs. 9 million for repair of
machinery and equipment
Lack of technical staff for specific equipment handling (Air
Pointers, AAS, ICP etc.)
Lack of capacity to bring functional equipment into
operation instead of buying new.
Limited tests, around 35, can be conducted with the few
operational equipment
Few equipment manuals and SOPs exist for conducting
analysis; e.g. SOPs for analysis of 8 water quality
parameters exist.
Time delays in complaint redressal due to delays in testing
and analysis of samples due to aforementioned reasons.
Occupational Safety and Health:
Programs concerned with safety, health and welfare of people
working in labs. This refers to the working conditions and
protective and preventive measures practiced in EPA labs
No occupational health and safety guidelines in place
Use of lab coats and gloves by some staff members
Few (only 5) and expired (since 2004) fire extinguishers
No protective gear to prevent other hazards; chemical,
biological, physical, electrical etc.
Lack of training to deal with lab hazards
No drills for times of emergency and no evacuation
procedure
No alternate emergency exits; same door used for entry
and exit.
Labs are not kept air conditioned at all times which results
in overheating of equipment and stuffy work space.
ISO 45001 sets requirement for OHS management systems
OHSAS 18001 Occupational Health and Safety
Management
USA: The Occupational Exposure to Hazardous Chemicals
in Laboratories standard and OSH Act 1970
(29 CFR 1910.1450)
Lack of provision of personal protective equipment (lab
coats, gloves, goggles)
Lack of training and drills for dealing with fire and
exposure to hazards; workers would not be able to respond
well in cases of emergency which is dangerous for their
wellbeing
Insufficient air conditioning and non-sterile environment
Lack of provision of safety measures (fire extinguishers,
alarms, showers, exits etc.)
Workers are susceptible to:
Injuries
Chemical hazards
Biological hazards
Physical hazards
radioactive hazards, and
musculoskeletal stresses
Difficult working conditions in a hot and stuffy laboratory
for the staff
Standard Operating Procedures: Step-by-step instructions to
carry out:
Sampling (composite, grab etc.)
Testing
Equipment handling, and
Lab manual
Equipment manual
For parameters of:
Water (drinking water, groundwater, surface water)
SOPs present for:
Water and wastewater (APHA Standard Methods book)
Total Dissolved Solids
Total Suspended Solids
BOD
COD
Total Chlorine
Chloride
pH
USEPA Guidance for Preparing Standard Operating
Procedures (SOPs)
USEPA Good laboratory Practices (GLP)
NSCEP Wastewater Laboratory Procedures And
Chemistry (1975)
APHA: Standard Methods for the Examination of Water
and Wastewater (22nd
edition)
European Commission Air Quality standards
Only 8 out of 32 parameters tested for water and
wastewater but capacity exists to measure 31 of 32 (except
pesticides which will also be possible after GC is
operational fully)
5 out of 16 tested for industrial gaseous emissions and 7 of
9 for ambient air but capacity to measure all parameters
exist for which equipment should be made operational
Vehicle exhaust measured by Regional labs only
Smoke opacity via Ringelmann chart only which is an
outdated method and smoke meters should be used.
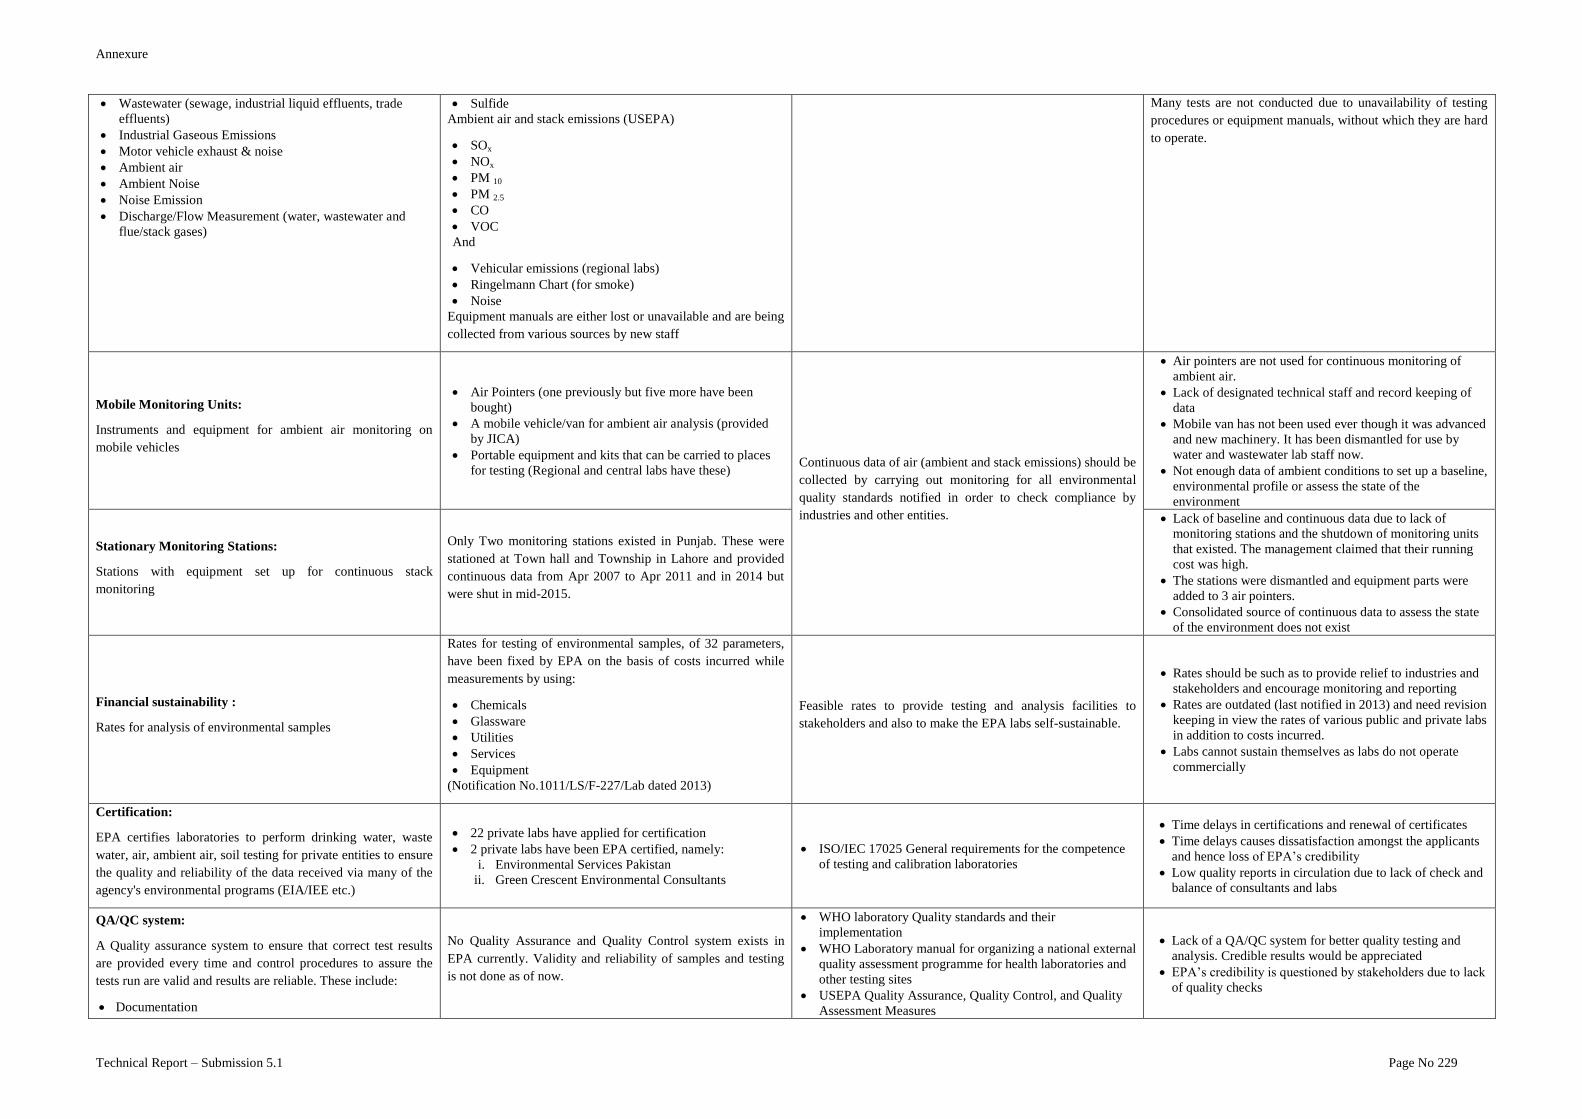
Annexure
Technical Report – Submission 5.1 Page No 229
Wastewater (sewage, industrial liquid effluents, trade
effluents)
Industrial Gaseous Emissions
Motor vehicle exhaust & noise
Ambient air
Ambient Noise
Noise Emission
Discharge/Flow Measurement (water, wastewater and
flue/stack gases)
Sulfide
Ambient air and stack emissions (USEPA)
SOx
NOx
PM 10
PM 2.5
CO
VOC
And
Vehicular emissions (regional labs)
Ringelmann Chart (for smoke)
Noise
Equipment manuals are either lost or unavailable and are being
collected from various sources by new staff
Many tests are not conducted due to unavailability of testing
procedures or equipment manuals, without which they are hard
to operate.
Mobile Monitoring Units:
Instruments and equipment for ambient air monitoring on
mobile vehicles
Air Pointers (one previously but five more have been
bought)
A mobile vehicle/van for ambient air analysis (provided
by JICA)
Portable equipment and kits that can be carried to places
for testing (Regional and central labs have these) Continuous data of air (ambient and stack emissions) should be
collected by carrying out monitoring for all environmental
quality standards notified in order to check compliance by
industries and other entities.
Air pointers are not used for continuous monitoring of
ambient air.
Lack of designated technical staff and record keeping of
data
Mobile van has not been used ever though it was advanced
and new machinery. It has been dismantled for use by
water and wastewater lab staff now.
Not enough data of ambient conditions to set up a baseline,
environmental profile or assess the state of the
environment
Stationary Monitoring Stations:
Stations with equipment set up for continuous stack
monitoring
Only Two monitoring stations existed in Punjab. These were
stationed at Town hall and Township in Lahore and provided
continuous data from Apr 2007 to Apr 2011 and in 2014 but
were shut in mid-2015.
Lack of baseline and continuous data due to lack of
monitoring stations and the shutdown of monitoring units
that existed. The management claimed that their running
cost was high.
The stations were dismantled and equipment parts were
added to 3 air pointers.
Consolidated source of continuous data to assess the state
of the environment does not exist
Financial sustainability :
Rates for analysis of environmental samples
Rates for testing of environmental samples, of 32 parameters,
have been fixed by EPA on the basis of costs incurred while
measurements by using:
Chemicals
Glassware
Utilities
Services
Equipment
(Notification No.1011/LS/F-227/Lab dated 2013)
Feasible rates to provide testing and analysis facilities to
stakeholders and also to make the EPA labs self-sustainable.
Rates should be such as to provide relief to industries and
stakeholders and encourage monitoring and reporting
Rates are outdated (last notified in 2013) and need revision
keeping in view the rates of various public and private labs
in addition to costs incurred.
Labs cannot sustain themselves as labs do not operate
commercially
Certification:
EPA certifies laboratories to perform drinking water, waste
water, air, ambient air, soil testing for private entities to ensure
the quality and reliability of the data received via many of the
agency's environmental programs (EIA/IEE etc.)
22 private labs have applied for certification
2 private labs have been EPA certified, namely:
i. Environmental Services Pakistan
ii. Green Crescent Environmental Consultants
ISO/IEC 17025 General requirements for the competence
of testing and calibration laboratories
Time delays in certifications and renewal of certificates
Time delays causes dissatisfaction amongst the applicants
and hence loss of EPA’s credibility
Low quality reports in circulation due to lack of check and
balance of consultants and labs
QA/QC system:
A Quality assurance system to ensure that correct test results
are provided every time and control procedures to assure the
tests run are valid and results are reliable. These include:
Documentation
No Quality Assurance and Quality Control system exists in
EPA currently. Validity and reliability of samples and testing
is not done as of now.
WHO laboratory Quality standards and their
implementation
WHO Laboratory manual for organizing a national external
quality assessment programme for health laboratories and
other testing sites
USEPA Quality Assurance, Quality Control, and Quality
Assessment Measures
Lack of a QA/QC system for better quality testing and
analysis. Credible results would be appreciated
EPA’s credibility is questioned by stakeholders due to lack
of quality checks
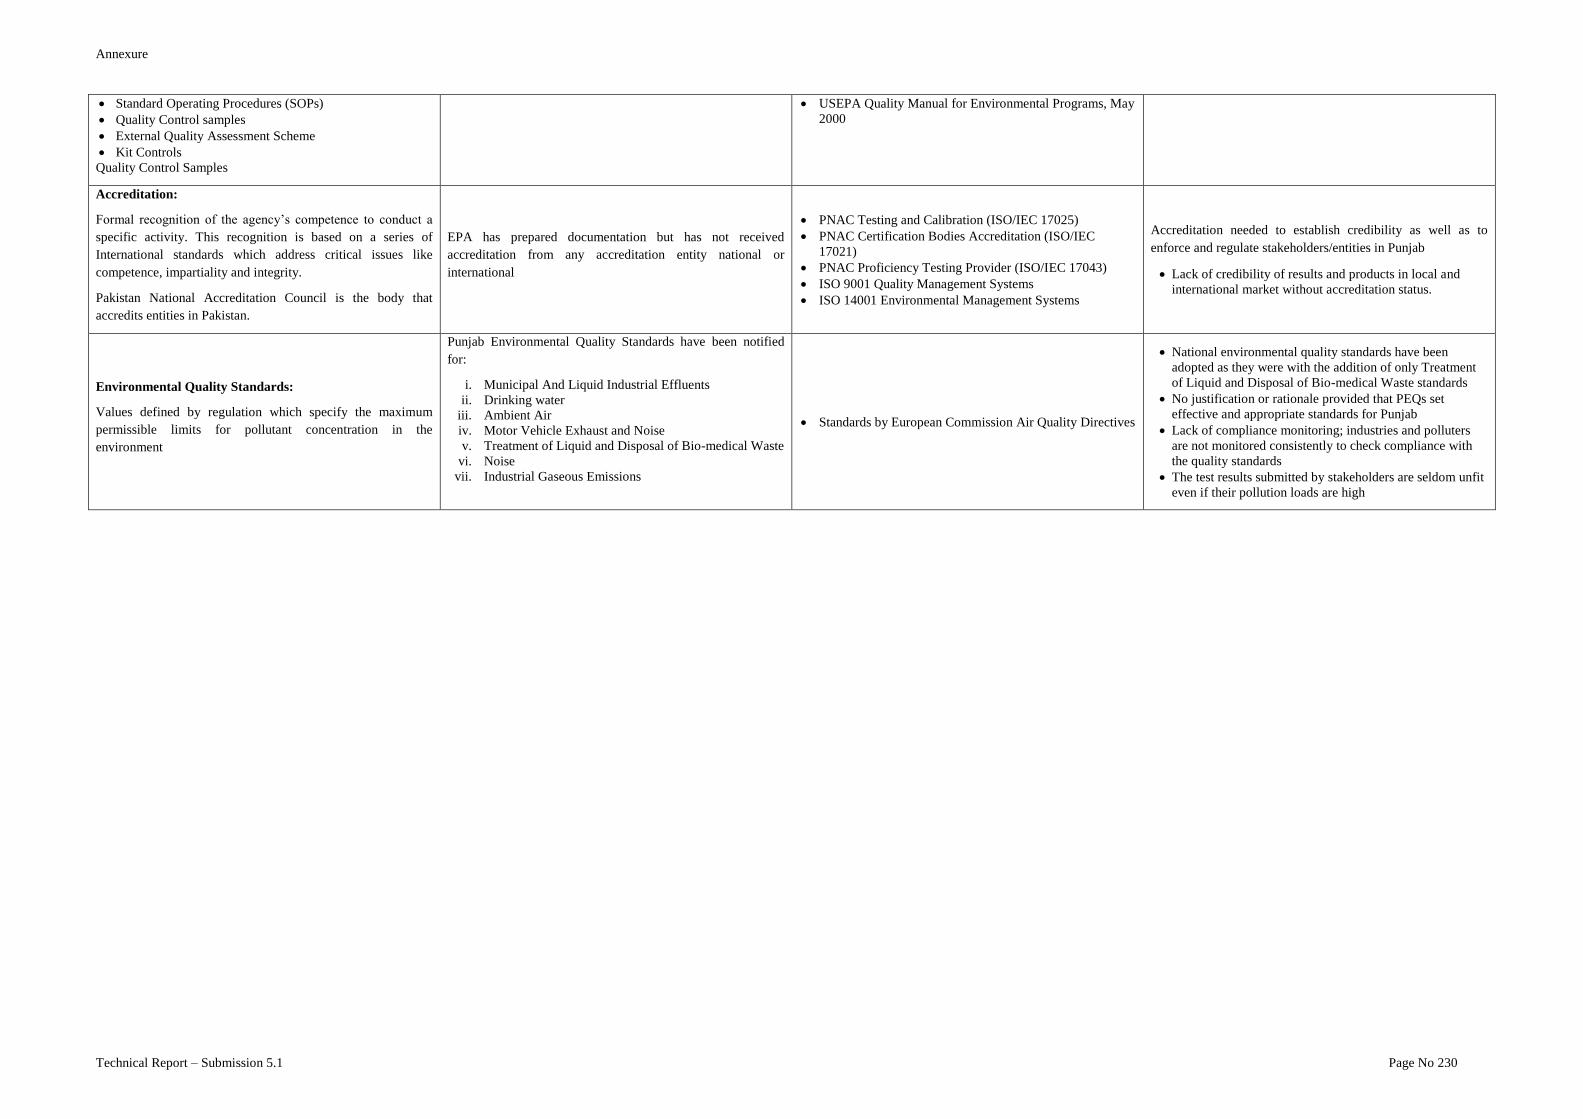
Annexure
Technical Report – Submission 5.1 Page No 230
Standard Operating Procedures (SOPs)
Quality Control samples
External Quality Assessment Scheme
Kit Controls
Quality Control Samples
USEPA Quality Manual for Environmental Programs, May
2000
Accreditation:
Formal recognition of the agency’s competence to conduct a
specific activity. This recognition is based on a series of
International standards which address critical issues like
competence, impartiality and integrity.
Pakistan National Accreditation Council is the body that
accredits entities in Pakistan.
EPA has prepared documentation but has not received
accreditation from any accreditation entity national or
international
PNAC Testing and Calibration (ISO/IEC 17025)
PNAC Certification Bodies Accreditation (ISO/IEC
17021)
PNAC Proficiency Testing Provider (ISO/IEC 17043)
ISO 9001 Quality Management Systems
ISO 14001 Environmental Management Systems
Accreditation needed to establish credibility as well as to
enforce and regulate stakeholders/entities in Punjab
Lack of credibility of results and products in local and
international market without accreditation status.
Environmental Quality Standards:
Values defined by regulation which specify the maximum
permissible limits for pollutant concentration in the
environment
Punjab Environmental Quality Standards have been notified
for:
i. Municipal And Liquid Industrial Effluents
ii. Drinking water
iii. Ambient Air
iv. Motor Vehicle Exhaust and Noise
v. Treatment of Liquid and Disposal of Bio-medical Waste
vi. Noise
vii. Industrial Gaseous Emissions
Standards by European Commission Air Quality Directives
National environmental quality standards have been
adopted as they were with the addition of only Treatment
of Liquid and Disposal of Bio-medical Waste standards
No justification or rationale provided that PEQs set
effective and appropriate standards for Punjab
Lack of compliance monitoring; industries and polluters
are not monitored consistently to check compliance with
the quality standards
The test results submitted by stakeholders are seldom unfit
even if their pollution loads are high
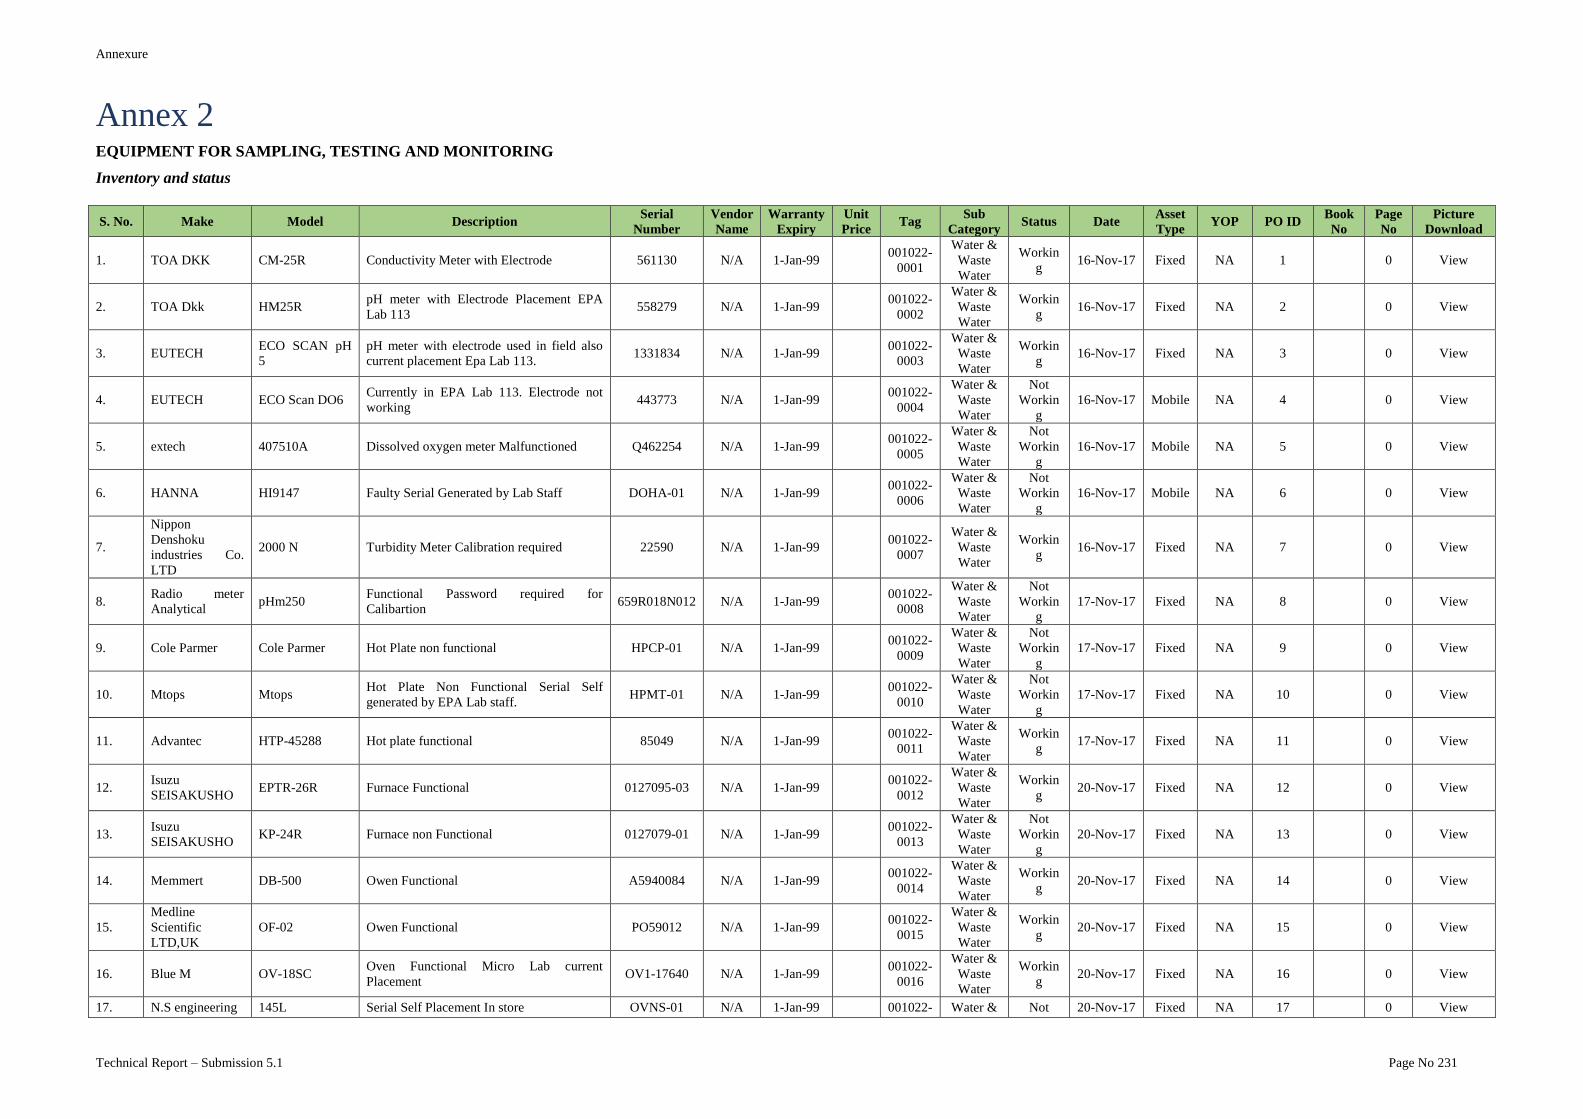
Annexure
Technical Report – Submission 5.1 Page No 231
Annex 2 EQUIPMENT FOR SAMPLING, TESTING AND MONITORING
Inventory and status
S. No. Make Model Description Serial
Number
Vendor
Name
Warranty
Expiry
Unit
Price Tag
Sub
Category Status Date
Asset
Type YOP PO ID
Book
No
Page
No
Picture
Download
1. TOA DKK CM-25R Conductivity Meter with Electrode 561130 N/A 1-Jan-99
001022-
0001
Water &
Waste
Water
Workin
g 16-Nov-17 Fixed NA 1
0 View
2. TOA Dkk HM25R pH meter with Electrode Placement EPA
Lab 113 558279 N/A 1-Jan-99
001022-
0002
Water &
Waste
Water
Workin
g 16-Nov-17 Fixed NA 2
0 View
3. EUTECH ECO SCAN pH
5
pH meter with electrode used in field also
current placement Epa Lab 113. 1331834 N/A 1-Jan-99
001022-
0003
Water &
Waste
Water
Workin
g 16-Nov-17 Fixed NA 3
0 View
4. EUTECH ECO Scan DO6 Currently in EPA Lab 113. Electrode not
working 443773 N/A 1-Jan-99
001022-
0004
Water &
Waste
Water
Not
Workin
g
16-Nov-17 Mobile NA 4
0 View
5. extech 407510A Dissolved oxygen meter Malfunctioned Q462254 N/A 1-Jan-99
001022-
0005
Water &
Waste
Water
Not
Workin
g
16-Nov-17 Mobile NA 5
0 View
6. HANNA HI9147 Faulty Serial Generated by Lab Staff DOHA-01 N/A 1-Jan-99
001022-
0006
Water &
Waste
Water
Not
Workin
g
16-Nov-17 Mobile NA 6
0 View
7.
Nippon
Denshoku
industries Co.
LTD
2000 N Turbidity Meter Calibration required 22590 N/A 1-Jan-99
001022-
0007
Water &
Waste
Water
Workin
g 16-Nov-17 Fixed NA 7
0 View
8. Radio meter
Analytical pHm250
Functional Password required for
Calibartion 659R018N012 N/A 1-Jan-99
001022-
0008
Water &
Waste
Water
Not
Workin
g
17-Nov-17 Fixed NA 8
0 View
9. Cole Parmer Cole Parmer Hot Plate non functional HPCP-01 N/A 1-Jan-99
001022-
0009
Water &
Waste
Water
Not
Workin
g
17-Nov-17 Fixed NA 9
0 View
10. Mtops Mtops Hot Plate Non Functional Serial Self
generated by EPA Lab staff. HPMT-01 N/A 1-Jan-99
001022-
0010
Water &
Waste
Water
Not
Workin
g
17-Nov-17 Fixed NA 10
0 View
11. Advantec HTP-45288 Hot plate functional 85049 N/A 1-Jan-99
001022-
0011
Water &
Waste
Water
Workin
g 17-Nov-17 Fixed NA 11
0 View
12. Isuzu
SEISAKUSHO EPTR-26R Furnace Functional 0127095-03 N/A 1-Jan-99
001022-
0012
Water &
Waste
Water
Workin
g 20-Nov-17 Fixed NA 12
0 View
13. Isuzu
SEISAKUSHO KP-24R Furnace non Functional 0127079-01 N/A 1-Jan-99
001022-
0013
Water &
Waste
Water
Not
Workin
g
20-Nov-17 Fixed NA 13
0 View
14. Memmert DB-500 Owen Functional A5940084 N/A 1-Jan-99
001022-
0014
Water &
Waste
Water
Workin
g 20-Nov-17 Fixed NA 14
0 View
15.
Medline
Scientific
LTD,UK
OF-02 Owen Functional PO59012 N/A 1-Jan-99
001022-
0015
Water &
Waste
Water
Workin
g 20-Nov-17 Fixed NA 15
0 View
16. Blue M OV-18SC Oven Functional Micro Lab current
Placement OV1-17640 N/A 1-Jan-99
001022-
0016
Water &
Waste
Water
Workin
g 20-Nov-17 Fixed NA 16
0 View
17. N.S engineering 145L Serial Self Placement In store OVNS-01 N/A 1-Jan-99 001022- Water & Not 20-Nov-17 Fixed NA 17
0 View
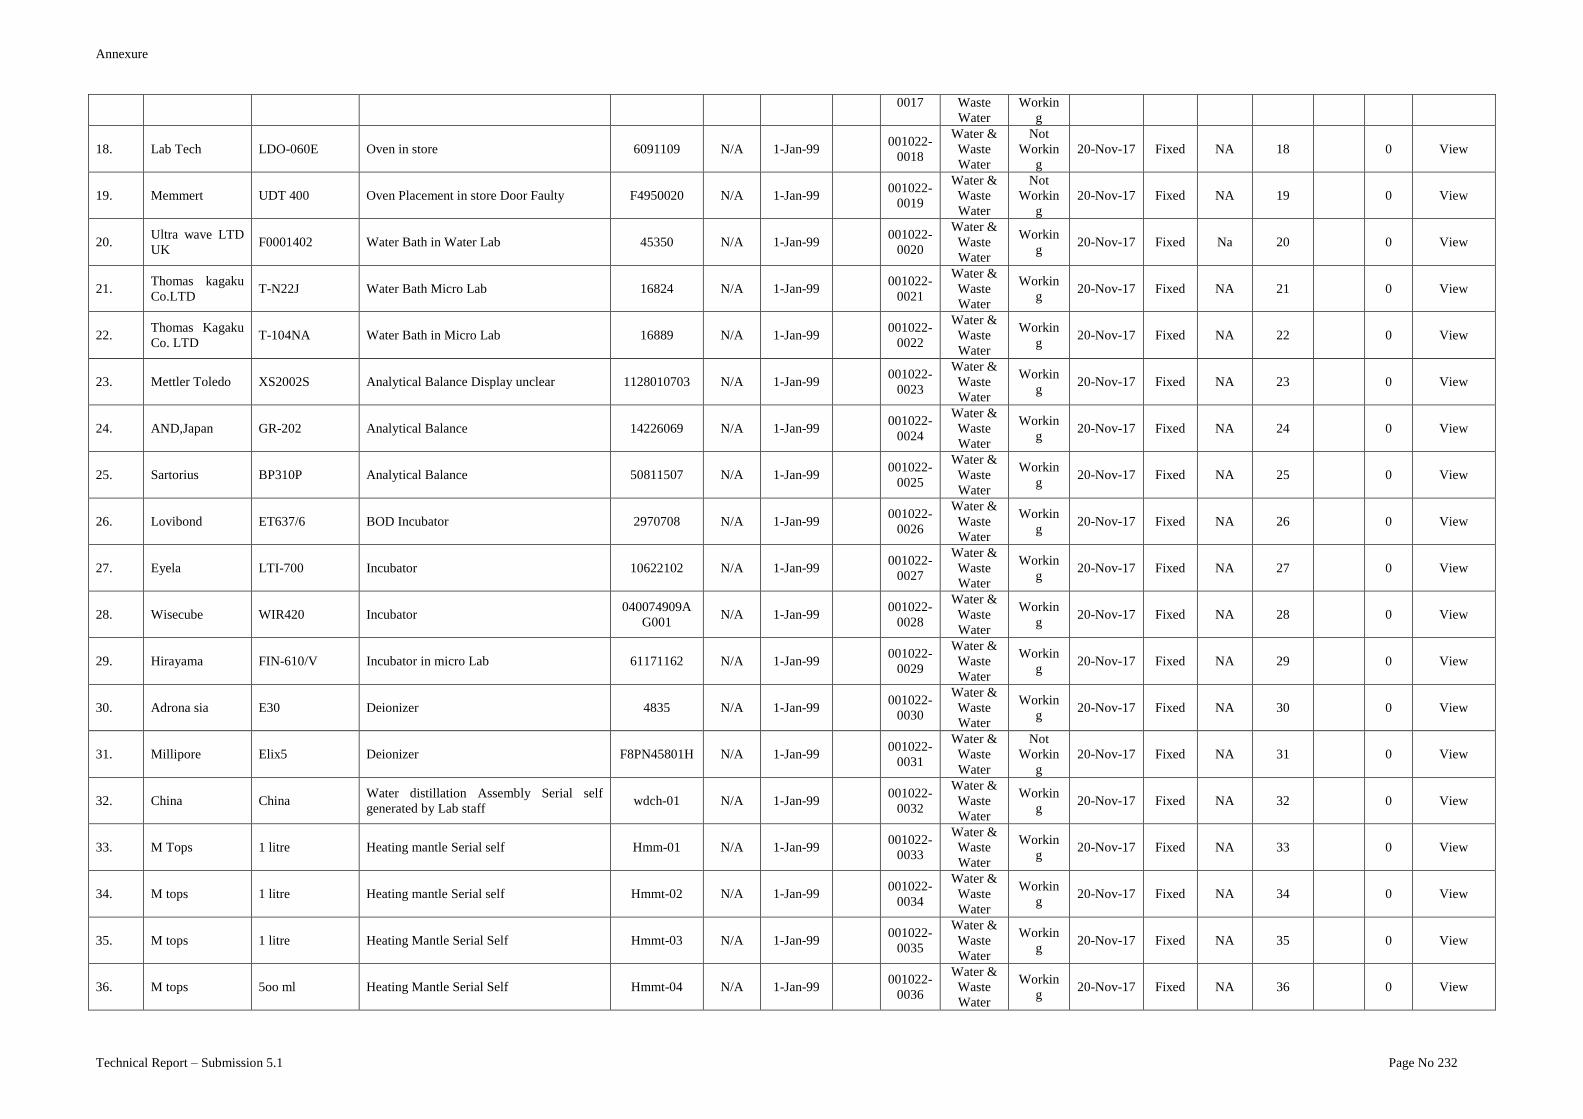
Annexure
Technical Report – Submission 5.1 Page No 232
0017 Waste
Water
Workin
g
18. Lab Tech LDO-060E Oven in store 6091109 N/A 1-Jan-99
001022-
0018
Water &
Waste
Water
Not
Workin
g
20-Nov-17 Fixed NA 18
0 View
19. Memmert UDT 400 Oven Placement in store Door Faulty F4950020 N/A 1-Jan-99
001022-
0019
Water &
Waste
Water
Not
Workin
g
20-Nov-17 Fixed NA 19
0 View
20. Ultra wave LTD
UK F0001402 Water Bath in Water Lab 45350 N/A 1-Jan-99
001022-
0020
Water &
Waste
Water
Workin
g 20-Nov-17 Fixed Na 20
0 View
21. Thomas kagaku
Co.LTD T-N22J Water Bath Micro Lab 16824 N/A 1-Jan-99
001022-
0021
Water &
Waste
Water
Workin
g 20-Nov-17 Fixed NA 21
0 View
22. Thomas Kagaku
Co. LTD T-104NA Water Bath in Micro Lab 16889 N/A 1-Jan-99
001022-
0022
Water &
Waste
Water
Workin
g 20-Nov-17 Fixed NA 22
0 View
23. Mettler Toledo XS2002S Analytical Balance Display unclear 1128010703 N/A 1-Jan-99
001022-
0023
Water &
Waste
Water
Workin
g 20-Nov-17 Fixed NA 23
0 View
24. AND,Japan GR-202 Analytical Balance 14226069 N/A 1-Jan-99
001022-
0024
Water &
Waste
Water
Workin
g 20-Nov-17 Fixed NA 24
0 View
25. Sartorius BP310P Analytical Balance 50811507 N/A 1-Jan-99
001022-
0025
Water &
Waste
Water
Workin
g 20-Nov-17 Fixed NA 25
0 View
26. Lovibond ET637/6 BOD Incubator 2970708 N/A 1-Jan-99
001022-
0026
Water &
Waste
Water
Workin
g 20-Nov-17 Fixed NA 26
0 View
27. Eyela LTI-700 Incubator 10622102 N/A 1-Jan-99
001022-
0027
Water &
Waste
Water
Workin
g 20-Nov-17 Fixed NA 27
0 View
28. Wisecube WIR420 Incubator 040074909A
G001 N/A 1-Jan-99
001022-
0028
Water &
Waste
Water
Workin
g 20-Nov-17 Fixed NA 28
0 View
29. Hirayama FIN-610/V Incubator in micro Lab 61171162 N/A 1-Jan-99
001022-
0029
Water &
Waste
Water
Workin
g 20-Nov-17 Fixed NA 29
0 View
30. Adrona sia E30 Deionizer 4835 N/A 1-Jan-99
001022-
0030
Water &
Waste
Water
Workin
g 20-Nov-17 Fixed NA 30
0 View
31. Millipore Elix5 Deionizer F8PN45801H N/A 1-Jan-99
001022-
0031
Water &
Waste
Water
Not
Workin
g
20-Nov-17 Fixed NA 31
0 View
32. China China Water distillation Assembly Serial self
generated by Lab staff wdch-01 N/A 1-Jan-99
001022-
0032
Water &
Waste
Water
Workin
g 20-Nov-17 Fixed NA 32
0 View
33. M Tops 1 litre Heating mantle Serial self Hmm-01 N/A 1-Jan-99
001022-
0033
Water &
Waste
Water
Workin
g 20-Nov-17 Fixed NA 33
0 View
34. M tops 1 litre Heating mantle Serial self Hmmt-02 N/A 1-Jan-99
001022-
0034
Water &
Waste
Water
Workin
g 20-Nov-17 Fixed NA 34
0 View
35. M tops 1 litre Heating Mantle Serial Self Hmmt-03 N/A 1-Jan-99
001022-
0035
Water &
Waste
Water
Workin
g 20-Nov-17 Fixed NA 35
0 View
36. M tops 5oo ml Heating Mantle Serial Self Hmmt-04 N/A 1-Jan-99
001022-
0036
Water &
Waste
Water
Workin
g 20-Nov-17 Fixed NA 36
0 View

Annexure
Technical Report – Submission 5.1 Page No 233
37. M tops 500 ML Heating Mantle Serial Self Hmmt-05 N/A 1-Jan-99
001022-
0037
Water &
Waste
Water
Workin
g 20-Nov-17 Fixed Na 37
0 View
38. Air Tech ADP-120 Fume hood H22687063 N/A 1-Jan-99
001022-
0038
Water &
Waste
Water
Not
Workin
g
20-Nov-17 Fixed NA 38
0 View
39. Air Tech BLB-1000 Laminar Flow Cabinet H226860603 N/A 1-Jan-99
001022-
0039
Water &
Waste
Water
Workin
g 20-Nov-17 Fixed NA 39
0 View
40. Mitsubishi PS-MSAK-SE Placement In lab Serial Self ACME-01 N/A 1-Jan-99
009014-
0040
Air
Condition
er
Workin
g 20-Nov-17 Fixed NA 40
0 View
41. Mitsubishi PS-SJAK-SE Placement in Water Lab ACME-02 N/A 1-Jan-99
009014-
0041
Air
Condition
er
Workin
g 20-Nov-17 Fixed NA 41
0 View
42. Jenway PFP-7 Flame photometer 12162 N/A 1-Jan-99
001022-
0042
Water &
Waste
Water
Not
Workin
g
20-Nov-17 Fixed NA 42
0 View
43. Jasco INT CO.
LTD V-530
UV Visible Spectro-photometer Double
Beam B312660512 N/A 1-Jan-99
001022-
0043
Water &
Waste
Water
Not
Workin
g
20-Nov-17 Fixed NA 43
0 View
44. Hitachi U-1100 UV Visible spetro photometer Single Beam 0353-028 N/A 1-Jan-99
001022-
0044
Water &
Waste
Water
Workin
g 20-Nov-17 Fixed NA 44
0 View
45. Dionex Ics90 Ion chromatography System Cationic
Section 6100393 N/A 1-Jan-99
001022-
0045
Water &
Waste
Water
Not
Workin
g
20-Nov-17 Fixed NA 45
0 View
46. Dionex ICS-90 Ion Chromatography system Anionic
Section 6100388 N/A 1-Jan-99
001022-
0046
Water &
Waste
Water
Not
Workin
g
20-Nov-17 Fixed NA 46
0 View
47. Dionex AS 40 Ion chromatography System Automated
sampler 6100701 N/A 1-Jan-99
001022-
0047
Water &
Waste
Water
Not
Workin
g
20-Nov-17 Fixed NA 47
0 View
48. HP HP-D5160 HP Printer placement water Lab MY68B120M
T N/A 1-Jan-99
007007-
0048 Printer
Not
Workin
g
20-Nov-17 Fixed NA 48
0 View
49. P-selecta Block digester 6 Digestor 518056 N/A 1-Jan-99
001022-
0049
Water &
Waste
Water
Not
Workin
g
20-Nov-17 Fixed NA 49
0 View
50. Eyela RCN-7 Magnetic stirrer 10622369 N/A 1-Jan-99
001022-
0050
Water &
Waste
Water
Not
Workin
g
21-Nov-17 Fixed NA 50
0 View
51. Eyela RCN-3 Magnetic stirrer 10622172 N/A 1-Jan-99
001022-
0051
Water &
Waste
Water
Workin
g 21-Nov-17 Fixed NA 51
0 View
52. kokusan H-27F Centrifuge Rpm are not adjustable 131918 N/A 1-Jan-99
001022-
0052
Water &
Waste
Water
Not
Workin
g
21-Nov-17 Fixed NA 52
0 View
53. JICA Japan DC-3 Colony Counter 61101 N/A 1-Jan-99
001022-
0053
Water &
Waste
Water
Workin
g 21-Nov-17 Fixed NA 53
0 View
54. Lovibond oxidirect BOD tracks Stirring plate and gasket are
non functional 602847 N/A 1-Jan-99
001022-
0054
Water &
Waste
Water
Not
Workin
g
21-Nov-17 Fixed NA 54
0 View
55. lovibond oxidirect BOD track Stirring plate and gasket are not
working properly 602695 N/A 1-Jan-99
001022-
0055
Water &
Waste
Water
Not
Workin
g
21-Nov-17 Fixed NA 55
0 View
56. Lovibond oxidirect BOD Track Stirring plate and gasket are not
working properly. 602696 N/A 1-Jan-99
001022-
0056
Water &
Waste
Not
Workin21-Nov-17 Fixed NA 56
0 View

Annexure
Technical Report – Submission 5.1 Page No 234
Water g
57. Lovibond Oxidirect BOD track Serial self generated by Lab
water staff LOOX-01 N/A 1-Jan-99
001022-
0057
Water &
Waste
Water
Not
Workin
g
21-Nov-17 Fixed NA 57
0 View
58. Lovibond Oxidirect BOD track Stirring plate and gaskets are not
working. 602845 N/A 1-Jan-99
001022-
0058
Water &
Waste
Water
Not
Workin
g
21-Nov-17 Fixed NA 58
0 View
59. Lovibond Oxidirect BOD track Stirring plate and gaskets not
working 601301 N/A 1-Jan-99
001022-
0059
Water &
Waste
Water
Not
Workin
g
21-Nov-17 Fixed NA 59
0 View
60. Lovibond Oxidirect BOD track 601450 N/A 1-Jan-99
001022-
0060
Water &
Waste
Water
Not
Workin
g
21-Nov-17 Fixed NA 60
0 View
61. kotobuki kakoki BL-40S Waste water treatment system Serial self
generated by lab staff. wwkk01 N/A 1-Jan-99
001022-
0061
Water &
Waste
Water
Not
Workin
g
21-Nov-17 Fixed NA 61
0 View
62. horiba ocma-200 oil content analyzer Serial self generated by
Lab staff. ocho-01 N/A 1-Jan-99
001022-
0062
Water &
Waste
Water
Not
Workin
g
21-Nov-17 Fixed NA 62
0 View
63. GERHARDT ki-16
kjeldahl distillation apparatus 3 Flasks are
not available/Broke Downpipe for
condensate Bottle(long)
1715080077 N/A 1-Jan-99
001022-
0063
Water &
Waste
Water
Workin
g 21-Nov-17 Fixed NA 63
0 View
64. ISCO FTD-250 Incubator 5311640 N/A 1-Jan-99
001022-
0064
Water &
Waste
Water
Workin
g 21-Nov-17 Fixed NA 64
0 View
65. ASF thomas D-82178 Vaccum Pump 2956469 N/A 1-Jan-99
001022-
0065
Water &
Waste
Water
Workin
g 24-Nov-17 Fixed NA 65
0 View
66. Ulvac Ba 120s Vaccum Pump 600332 N/A 1-Jan-99
001022-
0066
Water &
Waste
Water
Workin
g 24-Nov-17 Fixed NA 66
0 View
67. ulvac ba 120s Vaccum Pump 600334 N/A 1-Jan-99
001022-
0067
Water &
Waste
Water
Workin
g 24-Nov-17 Fixed NA 67
0 View
68.
TOYOZUMI
DENGENKIKI
Co LTD
cd220-15 Transformer 1640950071 N/A 1-Jan-99
009015-
0068
Transfor
mer
Not
Workin
g
24-Nov-17 Fixed NA 68
0 View
69. stabiamatic co.
Ltd GL-1500VA Voltage regulator 41011401 N/A 1-Jan-99
009027-
0069
Voltage
regulator
Workin
g 24-Nov-17 Fixed NA 69
0 View
70. caravell m170 Refrigerator 909030 N/A 1-Jan-99
009028-
0070
Refrigerat
or
Workin
g 24-Nov-17 Fixed NA 70
0 View
71. nihon BMS350F3 Freezer 61100193 N/A 1-Jan-99
009029-
0071 Freezer
Not
Workin
g
24-Nov-17 Fixed NA 71
0 View
72. waves deluxe Freezer WF-212 N/A 1-Jan-99
009029-
0072 Freezer
Workin
g 24-Nov-17 Fixed na 72
0 View
73. taitec
corporation SR-2S Reciprocating shaker 6091414 N/A 1-Jan-99
001022-
0073
Water &
Waste
Water
Not
Workin
g
24-Nov-17 Fixed NA 73
0 View
74. hirayama HVE 50 Autoclave 30606101299 N/A 1-Jan-99
001022-
0074
Water &
Waste
Water
Workin
g 24-Nov-17 Fixed NA 74
0 View
75. eyela ca1111 Chiller 10619185 N/A 1-Jan-99
001022-
0075
Water &
Waste
Water
Workin
g 24-Nov-17 Fixed NA 75
0 View
76. neslab neslab Chiller Serial self generated by EPA lab
staff chne-01 N/A 1-Jan-99
001022-
0076
Water &
Waste
Water
Workin
g 24-Nov-17 Fixed NA 76
0 View

Annexure
Technical Report – Submission 5.1 Page No 235
77. wise circu wise circu Chiller 4.00668E+12 N/A 1-Jan-99
001022-
0077
Water &
Waste
Water
Not
Workin
g
24-Nov-17 Fixed NA 77
0 View
78. Wise circu Wise circu Chiller 4.00668E+12 N/A 1-Jan-99
001022-
0078
Water &
Waste
Water
Not
Workin
g
24-Nov-17 Fixed NA 78
0 View
79. olympus BX-41TF Microscope 6L22058 N/A 1-Jan-99
001022-
0079
Water &
Waste
Water
Workin
g 24-Nov-17 Fixed NA 79
0 View
80. Eyela N1000 Rotary Evaporator Assembly 10616273 N/A 1-Jan-99
001022-
0080
Water &
Waste
Water
Workin
g 24-Nov-17 Fixed NA 80
0 View
81. Eyela SB 1000 Water Bath for Rotary evaporator 60615441 N/A 1-Jan-99
001022-
0081
Water &
Waste
Water
Workin
g 24-Nov-17 Fixed NA 81
0 View
82. ortholux ortholux Microscope Switch Adapter Missing 963728 N/A 1-Jan-99
001022-
0082
Water &
Waste
Water
Not
Workin
g
27-Nov-17 Fixed NA 82
0 View
83. Major science AM 180L Fermenter AM09090019
5 N/A 1-Jan-99
001022-
0083
Water &
Waste
Water
Not
Workin
g
27-Nov-17 Fixed NA 83
0 View
84. Major science AM 180L Fermenter AM09090019
8 N/A 1-Jan-99
001022-
0084
Water &
Waste
Water
Not
Workin
g
27-Nov-17 Fixed NA 84
0 View
85. Eyela A 1000S Aspirator for Rotary Evaporator 10618211 N/A 1-Jan-99
001022-
1082
Water &
Waste
Water
Not
Workin
g
27-Nov-17 Fixed NA 1082
0 View
86. Eyela CCA1110 Refrigerated Circulator for rotary
Evaporator 10621913 N/A 1-Jan-99
001022-
1083
Water &
Waste
Water
Workin
g 27-Nov-17 Fixed NA 1083
0 View
87. A&D company
Japan HR-60 Analytical Balance 12100977 N/A 1-Jan-99
001024-
1084
Stack
Emission
Workin
g 29-Nov-17 Fixed NA 1084
0 View
88. A&D company
korea EK 410I Top Loading Balance Q2600810 N/A 1-Jan-99
001024-
1085
Stack
Emission
Workin
g 29-Nov-17 Fixed NA 1085
0 View
89. Thermoscientific
Company USA
Thermoscientific
Company USA UV/Visible Spectrophotometer HEDN116006 N/A 1-Jan-99
001024-
1086
Stack
Emission
Workin
g 29-Nov-17 Fixed NA 1086
0 View
90. Japan Japan Digital Dessicator Serial self generated by
EPA lab Staff lahore DDC-01 N/A 1-Jan-99
001022-
1087
Water &
Waste
Water
Workin
g 29-Nov-17 Fixed NA 1087
0 View
91. Memmert
germany U-110 Memmert Oven 40050IP20 N/A 1-Jan-99
001024-
1088
Stack
Emission
Workin
g 29-Nov-17 Fixed NA 1088
0 View
92. Hettich EBA89 Centrifuge 155737 N/A 1-Jan-99
001024-
1089
Stack
Emission
Workin
g 29-Nov-17 Fixed NA 1089
0 View
93. Horiba Japan PG350 Portable Gas Analyzer REFGOW9A N/A 1-Jan-99
001024-
1090
Stack
Emission
Workin
g 29-Nov-17 Mobile NA 1090
0 View
94. Horiba Japan PS300 Cooling Unit for Portable Gas Analyzer 4LLOK5UO N/A 1-Jan-99
001024-
1091
Stack
Emission
Workin
g 29-Nov-17 Mobile NA 1091
0 View
95. Horiba JApan PG250A Portable Gas Analyzer 250 FOUO2YOT N/A 1-Jan-99
001024-
1092
Stack
Emission
Not
Workin
g
29-Nov-17 Mobile NA 1092
0 View
96. Horiba Japan PS 200 Cooling Unit for Portable Gas Analyzer 250 HOOOOV4R N/A 1-Jan-99
001024-
1093
Stack
Emission
Not
Workin
g
29-Nov-17 Mobile NA 1093
0 View
97. Amtek Spectroblue
FMT-26
Inductivity Coupled Plasma Spectrometer
ICP-OES 16001887 N/A 1-Jan-99
001031-
1094
ICP, AAS
&GC Lab
Workin
g 4-Dec-17 Fixed NA 1094
0 View
98. Amtek ASX 280 ICP auto sampler 021614A280 N/A 1-Jan-99
001031-
1095
ICP, AAS
&GC Lab
Workin
g 4-Dec-17 Fixed NA 1095
0 View
99. Perkin ELEmer AAnalyst-800 Atomic Absorption Spectrometer AAS 800S7020301 N/A 1-Jan-99
001031-
1096
ICP, AAS
&GC Lab
Not
Workin4-Dec-17 Fixed NA 1096
0 View
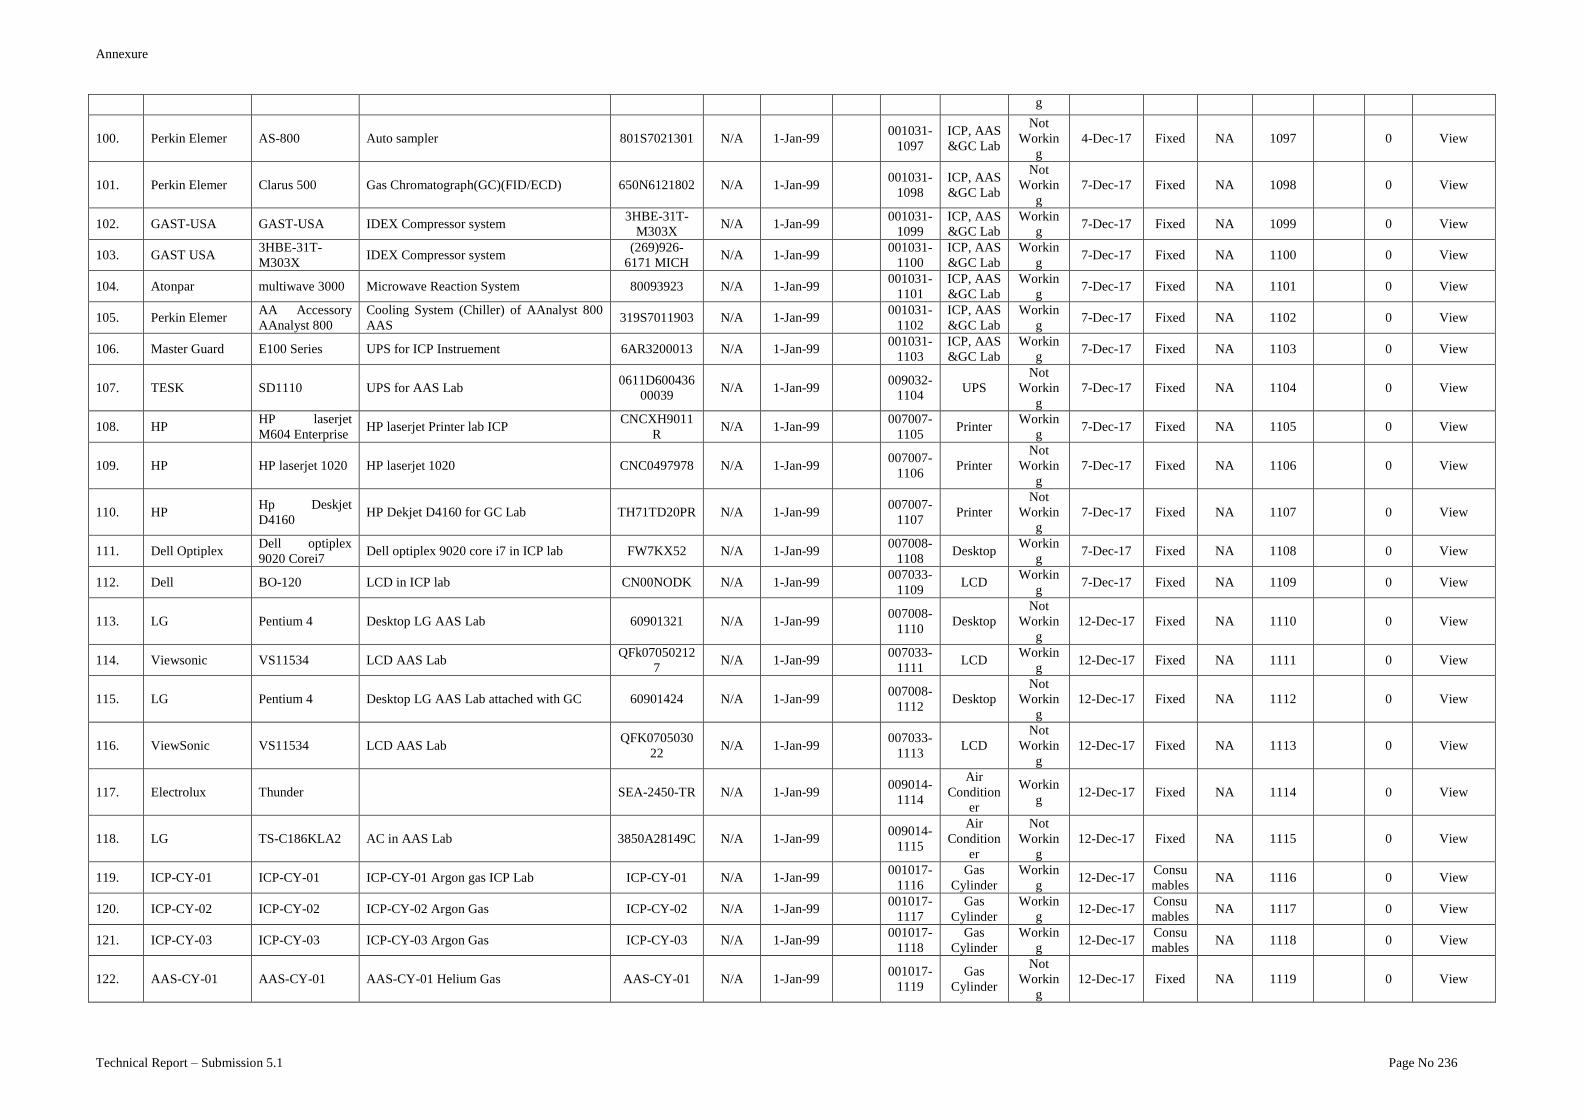
Annexure
Technical Report – Submission 5.1 Page No 236
g
100. Perkin Elemer AS-800 Auto sampler 801S7021301 N/A 1-Jan-99
001031-
1097
ICP, AAS
&GC Lab
Not
Workin
g
4-Dec-17 Fixed NA 1097
0 View
101. Perkin Elemer Clarus 500 Gas Chromatograph(GC)(FID/ECD) 650N6121802 N/A 1-Jan-99
001031-
1098
ICP, AAS
&GC Lab
Not
Workin
g
7-Dec-17 Fixed NA 1098
0 View
102. GAST-USA GAST-USA IDEX Compressor system 3HBE-31T-
M303X N/A 1-Jan-99
001031-
1099
ICP, AAS
&GC Lab
Workin
g 7-Dec-17 Fixed NA 1099
0 View
103. GAST USA 3HBE-31T-
M303X IDEX Compressor system
(269)926-
6171 MICH N/A 1-Jan-99
001031-
1100
ICP, AAS
&GC Lab
Workin
g 7-Dec-17 Fixed NA 1100
0 View
104. Atonpar multiwave 3000 Microwave Reaction System 80093923 N/A 1-Jan-99
001031-
1101
ICP, AAS
&GC Lab
Workin
g 7-Dec-17 Fixed NA 1101
0 View
105. Perkin Elemer AA Accessory
AAnalyst 800
Cooling System (Chiller) of AAnalyst 800
AAS 319S7011903 N/A 1-Jan-99
001031-
1102
ICP, AAS
&GC Lab
Workin
g 7-Dec-17 Fixed NA 1102
0 View
106. Master Guard E100 Series UPS for ICP Instruement 6AR3200013 N/A 1-Jan-99
001031-
1103
ICP, AAS
&GC Lab
Workin
g 7-Dec-17 Fixed NA 1103
0 View
107. TESK SD1110 UPS for AAS Lab 0611D600436
00039 N/A 1-Jan-99
009032-
1104 UPS
Not
Workin
g
7-Dec-17 Fixed NA 1104
0 View
108. HP HP laserjet
M604 Enterprise HP laserjet Printer lab ICP
CNCXH9011
R N/A 1-Jan-99
007007-
1105 Printer
Workin
g 7-Dec-17 Fixed NA 1105
0 View
109. HP HP laserjet 1020 HP laserjet 1020 CNC0497978 N/A 1-Jan-99
007007-
1106 Printer
Not
Workin
g
7-Dec-17 Fixed NA 1106
0 View
110. HP Hp Deskjet
D4160 HP Dekjet D4160 for GC Lab TH71TD20PR N/A 1-Jan-99
007007-
1107 Printer
Not
Workin
g
7-Dec-17 Fixed NA 1107
0 View
111. Dell Optiplex Dell optiplex
9020 Corei7 Dell optiplex 9020 core i7 in ICP lab FW7KX52 N/A 1-Jan-99
007008-
1108 Desktop
Workin
g 7-Dec-17 Fixed NA 1108
0 View
112. Dell BO-120 LCD in ICP lab CN00NODK N/A 1-Jan-99
007033-
1109 LCD
Workin
g 7-Dec-17 Fixed NA 1109
0 View
113. LG Pentium 4 Desktop LG AAS Lab 60901321 N/A 1-Jan-99
007008-
1110 Desktop
Not
Workin
g
12-Dec-17 Fixed NA 1110
0 View
114. Viewsonic VS11534 LCD AAS Lab QFk07050212
7 N/A 1-Jan-99
007033-
1111 LCD
Workin
g 12-Dec-17 Fixed NA 1111
0 View
115. LG Pentium 4 Desktop LG AAS Lab attached with GC 60901424 N/A 1-Jan-99
007008-
1112 Desktop
Not
Workin
g
12-Dec-17 Fixed NA 1112
0 View
116. ViewSonic VS11534 LCD AAS Lab QFK0705030
22 N/A 1-Jan-99
007033-
1113 LCD
Not
Workin
g
12-Dec-17 Fixed NA 1113
0 View
117. Electrolux Thunder SEA-2450-TR N/A 1-Jan-99
009014-
1114
Air
Condition
er
Workin
g 12-Dec-17 Fixed NA 1114
0 View
118. LG TS-C186KLA2 AC in AAS Lab 3850A28149C N/A 1-Jan-99
009014-
1115
Air
Condition
er
Not
Workin
g
12-Dec-17 Fixed NA 1115
0 View
119. ICP-CY-01 ICP-CY-01 ICP-CY-01 Argon gas ICP Lab ICP-CY-01 N/A 1-Jan-99
001017-
1116
Gas
Cylinder
Workin
g 12-Dec-17
Consu
mables NA 1116
0 View
120. ICP-CY-02 ICP-CY-02 ICP-CY-02 Argon Gas ICP-CY-02 N/A 1-Jan-99
001017-
1117
Gas
Cylinder
Workin
g 12-Dec-17
Consu
mables NA 1117
0 View
121. ICP-CY-03 ICP-CY-03 ICP-CY-03 Argon Gas ICP-CY-03 N/A 1-Jan-99
001017-
1118
Gas
Cylinder
Workin
g 12-Dec-17
Consu
mables NA 1118
0 View
122. AAS-CY-01 AAS-CY-01 AAS-CY-01 Helium Gas AAS-CY-01 N/A 1-Jan-99
001017-
1119
Gas
Cylinder
Not
Workin
g
12-Dec-17 Fixed NA 1119
0 View
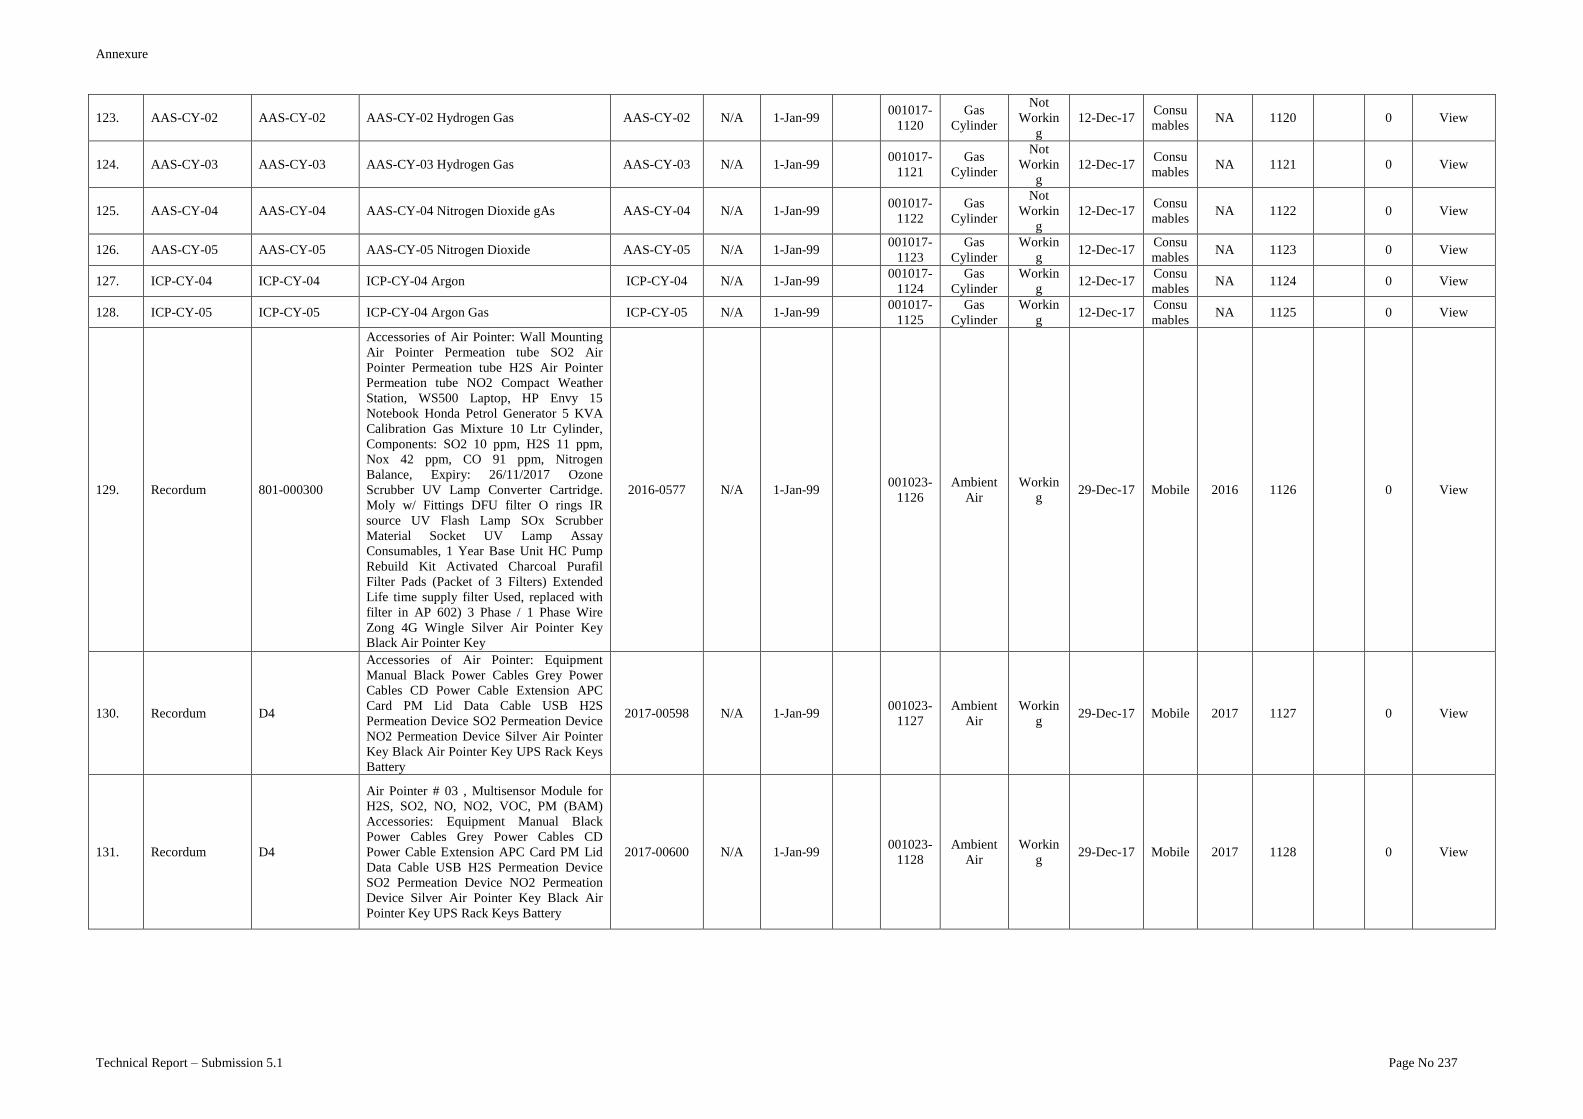
Annexure
Technical Report – Submission 5.1 Page No 237
123. AAS-CY-02 AAS-CY-02 AAS-CY-02 Hydrogen Gas AAS-CY-02 N/A 1-Jan-99
001017-
1120
Gas
Cylinder
Not
Workin
g
12-Dec-17 Consu
mables NA 1120
0 View
124. AAS-CY-03 AAS-CY-03 AAS-CY-03 Hydrogen Gas AAS-CY-03 N/A 1-Jan-99
001017-
1121
Gas
Cylinder
Not
Workin
g
12-Dec-17 Consu
mables NA 1121
0 View
125. AAS-CY-04 AAS-CY-04 AAS-CY-04 Nitrogen Dioxide gAs AAS-CY-04 N/A 1-Jan-99
001017-
1122
Gas
Cylinder
Not
Workin
g
12-Dec-17 Consu
mables NA 1122
0 View
126. AAS-CY-05 AAS-CY-05 AAS-CY-05 Nitrogen Dioxide AAS-CY-05 N/A 1-Jan-99
001017-
1123
Gas
Cylinder
Workin
g 12-Dec-17
Consu
mables NA 1123
0 View
127. ICP-CY-04 ICP-CY-04 ICP-CY-04 Argon ICP-CY-04 N/A 1-Jan-99
001017-
1124
Gas
Cylinder
Workin
g 12-Dec-17
Consu
mables NA 1124
0 View
128. ICP-CY-05 ICP-CY-05 ICP-CY-04 Argon Gas ICP-CY-05 N/A 1-Jan-99
001017-
1125
Gas
Cylinder
Workin
g 12-Dec-17
Consu
mables NA 1125
0 View
129. Recordum 801-000300
Accessories of Air Pointer: Wall Mounting
Air Pointer Permeation tube SO2 Air
Pointer Permeation tube H2S Air Pointer
Permeation tube NO2 Compact Weather
Station, WS500 Laptop, HP Envy 15
Notebook Honda Petrol Generator 5 KVA
Calibration Gas Mixture 10 Ltr Cylinder,
Components: SO2 10 ppm, H2S 11 ppm,
Nox 42 ppm, CO 91 ppm, Nitrogen
Balance, Expiry: 26/11/2017 Ozone
Scrubber UV Lamp Converter Cartridge.
Moly w/ Fittings DFU filter O rings IR
source UV Flash Lamp SOx Scrubber
Material Socket UV Lamp Assay
Consumables, 1 Year Base Unit HC Pump
Rebuild Kit Activated Charcoal Purafil
Filter Pads (Packet of 3 Filters) Extended
Life time supply filter Used, replaced with
filter in AP 602) 3 Phase / 1 Phase Wire
Zong 4G Wingle Silver Air Pointer Key
Black Air Pointer Key
2016-0577 N/A 1-Jan-99
001023-
1126
Ambient
Air
Workin
g 29-Dec-17 Mobile 2016 1126
0 View
130. Recordum D4
Accessories of Air Pointer: Equipment
Manual Black Power Cables Grey Power
Cables CD Power Cable Extension APC
Card PM Lid Data Cable USB H2S
Permeation Device SO2 Permeation Device
NO2 Permeation Device Silver Air Pointer
Key Black Air Pointer Key UPS Rack Keys
Battery
2017-00598 N/A 1-Jan-99
001023-
1127
Ambient
Air
Workin
g 29-Dec-17 Mobile 2017 1127
0 View
131. Recordum D4
Air Pointer # 03 , Multisensor Module for
H2S, SO2, NO, NO2, VOC, PM (BAM)
Accessories: Equipment Manual Black
Power Cables Grey Power Cables CD
Power Cable Extension APC Card PM Lid
Data Cable USB H2S Permeation Device
SO2 Permeation Device NO2 Permeation
Device Silver Air Pointer Key Black Air
Pointer Key UPS Rack Keys Battery
2017-00600 N/A 1-Jan-99
001023-
1128
Ambient
Air
Workin
g 29-Dec-17 Mobile 2017 1128
0 View
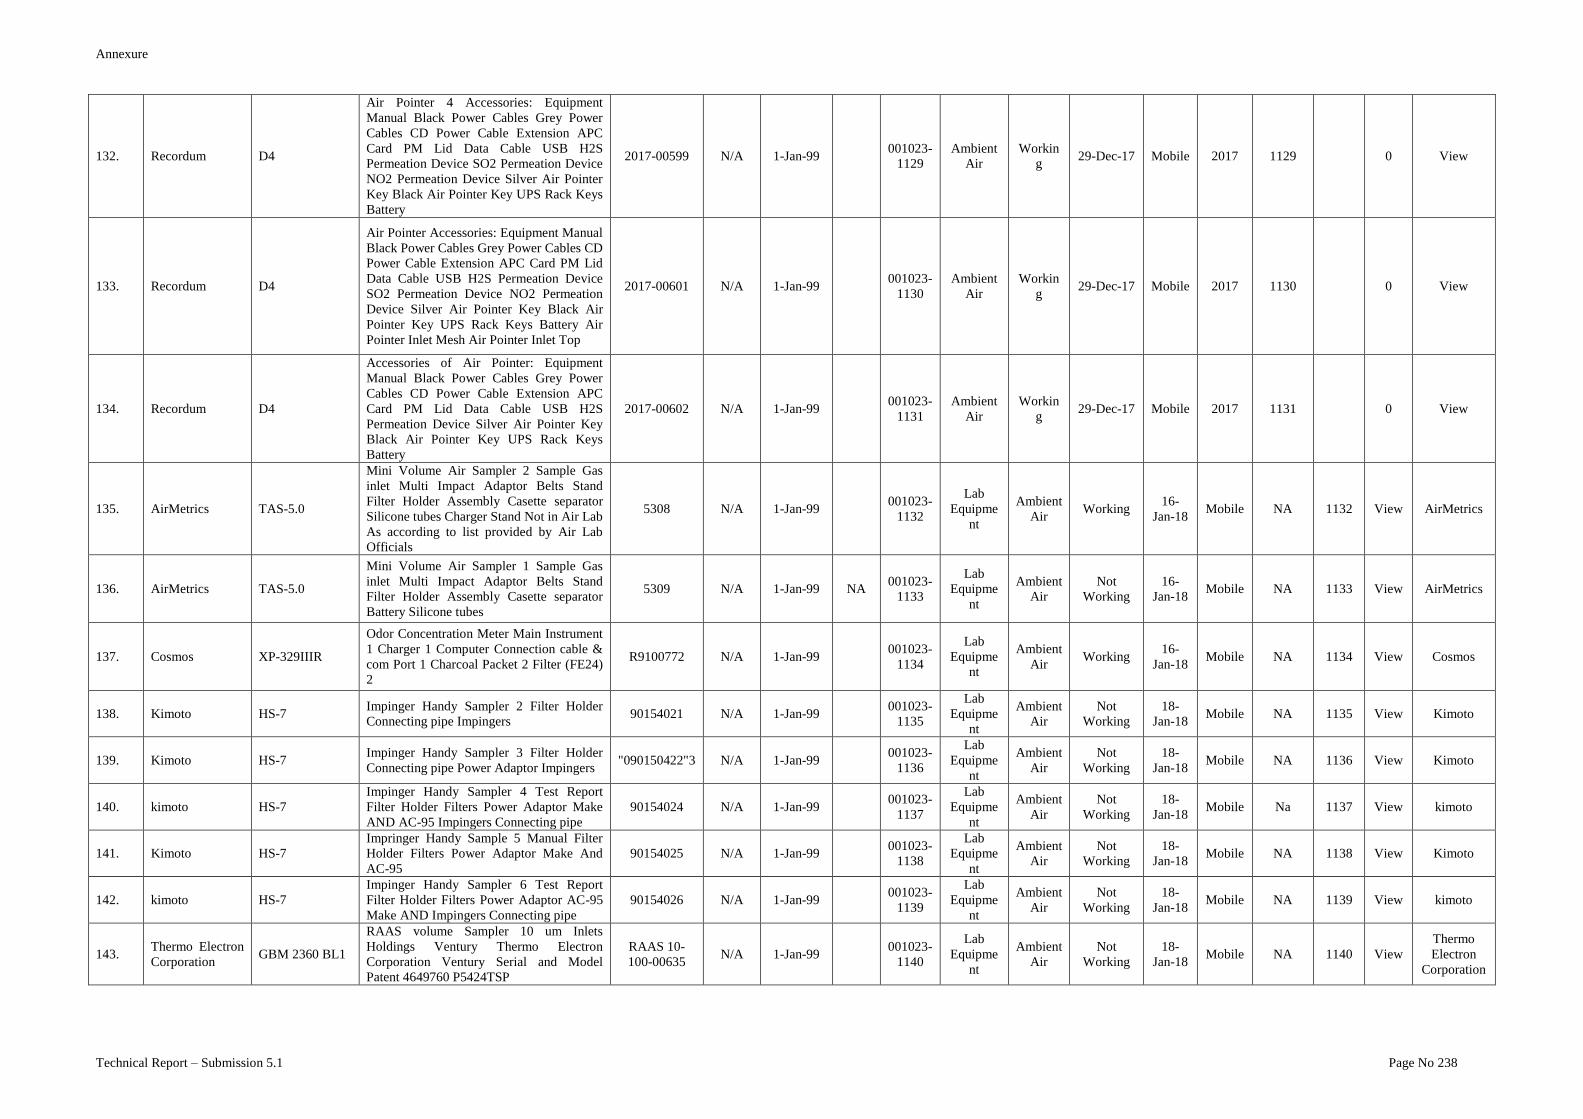
Annexure
Technical Report – Submission 5.1 Page No 238
132. Recordum D4
Air Pointer 4 Accessories: Equipment
Manual Black Power Cables Grey Power
Cables CD Power Cable Extension APC
Card PM Lid Data Cable USB H2S
Permeation Device SO2 Permeation Device
NO2 Permeation Device Silver Air Pointer
Key Black Air Pointer Key UPS Rack Keys
Battery
2017-00599 N/A 1-Jan-99
001023-
1129
Ambient
Air
Workin
g 29-Dec-17 Mobile 2017 1129
0 View
133. Recordum D4
Air Pointer Accessories: Equipment Manual
Black Power Cables Grey Power Cables CD
Power Cable Extension APC Card PM Lid
Data Cable USB H2S Permeation Device
SO2 Permeation Device NO2 Permeation
Device Silver Air Pointer Key Black Air
Pointer Key UPS Rack Keys Battery Air
Pointer Inlet Mesh Air Pointer Inlet Top
2017-00601 N/A 1-Jan-99
001023-
1130
Ambient
Air
Workin
g 29-Dec-17 Mobile 2017 1130
0 View
134. Recordum D4
Accessories of Air Pointer: Equipment
Manual Black Power Cables Grey Power
Cables CD Power Cable Extension APC
Card PM Lid Data Cable USB H2S
Permeation Device Silver Air Pointer Key
Black Air Pointer Key UPS Rack Keys
Battery
2017-00602 N/A 1-Jan-99
001023-
1131
Ambient
Air
Workin
g 29-Dec-17 Mobile 2017 1131
0 View
135. AirMetrics TAS-5.0
Mini Volume Air Sampler 2 Sample Gas
inlet Multi Impact Adaptor Belts Stand
Filter Holder Assembly Casette separator
Silicone tubes Charger Stand Not in Air Lab
As according to list provided by Air Lab
Officials
5308 N/A 1-Jan-99 001023-
1132
Lab
Equipme
nt
Ambient
Air Working
16-
Jan-18 Mobile NA 1132 View AirMetrics
136. AirMetrics TAS-5.0
Mini Volume Air Sampler 1 Sample Gas
inlet Multi Impact Adaptor Belts Stand
Filter Holder Assembly Casette separator
Battery Silicone tubes
5309 N/A 1-Jan-99 NA 001023-
1133
Lab
Equipme
nt
Ambient
Air
Not
Working
16-
Jan-18 Mobile NA 1133 View AirMetrics
137. Cosmos XP-329IIIR
Odor Concentration Meter Main Instrument
1 Charger 1 Computer Connection cable &
com Port 1 Charcoal Packet 2 Filter (FE24)
2
R9100772 N/A 1-Jan-99 001023-
1134
Lab
Equipme
nt
Ambient
Air Working
16-
Jan-18 Mobile NA 1134 View Cosmos
138. Kimoto HS-7 Impinger Handy Sampler 2 Filter Holder
Connecting pipe Impingers 90154021 N/A 1-Jan-99
001023-
1135
Lab
Equipme
nt
Ambient
Air
Not
Working
18-
Jan-18 Mobile NA 1135 View Kimoto
139. Kimoto HS-7 Impinger Handy Sampler 3 Filter Holder
Connecting pipe Power Adaptor Impingers "090150422"3 N/A 1-Jan-99
001023-
1136
Lab
Equipme
nt
Ambient
Air
Not
Working
18-
Jan-18 Mobile NA 1136 View Kimoto
140. kimoto HS-7
Impinger Handy Sampler 4 Test Report
Filter Holder Filters Power Adaptor Make
AND AC-95 Impingers Connecting pipe
90154024 N/A 1-Jan-99 001023-
1137
Lab
Equipme
nt
Ambient
Air
Not
Working
18-
Jan-18 Mobile Na 1137 View kimoto
141. Kimoto HS-7
Impringer Handy Sample 5 Manual Filter
Holder Filters Power Adaptor Make And
AC-95
90154025 N/A 1-Jan-99 001023-
1138
Lab
Equipme
nt
Ambient
Air
Not
Working
18-
Jan-18 Mobile NA 1138 View Kimoto
142. kimoto HS-7
Impinger Handy Sampler 6 Test Report
Filter Holder Filters Power Adaptor AC-95
Make AND Impingers Connecting pipe
90154026 N/A 1-Jan-99 001023-
1139
Lab
Equipme
nt
Ambient
Air
Not
Working
18-
Jan-18 Mobile NA 1139 View kimoto
143. Thermo Electron
Corporation GBM 2360 BL1
RAAS volume Sampler 10 um Inlets
Holdings Ventury Thermo Electron
Corporation Ventury Serial and Model
Patent 4649760 P5424TSP
RAAS 10-
100-00635 N/A 1-Jan-99
001023-
1140
Lab
Equipme
nt
Ambient
Air
Not
Working
18-
Jan-18 Mobile NA 1140 View
Thermo
Electron
Corporation
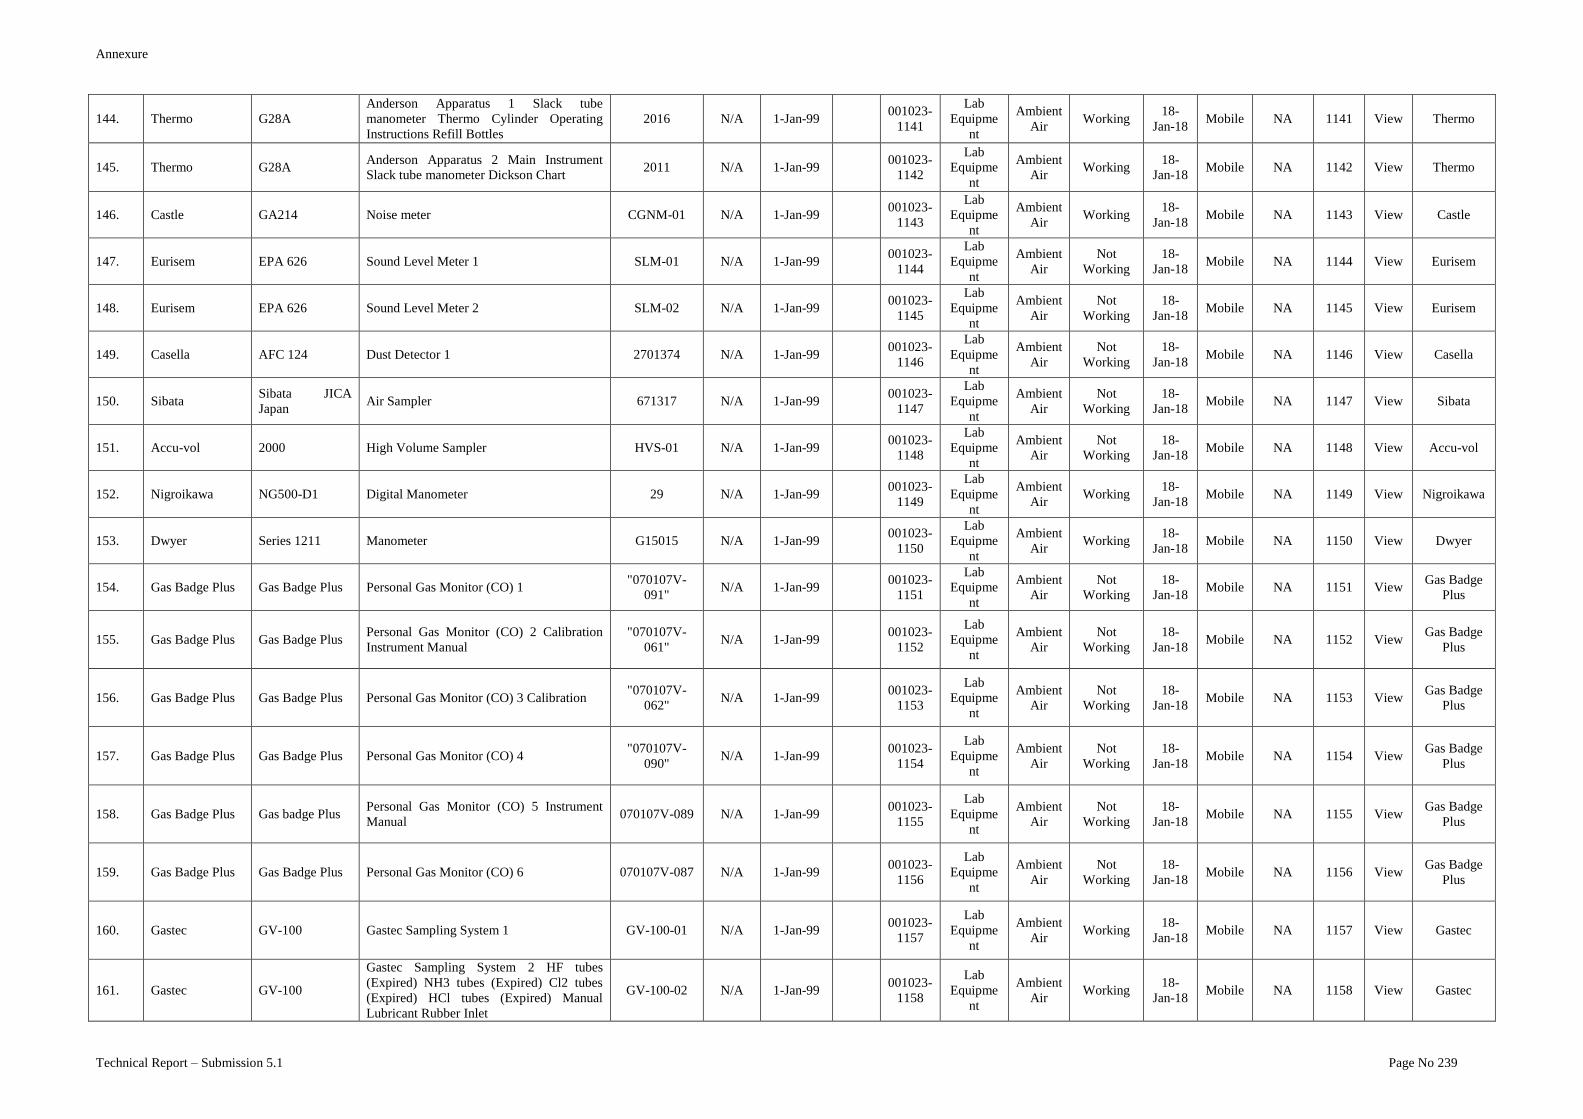
Annexure
Technical Report – Submission 5.1 Page No 239
144. Thermo G28A
Anderson Apparatus 1 Slack tube
manometer Thermo Cylinder Operating
Instructions Refill Bottles
2016 N/A 1-Jan-99 001023-
1141
Lab
Equipme
nt
Ambient
Air Working
18-
Jan-18 Mobile NA 1141 View Thermo
145. Thermo G28A Anderson Apparatus 2 Main Instrument
Slack tube manometer Dickson Chart 2011 N/A 1-Jan-99
001023-
1142
Lab
Equipme
nt
Ambient
Air Working
18-
Jan-18 Mobile NA 1142 View Thermo
146. Castle GA214 Noise meter CGNM-01 N/A 1-Jan-99 001023-
1143
Lab
Equipme
nt
Ambient
Air Working
18-
Jan-18 Mobile NA 1143 View Castle
147. Eurisem EPA 626 Sound Level Meter 1 SLM-01 N/A 1-Jan-99 001023-
1144
Lab
Equipme
nt
Ambient
Air
Not
Working
18-
Jan-18 Mobile NA 1144 View Eurisem
148. Eurisem EPA 626 Sound Level Meter 2 SLM-02 N/A 1-Jan-99 001023-
1145
Lab
Equipme
nt
Ambient
Air
Not
Working
18-
Jan-18 Mobile NA 1145 View Eurisem
149. Casella AFC 124 Dust Detector 1 2701374 N/A 1-Jan-99 001023-
1146
Lab
Equipme
nt
Ambient
Air
Not
Working
18-
Jan-18 Mobile NA 1146 View Casella
150. Sibata Sibata JICA
Japan Air Sampler 671317 N/A 1-Jan-99
001023-
1147
Lab
Equipme
nt
Ambient
Air
Not
Working
18-
Jan-18 Mobile NA 1147 View Sibata
151. Accu-vol 2000 High Volume Sampler HVS-01 N/A 1-Jan-99 001023-
1148
Lab
Equipme
nt
Ambient
Air
Not
Working
18-
Jan-18 Mobile NA 1148 View Accu-vol
152. Nigroikawa NG500-D1 Digital Manometer 29 N/A 1-Jan-99 001023-
1149
Lab
Equipme
nt
Ambient
Air Working
18-
Jan-18 Mobile NA 1149 View Nigroikawa
153. Dwyer Series 1211 Manometer G15015 N/A 1-Jan-99 001023-
1150
Lab
Equipme
nt
Ambient
Air Working
18-
Jan-18 Mobile NA 1150 View Dwyer
154. Gas Badge Plus Gas Badge Plus Personal Gas Monitor (CO) 1 "070107V-
091" N/A 1-Jan-99
001023-
1151
Lab
Equipme
nt
Ambient
Air
Not
Working
18-
Jan-18 Mobile NA 1151 View
Gas Badge
Plus
155. Gas Badge Plus Gas Badge Plus Personal Gas Monitor (CO) 2 Calibration
Instrument Manual
"070107V-
061" N/A 1-Jan-99
001023-
1152
Lab
Equipme
nt
Ambient
Air
Not
Working
18-
Jan-18 Mobile NA 1152 View
Gas Badge
Plus
156. Gas Badge Plus Gas Badge Plus Personal Gas Monitor (CO) 3 Calibration "070107V-
062" N/A 1-Jan-99
001023-
1153
Lab
Equipme
nt
Ambient
Air
Not
Working
18-
Jan-18 Mobile NA 1153 View
Gas Badge
Plus
157. Gas Badge Plus Gas Badge Plus Personal Gas Monitor (CO) 4 "070107V-
090" N/A 1-Jan-99
001023-
1154
Lab
Equipme
nt
Ambient
Air
Not
Working
18-
Jan-18 Mobile NA 1154 View
Gas Badge
Plus
158. Gas Badge Plus Gas badge Plus Personal Gas Monitor (CO) 5 Instrument
Manual 070107V-089 N/A 1-Jan-99
001023-
1155
Lab
Equipme
nt
Ambient
Air
Not
Working
18-
Jan-18 Mobile NA 1155 View
Gas Badge
Plus
159. Gas Badge Plus Gas Badge Plus Personal Gas Monitor (CO) 6 070107V-087 N/A 1-Jan-99 001023-
1156
Lab
Equipme
nt
Ambient
Air
Not
Working
18-
Jan-18 Mobile NA 1156 View
Gas Badge
Plus
160. Gastec GV-100 Gastec Sampling System 1 GV-100-01 N/A 1-Jan-99 001023-
1157
Lab
Equipme
nt
Ambient
Air Working
18-
Jan-18 Mobile NA 1157 View Gastec
161. Gastec GV-100
Gastec Sampling System 2 HF tubes
(Expired) NH3 tubes (Expired) Cl2 tubes
(Expired) HCl tubes (Expired) Manual
Lubricant Rubber Inlet
GV-100-02 N/A 1-Jan-99 001023-
1158
Lab
Equipme
nt
Ambient
Air Working
18-
Jan-18 Mobile NA 1158 View Gastec
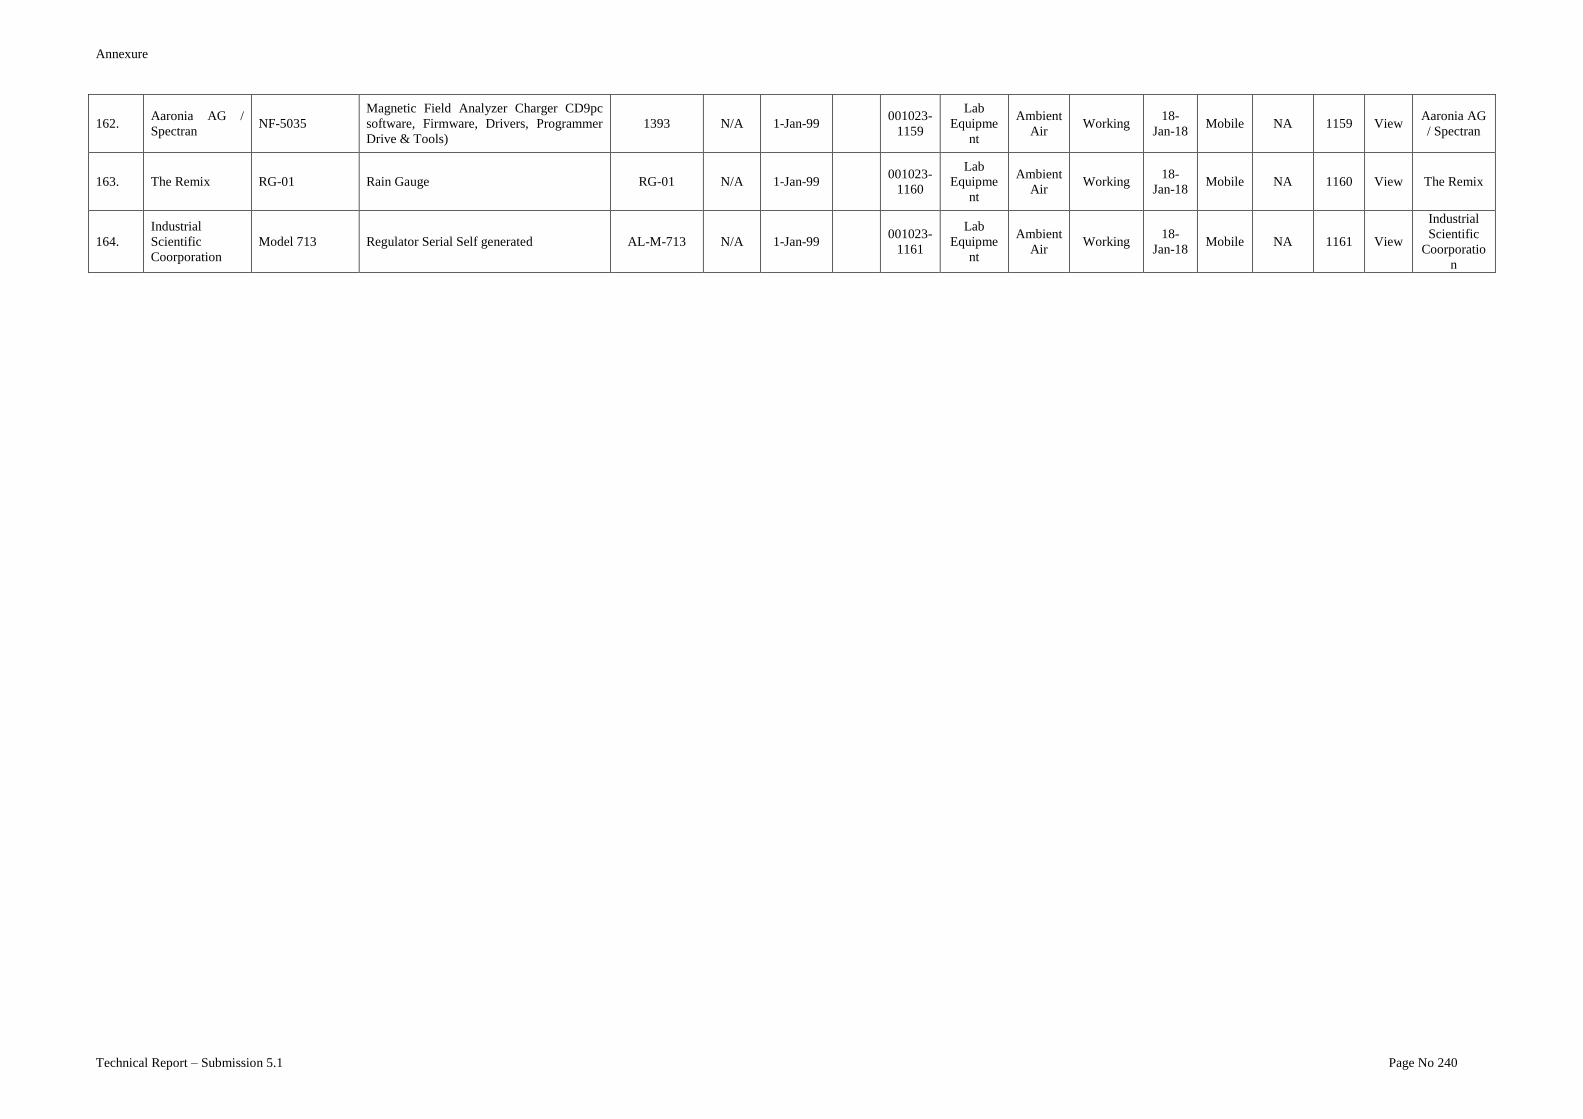
Annexure
Technical Report – Submission 5.1 Page No 240
162. Aaronia AG /
Spectran NF-5035
Magnetic Field Analyzer Charger CD9pc
software, Firmware, Drivers, Programmer
Drive & Tools)
1393 N/A 1-Jan-99 001023-
1159
Lab
Equipme
nt
Ambient
Air Working
18-
Jan-18 Mobile NA 1159 View
Aaronia AG
/ Spectran
163. The Remix RG-01 Rain Gauge RG-01 N/A 1-Jan-99 001023-
1160
Lab
Equipme
nt
Ambient
Air Working
18-
Jan-18 Mobile NA 1160 View The Remix
164.
Industrial
Scientific
Coorporation
Model 713 Regulator Serial Self generated AL-M-713 N/A 1-Jan-99 001023-
1161
Lab
Equipme
nt
Ambient
Air Working
18-
Jan-18 Mobile NA 1161 View
Industrial
Scientific
Coorporatio
n
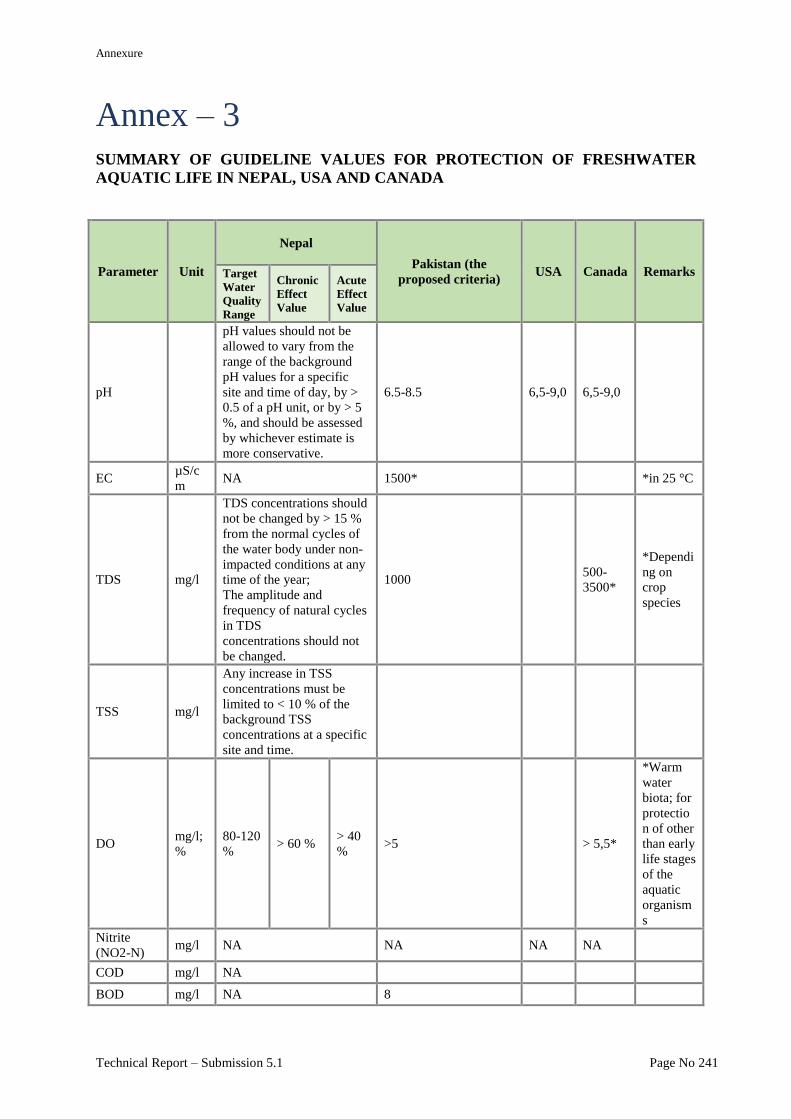
Annexure
Technical Report – Submission 5.1 Page No 241
Annex – 3 SUMMARY OF GUIDELINE VALUES FOR PROTECTION OF FRESHWATER
AQUATIC LIFE IN NEPAL, USA AND CANADA
Parameter Unit
Nepal
Pakistan (the
proposed criteria) USA Canada Remarks Target
Water
Quality
Range
Chronic
Effect
Value
Acute
Effect
Value
pH
pH values should not be
allowed to vary from the
range of the background
pH values for a specific
site and time of day, by >
0.5 of a pH unit, or by > 5
%, and should be assessed
by whichever estimate is
more conservative.
6.5-8.5 6,5-9,0 6,5-9,0
EC µS/c
m NA 1500*
*in 25 °C
TDS mg/l
TDS concentrations should
not be changed by > 15 %
from the normal cycles of
the water body under non-
impacted conditions at any
time of the year;
The amplitude and
frequency of natural cycles
in TDS
concentrations should not
be changed.
1000
500-
3500*
*Dependi
ng on
crop
species
TSS mg/l
Any increase in TSS
concentrations must be
limited to < 10 % of the
background TSS
concentrations at a specific
site and time.
DO mg/l;
%
80-120
% > 60 %
> 40
% >5
> 5,5*
*Warm
water
biota; for
protectio
n of other
than early
life stages
of the
aquatic
organism
s
Nitrite
(NO2-N) mg/l NA NA NA NA
COD mg/l NA
BOD mg/l NA 8
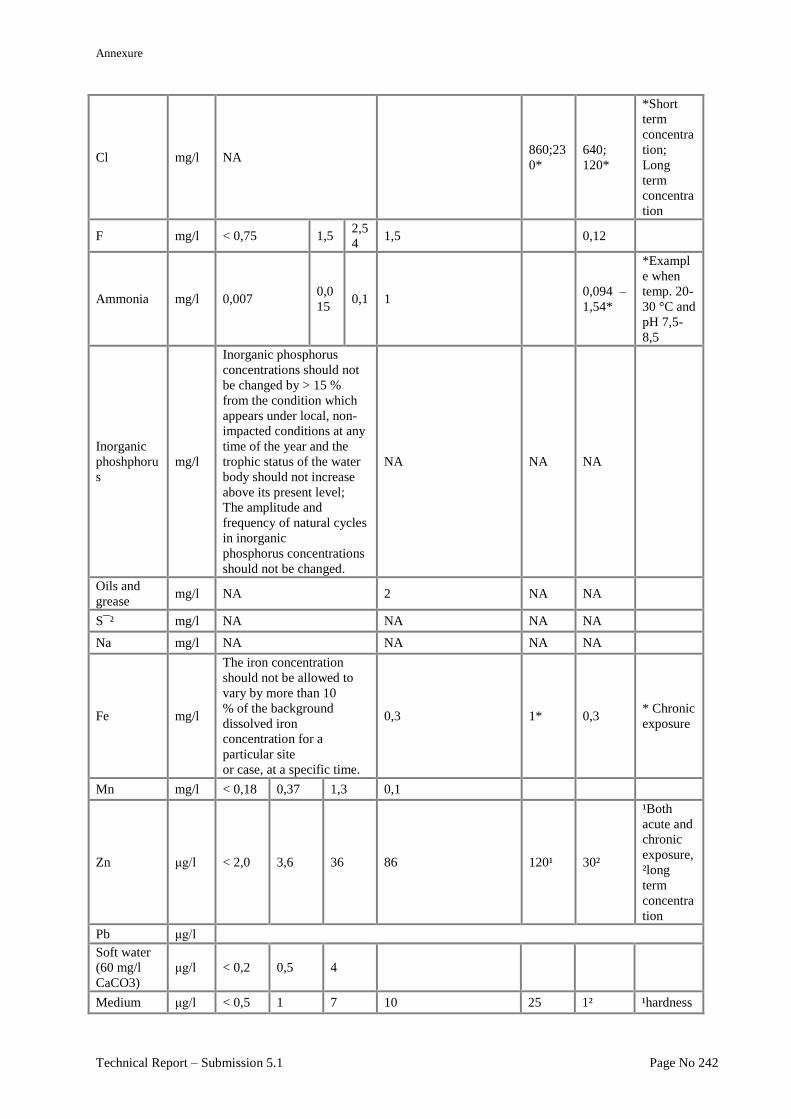
Annexure
Technical Report – Submission 5.1 Page No 242
Cl mg/l NA
860;23
0*
640;
120*
*Short
term
concentra
tion;
Long
term
concentra
tion
F mg/l < 0,75 1,5 2,5
4 1,5
0,12
Ammonia mg/l 0,007 0,0
15 0,1 1
0,094 –
1,54*
*Exampl
e when
temp. 20-
30 °C and
pH 7,5-
8,5
Inorganic
phoshphoru
s
mg/l
Inorganic phosphorus
concentrations should not
be changed by > 15 %
from the condition which
appears under local, non-
impacted conditions at any
time of the year and the
trophic status of the water
body should not increase
above its present level;
The amplitude and
frequency of natural cycles
in inorganic
phosphorus concentrations
should not be changed.
NA NA NA
Oils and
grease mg/l NA 2 NA NA
S¯² mg/l NA NA NA NA
Na mg/l NA NA NA NA
Fe mg/l
The iron concentration
should not be allowed to
vary by more than 10
% of the background
dissolved iron
concentration for a
particular site
or case, at a specific time.
0,3 1* 0,3 * Chronic
exposure
Mn mg/l < 0,18 0,37 1,3 0,1
Zn μg/l < 2,0 3,6 36 86 120¹ 30²
¹Both
acute and
chronic
exposure,
²long
term
concentra
tion
Pb μg/l
Soft water
(60 mg/l
CaCO3)
μg/l < 0,2 0,5 4
Medium μg/l < 0,5 1 7 10 25 1² ¹hardness
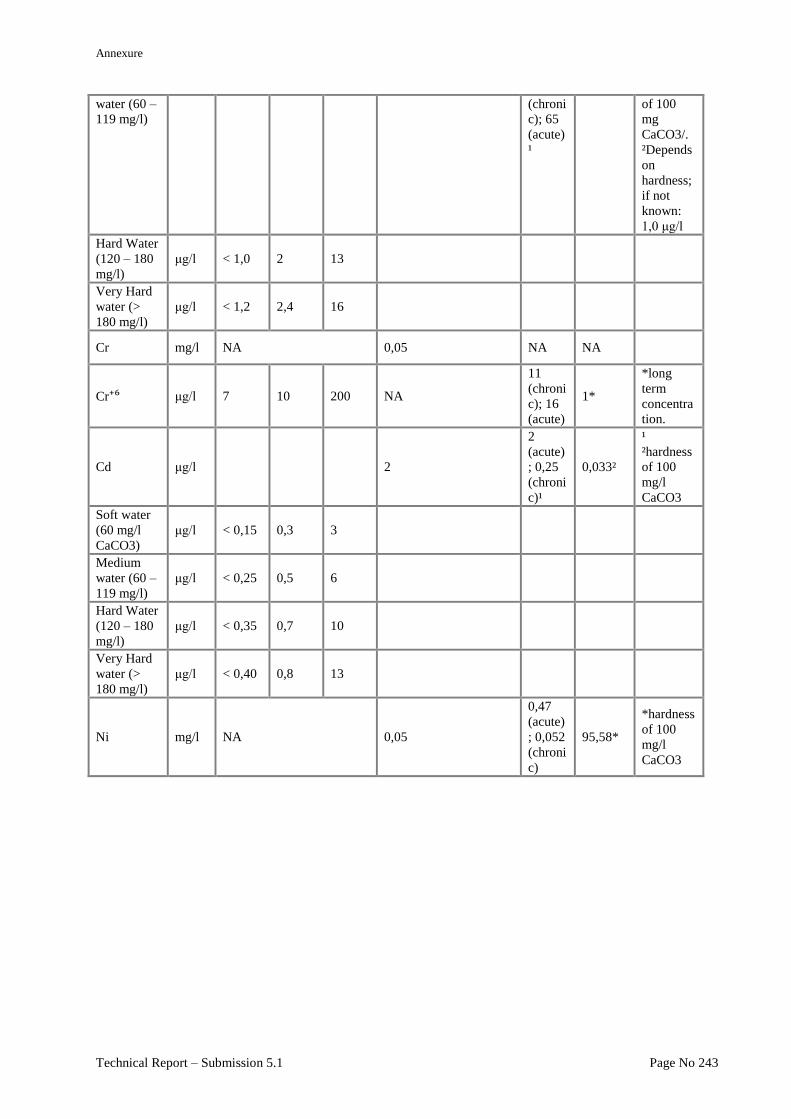
Annexure
Technical Report – Submission 5.1 Page No 243
water (60 –
119 mg/l)
(chroni
c); 65
(acute)
¹
of 100
mg
CaCO3/.
²Depends
on
hardness;
if not
known:
1,0 μg/l
Hard Water
(120 – 180
mg/l)
μg/l < 1,0 2 13
Very Hard
water (>
180 mg/l)
μg/l < 1,2 2,4 16
Cr mg/l NA 0,05 NA NA
Cr⁺⁶ μg/l 7 10 200 NA
11
(chroni
c); 16
(acute)
1*
*long
term
concentra
tion.
Cd μg/l
2
2
(acute)
; 0,25
(chroni
c)¹
0,033²
¹
²hardness
of 100
mg/l
CaCO3
Soft water
(60 mg/l
CaCO3)
μg/l < 0,15 0,3 3
Medium
water (60 –
119 mg/l)
μg/l < 0,25 0,5 6
Hard Water
(120 – 180
mg/l)
μg/l < 0,35 0,7 10
Very Hard
water (>
180 mg/l)
μg/l < 0,40 0,8 13
Ni mg/l NA 0,05
0,47
(acute)
; 0,052
(chroni
c)
95,58*
*hardness
of 100
mg/l
CaCO3

Annexure
Technical Report – Submission 5.1 Page No 244
Copyright © 2022 FDOKUMEN