Waste Management and Environment Protection
157
An Autonomous Institution of Government of Kerala Role of Grama Panchayats in Waste Management and Environment Protection Dr. Nirmala Padmanabhan S.M. Mohankumar Karthika K. Role of Grama Panchayats in Waste Management and Environment Protection Dr. Nirmala Padmanabhan S.M. Mohankumar Karthika K. Kerala state which is experiencing the paradox of low environmental hygiene with high personal hygiene has initiated some efforts, though not very effective, to address environmental challenges of air, water and soil pollution in urban regions. But these remained largely ignored in rural areas. This study focuses on analysing the role v/s performance of Grama Panchayats in environment protection and waste management. Reliable estimates of waste generation and its composition being a pre-requisite for formulation and implementation of any management strategy, this study is a unique attempt to conduct Waste Audit using direct measurement technique in villages. It seeks to address the lacuna of absence of ‘at source statistics’ of per capita generation and composition of waste in rural Kerala. The results reveal a worrying increase in plastic and sanitary waste even in villages and prevalence of unscientific disposal methods. Analysis of chemical and bacteriological quality of water from various water bodies also highlight the environment stress being experienced in rural Kerala which generally remain unnoticed by local people due to lack of visible symptoms. The study, in the light of experience in implementing a pilot waste management project in one of the villages, puts forward recommendations and potential solutions for addressing identified issues which can be of use in drafting policy decisions related to management of waste. Decentralisation Analysis Cell (DAC) An Autonomous Institution of Government of Kerala Decentralisation Analysis Cell Kerala Local Government Service Delivery Project GIFT Campus, Chavadimukku, Sreekariyam P.O. Thiruvananthapuram 695 017, Kerala www.gift.res.in
-
Upload
khangminh22 -
Category
Documents
-
view
0 -
download
0
Transcript of Waste Management and Environment Protection

An Autonomous Institution of Government of Kerala
Role of Grama Panchayats in
Waste Managementand Environment
ProtectionDr. Nirmala Padmanabhan
S.M. MohankumarKarthika K.
Role of Grama Panchayats in Waste Management and Environment ProtectionDr. Nirmala PadmanabhanS.M. MohankumarKarthika K.
Kerala state which is experiencing the paradox of low environmental hygiene with high personal hygiene has initiated some efforts, though not very effective, to address environmental challenges of air, water and soil pollution in urban regions. But these remained largely ignored in rural areas. This study focuses on analysing the role v/s performance of Grama Panchayats in environment protection and waste management. Reliable estimates of waste generation and its composition being a pre-requisite for formulation and implementation of any management strategy, this study is a unique attempt to conduct Waste Audit using direct measurement technique in villages.It seeks to address the lacuna of absence of ‘at source statistics’ of per capita generation and composition of waste in rural Kerala. The results reveal a worrying increase in plastic and sanitary waste even in villages and prevalence of unscientific disposal methods. Analysis of chemical and bacteriological quality of water from various water bodies also highlight the environment stress being experienced in rural Kerala which generally remain unnoticed by local people due to lack of visible symptoms. The study, in the light of experience in implementing a pilot waste management project in one of the villages, puts forward recommendations and potential solutions for addressing identified issues which can be of use in drafting policy decisions related to management of waste.
Decentralisation Analysis Cell (DAC)
An Autonomous Institution of Government of Kerala
Decentralisation Analysis CellKerala Local Government Service Delivery ProjectGIFT Campus, Chavadimukku, Sreekariyam P.O.Thiruvananthapuram 695 017, Keralawww.gift.res.in

i
Role of Grama Panchayats inWaste Management andEnvironment Protection
Dr. Nirmala PadmanabhanS.M. Mohankumar
Karthika K.
Decentralisation Analysis Cell (DAC)Kerala Local Government Service Delivery Project funded by The World Bank
Local Self Government Department Government of Kerala
(An Autonomous Institution of Government of Kerala)
Chavadimukku, Sreekariyam P.O., Thiruvananthapuram 695 017, Kerala, IndiaE-mail : [email protected], [email protected]
www.gift.res.in
September 2017

ii
Role of Grama Panchayats in Waste Management and Environment Protection
Policy Advisory Studies of Decentralisation Analysis Cell in GIFTKerala Local Government Service Delivery Project (KLGSDP) Local Self Government DepartmentGovernment of Kerala
Role of Grama Panchayats in Waste Management and Environment ProtectionDr. Nirmala PadmanabhanS.M. MohankumarKarthika K.
Project Co-ordinator: Dr. Jose JacobLayout & Cover : Printaids Laser Media, Thiruvananthapuram Printed at : Vijaya Press, Thiruvananthapuram
Printed & Published byDecentralisation Analysis Cell (DAC)Gulati Institute of Finance and Taxation (GIFT) Chavadimukku, Sreekariyam P.O Thiruvananthapuram 695017Kerala, IndiaTel : 0471-2596970, 2596980Email:[email protected], [email protected] www.gift.res.inDisclaimer : The views expressed in this work are those ofthe authors and do not reflect the official policy or views of GIFT.ISBN : 978-81-935037-4-4
September 2017

iii
Study Team
Dr. Nirmala PadmanabhanPrincipal Investigator
S.M. Mohankumar Co- Principal Investigator
Karthika K.Research Assistant
Dr.Jose JacobProject Co-ordinator
Project Consultant and Statistical SupportDr.G. Raveendran
(Former Additional Director General, Central Statistical Organisation, Govt. of India)
Technical AssistanceAnoop Tomy Thaliath
(Environment Engineer, Oman)
Chemical Analysis (Water quality)Dr. P.S. Harikumar & Team (CWRDM, Calicut)
Chemical Analysis (Waste)Mr. M.Anand
Assistant Professor, School of Environment Studies,(CUSAT)
Programming & Data ProcessingLekshmi L.M.
Survey TeamReshma Suresh
Akhila KumaranAneesha G.
Tessa PrasadNaseera Kuttasseri
Thomas Arul

iv
Role of Grama Panchayats in Waste Management and Environment Protection
ACKNOWLEDGEMENT
We would like to express our thanks to a number of people who made substantive contributions to this study Dr.G. Raveendran, Former Additional Director General, Central Statistical Organisation, Govt. of India for rendering exceptional support in designing the overall methodology for the study including sampling framework, survey instruments and formula for projection of quantum of waste from sample waste audit; Mr. Anoop Tomy Thaliath, Environment Engineer, Oman, for supervising our waste audit; Dr. P.S.Harikumar & Team, Centre for Water Resource Development and Management, Calicut for conducting chemical and bacteriological analysis of water samples and Mr. M.Anand, Assistant Professor, School of Environment Studies, Cochin University of Science and Technology for chemical analysis of solid waste samples. It was their inputs which facilitated an integrated framework for the study covering both social and physical sciences.
Our Special thanks to Mr. Abdu Muwonge (Economist/Task Team Leader), of World Bank Team for providing constructive suggestions from the beginning of the study. Comments from other representatives of the World Bank team and participants during review workshops, Expert Committee members: Dr. G. Raveendran, Former Additional Director General, Central Statistical Organisation, Govt. of India; Dr. K. Pushpangadan, Emeritus Professor, Centre for Development Studies, Thiruvanathapuram; Sri M. Chandra Dhas, Former Additional Secretary, Finance Department; Sri M. Gireeskumar IAS (Retd.) Deputy Director (Policy Advisor), DAC served as a useful guide in charting the structure of the report.
We also extend our gratitude to Dr. Jose Jacob, former Director and Project Co-ordinator, Gulati Institute of Finance and Taxation for facilitating this study, Dr. D. Narayana, present Director, Gulati Institute of Finance and Taxation for the initiative taken to publish the research report and his ready support of our social entrepreneurship unit for promoting green alternatives to plastic/rexine bags.
The support rendered by Sri P.S. Jayanthan (Administrative Officer, DAC) and Sri Thomas Arul (Administrative Assistant, DAC) in all administrative matters at DAC, GIFT warrants a special mention. We would also like to sincerely acknowledge the programming and data processing services rendered by Ms. Lekshmi. L.M; the earnest efforts of the survey team consisting of Ms. Reshma Suresh, Ms. Akhila Kumaran, Ms.Aneesha G, Ms.Tessa Prasad, Ms. Naseera Kuttasseri and Mr. Thomas Arul and the meticulous proof reading done by Mrs. Jyotsna Raghunandan.
Our heartfelt acknowledgement is due to the Panchayat officials, elected representatives, CDS chairpersons, Kudumbashree members, the laborers who sorted the waste and the entire sample respondents for their co-operation and patience without which this project would not have been possible. The team in Ezhikkara Panchayat need a special mention here for their co-operation and interest in implementing an action project “Ezhazhakilekku Ezhikkara” for addressing one of the issues identified in the study namely increasing quantum of plastic waste. We also place on record the financial assistance obtained from the Department of Environment and Climate Change, Government of Kerala for implementing this action project. Last but not the least, a heartfelt word of thanks for all the support rendered by Dr. Sr.Vinitha CSST, Manager; Dr.Sajimol Augustine. M., Principal; faculty in the Department of Economics and Bhoomithrasena Club of St. Teresa’s College Ernakulam which ultimately helped establish a social entrepreneurship unit in the college to mitigate the issue of burgeoning plastic/rexine waste. We hope this will be a small but strong step towards a greener Kerala.
Dr. Nirmala PadmanabhanS.M. MohankumarKarthika K.

v
CONTENTS List of Tables viii List of Figures x Abbreviations xii Executive Summary xiv
1 INTRODUCTION 11.1 Rationale for the Study 11.2 Objectives 31.3 Methodology 31.3.1 Selection of Sample Panchayats 31.3.2 Selection of Sample Households/Institutions in Each Panchayat 41.3.3 Selection of Panchayat for Case Study 51.4 Structure of the Study 5
2 ROLE OF GRAMA PANCHAYATS IN ENVIRONMENT PROTECTION- LEGAL FRAMEWORK 62.1 Environmental Legislation in India 62.1.1 Major Environmental Laws of India 72.2 From Centralised Governance to Decentralisation 92.3 Environment Related Functions of Grama Panchayats in Kerala 102.4 Summary 12
3 PERFORMANCE OF GRAMA PANCHAYATS IN KERALA IN ENVIRONMENT PROTECTION 133.1 Pattern of Allocation and Expenditure of Funds 133.2 Nature of Projects for Environment Protection 153.3 Summary 19
4 PERFORMANCE OF SAMPLE GRAMA PANCHAYATS 204.1 General Scenario 204.1.1 Socio-Demographic Profile 224.2 Allocation and Utilisation of Plan Funds for Environment Projects 234.2.1 Allocation of Funds 234.2.2 Utilisation of Funds 234.2.3 Project-wise Pattern of Expenditure 264.3 Environment Protection and MGNREGS 294.4 Total Expenditure on Environment Projects 354.5 Preparation and Use of Bio-diversity Registers 364.6 Use of Local Resource Maps 374.7 Performance in Environment Protection Functions as Specified in KPR Act 1994 374.8 Summary 40

vi
Role of Grama Panchayats in Waste Management and Environment Protection
5 WASTE MANAGEMENT SYSTEM IN SAMPLE GRAMA PANCHAYATS 425.1 Selection of Sample 425.2 Primary Survey of Households 435.2.1 Social Profile 435.2.2 Information on Ownership of Dwelling Unit and Land at the Place of Stay 445.2.3 Economic Status and Type of House 455.2.4 Information on Basic Amenities 455.2.5 Arrangements for Disposal of Septage and Liquid Waste 465.2.6 Distance of Latrines, Waste Dumps from Water Bodies in Sample Households 485.2.7 Arrangements for Solid Waste Management by G.Ps 505.2.8 Solid Waste Generation and Disposal 515.2.8.1 Food Waste 515.2.8.2 Vegetable Waste 525.2.8.3 Fish & Meat Waste 535.2.8.4 Paper & Card Board Waste 565.2.8.5 Plastic Waste 565.2.8.6 Sanitary Waste 575.2.8.7 Electrical Waste 575.2.8.8 Medical Waste 595.2.9 Perceptions of People about Pollution in their Area 605.2.10 Incidence of Water/ Vector Borne Diseases 615.3 Primary Survey of Institutions 615.3.1 Information on Building and Land 625.3.2 Information on Basic Amenities of Institutions 635.3.3 Perceptions of Sample Institutions 655.3.4 Solid Waste Generation and Disposal 665.3.4.1 Bio-degradable Waste 665.3.4.2 Non-bio degradable Waste 685.4 Analysis of Water Quality in Sample G.Ps 695.5 Summary 69
6 WASTE AUDIT 716.1 Methodology for Conducting Waste Audit 716.1.1 Methodology for Collection of Waste for Audit 716.1.2 Methodology for Measurement of Bulk Density 726.1.3 Methodology for Study of Waste Composition 736.1.4 Methodology for Estimating Total Weekly Waste from Panchayat 736.2 Generation and Characteristics of Solid Waste in Sample G.Ps 746.2.1 Waste Generation in Sample Panchayats 746.2.1.1 Quantum of Waste Generated in Sample G.Ps 746.2.1.2 Source of Waste Generation in Sample Panchayats 746.2.1.3 Composition of Waste in Sample G.Ps 756.2.2 Characteristics of Solid Waste 766.2.2.1 Bulk Density of Collected Waste (kg/cbm) 766.2.2.2 Moisture Content ( %) 766.2.2.3 pH 776.2.2.4 Calorific Value (kCal/kg) 786.3 Summary 78
7 SOCIAL IMPLICATIONS 797.1 Media Focus on Waste Audit 797.2 Action Program to Promote Waste Segregation in Ezhikkara Panchayat – ‘Ezhazhakilekku Ezhikkara’ 797.3 Operational Model for Solid Waste Management in G.Ps 80

vii
7.4 Social Entrepreneurship to Promote Use of Cloth Alternatives to Plastic Bags 877.5 Enhanced Awareness Campaign against Plastic in Schools, Civic Groups in Various Districts in Kerala 88
8 FINDINGS AND RECOMMENDATIONS 898.1 Role of GPs in Waste Management and Environment Protection 898.2 Allocation and Utilization of Funds for Environment Projects by all G.Ps in Kerala 908.3 Performance of Sample G.Ps in Environment Protection and Waste Management 908.4 Management of Waste by Households and Institutions in Sample G.Ps 938.5 Generation and Characteristics of Solid Waste in Sample G.Ps 958.6 Concluding Remarks 97 Reference Appendices Appendix 1 Water Quality Assessment of Sample Grama Panchayats 100 Appendix 2 Interview Schedules 112 Appendix 3 Glossary 137

viii
Role of Grama Panchayats in Waste Management and Environment Protection
LIST OF TABLES Sl. No Table No. Title Page No.
1 1.1 List of Sample Grama Panchayats 42 3.1 Allocation for Environment Projects by all Grama Panchayats in Kerala 133 3.2 Expenditure on Environment Projects by all Grama Panchayats in Kerala 144 3.3 Utilisation Rates of Environment Projects vis a vis Utilisation of Total Funds- all Grama Panchayats in Kerala 155 3.4 Type of Environment Projects of all Grama Panchayats in Kerala, 2011-12 156 3.5 Type of Environment Projects of all Grama Panchayats in Kerala, 2012-13 167 3.6 Type of Environment Projects of all Grama Panchayats in Kerala, 2013-14 178 3.7 Sectorwise Allocation & Expenditure on Environment Projects by Grama Panchayats in Kerala-2013-14 189 4.1 Infrastructure Facilities of Sample G.Ps 2210 4.2 Socio-Demographic Profile of Sample G.Ps 2311 4.3 Allocation of Funds for Environment Projects in Sample G.Ps 2412 4.4 Expenditure for Environment Projects in Sample G.Ps 2513 4.5 Allocation and Expenditure of Funds for Environment Projects in Ezhikkara G.P 2614 4.6 Allocation and Expenditure of Funds for Environment Projects in Kanjiramkulam G.P 2715 4.7 Allocation and Expenditure of Funds for Environment Projects in Marutharode G.P 2816 4.8 Allocation and Expenditure of Funds for Environment Projects in Nenmeni G.P 2917 4.9 Expenditure for Environment Projects under MGNREGS- Ezhikkara Panchayat 3018 4.10 Expenditure on Different Types of Environment Projects under MGNREGS - Ezhikkara Panchayat 3019 4.11 Expenditure for Environment Projects under MGNREGS- Kanjiramkulam Panchayat 3120 4.12 Expenditure on Different Types of Environment Projects under MGNREGS- Kanjiramkulam Panchayat 3121 4.13 Expenditure for Environment Projects under MGNREGS- Marutharode Panchayat 3222 4.14 Expenditure on Different Types of Environment Projects under MGNREGS- Marutharode Panchayat 3223 4.15 Expenditure for Environment Projects under MGNREGS- Nenmeni Panchayat 3324 4.16 Expenditure on Different Types of Environment Projects under MGNREGS- Nenmeni Panchayat 3325 4.17 Total Expenditure for Environment Projects by all Four Sample G.Ps (Plan fund & MGNREGS) 3526 4.18 Performance of Sample G.Ps in Environment Related Mandatory Functions Specified in KPR Act, 1994 3827 4.19 Performance of Sample G.Ps in Mandatory Waste Management Functions as Specified in KPR Act, 1994 3928 4.20 Performance of Sample G.Ps in Environment Related General and Sectoral Functions Specified in KPR Act, 1994 4029 5.1 Sampling Procedure for Selecting Units for Primary Survey 43

ix
30 5.2 Social Profile of the Sample Household 4331 5.3 Type of Land Owned 4432 5.4 Size of Land Owned 4433 5.5 Economic Status of Households 4534 5.6 Type of House 4535 5.7 Basic Amenities of Sample Households 4636 5.8 Toilet Facilities and Disposal of Septage 4737 5.9 System for Disposal of Liquid Waste 4838 5.10 Existence of Water Bodies 4939 5.11 Distance of Water Bodies (Tube Wells) from Latrines, Cattle Sheds and Waste Dumps in Sample Households 4940 5.12 Distance of Water Bodies (Wells) from Latrines, Cattle Sheds and Waste Dumps in Sample Households 5041 5.13 Arrangements for Solid Waste Management by G.Ps. 5142 5.14 Food Waste - Generation & Disposal 5243 5.15 Vegetable Waste - Generation & Disposal 5344 5.16 Fish & Meat Waste - Generation & Disposal 5445 5.17 Paper & Card board Waste- Generation & Disposal 5546 5.18 Plastic Waste - Generation & Disposal 5647 5.19 Sanitary Waste - Generation & Disposal 5748 5.20 Electrical Waste - Generation & Disposal 5849 5.21 Medical Waste - Generation & Disposal 5950 5.22 Perceptions of People about Pollution in their Area 6051 5.23 General Awareness about Environment and Sanitation 6052 5.24 Incidence of Water/Vector Borne Diseases 6153 5.25 Type of Establishments 6154 5.26 Ownership of Building and Ownership of Land 6255 5.27 Size of Land 6256 5.28 Type of Building 6357 5.29 Basic Amenities 6358 5.30 Existence of Water Bodies 6459 5.31 Distance of Water Bodies (Tube Wells) from Latrines, Cattle Sheds and Waste Dumps in Sample Institutions 6460 5.32 Distance of Water Bodies (Wells) from Latrines, Cattle Sheds and Waste Dumps in Sample Institutions 6561 5.33 Institutional Arrangements for Solid Waste Management 6662 5.34 Perceptions about Pollution in their area 6663 5.35 Bio-degradable Waste - Generation & Disposal 6764 5.36 Non-Biodegradable Waste - Generation & Disposal 6865 6.1 Waste Generation in Sample G.Ps 7466 6.2 Source wise Waste Generation 7567 6.3 Components of Waste 7568 6.4 Mean Bulk Density of Waste in Sample G.Ps 7669 6.5 Moisture Content 7770 6.6 pH 7771 6.7 Calorific Value 7772 7.1 Functional Specificities Relating to Various Phases of the Action Plan 85

x
Role of Grama Panchayats in Waste Management and Environment Protection
LIST OF FIGURES
Sl. TableNo No Title Page No.1 1.1 Methodology for Selection of Sample Panchayats 42 3.1 Share of Environment Projects in Total Projects, all G.Ps in Kerala- 2011-12 133 3.2 Share of Environment Projects in Total Projects, all G.Ps in Kerala 2012-2013 144 3.3 Share of Environment Projects in Total Projects, all G.Ps in Kerala 2013-2014 145 3.4 Expenditure on Environment Projects in all G.Ps in Kerala 2011-12 146 3.5 Expenditure on Environment Projects in all G.Ps in Kerala 2012-13 147 3.6 Expenditure on Environment Projects in all G.Ps in Kerala 2013-14 148 4.1 Allocation of Funds for Environment projects by Sample G.Ps vis-a- vis all G.Ps in Kerala 249 4.2 Expenditure on Environment Projects in Sample G.Ps vis- a-vis all G.Ps in Kerala 2610 4.3 Coir Bhoovasthram 3411 4.4 Rain Pits 3412 4.5 Mankulam 3413 4.6 Source of Funds for Environment Projects in Sample G.Ps- Plan Funds vis-a-vis MGNREGS 3614 5.1 Makeshift Toilet in Ezhikkara Panchayat 4715 6.1 Bag Containing Daily Waste Collection from Sample Institutions 7216 6.2 Methodology for Measurement of Bulk Density Step 1 7217 6.3 Methodology for Measurement of Bulk Density Step 2 7218 6.4 Methodology for Measurement of Bulk Density Step 3 7219 6.5 Sorting Table with 10mm Wire Mesh 7320 6.6 Waste Sorting Process 7321 6.7 Weighing Each Waste Fraction 7322 7.1 News Report- Ezhikkara 7923 7.2 (a )News Report- Kanjiramkulam 7924 7.2 (b) News Report- Kanjiramkulam 7925 7.3 News Report- Marutharode 7926 7.4 Launch of Ezhazhakilekku Ezhikkara- Ward 7 80

xi
27 7.5 House to House Awareness Campaign in Ward 7 8128 7.6 House to House Awareness Campaign in Ward 10 8129 7.7 Launch of Ezhazhakilekku Ezhikkara- Ward 10 8130 7.8 Multi-phase Strategy Model 8231 7.9 Bhoomithram Sanchis 8732 7.10 Prakrithi Bags 8833 8.1 Integrated Environment Management Plan 9234 8.2 Phased Targeting of Issues over Different Time periods 92 LIST OF BOX 1 2.1 Major Environment Legislations/ Regulations in India Since Independence 8

xii
Role of Grama Panchayats in Waste Management and Environment Protection
ABBREVIATIONSABS : Access and Benefit SharingAPHA : American Public Health AssociationAPL : Above Poverty LineASTM : American Society of Testing and MaterialsBDL : Below Detection LimitBIS : Bureau of Indian StandardBMC : Biodiversity Management CommitteeBPL : Below Poverty LineCAGI : Comptroller and Auditor General of IndiaCBO : Community Based OrganisationCED : Centre for Environment and DevelopmentCESS : Centre for Earth Science StudiesCPCB : Central Pollution Control BoardCWRDM : Centre for Water Resource Development and ManagementDept. : DepartmentDevpt. : DevelopmentDoECC : Department of Environment and Climate ChangeEPA : Environmental Protection ActFACT : The Fertilisers And Chemicals Travancore LimitedFGD : Focus Group DiscussionGovt : GovernmentG.P : Grama PanchayatIMAGE : The Indian Medical Association Goes Eco-FriendlyJNNURM : Jawaharlal Nehru National Urban Renewal MissionKILA : Kerala Institute of Local AdministrationKPR : Kerala Panchayati RajKSSP : Kerala Shastra Sahitya ParishadKSUDP : Kerala Sustainable Urban Development ProjectKWA : Kerala Water AuthorityLG : Local GovernmentLPG : Liquefied Petroleum GasLSG : Local Self- GovernmentLSGD : Local Self- Government DepartmentLSGI : Local Self- Government InstitutionMGNREGS : Mahatma Gandhi National Rural Employment Guarantee SchemesMoEF : Ministry of Environment and ForestsMPN : Most Probable NumberMSME : Ministry of Micro, Small and Medium EnterprisesMSW : Municipal Solid WasteNBA : National Biodiversity AuthorityNCESS : National Centre for Earth Science StudiesNGO : Non-Governmental OrganizationNREGA : National Rural Employment Guarantee ActNRHM : National Rural Health MissionNRWSS : Nenmeni Rural Water Supply SchemeNSS : National Service Scheme

xiii
NSVS : Nenmeni Shudhajala Vitarana SamitiNTU : Nephelometric Turbidity UnitsPBR : Peoples Biodiversity RegisterSBA : State Biodiversity AuthoritySBB : State Biodiversity BoardSC : Scheduled CasteSDC : Swiss Agency for Development and Co-operationSEUF : Socio Economic Unit FoundationSHG : Self-Help GroupSPCB : State Pollution Control BoardST : Scheduled TribeSTED : Scientific & Technical Education DevelopmentSWM : Solid Waste ManagementTDS : Total Dissolved SolidsUMP : Urban Management Programme UN : United NationsUNCHS : The United Nations Centre for Human Settlements UNECE : United Nations Economic Commission for Europe UNEP : United Nations Environment ProgrammeUP : Urban Proximity

xiv
Role of Grama Panchayats in Waste Management and Environment Protection
Kerala state which is hailed for its achievements on various social indicators of development, is facing the undesirable consequences of its strategy of pursuing social and economic health ignoring environmental health. The state is thus experiencing the paradox of low environmental hygiene with high personal hygiene. Studies indicate that while some efforts, though not very effective, have been initiated to address environmental challenges of air, water and soil pollution in urban regions, these have been largely ignored in rural areas. Set in this background, this research study focuses on analysing the role of G.Ps in management of solid and liquid waste and environment protection in four Panchayats in Kerala. The study, being exploratory in nature and first of its kind in G.Ps in Kerala, adopts a comprehensive approach including collection and analysis of available secondary data, collection of primary data through well designed sample surveys, segregation and measurement of solid waste generated by selected households/institutions through waste audits, conducting lab tests for assessing water quality etc.
The Kerala Panchayat Raj Act 1994, assigns a pivotal role to G.Ps in environment protection with preservation of traditional drinking water sources, collection and disposal of solid waste, regulation of liquid waste disposal, storm water drainage, maintenance of environmental hygiene, management of public market and maintenance of burial grounds listed as mandatory functions to be performed by local bodies. Some additional roles such as promoting environmental awareness, afforestation, water conservation and implementation of sanitation are also specified as general/ sectoral functions.
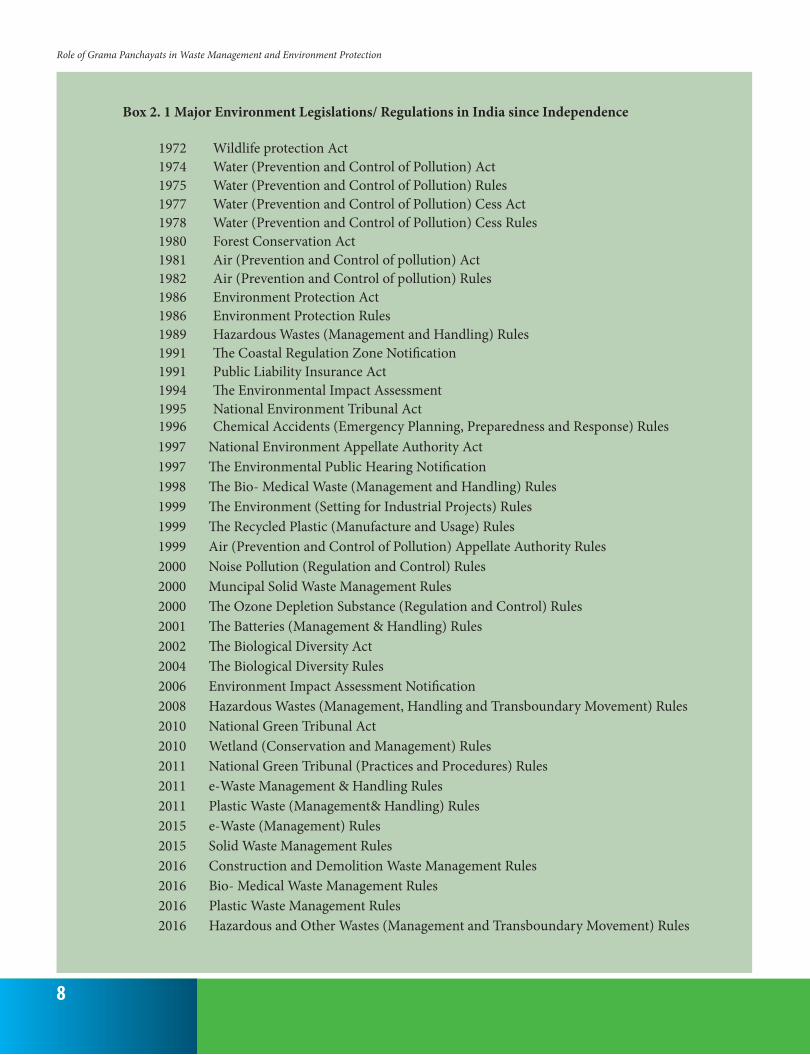
Analysis of performance of all G.Ps in Kerala in environment protection activities, based on allocation/ utilisation of funds for three years 2011-14, reveal that amounts set apart for environment projects was generally low and reflect a dismal pattern in terms of actual utilization.
Utilization rate of funds for environment projects was much lower than that for overall funds of Panchayats indicating worse performance in this sphere of activity.
Among the three heads of expenditure commonly followed by Panchayats for classification of their funds, projects relating to environment protection are most often found under production category where the utilisation rate of fund is less. Projects are observed mainly under sub categories of 1) energy generation 2) soil and water conservation, environment, afforestation and 3) sanitation & waste management. Among these, maximum number of projects was implemented under the heading of sanitation while the headings of solid and liquid waste management, biogas, pipe compost etc. revealed lowest utilization rates.
Case study of four G.Ps reiterate the finding of lacklustre performance in functions related to environment protection with mainly sanitation programmes and management of water supply schemes being implemented by G.Ps using their plan funds. However protection of ponds, water bodies and canals, afforestation etc. have been taken up primarily as works under the centrally sponsored MGNREGS. This employment guarantee scheme for poverty alleviation has thus become the prime instrument for implementing environment related mandatory and sectoral functions of G.Ps. Reasons for low utilization of plan funds for environment protection are varied including unwillingness of agencies to give quotation/ tender for Panchayat projects, land acquisition and asset issues, limited sanctioned fund vis a vis actual expense, necessity of advancing expenses, unwillingness of people to give beneficiary contribution, delay in getting technical and other sanctions from government departments, failure in getting state fund component and delay in preparation of beneficiary list.
Local level resource maps and biodiversity registers that have been prepared a few years back remain on paper, never
Executive Summary
xv
being utilized either for educating the public or designing protection strategies. Regarding maintenance of traditional drinking water sources, a mixed pattern was observed with some G.Ps totally neglecting maintenance due to availability of piped water from Kerala Water Authority, while in others, remarkable initiatives of community managed water supply were observed. Dumping of general waste in canals/ ponds was noted in Kanjiramkulam and discharge of waste including slaughter house waste into canals/ rivers reported in Ezhikkara. During rainy season, there is surface run off to ponds and no measures have been taken to prevent this. Afforestation programmes were reported but was found to be sporadic and not sustained even in Ezhikkara which had environmentally significant mangrove forests.
No activity is being undertaken by any of the sample G.Ps in respect of mandatory functions of collection and disposal of solid waste, regulation of liquid waste disposal and maintanence of environment hygiene. The main strategy being followed in the context of solid waste seems to be promotion of decentralised treatment of organic waste in individual households (with very low participation) and management of market waste through collecting and dumping in nearby areas. Very few households/ institutions were in the habit of consciously segregating their solid waste and the current strategy adopted for disposing of organic component was feeding domestic animals/ throwing in and outside own compound. Open air burning was the primary method of disposal being practiced for non-biodegradable components like paper, plastics, textiles and sanitary waste followed by other methods like throwing in own/ outside compound and burying in soil indicating adverse consequences for ground water recharging, air quality, fertility of soil, etc. Some of the clinics and hospitals within Panchayats do not seem to have tie up with IMAGE for collection of medical waste and carry out open air incineration of these wastes within their compound. Another harmful trend observed in Ezhikkara Panchayat was disposal of electric waste into canals and backwaters.
Despite over 90 percent of the sample units owning their own houses, living in semi pucca and pucca houses, almost all units having electricity connection and more than 60 percent using LPG for cooking purpose, very few had proper drainage system for disposal of liquid waste from kitchen and bathrooms. Some units in Ezhikkara village also discharged these into nearby backwaters. Open defecation, though very little, observed in some G.Ps with migrant labour and makeshift toilets which discharge their septage directly into water bodies indicate challenges to the sanitation achievements of Kerala. Use
of pit/ ring toilets are other potential source of soil-water contamination indicating that now Kerala needs to go further on sanitation front by focusing on upgrading the type/ quality of toilets constructed and addressing specific challenges such as sanitation facilities in coastal areas and for migrant labourers.
Study estimates not insignificant quantities of solid waste being generated in G.Ps. It ranges from 25 to 61 tonnes per week in the sample G.Ps with per capita waste generation between 161 gms per day to 186 gms in Nenmeni, Kanjiramkulam and Marutharode. However, the estimate for Ezhikkara was higher. Major source of solid waste generation in rural areas is households (80 percent) indicating that they should be the primary target group in any management plan in rural areas. Significant presence of organic kitchen waste in total waste stream, together with high moisture content- 61 percent to 71 percent and pH value indicate that composting is the best method of management to be adopted. The higher proportion of plastic waste estimates obtained in our study which is based on waste collected at generator’s/ source point compared to existing research which have analysed composition based on samples collected from secondary collection points or disposal sites suggests that the quantum of plastic waste in Kerala is currently higher than official estimates. Significant quantities of sanitary waste was also being generated in the Panchayats indicating usage of sanitary pads and diapers even in rural areas.
Analysis of water quality in a sample of water bodies indicate pollution stress in the rural ecosystems. Bacteriological contamination is the major water quality problem identified. About 44.6 percent of the entire 65 water samples analysed from the sample G.Ps were found to be contaminated with E.Coli indicating feacal contamination. The study thus indicates that both surface and ground water sources even in our rural areas are getting contaminated posing a threat to the water security of future generations.
To address the issues identified, the study suggests design of an integrated Environment Management Plan covering all environment functions entrusted to G.Ps under KPR Act 1994 and utilising both plan as well as MGNREGS funds. It is also suggested that local resource maps/ biodiversity registers need to be updated and used while designing development projects. The plan should include extensive IEC campaign, low cost systems for treatment of grey water, upgradation of pit and ring toilets to septic tanks, waste clinics/ support system for home composting, collection/ disposal system for non-biodegradable waste components, waste reduction/ recycling strategy, integration of existing informal systems of ragpickers and Kudumbasree groups,
Executive Summary

xvi
Role of Grama Panchayats in Waste Management and Environment Protection
material recovery centres, provision of viability gap funding etc. Since people think automatically, socially and with a mental mode, pivot of the program should be on social engineering and shaping the mental mode of the local community as a whole using a campaign based on tenets of behavioural economics. However it needs to be kept in mind that mere awareness induced action without support systems will turn counterproductive since public trust once
lost is hard to regain. Hence such awareness cum motivation should be supplemented with a comprehensive action plan involving relevant support systems and concerted effort by all stakeholders- state, district & local authorities, public, NGOs and student groups- where all work in unison to achieve the common goal of environmentally sustainable development in Kerala.

1
Introduction
The United Nations Conference on Human Development held at Stockholm proclaimed that “Protection and improvement of the human
environment is a major issue which affects the well-being of people and economic development throughout the world”. Principle three of the declaration further states that “the capacity of the earth to produce vital renewable resources must be maintained and, wherever practicable, restored or improved” (UNEP 1972). Thus for the first time, there was a global recognition that human action was starting to change the planet and that humans had to learn to control their demands/ impacts on the environment. The conference also made strong links between environment and development issues, and set the scene for the concept of sustainable development. For ensuring such a development process in developing and less developed countries, market based/ regulatory measures like environment taxes, tradeable emission permits etc. are perceived to be ineffective due to failure of state to ensure environmental standards and adequate use of resources and public goods. Instead a community based strategy is generally recommended which is envisaged in the new Kerala Development Model which emphasizes the responsibility of Local Self-Government Institutions in adequate use of local resources and preservation of environment (Veron 2001). Environment protection at local level has thus become an important function of G.Ps. Set in this background; this study focuses on examining the environment protection initiatives of select Panchayats, analysing their performance and identifying issues and constraints with special focus on management of solid waste.
1.1. Rationale for the studyKerala state, with its Western Ghats (one of the
25 biodiversity hotspots in the whole world), coastal,
freshwater and brackish water wetlands and its coastal marine coral reefs has one of the richest biodiversity systems in the world and is considered a unique environmental entity. The state, which is hailed for its achievements on various social indicators of development, is currently observed to be facing the undesirable consequences of its strategy of pursuing social and economic health ignoring environmental health. Thus, it faces a number of challenges on the environmental front such as loss and degradation of forests and mangrove systems, increased sand and clay mining, conversion of paddy fields, threats to coastal ecosystems, deterioration of rivers, increasing scarcity of water, alarming rate of soil, water and air contamination, menace of solid waste etc. (Govt. of Kerala 2009). This deterioration in environmental conditions is also reflected in the deteriorating health conditions of its people with statistics showing recurring contagious diseases. The state is currently experiencing the paradox of co-existence of high morbidity with low mortality and low environmental hygiene with high personal hygiene. In fact public hygiene is now perceived as a major issue that needs to be addressed. To quote from Human Development Report 2005, Kerala, “personal and home cleanliness notwithstanding, environmental hygiene in terms of solid and liquid waste disposal has become a serious problem, since open waste provides an ideal breeding ground for pathogens and germ carriers, resulting in the emergence of diseases like leptospirosis” (Govt. of Kerala, 2006). The outbreaks of chikungunya in 2006 and 2007 is largely attributed to the relatively recent phenomenon of stagnant water leading to prolific breeding of mosquitoes (Govt. of Kerala 2007). A number of reports also highlight the resurgence of communicable diseases in recent years which had previously been successfully under control (Government of Kerala, 2013). The State Government

2
Role of Grama Panchayats in Waste Management and Environment Protection
itself reports that “At present, the quality of services related to solid waste collection and disposal is extremely poor. Everyday, a quantity of about 1,200 tonnes waste is left to decompose on road margins, drains, canals, water bodies and open space. Such a situation provides ideal breeding ground for pathogens and germ carriers. Even more serious is the problem of ground water pollution due to leakage from disposal sites. Wind blown debris and burning of wastes invariably cause air pollution--”(Govt. of Kerala, 2006). It is not surprising that the number of asthma as well as acute respiratory infection cases in Kerala is reported to be the highest in India (Govt.of Kerala, Op.cit).
Generation of solid and liquid wastes in Kerala, much beyond the assimilating capacity of existing systems, is affecting not only our health but also our soil, water and air. Unscientific waste disposal coupled with unplanned construction of toilets in areas of high population density are in turn reported to be leading to deterioration of water quality and alarming rise in pollution levels in water bodies and drinking water resources in the state (Govt. of Kerala, 2008). Kerala is also dealing with issues created by first generation toilets which have no septic tanks and the absence of a scientific system for management of septage. Agencies often dump such waste in abandoned areas and water bodies causing serious public health hazard. All these indicate that Kerala is facing serious environmental issues which need to be addressed to ensure sustainability of its past achievements.
People’s Plan, introduced by the State Government in 1996, recognised this need to integrate sustainable development into its policy goals and bring environment protection as an important agenda in the development discourse in Kerala. The new approach also highlighted the necessity of people’s movement and community based strategies for achieving sustained local action. Peoples’ plan was restructured in the X1 plan period (2007-12) to focus on specific issues with high priority being assigned to watershed management and sanitation. Since sanitation was a mandatory function of local bodies, the policy guideline on sanitation directed all Village Panchayats, Municipalities and Corporations to have a sanitation plan consisting of solid waste management, liquid waste management, full coverage of household toilets by 2007-08, environmental sanitation of homesteads and campuses, sanitation of drinking water wells, toilets in public institutions and market waste management. The plan also emphasised a strategy based on four R’s of reduce, reuse, recycle and recovery (Govt. of Kerala, 2007). Institutionally, a mission approach was adopted with The Clean Kerala Mission focusing primarily on urban areas and the Total Sanitation and Health Mission focusing on
rural areas. Subsequently a policy decision to merge them into a common body – the Suchitwa Mission was taken in 2008 with a larger perspective of providing technical and institutional support to all kinds of activities related to sanitation including solid waste management, liquid waste management and other sanitation related issues. The multimedia campaign “Malinya Mukta Keralam” (Waste-free Kerala) was launched in 2008 and a programme for making the G.Ps waste free- “Suchitwa Gramam, Haritha Gramam”--was initiated with a target to establish integrated solid and liquid waste management systems in at least 50 percent of G.Ps. During twelfth plan period, the Govt. also implemented Suchitwa Varsham 2012- a year long campaign for promoting solid waste management at source among households and institutions. Despite such campaigns and initiatives, solid and liquid waste management has turned out to be a burning issue in the state in the last few years with administrative, ecological and public health dimensions (Govt. of Kerala, 2013).
The escalating issue has prompted academic/ administrative interest on solid/ liquid waste leading to articles/ research reports/ action plans focusing on varied dimension of the problem such as strategies/technological options of Municipal Solid Waste (Damodaran et.al,2010, Varma 2008), Kerala’s initiatives in sanitation and waste management (Varma 2013), State Government’s approach and strategies to solid waste (Govt. of Kerala 2015, 2007), city specific action plans for management (Ambat 1997), environment impact assessment of MSW (NCESS 2014), role of IMAGE in medical waste management (Nair 2013, Vijayabhas 2010), role of informal sector in waste management (Ambat 1994;1995) perception and attitude of the people towards scientific waste management (Ambat 1999), economic/social consequences of solid waste disposal (Dhanalakshmi 2011, Jayasree 2008, George 2010) review of solid waste management in Urban Local bodies (Govt. of Kerala, Report of the CAGI on LSGIs, various years), issues of women waste workers (Rani et al 2010, Mathews and Rani 2010, Jayakrishnan and Jeeja 2010) etc.
A few reports also focused on crucial aspects of waste, which are significant pre-requisites for design and implementation of management plans, such as measurement/ estimation of quantum generated/ composition/ physical and chemical properties, source of generation, etc. (NCESS 2014, JNNRUM 2007, KSUDP 2006, SEUF 2006, Padmalal et al 2002). However almost all of these have focused on measurement/ estimation of waste in urban areas (Corporations and Muncipalities) and are generally silent on the issue in Panchayats. Though no comprehensive study analysing at source generation and composition of waste in rural areas has been conducted,

3
Suchitwa Mission, based on existing studies, has estimated total solid waste generation in Kerala as 7072 tonnes/ day in 2012 of which 4964 tonnes i.e. around 70 percent is generated by 978 Panchayats (as cited in Govt. of Kerala Report of CAGI on LSGIs 2013). The present study addresses this research gap by estimating the quantum and composition of solid waste generated in a few sample G.Ps and assessing the prevailing arrangements for managing waste with special focus on the role and performance of Panchayats.
1.2. ObjectivesThe study is undertaken with the following objectives,
1. Examine the role of Panchayats in environment protection in general and management of waste in particular as envisaged in the existing legal framework.
2. Evaluate the performance of Panchayats in discharging the above responsibilities.
3. Study prevailing arrangements in Panchayats for solid and liquid waste management.
4. Evolve a methodology for assessing the magnitude and composition of solid waste generation at source.
5. Identify problems encountered by Panchayats in environment protection projects in general and solid and liquid waste management in particular and suggest feasible solutions to overcome them.
6. Identify social implications of awareness creation and devise public policy for recycling solid and liquid waste to achieve sustainable level of environmental sanitation in Panchayats
1.3 MethodologyThe study being exploratory in nature and first of its
kind in Kerala, a comprehensive approach was followed. It included collection and analysis of available secondary data sets, collection of primary data through well designed sample surveys, segregation and measurement of waste generated by selected institutions including households through waste audits, conducting lab tests of water quality, etc. Sources of secondary data include annual budgets and other official reports of Panchayats, bio-diversity registers and resource maps of local bodies, database compiled through Sulekha software, etc. The specific methodology and data sets used for meeting each of the objectives of the study are listed below:
1) Role of Panchayats in environmental protection in general and solid and liquid waste management in particular is identified on the basis of existing central and state level legislations.
2) Actual performance of Panchayats in Kerala on each of the identified roles was evaluated through a two
stage process consisting of:a) Analysis of allocation of funds vis-a-vis actual
expenditure by all Panchayats in the State for environment protection activities.
b) Case study of four sample Panchayats wherein detailed analysis of environment projects implemented at local level was undertaken. Pattern of fund allocation, actual expenditure of allotted funds as well as nature of schemes and projects implemented for environmental protection in these sample Panchayats was analysed for three years (2011-12, 2012-13 & 2013-14) based on Sulekha data, MGNREGS data as well as official records of the Panchayats. This was followed by indepth interviews with the elected representatives, other officials and stakeholders wherein various schemes implemented in this regard were examined. This also served to identify some of the hurdles and issues faced in implementing environment related projects at the local level- the fifth objective of our study.
3) The third aim of examining ground realities in Panchayats for solid and liquid waste management was based on a primary survey of a representative sample of households and institutions in the four sample G.Ps. This was followed by analysis of water quality from a sample of public/ private water bodies in sample G.Ps to examine presence/ absence of indicators of pollution stress in rural areas. The analysis was done with the assistance of a team of scientists from Centre for Water Resource Development and Management (CWRDM), Calicult- an autonomous research organization of the Govt.of Kerala.
4) Quantifying the amount of solid waste generation and thereby evolving a methodology for measuring waste in rural areas was done through conducting waste audits in the four Panchayats. Such audits helped to estimate quantities and composition of waste being generated and to identify the main sources of generation. These details are important pre-requisites for designing any sound waste management strategy.
1.3.1. Selection of Sample PanchayatsThe sample of Panchayats for case study was selected
from the list of 62 Panchayats identified by State Finance Commission which were classified based on geographical location/ physical features, into three categories as - lowland, midland and highland. While ideally samples should have been selected from all the three types, constraints of time and resources resulted in confining to two extremes and hence Panchayats from lowland and highland constituted the population for selection of our sample units. Further, since quantity and type of waste generated can be reasonably expected to vary with degree of urbanization, units falling in each of these two categories
Introduction

4
Role of Grama Panchayats in Waste Management and Environment Protection
were divided into two sub-categories- Panchayats which are in proximity/ have common boundary with urban local bodies and those which have no such proximity to urban centres. Th en from each sub-category, one Panchayat was selected at random.
Th e table given below shows the four Grama Panchayats selected for the study.
1.3.2. Selection of Sample Households/ Institutions in each Panchayat
Sampling forms an important part of the fi eld survey as it is expensive and time intensive to carry out a census of the whole Panchayat. As a result, a sampling plan was developed so that a representative sample of diff erent institutions (including households) generating waste could be selected. A multistage, stratifi ed sampling scheme was used for the purpose. Th e fi rst stage sample units were the wards in each of the selected Panchayats and the second stage units were the households/ institutions located in the selected wards. Th e wards in each Panchayat were fi rst stratifi ed into bulk generators of waste and others based
on the existence of commercial establishments, hospitals, markets, educational institutions, auditoriums, etc. Th e identifi ed wards with bulk generation of waste were selected with probability one. Th e non-bulk generators of waste were geographically numbered from North to South and one-third of them were selected using simple random sampling without replacement.
In the second stage all the structures in the selected wards were listed and sub-stratifi ed into the following three categories:
a) Residential buildings;b) Buildings for commercial purposes;c) Other buildings (Public institutions/offi ces, educational institutions, hospitals, etc.).In the case of households and commercial buildings,
5 percent of the units were selected using simple random sampling without replacement. In the case of the third category- other buildings-bulk generators such as hospitals, auditoriums etc., were covered in whole wherever only a few of them were present in each ward. Case study of
24
Decentralisation Analysis Cell (DAC)
Figure 1.1: Methodology for Selection of Sample Panchayats
The table given below shows the four Grama Panchayats selected for the study.
Table1.1:List of Sample Grama Panchayats
Sl.No.Panchayats/
Municipality
Urban
Proximity (UP)Geography District
1 Kanjiramkulam NilLow land
Thiruvananthapuram
2 Ezhikkara UP Ernakulam
3 Marutharode UPHigh land
Palakkad
4 Nenmeni Nil Wayand
1.3.2. Selection of Sample Households/ Institutions in each Panchayat
Sampling forms an important part of the field survey as it is expensive and time
intensive to carry out a census of the whole Panchayat. As a result, a sampling plan was
developed so that a representative sample of different institutions (including households)
List of Panchayats identified by State Finance Commission
High land Low land
Has Urban Proximity
Does not have Urban Proximity
Has Urban Proximity
Does not have Urban Proximity
Figure 1.1: Methodology for Selection of Sample Panchayats
Table1.1:List of Sample Grama PanchayatsSl.No. Grama Panchayats Urban Proximity (UP) Geography District
1 Kanjiramkulam Nil Low land Th iruvananthapuram2 Ezhikkara UP Ernakulam3 Marutharode UP High land Palakkad4 Nenmeni Nil Wayand

5
the first Panchayat in low land revealed that Panchayat records of buildings were often outdated leading to errors of exclusion and inclusion in sample selection wherein prevailing new buildings were excluded and non-existing/ unoccupied ones were included. Hence sample selection in the high land category Panchayats was made more robust with a prior listing process wherein all buildings in the sample wards were identified and basic details of all buildings located in it collected through a preliminary rapid assessment survey using a listing schedule. Once an exhaustive and accurate list of buildings was obtained, the above procedure was used to select sample buildings from each category.
1.3.3. Selection of Panchayat for Case StudyDue to lack of available information on methodology for
carrying out waste audit at Panchayat level, a methodology was developed and a pilot study carried out to perfect the same. Out of the list of Panchayats, Ezhikkara Panchayat was selected for the pilot study due to the fact that:
1. It is a coastal Panchayat and hence improper waste management can have implications not only for soil pollution but also for aquatic ecosystem. Further, the study may be replicable across all coastal Panchayats in Kerala.
2. Due to urbanisation and work related migration, the Panchayat is just beginning to experience issues associated with improper disposal of solid waste.
3. Ease of access for our research team.
1.4 Structure of the StudyThe study is organised in eight chapters. The first
outlines the objectives and details of methodology adopted. Second chapter examines the role assigned to Panchayats for environment protection within the existing legal framework. The third evaluates the performance of G.Ps in Kerala in environment protection based on analysis of allocation and expenditure of funds for such activities by all G.Ps in the state. The fourth represents a case study of four sample Panchayats so as to identify reasons for low utilization of funds allotted for environment related activities and examine hurdles faced in implementation of such projects. Prevailing solid and liquid waste management system in the four sample G.Ps are analysed in the fifth chapter. Results of quality analysis of water samples from select public/ private water bodies in all four Panchayats is also presented in this chapter which indicates presence/ absence of indicators of pollution stress in rural areas. Sixth chapter presents the results of waste audits carried out in all four sample Panchayats for assessing the quantity and characteristics of waste generated. This, apart from quantifying the solid waste in the four Panchayats under study, also details a methodology for conducting such studies in rural local bodies in the state. Seventh chapter profiles social implications of the project while main findings of the study and recommendations are detailed in the last chapter.
Introduction

6
Role of Grama Panchayats in Waste Management and Environment Protection
Role of Grama Panchayats in Environment Protection - Legal Framework
Environment protection is perhaps the most debated contemporary issue in today’s world and environment has found its rightful place in policy and decision
making process across the globe. Lately, environment considerations have been perceived as an integral part of life. However, protecting the environment is a big challenge in terms of its magnitude and the wide range of issues pertaining to it, solutions required, knowledge and skill required to tackle the issue. Environmental law progressed significantly during the latter part of 20th century and by early 1970s, the active role of state in environment protection gained widespread recognition globally.
2.1. Environmental Legislation in India India has a long tradition of conserving nature. Our Vedas
and Upanishads advocated a worshipful attitude towards earth, sky, air, water, plants, trees, and animals and enshrined a respect for nature and environment conservation. The first effort to codify environment protection was made by Kautilya in 300 BC where he formulated rules which mandated the rulers to protect forests and animals. This is in fact reported as the first documented case of legislation on environmental protection in the world. Respect for nature can also be seen in Emperor Asoka’s edicts (Sahasranamam 2012).
The period of colonial rule saw gradual emergence of forest laws and a few laws regulating water pollution and wildlife. However, these were piecemeal and inadequate and protection of environment was only incidental to other principal objectives of these enactments (Divan and Rosencranz 2001). The development of Indian environmental legislation has taken place primarily over the last four decades with the year 1972 marking a watershed with the country’s participation in The UN Conference on
Human Environment held at Stockholm. To implement the decisions taken at the Conference, Govt.of India initiated, through amendments to the Constitution, new legislations relating to environmental protection and also created institutions for implementing these legislations. Thus India has legislations which provides for specific provisions for protection and improvement of environment.
As per our constitution, regulation and enforcement of environment is the responsibility of both the central and the state governments and environment is a concurrent subject. This enables the State Governments and the local authorities to enact and notify their own enforcement laws and rules to ensure compliance. India, as a member of the United Nations and as a signatory to the Stockholm Declaration of 1972, inserted two Articles, i.e., 48A and 51A in its Constitution in 1976 - Article 48A inserted in part IV rightly directs that the State shall endeavor to protect and improve the environment and safeguard forests and wildlife of the country. Similarly, clause (g) of Article 51A inserted in the Fundamental duties (Part IV A) imposes a duty on every citizen of India, to protect and improve the natural environment including forests, lakes, river, and wildlife and to have compassion for living creatures. The cumulative effect of Articles 48A and 51A (g) seems to be that the ‘State’ as well as the ‘citizens’ both are now under constitutional obligation to conserve, preserve, protect and improve the environment. Every generation owes a duty to all succeeding generations to develop and conserve the natural resources of the nation in the best possible way. The phrase ‘protect and improve’ appearing in both the Articles 48A and 51A (g) seems to contemplate an affirmative government action to improve the quality of environment and not just to preserve the environment in its degraded form.
The above two articles are inserted under the heads
7
“Directive Principles of State Policy” and “Fundamental Duties” and there is no specific fundamental right in the Constitution specifically mentioning right of people to clean and unpolluted environment. Though the National Commission Constituted by the Govt. of India in 2001, to review the working of the Constitution and environment protection, recommended incorporation of right to safe drinking water, prevention of pollution, conservation of ecology and sustainable development in a new Article- 30- D, no concrete action has been taken. A positive note in this regard is the interpretation of Article 21-the Fundamental right to life and personal liberty- by the Supreme Court to include the right to a wholesome environment. There are numerous judicial decisions wherein the right to a clean environment, drinking water, a pollution-free atmosphere, etc. has been given the status of inalienable human rights and, therefore, fundamental rights of Indian citizens. Such judicial directives by the higher Judiciary in India consisting of the Supreme Court and various High Courts have also resulted in the basic principles of environmental management such as sustainable development, intergenerational equity, public trust doctrine, absolute liability, reversal of burden of proof, precautionary principle, polluter pays principle etc., becoming an integral part of environmental law in the country (Sahasranamam Opcit.). Thus the essence of the existing law in India relating to the environment has developed through both legislative and judicial initiatives.
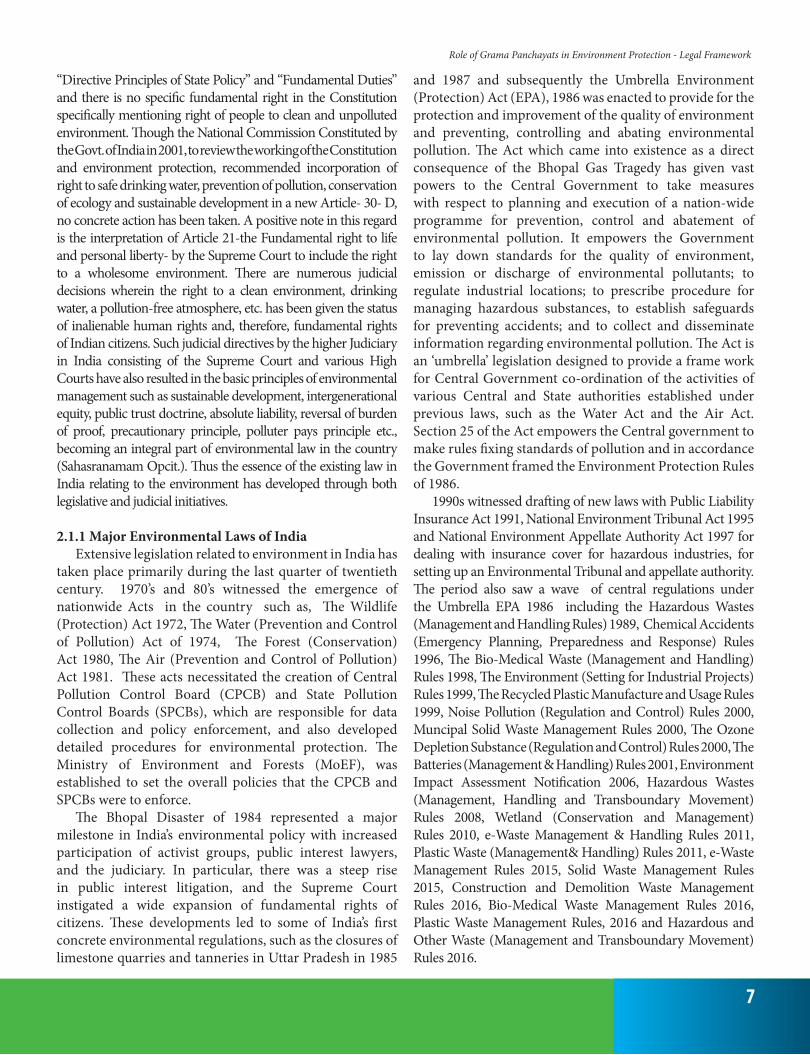
2.1.1 Major Environmental Laws of India Extensive legislation related to environment in India has
taken place primarily during the last quarter of twentieth century. 1970’s and 80’s witnessed the emergence of nationwide Acts in the country such as, The Wildlife (Protection) Act 1972, The Water (Prevention and Control of Pollution) Act of 1974, The Forest (Conservation) Act 1980, The Air (Prevention and Control of Pollution) Act 1981. These acts necessitated the creation of Central Pollution Control Board (CPCB) and State Pollution Control Boards (SPCBs), which are responsible for data collection and policy enforcement, and also developed detailed procedures for environmental protection. The Ministry of Environment and Forests (MoEF), was established to set the overall policies that the CPCB and SPCBs were to enforce.
The Bhopal Disaster of 1984 represented a major milestone in India’s environmental policy with increased participation of activist groups, public interest lawyers, and the judiciary. In particular, there was a steep rise in public interest litigation, and the Supreme Court instigated a wide expansion of fundamental rights of citizens. These developments led to some of India’s first concrete environmental regulations, such as the closures of limestone quarries and tanneries in Uttar Pradesh in 1985
and 1987 and subsequently the Umbrella Environment (Protection) Act (EPA), 1986 was enacted to provide for the protection and improvement of the quality of environment and preventing, controlling and abating environmental pollution. The Act which came into existence as a direct consequence of the Bhopal Gas Tragedy has given vast powers to the Central Government to take measures with respect to planning and execution of a nation-wide programme for prevention, control and abatement of environmental pollution. It empowers the Government to lay down standards for the quality of environment, emission or discharge of environmental pollutants; to regulate industrial locations; to prescribe procedure for managing hazardous substances, to establish safeguards for preventing accidents; and to collect and disseminate information regarding environmental pollution. The Act is an ‘umbrella’ legislation designed to provide a frame work for Central Government co-ordination of the activities of various Central and State authorities established under previous laws, such as the Water Act and the Air Act. Section 25 of the Act empowers the Central government to make rules fixing standards of pollution and in accordance the Government framed the Environment Protection Rules of 1986.
1990s witnessed drafting of new laws with Public Liability Insurance Act 1991, National Environment Tribunal Act 1995 and National Environment Appellate Authority Act 1997 for dealing with insurance cover for hazardous industries, for setting up an Environmental Tribunal and appellate authority. The period also saw a wave of central regulations under the Umbrella EPA 1986 including the Hazardous Wastes (Management and Handling Rules) 1989, Chemical Accidents (Emergency Planning, Preparedness and Response) Rules 1996, The Bio-Medical Waste (Management and Handling) Rules 1998, The Environment (Setting for Industrial Projects) Rules 1999, The Recycled Plastic Manufacture and Usage Rules 1999, Noise Pollution (Regulation and Control) Rules 2000, Muncipal Solid Waste Management Rules 2000, The Ozone Depletion Substance (Regulation and Control) Rules 2000, The Batteries (Management & Handling) Rules 2001, Environment Impact Assessment Notification 2006, Hazardous Wastes (Management, Handling and Transboundary Movement) Rules 2008, Wetland (Conservation and Management) Rules 2010, e-Waste Management & Handling Rules 2011, Plastic Waste (Management& Handling) Rules 2011, e-Waste Management Rules 2015, Solid Waste Management Rules 2015, Construction and Demolition Waste Management Rules 2016, Bio-Medical Waste Management Rules 2016, Plastic Waste Management Rules, 2016 and Hazardous and Other Waste (Management and Transboundary Movement) Rules 2016.
Role of Grama Panchayats in Environment Protection - Legal Framework
8
Role of Grama Panchayats in Waste Management and Environment Protection
Box 2. 1 Major Environment Legislations/ Regulations in India since Independence 1972 Wildlife protection Act 1974 Water (Prevention and Control of Pollution) Act 1975 Water (Prevention and Control of Pollution) Rules 1977 Water (Prevention and Control of Pollution) Cess Act 1978 Water (Prevention and Control of Pollution) Cess Rules 1980 Forest Conservation Act 1981 Air (Prevention and Control of pollution) Act 1982 Air (Prevention and Control of pollution) Rules 1986 Environment Protection Act 1986 Environment Protection Rules 1989 Hazardous Wastes (Management and Handling) Rules 1991 The Coastal Regulation Zone Notification 1991 Public Liability Insurance Act 1994 The Environmental Impact Assessment 1995 National Environment Tribunal Act 1996 Chemical Accidents (Emergency Planning, Preparedness and Response) Rules
1997 National Environment Appellate Authority Act 1997 The Environmental Public Hearing Notification 1998 The Bio- Medical Waste (Management and Handling) Rules 1999 The Environment (Setting for Industrial Projects) Rules 1999 The Recycled Plastic (Manufacture and Usage) Rules 1999 Air (Prevention and Control of Pollution) Appellate Authority Rules 2000 Noise Pollution (Regulation and Control) Rules 2000 Muncipal Solid Waste Management Rules 2000 The Ozone Depletion Substance (Regulation and Control) Rules 2001 The Batteries (Management & Handling) Rules 2002 The Biological Diversity Act 2004 The Biological Diversity Rules 2006 Environment Impact Assessment Notification 2008 Hazardous Wastes (Management, Handling and Transboundary Movement) Rules 2010 National Green Tribunal Act 2010 Wetland (Conservation and Management) Rules 2011 National Green Tribunal (Practices and Procedures) Rules 2011 e-Waste Management & Handling Rules 2011 Plastic Waste (Management& Handling) Rules 2015 e-Waste (Management) Rules 2015 Solid Waste Management Rules 2016 Construction and Demolition Waste Management Rules 2016 Bio- Medical Waste Management Rules 2016 Plastic Waste Management Rules 2016 Hazardous and Other Wastes (Management and Transboundary Movement) Rules

9
The suspected plague outbreak in Surat in 1994 was instrumental in framing of some of these subordinate legislations under the EPA, particularly the MSW rules of 2000. A public interest litigation was filed in the Supreme Court in 1996 against the Govt. of India, state governments, and municipal authorities for their failure to perform their duty of managing MSW adequately. The Supreme Court appointed an expert committee to look into all aspects of SWM and to make recommendations to improve the situation. Based on the recommendations of the committee and the principles enunciated by the Supreme Court, The Ministry of Environment and Forests issued the Municipal Solid Waste (Management and Handling) Rules 2000 which lay down the steps to be taken to ensure management of solid waste in Class I cities in India. According to these rules, Municipal authorities are responsible for implementing provisions of the 2000 rules and they must provide the infrastructure and services with regard to collection, storage, segregation, transport, treatment, and disposal of MSW. Municipal authorities have to obtain authorization from the state pollution control board or committee to set up waste processing and disposal facilities, and must deliver annual reports of compliance. The CPCB is responsible for co-ordinating the implementation of the rules among the state boards. Municipalities were mandated to implement the rules by December 2003, with punishment for municipal authorities that failed to meet the standards prescribed.
Yet another major milestone in Environment legislation in India is The Biodiversity Act 2002 which primarily addresses issues concerning access to genetic resources and associated knowledge by foreign nationals, institutions or companies, and equitable sharing of benefits arising out of the use of these resources and associated knowledge by the country and its people. The Act governs access and benefit sharing (ABS) through a three tier system, i.e., National Biodiversity Authority (NBA) at the national level, the State Biodiversity Board (SBB) and Biodiversity Management Committees (BMCs) at local levels. The NBA deals with the requests for access to bio-resources and associated traditional knowledge by foreign nationals, institutions or companies, and all matters pertaining to the transfer of research findings to any foreign national, imposition of terms and conditions to secure equitable sharing of benefits, establish sovereign rights over the bio-resources of India and approval for seeking any form of intellectual property rights in or outside India for an invention based on research or information pertaining to a biological resource and associated traditional knowledge obtained from India. SBBs deal with matters relating to access to bio-resources by Indians for commercial purposes and restrict any activity
which violates the objectives of conservation, sustainable use and equitable sharing of benefits. The mandate of the BMCs is conservation, sustainable use, documentation of biodiversity and chronicling of knowledge relating to biodiversity. NBA and SBAs would consult BMCs on matters related to use of biological resources and associated knowledge within their jurisdiction.
2.2. From Centralised Governance to Decentralisation
The case for decentralization in environmental governance has been articulated most prominently in the declaration of the 1992 Rio Earth Summit. Principle 10 specifically states that environmental issues are best handled with participation of all concerned citizens, at the relevant level. At the national level, each individual shall have appropriate access to information concerning the environment that is held by public authorities, including information on hazardous materials and activities in their communities, and the opportunity to participate in decision-making processes. States shall facilitate and encourage public awareness and participation by making information widely available. Effective access to judicial and administrative proceedings, including redress and remedy, shall be provided (UNEP, 1992). The declaration also contains a second relevant directive, Principle 22, which affirms the role of indigenous and local communities in environmental management and encourages states to enable local participation. Both principles were subsequently codified and elaborated in the United Nations Economic Commission for Europe’s 1998 Convention on Access to Information, Public Participation in Decision- Making and Access to Justice in Environmental Matters, commonly referred to as the Aarhus Convention after the Danish city where it was signed. The convention holds that living in a healthy environment is a fundamental right, from which follow three subsidiary rights, the so-called three pillars of the convention: “the right to know, the right to participate and the right of access to justice” (UNECE 1998). This repeats Principle 10’s call for communities to have access to information; in an environmental context this can refer to everything from pollution reporting data to tabulations of royalties paid for resource extraction. Participation is taken to mean local involvement and consultation in decision-making that reaches beyond symbolic public comments. Finally, access to justice refers to legal procedures and formal judicial standing enabling individuals to use the courts to seek redress for environmental harm or mismanagement.
In India the institution of Panchayat Raj was created as a constitutional third tier structure of sub- national
Role of Grama Panchayats in Environment Protection - Legal Framework

10
Role of Grama Panchayats in Waste Management and Environment Protection
administration through the 73rd and 74th constitutional Amendment Acts 1993. These acts gave the The Panchayati Raj institutions and urban local bodies a constitutional status and made the establishment of three tier system obligatory in all states. The Constitution also lists 29 subjects in the 11th Schedule and leaves it for the states to decide which activities under which functions will be assigned to Panchayats. The legislature of a state can make laws furnishing the Panchayats with relevant powers for preparation and implementation of plans in relation to these assigned functions. Among these 29 subjects the following have implications for environment management:
1. Agriculture including agriculture extension. 2. Land improvement, implementation of land reforms,
land consolidation and soil conservation. 3. Minor irrigation, water management and watershed
development. 4. Social forestry and farm forestry.5. Drinking water.6. Non-conventional energy sources. 7. Health and sanitation, including hospitals, primary
health centers and dispensaries.Under the Twelfth Schedule, the following environment related activities come under the realm of the Muncipalities. 1. Urban planning including town planning. 2. Regulation of land-use and construction of buildings. 3. Water supply for domestic, industrial and commercial
and solid waste management. 4. Public health, sanitation conservancy and solid waste
management. 5. Urban forestry, protection of the environment and
promotion of ecological aspects. 7. Provision of urban amenities and facilities such as
parks, gardens, playgrounds. 8. Regulation of slaughter house and tanners. These amendments empower and enable local
governments to take substantial steps towards environmental protection and has taken environment to the grass-root level (Sahasranamam Op.cit.).
2.3 Environment Related Functions of Grama Panchayats in Kerala
To give effect to the 73rd constitutional amendment, Kerala has enacted The Kerala Panchayat Raj Act 1994 which endows Panchayats with powers and authority to enable them to function as institutions of self-government. The third Schedule [Sub-section (1) of 166] of the act details the functions of a G.P. These functions are to be discussed in detail in the G.P; along with G.P functionaries and the extent to which the Panchayat is actually performing
these functions are to be reviewed from time to time. These functions are generally classified into three broad categories.
Mandatory Functions (Civic Functions and Regulatory Functions)
Provision, operation and maintenance of civic facilities have traditionally been the key functions of local governments. Effective delivery of civic services improves quality of life of villagers through ensured safe drinking water, sanitation, health care, roads and streetlight. Grama Panchayat as local government also has to carry out regulatory functions, so that citizens can avail their rights and do not encroach upon the rights of fellow citizens. In Kerala, among the civic and regulatory functions of the G.P the first ten as well as item 18 and 25 which are listed below have significant implications for environment protection:• Regulating building construction.• Protection of public lands against encroachment.• Maintenance of traditional drinking water sources.• Preservation of ponds and other water tanks.• Maintenance of waterways and canals under the control
of Village Panchayats.• Collection and disposal of solid waste and regulation of
liquid waste disposal.• Storm water drainage.• Maintenance of environmental hygiene.• Management of public markets.• Establishment and maintenance of burial and burning
grounds.• Provision of bathing and washing ghats.• Provision for toilet facilities and bathing ghats at public
places.
General FunctionsIn addition to civic and regulatory functions, Grama
Panchayats also carry out general functions such as mobilizing villagers to participate in the Grama Sabha for planning, monitoring and fighting social evils. In Kerala, among the various general functions, following is directly related to environment:• Inculcating environmental awareness and motivating
local action for environmental upgradation.
Sectoral Functions A Panchayat is also assigned nineteen sector specific
functions under various heads such as agriculture, animal husbandry and farming, fishing, minor irrigation, forestry, Industry, housing water supply, electricity, energy, public works, public health & sanitation, social welfare, SC/ ST Devpt. etc. Some of these sectoral functions and the items there under

11
which have a direct bearing on the environment are given below-
Sector function I. Agriculture• Soil protection.
Sector function III. Minor Irrigation• Maintenance and implementation of all minor irrigation
projects within the area of a village Panchayat.• Implementation and maintenance of all micro irrigation
projects.• Put into practice water conservation.
Sector function V. Social Forestry• Organise campaigns for planting of trees and to build
environmental awareness.• Afforestation of waste land.
Sector function VIII. Water Supply• Management of water supply schemes within a village
Panchayat.• Setting up of water supply schemes within a village
Panchayat.
Sector function IX Electricity and Energy• Encourage the consumption of biogas.
Sector function XII. Public Health and Sanitation• Implementation of sanitation programmes. Section 218-234 of The Kerala Panchayat Raj Act 1994
deals with public safety, convenience and health, many of the provisions of which are directly concerned with environment protection particularly solid and liquid waste management as is shown in the following excerpts:
218- All public water courses including rivers, streams, irrigation and drainage channels, canals, lakes, back waters, springs reservoirs, tanks, cisterns, fountains, wells and its banks are vested with the LSGs1.
219-A. Village Panchayat is to arrange for the removal of rubbish, solid wastes and filth
(1) Every village Panchayat shall make adequate arrangements for –
• Regular sweeping and cleaning of the roads and removal of sweeping there from;
• Daily removal of the filth and the carcasses of animals from private premises;
• Removal and burial of unclaimed dead bodies under intimation to the police;
• Removal of solid wastes;• Daily removal of rubbish from dustbins and private
premises. 219 C. Contract with owner or occupier for removal of
rubbish or filth. 219 D. Introduce house-to-house collection of rubbish.219 E. Rubbish and other solid waste shall be the property
of the village Panchayat. 219 F. Provision for the final disposal of solid waste -
(1) Every village Panchayat shall identify and notify suitable places within or outside the village Panchayat area for the purpose of final disposal of waste.
219 G. Provision for processing of solid wastes- Panchayat may manage, run or contract out any establishment for recycling, treating, processing and disposal of solid waste.
219 H. Removal of rubbish and solid waste accumulated on non-residential premises.
219 I. Prohibition of improper disposal of carcasses rubbish and filth.
219 J. Prohibition of keeping filth on premises.219 K. Prohibition against allowing outflow of filth: - No
owner or occupier of any premises shall allow the water from any sink, drain, latrine or stable, or any other filth to flow out of such premises to any portion of a street except a drain or a cess-pool or to flow out of such premises so as to cause an avoidable nuisance by the soakage of the said water or filth into the walls or ground at the side of drain forming a portion of a street.
219 L. Prohibition of disposal of skin of a carcass other than specified places.
219 M. Prohibition of using any cart without cover for the removal of filth.
219 N. Prohibition of deposit of rubbish or filth in public places.
219 Q. The employees of village Panchayat engaged in rubbish and solid waste management service are prohibited from depositing waste at a place other than specified.
219 S. Prohibition of deposit of rubbish, filth or excreta in water bodies and water sources.
219 T. Punishment for depositing or throwing any rubbish or solid waste in contravention of the provisions of the act.
This kind of focal role to local governments in environment protection is also highlighted in recent academic discourse. For instatnce, the Western Ghats Ecology Expert Panel (WGEEP), also known as the Gadgil Commission, appointed by the Ministry of Environment and Forests of India reiterates the important role to be assigned to local governments and advocates that the present system of governance of the environment should be changed.
1This implies that their protection is the responsibility of the LSG
Role of Grama Panchayats in Environment Protection - Legal Framework

12
Role of Grama Panchayats in Waste Management and Environment Protection
It propounds a bottom up approach right from Gram sabhas rather than a top down approach and recommends decentralization and more powers to local authorities in management of environment.2.4 Summary
The Kerala Panchayat Raj Act 1994, has empowered and entrusted the G.Ps in Kerala with the task of taking concrete measures towards environment protection with preservation of traditional drinking water sources, collection and disposal of solid waste, regulation of liquid waste disposal, draining of storm water, maintenance of environmental hygiene, management of public market and maintenance of burial grounds listed as mandatory functions to be performed by local bodies. Some additional roles such as promoting environmental awareness, afforestation, water conservation and implementation of sanitation are also specified as general/sectoral functions to be performed. Concrete measures to be taken particularly in the case of waste management and water conservation have been clearly specified in the parent act. The potential strategies to be followed by LGs in collection, transportation, treatment and disposal of various waste streams are detailed in the various acts, rules and regulations formulated at the national level. The pivotal role assigned to LG in environment protection and waste management reflect the basic economic principle that strong externalities may
result in market failure necessitating state intervention. Such decentralization in environmental governance was supported by concrete action in the State in the form of introduction of people’s plan in 1996 that emphasized participatory planning and collaboration between the State, NGOs and civic movements. This policy approach emphasised going beyond mere state regulation for environment protection to community based strategies leading to the emergence of what Veron has termed as new Kerala model which strived to integrate sustainable development goals into policy making. While all these implied a central role to the LGs in environment conservation, of late, there has been a shift in environment policy with greater responsibility assigned to principles of subsidiarity and polluters’ responsibility as is reflected in Kerala Environment policy 2009, Draft Health Policy 2013 etc. which highlight that the primary agency for action to protect and enrich the environment is the very citizen and household of Kerala. The approach paper for sustainable management of waste put forward by Suchitwa Mission in 2015 also gives maximum emphasis to behavioural and lifestyle change to be brought about by each and every one, advocates inter-departmental and inter-sectoral co-ordination as the way forward for sustainable management of resources and highlights that this can no longer be the sole responsibility of LSGD.

13
Performance of Grama Panchayatsin Kerala in Environment Protection
Local Governments, being assigned a central role in environment protection, it is prudent to analyse the forms, functions and performance in this area. Th is
section is an attempt in this regard with focus exclusively on allocation as well as utilization of funds and the type of projects envisaged for protection of environment by Panchayats in Kerala.
Th e primary source of data for analysing allocation and expenditure of funds by G.Ps for various development activities and functions is the ‘Sulekha database’. It is however not easily amenable for functional analysis due to problems in classifi cation. But subject to this limitation, we use this data set relating to three years 2011-12, 2012-13 and 2013-14 to analyse pattern of allocation and expenditure of all G.Ps in the state for environment protection.
3.1. Pattern of Allocation and Expenditure of Funds
Th e allocation for environment projects2 from the total outlay of the G.Ps in the state is meagre in the year 2011-12 and constitutes only one percent. Th is increased to 6 percent of total outlay in 2012-13 but declined to 5.23 percent in 2013-14 (Table 3.1& fi gures 3.1, 3.2 and 3.3).
Th is indicates that G.Ps are not giving due importance to environment protection while implementing development activities at local level.
Figure 3.1Share of Environment Projects in Total Projects, all G.Ps in Kerala 2011-12
Th e situation is even more dismal when we examine expenditure of Grama Panchayats with less than the allotted amount being spent in all three years. For instance
Table 3.1: Allocation of funds for Environment Projects by all Grama Panchayats in KeralaYear Allocated fund for all
projects(Rs)Allocation for Environment
Projects(Rs)Allocation for Environment Projects as per-
cent of total allocation
2011-12 4768,79,96,849 45,96,71,545 0.962012-13 4583,89,42,141 277,89,01,549 6.062013-14 5703,51,43,811 298,08,10,735 5.23
Source: Sulekha data
42
Decentralisation Analysis Cell (DAC)
Table 3.1: Allocation for Environment Projects by all Grama Panchayats in Kerala
Year Allocated fund for all projects(Rs)
Allocation for Environment Projects(Rs)
Allocation for Environment
Projects as percent of total allocation
2011-12 4768,79,96,849 45,96,71,545 0.96
2012-13 4583,89,42,141 277,89,01,549 6.06
2013-14 5703,51,43,811 298,08,10,735 5.23
Source: Sulekha data
Figure 3.1Share of Environment Projects in Total
Projects, all G.Ps in Kerala 2011-12
Figure 3.2 Figure 3.3Share of Environment Projects in Total Share of Environment Projects in Total Projects, all G.Ps in Kerala 2012-13 Projects, all G.Ps in Kerala 2013-14
The situation is even more dismal when we examine expenditure of Grama
Panchayats with less than the allotted amount being spent in all three years. For instance in
2011-12 only 40 percent of the allocated amount was spent which declined drastically to a
mere 12 percent in 2012-13 and was 21.45 percent in 2013-14 (Table 3.2 & figures 3.4, 3.5 and
3.6). The rest of the allocated fund was not utilized.
99 %
1%
Allocation for other Projects
Share of environment Projects
94%
6%Allocation for other Projects
Share of environment Projects 94.77 %
5.23%
Allocation for other ProjectsShare of environment Projects 2 Environment Project: A project is a planned set of interrelated tasks to be executed over a fi xed period and within certain cost and other limitations to achieve a
particular aim. Environment projects refers in this study to projects which include the activities of Grama Panchayats on natural assets like soil, water, and waste management, sanitation, aff orestation, bio diversity and projects which are directly or indirectly related to environment protection.
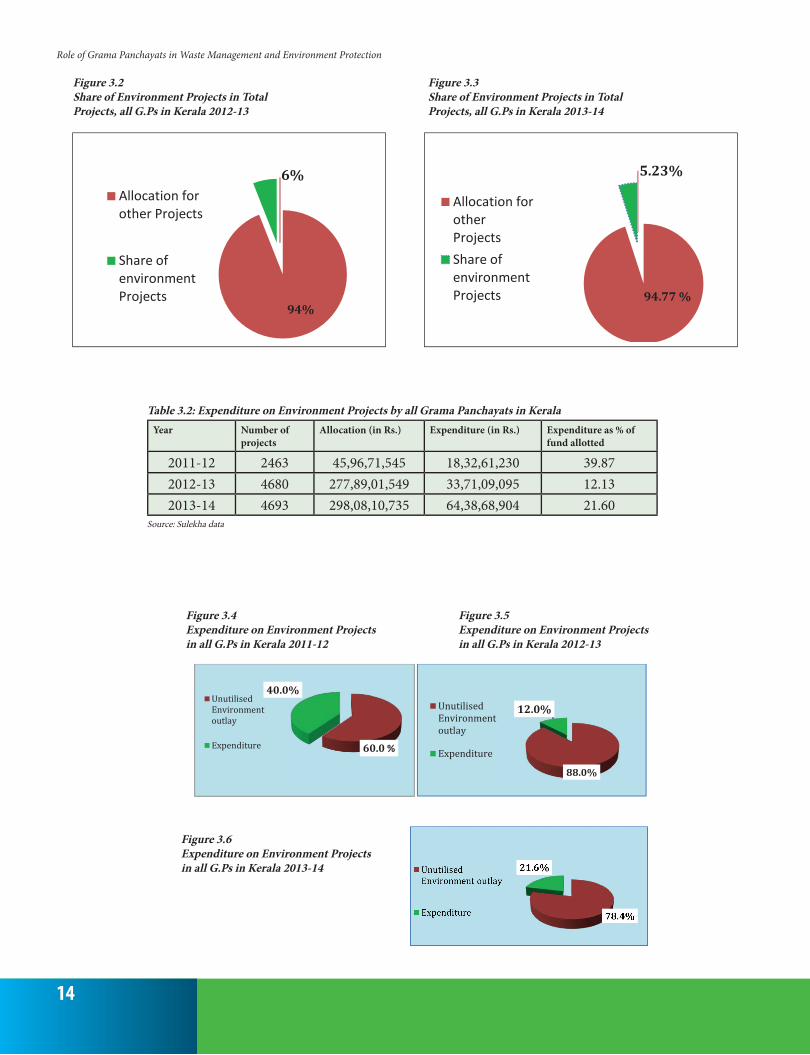
14
Role of Grama Panchayats in Waste Management and Environment Protection
42
Decentralisation Analysis Cell (DAC)
Table 3.1: Allocation for Environment Projects by all Grama Panchayats in Kerala
Year Allocated fund for all projects(Rs)
Allocation for Environment Projects(Rs)
Allocation for Environment
Projects as percent of total allocation
2011-12 4768,79,96,849 45,96,71,545 0.96
2012-13 4583,89,42,141 277,89,01,549 6.06
2013-14 5703,51,43,811 298,08,10,735 5.23
Source: Sulekha data
Figure 3.1Share of Environment Projects in Total
Projects, all G.Ps in Kerala 2011-12
Figure 3.2 Figure 3.3Share of Environment Projects in Total Share of Environment Projects in Total Projects, all G.Ps in Kerala 2012-13 Projects, all G.Ps in Kerala 2013-14
The situation is even more dismal when we examine expenditure of Grama
Panchayats with less than the allotted amount being spent in all three years. For instance in
2011-12 only 40 percent of the allocated amount was spent which declined drastically to a
mere 12 percent in 2012-13 and was 21.45 percent in 2013-14 (Table 3.2 & figures 3.4, 3.5 and
3.6). The rest of the allocated fund was not utilized.
99 %
1%
Allocation for other Projects
Share of environment Projects
94%
6%Allocation for other Projects
Share of environment Projects 94.77 %
5.23%
Allocation for other ProjectsShare of environment Projects
Table 3.2: Expenditure on Environment Projects by all Grama Panchayats in KeralaYear Number of
projectsAllocation (in Rs.) Expenditure (in Rs.) Expenditure as % of
fund allotted
2011-12 2463 45,96,71,545 18,32,61,230 39.872012-13 4680 277,89,01,549 33,71,09,095 12.132013-14 4693 298,08,10,735 64,38,68,904 21.60
Source: Sulekha data
42
Decentralisation Analysis Cell (DAC)
Table 3.1: Allocation for Environment Projects by all Grama Panchayats in Kerala
Year Allocated fund for all projects(Rs)
Allocation for Environment Projects(Rs)
Allocation for Environment
Projects as percent of total allocation
2011-12 4768,79,96,849 45,96,71,545 0.96
2012-13 4583,89,42,141 277,89,01,549 6.06
2013-14 5703,51,43,811 298,08,10,735 5.23
Source: Sulekha data
Figure 3.1Share of Environment Projects in Total
Projects, all G.Ps in Kerala 2011-12
Figure 3.2 Figure 3.3Share of Environment Projects in Total Share of Environment Projects in Total Projects, all G.Ps in Kerala 2012-13 Projects, all G.Ps in Kerala 2013-14
The situation is even more dismal when we examine expenditure of Grama
Panchayats with less than the allotted amount being spent in all three years. For instance in
2011-12 only 40 percent of the allocated amount was spent which declined drastically to a
mere 12 percent in 2012-13 and was 21.45 percent in 2013-14 (Table 3.2 & figures 3.4, 3.5 and
3.6). The rest of the allocated fund was not utilized.
99 %
1%
Allocation for other Projects
Share of environment Projects
94%
6%Allocation for other Projects
Share of environment Projects 94.77 %
5.23%
Allocation for other ProjectsShare of environment Projects
43
Decentralisation Analysis Cell (DAC)
Table 3.2: Expenditure on Environment Projects by all Grama Panchayats in Kerala
Year Number of Projects
Allocation(in Rs)
Expenditure(in Rs. )
Expenditure as percent of fund
allotted2011-12 2463 45,96,71,545 18,32,61,230 39.87
2012-13 4680 277,89,01,549 33,71,09,095 12.13
2013-14 4693 298,08,10,735 64,38,68,904 21.60Source: Sulekha data
Figure 3.4 Figure3.5
Expenditure of Environment Projects in Expenditure of Environment all G.Ps in Kerala 2011-12 Projects in all G.Ps in Kerala 2012-13
Figure 3.6:Expenditure of Environment Projects in all G.Ps in Kerala 2013-14
A comparison of utilization rate of funds for environment projects is made with
utilization of funds for all projects of G.Ps to examine whether low utilization is specific to
environment projects alone or is a malaise that applies to G.Ps in general. It reveals that
under utilization of funds is applicable to overall G.P funds with expenditure rate varying
from 50 to 63 percent in the three years under study (Table 3.3). However the rate of
utilisation in environment projects was much lower varying from 12 percent to 40 percent as
60.0 %
40.0%Unutilised Environment outlay
Expenditure
88.0%
12.0%Unutilised Environment outlay
Expenditure
78.5%
21.4%Unutilised Environment outlay
Expenditure
Figure 3.4 Figure 3.5 Expenditure on Environment Projects Expenditure on Environment Projectsin all G.Ps in Kerala 2011-12 in all G.Ps in Kerala 2012-13
Figure 3.6Expenditure on Environment Projects in all G.Ps in Kerala 2013-14
Figure 3.2 Figure 3.3Share of Environment Projects in Total Share of Environment Projects in Total Projects, all G.Ps in Kerala 2012-13 Projects, all G.Ps in Kerala 2013-14

15
Table 3.3:Utilisation Rates of Environment Projects vis a vis Utilisation of Total Funds- all Grama Panchayats in Kerala
Year Utilisation rate of environment projects
Utilisation rate of total G.P funds
2011-12 39.86 50.362012-13 12.13 53.232013-14 21.45 63.77
Source: Sulekha data
Table 3.4: Type of Environment Projects of all Grama Panchayats in Kerala, 2011-12Sl. No
Projects Number of projects
Allocation (in Rs)
Expenditure (in Rs)
Expendi-ture as % of fund allotted
Production sector1. Environment protection (Biodiver-
sity register preparation, bio waste management etc.)
477 48318748 20360741 42.14
2. Soil-water conservation (Minor ir-rigation, watershed programme, rain water harvesting and soil con-servation)
1986 411352797 162900489 39.60
Total Environment related projects 2463 459671545 183261230 39.86Source: Sulekha data
Figure 3.4 Figure 3.5 Expenditure on Environment Projects Expenditure on Environment Projectsin all G.Ps in Kerala 2011-12 in all G.Ps in Kerala 2012-13
in 2011-12 only 40 percent of the allocated amount was spent which declined drastically to a mere 12 percent in 2012-13 and was 21.45 percent in 2013-14 (Table 3.2 & fi gures 3.4, 3.5 and 3.6). Th e rest of the allocated fund was not utilized.
A comparison of utilization rate of funds for environment projects is made with utilization of funds for all projects of G.Ps to examine whether low utilization is specifi c to environment projects alone or is a malaise that applies to G.Ps in general. It reveals that under utilization of funds is applicable to overall G.P funds with expenditure rate varying from 50 to 63 percent in the three years under study (Table 3.3). However the rate of utilisation in environment projects was much lower varying from 12 percent to 40 percent as against the 50 to 63 percent in overall funds for all projects in these three years indicating worse performance in this sphere compared to the general scenario.
3.2. Nature of Projects for Environment Protection
Panchayats generally allocate fund to various projects
under three broad heads, namely production, infrastructure and service sectors, some of which are directly or indirectly related to the environment. Analysis of the nature and type of projects in these three sectors revealed that environment protection schemes are most oft en found under service category followed by a few schemes under the production category.
In 2011-12 environment projects were reported only in the production sector under the sub-headings, 1) environment protection and 2) soil-water conservation, as shown in Table 3.4. No projects were carried out either in service or infrastructure sector during this year. Th e fi rst sub-heading of environment protection which utilized 42 percent of outlay included projects for a) preparation of People’s Bio-diversity Register and b) implementing waste management programme. Th e second sub-heading of soil water conservation which spent 40 percent of allocation mainly included projects for minor irrigation, water shed programme and rain water harvesting and soil conservation. All these were implemented only through production sector in 2011-12.
In 2012-13, environment projects were implemented in
Performance of Grama Panchayats in Kerala in Environment Protection

16
Role of Grama Panchayats in Waste Management and Environment Protection
both production and service sectors but no projects were carried out in the infrastructure sector (Table 3.5).
Projects in the production sector are observed under slightly different sub headings compared to 2011-12 namely 1) energy generation and 2) soil-water conservation, environment, afforestation. Under the service sector, projects are reported under the sub-category of sanitation and waste processing. Actual expenditure on projects under the sub-headings of energy generation was 6.82 percent and that in soil-water conservation, environment, afforestation was 25.61 percent of allocation, while
sanitation and waste processing reflected a utilization rate of 12.13 percent of allocation.
In 2013-14, there was a sector wise improvement with environment projects being implemented under all the three functional categories- production, services and infrastructure (Table 3.6).
The sub-categories of a) soil-water conservation, environment, afforestation and b) sanitation and waste processing are implemented through all the three sectors in 2013-14 (Table 3.7)3 . Energy generation was included under production and service sectors only. Actual
Table 3.5: Type of Environment Projects of all Grama Panchayats in Kerala, 2012-13 Sl.
No.Projects Number of
projectsAllocation
(in Rs)Expenditure
(in Rs)Expenditure as percent of fund allotted
Production sector
1 Energy generation (Bio gas plant) 134 1242,65,355 84,75,549 6.82
2 Soil-water conservation,environment, afforestation
a Bio diversity register 321 22901597 6960288 30.39 b Water conservation 403 197696687 46853069 23.70 c Soil conservation 60 15361795 5123629 33.35 d Rain water harvesting 21 4036007 1897372 47.01 e Others 217 97211324 25522783 26.25
Total soil-water conservation, environment, afforestation 1022 33727410 86357141 25.61Service sector
3 Sanitation and waste processing a Solid & liquid waste manage-
ment 761 744378272 57103960 7.67 b Bio-gas 312 317935456 13598320 4.28
c Pipe compost/ring compost 225 238990850 2275450 0.95 d Sanitation 1538 595675943 105068457 17.64 e Crematorium/burials 316 223871985 37609272 16.80 f Others 372 196576278 26620946 13.54
Total sanitation and waste processing
3524 2317428784 242276405 10.45
Total environment related projects
4680 277,89,01,549 33,71,09,095 12.13
Source: Sulekha data
3 Such variation and lack of standardisation in sub category headings renders difficult precise comparative analysis, defeating one of the fundamental purposes of Sulekha data, namely, facilitating meaningful and comparative analysis of plan allocation and expenditure.

17
expenditure on projects under energy generation and soil-water conservation, environment, afforestation were 13.2 percent and 32 percent of allocation respectively while sanitation and waste processing reflected a utilization rate of 21 percent of allocation (Table 3.6).
In 2013-14, there were 104 energy generation projects, 815 soil water conservation and environment projects, and 3774 sanitation and waste processing projects. Majority (80 percent) of energy generation projects were devised under production category and the remaining (20 percent) through the service sector. Ninety five percent of
soil-water conservation, environment and afforestation projects have been visualised in production sector, 4 percent in infrastructure sector and very few in service sector. Sanitation and waste processing projects are mainly observed (95 percent) in service sector and the rest under production and infrastructure sectors (Table 3.7).
Comparison over the years reveals that in 2011-12 and 2012-13 soil- water conservation and environment, afforestation projects were implemented only in the production sector while in 2013-14, 95 percent of these projects were implemented in this sector. Sanitation and
Table 3.6: Type of Environment Projects of all Grama Panchayats in Kerala, 2013-14Sl No. Projects Number of
projectsAllocation
(in Rs.)Expenditure
(in Rs.)Expenditure as per-cent of fund allotted
1 Energy generation (bio gas plant)
104 89617117 11330307 13.20
2 Soil-water conserva-tion, environment, afforestation
a. Biodiversity register 314 22348918 9861372 44.12 b. Water conservation 257 145765644 42729181 29.31 c. Soil conservation 76 14383111 9882505 68.71 d. Rain water harvesting 22 8690327 1837111 21.14 e. Others 146 84302455 23807505 28.24
Total soil-water conserva-tion, environment, affor-estation
815 275490455 88117674 31.99
3 Sanitation and waste processing
a. Waste management 788 761718496 150017874 19.69 b. Bio-gas 525 495023712 62971895 12.72 c. Pipe compost/ ring
compost251 256925534 24207296 9.42
d. Sanitation 1612 650154997 183955197 28.29 e. Crematorium/burials 446 397273838 102833397 25.88 f. Others 152 54606586 19935264 36.51
Total sanitation and waste processing
3774 2615703163 543920923 20.79
Total environment related projects 4693 2980810735 643868904 21.60
Source: Sulekha data
Performance of Grama Panchayats in Kerala in Environment Protection

18
Role of Grama Panchayats in Waste Management and Environment Protection
waste management projects were observed only in service sector in 2012-13 while in 2013-14, 95 percent of these projects were observed in service sector. Thus only very small proportion of projects from both the categories was implemented through other sectors in 2013-14.
Analysis of quantum of fund allocation and type of projects under the various sub-categories revealed that in 2011-12, the first heading under production sector namely environment protection accounted for only 10 percent of total environment allocation. Projects under this sub-heading primarily consisted of preparation of people’s bio-diversity register apart from a few schemes related to solid waste management. G.Ps allocated 90 percent of its total environment related funds for the second sub-category namely soil- water conservation. Projects implemented under this category included minor irrigation works, watershed programmes, rain water harvesting, soil conservation activities etc. In 2012-13 and 2013-14, under the production sector category, the subcategory of energy generation mainly includes biogas plants while second sub category includes water conservation, soil conservation, rainwater harvesting and others.
Under water conservation, the Panchayats have
focused primarily on schemes for watershed management, construction and maintenance of bunds, maintenance and deepening of thodu etc. In soil conservation, site protection of SC colonies to prevent soil erosion, construction of kayyala for soil protection etc. is included. Few schemes for Western Ghats development program, SC colony protection, planting trees etc. have also been implemented by certain local bodies which has been clubbed together under the heading, others. During 2012-13 and 2013-14 preparation of people’s biodiversity registers is also observed. This involved preparing, with people’s participation, detailed bio-diversity registers profiling the local flora and fauna in the Panchayats.
Details of expenditure of funds vis- a- vis allotment under all the above sub-categories for the years 2012-13 and 2013-14 (only these two years were taken into account since comparative classification was available only for these) reflect the general trend of low utilization. Only rain water harvesting (47.01 percent) and soil conservation (33.35 percent) in 2012-13 and preparation of bio diversity register (44.12 percent) and soil conservation in 2013-14 reflected better utlisation with more than one third of the allocated funds being put to use. In all other cases
Table 3.7: Sector wise Allocation & Expenditure on Environment Projects by Grama Panchayats in Kerala, 2013-14
Sl.No
Projects Number of projects
Sector wise
projects %
Allocation (in Rs.)
Sector wise
alloca-tion %
Expenditure (in Rs.)
Expenditure as percent
of fund allotted
1 A) Energy generationInfrastructure 0 0 0 0 0 0Production 83 79.81 69337607 77.37 7732674 11.15Service 21 20.19 20279510 22.63 4097633 20.21Total A 104 100.00 89617117 100.0 11830307 13.20
2. B) soil-water conservation,environment, afforestationInfrastructure 31 3.80 6913347 2.51 4042956 58.48Production 775 95.09 265172404 96.25 81753874 30.83Service 9 1.11 3404704 1.24 2320844 68.17Total B 815 100 275490455 100.0 88117674 31.99
3. C) sanitation and waste processingInfrastructure 95 2.52 35870448 1.37 19251926 53.67Production 80 2.12 48021442 1.84 11461070 23.87Service 3599 95.36 2531811273 96.79 513207927 20.27Total C 3774 100 2615703163 100.0 543920923 20.79
Source: Sulekha data

19
utilization was less than one third of funds assigned.Other major projects are mainly observed under the
sub-heading sanitation & waste management which comes under service sector. This sub-category which is very crucial for environmental hygiene reflected very low utilization in both years under analysis reflecting 10.45 percent and 20.79 percent in 2012-13 and 2013-14 respectively. It includes varied schemes primarily related to sanitation, solid and liquid waste management, biogas, pipe compost and crematorium. Under the subcategory of sanitation, construction of toilets, comfort stations, etc. are included. Under solid and liquid waste management, Panchayats focused on cleaning public market places, allocation for the construction of solid waste plant, construction, maintenance and cleaning of drains, waste disposal system at source etc. Under the sub-heading of crematorium, Panchayats have allocated fund for purchase of land, construction and maintenance of crematorium for public and SC categories, providing modern infrastructure in the crematoriums, construction of protection wall etc. Implementation of various programmes like the mosquito control programme, construction and maintenance of slaughter houses etc. are included in the category of others. Among these, in terms of number of projects maximum number was observed under the sub-heading of sanitation and waste processing and schemes related to sanitation and crematorium reflected slightly better utilization of funds as compared to schemes for solid and liquid waste management, biogas as well as pipe compost.
3.3. SummaryThis chapter focused on assessment of performance
of G.Ps in environment protection activities based on an analysis of plan outlays and expenditures during the three year period 2011-12 to 2013-14. Data for the analysis was extracted from ‘Sulekha’ database maintained by the Information Kerala Mission (IKM) although it has been difficult to segregate relevant information due to absence of a detailed object based classification of expenditures. The analysis reveals that amounts set apart for environment projects was only one percent of total outlay in 2011-12 which increased to 6 percent in 2012-13 but declined to 5.23 percent in 2013-14. The situation is dismal when the pattern of actual expenditure of outlay is examined. In 2011-12, only 40 percent of the allocated amount was utilised which declined drastically to a mere 12 percent in 2012-13 and was 21.5 percent in 2013-14. While low utilization of funds is a malaise that is applicable to LGs in general, the utilization rate for environment projects was
much lower than overall fund utilization indicating worse performance in this sphere of activity.
Among the three heads of expenditure commonly followed by Panchayats for classification of their fund allocation and expenditure, projects relating to environment protection are most often found under service sector category followed by a few schemes under the production sector category. Only a few environment related projects are reported under the infrastructure sector category where the rate of fund utilisation as percent of allotted funds is generally better.
Environment projects under the production sector mainly relate to two sub-categories 1) energy generation and 2) soil and water conservation, environment, afforestation. The sub-category of energy generation mainly includes biogas plants while second sub-category includes water conservation, soil conservation, rainwater harvesting and others. Under water conservation, the G.Ps have devised schemes primarily for watershed management, construction and maintenance of bunds, maintenance and deepening of canals (thodu) etc. In soil conservation, side protection of SC colonies to prevent soil erosion, construction of Kayyala for soil protection etc. are included. Few schemes for Western Ghats development program, SC colony protection, planting trees etc., have also been implemented by certain local bodies. Another main scheme of preparation of biodiversity registers- is also included under production category.
Under service sector category, projects are mainly observed under the sub-heading sanitation and waste management. This sub category includes varied schemes primarily under the titles of a) sanitation, b) solid and liquid waste management, c) biogas, d) pipe compost and e) crematorium. The subcategory of sanitation, includes construction of toilets, comfort stations etc. Under solid and liquid waste management, Panchayats focused on cleaning public market places, construction of solid waste plant, construction, maintenance and cleaning of drainages, promoting waste disposal at source etc. Under the broad heading of crematorium, Panchayats have allocated fund for purchase of land, construction and maintenance of crematorium for public and SC categories, providing modern infrastructure in the crematoriums, construction of protection wall, etc. Among these, maximum number of projects were implemented under the heading of sanitation and the two subheadings of sanitation and crematorium reflected slightly better utilization of funds while the headings of solid and liquid waste management, biogas as well as pipe compost revealed very low utilisation rates.
Performance of Grama Panchayats in Kerala in Environment Protection

20
Role of Grama Panchayats in Waste Management and Environment Protection
Performance of SampleGrama Panchayats
Analysis of funds allotted for environment protection activities in Panchayats as a whole in Kerala having revealed very low utilization, a
case study of four sample Panchayats was done so as to examine plausible reasons for this and identify hurdles faced in implementation of such projects. The local bodies selected for such detailed study include two lowland G.Ps- Ezhikkara in Ernakulam district – lowland with urban proximity and Kanjiramkulam- in Thiruvananthapuram district – lowland without urban proximity. Corresponding highland G.Ps were Marutharode in Palakkad district (with urban proximity) and Nenmeni in Wayanad district (without urban proximity). Performance of these four Panchayats in environment protection activities is analysed through examination of 1) allotment, utilization of funds for environment projects and a detailed analysis of type of projects undertaken in this connection 2) role of MGNREGS in environment conservation 3) use of bio diversity registers 4) use of natural resource maps and 5) performance of functions assigned under KPR Act 1994. Thus the chapter consists of seven sections- first section profiles the socio- economic and demographic characteristics of the four sample Panchayats, second – analyses the allocation vis- a- vis utilization of plan funds for environment projects, examines the type of projects undertaken in this context and probes reasons for underutilization of allocated funds. Third section evaluates the environment related activities undertaken by Panchayats as a part of the central govt.
sponsored scheme MGNREGS. Fourth section examines the total fund utilised for environment protection in sample Panchayats which includes aggregate of both plan funds and MGNREGS funds and makes a comparative analysis of these two. Initiative of sample Panchayats in bio diversity conservation is analysed in the fifth section while use of resource maps is briefly examined in section six. The last evaluates performance of sample G.Ps in environment related functions as specified in KPR Act 1994.
4.1. General ScenarioThis section profiles the location, regional specificities,
major institutions and demographic details of the sample G.Ps.
EzhikkaraEzhikkara G.P is located in the Paravoor Taluk of
Ernakulam district. Occupying a total area of 15.27 sq km, and having 14 wards, Ezhikkara shares boundaries with Paravoor Municipality, Pallippuram and Chittattukara G.Ps in the north, Kadamakkudi, Nayarambalam and Varappuzha G.Ps in the south, Kottuvally, Varappuzha G.Ps and Paravoor Municipality in the east and Nayarambalam, Pallippuram, Edavanakkadu G.Ps in the west. Geographically, a low coastal land with backwaters, lakes, river and small canals4 (most of which reportedly have a high saline content5 ) it is famous for its ‘pokkali’ rice cultivation and prawn farms6 . Majority of the population
4 The main canals in the Panchayat are Puthenthodu, Ambathodu, Kuriyathodu, Kundekkavuthodu, and the primary lake is Kottuvally. 5 Salinity of water is a common issue stated by residents in the area. Inference drawn from primary survey conducted among households in Ezhikkara. Household Survey Schedule used for primary survey appended.6 The Pokkali field is a unique eco-system based on the symbiotic relation between rice and prawn cultivation. Rice is cultivated during June-October when water salinity is at its lowest; in November-April, when salinity reaches high levels, farmers resort to traditional prawn farming. This shifting cultivation is self sustaining with the prawns feeding on the remnants of the paddy and inturn providing manure to the soil for the next round of cultivation. However in recent times, citing a shortage of workers to harvest the paddy, many pokkali farmers are now choosing either to leave the land fallow or use for year-round prawn cultivation. The agri-cultural workers, in turn, are complaining that this practice is robbing them of their livelihood. (The Hindu, July 7, 2006).

21
depend on agriculture, fishing and construction work for their livelihood. Ezhikkara is thus a quintessential Kerala village bestowed with a serene natural beauty which needs to be preserved for future generations. Having acquired the status as ‘an inland fishing village’, and also been awarded the Nirmal Gram Puraskar in 2008, the village of Ezhikkara does have a significant bearing in the state. The village, despite being one of picturesque landscapes in the state appears relatively less affected by excessive commercialisation.
With regard to institutions, the Panchayat has one higher secondary school, 5 middle/ primary schools, one un-aided arts & science college, one nursery school, 19 anganwadi institutions, one community health centre, 2 private clinics, 2 Ayurveda/ homoeopathy hospitals, 2 clinical laboratories/ medical stores within its area. The G.P has one play ground but no market. It also does not have a crematorium, dump yard or waste treatment plant (Table 4.1).
KanjiramkulamKanjiramkulam G.P is located in Neyyattinkara Taluk
of Thiruvananthapuram district. It has an area of 10.36 square kilometers, and has 14 wards. The boundaries of Kanjiramkulam G.P are Athiyannoor, Kottukal, Thiruppuram and Karumkulam G.Ps. The major occupation of the people in this Panchayat is agriculture and livestock rearing. Geographically, Kanjiramkulam is a low land area. The lake- Karichalkaayal is near to Kanjiramkulam but is located under the area of nearest G.P, Kottukal. Kanjiramkulam G.P has only one irrigation canal, one thodu and a few ponds. The majority of the area has red or sandy soil. There is also high level of soil erosion in some sloppy areas particularly during the rainy season. The Panchayat has no urban proximity. The nearest town is Neyyattinkara Municipality, and the distance from the Panchayat to town is 9 kms.
In education and health sectors, the Panchayat has many institutions to cater to the needs of the people. It has one government arts and science college, 4 higher secondary schools, 7 high schools, 5 primary/ middle schools, 4 computer training institutes, 2 technical institutes including one government industrial training institute for SC community, one primary health centre, homeopathic dispensary, ayurveda dispensary, sidha hospital under NRHM scheme, one famous ayurveda marma hospital, 4 private clinics, 18 anganwadis and 9 nurseries. The marma hospital attracts people from other parts of Kerala. There is one public market in Kanjiramkulam, functioning under the control of G.P and one playground. Kanjiramkulam G.P has no slaughter house, waste treatment plant or
crematorium (Table 4.1).Marutharode
Marutharode G.P is situated in Malampuzha block of Palakkad Taluk in Palakkad district. The Panchayat which is spread over 19.68 sq.km has very close boundary to Palakkad Municipality, shared boundaries with Malampuzha, Puthusserry, Elappully, and Kodumbu G.Ps and Korayaar River. The Panchayat has 19 wards and the major occupation of the people is agriculture. Development activities for paddy cultivation are being implemented through paadasekharasamitis. Increasing growth of residential colonies and new buildings due to urban proximity with Palakkad Municipality is also seen here.
On the institutional front, there are 2 higher secondary schools, 2 secondary schools, 5 primary/ middle schools, 30 anganwadis, one primary health centre, 2 private clinics and other dispensaries. The G.P has one play ground and two crematoriums but no slaughter house or waste treatment plant (Table 4.1).
NenmeniNenmeni G.P is situated in Sultan Bathery Block of
Sultan Bathery Taluk in Wayanad district. The Panchayat has an area of 69.38 sq.kms spread over Nenmeni and Cheeral villages, situated near Western Ghats and shares its boundaries with Tamilnadu state. Besides this, it also shares its boundaries with Sultan Bathery, Noolpuzha, Ambalavayal G.Ps. It has 23 wards and the famous world heritage centre Edakkal Cave is situated in Ambukuthi hill of this Panchayat which is 4000 ft above the sea level. Inside the caves are pictorial writings believed to date to at least 6000 BC indicating the presence of pre-historic civilization in this region. The stone age carvings of Edakkal cave are rare in South India and have historical and cultural significance. The village has a good presence of tribal people who account for 17 percent of the total population. Major occupation of the people is agriculture and allied activities. Coffee, areca nut, tea, ginger and paddy are the major crops being cultivated amongst which paddy cultivation is witnessing a declining trend. MGNREGS is being successfully implemented and is integrated with agriculture which in turn is contributing to its development.
Due to its large size, Nenmeni G.P also has the greatest number of institutions among the sample G.Ps with 50 anganwadis, 12 primary/ middle schools, 4 secondary schools and two higher secondary schools, 3 training institutes in the education sector, many hospitals including 2 primary health centres, 2 Government hospitals, 5 ayurveda/ homeo/ unani hospitals, and supporting clinical laboratories. Nenmeni G.P is the only sample G.P which
Performance of Sample Grama Panchayats

22
Role of Grama Panchayats in Waste Management and Environment Protection
has a slaughter house. The G.P also has 4 play grounds and 6 crematoriums (Table 4.1).
Thus all the sample G.Ps have basic infrastructural institutional facilities in the education and health sector. Of these, Nenmeni is the only G.P having slaughter house, Marutharode and Nenmeni the highland G.Ps only have crematorium, public market exists only in Kanjiramkulam while community health centre is present only in Ezhikkara G.P. There is no waste treatment plant or dump yard in any of the sample G.Ps. Regarding physical infrastructure, all G.Ps have access to electricity and public taps, have black surface road, concrete road, metal road, kutcha road etc.
4.1.1. Socio-Demographic ProfileThe largest G.P, area wise, being Nenmeni (69.38 sq.km),
is also the most populated one (with 11330 households and 46950 persons) followed by Marutharode (8268 households and 34627persons), Kanjiramkulam (4919 households and 21989 persons) and the least populated, Ezhikkara (4536 households and 18019 persons). Density of population which has also got great bearing on waste generation is highest in Kanjiramkulam (1817 per sq km) followed by Marutharode (1760), Ezhikkara (1180), and Nenmeni with the lowest density (677 people per square kilometre).
Ezhikkara has the highest sex ratio (1051), literacy rate (95.9 percent), and scheduled caste population ratio compared to other sample G.Ps. The second highest sex ratio is in Nenmeni (1047) and is more or less same in Marutharode and Kanjiramkulam. Kanjiramkulam has the second highest literacy rate (92.12 percent) followed by Nenmeni
Table: 4.1: Infrastructure Facilities of Sample G.PsSl.No
Infrastructure Facilities Ezhikkara Kanjiram-kulam
Marutharode Nenmeni
1. Anganwadi 19 18 30 502. Nursery 1 9 - 123. Primary/Middle Schools 5 5 5 124. High schools 0 7 -5. Secondary without middle/primary 0 - 2 -6. Secondary with middle/primary 0 1 - 47. Higher secondary with no other levels 0 1 - 18. Higher secondary with secondary level
only1 0 2 -
9. Higher secondary with all lower levels - 3 - 110. Computer training institutes - 4 - 111. Other technical training institutes - 2 1 212. Primary health centre - 1 1 213. Community health centre 1 - - -14. Government hospital - - 215. Private clinic 2 4 2 -16. Private hospital - - - -17. Ayurveda/unani/homeopathy hospitals 2 4 1 518. Clinical laboratories/ medical stores 2 9 6 519. Markets - 1 - -20. Playground/stadium 1 1 1 421. Protected dump yard - - - -22. Open dump yard - - - -23. Slaughter houses - - 124. Crematorium - 2 625. Waste treatment plant - - -

23
(89.7 percent). The lowest literacy rate is in Marutharode (87.64 percent). In the case of Scheduled Caste population ratio, Marutharode is second followed by Kanjiramkulam and then Nenmeni. Highest scheduled tribe population is observed in Nenmeni whereas there is only a nominal presence of Scheduled Tribes in other G.Ps (Table 4.2).
4.2. Allocation and Utilisation of Plan Funds for Environment Projects
In this section the pattern of allocation and expenditure on environment projects by sample G.Ps is analysed for three years 2011-2014.
4.2.1 Allocation of Funds Sulekha data reveals total allocation of funds in all four
sample G.Ps and share of funds for environment projects for the years 2011-12, 2012-13 and 2013-14. In 2011-12, allocation for environment protection by all sample G.Ps was very meagre (Table 4.3). In Ezhikkara no environment related activity has taken place out of plan funds in that year. In 2012-13 and 2013-14 increase in allocation for environment protection projects was recorded in all sample G.Ps with highest allocation being made by Marutharode G.P with 21.45 percent of total in 2012-13 and 22.14 percent
in 2013-14. Kanjiramkulam G.P. allocated 13.71 percent in 2012-13 followed by Ezhikkara with 10.81 percent.
In 2013-14, Ezhikkara G.P. allocated 10.98 percent followed by Kanjiramkulam G.P whose allocation decreased to 8.19 percent. Nenmeni G.P, the biggest G.P in terms of land, total population and total funds has the lowest allocation for environment related projects among the sample G.Ps for all three years. It was 0.03 percent in 2011-12, 1.38 percent in 2012-13 and increased to 4.43 percent in the last year (Table: 4.3).
A comparison of the allocation trend in sample G.Ps with that among all G.Ps in the entire state shows a similar pattern in 2011-12 with very little allocation, less than one percent allocation in all (Figure 4.1). In 2012-13 and 2013-14 all the sample G.Ps except Nenmeni recorded higher allocation compared to the state average of 6 percent in 2012-13 and 5.23 percent in 2013-14 (Figure 4.1)7 . Thus the scenario in these sample G.Ps can be reasonably expected to represent a better picture than the average scenario in the state.
4.2.2. Utilisation of FundsThis section analyses the expenditure/ utilization rate of
funds for entire projects as well as environment projects in the sample G.Ps. The rate of utilization of total funds varies
Table: 4.2: Socio-Demographic Profile of Sample G.PsSl.No Indicators Ezhikkara Kanjiramkulam Marutharode Nenmeni
1. Area(Sq.kms) 15.27 10.36 19.68 69.382. Population 18019 21989 34627 46950
Male 8784 10870 17075 22929Female 9235 11119 17552 24021
3. Scheduled Castepopulation ratio
20.25 8.02 13.93 3.97
4. Scheduled Tribepopulation ratio
0.26 0.09 0.34 16.76
5. Number of households
4536 4919 8268 11330
6. Sex ratio 1051 1026 1027 10477. Literacy rate 95.90 92.12 87.64 89.708. Density of
population 1180 1817 1760 677
Source: 2011 Census
7 The allocation pattern of all G.Ps in the state is explained in chapter 3. The comparison of sample G.Ps with state average is made on the basis of values mentioned there.
Performance of Sample Grama Panchayats

24
Role of Grama Panchayats in Waste Management and Environment Protection
between different G.Ps as well as within same G.P over the years. However a consistent trend between the G.Ps is observed with Kanjiramkulam G.P recording highest utilization in all three years (82 percent, 64 percent, 79 percent respectively), (Table 4.4) followed by Ezhikkara G.P (60 percent, 53 percent, 69 percent respectively) and then Marutharode G.P (43 percent, 50 percent, 67 percent respectively). Nenmeni exhibits lowest
utilization of total funds in all the three years with utilization being 19 percent, 23 percent and 62 percent respectively. The general utilization trend shows that more than half of its outlay is utilized in the sample G.Ps except Nenmeni in the first two years under study and except Marutharode in 2011-12 (Table 4.4). This was not the situation in the case of utilisation rate of funds allotted for environment projects.
Figure: 4.1Allocation of Funds for Environment Projects by Sample G.Ps vis a vis all G.Ps in Kerala
Table: 4.3: Allocation of Funds for Environment Projects in Sample G.PsYear & Sample G.Ps Allocated fund for all
projectsAllocation for
environment projectsFund for environment projects as percent of
total funds
2011-12Ezhikkara 2,75,11,437 Nil 0Kanjiramkulam 2,45,79,537 55,000 0.22Marutharode 4,66,52,351 58,115 0.12Nenmeni 21,34,83,873 70,000 0.032012-13Ezhikkara 2,92,79,625 31,66,825 10.81Kanjiramkulam 2,89,10,303 39,66,400 13.71Marutharode 5,86,27,845 1,25,80,200 21.45Nenmeni 18,52,77,840 25,70,680 1.382013-14Ezhikkara 3,55,77,710 39,06,632 10.98Kanjiramkulam 3,12,98,947 25,66,100 8.19Marutharode 6,57,62,463 1,45,59,124 22.14Nenmeni 13,37,78,987 59,32,500 4.43
Source: Sulekha data

25
Except for Kanjiramkulam and Nenmeni in 2011-12, utilization of fun ds allotted for environment projects was very low in all the four sample G.Ps. The higher rate of utilization in 2011-12 can be attributed to two main factors 1) very low allocation of funds as such for environment projects in all G.Ps so that even low expenditure in absolute terms results in a higher utilization rate and 2) preparation of bio diversity register in all Panchayats except Ezhikkara in 2011-12. There was no other environment related projects in this year. Since Ezhikkara G.P. had not prepared biodiversity register in the prescribed manner expenditure is zero. In Kanjiramkulam, of the Rs.55000, Rs.50400 (91.63 percent) was spent for preparation of bio diversity register. In Marutharode G.P, of the Rs.58115, only 23.2 percent was spent. In Nenmeni, the outlay of Rs.70000 is fully utilized in 2011-12.
In 2012-13, Ezhikkara G.P utilised only 1.29 percent of its outlay and Nenmeni utilized 6.54 percent while Marutharode and Kanjiramkulam G.Ps did not spend anything from the allocated amount. In 2013-14, Ezhikkara spent only 10.13 percent, Kanjiramkulam and Marutharode recorded an increase in utilisation to 17 percent and 22 percent respectively (Table: 4.4). Nenmeni registered a decrease in fund utilisation in this year (2.47 percent). Thus
funds allotted for environment protection is hardly utilised and funds remained largely unspent. This shows that there is no serious action for environment protection in the G.Ps.
Figure 4.2 brings out the comparative analysis in utilization of funds of all Panchayats in the state vis-a-vis sample G.Ps8 . General rate of utilsation of funds for environment related projects is low at state level as well as in sample G.Ps under study. The only exception is utilisation in Kanjiramkulam G.P in 2011-12 where utilization level was over 90 percent. Here as we have seen, the entire funds were allotted and utilized for one specific purpose namely preparation of bio diversity registers. In fact 2011-12 was the year in which many local bodies engaged in the preparation of bio diversity register and that could also partly explain the higher utilization of nearly 40 percent at the state level in that year. The state wise utilization in other years was extremely low being 12.13 percent in 2012-13 and 21.58 percent in 2013-14.
In 2012-13 all our sample G.Ps had lower utilitsation rate of funds for environment related projects as compared to all the G.Ps in the state. In 2013-14, Marutharode recorded slightly higher utilisation compared to the state level while Ezhikkara, Kanjiramkulam and Nenmeni G.Ps registered
Table: 4.4: Expenditure for Environment Projects in Sample G.PsYear& sample G.Ps Expenditure of all
projectsExpenditure as percent
of allocation (all projects)
Expenditure of environment
projects
Expenditure as percent
of allocation (environment
projects)
2011-12Ezhikkara 1,65,57,476 60.18 0 0.0Kanjiramkulam 2,00,34,197 81.51 50,400 91.63Marutharode 2,00,96,511 43.08 13,484 23.20Nenmeni 3,96,11,451 18.55 70,000 100.002012-13Ezhikkara 1,54,31,763 52.70 40,900 1.29Kanjiramkulam 1,85,79,848 64.27 0 0Marutharode 2,94,95,861 50.31 0 0Nenmeni 4,33,58,284 23.40 168180 6.542013-14Ezhikkara 2,46,36,692 69.25 3,96,000 10.13Kanjiramkulam 2,46,51,495 78.76 4,34,179 16.92Marutharode 4,31,34,471 66.60 31,61,642 21.71Nenmeni 8,22,94,776 61.51 1,46,640 2.47
Source: Sulekha data
8The expenditure picture of all G.Ps in the state is explained in the chapter 3. Comparison of sample G.Ps with state average is made based on values mentioned there.
Performance of Sample Grama Panchayats

26
Role of Grama Panchayats in Waste Management and Environment Protection
lower rates. However what is common in both state as well as sample G.Ps is low utilisation of funds in environment projects as compared to overall fund utilisation.
4.2.3 Project-wise Pattern of ExpenditureAnalysis of project wise expenditure reveals the type
of projects formulated and implemented for environment protection in each sample G.P during previous three years. In Ezhikkara G.P, while no project was formulated in 2011-12, in the next year the Panchayat devised schemes to construct toilets, crematorium for S.C. communities, bio gas plants in individual households and implement total sanitation
programme. Out of this, some, albeit low, utilization was observed only in total sanitation programme (15 percent of outlay) while allocated amount for all other projects was unspent due to several reasons leading to overall abysmal utilisation rate of 1.3 percent. In 2013-14 the type of projects devised were more or less similar to that of previous year with the only additional scheme being that for construction of protection wall in house plots of SC households under the sub-category of soil water conservation. Th e main reason for such similarity was carry over of unutilized funds/projects to the successive year. Th e trend of low overall utilization of funds for environment projects continued in 2013-14 also at
Table: 4.5: Allocation and Expenditure of Funds for Environment Projects in Ezhikkara G.P.Sl. No. & Year Projects Allocated amount Expenditure Percent
2012-131. Toilets 6,50,000 0 02. Crematorium SC 5,10,000 0 0
3. Bio gas plant 17,40,000 0 04. (Nirmal Puraskar) total sanitation pro-
gramme2,66,825 40,900 15.3
Total sanitation & waste processing 31,66,825 40,900 1.32013-141. Energy generation (biogasplant) 10,96,500 1,87,000 17.02. Soil-water conservation (construction of
protection wall in house plot (SC) 10,71,207 25,000 2.3
3. Toilets 10,03,000 1,84,000 18.34. Crematorium SC 5,10,000 0 0
Total sanitation programme (Nirmal Puraskar) 2,25,925 0 0Total sanitation & waste processing 39,06,632 3,96,000 10.1
Source: Sulekha data
61
Decentralisation Analysis Cell (DAC)
partly explain the higher utilization of nearly 40 percent at the state level in that year. The
state wise utilization in other years was extremely low being 12.13 percent in 2012-13 and
21.58 percent in 2013-14.
In 2012-13 all our sample G.Ps had lower utilitsation rate of funds for environment
related projects as compared to all the G.Ps in the state. In 2013-14, Marutharode recorded
slightly higher utilisation compared to the state level while Ezhikkara, Kanjiramkulam and
Nenmeni G.Ps registered lower rates. However what is common in both state as well as
sample G.Ps is low utilisation of funds in environment projects as compared to overall fund
utilisation.
Figure: 4.2Expenditure pattern of environment projects in sample GPs vis- a- vis all GPs in Kerala
4.2.3 Project Wise Pattern of Expenditure
Analysis of project wise expenditure reveals the type of projects formulated and
implemented for environment protection in each sample G.P during previous three years. In
Ezhikkara G.P, while no project was formulated in 2011-12, in the next year the Panchayat
devised schemes to construct toilets, crematorium for S.C. communities, bio gas plants in
individual households and implement total sanitation programme. Out of this, some, albeit
low, utilization was observed only in total sanitation programme (15 percent of outlay) while
allocated amount for all other projects was unspent due to several reasons leading to overall
abysmal utilisation rate of 1.3 percent. In 2013-14 the type of projects devised were more or
less similar to that of previous year with the only additional scheme being that for
construction of protection wall in house plots of SC households under the sub-category of soil
water conservation. The main reason for such similarity was carry over of unutilized funds/
projects to the successive year. The trend of low overall utilization of funds for environment
0
20
40
60
80
100
2011-12 2012-13 2013-14
0 1.2910.13
91.63
0
16.9223.2
0
21.71
100
6.542.47
39.86
12.1321.58
Ezhikkara Kanjiramkulam Marutharode Nenmeni Kerala
Figure: 4.2Expenditure on environment projects in sample G.Ps vis- a- vis all G.Ps in Kerala

27
10 percent. In the case of toilet construction, utilization rate was 18 percent, biogas plant- 17 per cent and construction of protection wall 2 percent while it was nil in the case of crematorium for SC and total sanitation programme (Table 4.5).
Th e G.P authorities cited various problems in utilization of funds. In the case of crematorium, it was reported to be lack of accessibility of road to the project site with people being unwilling to surrender land for this purpose. In the case of biogas units it was stated to be delay in getting technical sanction and unwillingness of people to give the benefi ciary contribution. In the case of sanitation projects, benefi ciaries had to fi rst advance funds to construct latrine facilities and would later be reimbursed the amount prescribed under the scheme guidelines. Such prescribed amounts were oft en inadequate compared to actual cost. Necessity to upfront the expense as well as inadequacy of the actual allotted amount resulted in lack of interest by people in availing these projects which in turn led to low utilisation rates.
In Kanjiramkulam G.P, almost the entire amount in 2011-12 was allotted under one heading of environment protection and was used for a single purpose namely preparation of People’s Biodiversity Register which led to a high utilization
rate. In 2012-13, projects were formulated for construction of a solid waste plant at Kanjiramkulam public market and biogas plants and toilets in households of which nothing was spent (Table 4.6). In 2013-14, similar schemes were devised along with an additional scheme for maintenance of toilet in the public market. Of these, the G.P could spend the full amount of outlay only in the case of Asraya toilets and maintenance of toilets in public market.
Th e reason stated for non utlisation of funds allotted for construction of a solid waste plant at Kanjiramkulam public market was unwillingness of anyone to off er a tender in both the years which led to abandoning of the project. In the case of biogas plant in houses, initially in 2012-13, no agency was ready to supply bio gas units. In the next year an agency- Bio-Tech came forward to supply units but unwillingness of people to give benefi ciary contribution and lack of belief in long run sustainability of composting models led to low offt ake. In the case of toilet construction, zero utilization in 2012-13 was due to delay in starting the project in that year which led to spill over to the successive year where it was utilized.
In Marutharode G.P, preparation of People’s Bio diversity Register was the only project in 2011-12 which revealed 23 percent utilization rate. Construction of electric crematorium at Chandranagar, latrine units for households, latrine construction for S.C.women and Malinya Samskaranam
Table: 4.6: Allocation and Expenditure of Funds for Environment Projects in Kanjiramkulam G.P.Sl. No. &Year
Projects Allocated amount
Expenditure Percent
2011-121. Environmental protection ( prepara-
tion of PBR)55,000 50,400 91.6
2012-131. Construction of a solid waste plant
at Kanjiramkulam public market.3,00,000 0 0
2. Waste management plant in houses (bio gas)
33,62,400 0 0
3. Individual toilet construction. 3,04,000 0 0Total sanitation & waste processing 39,66,400 0 0
2013-141. Asraya toilets 2,08,000 2,08,000 100.02. Construction of a solid waste plant at
Kanjiramkulam public market3,00,000 0 0.0
3. Waste management plant in houses (bio gas)
19,97,500 1,65,579 8.29
4. Maintenance of public market toilet at Kanjiramkulam
60,600 60,600 100.0
Total sanitation & waste processing 25,66,100 4,34,179 16.02Source: Sulekha data
Performance of Sample Grama Panchayats

28
Role of Grama Panchayats in Waste Management and Environment Protection
(waste management) were the projects formulated in 2012-13 out of which nothing was spent, reflecting a pattern similar to that in Kanjiramkulam in the same year (Table 4.7). In the next year, 2013-14, funds were again allotted for these projects. Construction of graveyard compound wall and renovation of electric crematorium were the other projects in this year. While some of the above projects reflected high utilization, Malinya Samskaranam, construction of individual toilets and electric crematorium had low utilization rate.
In Nenmeni G.P, again People’s Bio diversity Register was the only environment related project in 2011-12 and amount allotted was fully spent. In 2012-13 again 100 percent utilization was observed for the project for preparing watershed master plan under the heading of soil and water conservation (Table 4.8). Under sanitation, waste processing category projects were devised for construction of protection wall for burial ground, toilet facilities for E.M.S. housing scheme beneficiaries, solid
waste management in households. Very little of allocation (1.23 percent) was used for toilet project and no money was spent for other projects. In the next year installation of pipe compost units, portable biogas plants and construction of toilets for ITI were the additional projects besides the same as in previous year. Among all these while limited funds were spent for pipe compost units (11 percent of outlay), nothing was utilized for other projects proposed resulting in overall low utilization rate of 2.47 percent of total funds allotted for environment projects.
The reasons stated for non- utilization of funds for burial ground protection wall was insufficiency of funds while for construction of toilets, it was incompletion of house construction by beneficiaries. Unavailability of suitable land for constructing waste management plant was stated to be the reason for non-utilization of funds allotted for solid waste management while delay in getting technical sanction was reported to be the reason
Table: 4.7: Allocation and Expenditure of Funds for Environment Projects in Marutharode G.P.Sl. No. &
YearProjects Allocated
amountExpenditure Percent
2011-121. Environmental protection (prepara-
tion of PBR)58115 13484 23.20
2012-131. Construction of electric crematorium,
Chandranagar.9600000 0
2. Sanitary latrine unit (individual) 1000000 03. Latrine construction (woman SC) 50000 04. Malinya samskaranam 1930200 0
Total sanitation & waste processing 12580200 0 0.002013-141. Chennikkadu graveyard
compound wall434193 434193 100.00
2. Nerukakkadu graveyard compound wall
369731 366783 99.20
3. Chandranagar electrical crematorium renovation
800000 800000 100.00
4. Purchase of soil for crematorium 276500 276500 100.005. Construction of electric
crematorium Chandranagar9600000 1230166 12.81
6. Sanitary unit (individual) 1000000 54000 5.407. Malinya samskaranam 1930200 0 0.008. Electric crematorium 148500 0 0.00
Total sanitation & waste processing 1,45,59,124 31,61,642 21.71Source: Sulekha data

29
in the case of biogas plants.The analysis of these four cases revealed that utilization
of allotted funds for environment related projects are appallingly low-and much worse than utilization of overall funds. This indicates that G.Ps are not giving sufficient importance to protection of the environment by following up and ensuring implementation of projects devised for the same. It also throws up some plausible reasons for low utilization namely unwillingness of agencies to give quotation/ tender for Panchayat projects, land acquisition and asset issues, limited sanctioned fund against actual expense of beneficiaries, necessity of advancing expenses, unwillingness of people to give beneficiary contribution, delay in getting technical and other sanctions from government departments and delay in preparation of beneficiary list.
4.3. Environment Protection and MGNREGS This section analyses the activities related to MGNREGS
(a Central Government sponsored scheme whose primary aim is to guarantee employment for people in rural areas and auxiliary aim is to strengthen natural resource management through works that address causes of poverty like drought, deforestation, soil erosion etc). NREGA- the act underlying MGNREGS has been described by M. S. Swaminathan as the worlds largest ecological security program which can successfully strengthen the ecological foundations for sustainable agriculture (as cited in Nair K.N. 2009). Hence to get a comprehensive picture of the environment related performance of Panchayats, works undertaken in MGNREGS are also examined in the four sample Panchayats for the three years- 2011-12 to 2013-14. The analysis revealed that most of the works undertaken in MGNREGS in sample Panchayats are related to flood
Table: 4.8: Allocation and Expenditure of Funds for Environment Projects in Nenmeni G.PSl.No. &
YearProjects Allocated
amountExpenditure Percent
2011-121. Environment protection (preparation
of PBR)70,000 70,000 70,000
2012-131. A) soil water conservation
(Watershed master plan)138180 138180 100.0
2. Protection wall for burial ground 50000 0 03. E.M.S.Housing scheme beneficiaries-
toilet facility1882500 30000 1.59
4. Solid waste management 500000 0 05. B)total sanitation waste
Processing (2+3+4)2432500 30000 1.23
Total (a+b) 2570680 168180 6.52013-141. Protection wall for burial ground 50000 0 02. Solid waste management 500000 0 03. E.M.S.Housing scheme beneficiaries
-toilet facility1852500 0 0
4. Installation of pipe compost units 1332000 146640 11.015. Treatment of waste - portable biogas
plant1998000 0 0
6. Chulliyode ITI toilet construction 200000 0 0Sanitation waste processing 5932500 146640 2.47
Source: Sulekha data
Performance of Sample Grama Panchayats

30
Role of Grama Panchayats in Waste Management and Environment Protection
Table: 4.9:Expenditure for Environment Projects under MGNREGS-Ezhikkara Panchayat (Rs in Lakhs)Year Expenditure of environment
project under MGNREGSExpenditure of total
projects under MGNREGSExpenditure of environment project as percentage of total
MGNREGS expenditure
2011-12 16.40 84.75 19.352012-13 11.46 102.65 11.172013-14 42.97 64.41 66.71Total 70.83 251.81 28.13
Source: Panchayat records and NREGA web site
Table: 4.10: Expenditure on Different types of Environment Projects under MGNREGS-Ezhikkara Panchayat (In Rs. Lakhs)
Sl.No. Projects 2011-12 2012-13 2013-14 Total
1. Flood control and protection 1.60 (1.88)
0 0 1.60 (0.63)
2. Drought proofing/afforestation 0 2.99 (2.90)
0 2.99 (1.18)
3. Water conservation and water harvesting
0 0 19.74 (30.64)
19.74 (7.84)
4. Renovation of traditional water bodies 14.80 (17.46)
8.47 (8.26)
23.23 (36.06)
46.50 (18.47)
Total 16. 40 (19.34)
11.46 (11.46)
42.97 (66.71)
70.83 (28.12)
Source: Panchayat records and NREGA web site *Figures in brackets are percentages of expenditure calculated from the expenditure of total MGNREGS projects per year.
control and protection, land development, micro irrigation, water conservation and water harvesting, renovation of traditional water bodies etc. which promote environment protection. Drainage cleaning, agricultural works on individual land, irrigation related works, cleaning of thodu (the natural water stream system) and canals, cleaning of ponds and other water bodies are some of the projects generally included under these major categories. The actual work implemented in each sample G.P was found to vary slightly based on geographical layout and local needs.
EzhikkaraThe MGNREGS in Ezhikkara G.P. is active and majority
of works undertaken are on individual lands for vegetable cultivation and other agricultural purposes, works on pokkali paddy fields, deepening and cleaning of thodu and canals, soil protection works etc. Ezhikkara G.P. we have seen is a low land with canals, thodu, lakes and therefore the cleaning and protection of these are important which is being done mostly through this scheme. Some afforestation activities have also been done by the MGNREGS. The total expenditure of MGNREGS increased from 2011-12 to 2012-13 and decreased in 2013-14. The percentage of
expenditure for environment protection works shows a decrease from 2011-12 to next year and then increased in 2013-14. Out of the total expenditure of all projects under MGNREGS for the last three years, 28 percent was incurred for environment projects.
The data reveals that in 2011-12, Rs 84.75 lakh was spent on MGNREGS in the Panchayat, out of which only 19.35 percent was utilised for environment works of flood control and renovation of traditional water bodies (Table 4.9 & 4.10). Among these two projects,the major share of expenditure was for renovation of water bodies. In 2012-13, major portion of funds under MGNREGS were utilized for agriculture related works including work on pokkali paddy fields and the share of environment projects decreased to 11.17 percent. Out of the total expenditure of 11.46 lakhs, Rs 2.9 lakh was spent for afforestation activities and Rs 8.47 lakh spent for the renovation of traditional water bodies which included deepening and cleaning works of thodu and canals (Table 4.10).
In 2013-14, the total expenditure of MGNREGS drastically decreased compared to the previous year and was only Rs. 64.41 lakh as compared to Rs 102.65 lakhs,
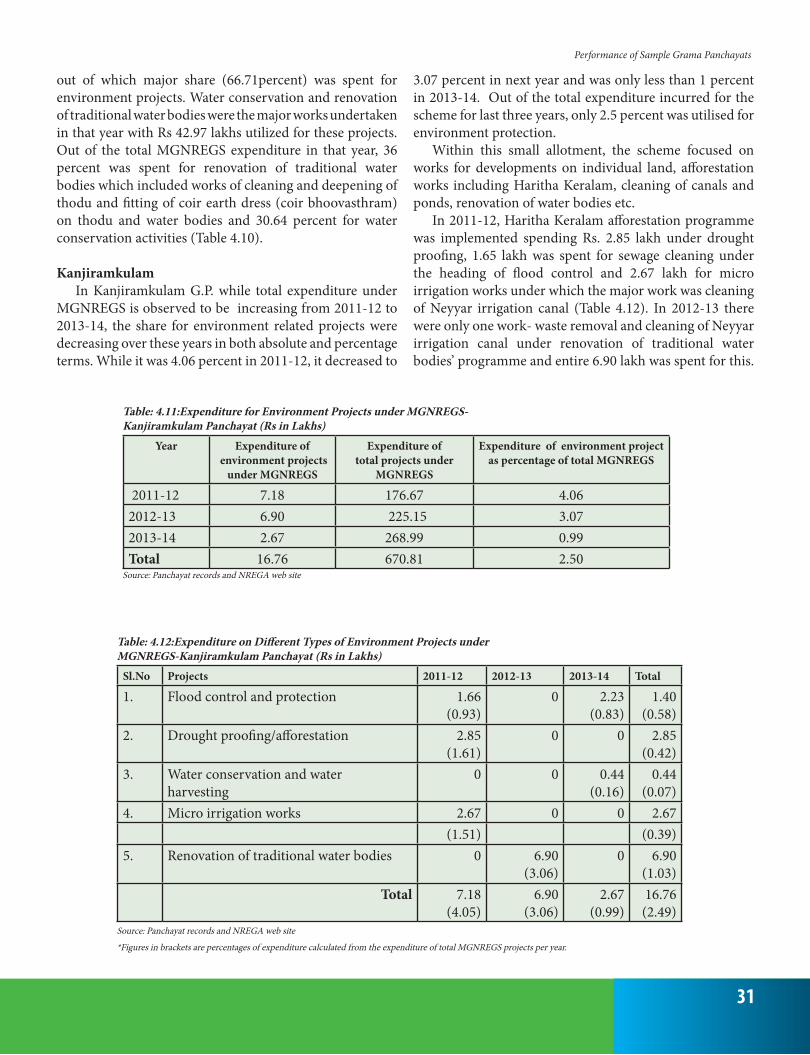
31
out of which major share (66.71percent) was spent for environment projects. Water conservation and renovation of traditional water bodies were the major works undertaken in that year with Rs 42.97 lakhs utilized for these projects. Out of the total MGNREGS expenditure in that year, 36 percent was spent for renovation of traditional water bodies which included works of cleaning and deepening of thodu and fitting of coir earth dress (coir bhoovasthram) on thodu and water bodies and 30.64 percent for water conservation activities (Table 4.10).
KanjiramkulamIn Kanjiramkulam G.P. while total expenditure under
MGNREGS is observed to be increasing from 2011-12 to 2013-14, the share for environment related projects were decreasing over these years in both absolute and percentage terms. While it was 4.06 percent in 2011-12, it decreased to
3.07 percent in next year and was only less than 1 percent in 2013-14. Out of the total expenditure incurred for the scheme for last three years, only 2.5 percent was utilised for environment protection.
Within this small allotment, the scheme focused on works for developments on individual land, afforestation works including Haritha Keralam, cleaning of canals and ponds, renovation of water bodies etc.
In 2011-12, Haritha Keralam afforestation programme was implemented spending Rs. 2.85 lakh under drought proofing, 1.65 lakh was spent for sewage cleaning under the heading of flood control and 2.67 lakh for micro irrigation works under which the major work was cleaning of Neyyar irrigation canal (Table 4.12). In 2012-13 there were only one work- waste removal and cleaning of Neyyar irrigation canal under renovation of traditional water bodies’ programme and entire 6.90 lakh was spent for this.
Table: 4.11:Expenditure for Environment Projects under MGNREGS-Kanjiramkulam Panchayat (Rs in Lakhs)
Year Expenditure of environment projects
under MGNREGS
Expenditure of total projects under
MGNREGS
Expenditure of environment project as percentage of total MGNREGS
2011-12 7.18 176.67 4.062012-13 6.90 225.15 3.072013-14 2.67 268.99 0.99Total 16.76 670.81 2.50
Source: Panchayat records and NREGA web site
Table: 4.12:Expenditure on Different Types of Environment Projects under MGNREGS-Kanjiramkulam Panchayat (Rs in Lakhs)
Sl.No Projects 2011-12 2012-13 2013-14 Total
1. Flood control and protection 1.66 (0.93)
0 2.23 (0.83)
1.40 (0.58)
2. Drought proofing/afforestation 2.85 (1.61)
0 0 2.85 (0.42)
3. Water conservation and water harvesting
0 0 0.44 (0.16)
0.44 (0.07)
4. Micro irrigation works 2.67 0 0 2.67(1.51) (0.39)
5. Renovation of traditional water bodies 0 6.90 (3.06)
0 6.90 (1.03)
Total 7.18 (4.05)
6.90 (3.06)
2.67 (0.99)
16.76 (2.49)
Source: Panchayat records and NREGA web site
*Figures in brackets are percentages of expenditure calculated from the expenditure of total MGNREGS projects per year.
Performance of Sample Grama Panchayats

32
Role of Grama Panchayats in Waste Management and Environment Protection
In 2013-14 only 2.23 lakh was spent for sewage cleaning under flood control and 0.44 lakh spent for rain water harvesting and initiatives to construct protection wall for ponds/water bodies and annual maintenance of these water bodies.
MarutharodeMarutharode G.P is different from our other sample
G.Ps due to prevalence of extensive paddy cultivation and also due to heavy focus on environment related activities under MGNREGS in all the three years under study. Total expenditure of MGNREGS increased yearly from 2011-12 to 2013-14 and the percentage share of expenditure for environment projects also increased year to year. Share of environment projects which was 66 percent in 2011-12 increased to 85 percent in the 2012-13 and further to 96 percent in 2013-14 (Table 4.13). Out of the total expenditure of all projects under MGNREGS for the last three years, 86.23 percent was spent for environment protection.
The MGNREGS works of Marutharode include land development, works on individual land for agricultural purposes, micro irrigation works, water conservation,
flood control, renovation of traditional water bodies etc. Irrigation has an important role in this Panchayat compared to other sample G.Ps. In 2011-12, projects undertaken included flood control and micro irrigation works and nearly half of total MGNREGS funds were used for the latter. Under flood control, the major works related to drainage cleaning whereas those under micro irrigation focused on cleaning of canals and ponds (Table 4.13 & 4.14). Drainage cleaning under flood control, cleaning of ponds under water conservation and cleaning/ other works of canals under micro irrigation are the main activities in both 2012-13 and 2013-14 of which major chunk of funds was used for the single item i.e., micro irrigation works.
NenmeniWayanad district is one of the first districts in India
which implemented MGNREGS. Nenmeni G.P of Wayanad district has successfully implemented various projects related to environment protection through MGNREGS scheme. Total expenditure of MGNREGS has increased every year from 2011-12 to 2013-14. Expenditure on environment related works was more
Table: 4.13: Expenditure for Environment Projects under MGNREGS- Marutharode Panchayat (in Lakhs)Year Expenditure of
envioronmental projects under MGNREGS
Expenditure of total projects under
MGNREGS
Expenditure of environment projects as percentage of total
MGNREGS expenditure
2011-12 37.08 56.27 65.902012-13 105.49 123.65 85.312013-14 126.45 132.05 95.76Total 269.02 311.97 86.23
Source: Panchayat records and NREGA web site
Table: 4.14: Expenditure on Different types of Environment Projects under MGNREGS-Marutharode Panchayat (Rs. in Lakhs)
Sl.No Projects 2011-12 2012-13 2013-14 Total
1. Flood control 9.70 (17.24)
27.40 (22.16)
31.00 (23.48)
68.10 (21.82)
2. Micro irrigation works 27.38 (48.66)
75.03 (60.68)
79.21 (60.0)
181.62 (58.21)
3. Water conservation and water harvesting
0 3.06 (2.47)
16.24 (12.29)
19.30 (6.18)
Total 37.08 (65.9)
105.49 (85.31)
126.45 (95.77)
269.02 (86.21)
Source: Panchayat records and NREGA web site
*Figures in brackets are percentages of expenditure calculated from the expenditure of total MGNREGS projects per year.

33
than 60 percent for two years except 2012-13. Out of total expenditure on all projects under MGNREGS for the last three years, more than half was exclusively spent for environment protection (Table 4.15).
In 2011-12, G.P. spent 207.85 lakh for MGNREGS, out of this 70 percent was spent for environment related works. In 2012-13 while total expenditure of MGNREGS scheme increased, environment related expenditure decreased drastically compared to the previous year and only around 21 percent was spent for such works. In 2013-14, the total expenditure of the scheme increased to Rs.399 lakh and out of this majority (63 percent) was spent for environment protection.
Nenmeni being located close to Western Ghats is an ecologically sensitive G.P, sharing its boundaries with other G.Ps, forest area and Tamilnadu state. Accrodingly the type of works under MGNREGS was also partly influenced by such regional specificities.
Some of the important works related to environment protection as observed in Nenmeni is as follows. • Trench construction– has been done in the Panchayat
boundary with forest area for protection from wild animals. It also serves as water storing pits during the rainy season.
• Man kayyaala- construction of land wall for prevention of soil erosion as part of the watershed programme.
• Man kulam- Small ponds constructed in individual agricultural land to store water for improving agricultural fertility.
• Compost pits- pits constructed on individual land for households to deposit bio degradable waste.
• Rain pits- pits constructed on individual land for rain water storage. It helps recharging of water table.In 2011-12, major works implemented were water
conservation and water harvesting and 51 percent of total expenditure of MGNREGS was spent on this heading
Table: 4.15: Expenditure for Environment Projects under MGNREGS-Nenmeni Panchayat (Rs in Lakhs)Year Expenditure of
envioronment projects under MGNREGS
Expenditure of total projects under MGNREGS
Expenditure of environment projects as percentage of total
MGNREGS expenditure
2011-12 145.37 207.85 69.942012-13 54.83 265.31 20.662013-14 251.52 399.4 62.97Total 451.72 872.56 51.77
Source: Panchayat records and NREGA web site
Table: 4.16: Expenditure on Different types of Environment Projects under MGNREGS-Nenmeni Panchayat (Rs. in Lakhs)
Sl.No. Projects 2011-12 2012-13 2013-14 Total
1. Flood control and protection
18.27(8.79)
3.27(1.23)
18.65(4.67)
40.19(4.61)
2. Water conservation and water harvesting
107.11(51.53)
1.87(0.70)
6.98(1.75)
115.96(13.29)
3. Micro irrigation works 2.00(0.96)
0 0 2.00(0.23)
4. Renovation of traditional water bodies
16.99(8.17)
16.24(6.12)
36.84(9.22)
70.08(8.03)
5. Works on individual land
0 32.04(12.07)
189.04(47.33)
221.08(25.34)
6. Land development 0.99(0.48)
1.41(0.53)
0 2.41(0.28)
Total 145.37(69.93)
54.83(20.65)
251.52(62.97)
451.72(51.78)
Source: Panchayat records and NREGA web site *Figures in brackets are percentages of expenditure calculated from the expenditure of total MGNREGS projects per year.
Performance of Sample Grama Panchayats

34
Role of Grama Panchayats in Waste Management and Environment Protection
(Table 4.16). Watershed related works and construction of mankayyala for soil protection were the major activities. Other works related to flood control and protection and renovation of traditional water bodies and more than 8 percent of total expenditure was spent for each of these. Nearly one lakh was spent for trench maintenance under land development category. There was also a small portion spent for micro irrigation works.
In 2012-13 major works undertaken were under the category of work on individual land and Rs. 32 lakh (12 percent of total MGNREGS funds) was spent on this for cleaning of colonies, construction of mankayyala, compost pits, small ponds (man kulam) etc. This environment focus of works undertaken on individual land was a unique feature observed only in Nenmeni Panchayat as distinct from the other G.Ps where such work were more oriented for promoting agriculture than protection of environment per se. Next in significance was protection of thodu under the category of renovation of traditional water bodies and Rs. 16 lakh was spent on this activity which accounted for 6 percent of total expenditure in that year. Cleaning and width expansion works on thodu under water conservation category and the drainage cleaning under flood control works were the other activities carried out (Table 4.16). Nearly 1.5 lakh has been spent for trench maintenance under land development category.
In 2013-14 also major work was done under the category of works on individual land like the previous year and Rs. 189 lakh accounting for nearly half of the total expenditure of
the scheme was used for this purpose for construction of mankayyala for soil protection, compost pits, small ponds, rain pits, etc. (Table 4.16). Cleaning of canal and thodu was done under renovation of traditional water bodies spending nearly Rs. 37 lakh and accounting for 9 percent of total funds. Besides this, nearly 19 lakh was spent for flood control and protection and 7 lakhs was utilized for undertaking works related to water conservation and water harvesting which included construction of ponds, cleaning of public well, check dam, etc.
Thus environment protection related works under MGNREGS scheme in Nenmeni are mainly in the area of soil-water conservation and ground water recharging and the G.P has successfully merged MGNREGS with agriculture related works. A noteworthy work in this G.P is construction of compost pits in households under MGNREGS for the purpose of depositing bio degradable wastes. However, during our survey households were observed to be using these pits for depositing all type of wastes including plastic covers which are then burnt periodically. This resulted in very little littering of wastes in public places and near absence of visible symptoms of unscientific waste disposal.
Our study reiterates the general observation reported in other states that any analysis of environment protection activities of G.Ps should necessarily include MGNREGS which, though aimed at guaranteeing employment for rural areas undertakes many works linked to key natural resources like water, soil, and land.9
9The studies of MGNREGA on Chitradurga district of Karnataka shows that the scheme gives multiple environment benefits rather than the employment guarantee of the people (Tiwari et. Al.2011).
73
Decentralisation Analysis Cell (DAC)
conservation and water harvesting which included construction of ponds, cleaning of public
well, check dam, etc.
Thus environment protection related works under MGNREGS scheme in Nenmeni are
mainly in the area of soil-water conservation and ground water recharging and the G.P has
successfully merged MGNREGS with agriculture related works. A noteworthy work in this
G.P is construction of compost pits in households under MGNREGS for the purpose of
depositing bio degradable wastes. However, during our survey households were observed to
be using these pits for depositing all type of wastes including plastic covers which are then
burnt periodically. This resulted in very little littering of wastes in public places and near
absence of visible symptoms of unscientific waste disposal.
Our study reiterates the general observation reported in other states that any analysis
of environment protection activities of G.Ps should necessarily include MGNREGS which
though aimed at guaranteeing employment for rural areas undertakes many works linked to
key natural resources like water, soil, and land.99
C
Figure: 4.3:Coir Bhoovasthram
Figure: 4.4: Rain Pits Figure: 4.5: Mankulam
99The studies of MGNREGA on Chitradurga district of Karnataka shows that the scheme gives multiple environment benefits rather than the employment guarantee of the people (Tiwari et. Al.2011).
Figure: 4.3Coir Bhoovasthram
Figure: 4.4Rain pits
Figure 4.5Mankulam

35
4.4. Total Expenditure on Environment ProjectsIn this section we analyse total expenditure of sample
G.Ps on environment projects which is the sum of plan funds as well as centrally sponsored scheme of MGNREGS. The study shows that the majority of funds spent in this sphere are from MGNREGS in all sample G.Ps and only very less amount is from Panchayat’s plan sources (Table 4.17) Ezhikkara in 2011-12 and Kanjiramkulam and Marutharode G.Ps in 2012-13 have not spent any amount from plan fund and the expenditure was only from MGNREGS. It was only in Marutharode and Kanjirakulam in 2013 -14 that plan funds accounted for 20 and 62 percent
respectively of total expenditure on environment projects. In all other cases MGNREGS accounted for more than 90 percent of total funds spent for environment protection.
In 2011-12 highest amount utilized for environment protection was by Nenmeni G.P where it spent Rs. 146 lakhs out of which 99.52 percent (145 lakh) was exclusively from MGNREGS. Next was Marutharode which spent Rs. 37.21 lakh out of which 99.6 percent was from MGNREGS followed by Ezhikkara which spent Rs. 16.39 lakhs which was completely from MGNREGS fund and the least amount spent was by Kanjiramkulam with Rs. 7.68 lakhs, of which 93.4 percent was from MGNREGS fund.
Table: 4.17: Total Expenditure for Environment Projects by all Four Sample G.Ps (Plan fund & MGNREGS)Year & sample G.Ps Expenditure for environ-
ment project under plan funds (Rs.)
Expenditure for environment projects under MGNREGS
(Rs.)
Total expenditure for environment projects
(Rs.)
2011-12Ezhikkara Nil 16,39, 833
(100.00)16,39,833
(100.00)Kanjiramkulam 50,400
(6.56)7,18,098
(93.44)7,68,498 (100.00)
Marutharode 13,484 (0.36)
37,08,227 (99.64)
37,21,711 (100.00)
Nenmeni 70,000 (0.48)
1,45,37,325 (99.52)
1,46,07,325 (100.00)
2012-13Ezhikkara 40,900
(3.45)11,46,128
96.55)11,87,028
(100.00)Kanjiramkulam nil 6,90,302
(100.00)6,90,302 (100.00)
Marutharode 0 1,05,48,988 (100.00)
1,05,48,988 (100.00)
Nenmeni 1,68,180 (2.98)
54,82,734 (97.02)
56,50,914 (100.00)
2013-14Ezhikkara 3,96,000
(8.44)42,97,067
( 91.56) 46,93,067
(100.00)Kanjiramkulam 4,34,179
(61.89)2,67,383
(38.11)7,01,562 (100.00)
Marutharode 31,61,642 (20.00)
1,26,44,635 (80.00)
1,58,06,277 (100.00)
Nenmeni 1,46,640 (5.51)
25,15,161 (94.49)
26,61,801 100.00)
Source: Sulekha data and NREGA web site *Figures in brackets are percentages
Performance of Sample Grama Panchayats

36
Role of Grama Panchayats in Waste Management and Environment Protection
In 2012-13 the highest utilization was by Marutharode G.P which spent Rs. 105 lakh for environment protection exclusively from MGNREGS. Nenmeni spent Rs. 56.5 lakhs in the same year with only around 3 percent from plan funds. Th e lowest utilization was again from Kanjiramkulam. In 2013-14 Marutharode again topped in spending funds which was Rs. 158 lakh of which 80 percent was from MGNREGS. Ezhikkara spent Rs. 46 lakhs followed by Nenmeni with Rs. 26 lakhs and again Kanjiramkulam recorded the lowest utilization in that year with Rs. 7 lakhs of which 61percent was from plan funds and 38 percent from MGNREGS (Table 4.17).
Th us among the sample G.Ps, the one with high utilization of fund for environment related projects is Marutharode followed by Nenmeni. Kanjiramkulam has recorded the lowest utilization for all three years. Th us the high land G.Ps among the sample have high expenditure for environment protection compared to low land G.Ps and they have used MGNREGS funds extensively for the same.
Among the sample G.Ps, no G.P has registered a high dependence on plan fund except Kanjiramkulam in 2013-14. Only very less amount has been spent from plan fund by the sample G.Ps compared to MGNREGS (Figure 4.6). Environment protection activities thus seem to have obtained a boost in the G.Ps aft er the implementation of MGNREGS.
4.5 Preparation and Use of Biodiversity Register
Considering the relevance of fl ora and fauna for the existence of an eco-system, Government of India has passed the Biological Diversity Act in 2002 for conservation of Bio diversity and subsequently published Biological Diversity Rules in 2004 which emphasised that bio diversity conservation should start from the local level with the participation of the local people. People’s Biodiversity Register shall thus document folk ecological knowledge and practices involving the use of natural resources, with the help of local educational institutions and NGOs working in collaboration with local, decentralized institutions of governance. Th e process of its preparation, as well as the resultant documents, could serve a signifi cant role in promoting more sustainable, fl exible, participatory systems of management and in ensuring a better fl ow of benefi ts from economic use of the living resources to the local communities. (Madhav Gadgil et.al, 2000).
Th e rules provide for constitution of a Biodiversity Management Committee (BMCs) by every local body within its area of jurisdiction. Main function of the BMC is to prepare PBRs in consultation with local people. Th e register shall contain comprehensive information on availability and knowledge of local biological resources, their medicinal or any other use. Th e process of PBR
75
Decentralisation Analysis Cell (DAC)
In 2011-12 highest amount utilized for environment protection was by Nenmeni G.P
where it spent Rs. 146 lakhs out of which 99.52 percent (145 lakh) was exclusively from
MGNREGS. Next was Marutharode which spent Rs. 37.21 lakh out of which 99.6 percent
was from MGNREGS followed by Ezhikkara which spent Rs. 16.39 lakhs which was
completely from MGNREGS fund and the least amount spent was by Kanjiramkulam with
Rs. 7.68 lakhs, of which 93.4 percent was from MGNREGS fund.
In 2012-13 the highest utilization was by Marutharode G.P which spent Rs. 105 lakh
for environment protection exclusively from MGNREGS. Nenmeni spent Rs. 56.5 lakhs in
the same year with only around 3 percent from plan funds. The lowest utilization was again
from Kanjiramkulam. In 2013-14 Marutharode again topped in spending funds which was Rs.
158 lakh of which 80 percent was from MGNREGS. Ezhikkara spent Rs. 46 lakhs followed
by Nenmeni with Rs. 26 lakhs and again Kanjiramkulam recorded the lowest utilization in
that year with Rs. 7 lakhs of which 61percent was from plan funds and 38 percent from
MGNREGS (Table 4.17).
Thus among the sample G.Ps, the one with high utilization of fund for environment
related projects is Marutharode followed by Nenmeni. Kanjiramkulam has recorded the
lowest utilization for all three years. Thus the high land G.Ps among the sample have high
expenditure for environment protection compared to low land G.Ps and they have used
MGNREGS funds extensively for the same.
Figure: 4.6Source of Funds for Environment Projects in Sample G.Ps- Plan funds vis a vis MGNREGS
0102030405060708090
100
G.P MGNREGS G.P MGNREGS G.P MGNREGS
2011-12 2012-13 2013-14
Ezhikkara
Kanjiramkulam
Marutharode
Nenmeni
Figure: 4.6 Source of Funds for Environment Projects in Sample G.Ps- Plan funds vis a vis MGNREGS

37
preparation and its guidelines has been established by the National Biodiversity Authority.10
Th e government of Kerala had accorded sanction to incur an expenditure of Rs.1,25,000/- (Rupees one lakh twenty fi ve thousand only) for G.Ps, Rs. 2, 50,000/- (Rupees two lakh fi ft y thousand only) for Municipalities and Rs. 5,00,000/-(Rupees fi ve lakh only) for Corporations from the general sector development fund of the annual plan or own general purpose fund for PBR preparation (Kerala State Biodiversity Board). It was mandatory and all LSGs having BMCs were required to utilise this fund and complete the PBR preparation before March 2014.
In the sample G.Ps, all have prepared PBR except Ezhikkara. Ezhikkara G.P also reported that they have prepared PBR with the help of students but it was not in the prescribed manner. Th e other three sample G.Ps reported that they have formed BMCs, conducted surveys and also followed guidelines during preparation of PBR. Th e details of fl ora and fauna of the localities, traditional knowledge of the people, history etc. are clearly mentioned in the PBR. Among the sample G.Ps, PBR of Nenmeni has special signifi cance due to the presence of medicinal plants and diverse fl ora and fauna compared to other sample G.Ps as it is situated near the Western Ghats. Th e traditional knowledge of the people, especially the tribes, about various plants and its uses are clearly stated in this PBR of Nenmeni.
Th e sample G.Ps reported that they have not taken any action on bio diversity aft er preparation of PBR nor do they periodically update it as is stipulated in the guidelines. Th e survey results show that the G.Ps are not taking any measures for protection of fl ora and fauna identifi ed in the PBR.
4.6 Use of Local Resource MapsA related program in this context was the natural
resources map which was prepared under people’s resource mapping program launched in Kerala in 1991 with the help of NGO- KSSP ( Kerala Shastra Sahitya Parishad) and CESS (Centre for Earth Science Studies) with support from the State government. Under the program, with the help of a checklist designed by CESS, local volunteers including teachers, retired people and educated unemployed people began to map local resources in co- operation with farmers. Th e program intended that ordinary people should learn
about their local resources and environment problems thus developing land literacy and environmental awareness (Veron 2001). All sample G.Ps reported that they had prepared such resource maps. But on enquiry, they had to undertake lengthy search operations for locating them. Some elected representatives were totally unaware of the existence of such maps since they were stacked away in some corner of the Panchayat building and remained unused and never updated since its preparation.
4.7 Performance in Environment Protection Functions as Specifi ed in KPR Act 1994
Some of the mandatory, general and sectoral functions entrusted to the G.Ps in the KPR Act 1994, we have seen, are directly aimed at protecting the environment. We now assess the performance of our four sample Panchayats in discharging these functions. Th e assessment is based on multiple criteria which include; a) our previous analysis of environment related projects in development funds of the Panchayats, b) analysis of environment related projects in central government sponsored MGNREGS and c) direct information collected from elected representatives/ offi cials of our sample Panchayats.
Th e evaluation shows that environment related mandatory functions like maintenance of traditional drinking water sources, preservation and maintenance of ponds, water ways and canals within the G.P. are being done in all sample G.Ps primarily through MGNREGS (Table 4.18). But a mixed pattern was observed regarding projects for conservation of public water bodies. As far as public wells are concerned, apart from chlorination of water bodies by Asha (sanitation) workers, no measures were being undertaken by the Panchayat in Ezhikkara to preserve them since water from these were generally not potable due to high salinity. Availability of alternate public water supply in all areas had reduced people’s dependence on traditional wells with consequent loss of motivation in maintenance. However, remarkable initiatives were observed in Kanjiramkulam, Marutharode and Nenmeni Panchayats which face acute water scarcity in certain areas. Th ese Panchayats have good examples of community managed water supply from wells/ borewells and have also taken initiatives for annual maintenance of ponds through the MGNREGS scheme. Management of public market was reported to be done, though not satisfactorily,
10Process in PBR PreparationStep 1: Formation of Biodiversity Management Committee (BMC), Step 2: Sensitization of the public about the study, survey and possible management, Step 3: Training of members in identifi cation and collection of data on biological resourcesand traditional knowledge Step 4: Collection of data. Data collection includes review of literature on the natural resources of the districts, Participatory Rural Appraisal (PRAs) at village level, house hold interviews, individual interviews with village leaders and knowledgeable individuals, household heads, key actors of the Panchayat raj institutions and NGOsand direct fi eld observations Step 5: Analysis and validation of data in consultation with technical support group and BMC Step 6: Preparation of People’s Biodiversity Register (PBR) Step 7: Computerization of information and resources(Revised Guidelines, 2013, National Biodiversity Authority, Govt.of India)
Performance of Sample Grama Panchayats

38
Role of Grama Panchayats in Waste Management and Environment Protection
in Kanjiramkulam G.P the only Panchayat in our sample having a market. Only Marutharode and Nenmeni G.Ps have established and undertaken maintenance of burial and burning ground. No major projects have been initiated by all four Panchayats in other mandatory functions such as maintenance of environmental hygiene, storm water drainage and collection and disposal of solid waste and regulation of liquid waste disposal.
The only activity being undertaken by the Panchayats per se in relation to functions specified in S. 219 of KPR Act were removal and burial of unclaimed dead bodies under intimation to the police. They also reported that at the time of giving license or sanction to commercial establishments, they give awareness on duty of owners and occupiers of such establishments for collection and deposit of rubbish and solid waste. None were performing any of the other functions specified such as regular sweeping and cleaning of roads, removal of filth from private premises, removal of solid waste, introduction of house to house collection of waste, provision for processing/ final disposal of waste etc. (Table 4.19). They do not have any employees engaged in waste collection/ management nor have they passed any bylaws for regulating/ banning of plastic covers, regulation of outflow of filth, depositing rubbish in public places etc.
Our previous analysis of funds and projects in the four G.Ps had revealed that some action has been taken with regard to promoting decentralised management of one
component of solid waste namely -organic waste. Schemes had thus been devised for promoting biogas, vermi composting, pipe composting etc. at source reflecting the current public policy approach of producer responsibility and principle of subsidiarity in waste management. However the success rate is abysmally low even in this as is reflected by the very low rate of utilization of allotted funds and the number of beneficiary households participating in the scheme.
Analysis of the performance of sample G.Ps in the general function of inculcating environmental awareness and motivating local action for environmental protection revealed that only Ezhikkara G.P had conducted some awareness programmes a few years before, but it has not been regular or sustained action.
In the case of sectoral functions, soil and water conservation activities are being implemented in all sample G.Ps. Nenmeni being near the Western Ghats, schemes for soil conservation is implemented under the Western Ghats Watershed Programme effectively utilising the service of MGNREGS. Ezhikkara G.P is also following a similar pattern of utilizing MGNREGS for soil conservation (Table 4.20). All sample G.Ps were observed to be actively carrying out water conservation activities through MGNREGS amongst which a noteworthy one was construction and maintenance of Jalanidhi check dam and other water bodies in Nenmeni. Only Marutharode and Nenmeni, the
Table: 4.18: Performance of Sample G.Ps in Environment Related Mandatory Functions Specified in KPR Act, 1994SlNo. Functions Ezhikkara Kanjiramkulam Marutharode Nenmeni
A. Mandatory functions1. Maintenance of traditional
drinking water sources.Yes* Yes* Yes* Yes*
2. Preservation of ponds and other water tanks
Yes* Yes* Yes* Yes*
3. Maintenance of waterways and canals under the control of village Panchayats.
Yes* Yes* Yes* Yes*
4. Collection and disposal of solid waste and regulation of liquid waste disposal.
No No No No
5. Storm water drainage. No No No No6. Maintenance of
environmental hygiene.No No No No
7. Management of public markets.
No Yes No No
8. Establishment and maintenance of burial and burning grounds.
No No Yes Yes
Source: primary data from sample G.Ps *Implemented mostly through MGNREGS

39
Table: 4.19: Performance of Sample G.Ps in Mandatory Waste Management Functions as Specified in KPR Act, 1994S l .No
Functions Ezhikkara Kanjiramkulam Marutharode Nenmeni
1 Regular sweeping and cleaning of the roads
No No No No
2 Daily removal of the filth and carcassesof animals from private premise
No No No No
3 Removal and burial of unclaimed dead bodies under intimation to the police
Yes Yes Yes Yes
4 Removal of solid wastes No No No No5 Daily removal of rubbish from dustbins
and private premises No No No No
6 Any awareness been given on duty of owners and occupiers for collection and deposit of rubbish and solid waste.
Yes Yes Yes Yes
7 Any contract with owner or occupier for removal ofrubbish or filth.
No No No No
8 Introduced house-to-house-collection of rubbish.
No No No No
9
Provision for final disposalof waste /-identified and notifiedsuitable places for the purpose offinal disposal of waste.
No No No No
10 Provision forprocessing of solid wastes.
No No No No
11 Removal of rubbish and solid waste accumulated on non-residential premises.
No No No No
12 Prohibited improper disposalof carcasses, rubbish and filth.
No No No No
13 Prohibited keepingof filth on premises.
No No No No
14 Prohibited allowing outflow of filth.
No No No No
15 Prohibited deposit of rubbish or filth in public places.
No No No No
16 Employees of Panchayat engaged in rubbish and solid waste management service
No No No No
Source: primary data from sample G.Ps
high land G.Ps, reported they implement and maintain minor irrigation and micro irrigation projects.
Ezhikkara reported that they have organised campaigns for planting of trees and to build environmental awareness.
No other sample G.Ps reported such activities. But afforestation in waste land has been conducted by all samples except Ezhikkara. All sample G.Ps are doing management and setting up of water supply schemes
Performance of Sample Grama Panchayats

40
Role of Grama Panchayats in Waste Management and Environment Protection
Table: 4.20: Performance of Sample G.Ps in Environment Related General and Sectoral Functions Specified in KPR Act 1994
Sl.No. Functions Ezhikkara Kanjiramkulam Marutharode Nenmeni
B. General functions1. Inculcating environmental aware-
ness and motivating local action for environmental upgradation.
Yes No No No
C. Sectoral functionsI Agriculture1. Soil protection Yes* Yes Yes Yes*
(Western GhatsWatershed
Programme)
2. Production of organic manure. No No No NoII Minor irrigation3. Maintenance and implementation
of all minor irrigation projects with-in the area of a village Panchayat.
No No Yes Yes
4. Implementation and maintenanceof all micro irrigation projects.
No No Yes Yes
5. Put into practice water conservation.
Yes* Yes * Yes* Yes
III Social forestry6. Growing trees for cattle feed, fire
wood and growing of fruit trees.Yes No No No
7. Organise campaigns for planting of trees and to build environmental awareness.
Yes No No No
8. Afforestation of waste land Yes Yes * Yes YesIV Water supply9. Management of water
supply schemes within a village Panchayat.
Yes Yes Yes Yes
10. Setting up of water supply schemes within a village Panchayath.
Yes Yes Yes Yes
V Public health and sanitation11. Implementation of sanitation
programmesYes Yes Yes yes
Source: Data from sample G.Ps *Implemented mostly through MGNREGS
within the Panchayat and implementation of sanitation programmes (Table 4.20).
4.8 SummaryCase study of four G.Ps-Ezhikkara, Kanjiramkulam,
Marutharode and Nenmeni-reiterate the finding of lacklustre performance in functions related to environment protection. The main programs being implemented by all
these G.Ps using their own plan funds was found to be those related to sanitation. Prime mandatory functions related to protection of ponds, water bodies and canals, afforestation etc. have been implemented mostly utilising funds from the centrally sponsored MGNREGS. The study thus highlights the relevance of MGNREGS in performing environment related mandatory and sectoral functions of G.Ps. Significant variations were observed between sample

41
G.Ps in extent of environment focus in MGNREGS with Marutharode G.P spending around 86.2 percent of their total funds under the scheme during the three year period of 2011-14 for environment projects while it was as low as 2.5 percent in Kanjiramkulam. Differences were also noted in type of environment works undertaken under the scheme with Marutharode focusing mainly on micro irrigation works, Nenmeni focusing primarily on environment related works on individual land such as Mankulam, Mankayyala, compost pits, rain pits etc. while Ezhikkara focused on renovation of traditional water bodies.
Local level resource mapping has been done and the resources are clearly mentioned in all sample Panchayats. However, such maps once prepared, remain on paper and are stacked away in some corner, never being utilized either for educating the public or as baseline reference records for checking on current status/ upkeep and maintenance of resources.
Biodiversity Register was prepared by all sample Panchayats with people’s participation but on inspection it was observed that it has not been prepared according to specified guidelines in Ezhikkara. In all G.Ps there was no subsequent follow up or updating of PBRs and the registers were also not being utilized for educating the public or for designing any related conservation measures to preserve the identified regional flora and fauna.
Dumping of waste in canals/ ponds is common in Ezhikkara and Kanjiramkulam. During rainy season, there is surface run off to ponds and no measures have been taken to prevent such run off. Dumping of slaughter house waste into rivers by neighbouring local bodies is also reported in Ezhikkara.
Afforestation programmes were reported to be done in all sample G.Ps through MGNREGS. But again it was found to be sporadic and not sustained. Long term conservation strategies were not observed even in Ezhikkara Panchayat which had environmentally significant mangrove forests.
Analysis of performance of sample G.Ps in mandatory
environment functions as specified in KPR Act 1994, revealed that maintenance of traditional drinking water sources, preservation of ponds and maintenance of waterways and canals are done in all sample Panchayats. But a mixed pattern was observed regarding projects for conservation of public water bodies. As far as public wells are concerned, apart from chlorination of water bodies by Asha (sanitation) workers, no measures were being undertaken by the Panchayat in Ezhikkara to preserve them since water from these were generally not potable due to high salinity. Availability of alternate public water supply in all areas had reduced people’s dependence on traditional wells with consequent loss of motivation in maintenance. However, remarkable initiatives were observed in Kanjiramkulam, Marutharode and Nenmeni Panchayats which face acute water scarcity in certain areas. These Panchayats have good examples of community managed water supply from wells/ borewells and have also taken initiatives for annual maintenance of ponds through the MGNREGS scheme.
No activity is being undertaken by any sample G.P per se in the case of important mandatory functions mentioned in KPR ACT 1994 like collection and disposal of solid waste, regulation of liquid waste disposal and maintaining environment hygiene. There is no organised system for collection or treatment of solid waste in all sample Panchayats and they do not have any door to door collection of waste or street sweeping. The main strategy being followed by these G.Ps in the context of solid waste seems to be promotion of decentralised treatment of organic waste through biogas/ vermi/pipe compost units in individual households all of which revealed very low participation by the public. The strategy followed for management of market waste in Kanjiramkulam- the only G.P having a market- was observed to be collecting the waste and dumping in a corner from where it is removed by private agencies once in 2-3 months.
Performance of Sample Grama Panchayats

42
Role of Grama Panchayats in Waste Management and Environment Protection
Analysis of performance of sample G.Ps in environment related mandatory and sectoral function had revealed that no activity is being
undertaken by any of them in collection / disposal of solid and liquid waste. Hence the prevailing solid and liquid waste management systems among households and other institutions in the four sample G.Ps are examined in this chapter. The chapter consists of three broad sections. The first briefly describes the sample size of households/ institutions for study in all these four G.Ps and its mode of selection, the second analyses prevailing arrangements for solid and liquid waste management in the Panchayats based on a primary survey of the selected sample households while the last section assesses the same pertaining to sample of institutions.
5.1 Selection of SampleThe representative sample of households/ institutions
from selected Panchayats, was identified through a multistage stratified sampling process which included:
a) Selection of sample wards; and b) Selection of sample households/ institutions from
these wards.From each Panchayat, around one third of the wards were
selected for the study. The list of total buildings in these wards was obtained from the Panchayat records and based on this data as well as discussion with elected representatives who have a sound grasp of regional specificities, wards were stratified into bulk generators of waste and non-bulk generators. Bulk generating wards i.e., those which have a large number of commercial establishments, educational institutions, hospitals, marriage auditoriums etc., was selected with a probability of one. Remaining wards were geographically clustered from North to South and required number was chosen through simple random sampling without replacement.
Ezhikkara and Kanjiramkulam G.Ps have 14 wards
each out of which 5 sample wards were selected from each. Of these, two wards from Ezhikkara and one from Kanjiramkulam were identified as bulk waste generating wards and selected with probability one while other three and four wards respectively from each Panchayat were selected from the remaining through random sampling method (Table 5.1). In Marutharode Panchayat, out of the total 19 wards, six were selected as sample out of which two were selected with probability one and remaining four through random sampling. Nenmeni Panchayat was the largest among the sample. Out of the 23 total wards, six were selected as sample out of which two were identified as bulk generating wards and other four selected through random sampling.
In the second stage, sample households/ institutions were selected from the chosen wards. A listing process was carried out in all chosen wards in all Panchayats (except Ezhikkara and Kanjiramkulam where the list of buildings obtained from the Panchayat records were made use of) wherein all buildings located there were identified and basic details collected. This exhaustive and accurate list of buildings was then used to select sample buildings from the following three broad categories.
a) Residential buildings;b Buildings for commercial purpose;c) Other buildings (Public institutions/offices,
educational institutions, hospitals, etc.).Five percent of total buildings in each category in each
Panchayat, selected using random number table, were chosen as the sample for study. Bulk generators such as hospitals, auditoriums etc., however, were covered in whole wherever only a few of them were present in each ward. The sample size and number of buildings thus varied in each G.P. depending on the size of the G.P.
The sample units so selected included 89 households and 34 institutions (20 commercial establishments and 14 other buildings) from Ezhikkara, 95 households and 39 institutions (28 commercial establishments and 11 other buildings) from
Waste Management System inSample Grama Panchayats

43
Kanjiramkulam, 161 households and 78 institutions (32 establishments and 46 other buildings) from Marutharode and 166 households and 70 institutions (29 establishments and 41 other buildings) from Nenmeni. The total sample from all four Panchayats was 732 and consisted of 511 households, 109 commercial establishments and 112 other buildings. The total sample size in low land Panchayats- Ezhikkara and Kanjiramkulam -were 123 and 134 respectively, and was more or less equal in the high land G.Ps Marutharode and Nenmeni- being 239 and 236 respectively.
5.2 Primary Survey of HouseholdsInformation collected through primary survey
was analysed separately under two major categories; household survey and institutional survey. The commercial establishments, public buildings, manufacturing units, schools, hospitals etc. are included in the category of
institutions. This section analyses information pertaining to primary survey of households.
5.2.1 Social ProfileMajority of the sample households belong to Hindu
religion and they constitute 67 percent, followed by Christians and Muslims. In all sample Panchayats, Hindus are dominant except in Kanjiramkulam where it is the Christians who are in majority. In Kanjiramkulam, the sample units belong to Hindu and Christian families only and there are no Muslim units. In Ezhikkara, Muslim sample units were very less and in Marutharode, Muslim sample units were higher than Christian units. In Nenmeni, both these categories were in equal proportion.
It is also observed that more than half of the sample households (54.8 percent) are from OBC category (Table 5.2), 25.8 percent from general category, 15 percent from
Table 5.1: Sampling ProcedureSl. No.
Ezhikkara Kanjiramkulam Mautharode Nenmeni Total
Selection of sample wards1. Total number of wards 14 14 19 23 702. Wards selected through random
sampling3 4 4 4 15
3. Wards selected with probability one 2 1 2 2 7Total number of sample wards 5 5 6 6 22
Selection of sample buildings1. Households 89 95 161 166 5112. Commercial establishments 20 28 32 29 1093. Other institutions 14 11 46 41 112
Total number of sample buildings 123 134 239 236 732
Table: 5.2: Social Profile of the Sample HouseholdsSl.No Religion Ezhikkara Kanjiramkulam Marutharode Nenmeni Total
1 Hindu 67 (75.30) 41 (43.20) 141 (87.60) 92 (55.40) 341 (66.73)2 Christian 19 (21.30) 54 (56.80) 3 (1.90) 37 (22.30) 113 (22.12)3 Muslim 3 (3.40) 0 (0.00) 17 (10.50) 37 (22.30) 57 (11.15)
Total 89 (100.00) 95 (100.00) 161 (100.00) 166(100.00) 511(100.00)Caste group Ezhikkara Kanjiramkulam Marutharode Nenmeni Total
1 SC 33 (37.10) 4 (4.2) 24 (14.90) 14 (8.40) 75 (14.68)2 ST 2 (2.20) 0 (0.00) 0 (0.00) 22 (13.30) 24 (4.70)3 OBC 37 (41.60) 67 (70.5) 101 (62.70) 75 (45.20) 280 (54.79)4 Others 17 (19.10) 24 (25.30) 36 (22.40) 55 (3310) 132 (25.83)
Total 89 (100.00) 95 (100.00) 161(100.0) 166(100.0) 511(100.0)Source: Primary data (Figures in brackets are percentages)
Waste Management System in Sample Grama Panchayats

44
Role of Grama Panchayats in Waste Management and Environment Protection
S.C community and 4.70 percent from ST community out of which most are from Nenmeni. The sample units cover all major communities/ categories in the state.
5.2.2 Information on Ownership of Dwelling Unit and Land at the Place of Stay
Analysis of ownership of dwelling and land by sample households is crucial while designing any solid/ liquid waste management techniques since it can significantly shape the attitude and incentive of people to preserve their surroundings and go in for making capital investments for the same. Ownership and size of land is also relevant for exploring the feasibility of adopting an integrated strategy of combining house composting with organic cultivation in households particularly against the backdrop of current Government policy of promoting decentralised treatment of organic waste at source. In our sample, majority of the
households- 93 percent have ownership of their dwelling units (Table 5.3). In Ezhikkara, all sample units possess their own dwelling unit, in Kanjiramkulam and Nenmeni, it is more than 95 percent and in Marutharode it is around 80 percent. Larger presence of rental households in Marutharode could be explained by its very close proximity to district capital and urban centre of Palakkad and presence of in migrant labour particularly from Tamil Nadu.
Assessment of land ownership revealed that more than two thirds (68 percent) possess only the land on which only their home stead is situated. This was particularly so in Ezhikkara and Kanjiramkulam. In Marutharode 65 percent possessed homestead only while in Nenmeni it is 46 percent. In Nenmeni, half of the sample G.Ps have homestead and other land which is normally used for small scale agriculture and other purposes which is crucial for
Table: 5.3: Type of Land OwnedSl.No Ezhikkara Kanjiramku-
lamMarutharode Nenmeni Total
A Dwelling Unit1 Owned 89 (100.00) 93 (97.90) 133 (82.60) 158 (95.18) 473 (92.56)2 Hired/Rent
free/Others0 (0.00) 2 (2.10) 28 (17.40) 8 (4.82) 38 (7.44)
Total 89 (100.00) 95 (100.00) 161 (100.00) 166(100.00) 511(100.00)B Type of Land1 Homestead
only83 (93.30) 82 (86.30) 104 (64.60) 76 (45.78) 345 (67.51)
2 Homestead and other land
6 (6.70) 11 (11.60) 26 (16.10) 82 (49.40) 125 (24.46)
3 Other land only
0 (0.00) 0 (0.00) 22 (13.70) 0 (0.00) 22 (4.31)
4 No l and 0 (0.00) 2 (2.10) 9 (5.60) 8 (4.82) 19 (3.72) Total 89 (100.00) 95 (100.00) 161 (100.00) 166(100.00) 511(100.00)
Source: Primary data (Figures in brackets are percentages)
Table: 5.4: Size of Land OwnedSl.No. Size of Land
(in Cents)Ezhikkara Kanjiramkulam Marutharode Nenmeni Total
1 <5 17 (19.10) 13 (13.68) 61 (37.90) 15 (9.03) 106 (20.75)2 5 19 (21.35) 5 (5.26) 20 (12.40) 27 (16.27) 71 (13.89)3 > 5 53 (59.55) 77 (81.06) 80 (49.70) 124 (74.70) 334 (65.36)
Total 89(100.00) 95(100.00) 161 (100.00) 166(100.00) 511 (100.00)Source: Primary data (Figures in brackets are percentages)

45
use of compost generated from bio-degradable waste. Regarding extent of land owned, more than one
third possess land of size only 5 cent or less than that. In Marutharode half of the sample households are living on land with a size less than or equal to 5 cent. In Kanjiramkulam and Nenmeni majority own more than 5 cent of land. The study indicates that while an integrated approach of waste disposal at source cum organic cultivation may be more easily possible in highland G.P of Nenmeni, Marutharode should focus on using less space intensive methods such as treatment at source coupled with terrace farming. This indicates that there is no one size that fits all and the best strategy should be designed taking into account regional specificities of each place.
5.2.3 Economic Status and Type of House Economic status of households indicates their capacity
to finance/contribute to various methods of treatment of solid/liquid waste. While some idea of economic status can be obtained from ownership of homestead and ownership of land, others could be the type of ration card held whether APL/ BPL, type of house they live in, basic facilities such as availability of electricity, type of fuel used for cooking etc. A major proportion, that is, around 62 percent of our sample households belong to APL category with the Panchayat wise analysis indicating maximum of 80 percent APL units in Marutharode, slightly more than 50 percent in Kanjiramkulam, and Nenmeni Panchayat (Table 5.5). However in Ezhikkara, slightly more than 50 percent belong to the BPL category. The sample households reported that they were not aware of any strict criterion being followed for fixing APL and BPL category pointing
to potential errors of both exclusion and inclusion often reported in issue of ration cards.
Among the sample households, only 46 percent have pucca house, another 48 percent have semi pucca house and there is a small portion (6 percent) living in kutcha houses (Table 5.6). In Ezhikkara and Nenmeni more than 50 percent of the household have semi pucca house and around 30 percent have pucca house whereas a reverse trend is observed in Kanjiramkulam and Marutharode with more than 50 percent sample units having pucca house and above 30 percent having semi pucca house. The study shows that in Kanjiramkulam and Marutharode– the high population density G.Ps, majority of the sample households belong to the APL category and have pucca houses.
5.2.4 Information on Basic AmenitiesWith regard to facilities in the households, around 70
percent of the sample units in all G.Ps have 4 to 6 rooms including kitchen and hall (Table 5.7). More than half of the total sample households have bathroom facility inside the house and it is applicable in all the G.Ps except Nenmeni. Majority of sample households in all G.Ps have one bathroom within the premises. Almost all sample units have access to electricity (97 percent) and only a few are using kerosene, candle, etc., for lighting purposes. LPG/ natural gas are the primary source of energy for cooking for a large proportion of sample household in Ezhikkara, Kanjiramkulam and Marutharode with highest percentage being observed in Ezhikkara with more than 90 percent households using LPG/natural gas for cooking while in Kanjiramkulam and Marutharode it is 71 percent. But,
Table: 5.5: Economic Status of HouseholdsSl.No Economic
StatusEzhikkara Kanjiramkulam Marutharode Nenmeni Total
1 BPL 46 (51.70) 43 (45.30) 30 (18.60) 74 (44.60) 193 (37.77)2 APL 43 (48.30) 52 (54.70) 130 (80.80) 92 (55.40) 317 (62.03)3 Others* 0 (0.00) 0 (0.00) 1 (0.60) 0 (0.00) 1 (0.20)
Total 89(100.00) 95 (100.00) 161 (100.00) 166(100.00) 511(100.00)Source: Primary data (Figures in brackets are percentages)
*One household had not been issued any card
Table: 5.6: Type of HouseSl.No. Type of
HouseEzhikkara Kanjiramkulam Marutharode Nenmeni Total
1 Pucca 25 (28.10) 57 (60.00) 91 (56.50) 60 (36.10) 233(45.60)2 Semi pucca 62 (69.70) 35 (36.80) 58 (36.00) 92 (55.50) 247 (48.33)3 Kutcha 2 (2.20) 3 (3.20) 12 (7.50) 14 (8.40) 31 (6.07)
Total 89 (100.00) 95 (100.00) 161 (100.00) 166(100.00) 511(100.00)Source: Primary data (Figures in brackets are percentages)
Waste Management System in Sample Grama Panchayats

46
Role of Grama Panchayats in Waste Management and Environment Protection
the case is different in Nenmeni where only 35 percent use LPG and majority (65 percent) depend on firewood. This could be due to the fact that availability of firewood is high in Nenmeni compared to other sample G.Ps. On the whole only a negligible segment is using electricity, kerosene, etc. for cooking.
5.2.5. Arrangements for Disposal of Septage and Liquid Waste
A very high proportion of sample households (98 percent) have access to toilet facilities either inside the house (61 percent), outside the house but within the premises (33 percent) or outside the premises (3 percent) (Table 5.8). A few sample households in Ezhikkara, Marutharode and
Table: 5.7: Basic Amenities of Sample HouseholdsSl.
No.Basic Amenities (i) Ezhikkara Kanjiramku-
lamMarutharode Nenmeni Total
1 Number of rooms 89 (100.00) 95 (100.00) 161 (100.00) 166(100.00) 511(100.00)1-3 26 (29.22) 13 (13.68) 28 (17.40) 9 (5.43) 76 (14.87)4-6 59 (66.29) 56 (58.95) 119 (73.90) 125(75.30) 359 (70.25)7-9 4 (4.49) 23 (24.21) 10 (6.20) 31 (18.67) 68 (13.31)>9 0 (0.00) 3 (3.16) 4 (2.50) 1 (0.60) 8 (1.57)
2 Number of bath rooms inside the house
89 (100.00) 95 (100.00) 161 (100.00) 166(100.00) 511(100.00)
1 31 (34.80) 32 (33.60) 31 (19.25) 54 (32.50) 148 (28.96)2-3 15 (16.90) 30 (31.60) 59 (36.65) 12 (7.30) 116 (22.70)>3 1 (1.10) 3 (3.2) 4 (2.50) 4 (2.40) 12 (2.35)Nil 42 (47.20) 30 (31.60) 67 (41.60) 96 (57.80) 235 (45.99)
3 Number of bath rooms outside the house but within the premises
89 (100.00) 95 (100.00) 161 (100.00) 166 (100.00) 511(100.00)
1 61 (68.55) 81 (85.30) 83 (51.60) 131(78.90) 356(69.67)2 1 (1.10) 3 (3.10) 5 (3.10) 4 (2.40) 13 (2.54)Nil 27 (30.35) 11 (11.60) 73 (45.30) 31 (18.70) 142 (27.79)
4 Primary source of energy for lighting
89 (100.00) 95 (100.00) 161 (100.00) 166 (100.00) 511(100.00)
Kerosene 2 (2.20) 0 (0.00) 4 (2.50) 8 (4.80) 14 (2.74)Candle 0 (0.00) 0 (0.00) 2 (1.20) 0 (0.00) 2 (0.39)Electricity 87 (97.80) 95 (100.00) 155 (96.30) 158 (95.20) 495 (96.87)
5 Primary source of energy for cooking
89 (100.00) 95 (100.00) 161 (100.00) 166 (100.00) 511 (100.00)
Firewood & chips 4 (4.50) 24 (25.20) 43 (26.80) 109(65.70) 180 (35.23)Kerosene 0 (0.00) 2 (2.20) 2 (1.20) 0 (0.00) 4(0.78)LPG/natural gas 83 (93.30) 68 (71.50) 115 (71.40) 53 (31.90) 319 (62.41)Electricity 2 (2.20) 1 (1.10) 0 (0.00) 0 (0.00) 3 (0.59)Coke/coal 0 (0.00) 0 (0.00) 1 (0.60) 1 (0.60) 2 (0.39)Charcoal 0 (0.00) 0 (0.00) 0 (0.00) 2 (1.20) 2 (0.39)Gobar gas 0 (0.00) 0 (0.00) 0 (0.00) 1 (0.60) 1 (0.21)
Source: Primary data (Figures in brackets are percentages)

47
Nenmeni do not have toilet facilities of their own and are using common facility (0.98 percent). In Kanjiramkulam, Marutharode and Nenmeni, some households are defecating in the open- with largest number being observed in Marutharode which also reported signifi cant presence of labour from neighbouring state of Tamil Nadu. Th e study thus reveals prevalence, though small in number, of open defecation even in G.Ps which are declared to be Nirmal G.Ps and indicates that migrant labour poses serious challenges to the sanitation achievements in Kerala. In Ezhikkara G.P, another sanitation challenge observed was makeshift toilets constructed on backwaters. Such structures, observed in households with limited land and located on the banks of canals and backwaters, were fi xed to the fl oor of water bodies using wooden poles, had a covering made of tarpaulin sheets and discharged their septage waste directly into the water bodies below (Figure 5.1). Th is points to one of the serious issues faced by LGs in coastal areas i.e, need to construct, eco-friendly, comfortable toilet system for the people living on the banks of the back waters.
With regard to discharge of waste from toilets, more than 68 percent households of all sample Panchayats fl ush to septic tanks. Other pattern which is common in use is pit toilets with nearly one fourth of sample households using such models. Use of such toilets was observed to be particularly high in lowland Panchayat of Kanjiramkulam
(37 percent) characterised by loose red soil posing high risk of contamination to adjacent water bodies. Ring type of toilet is another type which is observed more in Ezhikkara Panchayat -the low land coastal Panchayat with porous, sandy soil. 19 percent of households in Ezhikkara were observed to be using such ring pits which are another potential source of soil-water contamination particularly during monsoon season when the rings overfl ow. Th is indicates that now Kerala needs to go further on sanitation front by focusing on upgrading the type/ quality of toilets
Table: 5.8: Toilet facilities and Disposal of Septage
Sl.No.
Basic Amenities (ii) Ezhikkara Kanjiramkulam Marutharode Nenmeni Total
1 Toilet facility 89 (100.00) 95 (100.00) 161 (100.00) 166(100.00) 511(100.00)Within the house 87 (97.80) 65 (68.40) 78 (48.50) 83 (50.00) 313(61.25)Within own premises
1 (1.10) 29 (30.50) 70 (43.50) 70 (42.20) 170(33.27)
Outside own premises
0 (0.00) 0 (0.00) 7 (4.30) 9 (5.40) 16 (3.13)
Common facility 1 (1.10) 0 (0.00) 2 (1.20) 2 (1.20) 5 (0.98)Open space 0 (0.00) 1 (1.10) 4 (2.50) 1 (0.60) 6 (1.17)Others 0 (0.00) 0 (0.00) 0 (0.00) 1 (0.60) 1 (0.20)
2 Type of toilet 89 (100.00) 95 (100.00) 161 (100.00) 166(100.00) 511(100.00)Pit 12 (13.50) 35 (36.70) 38 (23.60) 40 (24.10) 125 (24.46)Flush to water bodies
3 (3.40) 1 (1.10) 2 (1.20) 2 (1.20) 8 (1.57)
Flush to septic tank
54 (60.70) 58 (61.10) 116 (72.00) 122 (73.50) 350 (68.49)
Ring 17 (19.00) 0 (0.00) 0 (0.00) 0 (0.00) 17 (3.33)Others 3 (3.40) 1 (1.10) 5 (3.20) 2 (1.20) 11 (2.15)
Source: Primary data (Figures in brackets are percentages)
92
Decentralisation Analysis Cell (DAC)
Figure 5.1:Makeshift toilet in Ezhikkara Panchayat
With regard to discharge of waste from toilets, more than 68 percent households of all
sample Panchayats flush to septic tanks. Other pattern which is common in use is pit toilets
with nearly one fourth of sample households using such models. Use of such toilets was
observed to be particularly high in lowland Panchayat of Kanjiramkulam (37 percent)
characterised by loose red soil posing high risk of contamination to adjacent water bodies.
Ring type of toilet is another type which is observed more in Ezhikkara Panchayat -the low
land coastal Panchayat with porous, sandy soil. 19 percent of households in Ezhikkara were
observed to be using such ring pits which are another potential source of soil-water
contamination particularly during monsoon season when the rings overflow. This indicates
that now Kerala needs to go further on sanitation front by focusing on upgrading the type/
quality of toilets constructed.
Despite over 90 percent of the sample units owning their own houses, living in semi
pucca and pucca houses, almost all units having electricity connection and more than 60
percent having LPG for cooking purpose, very few had proper drainage system for the
disposal of liquid waste from kitchen and bathrooms. Only 8 percent of the entire sample
households had soak pits for disposal of liquid wastefrom kitchenand 16 percent fordisposal
of liquid waste frombathroom and wash basin. In all Panchayats, primary system for
disposing liquid waste from kitchen (68 percent), and bathroom and wash basin (57.5
percent), are discharging untreated waste water within their own compound. In Ezhikkara
liquid waste being discharged to water bodies is a common phenomenon with 12 percent and
15.7 percent of the sample households discharging their untreated kitchen and bathroom
liquid waste into water bodies.
Figure 5.1:Makeshift toilet in Ezhikkara Panchayat
Waste Management System in Sample Grama Panchayats

48
Role of Grama Panchayats in Waste Management and Environment Protection
constructed. Despite over 90 percent of the sample units owning
their own houses, living in semi pucca and pucca houses, almost all units having electricity connection and more than 60 percent having LPG for cooking purpose, very few had proper drainage system for the disposal of liquid waste from kitchen and bathrooms. Only 8 percent of the entire sample households had soak pits for disposal of liquid waste from kitchen and 16 percent for disposal of liquid waste from bathroom and wash basin. In all Panchayats, primary system for disposing liquid waste from kitchen (68 percent), and bathroom and wash basin (57.5 percent), are discharging untreated waste water within their own compound. In Ezhikkara liquid waste being discharged to water bodies is a common phenomenon with 12 percent and 15.7 percent of the sample households discharging
their untreated kitchen and bathroom liquid waste into water bodies.
The study shows that the water bodies of Ezhikkara are being contaminated by liquid wastes from kitchen and bathrooms generated even in those households having pucca buildings. On enquiry, Panchayat officials reported that despite repeated warnings, households continued to do the same.
5.2.6 Distance of Latrines, Waste Dumps from Water Bodies in Sample Households
The existence of own water bodies enhances water security of the people. Out of the total sample households majority have no water bodies in their premises and only 44 percent have such sources (Table 5.10). Of this, nearly 32 percent have well and 12 percent have tube well in their
Table: 5.9: System for Disposal of Liquid WasteSl.
No.Arrangements for disposal of liquid
waste
Ezhikkara Kanjiramku-lam
Marutharode Nenmeni Total
1 Liquid waste dis-posal from kitchen
89 (100.00) 95 (100.00) 161 (100.00) 166 (100.00) 511 (100.00)
No drain 1 (1.10) 0 (0.00) 0 (0.00) 0 (0.00) 1 (0.20)Flown within own compound
70 (78.70) 70 (73.60) 93 (57.76) 115 (69.28) 348 (68.10)
Flown outside the compound
1 (1.10) 6 (6.30) 6 (3.70) 20 (12..05) 33 (6.46)
To the road 0 (0.00) 1 (1.10) 3 (1.90) 2 (1.20) 6 (1.17)To water bodies 11 (12.40) 1 (1.10) 0 (0.00) 0 (0.00) 12 (2.35)Soak pit 5 (5.60) 9 (9.50) 18 (11.20) 11 (6.63) 43 (8.41)To open drain 0 (0.00) 2 (2.10) 17 (10.60) 13 (7.83) 32 (6.26)To closed drain 1 (1.10) 6 (6.30) 24 (14.90) 5 (3.01) 36 (7.05)Others 0 (0.00) 0 (0.00) 0 (0.00) 0 (0.00) 0 (0.00)
2 Liquid waste disposal from bath-room/wash basin
89 (100.00) 95 (100.00) 161 (100.00) 166(100.00) 511(100.00)
No drain 0 (0.00) 1 (1.10) 0 (0.00) 0 (0.00) 1 (0.20)Flown within own compound
68 (76.40) 49 (51.50) 89 (55.30) 88 (53.00) 294 (57.54)
Flown outside the compound
0 (0.00) 4 (4.20) 5 (3.10) 25 (15.10) 34 (6.65)
To the road 0 (0.00) 1 (1.10) 1 (0.60) 0 (0.00) 2 (0.39)To water bodies 14 (15.70) 0 (0.00) 0 (0.00) 1 (0.60) 15 (2.94)Soak pit 4 (4.50) 14 (14.70) 22 (13.70) 43 (25.90) 83 (16.24)To open drain 1 (1.10) 1 (1.10) 17 (10.60) 4 (2.40) 23 (4.50)To closed drain 1 (1.10) 25 (26.30) 26 (16.10) 5 (3.00) 57 (11.15)Others 1 (1.20) 0 (0.00) 1 (0.60) 0 (0.00) 2 (0.39)
Source: Primary data (Figures in brackets are percentages)
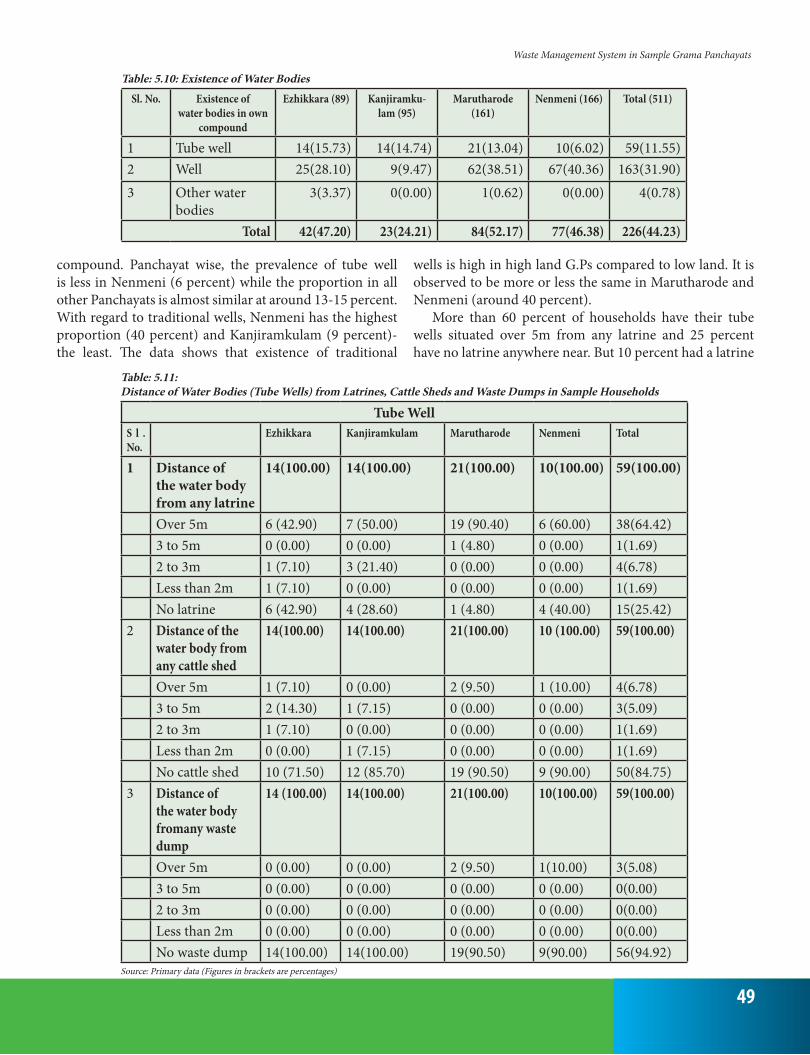
49
compound. Panchayat wise, the prevalence of tube well is less in Nenmeni (6 percent) while the proportion in all other Panchayats is almost similar at around 13-15 percent. With regard to traditional wells, Nenmeni has the highest proportion (40 percent) and Kanjiramkulam (9 percent)- the least. The data shows that existence of traditional
wells is high in high land G.Ps compared to low land. It is observed to be more or less the same in Marutharode and Nenmeni (around 40 percent).
More than 60 percent of households have their tube wells situated over 5m from any latrine and 25 percent have no latrine anywhere near. But 10 percent had a latrine
Table: 5.10: Existence of Water BodiesSl. No. Existence of
water bodies in own compound
Ezhikkara (89) Kanjiramku-lam (95)
Marutharode (161)
Nenmeni (166) Total (511)
1 Tube well 14(15.73) 14(14.74) 21(13.04) 10(6.02) 59(11.55)2 Well 25(28.10) 9(9.47) 62(38.51) 67(40.36) 163(31.90)3 Other water
bodies3(3.37) 0(0.00) 1(0.62) 0(0.00) 4(0.78)
Total 42(47.20) 23(24.21) 84(52.17) 77(46.38) 226(44.23)
Table: 5.11: Distance of Water Bodies (Tube Wells) from Latrines, Cattle Sheds and Waste Dumps in Sample Households
Tube WellS l .No.
Ezhikkara Kanjiramkulam Marutharode Nenmeni Total
1 Distance of the water body from any latrine
14(100.00) 14(100.00) 21(100.00) 10(100.00) 59(100.00)
Over 5m 6 (42.90) 7 (50.00) 19 (90.40) 6 (60.00) 38(64.42)3 to 5m 0 (0.00) 0 (0.00) 1 (4.80) 0 (0.00) 1(1.69)2 to 3m 1 (7.10) 3 (21.40) 0 (0.00) 0 (0.00) 4(6.78)Less than 2m 1 (7.10) 0 (0.00) 0 (0.00) 0 (0.00) 1(1.69)No latrine 6 (42.90) 4 (28.60) 1 (4.80) 4 (40.00) 15(25.42)
2 Distance of the water body from any cattle shed
14(100.00) 14(100.00) 21(100.00) 10 (100.00) 59(100.00)
Over 5m 1 (7.10) 0 (0.00) 2 (9.50) 1 (10.00) 4(6.78)3 to 5m 2 (14.30) 1 (7.15) 0 (0.00) 0 (0.00) 3(5.09)2 to 3m 1 (7.10) 0 (0.00) 0 (0.00) 0 (0.00) 1(1.69)Less than 2m 0 (0.00) 1 (7.15) 0 (0.00) 0 (0.00) 1(1.69)No cattle shed 10 (71.50) 12 (85.70) 19 (90.50) 9 (90.00) 50(84.75)
3 Distance of the water body fromany waste dump
14 (100.00) 14(100.00) 21(100.00) 10(100.00) 59(100.00)
Over 5m 0 (0.00) 0 (0.00) 2 (9.50) 1(10.00) 3(5.08)3 to 5m 0 (0.00) 0 (0.00) 0 (0.00) 0 (0.00) 0(0.00)2 to 3m 0 (0.00) 0 (0.00) 0 (0.00) 0 (0.00) 0(0.00)Less than 2m 0 (0.00) 0 (0.00) 0 (0.00) 0 (0.00) 0(0.00)No waste dump 14(100.00) 14(100.00) 19(90.50) 9(90.00) 56(94.92)
Source: Primary data (Figures in brackets are percentages)
Waste Management System in Sample Grama Panchayats

50
Role of Grama Panchayats in Waste Management and Environment Protection
located within 5m which is against the rules stipulated and pose a source of contamination of these water bodies. Around 84 percent had no cattle shed near the water source but 8 percent had cattle shed within 5 meters which are also potential sources of contamination (Table 5.11). It was observed that there was no waste dump near the water source for 95 percent of the households while 9.5 percent and 10 percent households in Marutharode and Nenmeni were found to have waste dumps situated relatively close though only at a distance of over the stipulated 5m.
In the case of traditional wells, 14 percent are located within 5 metres distance from latrines, 8 percent are located within 5 metres distance from cattle sheds and 5 percent are located within 5 metres from waste dumps all of which could be potential sources of contamination (Table 5.12).
5.2.7 Arrangements for Solid Waste Management by G.Ps
With regard to arrangements for solid waste management by the G.Ps, all sample units reported that there is no arrangement for collection of waste by local government, no dump yard for its disposal, no incinerator for burning and no plastic recycling plant (Table 5.13).
A small proportion (11.15 percent) reported that the G.Ps are giving assistance for setting up biogas plant which they have availed. Very few also reported that they have attended training programmes on waste management conducted by the G.Ps. The results of the primary survey re-iterate our earlier finding that no institutional arrangements for solid waste collection and disposal system are provided in the G.Ps. The strategy being adopted by Local Governments
Table: 5.12: Distance of Water Bodies (Wells) from Latrines, Cattle Sheds and Waste Dumps in Sample Households
Traditional WellSl.
No.Ezhikkara Kanjiramkulam Marutharode Nenmeni Total
1 Distance of the water body from any latrine
25(100.00) 9(100.00) 62(100.00) 67(100.00) 163 (100.00)
Over 5m 10 (40.00) 6 (66.70) 53 (85.50) 28 (41.80) 97 (59.50)3 to 5m 3 (12.00) 0 (0.00) 5 (8.10) 7 (10.40) 15 (9.20)2 to 3m 1 (4.00) 0 (0.00) 2 (3.20) 4 (6.00) 7 (4.30)Less than 2m 0 (0.00) 0 (0.00) 1 (1.60) 0 (0.00) 1 (0.60)No latrine 11 (44.00) 3 (33.30) 1 (1.60) 28 (41.80) 43 (26.40)
2 Distance of the water body from any cattle shed
25 (100.00) 9 (100.00) 62 (100.00) 67 (100.00) 163(100.00)
Over 5m 0 (0.00) 1 (11.10) 4 (6.50) 10 (14.90) 15(9.20)3 to 5m 0 (0.00) 1 (11.10) 0 (0.00) 7 (10.40) 8(4.90)2 to 3m 0 (0.00) 0 (0.00) 1 (1.60) 2 (3.10) 3(1.80)Less than 2m 3 (12.00) 0 (0.00) 0 (0.00) 0 (0.00) 3(1.80)No cattle shed 22 (88.00) 7 (77.80) 57 (91.90) 48 (71.60) 134(82.30)
3 Distance of the water body from any waste dump
25 (100.00) 9(100.00) 62 (100.00) 67 (100.00) 163(100.00)
Over 5m 1 (4.00) 2 (22.20) 1 (1.60) 7 (10.40) 11(6.75)3 to 5m 0 (0.00) 0 (0.00) 1 (1.60) 6 (9.00) 7(4.29)2 to 3m 1 (4.00) 0 (0.00) 0 (0.00) 0 (0.00) 1(0.62)Less than 2m 0 (0.00) 0 (0.00) 0 (0.00) 0 (0.00) 0(0.00)No waste dump 23 (92.00) 7 (77.80) 60 (96.80) 54 (80.60) 144(88.34)
Source: Primary data (Figures in brackets are percentages)

51
is promotion of decentralised treatment of organic waste in individual households. However the participation of households in such schemes is rather limited.
5.2.8 Solid Waste Generation and DisposalThis section analyses generation and disposal
arrangements for common types of waste in the sample households. This is examined for both biodegradable and non biodegradable components such as food, vegetables, fish and meat, paper/ card board, plastics, sanitary items, electrical waste, medical waste, etc.
5.2.8.1 Food WasteAlmost all households generate food waste (99.7 percent)
but only 39 percent reported separation of this waste for disposal (Table 5.14). In Ezhikkara, around 61 percent households reported that they separated the generated food waste while in Marutharode half of the households separated. Majority of the households in Kanjiramkulam and Nenmeni reported that food waste was generated but not separated.
For those who generate but do not separate food waste, the important methods of disposal were bio disposal, throwing within the compound and throwing outside the compound. Using the method of bio disposal was high in Nenmeni (44 percent), throwing waste within the
compound was high in Kanjiramkulam whereas throwing outside the compound was high in Marutharode. Burying in soil, making compost and other methods which include throwing in water bodies, dumping on road corners, burning, making bio-gas and handing over to waste collectors was also found in all Panchayats in a small proportion.
Bio-disposal and throwing within the compound were the main disposal pattern for those who generated and separated food waste. Around 54 percent households used the method of bio-disposal and 17 percent threw the waste within their compound. In Kanjiramkulam food wastes generated and separated for bio- disposal was reported from 91 percent of the households. In Nenmeni (76 percent) a high proportion reported bio disposal and in Marutharode half of the households reported this. The proportion of households who throw food waste within the compound was high in Ezhikkara (61 percent). Throwing outside the compound, making compost, giving to waste collectors and other methods which include burying underground, making bio-gas and burning were also seen in all Panchayats but its proportion was less. The data shows that households separated generated food wastes mainly for bio- disposal which was particularly high in Panchayats without urban proximity. Also food wastes were thrown within and outside the compound which was a common
Table: 5.13: Arrangements for Solid Waste Management by G.Ps
Sl.No.
Activity Ezhikkara (89)
Kanjiram-kulam (95)
Marutharode (161)
Nenmeni (166)
Total (511)
1 Arrangement for waste collection by local government
Nil Nil Nil Nil Nil
2 Dump yard for waste disposal
Nil Nil Nil Nil Nil
3 Incinerator for burn-ing waste
Nil Nil Nil Nil Nil
4 Bio-gas plant assist-ed/set-up by the local government
16(17.98) 20(21.05) 3(1.86) 18(10.84) 57(11.15)
5 Training courses on waste management by the local govern-ment
21(23.60) 8(8.42) 14(8.69) 57(34.34) 100(19.57)
6 Plastic re-cycling plant
Nil Nil Nil Nil Nil
Source: Primary data (Figures in brackets are percentages)
Waste Management System in Sample Grama Panchayats

52
Role of Grama Panchayats in Waste Management and Environment Protection
phenomenon for both separated and not separated waste categories.
5.2.8.2 Vegetable WasteMore than 98 percent of the total sample households
generate vegetable waste. Among this, around 64 percent generated but did not separate the waste and 34 percent generated and separated the waste (Table 5.15).
Among those who generated but did not separate
vegetable waste, throwing within compound and outside the compound (around 27 percent each) was the common pattern of disposal. Burying in soil (18 percent) and bio disposal (14 percent) were also common in all Panchayats. Other method of disposal seen in all Panchayats were making compost, throwing in water bodies, dumping on road corners, burning, taken by waste collectors and making bio-gas.
Bio disposal was the most common method of disposal
Table: 5.14: Food waste - Generation & DisposalSl .No. Food waste - Generation & disposal
Generation Ezhikkara Kanjiramkulam Marutharode Nenmeni Total1. Not generated 1 (1.13) 1 (1.10) 0 (0.00) 0 (0.00) 2(0.40)2. Generated but
not separated34 (38.20) 83 (87.30) 79 (49.10) 112 (67.50) 308(60.27)
3. Generated and separated
54(60.67) 11(11.60) 82 (50.90) 54 (32.50) 201(39.33)
Total 89 (100.00) 95 (100.00) 161 (100.00) 166(100.00) 511(100.00)A Food waste generated but not separated- Method of disposal
Method of disposal Ezhikkara Kanjiramkulam Marutharode Nenmeni Total
1 Throw within the compound
17 (50.00) 31(37.35) 11(13.92) 13(11.61) 72(23.38)
2 Throw outside the compound
0(0.00) 5(6.02) 28(35.44) 23(20.54) 56(18.18)
3 Bury under-ground
2(5.89) 3 (3.61) 15 (18.99) 16 (14.28) 36(11.69)
4 Make compost 0 (0.00) 0 (0.00) 3 (3.80) 7 (6.25) 10(3.25)5 Bio disposal 12 (35.29) 15 (18.07) 16(20.25) 49 (43.75) 92(29.87)6 Other means 3 (8.82) 29 (34.95) 6 (7.60) 4 (3.57) 42(13.63)
Total 34 (100.00) 83 (100.00) 79 (100.00) 112(100.00) 308(100.00)B Food waste generated and separated- Method of disposal
Method of disposal
Ezhikkara Kanjiramkulam Marutharode Nenmeni Total
1 Throw within the compound
33 (61.11) 0 (0.00) 2(2.40) 0 (0.00) 35(17.41)
2 Throw outside the Compound
2 (3.70) 0 (0.00) 9(11.00) 9 (16.70) 20(9.95)
3 Make compost 3 (5.56) 0 (0.00) 14 (17.10) 0 (0.00) 17(8.46)4 Taken by waste
collectors0 (0.00) 0 (0.00) 12 (14.62) 0 (0.00) 12(5.97)
5 Bio disposal 16 (29.63) 10(90.90) 41 (50.00) 41 (75.90) 108(53.73)6 Other means 0 (0.00) 1 (9.10) 4 (4.88) 4 (7.40) 9(4.48)
Total 54 (100.00) 11 (100.00) 82 (100.00) 54 (100.00) 201(100.00)Source: Primary data (Figures in brackets are percentages)

53
used by households who generated and separated vegetable waste. It comes to around 42 percent. In sample G.Ps that have livestock rearing, separated vegetable wastes are disposed as feed for cattle, goat, etc. Throwing outside the compound (15 percent), throwing within the compound (12 percent) and making compost (10 percent) were also commonly practiced. Burying underground, taken by waste collectors and other means which include throwing
in water bodies, dumping in road corners and making bio-gas were also prevalent in all Panchayats in a minor proportion.
5.2.8.3 Fish & Meat WasteAround 87 percent of the sample households generate
fish and meat waste (Table 5.16). In Marutharode more than one third of the households reported that they did not
Table: 5.15: Vegetable wastes - Generation & Disposal
Sl. No.
Vegetable waste - Generation & disposal
Generation Ezhikkara Kanjiramkulam Marutharode Nenmeni Total1. Not generated 3 (3.40) 1 (1.00) 0 (0.00) 3 (1.80) 7(1.37)2. Generated but
not separated46 (51.70) 85 (89.50) 88 (54.70) 111 (66.90) 330(64.58)
3. Generated and separated
40 (44.90) 9 (9.50) 73 (45.30) 52 (31.30) 174(34.05)
Total 89 (100.00) 95 (100.00) 161(100.00) 166(100.00) 511(100.00)A Vegetable waste generated but not separated- Method of disposal
Method of disposal
Ezhikkara Kanjiramku-lam
Marutharode Nenmeni Total
1 Throw within the compound
3 (6.50) 46 (54.10) 13 (14.80) 26 (23.40) 88(26.67)
2 Throw outside the compound
14 (30.40) 6 (7.10) 40 (45.50) 29 (26.20) 89(26.97)
3 Bury under-ground
5 (10.9) 9 (10.60) 22 (25.0) 22 (19.80) 58(17.58)
4 Make compost 0 (0.00) 2 (2.40) 4 (4.50) 9 (8.10) 15(4.55)5 Bio disposal 20 (43.50) 3 (3.50) 2 (2.30) 21 (18.90) 46 (13.93)6 Other means 4 (8.70) 19 (22.30) 7 (7.90) 4 (3.60) 34(10.30)
Total 46 (100.00) 85 (100.00) 88 (100.00) 111(100.00) 330(100.00)B Vegetable waste generated and separated- Method of disposal
Method of disposal Ezhikkara Kanjiramkulam Marutharode Nenmeni Total1 Throw within
the compound15 (37.50) 0 (0.00) 4 (5.50) 2 (3.80) 21(12.07)
2 Throw outside the compound
1 (2.50) 0 (0.00) 17 (23.30) 8 (15.40) 26(14.94)
3 Bury under-ground
3 (7.50) 0 (0.00) 5 (6.80) 2 (3.84) 10(5.75)
4 Make compost 3 (7.50) 0 (0.00) 15 (20.50) 0 (0.00) 18(10.34)5 Taken by waste
collectors0 (0.00) 0 (0.00) 10 (13.70) 0 (0.00) 10(5.75)
6 Bio disposal 18 (45.00) 8 (88.90) 14 (19.20) 33 (63.50) 73(41.96)7 Other means 0 (0.00) 1 (11.10) 8 (11.00) 7 (13.46) 16(9.19)
Total 40 (100.00) 9 (100.00) 73 (100.00) 52 (100.00) 174(100.00)Source: Primary data (Figures in brackets are percentages)
Waste Management System in Sample Grama Panchayats

54
Role of Grama Panchayats in Waste Management and Environment Protection
generate such waste. Compared to other sample G.Ps the people of Marutharode reported that they do not buy fish or meat regularly and do so only once in a week or two weeks.
Out of the total sample households around 52 percent reported that they did not separate the generated fish and meat waste and 34 percent separated the waste. Throwing within the compound (26 percent), outside the compound (22 percent), bio disposal (21 percent) and burying
underground (14 percent) were the common methods used for disposal of fish and meat waste, which was generated but not separated. Other methods used for this include throwing in water bodies, dumping in road corners, burning, and making compost, giving to waste collectors and making biogas. Marutharode was the Panchayat which had more households with little land. So throwing outside the compound was high there. In Ezhikkara, Kanjiramkulam and Nenmeni among those who did not
Table: 5.16: Fish & Meat Waste - Generation & Disposal
Sl. No.
Fish & Meat waste - Generation & disposal
Generation Ezhikkara Kanjiramkulam Marutharode Nenmeni Total1. Not generated 2 (2.20) 1 (1.10) 58 (36.10) 7 (4.30) 68(13.32)2. Generated but
not separated28 (31.50) 80 (84.20) 59 (36.60) 101 (60.80) 268(52.44)
3. Generated and separated
59 (66.30) 14 (14.70) 44 (27.30) 58 (34.90) 175(34.24)
Total 89 (100.00)
95 (100.00) 161 (100.00) 166(100.00) 511(100.0)
A Fish & meat waste generated but not separated- Method of disposalMethod of disposal
Ezhikkara Kanjiramkulam Marutharode Nenmeni Total
1 Throw within the compound
15 (53.60) 34 (42.50) 9 (15.30) 12 (11.90) 70(26.12)
2 Throw outside the compound
0 (0.00) 4 (5.00) 24 (40.70) 32 (31.70) 60(22.39)
3 Bury under-ground
5 (17.90) 3 (3.80) 13 (22.30) 16 (15.80) 37(13.81)
4 Bio disposal 4 (14.30) 14 (17.50) 9 (15.0) 30 (29.80) 57(21.26)5 Other means 4 (14.20) 25 (31.20) 4 (6.70) 11 (10.80) 44(16.42)
Total 28 (100.00) 80 (100.00) 59 (100.00) 101(100.00) 268(100.00)B Fish & meat waste generated and separated- Method of disposal
Method of disposal
Ezhikkara Kanjiramkulam Marutharode Nenmeni Total
1 Throw within the compound
13 (22.00) 0 (0.00) 2 (4.50) 7 (12.10) 22(12.57)
2 Throw outside the compound
1 (1.70) 0 (0.00) 11 (25.00) 13 (22.40) 25(14.28)
3 Bury under-ground
6 (10.30) 1 (7.10) 4 (9.20) 2 (3.40) 13(7.43)
4 Bio disposal 35 (59.30) 9 (64.30) 24 (54.50) 32 (55.20) 100(57.15)5 Other means 4 (6.70) 4 (28.60) 3 (6.80) 4 (6.90) 15(8.57)
Total 59 (100.00) 14 (100.00) 44 (100.00) 58 (100.00) 175(100.00)Source: Primary data (Figures in brackets are percent ages)
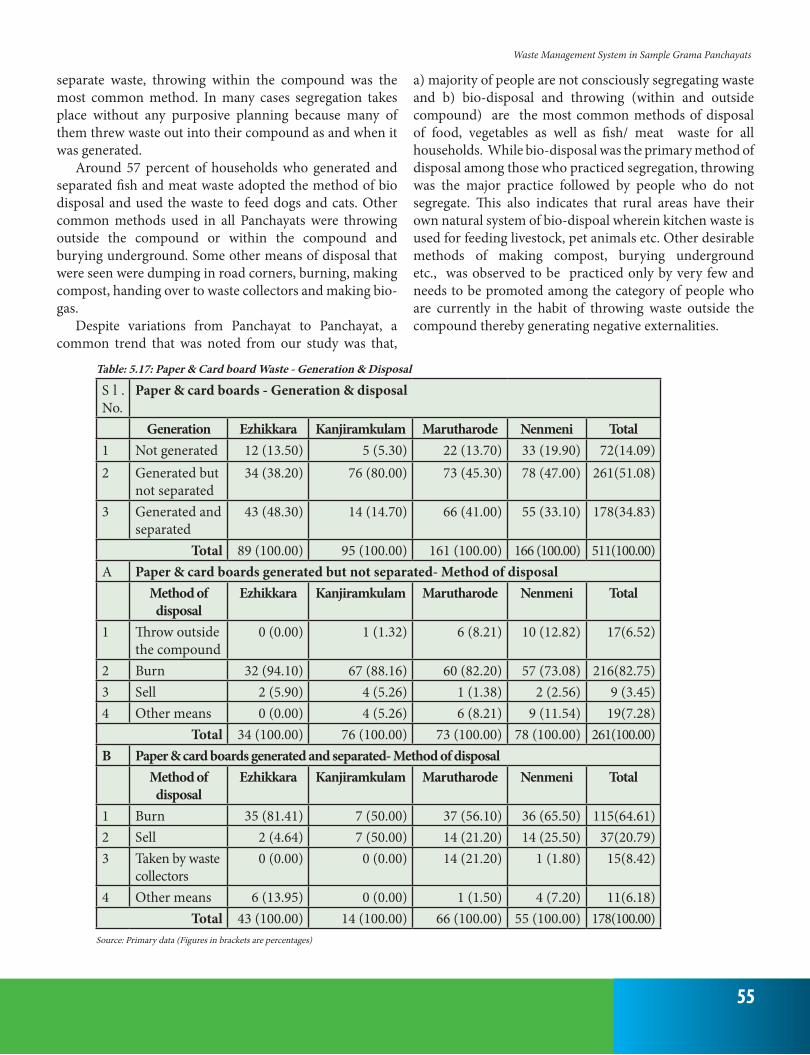
55
separate waste, throwing within the compound was the most common method. In many cases segregation takes place without any purposive planning because many of them threw waste out into their compound as and when it was generated.
Around 57 percent of households who generated and separated fish and meat waste adopted the method of bio disposal and used the waste to feed dogs and cats. Other common methods used in all Panchayats were throwing outside the compound or within the compound and burying underground. Some other means of disposal that were seen were dumping in road corners, burning, making compost, handing over to waste collectors and making bio-gas.
Despite variations from Panchayat to Panchayat, a common trend that was noted from our study was that,
a) majority of people are not consciously segregating waste and b) bio-disposal and throwing (within and outside compound) are the most common methods of disposal of food, vegetables as well as fish/ meat waste for all households. While bio-disposal was the primary method of disposal among those who practiced segregation, throwing was the major practice followed by people who do not segregate. This also indicates that rural areas have their own natural system of bio-dispoal wherein kitchen waste is used for feeding livestock, pet animals etc. Other desirable methods of making compost, burying underground etc., was observed to be practiced only by very few and needs to be promoted among the category of people who are currently in the habit of throwing waste outside the compound thereby generating negative externalities.
Table: 5.17: Paper & Card board Waste - Generation & Disposal
S l . No.
Paper & card boards - Generation & disposal
Generation Ezhikkara Kanjiramkulam Marutharode Nenmeni Total1 Not generated 12 (13.50) 5 (5.30) 22 (13.70) 33 (19.90) 72(14.09)2 Generated but
not separated34 (38.20) 76 (80.00) 73 (45.30) 78 (47.00) 261(51.08)
3 Generated and separated
43 (48.30) 14 (14.70) 66 (41.00) 55 (33.10) 178(34.83)
Total 89 (100.00) 95 (100.00) 161 (100.00) 166 (100.00) 511(100.00)A Paper & card boards generated but not separated- Method of disposal
Method of disposal
Ezhikkara Kanjiramkulam Marutharode Nenmeni Total
1 Throw outside the compound
0 (0.00) 1 (1.32) 6 (8.21) 10 (12.82) 17(6.52)
2 Burn 32 (94.10) 67 (88.16) 60 (82.20) 57 (73.08) 216(82.75)3 Sell 2 (5.90) 4 (5.26) 1 (1.38) 2 (2.56) 9 (3.45)4 Other means 0 (0.00) 4 (5.26) 6 (8.21) 9 (11.54) 19(7.28)
Total 34 (100.00) 76 (100.00) 73 (100.00) 78 (100.00) 261(100.00)B Paper & card boards generated and separated- Method of disposal
Method of disposal
Ezhikkara Kanjiramkulam Marutharode Nenmeni Total
1 Burn 35 (81.41) 7 (50.00) 37 (56.10) 36 (65.50) 115(64.61)2 Sell 2 (4.64) 7 (50.00) 14 (21.20) 14 (25.50) 37(20.79)3 Taken by waste
collectors0 (0.00) 0 (0.00) 14 (21.20) 1 (1.80) 15(8.42)
4 Other means 6 (13.95) 0 (0.00) 1 (1.50) 4 (7.20) 11(6.18)Total 43 (100.00) 14 (100.00) 66 (100.00) 55 (100.00) 178(100.00)
Source: Primary data (Figures in brackets are percentages)
Waste Management System in Sample Grama Panchayats

56
Role of Grama Panchayats in Waste Management and Environment Protection
5.2.8.4 Paper & Card Board WasteRegarding paper and cardboard, around 86 percent
generate such waste and 14 percent sample units do not. More than half reported that they generated but did not separate it for disposal and 35 percent generated and separated such waste (Table 5.17). Most of the households (83 percent) who generated but did not separate this kind of waste, burnt it. Throwing outside the compound was also practised. Other methods include throwing within the compound, burying underground, giving to waste collectors, throwing into water bodies etc.
Around 65 percent of households who generated and separated paper and cardboard waste burnt it and 21 percent sold it to recyclers. Around 8 percent said that it was taken by waste collectors and other means of disposal
included throwing within or outside the compound, dumping in road corners and burying underground.
5.2.8.5 Plastic WasteGeneration and disposal pattern of plastic waste is a
burning issue of the state. The study shows that 97 percent of households are generating plastic waste which includes both plastic bottles and covers of which 63 percent were not separating this waste (Table 5.18) while only around 34 percent households were separating for disposal.
In Marutharode, nearly 47 percent households separate this because waste collectors of nearby Palakkad municipality extended their collection system to some areas of Marutharode Panchayat due to special initiatives taken by some households. In Nenmeni also 33 percent
Table: 5.18: Plastic Waste - Generation & Disposal
Sl.No.
Plastics - Generation & disposal
Generation Ezhikkara Kanjiramkulam Marutharode Nenmeni Total
1 Not generated 3 (3.40) 0 (0.00) 10 (6.20) 1 (0.60) 14(2.74)2 Generated but
not separated55 (61.80) 81 (85.30) 76 (47.20) 110 (66.30) 322(63.02)
3 Generated and separated
31 (34.80) 14 (14.70) 75 (46.60) 55 (33.10) 175(34.24)
Total 89 (100.00) 95 (100.00) 161 (100.00) 166 (100.00) 511(100.00)A Plastics generated but not separated- Method of disposal
Method of disposal Ezhikkara (55) Kanjiramkulam (81)
Marutharode (76)
Nenmeni (110) Total (322)
1 Throw outside the compound
0 (0.00) 2 (2.47) 14 (18.42) 3 (2.72) 19(5.90)
2 Bury under-ground
0 (0.00) 4 (4.94) 0 (0.00) 4 (3.64) 8(2.48)
3 Burn 53 (96.36) 67 (82.71) 55 (72.37) 99 (90.00) 274 (85.10)4 Taken by waste
collectors0 (0.00) 0 (0.00) 6 (7.90) 2 (1.82) 8(2.48)
5 Other means 2 (3.64) 8 (9.88) 3 (3.94) 5 (4.55) 18(5.6)B Plastics generated and separated- Method of disposal
Method of disposal Ezhikkara(31) Kanjiramkulam (14)
Marutharode (75)
Nenmeni (55) Total (175)
1 Burn 28 (90.32) 13 (92.86) 42 (56.00) 36 (65.45) 119(68.00)2 Sell 1 (3.23) 1 (7.14) 18 (24.00) 6 (10.91) 26(14.86)3 Taken by waste
collectors0 (0.00) 0 (0.00) 19 (25.33) 6 (10.91) 25(14.28)
4 Other means 2 (6.45) 0 (0.00) 7 (9.33) 7 (12.73) 16(9.14)Source: Primary data (Figures in brackets are percentages)*For Marutharode and Nenmeni total figure is not matched because some households use two
type of disposal method.

57
separate this for giving it to recyclers without receiving any payment for the waste. In Ezhikkara 35 percent separate this because of the awareness programme arranged after the pilot study. Even though most of the households are aware that burning of plastic is harmful, the most common method used in all Panchayats for disposing plastic waste is open burning. And almost 85 percent of households who generate but do not separate plastic waste burn it. Throwing outside the compound, burying underground, selling, handing over to waste collectors and other means which include throwing within the compound, throwing into water bodies and dumping in road corners were also reported.
Among those who generated and separated plastic waste, 68 percent burn it. Around 15 percent said that they sell it while almost same proportion reported that it is taken by waste collectors. Other methods for disposing plastic waste included throwing outside the compound, throwing into water bodies, burying underground and dumping in road corners.
5.2.8.6 Sanitary WasteNearly half (49 percent) of the sample households
reported that they generate sanitary waste while remaining 51 percent reported that they did not generate such waste. Split up of the 49 percent who generate such waste revealed that 36 percent separated it while remaining 13 percent did not (Table 5.19).
Burning was the most common practice of disposal for those who separated or did not separate sanitary wastes. Those who generate but do not separate sanitary waste, burn this along with other waste like paper, plastic etc. Burying underground and other methods which include throwing within the compound and outside the compound was also being practiced by a few households.
5.2.8.7 Electrical WasteElectrical/electronic waste is another important
component which is generated from households. Around 55 percent of households reported to have no e-waste in the sense that it was not a common waste generated
Table: 5.19: Sanitary Waste - Generation & Disposal
Sl. No.
Sanitary waste - Generation & disposal
Generation Ezhikkara Kanjiramkulam Marutharode Nenmeni Total1 Not generated 21 (23.60) 51 (53.70) 92 (57.10) 98 (59.00) 262(51.27)2 Generated but
not separated1 (1.10) 35 (36.80) 9 (5.60) 21 (12.70) 66(12.91)
3 Generated and separated
67 (75.30) 9 (9.50) 60 (37.30) 47 (28.30) 183(35.82)
Total 89 (100.00) 95 (100.00) 161 (100.00) 166 (100.00) 511(100.00)
A Sanitary waste generated but not separated- Method of disposalMethod of disposal
Ezhikkara Kanjiramkulam Marutharode Nenmeni Total
1 Bury under-ground
0 (0.00) 0 (0.00) 0 (0.00) 6 (28.57) 6(9.09)
2 Burn 0 (0.00) 34 (97.14) 5 (55.56) 14 (66.67) 53(80.30)3 Other means 1 (100.00) 1 (2.86) 4 (44.44) 1 (4.76) 7(10.61)
Total 1 (100.00) 35 (100.00) 9 (100.00) 21 (100.00) 66(100.00)B Sanitary waste generated and separated- Method of disposal
Method of disposal
Ezhikkara Kanjiramkulam Marutharode Nenmeni Total
1 Burn 66 (98.50) 8 (88.89) 50 (83.33) 43 (91.49) 167(91.25)2 Other means 1 (1.50) 1 (11.11) 10 (16.67) 4 (8.51) 16(8.75)
Total 67 (100.00) 9 (100.00) 60 (100.00) 47 (100.00) 183(100.00)Source: Primary data (Figures in brackets are percentages)
Waste Management System in Sample Grama Panchayats

58
Role of Grama Panchayats in Waste Management and Environment Protection
Table: 5.20: Electrical Waste - Generation & disposal
Sl. No.
Electrical waste - Generation & disposal
Generation Ezhikkara Kanjiramkulam Marutharode Nenmeni Total
1 Not generated 60 (67.40) 65 (68.40) 113 (70.20) 45 (27.10) 283(55.38)2 Generated but not separated 8 (9.0) 29 (30.50) 13 (8.10) 51 (30.70) 101(19.77)3 Generated and separated 21 (23.60) 1 (1.10) 35 (21.70) 70 (42.20) 127(24.85)
Total 89 (100.00) 95 (100.00) 161 (100.00) 166(100.00) 511(100.00)A Electrical waste Generated but not Separated- Method of disposal
Method of disposal Ezhikkara Kanjiramkulam Marutharode Nenmeni Total
1 Throw within the compound 0 (0.00) 1 (3.40) 3 (23.10) 9 (17.60) 13(12.87)2 Throw outside the com-
pound1 (12.50) 3 (10.40) 6 (46.20) 6 (11.80) 16(15.84)
3 Dump in road corners 0 (0.00) 1 (3.40) 0 (0.00) 11 (21.60) 12(11.88)4 Bury underground 3 (37.50) 1 (3.40) 0 (0.00) 6 (11.80) 10(9.90)5 Sell 2 (25.00) 17 (58.70) 0 (0.00) 8 (15.70) 27 (26.73)6 Other means 2 (25.00) 6 (20.70) 4 (30.70) 11 (21.50) 23(22.78)
Total 8 (100.00) 29 (100.00) 13 (100.00) 51(100.00) 101(100.00)B Electrical waste Generated and Separated- Method of disposal
Method of disposal Ezhikkara Kanjiramkulam Marutharode Nenmeni Total
1 Throw within the compound 0 (0.00) 0 (0.00) 0 (0.00) 10 (14.30) 10(7.87)2 Throw outside the com-
pound1 (4.80) 1 (100.00) 10 (28.60) 5 (7.10) 17(13.38)
3 Dump in road corners 0 (0.00) 0 (0.00) 3 (8.60) 7 (10.00) 10(7.87)4 Bury underground 3 (14.30) 0 (0.00) 2 (5.70) 7 (10.00) 12(9.45)5 Sell 2 (9.50) 0 (0.00) 2 (5.70) 12 (17.20) 16(12.60)6 Burn 13 (61.90) 0 (0.00) 0 (0.00) 0 (0.00) 13(10.25)7 Taken by waste collectors 0 (0.00) 0 (0.00) 12 (34.30) 5 (7.10) 17(13.38)8 Other means 2 (9.50) 0 (0.00) 6 (17.10) 24 (34.30) 32(25.20)
Total 21 (100.00) 1 (100.00) 35 (100.00) 70(100.00) 127(100.00)Source: Primary data (Figures in brackets are percentages)
regularly and occured only once or twice in a year. Around 20 percent generated but did not separate and 25 percent separated the e-waste (Table 5.20). Majority of the households in all sample G.Ps reported that they did not generate e-waste except in Nenmeni. In Ezhikkara and Kanjiramkulam only one - third of households generated e-waste. In Marutharode only 30 percent generated e-waste and majority of them separated this waste. In Nenmeni 73 percent generated e-waste and most of them separated it and disposed it through other means.
In Ezhikkara, among those who did not separate e-waste, burying underground (37.5 percent), selling (25
percent), throwing outside the compound (12.5 percent), and other methods like throwing into water bodies and burning were the different methods of disposal. In Kanjiramkulam, methods for disposing e-waste include selling (59 percent), throwing outside the compound (10 percent), throwing inside the compound, dumping in road corners and burying underground (3.4 percent each) and other means including burning. Methods for disposing it in Marutharode include throwing outside the compound (46 percent), throwing within the compound (23 percent) and other means which include burning and taken by waste collectors. In Nenmeni, dumping on road corners

59
(21.6 percent), throwing within the compound (17.6 percent), selling (around 16 percent), throwing outside the compound and burying underground (12 percent each) and other methods like burning, giving to waste collectors, etc., were common.
For those who separated e-waste in Ezhikkara, burning (62 percent), burying underground (14 percent), selling (9.5 percent), throwing outside the compound (5 percent) and other methods like throwing into water bodies were the common methods of disposal. In Kanjiramkulam only one household was there in the category of separating e-waste and they threw it outside the compound. In Marutharode, 34 percent households gave it to waste collectors, around 29 percent threw it outside the compound, 9 percent dump on road corners, 5.7 percent each sold and buried underground. In Nenmeni other methods (34 percent) which include storing within a safe place, selling (17 percent), throwing within the compound (14 percent), burying underground, dumping on road corners, giving to waste collectors, throwing outside the compound were the common methods of disposal.
The study shows that there is no suitable method of
disposing e-waste and households reported that they have no clue as to how to dispose such waste. This is a major issue considering the health hazards of e-waste entering soil, water streams and getting mixed with other waste.
5.2.8.8 Medical WasteWith regard to generation of medical waste, 68 percent
of households reported that they did not generate medical waste. Proportion of those who generated but did not separate and those who generated and separated medical waste was almost similar, which was around 16 percent (Table 5.21). Burning and throwing outside the compound were the common methods for disposing medical waste. Other methods included burying underground, taken away by waste collectors, dumping on road corners, etc.
Analysis of disposal pattern of major non-kitchen waste indicates that burning was the most common method of disposal of paper, plastic and sanitary waste. In the case of electrical waste, main methods were throwing (in and outside own compound) and selling while in the case of medical waste it was burning and throwing outside the compound.
Table: 5.21: Medical Waste - Generation & Disposal
Sl.No.
Medical waste - Generation & disposal
Generation Ezhikkara Kanjiramkulam Marutharode Nenmeni Total
1 Not generated 65 (73.00) 80(84.20) 103 (64.00) 99(59.60) 347(67.91)2 Generated but
not separated18 (20.20) 12 (12.60) 16 (9.90) 35(21.10) 81(15.85)
3 Generated and separated
6 (6.80) 3 (3.20) 42(26.10) 32(19.30) 83(16.24)
Total 89(100.00) 95(100.00) 161 (100.00) 166(100.00) 511(100.00)A Medical waste generated but not separated- Method of disposal
Method of disposal Ezhikkara Kanjiramkulam Marutharode Nenmeni Total
1 Throw outside the compound
0(0.00) 0 (0.00) 8 (50.00) 11 (31.40) 19(23.46)
2 Burn 14 (77.80) 6 (50.00) 6 (37.50) 10 (28.60) 36(44.45)3 Other means 4 (22.20) 6(50.00) 2 (12.50) 14 (40.00) 26(32.09)
Total 18(100.00) 12 (100.00) 16 (100.00) 35 (100.00) 81(100.00)B Medical waste generated and separated- Method of disposal
Method of disposal Ezhikkara Kanjiramkulam Marutharode Nenmeni Total
Throw outside the compound
0 (0.00) 0 (0.00) 18 (42.90) 9 (28.20) 27(32.54)
1 Burn 2 (33.33) 3 (100.00) 19 (45.20) 4 (12.50) 28(33.73)2 Other means 4 (66.67) 0 (0.00) 5 (11.90) 19(59.30) 28(33.73)
Total 6(100.00) 3(100.00) 42(100.00) 32 (100.00) 83(100.00)Source: Primary data (Figures in brackets are percentages)
Waste Management System in Sample Grama Panchayats

60
Role of Grama Panchayats in Waste Management and Environment Protection
5.2.9 Perceptions of People about Pollution in their AreaDespite open burning and throwing of solid waste,
discharge of liquid waste directly into own compound, water bodies etc., none of the participants surveyed, perceived any pollution in their local environment. Thus it is only in Ezhikkara that 21 percent of sample households reported air pollution due to the smog seen early in the morning which they attributed as generated by the public sector company FACT located nearby (Table 5.22). One
fourth of the households here also reported prevalence of water pollution. In all other Panchayats, proportion of households reporting pollution is very less. This could be partially due to the absence of visible symptoms of big waste dumps as is seen in urban areas.
The sample households exhibited high degree of awareness about health implications of clean environment, contamination by waste dumps and breeding of mosquitoes in stagnant water. However awareness on harmful effects of burning plastics was slightly less with around one fifth of the
Table: 5.23: General Awareness about Environment and SanitationSl.
No.Household awareness Ezhikka-
ra(89)Kanjiramku-
lam (95)Marutharode
(161)Nenmeni (166) Total (511)
1 Clean environment is necessary for good health
88 (98.90) 94 (98.90) 156 (96.90) 163 (98.20) 501 (98.04)
2 Waste dumps around the house and public places contaminate the air, water and soil
88 (98.90) 92 (96.80) 142 (88.20) 163 (98.20) 485 (94.91)
3 Disease spreading vectors like mos-quitoes, flies, etc. breed in waste dumps and still water.
88 (98.90) 91 (95.80) 141 (87.60) 162 (97.60) 482 (94.32)
4 Contamination of air, water and soil leads to severe diseases.
88(98.90) 90 (94.70) 136 (84.50) 161 (97.00) 475 (92.95)
5 Contamination of environment due to plastic waste is highly injurious to health.
82 (92.10) 88 (92.60) 128 (79.50) 152 (91.60) 450 (88.06)
6 Burning of plastics releases toxic gas-es harmful to human life
76 (85.40) 82 (86.30) 117 (72.70) 141 (84.90) 416 (81.41)
7 Plastics in soil reduces ground water recharging and leads to water scarcity
48 (53.93) 52 (54.74) 82 (50.90) 113 (68.10) 295 (57.80)
8 Total sanitation programme of the gov-ernment and the activities undertaken by the local body under the programme.
51 (57.30) 55 (57.90) 72 (44.70) 65 (39.20) 243 (47.55)
9 Swachh Bharat Scheme and related activities
34 (38.20) 56 (58.90) 87 (54.00) 65 (39.20) 242 (47.36)
Source: Primary data (Figures in brackets are percentages calculated from total sample households for each item)
Table: 5.22: Perceptions of People about Pollution in their AreaSl.No. Perceptions Ezhikkara (89) Kanjiramkulam (95) Marutharode
(161)Nenmeni (166)
1 Noise pollution 0 (0.00) 6 (6.30) 0 (0.00) 4 (2.40)2 Air pollution 19 (21.30) 2 (2.10) 1 (0.60) 5 (3.00)3 Soil pollution 4 (4.50) 2 (2.10) 0 (0.00) 3 (1.80)4 Water pollution 23 (25.80) 1 (1.10) 0 (0.00) 3 (1.80)5 Willingness to
participate in waste manage-ment programme
67(75.30) 61(64.20) 125(77.60) 110 (66.30)
Source: Primary data (Figures in brackets are percentages

61
sample reporting ignorance. Adverse impact of plastics on ground water recharging and potential water scarcity was however not known to nearly half the sample indicating that awareness campaigns need to focus on these dimensions. So also popular sanitation programmes such as Swachh Bharat Scheme and Total sanitation programme was unknown to around half the respondents (Table 5.23).
5.2.10 Incidence of Water/ Vector Borne DiseasesWhile considering the incidence of water/ vector borne
diseases among sample household members in last one year, diseases like diarrhoea, jaundice, skin infections, etc. were not reported much in all sample G.Ps (Table 5.24).
Compared to other Panchayats, these diseases were reported to be high in Nenmeni G.P. Reason for low
incidence of water borne diseases could be the practice of boiling drinking water which was common among almost all households.
5.3 Primary Survey of InstitutionsThis section analyses the findings of the survey
conducted in various establishments in the sample G.Ps. Commercial establishments, manufacturing units, public buildings, schools, hospitals, auditoriums etc. are included in this category of institutions. Table 5.25 shows the Panchayat wise details of institutions surveyed in the study. The total sample size of the institutions is 221. Majority of the institutions that are surveyed are from Marutharode G.P followed by Nenmeni and the least from Ezhikkara
Table: 5.24: Water/ Vector Borne diseasesSl.
No.Disease Ezhikkara Kanjiramkulam Marutharode Nenmeni Total
1 Water borne diseases (Diarrhea, Jaundice, Typhoid, Cholera, etc.)
0 1 4 19 24
2 Vector borne diseases (Dengue, Chikungunya, Bird flu, etc.)
4 2 2 5 13
3 Others (including skin infections) 0 0 3 12 15Source: Primary data
Table: 5.25: Types of EstablishmentsSl.
No.Type of Establishment Ezhikkara Kanjiramkulam Marutharode Nenmeni Total
1 Trading 19 (55.90) 24 (61.50) 19 (24.40) 21 (30.00) 83(37.55)General provision-al store
6 (31.58) 8 (33.33) 7 (36.84) 9 (42.86) 30(36.10)
Hotel/ Tea shop 3 (15.80) 3 (12.5) 1 (5.26) 1 (4.76) 8(9.60)Textile shop 0 (0.00) 1 (4.17) 0 (0.00) 0 (0.00) 1(1.30)Electrical shop 0 (0.00) 0 (0.00) 2 (10.54) 0 (0.00) 2(2.40)Automobile repair shop
0 (0.00) 1 (4.17) 1 (5.26) 0 (0.00) 2(2.40)
Vegetable shop 0 (0.00) 0 (0.00) 0 (0.00) 2 (9.52) 2(2.40)Meat and fish store 4 (21.05) 0 (0.00) 0 (0.00) 0 (0.00) 4(4.80)Foot wear shop 1 (5.26) 0 (0.00) 0 (0.00) 0 (0.00) 1(1.20)Other repair shop 0 (0.00) 1 (4.17) 1 (5.26) 1 (4.76) 3(3.70)Others 5 (26.31) 10 (41.66) 7 (36.84) 8 (38.10) 30(36.10)
2 Manufacturing 1 (2.90) 4 (10.30) 13 (16.70) 8 (11.40) 26(11.77)3 Health 3 (8.80) 3 (7.70) 5 (6.40) 4 (5.70) 15(6.68)4 Education 4 (11.80) 3 (7.70) 12 (15.40) 13 (18.60) 32(14.48)5 Public buildings 2 (5.90) 0 (0.00) 4 (5.10) 8 (11.40) 14(6.34)6 Other
establishments5 (14.70) 5 (12.80) 25 (32.00) 16 (22.90) 51(23.18)
Total 34(100.00) 39 (100.00) 78 (100.00) 70 (100.00) 221(100.00)Source: Primary data (Figures in brackets are percentages)
Waste Management System in Sample Grama Panchayats

62
Role of Grama Panchayats in Waste Management and Environment Protection
which is based on the sampling principle of the study.Among the total sample establishments nearly 38
percent are trading units which include general provisional store, hotel/ tea shop, textile shop, electrical shop, vegetable shop, fish and meat store etc. (Table 5.31). Nearly 12 percent of sample institutions are manufacturing units. Remaining include around 7 percent of health institutions, 14 percent of educational institutions, 6 percent of government owned offices and 23 percent other establishments which include places of worship, auditoriums, arts and sports clubs, library etc. Out of the institutions surveyed in all G.Ps, majority were trading establishments except in Marutharode. In Kanjiramkulam and Ezhikkara, trading units like general provision stores constituted more than half of the sample. In Marutharode and Nenmeni trading establishments were 25 percent and 30 percent respectively. A good number of manufacturing and other establishments exists in Marutharode when compared to other G.Ps. Public buildings and educational institutions are high in Nenmeni compared to others.
5.3.1 Information on Building and LandIn all sample Panchayats, majority of the sample
institutions have their own building or establishment. Nearly 64 percent of the total sample institutions possess ownership of building, 29 percent are located in hired buildings and around 7 percent have rent free building. With regard to the ownership of land, 43 percent institutions possess establishment only, 20 percent have establishment and other land and 36 percent have no land at all (Table 5.26).
Among those who possess land, 49 percent own more than five cents of land, 41 percent have less than 5 cents of land and 10 percent own 5 cents of land (Table 5.27).
In Ezhikkara and Nenmeni more than 50 percent of the institutions have semi pucca building, and around 45 percent have pucca building whereas in Kanjiramkulam and Marutharode more than 60 percent sample units have pucca building. In all four Panchayats only a small proportion of institutions have kutcha building (Table 5.28).
Table: 5.26: Ownership of Building and Ownership of LandSl.No. Building/Establish-
mentEzhikkara Kanjiramkulam Marutharode Nenmeni Total
1 Owned 24 (70.60) 24 (61.50) 53 (67.90) 40 (57.20) 141(63.60)2 Hired 7 (20.60) 14 (35.90) 21 (26.9) 22 (31.40) 64(28.95)3 Rent free 2 (5.90) 1 (2.60) 4 (5.20) 8 (11.40) 15(6.75)4 Others 1 (2.90) 0 (0.00) 0 (0.00) 0 (0.00) 1(0.70)
Total 34 (100.00) 39 (100.00) 78 (100.00) 70(100.00) 221(100.00)Sl.No. Type of Land Ezhikkara Kanjiramkulam Marutharode Nenmeni Total
1 Establishment only
13 (38.20) 18 (46.20) 39 (50.00) 26 (37.10) 96(43.44)
2 Establishment and other land
12 (35.30) 5 (12.80) 13 (16.60) 14 (20.00) 44(19.91)
3 Other land only 0 (0.00) 0 (0.00) 1 (1.30) 0 (0.00) 1(0.45)4 No Land 9 (26.50) 16 (41.00) 25 (32.10) 30 (42.90) 80(36.20)
Total 34 (100.00) 39 (100.00) 78 (100.00) 70(100.00) 221(100.00)Source: Primary data (Figures in brackets are percentages)
Table: 5.27: Size of LandSl.No. Size of Land (in Cents) Ezhikkara Kanjiramkulam Marutharode Nenmeni Total
1 <5 6 (24.00) 12 (52.20) 26 (49.10) 14 (35.00) 58(41.13)2 5 2 (8.000 1 (4.30) 6 (11.30) 5 (12.50) 14(9.93)3 >5 17 (68.00) 10 (43.50) 21 (39.60) 21(52.50) 69(48.94)
Total 25 (100.00) 23 (100.00) 53 (100.00) 40(100.00) 141(100.00)Source: Primary data (Figures in brackets are percentages)

63
Table: 5.29: Basic AmenitiesSl.No.
Basic amenities Ezhikkara Kanjiramkulam Marutharode Nenmeni Total
1 Number of rooms 34(100.00) 39 (100.00) 78 (100.00) 70(100.00) 221(100.00)1-4 24 (70.60) 34 (87.20) 66 (84.60) 61 (87.10) 185(83.72)5-9 3 (8.80) 3 (7.60) 6 (7.60) 6 (8.60) 18(8.14)10-14 2 (5.90) 1 (2.60) 3 (3.90) 3 (4.30) 9(4.07)15< 5 (14.70) 1 (2.60) 3 (3.90) 0 (0.00) 9(4.07)
2 Bathroom facility 34(100.00) 39 (100.00) 78 (100.00) 70(100.00) 221(100.00)1 8 (23.50) 10 (25.60) 30 (38.50) 19 (27.10) 67(30.32)2-3 4 (11.80) 3 (7.70) 7 (9.00) 10 (14.30) 24(10.86)4 6 (17.65) 3 (7.70) 6 (7.60) 4 (5.70) 19(8.59)Nil 16 (47.05) 23 (59.00) 35 (44.90) 37 (52.90) 111(50.23)
3 Primary source of energy for lighting
34(100.00) 39 (100.00) 78 (100.00) 70(100.00) 221(100.00)
Kerosene 1 (2.90) 0 (0.00) 1 (1.30) 0 (0.00) 2(0.90)Candle 0 (0.00) 0 (0.00) 0 (0.00) 1 (1.40) 1(0.45)Electricity 31 (91.30) 39 (100.00) 75 (96.10) 61 (87.20) 206(93.22)Others 1 (2.90) 0 (0.00) 1 (1.30) 1 (1.40) 3(1.35)Nil 1 (2.90) 0 (0.00) 1 (1.30) 7 (10.00) 9(4.08)
4 Access to toilet 34(100.00) 39 (100.00) 78 (100.00) 70(100.00) 221(100.00)Access to toilet facility
18 (53.00) 16(41.00) 43(55.10) 33(47.10) 110 (49.77)
No Toilet 16 (47.00) 23 (59.00) 35 (44.90) 37 (52.90) 111(50.23)5 Type of toilet 34(100.00) 39 (100.00) 78 (100.00) 70(100.00) 221(100.00)
Pit 2 (5.90) 6 (15.40) 6 (7.70) 5 (7.10) 19(8.59)Flush to septic tank
16 (47.10) 10 (25.60) 37 (47.40) 27 (38.60) 90(40.73)
Flush to sewerage 0 (0.00) 0 (0.00) 0 (0.00) 1 (1.40) 1(0.45)Source: Primary data (Figures in brackets are percentages)
5.3.2 Information on Basic Amenities of InstitutionsWith regard to the facilities in the establishments, above
80 percent of the sample units have 1 to 4 rooms. Almost half of the sample institutions (around 50 percent) have no bathroom facility inside the building.
With regard to the primary source of lighting, 93 percent sample institutions have access to electricity. Only a negligible proportion is using other sources for lighting purpose and around 4 percent have no lighting (Table 5.29).
Table: 5.28: Type of BuildingSl.
No.Type of building Ezhikkara Kanjiramkulam Marutharode Nenmeni Total
1 Pucca 15 (44.10) 27 (69.20) 48 (61.50) 32 (45.70) 122(55.20)2 Semi Pucca 18 (52.90) 10 (25.60) 29 (37.20) 37 (52.90) 94(42.54)3 Kutcha 1 (2.90) 2 (5.20) 1 (1.30) 1 (1.40) 5(2.26)
Total 34 (100.00) 39 (100.00) 78 (100.00) 70(100.00) 221(100.00)Source: Primary data (Figures in brackets are percentages)
Waste Management System in Sample Grama Panchayats

64
Role of Grama Panchayats in Waste Management and Environment Protection
Table: 5.30: Existence of Water BodiesSl. No Existence of water
bodiesEzhikkara (34) Kanjiramku-
lam (39)Marutharode
(78)Nenmeni (70) Total (221)
1 Tube well 5(14.71) 1(2.56) 15(19.23) 5(7.14) 26(11.76)2 Well 11(32.35) 1(2.56) 13(16.67) 15(21.43) 40(18.10)3 Other water
bodies2(5.88) 0 (0.00) 0 (0.00) 1(1.43) 3(1.36)
Total 18 (52.94) 2 (5.12) 28 (35.90) 21(30.00) 69 (31.22)Source: Primary data (Figures in brackets are percentages)
The survey shows that half of the sample institutions have no toilet system indicating lack of basic facilities for the workers/ employees. It is seen that the toilet systems normally exist in public offices, hospitals, educational institutions etc. but were generally non-existent in majority of the local trading establishments.
Of the remaining half who have such facilities, nearly 40 percent flush waste to septic tank, very few are using pit and only less than 1 percent flush to sewerage.
Only 31 percent of total sample units have the existence of water source in their premises. Out of this, around 18 percent have well and 12 percent have tube well (Table 5.30).
Table: 5.31: Distance of Water Bodies (Tube Wells) from Latrines, Cattle sheds and Waste Dumps in Sample Institutions
Tube WellSl.No. Ezhikkara Kanjiramkulam Marutharode Nenmeni Total
1 Distance of the water body from any latrine
5 (100.00) 1 (100.00) 15 (100.00) 5(100.00) 26(100.00)
Over 5m 3 (60.00) 0 (0.00) 12 (80.00) 3 (60.00) 18(69.23)3 to 5m 1 (20.00) 0 (0.00) 1 (6.70) 0 (0.00) 2(7.70)2 to 3m 0 (0.00) 0 (0.00) 0 (0.00) 0 (0.00) 0(0.00)Less than 2m 0 (0.00) 0 (0.00) 0 (0.00) 0 (0.00) 0(0.00)No latrine 1 (20.00) 1 (100.00) 2 (13.30) 2 (40.00) 6(23.07)
2 Distance of the water body from any cattle shed
5 (100.00) 1 (100.00) 15 (100.00) 5(100.00) 26(100.00)
Over 5m 0 (0.00) 0 (0.00) 1 (6.70) 1 (20.00) 2(7.69)3 to 5m 0 (0.00) 0 (0.00) 1 (6.70) 0 (0.00) 1(3.84)2 to 3m 0 (0.00) 0 (0.00) 1 (6.70) 0 (0.00) 1(3.85)Less than 2m 0 (0.00) 0 (0.00) 0 (0.00) 0 (0.00) 0(0.00)No cattle shed 5 (100.00) 1 (100.00) 12 (79.90) 4 (80.00) 22(84.62)
3 Distance of the water body from any waste dump
5 (100.00) 1 (100.00) 15 (100.00) 5(100.00) 26(100.00)
Over 5m 1 (20.00) 0 (0.00) 1 (6.70) 2 (40.00) 4(15.38)3 to 5m 0 (0.00) 0 (0.00) 0 (0.00) 0 (0.00) 0(0.00)2 to 3m 0 (0.00) 0 (0.00) 1 (6.70) 0 (0.00) 1(3.85)Less than 2m 0 (0.00) 0 (0.00) 0 (0.00) 0 (0.00) 0(0.00)No waste dump 4 (80.00) 1 (100.00) 13 (86.60) 3 (60.00) 21(80.77)
Source: Primary data (Figures in brackets are percentages)

65
Nearly 8 percent of tube wells are located at a distance of less than 5 meter from any latrine (Table 5.31) and 8 percent have the water source very near to the cattle shed revealing a picture similar to that in the case of households.
In the case of wells, distance from latrine was more than 5 meter for 45 percent of wells and 45 percent had no latrine nearby but 10 percent were situated very close to a latrine. Majority (90 percent) reported that there were no cattle shed near the wells and 82.5 percent reported that there was no waste dump. But 5 percent reported location of cattle shed and waste dump near the wells.
5.3.3 Perceptions of Sample InstitutionsWith regard to institutional arrangements for solid
waste management by the G.Ps, all sample units in Kanjiramkulam and Marutharode reported that there was no arrangement for waste collection by the Local Government while in Nenmeni only one sample unit and in Ezhikkara 12 sample units said that there was some arrangement for waste collection (Table 5.33).
All institutions in Ezhikkara and Marutharode said that there was no dump yard for waste disposal. In Kanjiramkulam and Nenmeni, only one institution reported the existence of dump yard. Entire sample units in Ezhikkara and Nenmeni
Table: 5.32: Distance of Water Bodies (Wells) from Latrines, Cattle sheds and Waste Dumps in Sample Institutions
WellSl.No. Ezhikkara Kanjiramkulam Marutharode Nenmeni Total
1 Distance of the water body from any latrine
11(100.00) 1 (100.00) 13 (100.00) 15(100.00) 40(100.00)
Over 5m 4 (36.30) 0 (0.00) 10 (76.90) 4 (26.70) 18(45.00)3 to 5m 3 (27.30) 0 (0.00) 0 (0.00) 0 (0.00) 3(7.50)2 to 3m 0 (0.00) 0 (0.00) 0 (0.00) 0 (0.00) 0 (0.00)Less than 2m 1 (9.10) 0 (0.00) 0 (0.00) 0 (0.00) 1(2.50)No latrine 3 (27.30) 1 (100.00) 3 (23.10) 11(73.30) 18(45.00)
2 Distance of the water body from any cattle shed
11(100.00) 1(100.00) 13(100.00) 15(100.00) 40(100.00)
Over 5m 0 (0.00) 0 (0.00) 1 (7.70) 1 (6.70) 2(5.00)3 to 5m 0 (0.00) 0 (0.00) 0 (0.00) 1 (6.70) 1(2.50)2 to 3m 1 (9.10) 0 (0.00) 0 (0.00) 0 (0.00) 1(2.50)Less than 2m 0 (0.00) 0 (0.00) 0 (0.00) 0 (0.00) 0 (0.00)No cattle shed 10 (90.90) 1 (100.00) 12 (92.30) 13 (86.60) 36(90.00)
3 Distance of the water body from any waste dump
11(100.00) 1(100.00) 13(100.00) 15(100.00) 40(100.00)
Over 5m 2 (18.20) 0 (0.00) 0 (0.00) 3 (20.00) 5(12.50)3 to 5m 0 (0.00) 0 (0.00) 0 (0.00) 0 (0.00) 0 (0.00)2 to 3m 2 (18.20) 0 (0.00) 0 (0.00) 0 (0.00) 2(5.00)Less than 2m 0 (0.00) 0 (0.00) 0 (0.00) 0 (0.00) 0 (0.00)No waste dump 7 (63.60) 1 (100.00) 13 (100.00) 12(80.00) 33(82.50)
4 Water scarcity 11(100.00) 1(100.00) 13(100.00) 15(100.00) 40(100.00)No scarcity 5 (45.50) 0 (0.00) 13 (100.00) 12 (80.00) 30(75.00)Scarcity in some months
6 (54.50) 1 (100.00) 0 (0.00) 3 (20.00) 10(25.00)
Always scarce 0 (0.00) 0 (0.00) 0 (0.00) 0 (0.00) 0 (0.00)Source: Primary data (Figures in brackets are percentages)
Waste Management System in Sample Grama Panchayats

66
Role of Grama Panchayats in Waste Management and Environment Protection
reported the non-existence of incinerator for waste burning and one sample from Kanjiramkulam and Marutharode reported the existence of incinerator.
In all the four Panchayats, whole sample establishments said that there was no plastic recycling plant. A small proportion reported that G.Ps were giving assistance for bio-gas plant. A good number of institutions from Ezhikkara and Kanjiramkulam stated that they know about the training on waste management conducted by the G.Ps.The institutions reported very less pollution in their area but noise pollution and air pollution were reported by some of the establishments because most of them were situated on the side of public road (Table 5.34). Soil pollution and water pollution was reported to be very less in all the four sample Panchayats. Water pollution was reported higher in Ezhikkara as compared to other G.Ps, just like in the analysis of households. More than 60 percent of
sample establishments were willing to participate in waste management programmes in all Panchayats.
5.3.4 Solid Waste Generation and DisposalThis section analyses the generation and disposal pattern
of solid wastes from the sample institutions. Two broad categories of waste are analysed, namely bio-degradable and non-bio degradable.
5.3.4.1 Bio-degradable WasteBio-degradable waste includes food waste, vegetable waste,
paper/ cardboard waste, etc. Around 92 percent establishments generate bio-degradable waste but only 38 percent separate the generated waste for disposal (Table 5.35).
For those who generated but did not separate the waste, the important method of disposal was burning (41.5 percent) in all the sample Panchayats. Throwing
Table: 5.33: Institutional Arrangements for Solid Waste ManagementSl.No. Activity Ezhikkara (34) Kanjiramkulam
(39)Marutharode (78) Nenmeni (70)
1 Arrangement for waste col-lection by local government
12 (35.30) 0 (0.00) 0 (0.00) 1 (1.40)
2 Dump yard for waste disposal
0 (0.00) 1 (2.60) 0 (0.00) 1 (1.40)
3 Incinerator for waste burning
0 (0.00) 1 (2.60) 1 (1.30) 0 (0.00)
4 Bio-gas plant assisted/set-up by the local gov-ernment
4 (11.8) 1 (2.60) 3 (3.80) 5 (7.10)
5 Training courses on waste management by the local government
23 (67.60) 17 (43.00) 6 (7.60) 0 (0.00)
6 Plastic re-cycling plant 0 (0.00) 0 (0.00) 0 (0.00) 0 (0.00)7 Other activities 5 (14.70) 0 (0.00) 1 (1.30) 4 (5.70)
Source: Primary data (Figures in brackets are percentages)
Table: 5.34: Perceptions about Pollution in their AreaSl
No.Perceptions Ezhikkara
(34)Kanjiram-
kulam (39)Marutharode
(78)Nenmeni
(70)Total ( 221)
1 Noise pollution 0 (0.00) 4 (10.30) 11 (14.10) 4 (5.70) 19(8.59)2 Air pollution 2 (5.90) 1 (2.60) 10 (12.80) 2 (2.90) 15(6.78)3 Soil pollution 0 (0.00) 1 (2.60) 1 (1.30) 0 (0.00) 2(0.90)4 Water pollution 4 (11.80) 1 (2.60) 1 (1.30) 1 (1.40) 7(3.16)5 Willingness to partici-
pate in waste manage-ment programme
21 (61.80) 34 (87.20) 50 (64.10) 54 (77.10) 159(71.94)
Source: Primary data (Figures in brackets are percentages)

67
within the compound (13.6 percent) and throwing outside the compound (11 percent) was also common. Burying underground, disposit in pits, dumping in road corners and other methods such as bio disposal, taken by waste collectors etc. was also practiced.
Similar to those who generated but did not separate the waste, burning was the most common practice of disposal for those who generated and separated bio-degradable waste. Around 30.5 percent of those who generated and separated bio-degradable waste used the method of burning .Waste taken by waste collectors (11.7 percent),
thrown into water bodies (9.4 percent), sold (9.4 percent), buried underground, bio-disposal and other methods like dumping in road corners etc. were other important methods of disposal.
In all samples G.Ps except Marutharode, majority of the establishments did not separate the generated waste and primary method of disposal was burning. In Marutharode majority reported that they separated the bio-degradable waste. However the disposal method was primarly the same namely burning. There were only 4 institutions each from Marutharode and Nenmeni who reported that waste was
Table: 5.35: Bio-degradable Waste - Generation & Disposal
Biodegradable waste - Generation & disposalGeneration Ezhikkara Kanjiramkulam Marutharode Nenmeni Total
Not generated 4 (11.80) 1 (2.60) 3 (3.80) 10 (14.20) 18(8.15)Generated but not sepa-rated
21 (61.80) 33 (84.60) 27 (34.60) 37 (52.90) 118(53.39)
Generated and separated 9 (26.40) 5 (12.80) 48 (61.60) 23 (32.90) 85(38.46)Total 34(100.00) 39 (100.00) 78 (100.00) 70 (100.00) 221(100.00)
Biodegradable waste generated but not separated- Method of disposalMethod of Disposal Ezhikkara Kanjiramkulam Marutharode Nenmeni Total
Throw within the compound
7 (33.30) 6 (18.20) 3 (11.10) 0 (0.00) 16(13.55)
Throw outside the compound
1 (4.80) 2 (6.10) 6 (22.20) 4 (10.80) 13(11.01)
Dump on road corners 2 (9.50) 0 (0.00) 1 (3.70) 2 (5.40) 5(4.24)Bury underground 0 (0.00) 2 (6.10) 3 (11.10) 3 (8.10) 8(6.78)Burn 9 (42.90) 17 (51.50) 9 (33.30) 14 (37.80) 49(41.53)Deposit in pits 0 (0.00) 0 (0.00) 2 (7.40) 5 (13.50) 7(5.94)Other means 2 (9.50) 6 (18.10) 3 (11.20) 9 (24.40) 20(16.95)
Total 21(100.00) 33 (100.00) 27 (100.00) 37 (100.00) 118(100.00)Biodegradable waste generated and separated- Method of disposalMethod of Disposal Ezhikkara Kanjiramkulam Marutharode Nenmeni Total
Throw outside the Compound
0 (0.00) 0 (0.00) 3 (6.30) 2 (8.70) 5(5.88)
Throw into waterbodies 0 (0.00) 0 (0.00) 7 (14.60) 1 (4.30) 8(9.42)Bury underground 3 (33.30) 0 (0.00) 2 (4.20) 2 (8.70) 7(8.24)Burn 1 (11.10) 3 (60.00) 13 (27.10) 9 (39.10) 26(30.58)Sell 0 (0.00) 1 (20.00) 6 (12.50) 1 (4.31) 8(9.42)Taken by waste collectors 2 (22.20) 0 (0.00) 4 (8.20) 4 (17.40) 10(11.76)Bio disposal 2 (22.20) 1 (20.00) 1 (2.10) 3 (13.04) 7(8.23)Other means 1 (11.20) 0 (0.00) 12 (25.00) 1 (4.45) 14(16.47)
Total 9 (100.00) 5 (100.00) 48 (100.00) 23 (100.00) 85 (100.00)
Source: Primary data (Figures in brackets are percentages)
Waste Management System in Sample Grama Panchayats

68
Role of Grama Panchayats in Waste Management and Environment Protection
taken by waste collectors so they separated bio degradable wastes (while these was no official collection system in both these Panchayats, services of nearby Palakkad Muncipality was availed by some while services of Kudumbasree units set up by tourism dept. was utilised in Nenmeni through informal arrangements). In Marutharode, 7 units disposed waste into water bodies. The study shows that burning and throwing were the major methods of disposing bio-degradable waste by institutions.
5.3.4.2 Non-biodegradable WasteNon- biodegradable waste analysed includes plastic
waste, metal waste, electrical waste, medical waste, etc. Around 61 percent of establishments generated such non-biodegradable waste while 39 percent reported that they have no non- bio degradable waste. Almost 37 percent institutions generate but did not separate this waste and 24 percent generated and separated this for disposal (Table
5.36). In Marutharode 60 percent of the units said that they did not generate this waste. In all other sample G.Ps majority reported that they generated non-biodegradable waste.
Among those who generated but did not separate non- bio degradable waste, 66 percent burnt it, 7 percent threw it outside the compound, and 6 percent buried it underground or sold it. Other methods of disposal were also practiced which included waste taken by waste collectors, thrown within the compound, thrown into water bodies and dumped in road corners, etc.
Among those who generated and separated non-bio degradable waste, 40 percent burnt it. Around 15 percent said that they sold it while the same proportion reported that it was taken by waste collectors. Other methods for disposing this waste included throwing outside the compound, throwing within the compound, throwing into water bodies, burying underground, dumping in road
Table: 5.36: Non-Biodegradable Waste - Generation & Disposal
Non-biodegradable waste - Generation & disposalGeneration Ezhikkara Kanjiramkulam Marutharode Nenmeni Total
Not generated 10 (29.40) 9 (23.10) 47 (60.30) 21 (30.00) 87(39.36)Generated but not separated
16 (47.10) 19 (48.70) 13 (16.70) 34 (48.60) 82(37.12)
Generated and separated
8 (23.50) 11 (28.20) 18 (23.00) 15 (21.40) 52(23.52)
Total 34 (100.00) 39 (100.00) 78 (100.00) 70 (100.00) 221(100.00)Non-biodegradable waste generated but not separated- Method of disposalMethod of Disposal Ezhikkara Kanjiramkulam Marutharode Nenmeni Total
Throw outside the compound
2 (12.50) 1 (5.30) 1 (7.70) 2 (5.90) 6(7.32)
Bury under-ground
2 (12.50) 1 (5.30) 0 (0.00) 2 (5.90) 5(6.09)
Burn 8 (50.00) 13 (68.40) 7 (53.83) 26 (76.50) 54(65.86)Sell 1 (6.30) 3 (15.80) 1 (7.70) 0 (0.00) 5(6.09)Other means 3 (18.70) 1 (5.20) 4 (30.77) 4 (11.70) 12(14.64)
Total 16 (100.00) 19 (100.00) 13 (100.00) 34 (100.00) 82(100.00)Non-biodegradable waste generated and separated- Method of disposalMethod of Disposal Ezhikkara Kanjiramkulam Marutharode Nenmeni Total
Burn 6 (75.00) 8 (72.70) 1 (5.60) 6 (40.00) 21(40.39)Taken by waste collectors
1 (12.50) 0 (0.00) 4 (22.20) 3 (20.00) 8(15.38)
Sell 0 (0.00) 3 (27.30) 5 (27.80) 0 (0.00) 8(15.38)Other means 1 (12.5) 0 (0.00) 8 (44.40) 6 (40.00) 15(28.85)
Total 8 (100.00) 11 (100.00) 18 (100.00) 15 (100.00) 52(100.00)Source: Primary data (Figures in brackets are percentages)

69
corners, etc.In all sample G.Ps, majority of the establishments are
burning their non-biodegradable wastes in the generated and not separated waste category. In the case of generated and separated waste category all G.Ps followed burning as the major method of disposal except in Marutharode. In Marutharode establishments reported that waste was taken by waste collectors. Selling was also an important method of disposal, followed by other methods. Some of the clinics and hospitals within Panchayats do not seem to have tie up with IMAGE for collection of medical waste and hence they carry out open air incineration of these medical waste within their compound. The remaining ash from medical waste incineration is also often stored on site.
5.4 Analysis of Water Quality in Sample G.PsDespite a few latrines, cattle sheds and waste dumps
being located near water bodies, discharge of waste water into compound, water bodies etc. and open burning of non bio-degradable waste, people in the sample G.Ps did not perceive any pollution in the locality. Hence water quality in a sample of water bodies located in the four G.Ps were analysed to check for symptoms of pollution stress.11 The analysis reveal bacteriological contamination as the major water quality problem in rural water bodies. 44.61 percent of the entire 65 water samples analysed from the sample G.Ps were found to be contaminated with E.coli indicating feacal contamination. All the samples from Ezhikkara, Marutharode and Nenmeni also reported coliform contamination except one sample of Nenmeni. Kanjiramkulam presented a relatively better picture compared to other sample G.Ps with only 56 percent of sample stations reporting such contamination. However what was alarming here was the presence of coliform bacteria in water extracted from deep ground water sources in some areas of Kanjiramkulam which includes community run and other public water schemes (Kanjiramkulam despite being a lowland G.P, faces acute water scarcity in some areas and ground water is accessible only through wells/ bore wells dug at great depth). Among the sample G.Ps, Marutharode has been noticed to have high level of pollution in all types of water bodies including bore wells, public irrigation canals and rivers pointing to pollution stress in the ecosystem. Few water samples from Nenmeni- particularly samples from traditional wells- both public and private- and natural water stream in Wayanad district, the G.P near to the Western Ghats, also indicate pollution stress. A notable point is that the major Jalanidhi public drinking water scheme in Nenmeni- a World Bank
rural water supply scheme with over 3000 beneficiaries- has high level of bacterial contamination. The study thus indicates that both surface and ground water sources even in our rural areas are getting contaminated posing a threat to the water security of future generations.
5.5 Summary The findings of the primary survey of households and
institutions reveal prevailing arrangements in sample G.Ps for management of solid and liquid waste generated.
Majority of sample households (more than 90 percent) have ownership of houses and land indicating that, due to existence of such property rights, they can be motivated to take up activities to preserve environment quality. However around one third of the households had small size of land holdings implying that less space intensive techniques of solid/ liquid waste disposal need to be promoted.
Despite over 90 percent of the sample units owning their own houses, living in semi pucca and pucca houses, almost all units having electricity connection and more than 60 percent having LPG for cooking purpose, almost all households do not have proper drainage system for disposal of liquid waste from kitchen and bathrooms. Large segment of households have their liquid waste from kitchen/ bathroom flown within their compound. In Ezhikkara, disposal of liquid waste into water bodies was prevalent particularly among houses situated close to canals and back waters.
With regard to toilet facility, the study shows prevalence, though limited, of open defecation even in Nirmal G.Ps, the incidence of which was higher in places with migrant labour. Another disturbing practice was makeshift toilets directly over water bodies which was observed in households having limited land and located on the banks of canals and back waters.
As far as septage is concerned-68 percent of the surveyed households- discharge it into septic tanks while around one fourth use pit toilets and some use ring type. Use of pit toilets was observed to be particularly high in lowland Panchayat of Kanjiramkulam (37 percent) characterised by loose red soil which pose high risk of contamination to ground water. Ring type of toilet is observed more in Ezhikkara Panchayat-the low land coastal Panchayat with porous, sandy soil with 13 percent of households in Ezhikkara using these which are another potential source of soil-water contamination particularly during monsoon season when the rings overflow. This indicates that now Kerala needs to go further on sanitation front by focusing on upgrading the type/ quality of toilets constructed and
11 For detailed results see appendix.
Waste Management System in Sample Grama Panchayats

70
Role of Grama Panchayats in Waste Management and Environment Protection
addressing specific challenges such as sanitation facilities in coastal areas and for migrant labourers.
Of the 163 wells and 59 tube wells identified in the sample units, 23 wells (14 percent) and 6 tube wells (around 16 percent) were observed to be located very close to latrines which reveals clear violation of sanitation standards stipulated for G.Ps in India. This along with use of pit toilets and ring toilets indicate potential sources of water pollution in all our sample G.Ps which are all Nirmal G.Ps.
Our study reveals that majority of people in rural areas are not in the habit of consciously segregating solid waste generated. However, some form of segregation of biodegradable and non-biodegradable waste was taking place in a few households without any purposive planning when they used bio-degradable kitchen waste for feeding livestock and other pets like dogs and cats, or threw it out into the compound as and when it was generated. Thus in the case of households, the methods of disposal widely practiced for food, vegetable, fish and meat waste generated were bio-disposal, throwing within and outside compound, while in the case of institutions it was open burning and throwing. This reveals that at least some households in rural areas have their own natural system for disposing bio-degradable waste. In the case of paper and cardboard and non-biodegradable waste like, plastic, sanitary waste majority of households as well as institutions reported open burning as method of disposal being practiced.
With regard to medical waste only around one-third of the sample households reported that they generate medical waste. Burning, throwing outside the compound, dumping in road corners, burying underground etc. were the primary methods of disposal of medical waste which indicate a potential source of infection. Some of the clinics and hospitals within Panchayats do not seem to have tie up with IMAGE for collection of medical waste and hence they carry out open air incineration of these medical wastes within their compound. The remaining ash from medical waste incineration is also often stored on site.
Another dangerous trend observed in Ezhikkara Panchayat was disposal of electric waste including tubelights, batteries, etc. into canals and backwaters because of ignorance of people about scientific management techniques for such waste and non-availability of any collection systems for the same. In many other places people stated they did not know the correct technique nor had any system for disposing e-waste and hence were left with no option but to dump it in their own plots or public places.
Thus at present no proper disposal pattern for solid waste exists in rural areas particularly for non-biodegradable waste and disposal methods being practiced are often are clearly in contravention of the Municipal Solid Waste Management Rules (2015), Plastic Waste Management Rules (2016), Bio-Medical Waste Management Rules (2016) and e-Waste Management Rules (2015) formulated by Govt. of India and stipulations of CPCB (2013).
General awareness of the respondents on consequences of unscientific solid waste management is commendable with most of the respondents being aware about contamination of environment due to plastic waste, burning of plastic etc. However awareness of potential effect of plastics on ground water recharging was less indicating that IEC campaigns should focus on such dimensions. A noted paradox in this context was co-existence of such sound general knowledge with wrong perceptions about soil and water quality in their own locality. In spite of open burning/ dumping in soil of plastic and electric waste, flushing out wastewater into water bodies/ own compound and location of a few latrines in close proximity to water bodies, only few people reported soil and water pollution in their area. Analysis of water quality from samples collected belies this perception with high content of E-coli and coliform bacteria being observed in most of the samples collected. This paradox between general environment awareness and local environment quality perception could probably be due to lack of visible symptoms of environmental stress in rural areas as compared to urban cities.

71
Primary survey of sample G.Ps had revealed that open burning was the major method of disposal for non-bio degradable waste in rural areas which is
not an environmentally sound practice. In order to have a proper understanding of the dimensions of environmental impact due to waste as well as for designing a sound waste management system, it is necessary to have reliable estimates of waste generation and its composition. There cannot be a fit for all solution for waste as the quantum and type as well as physical and environmental conditions may vary from Panchayat to Panchayat. Reliable estimates of waste generation and its composition is also a pre-requisite for the formulation and implementation of any management strategy. The method and capacity of storage required, type, size and number of collection vehicles, optimum manpower required and periodicity of collection all depend primarily on volume and density of waste generated while disposal methods are influenced by composition of waste, its characteristics etc. Though some data on solid waste generated, collected, transported, treated etc. are available for Corporations and select Muncipalities in Kerala, hardly any such information is available for rural areas in the state. Hence waste audits were carried out in all the four sample Panchayats for assessing the quantity and characteristics of waste generated. The audit, apart from quantifying the issue of solid waste in the four Panchayats under study, is also expected to develop a methodology for conducting such studies in rural local bodies in the state.
6.1 Methodology for Conducting Waste AuditExisting literature reports a multitude of techniques for
estimating the quantity of waste generated by a community, the choice of which in any given context depends on size of the study area and resources available. Often quoted methods include:
• Direct Measurement Techniques through pilot studies to collect type and volume of waste generated by the community and
• Indirect Methods through assessment and summing up of the quantities of waste (i) collected and transported; (ii) backlog in collection and transportation; (iii) waste separated for recycling; and (iv) quantity disposed at source. Among these, we have used direct measurement
technique to assess the quantity and composition of waste generated in the sample Panchayats since it is generally reported to give more reliable results. Hence a waste audit was carried out in each of the four sample Panchayats for three days (one weekend and two week days).
A waste audit is a formal, structured process used to quantify the amount and types of waste being generated within a given region. Waste audit methodology was developed from World Bank Technical Paper number 426 which deals with designing and operating solid waste landfills in low-income countries. The methodology described was revised following discussions with statistical and waste management consultants and consisted of the following steps- a) Collection of a representative waste sampleb) Measurement of bulk densityc) Sorting of collected waste sample into various
components and weighing themd) Estimation of waste generation. Sampling design used for selecting sample units for
waste audit was the same as that for primary survey.
6.1.1 Methodology for Collection of Waste for AuditWaste audit was performed from generation sources
rather than end recipient (landfills, dumpsites, etc.) since a) that is reported to give most reliable results and b) at
Waste Audit

72
Role of Grama Panchayats in Waste Management and Environment Protection
rural level, there are no formal disposal sites and waste is disposed generally through burning at decentralised level. Members of Kudumbasree were engaged for collection of waste samples from generation sources and transferring the samples to a central location identified at each Panchayat for sorting and weighing purpose. Kudumbasree members along with co-ordinators and team members were trained in weighing and data entry procedure prior to commencement of the audit.
Two out of six working days and the week end holiday were selected for collection of waste generated by each of the selected units and its measurement. Waste audit was thus carried out for three days (two week days and one week end). In all Panchayats except Nenmeni, first day is the week end and second and third are week days. But in Nenmeni, third day is weekend and rest two are week days.
Sample units were made aware of the procedure for waste collection by Kudumbasree workers and survey team during the primary survey. Subsequently Kudumbasree workers distributed a collection bag each morning to the sample units for depositing daily waste. Daily distribution of bag prevented contamination and mixing of waste from previous day. Bag containing waste from previous day was collected around 7 a.m, weighed using a weigh scale and a fresh sample bag handed over to the household for next day’s sampling. Kudumbasree workers also collected information on sanitary napkin and diapers used daily in each household using a waste record sheet.
Waste was collected daily and number of waste bags counted to check the participation rate. This was then cross verified with data from the waste record sheet compiled by Kudumbasree.
Once the number of bags were counted, the waste was then unloaded onto a clean sheet surface for mixing since homogenization of waste collected is important for measurement of bulk density.
6.1.2 Methodology for Measurement of Bulk DensityBulk density of waste is an important parameter as they
remain fairly constant and helps to determine the volume of waste generated from each region. Bulk density is the mass of a portion of solid waste divided by the volume of the container which is filled by that portion under specific conditions. Volume of waste is important in determining the number and type of bins/vehicles required for collection.
Procedure for measurement of bulk density was as follows: 1. All waste collected was emptied onto a clean impervious
sheet for mixing.2. It was mixed thoroughly so that it is homogenized.
126
Decentralisation Analysis Cell (DAC)
Sample units were made aware of the procedure for waste collection process by
Kudumbasree workers and survey team during the primary survey. Subsequently
Kudumbasree workers distributed a collection bag each morning to the sample units for
depositing the daily waste generated. Daily distribution of bag prevented contamination and
mixing of waste from previous day. Bag containing waste from previous day was collected
around 7 a.m, weighed using a weigh scale and a fresh sample bag handed over to the
household for next day’s sampling. Kudumbasree workers also collected information on
sanitary napkin and diapers used daily in each household using a waste record sheet.
Waste was collected daily and number of waste bags counted to check the participation rate.
This was then cross verified with data from the waste record sheet compiled by
Kudumbasree.
Figure 6.1
Bag Containing Daily Waste Collected from Sample Institutions
Once the number of bags were counted, the waste was then unloaded onto a clean sheet
surface for mixing since homogenization of waste collected is important for measurement of
bulk density.
6.1.2 Methodology for Measurement of Bulk Density
Bulk density of waste is an important parameter as they remain fairly constant and
helps to determine the volume of waste generated from each region. Bulk density is the mass
of a portion of solid waste divided by the volume of the container which is filled by that
portion under specific conditions. Volume of waste is important in determining the number
and type of bins required for collection.
Procedure for measurement of bulk density was as follows:
Figure 6.3 : Methodology for Measurement of Bulk density Step 2
127
Decentralisation Analysis Cell (DAC)
1. All waste collected was emptied onto a clean impervious sheet for mixing.
2. It was mixed thoroughly so that it is homogenized.
3. Electronic waste such as bulbs and tubelights were separated and collected prior to
mixing so that breakage is avoided.
4. Once the waste was homogenized, it was loaded into a container with known volume
and weight.
5. The container filled with homogenized waste was then weighed after which the
contents were returned for sorting.
Figure 6.2Methodology for Measurement of Bulk density Step 1
Figure 6.3
Methodology for Measurement of Bulk density Step 2
Figure 6.4
Methodology for Measurement of Bulk density Step 3
Figure 6.4 : Methodology for Measurement of Bulk density Step 3
Figure 6.1 Bag Containing Daily Waste Collected from Sample Institutions
Figure 6.2 :Methodology for Measurement of Bulk density Step 1

73
3. Electronic waste such as bulbs and tubelights were separated and collected prior to mixing so that breakage is avoided.
4. Once the waste was homogenized, it was loaded into a container with known volume and weight.
5. The container filled with homogenized waste was then weighed after which the contents were returned for sorting.
6.1.3 Methodology for Waste Composition StudyThe homogenized waste was then loaded on a sorting
table of dimension 1.5m x 3m with 10mm wire mesh grid. The sorting table was placed on an impervious sheet to collect waste fraction of size less than 10mm. The waste was then sorted into different categories such as paper, plastic etc. and collected in correspondingly labelled bags. Components of waste assessed included the following:
1. Food waste 2. Plastic bags 3. Plastic bottles 4. Glass 5. Paper/card board 6. Battery/bulb/ e-waste 7. Medical waste 8. Metal waste 9. Combustible waste 10. Sanitary napkin & diaperSubsequent to sorting of waste stream into various
fractions mentioned above, gross weight of each bag containing each fraction was collected using a weigh scale. The same procedure was repeated daily in all the four Panchayats. As the waste collected was sorted on a day to day basis with least time lag, moisture loss is considered to be minimum.
In the above list, sanitary napkins/diapers were not collected or segregated and instead information on the number of sanitary napkins/diapers generated daily from each household was collected. The weight of sanitary napkin and diaper was calculated by multiplying their daily generation rate, which is available from data collected by Kudumbasree with a fixed weight of 230 grams per used diaper/sanitary napkin12.
6.1.4 Methodology for Estimating Total Weekly Waste from Panchayat
Once waste generated by the representative sample units in each Panchayat was measured, this was used to estimate the total quantity of waste generated per week from the respective Panchayats using the following method.
129
Decentralisation Analysis Cell (DAC)
Figure 6.5: Sorting table with 10mm wire mesh Figure 6.6: Waste sorting process
Figure 6.7: Weighing each Waste Fraction
6.1.4 Methodology for Estimating Total Weekly Waste from Panchayat
Once waste generated by the representative sample units in each Panchayat was
measured, this was used to estimate the total quantity of waste generated per week from the
respective Panchayats using the following method.
T= T1 +T2
T1= ∑ ∑ (M1j/m1j)[3∑y1ijk +y1ij3]
T2= (N/n)∑ ∑ (M2j/m2j)[3∑y2ijk +y2ij3]
Where T1= Total of waste generated by first group of wards
And T2= Total of waste generated by second group of wards
Here 1or 2 denotes the type of ward (1=wards selected with probability one,
2=others)
Figure 6.7: Weighing each Waste Fraction
12http://www.knowaste.com/local-authorities/calculating-your-ahp-tonnages
Figure 6.5: Sorting table with 10mm wire mesh
Figure 6.6: Waste sorting process
Waste Audit

74
Role of Grama Panchayats in Waste Management and Environment Protection
T= T1 +T2T1= ∑ ∑ (M1j/m1j)[3∑y1ijk +y1ij3]T2= (N/n)∑ ∑ (M2j/m2j)[3∑y2ijk +y2ij3] Where T1= Total of waste generated by first group of wardsAnd T2= Total of waste generated by second group of
wardsHere 1or 2 denotes the type of ward (1=wards selected
with probability one, 2=others)i = subscript for ith wardj = subscript for jth type of buildingk= 1, 2 or 3 denotes the day of survey and day three is the
holidayN= total number of wards in the second groupn= the number of wards selected for the survey from
second groupM1j=the total number of jth type of institution in the first
group of wardsm1j =the number of jth type of institution selected for the
survey in the first group of wardsM2j=the total number of jth type of institution in the second
group of wardsm2j=the number of jth type of institution selected for the
survey in the second group of wardsygijk = the amount of waste produced in kth day by the jth building of ith ward
6.2 Generation and Characteristics of Solid Waste in Sample G.Ps
Waste generation in sample Panchayats and characteristics of solid waste are assessed in this section.
6.2.1 Waste Generation in Sample PanchayatsPer capita waste generation per day, total quantum of
waste generated per week, different sources of generation and composition of waste are examined for all the four sample G.Ps based on results of the waste audit.
6.2.1.1. Quantum of Waste Generated in Sample G.Ps
Results of waste audit revealed that a person on an average generates between 160 to 190 grams of solid waste per day in Kanjiramkulam, Marutharode and Nenmeni G.Ps. This is in conformity with what has been estimated for G.Ps in Kerala by Suchitwa Mission which estimated per capita waste generation in grams per day in 2006 as 187gms for 999 G.Ps, 268 gms for the 53 municipalities and 465 gms for the Municipal corporations (Varma 2009). However per capita generation in Ezhikkara was higher at 281 grams per day. The estimates as per JNNRUM studies in 2007 indicates per capita generation per day to be 307 and 215 respectively in Thiruvankulam and Varappuzha Panchayats in Ernakulam district. Wide variations in waste generation is reported by studies particularly in relation to municipalities even within the same district with per capita generation in eight municipalities in Ernakulam district being observed to vary from 92 g/day to 484 g/day (Maya et al. 2000). While higher generation rates in Ezhikkara could be partly due to its very proximity to North Paravur Municipality, Kochi city and the nature of reported occupation of significant sections of population as construction workers working in Kochi city, our study also indicates that a single frame fits all scenario cannot be assumed in the case of all rural areas with the magnitude of solid waste generation varying with regional specificities.
Estimation of total waste generated in Panchayats revealed highest weekly generation of 61 tonnes in Nenemeni Panchayat followed by around 39 tonnes in Marutharode, 36 tonnes in Ezhikkara and 25 tonnes in Kanjiramkulam- most of which are disposed either by open burning or dumping.
6.2.1.2 Source of Waste Generation in Sample PanchayatsMajor proportion of total waste generated per week in
all sample Panchayats comes from residential buildings indicating that these should be the primary points of intervention in any solid waste management strategy. More than 90 percent of the total waste is generated by residential buildings in Marutharode, 88 percent Nenmeni,
Table 6.1: Waste Generation in Sample G.PsEzhikkara Kanjiramkulam Marutharode Nenmeni
Population 18019 21989 34627 46950Daily per capita waste generation (Grams)
281.51 165.36 160.68 186.29
Weekly per capita waste generation (Kg.)
1.97 1.16 1.12 1.30
Total weekly waste gen-erated in the Panchayat (Tonnes)
35.51 25.45 38.95 61.22
Source: Waste audit

75
80 in Ezhikkara and is above 75 percent in Kanjiramkulam G.P. This is rather high as compared to that estimated for city areas where the proportion of waste generated from households is reported to vary from 47 percent in Kozhikode Corporation to 66 percent in Kochi (KSUDP 2006). Comparatively higher proportion of domestic source in G.Ps can be partly attributed to lower presence of commercial establishments and other bulk generators such as hospitals, hotels, marriage auditoriums etc. and partly due to absence of market place in all Panchayats except Kanjiramkulam. In the latter Panchayat where there existed one market, domestic waste accounted for a lower share of 76 percent.
6.2.1.3 Composition of Waste in Sample G.PsAnalysis of the composition of waste reveals that major
proportion of total waste generated in all sample Panchayats is organic kitchen waste and consists of food, vegetable, fish and
meat waste which are bio-degradable. It was observed to be highest in Kanjiramkulam compared to other Panchayats and was seventy one percent there, followed by sixty eight percent in Nenmeni and more than 61 percent in Marutharode and Ezhikkara.What is noteworthy is the high proportion of plastic waste- particularly plastic covers and packaging generated in all four Panchayats. Weekly generation of plastic waste was 14 percent in Nenmeni, 11 percent in Ezhikkara and Marutharode and was noted to be lowest in Kanjiramkulam at 8 percent. While generation rate of plastic covers and packaging material in Nenmeni was more or less same as that of Ezhikkara and Marutharode, the higher value for plastic waste here is due to plastic bottle waste generated from the tourist destination - Edakkal caves which is located here. Share of plastic bottles in total waste generation per week is 4.58 percent in Nenmeni Panchayat of which 3.62 percent is from Edakkal caves. Remaining 0.97 percent is actually less
Table 6.2: Source wise Waste GenerationSample G.Ps (Waste Generated in tonnes)
Subgroup Ezhikkara Kanjiramkulam Marutharode Nenmeni
Residential buildings 28.65 (80.70)
19.39 (76.19)
36.21 (92.98)
54.17 (88.48)
Commercial establishments
5.41 (15.23)
3.79 (14.90)
2.04 (5.24)
5.86 (9.57)
Others 1.45 (4.07)
0.74 (2.92)
6.94 (1.78)
1.19 (1.95)
MarketX
1.52 (5.99) X X
Total 35.51 (100)
25.45 (100)
38.95 (100)
61.22 (100)
Source: Waste audit (Figures in bracket are percentage)
Table 6.3 : Components of Waste (in percentage)Sample G.Ps
Components of waste Ezhikkara Kanjiramkulam Marutharode Nenmeni
Food waste 61.88 71.14 61.20 67.63Plastic bags 9.39 7.04 9.55 9.56Plastic bottles 2.07 0.79 1.84 0.97 / 3.62*Glass 1.33 0.18 0.91 0.96Paper/bardboard 9.42 6.25 12.31 6.25e-waste 0.57 0.58 0.82 0.54Medical waste 2.38 3.47 1.38 0.18Metal waste 0.39 0.06 0.11 1.12Combustible waste 4.99 7.14 5.33 2.22Sanitary napkin and diaper 7.58 3.35 6.56 6.95Total 100 100 100 100
Source: Waste audit *denotes plastic bottles of Edakkal cave
Waste Audit

76
Role of Grama Panchayats in Waste Management and Environment Protection
than that of Marutharode and Ezhikkara Panchayat. Such higher estimates for plastic waste, particularly
covers and packaging, as compared to earlier studies in Kerala which report lower estimates in urban areas with variation from 2.05 percent of total waste in Kozhikode to 6.97 percent in Aluva (KSUDP 2006, Maya et al. 2000 ) could be due to various reasons such as 1) other studies, having as their focus of interest the charaterestics of waste reaching central treatment plants/disposal sites, have analysed composition based on samples taken from secondary collection points or end disposal points where some leakage would already have occured particularly of recyclable material while our study has analysed composition based on samples collected from source or generation point so as to avoid leakages 2) increasing usage of plastic over the years particularly use of packaged products even in rural areas (since all other studies relate to 2006/ 2007 or earlier) and 3) plausible increase in weight of plastic covers due to legislation regarding minimum microns for plastic covers. While this aspect warrants further research as to cause and consequences of plastic usage, what our study strongly indicates is that quantum of plastic waste generated in Kerala could be much higher than that projected by existing studies.
Paper/cardboard waste is high in Marutharode and Ezhikkara accounting for around 12 percent and 9 percent respectively. Glass waste, electronic waste and metal waste are less in all sample Panchayats indicating that collection periodicity can be less frequent as compared to plastic and paper. Medical waste is very less in Nenmeni Panchayat as compared to all other sample Panchayats (Existence of hospitals and laboratories is also less here according to assessment register of the Panchayat). Combustible waste is high in Kanjiramkulam Panchayat due to the existence of waste from weaving units and tailoring shops and low in Nenmeni Panchayat. Another striking feature was the significant generation of sanitary waste in all Panchayts (around 7 percent ) except Kanjiramkulam (3 percent) indicating increasing use of diapers and sanitary napkins even in rural areas most of which are disposed off through open burning or throwing in soil.
6.2.2 Characteristics of Solid WasteCharacteristics of solid waste will significantly influence the
choice of technology and operational modalities of waste disposal facilities.The physical and chemical parameters studied within our audit include:
1. Bulk density (kg/cbm)2. Moisture content (%)3. pH
4. Calorific value (kCal/kg)Chemical parameters were tested as per ASTM
international standards. A sample of size 1 kg was collected from waste generated daily and sent to the testing facility. The representative sample was collected using standard coning and quartering method. This sample was collected within two hours of collection of waste by Kudumbasree workers to prevent moisture loss and stored in an air tight container to prevent any contamination.
6.2.2.1 Bulk Density of Collected Waste (kg/cbm)The bulk density of solid waste in our four sample
Panchayats varied from 150 to 230 Kg/cbm and is less as compared to the bulk density of municipalities which is reported to vary between 420 to 688 kg/cbm (SEUF 2006). Bulk density is relatively high in Kanjiramkulam compared to other sample G.Ps and is more than 200kg/cbm in all three days. This can be attributed to high food waste content with high density and lower fraction of waste with low density such as plastic and paper in comparison to other Panchayats considered. Kanjiramkulam Panchayat, unlike the other three Panchayats sampled also had a public market in their area which contributed to the higher fraction of food waste. Hence bulk density of market waste in this Panchayat is presented separately and is observed to be 380- 450 kg/cbm.
Table 6.4: Mean Bulk Density of Waste in Sample G.Ps
Sample G.Ps First day Second day Third dayEzhikkara 160 152 200Kanjiramkulam 202 216 231.2Kanjiramkulam Market
452 386 409.6
Marutharode 176 180.8 126.4Nenmeni 164 186 196.8
Source: waste audit
6.2.2.2 Moisture Content (%)Moisture content is defined as the ratio of the weight of
water to the total weight of the wet waste and is a crucial parameter that determines the degradation of solid waste in landfills (Nitin et. al., 2003). Moisture content affects microbial activity, as well as the physical structure, in the composting process, and thus has a central influence on the biodegradation of organic materials.Very low moisture content values would cause early dehydration during composting, which will arrest the biological process, thus giving physically stable but biologically unstable composts (De-Bertoldi et al., 1983). On the other hand, high moisture

77
may produce anaerobic conditions due to water logging, which will prevent and halt the ongoing composting activities (Schulze KL., 1962). Also, high moisture content affects particle aggregation, matrix porosity, air-filled porosity, and matrix gas permeability, all of which can limit transport of essential oxygen into the composting zone where carcass decomposition occurs (Miller FC., 1989). Previously reported optimum moisture contents for composting range from 25 percent to 80 percent on a wet basis (w.b.), with generally recommended values in the 50 percent to 70 percent range (Imbeah M.1997, Haug RT 1993).
The typical range of moisture content is 20-40 percent, representing the extremes of waste in an arid climate and in the wet season of a region of high precipitation. However values greater than 40 percent are also reported in states like Kerala which experience around 6 months rainfall in a year (Damodaran et al. 2010). Our analysis indicates moisture content of waste in Ezhikkara, Kanjiramkulam and Nenmeni G.Ps to be within the range of 60-76 percent on all three days while a higher value was reported in Nenmeni on the second day. Such high moisture content is also reported in other studies on Corporations/ Municipalities in Kerala (CPCB 2004-05).
Table 6.5: Moisture Content (%) Sample G.Ps First day Second day Third day
Ezhikkara 60.73 65.33 76.3Kanjiramkulam 61 70 78Marutharode 38 32 48Nenmeni 72.85 82.73 73.32
Source: waste audit
Table 6.6: pH Sample G.Ps First day Second day Third day
Ezhikkara 4.02 4.75 4.8Kanjiramkulam 4.15 5.83 6.18Marutharode 4.1 4.8 4.6Nenmeni 4.23 3.95 4.91
Source: waste audit
Table 6.7: Calorific ValueSample GPs Calorific value (kCal/kg)
Ezhikkara 3950Kanjiramkulam 3692.55Marutharode 3687.17Nenmeni 4496.59
Source: waste audit
However moisture content was lower in Marutharode and varied from 32-48 percent.
6.2.2.3 pHpH is a numeric scale used to specify the acidity
or basicity (alkalinity of the waste).The pH values of waste in all four Panchayats ranged from 4-6 indicating that it is acidic in nature. This could be because of the high fraction of household waste and consequently food waste in total waste stream in all four Panchayats. Centrally collected household waste is often reported to be acidic, with pH normally ranging between 4.5 and 6 (Eklind et al., 1997). The acidity is ascribed to the presence of short chain organic acids, mainly lactic and acetic acid (BeckFriis et al., 2001). During successful and fully developed composting, the pH often rises to 8-9 (Sundberg et al.,2004).
According to Municipal Solid Waste (Management and Handling) Rules 2000, The pH value for municipal solid waste is between 5.5-8.5 and this value is reported in many municipalities and corporations in Kerala (SEUF 2006). Our study indicates a lower pH value for solid waste in rural areas as compared to that in urban areas because of higher fraction of organic waste generated from rural areas in comparison to urban areas.
Waste Audit

78
Role of Grama Panchayats in Waste Management and Environment Protection
6.2.2.4 Calorific Value (kCal/kg)Calorific value is an indicator for evaluating the
feasibility of converting waste to energy. Values estimated for our sample G.Ps revealed high values compared to other studies in Kerala (SEUF 2006, Maya et al., 2000) and were closer to that estimated by CPCB for regions such as Imphal, Aizawal, Itanagar etc. (CPCB 2004-05). Among our G.Ps, sample from Marutharode had the lowest calorific value of 3687 kCal/kg while Nenmeni had the highest with 4496.6 kcal/kg. This can be attributed to the high fraction of plastic waste (bags and bottles) in Nenmeni whereas Marutharode has the highest fraction of paper and cardboard which are wet and soiled which result in lower calorific value.
6.3 SummaryWaste audit conducted by the study team on the
selected G.Ps found that significant quantities of solid waste is generated in rural areas in Kerala. It is estimated that weekly generation of solid waste range from 25 to 61 tonnes in sample G.Ps with bulk density ranging from 150 – 230 kg/cbm. The greatest quantum of waste generated per week was 61 tonnes in Nenmeni Panchayat followed by 39 tonnes in Marutharode, 36 tonnes in Ezhikkara and 25 tonnes in Kanjiramkulam. The per capita waste generation varied between 161 gms per day to 186 gms in Nenmeni, Kanjiramkulam and Marutharode which is in the range of/ or slightly lower than what has been predicted for Panchayats in Kerala by Suchitwa Mission in 2006. However, per capita generation was slightly higher in Ezhikkara Panchayat at 281 gms per day.
Major source of solid waste generation in rural areas is households which account for more than 80 percent of weekly generation of waste. This indicates that these should be the primary target group in any action plan for management of solid waste in rural areas.
The main component of solid waste in rural areas was observed to be bio-degradable kitchen waste consisting of food, vegetable and fish/ meat waste. Solid waste in rural areas was also found to have higher proportion of plastic generated than estimated even for urban areas in previous studies. Since all other studies hitherto have analysed composition of waste based on representative samples collected from secondary collection points or disposal sites as compared to the present study which is based on 732 samples collected at generator’s point/ source point which reduces chances of leakages, it suggests that the quantum of plastic waste generated is currently higher in Kerala than is officially estimated. For instance plastic accounted for 10-11 percent of waste in Ezhikkara, Marutharode and Nenmeni and 8 percent in Kanjiramkulam- the major component of which consisted of plastic carry bags. Significant quantities of sanitary waste was also being generated in both the Panchayats indicating usage of sanitary pads and diapers even in rural areas all of which lack proper disposal system at present posing threats to the environment.
Organic fraction ranging from 61 percent to 71 percent of total waste indicate the potential for introducing household organic waste treatment system using composting techniques. Moisture content and pH of waste also reveals suitability of waste for composting.

79
Social Implications
Solid waste management being a burning issue faced by Kerala at present, the audit had its own social impact some of which include
1) Media focus on waste audit and issue of waste management during the course of the study
2) Action program to promote waste segregation in one of the sample Panchayats
3) Design of a standardised methodology for conduct of waste audit and development of replicable operational model for subsequent action plan
4) Social entrepreneurship program to reduce the quantum of plastic waste in the state.
140
Decentralisation Analysis Cell (DAC)
Figure 7.2: News Report- Kanjiramkulam
Figure 7.3: News Report- Marutharode
7.2 Action Program to Promote Waste Segregation in Ezhikkara Panchayat –‘Ezhazhakilekku Ezhikkara’
Subsequent to the study an action program was launched in one of the
samplePanchayats- Ezhikkara in January 2015 aimed at establishing a model green ward
which would practice segregation and recycling of solid waste.
The project was funded under the Paaristhithikam programme of the Department of
Environment and Climate Change, Government of Kerala and was implemented jointly by
Bhoomithra Sena Club of St. Teresa’s College, Ernakulam, EzhikkaraPanchayat,
Kudumbasree units, Ezhikkara, educational institutions, and other stakeholders in the locality.
The overall projects aimed at changing the current practice of disposal of plastic waste-
the major component of non-biodegradable waste in the Panchayat waste – namely burning,
disposing in nearby back waters or dumping in soil.The project was first implemented in
around 400 households in ward 7 of Ezhikkara Panchayat. Local public were educated about
bio-degradable and non-biodegradable waste, the need for segregation and appropriate
method of disposal. With the help of Kudumbasree members, non- biodegradable waste was
collected periodically from the households which were handed over to Credai Clean City
Movement for recycling. In order to reduce the usage of plastic carry bags, the Kudumbasree
members of Ezhikkara Panchayat were also given a training in making cloth bags
Figure 7.2 a: News Report- Kanjiramkulam
Figure 7.2 b: News Report- Kanjiramkulam
139
Decentralisation Analysis Cell (DAC)
7 Social Implications
Solid waste management being a burning issue faced by Kerala at present, the study had its
own social impact some of which include
1) Media focus on waste audit and issue of waste management during the course of the
study
2) Action program to promote waste segregation in one of the sample Panchayats
3) Design of a standardised methodology for conduct of waste audit and development of
replicable operational model for subsequent action plan
4) Social entrepreneurship program to reduce the quantum of plastic waste in the state
5) Strengthened awareness campaign on hazards of plastic waste.
7.1 Media Focus on Waste Audit The waste audit conducted in sample Panchayats was reported in local print media
highlighting the issue of waste even in rural areas.
Figure 7.1: News Report- Ezhikkara
Figure 7.1: News Report- Ezhikkara
7.1 Media Focus on Waste Audit The waste audit conducted in sample Panchayats was
reported in local print media highlighting the issue of waste even in rural areas.
7.2 Action Program to Promote Waste Segregation in Ezhikkara Panchayat –‘Ezhazhakilekku Ezhikkara’
Subsequent to the audit, an action program was launched in one of the sample Panchayats- Ezhikkara in January 2015 aimed at establishing a model green ward
140
Decentralisation Analysis Cell (DAC)
Figure 7.2: News Report- Kanjiramkulam
Figure 7.3: News Report- Marutharode
7.2 Action Program to Promote Waste Segregation in Ezhikkara Panchayat –‘Ezhazhakilekku Ezhikkara’
Subsequent to the study an action program was launched in one of the
samplePanchayats- Ezhikkara in January 2015 aimed at establishing a model green ward
which would practice segregation and recycling of solid waste.
The project was funded under the Paaristhithikam programme of the Department of
Environment and Climate Change, Government of Kerala and was implemented jointly by
Bhoomithra Sena Club of St. Teresa’s College, Ernakulam, EzhikkaraPanchayat,
Kudumbasree units, Ezhikkara, educational institutions, and other stakeholders in the locality.
The overall projects aimed at changing the current practice of disposal of plastic waste-
the major component of non-biodegradable waste in the Panchayat waste – namely burning,
disposing in nearby back waters or dumping in soil.The project was first implemented in
around 400 households in ward 7 of Ezhikkara Panchayat. Local public were educated about
bio-degradable and non-biodegradable waste, the need for segregation and appropriate
method of disposal. With the help of Kudumbasree members, non- biodegradable waste was
collected periodically from the households which were handed over to Credai Clean City
Movement for recycling. In order to reduce the usage of plastic carry bags, the Kudumbasree
members of Ezhikkara Panchayat were also given a training in making cloth bags
Figure 7.3: News Report- Marutharode

80
Role of Grama Panchayats in Waste Management and Environment Protection
which would practice segregation and recycling of solid waste.
The project was funded under the Paaristhithikam programme of the Department of Environment and Climate Change, Government of Kerala and was implemented jointly by Bhoomithra Sena Club of St. Teresa’s College, Ernakulam, Ezhikkara Panchayat, Kudumbasree units, educational institutions, and other stakeholders in the locality.
The overall projects aimed at changing the current practice of disposal of plastic waste- the major component of non-biodegradable waste in the Panchayat waste – namely burning, disposing in nearby back waters or dumping in soil. The project was first implemented in around 400 households in ward 7 of Ezhikkara Panchayat. Local public were educated about bio-degradable and non-biodegradable waste, the need for segregation and appropriate method of disposal. With the help of Kudumbasree members, non- biodegradable waste was collected periodically from the households which were handed over to Credai Clean City Movement for recycling. In order to reduce the usage of plastic carry bags, the Kudumbasree members of Ezhikkara Panchayat were also given a training in making cloth bags (Bhoomithram Sanchi). Motivation campaigns were organised to sustain interest and participation.
In 2016 the same activities were extended to nearly 390 households in ward 10 of Ezhikkara Panchayat. Thus, around 700 households are currently involved in this project.
7.3 Operational Model for Solid Waste Management in G.Ps
An operational model for solid waste management was designed based on experience gained while implementing the above pilot project in Ezhikkara Panchayat during the
period of study. The model which can be followed by other G.Ps suggests a multi-phase strategy which include the following phases:
a) Base line survey, identification of ground situation and quantification of challenges
Basic requirement for design of any project is an understanding of the existing situation so that the challenges can be quantified into achievable milestones. This requires information on environmental quality indicators including quantity/ composition of solid waste generated, major generation points, existing management systems, problem areas in waste disposal etc. Such information can be obtained through conducting waste audits/ water quality analysis/ soil health cards and through primary survey of sample of institutions. The methodology for waste audit and standardised schedules with keys evolved through the present study can be utilised for the same. The survey can be initiated by Panchayat and can be conducted utilising voluntary services of Nature clubs, NSS units etc. of nearby higher educational institutions and paid services of Kudumbasree members. Funds of various projects from established institutions such as those of STED, CED, DoECC, etc. can be channelised for the purpose.
b) Identify key stakeholders, share results of survey, create generic demand
Here LG needs to mobilise key stakeholder groups such as all ward members, residents associations, SHG groups, Community Based Organisations and share the above information with them highlighting the challenges faced so as to generate generic demand. Generic demand covers all direct benefits perceived by the community as motivations to change without external influence and includes all measures that will contribute to increasing the quality of the local environment for everyone. Here the presentation of environment report cards should use visual media to
141
Decentralisation Analysis Cell (DAC)
(Bhoomithram Sanchi). Motivation campaigns were organised to sustain interest and
participation.
In 2016 the same activities were extended to nearly 390 households in ward 10 of Ezhikkara
Panchayat. Thus, around 700 households are currently involved in this project.
Figure 7.4: Launch of Ezhazhakilekku Ezhikkara- Ward 7
Figure 7.5: House to House Awareness Campaign in Ward 7
Figure 7.6: House to House Awareness Campaign in Ward 10
Figure 7.4: Launch of Ezhazhakilekku Ezhikkara- Ward 7

81
highlight the future consequences in graphic detail keeping in mind a basic tenet of behavioural economics that people are bad at computing and have internal biases of salience and discounting. Thus they generally overestimate the likelihood of an event that they can easily imagine and underestimate the relevance of things that might happen only in the distant future. Strategy of framing effects should be made use of to leave a distinct imprint in the mind about the ground realities and looming consequences.
Where needed, demand also needs to be created by enforcement which includes motivations from external resources, such as local regulations which generates a demand that would not exist if the community is left to adopt behaviour independently.c) Identify technology for waste streams, technology providers, user fee
Identification of technology and technology providers should be done based on an informed choice approach which involves decisions by stakeholders/consumers from
among feasible technical, financial and organisational options based on an adequate understanding of alternative consequences. To facilitate this, information on feasible and cost effective technologies for source treatment of organic waste should be disseminated. Decisions should cover the following aspects: i) Common technology for decentralised treatment
of organic waste - The principle of subsidiarity and generator’s responsibility, is advocated for Kerala as the strategy to be promoted for management of organic waste. Considering the high moisture content of MSW in Kerala, the appropriate technologies identified as suitable for treatment of this component is composting with vermi composting/ biomethanation, pit/pot/ pipe composting etc. being advocated at household level and bin composting, bio-methanation and shed composting (vermi composting and aerobic composting) suggested for institutions. The high organic composition of solid waste generated in
141
Decentralisation Analysis Cell (DAC)
(Bhoomithram Sanchi). Motivation campaigns were organised to sustain interest and
participation.
In 2016 the same activities were extended to nearly 390 households in ward 10 of Ezhikkara
Panchayat. Thus, around 700 households are currently involved in this project.
Figure 7.4: Launch of Ezhazhakilekku Ezhikkara- Ward 7
Figure 7.5: House to House Awareness Campaign in Ward 7
Figure 7.6: House to House Awareness Campaign in Ward 10
Figure 7.5: House to House Awareness Campaign in Ward 7
141
Decentralisation Analysis Cell (DAC)
(Bhoomithram Sanchi). Motivation campaigns were organised to sustain interest and
participation.
In 2016 the same activities were extended to nearly 390 households in ward 10 of Ezhikkara
Panchayat. Thus, around 700 households are currently involved in this project.
Figure 7.4: Launch of Ezhazhakilekku Ezhikkara- Ward 7
Figure 7.5: House to House Awareness Campaign in Ward 7
Figure 7.6: House to House Awareness Campaign in Ward 10
142
Decentralisation Analysis Cell (DAC)
Figure 7.7: Launch of Ezhazhakilekku Ezhikkara- Ward 10 (Inaugurated by Cine Artist Kavya Madhvan on Feb 4, 2016)
7.3 Operational Model for Solid Waste Management in G.Ps An operational model for solid waste management was designed based on experience
gained while implementing the above pilot project in Ezhikkara Panchayat during the period
of study. The model which can be followed by other G.Ps suggests a multi-phase strategy
which include the following phases:
Figure 7.6: House to House Awareness Campaign in Ward 10 Figure 7.7: Launch of Ezhazhakilekku Ezhikkara- Ward 10 (Inaugurated by Cine Artist Kavya Madhvan on Feb 4, 2016)
Social Implications

82
Role of Grama Panchayats in Waste Management and Environment Protection
sample Panchayats along with high moisture content indicate that composting is the suitable method to be promoted for treatment of organic waste in rural areas where natural bio-systems are inadequate.
ii) Technology providers – while choosing technology providers, the list approved by Suchitwa mission can be made use of with a preference for those providers who guarantee operational support.
iii) Trouble shooting mechanisms - such programmes should, as far as possible, be adopted en masse to facilitate sharing of experience and be supplemented with trouble shooting systems involving technical support groups/ waste clinics/consultancy to ensure smooth operation and sustainability. Groups of
Kudumbasree members could be trained in their maintenance so that households have an agency to help and advice in operating the systems which in turn can encourage greater confidence and lower failure rates.
iv) Integration of kitchen/terrace garden with solid waste management capitalising on current public awakening to the danger of poisons in purchased vegetables. This will complete the organic chain and provide a useful outlet for the compost generated from organic waste treatment systems.
v) Operational system to be adopted for non biodegradable waste – including collection/ treatment/ disposal system. Potential for small/ big enterprises for recycling paper,
143
Decentralisation Analysis Cell (DAC)
Figure 7.8: Multi-phase Strategy Model
a) Base line survey, identification of ground situation and quantification of
challenges
Basic requirement for design of any project is an understanding of the existing situation
so that the challenges can be quantified into achievable milestones. This requires information
on environmental quality indicators including quantity/ composition of solid waste generated,
major generation points, existing management systems, problem areas in waste disposal etc.
Such information can be obtained through conducting waste audits/ water quality analysis/
soil health cards and through primary survey of sample of institutions. The methodology for
waste audit and standardised schedules with keys evolved through the present study can be
utilised for the same. The survey can be initiated by Panchayat and can be conducted utilising
voluntary services of Nature clubs, NSS units etc. of nearby higher educational institutions
and paid services of Kudumbasree members. Funds of various projects from established
institutions such as those of STED, CED, DoECC, etc. can be channelised for the purpose.
a. Base line study-quantify challenge-
conduct waste audits, water quality
analysis
b. Share results of survey with stakeholder
groups, create Generic demand
c. Identify technology for waste streams technology
providers, user fee
d. Fix achievable targets-both short term and long
term
e. Identify actors, fix responsibilities
f. Formulate elaborate Action plan
g. Build Community based institutions
h. Carry out Extensive IEC campaign
i. Initiate segregation/recycling/
treatment
j. Periodic monitoring and trouble shooting
k. Review , share audit results in Gram sabhas
l. Publicly recognise active participants
Figure 7.8: Multi-phase Strategy Model

83
plastic etc. need to be explored at the local/ block/ district/ state level. This will serve the dual purpose of increasing manufacturing activity as well as promoting sustainable development. Considering the increase in generation of plastic waste, small units for shredding plastic and utilizing the same for tarring of roads need to be set up as it has been reported successful in pilot projects in various parts of the country and recommended as an accepted method in India.
vi) Fixing user fee for collection of non-biodegradable waste.
vii) Material substitution and waste reduction/ recycling strategies-Local governments need to emphasise and promote waste reduction and re-use particularly in the case of plastic carry bags which we have observed amount to quite a significant component even in rural areas.
viii) Strategy for management of slaughter house waste/ market waste- being more uniform in nature, biomethanation is identified by research studies and technical experts as the most suitable strategy for dealing with market waste. Hence where markets exist, G.Ps need to consider setting up biogas plants.
d) Fix achievable targets both long term and short term.Through collective discussion with stakeholder groups,
achievable targets need to be specified in all areas. Here decisions need to be taken on whether a phased approach is to be taken starting with pilot ward/ wards and gradually expanding to cover entire Panchayat or a big bang approach simultaneously initiated over whole G.P is to adopted. In all cases, clear achievable targets needs to be fixed for both short run and long run through participation of all stakeholders. These can serve as a guide for evaluation of progress in future time periods.
Decisions should also be taken on • legal amendments needed - bylaws and rules• human and institutional capacity building required
All such key decisions should be taken through a community participatory approach based on the tenet that people need to feel involved and effective to make a change.
e) and f) Identify actors, fix responsibilities and accountabilities of each actor, formulate elaborate action plan
Next stage involves design of an elaborate plan of action, identifying various functionaries and assigning functions to them. This should again be done through a collective and participatory process and should be context specific based on a sound assessment of the technological options, financial feasibility as well as a deep understanding of local situation including the size of the problem, and
related psychological biases, cognitive burdens, social norms, mental modes, etc. Provisions needs to be made for ensuring flexibility through options for midcourse changes based on ground experience.
g) Build community based institutionLong run sustainability of any management plan
necessitates establishment of a number of supporting institutions which include:i) Panchayat level waste management committee
consisting of president and health standing committee chairperson but managed by an expert. Since institutional capacity of Local Governments is generally low in the area of environment management, capacity building training programmes in specific functional areas can be conducted for such selected functionaries entrusted with the various tasks. Such modules may be integrated with the periodic training programmes conducted by Kerala Institute of Local Administration (KILA) at present for local elected representatives.
ii) Ward level committee/ assign specific geographic areas to them.
iii) Trouble shooting groups / train them for decentralised treatment of organic waste.
iv) Trouble shooting cell – with phone number which is accountable for registering issues and ensuring follow up.
v) Drop off centres/ material recovery centres managed by Panchayat/ NGOs.
vi) Collection groups- rag pickers/ recyclers, fix schedules for collection-while designing a collection system for non biodegradable waste, attempts should be made to integrate any informal systems of rag-pickers existing in the locality. The contact details of recyclers published at Suchitwa Mission website can also be utilised where needed. Such integration/ authorisation lends credibility to the rag pickers besides promoting livelihood avenues to the poor and encouraging sustainable re-use of resources. Where such informal systems are not available, potential for setting up a self sustaining profitable system under Kudumbasree initiative can be explored.
vii) Community based monitoring committees consisting of volunteering student groups, NGOs, residents association representatives, ward members, Kudumbasree members etc.
h) Carry out extensive IEC campaignExtensive IEC campaigns need to be organised targeting
various segments of population. Campaign should focus
Social Implications

84
Role of Grama Panchayats in Waste Management and Environment Protection
on immediate as well as long term health aspects of waste management as well as benefit of poison free organic cultivation. It should strive for social engineering and needs to be designed taking into account the basic tenets of behavioural economics - that habits are important, people are motivated to do the right thing, are bad at computation, need to feel involved and effective to make a change and people’s self-expectations influence behaviour. Use of role models, shaping of people’s self-expectations through public commitments, periodic reminder through media, facebook, whatsapp etc. are certain potential tactics in this context. For instance public commitments are reported to encourage people to act on their intentions by locking them to a course of action. Similarly communication strategies drawn on local mental modes, social norms, use of role models, peers and networks can be more effective than when done otherwise. Narrative communicative structures involving use of art, imagery, local history, folklore and tradition may play a significant role in shaping public perception.
Prevailing systems- nature clubs/ Bhoomithra Sena Clubs, NSS units in schools colleges can also be encouraged to adopt one village and work in association with local bodies to facilitate social engineering and monitor compliance.
All information on environment activities – including environment report cards, results of waste audits, water quality in local water bodies, corrective measures visualised, feasible low cost technology options for disposal of liquid/ solid waste, harmful effects of unscientific disposal methods, available collection/disposal systems for non biodegradable waste, contact details of support groups/ cells, basis of segregation of waste, acknowledgement of people adopting model systems, sharing of their experience etc. need to be made available in the Panchayat webpage. Children can be introduced to/ encouraged to use this webpage during IT lab periods/ EVS sessions in their respective schools. Such measures, besides ensuring access of environment information to general public as highlighted in Arhus Convention, will facilitate informed decision making and encourage people’s participation and support for projects initiated in this regard.
i) Initiate segregation by householdsHouseholds can be encouraged to segregate waste at
source. Either two category segregation into bio-degradable and non-biodegradable or three way classification including a category of domestic hazardous waste can be encouraged. Since habits are difficult to break, segregation lists containing items of waste that occur most often in the locality can be distributed to all households which need
to be pasted near the waste generating/disposal site. Such cues will function as reminders to segregate the waste along with serving as a guide on what is/ isn’t bio-degradable/hazardous. Here weekly text message reminders can also serve to promote better adherence.
j) MonitoringPeriodic social monitoring will serve the double
purpose of promoting compliance and providing a gentle reminder for active participants. For the purpose, each ward can be adopted by NSS/ nature clubs of schools, volunteering NGOs or other CBOs and depending on time and manpower resources available, either monthly or bimonthly monitoring can be organised for a feasible sample of households selected at random from the ward. Such monitoring is essential at least in the initial period required for habit formation and can also serve as a platform for assessing whether support systems are functioning smoothly.
k) ReviewEnvironment audit can be organised by an independent
committee consisting of representatives from various civic groups. The results can be shared at Grama Sabha meetings where the progress of the project can be evaluated against community based targets set initially.
l) MotivationSocial incentives need to be used effectively which
includes informing people how they perform compared to their neighbours, publicly praising people who actively participate in the project, and requesting those who do not. All these will provide social motivation as well as social pressure which can promote positive action. Other local pressure tactics can also be used by the participating groups to rope in reluctant segments into the programme. Social awards, gifts, nonmonetary prizes, and recognition can all be used for such motivation which can be highlighted in local media- print, TV, radio as well as social media- facebook, whatsapp so as to relate to various age groups. Such recognition will also send out positive messages/ assurances on co- operative behaviour which in turn will promote compliance, working on the psychology that more people will be willing to take positive action if they are convinced that others will do the same.
The above multi phased action plan should clearly specify the different activities to be implemented, strategies to be adopted for implementation, various actors and their responsibilities as well as potential sources of fund. Such functional specification relating to various phases are detailed in the following table.

85
Table: 7.1. Functional Specificities Relating to Various Phases of the Action Plan PHASE ACTIVITY STRATEGY ACTORS/ RESPONSIBILITIES SOURCE OF FUND
a Base line survey, waste audits, water quality analysis, soil health cards
• Methodology evolved through this study
• Standardised sched-ules with keys evolved through this study
• To be initiated by Panchayat• Carried out by Kudumbasree
members, higher educational insti-tutions in the Panchayat
• Services of Nature clubs, NSS, technical institutes like CWRD, etc.
• Borne by Panchayat• Funds of vari-
ous projects from established institu-tions such as those of STED, MoEF, DoECC etc
b Share results of survey, create generic demand analyse neces-sary modifica-tions in rules/ bylaws to gen-erate enforce-ment demand
FGDs/ consultative work-shop with stakeholder groups
Use visual media to high-light impact
Organised by Panchayat in associ-ation with NGOs, residents associa-tions
• Borne by Panchayat• Support from media/
residents associa-tions/ sponsors
• Funds of various projects from estab-lished institutions such as those of STED, DoECC etc
c Identify tech-nology and put in practice systems for different waste streams• Organic waste
• Biogas/ vermi compost/other composting
• Identification jointly by stakehold-ers
• Implementation by genera-tors-HH, Institutions
• Service providers to either offer integrated cultivation or tie up with relevant agency
• Technical support groups to offer trouble shooting
• Borne by generators• LG may support with
subsidies
• Partly by LG
•Market/ slaug- hter house waste
• Biogas • Technical support groups to offer trouble shooting
• Partly from user free from meat vendors
• Sale of biogas•Sanitary waste/
medical wasteControlled incineration • Collection by Kudumbasree
• Operation of incineration by LG• LG to tie up with regional facilities / Hospitals/ IMAGE
• Borne by generators in the form of user fee for special paper cover
• e- waste • Reuse/ Recycle/ Landfill • Borne by LG• Collection fee paid by generator• Funds from MGNREGA for collec-
tion
• Other waste •Tie up with rag pickers or Kudumbasree members to set in place collection system
• Sale of recyclables• Funds from private recycling units• Subsidy from MSME
Social Implications

86
Role of Grama Panchayats in Waste Management and Environment Protection
d,e, f Fix short term/ long term targets, Identify actors/ responsibilities, Draw up detailed action plan
•LG in consultation with stakeholders
g Build commu-nity based in-stitutions/ Build capacities
Area specific training for various groups
• Area specific training by established institution such as CED/ KILA Clear cut governance structure by LG
• Trouble shooting groups- kudumbasree backed by service provider
• Monitoring groups
•Borne by LG• Funds from schemes of KILA/ CED• Various schemes of GOI• Kudumbasree funds
h Extensive IEC campaigns
Pamphlets, visual media • Students,• NGOs• Kudumbasree members
• Borne by LG• Sponsors• NGOs• IEC schemes of cen-
tral, State Govtsi Initiate segre-
gation and stor-age at source
Segregated waste collec-tion
• Three separate bins• Biodegradable - green
colour• Non-biodegradable –
white in colour• Other waste- black
colour• Superscribe on the
body of the bin/ bucket- biodegradable or non-biodegradable in vernacular language
• On wall near green/ white/ black bin stick list of common items to be put into thebin. These lists to have green/ white/ black lining to easily identify
• Waste generator responsible• The G.P/local residents associa-
tions can support in providing bins and buckets free of cost for the first time
• The G.P will be responsible for social mobilisation
• Monitoring & and enforcement by panchayat assisted by green corps
• Evaluation by research group which conducted survey
• Borne by generator• Support from G.P/
other agencies• Sponsorship from
agencies / individ-uals.
Recycling or re-use of material in white bin
• Waste generator themselves can reuse some of the materials.
• The waste collectors/SHGs may collect it from households to sell to recycling units
• Few G.Ps together can establish recycling units or persuade private operators to establish recycling units
• Borne by generator• G.Ps• Private entrepreneurs

87
7.4 Social Entrepreneurship to Promote Use of Cloth Alternatives to Plastic Bags
STEP (Society of Teresians for Environment Protection) was formed in St.Teresa’s College for environment protection along with encouraging social entrepreneurship among students. The society aims at promoting i) textile alternatives to plastic / rexin and ii) material resource recovery from textile waste.
154
Decentralisation Analysis Cell (DAC)
Figure 7.9: Bhoomithram Sanchis
Prakrithi Bags are trendy cloth bags which can replace bags made of rexin/non-biodegradable
material. The idea is to gradually convince student groups in the college to use such bags so
that youth go back to nature in its use of bags.
Figure 7.10: Prakrithi Bags
7.5 Enhanced Awareness Campaign against Plastic in Schools, Civic Groups in Various Districts in Kerala
Awareness campaigns were conducted on hazards of plastic waste and need for its reduction/
recycling in various educational institutions, residents associations and coastal villages
communities in the districts of Thrissur, Palakkad, Ernakulam, Kottayam and Alappuzha in
Kerala.
Figure 7.9: Bhoomithram Sanchis
j Periodic moni-toring
Monthly/ quarterly moni-toring of participating in-stitutions
•Community based monitoring committees
•Nss teams/ nature club members in educational institutions
•Other volunteering ngos
• Panchayat• Sponsorship
k Review • Environment audit- evaluation of perfor-mance against targets
•Panchayat level waste management committee, Grama Sabha
• Panchayat
l Motivation •Public recognition of active participants – in public meetings, Pan-chayat webpage, media
•Panchayat level waste management committee
• Media
• LG• Sponsors• Media
Accordingly two brands of products are being promoted i) Bhoomithram sanchi ii) Prakrithi Bags
Bhoomithram sanchi is a compact bag made of cloth which is designed in various shapes such as ball, purse, strawberry and carrot. The outer pouches of these bags are made from waste textile pieces collected from tailoring/ upholstery shops in Kochi city. The project aims at encouraging people to use this sanchi so that they do not
Social Implications

88
Role of Grama Panchayats in Waste Management and Environment Protection
ask for plastic carry bags. The idea is to make the use of bhoomithram sanchis a fashion among public and thereby reduce the volume of non-recyclable plastic waste being generated in the city at present while at the same time encourage material resource recovery from textile waste. Kudumbasree members of the anti-poverty cell in Cochin corporation are currently being trained in stitching these bags. The project apart from protecting mother earth, also indirectly empowers women from weaker sections of society through providing them employment opportunities.
Prakrithi Bags are trendy cloth bags which can replace college bags made of rexin/non-biodegradable material.
The idea is to gradually convince student groups in the college to use such bags so that youth go back to nature in its use of bags.
7.5 Enhanced Awareness Campaign against Plastic in Schools, Civic Groups in Various Districts in Kerala
Awareness campaigns were conducted on hazards of plastic waste and need for its reduction/ recycling in various educational institutions, residents associations and coastal villages communities in the districts of Thrissur, Palakkad, Ernakulam, Kottayam and Alappuzha in Kerala.
Figure 7.10: Prakrithi Bags

89
The development pattern of Kerala is recognised to be distinctively different from that of other states in India. It could achieve nearly hundred percent
toilet coverage and make significant progress in several social spheres. However rapid urbanisation, high density of population and consumerist lifestyle, indiscriminate use of water, unsafe disposal of waste, unscientific construction of toilets, inadequate sewage treatment facilities etc. have thrown up new environmental challenges such as extensive pollution of air, water and soil which threatens to undermine the state’s achievements. Studies indicate that while some efforts, though not very effective, have been initiated to address such issues in urban areas, these have been largely ignored in villages. Set in this background, this study focused on analysing role of G.Ps in management of solid and liquid waste and environment protection in four selected Panchayats in Kerala. The salient findings of the study and some recommendations based on it are detailed in this chapter.
8.1 Role of G.Ps in Waste Management and Environment Protection
2.4 The Kerala Panchayat Raj Act 1994, has empowered and entrusted the G.Ps in Kerala with the task of taking concrete measures towards environment protection with preservation of traditional drinking water sources, collection and disposal of solid waste, regulation of liquid waste disposal, draining of storm water, maintenance of environmental hygiene, management of public market and maintenance of burial grounds listed as mandatory functions to be performed by local bodies. Some additional roles such as promoting environmental awareness, afforestation, water conservation and implementation of sanitation are also specified as general/
sectoral functions to be performed. Concrete measures to be taken particularly in the case of waste management and water conservation have been clearly specified in the parent act. The potential strategies to be followed by LGs in collection, transportation, treatment and disposal of various waste streams are detailed in the various acts, rules and regulations formulated at the national level. The pivotal role assigned to LG in environment protection and waste management reflect the basic economic principle that strong externalities may result in market failure necessitating state intervention. Such decentralization in environmental governance was supported by concrete action in the State in the form of introduction of people’s plan in 1996 that emphasized participatory planning and collaboration between the State, NGOs and civic movements. This policy approach emphasised going beyond mere state regulation for environment protection to community based strategies leading to the emergence of what Veron has termed as new Kerala model which strived to integrate sustainable development goals into policy making. While all these implied a central role to the LGs in environment conservation, of late, there has been a shift in environment policy with greater responsibility assigned to principles of subsidiarity and polluters’ responsibility as is reflected in Kerala Environment policy 2009, Draft Health Policy 2013 etc., which highlight that the primary agency for action to protect and enrich the environment is the very citizen and household of Kerala. The approach paper for sustainable management of waste put forward by Suchitwa Mission in 2015 also gives maximum emphasis to behavioural and lifestyle change to be brought about by each and every one, advocates inter-departmental and inter-sectoral coordination as the way forward for sustainable management of resources and highlights that
Findings and Recommendations

90
Role of Grama Panchayats in Waste Management and Environment Protection
this can no longer be the sole responsibility of LSGD.
8.2 Allocation and Utilization of Funds for Environment Projects by all G.Ps in Kerala
3.3. The initial part of this study has been an assessment of performance of all G.Ps in Kerala in environment protection activities based on an analysis of plan outlays and expenditures during the three year period 2011-12 to 2013-14. Data for the analysis was extracted from ‘Sulekha’ database maintained by the Information Kerala Mission (IKM) The analysis reveals that amount set apart for environment projects was only one percent of total outlay in 2011-12 which increased to 6 percent in 2012-13 but declined to 5.23 percent in 2013-14. The situation is dismal when actual expenditure of outlay is examined. In 2011-12, only 40 percent of the allocated amount was utilised which declined drastically to a mere 12 percent in 2012-13 and was 21.5 percent in 2013-14. While low utilization of funds is a malaise that is applicable to LGs in general, the utilization rate for environment projects was much lower than overall fund utilization indicating worse performance in this sphere of activity.
Among the three heads of expenditure commonly followed by Panchayats for classification of their fund allocation and expenditure, projects relating to environment protection are most often found under service sector category followed by a few schemes under the production sector category. Only a few environment related projects are reported under the infrastructure sector category where the rate of fund utilisation as percent of allotted funds is generally better.
Environment projects under the production sector mainly relate to two sub-categories 1) energy generation and 2) soil and water conservation, environment, afforestation. The sub-category of energy generation mainly includes biogas plants while second sub-category includes water conservation, soil conservation, rainwater harvesting and others. Under water conservation, the G.Ps have devised schemes primarily for watershed management, construction and maintenance of bunds, maintenance and deepening of canals (thodu) etc. In soil conservation, side protection of SC colonies to prevent soil erosion, construction of Kayyala for soil protection etc. are included. Few schemes for Western Ghats development program, SC colony protection, planting trees etc have also been implemented by certain local bodies. Another main scheme of preparation of biodiversity registers- is also included under production category.
Under service sector category, projects are mainly observed under the sub-heading sanitation and waste management. This sub category includes varied schemes
primarily under the titles of a) sanitation, b) solid and liquid waste management, c) biogas, d) pipe compost and e) crematorium. The subcategory of sanitation, includes construction of toilets, comfort stations etc. Under solid and liquid waste management, Panchayats focused on cleaning public market places, construction of solid waste plant, construction, maintenance and cleaning of drainages, promoting waste disposal at source etc. Under the broad heading of crematorium, Panchayats have allocated fund for purchase of land, construction and maintenance of crematorium for public and SC categories, providing modern infrastructure in the crematoriums, construction of protection wall, etc. Among these, maximum number of projects were implemented under the heading of sanitation and the two sub-headings of sanitation and crematorium reflected slightly better utilization of funds while the headings of solid and liquid waste management, biogas as well as pipe compost revealed very low utilisation rates.
Based on the above findings we make the following recommendationR1. Local Governments need to be encouraged to assign
greater priority to environment protection activities. This prioratisation needs to be reflected in local budgets with higher allocation and better utilization of funds for such activities. The current State Government directives to local bodies to allocate at least ten percent of plan funds for solid waste management is a welcome step in this regard. Since greater allocation, as we have seen, need not necessarily be translated into utilization, this needs to be supplemented with strong efforts at promoting effective utilization of allotted funds.
8.3 Performance of Sample G.Ps in Environment Protection and Waste Management.
4.8 Case study of four G.Ps-Ezhikkara, Kanjiramkulam, Marutharode and Nenmeni -reiterate the finding of lacklustre performance in functions related to environment protection. The main programs being implemented by all these G.Ps using their own plan funds was found to be those related to sanitation. Prime mandatory functions related to protection of ponds, water bodies and canals, afforestation etc. have been implemented mostly utilising funds from the centrally sponsored MGNREGS. The study thus highlights the relevance of MGNREGS in performing environment related mandatory and sectoral functions of G.Ps. Significant variations were observed between sample G.Ps in extent of environment focus in MGNREGS with Marutharode G.P spending around 86.2 percent of their total funds under the scheme during the three year period of 2011-14 for environment projects while it was as low as 2.5 percent in Kanjiramkulam. Differences were also noted

91
in type of environment works undertaken under the scheme with Marutharode focusing mainly on micro irrigation works, Nenmeni focusing primarily on environment related works on individual land such as Mankulam, Mankayyala, compost pits, rain pits etc. while Ezhikkara focused on renovation of traditional water bodies.
Local level resource mapping has been done and the resources are clearly mentioned in all sample Panchayats. However, such maps once prepared, remain on paper and are stacked away in some corner, never being utilized either for educating the public or as baseline reference records for checking on current status/ upkeep and maintenance of resources.
Biodiversity Register was prepared by all sample Panchayats with people’s participation but on inspection it was observed that it has not been prepared according to specified guidelines in Ezhikkara. In all G.Ps there was no subsequent follow up or updating of PBRs and the registers were also not being utilized for educating the public or for designing any related conservation measures to preserve the identified regional flora and fauna.
Dumping of waste in canals/ ponds is common in Ezhikkara and Kanjiramkulam. During rainy season, there is surface run off to ponds and no measures have been taken to prevent such run off. Dumping of slaughter house waste into rivers by neighbouring local bodies is also reported in Ezhikkara.
Afforestation programmes were reported to be done in all sample G.Ps through MGNREGS. But again it was found to be sporadic and not sustained. Long term conservation strategies were not observed even in Ezhikkara Panchayat which had environmentally significant mangrove forests.
Evaluation of performance of sample G.Ps in mandatory environment functions as specified in KPR Act 1994 revealed that maintenance of traditional drinking water sources, preservation of ponds and maintenance of waterways and canals were reported to be done in all sample Panchayats. But a mixed pattern was observed regarding projects for conservation of public water bodies. As far as public wells are concerned, apart from chlorination of water bodies by Asha (sanitation) workers, no measures were being undertaken by the Panchayat in Ezhikkara to preserve them since water from these were generally not potable due to high salinity. Availability of alternate public water supply in all areas had reduced people’s dependence on traditional wells with consequent loss of motivation in maintenance. However, remarkable initiatives were observed in Kanjiramkulam, Marutharode and Nenmeni Panchayats which face acute water scarcity in certain areas. These Panchayats have good examples of community managed water supply from wells/ borewells and have also
taken initiatives for annual maintenance of ponds through the MGNREGS scheme.
No activity is being undertaken by any sample G.P per se in the case of important mandatory functions mentioned in KPR ACT 1994 like collection and disposal of solid waste, regulation of liquid waste disposal and maintaining environment hygiene. There is no organised system for collection or treatment of solid waste in all sample Panchayats and they do not have any door to door collection of waste or street sweeping. The main strategy being followed by these G.Ps in the context of solid waste seems to be promotion of decentralised treatment of organic waste through biogas/ vermi/pipe compost units in individual households all of which revealed very low participation by the public. The strategy followed for management of market waste in Kanjiramkulam- the only G.P having a market- was observed to be collecting the waste and dumping in a corner from where it is removed by private agencies once in 2-3 months.
Based on these findings we make the following recommendationsR2. Local Governments need to be prompted to take
up their mandatory functions specified in the KPR Act 1994 particularly relating to collection, disposal and treatment of solid/ liquid waste. For effective action in these areas, elected representatives, other administrative authorities and public need to be sensitised to local environment issues particularly in relation to solid and liquid waste generation/ disposal and the urgent necessity of taking protective action.Generally they seem to be unaware of the extent of the issue with one Panchayat President in our sample even stating that they have no waste issues in their locality.
Thus it is essential to undertake proper waste audit in each Panchayat and make available to the public information on quantum, type and source of waste generation in their area. Such quantification apart from highlighting the magnitude and gravity of the issue, will also serve as base line data for designing suitable waste management strategies and systems in each Panchayat.
R3. Waste audit should be supplemented with water/ soil quality analysis and resultant environment report cards should be disseminated to all segments of local population highlighting the consequences of non scientific disposal of solid/ liquid waste on their livelihood and health. Such awareness campaigns aimed at social engineering should be designed taking into account a basic tenet of behavioural economics that people are bad at computing and have internal biases of salience and discounting.
Findings and Recommendations

92
Role of Grama Panchayats in Waste Management and Environment Protection
R4. Once sensitized to the gravity of the situation, G.Ps should be entrusted with formulating an integrated Environment Management Plan covering all environment related functions entrusted to them under KPR Act 1994. Since current capability – both technical and manpower capacity- to undertake such planning is limited, a separate environment management committee consisting of experts may be formed at the local level or the responsibilities and capacity of the health committee may be expanded.
Considering the signifi cance of MGNREGS in environment protection such plans need to be prepared in an integrated manner including both plan funds of G.Ps as well as MGNREGS funds. It also needs to be formulated based on geographical specifi cities- such
as type of soil, water bodies, local fl ora and fauna, utilising information contained in natural resource maps, biodiversity registers and other relevant data sources: Currently planning refl ects a piecemeal approach and most projects formulated under plan funds appear to be stereo typed ones not taking into consideration regional specifi cities.
While an integrated plan covering all sources of funds, all environmental issues, and the entire Panchayat area should be the long term goal in sight, these can be initiated either simultaneously or in a phased manner depending on the willingness and attitude of each local community.
In the event of a phased approach being adopted, clear prioratisation of goals and targets need to be done. For instance in waste management, it may be initiated with solid waste management integrated with cultivation of organic vegetables slowly extending to liquid waste and fi nally septage treatment. In both cases the long term objectives should be quantifi ed into achievable, discrete, short term targets that can be clearly understood by all and can serve as major milestones for evaluation purpose.
Each of these areas necessitate a detailed action plan clearly specifying the strategy to be followed, institutional pre-requisites, organisational/ governance structure, actors and their responsibilities, legal modifi cations, fi nancial requirements and sources etc. Guidelines for stepwise plan of action can be furnished which will specifi cally express what needs to done. (A general model of action for solid waste is detailed in the previous chapter). Each local body can use this as a basic framework and then incorporate specifi cities based on their local facilities and requirements.
R5. Aff orestation activities which are rather weak at present need to be activated in association with forest department, with focus on varieties suitable for each
locality as identifi ed by biodiversity experts. R6. Local elected representatives as well general public should be familiarised with the existing local resource maps/ biodiversity registers and they should be encouraged to conduct evaluation studies on current status of the resources mentioned therein, undertake periodic up-dation of these records and design environment conservation programmes based on them. State Biodiversity Board can take an initiative in this regard by calling for biodiversity action plans based on the registers prepared
161
Decentralisation Analysis Cell (DAC)
either simultaneously or in a phased manner depending on the willingness and attitude
of each local community.
Figure 8.1:Integrated Environment Management Plan
In the event of a phased approach being adopted, clear prioratisation of goals and
targets need to be done. For instance in waste management, it may be initiated with
solid waste management integrated with cultivation of organic vegetables slowly
extending to liquid waste and finally septage treatment. In both cases the long term
objectives should be quantified into achievable, discrete, short term targets that can be
clearly understood by all and can serve as major milestones for evaluation purpose.
Figure 8.2: Phased targeting of issues over different time periods
Solid waste
Septage
Soil, water conservation, affores
tation
Liquid waste
SeptageTreatment
liquid waste
Solid waste + vegetable cultivation
•Time periods- targets
•Time periods -targets
•Period 1-pilot ward•Period 2- one fourth wards•period 3- half the wards•period 4- complete panchayat
Figure 8.1:Integrated Environment Management Plan
161
Decentralisation Analysis Cell (DAC)
either simultaneously or in a phased manner depending on the willingness and attitude
of each local community.
Figure 8.1:Integrated Environment Management Plan
In the event of a phased approach being adopted, clear prioratisation of goals and
targets need to be done. For instance in waste management, it may be initiated with
solid waste management integrated with cultivation of organic vegetables slowly
extending to liquid waste and finally septage treatment. In both cases the long term
objectives should be quantified into achievable, discrete, short term targets that can be
clearly understood by all and can serve as major milestones for evaluation purpose.
Figure 8.2: Phased targeting of issues over different time periods
Solid waste
Septage
Soil, water conservation, affores
tation
Liquid waste
SeptageTreatment
liquid waste
Solid waste + vegetable cultivation
•Time periods- targets
•Time periods -targets
•Period 1-pilot ward•Period 2- one fourth wards•period 3- half the wards•period 4- complete panchayat
Figure 8.2: Phased targeting of issues over diff erent time periods

93
and building up on the existing registers so as to take it to the next level visualized in the Biodiversity Act.
R7. Steps also need to be initiated to address the abysmally low utilisation of funds allotted for environment protection. This necessitates administrative reforms particularly in the form of timely decisions on technical/administrative sanction, design of integrated projects, timely preparation of beneficiary list and so on.
8.4 Management of Waste by Households and Institutions in Sample G.Ps
5.5 The findings of the primary survey of households and institutions reveal prevailing arrangements in sample G.Ps for management of solid and liquid waste generated.
Majority of sample households (more than 90 percent) have ownership of houses and land indicating that, due to existence of such property rights, they can be motivated to take up activities to preserve environment quality. However around one third of the households had small size of land holdings implying that less space intensive techniques of solid/ liquid waste disposal need to be promoted.
Despite over 90 percent of the sample units owning their own houses, living in semi pucca and pucca houses, almost all units having electricity connection and more than 60 percent having LPG for cooking purpose, almost all households do not have proper drainage system for disposal of liquid waste from kitchen and bathrooms. Large segment of households have their liquid waste from kitchen/ bathroom flown within their compound. In Ezhikkara, disposal of liquid waste into water bodies was prevalent particularly among houses situated close to canals and back waters.
With regard to toilet facility, the study shows prevalence, though limited, of open defecation even in Nirmal G.Ps, the incidence of which was higher in places with migrant labour. Another disturbing practice was makeshift toilets directly over water bodies which was observed in households having limited land and located on the banks of canals and back waters.
As far as septage is concerned-68 percent of the surveyed households- discharge it into septic tanks while around one fourth use pit toilets and some use ring type. Use of pit toilets was observed to be particularly high in lowland Panchayat of Kanjiramkulam (37 percent) characterised by loose red soil which pose high risk of contamination to ground water. Ring type of toilet is observed more in Ezhikkara Panchayat - the low land coastal Panchayat with porous, sandy soil with 13 percent of households in Ezhikkara using these which are another potential source
of soil-water contamination particularly during monsoon season when the rings overflow. This indicates that now Kerala needs to go further on sanitation front by focusing on upgrading the type/ quality of toilets constructed and addressing specific challenges such as sanitation facilities in coastal areas and for migrant labourers.
Of the 163 wells and 59 tube wells identified in the sample units, 23 wells (14 percent) and 6 tube wells (around 16 percent) were observed to be located very close to latrines which reveals clear violation of sanitation standards stipulated for G.Ps in India. This along with use of pit toilets and ring toilets indicate potential sources of water pollution in all our sample G.Ps which are all Nirmal G.Ps.
Our study reveals that majority of people in rural areas are not in the habit of consciously segregating solid waste generated. However, some form of segregation of biodegradable and non-biodegradable waste was taking place in a few households without any purposive planning when they used bio-degradable kitchen waste for feeding livestock and other pets like dogs and cats, or threw it out into the compound as and when it was generated. Thus in the case of households, the methods of disposal widely practiced for food, vegetable, fish and meat waste generated were bio-disposal, throwing within and outside compound, while in the case of institutions it was open burning and throwing. This reveals that at least some households in rural areas have their own natural system for disposing bio-degradable waste. In the case of paper and cardboard and non-biodegradable waste like, plastic, sanitary waste majority of households as well as institutions reported open burning as method of disposal being practiced.
With regard to medical waste only around one-third of the sample households reported that they generate medical waste. Burning, throwing outside the compound, dumping in road corners, burying underground etc. were the primary methods of disposal of medical waste which indicate a potential source of infection. Some of the clinics and hospitals within Panchayats do not seem to have tie up with IMAGE for collection of medical waste and hence they carry out open air incineration of these medical wastes within their compound. The remaining ash from medical waste incineration is also often stored on site.
Another dangerous trend observed in Ezhikkara Panchayat was disposal of electrical waste including tubelights, batteries, etc. into canals and backwaters because of ignorance of people about scientific management techniques for such waste and non-availability of any collection systems for the same. In many other places people stated they did not know the correct technique nor had any system for disposing e-waste and hence were left
Findings and Recommendations

94
Role of Grama Panchayats in Waste Management and Environment Protection
with no option but to dump it in their own plots or public places.
Thus at present no proper disposal pattern for solid waste exists in rural areas particularly for non-biodegradable waste and disposal methods being practiced are often are clearly in contravention of the Solid Waste Management Rules (2015), Plastic Waste Management Rules (2016), Bio-Medical Waste Management Rules (2016) and e-Waste (Management)Rules (2015) formulated by Govt. of India and stipulations of CPCB (2013).
General awareness of the respondents on consequences of unscientific solid waste management is commendable with most of the respondents being aware about contamination of environment due to plastic waste, burning of plastic etc. However awareness of potential effect of plastics on ground water recharging was less indicating that IEC campaigns should focus on such dimensions. A noted paradox in this context was co-existence of such sound general knowledge with wrong perceptions about soil and water quality in their own locality. In spite of open burning/ dumping in soil of plastic and electric waste, flushing out wastewater into water bodies/ own compound and location of a few latrines in close proximity to water bodies, only few people reported soil and water pollution in their area. Analysis of water quality from samples collected belies this perception with high content of e- coli and Coliform bacteria being observed in most of the samples collected. This paradox between general environment awareness and local environment quality perception could probably be due to lack of visible symptoms of environmental stress in rural areas as compared to urban cities.Based on the above findings we make the following recommendations.R8. Highest priority should be assigned in G.Ps to
operationalise collection systems for non bio-degradable waste particularly, plastic, e-waste and medical waste including sanitary waste. Waste management being a public good with externalities, assigning it completely to the markets may result in the classic case of market failure with consequent environmental destruction as is clearly revealed in the current practices being followed by all our sample G.Ps for disposal of non biodegradable waste components. For instance most recycling vendors accept only those plastic waste which has market value and either refuse to collect the rest or make a show of collecting it and then dump it in some public place. So is the case with tubelights and other electric waste which have low recycle value. Thus each local body needs to take the initiative to put in place sound collection systems. Such arrangements should encompass prevailing
informal systems of ragpickers/ recyclers and where these are not adequate; need to be supplemented with groups of Kudumbasree members. Since the study team’s experience in implementing a collection system for plastic in Ezhikkara indicates that public willingness to pay collection fees is low in rural areas, strategies suggested for developing countries (UNDP/ UNCHS/ WORLD BANK-UMP and SDC 1996) such as attaching these expenses to other fees charged for essential services- either electricity or water -may be visualized in the short run.
R9. In this context, a serious look into the potential of expanding the scope of central govt. sponsored MGNREGS to include waste management services is warranted. MGNREGS which currently serves as the major environment protection programme in rural areas visualizes only agricultural and asset creation activities. Urgent necessity of improving waste management coupled with paucity of funds suggests that converged efforts by all layers of Govt are needed to address the issue. Thus government should investigate the scope of including waste management services also under MGNREGS and combined projects using MGNREGS funds and G.Ps funds can be visualised where G.Ps provide a part of the wage component for establishing and operating a collection system for non-biodegradable waste.
R10. Another challenge is treatment and disposal of collected non biodegradable waste. In the case of paper, plastic etc., potential for small/ big enterprises for recycling need to be explored at the local level. If found not feasible at G.P level, its viability needs to be evaluated at the next level of decentralization namely block/ district level and as a last resort at the state/ national level. To encourage such recycling units, Government needs to provide viability gap funding. A feasible alternative is promotion of use of plastics in road tarring which requires converged, co-ordinated efforts by MSME, health, Public Works (PWD) and LG departments at the state level. While some efforts and progress has been made in this context by amending PWD rules, actual use of shredded plastic in tarring of roads is yet to become widespread in the state.
R11. Where treatment and disposal at local levels are not feasible, G.Ps need to promote material resource recovery centers which can serve as storage for collected non biodegradable components till they reach the commercially viable quantum needed for transportation to recycling plants.Development of such centres are the immediate need of the hour in almost all G.Ps in the state.

95
R12. The increasing use of sanitary napkins, diapers in rural areas necessitate design of proper strategies for these in all G.Ps so as to do away with the current practice of open burning/ burying in soil. Either affordable napkins made of eco-friendly/ bio-degradable material have to be promoted or a proper collection and disposal system need to be designed. One immediately feasible solution could be wrapping such waste separately in specially designed, priced paper bags and handing it over to collectors who in turn take it to incinerators operated by Panchayat or nearby hospitals. The price of the paper bags could include the fee to be paid to the Panchayat/ hospitals for disposal. The emission standards of such incinerators need to be monitored by the State Pollution Control Board. The services of IMAGE should be extended to all primary/community health centres as well as medical labs which currently are outside its purview.
R13. Taking into consideration deterioration of water quality even in rural areas, urgent action needs to be taken to protect and conserve our traditional water bodies- both public and private. Facilities for periodic testing of water quality need to be made available and accessible to all households at reasonable cost. Feasibility of utilizing chemistry labs in schools and colleges for periodic assessment of water quality in local water bodies may be explored. Such a project can tap in on the emphasis placed on rural outreach programmes placed by higher education agencies in our country at present and will enhance the pedagogy and quality of teaching-learning at all levels. Once quality problems are identified, periodic consultancy services of expert institutions like Centre for Water Resource Development and Management need to be made available so that appropriate intervention can be designed and executed.
R14. Households in G.Ps also need to be educated about the dangers of constructing toilets within close proximity of water sources and encouraged to set up low cost systems for treatment of grey water which in turn can be utilised at least for gardening purposes. Such awareness campaigns need to highlight the results of quality analysis of local water bodies. As observed, despite bacterial contamination of many water bodies, people in rural areas have wrong notions about quality of their water bodies. Thus the strategy of framing effects should be made use of to leave a distinct imprint in people’s mind about ground realities in their locality and looming consequences.
G.Ps also need to focus on improving quality of sanitation by upgrading pit and ring toilets to septic
tanks. Joint projects by neighbouring local bodies need to be devised for scientific treatment/ disposal of septage.
R15. While the above are measures to be taken up by the Local Governments, this has to be supplemented with an initiative/ policy decision by the State Government where in they bring out a compendium on replicable initiatives successfully implemented by enterprising local authorities and circulate this among local elected representatives so that they have a wide choice of workable models to pick from as per their requirements. This will facilitate informed choices, help avoid pitfalls and instill confidence on practical feasibility.
R16. All information on environment activities – including environment report cards, results of waste audits, water quality in local water bodies, corrective measures visualised, feasible low cost technology options for disposal of liquid/ solid waste, harmful effects of unscientific disposal methods, available collection/disposal systems for non biodegradable waste, contact details of support groups/ cells, basis of segregation of waste, acknowledgement of people adopting model systems, sharing of their experience etc. need to made available in the Panchayat webpage. Children can be introduced to/ encouraged to use this webpage during IT lab periods/ EVS sessions in their respective schools. Such measures, besides ensuring access of environment information to general public as highlighted in Arhus Convention, will facilitate informed decision making and encourage people’s participation and support for projects initiated in this regard.
8.5 Generation and Characteristics of Solid Waste in Sample G.Ps
6.3 Waste audit conducted by the study team on the selected G.Ps found that significant quantities of solid waste is generated in rural areas in Kerala. It is estimated that weekly generation of solid waste range from 25 to 61 tonnes in sample G.Ps with bulk density ranging from 150 – 230 kg/cbm. The greatest quantum of waste generated per week was 61 tonnes in Nenmeni Panchayat followed by 39 tonnes in Marutharode, 36 tonnes in Ezhikkara and 25 tonnes in Kanjiramkulam. The per capita waste generation varied between 161 gms per day to 186 gms in Nenmeni, Kanjiramkulam and Marutharode which is in the range of/ or slightly lower than what has been predicted for Panchayats in Kerala by Suchitwa Mission in 2006. However, per capita generation was higher in Ezhikkara Panchayat at 281 gms per day.
Findings and Recommendations

96
Role of Grama Panchayats in Waste Management and Environment Protection
Major source of solid waste generation in rural areas is households which account for more than 80 percent of weekly generation of waste. This indicates that these should be the primary target group in any action plan for management of solid waste in rural areas.
The main component of solid waste in rural areas was observed to be bio-degradable kitchen waste consisting of food, vegetable and fish/ meat waste. Solid waste in rural areas was also found to have higher proportion of plastic generated than estimated even for urban areas in previous studies. Since all other studies hitherto have analysed composition of waste based on representative samples collected from secondary collection points or disposal sites as compared to the present study which is based on 732 samples (511 households, 109 commercial establishments, and 112 other buildings) collected at generator’s point/ source point which reduces chances of leakages, it suggests that the quantum of plastic waste generated is currently higher in Kerala than is officially estimated. For instance plastic accounted for 10-11 percent of waste in Ezhikkara, Marutharode and Nenmeni and 8 percent in Kanjiramkulam- the major component of which consisted of plastic carry bags. Significant quantities of sanitary waste was also being generated in both the Panchayats indicating usage of sanitary pads and diapers even in rural areas all of which lack proper disposal system at present posing threats to the environment.
Organic fraction ranging from 61 percent to 71 percent of total waste indicate the potential for introducing household organic waste treatment system using composting techniques. Moisture content and pH of waste also reveals suitability of waste for composting. Based on the above findings we make the following recommendations.R17. High organic component of solid waste in GPs and
its characteristics indicate that composting is the suitable method for treatment. Hence the principle of subsidiarity and generator’s responsibility, as recognised and suggested at the National level (Govt. of India 2014 a, 2014 b, 2011) can also be advocated for rural areas in Kerala. The composting technologies identified as appropriate at household level (vermi composting/ bio-methanation, pit/pot/ pipe composting etc.) and at institutional level (bin composting, bio-methanation and shed composting, vermi composting and aerobic composting) (NCESS 2014, Govt. of Kerala 2015 and 2007, Varma 2008, Maya et al. 2000) may be promoted in those rural areas where natural biosystems are not functional.
However while promoting such decentralised treatment of organic waste, one needs to factor in
ground realities that public participation in such projects currently remain low due to frequent technical snags and lack of follow up support. Hence such programmes should, as far as possible, be adopted en masse to facilitate sharing of experience and be supplemented with trouble shooting systems involving waste clinics to ensure smooth operation and sustainability. Such clinics can be manned by groups of Kudumbasree members trained in maintenance of decentralized systems so that households have a support system in operations which in turn can encourage greater confidence and ensure lower failure rates.
R18. State Governments should include maintenance and follow up support as an integral part of any contract signed with service providers in decentralised organic waste management. A policy that subsidy will be furnished only for those service providers who undertake to furnish such trouble shooting mechanisms free of cost upto a reasonable time period and at reasonable cost subsequently will serve to ensure follow up.
R19. G.Ps also need to promote integration of kitchen/ terrace garden with such decentralised solid waste management so as to complete the organic chain and provide an avenue for final disposal of compost generated. Such integration will also serve to boost horticultural production, reduce the State’s dependency on neighbours for essential vegetables and improve overall health of its population.
R20. The high percentage of plastic waste even in rural areas indicate that G.Ps need to emphasise and promote waste reduction, material substitution and re-use strategies along with recycling. This is particularly warranted in the case of plastic carry bags which was observed to amount to quite a significant component in sample G.Ps. A multipronged strategy which includes making available alternatives such as paper, cloth and jute bags and social engineering aimed at changing the habits of the people need to be adopted across all G.Ps.
R21. Quantification of the environmental issues in rural Kerala is rather rare and practically non existent with respect to solid waste. This coupled with absence of visible symptoms of environment degradation create a false sense of complacency and well being which hamper concerted action to address the issues. Hence the waste audit methodology evolved through this study can be used to quantify the issues, the results of which as mentioned earlier, needs to be presented to the public so as to generate a sense of urgency for change.

97
8.6 Concluding RemarksCase study of four G.Ps indicate that solid and liquid
waste generated even in villages in Kerala are beyond nature’s sink capacity leading to a gradual deterioration of the rural environment. However, lack of clear visible symptoms of environment stress has resulted in underestimation of the magnitude of the problem and consequent lackluster performance of G.Ps in discharging even mandatory environment functions. Panchayats have thus failed to effectively make use of their newly opened fiscal space to meet the onus of environment protection particularly with respect to waste management. While the principle of subsidiarity and generator’s responsibility, often propounded in recent public policy as the way forward, can certainly be a central pillar in future plan of action, it needs to be highlighted that it cannot be
a stand alone pillar and has to be complemented with strong support systems by G.Ps in the form of extensive social engineering, development of collection/disposal systems for non-biodegradable waste, promotion of waste reduction/recycling, integration of informal systems of rag pickers, organization of Kudumbasree groups, setting up of material recovery centers, design of waste clinics, provision of viability gap funding etc. The G.Ps have to thus take the lead for designing an integrated environment management plan combining above elements with stronger initiatives for protection of prevailing natural resources particularly local water bodies, flora and fauna which should then be supplemented with concerted effort by all stakeholders- state, district, public, NGOs, SHGs and student groups- where all work in unison to achieve the common goal of environmentally sustainable development in Kerala.
Findings and Recommendations

98
Role of Grama Panchayats in Waste Management and Environment Protection
Ambat, Babu (1994).Study of the Role of Informal sector in Solid Waste Management System in Thiruvanathapuram City, Centre for Envi-ronment and Development, Thiruvananthapuram
__________ (1995). Study of the Role of Informal Sector in Solid Waste Management System in Alappuzha, Trissur, Palakkad and Vadaka-ra Municipalities in Kerala, Centre for Environment and Develop-ment, Thiruvananthapuram
__________ (1997). Action Plan for Solid Waste Management of Thi-ruvanathapuram City, Centre for Environment and Develop-ment,Thiruvananthapuram.
__________ (1999). Study of the Attitude and Perseption of Commu-nity Towards Solid Waste Management - A Case study of Thi-ruvananthapuram City, Centre for Environment and Develop-ment,Thiruvananthapuram
Beck-Friis, B., Smars, S., Jonsson, H., Kirchmann, H.,( 2001). Gaseous Emissions of Carbon dioxide, Ammonia and Nitrous Oxide from Organic household Research78 (4), Waste in a Compost Reactor under Different Temperature Regimes. Journal of Agricultural En-gineering 423–430
Central Pollution Control Board (CPCB), 2004. Management of Munic-ipal Solid Waste. New Delhi: Ministry of Environment and Forests.
Damodaran V.K., Geena Prasad, Joseph V.T. and Babu Ambat (2010) Review of Strategy, Framework and Technological Options for Municipal Solid Waste Management, Proceedings of Kerala En-vironment Congress 2010, Centre for Environment and Develop-ment, Thiruvananthapuram
De-Bertoldi M, Vallini G, Pera A.(1983) The Biology of Composting: A Review. Waste Manag Res;1(2):157–176. doi: 10.1016/0734-242X(83)90055-1
Dhanalakshmi,T. (2011),Study on Solid Waste Management: An Eco-nomic Analysis With Respect to Ernakulam District. Unpublished PhD thesis, Cochin University of Science and Technology, Cochin.
Dineshkumar D, Nitin Bassi, MVK Sivamohan, V.Niranjan (2011)’Em-ployment Guarantee and its Environmental Impact: Are the claims valid?, Economic and Political Weekly, Vol XLVI, No 34, EPW, August 20 pp 69-71.
Divan Shyam and Armin Rosencranz(2001) Environment law and Poli-cy in India ,Cases, Materials and Statutes. Oxford University Press.
Eklind, Y., Beck-Friis, B., Bengtsson, S., Ejlertsson, J., Kirchmann, H., Mathisen, B., Nordkvist, E., Sonesson, U., Svensson, B.H., Tor-stensson, L., (1997)Chemical Characterization Of Source-Sepa-rated Organic Household Waste. Swedish Journal of Agricultural
Research 27, 167–178.George Mothi (2010) Urban Solid Waste Management: A Micro Analy-
sis, Unpublished Ph.DThesis, Department of Economics, Univer-sity of Kerala.
Government of India ; Report of the Western Ghats Ecology Expert Pan-el-Part I, 2011, Ministry of Environment and Forests. Different Legislations of Ministry of Environment and Forests (2015).;Tak-ing on New Challenges: A Compendium of Good Practices in Rural Water Supply Schemes’, Water& Sanitation Programme, Ministry of Drinking Water and Sanitation (2014 a) ;Guidelines for Developing State Policies on Solid and Liquid Waste Manage-ment (SLWM) in Rural Areas, Ministry of Drinking Water Supply and Asian Development Bank July.(2014 b); Muncipal Solid Waste Management Manual, Ministry of Urban Development, May. (2013); Revised Guidelines, National Biodiversity Authority.
Government of Kerala (2015) Waste?An Approach Paper for Sustainable Management Of Waste, SuchitwaMission, Local Self Government Department, August (2014) Report of The Expert Committee on Health, Twelfth Five Year Plan(2012-2017), State Planning Board, Thiruvananthapuram (2013) Draft Health Policy 2013, Health and Family Department (2013) Local Fund Audit Report 2013, Kerala State Audit Department (2009) Kerala State Environment Policy, Department of Environment (2008) WaterPolicy, Water Resources Department (2007) MalinyaMukthaKeralam Action Plan, Local self Government Department (2006) Human Devel-opment Report 2005 Kerala, State Planning Board, Thiruvanan-thapuram(1994) Kerala Panchayati Raj Act (1994) Kerala Munici-pality Act
Haug RT. (1993).The Practical Handbook of Compost Engineering. Boca Raton: Lewis Publishers.
Imbeah M.(1997) Composting Piggery Waste: A Review. Bioresour Technol.; 63:197–203.
Jayakrishnan.T and Jeeja M.C (2010) Unmet Needs of Solid Waste Man-agement Workers at Calicut Corporation Area, Kerala Environ-ment Congress 2010, Centre for Environment and Development, Thiruvananthapuram, pp168-175
Jayasree. S (2008) Solid Waste Disposal, Economic Effects and Social Consequences, Unpublished Ph.D thesis submitted to The Univer-sity of Kerala,Thiruvananathapuram
JNNRUM Appraisal Report, (2007), submitted to MoUD, Govt. of IndiaKSUDP(2006). Solid Waste Management of Kollam, Kochi, Thrissur
and Kozhikkode Corporations of Kerala. Detailed Project Report. Local Self Government Department, Government of Kerala & Asian Development Bank
Madhav Gadgil et.al,(2000), New meanings for Old Knowledge: The
Reference

99
People’s Biodiversity Registers Program,Volume 10, issue 5, Eco-logical Applications, Ecological Society of America,http://esajour-nals.onlinelibrary.wiley.com
Maya K, Padmalal D. and Ramachandran K.K. (2000), Quantification, Characterization and Management of Municipal Solid Wastes of Central Kerala, Proceedings of the Twelfth Kerala Science Con-gress, January 2000, Kumily, pp 583-587.
Mathews Elezebeth and Rani S.S. (2010), Health Hazards Assessment among Waste Workers of Thiruvananthapuram Corporation, Kerala Environment Congress 2010, Centre for Environment and Development, Thiruvananthapuram, pp217-224
Miller FC. (1989)Matric Water Potential as an Ecological Determinant in Compost, A Substrate Dense System.Microb Ecol. ;18:59–71. doi: 10.1007/BF02011696
Nair KN, T.P Sreedharan and M.Anoopkumar (2009), A Study of Na-tional Rural Employment Guarantee Scheme in Three GramaPan-chayats of Kasargod District, WP 413, Centre for Development Studies, August
Nair. V. S. S (2013) Bio Medical Waste Management in Kerala, Resource Book of the International Conference on Waste, Wealth and Health Organized by IIWM, VigyanBharati & MPCST, Bhopal , in association with MPPCB, giz & NSWAI at Bhopal on Feb 15th - 17th, pp59-61
NCESS (2014) Environmental Impact Assessment of Muncipal Solid Waste Management Project of Thiruvananathapuram Muncipal Corporation, project report submitted to Corporation of Thiru-vananthapuram, Centre for Earth Sciences, Thiruvananthapuam
Nitin A. Gawande, Debra R. Reinhart, Philip A. Thomas, Philip T. Mc-Creanor,Timothy G. Townsend ( 2003). Municipal Solid Waste In Situ Moisture Content Measurement Using An Electrical Resis-tance Sensor, Waste Management 23, 667–674.
Padmalal D. (2001). Keralathile Dhathunikshepangalum Paristhithi Prasnangalaum (Malayalam), in Paristhithi: Sasthreeyaveeksha-nam, State Institute of Languages, Kerala. PP. 200-224
Padmalal D., NarendraBabu K, Maya K,Rajesh Reghunath,Mini S.R. ,Sreeja R, and Saji S.,(2002), Municipal Solid Waste Generation and Management of Changanesseri, Kottayam and Kannur Mu-nicipalities, Kerala. Rep. Centre for Earth Science Studies, Thiru-vananthapuram. CESS PR-02-2002. P. 47
Rani S.S., Elezebeth Mathews and Babu Ambat (2010), Perceptions and Practices of Waste Handling among the Women Solid Waste Workers- A Study in Thiruvananthapuram Corporation, Kerala, Kerala Environment Congress 2010, Centre for Environment and Development, Thiruvananthapuram, pp 184-191
Sahasranamam P.B.(2014) Environment Protection Laws-A.G.Publica-tions.
Sahasranamam P.B.(2012) Handbook of Environment Laws, Second edition, Oxford University Press
Schulze KL. (1962) Continuous Thermophilic Composting.ApplMicro-biol.; 10:108–122.
Sundberg .C*, S. Smars, H. Jonsson (2004). Low pH as An Inhibiting Factor in the Transition From Mesophilic to Thermophilic Phase in Composting, Bioresource Technology 95, 145–150
SEUF (2006), Sector Assessment of Municipal Solid Waste Manage-ment in Kerala.Consultancy to Support Clean Kerala Mission (Government of Kerala) to Develop Policy and Institutional Re-
form Guidelines. Final Report. Socio Economic Unit Foundation. Thiruvananthapuram
Tiwari Rakesh et al (2011),’MGNREGA for Environmental Service En-hancement and Vulnerability Reduction : Rapid Appraisal in Chi-tradurga District, Karnataka’ Economic and Political Weekly, vol XLVI No 20, July.
UNECE (1998) Convention on Access to Information, Public Partic-ipation in Decision Making and Access to Justice, Aarhus 1998, http://www.unece.org/env/pp/welcome.html accessed December 2015
UNDP/ UNCHS/ WORLD BANK-UMP and SDC (1996) Urban Man-agement and Infrastructure, Conceptual Framework for Muncipal Solid Waste Management in Low Income Countries, Working Pa-per No 96 ,UNDP/ UNCHS/ WORLD BANK/SDC collaborative program on Muncipal Solid Waste Management Program In Low Income Countries, SKAT, Swtizerland
UNEP (2016) Guidelines for Framework Legislation for Integrated Waste Management, United Nations Environment Programme, February, accessed February 27 , 2016
UNEP (1992) Rio Declaration on Environment and Development www.unep.org/documents.multilingual/default.asp?documentid=78,. Accessed November 23 2015
UNEP (1972)Declaration of the United Nations Conference on the Human Environment, www.unep.org/documents.multilingual/default.asp?documentid=97, accessed Nov 2015
Varma Ajay Kumar. R. A., (2013).Experiencing a Movement Towards Waste Free Kerala, Resource Book of the International Conference on Waste, Wealth and Health Organized by IIWM, VigyanBharati & MPCST, Bhopal , in association with MPPCB, giz & NSWAI at Bhopal on Feb 15th - 17th, 2013, pp21-27
Varma A., & Suchitwa Mission (2009).Status of Municipal Solid Waste Generation in Kerala and their Characteristics http://www.sanita-tion.kerala.gov.in/pdf/stateof_solidwaste.pdf
Varma Ajay Kumar. R. A., (2008). Technology Options for Treatment of Municipal Solid Waste with Special Reference to Kerala, Proceed-ings of Kerala Environment Congress,Centre for Environment and Development
Veron, R. 2001. The New Kerala Model: Lessons for Sustainable Devel-opment‘, World Development, 29:4, 601-617.
Vijayabhas E.J. (2010), Strategy and Options for Bio- Medical Waste Management, Kerala Environment Congress 2010, Centre for En-vironment and Development, Thiruvananthapuram
World Bank (2015), World Development Report -Mind, Society and Behaviour .
World Bank (2008) Improving Municipal Solid Waste Management in India- A Source Book for Policy Makers and Practitioners, WBI Development Studies
World Bank (1999), Solid Waste Landfills in Middle and Lower Income Countries: A Technical Guide to Planning, Design, and Opera-tion, Technical Paper 426
The Hindu (2006), Collector Issues Directive to Ensure Cultivation of Pokkali Fields, July 7
http://www.knowaste.com/local-authorities/calculating-your-ahp-ton-nages
http://www.nbaindia.org/act/act_english. htm
Reference

100
Role of Grama Panchayats in Waste Management and Environment Protection
Water is the major indicator of pollution of a particular area and the quality of water bod-ies reflect environment condition. Hence the
drinking water system was examined and water quality of a sample of major water bodies (both drinking and non drinking) was assessed in our sample G.Ps.
A1.1 : Drinking Water System in Sample G.PsSample G.Ps are depending on pipe water as well
as ground water sources like well and bore well for drinking purpose. Our survey results had revealed that Nenmeni had high dependence on well water followed by Marutharode and Kanjiramkulam where around one fifth of sample households depend on well/ bore well for drinking purpose. It also revealed mixed pattern in availability of drinking water within same G.P with some areas obtaining sufficient supply and other areas facing shortage. All sample G.Ps are facing shortage of drinking water either in some of the areas or during some seasons.
Ezhikkara G.P is covered with canals and back waters and there is high salinity in the water bodies including ground water sources. In general, both public and private wells are not being used by people for drinking purpose because of this issue and people are depending exclusively on pipe water from Kerala Water Authority (KWA). Hence many wells are not periodically cleaned or maintained. Generally, there is no drinking water shortage because of availability of pipe water in all areas of the G.P, but dependence on only one source for drinking water increases the risk of water insecurity. Any failure of this one system will affect the G.P as a whole. People of Ezhikkara reported that before getting pipe connection from KWA, the G.P faced acute shortage of drinking water and some people used to bring drinking water from nearby G.Ps while some others were compelled to use saline water from wells, bore wells, canals and backwaters.
In Kanjiramkulam people depend on pipe water, wells and bore wells for drinking purpose. There are three major drinking water schemes –Kumily Scheme, Karichaal
Scheme and Nediyakala Scheme which meet the demand of the people of Kanjiramkulam as well as nearby G.Ps. Besides these, local bore well based drinking water schemes are also functioning within the Panchayat. Public wells of the Panchayat are being protected and maintained but availability of drinking water is not sufficient and Panchayat faces acute drinking water shortage in some areas. To avoid this, the Panchayat has initiated a community based water management programme. Under this scheme, bore wells are drilled in potential areas or planted within public wells. Water from these are pumped into a water tank from which needy households can get water through pipe connection. Consequently the households get water within their premises in the form of pipe water. Around 20 to 50 households get drinking water from one bore well. The operational cost is shared by the beneficiary households. A monitoring committee is formed by the people of that particular area with the help of G.P for smooth running of this programme and they maintain a common fund for the same. If a household needs water connection, they have to pay an initial amount to this committee which includes the cost of extension of pipe line from the water tank to the house. Subsequently the household has to meet only the monthly electricity and other charges decided on a sharing system. This system is prevailing in some wards which are facing acute drinking water shortage. Despite Kanjiramkulam G.P being a low land, ground water is scarce and they have to resort to digging deep bore wells within traditional wells to access water.
Marutharode G.P is also facing drinking water shortage in some areas. Marutharode is a high land G.P and the people depend on wells and bore wells. The major public drinking water source is Malampuzha drinking water project of Kerala Water Authority but it does not cover all areas. Households get water from wells or bore wells within their premises in some areas. Besides this, to meet demand, the G.P has implemented few community drinking water schemes similar to that in Kanjiramkulam majority of which are based on bore well system. The motor pump
Appendix: 1
WATER QUALITY ASSESSMENT OF SAMPLE GRAMA PANCHAYATS

101
connected at each bore well station pump water into tanks and distribute it through pipe connection to households. A beneficiary committee is formed to monitor this and collect a minimum amount from each household so as to meet operational cost.
Nenmeni is also a high land G.P and people depend on wells, bore well and pipe water for drinking purpose with great reliance on private wells compared to other sample G.Ps. The major public drinking water project is Jalanidhi (implemented by the state government with the World Bank fund in 2005) under which ownership of the single-village schemes of Kerala Water Authority were transferred. One such scheme is the Nenmeni Rural Water Supply Scheme (NRWSS), established in 1998 and operated by KWA until 2007. Since supply was irregular and quality of water poor, the scheme in 2007 was transferred to the Scheme Level Executive Committee (SLEC) registered under the name Nenmeni ShudhajalaVitarana Samiti (NSVS)13 formed as part of the Jalanidhi project. The scheme’s water source is from Noolpuzha, a perennial river originating in Tamil Nadu, which flows through Nenmeni and Noolpuzha GPs in Kerala before joining Kabini River, a tributary of Kaveri River. The NSVS distributes water in 18 of the 22 wards in Nenmeni G.P covering two revenue villages of the G.P- Cheeral and Nenmeni. Water from NRWSS is supplied to the entire stretch of Cheeral village and partial stretch in Nenmeni village and provides water for around 3000 beneficiaries. Besides this large scheme, there are many small schemes functioning under Jalanidhi project.
To address acute drinking water shortage faced in some areas, there are other many community water supply schemes, which source water from wells and follow an operational model similar to that in Marutharode and Kanjiramkulam wherein it is monitored by a beneficiary committee. The G.P reported that 103 such schemes have been implemented out of which 95 are functioning well. Out of 103 schemes, 79 have been introduced with the support of Jalanidhi and remaining 24 implemented through the other schemes of block and district Panchayats with full cost being met by government. In Jalanidhi schemes, major share (75percent) of the cost of implementing such minor schemes are borne by Jalanidhi, 15 percent by G.P and the remaining 10 percent in the form of beneficiary contribution provided either in the form of money or labour.
A1.2: Water Quality AssessmentFor assessing water quality, a total of 65 water samples
were collected from Ezhikkara (16), Kanjiramkulam (16), Marutharode (17) and Nenmeni (16) Panchayats. The containers used for sampling were pre cleaned, non reactive plastic bottles (1 liter) and sterilized bottles (100ml) for physico–chemical and microbiological analysis respectively. Some parameters like pH, temperature, electrical conductivity and salinity were measured in situ. Sampling and analysis of water quality parameters were carried out as per the standard procedure proposed by APHA (2012). The details of sampling stations are given in TableA 1.1 Result of quality analysis is presented separately for each G. P.
A 1.2.1. Ezhikkara A total of 16 water samples were collected from
Ezhikkara Panchayat during the month of January, 2015. The details of sample stations and type of water body is given in TableA 1.2. Samples were collected from both surface water (8) and groundwater sources (8) and its water quality characteristics are given in Table. A 1.3
A 1.2.1.1 pHWater with pH values ranging from 6.5 to 8.5 is
considered normal. The pH values of water samples collected from Ezhikkara G.P ranged from 6.57 to 7.58. pH values of all the water samples was found to be within the BIS limit.
A 1.2.1.2 Total Dissolved SolidsWater with total dissolved salts values below 500(mg/l)
are considered as normal. Total dissolved salts values in Ezhikkara ranged between 104mg/l and 42400mg/l. High TDS values were observed in the samples collected from the stations namely, Kundekavu, Veerampuzhakayal, Pulinganad Thodu, Perumparakalluchira puzha, Ettiyodamperum-padannapuzha (Paravoor Puzha). It indicates pollution stress in the ecosystem.
‘
Table: A 1.1:Details of Water Sampling StationsSl. No. Name of Panchayat No. of samples collected District
1 Ezhikkara 16 Ernakulam2 Kanjiramkulam 16 Thiruvananthapuram3 Marutharode 17 Palakkad4 Nenmeni 16 Wayanad
Total 65
13The rural water supply of Nenmeni of Jalanidhi is reported as good practices in rural water supply in the report of Government of India. Taking on New Challenges: A Compendium of Good Practices in Rural Water Supply Schemes, Water & Sanitation programme, Ministry of Drinking Water and Sanitation, Government of India, February 2015.
Appendix: 1 - Water quality assessment

102
Role of Grama Panchayats in Waste Management and Environment Protection
Table:A 1.2: Water Sample of EzhikkaraPanchayatSample Number
Name of the location Type of water body Ward number
1 Nandiyathukunnam LP school Public well 52 Kudiyakulangara temple Pond (Public) 133 Vaniviharam Kizhakkethe Well 134 Kundekkavu Canal 135 Aayapalli Pond (Public) 76 Ezhikkara GHSS Public well 77 Nettayikkadam Public well 78 Public health centre Pond (Public) 109 Public health centre Well 1010 Nadamel Varghese Private well 811 Jacobite church Public well (unused) 812 Veerampuzha kayal, chathanadu Lake 813 Vincent (Joshi), Pulinganadu Private well 1014 Pulinganadu thodu Canal 1015 Perumpadakalluchira puzha
(Kollam- Kottapuram waterway)River 1
16 EttiyodamPerumpadanna Puzha (Paravur puzha)
River 1
Table: A1.3: Water Quality Characteristics of Water Samples Collected from EzhikkaraSample Number*(EZHI: Ezhikkara)
Parameters EZHI 1 EZHI 2 EZHI 3 EZHI 4 EZHI 5 EZHI 6 EZHI 7 EZHI 8
pH 6.86 7.40 7.43 6.93 7.58 7.73 7.43 7.47Colour, (Hazen) 6.0 2.0 4.0 7.0 3.0 2.0 3.0 BDLTurbidity, (NTU) 0.60 0.50 0.20 1.70 BDL BDL BDL BDLTDS, (mg/l) 225.0 155.0 161.0 16000.0 160.0 146.0 199.0 110.0Chloride,(mg/l) 29.69 29.69 11.14 11126.0 22.27 18.56 29.69 14.85Total Hardness, (mg/l)
111.0 81.40 88.80 3700.0 66.60 92.50 107.30 88.80
Sulphate,(mg/l) 10.68 25.36 11.84 1920.0 3.88 12.28 5.68 8.92Nitrate,(mg/l) BDL BDL BDL BDL BDL BDL BDL BDLIron,(mg/l) BDL BDL BDL BDL BDL BDL BDL BDLCalcium,(mg/l) 36.80 28.80 30.40 320.0 20.80 30.40 22.40 35.20Magnesium,(mg/l) 4.61 2.28 3.11 524.88 3.54 4.00 12.46 0.19
Total coliform, MPN/100ml
1100 75 1100 75 9 ≥2400 ≥2400 1100
E. coli Present Absent Present Present Absent Present Present Present BDL: Below Detection Limit * The type of sample with respect to the sample number is shown in Table A1.2

103
A 1.2.1.3 Total HardnessHardness is one of the important parameters for
quality determination of water for human consumption. A hardness value between 150 mg/l to 300 mg/l means the water is hard. The sulphate, nitrate and chloride of calcium and magnesium form the non-carbonate or permanent hardness in water.Total Hardness values of water samples ranged from 55.5mg/l to 5180mg/l. High values for total hardness was observed in the samples collected from the stations namely, Kundekavu, Veerampuzha kayal, Pulinganad thodu, Perumparakalluchira puzha and Ettiyodamperumpadanna puzha (Paravoor puzha).
A 1.2.1.4 CalciumCalcium is one of the alkaline earth metals. Calcium
content ranged between 19.2mg/l and 640mg/l. The desirable limit for calcium is 75 mg/l. The presence of calcium in water can be attributed to salinity intrusion or due to mineralogical origin. Higher values were observed in the sites where high TDS and Hardness were observed.
A 1.2.1.5 Magnesium Magnesium is a common constituent of natural waters.
Magnesium concentration varied from 0.19mg/l to 869.94mg/l. High values are observed in the stations where high calcium hardness were observed.
A1.2.1.6 Chloride Chloride in the form of chloride ion is one of the
major inorganic anions in water. In potable water, the salty taste produced by chloride concentration is variable and dependent on the chemical composition of water. A maximum permissible limit for chloride content in drinking water is 250mg/l. In Ezhikkara sample, chloride content ranged from 11.14mg/l to 15578.3mg/l. High values are observed in the sites where high TDS was observed.
A 1.2.1.7 SulphateThe desirable limit of sulphate is 200 mg/L. Sulphate
concentration of samples ranged from 3.16mg/l to 2720mg/l. Higher values are observed in the sites where high TDS was observed.
A1.2.1.8 TurbidityThe desirable limit of turbidity is 1 NTU; the water
samples showed turbidity values ranged from BDL to 6.2
Table:A1.3.continued.
Sample Number
Parameters EZHI 9 EZHI 10 EZHI 11 EZHI 12 EZHI 13 EZHI 14 EZHI 15 EZHI 16pH 7.32 7.25 7.04 7.04 6.94 6.57 7.32 7.09Colour, (Hazen) 1.0 6.20 6.0 17.0 1.0 9.0 27.0 23.0Turbidity, (NTU)
BDL 1.20 0.80 2.30 BDL 2.50 6.20 3.70
TDS,(mg/l) 126.0 394.0 104.0 15100.0 185.0 15100.0 42400.0 19200.0Chloride, (mg/l)
14.85 89.0 14.85 11126.30 70.50 11126.30 15578.30 14836.30
TotalHardness, (mg/l)
70.30 118.40 55.50 3700.0 96.20 3700.0 4440.0 5180.0
Sulphate,(mg/l) 12.64 18.64 3.16 2160.0 10.48 1952.0 2720.0 2480.0Nitrate,(mg/l) BDL BDL BDL BDL BDL BDL BDL BDLIron, (mg/l) BDL BDL BDL BDL BDL BDL BDL BDLCalcium,(mg/l) 27.20 32.0 19.20 640.0 35.20 320.0 640.0 640.0Magnesium, (mg/l)
0.55 9.33 1.82 510.3 1.99 704.70 690.12 869.94
Total coliform, MPN/100ml
75 460 ≥2400 1100 23 ≥2400 ≥2400 ≥2400
E. coli Absent Present Present Present Absent Present Present PresentBDL: Below Detection Limit * The type of sample with respect to the sample number is shown in Table A1.2
Appendix: 1 - Water quality assessment

104
Role of Grama Panchayats in Waste Management and Environment Protection
NTU. High values are observed in the sites where high TDS was observed. A1.2.1.9 Microbiological Analysis.
Bacteriological analysis carried out on the 16 samples revealed higher index for Total coliform in 6 stations. High total coliform count (≥2400) was observed in the stations namely Ezhikkara GHSS, Nettayikadam, Jacobite church Pulinganad thodu, Perumpara Kalluchira puzha, Ettiyodam perumpadanna puzha (Paravoor puzha). Seventy five percentage of the surface water samples were found to be contaminated with E.coli.
The analysis shows that majority of the water samples have bacterial contamination. Samples were collected from 3 public ponds all of which had coliform bacteria. Sample from 2 canals also show the presence of E.coli. Water of the 2 rivers (one is National Water Way -Kollam-Kottapuram Water way) are also highly contaminated with higher index of coliform, presence of E.coli as well as higher level of total hardness and total dissolved solids. The water from lake also shows E.coli contamination. The analysis shows that almost all water bodies are highly polluted in the G.P. All the 4 samples of public wells are highly contaminated in Ezhikkara with a higher index of coliform and the presence of E.coli. The sample from 4 private wells shows the presence of coliform and 2 have E.coli.
A1.2.2. Kanjiramkulam A total of 16 water samples (5 surface and 11 groundwater)
were collected from Kanjiramkulam Panchayat of Thiruvana nthapuram district during the month of June 2015. The details of sample stations and type of water body is given in TableA1.4.Water quality characteristics of water samples collected from Kanjiramkulam G.P are given in Table.A1.5
A.1.2.2.1. pHThe pH values of the water samples ranged from 4.95
to 6.84. pH values of14 samples were found to be less than 6.5.
A.1.2.2.2 Total Dissolved Solids Total dissolved solid values ranged between 52mg/l and
436mg/l. The value of TDS is found to be within the limit in all water samples.
A1.2.2.3 Total HardnessTotal hardness values of water samples ranged from
7.84mg/l to 62.72mg/l. The concentration of hardness is found to be within the BIS limit in all water samples.
A1.2.2.4. Calcium The value of calcium is found to be within the limit in
all water samples.
A1.2.2.5. Magnesium Magnesium concentration varied from 0.95mg/l to
4.76mg/l.The concentration of magnesium is found to be within the limit in all water samples.
Table:A1.4: Water Samples of Kanjiramkulam G.P.Sample Number
Name of location Type of the water body
1. Nellikkakkuzhi pond Public pond2. Kumily water supply scheme Public drinking water project3. Metro hospital, Kanjiramkulam Private bore well4. Malinamkulam Public pond 5. Kaivanvila drinking water project Public bore well6. Private well Private well (Inside bore well)7. Moonnumukkuthodu Small public canal(Starting point)8. Parayanvilakam drinking water project Public well (Inside bore well)9. Karichal drinking water project Public water scheme10. Pulladichanvila drinking water project Public bore well11. Private borewell Private bore well (Sharing system)12. Well from oottara Private well13. Oottara thodu Public thodu14. Oottara pond Public pond15. Mavila drinking water project Public bore well16. Near panchayat compound Public bore well

105
Table:A1.5: Water Quality Characteristics of Water Samples Collected from Kanjiramkulam Sample Number * (KK: Kanjiramkulam)
Parameters KK-1 KK-2 KK-3 KK-4 KK-5 KK-6 KK-7 KK-8
pH 6.84 6.35 6.35 6.70 5.50 5.50 5.90 5.27Colour, (Hazen) BDL 18.0 BDL 17.0 BDL BDL 8.0 BDLTurbidity, (NTU) BDL 3.20 BDL 3.60 BDL BDL 2.0 BDLTDS, (mg/l) 66.0 58.0 52.0 93.0 53.0 57.0 104.0 71.0Chloride,(mg/l) 27.22 19.44 15.55 11.66 31.11 19.44 27.22 27.22Total Hardness (mg/l) 15.68 15.68 15.68 39.20 11.76 11.76 31.36 11.76Sulphate,(mg/l) 12.88 2.20 1.84 5.56 1.84 2.64 6.92 3.40Alkalinity,(mg/l) 27.45 19.61 15.69 47.06 23.53 11.76 23.53 15.69Iron,(mg/l) 0.17 0.11 BDL 0.06 BDL BDL 0.06 BDLCalcium ,(mg/l) 11.76 7.84 11.76 27.44 7.84 3.92 19.6 7.84Magnesium, (mg/l) 0.95 1.90 0.95 2.85 0.95 1.90 2.85 0.95Total coliform, MPN/100ml
Absent Absent Absent ≥2400 Absent Absent 300 1400
E.coli Absent Absent Absent Present Absent Absent Present AbsentBDL: Below Detection Limit * sample corresponding to each sample number is shown in Table A1.4
Table:A1.5continued... Sample NumberParameters KK-9 KK-10 KK-11 KK-12 KK-13 KK-14 KK-15 KK-16pH 5.75 6.40 6.25 5.20 6.1 5.60 5.26 4.95Colour, (Hazen) BDL BDL BDL BDL 22.0 BDL BDL BDLTurbidity, (NTU) BDL BDL BDL BDL 5.20 BDL BDL BDLTDS, (mg/l) 436.0 62.0 117.0 159.0 61.0 71.0 75.0 92.0Chloride,(mg/l) 159.44 27.22 42.77 50.55 23.33 23.33 23.33 15.55Total Hardness ,(mg/l) 62.72 11.76 15.68 23.52 15.68 15.68 7.84 11.76Sulphate,(mg/l) 18.20 1.40 2.52 1.40 4.40 5.92 1.64 10.0Alkalinity,(mg/l) 23.53 7.84 15.69 7.84 7.84 11.76 7.84 3.92Iron,(mg/l) 0.11 BDL BDL BDL 0.09 BDL BDL BDLCalcium,(mg/l) 43.12 7.84 11.76 11.76 7.84 11.76 3.92 7.84Magnesium,(mg/l) 4.76 0.95 0.95 2.85 1.90 0.95 0.95 0.95Total coliform , MP-N/100ml
Absent 2300 2000 100 100 ≥2400 200 Absent
E.coli Absent Absent Present Absent Absent Absent Absent AbsentBDL: Below Detection Limit * sample corresponding to each sample number is shown in Table A1.4
A1.2.2.6. Chloride Chloride content ranged from 11.66mg/l to 159.44mg/l.
The concentration of chloride is found to be within the limit in all water samples.
A1.2.2.7. SulphateSulphate concentration of samples ranged from
1.84mg/l to 18.20mg/l. The concentration of sulphate is found to be within the limit in all water samples.
A1.2.2.8. TurbidityThe water samples showed turbidity values ranged
from BDL to 5.2 NTU. High values were observed in the samples collected from the stations namely Kumily water supply scheme, Malinamkulam, Moonnumukku thodu and Ootara thodu.
A1.2.2.9 Microbiological Analysis.
Appendix: 1 - Water quality assessment

106
Role of Grama Panchayats in Waste Management and Environment Protection
Bacteriological analysis of 16 samples revealed that four stations had higher index for total coliform. High total coliform count (≥2400) was observed in the stations namely, Malinamkulam, Public well, Private well and Ootara Pond. Eighteen percentage of the surface water samples were found to be contaminated with E.Coli.
Out of the public water bodies in the G.P, samples from 2 ponds and one thodu have been analysed. Out of this, one pond and thodu have the presence of E-coli and another pond have coliform bacteria (Table A1.4&A1.5). The chemical analysis of samples taken from 6 drinking water schemes in the G.P shows that three community water supply schemes based on the bore well system have the presence of coliform bacteria. Besides this one private drinking water sharing system based on bore well also was noted to have coliform. The study indicates bacterial contamination even in ground water sources.
A1.2.3.MarutharodeA total of 17 water samples (2 surface and 15
groundwater) were collected from Marutharode G.P of Palakkad District during the month of December 2015. The details of sample stations and type of water body is given in TableA1.6. The water quality characteristics are discussed in the following sections and details are given in Table A1.7.
A1.2.3.1. pHpH values of the water sample ranged from 5.90 to
7.33.Five sampling stations(MTRD -1, MTRD -2, MTRD -3, MTRD -6 and MTRD -7) showed pH values less than 6.5.pH values of all other water samples were found to be within the BIS limit.
A1.2.3.2. Total Dissolved SolidsTotal dissolved salts values in Marutharode ranged
between 62mg/l to 1030mg/l. High TDS values were observed in the samples collected from the stations namely, Kottekkadu well, Anappara borewell, Anappara well, Anappara DWP and Korayaar river. It indicates pollution stress in the ecosystem.
A1.2.3.3. Total HardnessTotal hardness values of water samples ranged from
58mg/l to 630mg/l. High values for total hardness was observed in samples collected from the stations namely, Anappara(borewell), Anappara(openwell), Anappara DWP and Korayaar river.
A1.2.3.4.CalciumHigher values for calcium were observed in the station
namely Anappara.
Table: A1.6: Water samples of Marutharode G.P.Sample Number
Name of location Type of water body
1 Canal , Kalleppulli Public irrigation canal2 Ward 15 Private well3 Ward 15 Private well4 PAMM U.P. School, Kalleppulli Bore well5 Malambuzha DWP (Tamil colony) Public pipe6 Tamil Colony Private well7 Malambuzha DWP ICDS office connection8 Kottekkadu Private well9 Anappara Private borewell10 Anappara Private well11 Anappara DWP (Panchayat) Borewell12 Thekkethara DWP (Panchayat) Borewell13 Cheenikkadu DWP (Panchayat) Anganwadi14 Padalikkadu DWP (Panchayat) Borewell15 Korayaar river River16 Namballam DWP (Panchayat) Borewell17 Panchayat office Borewell

107
Sample Number* (MTRD: Marutharode)
Parameters MTRD 1
MTRD 2
MTRD 3
MTRD 4
MTRD 5
MTRD 6
MTRD 7
MTRD 8
MTRD 9
pH 6.04 6.23 6.39 6.90 6.51 5.90 6.33 6.71 6.50Colour, (Hazen) 2.0 BDL 2.0 BDL 1.0 1.0 2.0 BDL 3.0Turbidity, (NTU) BDL BDL BDL BDL BDL BDL BDL BDL BDLTDS, (mg/l) 93.0 357.0 310.0 387.0 62.0 494.0 63.0 510.0 786.0Chloride ,(mg/l) 11.87 75.17 55.39 43.52 11.87 166.16 3.96 55.39 300.66Total Hardness ,(mg/l) 63.0 210.0 155.40 210.0 71.40 172.20 58.80 176.40 432.60Sulphate,(mg/l) 4.56 20.0 22.24 22.40 3.40 15.20 3.28 42.40 39.60Alkalinity,(mg/l) 41.93 144.86 129.61 148.67 26.69 91.49 34.31 259.22 182.98Iron,(mg/l) BDL BDL BDL BDL BDL BDL BDL BDL BDLCalcium, (mg/l) 17.60 38.40 44.80 51.20 17.60 41.60 9.60 49.60 80.0Magnesium, (mg/l) 4.62 27.70 10.55 19.93 6.66 16.57 8.46 12.73 56.52Total coliform , MPN/100ml
≥2400 ≥2400 150 200 23 ≥2400 23 ≥2400 210
E coli Present Present Present Absent Absent Absent Absent Absent Absent
Table:A1.7 continued.. Sample Number
Parameters MTRD 10
MTRD 11
MTRD 12
MTRD 13
MTRD 14
MTRD 15
MTRD 16
MTRD 17
pH 6.82 6.71 6.97 6.64 6.63 7.33 7.08 7.10Colour, (Hazen) BDL 2.0 BDL BDL BDL 22.00 2.00 BDLTurbidity, (NTU) BDL BDL BDL BDL BDL 6.80 0.60 BDLTDS,(mg/l) 1030.0 721.0 482.0 246.0 312.0 797.0 309.0 450.0Chloride ,(mg/l) 312.53 174.07 75.17 35.61 67.26 174.07 63.30 134.51Total Hardness ,(mg/l) 630.0 357.0 231.0 180.60 189.0 390.60 168.0 268.80Sulphate,(mg/l) 66.0 47.60 34.40 12.0 16.24 50.00 20.40 18.44Alkalinity,(mg/l) 243.97 243.97 224.90 129.60 133.42 335.46 118.17 141.0Iron,(mg/l) BDL BDL BDL BDL BDL BDL BDL BDLCalcium,(mg/l) 120.0 56.0 41.60 24.00 36.80 67.20 24.00 48.00Magnesium,(mg/l) 80.19 52.73 30.86 29.31 23.57 54.09 26.24 36.16Total coliform, MPN/100ml
≥2400 23 ≥2400 ≥2400 20 ≥2400 150 ≥2400
E.coli Absent Present Absent Present Present Present Present AbsentBDL: Below Detection Limit * The type of sample with respect to the sample number is shown in Table A1.6
A1.2.3.5. MagnesiumMagnesium concentration varied from 4.62mg/l to
80.19mg/l. High values are observed in the stations where high calcium hardness were observed.
A1.2.3.6 Chloride Sample collected from Marutharode reported high
chloride content of 312.53mg/l. High values are observed in Anappara (bore well) and Anappara (open well).
A1.2.3.7. SulphateSulphate concentration of Marutharode samples ranged
from 3.29mg/l to 66mg/l. The concentration of sulphate is found to be within the limit in all water samples.
BDL: Below Detection Limit * The type of sample with respect to the sample number is shown in Table A1.6
Appendix: 1 - Water quality assessment
Table: A1.7: Water Quality Characteristics of Water Samples of Marutharode G.P.

108
Role of Grama Panchayats in Waste Management and Environment Protection
A1.2.3.8 TurbidityThe water samples showed turbidity values ranging
from BDL to 6.8 NTU. High values were observed in the sample collected from the station namely Korayar river.
A1.2.3.9 Microbiological AnalysisBacteriological analysis of 17 water samples collected from
Marutharode G.P reavealed that nine stations had higher index for total coliform. High total coliform count (≥2400) was observed in the stations namely Kallepully, Private well ward 15, Tamil colony, Kottekadu, Anappara, Thekkethara, Cheenikkad, Korayar River and Murutharode. Out of the 17 water samples collected, 50 percent of them were found to be contaminated with E.coli.
All the water samples have the presence of coliform bacteria and nine have higher index. The study shows that public water bodies are highly contaminated in the G.P. with Korayaar river having high values for total hardness, dissolved salts, and higher index of coliform and E-coli, public irrigation canal having higher index of coliform and E-coli. Since water from these are used by people, there is a need to give serious attention to this. The G.P reported that many industries in nearest G.P dump their industrial wastes into Korayaar river.
The sample of Malampuzha public drinking water project, the major public drinking water scheme in the G.P, shows the presence of coliform but not higher level. The samples
from all 5 private wells have the presence of coliform and 4 have reported higher index. All the bore wells have the presence of coliform. 4 out of 5 bore based, drinking water schemes sampled from the G.P shows presence of E-coli out of which two have high index of coliform. The data shows that ground water of Anappara area of Marutharode G.P is highly contaminated with Anappara borewell, Anappara well, Anappara drinking water schemes having high values for total hardness, dissolved salts, high index of coliform bacteria in Anappara private well, presence of coliform in Anappara private bore well, and E-coli presence in the Anappara drinking water scheme. The study shows a high level contamination in both surface and ground water source some of which are also used for drinking purposes.
A1.2.4. NenmeniA total of 16 water samples (2 surface and 14
groundwater) were collected from Nenmeni Panchayat of Wayanad District during the month of October 2015. The details of sample stations and type of water body are given in TableA1.8. Water quality characteristics are discussed in the following sections and details are given in Table A1.9.
A1.2.4.1. pHThe pH values ranged from 6.85 to 8.38. pH values of
samples were found to be within the BIS limit.
Table: A1.8: Water Samples of Nenmeni G.P.Sample Number
Name of location Type of water body
1 Govt. Model Higher Secondary School, Cheeral Well2 Karinkalikunnu colony Jalanidhi public pipe water3 Cheeraal Jalanidhi small scheme4 Paniyar S.T colony, Cheeral Public well5 Thovarimala Public well6 Kaaliparambu Uravu drinking water project Jalanidhi small scheme7 Thekkankolly Paniyar colony Private well8 Thekkankolly pipe water Jalanidhi9 Thekkankolly Private well10 Thekkankolly Thodu11 Anappara Higher Secondary School Borewell12 Ward 17 Private well13 Palakkadan SC colony Jalanidhi small scheme from public well14 Konnampatta S.T. Naykkar colony Jalanidhi small scheme from public well15 Koylomkunnu Paniyar colony Public well16 Koylomkunnu vayal Public well

109
A1.2.4.2. Total Dissolved SolidsTotal dissolved solid values in Nenmeni ranged between
47mg/l and 222 mg/l. The value of TDS is found to be within the limit in all water samples.
A1.2.4.3. Total HardnessTotal hardness values of water samples ranged from
25.20(mg/l) to 134.40(mg/l). The concentration of hardness is found to be within the limit in all water samples.
Table:A1.9: Water Quality Characteristics of Water Samples of Nenmeni G.P.Sample Number* (NMI: Nenmeni)
Parameters NMI-1 NMI -2 NMI -3 NMI -4 NMI -5 NMI 6 NMI -7 NMI -8
pH 8.38 7.84 7.81 7.42 7.48 7.29 6.86 7.25Colour, (Hazen) BDL 3.00 BDL BDL BDL BDL BDL BDLTurbidity, (NTU) BDL 0.60 BDL BDL BDL BDL BDL BDLTDS, (mg/l) 100.0 56.0 79.0 47.0 187.0 119.0 38.0 59.0Chloride ,(mg/l) 19.79 19.79 15.83 11.87 39.57 31.65 7.92 23.74Total Hardness (mg/l) 63.00 42.00 46.20 25.20 100.80 67.20 29.40 42.00Sulphate,(mg/l) 1.40 1.60 2.0 2.48 8.80 1.28 1.40 1.80Alkalinity,(mg/l) 80.05 26.69 38.12 22.87 49.56 30.50 19.06 30.50Iron,(mg/l) BDL 0.16 BDL BDL BDL BDL BDL BDLCalcium ,(mg/l) 20.80 12.80 12.80 8.00 25.60 17.60 8.00 8.00Magnesium ,(mg/l) 2.67 2.43 3.45 1.26 8.94 5.64 2.28 5.35Total coliform , MP-N/100ml
23 ≥2400 23 20 ≥2400 ≥2400 4 ≥2400
E.coli Absent Present Absent Absent Absent Present Absent PresentBDL: Below Detection Limit * The type of sample with respect to the sample numberis shown in Table A1.8
Table:A1.9.continued... Sample Number
Parameters NMI09 NMI -10 NMI -11 NMI 12 NMI -13 NMI 14 NMI -15 NMI -16
pH 6.79 6.95 7.02 6.85 7.50 7.05 7.55 7.50Colour, (Hazen) BDL 8.00 BDL BDL BDL BDL 4.00 7.00Turbidity, (NTU) BDL 2.50 BDL BDL BDL BDL 1.30 2.80TDS, (mg/l) 47.0 74.0 124.0 171.0 155.0 73.0 222.0 90.0Chloride ,(mg/l) 27.70 27.70 47.48 83.08 35.61 15.83 87.04 15.83Total Hardness ,(mg/l) 37.80 42.00 63.00 92.40 96.60 50.40 134.40 67.20Sulphate,(mg/l) 2.48 1.52 1.92 8.72 10.88 1.52 6.04 2.16Alkalinity,(mg/l) 7.63 34.31 26.69 38.12 72.43 34.31 87.68 11.44Iron,(mg/l) BDL 0.23 BDL BDL BDL BDL BDL BDLCalcium ,(mg/l) 8.00 11.20 14.40 22.40 25.60 11.20 36.80 14.40Magnesium ,(mg/l) 4.33 3.40 6.56 8.85 7.92 5.44 10.30 7.58Total coliform , MP-N/100ml
23 ≥2400 0 ≥2400 23 23 210 ≥2400
E.coli Present Present Absent Absent Absent Absent Absent PresentBDL: Below Detection Limit * The type of sample with respect to the sample number is shown in Table A1.8
Appendix: 1 - Water quality assessment

110
Role of Grama Panchayats in Waste Management and Environment Protection
A1.2.4.4. Calcium The value of calcium is found to be within the limit in
all water samples.
A1.2.4.5. MagnesiumMagnesium concentration varied from 1.26mg/l
to10.30mg/l. The concentration of Magnesium is found to be within the limit in all water samples.
A1.2.4. 6. Chloride Chloride content ranged from 7.92mg/l to 87.04mg/l.
The concentration of chloride is found to be within the limit in all water samples.
A1.2.4.7. SulphateSulphate concentration ranged from 1.28mg/l to
10.88mg/l. The concentration of sulphate is found to be within the limit in all water samples.
A1.2.4.8.TurbidityThe water samples showed turbidity values ranged
from BDL to 2.80 NTU.High values were observed in the samples collected from the stations namely Thekkankolly thodu and Koaylomkunnu.
A1.2.4.9. Microbiological Analysis.Bacteriological analysis carried out revealed that
seven stations had higher index for total coliform. High total coliform count (≥2400) was observed in the stations of Karinkalikunnu colony, Thovarimala, Kaliparambu, Haritha Jalanidhi, Thekkankolly thodu, Ward-17, Koylaomkunnuvayal. Thirty seven percentage of the samples were found to be contaminated with E.coli.
The analysis shows that water from natural water stream – Thekkankollythodu has high coliform and also has E.coli. The sample from the 4 public wells indicate bacterial presence and 2 have high index of coliform and one has E.coli. All samples from 4 private wells show prevelance of coliform of which one has high level and another one has E.coli. Sample collected from Jalanidhi project (major public drinking water scheme of Nenmeni), in Karinkalikunnu Colony, shows high level of coliform and presence of E.coli. Analysis of samples from 5 well based small community water supply schemes of Jalanidhi also revealed presence of coliform of which 2 have high index and E.coli. The water sample from the bore well of Anappara do not report any bacterial contamination. Thus except this, all other water samples in nenmeni show presence of coliform bacteria and six water bodies (37percent) also reveal contamination with E.coli.
A1.3 Summary of Water Quality Analysis• All the water quality parameters except pH were found
to be exceeding the BIS limit in five sampling stations of Ezhikkara G.P. High values of quality parameters such as dissolved solids, chloride and hardness was observed in the surface water samples of Kundekavu, Veerampuzha kayal, Pulinganad thodu, Perumpara kalluchira puzha and Ettiyodamperumpadanna puzha. The reason can be attributed to the intrusion of saline water to those stations. Another major water quality problem identified in this area was bacteriological contamination of surface and groundwater samples.
• Water quality parameters such as, colour and turbidity were exceeding the BIS limit in a few of the surface water samples collected from Kanjiramkulam G.P of Thiruvananthapuram (Kumily Water Supply Scheme, Malinamkulam, Moonnumukku and Oottara Thodu).Coliform bacteria is present in 43 percent of total water samples and E.coli in 18 percent. Three community water supply schemes and one private drinking water scheme based on borewell system were noted to have high coliform bacteria indicating contamination of water.
• Water quality problems of dissolved solids, hardness and turbidity were observed in the water samples collected from Anappara (borewell), Anappara (open well), Anappara DWP and Korayaar river located in Marutharode G.P. of Palakkad district.
• In Nenmeni G.P of Wayanad district, water quality parameters such as colour and turbidity were exceeding the BIS limit in three water samples (Thekkankollythodu, Koylomkunnu, Paniyar Colony Public Well and KoylomkunnuVayal Public Well)
• Bacteriological contamination is the major water quality problem identified in the present study. 44.61 percentof the entire 65 samples were found to be contaminated with E.Coli indicating feacal contamination. All the samples from Ezhikkara, Marutharode and Nenmeni reported coliform contamination except for one sample from Nenmeni. Kanjiramkulam presented a relatively better picture compared to other sample G.Ps with only 56 percent of sample stations reporting such contamination. However what was alarming here was the presence of coliform bacteria in water extracted from deep ground water sources in some areas of Kanjiramkulam which includes community run and other public water schemes (Kanjiramkulam despite being a lowland G.P, faces acute water scarcity in some areas and ground water is accessible only through wells/ bore wells dug at great depth). Among the sample G.Ps, Marutharode has been noticed to have high level of

111
pollution in all types of water bodies including bore wells, public irrigation canals and rivers pointing to pollution stress in the ecosystem. Few water samples from Nenmeni- particularly samples from traditional wells- both public and private- and natural water stream in Wayanad district, the G.P near to the Western Ghats, also indicate pollution stress. A notable point is that the major Jalanidhi public drinking water scheme in Nenmeni - a World Bank rural water supply scheme with over 3000 beneficiaries -has high level of bacterial contamination.
The study indicates that both surface and ground water sources even in our rural areas are getting contaminated posing a threat to the water security of future generations. Thus Kerala, having crossed significant milestones in eliminating open defecation even in viallges, now needs to focus on improving quality of sanitation facilities so as to reduce sanitation related environment stress. Sanitation being one of the functions transferred to local bodies under KPR Act of 1994, G.Ps have to pay serious attention to preserving water quality in their locality.
Appendix: 1 - Water quality assessment

112
Role of Grama Panchayats in Waste Management and Environment Protection
Survey on Waste Management Listing SchedulePanchayat: Ward: Enumerator:Sl. Sampling Serial NumberNo: Build-
ing No:
Build-ing Name
Use (Codes)
Struc-ture type (Codes)
Resi-den-tial
Trad-ing
Man-ufac-tur-ing
Health Inst.
Edu.In-stitu-tions
Public build-ings
Oth-ers
Wor-ship Place
Resi-den-tial
Trad-ing
Manu-factur-ing
Health-Institu.
Edu-cation .Insti-tutions
Public build-ings
Oth-ers
wrok ship place
1 2 3
CodesUse Structure Type
Residential 1 Pucca 1Trading unit 2 Semi pucca 2 Manufacturing unit 3Health institutions 4Educational institutions 5
Kutcha 3
Public Building 6Other establishments 7
Appendix: 2
INTERVIEW SCHEDULES
1. Listing Schedule

113
2. Panchayat Data Sheet
Decentralisation Analysis Cell (DAC)Gulati Institute of Finance and Taxation (GIFT)
Government of Kerala
Study on Role of Grama Panchayats in Waste management and Environment Protection
DATA SHEET
District: : ………………………………………………… Taluk : ………………………………………………….. Name of Block Panchayat : ………………………………………………….
Name of Grama Panchayat : ………………………………………………….
Name of the Investigator : ………………………………………………….
Date : ………………………………………………….
1. Contact Details
1.1 Name of the GramaPanchayat :
1.2 Address of its office :
1.3 Telephone number :
1.4 Name of the President 1.5 Telephone number of the President :
2. Locational Details2.1 Name of nearest town :2.2 Distance to the town (Kms) :2.3 Number of wards having border with the town:
Appendix: 2 - Interview schedules

114
Role of Grama Panchayats in Waste Management and Environment Protection
2.4 Name of nearest railway station :2.5 Distance to the railway station(Kms) :2.6 Name of the nearest long route bus station :2.7 Distance to the long route bus station(Kms) :2.8 Name of the nearest local bus stop :2.9 Distance to the local bus stop(Kms) : 3. Ward-wise Particulars :
No: Name Women SC/ST All BPL (Sq.Kms)(1) (2) (3) (4) (5) (6) (7)
4. Details of Physical Infrastructure
Sl.No: Infrastructure Length (Kms) Coverage (Number of) Wards Households4.1 Black surface road4.2 Concrete Road4.3 Metal road4.4 Kutcha road4.5 Pipeline carrying treated water4.6 Pipeline carrying untreated water4-7 Public taps xxxxxxxxx4.8 Covered drain4.9 Open drain4.10 Sewerage pipe4.11 Electricity connection xxxxxxxxxx4.12 Street lights xxxxxxxxxx xxxxxxxxx
4.13. Source of water for treated water supply KWA -1, River---2, Tube well---3, Pond---4, Well---5, None-6, Others--7
4.14. Source of water for untreated water supply KWA -1, River---2, Tube well---3, Pond---4, Well---5, None-6, Others --7
4.15 Method of drain water disposal Treated and recycled-1, Flown to river/canal after treatment-2,

115
Flown to river/canal without treatment-3, Flown to drain pits-4, None-5, Others-6
4.16. Method of sewerage disposal Liquid treated and residue converted into manure-1, Liquid treated and residue burned-2 Connected to main sewerage pipe-3, None-4, other methods-5
4.17. Allocation for liquid waste managementYear Amount of Allocation (Rs.)
2011-122012-132013-14
Total 4.18. Expenditure on liquid waste management
Year Amount of Expenditure (Rs.)2011-122012-132013-14
Total 4.19. If unspent, give reasons………………………………………………………................ ………………………………………………………………………………………..
5. Details of Educational Institutions Within the Panchayat
Sl.No: InstitutionNumber
Girls Boys Mixed5.1 Anganwadi5.2 Nursery5.3 Primary/middle5.4 Secondary without primary/middle5.5 Secondary with middle/primary5.6 Higher secondary with no other levels5.7 Higher secondary with secondary level only5.8 Higher secondary with all lower levels5.9 Computer training institutes5.10 Other technical training institutes
at diploma level5.11 Other technical training institutes
at certificate level5.12 Other higher educational institutions
Appendix: 2 - Interview schedules

116
Role of Grama Panchayats in Waste Management and Environment Protection
6. Details of Educational Institutions Outside the Panchayat but Serving the Residents
Sl.No: Institution Distance to the nearest(Kms)Girls Boys Mixed
6.1 Anganwadi6.2 Nursery6.3 Primary/middle6.4 Secondary without primary/middle6.5 Secondary with middle/primary6.6 Higher secondary with no other levels6.7 Higher secondary with secondary level only6.8 Higher secondary with all lower levels6.9 Computer training institutes6.10 Other technical training institutes at diploma level6.11 Other technical training institutes at certificate level6.12 Other higher educational institutions
7. Details of Health Institutions Within the Panchayat
Sl.No: Institution Number of InstitutionsWomen Women &child All
7.1 Primary health centre7.2 Community health centre7.3 Government hospital7.4 Private clinic7.5 Private hospital7.6 Ayurveda/Unani/Homeopathy hospitals7.7 Veterinary hospital xxxxx xxxxx7.8 Dental hospital7.9 Eye hospital7.10 Clinical laboratories7.11 X-Ray/Scanning centres7.12 Medical stores

117
8. Details of Health Institutions Outside the Panchayat but Serving the Residents
Sl.No: Institution Distance to the nearest (Kms.)Women Women & child All
8.1 Primary health centre8.2 Community health centre8.3 Government hospital8.4 Private clinic8.5 Private hospital8.6 Ayurveda/Unani/Homeopathy hospitals8.7 Dental hospital8.8 Eye hospital8.9 Clinical laboratories8.10 X-Ray/Scanning centres8.11 Medical stores
9. Other Social Infrastructural Facilities within the Panchayat
Sl.No: Infrastructure Number9.1 Markets9.2 Post office9.3 Akshaya centre9.4 Playground/stadium9.5 Public ponds9.6 Public wells9.7 Protected dump yard9.8 Open dump yard9.9 Slaughter houses9.10 Crematorium9.11 Waste treatment Plant9.12 Others
10. Solid Waste Collection and Disposal System
10.1. Waste collection from households No system-1, Out sourced to private agency-2, Kudumbasree members-3, Janasree members-4, Others-5
10.2. Number of persons engaged in waste collection
10.3. Number of households covered
10.4 Waste collection from markets and public places No system-1, Out sourced to private agency-2, Kudumbasree members-3, Janasree members-4, Own staff-5, Agencies/persons engaged by respective authorities-6, Others-7
10.5 Disposal of collected waste
Appendix: 2 - Interview schedules

118
Role of Grama Panchayats in Waste Management and Environment Protection
Taken to designated dump yard-1, Disposed in open spaces within the Pachayat-2, Disposed in open spaces outside the Panchayat-3, Segregated and used for compost making-4, Burned by using incinerators-5, Other methods-6
10.6 Allocation for solid waste management
Year Amount of Allocation (Rs.)2011-122012-132013-14Total
10.7. Expenditure on solid waste management Year Amount of Expenditure (Rs.)2011-122012-132013-14Total
10.8. If unspent, please give reasons……………………………………………………….. ………………………………………………………………………………………..10.9 Assistance for installing bio-gas plants by households Yes-1, No-2
10.10. If yes, number of households assisted so far
10.11. Assistance for installing pipe composts by households Yes-1, No-2
10.12. If yes, number of households assisted so far 11. Protection and Maintenance of Water Bodies in the Panchayat 5.1 Does the Panchayat maintain any record of number and size of public ponds/canals? Yes-1, No-2
11.2 Method of protection of the water bodies No significant effort-1, Protected by constructing retention walls-2, Protected by fencing-3 Protected by placing sign boards-4, Other methods-5
11.3 Is there any mechanism for carrying out annual maintenance of water bodies? Yes-1, No-2
11.4. Allocation for water conservationYear Amount of Allocation (Rs.)2011-122012-132013-14Total
11.5. Expenditure on water conservation

119
Year Amount of Expenditure (Rs.)2011-122012-132013-14Total
11.6. If unspent, please give reasons……………………………………………………….. ………………………………………………………………………………………..
11.7. Is any systematic measure taken to avoid pollution of water bodies? Yes-1, No-2
11.8. If yes, indicate the steps taken last year. ………………………………………………..
11.9. How much money is spent on cleaning and prevention of pollution of water bodies last three years ?
2011-12 2012-13 2013-14
12. Management of Industrial and Chemical Waste 12.1 Number of industrial units within the Panchayat12.2 Number of establishments having valid clearance from Pollution Control Board12.3 What are the stipulations made on pollution control while issuing industrial licenses? …………………………………….12.4 How is the implementation of pollution control regulations by industries monitored? Through periodic inspections-1, By obtaining periodic reports-2, Based on complaints received from citizens-3, No such monitoring-4
12.5. How many industrial units in the Panchayath have installed treatment plantsfor treating factory waste/emulsions?13. Environment Protection and Biodiversity Programmes13.1. Is there any specific scheme for environment protection? Yes-1, No-2
13.2. If yes, give the details of the scheme…………………………………………………..
13.3. How much money is spent on the scheme?
Year Allocation Expenditure Remarks2011-122012-132013-14Total
Appendix: 2 - Interview schedules

120
Role of Grama Panchayats in Waste Management and Environment Protection
13.4. Has there been any environment awareness campaigns in the Panchayat
During last three years?
Yes-1 No-2
13.5. If yes, what was the amount spent?
Year Allocation Expenditure Remarks2011-122012-132013-14Total
13.6. Is there any afforestation programme in the Panchayat?
Yes-1, No-2
13.7. If yes, what was the amount spent?
Year Allocation Expenditure Remarks2011-122012-132013-14Total
13.8. How much area is brought under the programme so far (sq.kms)?
13.9. Is there any bio-diversity register in the Panchayat?
Yes-1, No-2
13.10. If so, is it complete and up to date? Complete & uptodate-1, Complete but not uptodate-2, Partially complete-3
13.11. Is there any endemic species of flora and fauna in the Panchayat?
Yes-1 No-2
13.12 If yes, what are the measures taken to protect those species?..................................................…………………………………………………………………………………………….............…………………………………………………………………………………………….............
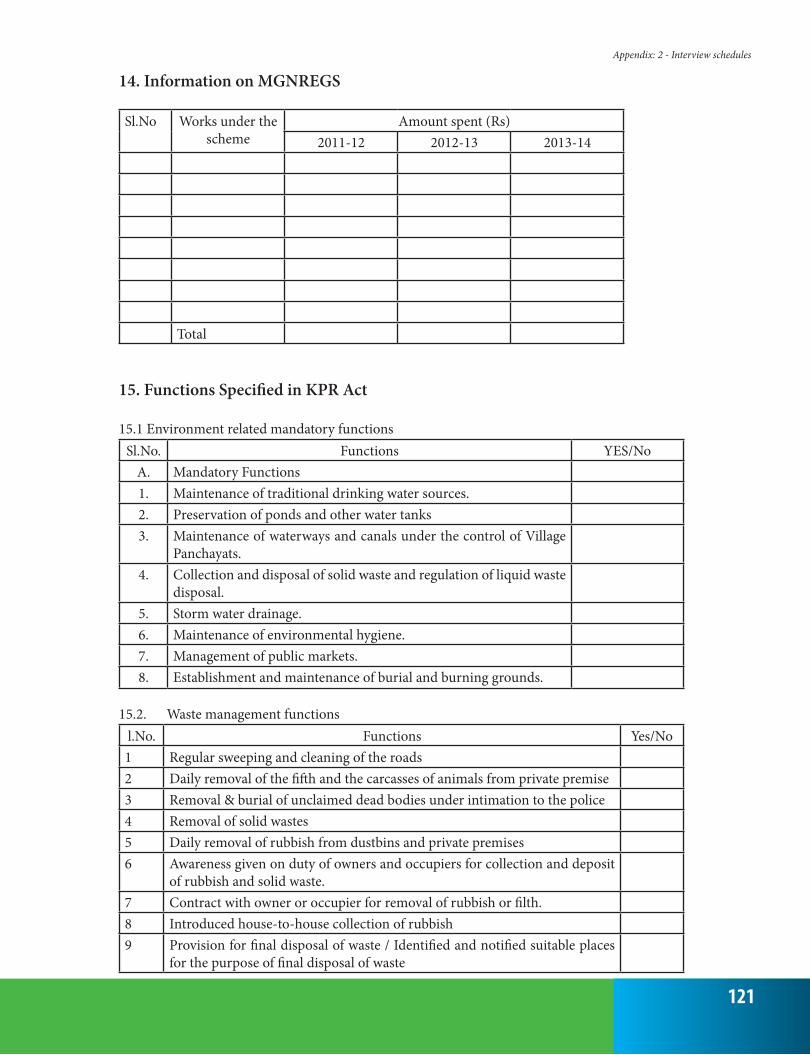
121
14. Information on MGNREGS
Sl.No Works under the scheme
Amount spent (Rs)2011-12 2012-13 2013-14
Total
15. Functions Specified in KPR Act
15.1 Environment related mandatory functions Sl.No. Functions YES/No
A. Mandatory Functions1. Maintenance of traditional drinking water sources.2. Preservation of ponds and other water tanks3. Maintenance of waterways and canals under the control of Village
Panchayats.4. Collection and disposal of solid waste and regulation of liquid waste
disposal.5. Storm water drainage.6. Maintenance of environmental hygiene.7. Management of public markets.8. Establishment and maintenance of burial and burning grounds.
15.2. Waste management functions
l.No. Functions Yes/No1 Regular sweeping and cleaning of the roads 2 Daily removal of the fifth and the carcasses of animals from private premise3 Removal & burial of unclaimed dead bodies under intimation to the police4 Removal of solid wastes5 Daily removal of rubbish from dustbins and private premises 6 Awareness given on duty of owners and occupiers for collection and deposit
of rubbish and solid waste. 7 Contract with owner or occupier for removal of rubbish or filth.8 Introduced house-to-house collection of rubbish9 Provision for final disposal of waste / Identified and notified suitable places
for the purpose of final disposal of waste
Appendix: 2 - Interview schedules

122
Role of Grama Panchayats in Waste Management and Environment Protection
10 Provision for processing of solid wastes.11 Removal of rubbish and solid waste accumulated on non-residential premises12 Prohibited improper disposal of carcasses rubbish and filth.13 Prohibited keeping of filth on premises.14 Prohibited allowing outflow of filth:15 Prohibited deposit of rubbish or filth in public places.16 Employees of Panchayat engaged in rubbish and solid waste management
service
15.3 Environment related general and sectoral functions Sl.No. Functions Yes/NoB. General functions1. Inculcating environment awareness and motivating local action for envi-
ronmen upgradation.C. Sectoral functionsI Agriculture1. Soil protection2. Production of organic manure.II Minor irrigation3. Maintenance and implementation of all minor irrigation projects within
the area of a village Panchayat.4. Implementation and maintenance of all micro irrigation projects.5. Put into practice water conservation.III Social forestry6. Growing trees for cattle feed, fire wood and growing of fruit trees.7. Organise campaigns for planting of trees and to build environment
awareness.8. Afforestation of waste landIV Water supply9. Management of water supply schemes within a village Panchayat.10. Setting up of water supply schemes within a village Panchayat.V Public health and sanitation11. Implementation of sanitation programmes.
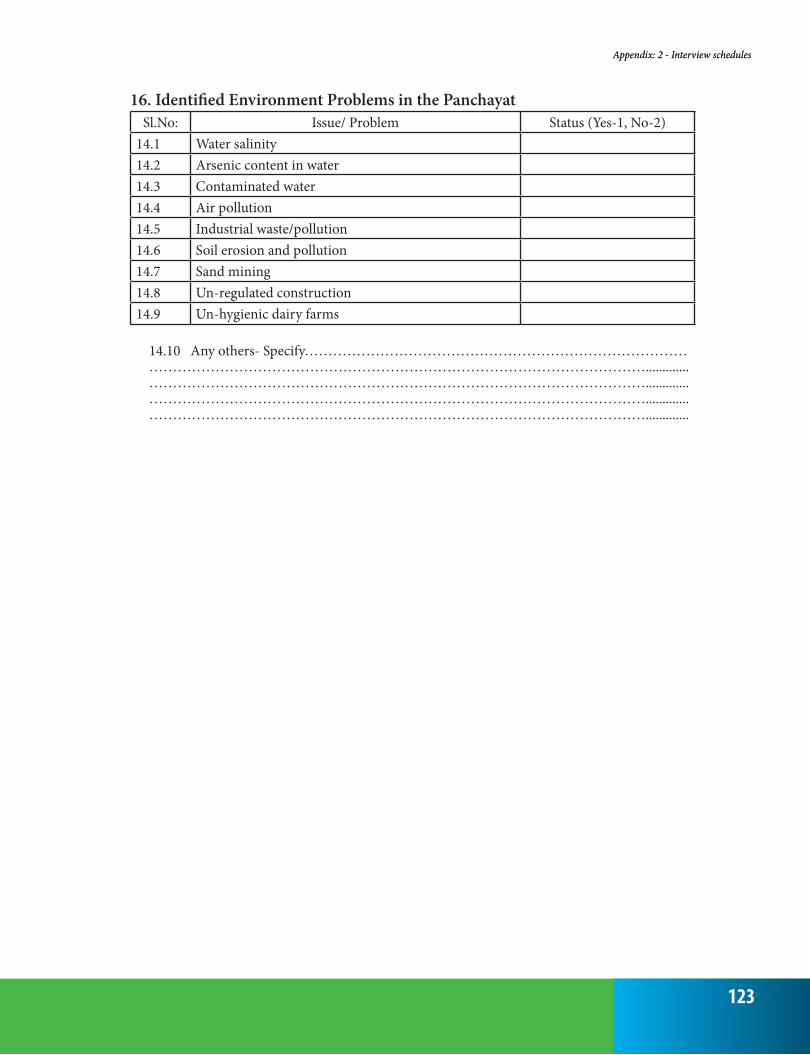
123
16. Identified Environment Problems in the Panchayat
Sl.No: Issue/ Problem Status (Yes-1, No-2)14.1 Water salinity14.2 Arsenic content in water14.3 Contaminated water14.4 Air pollution14.5 Industrial waste/pollution14.6 Soil erosion and pollution14.7 Sand mining14.8 Un-regulated construction14.9 Un-hygienic dairy farms
14.10 Any others- Specify…………………………………………………………………………………………………………………………………………………………………….............…………………………………………………………………………………………….............…………………………………………………………………………………………….............…………………………………………………………………………………………….............
Appendix: 2 - Interview schedulesAppendix: 2 - Interview schedules

124
Role of Grama Panchayats in Waste Management and Environment Protection
3. Household Data Schedule Household Survey on Waste Management
1. Identification Particulars1.1 District 1.2 Panchayath1.3 Ward1.5 House number1.6 Sampling serial number1.7 Telephone number 1.8 Mobile number
2. Household CharacteristicsSl.No: Item Particulars
2.1 Name of head of the household2.2 Religion [Hindu-1, Christian-2, Muslim-3, Others-9]
2.3 Social group [ Scheduled Tribe-1, Scheduled Caste-2, Other Backward Classes-3, Others-9]
2.4 Dwelling unit [Owned-1, Hired-2, Rent free-3, Others-9]
2.5 Ownership of land at the place of stay [Yes-1, No-2]
2.6 Type of land owned if ‘Yes’ to item 2.5[Homestead only-1, Homestead & other land-2, Other land only-3]
2.7 Size of the land owned (cents)
2.8 Status as per government BPL list [BPL-1, APL-2]

125
3. Basic Amenities
Sl.No: Item Particulars3.1 Type of house
Pucca-1, Semi-pucca-2, Kutcha-3
3.2 Number of rooms (include bed rooms, drawing & dining and kitchen)
3.3 Number of bath rooms inside the house3.4 Number of bath rooms outside the house but within the premises3.5 Primary source of energy for lighting (code)3.6 Primary source of energy for cooking (code)3.7 Primary drinking water facility (code)3.8 Primary drinking water source (code)3.9 Primary bathing and washing facility (code)3.10 Primary bathing and washing water source (code)3.11 Toilet facility (code)
Within the house-1, Within own premises-2, Outside own premises-3 Common facility-4, Open space-5, Others-6
3.12 Type of toiletPit-1, Flush to water bodies-2, Flush to septic tank-3,Flush to sewerage-4, Bio toilet-5, Others-6
3.13 Liquid waste disposal from kitchenNo drain-1, Flown within own compound-2, Soak pit-6, To open drain-7, To closed drain-8, Treatment plant-9, Others-10
3.14 Liquid waste disposal from bathroom/wash basinNo drain-1, Flown within own compound-2, 3, To the road-4, To water bodies-5, Soak pit-6, To open drain-7, To closed drain-8, Treatment plant-9, Others-10, Flown outside the compound-11
3.15 Treatment of drinking waterNo treatment-1, Strain through cloth-2, Chlorinate-3, Boil-4, Use water filters-5, Others-6
Codes for Block 3Item 3.5: Primary source of energy for lighting Kerosene-1, other oils-2, Candle-3, Gas-4, Electricity-5, Others-9 Item 3.6: Primary source of energy for Cooking Firewood & chips-1, Dung cake-2, Kerosene-3, Coke/coal-4, Charcoal-5, Gobar gas-6, LPG/Natural gas-7, Electricity-8, others-9
Items 3.7 & 3.9: Primary drinking water facility/Bathing and washing facility Exclusive (own premises)-1, Shared private-2, Common facility-3
Items 3.8 & 3.10: Primary drinking water source/ Bathing and washing water source Treated pipe water-1, Untreated pipe water -2, Tube well-3, Well-4, Shallow well-5, Spring-6, Pond/Canal-7, River-8, Others-9
Appendix: 2 - Interview schedules

126
Role of Grama Panchayats in Waste Management and Environment Protection
4. Demographic and other Particulars of Household Members
Sl.No: Name Relation to head (code)
SexMale-1, Female-2
Age Marital status (code)
Member of Kudumbasree
Edu-cation (code)
Techni-cal Cert/Diploma (code)
Usual Activity status (code)
(1) (2) (3) (4) (5) (6) (7) (8) (9) (10)010203040506070809101112
Codes for Block 4Col (3): Self-1, Spouse of head-2, Married child-3, Spouse of married child-4, Unmarried child-5, grandchild-6, Father/Mother/Father-in-law/Mother-in-law-7, Brother/Sister/Brother-in-law/Sister-in-law/other relatives-8Servants/employees/other non-relatives-9.Col (6): Never married-1,Currently married-2, Widowed-3, Divorced/separated-4.Col (8): Illiterate-1, Below primary-2, Primary (5thStd.)-3, Middle (8th Std.)-4, Secondary (10th Std.)-5,Higher secondary -6, Graduate (technical)-7, Graduate (non-technical)-8, Post graduate (technical)-9, Post graduate (non-technical)-10Col (9): Undergraduate level certificate-1, Undergraduate level diploma-2, Postgraduate level certificate-3, Postgraduate level diploma-4, Others-9Col (10): Self-employed own account worker-1, Self-employed employer-2, Unpaid family worker-3, Self-employed in Kudumbasree based production/service activities-4, Regular wage workerss-5, Kudumbasree based regular wage workers-6, Casual work-7, Kudumbasree based casual work-8, Seeking work-9, Student-10, Attending to domestic duties-11, Pensioner (employer)-12, Pensioner (EPFO)-13, Pensioner (Welfare Boards)-14, Pensioner (old age, etc.)-15, Renter-16, too young/too old-17, Others-19.

127
5. Water Sources and Maintenance
Sl. Water SourceNo: Characteristics Tube well Well Shallow
WellSpringCanal
Pond/
5.1 Existence of water source (Yes-1, No-2)5.2 Use of water source
Drinking & other purposes-1, Drinking only-2, Washing/bathing only-3, Gardening only-4, Gar-dening & washing/bathing-5, Not used-6
5.3 Lining of the sourceConcrete-1, Laterite-2, Laterite cutting-3, Not lined-4
X x x
5.4 Cement flooring around the sourceOver 1.0m wide-1, Less than 1.0m wide-2, No cement floor-3
x x
5.5 Parapet wallBrick/cement-1, Mud-2, No parapet-3
X x x
5.6 CoverCovered-1, No cover-2
X x x
5.7 Distance of the water source from any la-trineOver 5m-1, 3 to 5m-2, 2 to 3m-3, Less than 2m-4, No latrine-5
5.8
Distance of the water source from any cattle shedOver 5m-1, 3 to 5m-2, 2 to 3m-3, Less than 2m-4,No cattle shed-5
5.9
Distance of the water source from any waste dumpOver 5m-1, 3 to 5m-2, 2 to 3m-3, Less than 2m-4,No waste dump-5
5.10 Water quality-odourNo odour-1, Foul smell-2
5.11 Water quality-tasteNormal-1, Saltish-2, Others-3
5.12 Water quality-colourClear-1, Brownish-2, Muddy-3, Greenish-4, Others-5
5.13 Water quality-contaminationPure-1, Contaminated by solid waste-2, Contam-inated other wastes-3, Others-4
5.14 Water scarcityNo scarcity-1, Scarce in some months-2,Always scarce-3
5.15 Addition of bleaching powder/chlorinationFrequently done-1, Occasionally done-2, Never done-3
Appendix: 2 - Interview schedules

128
Role of Grama Panchayats in Waste Management and Environment Protection
6. Solid Waste Generation and Disposal
Sl.No:
Waste Item Generation & Disposal(Code)
Method of disposal(Code)
Periodicity
(1) (2) (3) (4) (5)6.1 Biodegradable waste6.11 Food waste6.12 Agricultural wastes6.13 Vegetable waste6.14 Fish & meat waste6.15 Paper & card board6.16 Threads & textiles6.17 Others6.2 Non-biodegradable waste6.21 Plastics6.22 Glass6.23 Metal6.24 Sanitary items6.25 Electrical items /E-waste6.26 Medical waste6.27 Others
Codes for Block 6Col(3): Not generated-1, Generated but not separated-2, Generated and separated-3Col (4):Throw within the compound-1, Throw outside the compound-2, Throw into water bodies-3, Dump on road corners-4, Bury underground-5, Burn-6, Make compost-7, Make biogas-8, Sell-9, Taken by waste collectors-10, Bio disposal-11,Other means-12Col (5): Daily-1, Alternate days-2, Weekly-3, Monthly-4, Once in a while-5
7. Institutional Arrangements for Solid Waste ManagementSl.No: Activity Status7.1 Arrangement for waste collection by local government
Exist-1, Does not exist-2
7.2 Dump yard for waste disposalExist-1, Does not exist-2
7.3 Incinerator for waste burningExist-1, Does not exist-2
7.4 Bio-gas plant assisted/set-up by the local governmentExist-1, Does not exist-2
7.5 Training courses on waste management by the local governmentOrganised periodically-1, Organised once in a while-2, Never-3
7.6 Plastic re-cycling plantExist-1, Does not exist-2
7.7 Other activities (Pl. specify……………………………….)Exist-1, Does not exist-2

129
8. Incidence of Water/Vector borne Diseases among Household Members in Last one Year
Sl.No Type of Disease No. of occurrence8.1 Diarrhea8.2 Jaundice (Hepatitis) 8.3 Typhoid8.4 Cholera8.5 Dengue, Chikun Guinea, Bird flu and other serious fevers8.6 Elephantiasis8.7 Skin infections8.8 Others (Please specify……………………………………..)
9. General Awareness Environment and Sanitation
Sl.No:
StatusYes-1, No-2
9.1 Clean environment is necessary for good health9.2 Waste dumps around the house and public places contaminate the air,
water and soil9.3 Disease spreading vectors like mosquitoes, flies, etc. breed in waste
dumps and still water. 9.4 Contamination of air, water and soil leads to severe diseases.9.5 Contamination of environment due to plastic waste is injurious to health.9.6 Burning of plastics releases toxic gases harmful to human life9.7 Plastics in soil reduces ground water recharging and leads to water scar-
city9.8 Total sanitation programme of the government and the activities under-
taken by the local body under the programme.9.9 Swachh Bharat Scheme and related activities
Appendix: 2 - Interview schedules

130
Role of Grama Panchayats in Waste Management and Environment Protection
10. Perceptions and Suggestions10.1. Is there noise pollution in your area? Yes-1, No-2 10.2. If yes, why do you think so?...........................................................................................10.3. Is there air pollution in your area? Yes-1, No-2 10.4. If yes, why do you think so?...........................................................................................10.5. Is there soil pollution in your area? Yes-1, No-2 10.6. If yes, why do you think so?...........................................................................................10.7. Is there water pollution in your area? Yes-1, No-2 10.8. If yes, why do you think so?...........................................................................................10.9. What are your suggestions for reducing noise, air, and soil and water pollution in your area? ………………………………………………………………………………………….10.10. What are your suggestions for keeping the environment clean in your area?........................................................................................................................................................................................................................................................10.11.Are you willing to participate in a waste management programme in your area? Yes-1, No-2 10.12. If yes, how much are you willing to pay per month?............
11. Operational AspectsSl. No. Item Details
11.1 Name of the enumerator11.2 Dates of visits in the household for survey 11.3 Name of supervisor11.4 Date of checking11.5 Date of scrutiny and coding 11.6 Name of data entry operator11.7 Date of data entry

131
4. Establishment Data ScheduleEstablishment/Institutional Survey on Waste Management
1. Identification Particulars 1.1 District 1.2 Panchayat1.3 Ward1.5 House/building bumber1.6 Sampling serial number1.7 Telephone number 1.8: Mobile number
2. Establishment/Institutional CharacteristicsSl.No: Item Particulars2.1 Name of the establishment/institution2.2 Name of the owner/operator/manager ( other than public institutions)2.3 Religionof the owner/operator (otherthan public institutions)
[Hindu-1, Christian-2, Muslim-3, Others-9]
2.4 Social group (otherthan public institutions) [ Scheduled Tribe-1, Scheduled Caste-2, Other Backward Classes-3, Others-9]
2.5 Building/Establishment[Owned-1, Hired-2, Rent free-3, Others-9]
2.6 Ownership of land by the establishment [Yes-1, No-2]
2.7 Type of land owned if ‘Yes’ to item 2.5[Establishment only-1,Establishment & other land-2, Other land only-3]
2.8 Size of the land (cents)2.9 Type of establishment/institution
Trading-2, Manufacturing-3, Health & education-4, Public buildings-5, Other establishments-6, Worship place-7
2.10 If trading establishment, describe the category General provision store-1, Mall-2, Hotel /tea shop-3,Vegetable shop-4, Meat and fish store-5, Textile shop-6, Foot wear shop-7, Electrical shop-8, Automobile repair shop-9, Other repair shop-10, Others-11
2.11 If manufacturing establishment, indicate the main item of manufacture
2.12 If health & education, indicate the category.Hospital-1, Clinic-2, Lab-3, Nursery school-4, Primary School-5, Middle School-6, Secondary/higher secondary school-7, College-8, Coaching centre-9, Others-10
2.13 If public building, indicate the office name2.14 If other establishments, indicate the category
Appendix: 2 - Interview schedules
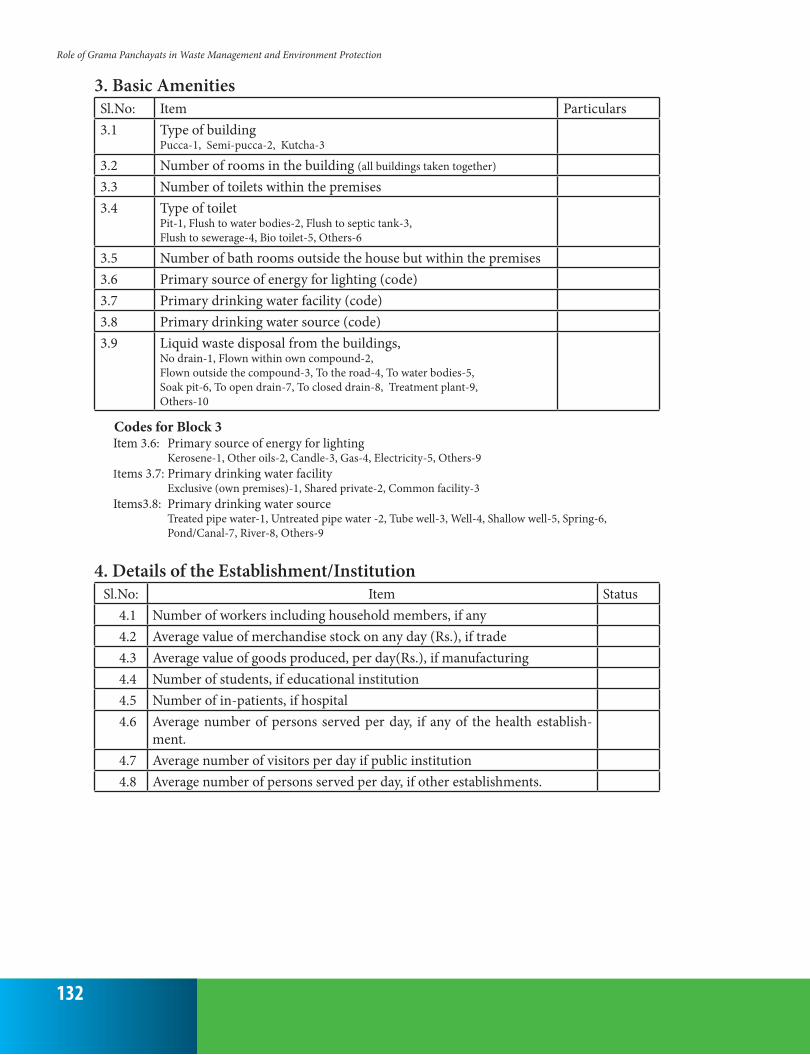
132
Role of Grama Panchayats in Waste Management and Environment Protection
3. Basic AmenitiesSl.No: Item Particulars3.1 Type of building
Pucca-1, Semi-pucca-2, Kutcha-3
3.2 Number of rooms in the building (all buildings taken together)
3.3 Number of toilets within the premises3.4 Type of toilet
Pit-1, Flush to water bodies-2, Flush to septic tank-3, Flush to sewerage-4, Bio toilet-5, Others-6
3.5 Number of bath rooms outside the house but within the premises3.6 Primary source of energy for lighting (code)3.7 Primary drinking water facility (code)3.8 Primary drinking water source (code)3.9 Liquid waste disposal from the buildings,
No drain-1, Flown within own compound-2, Flown outside the compound-3, To the road-4, To water bodies-5, Soak pit-6, To open drain-7, To closed drain-8, Treatment plant-9,Others-10
Codes for Block 3Item 3.6: Primary source of energy for lighting Kerosene-1, Other oils-2, Candle-3, Gas-4, Electricity-5, Others-9Items 3.7: Primary drinking water facility Exclusive (own premises)-1, Shared private-2, Common facility-3Items3.8: Primary drinking water source Treated pipe water-1, Untreated pipe water -2, Tube well-3, Well-4, Shallow well-5, Spring-6, Pond/Canal-7, River-8, Others-9
4. Details of the Establishment/Institution Sl.No: Item Status
4.1 Number of workers including household members, if any4.2 Average value of merchandise stock on any day (Rs.), if trade4.3 Average value of goods produced, per day(Rs.), if manufacturing4.4 Number of students, if educational institution4.5 Number of in-patients, if hospital4.6 Average number of persons served per day, if any of the health establish-
ment. 4.7 Average number of visitors per day if public institution4.8 Average number of persons served per day, if other establishments.

133
5. Water Sources Within the Premises and Maintenance
Sl.No: Characteristics Water SourceTube well Well Shallow
WellSpring Pond/
Canal5.1 Existence of water source (Yes-1, No-2)5.2 Use of water source
Drinking & other purposes-1, Drinking only-2, Washing/bathing only-3, Gardening only-4, Gardening & washing/bathing-5, Not used-6
5.3 Lining of the sourceConcrete-1, Laterite-2, Laterite cutting-3, Not lined-4
x x x
5.4 Cement flooring around the sourceOver 1.0m wide-1, Less than 1.0m wide-2,No cement floor-3
5.5 Parapet wallBrick/cement-1, Mud-2, No parapet-3
x x x
5.6 CoverCovered-1, No cover-2
x x x
5.7 Distance of the water source from latrineOver 5m-1, 3 to 5m-2, 2 to 3m-3, Less than 2m-4, No latrine-5
5.8 Distance of the water source from cattle shedOver 5m-1, 3 to 5m-2, 2 to 3m-3, Less than 2m-4, No cattle shed-5
5.9 Distance of the water source from waste dumpOver 5m-1, 3 to 5m-2, 2 to 3m-3, Less than 2m-4, No waste dump-5
5.10 Water quality-odourNo odour-1, Foul smell-2
5.11 Water quality-tasteNormal-1, Saltish-2, Others-3
5.12 Water quality-colourClear-1, Brownish-2, Muddy-3, Greenish-4, Others-5
5.13 Water quality-contaminationPure-1, Arsenic-2, Garbage-3, Bacteria-4, Others-5
5.14 Water scarcityNo scarcity-1, Scarce in some months-2, Always scarce-3
5.15 Addition of bleaching powder/chlorina-tionFrequently done-1, Occasionally done-2, Never done-3
Appendix: 2 - Interview schedules

134
Role of Grama Panchayats in Waste Management and Environment Protection
6. Solid Waste Generation and DisposalS l.No: Waste Item Generation & Dis-
posal (Code)Method of disposal Periodicity
(1) (2) (3) (4) (5)6.1 Bio-degradable waste6.1.1 Food waste6.1.2 Agricultural wastes6.1.3 Vegetable waste6.1.4 Fish & meat waste6.1.5 Paper & card board6.1.6 Threads & textiles6.1.7 Others6.2 Non-biodegradable waste6.2.1 Plastics6.2.2 Glass6.2.3 Metal6.2.4 Sanitary items6.2.5 Electrical items / E-waste6.2.6 Medical waste6.2.7 Others6.3 Industrial waste 6.3.1 Chemical effluents x6.3.2 Oil waste x6.3.3 Contaminated liquid x
Codes for Block 6Col (3): Not generated-1,Generated but not separated-2, Generated and separated-3Col (4): Throw within the compound-1, Throw outside the compound-2, Throw into water bodies-3, Dump on road corners-4, Bury underground-5, Burn-6, Make compost-7, Make biogas-8, Sell-9, Taken by waste collectors-10, Leach pit-11, Treatment plant-12, Bio disposal-13, Other means-14Col (5): Daily-1, Alternate days-2, Weekly-3, Monthly-4, Once in a while-5
7. Institutional Arrangements for Solid Waste ManagementSl.No: Activity Status7.1 Arrangement for waste collection by local government
Exist-1, Does not exist-2
7.2 Dump yard for waste disposalExist-1, Does not exist-2
7.3 Incinerator for waste burningExist-1, Does not exist-2
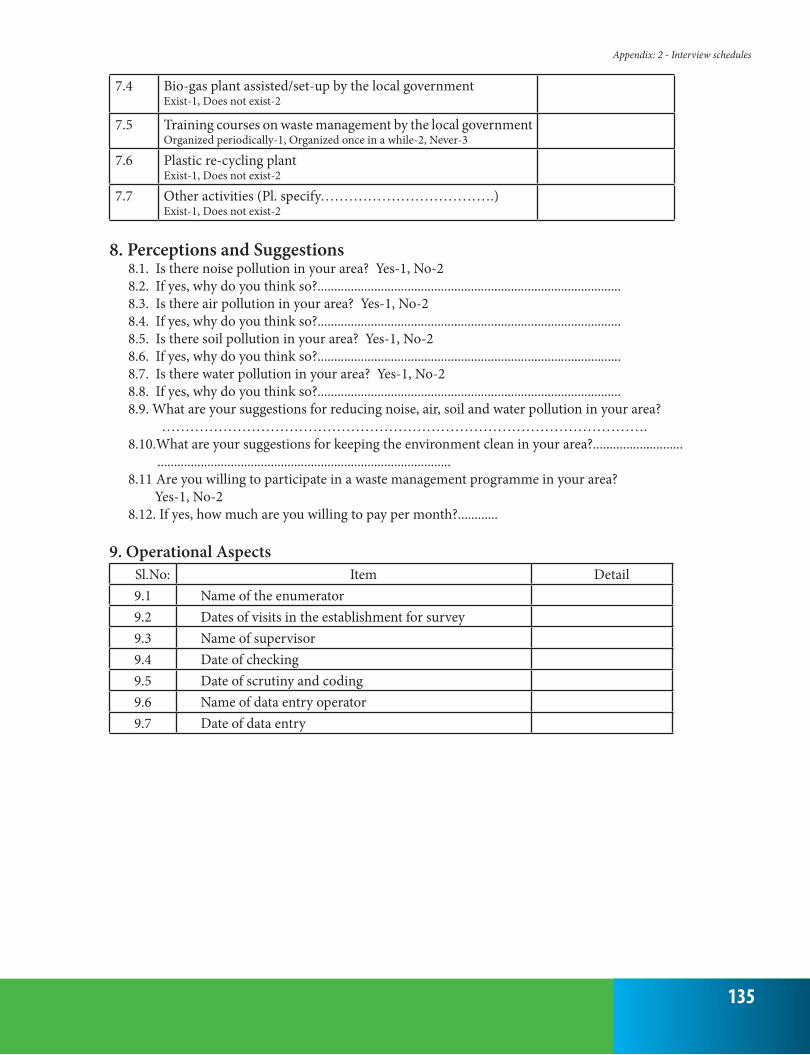
135
7.4 Bio-gas plant assisted/set-up by the local governmentExist-1, Does not exist-2
7.5 Training courses on waste management by the local governmentOrganized periodically-1, Organized once in a while-2, Never-3
7.6 Plastic re-cycling plantExist-1, Does not exist-2
7.7 Other activities (Pl. specify……………………………….)Exist-1, Does not exist-2
8. Perceptions and Suggestions8.1. Is there noise pollution in your area? Yes-1, No-2 8.2. If yes, why do you think so?........................................................................................... 8.3. Is there air pollution in your area? Yes-1, No-2 8.4. If yes, why do you think so?........................................................................................... 8.5. Is there soil pollution in your area? Yes-1, No-2 8.6. If yes, why do you think so?........................................................................................... 8.7. Is there water pollution in your area? Yes-1, No-2 8.8. If yes, why do you think so?........................................................................................... 8.9. What are your suggestions for reducing noise, air, soil and water pollution in your area? ………………………………………………………………………………………….8.10.What are your suggestions for keeping the environment clean in your area?........................... ........................................................................................ 8.11 Are you willing to participate in a waste management programme in your area? Yes-1, No-2 8.12. If yes, how much are you willing to pay per month?............
9. Operational AspectsSl.No: Item Detail9.1 Name of the enumerator9.2 Dates of visits in the establishment for survey 9.3 Name of supervisor9.4 Date of checking9.5 Date of scrutiny and coding 9.6 Name of data entry operator9.7 Date of data entry
Appendix: 2 - Interview schedules

136
Role of Grama Panchayats in Waste Management and Environment Protection
5. Waste Record- Each Day
Name:
Signature:
WardHouse No., Name and Address
First day Second day Third day
Waste mea-sure-ment
Sanitary napkin
Diaper Waste mea-sure-ment
Sanitary napkin
Diaper Waste mea-sure-ment
Sanitary napkin
Diaper
kg. no. no. kg. no. no. kg. no. no.

137
Appendix: 3
GLOSSARY
Afforestation: The establishment of forest cover on land not previously forested.
Air pollution: The condition in which air is contaminated by foreign substances
Biodegradable: A biodegradable substance is one that is easily decomposed by bacteria
Biodiversity: The variety and variability among living or-ganisms from all sources including, inter alia, terres-trial, marine.
Biogas: refers to a mixture of different gases produced by the breakdown of organic matter in the absence of oxygen.
Biological resources: These include genetic resources, or-ganisms or parts thereof, populations, or any other bi-otic component of ecosystems with actual or potential use or value for humanity.
Brackish water: Distastefully salty but less saline than sea-water (between 1,000 to 10,000 ppm [parts per mil-lion] in total dissolved solids [TDS].
Chlorination: Addition of chlorine to water, to kill certain microorganism and to oxidize organic contaminants.
Calorific value: The energy contained in a fuel or food, determined by measuring the heat produced by the complete combustion of a specified quantity of it. This is usually expressed in joules per kilogram.
Combustible waste: refers in this study to the organic content of solid waste; wood, boxes, excelsior, tex-tiles, bedding, leather, rubber, paints, yard trimmings, leaves, and household waste all of which will burn but excludes paper, cardboard, plastic.
Composting: is nature’s way of recycling. Composting bio-degrades organic waste.i.e.food waste, manure, leaves, grass trimmings, paper, wood, feathers, crop residue etc., and turns it into a valuable organic fertilizer.
Crematorium: A building where dead people’s bodies are burned, usually as part of a funeral ceremony.
Drought proofing: It means the capacity to meet the basic material and physical needs of the local population - human and animal - in a drought period so that there is minimal distress.
Ecosystem: any area or region regarded as a unit for eco-logical observation and study of the interrelationships between organisms and their environment.
Environment: includes water, air and land and the in-ter-relationship which exists among and between water, air and land, and human beings, other living creatures, plants, micro-organism and property.
Environmental Governance: means by which society de-termines and acts on goals and priorities related to the management of natural resources.
Environmental health: is the branch of public health that is concerned with all aspects of the natural and built environment that may affect human health.
Environmental hygiene: Refers to higiene of sanitation of the environment.
Environmental legislation: is a collection of many laws and regulations aimed at protecting the environment from harmful actions.
Environmental management: Control in the use of natu-ral resources and the implementation of measures to ensure their conservation, protection of habitats and

138
Role of Grama Panchayats in Waste Management and Environment Protection
control of hazards.
Environment pollution: means the presence of any envi-ronmental pollutant in the environment.
Environment project: Environment Projects refers in this study to projects of Grama Panchayats on protection of natural assets like soil, water, and waste manage-ment, sanitation, afforestation, bio diversity and the projects which are directly or indirectly related to en-vironment protection.
Environment Protection: is a practice of protecting the natural environment on individual, organizational or governmental levels, for the benefit of both the natural environment and humans.
Environmental sustainability: It can be defined as sus-tainability of the ecological services on which humans depend, directly and indirectly.
Externalities: An externality arises when the actions of an individual, firm or community affect the welfare of other individuals, firms or communities.
E-waste: is any refuse created by discarded electronic de-vices and components as well as substances involved in their manufacture or use.
Flood control: The technique or practice of preventing or controlling flood with dams, river, artificial channels etc.
Genetic resources (GRs): refer to genetic material of actu-al or potential value.
Groundwater: is the water found underground in the cracks and spaces in soil, sand and rock. It is stored in and moves slowly through geologic formations of soil, sand and rocks called aquifers.
Groundwater recharge: is a hydrologic process where wa-ter moves downward from surface water to ground-water.
Hazardous substances: Hazardous materials are those that could cause injury or death; or damage or pollute land, air, or water.
Human Development- is about expanding the richness of human life, rather than simply the richness of the economy in which human beings live. It is an approach that is focused on people and their opportunities and choices.
Intergenerational equity: is a concept that says that hu-mans hold the natural and cultural environment of the Earth in common both with other members of the
present generation and with other generations, past and future.
Liquid waste: It can be defined as such fluids as wastewa-ter, fats, oils or grease (FOG), used oil, and hazardous household liquids, to name a few.
Medical waste: These are numerous hazardous waste from hospitals, laboratories, medical clinic etc.
Micro irrigation: is defined as the frequent application of small quantities of water directly above and below the soil surface; usually as discrete drops, continuous drops or tiny streams through emitters placed along a water delivery line.
Municipal solid waste: includes commercial and residen-tial waste generated in notified municipal areas in either solid or semi-solid form excluding industrial hazardous waste but including treated bio-medical wastes.
Natural resources: Assets and flows of goods which are produced by nature rather than being human-made.
Noise pollution: is the disturbing or excessive noise that may harm the activity or balance of human or animal life.
Non-biodegradable: It describes substances that do not break down to a natural, environmentally safe condi-tion over time by biological processes.
Organic waste: is material that is biodegradable and comes from either a plant or animal.
Organic cultivation or organic farming: is a method of crop and livestock production that involves using or-ganic cultivation methods and choosing not to use pesticides, fertilizers, genetically modified organisms, antibiotics and growth hormones.
Panchayati Raj: government at the village and district level.
pH scale: This scale measures the degree of acidity of a particular substance, on a 0 to 14 scale. A measure of 14 indicates that the substance is extremely alkaline, while at the opposite end of the scale 0 indicates pure acid.
Plastic recycling: is the process of recovering scrap or waste plastic and reprocessing the material into use-ful products, sometimes completely different in form from their original state.
Pollution control: It is a term used in environmental man-agement. It means the control of emissions and efflu-ents into air, water or soil.

139
Polluter Pays Principle (PPP): The principle that the price of a good or service should include the cost of envi-ronmental damage that results from the production process.
Precautionary Principle (PP): Upholding the PP means that states agree to act with care when taking actions which may harm the environment. It implies that when the health of humans and the environment is at stake, it may not be necessary to wait for scientific cer-tainty to take protective action.
Public trust doctrine: The principle that certain natural and cultural resources are preserved for public use, and that the government owns and must protect and maintain these resources for the public’s use.
Rain-pit: Open pits dug in the ground which will fill with rainwater during the rainy season, enhance moisture in the soil, promote vegetative cover and recharge the underground aquifers.
Rainwater harvesting: is a technique of collection and storage of rainwater in natural reservoirs or tanks, or the infiltration of surface water into subsurface aqui-fers (before it is lost as surface runoff).
Resource mapping: A method for collating and plotting information on the occurrence, distribution, access and use of resources within the economic and cultural domain of a specific community.
Recycling: The re-use of natural resources or products de-rived from natural resources.
Regulations: These are government measures that explic-itly require or restrict specific actions on the part of individuals or firms in a country.
Renovation: The state of being restored to its former good condition.
Salinity: is the saltiness or dissolved salt content of a body of water.
Sanitation: is the hygienic means of promoting health through prevention of human contact with the haz-ards of wastes as well as the treatment and proper dis-posal of sewage or wastewater.
Segregation: It means the separation of the entire waste generated in to different waste groups according to the specific treatment and disposal requirements.
Septage: is a fluid mixture of untreated and partially treated sewage solids, liquids and sludge of human or domes-tic origin which is removed from a septic tank system.
Soak pit: also known as a soak away or leach pit, is a cov-ered, porous-walled chamber that allows water to slowly soak into the ground.
Social forestry: means the management and protection of forests and afforestation on barren lands with the pur-pose of helping in the environmental, social and rural development.
Soil conservation: is the prevention of soil from erosion or reduced fertility caused by overuse, acidification, sali-nization or other chemical contamination.
Soil fertility: refers to the ability of a soil to sustain plant growth, i.e. to provide plant habitat and result in last-ing constant yields of high quality.
Soil erosion: The stripping of topsoil by rain and wind. This is a common problem which has serious on crop productivity.
Soil pollution: is defined as the presence of materials in the soil which are harmful to the living beings when they cross their threshold concentration levels.
Solid waste: Waste products ranging from municipal re-fuse to industrial wastes. Solid waste also refers to sew-age sludge, agricultural waste, demolition wastes and mining residues.
Street sweeping: It is all material collected by the Govern-ment’s street sweepers/ vehicles and includes materi-als such as leaves, sand, gravel, silt, litter, minerals and inorganic compounds associated with road traffic and debris.
Storm water drainage: Drain system designed to drain excess rain and ground water from impervious surfac-es such as paved streets, car parks, parking lots, foot-paths, sidewalks, and roofs.
Surface water source: Surface water is water on the surface of the planet such as in a stream, river, lake, wetland, or ocean.
Sustainability: A broad definition of sustainability is the economic, social and environmental systems that gen-erate human wellbeing can be at least maintained over time.
Sustainable development: is defined as development that meets the needs of the present without compromis-ing the ability of future generations to meet their own needs.
Turbidity: is the cloudiness or haziness of a fluid caused by large numbers of individual particles that are generally invisible to the naked eye, similar to smoke in air. The
Appendix: 3 - Glossary

140
Role of Grama Panchayats in Waste Management and Environment Protection
measurement of turbidity is a key test of water quality.
Total sanitation programme: is a comprehensive pro-gramme to ensure sanitation facilities in rural areas with broader goal to eradicate the practice of open defecation, which was initiated in 1999.
Urban proximity: Panchayats sharing its border with at least one urban area (Municipality or Corporation). That implies close accessibility of establishments, in-stitutions and other infrastructural facilities in these rural areas.
Waste audit: is the process used to find out what sort of waste as well as what amount of waste is being pro-duced in particular period of time.
Waste disposal: Proper disposition of discarded or dis-charged material in accordance with local environ-mental guidelines or laws.
Waste dumping: Disposal of hazardous and other waste in the land or sea.
Waste management: The collection, transportation, and disposal of garbage, sewage, and other waste products.
Waste sorting: is the process by which waste is separated in to different elements.
Waste treatment: Biological, chemical or mechanical method employed to remove pollutant.
Water conservation: encompasses the policies, strategies and activities made to manage fresh water as a sustain-able resource, to protect the water environment, and to meet current and future human demand.
Watershed development: it refers to the conservation regen-eration and the judicious use of all the resources – natural (like land, water plants, animals) and human – within the watershed area.
Water pollution: is the contamination of water bodies like river, ocean etc.
Watershed: is the area of land that drains or sheds water in specific receiving water bodies such as lake, river.
Watershed management: is a term used to describe the process of implementing land use and water manage-ment practices to protect and improve the quality of water and other natural resources within watershed by managing the use of those land and water resources in a comprehensive manner.