
marine environment protection - Eduskunta
38
I:\MEPC\76\MEPC 76-7-5.docx E MARINE ENVIRONMENT PROTECTION COMMITTEE 76th session Agenda item 7 MEPC 76/7/5 10 March 2021 Original: ENGLISH Pre-session public release: ☒ REDUCTION OF GHG EMISSIONS FROM SHIPS Report of the Correspondence Group on the Development of Technical Guidelines on Carbon Intensity Reduction (TOR 2) Submitted by China, Japan and the European Commission SUMMARY Executive summary: This document provides the report of the Correspondence Group on the Development of Technical Guidelines on Carbon Intensity Reduction established at MEPC 75, on TOR 2 (the draft technical guidelines supporting the CII framework) Strategic direction, if applicable: 3 Output: 3.2 Action to be taken: Paragraph 42 Related documents: MEPC 75/18; MEPC 76/7/3, MEPC 76/7/4, MEPC 76/7/6, MEPC 76/INF.7, MEPC 76/INF.8, MEPC 76/INF.9 and MEPC 76/INF.10 Introduction 1 The seventy-fifth session of the Committee (MEPC 75) established a Correspondence Group on the Development of Technical Guidelines on Carbon Intensity Reduction, under the joint coordination of China, Japan and the European Commission. The overview of the Correspondence Group is provided in document MEPC 76/7/3 (China, Japan and the European Commission). 2 This document provides the report of the Correspondence Group on TOR 2 (draft technical guidelines supporting the CII framework). The summary of comments provided by the members on TOR 2 is provided in document MEPC 76/INF.8 (China, Japan and the European Commission). The Technical report on CII guidelines development (including Add.1 and Add.2) prepared by the coordinators is provided in document MEPC 76/INF.10 (China, Japan and the European Commission).
-
Upload
khangminh22 -
Category
Documents
-
view
0 -
download
0
Transcript of marine environment protection - Eduskunta

I:\MEPC\76\MEPC 76-7-5.docx
E
MARINE ENVIRONMENT PROTECTION COMMITTEE 76th session Agenda item 7
MEPC 76/7/5
10 March 2021 Original: ENGLISH
Pre-session public release: ☒
REDUCTION OF GHG EMISSIONS FROM SHIPS
Report of the Correspondence Group
on the Development of Technical Guidelines on Carbon Intensity Reduction (TOR 2)
Submitted by China, Japan and the European Commission
SUMMARY
Executive summary: This document provides the report of the Correspondence Group on the Development of Technical Guidelines on Carbon Intensity Reduction established at MEPC 75, on TOR 2 (the draft technical guidelines supporting the CII framework)
Strategic direction, if applicable:
3
Output: 3.2
Action to be taken: Paragraph 42
Related documents: MEPC 75/18; MEPC 76/7/3, MEPC 76/7/4, MEPC 76/7/6, MEPC 76/INF.7, MEPC 76/INF.8, MEPC 76/INF.9 and MEPC 76/INF.10
Introduction 1 The seventy-fifth session of the Committee (MEPC 75) established a Correspondence Group on the Development of Technical Guidelines on Carbon Intensity Reduction, under the joint coordination of China, Japan and the European Commission. The overview of the Correspondence Group is provided in document MEPC 76/7/3 (China, Japan and the European Commission). 2 This document provides the report of the Correspondence Group on TOR 2 (draft technical guidelines supporting the CII framework). The summary of comments provided by the members on TOR 2 is provided in document MEPC 76/INF.8 (China, Japan and the European Commission). The Technical report on CII guidelines development (including Add.1 and Add.2) prepared by the coordinators is provided in document MEPC 76/INF.10 (China, Japan and the European Commission).

MEPC 76/7/5 Page 2
I:\MEPC\76\MEPC 76-7-5.docx
Summary of discussion on TOR 2 (technical guidelines supporting the CII framework) TOR 2.1: Draft guidelines on operational carbon intensity indicators and the calculation methods (CII guidelines, G1) 3 The Group considered the draft guidelines on operational carbon intensity indicators and the calculation methods (G1), using the base document circulated by the coordinators. The base document was developed based on documents ISWG-GHG 7/2/21 (Brazil and China), ISWG-GHG 7/2/27 (Denmark, France and Germany) and ISWG-GHG 7/2/30 (China), with some refinements to reflect the views and proposals made at ISWG-GHG 7 and MEPC 75. Having thoroughly reviewed the base document, the following items were in particular considered and discussed:
.1 the formula of CII of individual ships, especially the proxies for transport work; .2 the need for and concrete proposals on introducing certain correction factors
and voyage exclusions; and .3 the CII of individual ships for trial purposes on a voluntary basis.
The formula of CII of individual ships, especially the proxies for transport work 4 The Group considered the carbon intensity metrics for use by individual ships. To ensure the consistent implementation of the short-term measure, the Group recognized that only one single metric should be taken as the mandatory CII for each and every ship type and the mandatory CII should be calculated on the basis of the Data Collection System (DCS). 5 In its most simple form, the attained annual operational CII of individual ships is calculated as the ratio of the total mass of CO2 emitted to the total transport work undertaken in a given calendar year. However, since the data on cargo/passenger on board a ship is not covered by the IMO DCS, the deadweight tonnage (DWT) or gross tonnage (GT) has to be taken as a proxy. For easy reference, the metric calculated as "CO2 emissions / (DWT×Distance travelled)" is referred to as AER, while the metric calculated as "CO2 emissions / (GT×Distance travelled)" is referred to as cgDIST. 6 In the discussion, an overwhelming majority of the members supported the use of AER for Bulk carriers, Gas carriers, Tankers, Container ships, General cargo ships, Refrigerated cargo carriers, Combination carriers, LNG carriers and ro-ro cargo ships (not vehicle carrier), and the use of cgDIST for Cruise passenger ships having non-conventional propulsion. For ro-ro cargo ships (vehicle carrier) and ro-ro passenger ships, a large majority of the members preferred to use cgDIST based on a number of justifications. As a result, cgDIST was chosen as the mandatory CII for Cruise passenger ships having non-conventional propulsion, ro-ro cargo ships (vehicle carrier) as well as ro-ro passenger ships in the draft G1, while AER was applied to all other ship types under consideration. The Group noted that some concrete technical justifications for the use of cgDIST for Ro-ro cargo ships (not vehicle carrier) were also provided and a document on comprehensive technical analysis undertaken for this segment may be submitted to the forthcoming ISWG-GHG 8 or MEPC 76 to facilitate further consideration. 7 In all the CII formulas specified in the draft G1, 100% of DWT or GT have been taken as a ship's capacity. In the discussion, there were divergent views on the use of 70% or 100% of DWT as the capacity to calculate the attained AER for container ships. Since this difference would only change the absolute metric value, without substantially changing the methods and results of the reference line, reduction factors as well as the rating bands, a large majority of the members supported to use 100% DWT. This choice was consistent with the CII formula of other ship types and could avoid the possible human errors in CII calculation.

MEPC 76/7/5 Page 3
I:\MEPC\76\MEPC 76-7-5.docx
The need for and concrete proposals on introducing certain correction factors and voyage exclusions 8 To ensure the comparability between ships of various design and operational features, the Group considered the need for and concrete proposals on introducing certain correction factors and voyage exclusions in CII calculation. Three categories of correction factors were discussed, namely the correction factors for ice-classed ships, for ships carrying refrigerated containers (reefers), and for ships with cargo heating/cooling systems or other cargo handling gears. The scenarios proposed to be excluded from the CII calculation included those specified in regulation 3.1 of MARPOL Annex VI, sailing in ice conditions, prolonged period without distance travelled, severe weather conditions, dynamic positioning (DP) operations as well as disproportionate fuel consumptions. Nevertheless, the Group shared a common view that which kind of corrections or exclusions would be introduced, data under the DCS should still be collected and reported pursuant to regulation 22A of MARPOL Annex VI. 9 Although extensive comments had been provided by the members throughout the three rounds on this matter, limited convergence was observed. The main reasons given to support correction factors or voyage exclusions were to create a level playing field and to deal with differences in CII values for ships that result from type of cargo carried (e.g. trade lanes with higher refrigerated container volumes). The main reasons given for rejecting correction factors or voyage exclusions included the possible biasness of the CII rating, the difficulties in verification of the data used for correction or exclusion, and the deviations of the corrected individual performance from the given reference lines which would be developed based on the IMO DCS data without any corrections. Besides, the members had different understandings on whether voyage exclusions that went beyond regulation 3.1 of MARPOL Annex VI should be considered in the guidelines or if they would need to be stipulated in MARPOL Annex VI. There was a slight majority favouring the use of the guidelines. Further, if voyage exclusions were however incorporated into guidelines, a large majority favoured having these exclusions in the G1 Guidelines rather than the SEEMP Guidelines. 10 Regarding the correction factors, the corrections for ice-classed ships were supported by a large majority of members, while the reefer and cargo maintenance/handling corrections were supported by a smaller majority. It was pointed out by some members that the correction factors should not be ship specific, e.g. reefer container correction should be for all ships not just container ships, heating/cooling correction should not be limited to tankers but extended to other ships. It was further suggested that correction factors for reefers and heating/cooling should start at 75% and reduce over time in order to incentivize energy efficiency improvements in the carriage of those types of cargo. One view expressed argued that all EEDI capacity correction factors were equally applicable to CII calculation, because AER was a capacity related indicator (using DWT). One member pointed out that the formulas used should cover the actual fuel consumption to preserve the basic reason for the correction factors, namely ships of same category with significant difference in operations could be related to same CII reference line. As a result, the Group included the correction factors for ice-classed ships in the draft G1 and put the other correction factors in the square brackets for further consideration.

MEPC 76/7/5 Page 4
I:\MEPC\76\MEPC 76-7-5.docx
11 Regarding the voyage exclusions, there was no objection to exclude the scenarios stipulated in regulation 3.1 of MARPOL Annex VI from the CII calculation, but concerns were expressed by some members regarding how the proposed exclusion related to regulation 3.1 should be drafted. A large majority of the members also supported the exclusion of voyages sailing in ice conditions, though different interpretations of this scenario were presented. For other scenarios, evenly split views were presented on the exclusions for severe weather conditions and DP operations, while a slight majority was against the introduction of exclusions for disproportionate fuel consumption. One member highlighted that the inclusion of port emissions in the CII for cruise industry may lead to ships with an intensity drop accompanying an absolute intensity rise. In the meanwhile, concerns on the ambiguous definition of the scenarios, the increased administrative burden, as well as the risk for abuse and difficulty in verification of conditions that qualify for exclusion were raised by some members. It was highlighted that the exclusions needed to be exceptional and irregular, or frequent occurrences would result in the exclusion of a large number of voyages. The concerns on possible overlap between the exclusions and the correction factors were also raised. There was an observation that the challenge for reefers, DP operations of shuttle tankers, as well as the disproportionate fuel consumptions for cargo maintenance (such as cargo heating, tank cleaning or refrigerating) may be more appropriate to be addressed by a correction factor rather than an exclusion. Since no clear convergence had been observed, the Group put all the scenarios beyond regulation 3.1 of MARPOL Annex VI in square brackets for further consideration by ISWG-GHG 8 or the Committee. 12 Given the list of the correction factors and voyage exclusions, the Group noted that correction factors and voyage exclusions should be considered through a comprehensive, transparent analysis, showing that the problem was best addressed through a ship-specific correction factor and/or voyage exclusion, if appropriate. The correction factors should be based on verifiable ship characteristics and application, and the voyage exclusion should be assessed subject to clear criteria and not create perverse incentives, with further consideration of whether such exclusions should be reflected in guidelines or should rather be in MARPOL Annex VI. The analysis should include an assessment of the impact of the correction factors and voyage exclusions in terms of carbon intensity reduction. This impact should be reflected in the reduction requirements for the specific segment or all segments, to ensure that the achievement of the ambitions would not be impaired. The CII of individual ships for trial purposes on a voluntary basis 13 In discussing the mandatory CII for individual ships, it was pointed out that the DWT or GT may not be the most suitable particular to represent the capacity of all ship types and both AER and cgDIST would punish a ship with higher payload utilization thus incentivizing lower loads and more ballast voyages (inefficient operations). Compared with DWT or GT, the number of available lower berths and the length of the lanes may be more appropriate to represent the capacity of a cruise passenger ship and a ro-ro ship, respectively. Compared with the total distance travelled, the use of laden distance in CII calculation may alleviate the biasness in AER and cgDIST. Besides, the energy efficiency operational indicator (EEOI) as defined in document MEPC.1/Circ.684 on Guidelines for voluntary use of the ship energy efficiency operational indicator (EEOI) had readily developed a set of metrics to indicate the CO2 emission per transport work. However, the reference lines and rating boundaries could not be developed on these metrics, due to the limitation of the current DCS. 14 To gain sufficient supporting data for decision-making in the review, the Group incorporated a set of trial CIIs in the draft G1 for use on a voluntary basis. It was recognized that a standardized reporting format and verification procedure for the additional voluntary data was needed for the sake of consistency, transparency and reliability. Since there was no mandate of this Group to consider the approaches for voluntarily collecting and reporting data beyond current IMO DCS for trial purposes, this issue was suggested to be further considered by ISWG-GHG 8 and the Committee.

MEPC 76/7/5 Page 5
I:\MEPC\76\MEPC 76-7-5.docx
Other comments/proposals on CII of individual ships 15 The Group noted that for certain ship types which frequently undertake various high fuel consuming operations, the introduction of correction factors or voyage exclusions may not help in addressing the unfair punishment in terms of CII rating. Neither such a challenge could be addressed by developing a more proper operational carbon intensity metric at this stage. In this regard, it was suggested by some members that the Statement of Compliance be amended to include space for comments to provide an opportunity for the ships to explain the inferior CII performance, but the attained CII and the CII ratings would not be changed. Given that this Group had no mandate to consider the amendments to the Statement of Compliance, this issue was suggested to be further considered by the Committee. Besides, the Group received a proposal for changing the names of various CIIs, which argued that the current names did not reflect the difference between the indicators and did not communicate well. In order to avoid confusions during the Group's consideration, this proposal was not taken forward by this Group, but may be considered at a later stage. Development of the draft guidelines on operational carbon intensity indicators and the calculation methods (CII guidelines, G1) 16 Following the discussion, the Group developed the draft guidelines on operational carbon intensity indicators and the calculation methods, as set out in annex 1 to this document. The following items, in particular, require further consideration by the forthcoming ISWG-GHG 8 and MEPC 76:
.1 the use of AER or cgDIST for ro-ro cargo ship (not vehicle carrier);
.2 the correction factors for ships carrying refrigerated containers (reefers), and for ships with cargo heating or cooling systems;
.3 the proposals for scenarios to be excluded from CII calculation beyond
regulation 3.1 of MARPOL Annex VI; .4 the approaches for voluntarily collecting and reporting data beyond current
IMO DCS for trial purposes; and .5 the possibility to amend the Statement of Compliance to include space for
comments to provide an opportunity for the ships to explain the inferior CII performance.
TOR 2.2: Draft guidelines on the reference lines for use with operational carbon intensity indicators (CII Reference line guidelines, G2) 17 The Group considered the draft guidelines on the reference lines for use with operational carbon intensity indicators (G2), using the base document circulated by the coordinators. The base document was developed based on documents ISWG-GHG 7/2/21, ISWG-GHG 7/2/27 and ISWG-GHG 7/2/30, with some refinements to reflect the views and proposals made at ISWG-GHG 7 and MEPC 75. The concrete results were calculated by the coordinators using the data in 2019 from the IMO DCS. The detailed information was provided in "Technical Report on CII Guidelines Development" and "Technical Report on CII Guidelines Development (Add.1)". In developing the reference lines, the following items were in particular considered and discussed:
.1 the methods and results of the reference lines; and .2 the need for and method to develop split (separate) reference lines.

MEPC 76/7/5 Page 6
I:\MEPC\76\MEPC 76-7-5.docx
The methods and results of the reference lines 18 In the base document, two methods were provided to develop the CII reference lines, namely "Option 1: Two-step approach" and "Option 2: Correction factor (K1) approach", both taking the year 2008 as reference. Although the "two-step approach" was initially supported by a larger majority of the Group, there was a big concern on the uncertainties in the data of yea 2008. Therefore, the first step, renamed as "one-step approach relative to 2019", was used by the Group, which built the CII reference lines only using the data in year 2019 from the DCS, thus avoiding a back-calculation to the year 2008. The median regression, rather than the lease square estimation, was applied in this method to estimate the parameters of the reference lines, due to its robustness to the outliers and the skewed distribution of the observations. It is important to note that this is just a methodological choice that concerns the setting of the gradient or slope (shape) and intercept (position) of the reference lines. This method will not change or have any implication on the levels of ambition set out in the Initial IMO GHG Strategy. 19 A large majority of the CG members supported the reference lines provided in the draft G2, which were calculated through the "one-step approach relative to 2019". In this draft document, the reference line for most ship types were developed as a single and continuous curve over ship capacity. To avoid significant biasness, split (separate) reference lines were developed for bulk carriers, general cargo ships, gas carriers and LNG carriers. For bulk carriers and general cargo ships, the reference lines followed different functions, but the regression curves kept continuous. For gas carriers and LNG carriers, a continuous regression line could hardly be made, due to the significant different distribution patterns of different size groups. 20 Some concerns were raised about the given method and the reference lines in the draft G2. One view was that ships of the same type and size may not be always comparable with each other due to their different design and operational features, but the data sets used to develop the reference lines lacked such details. Specifically, general cargo ships in the small ship segment may operate as a different ship type and should be given an option to use the reference lines of other ship types. Some members were concerned that discontinuous reference lines may create incentives to build slightly larger or smaller ships to reach a much more lenient reference level and reduction requirements. The need for and method to develop split (separate) reference lines 21 In developing the reference lines, a large majority of the members preferred to develop a single and continuous reference line for each ship type as far as technically possible. In the meanwhile, it was pointed out that if there was a fundamental difference in the performance related to the size segments, this should be reflected in the reference lines, such as the cases in the draft G2. Several members argued that a single and continuous reference line may not be able to capture the operational profiles of ships of different size ranges equally well and therefore the split (separate) reference lines should be considered for more ship types. 22 Some useful findings in exploring the split (separate) reference lines were provided, including the grouping strategies for gas carriers and ro-ro cargo ships. It was reiterated that High Speed Craft (HSC) should be classified as a separate sector in the DCS data set and be removed from the reference line of ro-ro passenger ships. Additionally, an assessment on several splits of the reference lines of ro-ro cargo and ro-ro passenger ships showed that most of them ended up with generating a new sub-set in which the "advantaged" and "disadvantaged" ships were simply redistributed, without improving the equity between ships. However, no concrete split (separate) reference lines were proposed based on these findings.

MEPC 76/7/5 Page 7
I:\MEPC\76\MEPC 76-7-5.docx
Development of the draft guidelines on the reference lines for use with operational carbon intensity indicators (CII Reference line guidelines, G2) 23 Following the discussion, the Group developed the draft guidelines on the reference lines for use with operational carbon intensity indicators (G2), as set out in annex 2 to this document. The following items, in particular, require further consideration by the forthcoming ISWG-GHG 8 and MEPC 76:
.1 the concrete reference lines provided in the draft G2, especially the split (separate) reference lines for gas carriers and LNG carriers; and
.2 the concrete proposals to develop additional split (separate) reference lines.
TOR 2.3: Draft guidelines on the operational carbon intensity reduction factors relative to reference lines (CII Reduction factor guidelines, G3) 24 The Group considered the draft guidelines on the operational carbon intensity reduction factors relative to reference lines (G3), using the base document circulated by the coordinators. The base document was developed based on documents ISWG-GHG 7/2/21, ISWG-GHG 7/2/27 and ISWG-GHG 7/2/30, with some refinements to reflect the views and proposals made at ISWG-GHG 7 and MEPC 75. The concrete results were calculated by the coordinators using the data in 2019 from the IMO DCS. The detailed steps were explained in "Technical Report on CII Guidelines Development (Add.2)". In developing the reduction factors, the following items were in particular considered and discussed:
.1 the measurement of the 2030 target and the already achieved carbon
intensity improvement; .2 the method to derive 2019 fleet average improvement relative to 2008; .3 the use of ship type specific or flat reduction factors; and .4 the concrete reduction factors for year 2030 and the trajectory of the required
carbon intensity reduction. The measurement of the 2030 target and the already achieved carbon intensity improvement 25 The carbon intensity of international shipping was referred to as "CO2 emissions per transport work as an average across international shipping" in the Initial IMO strategy on reduction of GHG emissions from ships, but the definition of "transport work" was not specified in that document. Based on different understandings of the "transport work", different measurements of the carbon intensity of international shipping would be derived. As shown in the Fourth IMO GHG Study 2020, in measuring the same carbon intensity improvement, the results were different when different metrics were applied. Therefore, different understandings of the "transport work" would lead to different calculated improvements already achieved and so as the different gaps of international shipping against the 2030 target. 26 Two types of measurements of the operational carbon intensity of international shipping were considered: one is referred to as "demand-based measurement" (or "Option 1A"), indicating the CO2 emissions per actual transport work of international shipping (similar to EEOI of individual ships); and the other one is referred to as "supply-based measurement" (or "Option 2A"), indicating the CO2 emissions per transport work proxy (similar to AER or cgDIST of individual ships). Given that no other data was available in year 2008, the

MEPC 76/7/5 Page 8
I:\MEPC\76\MEPC 76-7-5.docx
carbon intensity improvement already achieved by the international shipping in both measurements had to be estimated using data from the Third and Fourth IMO GHG Studies. According to the demand-based measurement, the carbon intensity of international shipping had improved by 31.8% in year 2018 relative to year 2008, while according to the supply-based measurement the improvement was 22.0%. The preferences of the members on the use of demand-based or supply-based measurement of 2030 target were divergent, but a small majority preferred the demand-based measurement. 27 The members who supported the demand-based measurement highlighted, inter alia, the following views:
.1 the "transport work" had been clearly defined in the EEOI guidelines (MEPC.1/Circ.684) based on the demand-based measurement. Since this was a formal document of the IMO that had specially provided a definition of "transport work", there was no reason to ignore this agreed understanding;
.2 the demand-based measurement was more meaningful than the supply-
based measurement in tracking the trajectory of the carbon intensity performance of the fleet, because the former could reflect the real performance while the latter would bias the already achieved improvement of international shipping thus yielding unrealistic gap against the 2030 target;
.3 the supply-based measurement of the 2030 target would actually punish
international shipping for the contribution in carbon intensity reduction already made by this industry;
.4 the supply-based metrics (AER or cgDIST) were supported to be used by
individual ships because of the limitation of the DCS, rather than for their inherent suitability. This should not be used to justify the supply-based measurement of carbon intensity of international shipping; and
.5 as provided in the Fourth IMO GHG Study 2020, in measuring the same
scale of improvement in carbon intensity, the result measured in AER was smaller than that measured in EEOI. This meant using AER for compliance would actually enable shipping to achieve a more ambitious target than the given gap. Therefore, although the carbon intensity gap against 2030 had been in demand-based measurement, it could still be applied by individual ships using supply-based metrics (AER or cgDIST) in 2023-2030, so as to be compatible with the IMO DCS and to actually achieve a larger improvement than the given requirement.
28 The members who supported the supply-based measurement highlighted, inter alia, the following views:
.1 the measurement of the achieved carbon intensity of international shipping should be consistent with the mandatory metrics (AER or cgDIST) of individual ships. A coherence between the different guidelines should be assured. Mixing different measurements in the method would be clearly inconsistent and would generate a high uncertainty on the final result;
.2 avoiding the mix of two different types of measurements and two different
CIIs (EEOI and AER/cgDIST) for achieving a unique level of ambition would ensure clarity, consistency and legitimacy of the system towards the general public;

MEPC 76/7/5 Page 9
I:\MEPC\76\MEPC 76-7-5.docx
.3 as there was no direct and stable relation between the EEOI and the AER, there was no justification in developing a reduction trajectory based on demand-based starting and ending points but using supply-based data for the implementation and monitoring of progress in the system. Using the demand-based measurement would only ensure the achievement of the level of ambition according to the "demand-based" definition of transport work;
.4 considering that the two ways to define and measure "transport work" were
equally legitimate, the Group should ensure that the level of ambition could be reached in both ways, i.e. using the most stringent one (the supply-based measurement). Besides, limiting the data sources and the complexity of this measure would facilitate the review to be conducted before 1 January 2026; and
.5 the 2008 AER values were more robust than the 2008 EEOI value: they were
internally consistent as the numerator and denominator (DWT-nm) were sourced in the same way. There was still scope for uncertainty, but if the size of the active fleet in 2008 was overestimated then both the fuel consumption and the DWT-nm would be high and so the uncertainty could cancel out. Moreover, the EEOI cargo data were not obtained with the same method for the period 2008-2011 and 2012-2018 periods. The uncertainty over cargo data should be estimated.
29 Having noted that the choice of demand-based or supply-based measurement of 2030 target was not only a technical issue, but also of a political nature, the reduction factors based on both measurements were kept in the draft G3 for further consideration by ISWG-GHG 8 and the Committee. The method to derive 2019 fleet average improvement relative to 2008 30 As the reference lines had been supported to be developed using the data in year 2019, the reduction factors were consequently set taking the year 2019 as reference. To ensure the equivalence between the reduction factors relative to year 2019 and relative to year 2008, the improvement already achieved by the international fleet in year 2019 relative to 2008 needed to be calculated. However, there was a gap in the Fourth IMO GHG Study 2020 modelled data for 2018 compared to 2019 IMO DCS results, no matter whether the demand-based or supply-based measurement would be used. Since the scope and data collection methods applied in the Fourth IMO GHG Study 2020 were inconsistent with those under IMO DCS, the results derived from the two sources could not be compared directly. Nevertheless, since the methodologies within the Third and Fourth IMO GHG Studies were very similar, the trend results between 2008 and 2018 could be compared. Therefore, the Group used the concept of adding the annual average improvement to the 2018 data to derive the 2019 fleet average improvement relative to 2008. Then, the scale of the gap against the 2030 target could be transformed taking year 2019 as reference. Following this method, the demand-based carbon intensity reduction achieved in year 2019 was estimated as 33.3% relative to year 2008 and thus the gap against the 2030 target was 10% relative to year 2019. Alternatively, the supply-based carbon intensity reduction achieved in year 2019 was estimated as 23.6% relative to year 2008 and thus the gap against the 2030 target was 16.4% relative to year 2019. One member highlighted that the discrepancy between DCS and the IMO GHG studies should be further investigated.

MEPC 76/7/5 Page 10
I:\MEPC\76\MEPC 76-7-5.docx
The use of ship type specific or flat reduction factors 31 Given the gap in carbon intensity improvement of the entire international shipping fleet against the 2030 target, there were two methodological approaches to assign the reduction factors to ship types. One approach was to assign ship-type specific reduction factors, taking into account the average annual reduction rate of the entire international shipping fleet, the relative carbon intensity level, the improvement already made, the uncertainties in the estimated achievement and the potential for further improvement of each ship type. The other approach was to use the average gap of international shipping against 2030 target as the uniform gap of each and every ship type (flat reduction factors). As the two approaches could be potentially applied in conjunction with either demand-based or supply-based measurement of 2030 target, there were actually four basic combinations to set the reduction factors of ship types, as follows:
.1 demand-based measurement of 2030 target combined with ship type specific reduction factors;
.2 demand-based measurement of 2030 target combined with flat reduction
factors; .3 supply-based measurement of 2030 target combined with ship type specific
reduction factors; and .4 supply-based measurement of 2030 target combined with flat reduction
factors.
32 The vast majority of the members who supported the demand-based measurement of the 2030 target indicated in the meanwhile a preference to use ship type specific reduction factors, while a small majority of the members who supported supply-based measurement of 2030 target preferred flat reduction factors. Even so, the rationale for the choice of ship type specific reduction factors or flat reduction factors was the same: i.e. for fairness. The members who preferred ship specific reduction highlighted that different ship types had achieved different carbon intensity improvements and would have different potential for further improvements. The target set out in the Initial IMO GHG Strategy was for international shipping as a whole, it would be unfair if a flat reduction factor was applied to all ship types regardless of the contribution already made and the capability for further improvement. The members who preferred the flat reduction factor highlighted that the achieved reductions per ship type were less certain and using these may end up with unfair or even impossible requirement on some ship types. 33 To streamline the discussion, the reduction factors assigned following combinations (1) and (4) were shown in the main body of the draft G3, while the reduction factors as well as the background information under the four combinations were all provided as appendixes. This does not mean that the choice of demand-based or supply-based measurement of the 2030 target is necessarily combined with the ship type specific reduction factors or the flat reduction factors. Rather, the concrete reduction factors under the two combinations in draft G3, which had been put in square brackets, were just provided as a starting point for further consideration by ISWG-GHG 8 and the Committee.

MEPC 76/7/5 Page 11
I:\MEPC\76\MEPC 76-7-5.docx
The concrete reduction factors for year 2030 and the trajectory of the required carbon intensity reduction 34 Regarding the reduction factors for year 2030, a large majority of the members were in support of the values as demonstrated in the draft G3 under their preferred combinations, or at least would take them as a starting point for further consideration. As cgDIST had been supported to be used as the mandatory CII for ro-ro cargo ships (vehicle carrier) and ro-ro-passenger ships, some members pointed out that the reduction factors should be updated accordingly to account for the economies of scale achieved in these ship categories since 2008, which would not be the case if consideration was limited to DWT. However, since GT had not been included in the 2008 data set in the Third IMO GHG Study 2014, the achieved carbon intensity improvement could hardly be calculated in cgDIST. Some members pointed out that the reduction factors should also take into account other levels of ambition as set out in the Initial IMO GHG Strategy, including the peaking and reduction of CO2 emissions. 35 Regarding the trajectory of the required carbon intensity reduction, the overwhelming majority supported a linear reduction throughout 2023 to 2030, while some members also indicated their openness to other options if proper justification could be given. The starting points of reduction factors for year 2023 as demonstrated in the draft G3 under the preferred combination were generally supported, but the concrete values may be adjusted subject to the finally agreed reduction factors for year 2030. Development of the draft guidelines on the operational carbon intensity reduction factors relative to reference lines (CII Reduction factor guidelines, G3) 36 Following the discussion, the Group developed the draft guidelines on the operational carbon intensity reduction factors relative to reference lines, as set out in annex 3 to this document. The following items, in particular, require further consideration by the forthcoming ISWG-GHG 8 and MEPC 76:
.1 the choice of demand-based (Option 1A) or supply-based (Option 2A) measurement of 2030 target and the already achieved carbon intensity improvement;
.2 the use of ship type specific or flat reduction factors; .3 the concrete reduction factors for year 2030; and .4 the average annual reduction factors for ship types and the starting points in
year 2023. TOR 2.4: Draft guidelines on the operational carbon intensity rating of ships (CII Rating Guidelines) 37 The Group considered the draft guidelines on the operational carbon intensity rating of ships (G4), using the base document circulated by the coordinators. The base document was developed based on documents ISWG-GHG 7/2/21, ISWG-GHG 7/2/27 and ISWG-GHG 7/2/30, with some refinements to reflect the views and proposals made at ISWG-GHG 7 and MEPC 75. The concrete results were calculated by the coordinators using the data in 2019 from the IMO DCS. The detailed information was provided in "Technical Report on CII Guidelines Development" and "Technical Report on CII Guidelines Development (Add.1)". In developing the operational carbon intensity rating of ships, the following items were in particular considered and discussed:

MEPC 76/7/5 Page 12
I:\MEPC\76\MEPC 76-7-5.docx
.1 The methods and results of the rating boundaries; and .2 The need and method to introduce size-dependent rating boundaries.
The methods and results of the rating boundaries 38 In the base document, two methods were provided to develop the rating boundaries, namely "Option 1: distribution approach" and "Option 2: variability approach". An overwhelming majority of the members showed a preference for Option 1, due to its rational distribution of having the largest proportion of ships classified as category C and its full dependence on the DCS. The other option was not preferred mainly because the bands representing the "middle performing" ships were too narrow, thus leading to much wider A and E bands. Following Option 2, the narrow bandwidth separating A from E would be easy to cross and ships would easily convert from A to E rating and vice versa. Therefore, "Option 1: distribution approach" was used by this Group to develop the rating boundaries. The concrete rating boundaries provided in the draft G4 were also supported to be taken as a starting point. The need and method to introduce size-dependent rating boundaries 39 In developing the rating boundaries, some members raised the concern that the CIIs showed a wide scatter for smaller size ships than for the larger size ships for certain ship types and therefore there was a need to develop size-dependent rating boundaries, ensuring a similar and consistent percentage of ships within a boundary regardless of DWT. Some potential approaches to set the size-dependent rating boundaries were presented, including the use of commercial size categories and the introduction of certain size-dependent correction parameters. However, a majority of the members did not support to further correct the rating boundaries by ship size, because the given method "Option 1: distribution approach" was in fact already size dependent. This had been clarified by the coordinators in their responses to the comments from the members, as well as in the presentation in the informal Q&A session. Some members did not oppose to further introduce the size-dependent corrections, but would prefer to do this at the review stage based on the experience acquired by then. Following the views of the majority, the Group did not further correct the rating boundaries by ship size. The Group noted that a concrete proposal on the size-dependent correction parameters for the rating boundaries of General cargo ships and Container ships of less than 20,000 DWT would be provided for further consideration by ISWG-GHG 8 and the Committee. Development of the draft guidelines on the operational carbon intensity rating of ships (CII Rating Guidelines, G4) 40 Following the discussion, the Group developed the draft guidelines on the operational carbon intensity rating of ships, as set out in annex 4 to this document. The following items, in particular, require further consideration by the forthcoming ISWG-GHG 8 and MEPC 76:
.1 the concrete rating boundaries provided in the draft G4; and .2 the concrete proposals on the size-dependent corrections for the given rating
boundaries. Other issues raised in the discussion 41 All the concrete results on the reference lines, reduction factors as well as the rating boundaries were calculated by the coordinators using the rounded data from the IMO DCS, where certain categorization errors were also detected. Therefore, there is a need to further
MEPC 76/7/5 Page 13
I:\MEPC\76\MEPC 76-7-5.docx
examine the data set and to validate the results using the original data without rounding. As the Parties to MARPOL Annex VI only have access the anonymous data after rounding, which makes such a validation impossible, the Secretariat has kindly offered to undertake this work and will provide the updated results to MEPC 76. Action requested of the Committee 42 The Committee is invited to:
.1 note the discussion at the Correspondence Group on the development of technical guidelines on carbon intensity reduction, on TOR 2 (technical guidelines supporting the CII framework), as summarized in this document; and
.2 consider, with a view to finalization and adoption at this session:
.1 the draft guidelines on operational carbon intensity indicators and the calculation methods (CII guidelines, G1), as set out in annex 1 (TOR 2.1);
.2 the draft guidelines on the reference lines for use with operational
carbon intensity indicators (CII Reference line guidelines, G2), as set out in annex 2 (TOR 2.2);
.3 the draft guidelines on the operational carbon intensity reduction
factors relative to reference lines (CII Reduction factor guidelines, G3), as set out in annex 3 (TOR 2.3); and
.4 the draft guidelines on the operational carbon intensity rating of
ships (CII Rating Guidelines, G4), as set out in annex 4 (TOR 2.4).
***


MEPC 76/7/5 Annex 1, page 1
I:\MEPC\76\MEPC 76-7-5.docx
ANNEX 1
DRAFT GUIDELINES ON OPERATIONAL CARBON INTENSITY INDICATORS AND THE CALCULATION METHODS (CII GUIDELINES, G1)
1 Introduction 1.1 In the Initial IMO Strategy on Reduction of GHG Emissions from Ships (resolution MEPC.304(72)), the level of ambition on carbon intensity of international shipping is quantified by the CO2 emissions per transport work, as an average across international shipping. 1.2 These Guidelines address the calculation methods and the applicability of the operational carbon intensity indictor (CII) for individual ships to which Chapter 4 of MARPOL Annex VI, as amended, apply. 2 Definitions 2.1 MARPOL means the International Convention for the Prevention of Pollution from Ships, 1973, as modified by the Protocols of 1978 and 1997 relating thereto, as amended. 2.2 IMO DCS means the data collection system for fuel oil consumption of ships referred to in regulation 22A and related provisions of MARPOL Annex VI. 2.3 For the purpose of these Guidelines, the definitions in MARPOL Annex VI, as amended, apply. [2.4 A refrigerated container or "reefer" is an intermodal shipping container that is refrigerated for the transportation of temperature-sensitive cargo.] 2.5 The metrics indicating the average CO2 emissions per transport work of a ship are generally referred to as operational carbon intensity indicator (CII) in these Guidelines.
.1 A specific CII calculated based on the actual or estimated mass or volume of the shipment carried on board a ship is generally referred to as demand-based CII; and
.2 A specific CII, in which calculation the capacity of a ship is taken as proxy of
the actual mass or volume of the shipment carried on board, is generally referred to as supply-based CII.
2.6 The supply-based CII which uses DWT as the capacity is referred to as AER, and the supply-based CII which uses GT as the capacity is referred to as cgDIST.

MEPC 76/7/5 Annex 1, page 2
I:\MEPC\76\MEPC 76-7-5.docx
3 Application 3.1 For all ships to which regulation 22B of MARPOL Annex VI applies, the operational carbon intensity indicators defined in section 4 should be applied. 3.2 The operational carbon intensity indicators defined in section 5 are encouraged to be additionally used by ships, where applicable, for trial purposes. 4 Operational carbon intensity indicator (CII) of individual ships for use in implementing regulation 22B of MARPOL Annex VI In its most simple form, the attained annual operational CII of individual ships is calculated as the ratio of the total mass of CO2 (M) emitted to the total transport work (W) undertaken in a given calendar year, as follows:
/shipattained CII M W= (1)
For certain ship types, one or more correction factors may be applied, as detailed in section 4.3.
[Note: the corrections factors would be incorporated into the CII formula after they are finally agreed upon.]
4.1 Mass of CO2 emissions (M) The total mass of CO2 is the sum of CO2 emissions (in grams) from all the fuel oil consumed on board a ship in a given calendar year, as follows:
( )jj j F
jM FC FE C= −∑ (2)
where:
j is the fuel oil type; jFC is the total mass (in grams) of consumed fuel oil of type j in the calendar
year, as reported under IMO DCS; jFE is the mass (in grams) of consumed fuel oil of type j which should be
excluded from CII calculation in accordance with section 4.4 [and which has been captured and stored rather than having been emitted to the atmosphere]; and
jFC represents the fuel oil mass to CO2 mass conversion factor for fuel oil type j
, in line with those specified in the 2018 Guidelines on the method of calculation of the attained EEDI for new ships (resolution MEPC.308(73)), as may be further amended.[ In case the type of the fuel oil is not covered by the guidelines, the conversion factor should be obtained from the fuel oil supplier supported by documentary evidence.]

MEPC 76/7/5 Annex 1, page 3
I:\MEPC\76\MEPC 76-7-5.docx
4.2 Transport work (W)
4.2.1 In absence of the data on actual transport work, the supply-based transport work (Ws) can be taken as a proxy, which is defined as the product of a ship's capacity and the distance travelled in a given calendar year, as follows:
Ws= C×(Dt - Dx) (3) where:
C represents the ship's capacity: - For bulk carriers, tankers, container ships, gas carriers, LNG carriers, [ro-ro
cargo ships], general cargo ships, refrigerated cargo carrier and combination carriers, deadweight tonnage (DWT)1 should be used as Capacity;
- For cruise passenger ships, ro-ro cargo ships (vehicle carriers) and ro-ro passenger ships gross tonnage (GT)2 should be used as Capacity;
Dt represents the total distance travelled (in nautical miles), as reported under IMO DCS; and
Dx represents distance travelled (in nautical miles) which should be excluded from CII calculation in accordance with section 4.4.
4.3 Correction factors
4.3.1 For ships with ice class, the following specific correction factors may be applied:
.1 capacity correction factor for ice-classed ships ( if ), as given in
paragraph 2.2.11.1 in the 2018 Guidelines on the method of calculation of the attained Energy Efficiency Design Index (EEDI) for new ships (see resolution MEPC.308(73)); and
.2 correction factor ( mf ), for ice-classed ships having IA Super and IA
or equivalent,3 as given in paragraph 2.2.19 of the 2018 Guidelines on the method of calculation of the attained Energy Efficiency Design Index (EEDI) for new ships as amended by resolution MEPC.322(74).
[4.3.2 For ships carrying refrigerated containers (reefers), the correction factors
specified in part A of appendix 1 to this document may be applied.]
1 Deadweight tonnage (DWT) means the difference in tonnes between the displacement of a ship in water of
relative density of 1025 kg/m3 at the summer load draught and the lightweight of the ship. The summer load draught should be taken as the maximum summer draught as certified in the stability booklet approved by the Administration or an organization recognized by it.
2 Gross tonnage (GT) should be calculated in accordance with the International Convention on Tonnage
Measurement of Ships, 1969. 3 For further information on approximate correspondence between ice classes, see HELCOM
Recommendation 25/7, which can be found at http://www.helcom.fi

MEPC 76/7/5 Annex 1, page 4
I:\MEPC\76\MEPC 76-7-5.docx
[4.3.3 For ships with cargo heating/cooling systems, or other cargo handling gears such as, but not limited to cranes, excavators, side loaders, the correction factors specified in part B of appendix 1 to this document may be applied.]
4.3.4 In case the above correction factors are applied, the ship should still report
total fuel oil consumption (t) of each type of fuel and other data to the Administration pursuant to regulation 22A of MARPOL Annex VI.
4.4 Voyage exclusions 4.4.1 The following scenarios should be excluded from the calculation of the
attained CII:
.1 scenarios specified in regulation 3.1 of MARPOL Annex VI, which may endanger safe navigation of a ship;
[.2 sailing in ice conditions, which means [sailing in a sea area within the ice
edge and the coastline, where the level ice thickness at the coastline is at least in the range of 15 [ ~ 30 ] cm and an ice class is required for the ship when sailing to or from a port in this area] [sailing in ice area] [ice concentration at least 40% and ice thickness at least 10 cm][ sailing and operating in ice/exceptional cold conditions];]
[.3 fuel consumption with no distance travelled for a prolonged period exceeding
[a cumulative number] [30 days] such as, but not limited to lay-up, drydock, operation as fuel storage unit, stop for technical repairs, or waiting time due to port congestion where time at anchor waiting for a berth exceeds [24] [48] [72] hours];]
[.4 sailing in sea states at or more severe than Bf[7];]
[.5 fuel consumption during dynamic positioning operations of shuttle tankers for
cargo loading at offshore locations and ship-to-ship transfer (STS) operations; and]
[.6 fuel consumption used for cargo maintenance (such as cargo heating, tank
cleaning or refrigerating) [accounting for more than [30%] of the total daily fuel consumption].]
[.6bis fuel consumption used for cargo maintenance (such as cargo heating, tank
cleaning or refrigerating) as specified in appendix 2 to this document.]
4.4.2 In case the above scenarios are excluded, the ship should still report following data for the excluded voyages or periods to the Administration pursuant to regulation 22A of MARPOL Annex VI:
.1 fuel oil consumption (t) by each type of fuel oils; .2 hours underway (h); .3 distance travelled (nm); and .4 reasons for the exclusions.

MEPC 76/7/5 Annex 1, page 5
I:\MEPC\76\MEPC 76-7-5.docx
5 Operational carbon intensity indicator (CII) of individual ships for trial purpose The following metrics are encouraged to be used for trial purposes, where applicable:
.1 Energy Efficiency Performance Indicator (EEPI)
- )l lx
MEEPIC D D
=×(
.2 cbDIST
- )t xALMcbD
BIST
D D=
×(
.3 clDIST
- )t x
MclDISTLanemeter D D
=×(
.4 EEOI, as defined in document MEPC.1/Circ.684 - Guidelines for voluntary
use of the ship energy efficiency operational indicator (EEOI). In the formulas above:
the mass of CO2 (M), the ship's capacity (C), the total distance travelled (Dt) and the distance travelled in voyages which should be excluded (Dx) are identical with those used to calculate the attained CII of individual ships, as specified in section 4.1 and 4.2;
Dl means the laden distance travelled (in nautical miles) when the ship is loaded; Dlx means the laden distance travelled (in nautical miles) when the ship is loaded
but should be excluded from the CII calculation in accordance with section 4.4; ALB means the number of available lower berths of a cruise passenger ship; and Lanemeter means the length (in metres) of the lanes of a ro-ro ship.
[Note: the corrections factors would be incorporated into the trial metrics, where applicable, after they are finally agreed upon.]

MEPC 76/7/5 Annex 1, page 6
I:\MEPC\76\MEPC 76-7-5.docx
[Appendix 1 Correction factors for use in CII calculation
Part A. Correction factors for reefers For ships carrying refrigerated containers (reefers), the following specific correction factors may be applied:
.1 For ships that have the ability to monitor reefer electrical consumption, the
ship may calculate container ship reefer kWh consumption as follows:
- kWh for cooling or heating of cargo on the vessel (reefer kWh) should be measured on the vessel by the kWh meter counter on the vessel and verified.
- Refrigerated container fuel oil consumption (FOCreefer) should be
calculated as:
𝐹𝐹𝐹𝐹𝐶𝐶𝑟𝑟𝑟𝑟𝑟𝑟𝑟𝑟𝑟𝑟𝑟𝑟 = (𝑟𝑟𝑟𝑟𝑟𝑟𝑟𝑟𝑟𝑟𝑟𝑟 𝑘𝑘𝑘𝑘ℎ) 𝑥𝑥 (𝑆𝑆𝐹𝐹𝐹𝐹𝐶𝐶 𝐴𝐴𝐴𝐴) - The following calculation should be used:
𝐶𝐶𝐶𝐶𝐶𝐶 = 𝐶𝐶𝑟𝑟 ×𝐹𝐹𝐹𝐹𝐶𝐶𝑡𝑡𝑡𝑡𝑡𝑡𝑡𝑡𝑡𝑡 − [0.75]𝐹𝐹𝐹𝐹𝐶𝐶𝑟𝑟𝑟𝑟𝑟𝑟𝑟𝑟𝑟𝑟𝑟𝑟
𝐷𝐷𝐶𝐶𝐷𝐷𝐷𝐷𝐷𝐷𝐷𝐷𝐷𝐷𝑟𝑟 × 𝐷𝐷𝑘𝑘𝐷𝐷
where: FOCreefer (Reefer fuel oil consumption) represents the estimated fuel
consumption attributed to in-use refrigerated containers carried.4 [75% of the] Total reefer consumption to be deducted from the ship's total annual fuel consumption.
FOCtotal represents the total fuel consumption of the ship over the declared period.
Cf represents the conversion factor between fuel consumption and CO2 emission (default value 3.114 g CO2 per tonne of fuel to be applied or appropriate carbon factor if using an alternative fuel).
SFOC AE (auxiliary engine) represents the specific fuel oil consumption associated with the relevant auxiliary engines [as per EEXI technical file].
.2 For ships that do not have the ability to monitor reefer electrical consumption, the ship may calculate container ship reefer kWh consumption as follows:
.1 In ports where shore-power is not used, the number of in-use
reefers at port should be calculated as:
𝐷𝐷𝐷𝐷𝐷𝐷𝐷𝐷𝑅𝑅𝑅𝑅,𝑝𝑝𝑡𝑡𝑟𝑟𝑡𝑡 = 𝑁𝑁𝑜𝑜𝑅𝑅 𝐴𝐴𝑟𝑟𝑟𝑟𝐶𝐶𝐴𝐴𝐷𝐷𝐴𝐴 + 𝑁𝑁𝑜𝑜𝑅𝑅 𝐷𝐷𝑟𝑟𝐷𝐷𝐷𝐷𝑟𝑟𝐷𝐷𝐷𝐷𝑟𝑟𝑟𝑟
2× 𝐷𝐷𝐷𝐷𝐷𝐷𝐷𝐷𝑝𝑝𝑡𝑡𝑟𝑟𝑡𝑡
𝐷𝐷𝐷𝐷𝐷𝐷𝐷𝐷𝑅𝑅𝑟𝑟,𝑝𝑝𝑡𝑡𝑟𝑟𝑡𝑡 = 𝑁𝑁𝑜𝑜𝑟𝑟 𝐴𝐴𝑟𝑟𝑟𝑟𝐶𝐶𝐴𝐴𝐷𝐷𝐴𝐴 + 𝑁𝑁𝑜𝑜𝑟𝑟 𝐷𝐷𝑟𝑟𝐷𝐷𝐷𝐷𝑟𝑟𝐷𝐷𝐷𝐷𝑟𝑟𝑟𝑟
2× 𝐷𝐷𝐷𝐷𝐷𝐷𝐷𝐷𝑝𝑝𝑡𝑡𝑟𝑟𝑡𝑡
4 The actual number of in-use reefers carried is documented in the Baplie file for auditing purposes.

MEPC 76/7/5 Annex 1, page 7
I:\MEPC\76\MEPC 76-7-5.docx
where: Days port represents… Days Rc, port represents the number of chilled in-use reefer days while
at port5 Days Rf, port represents the number of frozen in-use reefer days while
at port6 𝑁𝑁𝑜𝑜𝑅𝑅 𝐴𝐴𝑟𝑟𝑟𝑟𝐶𝐶𝐴𝐴𝐷𝐷𝐴𝐴 represents… 𝑁𝑁𝑜𝑜𝑅𝑅 𝐷𝐷𝑟𝑟𝐷𝐷𝐷𝐷𝑟𝑟𝐷𝐷𝐷𝐷𝑟𝑟𝑟𝑟 represents… 𝑁𝑁𝑜𝑜𝑟𝑟 𝐴𝐴𝑟𝑟𝑟𝑟𝐶𝐶𝐴𝐴𝐷𝐷𝐴𝐴 represents… 𝑁𝑁𝑜𝑜𝑟𝑟 𝐷𝐷𝑟𝑟𝐷𝐷𝐷𝐷𝑟𝑟𝐷𝐷𝐷𝐷𝑟𝑟𝑟𝑟 represents…
Then, total fuel consumption should be calculated as:
𝐹𝐹𝐹𝐹𝐶𝐶𝑟𝑟𝑟𝑟𝑟𝑟𝑟𝑟𝑟𝑟𝑟𝑟 = �(𝐶𝐶𝑥𝑥𝑅𝑅) �𝐷𝐷𝐷𝐷𝐷𝐷𝐷𝐷𝑅𝑅𝑅𝑅 × 24 ℎ𝑟𝑟𝐷𝐷𝑑𝑑𝐷𝐷𝐷𝐷
� (𝑆𝑆𝐹𝐹𝐹𝐹𝐶𝐶𝐴𝐴𝐴𝐴)�
+ ��𝐶𝐶𝑥𝑥𝑟𝑟� �𝐷𝐷𝐷𝐷𝐷𝐷𝐷𝐷𝑅𝑅𝑟𝑟 × 24 ℎ𝑟𝑟𝐷𝐷𝑑𝑑𝐷𝐷𝐷𝐷
� (𝑆𝑆𝐹𝐹𝐹𝐹𝐶𝐶𝐴𝐴𝐴𝐴)�
+ ���𝐷𝐷𝐷𝐷𝐷𝐷𝐷𝐷𝑅𝑅𝑅𝑅,𝑝𝑝𝑡𝑡𝑟𝑟𝑡𝑡 × 𝐶𝐶𝑥𝑥𝑅𝑅
+ 𝐷𝐷𝐷𝐷𝐷𝐷𝐷𝐷𝑅𝑅𝑟𝑟,𝑝𝑝𝑡𝑡𝑟𝑟𝑡𝑡 × 𝐶𝐶𝑥𝑥𝑟𝑟� �24 ℎ𝑟𝑟𝐷𝐷𝑑𝑑𝐷𝐷𝐷𝐷
� (𝑆𝑆𝐹𝐹𝐹𝐹𝐶𝐶𝐴𝐴𝐴𝐴)�
𝐶𝐶𝐶𝐶𝐶𝐶 = 𝐶𝐶𝑟𝑟 ×𝐹𝐹𝐹𝐹𝐶𝐶𝑡𝑡𝑡𝑡𝑡𝑡𝑡𝑡𝑡𝑡 − [0.75]𝐹𝐹𝐹𝐹𝐶𝐶𝑟𝑟𝑟𝑟𝑟𝑟𝑟𝑟𝑟𝑟𝑟𝑟
𝐷𝐷𝐶𝐶𝐷𝐷𝐷𝐷𝐷𝐷𝐷𝐷𝐷𝐷𝑟𝑟 × 𝐷𝐷𝑘𝑘𝐷𝐷
where: FOCreefer (Reefer fuel oil consumption) represents the estimated fuel
consumption attributed to in-use refrigerated containers carried.7 [75% of the] total reefer consumption to be deducted from the ship's total annual fuel consumption.
FOCtotal represents the total fuel consumption of the ship over the declared period
Cxc represents the in-use chilled reefer consumption (5.8 kW average value suggested).
Cxf represents the in-use frozen reefer consumption (4.0 kW average value suggested).
Days Rc represents the number of chilled in-use reefer-days over the declared period.
Days Rf represents the number of frozen in-use reefer-days over the declared period.
.3 For ships for which this correction factor is applied, the fraction of FOCreefer
which may be deducted starts at [75%] and is reduced by [3%] per year (stimulating the improvement of reefer efficiency and stimulating the use of shore power for this purpose).
5 The number of reefers onboard while in port, should be calculated to equal the number of reefers at arrival
and at departure as calculated above. Same calculation applies for Days Rc in port and Days Rf in port. 6 Ibid.
7 The actual number of in-use reefers carried is documented in the Baplie file for auditing purposes.

MEPC 76/7/5 Annex 1, page 8
I:\MEPC\76\MEPC 76-7-5.docx
Part B. Correction factors for ships with cargo heating/cooling systems or other cargo handling gears 1 For tankers with cargo heating or cooling systems, the following specific correction factors may be applied for the period that the cargo heating, cargo cooling or tank washing systems are in operation:
.1 For tankers that have the ability to monitor boiler/cooling fuel/energy consumption during cargo heating, cooling or tank washing operation, the ship may calculate cargo heating or cooling and tank washing fuel consumption as follows:
- Fuel consumption by the boilers during cargo heating, cooling and tank
washing operation (FOCboiler) or energy consumption (kWh meter counter) of the cooling system should be measured on the vessel by accepted means and verified.
- As the boilers are assumed to be not only used for tank heating, cooling
and tank washing, but also for heating of bunkers, etc., 75% of the boiler fuel consumption (FOCboiler) is to be taken into account.
- The following calculation should be used:
Cii =Cf×(FOCtotal-(FOCboiler×[0.75]))/(Distance × DWT) where: FOCboilers (Boiler fuel oil consumption) represents the measured total fuel
consumption attributed to in-use boilers or cooling during cargo heating, cooling or tank washing operation. 75% of the total boiler fuel consumption during cargo heating, cooling or tank washing operation to be deducted from the ship's total annual fuel consumption.
FOCtotal represents the total fuel consumption of the ship over the declared period.
Cf represents the conversion factor between fuel consumption and CO2 emission (default value 3.114 g CO2 per tonne of fuel to be applied or appropriate carbon factor if using an alternative fuel).
.2 For tankers for which this correction factor is applied, the fraction of FOCboiler
which may be deducted starts at [75%] and is reduced by [3%] per year (stimulating the improvement of cargo tank heating, cooling and tank washing efficiency).
2 For ships, excluding tankers, having cargo handling gear such as, but not limited to cranes, excavators, side loaders etc., the following specific correction factors may be applied:
.1 For ships that have the ability to monitor cargo handling gear electrical consumption, the ship may calculate cargo handling gear kWh consumption as follows:
- kWh for cargo handling on the vessel (Cargo handling kWh) should be
measured on the vessel by the kWh meter counter on the vessel and verified.

MEPC 76/7/5 Annex 1, page 9
I:\MEPC\76\MEPC 76-7-5.docx
- Cargo handling fuel oil consumption (FOCcargohandling) should be calculated as:
FOCcargohandling=(Cargo handling kWh) x (SFOC AE)
- The following calculation should be used:
Cii =Cf×(FOC total-(FOC cargohandling x [0.75]))/(Distance × DWT) where: FOCcargohandling (Cargo handling fuel oil consumption) represents the
estimated fuel consumption attributed to in-use cargo handling gear. [75%] of the total cargo handling gear fuel consumption to be deducted from the ship's total annual fuel consumption. Cargo handling gear that is operated on shore power should not be deducted from Cii.
FOCtotal represents the total fuel consumption of the ship over the declared period.
Cf represents the conversion factor between fuel consumption and CO2 emission (default value 3.114 g CO2 per tonne of fuel to be applied or appropriate carbon factor if using an alternative fuel).
SFOCAE (auxiliary engine) represents the specific fuel oil consumption associated with the relevant auxiliary engines [as per EEXI technical file].
.2 For ships that do not have the ability to monitor cargo handling electrical consumption, the ship may calculate cargo handling kWh consumption as follows:
FOCcargohandling=(Load factor) x Pinstalled x (running hours) x (SFOCAE) where:
Load factor represents the average power usage of the cargo handling gear and to be taken as 0.60.
Pinstalled is the installed power of the specific cargo handling gear, as specified by the manufacturer.
Running hours is the actual number of hours the cargo handling gear has been in use over the past year.
FOCcargohandling can then be used in the formula under [4.3.4.1.3] to calculate the CII of the ship.
.3 For ships for which this correction factor is applied, the fraction of FOCcargohandling which may be deducted starts at [75%] and is reduced by [3%] per year (stimulating the improvement of cargo handling, cargo handling gear efficiency and stimulating the use of shore power for this purpose).

MEPC 76/7/5 Annex 1, page 10
I:\MEPC\76\MEPC 76-7-5.docx
Appendix 2
Fuel used for operational purposes of tankers to be excluded from CII calculation
1 Tankers required to use cargo heating or cooling systems should:
.1 Monitor and record all fuel used in systems providing the required heating and/or cooling of the cargo.
.2 Subtract the fuel used for heating and/or cooling systems such that it is an
excluded fuel mass when performing the yearly mass of CO2 emissions calculations.
2 Tankers using cargo heating systems and other ship equipment to clean cargo tanks should:
.1 Monitor and record all fuel used in systems affecting the tank cleaning operations.
.2 Subtract the fuel used for tank cleaning operations such that it is an excluded
fuel mass when performing the yearly mass of CO2 emissions calculations.
3 Tankers using nitrogen and/or inert gas systems for cargo integrity/safety where the nitrogen and/or inert gas system relies upon marine fuel to generate the resulting gas should:
.1 Monitor and record all fuel used in systems used to generate nitrogen and/or inert gas.
.2 Subtract the fuel used for generating nitrogen and/or inert gas such that it is
an excluded fuel mass when performing the yearly mass of CO2 emissions calculations.]
***
MEPC 76/7/5 Annex 2, page 1
I:\MEPC\76\MEPC 76-7-5.docx
ANNEX 2
DRAFT GUIDELINES ON THE REFERENCE LINES FOR USE WITH OPERATIONAL CARBON INTENSITY INDICATORS (CII REFERENCE LINE GUIDELINES, G2)
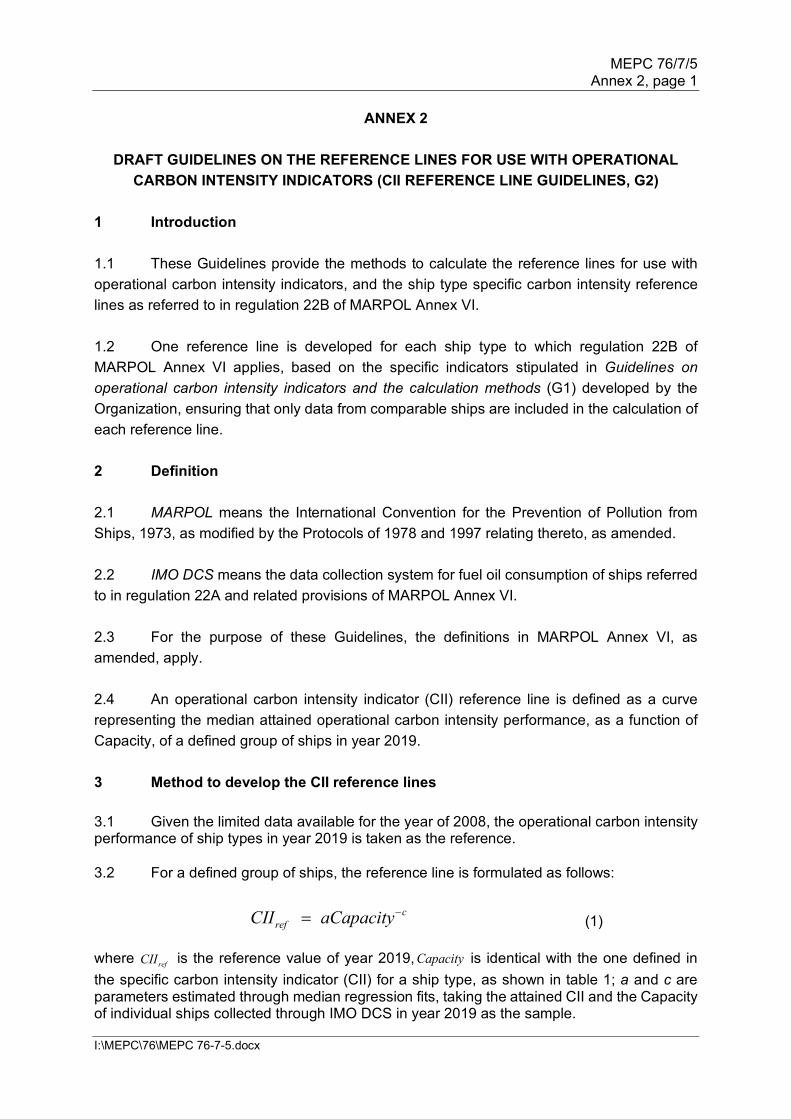
1 Introduction 1.1 These Guidelines provide the methods to calculate the reference lines for use with operational carbon intensity indicators, and the ship type specific carbon intensity reference lines as referred to in regulation 22B of MARPOL Annex VI. 1.2 One reference line is developed for each ship type to which regulation 22B of MARPOL Annex VI applies, based on the specific indicators stipulated in Guidelines on operational carbon intensity indicators and the calculation methods (G1) developed by the Organization, ensuring that only data from comparable ships are included in the calculation of each reference line. 2 Definition 2.1 MARPOL means the International Convention for the Prevention of Pollution from Ships, 1973, as modified by the Protocols of 1978 and 1997 relating thereto, as amended. 2.2 IMO DCS means the data collection system for fuel oil consumption of ships referred to in regulation 22A and related provisions of MARPOL Annex VI. 2.3 For the purpose of these Guidelines, the definitions in MARPOL Annex VI, as amended, apply. 2.4 An operational carbon intensity indicator (CII) reference line is defined as a curve representing the median attained operational carbon intensity performance, as a function of Capacity, of a defined group of ships in year 2019. 3 Method to develop the CII reference lines 3.1 Given the limited data available for the year of 2008, the operational carbon intensity performance of ship types in year 2019 is taken as the reference. 3.2 For a defined group of ships, the reference line is formulated as follows:
crefCII aCapacity−= (1)
where refCII is the reference value of year 2019, Capacity is identical with the one defined in the specific carbon intensity indicator (CII) for a ship type, as shown in table 1; a and c are parameters estimated through median regression fits, taking the attained CII and the Capacity of individual ships collected through IMO DCS in year 2019 as the sample.

MEPC 76/7/5 Annex 2, page 2
I:\MEPC\76\MEPC 76-7-5.docx
4 Ship type specific operational carbon intensity reference lines The parameters for determining the ship type specific reference lines, for use in Eq.(1), are specified as follows:
Table 1: Parameters for determining the 2019 ship type specific reference lines Ship type Capacity a c
Bulk carrier 279,000 DWT and above 279,000 4977 0.626
less than 279,000 DWT DWT 4977 0.626
Gas carrier 65,000 and above DWT 2384E7 1.910
less than 65,000 DWT DWT 8032 0.638
Tanker DWT 5118 0.607
Container ship DWT 1963 0.487
General cargo ship 20,000 DWT and above DWT 61293 0.854
less than 20,000 DWT DWT 361 0.336
Refrigerated cargo carrier DWT 6736 0.599
Combination carrier DWT 151991 0.930 LNG carrier 100,000 DWT and above DWT 9.860 0
65,000 DWT and above, but less than 100,000 DWT DWT 1966E10 2.498
less than 65,000 DWT 65,000 1966E10 2.498
Ro-ro cargo ship (vehicle carrier) GT 5831 0.633
Ro-ro cargo ship [DWT] [15958] [0.677]
Ro-ro passenger ship GT 7691 0.586
Cruise passenger ship having non-conventional propulsion GT 904 0.380
***

MEPC 76/7/5 Annex 3, page 3
I:\MEPC\76\MEPC 76-7-5.docx
ANNEX 3
DRAFT GUIDELINES ON THE OPERATIONAL CARBON INTENSITY REDUCTION FACTORS RELATIVE TO REFERENCE LINES (CII REDUCTION FACTOR GUIDELINES, G3)
1 Introduction 1.1 These guidelines provide the methods to determine the annual operational carbon intensity reduction factors and their concrete values from year 2023 to 2030, as referred to in regulation 22B of MARPOL Annex VI. 1.2 The annual operational carbon intensity reduction factors are determined for each ship type to which regulation 22B of MARPOL Annex VI applies, in a transparent and robust manner, based on the specific carbon intensity indicators stipulated in the Guidelines on operational carbon intensity indicators and the calculation methods (G1) and the reference lines developed in the Guidelines on the reference lines for use with operational carbon intensity indicators (G2) developed by the Organization. 1.3 The reduction factors of ship types have been set at the levels to ensure that, in combination with other relevant requirements of MARPOL Annex VI, the reduction in CO2 emissions per transport work by at least 40% by 2030, compared to 2008, can be achieved as an average across international shipping. 2 Definitions 2.1 MARPOL means the International Convention for the Prevention of Pollution from Ships, 1973, as modified by the Protocols of 1978 and 1997 relating thereto, as amended. 2.2 IMO DCS means the data collection system for fuel oil consumption of ships referred to in regulation 22A and related provisions of MARPOL Annex VI. 2.3 For the purpose of these Guidelines, the definitions in MARPOL Annex VI, as amended, apply. 2.4 The annual operational carbon intensity reduction factor, generally denoted as "Z" in regulation 22B of MARPOL Annex VI, is a positive value, stipulating the percentage points of the required annual operational carbon intensity indicator of a ship for a given year lower than the reference value. 3 Method to determine the annual reduction factor of ship types 3.1 Operational carbon intensity of international shipping Given significant heterogeneity across ship types, the attained annual operational CII of international shipping as a whole is calculated as the ratio of the aggregated mass (in grams) of CO2 ( aggregated M ) emitted to the aggregated mass (in tonnenmiles) of transport work ( aggregated W ) undertaken by all individual ships of representative ship types in a given calendar year, as follows:
/ shippingattained CII aggregated M aggregated W= (4)

MEPC 76/7/5 Annex 3, page 4
I:\MEPC\76\MEPC 76-7-5.docx
In absence of the data on actual annual transport work of individual ships, the aggregated transport work obtained from other reliable sources, such as UNCTAD, can be taken as approximation. The representative ship types refer to bulk carriers, gas carriers, tankers, container ships, general cargo ships, refrigerated cargo carrier and LNG carriers, as per the Fourth IMO GHG Study 2020. 3.2 The achieved carbon intensity reduction in international shipping
.1 For a given year y , the achieved carbon intensity reduction in international shipping relative to the reference year refy , denoted as ,shipping yR , can be calculated as follows:
, , , ,=100% ( ) /
ref refshipping y shipping y shipping y shipping yR attained CII attained CII attained CII× − (5) where the ,shipping yattained CII and , refshipping yattained CII represents the attained annual operational carbon intensity of international shipping in year y and in the reference year refy , as defined in Eq.(1). .2 The achieved carbon intensity reduction in international shipping can be
alternatively calculated on the carbon intensity performance of ship types. Since CII metrics for different ship types may not be identical, the weighted average of the carbon intensity reduction achieved by ship types can be applied, as follows:
, , ,shipping y type y type y
typeR f R= ∑ (6)
In Eq(3),
type represents the ship type; ,type yf is the weight, which is equal to the proportion of CO2 emitted by the ship
type to the total CO2 emissions of international shipping in year y ; and ,type yR represents the carbon intensity reduction achieved by the ship type in year
y , calculated as , , , ,=100% ( ) / ref reftype y type y type y type yR attained CII attained CII attained CII× − ,
where the ,type yattained CII and ,type refattained CII represents the attained annual operational carbon intensity of the ship type in year y and in the reference year
refy , as defined in Eq.(4), as follows:
, , /type ship t ship tship ship
attained CII M W= ∑ ∑ (7)
where:
,ship tM and ,ship tW represents the total mass of CO2 emitted from and the total transport work undertaken by a ship of this type in a given calendar year, as stipulated in the Guidelines on operational carbon intensity indicators and the calculation methods (G1).

MEPC 76/7/5 Annex 3, page 5
I:\MEPC\76\MEPC 76-7-5.docx
3.3 Rational ranges of reduction factors of ship types in year 2030
.1 In the Initial IMO Strategy on Reduction of GHG Emissions from Ships (resolution MEPC.304(72)), the levels of ambition on carbon intensity of international shipping have been set taking year 2008 as reference. The carbon intensity of international shipping in year 2008, as well as the improvement through 2012 to 2018, has been estimated in the Fourth IMO GHG Study 2020. However, since the scope and data collection methods applied in the Fourth IMO GHG Study 2020 were inconsistent with those under IMO DCS, the results derived from the two sources cannot be compared directly.
.2 To ensure the comparability of the attained carbon intensity of international
shipping through year 2023 to 2030 with the reference line, the following methods are applied to calculate the equivalent carbon intensity target in year 2030 ( ,2030shippingeR ), taking year 2019 as reference, i.e. how much additional improvement is needed by 2030 from the 2019 performance level.
- The achieved carbon intensity reduction of international shipping in year
2019 relative to year 2008 ( ,2019shippingR ) can be estimated as the sum of the achieved carbon intensity reduction of international shipping in year 2018 relative to year 2008 ( ,2018shippingR ) as given by the Fourth IMO GHG Study 2020 and the estimated average annual improvement during 2012 and 2018 ( shippingr ), as follows:
,2019 ,2018=shipping shipping shippingR R r+ (8)
[ Option 1A: Demand-based measurement of 2030 target As estimated by the Fourth IMO GHG Study 2020, the attained CII of international shipping (on aggregated demand-based metric) has reduced by 31.8% ( ,2018 =31.8%shippingR ) compared to 2008, with an estimated average annual improvement at 1.5 percentage points ( =1.5%shippingr ). In accordance with Eq.(5), the carbon intensity reduction achieved in year 2019 is estimated as 33.3% ( ,2019 =33.3%shippingR ). ] [ Option 2A: Supply-based measurement of 2030 target As estimated by the Fourth IMO GHG Study 2020, the attained CII of international shipping (on aggregated supply-based metric) has reduced by 22.0% ( ,2018 =22.0%shippingR ) compared to 2008, with an estimated average annual improvement at 1.6 percentage points ( =1.6%shippingr ). In accordance with Eq.(5), the carbon intensity reduction achieved in year 2019 relative to 2008 is estimated as 23.6% ( ,2019 =23.6%shippingR ).]
- Given the achieved carbon intensity reduction of international shipping in year 2019 relative to year 2008, the carbon intensity reduction target of international shipping in year 2030 can be converted to the equivalent target ( ,2030shippingeR ) relative to year 2019, as follows:
,2019
,2030,2019
40%1
shippingshipping
shipping
ReR
R−
=−
(9)

MEPC 76/7/5 Annex 3, page 6
I:\MEPC\76\MEPC 76-7-5.docx
[Option 1A: Demand-based measurement of 2030 target In accordance with Eq.(6), the equivalent reduction factor of international shipping in year 2030 relative to year 2019 ( ,2030shippingeR ) would be 10.0% measured in aggregated demand-based CII metric, i.e. additional 10.0% improvement from the 2019 level is needed by 2030). ] [Option 2A: Supply-based measurement of 2030 target In accordance with Eq.(6), the equivalent reduction factor of international shipping in 2030 relative to year 2019 ( ,2030shippingeR ) would be 21.5%, measured in aggregated supply-based CII metric,i.e. additional 21.5% improvement from the 2019 level is needed by 2030).]
.3 In accordance with Eq.(3), to achieve the carbon intensity reduction target of international shipping in year 2030 , the following restriction on reduction factors of ship types relative to year 2019, denoted 2019
,2030typeZ , should be satisfied, taking into account the relative carbon intensity performance of ship types:
[Option 1A: Demand-based measurement of 2030 target
2019,2030 ,2030100 10%type type
typef Z ≥∑ (10) ]
[Option 2A: Supply-based measurement of 2030 target
2019
,2030 ,2030100 21.5%type typetype
f Z ≥∑ (11) ]
where ,2030typef is the weight, which is equal to the proportion of CO2 emitted by the ship type to the total CO2 emissions of international shipping in year 2030. The proportion of CO2 emitted by the ship type to the total CO2 emissions of international shipping in year 2019 can be taken as the plausible approximation.
.4 The reduction factors through year 2023 to 2029 should be set based on the reduction factor in year 2030. To ensure a continuous decline of the operational carbon intensity towards a rational level, the following restriction on annual improvement in carbon intensity of ship types ( typer ) should be satisfied: ,0 type type limr r< ≤ , where ,type limr represents the maximum annual improvement potential of the ship type, taking into account the technical and operational methods available, as well as the historical performance.
4 The reduction factors for the required annual operational CII of ship types 4.1 In accordance with regulation 22B of MARPOL Annex VI, the required annual operational CII for a ship is calculated as follows:
Required annual operatio (1 /100)nal RZC III C I= − ×
where RCII is the reference value in year 2019 as defined in the Guidelines on the reference lines for use with operational carbon intensity indicators (G2) , Z is a general reference to the reduction factors for the required annual operational CII of ship types from year 2023 to 2030, as specified in [table.1A] [table. 2A]
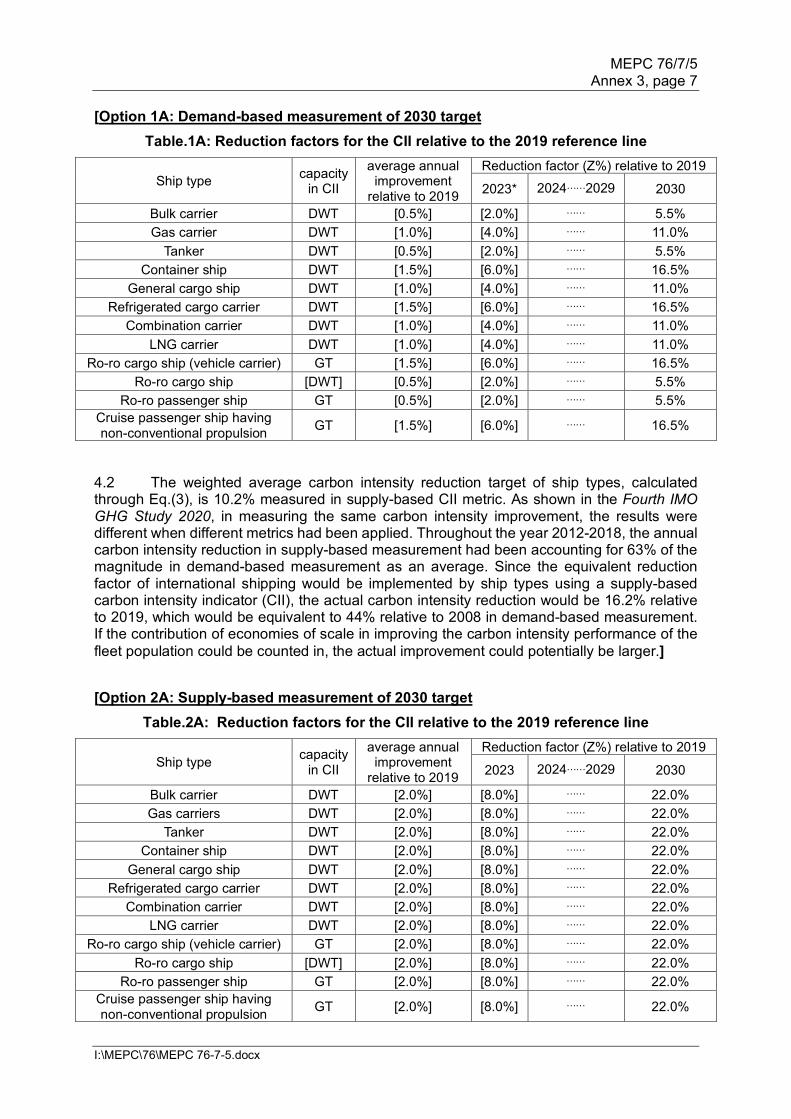
MEPC 76/7/5 Annex 3, page 7
I:\MEPC\76\MEPC 76-7-5.docx
[Option 1A: Demand-based measurement of 2030 target Table.1A: Reduction factors for the CII relative to the 2019 reference line
Ship type capacity in CII
average annual improvement
relative to 2019
Reduction factor (Z%) relative to 2019
2023* 2024……2029 2030
Bulk carrier DWT [0.5%] [2.0%] …… 5.5% Gas carrier DWT [1.0%] [4.0%] …… 11.0%
Tanker DWT [0.5%] [2.0%] …… 5.5% Container ship DWT [1.5%] [6.0%] …… 16.5%
General cargo ship DWT [1.0%] [4.0%] …… 11.0% Refrigerated cargo carrier DWT [1.5%] [6.0%] …… 16.5%
Combination carrier DWT [1.0%] [4.0%] …… 11.0% LNG carrier DWT [1.0%] [4.0%] …… 11.0%
Ro-ro cargo ship (vehicle carrier) GT [1.5%] [6.0%] …… 16.5% Ro-ro cargo ship [DWT] [0.5%] [2.0%] …… 5.5%
Ro-ro passenger ship GT [0.5%] [2.0%] …… 5.5% Cruise passenger ship having non-conventional propulsion GT [1.5%] [6.0%] …… 16.5%
4.2 The weighted average carbon intensity reduction target of ship types, calculated through Eq.(3), is 10.2% measured in supply-based CII metric. As shown in the Fourth IMO GHG Study 2020, in measuring the same carbon intensity improvement, the results were different when different metrics had been applied. Throughout the year 2012-2018, the annual carbon intensity reduction in supply-based measurement had been accounting for 63% of the magnitude in demand-based measurement as an average. Since the equivalent reduction factor of international shipping would be implemented by ship types using a supply-based carbon intensity indicator (CII), the actual carbon intensity reduction would be 16.2% relative to 2019, which would be equivalent to 44% relative to 2008 in demand-based measurement. If the contribution of economies of scale in improving the carbon intensity performance of the fleet population could be counted in, the actual improvement could potentially be larger.]
[Option 2A: Supply-based measurement of 2030 target Table.2A: Reduction factors for the CII relative to the 2019 reference line
Ship type capacity in CII
average annual improvement
relative to 2019
Reduction factor (Z%) relative to 2019
2023 2024……2029 2030
Bulk carrier DWT [2.0%] [8.0%] …… 22.0% Gas carriers DWT [2.0%] [8.0%] …… 22.0%
Tanker DWT [2.0%] [8.0%] …… 22.0% Container ship DWT [2.0%] [8.0%] …… 22.0%
General cargo ship DWT [2.0%] [8.0%] …… 22.0% Refrigerated cargo carrier DWT [2.0%] [8.0%] …… 22.0%
Combination carrier DWT [2.0%] [8.0%] …… 22.0% LNG carrier DWT [2.0%] [8.0%] …… 22.0%
Ro-ro cargo ship (vehicle carrier) GT [2.0%] [8.0%] …… 22.0% Ro-ro cargo ship [DWT] [2.0%] [8.0%] …… 22.0%
Ro-ro passenger ship GT [2.0%] [8.0%] …… 22.0% Cruise passenger ship having non-conventional propulsion GT [2.0%] [8.0%] …… 22.0%

MEPC 76/7/5 Annex 3, page 8
I:\MEPC\76\MEPC 76-7-5.docx
4.3 The weighted average carbon intensity reduction target of ship types, calculated through Eq.(3), is 21.5% measured in supply-based metrics, which is equivalent to 40% reduction relative to 2008 in supply-based measurement. If the contribution of economies of scale in improving the carbon intensity performance of the fleet population could be counted in, the actual improvement could potentially be larger.]

MEPC 76/7/5 Annex 3, page 7
I:\MEPC\76\MEPC 76-7-5.docx
Appendix 1 Background information used in Option 1A Table 1A: Demand-based measurement of 2030 target – ship type specific rate
Appendix 2 Background information on Option 1A: Demand-based measurement of 2030 target – flat rate
Ship type
achieved reductionin demand-basemeasurement in2018 ref.2008
average annualimprovement indemand-basemeasurement(2012-2018)
estimatedachieved reduction
in demand-basemeasurement in2019 ref.2008
Gap to 40%target ref. 2019in demand-base
measurement
attained AER orcgDIST (only forcruise passengership) in year 2019
annual AERor cgDIST
reduction (ref.2019)
reductionfactor in 2030
in AER orcgDIST (ref.
2019)
proportionof CO2
emissions
contribuionin reducing
carbonintesntiy in
2030Bulk carrier 40.0% 1.3% 41.3% achieved 3.816 0.5% 5.5% 27.4% 1.51%Gas carrier (1.79%) 0.5% (1.26%) 40.7% 9.739 1.0% 11.0% 3.5% 0.39%Tanker 29.0% 0.9% 29.8% 14.5% 4.143 0.5% 5.5% 21.1% 1.16%Containership 26.2% 2.3% 28.5% 16.1% 8.225 1.5% 16.5% 29.8% 4.92%General cargo ship 27.0% 0.9% 27.9% 16.8% 10.74 1.0% 11.0% 3.2% 0.35%Refrigerated cargo carrier 7.5% (0.3%) 7.2% 35.4% 23.80 1.5% 16.5% 0.7% 0.12%Combination carrier —— —— —— —— 5.090 1.0% 11.0% 0.1% 0.01%LNG carrier (1.79%) 0.5% (1.26%) 40.7% 10.03 1.0% 11.0% 4.7% 0.52%Ro-ro cargo ship (vehicle carrier) 15.7% 0.8% 16.5% 28.2% 17.53 1.5% 16.5% 3.1% 0.51%Ro-ro cargo ship 46.2% (0.1%) 46.1% achieved 24.78 0.5% 5.5% 1.2% 0.07%Ro-ro passenger ship 45.0% 0.7% 45.7% achieved 92.00 0.5% 5.5% 1.6% 0.09%Cruise passenger ship 27.6% 0.1% 27.7% 17.1% 11.64 1.5% 16.5% 3.6% 0.59%International shipping 31.8% 1.5% 33.3% 10.0% 1.0% —— 100.0% 10.22%
Ship type
achieved reductionin demand-basemeasurement in2018 ref.2008
average annualimprovement indemand-basemeasurement(2012-2018)
estimatedachieved reduction
in demand-basemeasurement in2019 ref.2008
Gap to 40%target ref. 2019in demand-base
measurement
attained AER orcgDIST (only forcruise passengership) in year 2019
annual AERor cgDIST
reduction (ref.2019)
reductionfactor in 2030
in AER orcgDIST (ref.
2019)
proportionof CO2
emissions
contribuionin reducing
carbonintesntiy in
2030Bulk carrier 40.0% 1.3% 41.3% achieved 3.816 1.0% 11.0% 27.4% 3.01%Gas carrier (1.79%) 0.5% (1.26%) 40.7% 9.739 1.0% 11.0% 3.5% 0.39%Tanker 29.0% 0.9% 29.8% 14.5% 4.143 1.0% 11.0% 21.1% 2.32%Containership 26.2% 2.3% 28.5% 16.1% 8.225 1.0% 11.0% 29.8% 3.28%General cargo ship 27.0% 0.9% 27.9% 16.8% 10.74 1.0% 11.0% 3.2% 0.35%Refrigerated cargo carrier 7.5% (0.3%) 7.2% 35.4% 23.80 1.0% 11.0% 0.7% 0.08%Combination carrier —— —— —— —— 5.090 1.0% 11.0% 0.1% 0.01%LNG carrier (1.79%) 0.5% (1.26%) 40.7% 10.03 1.0% 11.0% 4.7% 0.52%Ro-ro cargo ship (vehicle carrier) 15.7% 0.8% 16.5% 28.2% 17.53 1.0% 11.0% 3.1% 0.34%Ro-ro cargo ship 46.2% (0.1%) 46.1% achieved 24.78 1.0% 11.0% 1.2% 0.13%Ro-ro passenger ship 45.0% 0.7% 45.7% achieved 92.00 1.0% 11.0% 1.6% 0.18%Cruise passenger ship 27.6% 0.1% 27.7% 17.1% 11.64 1.0% 11.0% 3.6% 0.40%International shipping 31.8% 1.5% 33.3% 10.0% 1.0% —— 100.0% 10.99%

MEPC 76/7/5 Annex 3, page 8
I:\MEPC\76\MEPC 76-7-5.docx
Appendix 3 Background information on Option 2A - Supply-based measurement of 2030 target – ship type specific rate
Appendix 4 Background information used in Option 2A Table 2A - Supply-based measurement of 2030 target – flat rate
***
Ship type
achieved reduction in supply-based measurement in 2018 ref.2008
average annual improvement in supply-based measurement (2012-2018)
estimated achieved reduction
in supply-based measurement in 2019 ref.2008
Gap to 40% target ref. 2019 in supply-based measurement
average annual AER or cgDIST reduction
(ref. 2019)
reduction factor in
2030 in AER or cgDIST (ref. 2019)
proportion of CO2
emissions
contribution in reducing
carbon intensity in
2030
Bulk carrier 31.2% 1.3% 32.50% 11.1% 1.5% 16.5% 27.4% 4.5%Gas Carrier (6.6%) 2.4% -4.20% 42.4% 2.0% 22.0% 3.5% 0.8%Tanker 12.6% 0.8% 13.40% 30.7% 2.0% 22.0% 21.1% 4.6%Containership 26.7% 2.1% 28.80% 15.7% 2.5% 27.5% 29.8% 8.2%General cargo ship 19.4% 1.2% 20.60% 24.4% 2.0% 22.0% 3.2% 0.7%Refrigerated cargo carrier 22.4% -0.5% 21.90% 23.2% 1.5% 16.5% 0.7% 0.1%Combination carrier —— —— 23.6% 21.5% 2.0% 22.0% 0.1% 0.0%LNG Carrier (6.6%) 2.4% -4.20% 42.4% 2.0% 22.0% 4.7% 1.0%Ro-ro cargo ship (vehicle carrier) 7.9% 0.7% 8.60% 34.4% 2.0% 22.0% 3.1% 0.7%Ro-ro cargo ship 39.5% -0.6% 38.90% 1.8% 1.0% 11.0% 1.2% 0.1%Ro-ro passenger ship (4.7%) 0.6% -4.10% 42.4% 1.0% 11.0% 1.6% 0.2%Cruise passenger ship 28.9% (0.1) 18.90% 26.0% 2.0% 22.0% 3.6% 0.8%International shipping 22.0% 1.6% 23.60% 21.5% 2.0% —— 100.0% 21.8%
Ship type
achieved reduction in supply-based measurement in 2018 ref.2008
average annual improvement in supply-based measurement (2012-2018)
estimated achieved reduction
in supply-based measurement in 2019 ref.2008
Gap to 40% target ref. 2019 in supply-based measurement
average annual AER or cgDIST reduction
(ref. 2019)
reduction factor in
2030 in AER or cgDIST (ref. 2019)
proportion of CO2
emissions
contribution in reducing
carbon intensity in
2030
Bulk carrier 31.2% 1.3% 32.50% 11.1% 2.0% 22.0% 27.4% 6.0%Gas Carrier (6.6%) 2.4% -4.20% 42.4% 2.0% 22.0% 3.5% 0.8%Tanker 12.6% 0.8% 13.40% 30.7% 2.0% 22.0% 21.1% 4.6%Containership 26.7% 2.1% 28.80% 15.7% 2.0% 22.0% 29.8% 6.6%General cargo ship 19.4% 1.2% 20.60% 24.4% 2.0% 22.0% 3.2% 0.7%Refrigerated cargo carrier 22.4% -0.5% 21.90% 23.2% 2.0% 22.0% 0.7% 0.2%Combination carrier —— —— 23.6% 21.5% 2.0% 22.0% 0.1% 0.0%LNG Carrier (6.6%) 2.4% -4.20% 42.4% 2.0% 22.0% 4.7% 1.0%Ro-ro cargo ship (vehicle carrier) 7.9% 0.7% 8.60% 34.4% 2.0% 22.0% 3.1% 0.7%Ro-ro cargo ship 39.5% -0.6% 38.90% 1.8% 2.0% 22.0% 1.2% 0.3%Ro-ro passenger ship (4.7%) 0.6% -4.10% 42.4% 2.0% 22.0% 1.6% 0.4%Cruise passenger ship 28.9% (0.1) 18.90% 26.0% 2.0% 22.0% 3.6% 0.8%International shipping 22.0% 1.6% 23.60% 21.5% 2.0% —— 100.0% 22.0%

MEPC 76/7/5 Annex 4, page 1
I:\MEPC\76\MEPC 76-7-5.docx
ANNEX 4 DRAFT GUIDELINES ON THE OPERATIONAL CARBON INTENSITY RATING OF SHIPS
(CII RATING GUIDELINES, G4) 1 Introduction 1.1 These guidelines provide the methods to assign operational energy efficiency performance ratings to ships, as referred to in regulation 22B of MARPOL Annex VI. On this basis, the boundaries for determining a ship's annual operational carbon intensity performance from year 2023 to 2030 are also provided. 2 Definitions 2.1 MARPOL means the International Convention for the Prevention of Pollution from Ships, 1973, as modified by the Protocols of 1978 and 1997 relating thereto, as amended. 2.2 IMO DCS means the data collection system for fuel oil consumption of ships referred to in regulation 22A and related provisions of MARPOL Annex VI. 2.3 For the purpose of these guidelines, the definitions in MARPOL Annex VI, as amended, apply. 2.4 Operational carbon intensity rating means to assign a ranking label from among the five grades (A, B, C, D and E) to the ship based on the attained annual operational carbon intensity indicator, indicating a major superior, minor superior, moderate, minor inferior, or inferior performance level. 3 Framework of the operational energy efficiency performance rating 3.1 An operational energy efficiency performance rating should be annually assigned to
each ship to which regulation 22B of MARPOL Annex VI applies, in a transparent and robust manner, based on the deviation of the attained annual operational carbon intensity indicator (CII) of a ship from the required value.
3.2 To facilitate the rating assignment, for each year from 2023 to 2030, four boundaries
are defined for the five-grade rating mechanism, namely superior boundary, lower boundary, upper boundary, and inferior boundary. Thus, a rating can be assigned through comparing the attained annual operational CII of a ship with the boundary values.
3.3 The boundaries are set based on the distribution of CIIs of individual ships in
year 2019. The appropriate rating boundaries are expected to generate the following results: the middle 30% of individual ships across the fleet segment, in terms of the attained annual operational CIIs, are to be assigned rating C, while the upper 20% and further upper 15% of individuals are to be assigned rating D and E respectively, the lower 20% and further lower 15% of the individuals are to be assigned rating B and A respectively, as illustrated in figure 1.

MEPC 76/7/5 Annex 4, page 2
I:\MEPC\76\MEPC 76-7-5.docx
Figure 1: Operational energy efficiency performance rating scale
3.4 Given the incremental operational carbon intensity reduction factors over time, the boundaries for defining performance ratings should be synchronized accordingly, although the relative distance between the boundaries should not change. The rating of a ship would be determined by the attained CII and the predetermined rating boundaries, rather than the attained CII of other ships. Note that the distribution of ship individual ratings in a specific year may not be always identical with the scenario in 2019, where for example 20% may achieve A, 30% may achieve B, 40% may achieve C, 8% may achieve D and 2% may achieve E in a given year. 4 Method to determine the rating boundaries 4.1 The boundaries can be determined by the required annual operational CII in conjunction with the vectors, indicating the direction and distance they deviate from the required value (denoted as dd vectors for easy reference), as illustrated in figure 2.
Figure 2: dd vectors and rating bands
4.2 Statistically, the dd vectors depend on the distribution of the attained annual operational CII of ships of the type concerned, which can be estimated through a quantile regression, taking data collected through DCS in year 2019 as the sample. 4.3 The quantile regression model for a specific ship type can be developed as follows:
( ) ( )ln( ) ln( ) , {0.15,0.35,0.50,0.65,0.85}p pattained CII c Capacity pδ ε= − + = (12) where Capacity is identical with the one used in the operation carbon intensity indicator as specified in the Guidelines on operational carbon intensity indicators and the calculation

MEPC 76/7/5 Annex 4, page 3
I:\MEPC\76\MEPC 76-7-5.docx
methods (G1); p is the typical quantile, meaning the proportion of observations with a lower
value is %p ; ( )pδ is the constant term, and ( )pε is the error term. 4.4 The quantile regression lines in logarithm form are illustrated in figure 3.
Figure 3: Quantile regression lines in logarithm form
4.5 Then, the dd vectors can be calculated based on the estimates of the intercept ( ( )ˆ pδ ), in accordance with Eq.(2), as follows:
(0.15) (0.50)1
(0.35) (0.50)2
(0.65) (0.50)3
(0.85) (0.50)4
ˆ ˆ
ˆ ˆ
ˆ ˆ
ˆ ˆ
d
d
d
d
δ δ
δ δ
δ δ
δ δ
= −
= −
= −
= −
(13)
4.6 Through an exponential transformation of each dd vector , the four boundaries fitted in the original data form can be derived based on the required annual operational carbon intensity indictor ( required CII ), as follows:
1
2
3
4
superior boundary exp( ) lower boundary exp( ) upper boundary exp( )
boundary exp( ) inferior
d required CIId required CIId required CII
d required CII
= ⋅ = ⋅ = ⋅ = ⋅
(14)

MEPC 76/7/5 Annex 4, page 4
I:\MEPC\76\MEPC 76-7-5.docx
5 Rating boundaries of ship types
The estimated dd vectors after exponential transformation for determining the rating boundaries of ship types are as follows:
Table 1: dd vectors for determining the rating boundaries of ship types
Ship type Capacity
in CII calculation
dd vectors (after exponential transformation)
exp(d1) exp(d2) exp(d3) exp(d4)
Bulk carrier DWT 0.86 0.94 1.06 1.18
Gas carrier 65,000 DWT and above DWT 0.79 0.89 1.12 1.38 less than 65,000 DWT DWT 0.85 0.95 1.06 1.25
Tanker DWT 0.82 0.93 1.08 1.27 Container ship DWT 0.83 0.94 1.07 1.19 General cargo ship DWT 0.84 0.95 1.07 1.19 Refrigerated cargo carrier DWT 0.77 0.90 1.07 1.21 Combination carrier DWT 0.88 0.95 1.06 1.26
LNG carrier 100,000 DWT and above
DWT 0.91 0.98 1.05 1.11
less than 100,000 DWT 0.77 0.91 1.12 1.37 Ro-ro cargo ship (vehicle carrier) GT 0.86 0.94 1.06 1.16 Ro-ro cargo ship [DWT] [0.67 0.90 1.09 1.37] Ro-ro passenger ship GT 0.73 0.87 1.10 1.37 Cruise passenger ship having non-conventional propulsion GT 0.85 0.94 1.04 1.15
By comparing the attained annual operational CII of a specific ship with the four boundaries, a rating can then be assigned. For example, given the required CII of a bulk carrier in a specific year as 10 gCO2/(dwt.nmile), then the superior boundary, lower boundary, upper boundary, and inferior boundary is 8.6, 9.4, 10.6 and 11.8 gCO2/(dwt.nmile). If the attained CII is 9 gCO2/(dwt.nmile), the ship would be rated as "B".
___________