Engineering knits for versatile technical applications - CiteSeerX
Upload
khangminh22Category
view
0download
0
AD-A281 974
TECHNICAL REPORTNaval Facilities Engineering Service Center, Port Hueneme, CA 93043-4328
S- TR-2019-ENVW LMay 1994
"by: C. A. Kodres
Sponsored by:94-22529 Office of Naval Research
MOISTURE INDUCED PRESSURES INCONCRETE AIRFIELD PAVEMENTS
ABSTRACT The erosion of military concrete air- across the medium. The key premise is that the re-field pavements by jet exhausts is an expensive prob- sistance to flow through a high resistance porouslem expected to get worse. Scaling of pavements is medium can be modeled with friction coefficientsbeing observed beneath the auxiliary power units analogous to the method used for simpler geom-(APUs) of F/A-18 and B-I aircraft. The AV-8B Har- etries. Crier and future vertical takeoff and landing aircraft Pore pressures predicted using this model showwill generate a concrete environment much more that moisture in the pores of the cement is unlikelysevere than that generated by the low power APUs. to be the primary cause of material failure in airfield
In order to develop pavements impervious to pavements heated by the F/A-18 APU. Moisture is athis form of erosion, the failure mechanism must be probable cause of failure, however, when the ce-known. One plausible culprit, suggested by the ap- ment is being heated by the exhaust of a Harrierparent role of heating, is moisture. To examine this during takeoff and landing. For an initial pore satu-hypothesis, a mathematical model was developed to ration of 90 percent or greater, extremely high porepredict pore pressures caused by water vapor and pressures and pressure gradients result from air be-air migrating through the pores of a heated section ing compressed by the thermal expansion of liquidof concrete. water. Concrete temperatures beneath a VSTOL reach
The foundation of this model is a constitutive 300'C in about 2 minutes. For a lesser pore satura-relationship developed to characterize the flow of tion, the water vapor pressure could eventually behigh velocity, compressible, heated gases through sufficient to cause a tensile failure in Portland ce-concrete. This relationship equates a nondimensional ment concrete.flow parameter with pressure and temperature ratios
Approved for public release; distribution is unlimited.
~ '4.

III
I2 u 1'2
A yj.
E
J~ as
on E~ E 0-
E riE - - -hI.~~2 E~8 6
1med
Si Sz
S I*
2 1L
S w10 am a
*1 v .e CLC

PREFACE
On I October 1993, the Naval Civil Engineering Laboirory (NCEL) and theNaval Energy and Enviromnental Support Activity (NEESA) were consolidatedwith four other Naval Facilities Engineering Command (NAVFAC) componentsinto tke Naval Facilities Engineering Service Center (NFESC). Due to publishingtimeframe, this document may have references to NEESA or NCEL instead ofNFESC.
DTIC QUALITY INSPECTED 5

REPORT DOCUMENTATION PAGE W 0"
PU*ompmnqlbusdenbrthb coadomnofdnumdaoni eIaudtowrage I hourp-rpeeo, hriu* wthnfor mvIewunimne . eaarndft detdafta saure. 9hedn mand muinaWi the da, needed, and eampleganid reviWiingthe oelecDon offinfodon. Send oonrnem . mgadlingthis budenearmeaorw dother pea' ct offth-l-c Ic'mo nfma Incbuding euggeedae 'freduckitNs burden, to WeadhwnHoeo qunmSee. Dketaft•bdUarUonandftpa- 1215 JefhmDedon Hw•Av.Su 12O4. Ad*gt VA 22202-430w andloV Omof Mt nunw t mnd Budgi t PaPeWVnmkeduednP1t IO70W4Q. Wa. WahIv DC 2050.
1. AGENCY USE ONLY ILeve bhAw*k) 2. REPORT DATE 3. REPORT TYPE AND DATES COVERED
May 1994 Final, 1Oct 1990-30Sep 1993
4. TITLE AND SUBTITLE 5. FUNDING NUMBERS
MOISTURE INDUCED PRESSURES IN CONCRETE PR - ROOO-NO-211AIRFIEL PAVEMENTS WU - DN661002
S. AUTHOR(S)
C. A. Kodres
7. PERFORMING ORGANIZATION NAMEIS) AND ADDRESSE(S) S. PERFORMING ORGANIZATION REPORT
Naval Facilities Engineering Service Center NUMER560 Center Drive TR-2019-ENVPort Hueneme, CA 93043-4328
9.SPONSORINGIMONITORING AGENCY NAME(S) AND ADDRESSES 10. SPONSORINGIMONITORING AGENCY REPORTNUMBER
Office of Naval ResearchArlington, VA 22217-5000
11. SUPPLEMENTARY NOTES
12a. DISTRIBUTION/AVAILABILITY STATEMENT 12b. DISTRIBUTION CODE
Approved for public release; distribution is unlimited.
13. ABSTRACT (Maximum 200 wv,.J)
The erosion of military concrete airfield pavements by jet exhausts is an expensive problem expected to get worse. Scaling ofpavements is being observed beneath the auxiliary power units (APUs) ofF/A-18 and B-1 aircraft. The AV-8B Harrier and futureverticaltakeoffand landing aircraftwill generatea concrete environment muchmore severe than that generated by the lowpower APUs.
In order to develop pavements impervious to this form of erosion, the failure mechanism must be known. One plausible culprit,suggested by the apparent role of heating, is moisture. To examine this hypothesis, a mathematical model was developed to predictpore pressures caused by water vapor and air migrating through the pores of a heated section of concrete.
The foundation ofthis modelis a constitutive relationshipdeveloped to characterize the flow of high velocity, compressible, heatedgases through concrete. This relationship equates a nondimensional flow parameter with pressure and temperature ratios across themedium. The key premise is that the resistance to flow through a high resistance porous medium can be modeled with frictioncoefficients analogous to the method used for simpler geometries.
Pore pressures predicted using this model show that moisture in the pores of the cement is unlikely to be the primary cause ofmaterial failure in airfield pavements heated by the F/A-18 APU. Moisture is a probable cause of failure, however, when the cementis being heated by the exhaust ofa Harrier during takeoff andlanding. Foran initialpore saturation of 90 percent or greater, extremelyhigh pore pressures and pressure gradients result from air being compressed by the thermal expansion of liquid water. Concretetemperatres beneatha VSTOL reach 300C inabout2 minutes. Fora lesserpore saturation, the watervaporpressure could eventuallybe sufficient to cause a tensile failure in portland cement concrete.
14. SUBJECT TERMS 16. NUMBER OF PAGES
103Concrete, moisture, erosion of airfield pavements, computer program 1S. PRICE CODE
17. SECURITY CLASSIFICATION IB. SECURITY CLASSIFICATION 10. SECURITY CLASSIFICATION 20. LIMITATION OFOF REPORT OF THIS PAGE OF ABSTRACT ABSTRACT
Unclassified Unclassified Unclassified UL
N8117540O1-2104500 Standard Fomn 298 (Rev. 2-89)
Preabed by ANSI Std. 239-18

CONTENIS
pare
INTRODUCTION ........................................ 1
Cement Pore Structure ................................. 1Thermodynamics of Pore Moisture ........................ 6Hypothesis ........................................ 10Plan of Attack ...... ............................... 10
RELATED WORK ....................................... 10
HIGH VELOCITY FLOW THROUGH CONCRETE .................. 12
Darcy's Law ....................................... 12Porous Media Friction Factors ............................ 14Derivation of the Flow Equation .......................... 14Qualitative Validation of Flow Equation ...................... 23
MEASURED FLOW CHARACTERISTICS ........................ 27
Concrete .... . ....................................... 27Other Porous Media .................................. 27Comments ........................................ 28
EFFECTIVE FLOW AREA .................................. 34
MATHEMATICAL SIMULATION OF AIRFIELD PAVEMENT ............. 34
Governing Equations ...................................... 35Initial and Boundary Conditions .............................. 38Computational Procedures ............................... 39
THEORETICAL RESULTS ...................................... 39
APU Heated Pavements ................................... 39VSTOL Heated Pavements .................................. 42
EXPERIMENTAL RESULTS ................................... 47
COMMENTS ........................................... 53
CONCLUSIONS ......................................... 57
REFERENCES .......................................... 57
v

1 -7:7
INE4ODUCMfON
Scaling of U.S. Navy and Marine Corps concrete airfield parking and run-up aprons isbecoming a multimillion dollar problem. A scaling airfield pavement is an immediate threat tojet engines, generating loose cement and aggregate that is easily ingested.
The age of the failing pavements ranges from a few years to over 15 years. Yet, thedamage has been observed only recently, always following the arrival of the F/A-18. Figures1 and 2 show examples of run-up apron scaling. This particular damage occurred at the NavalAir Station (NAS) North Island, California.
Unlike its predecessors, the auxiliary power unit (APU) of the F/A-18 tilts away fromthe aircraft centerline. The APU is a low power gas turbine that provides compressed air, froma load driven compressor, for starting the maw engines and for operating auxiliary systemsduring ground maintenance. Exhaust from the APU strikes the pavement at about a 45-degreeangle approximately below the tail section of the plane as illustrated in Figure 3.
While starting the main engines, the APU nozzle velocity reaches about 125 m/sec at atemperature slightly above 5000C (Houck, 1990). The concrete surface is heated to roughly100°C during a 30-second main engine start (Houck, 1990; Bier et al., 1991; Houck et al.,1992). A typical run-up apron is subjected to the APU blast three to five times a day, five daysa week, throughout the year. During ground maintenance, the APU runs for a much longerduration.
Failure does not happen immediately, nor does it occur explosively. Scaling occursslowly, beginning in those areas that have the most usage. The depth and extent of the damagevaries with the location of the airfield. In general, scaling occurs to the top 1/2 to 1 cm of thepavement. The extent of the damage ranges from only a few square centimeters up to an areaof more than 2 meters in diameter. With only one exception, scaling is limited to the cement;at NAS Cecil Field, Florida, fracturing occurred through some of the limestone aggregates.
Future erosion problems will be more severe. The APU exhaust temperature of the newA-12 attack aircraft is about 400C hotter than the APU of the F/A-18. V-22 tiltrotor jets willstrike the pavement at temperatures in excess of 5000C. The AV-8B Harrier and future vectorthrust aircraft will generate a concrete environment much more severe than that induced by therelatively low velocity, low temperature APUs. Perhaps the main runways will be affected.
The damage suggests a fatigue failure (Houck, 1990). Failure mechanisms involvingchemical degradation of the cement are also being proposed (McVay et al., 1993). The mostplausible cause of the scaling, however, is the simplest. These same failure characteristics wouldbe present if the tensile strength of the concrete was being exceeded intermittently, and in verysmall regions, by the thermal expansion of water or some other fluid trapped in the pores of theconcrete. This report discusses the theoretical and experimental examination of this hypothesis.
Cement Pore Structure
The term concrete as used in this work can be interpreted to mean a mixture of portlandcement, water, and some inert mineral aggregate. Portland cement is a calcium silicatecompound predominantly containing tricalcium and dicalcium silicates. The development ofstrength is the result of chemical reactions between the cement silicates and the added water,
1

Pav" t salin du to Figure 1Pav n~ t scaing due toF/A - Is exhaust at NA S N orth Island.
A-A
Closeup Of Figure 2Cloe-u ofNAS Northi Island damage.
2

Figure 3F/A-18 APU exhaust profile.
forming a fibriilar calcium-silicate-hydrate gel (Collepardi, 1973; Neville, 1973; Double andHellawell, 1977). Aggregate, which is cheaper than the cement, was originally dispersedthroughout the cement paste for economic reasons (Neville, 1973). Aggregate is not completelyinert, however, and it is equally plausible to view concrete as an aggregate framework heldtogether by the cement paste.
Pores formed in the cement are initially either water or gas filled. As the cement andwater react, the resulting mixture expands into the volume originally filled with water. The finalvolume of the cement paste is less than the suni of the original volumes of cement and water•(Verbeck, 1966). Voids remain in the concrete, called capillary pores to differentiate from thesmaller pores inherent in the gel. Some of these pores remain filled with water.
Water reacting with the cement is usually designated "non-evaporablew to distinguish fromevpoale, or free, water. About 20 percent of the weight of fully hydrated portland cementis non-evaporable water (Powers, 1949; Harmathy and Berndt, 1966; Neville, 1973).Evaporable water is primarily water in capillary and gel pores but also includes adsorbed water(ILmnkard et al., 1971) so the distinction is largely for reference. Much of the evaporable waterin concrete was part of the original mix, and is a flmction of mix conditions such as temperature,water-cement ratio, and degree of hydration. Evaporable water is also transferred to and fromthe environment, the mass transfer induced by humidity and rainfall. Thus, the amount ofevaporable water in cement or concrete is highly variable. Without including rainfall, valuesaround 5 percent by weight are representative (Copeland and Hayes, 1953).
The porosity of cement is largely a function of the initial evaporable water. Cement isporous. The gel porosity of hardened portland cement reaches about 28 percent (Powers, 1949),and, although capillary pores should eventually disappear if the original water-cement ratio is notabove approximately 0.39 by weight (Powers, 1949), even cement mixed under optimumconditions will contain some capillary pores. For a fully hydrated cement paste mixed with awater-cement ratio of 0.4, Diamond (1973) measured a total porosity of about 37 percent. Ifthe aggregate is included, porosities are commonly in the range 6 to 10 percent (Dullien, 1979).
IM3

Figure 4 is a pore size distribution of Secar 250 hydrated cement measured by M. Jung(1973) using mercury penetration (Winslow and Diamond, 1970; Auskern and Horn, 1973). At100°C, pore radii range between 10-3 and 10-3 mm with the largest total volume of pores formedwith a radius between 104 and 10j- mm. Other published pore distributions are of the sameorders of magnitude (Verbeck, 1966; Diamond, 1973; Chekhovsky et al., 1973). Figure 5 isperhaps more enlightening. It shows pore distribution in terms of number of pores rather thanpore volume. Gel pores are by far the most numerous, formed with a radius less than 10-5 mm.
As would be expected from the way pores are formed, intrusion measurements show bothporosity and average pore size to increase with an increase in the water-cement mix ratio and todecrease with hydration time (Diamond, 1973; Jung, 1973). The average pore size decreaseswith increase in the curing temperature (Chekhovsky et al., 1973) although not significantly(Diamond, 1973).
Cement also contains voids formed from air, accidently trapped or purposely entrained,dispersed throughout the cement paste. These voids range in size up to a maximum of about2 mm (Verbeck, 1966).
100
90 ---
• 80 .............
WU 70 500
D 60 00qC0j 10_____ __ __
> so 120 C.Uj1. 40 W..-. . ..0CL0"0
2. 0
10 1
0 1 1 1 fi.. .
1.OE-06 1.OE-05 1.OE-04 1.OE-03 1.OE-02PORE RADIUS (mm)
Figure 4Pore size distribution of secar 250 hydrated cement
as a function of firing temperature (Jung, 1973).
4

1610
1610
1000C14
10
Z 13O 10
12L -10
aD11 -1000 C
UJ 11-I ~10
0 0> -w " 10 ADAPTED FROMcc. 100 FIGURE 4
910
8 1400 C10
-6 -6 -4 -3 -10 10 10 10 10
PORE RADIUS, MM
Figure 5
Number of pores in cement at different temperatures.
5

Cement is porous, yet, the permeability' of even moderate quality portland cement isvery low. Most of the porosity is accounted for by the very small gel pores (see Figure 4).Capillary pores are much fewer in number and spread throughout the cement. The dominantresistance to flow is the resistance provided by the smaller pores. Therefore, mix conditions thataffect pore size distribution will also affect permeability. For example, permeability of cementpaste is increased approximately a thousandfold by an increase in water-cement ratio from 0.4to 0.8; permeability is decreased approximately a thousandfold between the curing ages of 7 daysand 1 year (Verbeck, 1966).
The pore structure of fully hydrated portland cement is altered by heating. Hydratedcement dehydrates at higher temperatures, 100°C to perhaps 5000C, and the total pore volumewhich had been decreasing with hydration, increases again (Jung, 1973). Bazant and Thonguthal(1978) have observed that the permeability of concrete to water increases over two orders ofmagnitude between 95°C and 1050C. They attribute this increase to evaporation plus a"smoothing" of the pore necks providing the dominant resistance. Further heating can beexpected to induce hydrate phase transformations and the formation of new mineral phases.Above 1,000°C, with beginning sintering, smaller pores combine to form larger pores (Jung,1973) as shown in Figure 5.
"Thermodynamics of Pore Moisture
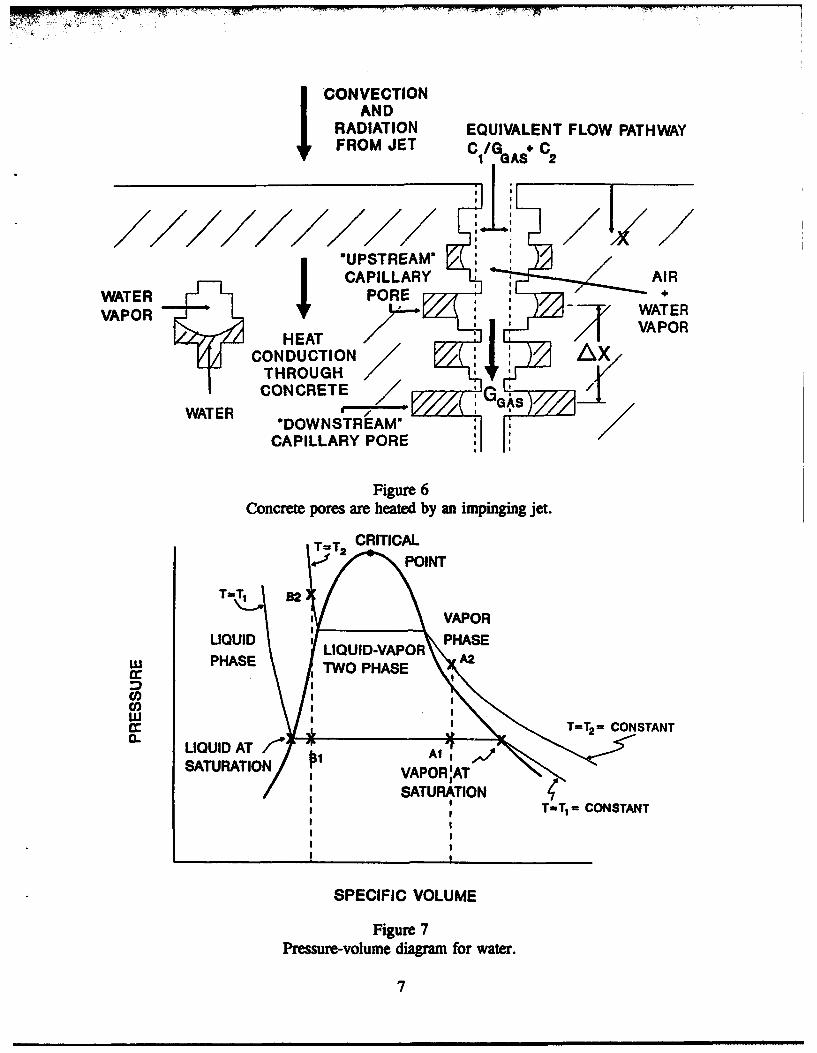
Consider a single isolated concrete capillary pore such as illustrated in Figure 6. Tosimplify explanation of the behavior of pore moisture when heated, suppose, for the moment,this pore contains only water and water vapor. Assume the water, its vapor, and the surroundingcement are in equilibrium. Finally, neglect any effects that temperature or pressure might haveon the pore dimensions; the volume of this pore remains constant.
When water trapped in these pores is heated, the quality of the liquid-vapor mixture ischanged. The net phase change can go in either direction, depending upon the initial liquid andvapor fractions in the pore (i.e., on the initial quality of the liquid-vapor mixture). Thephenomena is best shown on the pressure-volume (P-V) diagram for water (Figure 7). If thereis very little liquid water in the pore (a high specific volume of the contents of the pore), heatingthe concrete will evaporate the remaining water, leaving only the saturated vapor. Furtherincreases in temperature will superheat the vapor. Shown on the P-V diagram, the mixture inthe pore is changing from the state at Al to the state at A2. Conversely, if the pore is nearlyfilled with liquid water (a low specific volume), heating the concrete will expand the liquid phasefaster than it is being vaporized. The pore becomes filled with the saturated liquid phase.Further heating compresses the water. This process is illustrated on the P-V diagram by achange from state BI to state B2. With less heating, both water and vapor, in equilibrium,remain in the pore, and the pressure of the liquid is equal to its vapor pressure. Observe that,at any given temperature, the pressure of the compressed liquid is much higher than the vaporpressure or the pressure of the superheated vapor. Figure 7, which is not drawn to scale, doesnot accurately show the tremendous pressures generated when water is compressed in thismanner.
'Constant proportional to flow through porous media, see Equation 1.
6
E7T
ICONVECTIONAND
RADIATION EQUIVALENT FLOW PATHWAYFROM JET CI/GaAs C21 GAS 2
* I
I UPSTREAM"I CAPILLARY AIR
WATER WAT E RVAPOR WATER
VAPORHEAT
CONDUCTION AXTHROUGHCONCRETE
WATER"DOWNSTREAM" "1
CAPILLARY PORE
Figure 6Concrete pores are heated by an impinging jet.
T=T2 CRITICALPOINT
T=nT 82
VAPORLIQUID ' LIQUID-VAPOR PHASE
w PHASE TWO PHASE A
Co lWr T=T2 - CONSTANT
SATURATION VAPOR 'ATSATURATION
T-T 1 = CONSTANT
SPECIFIC VOLUME
Figure 7Pressure-volume diagram for water.
7

Recall that no transport of water between pores was allowed. If the pores are connected,which they normally are, the specific volume of the water in the pores will change, illustrated,for example, by a change of state from BI to A2 on the P-V diagram. Furthermore, if the poreis near the surface of the cement, the gas pressure inside the pore could be less than thesaturation pressure of the water. Under these conditions, the water would boil.
Also recall that the pore was assumed to contain only water. Air is present in the poresof cement and has a major influence on pore pressure. The solubility of air in water is low.Therefore, when heated, water does not expand into the gas phase as it does if only water vaporis present. Air acts as a shock absorber; the water expands against the mass of the air ratherthan against the solid walls of the pore. The pore pressure will never reach the magnitudes itwould if only water were present. However, compression of the liquid phase occurs with lesswater in the pores.
The effect of air on pore pressure is illustrated by Figures 8 and 9. These figures weredeveloped by assuming:
1. Air is an ideal gas; air is insoluble in water.
2. Liquid water is in equilibrium with its vapor.
3. Completely mixed gases and water.
4. Air and water vapor occupy the same space only.
5. No capillary effects.
6. No deformation of the pore other than thermal expansion.
Curve fits of the Steam Table data (Keenan and Keyes, 1936) were used as equations ofstate for water and water vapor. The equations of state for air and water were solvedsimultaneously for pressures while conserving the mass of water plus water vapor and the massof air and constraining the total volume of the pore.
In Figure 8, a closed cement pore has been heated from 150C up to 1800C. The fractionof pore volume occupied by liquid water (percent of saturation) when the cement was cold isused as the independent variable. Pore pressure, the dependent variable, is the sum of the airand water vapor pressures, or equivalently, since capillarity is being neglected, the pressure ofthe liquid water phase.
As more water is enclosed by the pore, the decrease in air volume due to the expansionof the water becomes fractionally more significant, and the air compression increases. As thepore approaches 100 percent saturation, the expanding water occupies so much of the porevolume that the air pressure becomes very high. Under the conditions assumed to developFigure 8, pore pressures will exceed the tensile strengt ,' cement heated to 1800C when poresaturation is greater than about 85 percent.
Volumetric expansion of the pore water i3 proportional to the rise in temperature. Thus,the hotter the cement, the higher the pore pressure and, more importantly, the lower the"critical" saturation. Figure 9 is a similar plot of pore pressures but with the final cementtemperature as a parameter. For example, if the cement is heated further to 230cC, the tensilestrength of the material is exceeded in pores with only 75 percent saturation.
8

70
60
S40
co
m 80
I. TOTAL PORE20 PRESSURE WATER VAPOR
PRESSURE
AIR PRESSURE -,
0 1 1 10 0.1 0.2 0.3 0.4 0.5 0.6 0.7 0.8 0.9 1
INITIAL UQUID KO (VOLUME FRACTION)
Figure 8Effect of saturation on concrete pore pressure (isolated pore heated to 180oC).
100
s80ISOLATED POREHEATED TO 230Cto 60 120oC
Lu
CLu4L 40
0~IL 20 10 " I
0 0.2 0.4 0.6 0.8 1
INITAL LIQUID KIO (VOLUME FRACTION)
Figure 9Effect of temperature on concrete pore pressure.
9

Because most of the pores in cement are interconnected, as also shown schematically inFigure 6, mass is transferred from pore to pore, pressure differences induced by local differencesin saturation and temperature. Such mass flows tend to equalize pore pressures. Although theair is still compressed in the manner described above, maximum pore pressures will be decreasedbecause of the air and water flowing out of the highest pressure pores.
Hypothess
Yet, the resistance to flow through cement is very high. If the concrete is heated rapidly,for example, by the APU of an F/A-18, flow rates out of the pores might not be sufficient torelieve the pressures generated by water expansion.
The work presented here is based upon this hypothesis. Somehow the water gets into thepores of the concrete pavement. The pavement surface is likely to be the wettest, with rainfallentering the pores, adding to evaporable water remaining from the original mix. The surfacealso has the highest heating rate and reaches the highest temperatures. The concrete is thenheated intermittently by the jet of the APU. Occasionally, a pore is hot enough and saturatedenough to produce a state of compressed water. Pore pressures are increased beyond the tensilestrength of the cement. Material failure results, beginning with a few single pores near thepavement surface. Over a period of time, the damage spreads to the extent that scaling isvisually observed.
Plan of Attack
The procedure followed to confirm this hypothesis is to first theoretically determine porepressures induced by the APU. Then, if these pressures are predicted to exceed the tensilestrength of the cement, results will be confirmed by saturating and heating samples of airfieldconcrete pavement.
This work is limited to moderate temperatures. There are no reactions affecting thechemical structure of the cement. The concrete expands and contracts with temperature changes,and the evaporable water migrates from pore to pore, but hydration is complete and temperaturesare too low for dehydration.
Scaling characteristics suggest that the affected pores are located in the cement rather thanthe aggregate. The aprons are made of concrete, however, and much of the published relatedwork examines concrete rather than cement. Thus, these analyses have been made as generalas possible, distinguishing between cement and concrete where necessary.
RELATED WORK
The effects of moisture plus high temperature on concrete are also important to fireresearchers and to nuclear engineers, and much of their work is published. Heating rates aresomewhat slower, however, and the quantitative contribution of this work to runway erosionanalyses is limited.
Most of the available literature is theoretical. There are three different approaches to theanalyses. The first approach is to assume the mass flow of the liquid phase is negligible andtreat the problem as a flow of gases through a porous concrete. Two arguments for thisapproach are given. Resistance to the flow of liquids through concrete is several orders of
10

magnitude greater than the resistance to gases. In addition, the liquid phase is unlikely to becontinuous from pore to pore. Sahota and Pagni (1979) use this approach to examine thethermodynamics of moisture in the pores of a concrete structure subjected to fire. This work isparticularly pertinent because many of their assumptions are adopted to theoretically study therunway erosion problem. In addition to neglecting the movement of liquid water, Sahota andPagni assume:
1. Local thermal equilibrium exists.
2. Local phase equilibrium exists, and therefore, water vapor pressure is equal to thewater saturation pressure at the pore temperature.
3. Dehydration is neglected.
4. Air and water vapor are ideal gases.
Sahota and Pagni solved the conservation equations for energy and species, employing a finitedifference scheme. Permeability was used as a parameter; however, they stopped the parametricstudy when pore pressures reached 10 atmospheres. Pressures above 10 atmospheres "are notexpected due to microcracking and cracking."
An empirical approach was adopted by Bazant and Thonguthal (1978) to study the heatingof concrete. By fitting test data, they developed relationships between pore saturation and porepressure and between permeability and pore pressure. They did not distinguish between massflux phases. These equations were coupled with conservation of energy and mass and solvedemploying a finite element technique. An unsealed concrete slab was examined (Bazant andThonguthal, 1979) with surface temperature increasing at the rate of 80°C. ,in. At this rate, thesurface temperature reaches 150°C in slightly less than 2 minutes, similar to the rate at whichan APU heats an airfield pavement. The corresponding maximum pore pressure is about 5atmospheres. Huang and Ahmed (1991) used the same empirical model to make a similar study.A 40-cm concrete slab was subjected to fire. The slab had an initial saturation of about 10percent. They found the moisture front to move rapidly in the early stages, and to slow as thefire progressed, requiring approximately 2 hours to dry completely.
The third approach to calculating moisture migration through high resistance porous mediais to use the methods developed to study the migration of moisture through more permeablemedia such as soil. The flow of both liquid and gaseous phases is accounted for, applyingtheoretical correlations between capillary pressure and pore saturation and relative permeabilityand pore saturation (Fatt and Klikoff, 1959; Brooks and Corey, 1964; van Genuchten, 1980;Verma, 1985). Doughty and Pruess (1990) employed this method to determine the feasibilityof constructing a geologic repository for high-level nuclear waste.
While theoretical studies of moisture migration in concrete are plentiful, experimentalstudies are scarce. Difficulties in measuring moisture and pressure on a pore scale are manifest.The most cited experimental study is still the work of England and Ross (1970), and England andSharp (1971), completed in 1971. They heated one end of a 0.6-meter cylindrical concretespecimen and recorded pressure and, using resistance meters, moisture along its length. Thesides of the specimen were insulated to ensure one-dimensional heat and mass transfer. The hotend reached 150°C, although time and space gradients of temperature were very small. Thiswork is of special interest because it provides, in part, an experimental confirmation of the
11
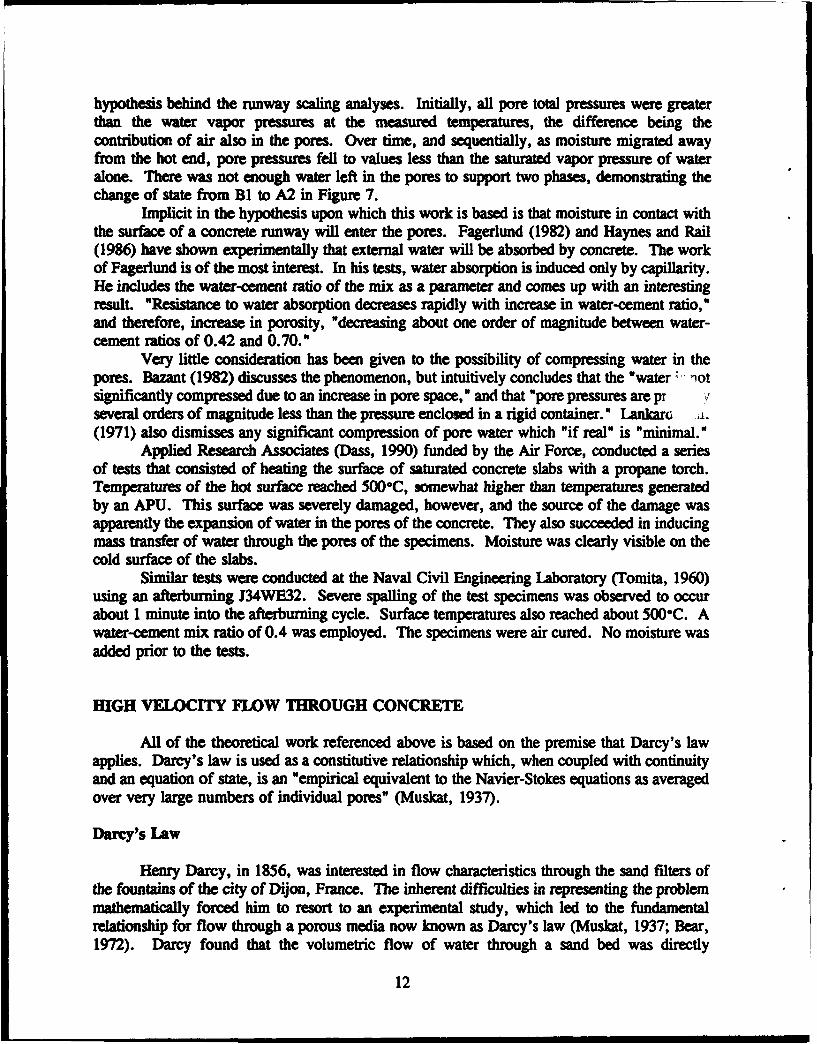
hypothesis behind the runway scaling analyses. Initially, all pore total pressures were greaterthan the water vapor pressures at the measured temperatures, the difference being thecontribution of air also in the pores. Over time, and sequentially, as moisture migrated awayfrom the hot end, pore pressures fell to values less than the saturated vapor pressure of wateralone. There was not enough water left in the pores to support two phases, demonstrating thechange of state from BI to A2 in Figure 7.
Implicit in the hypothesis upon which this work is based is that moisture in contact withthe surface of a concrete runway will enter the pores. Fagerlund (1982) and Haynes and Rail(1986) have shown experimentally that external water will be absorbed by concrete. The workof Fagerlund is of the most interest. In his tests, water absorption is induced only by capillarity.He includes the water-cement ratio of the mix as a parameter and comes up with an interestingresult. *Resistance to water absorption decreases rapidly with increase in water-cement ratio,"and therefore, increase in porosity, *decreasing about one order of magnitude between water-cement ratios of 0.42 and 0.70."
Very little consideration has been given to the possibility of compressing water in thepores. Bazant (1982) discusses the phenomenon, but intuitively concludes that the "water -lotsignificantly compressed due to an increase in pore space," and that "pore pressures are pr Vseveral orders of magnitude less than the pressure enclosed in a rigid container." Lankar6 a.(1971) also dismisses any significant compression of pore water which "if real' is "minimal."
Applied Research Associates (Dass, 1990) funded by the Air Force, conducted a seriesof tests that consisted of heating the surface of saturated concrete slabs with a propane torch.Temperatures of the hot surface reached 500°C, somewhat higher than temperatures generatedby an APU. This surface was severely damaged, however, and the source of the damage wasapparently the expansion of water in the pores of the concrete. They also succeeded in inducingmass transfer of water through the pores of the specimens. Moisture was clearly visible on thecold surface of the slabs.
Similar tests were conducted at the Naval Civil Engineering Laboratory (Tomita, 1960)using an afterburning J34WE32. Severe spalling of the test specimens was observed to occurabout 1 minute into the afterburning cycle. Surface temperatures also reached about 500eC. Awater-cement mix ratio of 0.4 was employed. The specimens were air cured. No moisture wasadded prior to the tests.
HIGH VELOCITY FLOW THROUGH CONCRETE
All of the theoretical work referenced above is based on the premise that Darcy's lawapplies. Darcy's law is used as a constitutive relationship which, when coupled with continuityand an equation of state, is an 'empirical equivalent to the Navier-Stokes equations as averagedover very large numbers of individual pores" (Muskat, 1937).
Darcy's Law
Henry Darcy, in 1856, was interested in flow characteristics through the sand filters ofthe fountains of the city of Dijon, France. The inherent difficulties in representing the problemmathematically forced him to resort to an experimental study, which led to the fundamentalrelationship for flow through a porous media now known as Darcy's law (Muskat, 1937; Bear,1972). Darcy found that the volumetric flow of water through a sand bed was directly
12

pr�pnmianl to the cro-sectional area of the bed and to the bead, and inversely propoitiona tothe leth of the bed,
Q -A 2-1L
The constant of propotionality, K, usually called hydraulic conductivity, is a function of boththe fluid and porous media. Subsequent experiments with different fluids and with differentmedia led to an expression eliminating fluid properties from the constant,
Q k P2 - P,A i L
where V is an average flow velocity, pi is the viscosity of the fluid, and k is a permeability ofthe media and independent of the fluid (Temeng, 1988). MThe various extensions of Darcy'slaw, e.g., to three dimensional flow, to unsteady flow, etc., were first suggested as heuristicge alizations, and were then justified a posteriori by numerous planned experiments as wellas by their success in predicting the flow in porous media systems of practical interest" (Bear,1972).
It soon became apparent that Darcy's law had limitations. At higher velocities, Equation1 did not fit the flow data. Darcy's flow was laminar, and the departure from linearity wasinitially thought to be caused by turbulence. By analogy with the turbulence phenomena
occurring in pipes, Forchheimer (Scheidegger, 1974), in 1901, added a V2 term to
Equation 1,
V2 "2 - '2 - 1 (2)L
Universal correlations for the constants a and P have proven to be elusive.Most researchers now believe that inertial effects, not turbulence, are responsible for the
onset of nonlinear flow through porous media (Ahmed and Sunada, 1969; Firoozabadi and Katz,1979; Noman and Archer, 1988; Geertsma, 1974). Bear (1972) and Wright (1968) bothpostulate a transition regime, still laminar, where inertial forces begin to dominate, followed bya turbulent flow regime. Other opinions exist. Hasnizadeh and Gray (1987) do an order ofmagnitude study and conclude that nonlinearities are due to the effects of increased drag forceson the pore walls. Temeng (1988) suggests that fluid properties are varying. Although therehave been relatively successful modifications to Darcy's law to account for inertial effects, noneof these relationships are valid when the flow is compressible or when it is heated.
13

Porous Media Friction Factors
Some thought has been given to extending Darcy's law to higher velocities by employinga variable friction factor analogous to the Fanning friction factor of pipe flow. Fancher andLewis (1933) measured the flow of air, oil, and water through different types of sand, and, fromthese data, developed friction factor versus Reynolds number charts. These charts closelyresemble those for flow through pipes. There is a definite change from viscous to turbulent flowas flow rate increases. Each type of sand has a different "roughness" and, therefore, plots asa separate curve. Green and Duwez (1951), Cornell and Katz (1953), and others carried thisapproach further. By defining friction factor and Reynolds number in terms of the constants inForchheimer's equation, they were able to develop a single friction factor versus Reynoldsnumber function, valid for several media.
The success of Green and Duwez and of Cornell and Katz in developing friction factorcharts for sintered metals and for sandstone, respectively, plus the common use of friction andexpansion coefficients to predict compressible flow through pipes, suggests that resistance to flowthrough concrete might be defined in a similar manner. There remains the additional problemof accounting for the role of heating.
Derivation of the Flow Equation
Consider a finite segment of a single passageway through a hot slab of concrete such asillustrated in Figure 10. A gas, consisting of a mixture of air and water vapor, is flowingthrough this passage, induced by a difference in pressure between the two ends of the segment.The ends of this segment are each formed by one of the larger (i.e., capillary) pores althoughthe length of this segment is such that it contains many capillary pores and many more smallergel pores. Thus, the fluid velocity at the upstream end of the segment is negligible comparedwith the average velocity through the segment. This flow is being heated, a condition that wouldoccur near the top surface of the airfield pavement, but the flow direction is arbitrary. Make thefollowing assumptions:
1. Energy and mass transport are one-dimensional.
2. All gases are ideal.
3. The porous structure of the concrete is homogeneous.
4. Steady state exists.
The one-dimensionality of the phenomena will become apparent when the results of theanalyses are presented. Resistance to heat conduction into the segment is substantial. Over thefew minutes of interest here, the depth of pavement influenced by the hot jet is very smallcompared to the "footprint" of the jet.
An air/water vapor mixture at the moderate pavement temperatures stipulated remainsclose to ideal.
The assumption of homogeneity is made so that passage cross-sectional area and frictionlosses are constants. This is certainly not true, but experimental input will ultimately benecessary, and this input will be the sum of flows through many such passages. Thus,
14

C, +C2
./4"
CAPILLARY CAPILLARY
PORE PORE
I G
I #I
I 0IL
LLJ STAGNATION
V••) ' S TATIC
LiJ
LSTAGSTATICI-I
LLJ I
Figure 10Qualitative pressur and temperature profiles throuigh a single concrete flow passage.
homogeneity is necessarily built into the simulation. This will become clear when the derivationis complete.
Although the relationship being developed here is constitutive, it is derived over a finiteregion. Therefore, steady state does not necesarily always apply. For the airfield pavementproblem, however, this is moot. The time frame associated with flow rates is several orders ofmagnitude shorter than the time frame associated with the heating of the fluids.
Also shown in Figure 10 are qualitative pressure and temperature profiles through the slaband numbers designating slab locations used in the derivation.
Applying continuity,
mh r (3)
15

where ih is the mass flow rate of gases through the passage, A the effective cross-sectional areaof the passage, p the density of the gases, and V the gas velocity. G is the mass flux of theair/water vapor mixture.
Conserving momentum of the gases,
dP+PVdV + ÷C PV2 dx - 0 (4)
The coefficient Cf can be considered a concrete wall friction coefficient. It is defined as the ratioof the wall shearing stress to the dynamic head of the flow, a technique employed in elementaryfluid mwhanics and in several other approaches to modeling non-Darcy flow (Fancher andLewis, 1933; Green and Duwez, 1951; Cornell and Katz, 1953).
Applying conservation of energy,
dh + d(12~ d= (5)
The variable h is the specific enthalpy of the gases; q is the heat transfer per unit mass betweenthe gases and concrete.
The equation of state for an ideal gas can be written:
P = pRT (6)
where R is the gas constant.Integrating Equation 5 from the first capillary pore to some arbitrary location x,
jdh + fd ( ) = ) dq
1 1 1
h -h - -'I + A2
or, for an ideal gas,
16

,-7 FF T• -F' -ý ... -, -, -1 7-'. 1 - - - - - -' -"q 7+ • •" ,
•'i.t• -''. +L••: 'r• ' '" - : , ..
2c,T1 - castt - c,T1 + * •
.i- T-CRat C Z+V IQI (7)
where c, is the specific heat of the gases, and 1•Q is the total heat transferred to the flow between1and "x.U
Combining Equations 3, 6, and 7, dropping the "x" subscript,
PT, cP MIpR 2p2
and rearranging,
P = pRT÷ -R + pQR2pcp cp
Differentiating, assuming constant specific heat,
dP = RT dp + RG2 dp + QR.dp + -ERdQ (8)2 p 2 C CP C
Combining Equations 3, 4, and 6,
lk dP +2 + Cfdx = 02__p ÷2 dV2pd -2" + .,Crx = 0
0j 2 p
Integrating across the concrete slab,
17

2f fpdP- 2f + fCfdx 0
02•pd 2 2 P, 2
2 f p dp - 2 h(L3 + Cf L =0 (9)T2~ 2 P2,
The friction coefficient C, is the mean value over the length L.Using Equation 8 to evaluate the integral in Equation 9,
2 RI3 3 3 32 pdP I d + - dp 21 2R
2fpdP = p dp + - f-+ --2L pQdp + fp2dQ02 2 C 2 G C, 2 G 2Cp 2
3 [T P I Ri(P R3 3 2
f-fpdP 3 2) + " ' + fpQdp + f(PdQI022 02 ip P2) GP 2c 2
Therefore,
-T (P I(R - 2) n~ + Z, L + ( 2 PQ
22f1(p Q) cT 2 [pQdp+ f pzd] (10)
Solving for the mass flux,
18

I(n(R P(2) + af LF
A theoretical closed form relationship between gas density and heat transfer, necessaryto determine the function fl, is not normally available. The integrals are retained in the flowequation and evaluated numerically. This leads to a function of the form,
f _L " - (C4 P2+*CS P') (10a)
Sis the total heat transferred to the gases as they pass through the segment. C4 and Cs areconstants dependent upon the integration scheme employed. The techniques used in this workare discussed in Appendix A. Equation 11 then becomes:
G = RT11"2[C6 p -C'P32I1"2
[("3LR) Inf(P.) + Cf LI]
C6 1- QC 4cTj
The total heat transferred to the gases is determined from the overall problem. For anideal gas,
Q = c,(ToM-TOI) = cp(To•-T ,)
19

Q T__S_c .T1
and
C,- = i 2c 4 (.-i)(IT.
C7 - 1 +2CS( 3 0'-)
The temperature T03 is the stagnation temperature at location 3.
The equation of state can be used to eliminate the densities in Equation 11:
[P3 [P ,12C,6 P2C 7 P2 =CS _2 7 3
22
C6p - p = T (AJ[C6(P)1T-' i(P)2(T)]P (12)
C6P2 C P2 R' P2)1P)T C7~ T2 13
At thifs stage of the derivation, the unknowns are the flow rate, the pressure andtemperature at station 2, the friction coefficient, and the temperature at station 3. If the lossesbetween stations 1 and 2 are neglected, two unknowns are eliminated, and the mathematics ofthe derivation are greatly simplified. The accuracy of the flow equation is not changedsignificantly. The length of the segment, L, is huge compared to the size of even the largestpores. "Moving" the ends of the segment a few pore diameters to diminish losses will not
20

1.W I I 7 77
noticeably change predicted flows through the segment. Regardless, the loss from station 1 to
station 2 can be assumed lumped into the mean friction coefficient Cf. Equations 12 and 13 nowbecome,
1-6 P2 _C7 P3 = jT..[C (Pi(~l (14)
In(r r2 -In (15)
T-3) LAPIT)TI)
Combining Equations 11, 14, and 15,
LR(C6 _, )'f C7 T -2T' 2S- RT P3
{(P R) I[n~) T.l + :L}
or, in nondimensional form,
XA C - C7 1- 1
-r at' G R'T 3(16)P ,
The unknowns are now the flow parameter,#, the mean friction coefficient, and thetemperature ratio, T1/T3. Use of the nondimensional form of the flow equation simplifies thenumerical procedures required for a solution. This form also makes the effects of heating andfriction easier to evaluate. Therefore, even though the extra step of calculating the flow ratefrom * is necessary, the nondimensional form of the flow equation is employed.
A second relationship is acquired by applying conservation of energy between the staticand stagnation states at location 3,
21

_O V3 (17)T3 2cT.
Combining Equation 17 with the continuity equation and the equation of state and rearranging,
Ti TO) 1~ + 02(R p321 I(TjP
.12(1 , T I/T/- 1(8
GIR1]2 cp T1 (1 1T 03 181[R P3) 1T3 [ T ,)T) i
If the friction coefficient is known, Equations 16 and 18 can be solved simultaneously todetermine * and T,/T3. Once these nondimensional variables are acquired, the gas flow andthe temperature at station 3 of the concrete slab are easily calculated.
The success of the correlation developed by Green and Duwez (1951) for sintered metalssuggests that the friction coefficient be set equal to the sum of a viscous and an inertial term,
Cf=• _ -Tc,Zf + C2 + C2
Cross-sectional dimensions and viscosity terms of the Reynolds number N,. are lumped into the
coefficient C4. C' and C2 have the units mass flux/length and 1/length, respectively. Both aredetermined experimentally. The test procedure and the calculation of the wall frictioncoefficients are described in Appendix B.
The flow parameter derived in this manner describes flow through the total cross sectionof the concrete specimen rather than through a single passage. To account for this difference,a third constant is added to Equation 16. Noting that,
Gww= G(L) * Number of passages
defining
22

Csm~~) *Number of passges
and redefining the flow parameter p,
P1
Equation 16 becomes:
* = G ww R T i I C-3 C 6 C 7 _P i ° T i
P1 1(c-) iAP 3 ( f (19)
f(.~RIn(i(Tf +(CP 3
By lumping C3 into C(, to obtain C,, G,, rather than G, is used to calculate the frictioncoefficient.
Equation 18 is similarly modified,
Equations 18a and 19 together will be used as a constitutive momentum relationship,
analogous to the way Darcy's law is used.
Qualitative Validation of Flow Equation
Entrance losses were neglected in the derivation of Equation 19 (i.e., the pressure dropbetween station 1 and station 2 was assumed very small compared to the drop between station2 and station 3). Reexamine Figure 10. In the absence of heat transfer, this is the onlydifference between Equation 19 and the momentum equation describing Fanno flow. Therefore,for large friction coefficients and under adiabatic conditions, Equation 19 should approach Fannoflow. The comparison is made in Figure 11 (a) using one-dimensional compressible flow tables
P1(Zucrow and Hoffman, 1976) as the Fanno flow "equation." The pressure ratio, -, requiredP3
to choke the flow is used as the dependent variable as the coefficient C2 is increased. Thedifference between the two equations reduces to fractions of a percent long before frictioncoefficients reach values common in concrete.
23

PR 4(.,
PR 1UIES
NOTES:(1) NITROGEN AT 25 C
1.1 (2) C1 - o; C - t(SM ADIABATIC
1
0.9 I0.1 1. 10. 100 1000
C2, M"
11(a) Varying friction.1.2-
PR E009)
PR NOTES:TA ILES (1) NITROGEN
(2) C3 - 1.(3) FRICTIONLESS
1.1
0.9 I
11. 2 2.5
11(b) Varying heating.
Figure 11Pressure ratio required to choke flow, comparing Equation 19 with compressible flow tables.
24

Similarly, when friction is absent, Equation 19 should describe Rayleigh flow. Here, anyerror is the result of approximations inherent in the method used to evaluate the integrals inEquation 10. The comparison is made in Figure 11(b). Errors range from 5 to 10 percent overthe heating rates (temperature ratios) experienced by airfield pavements.
Fanno flow through porous iron, as predicted by Equation 19, is shown in Figure 12.The inertial friction coefficient is used as a parameter. The relationships between flowresistance, flow rate, and choking, characteristic of compressible flows, are apparent in thisfigure.
Heating a compressible flow decreases mass flow rate and increases the pressure ratiorequired to choke the flow, analogous to increasing friction. The ability of Equation 19 tocorrectly predict the effects of heating is shown in Figure 13. (For illustrative purposes, thechoking pressure ratio was increased by maintaining a small flow resistance.)
With restrictions, Equation 19 reduces to the Forchheimer equation for an ideal gas.Combining the constants together as a and 0, the Forchheimer equation can be written(Geertsma, 1974):
2 _p2S L = LRTIG + PRT1 G2
Rearranging,
[p-2, 1 f[•R TI]12 I1 _- (G= T1I"2
-
or
which approximates Equation 19 for adiabatic conditions when the flow rates are low, T, - T 3"- T03, and the log term in the denominator, very small compared to the flow resistance ofconcrete, is neglected.
25

10-2
v- E DECREASE C2 BY FACTOR OF 4
R, POROUS IRON NO. 672
C2 - O.85E*4 t/M
INCREASE C2 BY FACTOR OF 4
NOTES:(1) IRON AT 25 C
(2) THICKNESS - 0.84 CM(8) Cl a 0.1E+6 KG/HR-M*-3; C3 0.15E-1
10 4 I I I I , I
1 3 a 7 PvP 9 11 13 15
Figure 12Effect of friction on the flow of nitrogen through porous iron.
1.0
COOLED FROM 150 C TO 0 C NOTES:
0.8 (1) C1 " 0; C2 a CS t/VT (2) THICKNESS - 1 M
0.8 HE.D CONSTANT AT 150 C
HEATED FROM 150 C TO 300 C
0.4- O.4 // • -•" HEATED FROM 160 C TO 450 C
0.2
0.0 , , I1.0 a P1.53 2.0 2.5
Figure 13
Effect of heating on the flow of nitrogen through a low resistance medium.
26

MEASURED FLWW CHARACTISTICS
There is very little high resistance porous media flow data available that is completeenough to use to develop a flow parameter. The Air Force Civil Engineering Support Agency,also studying the airfield deterioration problems, has contracted Professor M.C. McVay, of theUniversity of Florida, to determine the permeability of different mixes of concrete. Flowparameters developed from McVay's data are being used in this work. Appendix B describesthese flow tests and the preparation of the concrete.
Flow rates through porous metals and through sandstone were published in the 1950s.The work was well done, and examination of flow parameters developed from these datacontributes to a validation of Equation 19. The porous metal data are particularly valuable sincepressure ratios were increased high enough to choke the flow.
Concrete
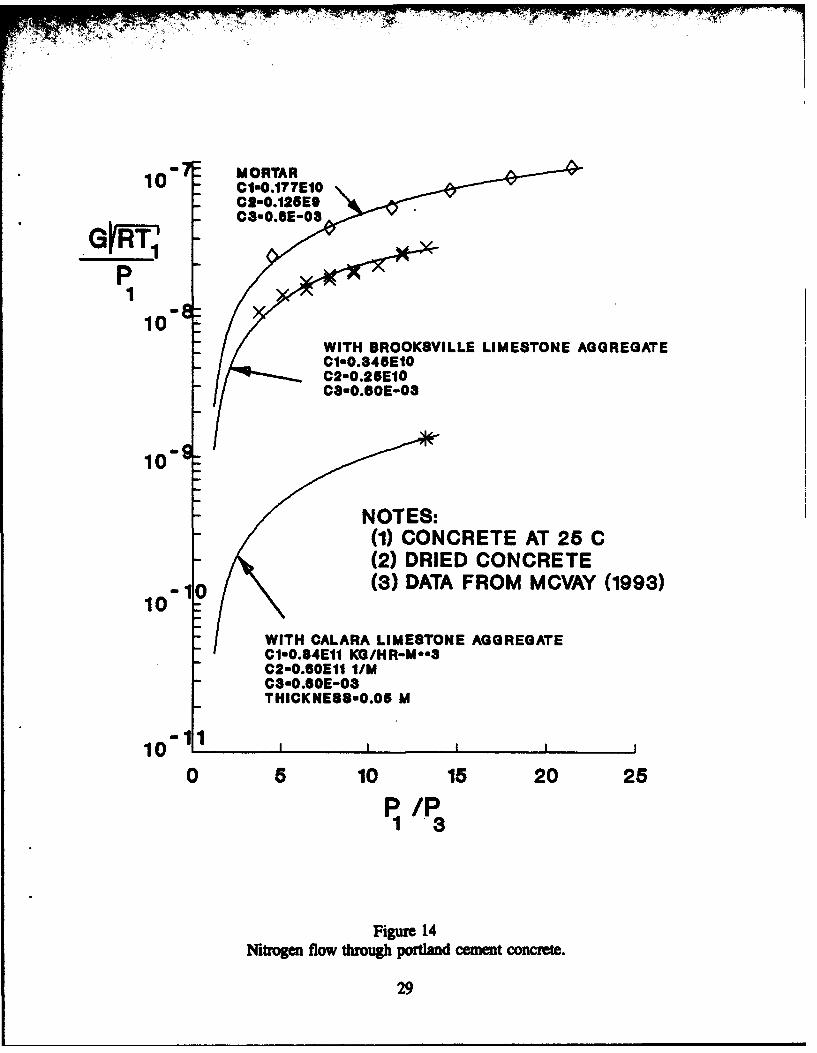
Parameters describing the flow of nitrogen (air) through three mixes of concrete arecompared in Figure 14. Friction coefficients were set to make Equation 19 match the flow dataof McVay and Rish (1993). Maximum test pressure ratios are nowhere near high enough tochoke the flow. The total number of flow passages was assumed to be unaffected by theaggregate. The aggregate acts as an obstacle, increasing the effective length of the passageways.The area coefficient C3 is independent of the aggregate; the flow resistances C, and C2 vary withthe aggregate.
The extremely high resistance to flow through concrete is obvious. This will becomeeven more apparent by comparing concrete flow parameters with flow parameters of porousmetals and sandstone that are discussed in the next section. Also obvious is the effect thataggregate has on flow through concrete. There are two orders of magnitude difference betweenflow parameters of mortar and of concrete made with the impervious Calara limestone.
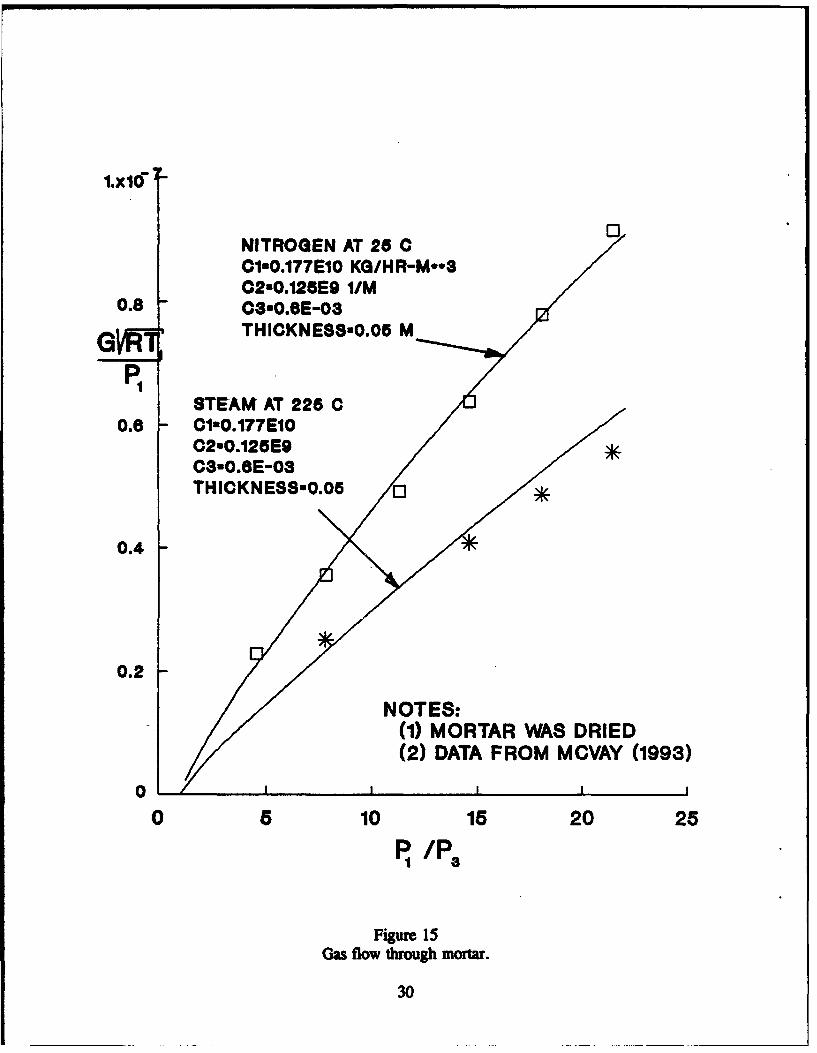
Figure 15 compares flow parameters of steam at 2250C and nitrogen at 250C through thesame mortar. The resistance coefficients for both gases are identical. This is extremelyimportant. The coefficients of Equation 19 depend only upon the porous medium; they areindependent of the fluid. When heated by a jet exhaust, a mixture of steam and air is beingforced through the pores of the concrete airfield pavement. If C1 and C2 were dependent uponthe composition of the gas, they would be changing with both time and depth into the concrete.A model based on Equation 19 would become very clumsy.
Other Porous Media
The most extensive measurements of flows through high resistance porous media are stillthe data of Green and Duwez (1951), measuring the flow of nitrogen through unheated porousmetals. These data are plotted as flow parameter versus pressure ratio in Figures 16(a) and (b).The gas flow through these 0.6-cm specimens chokes at very moderate pressure ratios. If thesewere runway material, gases would have to be treated as "compressible."
Noted on these figures are the coefficients CI, C2 and C3 used to fit Equation 19 to thisdata. Several observations are pertinent. The difference in flow characteristics through "ironno. 672" and through "iron no. 641" appears attributable to a change in flow resistance (i.e.,through a single passageway); more nitrogen is flowing through iron no. 672, but this metalchokes at a lower pressure ratio. The friction coefficients for iron no. 641 are more than an
27

order of magnitude greater. The restricting flow area, proportional to the coefficient C3, isroughly the same for the two metals.
"11C difference in nitrogen flow through "stainless steel no. 1" and through iron no. 641appears attributable to differences in both the flow resistance and the number of flow passages.The iron chokes at a much lower pressure ratio, implying a lower flow resistance. At highprsure ratios, however, flow through both metals is about the same. There must be more flowpassages through the stainless steel.
Characteristics describing the flow of air and nitrogen through a higher resistance porousmedia, sandstone, are shown in Figure 17(a). The coefficients were set to match the flow dataof Cornell (1952). Experintal pressure ratios were not increased high enough to choke theflow. Even though the flow equation fits the data extremely well, there is not enoughinformation to uniquely determine the coefficients C1, C2, and C3. This is discussed in thecomments below.
Figure 17(b) shows flow parameters of different gases through brown dolomite. Theresistance coefficients were set to match the air and nitrogen flow data. Using these samecoefficients, flow parameters for methane and helium are plotted and compared with data.Although the resulting 'fit* is not as good as shown above for nitrogen and steam flowingthrough concrete, considering the huge differences in properties of these gases, the flowparameters are certainly encouraging.
Cmmnents
All the flow tests cited were conducted under adiabatic conditions. A complete validationof Equation 19 requires some flow measurements of heated gases.
The exit static temperature, T3, was not measured on any of the flow tests describedabove, and this variable probably cannot be accurately measured. Therefore, there are twoequations, Equations 16 and 17, to solve for the four unknowns C1, C2, C3, and T1/T 3. Theresistance coefficients C1 and C2 are dominant at low and high flow rates, respectively, and canbe determined independently of each other. If test pressure ratios are increased high enough tochoke the flow, as was done for the porous metals, the exit static temperature is known from therelationship (Shapiro, 1953):
T3 2
T03 Y+1
where y is the ratio of specific heats. Since T, and T3 are boundary conditions, C2 and C3, andthen C1, can be determined uniquely. If the test flows were not choked, a unique solution is notpossible. Coefficients that accurately predict mass flows can be determined, however, and thisis often sufficient for modeling.
28
pRr -- 4'. .
10 CIO.177E10
10WITH BROOKSVILLE LI MESTONE AGG REGATE
10
(1) CONCRETE AT 25 C
(2) DRIED CONCRETE
10 -10 (3) DATA FROM MCVAY (1993)
WITH CALARA LIMESTONE AGGREGATECI-O.84E11 KG/HR-M**3C2u0.6OE1I IIMC3*O.6OE-03THICKNESS-O.O6 M
0 5 10 15 20 25P /P1 3
Figure 14
Nfitrogen flow through portlad cemet concrete.
29
1.x10"
0NITROGEN AT 20 CC01".177E10 KG/HR-M**8C2"0.126E9 I/M
0.8 C3w0.8E-03, THICKNESS"O.05 M
1STEAM AT 225 C
0.8 C-10.-177E10C2-0.126E9C3-0.8E-03THICKNESSO.06 0
0.4
0.2
NOTES:(1) MORTAR WAS DRIED(2) DATA FROM MCVAY (1993)
0 8 10 18 20 25
P /P
Figure 15
Gas flow through mortar.
30

-4.
26 -10
C, - 0.1E+6 KG/HR-rn020 ct - 0.6E+4 m"1
Ca - 0.15E-1
15 C1 " 0.145E+9 DATA REF: GREEN & DUWEZGN, Ca - 0.2E+5 •J. APPL MECH.
C, " 0.188E-1 MARCH, 1951' 1 0 --- +
o Ci " 0.14E.10C2 a 0.95E*5Ce - 0.275E-1
00 5 10 15 p 20 25 30 35 40
/Ps
Iron #641 + Stn Steel #1 * Iron #672
Figure 16(a)Flow of nitrogen through porous metals.
POREX GRADE 4:0.020 C1 - 0.135E#9
C2 - 0.32E.4CS * 0.965E-1++
0.015 i NOTES:
ST(1) DATA FROM GREEN & DUWEZ (1951)R (2) THICKNESS - 0.6 CM
(3) ADIABATIC0.010
IRON #672:C1 - 0.15.6 KG/HR-M.°SC2 a 0.68E*4 1/M
0.005. CS - 0.15E-1
0.000
1 2 a 4 a 6 7 8 9 10
P/P13
Figure 16(b)Flow of nitrogen through porous metals.
31

-3
10 WILCOX" SANDSTONE
Cl-O.38GE1O KG/HR-M**3
C3-0.SSE-1Pi THICK NES$-O.02798 M
10' 4* AIR FLOW DATA
X NITROGEN FLOW DATA
"BROMIDE" SANDSTONE10 • -~~
C2-0.425E6
C3-0.13E-2
THICK NESS-0.0177
DATA REF: D. CORNELL, PH.D DISSERTATION
UNIV OF MICHIGAN, 19521 0 " I I
0 10 20 30 40 50 60
P/P1 3
Figure 17(a)
Flow of nitrogen and air through sandstone.
32

DATA REF: D. CORNELL, PH.D. DISSERTATION
25 x10 "6 UNIV OF MICHIGAN, 1962
AIR/NITROGENFLOW PARAMETER
20-
GP115 -
HELIUM FLOW PARAMETER10
METHANE FLOW PARAMETER
5-RESISTANCE COEFFICIENTS FOR ALL GASESC1-0.26E9 KG/HR-M--3; C2-0.96E6 1/MC3-0.39; THICKNESS-O.0229 M
0 1 1 1 1
0 5 10 15 20 25 30 35
P1/P3
+- AIR * NITROGEN
0 METHANE x HELIUM
Figure 17(b)
Flow of different gases through brown dolomite.
33

EFFECTIVE FLOW AREA
The flow parameters were developed from gas flow data that were acquired using dryconcrete as the medium. In order to accurately predict pore pressures, the additional flowresistance provided by liquid water in the pores must be accounted for. This is analogous toadding a relative permeability to Darcy's law.
For this study, the effect of liquid water will be included as a change in the concrete flowparameter via a change in effective cross-sectional area of the flow passages. Data sufficient todetermine these effective areas are not yet complete. In the meantime, relative permeabilitieswill be used. There are many such functions published in the soil science and petroleumliterature. The function most apropos to this work is the relative permeability, k, develot.d byVerma et al. (1985) for the concurrent flow of steam and water through an unconsolidated porousmedium (Verma et al., 1985; Doughty and Pruess, 1990),
k = 1.259 - 1.7615S + 0.5089S2
S is the pore saturation, the volume fraction of liquid water in the pores. This function isapplied to the cross-sectional area in Equation 19 through the coefficient C3,
C3 A Passages * (1.259 - 1.7615S + 0.5089S2)
MATHEMATICAL SIMULATION OF AIRFIELD PAVEMENT
Now consider the slab as a homogeneous continuum, a cement/aggregate solid matrixinterspersed with pores filled with air and/or water. Some of these pores connect to formpassages through the slab.
Make the following assumptions:
1. Energy and mass transport are one-dimensional.
2. Air is an ideal gas; mixtures of air and water vapor are ideal.
3. Local thermal equilibrium exists; the temperature of the fluids is the same as thetemperature of the surrounding solid.
4. Movement of liquid water is negligible.
5. Phase equilibrium exists inside each pore; if there is liquid water in the pore, thewater vapor pressure is its saturation pressure.
6. There isno dehydration; the physical properties of the concrete remain constant.
34

7. Capillary forces are negligible.
Homogeneity and the first two listed assumptions were discussed during development ofthe flow equation. The assumption of thermal equilibrium is based upon the huge passage wallto cross-section area ratios occurring in porous media. Thus, as suggested by Sahota and Pagni(1979), "the response time for local heat transfer between the fluid and the solid is several ordersof magnitude smaller than the times of interest." Sahota and Pagni also offer arguments forneglecting movement of liquid water. They emphasize the very great resistance to the flow ofliquids through porous media compared to the resistance to gases. They also point out that "theliquid, particularly at low moisture content, is present in the pendular state, that is, the liquidin different pores is not interconnected." McVay and Rish (1993) measured mass flow rates ofnitrogen and liquid water through samples of concrete, finding that the gas flows were about 300times greater. Arguments supporting the assumption of phase equilibrium are more tacit. Thehigh pressure flow of air and water vapor through the pores will tend to break up the liquidwater, forming large vapor-liquid interfacial areas, and, in addition, transporting both phasestoward/away from these interfaces.
It is stipulated that there is no dehydration. These analyses are valid only when thechemical and physical structure of the concrete does not vary.
Governing Equations
Figure 10 illustrates the problem. The unknown variables are:
G,, = Mass flow rate of air per unit cross-sectional area of the concrete slab.
G,,.P. = Mass flow rate of water vapor per unit cross-sectional area of the slab.
Gt, f= Total flow rate of air plus water vapor.
Mi = Mass of the air in the slab.
Mp., f= Mass of the water vapor in the slab.
M,0'r = Mass of the liquid water in the slab.
PP f = Pressure of air in the pores.
Ps"= Pressure of the air-water vapor mixture in pores.
PP, ff = Pressure of water vapor in the pores.
PPwur = Pressure of liquid water in the pores.
35

Qs - Energy of vaporization/condensation.
T - Slab temperature, also the stagnation temperature of the gases.
Vs. =f Volume of air plus water vapor in the slab.
Vw - Volume of liquid water.
v,, -- Specific volume of water vapor.
v.,.• - Specific volume of liquid water.
These variables are to be determined in terms of both time, t, and location, x.Applying conservation of energy to the slab,
a(pcT) + a(G ,,cT) = -LkaT + (20)8t ax ax + Qf ax
The heat capacity, pc, and the thermal conductivity, k, are mass averages of the concrete andliquid water. The specific heat of the gas mixture, cp, is the molar average of the air and watervapor.
Q,. =h, aM.,v= 15 "at (21)Vt'W at
The heat of vaporization of water, hf,, is assumed constant. Vw is the total volume of the slab.Conserving the mass of the air and the water,
V1a at ax
V1 88 8 0
VA,,1 a +tV + ax + 0 (23)
Air is assumed to be an ideal gas,
Pak Vow = M* RIT (24)
36

IM .•... .
where ILk is the gas constant for air.Equations of state of the compressed water and saturated and superheated water vapor
were acquired from the steam tables of Keenan and Keyes (1936) using provided fits of the data,
PM., f2(T) (25)
vM = f3(T) (26)
vms = f4(TI Pvo) (27)
Using the definition of specific volume,
V..=.,W - vs, (28)
v,= V,.W (29)
The air-water vapor mixture is considered a mixture of ideal gases.
=* (~G 3 . (30)
G r, ) p( _- Gw.. (31)
P& + VWW PSM(32)
The pores are always filled with either water or gas or both,
VSM + VWa = eVW (33)
37

where e is the porosity of the concrete.The final equation required is a relationship between the gas and liquid water pressures
inside the pores. This pressure difference is a function of the interfacial tension between the twophases and the size and shape of the pores. The presence of air further complicates such arelationship. For this work, capillarity is assumed negligible,
pow =P (34)
The error introduced by neglecting capillarity is difficult to appraise. Defay and Prigogine(1966) estimated the effect of curvature on the difference in pressure inside and outside watervapor bubbles at 18°C. When the bubble has a radius of 10-r mm, the difference is about 1.4atmospheres; when the bubble has a radius of only 10-3 mm, the difference is about 140atmospheres. Concrete pore radii range roughly between 10-5 and 10-3 mm. In the largercapillary pores, therefore, surface tension forces are small. Capillarity should have only a minoreffect on mass flow rates through a segment of concrete. In the smaller pores, capillarity willbe significant. This will tend to "skew" pore pressures through the interior of the concretesegment and will affect saturation of smaller pores.
Initial and Boundary Conditions
The concrete is initially at the ambient temperature T.. When the jet is started, thesurface temperature of the pavement, T., is steadily increased,
T T. @0 - X . L, t s 0
T = Tw(t) @X=0, t> 0
T = T @X=L,t>-0
The effects of the jet do not penetrate the concrete beyond a depth of L.The initial saturation of the pores, S., is stipulated. The liquid and vapor phases are in
eouilibrium. The water vapor pressure is the saturated vapor pressure at T.. Air occupies thesame volume as the water vapor. The initial pore pressure is equal to the ambient pressure, P..
38

SCS.VC dd
MVW - e . 0 &x-L,tS 0VM
. (1 -S.) V - @W 0 s x. d L, t s 0
A constant cement porosity, e, of 0.25 is assumed for this work.
Ct Procedures
Equations 18 through 34 are solved simultaneously for the 16 variables listed above andthe temperature T3 . Finite differences are used to approximate Equations 20, 22, and 23. Singlestep iteration, with an option to apply relaxation, is employed. Details of the computationalprocedures and a listing of the computer code, called POREFLOW, are included in AppendixA.
THEORETICAL RESULTS
The flow parameter for mortar, shown in Figure 15, was used in these analyses. Thescaling occurs in the cement. Furthermore, there is little aggregate at or close to the surfacewhere the maximum pressures are occurring. Neglecting the flow resistance of the aggregate,at worst, results in higher predicted flow rates and lower predicted pore pressures.
APU Heated Pavements
The effect of moisture on F/A-18 APU heated concrete pavements was examinedtheoretically using POREFLOW. Pavement surface temperatures measured by Houck et al.(1992) were used as a boundary condition. These temperatures are shown in Figures 18(a) and(b) along with the curve fit that was added to the code.
An important initial condition is the saturation of the cement. The greater the initialsaturation, the greater the thermal expansion of the water and the greater the probability of highpore pressures. Complete saturation is unlikely; some residual air is expected to always remainin most pores. This value has never been determined for concrete, however. Osoba et al.(1951), studying the flow characteristics of oil and natural gas through rock, measured a gasresidual of about 10 percent. Verma et al. (1985), in a laboratory study of the flow of steamand water through 100-Irm glass beads, measured a steam residual of also about 10 percent. Thepossibility of phase changes makes these measurements very rough.
Figure 19 was developed to examine the effect of the initial saturation on pore pressureswhen the concrete is heated by the exhaust of an F/A-18 APU. Pore pressure just below thepavement surface is the dependent variable. The key point shown by this figure is that an initial
39

140
kf•12o * ~*I 0 -
S100
wIL x2 80 xw xI- • T8URFTAMB#48.84oTIMEo.O.223 XwU 60 xIý-w
" 40 DATA REF: NIL AIR MARFARE CENTERZ REPORT SA-162R-910o 20
0 1I , 1 i L I
0 10 20 30 40 50 60 70ELAPSED TIME, MINUTES
3 RTL * GMM + MES X COOL DOWN
Figure 18(a)Surface temperatures of concrete heated by an impinging F/A-18 APU.
DATA FROM AUSTIN, ET AL. (eNs)
T1URFAMI-UT. 1"144
iM400m ~"W81mL
200
FIA-181 AMU100
0
0 100 200 300 400
ELAPSED TIME, SECONDS
Figure 18(b)Surface temperatures of concrete heated by an impinging VSTOL jet.
40

30-
25
INITIAL SATURATION-O.99
20
CDCD
wu: 16
w0S10 INITIAL SATURATION-0.985
- "INITIAL SATURATION-0.96
0
0 2 4 6 8 10 12ELAPSED TIME, SECONDS
Figure 19
Concrete pore pressures at a depth of 0.1 mm when pavement heated by exhaust of F/A- 18 APU.
41

saturation less than 95 percent has little influence on pore pressures. For the F/A-I18 APU study,the initial saturation was set at 90 percent, i.e., assuming a maximum residual air of 10 percent.
Results of the POREFLOW simulation are summarized in Figures 20(a) through 20(c).The first 120 seconds following APU startup were simulated. This is the period during whichconcrete temperatures would be increasing most rapidly (see Figure 18(a)).
Figure 20(a) shows predicted pore pressure profiles down through the cement plotted afterdifferent intervals. Pore pressures were set initially at one atmosphere. The pavement surfacepressure remains at one atmosphere. Pore pressures are increasing with time, but at a decreasingrate. After 120 seconds, the maximum APU induced pore pressure is only about 2 atmospheres.After the first 30 seconds, the maximum pressure gradient, which occurs at the surface, barelychanges. The depth of the maximum pressure is slowly increasing with time.
As explained previously, the pore pressure is the sum of the water vapor pressure and thepressure of any air in the pores. Vapor pressure is a function of pore temperature, which isincreasing slowly and at a decreasing rate at all depths, as shown by Figure 20(b). The airpressure is a function of the mass and volume of the air in the pores as well as the temperature.Near the pavement surface, air is being forced out of the pores faster than the air volume isdecreased by the expansion of the liquid water, i.e., by the increase in saturation. Thisphenomenon is illustrated in Figure 20(c). The pore air pressure is actually decreasing near thesurface. The increase in vapor pressure and decrease in air pressure cancel each other, and thepore pressure barely changes. Away from the surface, both the vapor pressure and air pressureare slowly increasing with time.
VSTOL Heated Pavements
To estimate potential runway damage when the cement is heated more rapidly, apavement surface temperature versus time boundary condition was formulated to simulatetemperatures that would be induced by the exhaust of a VSTOL taking off or landing. Thesesurface temperatures are shown in Figure 18(b). The curve labeled Harrier "max" wasextrapolated from laboratory data (Austin et al., 1993) in which the heating was almost a stepfunction. The concrete was shielded until the test engine powered up to Harrier "conditions,"and then the shield was mechanically yanked off. Pavement temperatures beneath an actualVSTOL exhaust would increase more slowly as the engine was started up before takeoff or theaircraft approached for a landing. With this in mind, the heating rate was arbitrarily decreased.The curve labeled "VSTOL" was used as a boundary condition and POREFLOW again was usedto predict the influence of moisture on airfield pavement.
Figures 21(a) through 21(f) were developed assuming an initial saturation of 0.9. Exceptfor the higher pavement surface temperature, initial and boundary conditions are identical tothose used to study the effects of the APU exhaust. The results are strikingly different. Porepressures at the surface (Figure 21(a)) increase very quickly to values high enough to cause theconcrete to fail. This is primarily due to an increase in pore air pressure. Pore temperatures arenow increasing rapidly (Figure 21(b)), and thermal expansion of the liquid water is filling up thepores (Figure 21(c)). This phenomenon is analogous to moving up from state "Bl" on Figure7. Unlike the APU heated concrete, the pore air does not have time to escape (Figure 21(d)),and is compressed by the expanding water. The pressure of water vapor in the pores, althoughincreasing, contributes little to the total pore pressure that fails the concrete (Figure 21(e)).
42

0 04i0~ ~ , 0, "4ii U 2u ~ 4WO
~ N004
d 0 N
mv 3wOd Mo mnOIiveffr
r.Ow0
0)0
0 co
5C p
ma
- 00
0)0
41
*~ 0>
.44
'44
o4o
- q 0 0 9-4
0 r.
NAY~~~~ 3MlS0dU

INITIAL SATURATION - 0.9.
40AFTER 8 SECONDS
INITER SATUATONDS0.
10120 AFTER 8 SECONDS
00 0.5 1 1. 2 .5 3
DEPTH. MM
Figur 21 (a)Predicted pore pressures through concrete paveent heated by VSTOL exhaut.
INITIAL SATURATION -- 0.9140r
120- AFTER 8 SECONDS
wdlO0AFTER 7 SECONDS
5 SECONDS
CIU
0
U
20 AFTER 1 SECOND
00 0.5 1 1. 2 2.5
DEPTH. MM
Figure 21(b)Predicted temperature profiles through concrete pavements heated by VSTOL exhaust.
44

INSYW. SATURATION - 0.9
7aSSECOND
0.6 5 SECONDS
AFTER I SECOND
2ZS0.6
iz
I 0.4
0o.
00 0.8 1 1.6 2 2.5 3
DEPTH, MM
Figure 21(c)Predicted satura through concret pavements heated by VSTOL exhaust.
INITIAL SATURATION - 0.9
1AFTER a SECONDSAFTER 7 SECONDS
0.98-AFTER 1 SECOND
Ic 0.96
Q 0.94ma AFTER 8 SECONDS,
0I0.g
0.92-
0.9,0 0.8 1 1.8 2 2.5 3
DEPTH. MM
Figure 21(d)Predicted air in pores of concrete pavements heated by VSTOL exhaust.
45

INITIAL SATURATION - 0.9so 140
NOTE: HEATED BY VSTOL EXHAUST
12040
TEMPERATURE100
So.30
680m a_
S0060IL 20 i.
SAIR -40
PRESSURE10
PORE PRESSURE -20
VAPOR PRESSURE
0 0
0 2 4 B a 10ELAPSED TIME. SECONDS
Figure 21(e)Change in concrete pressure and temperature at a depth of 0. 1 mm.
INITIAL SATURATION = 0.9
SATURATION(VOLUME FRA N)
0.98.
w0
S0.96z0
• 0.94
PORE AIR(MOLE FRACTION)
0.92
0.90 2 4 6 8 10
ELAPSED TIME, SECONDS
Figure 21(f)Change in concrete pore air and saturation at a depth of 0. 1 mm.
46

Figures 22(a) through 22(f) were developed assuming a VSTOL exhaust and an initialsaturation of 0.7. Again, pore pressures at the surface increase to values high enough to causethe concrete to fail (Figure 22(a)). Pore temperatures are increasing at roughly the same rate(Figure 22(b)), and again the expanding water is filling up the pores (Figure 22(c)). This time,there is more air space to fill, and the air has time to escape (Figure 22(d)). This phenomenais analogous to the phenomena occurring in the APU heated pavement discussed above.Temperatures are much higher, however, and vapor pressures become significant (Figure 22(e)).The pavement would probably fail due to the pressure of the water vapor in the pores before theliquid water filled up the pore and was compressed.
The phenomena of moisture induced high pore pressures is perhaps better understood aftercomparing Figures 21(e) and 22(e) and comparing Figures 21(f) and 22(f).
Figures 23(a) through 23(d) were developed assuming a VSTOL exhaust and an initialsaturation of 0.2. Pore pressures reach about the same levels they do when the pores are moresaturated (Figure 23(a)), but it takes twice as long. Maximum pressures do not occur at thesurface. Pressure gradients are not as severe as when the pores are more saturated. The rateof increase in pore temperatures is slightly higher due to the decrease in heat capacity caused bythe decrease in the mass of water (Figure 23(b)).
These differences are all attributable to the low initial saturation. Vapor flowing out ofthe pores is sufficient to start draining the pores of the little liquid water that was initiallypresent. This draining begins at the surface and progresses into the concrete as shown in Figure23(c). Most of the air also leaves the pores near the surface. Maximum pressures now occurin the hottest pores that still have some liquid water and air in them. Pore pressures in the "dry"pores are induced primarily by superheated steam and perhaps a small amount of air passingthrough.
Figure 23(d) plots these phenomena together in a pore near the surface. After about 20seconds, most of the air has been forced out of these pores. At this time, there is a decrease inthe rate of increase of pore pressure. After about 42 seconds, the pore has been drained; thereis not enough water left in the pores to support a liquid phase. This time there is an evensharper decrease in the rate at which pore pressures are increasing. After the pore is "dry,"further increases in pressure are the result of further superheating the steam.
EXPERIMENTAL RESULTS
To substantiate the predictions of the model, small blocks of airfield pavement concretewere heated by a small burner at rates corresponding to an F/A-18 APU and then a VSTOLenvironment. Heating rates were determined by monitoring the surface temperature of thesamples. The burner was set at whatever rate was necessary to duplicate the increases in surfacetemperatures shown in Figures 18(a) through 18(b).
Only the surface temperature was measured. Microscope photographs of the surfaceswere taken at various stages of the heating. For each test, two concrete specimens were heatedat the same rate. One of the specimens was "completely" saturated; the other was dried toremove all evaporable water. The dried specimens were used to identify failure modes notcaused by pore water.
Preparation of the samples and details of the test procedures are discussed in Appendix C.
47

INITIAL SATURATION - 0.7A 0E
AFTER 60 SECONDS
80-uso
IL30-
S 3AFTER04 SECONDS
10 18 SECONDS
0
0 0.5 1 1.8 2 2.5 3DEPTH, MM
Figure 22(a)Predicted pore pressures through concrete pavements heated by VSTOL exhaust.
INITIAL SATURATION - 0.7300
us ~ AFTER 160 SECONDS
L 200-
45 SECONDS-.ý,
1- 1500
500 100 AFE 15 SECOND
0 0.8 1 1.5 2 2.5 3DEPTH. MM
Figure 22(b)Predicted temperature profiles through concrete pavements heated by VSTOL exhaust.
48

INITIAL SATURATION - 0.71 78 SECONDS
0 ESECONDS
a 45 SECONDS0. 30 SECONDS>0.
> AFTER 15 SECONDS
0
i- 0.4
w0E
0.2
00 0.5 1 t1 2 2.5 3
DEPTH. MM
Figure 22(c)Predicted saturation through concrete pavements heated by VSTOL exhaust.
INITIAL SATURATION - 0.70.8
AFTER 15SECONDS
i 0.6
LI.'U.j0
S0.4OAFTER 30 SECONDS
0 48 SECONDS
0.2
AFTER 60 SECONDS
00 0.5 1 t5 2 2.5 3
DEPTH, MM
Figure 22(d)Predicted air in pores of concrete pavements heated by VSTOL exhaust.
49

INITIAL SATURATION - 0.725 250
NOTE: HEATED BY VSTOL EXHAUST
20- 200X 0
TEMPERATURE uiUr
cc-is- 18150 c
tu us
i-.
10- PORE 100PRESSUR
5 VAPOR PRESSURE 50
0 0A PRESSURE
0 a 10 15 20 25 30 35 40ELAPSED TIME. SECONDS
Figure 22(e)Change in concrete pressure and temperature at a depth of 0. 1 mm.
INITIAL SATURATION - 0.71
%- SATURATION4 0.8 (VOLUME FRACTION)U'
0.
0z 0.60. NOTE: HEATED BYV/STOL EXHAUST
0.4o)
PORE AIR0.2 (MOLE FRACTION)
00 20 40 60 80
ELAPSED TIME, SECONDS
Figure 22(f)Change in concrete pore air and saturation at a depth of 0. 1 mm.
50
INITIAL SATURATION - 0.260
AFTER 120 SECONDS
I L -\
AF E 60 S C N D S
2O
AFTER 90 SECONDS
10-
40
0 0.5 1 1.5 2 2-5 3
DEPTH. MM
Figure 23(a)Predicted pore pressures through concrete pavements heated by VSTOL exhaust.
INITIAL SATURATION'- 0.2400O
S350! AFTER 120 SECONDS
M ~ 6 AFTRCONDEOND
300,
cc
OFAFTER SECONDS
S.
200
AE 30 S C ODS
AFTER15 SECONDS
10-
0
0 0.5 1 1.5 2 2.5 3
DEPTH, MM
Figure 23(b)Predicted temperature profiles through concrete pavements heated by a VSTOL exhaust.
51

INITIAL SATURATION - 0.20.4
AFTER 120 SECONDS
~0.35- 36 90 SECONDS~80 SECONDS
0.3 3D SECONDS
15 ¶ SECONDS
S0.25-0
0
g 0.16
* 0.1
0
0.05
00 0.5 1 1.5 2 2.5 3
DEPTH, MM
Figure 23(c)Predicted saturation through concrete pavements heated by VSTOL exhaust.
INITIAL SATURATION - 0.225 1
20 0.8
1NOTE. HEATED BY CCVSTOL EXHAUST 0.6 0
CD 0Uj zcc 0
w 10 0.4
PORE PRESSURE
5 -~0.
PORE AIR 0.2
SATURATION
0 1 00 20 40 60 80 100 120 140
ELAPSED TIME. SECONDS
Figure 23(d)Change in pore pressure and pore air at a depth of 0. 1 mm.
52

None of the specimens heated at the APU rate showed any indication of scaling or anyother type of surface damage other than an occasional crack. A layer of translucent crystalsformed on the surface of the saturated specimens, as shown in Figure 24, which could cover poresize damage.
Three of the six saturated specimens heated at the VSTOL rate failed. In two cases, thefailure mode was an explosive spall rather than a gradual scaling. Only the cement failed. Nodamage to the aggregate was apparent on either spall. Figure 25 is a 4X photograph showingthe crater of a spall type material failure of cement between and around several pieces ofaggregate. Figure 26 is a 25X photograph showing the edge and floor of this crater. Note thatthe cement is torn off the aggregate beneath the surface. This particular specimen failed whenthe surface temperature reached 230°C. The other spall occurred at about 300°C. In the thirdfailure, the cement was not torn completely away but formed a fissure as shown in Figure 27.This figure is a 15X photograph. Steam could be observed leaving the concrete through thisopening.
Cracks also formed in the specimens heated at the VSTOL rate. This damage occurredin both the saturated and dried specimens and can be presumed to be caused by the unevenexpansion of the cement and aggregate. The cracks formed through the cement and along theinterface with the aggregate (Figure 28). Cracks also formed in small oases among thecrystallized surfaces.
CONMM
This research was based upon the hypothesis that the concrete failure was the result ofthermally expanding pore water filling up the pore volume and then being compressed. A majorcorollary of this work is that pore pressures can exceed the tensile strength of concrete via threemechanisms:
1. High saturated water pressures.
2. Water expanding against the air in the pores.
3. Water expanding against the solid walls of the pores after all air has been forced out.
The failure mode, and whether failure occurs, was found to be dependent upon the initial poresaturation and the heating rate, i.e., type of engine. Although not included as a parameter in thiswork, it is presumed that the type of cement and the mix characteristics, since both influenceflow resistance, also influence mode of failure.
Perhaps the specimens used in the experiments should have been made of mortar ratherthan concrete. The model assumes mortar. Non-moisture related failure modes such asexpansion cracks would have been eliminated.
The apparent scaling of airfield pavements by the F/A-18 APU was the catalyst for thisresearch. The work was expanded to include potential pavement problems generated by VSTOLaircraft during takeoff and landing. No changes in the model were made for the VSTOL study.For example, dehydration of the cement was not included. At VSTOL temperatures, dehydrationreactions would change the evaporable water in the pores of the cement and probably change theresistance to flow through the cement.
53

Figure 2425X photograph of saturated concrete subjected to
six cycles of a simulated F/A-18 APU exhaust.
.*:V . ' '"
Figure 25Crater formed by explosive spall of saturated concrete
heated at a rate equivalent to a VSTOL taking off.
54

-' IWI
*
WYV
ha
U
4'-
0
p
'CK0.CuI4
pI'I ..
S
S
� ?� 455

1 ,,
Figure 27Fissure formed in saturated concrete heated at a rate
equivalent to an impinging VSTOL aircraft jet.
4 e 4
Figure 28Surface of dried concrete heated at a rate equivalent to a VSTOL taking off or landing.

Pon sim dm VM but nev observed. Epe imentally induced failureswere in the fom of an explohive spell, or cracks, rather tha gradual scaling. Perhaps airfieddpaveonun we rarely completely saturated.
CONCLUSIONS
Moisture in the pores of the cement is unlikely to be the primary cause of material failurein airfield pavements heated by the F/A-18 APU. The pavement surface reaches a maximumtof only about 1300C. The saturated vapor pressure at this temperature is less thanthree atmopheres. Heating is relatively slow. Even if the pores have been nearly saturated, thewater will escape before any damage can be done.
Moisture is a probable cause of pavement failure, however, when the cement is beingheated by the exhaust of a VSTOL, such as the AV-8B Harrier, during takeoff and landing. Foran initial pore saturatimo of 90 percent or greater, extremely high pore pressures result from airbeing compressed by the thermal expansion of liquid water. Maximum pressures occur near thesurface of the concrete, and very large pressure gradients are induced. Failure would occur veryrapidly.
concrete a beneath a VSTOL exceed 5006C. The water vapor pressurec s ing to a temperature of only 2506C would be sufficient to induce a tensile failure inportland cement concrete. For moderate or even low pore saturation, high pore pressures canstill occur, resulting from the high vapor pressures of pore water. Failure will take longer.Pressure gradients are usually less severe.
REFER1CES
Ahmed, N. and D.K. Sunada (1969). "1Nonlinear flow in porous media," Journal of theHydraulics Division, Proceedings of the American Society of Civil Engineers, vol 95, no. HY6,1969, pp 1847-1857.
Auskern, A. and W. Horn (1973). "Capillary porosity in hardened cement paste," Journal ofTesting and Evaluation, vol 1, no. 1, 1973, pp 74-79.
Austin, S.A., P.J. Robins, and M.R. Richards (1993). "Jet-blast resistant concrete for Harrieraircraft pavements," submitted as a candidate for publication in the Journal of the Institute ofStructural Engineers, 1993.
Bazant, Z.P. and W. Thonguthal (1978). "Pore pressure and drying of concrete at hightemperature,q Journal of the Engineering Mechanics Division, Proceedings of the AmericanSociety of Civil Engineers, vol 104, no. EMS, 1978, pp 1059-1079.
Bazant, Z.P. and W. Thonguthal (1979). "Pore pressure in heated concrete walls: theoreticalprediction," Magazine of Concrete Research, vol 32, no. 107, 1979, pp 67-76.
57

Baunt, Z.P. (1982). Normal and refractory concretes for LMFBR applications; Volume 1:Review of literature on high temperature behavior of portland cement and refractory concretes,Electric Power Research Institute, Technical Report 'P-2437. Palo Alto, CA, 1982.
Bear, J. (1972). Dynamics of fluids in porous media. New York, NY, Elsevier, 1972.
Bier, T.A., S. Wise, and P. Chang (1991). A mechanistic study of failure of concrete subjectedto cyclic thermal loads. Naval Civil Engineering Laboratory, Contract Report CR 91.008.CEMCOM Research Associates, Inc., Lanham, MD, 1991.
Brooks, R.H. and A.T. Corey (1964). Hydraulic properties of porous media, Hydrology paperno. 3, Colorado State University. Fort Collins, CO, 1964.
Chekhovsky, J.V., L.E. Berlin, and M.I. Brusser (1973). "Investigation into cement concreteporous structure and its relationship with technological factors and physical properties ofconcrete," Proceedings of the International Symposium RILEMUPAC, ed. by S. Modry,Prague, 18-21 Sep 1973, pp B-51 to B-69.
Coliepardi, M. (1973). "Pore structure of hydrated tricalcium silicate," Proceedings of theInternational Symposium RILEM/UPAC, ed. by S. Modry, Prague, 18-21 Sep 1973, pp B-25to B-49.
Conte, S.D. and C. de Boor (1972). Elementary numerical analysis, 2nd ed. New York, NY,McGraw-Hill, 1972, pp 284-290.
Copeland, L.E. and J.C. Hayes (1953). "Determination of non-evaporable water in hardenedportland cement paste," ASTM Bulletin No. 194, 1953, pp 70-74.
Cornell, D. (1952). Flow of gases through consolidated porous media, Ph.D. dissertation,University of Michigan. Ann Arbor, MI, 1952.
Cornell, D. and D.L. Katz (1953). "Flow of gases through consolidated porous media,"Industrial and Engineering Chemistry, vol 45, no. 10, 1953, pp 2145-2152.
Dass, W.C. (1990). Applied Research Associates, Inc. Letter Report: ASTOVL slab tests. AirForce Engineering and Services Center, Tyndall AFB, FL, 31 Oct 1990.
Defay, R. and I. Prigogine (1966). Surface tension and adsorption, 1st ed. London, U.K.,Longmans-Green and Co., Ltd., Chapter XV, 1966.
Diamond, S. (1973). "Pore structure of hardened cement paste as influenced by hydrationtemperature," Proceedings of the International Symposium RILEM/UPAC, ed. by S. Modry,Prague, 18-21 Sep 1973, pp B-73 to B-88.
Double, D.D. and A. Hellawell (1977). "The solidification of cement," Scientific American,vol 237, no.1, 1977, pp 82-90.
58

Doughty, C. and L Prmess (1990). -A similarity solution for two phase fluid and heat flow nearhigh-level nuclear waste packMges emplaced in porous media,' International Journal of Heat andMass Transfer, vol 33, no. 6, 1990, pp 1205-1222.
Dullien, F.A.L. (1979). Porous media fluid transport and pore structure, 1st ed. New York,NY, Academic Press, 1979, pp 143-145.
England, G.L. and A.D. Ross (1970). *Shrinkage, moisture, and pore pressure in heatedconcrete$, in Concrete for Nuclear Reactors, American Concrete Institute Special Publication No.34, Detroit, MI, 1970, pp 883-907.
England, G.L. and T.J. Sharp (1971). 'Migration of moisture and pore pressures in heatedconcrete," Proceedings of the First International Conference on Structural Mechanics in ReactorTechnology, Paper no. H2/4, Berlin, Germany, 1971.
Fagerlund, G. (1982). 'On the capillarity of concrete,' Nordic Concrete Research PublicationNo. 1, The Nordic Concrete Federation. Oslo, Norway, 1982, pp 6.1-6.20.
Fancher, G.H. and J.A. Lewis (1933). *Flow of simple fluids through porous materials,"Industrial and Engineering Chemistry, vol 25, no. 10, 1933, pp 1139-1147.
Fatt, I. and W.A. Klikoff (1959). 'Effect of fractional wettability on multiphase flow throughporous media," AIME Technical Note No. 2043, AIME Transactions, vol 216, 1959, pp 426-432.
Firoozabadi, A. and D.L. Katz (1979). 'An analysis of high velocity gas flow through porousmedia,' Journal of Petroleum Technology, 1979, pp 211-216.
Geertsma, J. (1974). 'Estimating the coefficient of inertial resistance in fluid flow throughporous media,' Society of Petroleum Engineers Journal, 1974, pp 445-450.
Green, L. and P. Duwez (1951). 'Fluid flow through porous metals,' Journal of AppliedMechanics, vol 18, 1951, pp 39-45.
Hassanizadeh, S.M. and W.G. Gray (1987). "High velocity flow in porous media," Transportin Porous Media, vol 2, 1987, pp 521-531.
Haynes, H.H. and R.D. Rail (1986). Handbook for design of undersea, pressure resistantconcrete structures, Naval Civil Engineering Laboratory, Technical Note N-1760. PortHueneme, CA, 1986.
Harmathy, T.Z. and J.E. Berndt (1966). "Hydrated portland cement and lightweight concreteat elevated temperatures,' Journal of the American Concrete Institute, vol 63, no. 1, 1966, pp93-111.
Houck, M.L. (1990). F-18 auxiliary power unit exhaust gas footprint evaluation test, U.S.Naval Air Propulsion Center, Technical Report LR-90-18. Trenton, NJ, 1990.
59

Houck, S.W., D.N. Gordge, and C.A. Hadfield (1992). Evaluation of an F/A-18 auxiliarypower unit modified nozzle, Naval Air Warfare Center, Report SA-162R-91. Patuxent River,MD, 1992.
Huang, C.L.D. and G.N. Ahmed (1991). "Influence of slab thickness on responses of concretewalls under fire," Numerical Heat Transfer, Part A, vol 119, 1991, pp 43-64.
Jung, M. (1973). "The porosity of hydrated cement as a function of temperature in the range20 to 1400 C and its influence on refractory concrete characteristics," Proceedings of theInteational Symposium RILEM/UPAC, ed. by S. Modry, Prague, 18-21 Sep 1973, pp B-89to B-107.
Keenan, J.H. and F.G. Keyes (1936). Thermodynamic properties of steam, 1st ed. New York,NY, John Wiley, 1936, pp 11-24.
Lankard, D.R., D.L. Birkimer, F. Fondriest, and M.J. Snyder (1971). "Effects of moisturecontent on the structural properties of portland cement concrete exposed to temperatures up to500 F," in Temperature and Concrete, American Concrete Institute publication SP-25. Detroit,MI, 1971, pp 59-102.
McVay, M.C., L.D. Smithson, and C.W. Manzione (1993). "Chemical damage to airfieldconcrete aprons from heat and oils," to be published in the Proceedings of the AmericanConcrete Institute, Materials Journal, 1993.
McVay, M.C. and J.W. Rish (1993). "Flow of nitrogen and superheated steam through cementmortar," submitted for publication to the Journal of Thermophysics and Heat Transfer, 1993.
Muskat, M. (1937). The flow of homogeneous fluids through porous media, 1st ed. New York,NY, McGraw-Hill, 1937.
Neville, A.M. (1973). Properties of concrete, 2nd ed. New York, NY, Pitman Publishing,1973, pp 23-36.
Noman, R. and J.S. Archer (1988). "High velocity flow in liquid saturated porous media andits visualization," Journal of Canadian Petroleum Technology, vol 27, no. 3, 1988, pp 64-69.
Ortega, J.M. and W.C. Rheinboldt (1970). Iterative solution of nonlinear equations in severalvariables, 1st ed. New York, NY, Academic Press, 1970, pp 219-220.
Osoba, J.S., J.G. Richardson, J.K. Kerver, J.A. Hafford, and P.M. Blair (1951). "Laboratorymeasurements of relative permeability," Petroleum Transactions, American Institute of Miningand Metallurgical Engineers, vol 192, 1951, pp 47-56.
Powers, T.C. (1949). "The nonevaporable water content of hardened portland-cement paste-Itssignificance for concrete research and its method of determination," American Society of Testingand Materials Bulletin No. 158, Philadelphia, PA, 1949, pp 68-76.
60

&a&laU, M.S. and P.J. Pagni (1979). HIeat and mass transfer in porous media subject to fires,Inn Journal of Heat and Mass Transfer, vol 22, no. 7, 1979, pp 1069-1081.
Scheidegger, A.E. (1974). The physics of flow through porous media, 3rd ed. Toronto,Canada, University of Toronto Press, 1974, pp 152-170.
Shapiro, A.H. (1953). The dynamics and thermodynamics of compressible fluid flow, VolumeI, 1st ed. New York, NY, Ronald Press, 1953, Chapter 4.
Temeng, K.O. (1988). Effects of high pressure gradients on the flow of real gases throughporous media, Ph.D. dissertation, Stanford University. Stanford, CA, 1988.
Tomita, H. (1960). Effects ofjet engine exhaust on Virginia Diabase Concrete pavement, NavalCivil Engineering Laboratory, Technical Report R-89. Port Hueneme, CA, 1960.
van Genuchten, M.Th. (1980). "A closed form equation for predicting the hydraulicconductivity of unsaturated soils," Soil Science Society of America Journal, vol 44, 1980, pp892-898.
Verbeck, G. (1966). -Pore structure,' in Special Publication No. 169-A: Significance of testsand properties of concrete making materials, American Society of Testing and Materials,Philadelphia, PA, 1966, pp 211-219.
Verma, A.K., K. Pruess, C.F. Tsang, and P.A. Witherspoon (1985). 'A study of two-phaseconcurrent flow of steam and water in an unconsolidated porous medium," Proceedings of the23rd ASMEAIChE National Heat Transfer Conference, HTD Volume 46: Heat Transfer inPorous Media and Particulate Flows, American Society of Mechanical Engineers, Denver, CO,1985, pp 135-143.
Winslow, D.N. and S. Diamond (1970). "A mercury porosimetry study of the evolution ofporosity in portland cement," Journal of Materials, vol 5, no.3, 1970, pp 564-585.
Wright, D.E. (1968). 'Nonlinear flow through granular media," Journal of the HydraulicsDivision, Proceedings of the American Society of Civil Engineers, vol 94, no. HY 4, 1968, pp851-872.
Zucrow, M.L. and J.D. Hoffman (1976). Gas Dynamics, Volume I, Ist ed. New York, NY,John Wiley, Appendix C, 1976.
61

Appendix A
COMPUTATIONAL PROCEDURES
This appendix discusses the method used to evaluate the integrals in Equation 10 in themain text of this report and the numerical techniques used to solve the governing equations. Asample calculation and a listing of the FORTRAN program developed to make these calculationsare also included.
INTEGRATION SCHEME
Rewriting Equation 10,
f= c'T [ pQdp + fpdQ] (Al)
Integrating the first integra by parts,
fpQdp = .9__1 _fp2dQ2 2 2 22
Q 2 3f pQdp fp2dQ
2 2 2 2
and using the result to eliminate this integral from Equation A-l,
2 QP23 3!2 f p2dQ
The remaining integral is evaluated numerically, employing a trapezoidal approximation(Conte and de Boor, 1972),
A-I

fP dQ (P PS+&,
2
3fp 2dQ (P 2~( + P2
and
2Q _IP2 +1 P2(A-la)c,T 4
Comparing Equation A-la with Equation l~a,
C4=1
These values of the constants C4 and C5 are assumed throughout this work.
SOLUTION OF GOVERNING EQUATIONS
The partial differential Equations 20, 22, and 23 are approximated using finitedifferences. Equations 18 through 34 are then solved simultaneously for the unknown variables.Although slab temperture was found to be a weak function of gas flow rate through theconcrete, a more universal model was desired, and the convective term in the energy equationwas retained. This term makes the problem nonlinear and necessitates an iterative solution.Several iterative techniques were tried, but ondy the simplest, single step iteration (Ortega andRheinboldt, 1970) would converge over the entire range of boundary conditions required for theconcrete analyses.
COMPUTER PROGRAM "POREFLOWN
The system of equations is programmed in FORTRAN 77, and the problems are run onan IBM compatible 486 PC. Run times in hours are typical.
A-2

The solution is complicated by the great disparity in the magnitudes of the variables andin their convergence rates. Successive relaxation is applied to all variables. Gas pressuresrequire considerable underrelaxation. Convergence of each of the governing equations ismonitored separately. When convergence is achieved, the equation is deleted from the iterationloop. A variable time step is used but with limited success; rates of change of the differentvariables reach their maximums at different times.
Running the Program
The input is all contained in the first fcw lines of POREFLOW: the type of concrete,geometry, initial and boundary conditions. Time steps are also input. Convergence toleranceand the relaxation coefficients are parameters. The coefficients C1, C2, and C3 of Equation 19are an input.
Sample Problem
Predicted results of heating highly saturated concrete have already been discussed in somedetail. The equations governing POREFLOW are also valid when the pores are dry or onlypartially saturated. Such a problem makes a good example to illustrate the output of theprogram.
Figure A-1 shows concrete surface temperatures used as a boundary condition. Theheating and cooling have been accelerated; heating lasts 10 seconds, and the concrete surface iscooled back down to ambient in another 20 seconds. Therefore, the results are only qualitative.All pores initially contain 10 percent liquid water. Brooksville limestone aggregate is assumed,mixed at a water/cement ratio of 0.38. Figure A-2 shows predicted temperature profiles throughthe concrete during the heating/cooling cycle.
Concrete pore pressures calculated to occur during the heating cycle are shown in FigureA-3(a). The maximum pressure occurs at the surface and just after the jet initially strikes theconcrete. This would be expected. Pore pressure is the sum of the saturated vapor pressure,increasing exponentially with temperature and thus maximum at the surface, and the air pressure.Air pressure increases with temperature and also with decrease in volume as the liquid waterexpands in the pore, both maximum at the surface.
After a short period of time, much of the water and air contained in the surface pores isforced out the top. There is not enough water left in these pores to sustain a liquid phase, andthe vapor pressure drops below saturation. Air pressure decreases. The peak pore pressure nowoccurs deeper into the concrete where there is still liquid water and air. This is happening fasterthan the interior temperature is increasing, therefore, the peak pressure is decreasing with time.
The movement of water and air are shown in Figures A-4(a) and A-5(a), respectively.Note that both fluids are being forced away from the maximum pressure, out the top or deeperinto the interior of the concrete. The increase in peak saturation, shown in Figure A-4(a) after5 and 10 seconds, is caused by an increase in water volume rather than an increase in the totalmass of liquid water.
Pore pressures calculated to occur during the cooling of the concrete are shown in FigureA-3(b). Of particular interest is the suction generated in the pores as the gases cool. Pressureratios are low, and the gas density is decreasing faster than the mass can be increased by flowfrom adjacent pores. Although Figure A-4(b) does not show it very well, fluids are being suckedin from the surface and up from the interior of the concrete.
A-3

The prm listing below includes the input used to generate Figures A-1 through A-5.Table A-1 is a typical output for this sample problem.
FORTRAN LISTING
C U.S. NAVAL CIVIL ENGINEERING LABORATORY PROGRAM "POREFLOW"C TO CALCULATE THE PRESSURES IN THE PORES OF A HEATED CONCRETEC SLAB...INDUCED BY THE EXPANSION, VAPORIZATION AND MIGRATION OFC INTERNAL FREE MOISTURE AND THE MIGRATION OF AIR... MODERATEC TEMPERATURES ARE ASSUMED, I .E., TEMPS ARE LOW ENOUGH THAT NOC CHEMICAL/DEHYDRATION REACTIONS OCCUR; THEREFORE, PORE FREEC WATER ARRIVES/LEAVES THE CONCRETE ONLY THRU THE PORES, AND THEC FLOW RESISTANCE IS CONSTANT.C PROGRAM DEVELOPED BY: DR. C.A. KODRESC NAVAL CIVIL ENGINEERING LABORATORYC PORT HUENEME, CALIFORNIA 93043-5003C (805) 982-1656C DATE OF THIS VERSION: 01/08/93
DIMENSION T(50),PV(50),PAIR(50),PWATER(50),PGAS(50),GVAPOR(51)1,GAIR(51) ,GGAS(51) ,VGAS(50) ,VWATER(50),CP(50) ,RGAS(50) ,X(50)2,QFG(50) ,OLDT(50) ,OLDAIR(50),OLDVAP(50),OLDH20(50),S(50)3,VOLH20(50),DEVMAX(10), DEVSAV(10)
REAL MWV,MWAIR,MCRIT,MFRAC(50),MOLES1,MOLES2,NPRTCHARACTER*80 AGGRDOUBLE PRECISION VGAS,VWATER,MVAPOR(50),MAIR(50),MKWATER(50)COMMON/PROPS/RGAS, CPCOMMON/FLOW/GGAS,TAMB, TSURF, PAMB, SCOMMON/TEST/PRATIO, TRATIO, FPARA,DXCOMMON/GASFLOW/Cl,C2, C3PARAMETER(NODES-50)PARAMETER(MWV-18.016 ,MWAIR-28.967)PARAMETER(UNITS1-1. E03 ,UNITS2-101.35E03 ,UNITS3-3600.)PARAMETER(ITER-50,TOL-1. E-06, TOLG-1. E-03,TINY-1.E-08)PARAMETER(RELAXT-1.0, RELAXP-O.1, RELAXM-O.01, RELAXG-1.0)PARAMETER(CPAIR-1004.6, RAIR-287. 1)PARAMETER(CPV-1863.6,RVAPOR-461.6,HFG-2.28E06)DATA COND1,COND2,RHOC1,RHOC2/1.73,0.66,1.88E06,4.023E06/
OPEN(6, FILE-'\RUNWAYS\POREFLOW. OUT',STATUS-' NEW')CC INPUT THE DESCRIPTION OF THE CONCRETE: AGGREGATE, WATER TO
CEMENT MIXC RATIO AND AGE IN MONTHS
AGGR-'BROOKSVILLE AGGREGATE WITH 20% FLY ASH'WC-O.38AGE-6.
C INPUT THE THICKNESS (CM) AND POROSITY (FRACTION) OF THE SLABXO-1.EPSI-0.25
C INPUT THE INITIAL TEMPERATURE (DEGC), GAS PRESSURE (ATM), ANDC INITIAL SATURATION (FRACTION) OF THE SLAB
TAMB-25.PAMB-1.
A-4

SAMB-O. 1C INPUT THE MOMENTUM CONSTANTS OF THE SLAB; Cl IS IN KG/HR-M**3,C C2 IS IN 1/M, AND C3 IS DIMENSIONLESS
Cl-0. 345E10C2-,0.25E10C3-0.60E-03
C INPUT THE TIME TO STOP THE ANALYSES (SECONDS) AND THE TIME INTERVALC TO PRINT THE RESULTS
TSTOP-120.1TPRINT-2.
CC PRINT THE INITIAL CONDITIONS
WRITE(6,4) AGGR,WC,AGEWRITE(6,6) XO,EPSIWRITE(6,7) TAMB,PAMB,SAMB
C SET TIME STEPS AND PROGRAM INDICATORSDELMIN-O.01DELMAX-5.76DELTAU-DELMINTAU-DELUIN
C HEAT THE SURFACE AS WITH VSTOL EXHAUSTTSURF-TAMB+433.28*TAU**O.42PRTIND-DELMINNPRT-1.ICONVG-OICONVT-O
C DIVIDE THE SLAB INTO *CELLS" FOR NUMERICAL CALCULATIONSDELX-XO/NODESX(1)-O.5*DEIXDO 5 I-2,NODESX(I)-X(I-1)+DELX
5 CONTINUEDELX-O. 01*DEIXXO-O. o1*XO
C CALCULATE VOLUME OF CONCRETE SLAB (M**3)V-XODELV-V/NODES
C CALCULATE THE INITIAL MASS (KG) OF WATER, WATER VAPOR, ANDC AIR IN THE SLAB; INITIALIZE THE NECESSARY VARIABLES
TAMB-TAMB+273.16THOT-TSURFTSURF-TSURF+273.16VAMB-SPVOL(TSURF, PAMB)CALL VAPOR(TAMB,PVAMB, SPVOLV)
C MASSES ARE CONTINUUM VALUES; I.E., MASSES (KG) OF FLUID CONTAINEDC IN A ONE SQUARE METER BY DELX VOLUME
EQ1-EPSI*(l. -SAMB)*DELV/SPVOLV*UNITS1EQ2-EPSI*SAMB*DELV/SPVOL(TAMB,PAMB)*UNITS1EQ3-(PAMB-PVAMB)*EPSI* (1.- SAMB) *DELV/.AIR/TAMB*UNITS2EQ4-DELV*EPSI*(1. - SAMB)EQ5-DELV*EPSI*SAMBDO 10 I-1,NODEST(I)-TAMBOLDT(I)-T(I)
A-5

PVATR(I )-PAMBVOAS(I )-ZQ4MVAP`OR.( I)-EQ1OLDVAP (I )-MVAPOR( I)MWATER(I)-3ZQ2OLD)H2O(I )-*WATER( I)MAIR( I)-EQ3OLDAIR(I)-MAIR(I)N (I )-PVAMBVWATER( I)-EQ5PGAS (I)-PAMBPAIR( 1)-PANE
10 CONTINUFDO 15 1-1,NODES+1GGAS (I )-O.GVAPOR.(I)-O.
15 CONTINUEC COMBINE CONSTANTS TO SIMPLIFY ANALYSES
CONST4-DELTAU*DELV/DELX/UNITS 3CONST5-HFG/DELV,/DELTAUCONST8-EPSI*DELV
C AN ITERATIVE TECHNIQUE IS EMPLOYED TO SOLVE THE GOVERNINGC EQUATIONS... .SINGLE STEP ITERATION IS USED WITH AN OPTIONC TO APPLY LINEAR RELAXATION AS DESIRED
20 DO 100 K-1,ITERDO 25 1-1,10DEVMAX(I )-O.
25 CONTINUEDO 30 1-1,NODES
C USE KG-HOILE FRACTIONS TO ESTIMATE PROPERTIES OF AIR-VAPOR MIXTUREMOLES1-KAIR(I) /MWAIR.MOLES 2-MVAPOR( I) /MWVCP (I) -(MOLES 1*CPAIR+MOLES2*CPV) /(MOLES1+MOLES2)RGAS (I)- (MOLES 1*RAIR+MOLES 2*RVAPOR) /(MOLES1+MOLES2)MFRAC (I)-MOLES1/(MOLES1+MOLFES2)
C CALCULATE THE PRESSURE AND SPECIFIC VOLUM4E OF VAPOR IN THEC PORES WHEN LIQUID WATER IS PRESENT
SAVE-PV( I)IF (ICONVT.GT.2) GO TO 26CALL VAPOR(T(I) ,PV(I) ,SPVOLV)
C MASS OF WATER IN PORE IF COMPLETELY FILLED WITH VAPOR PHASEC AT SATURATION, I.E., VAPOR AT '1(I) AND PV(I)
MCRIT-CONST8/SPVOLV*UNITS126 SAVEl-VWATER (I)
SAVE2-MVAPOR( I)SAVE3-VGAS (I)SAVE4-MWATER (I)IF (MVAPOR(I)+MWATER(I).LT.MCRIT) THEN
C PORE FILLED WITH SUPERHEATED STEAMVWATER( I) -0.S(I)-O.MVAPOR(I)-OLDVAP(I)+OLDH2O(I) -CONST4*(GVAPOR(I+1) -GVAPOR(I))VOAS (I )DELV*EPSISPVOLV-VGAS (I)/MVAPOR(I)*UNITS1
A-6

PV(I)-PSTEAM(T(I) ,SPVOLV)PV (I) -SAVE+RELAXP* (PV (I) -SAVE)DIV-ABS (N (I) -SAVE) /SAVEIF (DEV.GT.DEVMAX(1)) DEVMAX(1)-DEVMWATER( I) -0.ELSE
C PORE FILLED WITH WATER AND SATURATED STEAMVOLH2O(I)-SPVOL(T(I) ,NATER(I))VWATER(I )-KWATER( I)*VOUI2O(I)/UNITS1S (I)-WATER(I)/CONST8VGAS( I)-CONST8-WATER(I)MVAPOR(I )-VGAS (I)/SPVOLV*UNITS1MWATER (I) -OLDVAP (I) -MVAPOR (I) )OLDH2 ( I) -CONST4* (GVAPOR ( +1)1-GVAPOR(I))ENDIFWATER (I) -SAVE1.RELAXK* (WATER (I) - SAVEl)DIV-ABS (WATER(I) -SAVE1)/(SAVE1+TINY)IF (DEV.GT.DEYMAX(2)) DEVNAX(2)-DEVMVAPOR(lI)-SAVE2+RELAXK* (MVAPOR( I) -SAVE2)DIV-ABS (MVAPOR(I) -SAVE2 )/(SAVE2+TINY)IF (DEV.GT.DEVMAX(3)) DEVMAX(3)-DEVVGAS(I)-SAVE3+RELAXN*(VGAS (I) -SAVE3)DIV-ABS (VGAS (I) -SAVE3) / (SAVE3+TINY)IF (DEV.GT.DEVMAX(4)) DEVHAX(4)-DEVMWATER( I) -SAVE4-eRELAXK* (MWATER( I) -SAVE4)DIV-ABS (NWATER(I) -SAVE4)/(SAVE4+TINY)IF (DIV.GT.DEVMAX(5)) DEVMAX(5)-DEV
C CALCULATE GAS AND WATER PRESSURES (ATM)SAVE-PAIR( I)PAIR(I)-HAIR(I)*RAIR*T( I)/VGAS (I )/UNITS2PAIR( I)-SAVE+RELAXP* (PAIR( I) -SAVE)DIV-ABS (PAIR(I) -SAVE)/(SAVE+TINY)IF (DEV.GT.DEVMAX(6)) DEVMAX(6)-DEVPGAS(I)-PV(I)+PAIR(I)PWATER(I)-PGAS (I)
C HEAT OF VAPORIZATION (W/M**3)QFG(I)-CONST5*(MWATER(I) -OLDH2O(I))
30 CONTINUEC CALCULATE THE GAS FLOWS (KG/SEC-M**2) THROUGHOUT THE SLAB
IF (ICONVG.GT.2) THENDEVMAX(7)-DEVSAV(7)DEVMAX(8)-DEVSAV(8)GO TO 45ENDIFCALL FLOWPARA(PGAS ,T,DEUX,NODES)DO 40 I-2,NODESSAVEl-GVAPOR( I)SAVE2-GAIR( I)II-I-1IF (GGAS(I).LT.O.) II-IGVAPOR(I)-PV(II)/PGAS(II)*GGAS(I)
GVAPOR(I )-SAVE1+RELAXG* (GVAPOR(I) -SAVEl)DIV-ABS (GVAPOR(I) -SAVE1)/(SAVE1+TINY)
A-7

IF (DEV.GT.DEVKA(7)) THENDIUXAX(7)-DEVDEYSAV(7)-DEVNAX(7)ENDIFGAIR( I)-SAVE2+RElAXG*(GAIR(I) -SAVE2)DEV-ABS(GAIR(I) -SAVE2)/(SAVE2+TINY)IF (DEV.GT.DEVMAX(8)) THENDEVNAX(8) -DEVDEVSAV (8)-DEVMAX( 8)ENDIF
40 CONTINUESAVE-GVAPOR( 1)GVAPOR(l)-PV(1)/PGAs(1)*GGAS(l)GVAPOR(l1)-SAVE+REIAXG* (GVAPOR( 1) - SAVE)DEV-ABS (GVAPOR( 1) -SAVE) /(SAVE+TINY)IF (DEV.GT.DEVMAX(7)) THENDEVMAX(7)-.DEVDEVSAV(7)-DEVNAX(7)ENDIFSAVE-GAIR( 1)GAIR(1)-PAIR(1)/PGAS(1)*GGAS(l)GAIR(1)-SAVE.IRELAXG*(GAIR(l) -SAVE)DEV-ABS (GAIR(1) -SAVE)/(SAVE+TINY)IF (DEV.GT.DEVMAX(8)) THENDEVMAX(8)-DEVDEVSAV(8)-DEVMAX(8)ENDIFSAVE-GVAPOR(NODES+l)
GVAPOR(NODES4-1)-PAIR(NODES) /PGAS (NODES) *GCAS (NODES+1)GVAPOR(NODES+1)-SAVE+RELAXG*(GVAPOR(NODES+1) -SAVE)DEV-ABS (GVAPOR(NODES+1) -SAVE) /(SAVE+TINY)IF (DEV.GT.DEVMAX(7)) THENDEVMAX( 7)-DEVDEVSAV(7)-DEVMAX(7)ENDIFSAVE-GAIR(NODES+1)GAIR(NODES+1)-PAIR(NODES )/PGAS (NODES) *GGAS (NODES4-1)GAIR(NODES+1)-SAVE+REIAXG*(GAIR(NODES+1) -SAVE)DEV-ABS (GAIR(NODES+1) -SAVE) / (SAVE+TINY)IF (DEV.GT.DEVMAX(8)) THENDEVMAX( 8)-DEVDEVSAV(8)-DEVNAX(8)ENDIFIF ((DEVHAX(7) .LE.TOLG) .AND. (DEVMAX(8) .LE.TOLG)) ICONVG-5
45 CONTINUEC CALCULATE MASS (KG) OF AIR IN THE PORES
DO 50 I-1,NODESIF (MFRAC(I).LT.O0.1) GO TO 50SAVE-NAIR(I)MAIR(I)-OLDAIR(I) -CONST4*(GAIR(I+1) -GAIR(I))MAIR(I )-SAVE+RELAXH*Q{AIR(I) -SAVE)DEV-ABS (MAIR(I) -SAVE)/(SAVE+TINY)IF (DEV.GT.DEVMAX(9)) DEVMAX(9)-~DEV
50 CONTINUE
A-8
C FINIALLY, CALCULATE THE TEMPERATURE PROFILE (DECK) THROUGH THE SLABC AS A FUNCTION OF TIME
IF (ICOHVT.GT.2) THENDEYMAX( 1O)DEVSAV(1O)GO TO 90ENDIFDO 60 I-2,NODES-1
C HEAT THE CONCRETE AND LIQUID WATER, THE HEAT CAPACITY OF THE GASESC IS ASSUMED NEGLIGIBLE
RHOCP-RHOC1*(1. -EPSI)+RHOC2*S (I)*EPSICONSTL-DELTAU/DELX/RHOCP/UNITS3
C CONDUCTIVITY IS A CONCRETE-WATER EFFECTIVE VALUE, HEAT TRANSFERC THROUGH THE GASES IS NEGLECTED
C~OND-CONDl*(l. -EPSI)+COND2*EPSI*S(I)CONST2-DELTAU*COND/RHOCP/DELX**2CONST3-DELTAU/RHOCPSAVE-T (I)
C GOVERNING EQS BASED ON DIRECTION OF FLOWSIF ((GGAS (I+1). LE.O0. ) .AND. (GGAS (I). LE.0. )) THENT(I)-(OLDT(I) -CP(I+1)*CONST1*T(I+1)*GGAS (I+1).ICONST2*(T(I+1)
1+T(I-1))4.CONST3*QFG(I))/(1. -CP(I)*CONST1*GGAS(I)4-2.*CONST2)ELSEIF ((GGAS (I+1). LE.0. ).AND. (GGAS (I). GT.O0.)) THEN
1*T(I-1)*GGAS(I)+CONST2*(T(I+1)+T(I-1) )+CONST3*QFG(I))2/ (1 .+2. *CONST2)ELSEIF ((GGAS(I+1).GT.O.).AND.(GGAS(I).LE.O.)) THEN
1*CONSTI*GGAS(I)+CP(I)*CONST1*GGAS(I+1)+2.*CONST)ELSEIF ((GGAS(14-1).GT.0.).AND.(GGAS(I).GT.O.)) THENT(l)-(OLDT(I)+CP(I-1)*CONST1*T(I-1)*GGAS(I)+CONST2*(T(I+l)
1+T(I-1) )+CONST3*QFG(I) )/(1 .+CP(I)*CONST1*GGAS(I+1)+2.*OS2ENDIFT(I)-SAVE+REI.AXT*(T(I) -SAVE)DEV-ABS(T(I) -SAVE)/SAVEIF (DEV.GT.DEVMAX(10)) THENDEVMAX( 10)-DEVDEVSAV(10)-DEVMAX(1O)ENDIF
60 CONTINUEC THE TEMPERATURE BOUNDARY CONDI" AT THE HOT SURFACE
RHOCP-RHOC1*(l. -EPSI)+RHOL )*EPSICOND-COND1*(1. -EPSI)-ICOND2 -- i-,*S(l)CONST1-DELTAU/DELX/RHOCP/UNITS3CONST2-DELTAU*COND/RHOCP/DEIx**2CONST6-2 .*CNCONST7-CONST2+CONST6SAVEo-T (1)IF (GGAS(2).LE.O.) THENT(l)-(OLDT(1) -CP(2)*CONST1*T(2)*GGAS(2)+CONST2*T(2)+CONST6
1*TSURF-eCONST3*QFG(1) )/(1. -CP(1)*CONST1*GGAS (1)+CONST7)ELSET(l)m(OLDT(1)+CONST2*T(2)+CONST6*TSURF+COUTST3*QFG(1))/(l.+CP(l)
1*CONST1*(GGAS(2) -GGAS(l) )+CONST7)ENDIF
A-9

T(1)-8AVI.3.LAXT* (T(l) -SAVE)DEW-USS(T (1) -SAVE) /SAVEIF (DEV.GT.DKYNAX(10)) THENDEVNAX(1O)-DEVDEVSAV(10)-DEVNAX( 10)ENDIF
C THE TEMPERATURE BOUNDARY CONDITION AT THE BOTTOM( OF THE SLABRHOCP-RIOC1*(1. -EPSI)+RHOC2*S(NODES)*EPSICOND-COND1*(l. -EPSI)+COND2*EPSI*S(NODES)CONST1-DELTAU/DELX/RHOCP/UNITS3CONST2-DELTAU*COND/RHOCP/DELX**2CONST6-2 .*CNCONST7-CONST2+CONST6SAVE-T (NODES)IF (GGAS(NODES).LE.O.) THENT(NODES)-(OWDT(NODES )+CONST6*TAIIB+CONST2*T(NODES -1 )+CONST31*QFG(NODES) )/(1. -CP(NODES)*CONST1*GGAS(NODES)+CP(NODES)*CONST12*GGAS (NODES+1) +CONST7)ELSET(NODES)-(OLDT(NODES)+CP(NODES-1)*CONST1*T(NODES- 1)*GGAS(NODES)1.CONST6*TAKE+CONST2*T(NODES-1)+CONST3*QFG(NODES) )/(l..+CP(NODES)2*CONST1*GGAS (NODES+1 )+CONST7)ENDIFT(NODES)-SAVE+RELAXT*(T(NODES) -SAVE)DEV-ABS (T(NODES) -SAVE) /SAVEIF (DEV.GT.DEVMAX(10)) THENDEVHAX( 1O)-DEVDEVSAV(1O)-DEVHAX(10)ENDIFIF (DEVMAX(1O).LE.TOL) ICONVT-5
90 CONTINUEIF ((ICONVG.GT.2).AND.(ICONVT.GT.2)) GO TO 105
100 CONTINUEC WRITE(6,1)C WRITE(6,11) TOLITERC WRITE(6,1)C CHECK TO SEE IF TIME TO PRINT RESULTS
105 IF (PRTIND.LT..TPRINT) GO TO 140THOT-TSURF- 273.16VANE-S PVOL(TSURF, PANE)WRITE(6.8) TAU,THOT,GGAS(l),VAMBDO 130 1-1,15T(I)-T(I)-273. 16GNET-GGAS(I)-GGAS(I+l)PPORE-AKAX1(PGAS(I) ,PWATER(I))IF (S(I).GT.O.999) S(I-i.WRITE(6,9) X(I),T(I),PPORE,S(I),GNET,MFRAC(I),PV(I),VOLH2O(I)
1, NWATER( I)T(I)-T(I)+273. 16
130 CONTINUEDO 135 1-1,10DEVNAX(I)-100. *DEVk(AJ(I)
135 CONTINUEWRITE(6,2) K
A-10

VRXTR(6,3) DVMNAX(.O),DEVAX(l) ,DEKAX(6) ,DEMAX(5) ,DEVKAX(7)1,DEVNA•(6),DEVNAX(2),D•VMAX(3),DEVMAX(9),DEVMAX(4)NPIT-NPRT+l.
C CHECK TO SEE IF TIME TO STOP140 IF (TAU.GE.TSTOP) GO TO 200
C CONTINUE THE ANALYSESTAU-TAU+DELTAU
C HEAT SURFACE AT SAME RATE AS VSTOL EXHAUSTTSURF-TAMB+43.28*TAU**0.42
C OPTION TO CHANGE TIME STEP AS RUN PROGRESSESDELTAU-DELMIN+TAU/TSTOP* (DEIXAX- DEIMIN)IF (DELTAU.GT.0.05) DELTAU-0.05PRTIND-TAU/NPRTDO 150 I-1,NODESOLDT(I)-T(I)OLDVAP (I)-KVAPOR(I)OLDH20(I)-MWATER(I)OLDAIR(I)-.AIR(I)
150 CONTINUEICONVG-OICONVT-OGO TO 20
200 STOP1 FORN&T(1H 5X
1"*******' /)2 FORMAT(iH ,/6X,- PERCENT CHANGE, PER ITERATION, IN CALC VALUE AFTER1 ',13,' ITERATIONS')
3 FORMAT(lH ,5X,'TEMP - ',EIO.3,4X,'PV - ',EIO.3,4X,'PAIR -1',E1O.3,/6X,'M WATER- ',E10.3,4X,'GVAPOR- ',E10.3,4X,'GAIR -2E10.3,/6X,'-WATER- ',E1O.3,4X,'NVAPOR- ',E1O.3,4X,'MAIR - ',El30.3,/6X,'VGAS - ' E1O.3//)
4 FORMAT(1H ,5X,'MOISTURE MIGRATION THROUGH A HEATED CONCRETE SLAB'1/1IX, 'PORTLAND CEMENT' /11X,A60,/11X, 'W/C RATIO - ',F4.2,/11X, 'AGE2 - ',F3.0,' MONTHS')
6 FORMAT(1H ,10X,'SLAB THICKNESS - ',E1O.4,' CM',/11X,'POROSITY -1,F4.2/)
7 FORNAT(1H , 5X, 'AMBIENT (INITIAL) CONDITIONS:',/1IX, 'TEMPERATURE -1 ',F4.0,' DEGC',/1IX,'PRESSURE - ',F4.2,' ATM',/11X,'PORE SATURATI20N - ',F5.3/)
8 FORMAT(1H /6X, ' MOISTURE THROUGHOUT THE SLAB AFTER ',F6 1,' SECOND1S',//6X,'DEPTH',5X,'TEMPERATURE' ,5X,'PORE PRESS',3X,'SATURATION',72X,'NET FLOW' ,8X,'PORE AIR ',6X,'VAPOR PRESS',4X,'WATER VOL',4X,'WA3TER MASS' ,/7X,'(CM)' ,8X,'(DEGC)', 9X,' (ATM) ',6X,'(FRACTION)',5X,' (K4G/HR-M**2)',5X,'(MOLE FRAC)', 7X,' (ATM)', 7X,'(CM**3/GM)', 7X,'(KG) '/56X, '0. ', 11X,F6.2, 1OX,'1. ',11X, '0.', LOX,El1.4,9X, '0.', 14X,'O.', 1X,6F5.3,7X, '0. ')
9 FORMAT(1H ,5X,F5.3,8X,F6.2,8X,F6.2,9X,F5.3,7X,Ell.4,9X,F5.3,8X,1F8.3, 8X, F5. 3,6X, El1.4)
11 FORMAT(1H ,5X,'DID NOT CONVERGE TO WITHIN ',E8.1,' AFTER ',14,' IT1ERATIONS'/)
ENDCC PROGRAM NVAPOR" TO CALCULATE THE VAPOR PRESSURE AND SPECIFICC VOLUME OF WATER VAPOR... THE FORMULAE ARE CURVE FITS ACQUIRED
A-1l

C 13.0 THE STEM ABLES... REF: OTHERMODYNAMIC PROPERTIES OF STEAK,"C J.H. KEENAN AND F.G. KEYES, JOHN WILEY & SONS, NEW YORK, 1936
SUBROUTINE VAPOR.(T, P,V)PARAMETER(TC-647.27, PC-218.167)DATA A,B,C,DE,Al1B1,Cl,D1/3. 346313,4.14113D-02 ,7.515484D-09
1.1.3794481D-02,6.56444D-11,3.2437814,5.86826D-03,1.1702379D-082.*2. 1878462D-03/
C TEMPERATURE IS IN DEGREES KELVIN, PRESSURE IN ATMOSPHERES, ANDC SPECIFIC VOLUME IN CUBIC CENTIMETERS PER GRAM
X-TC -TIF (T.GT.373.) THENF1-X/T* (A+B*X+C*X**3+E*X**4) /(1 .+D*X)ELSEF1-X/T* (A1+B1*X+C1*X**3 ) /(1 .+Dl*X)
ENDIFP-PC/tO. **F1TAU-1./T
C FOR TEMPS LESS THAN APPROX 450. DEGK, G3 IS NEGLIGIBLEC G3-.3.635D-04-6. 768D64*TAU**24
G2-O.21828-1. 2697D5*TAU**2Gl-82 .546*TAU-1. 6246D5*TAU**2BO-.4.89-2641. 62*TAU*1O.**(80870 .*TAU**2)CONST1mO.
C CONST1-BO**13*TAU**12*P**12*G3B2-BO+BO**2*G1*TAU*P+B0**4*G2*TAU**3*P**3 -CONSTl
V-4. 55504*T/P+B2RETURNEND
CC PROGRAM "PSTEAM" TO CALCULATE THE PRESSURE OF SUPERHEATED STEAKC IN ATMOSPHERES ... FORMULAE FROM THE STEAM TABLES ARE USED...C REF: KEENAN AND KEYES
FUNCTION PSTEAM(TDEGK, SPVOL)DIMENSION F(2) ,WVSL(2) ,WVSM(2)REAL JH2O(2,2)PARAMETER(ITER-100 ,TOI,-1. E-04)
C TEMPERATURE IS IN DEGREES KELVIN; SPECIFIC VOLUME IN CM**3/GMTAUm . /TDEGK
C FOR TEMPS BELOW APPROX 450 DEGK, G3 IS NEGLIGIBLEC G3-3 .635D-04-6. 768D64*TAU**24
G2-O. 21828-1. 2697D5*TAU**2G1-82 .546*TAU- 1. 6246D5*TAU**2BO-1.89-2641.62*TAU*10.**(80870.*TAU**2)
C THE TERM wG30 AND ITS DERIVATIVE IS NEGLIGIBLE FOR TEMPERATURESC BELOW ABOUT 450 DEGKC CONST1-BO**13*TAU**12*PSTEAM**12*G3C DC1DP-12 .*BO**13*G3*TAU**12*PSTEAM**1.1
CONST1.-O.DC1DP-O.
C SOLVE FOR UNKNOWNS PSTEAM AND THE CONSTANT B2 ... USE NEWTON-RAPHSONC ITERATION...FIRST, ESTIMATE THE TWO VARIABLES
PSTEAM-1 .1B2--5.DEVMAX-B2
A-12

C BEGIN THE ITERATIONDO 20 K-1.ITERDSAVE-DEVMAXDEVMAX-O.
C UPDATE THE FUNCTIONSF(1)-BO+BO**2*G1*TAU*PSTEAM+BO**4*G2*TAU**3*PSTEAM**3 - CONST1 -B2F(2)-4. 55504*TDEGK/(SPVOL-B2) -PSTEAM
C CALCULATE THE JACOBIAN OF THESE FUNCTIONS WITH RESPECTC TO THE UNKNOWNS
JH20(1 ,1)-BO**2*G1*TAU+3.*BO**4*G2*TAU**3*PSTEAM**2-DC1DPJH20(1,2)--1.JH20(2,1)--1.JH20(2,2)-4. 55504*TDEGK/(SPVOL-B2)**2
C INVERT THE JACOBIANCALL MINV(JH20,2,D,WVSL,WVSM)
C THEN IMPROVE ON THE VARIABLE ESTIMATESSAVE1-PSTEAMSAVE2-B2DO 5 1-1,2PSTEAM-PSTEAM-JH20(1i, I)*F(I)B2-B2-JH20(2,I)*F(I)
5 CONTINUEDEV-ABS ( (SAVEl- PSTEAM)/SAVE1)IF (DEV.GT.DEVMAX) DEVMAX-DEVDEV-ABS( (SAVE2 -B2)/SAVE2)IF (DEV.GT.DEVMAX) DEVMAX-DEV
C CHECK TO SEE IF ITERATION IS CONVERGINGIF (K.LE.5) GO TO 10IF (DEVMAX.LE.DSAVE) GO TO 10WRITE(6,2)WRITE(6,1) KWRITE(6,2)GO TO 30
C CHECK TO SEE IF ITERATION CONVERGED TO WITHIN TOLERANCE10 IF (DEVMAX.LE.TOL) GO TO 3020 CONTINUE
WRITE(6,2)ERROR-TOL*lO0.WRITE(6,3) ERROR,ITERWRITE(6,2)
30 CONTINUERETURN
1 FORMAT(1H ,5X, 'SUPERHEATED STEAM PRESSURE CALCS DIVERGE AFTER1,13,' ITERATIONS'/)
2 FORMAT(IH ,5X, '
3 FORMAT(1H ,5X,'STEAM PRESSURE CALCS DID NOT CONVERGE TO WITHIN ',E110.4,' PERCENT AFTER',14,' ITERATIONS'/)
ENDCC PROGRAM "SPVOL" TO CALCULATE THE SPECIFIC VOLUME OF COMPRESSEDC LIQUID WATER IN CUBIC CENTIMETERS PER GRAM... FORMULA FROM THEC STEAM TABLES IS USED...REF: KEENAN AND KEYES
FUNCTION SPVOL(TDEGK, P)
A-13

.44
T-TDIOK- 273.16Z-374.1-TY-385. -T
SPVOIp3.086-0.899017*Z**O. 147166-0.4/Y**1. 6*(P-218.5)RETURNEND
CC PROGRAM "FLOWPARA* TO DETERMINE THE COMPRESSIBLE FLOW PARAMETERC OF A HIGH PRESSURE GAS OF KNOWN PROPERTIES FLOWING, AGAINST FRICTION,C THROUGH A CONCRETE SLAB... THE OPTION FOR HEAT TRANSFER IS PROVIDED...C THE FOLLOWING ASSUMPTIONS ARE MADE:C (1) ONE-DIMENSIONALC (2) IDEAL GASC (3) NO MECHANICAL WORKC (4) CONSTANT PROPERTIESC (5) STEADY FLOWC (6) GAS TEMPERATURE EQUAL TO TEMP OF SURROUNDING SOLID
SUBROUTINE FLOWPARA(PGAS, TGAS,DELX, NN)DIMENSION P(52),T(52),PGAS(50),TGAS(50),S(50)REAL MDOT(51),LCOMMON/PROPS/R(50), SPHT(50)COMKON/FLOW/MDOT, TAME, TSURF, PAE,, SCOMKON/TEST/PRATIO, TRATIO, FPARA,DXCOMMON/GASFLOW/Cl, C2, C3PARAMETER(ITER-100, TOL-1. E-04,RELAX-1.0)PARAMETER(UNITS1-3.6E08,TINY-i. E-03)PARAMETER(CPAIR-1004.6 ,RAIR-287.1)DATA C4,C5/0.25,0.75/
C DETERMINE WHICH DIRECTION THE FLOW IS GOINGC TEMPERATURES IN DEGK... PRESSURES IN ATM... FLOWS IN KG/HR-M**2
DO 5 I-2,NN+iP(I)-PGAS(I-1)T(I)-TGAS (I-1)
5 CONTINUEP(1)-PANET(1)-TSURFP (NN+2)-PAMB-TINYT(NN+2)-TAMBDO 30 I-1,NN+IL-DELXIF ((I.EQ.1).OR.(I.EQ.NN+1)) L-O.5*DELXIF (P(I+1).GT.P(I)) THENII-I+lJJ-I
C NEGATIVE FLOWS ARE IN THE DIRECTION OF THE HOT SURFACEDIR--i.IJ-IIF (IJ.GT.NN) IJ-NNELSEII-IJJ-I+lDIR-i.IJ-I -1IF (IJ.LT.1) IJ-1
A-14

ENDIFC FLOW CROSS SECTIONC USE CORRELATION OF VERMA, ET AL., 23RD ASNE NATIONAL HT CONF,C HTD VOL 46, PP 135-143, 1985.
AREAm1.259-1.7615*S(IJ)+O. 5089*S(IJ)**2P1-P( II)P3-P(JJ)PDIFF-ABS(P1-P3)IF (PDIFF.LE.TINY) THENMDOT(I)-O.GO TO 30ENDIFTl-T(11)T03-T(JJ)P1P3-Pl/P3
C CHECK FOR FLOW ENTERING THE SLAB. .AN ERRORIF ((II.LE.1).OR.(II.GE.NN+2)) THENCP-CPAIRRGAS-RAIRGO TO 8ENDIFRGAS-R( 11-1)CP-SPHT(II-1)
8 C6-l. -2.*C4*(TO3/T1-l.)C7-1.+2.*C5*(TO3/T1-1.)
C CHECK IF ENOUGH PRESSURE TO INITIATE FLOWTRSHLD-C6 -C7* (T1/T03/P1P3)**2IF (TRSHLD. LE. TINY) THENMDOT(I)-O.GO TO 30ENDIF
C COMBINE CONSTANTS TO SIMPLIFY CALCULATIONSCONST1-T03/T1CONST2-2.*CONST1CONST3-2 .*CP/RGASCONST4-4.*CONST1/C3**2/CONST3CONST5-(2 .*CP-RGAS)/CPCONST6-SQRT (RGAS*T ) /P1/AREA/UNITS1
C SOLVE FOR THE UNKNOWNS PSI, 7173 AND CF... .FIRST MAKE AN INITIALC ESTIMATE OF THE UNKNOWNS
T1T3-1.PSI-C3**2MDOT( I)-PSI/CONST6CF-Cl/MDOT(I)+C2
C AN ITERATIVE TECHNIQUE IS EMPLOYED TO SOLVE THE GOVERNINGC EQUATIONS... .SINGLE STEP ITERATION WITH AN OPTION TO APPLYC LINEAR RELAXATION AS DESIRED
DEVMAX-1.DO 20 K-1,ITERDSAVE-DEVMAXDEVMAX-O.SAVE-T1T3TlT3-(1 .+SQRT(1 .+CONST4*PSI**2*P1P3**2) )/CONST2TlT3-RELAX* (7173- SAVE)+SAVE
A-15

DIV-A3S (T1T3 -SAVE) /SAKVEIF (DEV.GCT. DVM&X) DEVMhX-DEVSAVE-PSIPSI..C3*SQRT(C6-C7*(T1T3/PlP3)**2)/SQRtT(CONSTS*AI.OG(PlP3/TlT3)
1+CF*L)PSI-RELAX*( PSI -SAVE) +SAVEDEV-ABS (PSI -SAVE)/SAVEIF (DKV. GT. DEVMAX) DEVMAX-DEVSAVEý-CFMDOT(I)-PSI/CONST6CF-C 1/IDOT( I)+C2CF-REI.AX*(CF- SAVE)+SAVEDKV-ABS (CF. SAVE) /SAVEIF (DEV.GT. DEVMAX) DEVMAX-DEV
C CHECK TO SEE IF ITERATION IS CONVERGINGIF (K.LE.3) GO TO 15IF (DEVMAX.LT.DSAVE) GO TO 15WRITE(6, 1)WRITE(6,3) KWRITE(6,1)STOP
C CHECK TO SEE IF ITERATION HAS CONVERGED TO WITHIN TOLERANCE15 IF (DEVMAX.LE.TOL) GO TO 2520 CONTINUE
ERROR-i 00. *TOLWRITE(6,4) ERROR,ITER
25 CONTINUEMDOTM() DIR*MDOT (I)IF (I.EQ.1) THENPRATIO-P1P3TRATIO-TlT3FPARA-PS IDX-LENDIF
30 CONTINUERETURN
1 FORMAT(1H ,X AAAA*AA~~~A**************
3 FORMAT(1H ,5X,'CALCUIATIONS DIVERGING AFTER ',13,' ITERATIONS'/)4 FORMAT(1H 5X,'CALCULATIONS DID NOT CONVERGE TO WITHIN ',E8.2,' PE
iRCENT AFTER ,13,' ITERATIONS '/)END
CC PROGRAM 'MINV' TO INVERT A GENERAL MATRIX
SUBROUTINE MINV(A,N,D,L,M)DIMENSION A(4) ,L(2) ,M(2)
C SEARCH FOR THE LARGEST ELEMENTD-1.0NK-- NDO 80 K-1,NNK-NK+NL(K) -KM(K) -KKK-NK+K
A-16

BIGA-A(KK)DO 20 J-K,NIZ-N* (J- 1)DO 20 I-K,NIJ-IZ+IIF (ABS(BIGA)-ABS(A(IJ))) 15,20,20
15 BIGA-A(IJ)L(K)-IM(K)-J
20 CONTINUEC INTERCHANGE ROWS
J-L(K)IF (J-K) 35,35,25
25 KI-K-NDO 30 I-1,NKI-KI+NHOLD--A(KI)JI-KI-K+JA(KI)-A(JI)
30 A(JI)-HOLDC INTERCHANGE COLUMNS
35 I-M(K)IF (I-K) 45,45,38
38 JP-N*(I-1)DO 40 J-1,NJK-NK+JJI-JP+JHOLD--A(JK)A(JK)-A(JI)
40 A(JI)-HOLDC DIVIDE COLUMN BY MINUS PIVOT
45 IF (BIGA) 48,46,4846 D-O.0
RETURN48 DO 55 I-1,N
IF (I-K) 50,55,5050 IK-NK+I
A(IK)-A(IK)/( -BIGA)55 CONTINUE
C REDUCE MATRIXDO 65 I-1,NIK-NK+IHOLD-A(IK)!J-I-NDO 65 J-1,NIJ-IJ+NIF (I-K) 60,65,60
60 IF (J-K) 62,65,6262 KJ-IJ-I+K
A(IJ)-HOLD*A(KJ)+A(IJ)65 CONTINUE
C DIVIDE ROW BY PIVOTKJ-K-NDO 75 J-I,N
A-17

KJ-KJI+NIF (J-K) 70,75,70
70 A(KJ)-A(KJ)/BIGA75 CONTINUE
C PRODUCT OF PIVOTSD-D*BIGA
C REPLACE PIVOT BY RECIPROCALA(KK) -1. 0/BIGA
80 CONTINUEC FINAL ROW AND COLUMN INTERCHANGE
K-N100 K-(K-1)
IF (K) 150,150,105105 I-L(K)
IF (I-K) 120,120,108108 JQ-N*(K-1)
JR-N* (I-I)DO 110 J-1,NJK-JQ+JHOLD-A(JK)JI-JR+JA(JK)--A(JI)
110 A(JI)-HOIJ)120 J-M(K)
IF (J-K) 100,100,125125 KI-K-N
DO 130 I-1,NKI-KI+NHOLD-A(KI)JI-KI-K+JA(KI)--A(JI)
130 A(JI)-HOLDGO TO 100
150 RETURNEND
A-18

300
0
LLCC 200
I- IUJ 100-
25 --
0 I I I I I
0 10 20 30 40 50 60
TIME, SECONDS
Figure A-1
Concrete surface temperature.
A-19

300
LL
~200- AFTER 0.5 SECONDS
Cw1 SCN11 SECONDS
w10-1SEODI-U
z0 - - -
0 1 2 3 4 5DEPTH, mm
Figure A-2(a)Concrete temperature profiles during heating (porosity =0. 25, initial saturation =0. 1).
Lo 200 AFTER 15 SECONDS
LL
20 SECONDS
C'L
LU 100-25 SECONDSI--wi 30 SECONDS
z 60 SECONDS-o 25
00 1 2 3 4 5 6 7 8 9
DEPTH, mm
Figure A-2(b)Concrete temperature profiles during cooling.
A-20

50-
AFTER 0.5 SECONDS
40
I-
Iu30co•:: 1 SECOND
CL 20-w
R O1 -10 SECONDS
00 1 2 3 4 5
DEPTH, mm
Figure A-3(a)Concrete pore pressure profiles during heating
(Brooksville aggregate with 20 percent flyash, w/c = 0.38, initial saturation = 0. 1).
5-
AFTER 15 SECONDS
4-
3-
c3
U 1U 2
CL
30ENSECNS NI- EOD
0~
0 1 2 3 4 5 6 7 8 9DEPTH, mm
Figure A-3(b)
Concrete pore pressure profiles during cooling.
A-21

0.2--AFTER 0.5 SECONDS
2: 1 SECOND
0O.15- EOD
LU 10SECONDS
0.1
INTtAL SATURATION
0 -
0123 45DEPTH, mm
Figure A-4(a)Concrete saturation profile during heating.
(Saturation defined as the fraction of pore volume tilled with liquid water.)
z ~AMTR 15 SECONDS
0.15-
0
I.0.05-
AFTER 60 SECONDS
0 1 2 3DEPTH, mmFigure A-4(b)
Concrete saturation profile during cooling.
A-22

r AFTER 0.5 SECONDS
1.0- SECOND o1 .0 81SCN INTIAL MOLE FRACTION -0.969
_ 0.8
-0.6 •- 10 SECONDS
0
C6 0.4'U
S.5 SECONDS- 0.2
0.00 1 2 3 4 5
DEPTH, mm
Figure A-5(a)Amount of air in concrete pores during heating (mole fraction in air-water vapor mixture).
60 SECONDS
30SECONDS1.0 1 Il
z INITIAL MR = 0.9690 0.80 0.8 -•20SECONDS
0.6 25 SECONDS
0
3 0.4
z02
; AFTER 15 SECONDS
0.00 1 2 3 4 5 6 7 8 9
DEPTH, mm
Figure A-5(b)
Amo'it of air in concrete pores during cooling.
A-23

Table A-IPOREFLOW Sample Outpua
Depth Tenaruexe Pogo Sauration Not F H120 Vapor Water WaterPress (faco)ap Press Voun ma
(1:m) ('C) (at) _________ ______-_____ (moe fra) (aim) (cm*03/gn) (r
0. 300.00 1. 0. -0.523&E+01 0. 0. 1.463 0.
0.010 269.48 12.93 0.007 0.9387E.01 0.912 12.978 1.345 0.2723E-030.030 217.35 21.77 0.058 -0.1129E+02 0.930 21.766 1.216 0.2379E-020.050 135.17 11.19 0.157 0.3018E+01 0.415 11.125 1.159 0.6777E-020.070 161.01 6.59 0.132 0.1271E+01 0.120 6.251 1.122 0.5395E-020.090 141.83 4.66 0.121 0.7071E+00 0.046 3.747 1.095 0.5506E-020.110 125.92 3.81 0.114 0.2667E+00 0.028 2.348 1.074 0.5321E-020.130 112.30 3.26 0.111 0.1222E+00 0.023 1.519 1.057 0.5241E-020.150 100.41 2.82 0.109 0.8864E-01 0.021 1.008 1.043 0.5217E-020.170 89.89 2.44 0.107 0.7992E-01 0.021 0.684 1.031 0.5201.E020.190 30.54 2.13 0.106 0.7426E-01 0.022 0.473 1.021 0.5193E-020.210 72.22 1.87 0.105 0.6670E.01 0.023 0.335 1.012 0.5188-E020.230 64.84 1.66 0.104 0.5724E-01 0.024 0.242 1.004 0.5185E-020.250 58.33 1.50 0.103 0.4720E-01 0.026 0.180 0.997 0.5184E-020.270 52.65 1.38 0.103 0.3775E.01 0.027 0.137 0.992 0.51335-020.290 47.72 1.28 0.102 0.2955.-01 0.023 0.107 0.937 0.5133E-020.310 43.50 1.21 0.102 0.2287E-01 0.029 0.087 0.983 0.5182E-020.330 39.91 1.16 0.101 0.17555-01 0.029 0.072 0.979 0.51325-020.350 36.91 1.12 0.101 0.1343E-01 0.030 0.061 0.976 0.5182E-020.370 34.41 1.09 0.101 0.1028E-01 0.030 0.053 0.974 0.5182E-020.390 32.37 1.07 0.101 0.78785-02 0.030 0.048 0.972 0.5182E-020.410 30.71 1.05 0.101 0.6054E-02 0.031 0.043 0.970 0.51825-020.430 29.38 1.04 0.100 0.46665E02 0.031 0.040 0.969 0.5182E-020.450 28.33 1.03 0.100 0.3602E-02 0.031 0.038 0.968 0.5182E-020.470 27.50 1.02 0.100 0.2731E-02 0.031 0.036 0.967 0.5182E-020.490 26.86 1.02 0.100 0.2144E-02 0.031 0.035 0.967 0.5182E-020.510 26.37 1.01 0.100 0.1647E-02 0.031 0.034 0.966 0.51825-020.530 26.00 1.01 0.100 0.1259E-02 0.031 0.033 0.966 0.51825-020.550 25.72 1.01 0.100 0.9632E-03 0.031 0.033 0.966 0.51825-020.570 25.52 1.00 0.100 0.7201E-03 0.031 0.032 0.966 0.5182E-020.590 25.37 1.00 0.100 0.3708E-03 0.031 0.032 0.965 0.5132E-020.610 25.26 1.00 0.100 0.1570E-02 0.031 0.032 0.965 0.5132E-020.630 25.18 1.00 0.100 0.0(OE+00 0.031 0.032 0.965 0.51825.02
0.650 25.12 1.00 0.100 0.0000E+00 0.031 0.031 0.965 0.5182E-020.670 25.08 1.00 0.100 0.0000E+00 0.031 0.031 0.965 0.5182E-020.690 25.06 1.00 0.100 0.O000E+00 0.031 0.031 0.965 0.5182E-020.710 25.04 1.00 0.100 0.0000E+00 0.031 0.031 0.965 0.51825-020.730 25.03 1.00 0.100 0.0000E+00 0.031 0.031 0.965 0.5182E-02
0.750 25.02 1.00 0.100 0.0005E+00 0.031 0.031 0.965 0.5132E-020.770 25.01 1.00 0.100 0.0000E+00 0.031 0.031 0.965 0.5182E-020.790 25.01 1.00 0.100 0.00005+00 0.031 0.031 0.965 0.5182E-02
0.810 25.00 1.00 0.100 O.0000E+00 0.031 0.031 0.965 0.5182E-020.830 25.00 1.00 0.100 0 0000E+00 0.031 0.031 0.965 0.5132E-020.350 25.00 1.00 0.100 0.0005E+00 0.031 0.031 0.965 0.51825-020.870 25.00 I.C' 0.100 0.0000E+00 0.031 0.031 0.965 0.5182E-02
0.890 25.00 1.00 0.100 0.0000E+00 0.031 0.031 0.965 0.5182E-020.910 25.00 1.00 0.100 0.0005E+00 0.031 0.031 0.965 0.5182E-020.930 25.00 1.00 0.100 O.0000E+00 0.031 0.031 0.965 0.5182E-020.950 25.00 1.00 0.100 0.0000E+00 0.031 0.031 0.965 0.5182E-020.970 25.00 1.00 0.100 0.0005E+00 0.031 0.031 0.965 0.5182E-020.990 25.00 1.00 0.100 0.0000E+00 0.031 0.031 0.965 0.5182E-02
"sMoisure migration dtough a heated concrete slab: Ambient (iitial) condition:Portland cesnet Temperature = 25*KBrookavifle AgregSaf with 20% flyash Pressure - 1.00 ATMW/C ratio - 0.38 Pore maturation = 0.100Age - 6 moauhs Slab thickness = 0.1000E+01 CMPorosity - 0.25
A-24

Appendix B
MEASURING CONCRETE FLOW RATES
Concrete flow characteriscs were determined experimentally by Dr. M.C. McVay of theUniversity of Florida under contract to the Air Force Civil Engineering Support Agency. Thisappendix consists of excerpts from his report (McVay and Rish, 1993).
The initial plan was to conduct both air and steam flow tests. To eliminate the possibilityof adding moisture, nitrogen, which makes up about 78 percent of air, was used instead.Similarly, to prevent condensation of steam within the pores, superheated steam was used for thesteam tests.
EXPEREMETAL APPARATUS
Since concrete is relatively impervious, a large diameter concrete specimen was necessaryto obtain a measurable flow rate. A large diameter specimen also reduces the error caused byside wall effects. Consequently, a 12.7-cm diameter by 5.1-cm long specimen was selected.Flow was to be constrained to one dimension and, therefore, the side of the specimen had to besealed. For the nitrogen tests, the specimen was sealed inside an acrylic tube as shown in FigureB-I. For the steam tests, repeatable results were achieved by using a 12.78-cm inside diametersteel pipe around the specimen and Dexter Hysol's high temperature epoxy within the gap. Thelow pressure side of the specimen was supported by a 1.27-cm perforated aluminum plate. Thetop and bottom of the steel pipe were sealed to 30.5-cm diameter by 2.6-cm thick aluminumplates. These plates were used to provide large heat sources to superheat steam coming from theboiler, as well as to maintain constant temperatures across the circular plane of the specimen.
For the steam flow tests, the specimen, in its container, was placed in an oven, as shownin Figure B-2, so it could be heated prior to beginning the experiments. Also shown in thisfigure are the boiler (heated with an electric furnace), condenser, and scale to measure mass flowrate. Both the temperature and pressure of the steam entering the oven were continuouslymonitored as were the temperatures of the specimen and superheated steam in the oven. Foreach of the steam tests, the oven had to be maintained at a temperature hotter than the boiler toensure that the steam achieved a superheated state.
The nitrogen flow experiments were conducted by tying into the steam supply line witha high pressure hose connected to a regulated bottle of nitrogen. The nitrogen, after passingthrough the specimen, was collected underwater in a burette.
FLOW TESTS
To determine the amount of either gas flowing through the concrete, the upstreampressure was set, and the flow rate monitored. The downstream pressure was maintained atambient. After steady state was reached, the total flow passing through the concrete specimen
B-1

Quick Connection
Neoprene Gasket
Stsel Rod Acrylic TubeEpoxy
Concrete L_Specimen .
Bottomplate
Figure B-1Nitrogen flow test apparatus.
Figure B3-2
Specinme placed in an oven for fth steam flow tests.
B3-2

was recorded over a period of several hours to guarantee a representative average. Flow rateswere acquired by simply dividing the total measured flow by the total time. The tests wererepeated for different upstream pressures up to a maximum of 22 atmospheres.
SPECIMEN PREPARAIION
Three different concrete mixes were tested. Specimens constructed of cement mortarwere prepared according to ASTM Specification C-139. This required a water-to-cement ratioof 0.4, and a sand-to-cement ratio of 2.5 by weight. Quartz sand was used as the fine aggregate,and no additives such as a plasticizer were used. The specimens were cured for 7 days bysubmersion in water. After curing, the specimens were dried of their evaporable water byplacing them in a convection oven at 1 10C and monitoring their weight loss. The drying tookapproximately 3 days. Porosities of the dried samples averaged about 17.5 percent. Afterdrying, the nitrogen and steam flow tests were conducted.
The two other concrete mixes were similarly prepared, and a limestone aggregate wasadded. Nitrogen flow tests were conducted on specimens made with the very porous Brooksvillelimestone and also with the less porous Calara limestone.
B-3

Appendix C
EXPERIMENTAL EXAMINATION OF THE EFFEC OFMOISTURE IN HEATED AIRFIELD CONCRETE
By
C. David Gaughen
SAMPLE PREPARATION
The mix design met the requirements outlined in the Naval Facilities EngineeringCommand guide specification (NFGS-02520C) for "Portland Cement Concrete Pavement forRoads and Airfields." Type 1/11 portland cement with both San Gabriel sand and number 57round rock coarse aggregate was used. Samples were cast from one batch into 2- by 2-foot by3-inch wood forms and placed in a fog room for 28 days at 706F. After 28 days, seven beamshad an average flexural strength of 830 psi.
When cured, samples were cut into 2.75- by 3- by 3-inch cubes using a masonry saw.The original surface had a coarse burlap drag finish, and the first quarter inch of portland cementconcrete was removed with a masonry saw. This procedure gave the surface of each sample asmooth appearance which facilitated photographic documentation. Samples were divided intotwo groups that were subjected to different environments. The first group was placed in a Blue-M circulating air oven at 500C for 1 week, and, for an additional week, the temperature wasincreased to 700C (dry samples). The second group was placed in a bucket of deionized waterfor 3 weeks (saturated samples).
TEST PROCEDURE
Saturated and dry samples were subjected to cyclic heating typically caused by an F/A- 18auxiliary power unit (APU) in its ready to load (RTL) mode and VSTOL aircraft during takeoffand landing. Each cycle had a duration of 5 minutes. Figure C-1 shows concrete surfacetemperature versus time for both actual and experimental heating of an F/A-18 APU operatingin the RTL mode. The smooth curve shows actual heating from field data (Ref C-1) and thetriangles show experimental heating used in the laboratory. Figure C-2 shows concrete surfacetemperature versus time for both actual and experimental heating of VSTOL during takeoff andlanding. The smooth curve shows actual heating from field data collected in this study and thetriangles show heating used in the laboratory.
Figure C-3 shows the apparatus used to experimentally generate these heating rates. Theheating source used to simulate the F/A-18 APU was a SEELYE Si-1500C/D heat gun. Amethane Bunsen burner was used to simulate a VSTOL. To record the temperature of eachsample upon heating, a Dickson model 1R550 (infrared temperature measuring instrument) wasused. An Olympus SZIITR microscope system was used to take photographs.
C-1

Concrete Surface Temp (C)120
100/
60
40
20 '
0 50 100 150 200. 250 300 350Elapsed Time (seconds)
- Actual Heating 1 Experimental Heating
Figure C-iActual and experimental heating of F/A-18 APU operating in the RTL mode.
Concrete Surface Temp (C)600
500 -
40 0 . . . . .
300A
200-
100
I I I I
0 50 100 150 200 .250 300 350Elapsed Time (seconds)
Actual Heating A Experimental Heating
Figure C-2Actual and experimental heating of V/STOL during takeoff and landing.
C-2

Both saturated and dry samples were heated at the rates shown in Figures C-I and C-2.Samples would either be heated once or cycled six times using these rates. After each cycle,samples would cool to ambient temperature before an additional cycle would begin. If more thanone cycle was desired on a saturated sample, it would be resaturated by submersion in deionizedwater for a minimum of 10 minutes. The table below shows the number of samples, sampletype, number of cycles, and cycle type used in this experiment.
Number of Samples Sample Type Number of Cycles Cycle Type
2 Dry 1
2 Saturated 1F/A-18
4 Dry 6
4 Saturated 6
2 Dry 1
4 Saturated 1VSTOL
2 Dry 6
2 Saturated 6
RESULTS
Figure C-4 shows the surface of a saturated sample before cycling. A thin layer of whitedeposits consisting of calcium hydroxide, calcium carbonate, and other solids exits on eachsurface of the saturated samples. When water passes through concrete it may dissolve some ofthe readily soluble calcium hydroxide (formed during hydration of the cement) and other solids.This leaching of the calcium hydroxide and subsequent carbonation and evaporation is known asefflorescence (Ref C-2). Carbonation occurs when calcium hydroxide reacts with carbon dioxidein air to form calcium carbonate. Figure C-5 shows the surface of a dry sample prior to cycling.It becomes apparent, when compared to Figure C-4, that this sample has an absence ofefflorescence.
Explosive spalling, pop-outs, cracking, and scaling did not occur on any of the twelvesamples that were subjected to the simulated F/A-18 APU operating in the RTL mode. Theobservations were consistent for both the dry and saturated samples regardless of the number ofcycles (cycles ranged from one to six). However, cycling on the saturated samples appeared toincrease the deposits from efflorescence.
Cracking occurred on the majority of the 10 samples subjected to the simulated VSTOL.This was observed predominantly after the first cycle and continued to progress as the numberof cycles increased. Figure C-6 is a photograph taken after six VSTOL cycles of the same drysample and relative area as in Figure C-5. This figure shows slight cracking in the center andin the right comer. Figure C-7 shows slightly larger cracking after six VSTOL cycles on anotherdry sample. Many of the cracks that were viewed occurred adjacent to a piece of aggregate.
C-3

Figure C-3
Apparatus used to simulate heating.
Aw
VC.
4w
Figure C-4Saturated sample prior to cycling, 25X. White regions are visible signs of efflorescence.

.0 t
~N0
- .- ',~ - 4 _ ____J~ 4!*A
-C-

Explosive spalling occurred only on the saturated samples subjected to the simulatedVSTOL. Figure C-8 shows an explosive spall that occurred on the first cycle after 50 secondsof heating. The dark portion in the center of the photograph is where the spall occurred. FigureC-9 shows a portion of the perimeter of the same spall. In this photograph, the concrete appearssmooth whereas the region of the spall appears coarse. Figure C-10 shows another perspectiveof the same spall. This photograph shows a region where the cement paste became suspendedabove a piece of aggregate. In viewing this spall's crater from 3.3 to 40 times magnification,it was observed that the aggregate remained embedded in the concrete matrix and did notrupture. The sample shown in Figures C-8, C-9, and C-10 was the only sample out of four toexhibit an explosive spall on its cut surface.
Two saturated and one dry sample were subjected to one VSTOL cycle on an uncutsurface. Explosive spalling occurred on both saturated samples. Figure C-Il shows one of theexplosive spalls. The region of the spall appears coarse and is centrally located. In the spall'scrater, a section of clear aggregate is exposed. This uncut surface has cement paste covering allaggregate and most of the entrained air voids. Explosive spalling did not occur on the drysample.
OBSERVATIONS/COMMENTS
Cracking may have occurred as a result of two phenomena: thermal expansion andthermal shock. Aggregate and cement have different coefficients of thermal expansion. If theexpansion rates are not identical, the concrete, upon heating, may relieve internal stress bycracking. In addition, concrete may undergo thermal shock during rapid heating or cooling.This temperature difference between the heated concrete and room temperature may haveexceeded the point where cracking occurs in concrete.
The only concrete samples that exhibited explosive spalling were those that were saturatedwith deionized water and subjected to the VSTOL heating. Two uncut surfaces and one cutsurface out of six saturated samples explosively spalled. Therefore, it appears that the mostsignificant contributing factor to this type of spalling was the presence of trapped water in eachsample. In addition, upon heating the saturated samples, a steam/water mixture was ejected fromentrapped air voids and cracks adjacent to aggregate. This suggests that steam migratesthroughout the concrete matrix. Thus, the added pressure from steam may have caused theexplosive spelling in the saturated samples.
REFERENCES
C-1. Naval Air Warfare Center. Report SA-162R-91: Evaluation of an F/A-18 auxiliary powerunit modified nozzle, by S.W. Houck, D.N. Gordge, and C.A. Hadfield. Patuxent River, MD,Jan 1992.
C-2. George Earl Troxell, Harmer E. Davis, and Joe W. Kelly. Composition and propertiesof concrete, 2nd edition. New York, NY, McGraw-Hill Book Company, 1968, pp 281.
C-6

Figure C-7
Dry sample after six V/STOL cycles, 25X.
C-7

I. 40
Figure C-8Saturated sample showing explosive spall, 3.3X.
FigreC-
FiueC-9

Figure C-10Saturated sample showing explosive spell crater
with cement paste suspended above central dark aggregate, 15X.
4&
Figure C-II
Saturated sample showing explosive spell on an uncut surface, 15X.
C-9

-. 417 ,,J-
ARMY ClERL LIB, CHAMPAIGN, ILARMY CRREL I CECRL-IC, HANOVER, NHDTIC I ALEXANDRIA, VAFAA / ARD 200 (TOMITA), WASHINGTON, DCLANTNAVFACENGCOM I CODE 15C, NORFOLK, VA; CODE 411, NORFOLK, VA; LIBRARY,
NORFOLK. VANAVFACENGCOM I CODE 13, ALEXANDRIA, VA; CODE 133, ALEXANDRIA, VA; DEL COLLO,
ALEXANDRILA VA; SKAR. ALEXANDRWIA VANAVSCOLCECOFF / CODE C5, PORT HUENEME, CANFESC ECDET / CECILIO, WASHINGTON, DC; JONES, WASHINGTON, DCNORTHNAVFACENGCOM / TECH LIB, LESTER, PA; CODE 164P, SCHIAVINO, LESTER, PAPACNAVFACENGCOM / CODE 102, PEARL HARBOR, HI; CODE 405, PEARL HARBOR, HISOUTHNAVFACENGCOM I CODE 102B, CHARLESTON, SC; CODE 4023, CHARLESTON, SC;
LIBRARY, CHARLESTON, SCSOWESTNAVFACENGCOM / CODE 161, TONG, SAN DIEGO, CAWES / CODE GP HAMMrTF, VICKSBURG, MS; LIBRARY, VICKSBURG, MSWESTNAVFACENGCOM / CODE 411, SAN BRUNO, CAWRIGHT LABORATORY / WL/FIVCO-OL, MURFEE, TYNDALL AFB, FL; WLIFIVCO-OL, RISH,
TYNDALL AFB, FL
Copyright © 2022 FDOKUMEN